1. Introduction
Front-End Planning (FEP) is the crucial early stage in the life cycle of a project during which decisions are made that will lead to success or failure for infrastructure and megaprojects alike. As defined by CII, FEP is “the process of developing sufficient strategic information with which owners can address risk and decide to commit resources to maximize the chance for a successful project”. Located just in advance of the investment decision, FEP is tremendously important for decision-making, because “it is at this stage that the opportunity to influence outcomes is greatest at the lowest cost of change”. The timing of FEP in the life cycle imparts its strategic advantages to project managers. Studies show that, when correctly performed, FEP dramatically improves the likelihood that the project will be a success, and, as reported in Hansen et al. (2018), CII research indicates that inadequate FEP is considered the primary factor responsible for 60 to 85 percent of the budget variance impact [
1]. Despite its widespread acceptance, effectiveness in implementing such ideas in practice is not guaranteed. Even when using a well-established FEP methodology, for example, about two-thirds of projects incur budget overruns, and half exceed their budgets by more than 10 percent [
2].
Current FEP frameworks have evolved out of studies conducted mostly in Western institutional settings that may not reflect Saudi Arabia’s megaproject environment. The Kingdom’s Vision 2030 megaprojects are subject to integrated government–private partnerships, specific regulatory requirements and tight delivery timelines that may fundamentally change which FEP activities are most critical for success. With over 100 megaprojects and overall investments anticipated to exceed USD 1.1 trillion [
3], Vision 2030 represents one of the most extensive infrastructure development programs in the world.
Several research gaps motivate this investigation. First, an institutional context gap exists because initial FEP research identified critical activities primarily based on U.S. industrial projects [
4], and subsequent validation studies in different contexts have yielded inconsistent results [
2]. Second, a scale and complexity gap exists because past research focused on industrial projects rather than the infrastructure megaprojects that dominate Saudi Arabia’s development agenda. Third, no prior research has explored the relative importance of specific FEP activities in Saudi Arabia, where stakeholder dynamics, regulatory structures, and delivery models differ from those in Western settings. Fourth, a digital and spatial planning gap exists because contemporary megaproject FEP practice increasingly relies on Building Information Modeling (BIM), three-dimensional coordination tools, and integrated digital workflows [
5,
6,
7], yet these dimensions are largely absent from the established CII activity frameworks that guide most empirical research on FEP effectiveness. Recognizing this gap is important for interpreting findings from instruments that operationalize FEP primarily through process-oriented assessments.
Within this context, the aims of this research are twofold: (1) to explore which FEP activities are most strongly associated with cost and schedule variances in Saudi megaprojects, examining 33 activities across five FEP domains and their relative associative strength, and (2) to develop a preliminary prioritized FEP framework applicable to the Saudi context that may assist decision makers in concentrating resources on activities most closely linked with delivery success. Given the small sample size (n = 35), this study is explicitly framed as exploratory, intended to generate empirically grounded hypotheses for future confirmatory investigation rather than to establish definitive causal relationships.
This study advances prior work in three respects. First, it provides the first empirical examination of FEP activity quality and project performance associations within the Saudi megaproject context, where institutional characteristics differ substantially from the Western settings in which existing frameworks were developed. Second, it employs reliability-validated domain composites rather than individual activity ratings, providing more stable predictors suited to the constraints of megaproject research where sample sizes are inherently limited. Third, it proposes a preliminary prioritized framework that distinguishes between activities associated with performance protection and those that may signal underlying project complexity, offering a more nuanced perspective than existing binary classifications of activities as simply critical or non-critical.
2. Materials and Methods
This section describes the research design and analytical procedures employed to address the study’s exploratory objectives. The approach combines reliability analysis with regression modeling to examine how different planning domains relate to project outcomes, drawing on assessments from practitioners with direct megaproject experience. Because the achieved sample (n = 35) constrains statistical power, the study is positioned as hypothesis-generating rather than confirmatory.
2.1. Theoretical Framework and Conceptual Foundation
2.1.1. Economic Rationale for Front-End Planning
The literature converges on a consistent finding: resources allocated to early project phases are associated with disproportionate returns relative to equivalent resources spent later. Samset and Volden [
8] describe a fundamental paradox of project development: the capacity to influence outcomes is greatest during the earliest phases, when formal knowledge is lowest and major commitments have not yet been made. As Flyvbjerg and Gardner [
9] document, the cost of making changes rises dramatically once projects move beyond front-end phases, as accumulating commitments narrow the range of feasible adjustments. Merrow [
10] adds that structured front-end investigation enables teams to identify and address risks while mitigation options remain affordable; risks not surfaced until execution manifest as crises requiring costly corrective action. The economic case is further reinforced by shifting stakeholder dynamics across project phases. Research on global projects demonstrates that stakeholder salience is not static but shifts as projects progress [
11], meaning that engaging key stakeholders during front-end phases, when parameters remain flexible, allows teams to accommodate diverse interests before downstream commitments create rigidity.
2.1.2. Implementation Frameworks
Industry practice has developed two companion disciplines. Scope definition rating systems, notably the Project Definition Rating Index (PDRI) [
12], evaluate projects across dimensions including basis of project decision, basis of design, and execution approach, producing scores that correlate with downstream performance [
13]. Front-End Loading (FEL) frameworks divide planning into sequential phases with specific deliverables and decision gates [
10]. Merrow [
10] emphasizes that effectiveness depends on whether stage-gate reviews genuinely challenge assumptions or merely function as procedural checkpoints. Samset and Volden [
8] identify a persistent paradox: projects tend to lock into an initial concept prematurely, narrowing the decision space before alternatives have been evaluated. Liu et al. [
14] further show that success factors differ across delivery systems, reinforcing that effective front-end work requires adaptation to context rather than mechanical application of standardized procedures.
2.1.3. Critical Activities Research
George et al. [
4] identified seven activities that distinguished successful from unsuccessful projects: establish image and public relations; define startup requirements; refine public relations; address safety and quality issues; develop preliminary execution plan; compile project scope; and develop utilities and offsite scope. However, Motta et al. [
2] found meaningful gaps between theoretical FEP expectations and field results in Brazilian companies, with 67 percent of projects experiencing budget overruns despite applying established methodologies. Their findings demonstrate that FEP frameworks do not transfer straightforwardly across institutional environments, underscoring the need for context-specific validation.
2.1.4. Contextual Influences on Planning Effectiveness
Planning effectiveness depends fundamentally on implementation context. Williams and Samset [
15] argue that governance structures, political dynamics, and decision-making authority distribution influence which activities receive emphasis. Projects operating in environments with multiple governmental authorities and overlapping jurisdictions face different coordination challenges than those in consolidated settings [
11], and success factors are contingent on delivery context [
14].
Western FEP frameworks developed within institutional environments characterized by mature regulatory frameworks and relatively distributed decision-making authority [
1,
4]. The Saudi context differs. Research indicates that Saudi megaprojects often develop through governance structures [
16]. Al-Kharashi and Skitmore [
17] identified client-related factors among the most significant delay causes in Saudi public construction. These patterns suggest that scope definition and stakeholder alignment may require different emphasis in Saudi Arabia compared to Western frameworks.
Digital and Spatial Planning in Contemporary Megaproject FEP
Contemporary megaproject practice increasingly relies on Building Information Modeling (BIM) and integrated digital workflows during front-end phases [
18]. Sacks et al. [
18] describe BIM as enabling scope visualization, spatial conflict detection, and cross-discipline coordination during early project stages. For megaprojects, where multiple design disciplines, governmental agencies, and construction packages must be coordinated simultaneously, BIM-based spatial planning transforms activities such as scope compilation (E23) and site plan development (E28) from document-centric administrative processes into three-dimensional coordination exercises involving clash detection, constructability review, and logistics simulation. Succar [
6] proposes a maturity framework describing progressive capability levels, from object-based modeling through model-based collaboration to network-based integration, that shape how effectively digital tools support substantive planning decisions rather than merely producing visualization outputs.
Whyte [
5] further highlights that front-end effectiveness is increasingly mediated by the digital infrastructure through which planning information flows, arguing that the integration of information across organizational boundaries during front-end phases is as consequential as the planning activities themselves. In the Saudi context, where Vision 2030 megaprojects involve rapid mobilization of international design teams coordinating across multiple time zones and regulatory jurisdictions, the digital maturity of FEP processes may represent a significant moderating variable that established CII frameworks do not capture.
The present study’s CII-derived instrument operationalizes FEP through process-oriented quality assessments (e.g., how well was scope compiled?) and does not directly measure BIM maturity, spatial coordination capability, or digital workflow integration. This boundary condition means that two projects receiving identical quality ratings on scope compilation could differ substantially in the spatial sophistication of their scope definition processes. This limitation is acknowledged, and future research should integrate digital maturity indicators alongside process quality assessments to capture the full spectrum of contemporary FEP practice.
2.2. Operational Framework: The 33-Activity Structure
This research operationalizes FEP assessment through 33 discrete activities organized into five domains, adapted from CII frameworks [
1,
4,
12]. The five domains are Business Planning (BP, 12 activities: strategic planning, business objectives, market analysis, funding, stakeholder engagement), Cost and Schedule (CS, 4 activities: cost estimation, schedule development, contracting strategy), Project Planning (PP, 8 activities: preliminary design, execution planning, scope definition, technical requirements), Site Development (SD, 5 activities: site assessment, utilities planning, environmental scope, infrastructure requirements), and Technical Planning (TP, 4 activities: technical surveys, product testing, licensing, operational readiness).
Table 1 presents the complete framework.
This framework captures the managerial and procedural dimensions of FEP but does not directly measure spatial planning tools such as BIM-based coordination [
5,
6], a boundary noted in Section Digital and Spatial Planning in Contemporary Megaproject FEP. The theory-driven domain structure avoids the sample size requirements of exploratory factor analysis, enables comparison with prior CII research, and provides a stable analytical foundation for an exploratory study.
2.3. Linking Activities to Mechanisms and Outcomes
Each domain contributes to project success through distinct pathways. Strategic definition and business case activities may reduce scope drift by establishing clear objectives and benefits realization plans, supported by reference class forecasting that corrects planning optimism [
9]. Institutional alignment activities can shorten approval critical paths through permit matrices, environmental scope definitions, and utility confirmations. Delivery and contracting strategy activities influence bidder competition and risk pricing; Merrow [
10] emphasizes that early contracting decisions condition both procurement duration and execution stability. Scope definition and preliminary engineering activities anchor estimate accuracy through basis-of-design development, work breakdown structures, and design maturity, with PDRI research demonstrating that scope definition completeness is associated with downstream performance [
12,
13]. Execution planning activities define schedule credibility through constructability analysis and sequence logic development, shaped by the quality and integration of project information flows [
5].
2.4. Population and Sample
2.4.1. Target Population
The target population comprised professionals directly involved in FEP for Saudi megaprojects. Eligibility required project investment of at least SAR 1 billion (approximately USD 267 million), professional roles encompassing project directors, program managers, project managers, planning managers, engineering managers, cost managers, FEP specialists, and senior consultants, direct involvement in at least one megaproject FEP process, and project location within Saudi Arabia.
2.4.2. Sampling Strategy and Sample Characteristics
A purposive sampling strategy was employed to ensure respondents possessed specialized megaproject knowledge [
19]. Recruitment occurred through professional networking platforms, industry conferences, and direct organizational contacts. The achieved sample of 35 respondents includes 82.9 percent with 8 or more years of experience, 68.6 percent representing owner organizations, and 91.4 percent of projects meeting the SAR 1 billion threshold.
Sample size adequacy was evaluated against established guidelines. Hair et al. [
20] recommend a minimum ratio of 10 observations per predictor, with 5:1 as an absolute minimum for exploratory research. With four domain-level predictors in the final regression models (see
Section 2.6.5), the ratio of 8.75:1 falls between these thresholds. Post hoc power analysis using G*Power [
21] with four predictors and α = 0.05 yielded achieved power of 0.898 for the schedule model (f
2 = 0.512) and 0.401 for the cost model (f
2 = 0.169). All findings are therefore framed as exploratory and require replication with larger samples.
2.5. Data Collection Instrument
The survey comprised four sections: demographics and project context, FEP activity quality assessment across 33 activities, project outcome measures, and qualitative comments. Activity quality was assessed using five-point Likert-type scales (1 = very poor quality to 5 = excellent quality), while cost and schedule variance were measured as percentage deviations between actual and planned values. The use of Likert-type data as interval-level input follows established methodological practice. Norman [
7] demonstrated that parametric statistics, including means, standard deviations, and regression coefficients, are robust to ordinal-to-interval treatment of Likert-type items, particularly when multiple items are aggregated into composite scores. Simulation studies confirm that five-point or wider scales yield results comparable to those obtained with continuous measures in regression contexts, supporting the approach adopted here where domain composites average between 4 and 12 items. Statements and scales were adapted from CII frameworks validated by previous researchers [
2,
4,
12].
2.6. Data Analysis Procedures
2.6.1. Analytical Framework
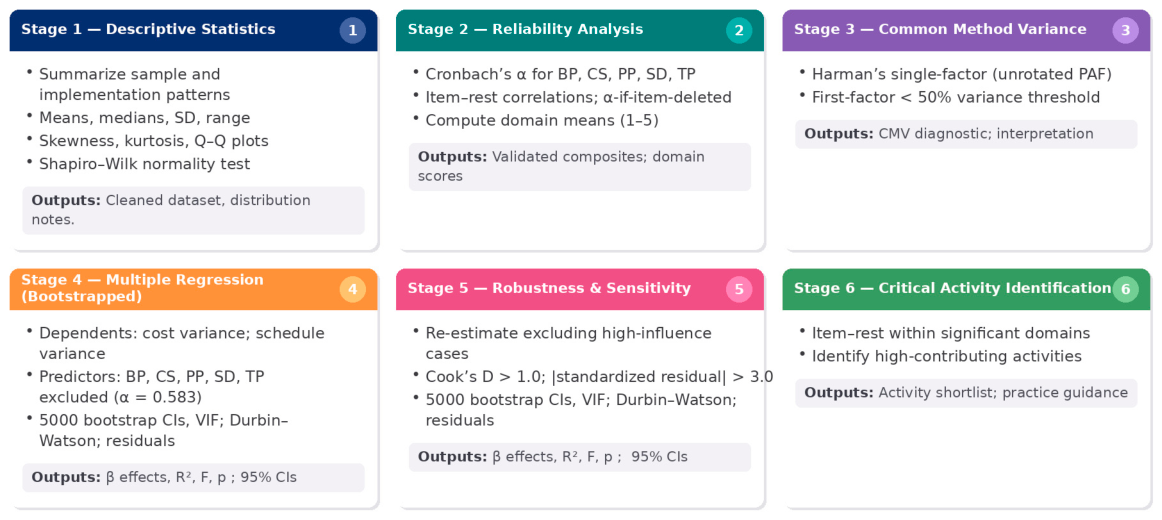
Analysis proceeded through six sequential stages: (1) descriptive statistics characterizing sample and implementation patterns; (2) reliability analysis of domain composites; (3) common method variance assessment; (4) multiple regression with bootstrapped confidence intervals; (5) robustness and sensitivity analysis; and (6) critical activity identification within significant domains. The framework is illustrated in
Figure 1.
2.6.2. Stage 1: Descriptive Statistics
Measures of central tendency and dispersion were calculated for all activity ratings and outcome variables. Distribution characteristics (skewness, kurtosis) were assessed to inform parametric versus non-parametric decisions. The Shapiro–Wilk test [
22] assessed normality of outcome distributions.
2.6.3. Stage 2: Reliability Analysis of Domain Composites
Cronbach’s alpha was calculated for each theoretical domain to assess internal consistency. The threshold of α ≥ 0.70 was adopted as recommended, with α ≥ 0.60 acceptable for exploratory research [
20]. Item-level diagnostics including item-total correlations and alpha-if-item-deleted values were examined. Domains falling below α ≥ 0.60 were flagged for exclusion from regression models on the grounds that unreliable composites compromise regression estimates. Domain composite scores were computed as the mean of constituent activity ratings, maintaining the original 1–5 scale.
2.6.4. Stage 3: Common Method Variance Assessment
Because all data were collected from single respondents using the same instrument, common method variance (CMV) represents a potential threat. Harman’s single-factor test was conducted by entering all 33 items into an unrotated principal axis factoring. If the first factor accounts for less than 50 percent of total variance, CMV is not considered dominant [
23]. While acknowledged as a conservative diagnostic, Harman’s test provides a baseline assessment appropriate for exploratory research.
2.6.5. Stage 4: Multiple Regression Analysis
Four domain composites (BP, CS, PP, SD) served as predictors, with cost variance and schedule variance as dependent variables in separate models. The Technical Planning domain was excluded because its internal consistency fell below the acceptable threshold (α = 0.583); including an unreliable predictor risks introducing measurement error that distorts estimates [
20]. TP is retained in descriptive and reliability analyses and discussed qualitatively.
Ownership type (governmental, private, PPP) was originally included as a categorical predictor but was removed from final models because the additional dummy variables reduced the observations-per-predictor ratio to approximately 5.8:1, approaching the absolute minimum for stable estimation [
20], and preliminary analysis indicated ownership was not statistically significant after controlling for FEP quality. Ownership is reported descriptively.
To address small-sample and distributional constraints, bootstrapped confidence intervals (5000 resamples) were computed for all coefficients [
20]. Bootstrapped intervals are reported alongside standard parametric intervals.
2.6.6. Regression Assumption Assessment
Linearity was assessed via residual-versus-fitted plots. Independence of errors was assessed using the Durbin–Watson statistic (acceptable range 1.5–2.5) [
24]. Homoscedasticity was assessed through residual plot inspection. Normality of residuals was assessed through histograms and Q-Q plots, supplemented by bootstrapping. Multicollinearity was assessed through VIF values (VIF < 10 acceptable) [
20].
2.6.7. Stage 5: Robustness and Sensitivity Analysis
Both models were re-estimated excluding cases with Cook’s Distance exceeding 1.0 or standardized residuals exceeding ±3.0 [
20,
24]. Coefficients from full-sample and reduced-sample models are reported side by side to assess whether conclusions depend on extreme observations.
2.6.8. Stage 6: Critical Activity Identification
For each domain significantly associated with outcomes, constituent activities were examined using item-rest correlations to identify which activities contribute most strongly to the domain’s internal consistency and, by extension, to the observed domain–outcome association.
2.7. Statistical Software
JASP version 0.18 served as the primary analytical tool, providing descriptive statistics, reliability analysis, regression modeling, and bootstrapped inference. Post hoc power analysis was conducted using G*Power version 3.1 [
21].
2.8. Accepted Criteria for Statistical Analysis
Table 2 summarizes the accepted criteria applied throughout the analysis. The approach rests on several assumptions.
2.9. Research Assumptions
Respondents possess accurate knowledge of FEP activities and project outcomes for assessed megaprojects. Respondents provided honest responses; Harman’s single-factor test (
Section 2.6.4) offers a partial diagnostic. The theoretical domain structure validly represents how FEP activities cluster functionally, supported by reliability analysis and prior CII research [
4,
12]. Relationships between domain composites and outcomes are approximately linear, assessed through residual analysis. Higher-quality FEP execution precedes better outcomes rather than the reverse; this temporal ordering is assumed but cannot be confirmed within the cross-sectional design, so all findings are described as associations. Likert-type ratings can be treated as approximately interval-level data for computing means and regression, consistent with established guidance [
7].
3. Results
3.1. Sample Characteristics
The 35 respondents represented diverse professional roles: project managers (34.3 percent), project engineers (25.7 percent), project directors (14.3 percent), and consultants (14.3 percent). The majority (82.9 percent) possessed 8 or more years of experience, with the modal category being 13 years (37.1 percent). Organization types included public sector owners (42.9 percent), private sector owners (25.7 percent), consulting firms (11.4 percent), EPC contractors (8.6 percent), project management consultancies (5.7 percent), and public–private partnership entities (5.7 percent).
Projects spanned multiple sectors: infrastructure (28.6 percent), energy (25.7 percent), real estate (14.3 percent), social infrastructure (14.3 percent), industrial (11.4 percent), and digital/technology (5.7 percent). Investment values were concentrated in the SAR 1 to 5 billion range (74.3 percent), with 91.4 percent meeting the megaproject threshold. Ownership structures included government-owned (51.4 percent), private sector (37.1 percent), and public–private partnerships (11.4 percent).
3.2. Project Performance Outcomes
Table 3 presents the descriptive statistics for the two project outcome variables.
Cost variance did not deviate significantly from normality (W = 0.965, p = 0.331). Schedule variance departed significantly from normality (W = 0.754, p < 0.001), driven primarily by one extreme observation (Case 21: 100 percent schedule overrun). Mean schedule variance exceeded mean cost variance by approximately six percentage points, with greater dispersion and a wider range, suggesting that schedule performance is more susceptible to extreme deviations in Saudi megaprojects.
3.3. Reliability Analysis
Before examining the predictive relationships between FEP domains and project outcomes, the internal consistency of the five theoretical domain structures required verification. Reliability analysis using Cronbach’s alpha assessed whether activities grouped within each domain measured coherent underlying constructs, which is a necessary precondition for computing meaningful composite scores. Domain composites that lack internal consistency would produce unreliable predictors and compromise regression estimates.
Table 4 summarizes the reliability coefficients, confidence intervals, and interpretive classifications for each of the five FEP domains.
Four of five domains demonstrated acceptable to excellent internal consistency (α ≥ 0.70). The Technical Planning domain showed marginal reliability (α = 0.583), which is acknowledged as a limitation.
Item-level analysis revealed that within the Business Planning domain, all items demonstrated adequate item–rest correlations ranging from 0.506 to 0.791. Within the Cost and Schedule domain, E15 (Review potential EPC contractor bidders) and E16 (Select EPC contractor team) demonstrated particularly strong correlations (0.803 and 0.764, respectively). Within the Project Planning domain, E23 (Compile project scope) and E22 (Develop preliminary execution plan) showed particularly strong correlations (0.779 and 0.740, respectively). Within the Technical Planning domain, E32 (Obtain license agreements) showed notably low item-rest correlation (0.195), and removing it would improve domain reliability to α = 0.670. However, even with this adjustment, the domain would remain below the conventional α = 0.70 threshold. Because a composite score derived from items with insufficient internal consistency would introduce measurement error into regression estimates, the Technical Planning domain was excluded from subsequent regression analyses. The four remaining domains (BP, CS, PP, SD), all meeting or exceeding α = 0.70, were retained as predictors. Composite scores were computed as means of constituent item ratings.
3.4. Common Method Variance Assessment
All 33 items were entered into an unrotated principal axis factoring for Harman’s single-factor test. The first factor accounted for 37.6 percent of total variance (eigenvalue = 12.42), below the 50 percent threshold. Following Harman’s single-factor test [
18], no single factor accounted for the majority of variance, suggesting common method bias is unlikely to be a serious threat. However, Podsakoff et al. [
23] note this test is a conservative diagnostic. Individual loadings ranged from negligible values for E30 (uniqueness = 0.945) and E33 (uniqueness = 0.841) to 0.845 for E16, indicating substantial variation inconsistent with a single method factor. While this diagnostic does not eliminate common method variance, it suggests that a single method factor does not dominate the data.
3.5. Multiple Regression Analysis
Two regression models were estimated with the four retained domains (BP, CS, PP, SD) as predictors. Bootstrapped confidence intervals (5000 resamples, bias-corrected accelerated) supplemented parametric estimates.
3.5.1. Schedule Variance Model
The model was statistically significant (R
2 = 0.339, adjusted R
2 = 0.250, F(4, 30) = 3.840,
p = 0.012). Post hoc power analysis indicated an achieved power of 0.898 for this effect size (f
2 = 0.512), confirming adequate statistical power.
Table 5 reports the regression coefficients and bootstrap confidence intervals.
Project Planning showed a large negative association (β = −0.801,
p = 0.002), with a bootstrapped 95 percent CI excluding zero [−55.39, −0.585]. Business Planning showed a significant positive coefficient (β = 0.745,
p = 0.031; bootstrap CI [8.27, 49.55] excluding zero). The positive direction is counterintuitive and is examined in
Section 4.2. CS and SD were not significant.
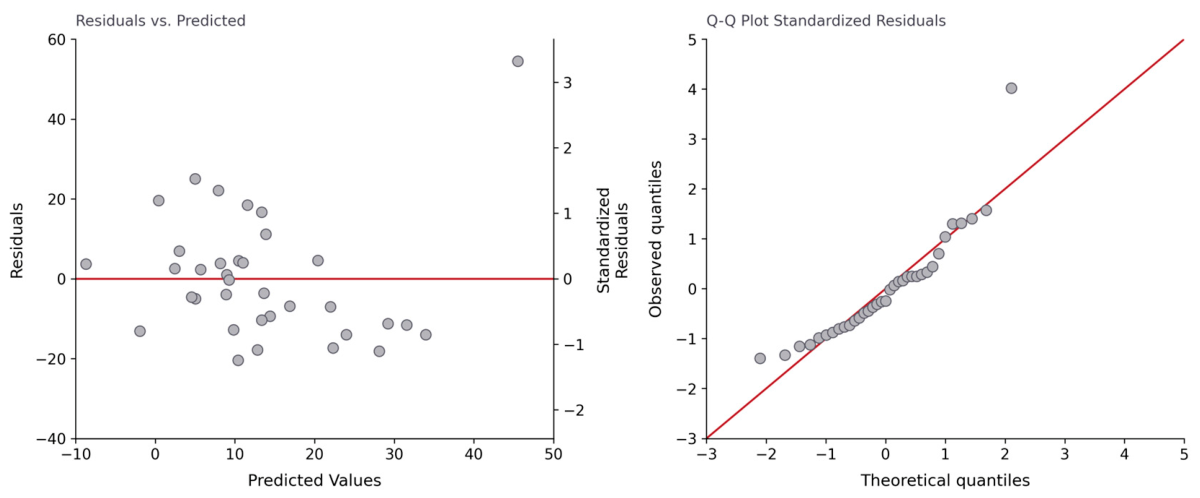
Figure 2 presents the residual diagnostic plots for this model.
3.5.2. Cost Variance Model
The model did not reach significance (R
2 = 0.145, adjusted R
2 = 0.030, F(4, 30) = 1.267,
p = 0.305). Post hoc power analysis indicated achieved power of only 0.401 for this effect size (f
2 = 0.169), indicating the study was substantially underpowered for detecting effects of this magnitude.
Table 6 reports the regression coefficients and bootstrap confidence intervals for the cost variance model.
No individual predictor reached significance at
p < 0.05. PP approached significance parametrically (
p = 0.070), but the bootstrap CI [−23.87, 6.72] included zero. With only 40.1 percent achieved power, genuine medium-sized effects may be undetectable in this sample.
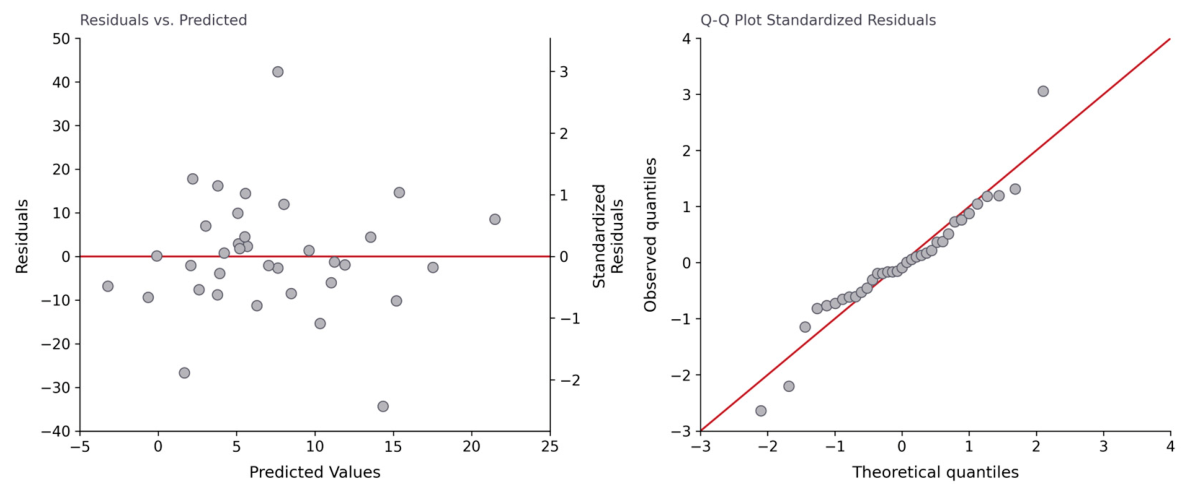
Figure 3 presents the residual diagnostic plots for this model.
3.5.3. Assumption Diagnostics
Table 7 summarizes the regression diagnostics for both regression models.
The Durbin–Watson statistic for the schedule model (1.393) fell slightly below the lower acceptable bound. VIF values were below 10 for all predictors. One influential case was identified: Case 21 (schedule variance = 100 percent, standardized residual = 4.019, Cook’s Distance = 1.493).
3.6. Sensitivity Analysis
The schedule model was re-estimated, excluding Case 21 (
n = 34).
Table 8 compares the full-sample and reduced-sample regression results.
Removing a single observation halved the explained variance, shifted the overall model from significant to non-significant, and converted PP from the strongest predictor (p = 0.002) to a non-significant one (p = 0.297). BP remained significant in both specifications (β = 0.841, p = 0.035), although its VIF increased to 5.033 in the reduced sample. The Durbin–Watson statistic improved to 1.752, confirming the marginal autocorrelation was an artifact of the extreme residual. Post hoc power for the reduced model (f2 = 0.200, n = 34, 4 predictors, α = 0.05) was 0.455, indicating the reduced-sample model was substantially underpowered.
3.7. Critical Activity Identification
For domains reaching significance in the primary model, constituent activities were examined using item-rest correlations and supplementary PLS-SEM outer loadings.
Table 9 presents the critical activities identified within each significant domain.
Two activities identified by George et al. [
4] as critical, scope compilation and execution planning, were confirmed as the strongest PP contributors. The BP domain’s most salient activities centered on strategic definition processes not prominently featured in prior CII critical-activity research.
4. Discussion
4.1. FEP Quality and Schedule Performance
The four-domain model explained approximately 34 percent of schedule variance, with Project Planning showing the largest individual association (β = −0.801). Within PP, scope compilation (E23) and execution planning (E22) emerged as the strongest contributors, consistent with George et al.’s [
4] identification of these activities among those distinguishing successful projects. PDRI research similarly demonstrates that scope definition completeness is associated with improved downstream performance [
12,
13].
However, the sensitivity analysis imposes a critical qualification. Removing Case 21 reduced PP’s coefficient from −0.801 (
p = 0.002) to −0.323 (
p = 0.297) and rendered the overall model non-significant. The PP finding therefore rests substantially on a single extreme observation. While schedule overruns of this magnitude are documented in megaproject research [
9], the concentration of inferential evidence in one case precludes generalization. This pattern suggests a threshold interpretation: Project Planning quality may matter most for preventing catastrophic schedule failures rather than producing incremental improvements across typical projects.
4.2. Business Planning Paradox
The positive BP coefficient (β = 0.745, p = 0.031) was the most robust finding, maintaining significance across both model specifications. Three non-exclusive interpretations merit consideration.
First, statistical suppression may be operating. With BP’s VIF at 4.891, once shared variance with other domains is partialled out, the residual BP variance may correlate with unmeasured complexity factors that drive overruns [
27]. Second, projects requiring higher-quality business planning may be inherently more complex, involving more governmental interfaces [
16]. Third, thoroughness in business justification may extend decision timelines, creating downstream schedule pressure [
8], consistent with Al-Kharashi and Skitmore’s [
17] identification of decision-making as a primary delay factor in Saudi public projects.
The multicollinearity context means the coefficient magnitude should not be interpreted literally. The finding’s value lies in demonstrating that the FEP quality-to-outcome relationship is more complex than a simple linear narrative suggests. This interpretation is offered as a hypothesis-generating insight for future investigation rather than a confirmed mechanism.
4.3. Cost Performance
The cost model’s non-significance (R2 = 0.145, p = 0.305) is partially attributable to insufficient statistical power (achieved power = 0.401). A genuine medium-sized effect may be undetectable at n = 35. Additionally, cost variance exhibited lower dispersion than schedule variance, providing less criterion variance, and cost outcomes in Saudi megaprojects may be more strongly influenced by factors outside FEP quality assessment, including commodity price volatility, currency fluctuations, and change-order dynamics.
4.4. Construct Validity Evidence from Supplementary PLS-SEM
A supplementary PLS-SEM analysis revealed that the CII-derived five-domain structure exhibits pervasive discriminant validity failures. Despite excellent internal consistency (α = 0.906), BP showed a PLS composite reliability of only 0.242 and an AVE of 0.115, with only one of twelve indicators exceeding the 0.708 loading threshold. HTMT ratios exceeded 0.85 for four domain pairs (BP↔SD = 0.948; PP↔SD = 0.926; TP↔SD = 0.925; CS↔BP = 0.897), and the SRMR (0.297) far exceeded the 0.08 threshold.
These findings validate the decision to employ OLS regression as the primary method, since regression does not require discriminant validity between predictors. The results also suggest that a substantial general “FEP quality” dimension underlies all 33 activities, and the CII domain boundaries impose analytical structure on what may be a more unified construct in practice. Future research should investigate alternative domain structures and formative measurement specifications.
4.5. Alignment with Prior Research
The identification of scope compilation and execution planning as critical activities is consistent with established CII research [
4,
12,
13]. However, public-relations activities (E04, E12), which George et al. [
4] identified among critical activities, showed the weakest PLS contributions in this sample, suggesting different mechanisms in the Saudi context [
16]. The non-significance of the cost model diverges from CII findings [
1,
13] but aligns with Motta et al.’s [
2] observation that cost overruns persist despite FEP application.
4.6. Preliminary Prioritized Framework
Based on the empirical findings and their qualifications,
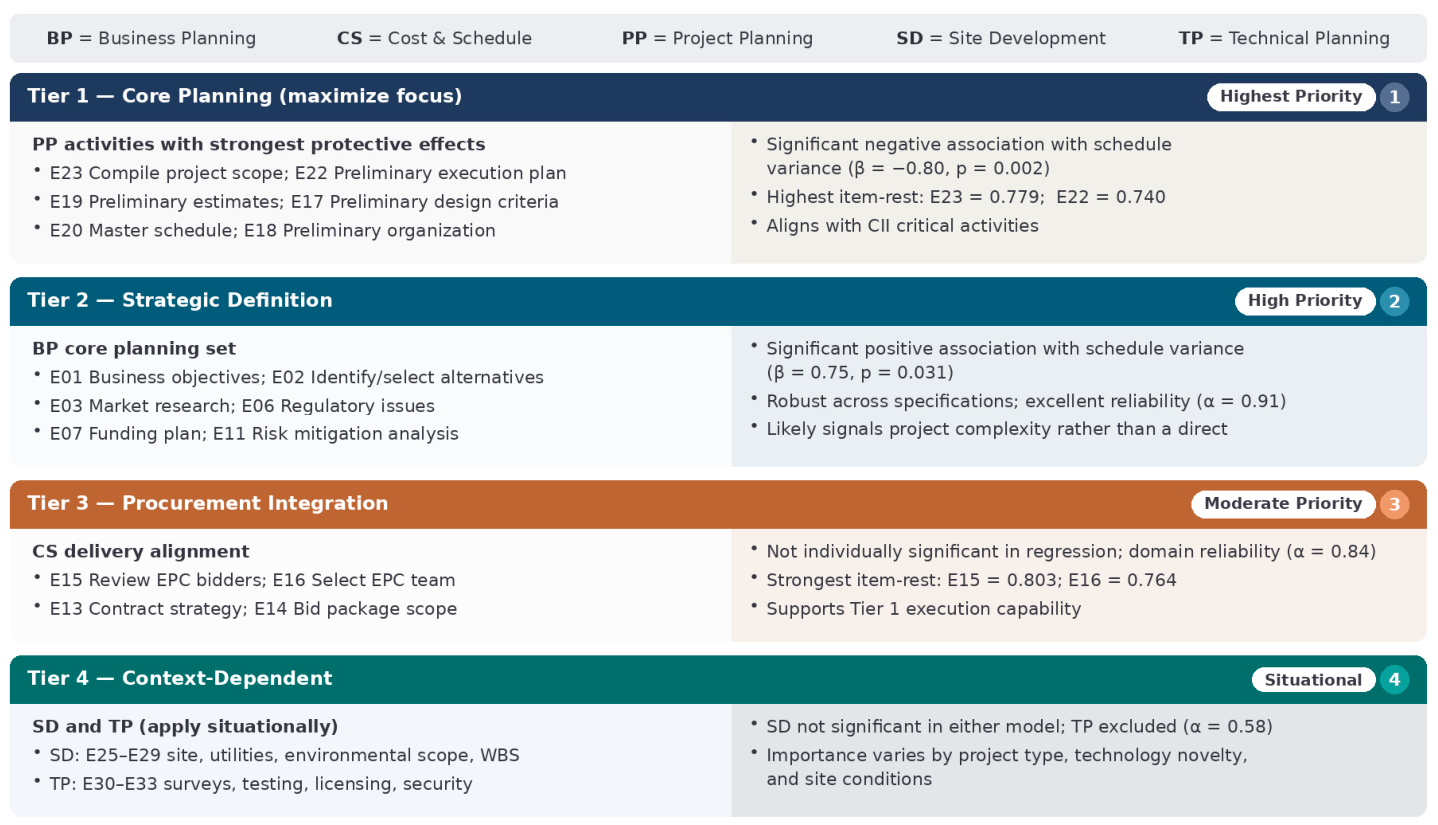
Table 10 presents a preliminary prioritized framework organizing FEP activities into tiers. Because the evidence base is exploratory and several findings are sensitive to model specification, this framework is proposed as a working hypothesis for practitioners rather than a validated prescription.
Figure 4 provides a visual representation of the framework structure.
Interpretation guidance. Tier 1 activities represent the strongest empirical candidates for resource concentration during front-end phases, though the sensitivity of the PP finding to a single case warrants caution in the strength of claims. Tier 2 activities are essential for project authorization and strategic definition, but the counterintuitive positive association with schedule variance suggests that intensive BP effort may serve as a diagnostic indicator of project complexity, warranting enhanced oversight rather than a straightforward lever for reducing overruns. This interpretation is offered as a hypothesis for future testing. Tier 3 and Tier 4 activities are not empirically linked to outcomes in this sample but retain theoretical importance from CII frameworks; their relative priority should be determined by project-specific characteristics.
4.7. Practical Implications
Three practical considerations emerge from the analysis, each qualified by the study’s exploratory limitations.
First, strategic definition activities (business objectives, alternatives evaluation, market analysis) occupy a central position in Saudi FEP, but practitioners should manage the paradox that thoroughness may extend decision timelines. When a megaproject requires intensive business planning effort, this should be treated as a complexity signal warranting closer schedule monitoring rather than as reassurance that outcomes are being managed.
Second, prioritizing scope compilation and execution plan quality during front-end phases aligns with global best practice [
4,
12,
13]. The concentration of the strongest item–rest correlations in E23 (scope) and E22 (execution planning) across both reliability analysis and supplementary PLS loadings provides convergent evidence that these activities are central to the Project Planning construct, even though the regression-level finding is sensitive to the extreme case. Organizations should ensure that scope compilation processes achieve substantive definition clarity rather than procedural compliance, consistent with Merrow’s [
10] distinction between substantive and pro forma stage-gate review.
Third, the non-significance of Site Development suggests that site-related planning may not be the primary differentiator of outcomes in this context, though this null finding may reflect insufficient power rather than genuine irrelevance.
4.8. Limitations
The sample size (
n = 35) limits statistical power, particularly for the cost model (achieved power = 0.401). The PP finding is dependent on a single influential observation. Multicollinearity (BP VIF = 4.891 to 5.033) compromises individual coefficient precision. The cross-sectional design cannot verify temporal ordering, and retrospective assessment bias remains a concern. Self-report data from single respondents per project introduce potential common method variance; while Harman’s test did not indicate a dominant method factor, this diagnostic is conservative and does not rule out inflation of associations. PLS-SEM revealed that the five-domain structure lacks discriminant validity, suggesting the CII domain boundaries may not represent empirically distinct constructs in this sample. The instrument does not capture digital planning maturity, BIM adoption [
6,
7], or spatial coordination capabilities [
5], meaning that the quality assessments reflect process completeness but not the technological sophistication of planning execution. Findings are context-specific to Saudi megaprojects and may not generalize to other settings.
4.9. Future Research
Future studies should recruit 80 to 100 megaprojects to provide adequate power and reduce the leverage of individual extreme observations. Multi-country designs would test whether the patterns observed here are Saudi-specific or reflect broader regional dynamics. The PLS-SEM findings suggest exploring alternative factor structures, including parsimonious two or three-factor solutions that may better represent the empirical structure of FEP quality. Longitudinal designs assessing FEP quality before execution begins would strengthen causal inference. Future instruments should integrate digital maturity indicators [
6] and spatial coordination capabilities [
5] alongside process quality assessments, capturing whether scope compilation involved BIM-based three-dimensional coordination or traditional document-centric approaches. Robust regression techniques such as M-estimation or quantile regression should be employed to accommodate the right-skewed distributions characteristic of megaproject performance data. Finally, multiple informants per project would reduce single-source bias and enable cross-validation of quality assessments.
5. Conclusions
This exploratory study provides the first empirical examination of Front-End Planning effectiveness in Saudi megaprojects, yielding three principal findings qualified by the study’s methodological constraints.
First, Project Planning quality, encompassing scope compilation, execution planning, preliminary estimation, and master scheduling, showed the largest negative association with schedule variance (β = −0.80, p = 0.002) in the full-sample model. However, the sensitivity analysis demonstrated that this finding is substantially dependent on a single influential observation (Case 21, 100 percent schedule overrun). The association should therefore be treated as a hypothesis warranting confirmation with larger samples rather than as an established empirical relationship.
Second, Business Planning intensity showed a robust positive association with schedule variance across both model specifications (full sample: β = 0.75, p = 0.031; reduced sample: β = 0.84, p = 0.035). This counterintuitive pattern is interpreted as a complexity signal: projects requiring intensive strategic definition, stakeholder engagement, and regulatory navigation tend to be structurally complex undertakings with greater inherent schedule risk. This interpretation is offered as a hypothesis-generating insight for future investigation.
Third, the cost model did not reach statistical significance (p = 0.305), attributable in part to insufficient statistical power (achieved power = 0.40). No conclusions regarding FEP domain associations with cost variance can be drawn from this sample.
For practitioners, the findings suggest that concentrating front-end resources on Tier 1 Project Planning activities, particularly scope compilation and execution planning, represents a reasonable priority, consistent with both the present exploratory evidence and established CII research [
4,
12,
13]. When projects require intensive Business Planning, this should trigger enhanced schedule oversight rather than providing reassurance about outcomes. Adequate FEP duration should be ensured rather than compressed to accelerate project commencement.
For policy makers, the findings offer preliminary support for establishing FEP quality benchmarks focused on scope definition and execution planning completeness, while recognizing that the evidence base requires strengthening before prescriptive mandates are warranted.
The central contribution of this study lies not in definitive causal claims but in generating empirically grounded, context-specific hypotheses about which FEP activities most closely associate with megaproject performance in Saudi Arabia. These hypotheses provide a structured foundation for the larger-scale, longitudinal investigations needed to establish actionable FEP policy for Vision 2030 implementation.
Author Contributions
Conceptualization, F.A. and R.A.; methodology, F.A., R.A. and B.S.; formal analysis, F.A., R.A. and B.S.; investigation, F.A.; resources, F.A.; writing—original draft preparation, F.A., R.A. and B.S.; writing—review and editing, B.S. All authors have read and agreed to the published version of the manuscript.
Funding
This research is funded by Prince Sultan University.
Institutional Review Board Statement
This study is waived for ethical review due to the Prince Sultan University Institutional Review Board (PSU IRB) policy, in alignment with the National Committee of Bioethics (NCBE) guidelines under Royal Decree No. (M/59), which stipulate that research not involving identifiable personal data, medical procedures, or vulnerable populations is exempt from formal ethical review.
Informed Consent Statement
Informed consent for participation is not required as per the Prince Sultan University Institutional Review Board (PSU IRB) policy, in alignment with the National Committee of Bioethics (NCBE) guidelines under Royal Decree No. (M/59), which stipulate that studies not involving identifiable personal data, medical procedures, or vulnerable populations are exempt from this requirement.
Data Availability Statement
The data presented in this study are available on request from the corresponding author.
Acknowledgments
The authors would like to acknowledge the support of Prince Sultan University for paying the Article Processing Charges [APC] of this publication. The authors would also like to thank N. Khan for his academic input.
Conflicts of Interest
The authors declare no conflicts of interest.
References
- Hansen, S.; Too, E.; Le, T. Retrospective look on front-end planning in the construction industry: A literature review of 30 years of research. Int. J. Constr. Supply Chain Manag. 2018, 8, 19–42. [Google Scholar] [CrossRef] [Scilit]
- Motta, O.M.; Quelhas, O.L.G.; de Farias Filho, J.R.; França, S.; Meiriño, M. Megaprojects front-end planning: The case of Brazilian organizations of engineering and construction. Am. J. Ind. Bus. Manag. 2014, 4, 401–412. [Google Scholar] [CrossRef]
- Vision Realization Programs. Vision 2030 Government Report; Kingdom of Saudi Arabia: Riyadh, Saudi Arabia, 2023.
- George, R.; Bell, L.C.; Back, W.E. Critical activities in the front-end planning process. J. Manag. Eng. 2008, 24, 66–72. [Google Scholar] [CrossRef] [Scilit]
- Whyte, J. How digital information transforms project delivery models. Proj. Manag. J. 2019, 50, 177–194. [Google Scholar] [CrossRef] [Scilit]
- Succar, B. Building information modelling framework: A research and delivery foundation for industry stakeholders. Autom. Constr. 2009, 18, 357–375. [Google Scholar] [CrossRef] [Scilit]
- Norman, G. Likert scales, levels of measurement and the “laws” of statistics. Adv. Health Sci. Educ. 2010, 15, 625–632. [Google Scholar] [CrossRef] [Scilit]
- Samset, K.; Volden, G.H. Front-end definition of projects: Ten paradoxes and some reflections regarding project management and project governance. Int. J. Proj. Manag. 2016, 34, 297–313. [Google Scholar] [CrossRef] [Scilit]
- Flyvbjerg, B.; Gardner, D. How Big Things Get Done: The Surprising Factors That Determine the Fate of Every Project; Currency: New York, NY, USA, 2023. [Google Scholar]
- Merrow, E.W. Industrial Megaprojects: Concepts, Strategies, and Practices for Success; John Wiley & Sons: Hoboken, NJ, USA, 2011. [Google Scholar]
- Aaltonen, K.; Kujala, J.; Oijala, T. Stakeholder salience in global projects. Int. J. Proj. Manag. 2008, 26, 509–516. [Google Scholar] [CrossRef] [Scilit]
- Gibson, G.E.; Wang, Y.R.; Cho, C.S.; Pappas, M.P. What is preproject planning, anyway? J. Manag. Eng. 2006, 22, 35–42. [Google Scholar] [CrossRef] [Scilit]
- Cho, C.S.; Gibson, G.E. Building project scope definition using project definition rating index. J. Archit. Eng. 2001, 7, 115–125. [Google Scholar] [CrossRef] [Scilit]
- Liu, B.; Huo, T.; Meng, J.; Gong, J.; Shen, Q.; Sun, T. Identification of key contractor characteristic factors that affect project success under different project delivery systems: Empirical analysis based on a group of data from China. J. Manag. Eng. 2016, 32, 05015017. [Google Scholar] [CrossRef] [Scilit]
- Williams, T.; Samset, K. Issues in front-end decision making on projects. Proj. Manag. J. 2010, 41, 38–49. [Google Scholar] [CrossRef] [Scilit]
- Alsediary, F. The Dynamics of Mega Infrastructure Decision-Making in Saudi Arabia. Ph.D. Thesis, University of Edinburgh, Edinburgh, UK, 2018. Available online: https://era.ed.ac.uk/server/api/core/bitstreams/66236b44-aab0-4855-ad86-764f28849536/content (accessed on 21 May 2026).
- Al-Kharashi, A.; Skitmore, M. Causes of delays in Saudi Arabian public sector construction projects. Constr. Manag. Econ. 2009, 27, 3–23. [Google Scholar] [CrossRef] [Scilit]
- Sacks, R.; Eastman, C.; Lee, G.; Teicholz, P. BIM Handbook: A Guide to Building Information Modeling for Owners, Designers, Engineers, Contractors, and Facility Managers, 3rd ed.; Wiley: Hoboken, NJ, USA, 2018. [Google Scholar]
- Saunders, M.; Lewis, P.; Thornhill, A. Research Methods for Business Students, 8th ed.; Pearson: Harlow, UK, 2019. [Google Scholar]
- Hair, J.F.; Black, W.C.; Babin, B.J.; Anderson, R.E. Multivariate Data Analysis, 8th ed.; Cengage Learning: Boston, MA, USA, 2019. [Google Scholar]
- Faul, F.; Erdfelder, E.; Buchner, A.; Lang, A.-G. Statistical power analyses using G*Power 3.1: Tests for correlation and regression analyses. Behav. Res. Methods 2009, 41, 1149–1160. [Google Scholar] [CrossRef] [Scilit]
- Shapiro, S.S.; Wilk, M.B. An analysis of variance test for normality (complete samples). Biometrika 1965, 52, 591–611. [Google Scholar] [CrossRef] [Scilit]
- Podsakoff, P.M.; MacKenzie, S.B.; Lee, J.-Y.; Podsakoff, N.P. Common method biases in behavioral research: A critical review of the literature and recommended remedies. J. Appl. Psychol. 2003, 88, 879–903. [Google Scholar] [CrossRef] [Scilit]
- Field, A. Discovering Statistics Using IBM SPSS Statistics, 4th ed.; Sage: London, UK, 2013. [Google Scholar]
- Keith, T.Z. Multiple Regression and Beyond: An Introduction to Multiple Regression and Structural Equation Modeling, 2nd ed.; Routledge: New York, NY, USA, 2015. [Google Scholar]
- George, D.; Mallery, P. SPSS for Windows Step by Step: A Simple Guide and Reference; Pearson: Boston, MA, USA, 2010. [Google Scholar]
- Cohen, J.; Cohen, P.; West, S.G.; Aiken, L.S. Applied Multiple Regression/Correlation Analysis for the Behavioral Sciences, 3rd ed.; Lawrence Erlbaum: Mahwah, NJ, USA, 2003. [Google Scholar]
| Disclaimer/Publisher’s Note: The statements, opinions and data contained in all publications are solely those of the individual author(s) and contributor(s) and not of MDPI and/or the editor(s). MDPI and/or the editor(s) disclaim responsibility for any injury to people or property resulting from any ideas, methods, instructions or products referred to in the content. |