Article

Using Machine Learning Models and Numerical Algorithms for Estimating the Strength of Cemented Silt Through Porosity-Binder Index


by
Jair de Jesús Arrieta Baldovino
1,*,
Oscar E. Coronado-Hernandez
2 and
Yamid E. Nuñez de la Rosa
3,*
1
Department of Civil Engineering, Universidad de Cartagena, Cartagena de Indias 130015, Colombia
2
Instituto de Hidráulica y Saneamiento Ambiental, Universidad de Cartagena, Cartagena de Indias 130001, Colombia
3
Faculty of Engineering and Basic Sciences, Fundación Universitaria Los Libertadores, Bogotá 110231, Colombia
*
Authors to whom correspondence should be addressed.
Buildings 2026, 16(11), 2169; https://doi.org/10.3390/buildings16112169
Submission received: 28 April 2026 / Revised: 21 May 2026 / Accepted: 25 May 2026 / Published: 28 May 2026
(This article belongs to the Section Building Materials, and Repair & Renovation)

Abstract

One of the recent challenges in problematic-soil improvement is the proper definition of mix design parameters, particularly cement dosage, curing time, and compaction density. Although the porosity–cement ratio has been widely used to assess the strength behaviour of cemented soils, traditional empirical approaches often fail to capture the complex nonlinear interactions among soil structure, binder content, and curing conditions. In parallel, existing machine learning (ML) algorithms have shown significant potential for predicting the behaviour of geotechnical materials; however, most previous studies rely exclusively on data-driven models without incorporating physically meaningful parameters associated with cementation mechanisms. In this context, this study proposes a predictive framework for estimating the strength of silt stabilised with three types of hydraulic cement by integrating the porosity–cement index with ML algorithms and numerical optimisation methods. Initially, the mechanical response was correlated using the porosity–cement ratio with an exponent of 0.40. Subsequently, ML techniques were applied using cement type, cement content, soil content, dry density, and curing time as input variables. During the optimisation process, the exponent was refined to 0.423, remaining close to the conventionally obtained value. The results demonstrate that integrating the porosity–cement index with machine learning provides a reliable and physically consistent framework for predicting the strength behaviour of cemented silts, enabling a more rational and efficient mix design methodology for ground improvement applications.

1. Introduction

Improved soil–cement mixtures have been the subject of numerous studies conducted on different types of geomaterials [1,2,3,4,5,6]. Recently, increasing attention has been given to the use of alternative cementing agents to enhance the strength of low-plasticity silts (e.g., [7,8,9]). The main challenge in stabilising silts lies in establishing a rational mix design methodology, as their particle characteristics and mechanical behaviour differ significantly from those of sands and clays. This makes silts particularly interesting from the standpoint of strength, stiffness, and durability [10,11]. In this context, recent studies by Baldovino et al. [12] have advanced the application of the porosity–cement index to predict the strength of cemented silts. Recent advances have shown that combining physically based models with intelligent algorithms can significantly improve engineering prediction systems. Wang et al. reported an intelligent monitoring framework integrating physical mechanisms and advanced predictive algorithms for structural performance assessment [13]. This hybrid approach is conceptually consistent with the present study, where the porosity–cement index is combined with machine learning techniques to improve the prediction of cemented soil behaviour.
When artificially cemented soils are used as compacted layers over weak subgrades, failure typically occurs due to tensile stresses at the base of the improved layer. Therefore, it may appear more appropriate to use tensile strength as a design parameter for soil–cement materials. However, experimental evidence indicates that the tensile strength of soil–cement mixtures typically ranges between 9% and 14% of their unconfined compressive strength [14]. Small variations in porosity, particularly in specimens with higher cement contents, can lead to significant increases in unconfined compressive strength. This behaviour is attributed to the reduction in void space, which results in a greater number of interparticle contacts and, consequently, a more efficient load-transfer mechanism [15]. It is also recognised that variations in water content influence strength through their effect on the soil structure developed during compaction. In this context, water content plays a fundamental role in determining particle arrangement and the effectiveness of bonding. In some cases, the water content that maximises strength and durability does not necessarily coincide with the water content that produces the maximum dry unit weight [16].
When water present in the soil comes into contact with cement, rapid hydration occurs, leading to the formation of primary hydration products such as calcium silicate hydrates (C–S–H), calcium aluminosilicate hydrate phases (C–A–S–H), sulfate hydrates including ettringite (AFt) and monosulfate (AFm), and hydrated lime [17,18].
The reactions occurring in soil–cement systems can be classified as primary and secondary. In highly granular soils with little or no clay content, cementation is mainly governed by primary reactions. In contrast, in predominantly clayey soils, cementation is largely controlled by secondary reactions [19]. Cement hydration increases the pH of the pore water, creating an alkaline environment. Silica and alumina present in the soil, which behave as acidic components, are dissolved by the strong bases generated from cement compounds. This process occurs through the dissolution of clay minerals and amorphous materials at the particle surface and is analogous to the reaction between a weak acid and a strong base [20]. In clayey soils, the reaction with cement tends to be slower. Soft clays and organic soils, such as peat, typically exhibit low natural unit weights and large void ratios, with the voids predominantly filled with water. For stabilisation purposes, this water must be partially replaced by a cementing agent, commonly Portland cement, to promote the development of a bonded and mechanically stable structure [21].
Recent studies have demonstrated significant advances in sustainable soil stabilisation using alternative binders, geopolymers, nano-additives, polymers, fibres, and bio-based materials. Shetgar and Apte [22] reviewed geopolymer-based stabilisation techniques for expansive soils contaminated with microplastics and reported substantial improvements in unconfined compressive strength, California Bearing Ratio (CBR), and shrink–swell resistance, highlighting the growing importance of sustainable stabilisation technologies. Similarly, Fattahi et al. [23] investigated alkali-activated construction waste binders for sandy soil stabilisation and obtained qu values up to 6.76 MPa after 28 days of curing, while also demonstrating significant reductions in CO2 emissions compared with ordinary Portland cement. Chen et al. [24] evaluated sodium polyacrylate as an eco-friendly stabiliser for expansive soils and reported reductions of up to 54.57% in the free swelling ratio together with substantial improvements in shear strength and compressive behaviour. In another sustainable approach, Petcherdchoo et al. [25] applied microbially induced carbonate precipitation (MICP) to sandy soils and achieved increases of approximately 211% in the initial shear modulus through enhanced calcium carbonate precipitation and cementation. Kannan et al. [26] stabilised organic silt using chitosan nanoparticles and observed qu increases of up to 146% after 90 days of curing, accompanied by permeability reductions of approximately 69%.
Hatefi et al. [27] demonstrated that nano-silica and GGBS significantly improved the mechanical performance and freeze–thaw durability of loess soils, increasing qu values by up to 24 times while reducing carbon emissions by more than 60%. Likewise, Chen et al. [28] reported synergistic effects between nano-silica and polypropylene fibres, achieving peak qu values of 923.1 kPa and enhanced durability against wet–dry and freeze–thaw cycles. Barimani et al. [29] studied nano-calcium carbonate stabilisation of collapsible soils and observed increases of approximately 90% in qu and 155% in indirect tensile strength. Sustainable fibre- and biochar-based stabilisation methods have also shown promising results. Chen et al. [30] demonstrated that the combination of biochar and sisal fibres effectively improved the compressive strength and deformation behaviour of expansive soils through fibre bridging and interfacial friction mechanisms. In field applications, Kuttah and Olsson [31] evaluated enzyme-based stabilisation for forest roads and reported increases of up to 17% in the dynamic deformation modulus.
Liu et al. [32] used a green polymer-based admixture for expansive subgrade improvement and achieved increases of 170.1% in soaked CBR and 40.2% in resilient modulus. Anjum et al. [33] investigated the combined use of calcium carbide residue and rice husk ash, observing significant improvements in qu and CBR together with reductions in swelling potential. Hayder et al. [34] demonstrated that paper sludge ash-based geopolymers substantially enhanced the mechanical performance and permanent deformation resistance of sandy soils. Furthermore, Chen et al. [35] evaluated lignin–cement stabilisation of contaminated lateritic clay and confirmed the formation of cementitious products such as C–S–H and ettringite responsible for strength improvement.
Pasupuleti et al. [36] highlighted the growing need for reliable predictive tools in geotechnical engineering, demonstrating that ensemble-based machine learning (ML) models such as LSBoost can accurately estimate the unconfined compressive strength (UCS) of stabilised soils, achieving coefficients of determination up to 0.96. Their findings emphasise that although conventional laboratory procedures are robust, they are often time-consuming and impractical for large-scale applications, thereby motivating the adoption of data-driven approaches. Similarly, Ghorbanzadeh et al. [37] explored advanced machine and deep learning techniques—including LSTM and XGBoost—to predict the California Bearing Ratio (CBR) of soils stabilised with agro-industrial residues, reporting prediction accuracies exceeding R = 0.95. Their study further demonstrated that key geotechnical variables, such as cement content, plasticity index, and compaction parameters, exert dominant control on mechanical performance.
Vinay et al. [38] investigated the stabilisation of expansive soils using cementitious and supplementary binders, integrating ML models such as Random Forest and XGBoost to predict UCS and CBR. Their results revealed excellent predictive capability (R2 = 0.99) and confirmed that cement dosage and curing time are the most influential parameters governing strength development. In parallel, Luo et al. [39] developed interpretable ML frameworks for geopolymer-stabilised soils under extreme environmental conditions, achieving R2 values of around 0.95 and identifying curing conditions and stress states as critical variables. These findings demonstrate the robustness of ML in capturing complex thermo-mechanical interactions that are difficult to model using traditional empirical approaches.
El-Sekelly et al. [40] extended the application of explainable artificial intelligence (XAI) to bio-cemented sands, combining ensemble learning techniques with interpretability tools such as SHAP to quantify the influence of microstructural and chemical variables on UCS. Their results confirmed the strong nonlinear relationships between void ratio, chemical concentrations, and strength development. Likewise, Lal et al. [41] showed that ML models, particularly Random Forest, can effectively replace conventional experimental procedures for predicting stabilisation performance, achieving prediction accuracies between 75% and 80% while significantly reducing laboratory effort.
More recent studies have focused on hybrid and optimisation-based ML approaches. Yadav et al. [42] proposed a quantum neural network–based model, achieving R2 values close to 0.99 for predicting multiple geotechnical properties, while Ghavami and Naseri [43] demonstrated that CatBoost models can accurately capture the nonlinear influence of curing time and additive content on qu. Furthermore, Luo et al. [44] introduced data-driven frameworks combining ML and interpretability techniques, highlighting the importance of chemical activators and mixture composition in strength evolution.
The first rational mix design methodology for soil–cement mixtures was proposed by Consoli et al. [45] based on the voids–cement ratio (η/Civ), defined as the porosity of the compacted mixture divided by the volumetric cement content. This parameter has been successfully used to estimate the unconfined compressive strength of soil–cement mixtures. In their study on a clayey sand, the authors demonstrated that no consistent relationship exists between unconfined compressive strength and the water–cement ratio (w/c), defined as the mass of water divided by the mass of cement. Consoli et al. [45] argued that the water–cement ratio is not applicable in such systems because the voids are only partially filled with water, in contrast to previous assumptions of Horpibulsuk et al. [46].
For soil–cement blends, Consoli et al. [45] proposed an empirical equation for the estimation of unconfined compressive strength (qu), expressed in the following form (Equation (1)):
q u = A η C i v x B
where initial porosity (η) is expressed as a percentage of the volume of voids divided by the total volume of the specimen, while the volumetric cement content (Civ) is expressed as a percentage of the volume of cement divided by the total volume of the specimen; and A, x, and B are materials-related parameters related to the type of soil and the type of binder, as well as their interaction. Thus, many mixtures have been studied using this semi-empirical relationship, for soil-reinforced soils [47], soil–lime blends [48,49], stabilised marine clay [50] and alluvial clays [51]. Although numerous studies have examined the application of the porosity–cement relationship, only a few investigations by Diambra et al. [52,53] have approximated the values of the constants A, x, and B. These constants are not empirical and have a physical–mechanical value. However, they have only been demonstrated through modelling for clean sands. Therefore, mathematical approximations and optimisation of the actual values of these factors are fundamental.
Despite these advances, most existing studies rely exclusively on data-driven models without incorporating physically meaningful parameters such as x, B and A, which describe soil structure and cementation mechanisms according to Equation (1). In this context, the porosity–cement index (η/Civ) has been widely recognised as a robust theoretical framework capable of normalising the combined effects of porosity and binder content on mechanical behaviour. However, its integration with machine learning techniques for the prediction of cemented geomaterial strength remains limited. Therefore, this study proposes a hybrid mechanistic–surrogate modelling framework integrating the porosity–cement index with ML algorithms to predict the compressive and tensile strength of cemented silt mixtures. Specifically, the study aims to optimise the constants (x, B, and A) for silt mixtures stabilised with three different types of cement and cured for 28 days, while simultaneously evaluating the predictive capability of machine learning models for estimating the mechanical behaviour of the mixtures.

2. Geotechnical Analysis and Experimental Facility Configuration

2.1. Materials

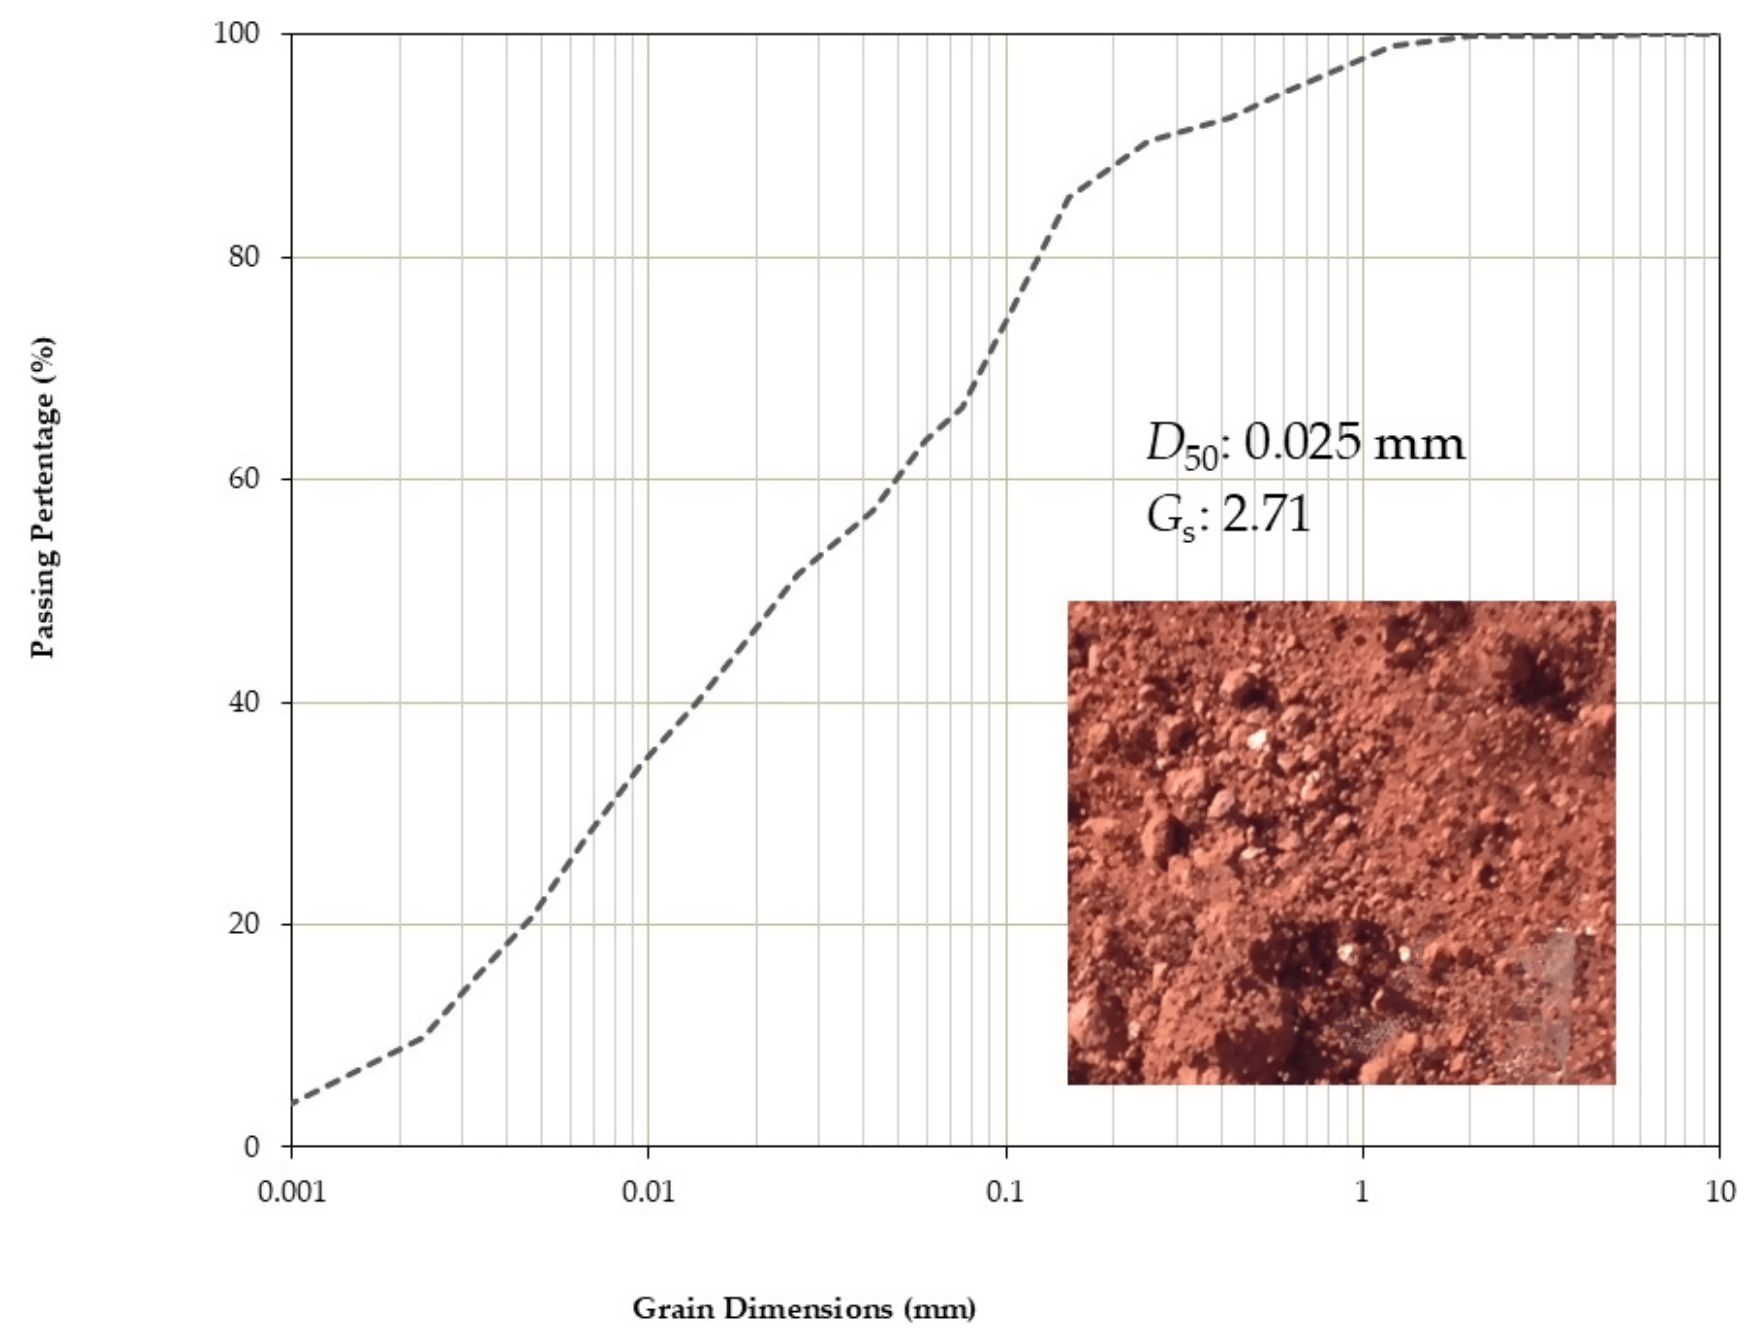
The soil used in this study corresponds to a pink-coloured silt from the metropolitan region of Curitiba, Brazil. The material was collected from an excavation site associated with the construction of social housing. The soil was obtained in a disturbed condition at a depth of 1.5 m and in sufficient quantity to perform all the required tests. For classification purposes, the following tests were conducted: natural water content, specific gravity, liquid limit, plastic limit, particle size distribution using sieving and sedimentation, chemical composition, and mineralogical composition. Figure 1 shows the soil’s granulometric curve and a photo of the collected sample. Table 1 presents the results of soil geotechnical characterisation.
The studied soil is classified as a high-plasticity silt (MH) according to the Unified Soil Classification System (USCS) [54], exhibiting a liquid limit (LL) of 53.1% and a plasticity index (PI) of 21.3%. The particle size distribution is dominated by fine fractions, with 57.6% silt and 9.3% clay, while sand content is relatively limited (33.4% in total, primarily fine sand). No gravel fraction was identified. The mean particle size (D50) of 0.025 mm further supports the predominance of silt-sized particles. The specific gravity (Gs) is 2.71.
The cements used were commercial CPII, CPIV, and CPV (Brazilian nomenclature). Each cement was characterised using fineness and density tests according to the Le Chatelier method. The water used to prepare soil–cement specimens and for material characterisation was distilled to avoid undesirable chemical reactions. Table 2 summarises the cement properties and chemical composition.

2.2. Preparation Protocols of Soil–Cement Specimens

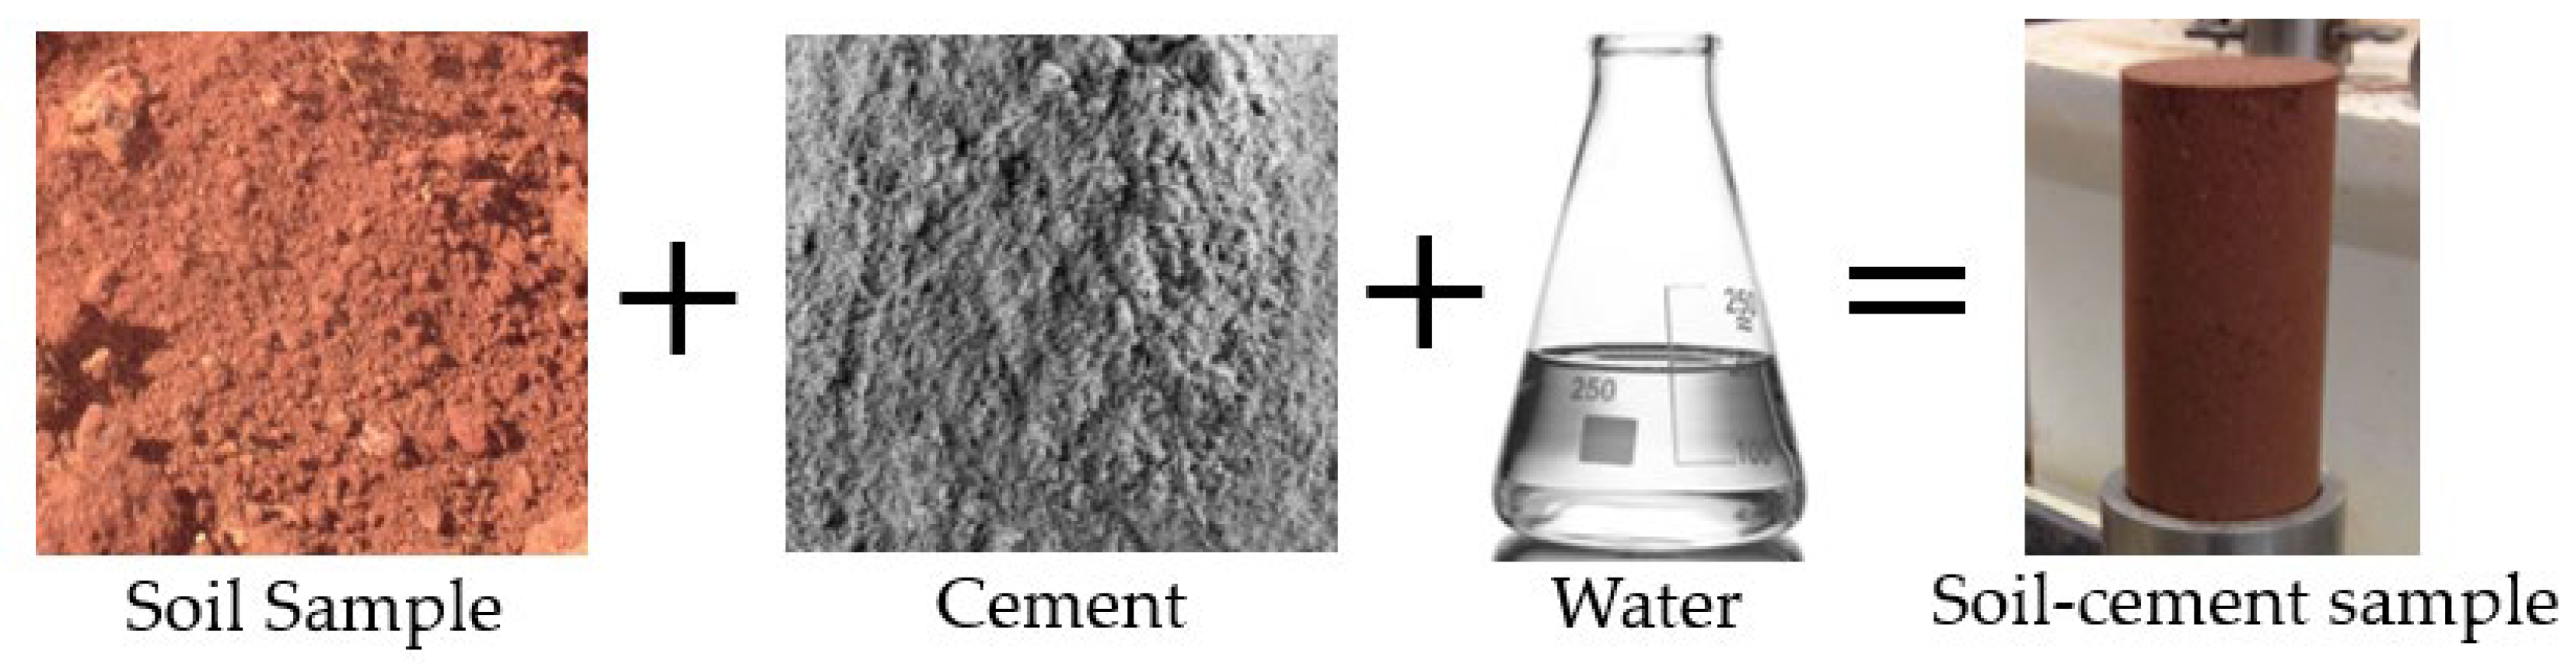
Table 3 presents the moulding conditions for soil–cement specimens. Four dry unit weights γd of 15.10, 14.43, 13.77 and 13.10 kN/m3 were chosen, and a moisture content of 23% was fixed. For each compaction point, three identical specimens were compacted. A total of 48 specimens were compacted by cement; the total was 144. Figure 2 summarises the soil–cement sample preparation process.
For the preparation of the soil–cement specimens, the soil was first oven-dried, disaggregated to break down clay lumps, and subsequently sieved to ensure homogenization of the material before mixing and compaction. Each proportion corresponding to an individual specimen was separated and mixed with the desired cement content, namely 3%, 5%, 7%, and 9% by dry weight of soil. Subsequently, water was added to achieve a moisture content of 23%, which corresponds to the optimum moisture content for this soil, as reported by Baldovino et al. [12].
Each moist mixture was divided into three equal portions and compacted in three layers within a stainless-steel mould until the target dry density (γd) was achieved. The specimens were then extruded using a hydraulic jack. A portion of the remaining material was oven-dried to determine the moisture content.
The first and second layers were scarified to improve interlayer bonding. The specimens were then sealed with plastic film and stored in a humid chamber at 95% relative humidity for 28 days of curing.
Before and after curing, each specimen was weighed, and its diameter and height were measured. The following acceptance criteria were adopted for compression testing: dry unit weight ±0.1 kN/m3, moisture content ±0.1%, and dimensions (height and diameter) ±1 mm.

2.3. Soil–Cement Initial Porosity Calculations

The specimens prepared for the unconfined compressive strength tests are composed of four volumetric and weight phases: soil, cement, water, and air. The amount of dry powdered cement (e.g., c = 3%, 5%, 7%, and 9%) was added with reference to the dry mass of the soil. To determine the volume of soil solids contained in the soil–cement specimen, the dry mass of soil must be divided by the specific unit weight of the soil grains ( γ S ). The specific unit weight of the soil grains is obtained from the product between the specific gravity of the soil particles and the unit weight of water. Thus, the porosity value can be calculated as follows:
η = 100     100 γ d 1 + c 100 1 γ S + c 100 γ C
where γ C is the specific gravity of cement particles and γ d is the dry unit weight of the specimen detailed in Table 3. The volumetric cement content (Civ) is defined as the ratio between the cement volume and the total specimen volume. Thus, the volumetric cement content (Civ) can be calculated using Equation (3):
C i v = 100 γ d   1 + c / 100 c 100 / γ C
The volumetric cement content increases with increasing cement content, whereas the porosity-to-volumetric cement content ratio decreases. Therefore, according to Consoli’s equation (Equation (1)), a relationship between voids and cement can be established, referred to as the voids-to-cement ratio or the porosity-to-volumetric cement content ratio.

2.4. Unconfined Compressive Test

After curing for 28 days, the specimens were weighed and placed in a tank of distilled water to ensure saturation and avoid suction effects on mechanical strength. They were left in the tank for 5 h, as recommended in [55,56]. After this, they were weighed again. The unconfined compression tests followed the standard ASTM D2166 [57] protocols. The tests were performed on an automatic press with a capacity of 5 kN and a constant speed of 1 mm-minute.

3. Proposed Simulation Methodology

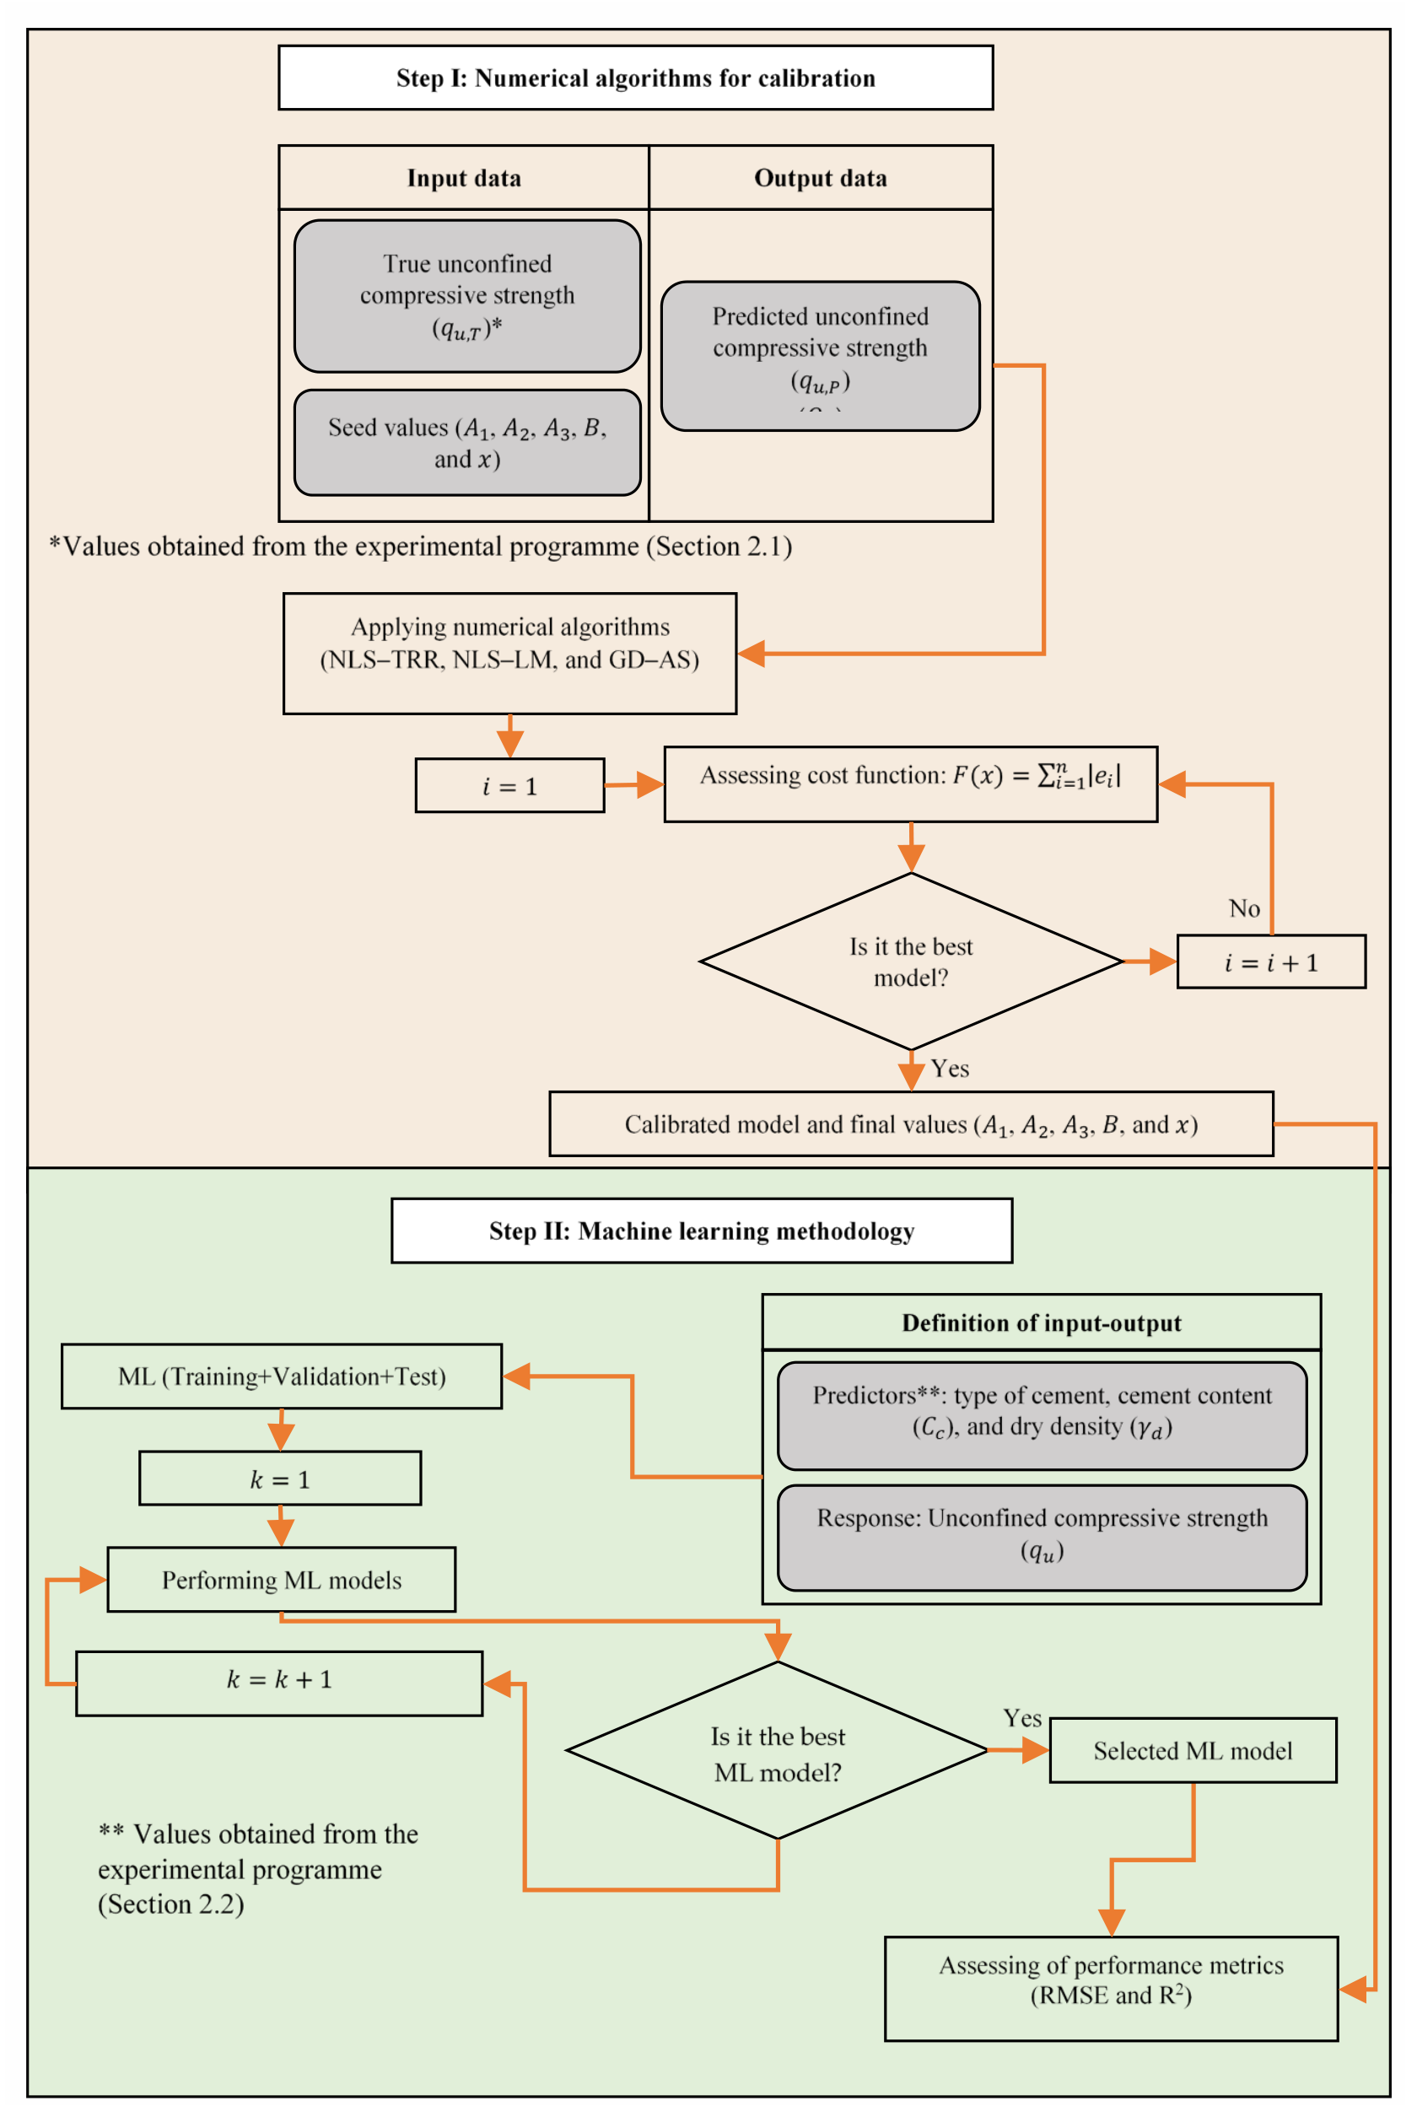
This section presents the simulation methodology proposed in this study, illustrated in Figure 3. The methodology has two main steps: (i) evaluating the cost function using different calibration methods to predict the unconfined compressive strength based on traditional geotechnical formulations ( q u ); and (ii) performing a surrogate modelling analysis to estimate q u considering the type of cement, dry density, and cement content. The following subsections provide a detailed description of each step.

3.1. Numerical Algorithms for Calibration (Step I)

To compute the parameters A 1 , A 2 , A 3 , B , and x in Equation (1), it is essential to employ a suitable algorithm that allows the automatic determination of these values. The selected algorithm must also be capable of approximating the relationship x · B 1 . To evaluate the adequacy of the most appropriate optimisation method, two numerical solution schemes are considered, as presented below.
  • Nonlinear least-squares method (NLSM): This method solves nonlinear least-squares problems of the form,
    F ( x ) 2 2 = m i n f 1 x 2 + f 2 x 2 + + f n x 2
    subject to the following constraints:
    s . t . x _ x x _
    where f i x corresponds to the i -th residual.
  • Gradient descent method (GDM): It approximates the function locally using a linear representation around the current point and updates the variables to reduce the objective function value. The method employs the following update rule:
    f x f x 0 + f x 0 ( x x 0 )
    where f x 0 = the slope of the derivative at a point x 0 .
The two previously described methods are implemented in combination with the following algorithms:
  • Trust-region algorithm (TRA): This method computes a trial step s to minimise the cost function within a trust region, where the local approximation of the objective function is assumed to be reliable. The method is expressed as follows,
    q s ,   s   N
    where q ( s ) corresponds to the quadratic approximation of the cost function.
  • Levenberg–Marquardt algorithm (LMA): This algorithm is formulated as a local minimisation problem, where the following expression determines the optimal solution [58]:
    w = H + ς I 1 g
    where H is the Hessian matrix, ς corresponds to a regularisation parameter, I represents the identical matrix, and w is a vector of weights arranged.
  • Active-set algorithm (ASA): This algorithm can solve quadratic programming problems and uses the following minimising objective function:
J = 1 2 x T H x + f T x
Based on the optimisation methods and algorithms presented above, the following combinations were adopted in this study to evaluate the parameters A 1 , A 2 , A 3 , B , and x : NLSM-TRA, NLSM-LMA, and GD-ASA. These algorithms were evaluated using the Parameter Estimator tool in Simulink [59], considering a parameter tolerance of 0.001, a maximum number of iterations of 100, and a function tolerance of 0.001.
For each algorithm–method combination, the sum of absolute errors was adopted as the cost function, defined as follows:
C F ( x ) = i = 1 n e i
where C F is the cost function, e i is the residual error, and n corresponds to the total of observations.

3.2. Machine Learning Models (Step II)

The computations using machine learning (ML) methods were performed using the Regression Learner App in MATLAB R2024b. For all ML models, a 5-fold cross-validation scheme is used during the validation stage to prevent overfitting. In addition, during the testing stage, a hold-out set comprising 10% of the data is used for all ML methods.
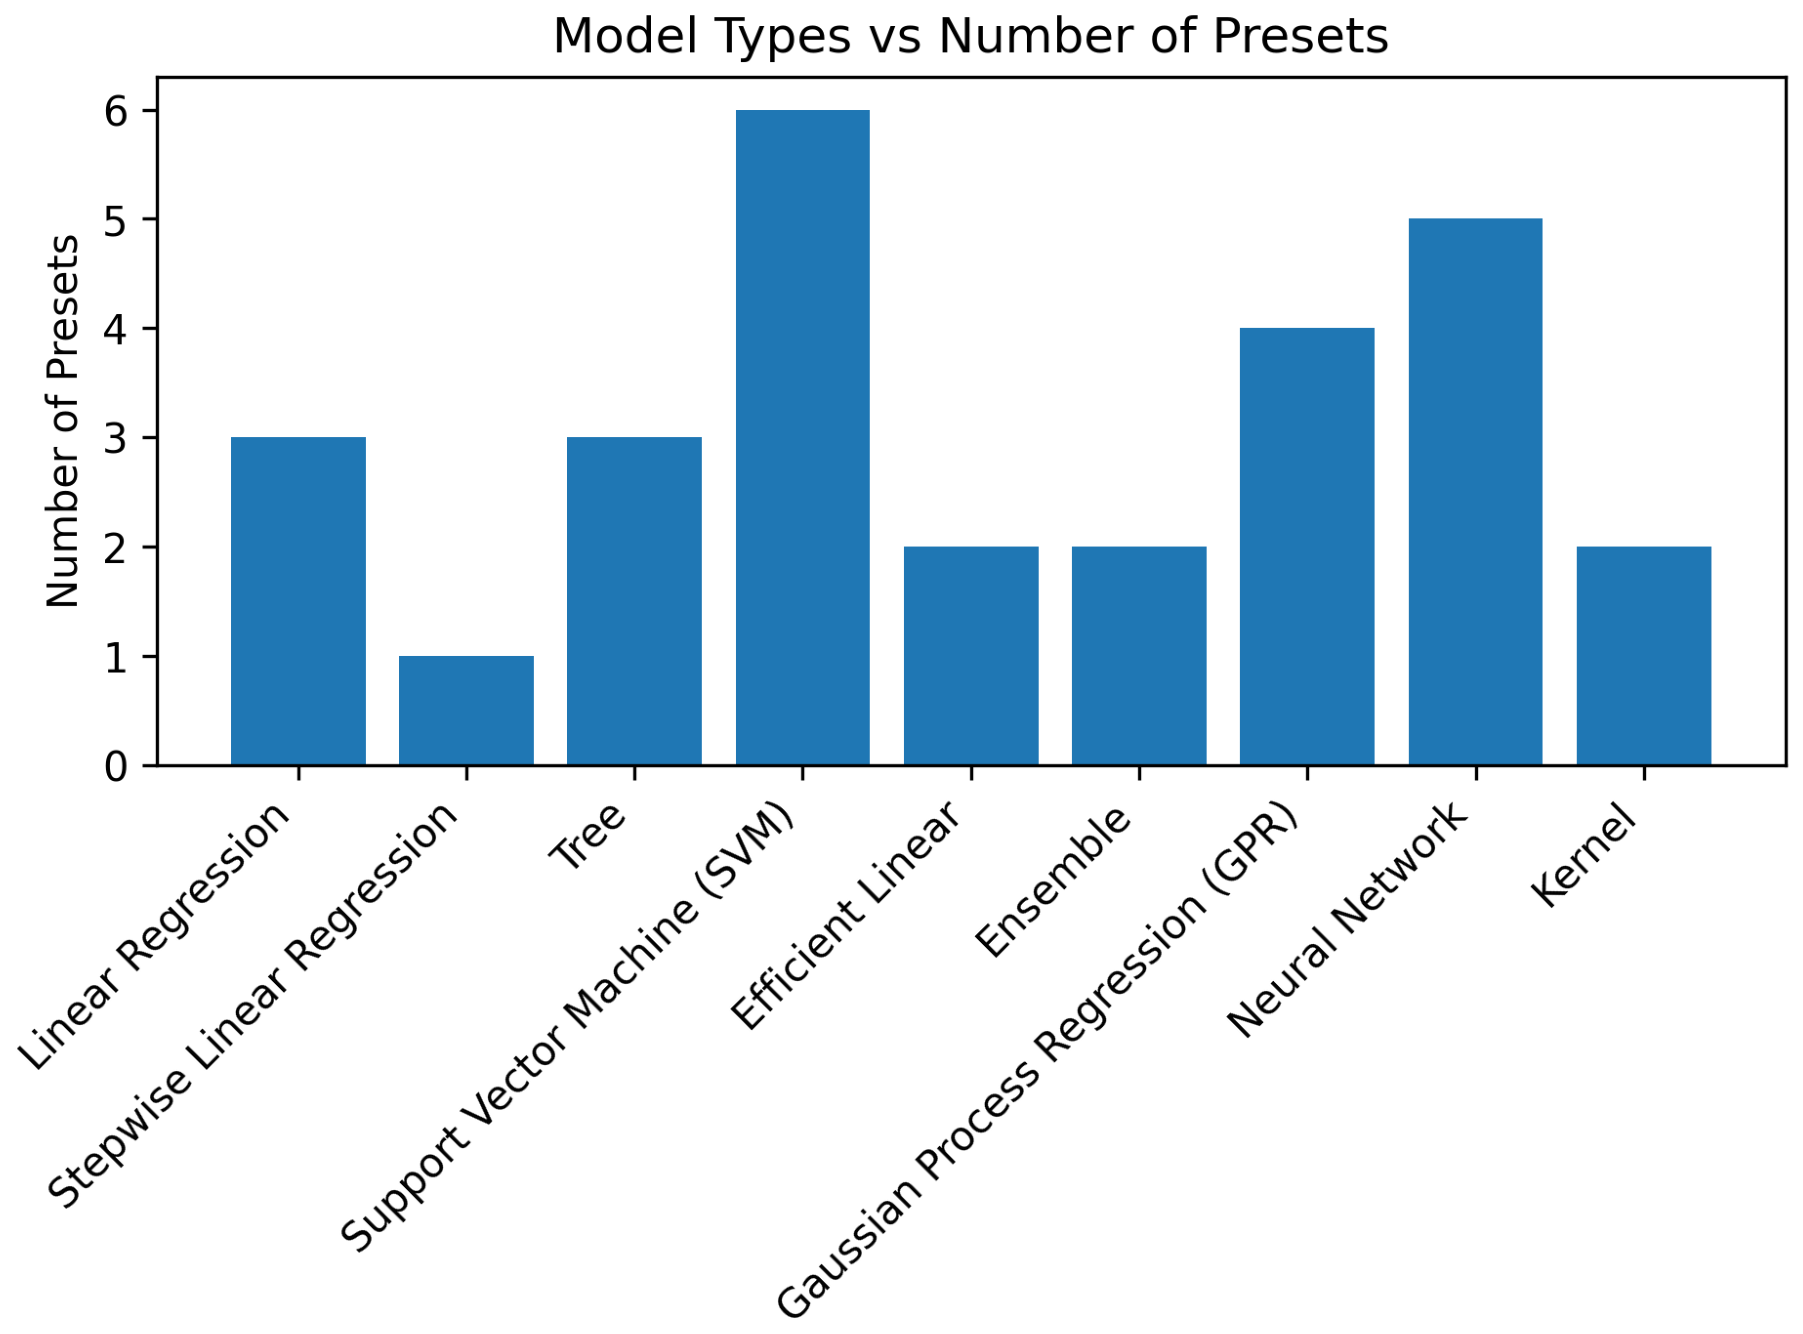
The predictors used in the models include cement type (CPII, CPIV, and CPV), cement content, and dry density, while the response variable is unconfined compressive strength. Figure 4 presents the 28 ML algorithms analysed in this study, organised by model type.
Gaussian Process Regression (GPR) models can be used for capturing nonlinear behaviour. The general formulation of GPR models is presented below.
P ( y | f ,   X ) ~ N ( y | H β + f , σ 2 I )
where β is the coefficient calculated from the observations contained in the experimental programme, y is the predicted unconfined compressive strength, N denotes the Gaussian distribution, x i represents the predictors, and σ 2 is the variance.
The matrix and vector used in Equation (9) are:
X = ( x 1 T   x 2 T   x 3 T         x n T   ) ,     y = y 1   y 2   y 3         y n   ,   H = h ( x 1 T )   h ( x 2 T )   h ( x 3 T )         h ( x n T )   ,   f = f ( x 1 )   f ( x 2 )   f ( x 3 )         f ( x n )  
where f ( x i ) is the latent variable and h ( x ) represents the set of basis functions.
The Matern 5/2 kernel function provides a suitable balance between smoothness and flexibility, making it capable of capturing the nonlinear behaviour of unconfined compressive strength. In contrast, the squared exponential GPR model is more suitable for relatively uniform materials, whereas the exponential GPR model is recommended for scenarios involving abrupt variations in qu values. The rational quadratic GPR model, on the other hand, is generally more appropriate for heterogeneous materials.
The covariance function corresponding to the Matern 5/2 kernel is expressed as follows:
k x i , x j = σ f 2 1 + 5 r σ l + 5 r 2 3 σ l 2 exp 5 r σ l
where k x i , x j denotes the covariance function, σ f corresponds to the signal standard deviation, σ f is the characteristic length scale, and r represents the Euclidean distance.
The Euclidean distance ( r ) is computed as:
r = x i x j T ( x i x j )
Two performance metrics were adopted to assess the performance of the numerical algorithms used for calibration and the ML methods:
  • Root mean square error (RMSE):
R M S E = 1 N i = 1 N ( q u , T i q u , P i ) 2
where the subscript T denotes the true value obtained from the numerical algorithms or ML models, while P represents the predicted value.
  • Coefficient of determination (R2):
R 2 = 1 i = 1 N ( q u , T i q u , P i ) 2 i = 1 N ( q u , T i q u , T _ ) 2

4. Results and Discussions

4.1. Impact of Porosity-to-Cement Index on Strength

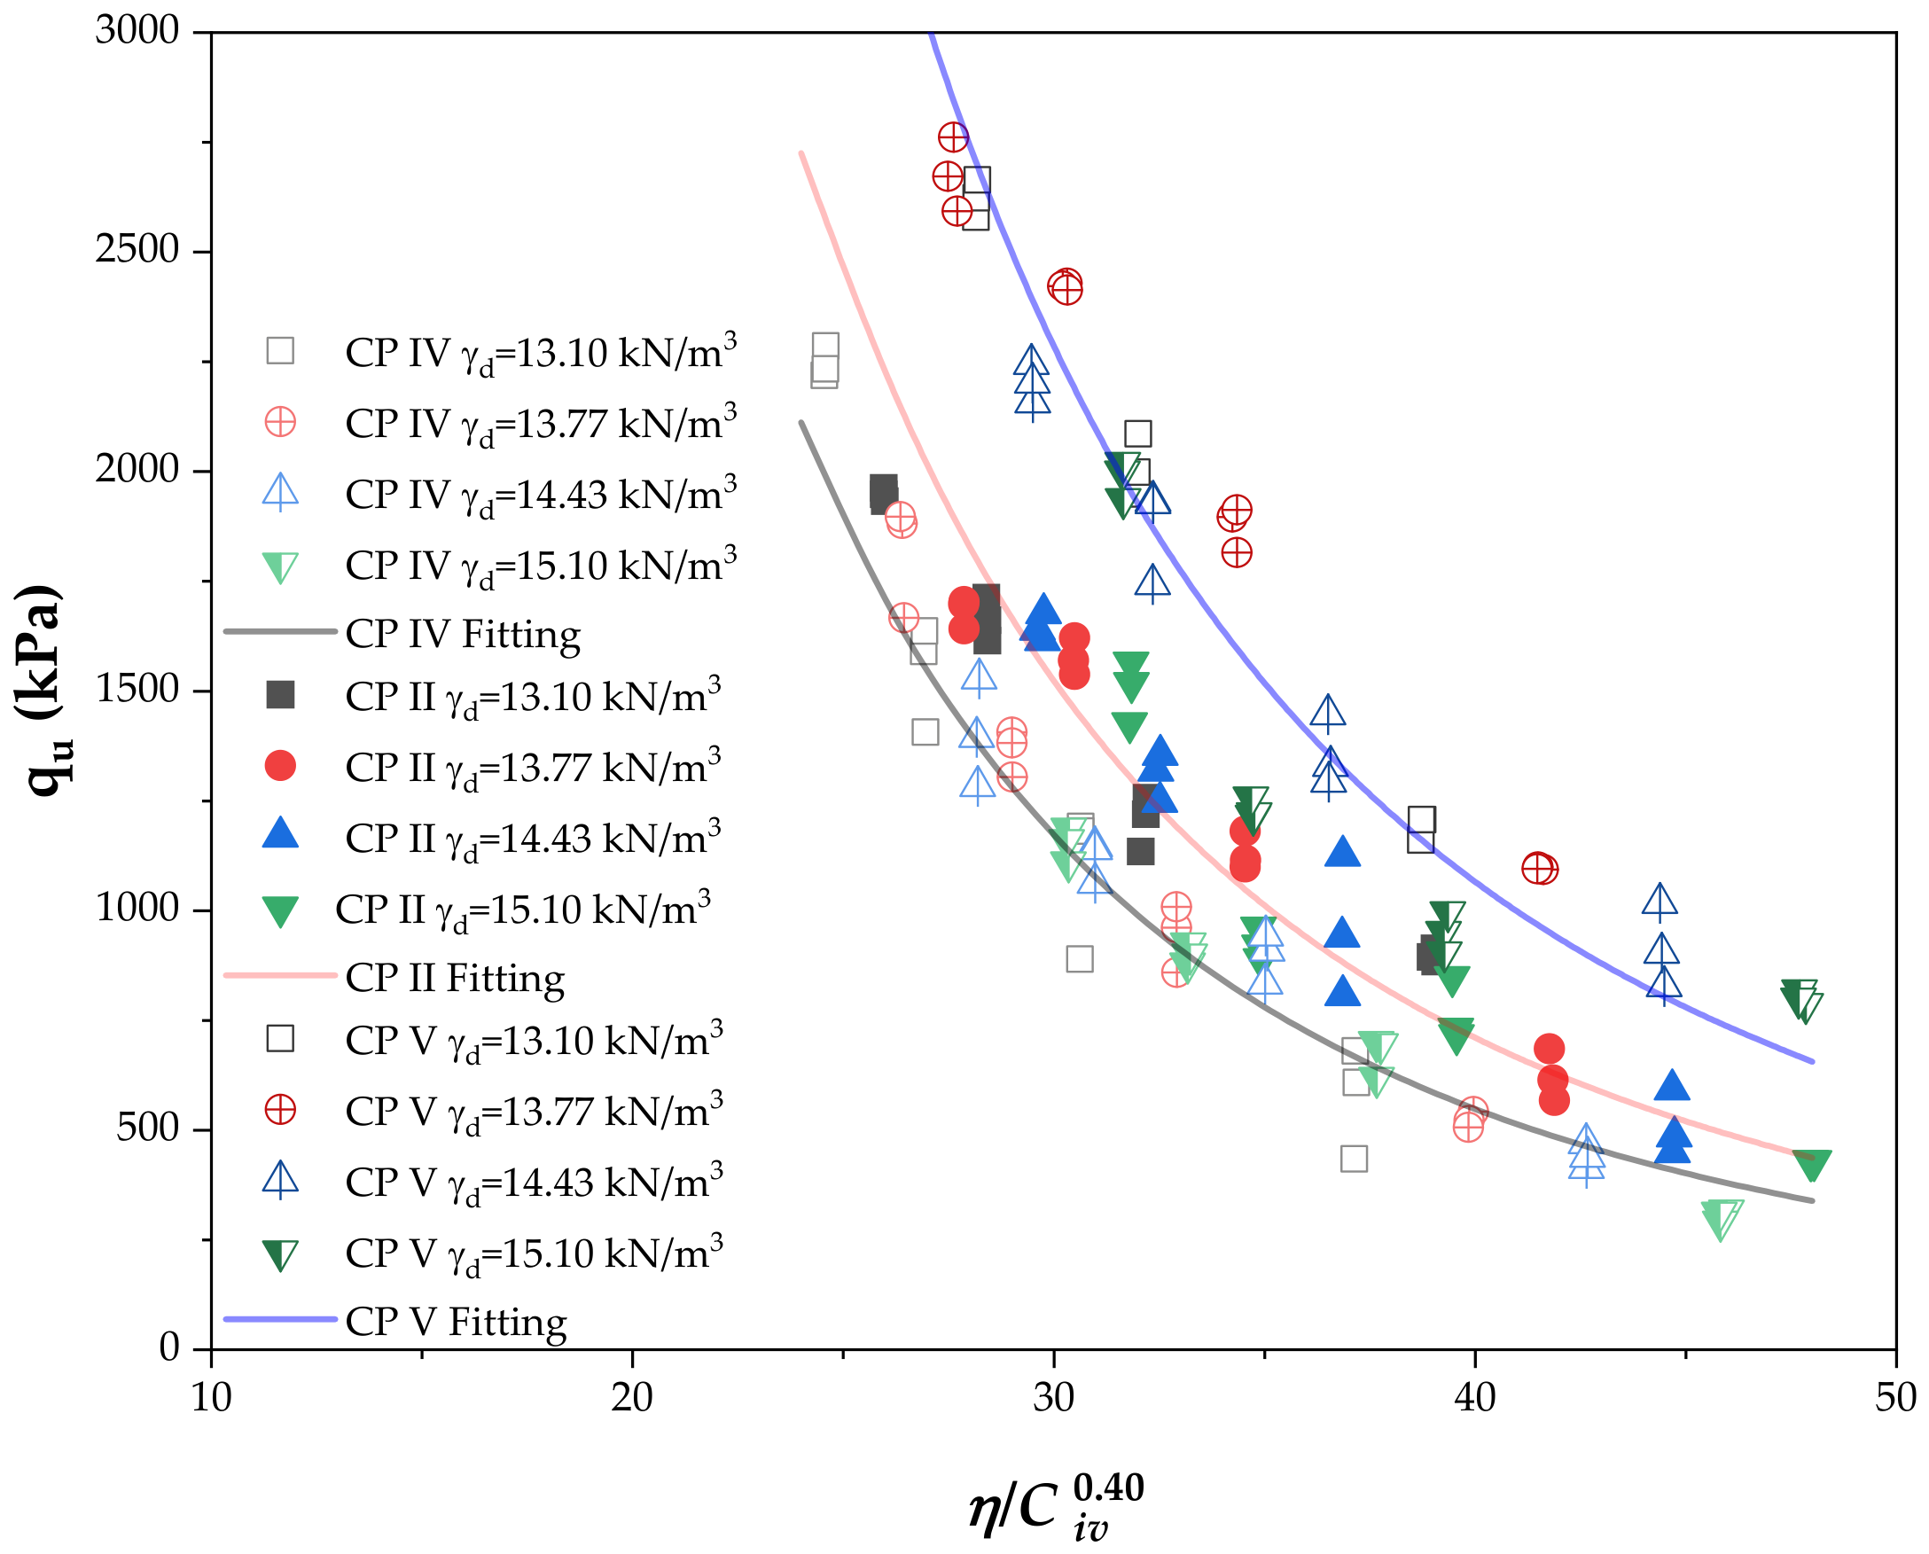
The results of the unconfined compression tests (qu) for each cement type and for the four proposed moulding dry unit weights were analysed considering the influence of the porosity–cement ratio using Equation (1). The parameters x, B, and A for each cement type were determined using a unified calibration procedure implemented in Microsoft Excel (version 2026). The best-fitting value of x was found to be 0.40, while the parameter B was equal to 2.64. Accordingly, the governing equations that describe the relationship between qu and the porosity–cement ratio are presented in Figure 5.
The highest strength values were obtained with CP V cement, which is characterised not only by its high early strength behaviour but also by its higher CaO content (60.73%), lower insoluble residue (0.77%), and greater axial compressive strength at 28 days (53 MPa) compared with CP II and CP IV cements. These characteristics enhance clinker reactivity and hydration kinetics, promoting the formation of larger amounts of cementitious products and resulting in superior mechanical performance of the stabilised silty soil mixtures. In contrast, CP IV cement presented the lowest strength values due to its higher pozzolanic content and slower hydration development.
The obtained R2 values were 0.96 for the equation governing CPV and 0.95 for both CPII and CPIV. These excellent correlations demonstrate that the porosity–cement ratio is a robust predictor of the strength of compacted silt. Moreover, the results indicate that this index exerts a dominant control over strength development, regardless of the cement type, since the parameters x and B remain essentially unchanged.

4.2. Numerical Algorithms Results

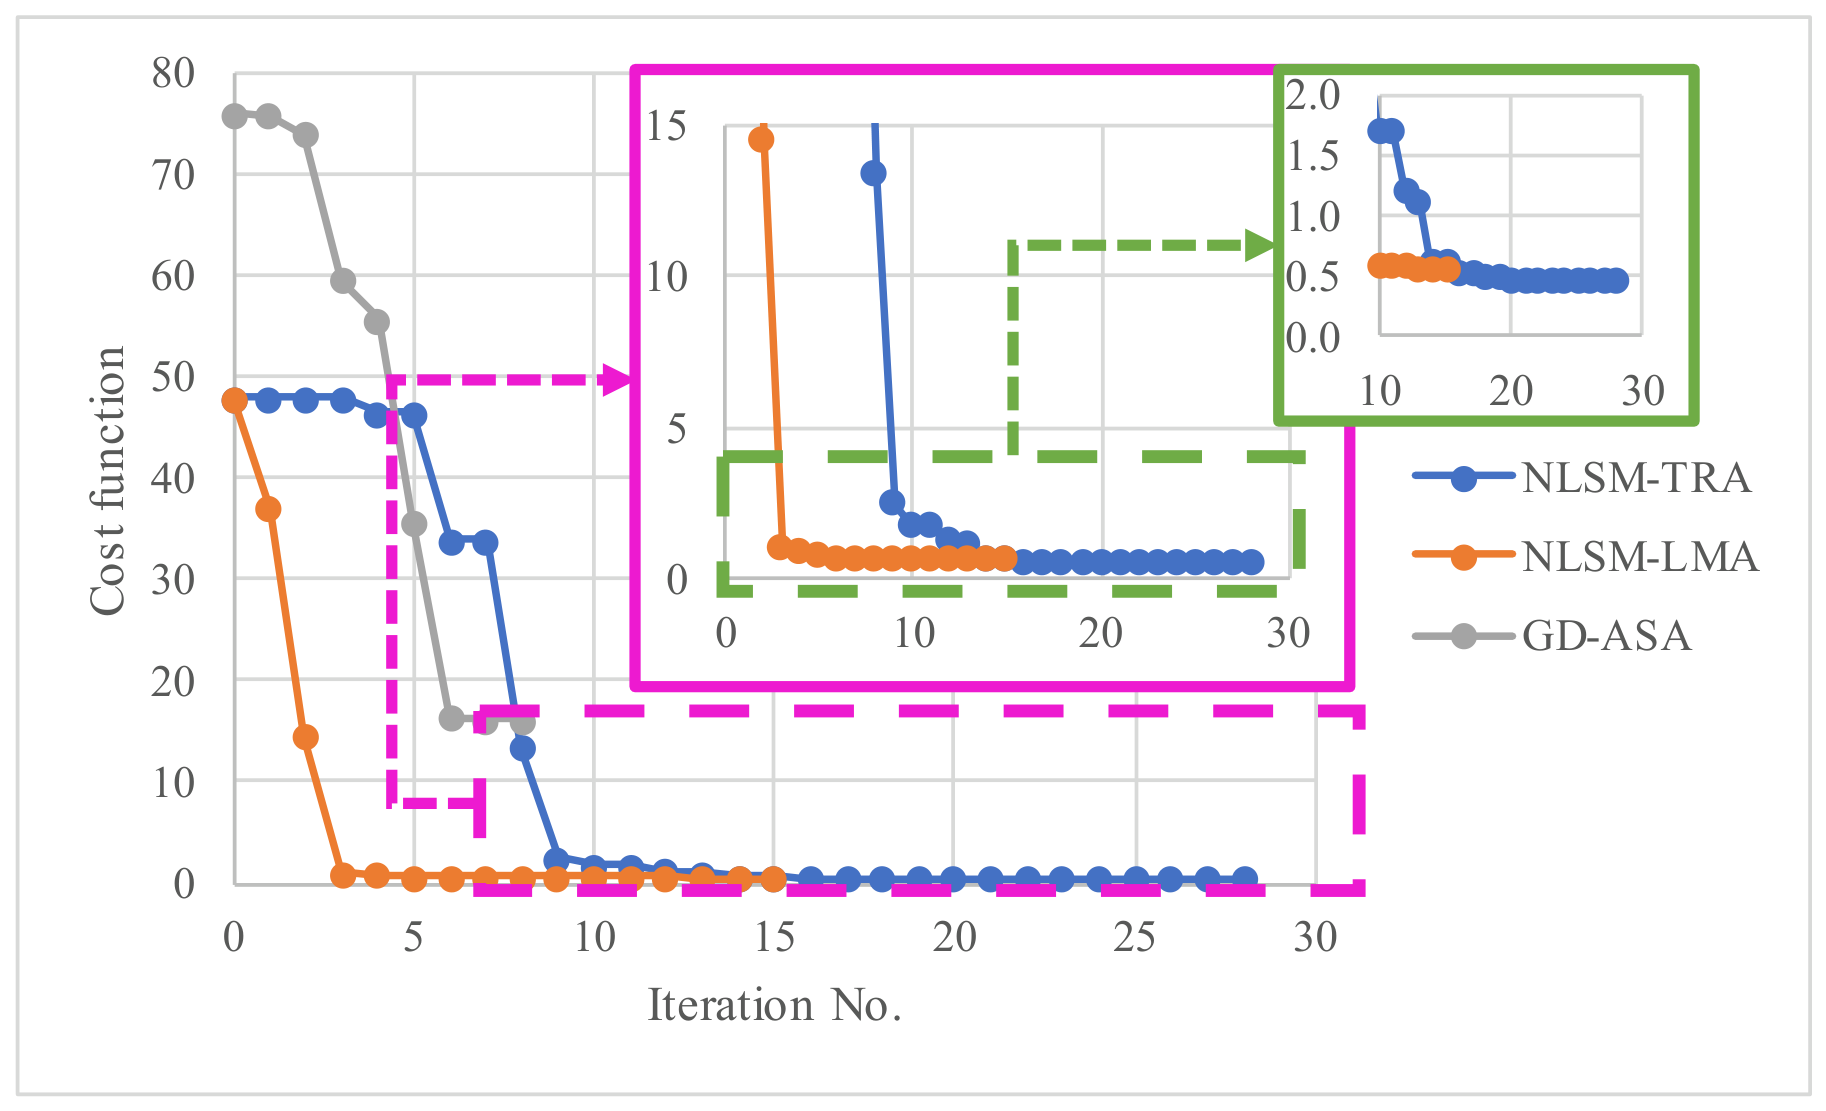
This section presents the results obtained for the computation of the parameters A 1 , A 2 , A 3 , B , and x , considering the three methodologies adopted in this study (NLSM-TRA, NLSM-LMA, and GD-ASA). Figure 6 illustrates the evaluation of the cost function for these methodologies.
The GD-ASA method exhibited the poorest fit, with a final value of 10.48 after only nine iterations. In contrast, the NLSM-TRA and NLSM-LMA approaches produced comparable results, with final values of 0.484 and 0.581, respectively. Although NLSM-TRA achieved the best calibration, it required more iterations (28) than NLSM-LMA, which converged in 15 iterations.
The assessment of the different numerical algorithms for calibration was carried out using identical initial (seed) values for the three models analysed, with Ai set to 18.0 × 10⁶, x = 0.2, and B = 5.0. Upon performing NLSM-TRA, NLSM-LMA, and GD-ASA, the values of B ranged from 2.47 to 2.87. Similarly, the parameter x varied between 0.392 and 0.452. The NLSM-TRA demonstrated the closest agreement, yielding values of x = 0.423 and B = 2.472, which are near unity (1.068). Table 4 summarises the results of the numerical algorithms.
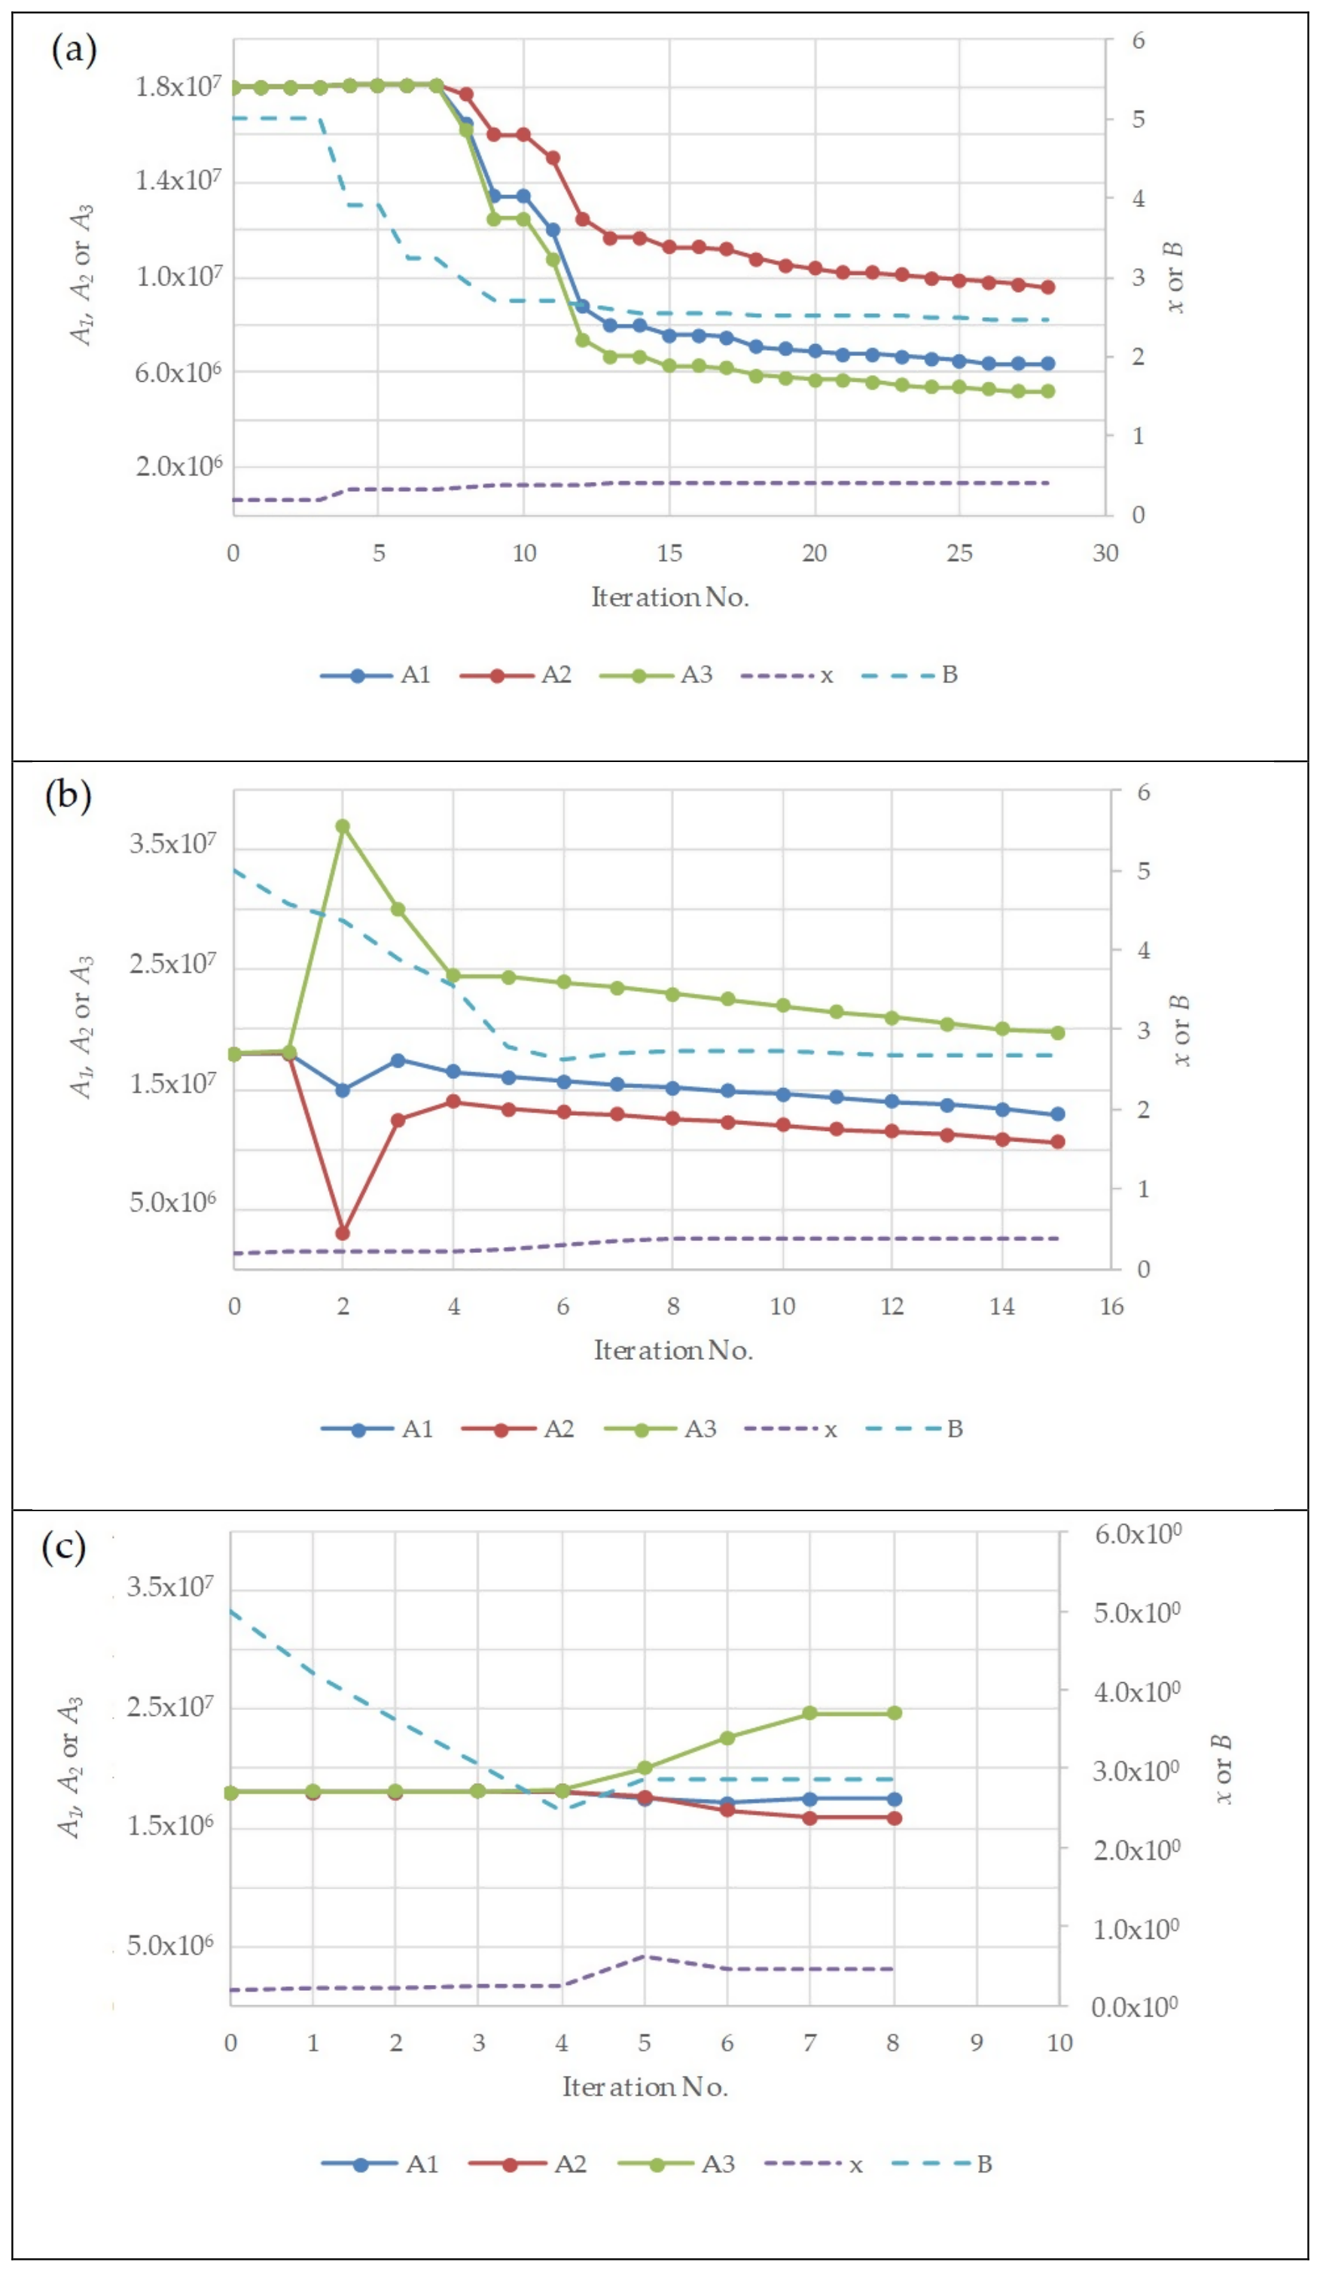
Figure 7 illustrates the evolution of the parameters over successive iterations for the three selected numerical algorithms. For NLSM-TRA, the parameter Ai decreases relative to the initial value considered (18.0 × 10⁶). By iteration 28, the parameters are A1 = 6.296 × 10⁶, A2 = 5.186 × 10⁶, and A3 = 9.567 × 10⁶.
For NLSM-LMA, only parameter A3 attains a value higher than its initial value, while the remaining parameters decrease. In contrast, GD-ASA also yields an A3 value above the initial estimate, whereas the remaining parameters fall below their initial values.
This behaviour is consistent with the type of cement used, as the strength developed with CPV (parameter A3) is higher than that obtained with CPII and CPIV.
Figure 7a illustrates how the parameters B and x evolve over successive iterations for NLSM-TRA (the best-performing model). Parameter B starts at 5.0 (iteration 0) and remains practically constant until iteration 4. At the end of the iteration process, a value of 2.472 is obtained at iteration 28, corresponding to the convergence stage. With regard to the parameter x, a value of 0.2 is observed during the initial stages of the iteration process, up to iteration four. Thereafter, this value increases until it reaches 0.423.
The main advantage of the selected algorithm (NLSM-TRA) lies in its capacity to capture the underlying physicochemical processes within the mixture. The product of x and B tends towards unity, indicating that the contributions of cement content and the degree of compaction are comparable in their influence on achieving a given strength after 28 days of curing. A value of x equal to 0.2 is associated with clean sands [53]. During the execution of the selected algorithm, the final value of 0.423 ensures consistency between the mechanical strength response and the inverse dependence governed by x.
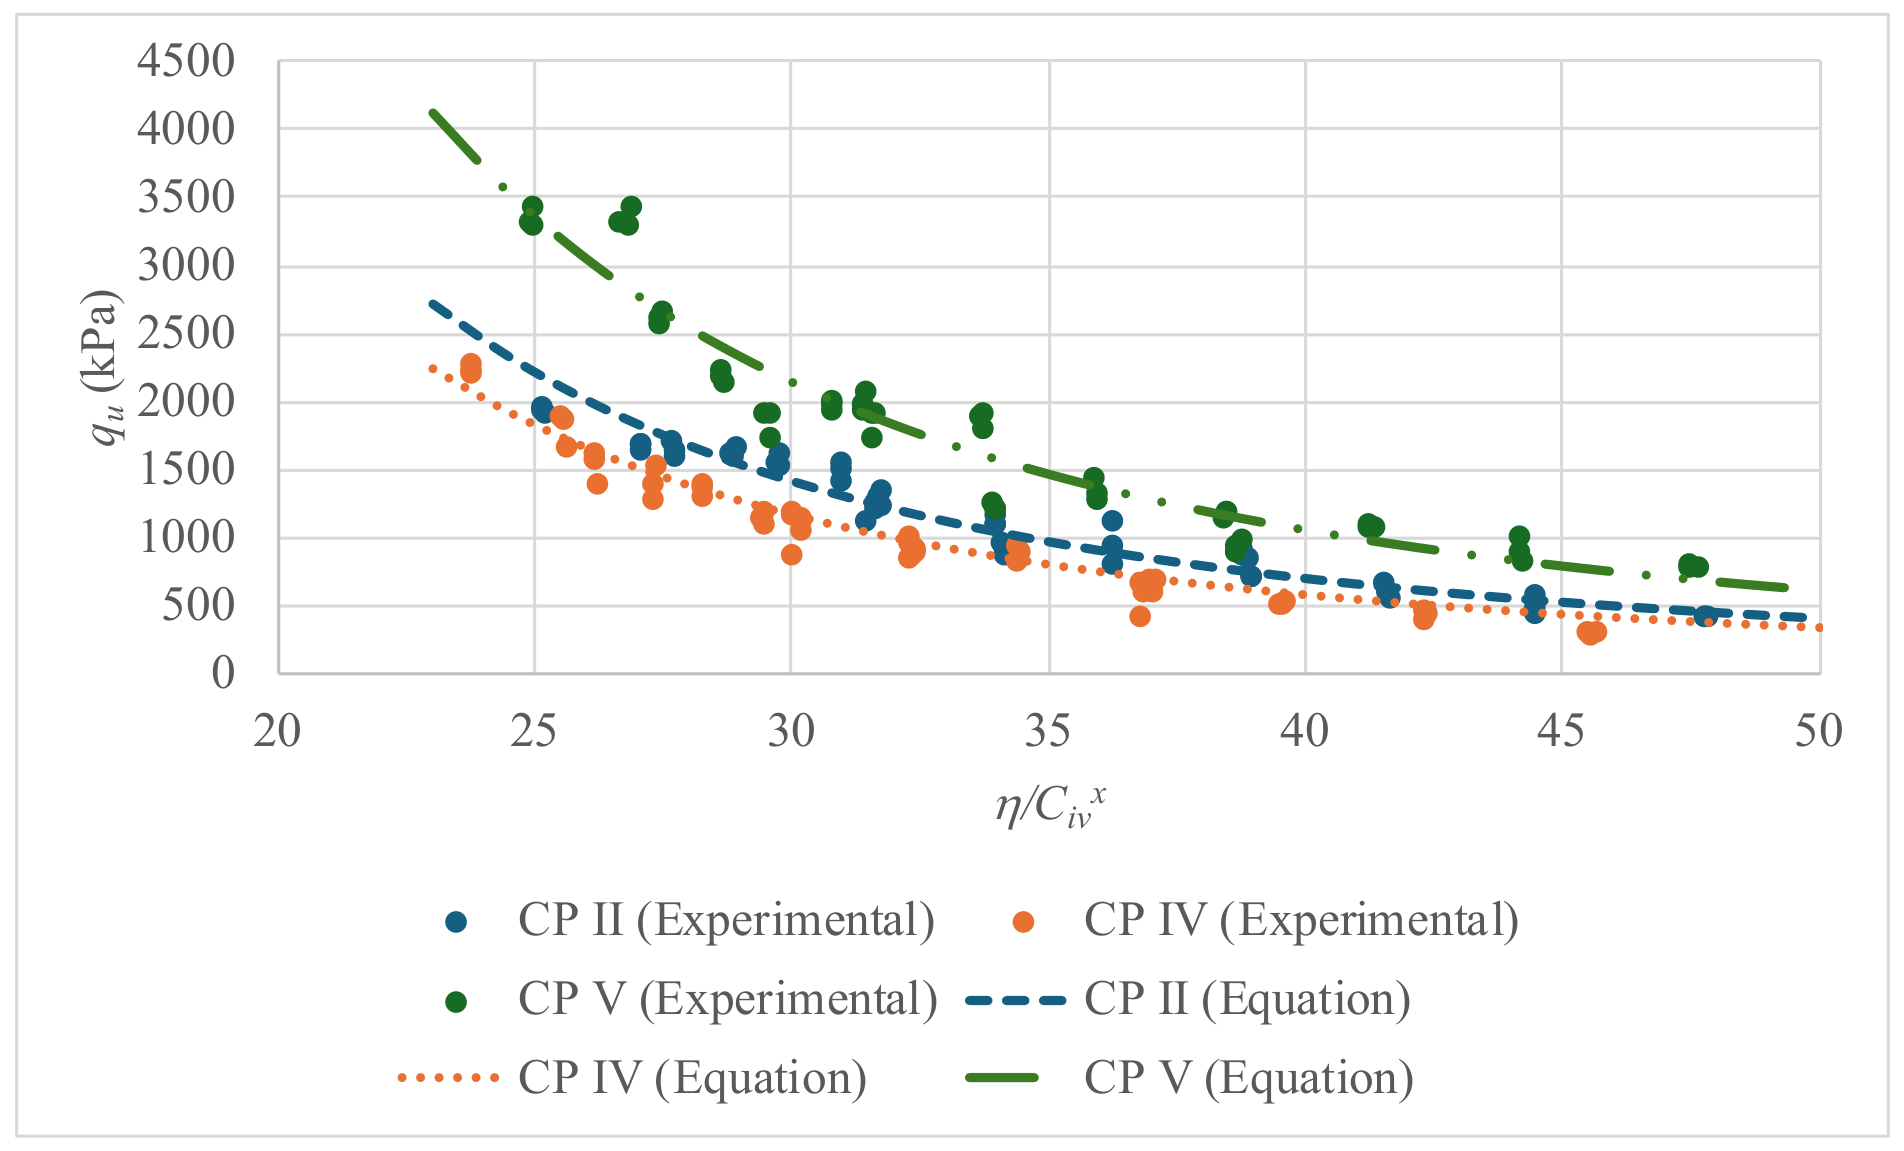
Figure 8 compares the measured unconfined compressive strength with the values predicted by NLSM-TRA. The results indicate that the equations accurately reproduce the values obtained from the experimental programme for all cement types.
  • For type II cement:
q u = 6.296 · 10 6 η C i v 0.423 2.472   ( R 2 = 0.94 )
  • For type IV cement:
q u = 5.186 · 10 6 η C i v 0.423 2.472   ( R 2 = 0.97 )
  • For type V cement:
q u = 9.567 · 10 6 η C i v 0.423 2.472   ( R 2 = 0.92 )
Compared to the original data results presented by Baldovino et al. [12], the parameter x increased slightly from 0.40 (from the conventional method) to 0.423 with the optimised procedure. The corresponding R2 values further confirm the adequacy of the approach for this type of mixture, consistently exceeding 0.90, indicating the model’s high capability to capture the mechanical behaviour accurately.

4.3. Machine Learning Results

This section presents the results obtained from the 28 ML models used in this research. Table 5 summarises the performance metrics for the validation and testing stages, as well as the hyperparameters employed. As previously mentioned, the predictors correspond to cement type, dry density, and cement content, which were used to estimate unconfined compressive strength. For each model, the RMSE and R2 values were computed in order to identify the most suitable model for the validation and testing stages. In addition, the model hyperparameters are summarised.
According to the results, the Matern 5/2 Gaussian Process Regression (GPR) model is the most suitable for representing the unconfined compressive strength across both analysed stages. RMSE values of 92.782 kPa and 117.260 kPa were obtained for the validation and testing stages, respectively, while R2 values of 0.982 and 0.962 were achieved. These values are highlighted in grey.
The remaining GPR models offer comparable performance to the Matern 5/2 model. In contrast, the cubic support vector machine (SVM) model presented the poorest fit, yielding even negative R2 values. Neural network models yielded reasonable results, with R2 values ranging from 0.951 to 0.973 during validation.
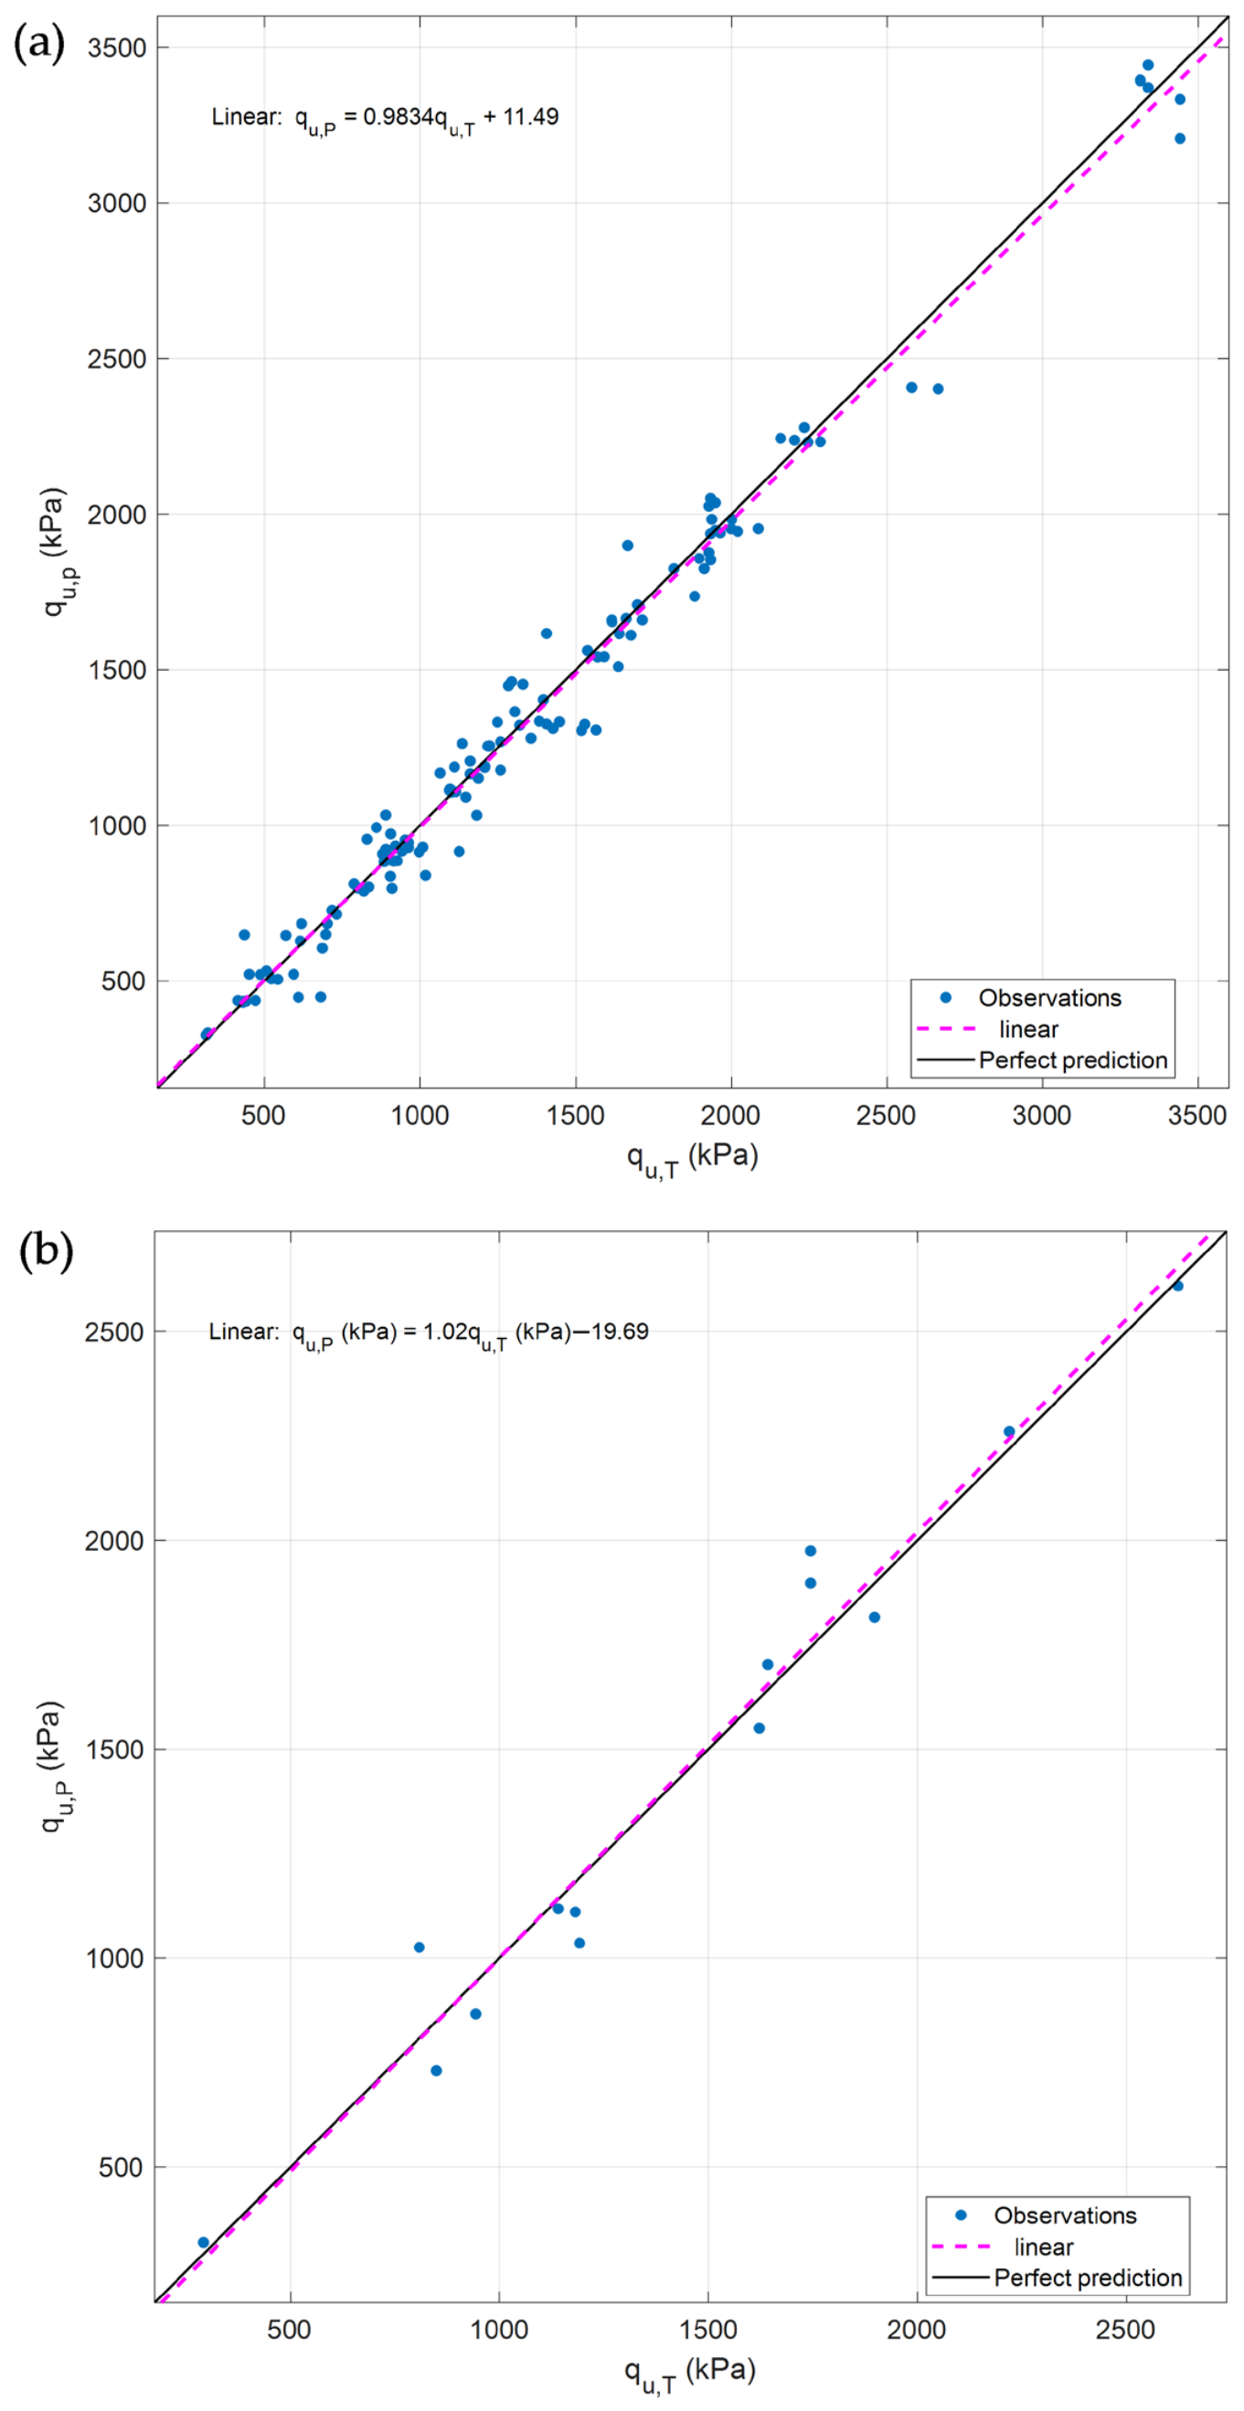
Given that the Matern 5/2 GPR model achieved the best performance metrics (RMSE and R2), a comparison between predicted and measured unconfined compressive strength was carried out, as shown in Figure 9. The results confirm the adequacy of this machine learning model, as during the validation stage it closely follows the observed behaviour. This is evidenced by the similarity between the black line (perfect fit) and the dashed purple line (fitted data) in Figure 9a.
The relationship between the true and predicted values for the validation stage is expressed as follows:
q u , P = 0.9834 q u , T + 11.49
Similarly, during testing, the model remains suitable, as it follows behaviour consistent with that observed during validation. This indicates that the model does not suffer from overfitting and can therefore be considered a reliable tool for predicting the unconfined compressive strength. A slight tendency to overestimate the values is observed, as the dashed purple line lies above the black line (perfect fit), as shown in Figure 9b.
The relationship between the true and predicted values for the testing stage is given by:
q u , P = 1.02 q u , T 19.69
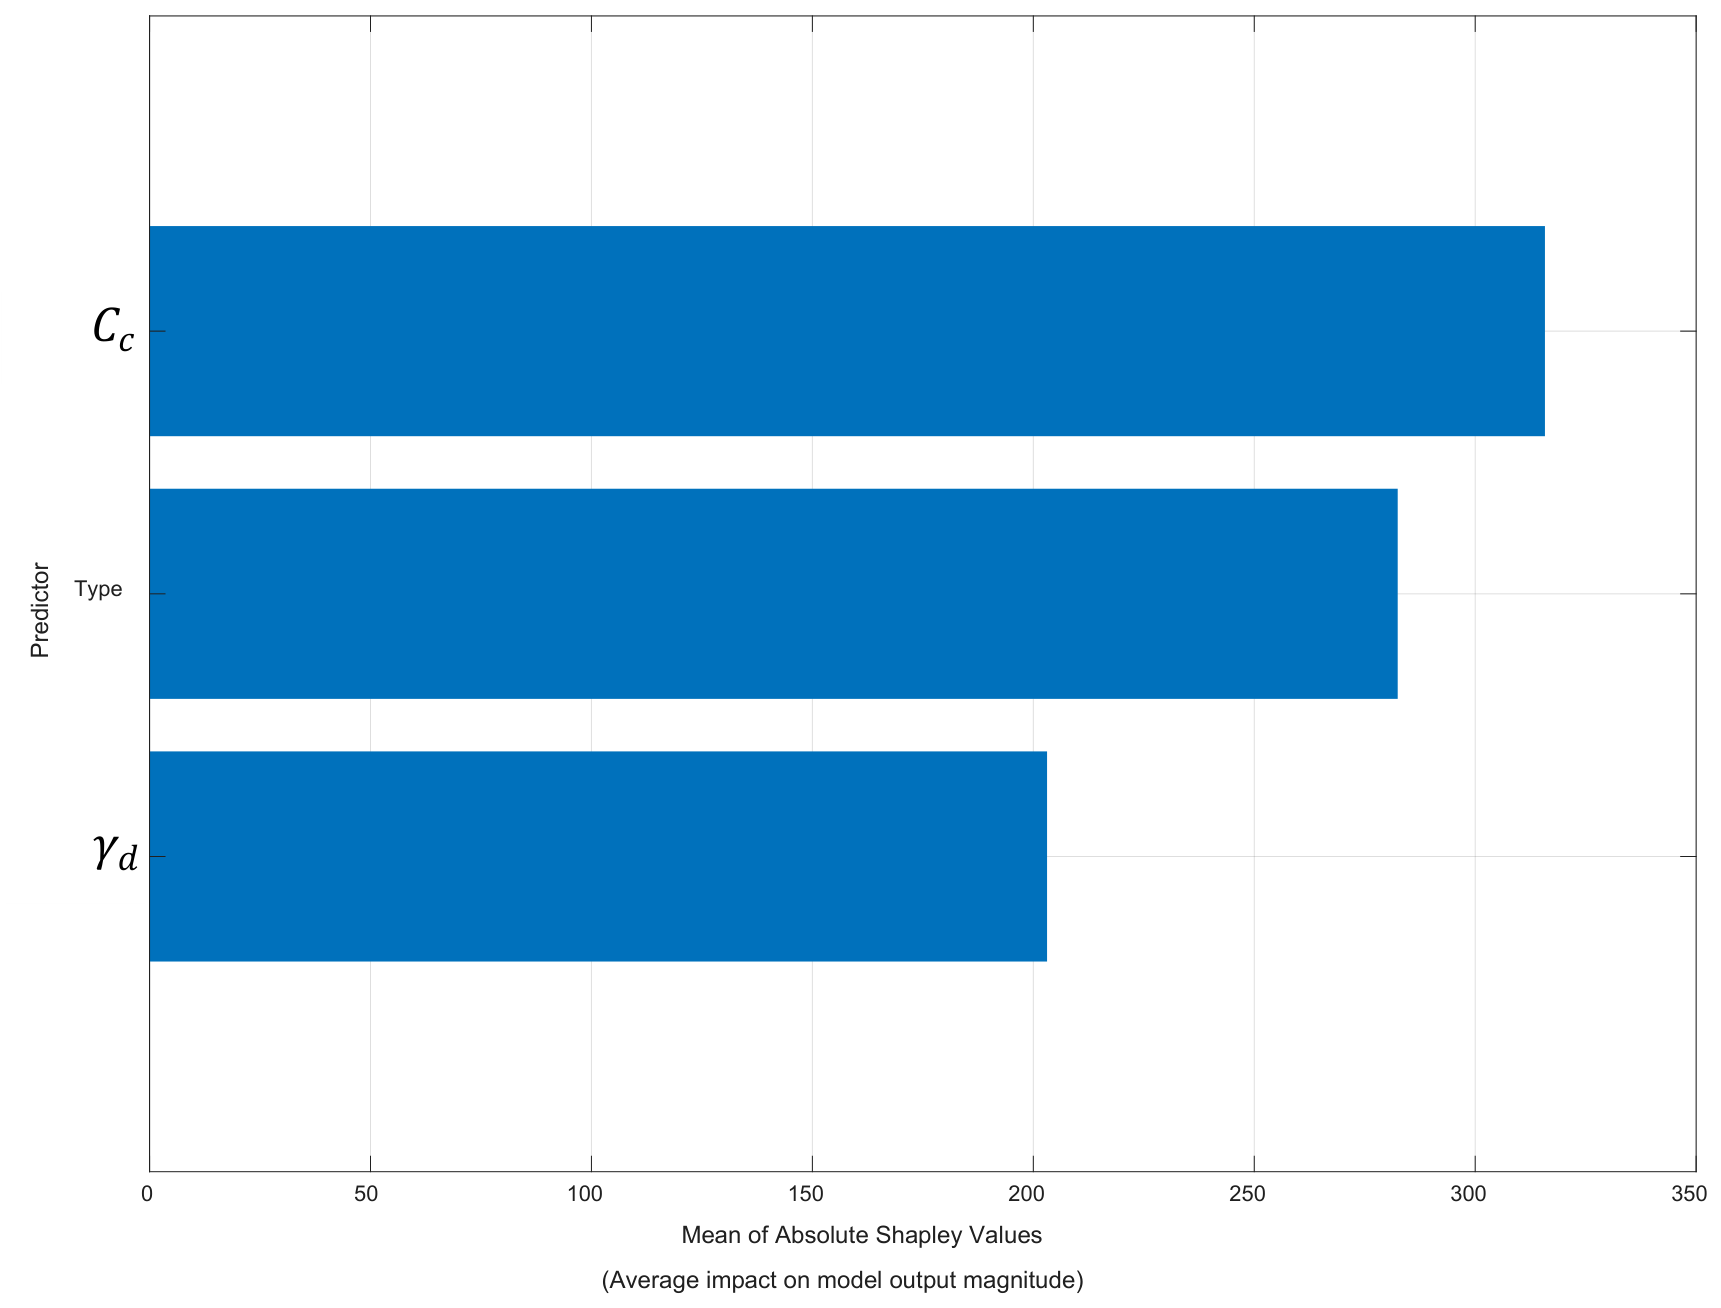
Figure 10 presents the Shapley value analysis, indicating the relative importance of the predictors in estimating unconfined compressive strength. A strong dependence on all three predictors—cement content, cement type, and dry density—is observed, as each exhibits a Shapley value greater than 200. The cement content is the most influential variable, followed by cement type, while dry density contributes comparatively less. In this analysis, the three predictors remain essential for achieving accurate model predictions.

4.4. Comparative Analysis

This section presents a comparative analysis between the best numerical algorithm (NLSM-TRA) and the best surrogate model (Matern 5/2 GPR), as shown in Table 6. The machine learning model exhibits a superior fit compared to NLSM-TRA, as evidenced by improved performance metrics for both R2 and RMSE.
Specifically, the ML model achieved RMSE values of 92.78–117.26 kPa for the validation and testing stages, respectively. In contrast, the NLSM-TRA approach yielded its best result of 105.77 kPa only for the CPIV cement type. The ML model (Matern 5/2 GPR) exhibited coefficients of determination ranging from 0.962 to 0.982, which are higher than those obtained using NLSM-TRA, where values ranged from 0.92 to 0.94.
Table 7 summarises the main findings of previous studies on soil stabilisation and ML-based prediction models. Most investigations reported high predictive performances, with R2 values generally ranging from 0.90 to 0.99; however, they were primarily based on purely empirical or data-driven approaches without incorporating physically meaningful cementation parameters. In contrast, the present study combines the porosity–cement index with ML algorithms and numerical optimisation methods, achieving R2 values up to 0.997 while maintaining the mechanistic interpretation of the cementation process. Furthermore, unlike previous studies focused mainly on sands, expansive soils, or geopolymer-treated materials, the proposed framework was successfully applied to cemented silts using three hydraulic cements and optimisation of the parameters A, x, and B.

5. Conclusions

This research presented a methodology for estimating the unconfined compressive strength (UCS) of cemented silt using the porosity–cement index, incorporating both a robust automated algorithm to predict the interacting parameters and the utilisation of surrogate models.
The porosity–cement index proved to be a robust and physically meaningful parameter to describe the mechanical behaviour of cemented silt. A single exponent value, x = 0.40, and B = 2.64 were sufficient to collapse the experimental data across all cement types, yielding coefficients of determination R2 = 0.95–0.96. This demonstrates that the index effectively normalises the combined influence of porosity and binder content, confirming its applicability as a unified design parameter for silty soils regardless of cement type.
From a geotechnical standpoint, the experimental results confirmed that both porosity and cement type exert a dominant control on strength development. The porosity–cement ratio ranged from 25% to 48%, with CPV cement achieving the highest strength levels due to its high early reactivity. The parameter A3 associated with CPV reached a value of 9.57 × 10⁶, significantly higher than CPII and CPIV, demonstrating that binder mineralogy directly influences the magnitude of strength while the governing mechanism remains unchanged.
The nonlinear least squares method with the trust-region algorithm (NLSM-TRA) exhibited the best performance metrics, achieving R2 values of up to 0.97. It is important to highlight that this algorithm is capable of automatically reproducing a theoretical product of x and B close to unity, which reinforces its applicability.
With regard to the implementation of different types of ML models, Gaussian Process Regression (GPR) with the Matern 5/2 kernel demonstrated the best agreement, achieving coefficients of determination (R2) of 0.982 and 0.962 for the validation and testing stages, respectively. In addition, the RMSE values were below 117.26 kPa.
The comparative analysis between the best numerical model (NLSM-TRA) and the best machine learning model (Gaussian Process Regression with Matern 5/2 kernel) indicated that the ML model achieved slightly better performance metrics than the numerical algorithms. In particular, the highest coefficient of determination (R2) obtained with the NLSM-TRA approach was 0.97 for CP IV cement. In contrast, values of 0.94 and 0.92 were obtained for CP II and CP V, respectively.
It is important to note that, despite slightly lower predictive performance, the numerical algorithms preserve the underlying physical principles governing soil behaviour, yielding interpretable, theoretically consistent results with reasonable accuracy. It should be noted that the applicability of the proposed methodology must initially be assessed using numerical algorithms and their corresponding performance metrics. If satisfactory results are achieved, conventional empirical formulations for unconfined compressive strength may be adopted. Conversely, when these formulations fail to provide reliable predictions, machine learning methods become essential for improving the prediction accuracy of unconfined compressive strength.

Author Contributions

Conceptualization, J.d.J.A.B. and O.E.C.-H.; methodology, J.d.J.A.B. and O.E.C.-H.; validation, J.d.J.A.B. and Y.E.N.d.l.R.; formal analysis, J.d.J.A.B. and O.E.C.-H.; investigation, J.d.J.A.B. and O.E.C.-H.; resources, Y.E.N.d.l.R. and J.d.J.A.B.; writing—original draft preparation, J.d.J.A.B. and O.E.C.-H.; writing—review and editing, J.d.J.A.B.; visualisation, Y.E.N.d.l.R.; supervision, J.d.J.A.B.; funding acquisition, Y.E.N.d.l.R. All authors have read and agreed to the published version of the manuscript.

Funding

The Fundación Universitaria Los Libertadores—Colombia funded the APC: Project ING-53-26.

Institutional Review Board Statement

Not applicable.

Informed Consent Statement

Not applicable.

Data Availability Statement

Data are contained within the article.

Acknowledgments

The authors thank the Universidad de Cartagena and Fundación Universitaria Los Libertadores (Bogotá, Colombia).

Conflicts of Interest

The authors declare no conflicts of interest.

References

  1. Liu, L.; Zhou, A.; Deng, Y.; Cui, Y.; Yu, Z.; Yu, C. Strength Performance of Cement/Slag-Based Stabilized Soft Clays. Constr. Build. Mater. 2019, 211, 909–918. [Google Scholar] [CrossRef]
  2. Chompoorat, T.; Maikhun, T.; Likitlersuang, S. Cement-Improved Lake Bed Sedimentary Soil for Road Construction. Proc. Inst. Civ. Eng. Ground Improv. 2019, 172, 192–201. [Google Scholar] [CrossRef]
  3. Chen, C.; Zhang, G.; Zornberg, J.G.; Morsy, A.M.; Zhu, S.; Zhao, H. Interface Behavior of Tensioned Bars Embedded in Cement-Soil Mixtures. Constr. Build. Mater. 2018, 186, 840–853. [Google Scholar] [CrossRef]
  4. Pham, T.A.; Kyokawa, H.; Koseki, J.; Dias, D. A New Index for the Strength Analysis and Prediction of Cement-Mixed Soils. Eur. J. Environ. Civ. Eng. 2023, 27, 840–853. [Google Scholar] [CrossRef]
  5. Swamynaidu, M.; Tyagi, A. Prediction Models for Strength of Portland Blast Furnace Slag Cement-Stabilised High Plastic Clays. In Deep Foundations Institute of India Annual Conference; Springer Nature: Cham, Switzerland, 2025; pp. 225–233. [Google Scholar]
  6. Ribeiro, I.S.; Fagundes, D.d.F.; Nierwinski, H.P. Effects of Ettringite Formation on the Stability of Cement-Treated Sediments. Resources 2025, 14, 73. [Google Scholar] [CrossRef]
  7. Consoli, N.C.; Dalla Rosa Johann, A.; Gauer, E.A.; Dos Santos, V.R.; Moretto, R.L.; Corte, M.B. Key Parameters for Tensile and Compressive Strength of Silt-Lime Mixtures. Geotech. Lett. 2012, 2, 81–85. [Google Scholar] [CrossRef]
  8. Anantanasakul, P.; Kaliakin, V.N. Shear Band Analysis of Silt-Clay Transition Soils under Three-Dimensional Stress-Strain Conditions. Soils Found. 2024, 64, 101532. [Google Scholar] [CrossRef]
  9. Moazami, D.; Pourabbas Bilondi, M.; Rahnama, A.; Zaresefat, M.; Moretti, L. Recycled Glass Powder and Calcium Carbide Residue Geopolymer to Stabilise Silty Sand Soil: Mechanical Performances and Statistical Analysis. Heliyon 2025, 11, e41738. [Google Scholar] [CrossRef] [PubMed]
  10. Diagne, M.; Tinjum, J.M.; Nokkaew, K. The Effects of Recycled Clay Brick Content on the Engineering Properties, Weathering Durability, and Resilient Modulus of Recycled Concrete Aggregate. Transp. Geotech. 2015, 3, 15–23. [Google Scholar] [CrossRef]
  11. Zhang, Z.; Tao, M. Durability of Cement Stabilized Low Plasticity Soils. J. Geotech. Geoenviron. Eng. 2008, 134, 203–213. [Google Scholar] [CrossRef]
  12. Baldovino, J.d.J.A.; Moreira, E.B.; Carazzai, É.; Rocha, E.V.d.G.; dos Santos Izzo, R.; Mazer, W.; Rose, J.L. Equations Controlling the Strength of Sedimentary Silty Soil–Cement Blends: Influence of Voids/Cement Ratio and Types of Cement. Int. J. Geotech. Eng. 2021, 15, 359–372. [Google Scholar] [CrossRef]
  13. Wang, Y.; Shi, Y.; Yang, T.; Wang, W.; Sun, Z.; Zhang, Y. Structural Performance Warning Based on Computer Intelligent Monitoring and Fractional-Order Multi-Rate Kalman Fusion Method. Fractal Fract. 2026, 10, 186. [Google Scholar] [CrossRef]
  14. Amini, Y.; Hamidi, A. Triaxial Shear Behavior of a Cement-Treated Sand–Gravel Mixture. J. Rock Mech. Geotech. Eng. 2014, 6, 455–465. [Google Scholar] [CrossRef]
  15. Hoy, M.; Nhieu, D.V.; Horpibulsuk, S.; Suddeepong, A.; Chinkulkijniwat, A.; Buritatum, A.; Arulrajah, A. Effect of Wetting and Drying Cycles on Mechanical Strength of Cement-Natural Rubber Latex Stabilized Recycled Concrete Aggregate. Constr. Build. Mater. 2023, 394, 132301. [Google Scholar] [CrossRef]
  16. Horpibulsuk, S.; Miura, N.; Nagaraj, T.S. Assessment of Strength Development in Cement-Admixed High Water Content Clays with Abrams’ Law as a Basis. Géotechnique 2003, 53, 439–444. [Google Scholar] [CrossRef]
  17. Al-Gharbawi, A.S.A.; Najemalden, A.M.; Fattah, M.Y. Expansive Soil Stabilization with Lime, Cement, and Silica Fume. Appl. Sci. 2023, 13, 436. [Google Scholar] [CrossRef]
  18. Rios Silva, S.; Viana Da Fonseca, A.; Consoli, N.C. Strength and Stiffness Properties of Mixtures of Granitic Soil-Cement. In Proceedings of the 17th International Conference on Soil Mechanics and Geotechnical Engineering: The Academia and Practice of Geotechnical Engineerin, Alexandria, Egypt, 5–9 October 2009; Volume 1. [Google Scholar]
  19. Shibi, T.; Kamei, T. Effect of Freeze–Thaw Cycles on the Strength and Physical Properties of Cement-Stabilised Soil Containing Recycled Bassanite and Coal Ash. Cold Reg. Sci. Technol. 2014, 106–107, 36–45. [Google Scholar] [CrossRef]
  20. Jin, L.; Song, W.; Shu, X.; Huang, B. Use of Water Reducer to Enhance the Mechanical and Durability Properties of Cement-Treated Soil. Constr. Build. Mater. 2018, 159, 690–694. [Google Scholar] [CrossRef]
  21. Liu, Y.; Chang, C.W.; Namdar, A.; She, Y.; Lin, C.H.; Yuan, X.; Yang, Q. Stabilization of Expansive Soil Using Cementing Material from Rice Husk Ash and Calcium Carbide Residue. Constr. Build. Mater. 2019, 221, 1–11. [Google Scholar] [CrossRef]
  22. Shetgar, C.; Apte, S.; Itankar, N. Geopolymer-Based Techniques for Stabilization of Microplastic Contaminated Expansive Soil. Sustain. Environ. Res. 2026, 36, 8. [Google Scholar] [CrossRef]
  23. Fattahi, S.M.; Zamani, S.; Imani, M.; Heydari, A. Sustainable Stabilization of Sandy Soil Using Alkali-Activated Construction Waste Binders. Sci. Rep. 2026, 16, 12012. [Google Scholar] [CrossRef] [PubMed]
  24. Chen, Y.; Liao, Z.; Niu, W.; Hu, Y.; Tan, H.; Hu, W. Study on the Mechanical Deformation Characteristics of Expansive Soil under the Action of Sodium Polyacrylate. Multiscale Multidiscip. Model. Exp. Des. 2026, 9, 42. [Google Scholar] [CrossRef]
  25. Petcherdchoo, A.; Wungsumpow, C.; Pochalard, S.; Piriyakul, K. MICP Treatment Techniques for Sandy Soil Stabilization through Shear Wave Velocity Monitoring. Discov. Sustain. 2025, 7, 46. [Google Scholar] [CrossRef]
  26. Kannan, G.; Sujatha, E.R.; O’Kelly, B.C. Investigation on Geoengineering Properties of Organic Silt Soil Treated with Chitosan Nanoparticle Additive. Sci. Rep. 2026, 16, 7793. [Google Scholar] [CrossRef] [PubMed]
  27. Hatefi, M.H.; Arabani, M.; Hosseinpour, I.; Payan, M.; Ranjbar, P.Z. Mechanical Behavior and Microstructural Investigation of Loess Sustainable Stabilization Using Nanosilica and GGBS. Sci. Rep. 2025, 16, 4187. [Google Scholar] [CrossRef]
  28. Chen, Z.; Ji, Y.; Jiang, S.; Song, S.; Lai, X.; Hu, T. Sustainable Soil Stabilization with Nano-Silica and Polypropylene Fibers Mechanical Properties Durability and Microstructural Analysis. Sci. Rep. 2026, 16, 9634. [Google Scholar] [CrossRef]
  29. Barimani, M.; Motaghedi, H.; Soleimani Kutanaei, S.; Ebrahimi, A. Stabilizing Collapsible Soils Using Nano Calcium Carbonate to Enhance Mechanical Properties. Sci. Rep. 2026, 16, 9353. [Google Scholar] [CrossRef]
  30. Chen, A.; Chen, F.; Ding, C.; Shi, X. Effect of Biochar and Sisal Fiber on Compressive Strength of Expansive Soil. Case Stud. Constr. Mater. 2025, 23, e05071. [Google Scholar] [CrossRef]
  31. Kuttah, D.; Olsson, N.A. Field Assessment of Enzyme-Based Stabilization for Sustainable Forest Roads in Sweden. Eur. Transp. Stud. 2025, 2, 100024. [Google Scholar] [CrossRef]
  32. Liu, M.; Saberian, M.; Li, J.; Tajaddini, A.; Roychand, R. Improving Expansive Soil Subgrade Using Sustainable Green Polymer-Based Admixture. Case Stud. Constr. Mater. 2025, 23, e05090. [Google Scholar] [CrossRef]
  33. Anjum, S.; Sharma, A.; Onyelowe, K.C.; Alsabhan, A.H.; Alam, S.; Singh, K.; Tiwary, A.K.; Sharma, S.; Qadri, J. Sustainable Subgrade Improvement with Calcium Carbide Residue and Rice Husk Ash. Sci. Rep. 2025, 15, 14351. [Google Scholar] [CrossRef]
  34. Hayder, M.R.; Ziari, H.; Shaban, A.M. Strength and Microstructural Characteristics of Sand Soils Stabilized with Paper Sludge Ash-Based Geopolymer. Sci. Rep. 2025, 15, 8752. [Google Scholar] [CrossRef]
  35. Chen, J.; Wei, X.; Huang, B.; Chen, A.; Shi, X.; Li, S.; Xiao, Y.; Liao, X.; Zhao, L. Research on Engineering Characteristics of Lignin–Cement-Stabilized Lead-Contaminated Lateritic Clay. Buildings 2025, 15, 4433. [Google Scholar] [CrossRef]
  36. Pasupuleti, L.N.; Penugonda, S.K.; Danikonda, A.K.; Jyothula, H. Composite Machine Learning Models for Forecasting UCS of Stabilized Lateritic Soils. Multiscale Multidiscip. Model. Exp. Des. 2026, 9, 113. [Google Scholar] [CrossRef]
  37. Ghorbanzadeh, S.; Daei, A.; Armaghani, D.J.; Payan, M. On the Interpretability of Machine and Deep Learning Techniques for Predicting CBR of Stabilized Soil Containing Agro-Industrial Wastes. Sci. Rep. 2026, 16, 1570. [Google Scholar] [CrossRef] [PubMed]
  38. Vinay, A.; Sridhar, H.N.; Shiva Kumar, G.; Ujwal, M.S.; Ramaraju, H.K.; Pandit, P. Performance Evaluation and Machine Learning-Based Prediction of Black Cotton Soil Stabilization with Supplementary Cementitious Binders. Discov. Appl. Sci. 2026, 8, 304. [Google Scholar] [CrossRef]
  39. Luo, H.; Han, F.; Liu, F.; Yu, W.; Liang, T.; Wang, S. Interpretable Machine Learning for Thermomechanical Property Prediction of Geopolymer-Solidified Soils under Subzero Curing Conditions. J. Cold Reg. Eng. 2026, 40, 04025048. [Google Scholar] [CrossRef]
  40. El-Sekelly, W.; Raja, M.N.A.; Abdoun, T. Explainable AI for Predicting the Strength of Bio-Cemented Sands. J. Rock Mech. Geotech. Eng. 2026, 18, 1552–1569. [Google Scholar] [CrossRef]
  41. Lal, A.G.; George, T.; Vaishnavi, S.; Vrindalekshmi, P.; Mathew, A. Prediction of Unconfined Compressive Strength of Stabilized Soil Using Machine Learning. In International Conference on Innovative Trends in Engineering for Sustainability; Springer Nature: Singapore, 2026; pp. 221–230. [Google Scholar]
  42. Yadav, N.K.; Prajapati, B. Investigating Plasticity and Swelling Properties of Improved Expansive Soil Designs Based on Hybrid Deep Learning Optimization for High Pay Load Applications. Soil Sci. Soc. Am. J. 2026, 90, e70192. [Google Scholar] [CrossRef]
  43. Ghavami, S.; Naseri, H. Prediction of Compressive Strength in Fine-Grained Soils Stabilized with a Combination of Various Stabilization Agents and Nano-SiO2 Using Machine Learning Algorithms. Math. Comput. Appl. 2025, 30, 137. [Google Scholar] [CrossRef]
  44. Luo, Z.; Xue, X.; Xiong, C.; Huang, R.; Du, J.; Li, J.; Liu, K. Data-Driven Prediction of Unconfined Compressive Strength in Stabilized Soils Using Machine Learning. Discov. Appl. Sci. 2025, 7, 1122. [Google Scholar] [CrossRef]
  45. Consoli, N.C.; Foppa, D.; Festugato, L.; Heineck, K.S. Key Parameters for Strength Control of Artificially Cemented Soils. J. Geotech. Geoenviron. Eng. 2007, 133, 197–205. [Google Scholar] [CrossRef]
  46. Sukmak, G.; Sukmak, P.; Horpibulsuk, S.; Arulrajah, A.; Horpibulsuk, J. Generalized Strength Prediction Equation for Cement Stabilized Clayey Soils. Appl. Clay Sci. 2023, 231, 106761. [Google Scholar] [CrossRef]
  47. Consoli, N.C.; Arcari Bassani, M.A.; Festugato, L. Effect of Fiber-Reinforcement on the Strength of Cemented Soils. Geotext. Geomembr. 2010, 28, 344–351. [Google Scholar] [CrossRef]
  48. Consoli, N.C.; da Silva Lopes, L.; Foppa, D.; Heineck, K.S. Key Parameters Dictating Strength of Lime/Cement-Treated Soils. Proc. Inst. Civ. Eng. Geotech. Eng. 2009, 162, 111–118. [Google Scholar] [CrossRef]
  49. Baldovino, J.D.J.A.; Izzo, R.L.D.S.; Moreira, E.B.; Rose, J.L. Optimizing the Evolution of Strength for Lime-Stabilized Rammed Soil. J. Rock Mech. Geotech. Eng. 2019, 11, 882–891. [Google Scholar] [CrossRef]
  50. Román Martínez, C.; Nuñez de la Rosa, Y.E.; Estrada Luna, D.; Baldovino, J.A.; Jordi Bruschi, G. Strength, Stiffness, and Microstructure of Stabilized Marine Clay-Crushed Limestone Waste Blends: Insight on Characterization through Porosity-to-Cement Index. Materials 2023, 16, 4983. [Google Scholar] [CrossRef] [PubMed]
  51. Hanafi, M.; Ekinci, A.; Aydin, E. Engineering and Microstructural Properties of Alluvium Clay Stabilized with Portland Cement and Coal Bottom Ash for Sustainable Future. KSCE J. Civ. Eng. 2022, 26, 5049–5066. [Google Scholar] [CrossRef]
  52. Diambra, A.; Festugato, L.; Ibraim, E.; Peccin da Silva, A.; Consoli, N.C. Modelling Tensile/Compressive Strength Ratio of Artificially Cemented Clean Sand. Soils Found. 2018, 58, 199–211. [Google Scholar] [CrossRef]
  53. Diambra, A.; Ibraim, E.; Peccin, A.; Consoli, N.C.; Festugato, L. Theoretical Derivation of Artificially Cemented Granular Soil Strength. J. Geotech. Geoenviron. Eng. 2017, 143, 04017003. [Google Scholar] [CrossRef]
  54. ASTM D2487—11; Standard Practice for Classification of Soils for Engineering Purposes (Unified Soil Classification System). ASTM International: West Conshohocken, PA, USA, 2011; pp. 1–16. [CrossRef]
  55. ABNT NBR 13553:2012; Soil-Cement Materials for Monilithic Walls of Soil-Cement Without Structural Function—Requirements. Associação Brasileira de Normas Técnicas: Rio de Janeiro, Brazil, 2012.
  56. ABNT NBR 12253:2012; Soil-Cement—Mixture for Use in Pavement Layer—Procedure. Associação Brasileira de Normas Técnicas: Rio de Janeiro, Brazil, 2012.
  57. ASTM D 2166—03; Standard Test Method for Unconfined Compressive Strength of Cohesive Soil 1. ASTM International: West Conshohocken, PA, USA, 2003; Volume 4.
  58. Farber, R. CUDA for Machine Learning and Optimization. In CUDA Application Design and Development; Elsevier: Amsterdam, The Netherlands, 2011; pp. 33–61. [Google Scholar]
  59. MATLAB, version R2020a. Mathworks Statistics and Machine Learning ToolboxTM User’s Guide. MATLAB Mathworks Inc.: Natick, MA, USA, 2020.
Figure 1. Granulometric curve of the soil sample.
Buildings 16 02169 g001
Figure 2. Process of soil-sample preparation and raw materials.
Buildings 16 02169 g002
Figure 3. Methodology proposed in this research.
Buildings 16 02169 g003
Figure 4. Model types versus number of presets for ML.
Buildings 16 02169 g004
Figure 5. Influence of porosity-to-cement index on the strength of soil–cement compacted blends considering various types of cements.
Buildings 16 02169 g005
Figure 6. Assessing the cost function for different numerical algorithms.
Buildings 16 02169 g006
Figure 7. Parameter estimation considering the numerical simulation: (a) NLSM-TRA; (b) NLSM-LMA; and (c) GD-ASA.
Buildings 16 02169 g007
Figure 8. Comparison between measured and computed unconfined compressive strength using NLSM-TRA.
Buildings 16 02169 g008
Figure 9. Comparison between true and predicted unconfined compressive strength for the Matern 5/2 GPR: (a) validation stage; and (b) testing stage.
Buildings 16 02169 g009
Figure 10. Analysis of Shapley values of the Matern 5/2 GPR model.
Buildings 16 02169 g010
Table 1. Results of soil properties. D is the diameter of the particle.
PropertySoilUnit
Liquid limit, LL53.1%
Plastic index, PI21.3%
Specific gravity, Gs2.71a
Clay (D < 0.002 mm)9.3%
Silt (0.002 mm < D < 0.075 mm)57.6%
Fine sand (0.075 mm < D < 0.425 mm)25.9%
Medium sand (0.425 mm < D < 2.0 mm)7.5%
Coarse sand (2.0 mm < D < 4.75 mm)0%
Gravel (4.75 mm < D < 19 mm)0%
Mean particle (D50)0.025mm
USCS ClassificationMHa
a dimensionless.
Table 2. Results of cement properties.
Type of CementMgO (%)SO3 (%)CaO (%)Insoluble Residue (%)Uniaxial Strength (MPa)Fineness (%)γsc (kN/m3)
CP IV2.942.2745.0425.6245.400.4928.3
CP II3.682.5454.4611.0441.001.8331.5
CP V4.112.9960.730.7753.000.0431.1
Table 3. Moulding points for soil–cement compacted blends.
Moulding Pointsγd (kN/m3)Cement Content, c (%)Moisture, ω (%)Curing Time (Days)Total Specimens
115.103%, 5%, 7%, 9%23.002848
214.433%, 5%, 7%, 9%23.002848
313.773%, 5%, 7%, 9%23.002848
413.103%, 5%, 7%, 9%23.002848
Table 4. Initial and final values for the numerical algorithms.
Parameter/MethodInitial ValueFinal Value
NLSM-TRANLSM-LMAGD-ASA
A 1 18.0 × 10 6 6.296 × 10 6 1.294 × 10 7 1.748 × 10 7
A 2 18.0 × 10 6 5.186 × 10 6 1.064 × 10 7 1.588 × 10 7
A 3 18.0 × 10 6 9.567 × 10 6 1.974 × 10 7 2.464 × 10 7
B 5.000 2.472 2.671 2.867
x 0.200 0.423 0.392 0.452
Table 5. Results of the machine learning models used to predict unconfined compressive strength.
ML ModelRMSE (V)R2 (V)RMSE (T)R2 (T)Hyperparameters
Linear348.1200.746261.2340.809Terms: Linear
Interactions Linear324.1920.780263.8110.805Terms: Interactions
Robust Linear362.2810.725244.2100.833Terms: Linear
Stepwise Linear329.9310.772263.8110.805Initial terms: Linear
Fine Tree287.5030.827254.0480.819Minimum leaf size: 4
Medium Tree453.1470.570324.2390.706Minimum leaf size: 12
Coarse Tree554.7410.355374.1000.608Minimum leaf size: 36
Linear SVM352.0050.740244.1840.833Kernel function: Linear
Quadratic SVM215.2880.903157.2000.931Kernel function: Quadratic
Cubic SVM1307.265−2.583416.2390.515Kernel function: Cubic
Fine Gaussian SVM347.0160.748109.8840.966Kernel function: Gaussian
Medium Gaussian SVM178.1350.933198.7940.889Kernel function: Gaussian
Coarse Gaussian SVM361.6760.726237.2390.843Kernel function: Gaussian
Efficient Linear Least Squares387.8110.685274.7740.789Learner: Least squares
Efficient Linear SVM558.7830.345469.7400.383Learner: SVM
Boosted Trees213.7170.904190.6220.898Minimum leaf size: 8
Bagged Trees288.7350.825167.3010.922Minimum leaf size: 8
Squared Exponential GPR132.9470.963116.7360.962Basis function: Constant
Matern 5/2 GPR92.7820.982117.2600.962Basis function: Constant
Exponential GPR96.3170.981114.6680.963Basis function: Constant
Rational Quadratic GPR92.8820.982116.6110.962Basis function: Constant
Narrow Neural Network152.8880.951180.3450.909Number of fully connected layers: 1
Medium Neural Network142.7200.957140.4040.945Number of fully connected layers: 1
Wide Neural Network114.4580.973122.9090.958Number of fully connected layers: 1
Bilayered Neural Network150.2510.953168.3750.921Number of fully connected layers: 2
Trilayered Neural Network126.3520.967120.7120.959Number of fully connected layers: 3
SVM Kernel700.797−0.030636.855−0.135Learner: SVM
Least Squares Regression Kernel507.8920.459257.4210.815Learner: Least Squares Kernel
Note: SVM = support vector machine, GPR = Gaussian Process Regression.
Table 6. Comparison between the results of the best-performing ML model and the numerical algorithm used to predict unconfined compressive strength.
MethodPerformance Metrics
NLSM-TRACP II − R2 = 0.94, RMSE = 122.06 kPa
CP IV − R2 = 0.97, RMSE = 105.77 kPa
CP V − R2 = 0.92, RMSE = 219.91 kPa
ML (Matern 5/2 GPR)Validation stage: R2 = 0.982, RMSE = 92.78 kPa
Testng stage: R2 = 0.962, RMSE = 117.26 kPa
Table 7. Comparison between previous studies and the proposed methodology for strength prediction of cemented soils.
StudyMaterial/SystemMethodologyMain ResultsLimitationsMain Contribution Compared to Previous Studies
Consoli et al. [45]Cemented sandPorosity–cement indexIntroduced η/Civ relationshipNo ML integration; focused on granular soilsPresent study extends η/Civ framework to cemented silts combined with ML
Diambra et al. [52,53]Artificially cemented sandsTheoretical calibration of x and BDemonstrated physical interpretation of xBRestricted to clean sandsCurrent work applies optimisation to silty soils with different cement types
Pasupuleti et al. [36]Stabilised lateritic soilsML models (LSBoost)R2 = 0.96Purely data-driven approachPresent study integrates physical-mechanistic parameters with ML
Ghorbanzadeh et al. [37]Agro-industrial stabilised soilsDeep learning and XGBoostR > 0.95Lack of physical interpretationCurrent work incorporates η/Civ as mechanistic variable
Vinay et al. [38]Expansive soilsRandom Forest and XGBoostR2 = 0.99No optimisation of cementation parametersPresent study optimises x, B and A simultaneously
Luo et al. [39]Geopolymer stabilised soilsInterpretable MLR2 = 0.95Focus on thermal conditionsCurrent work focuses on compaction–cementation interactions
Present studyCemented siltη/Civ + ML + optimisation algorithmsR2 up to 0.982Limited to one silty soil typeHybrid mechanistic–ML framework with physically interpretable parameters
Disclaimer/Publisher’s Note: The statements, opinions and data contained in all publications are solely those of the individual author(s) and contributor(s) and not of MDPI and/or the editor(s). MDPI and/or the editor(s) disclaim responsibility for any injury to people or property resulting from any ideas, methods, instructions or products referred to in the content.