1. Introduction
With the booming development of the coastal beach tourism economy, recent years have seen large-scale water parks, Ferris wheels, roller coasters, and other heavy amusement facilities being densely constructed in beach areas, with some individual equipment requiring foundation bearing capacities as high as 500 kPa. Previous studies on coastal-zone land-use change, spatial suitability, and coastal earthwork have shown that intensified development and local ground conditions jointly affect coastal engineering suitability [
1,
2,
3]. Quanzhou Bay is a strong tidal bay with reciprocating tidal currents and a complex coastal-zone development background [
4]. Under long-term tidal and wave cyclic loading, the sandy soil structure in coastal zones is continuously adjusted and degraded, and it is often characterized by a high void ratio (e > 0.8), low cohesion (c < 10 kPa), and strong liquefaction tendency (standard penetration test N-value < 10). This special geological condition leads to significant errors in practical applications of foundation bearing capacity calculation methods based on the homogeneous soil assumption. For example, in 2021, a safety alarm was triggered due to uneven foundation settlement at the base of a drop tower in a coastal scenic area, with the maximum settlement difference reaching 12 mm, revealing insufficient understanding of the long-term stability of sandy soil foundations under tidal influence.
The bearing capacity of shallow foundations on sand has long been studied using classical soil-mechanics theories and model tests. Ref. [
5] established the classical theoretical basis for bearing capacity analysis, and [
6] further analyzed ultimate loads of shallow foundations. Ref. [
7] investigated the bearing capacity of sand overlying soft clay for offshore mudmat foundation stability. Refs. [
8,
9] carried out model tests and failure-mechanism analyses for foundations on sand. Refs. [
10,
11,
12,
13,
14] further reported the influences of specimen size, gravity condition, reinforcement, test method, and soil parameters on foundation bearing capacity and settlement behavior. These studies provide useful references for understanding foundation bearing behavior, but most of them focus on general sand foundations, offshore foundations, reinforced sand, or building foundation conditions rather than naturally deposited coastal beach sand under tidal influence.
At the material scale, the bearing capacity of sandy foundations is closely related to particle grading, particle morphology, density state, and particle breakage. Ref. [
15] showed that particle grading and particle shape strongly affect the density, dilatancy, and shear strength of sands. Ref. [
16] examined the macro–meso effects of gradation and particle morphology on the compressibility characteristics of calcareous sand. Ref. [
17] analyzed the influence of particle shape on the density and compressive performance of calcareous sand. Ref. [
18] investigated the bearing capacity and deformation behavior of coral sand foundations under shallow footing loads, and [
19] developed CPT-based predictions of bearing capacity for shallow footings in calcareous sand considering particle breakage. Ref. [
20] further examined the effects of relative density and particle morphology on the bearing capacity and collapse mechanism of strip footings in sand. These studies indicate that particle characteristics and density state are important material factors controlling the bearing response of sandy foundations.
Hydraulic and environmental factors also have significant effects on the bearing behavior of coastal sandy soils. Ref. [
21] proposed a framework for assessing the bearing capacity of sandy coastal soils using remotely sensed moisture contents. Ref. [
22] evaluated the bearing capacity of two-layered unsaturated sand through analytical and experimental methods. Ref. [
23] investigated the effects of upward seepage on excess pore-water pressure and shallow-foundation stability above saturated sand. Ref. [
24] studied the capacity decrease around cyclically loaded offshore foundations in sand due to accumulated excess pore pressures. Ref. [
25] investigated the effects of wetting–drying cycles on the profile mechanical behavior of soils with different initial conditions, while [
26] studied the mechanical behavior of calcareous sand subjected to wet–dry cycles. Recent studies on shallow foundation loading and unsaturated sandy soils have also examined lateral stresses, bearing capacity, moisture content, and wet–dry cycle effects [
27,
28].
Although these studies have provided valuable insights into sandy soil bearing capacity, cyclic loading, wetting–drying effects, particle morphology, and shallow foundation behavior, several limitations remain. First, many existing studies focus on general sand, calcareous sand, offshore sand, reinforced sand foundations, or pile and building foundation cases, whereas naturally deposited coastal beach sand under tidal influence has received less attention. Second, most bearing capacity models still rely mainly on traditional strength parameters, such as internal friction angle and unit weight, and do not directly include easily measurable physical parameters such as moisture content, particle size distribution, and relative density. Third, the coupled influence of gradation, moisture content, and relative density on both bearing capacity parameters and failure modes has not been sufficiently quantified. Therefore, it is necessary to establish a bearing capacity evaluation method that combines model tests with physical-parameter-based prediction for coastal beach sand. However, the coupled effects of gradation, relative density, and moisture content under static loads remain insufficiently understood, especially for heavy facility foundations in tidal zones.
The engineering properties of coastal sandy soils result from the long-term coupling of their multiphase composition, depositional history, and complex environmental loads. Their pore structure, physical properties, and mechanical characteristics exhibit distinct features different from inland sands. Due to the continuous sorting and transportation effects of marine dynamics (waves, tides), sand particles have higher roundness and smoother surfaces, simultaneously forming a typical “marine” accumulation structure dominated by single-grain fabric with fewer contact points and loose arrangement. Research has found that fine-grained soils along the Zhejiang-Fujian coastal areas in China mainly consist of mud and muddy clay, with small amounts of clayey silt, silty clay, and clay. They generally exhibit high water content, a high void ratio, high compressibility, high plasticity, and low shear strength. This structure results in them being in a medium-dense to loose state under natural conditions, with void ratios typically ranging between 0.7 and 1.0, and permeability showing significant anisotropy, providing pathways for groundwater seepage and rapid dissipation of pore pressure, but also increasing the risk of seepage deformation. Coastal sands are chronically exposed to periodic wet–dry alternation and salinity fluctuation environments. Salinity changes in pore water affect interparticle cementation, while capillary action in unsaturated states can provide some apparent cohesion, but its strength is extremely sensitive to changes in water content and is rapidly lost after saturation by immersion. Furthermore, periodic water level fluctuations caused by tides subject soil elements to repeated wetting and drying processes, potentially leading to particle reorganization and slight volume changes, a phenomenon that cannot be ignored when evaluating long-term foundation deformation. The core challenge of coastal sands lies in their weakly cemented nature under low effective stress and extreme sensitivity to cyclic loading. Firstly, the lack of durable cementation formed by clay minerals between particles means their shear strength primarily relies on friction and interlocking, resulting in extremely low cohesion and poor static stability. Secondly, under long-term low-frequency cyclic loads such as waves, the sand structure is prone to cyclic degradation, manifested as cumulative pore pressure increase, stiffness attenuation, and irreversible plastic strain accumulation, i.e., the “cyclic softening” phenomenon, which significantly reduces its liquefaction resistance and long-term bearing capacity. Therefore, coastal sandy soil is a special geological material with variable physical states and complex mechanical responses; a comprehensive grasp of its characteristics is a prerequisite for establishing accurate engineering models.
The bearing capacity characteristics of coastal sandy soils constitute a complex function dynamically controlled by multi-scale factors, far from being completely described by traditional static, drained bearing capacity formulas. Its influencing factors can be systematically summarized into the following three levels: First, material intrinsic state factors. These form the material basis for bearing capacity development, including particle size distribution and shape, moisture content, mineral composition, in situ relative density, and initial stress state. Previous research has shown that particle grading and particle shape strongly affect density, dilatancy, and shear strength of sands [
15]. More critically, the state parameter (ψ), describing the relative relationship between current density and stress level in sand, is widely regarded as the fundamental factor controlling its peak strength and deformation characteristics. Second, external marine environmental dynamic factors. These are the core influencing domains distinguishing coastal sands from sands in other environments. (1) Tidal action: Periodic water level changes not only alter the effective overburden stress and buoyancy distribution of the foundation soil but also generate periodically varying seepage fields. This seepage force changes the effective stress between soil particles and may even cause internal erosion (e.g., piping), thereby dynamically weakening the foundation bearing capacity. (2) Wave loading: When waves propagate into shallow water, they induce cyclically varying shear stresses and pore pressures within the seabed. Long-term wave loading can lead to cumulative settlement or liquefaction of the seabed sand, with its influence depth and intensity closely related to wave height, period, and seabed slope. This cyclic stress reshapes the soil structure, producing a “pre-damage” effect, thereby reducing its load-bearing performance under subsequent static loads. Third, engineering load application conditions, including the magnitude, distribution, and loading rate of static loads transmitted from the superstructure, as well as accidental extreme dynamic loads like earthquakes. Traditional bearing capacity theories (e.g., improvements to Terzaghi’s theory by Meyerhof, Hansen, etc.) mainly address static, uniformly distributed loads. For foundations of large amusement facilities subjected to significant overturning moments, bearing capacity calculations must consider reductions due to load inclination and eccentricity, which are particularly pronounced in easily deformable sandy soil foundations. Moreover, the potential superposition of seismic and wave loads could push the foundation to its limit state. Therefore, systematically revealing the evolution laws of sand bearing capacity under the coupled action of the multiple factors mentioned above, specific to the environmental conditions of the Quanzhou coastal zone, holds significant academic value and engineering importance for developing foundation design and reinforcement theories adapted to local conditions.
To address these limitations, this study investigated the bearing capacity of coastal beach sand in Quanzhou Bay through field sampling, laboratory static plate load tests, and bearing capacity modeling. The main tasks were as follows: First, representative beach sand samples were collected from typical coastal zones, including Shenhu Bay and Qingshan Bay, and their basic physical properties were determined. Second, static plate load tests were conducted under different moisture contents, particle size distributions, and relative densities to obtain load–settlement curves and failure characteristics. Third, the proportional limit load, ultimate load, characteristic value of bearing capacity, and deformation modulus were analyzed to clarify the effects of the main controlling factors. Finally, a semi-empirical bearing capacity model was established by combining experimental data with classical bearing capacity theory. The model uses easily measurable parameters and is intended to provide a practical reference for coastal foundation design and beach trafficability assessment.
2. Overview of the Study Area
The study area is located in southeastern Fujian Province, lying within the remote response zone of the subduction–collision system between the Eurasian Plate and the Western Pacific Plate and also belonging to the circum-Pacific continental margin tectonic belt and the Mesozoic magmatic belt along the southeastern coast of China. Sandy beaches in the area are concentrated on the coastal front at elevations of 0–10 m, serving as the primary occurrence sites for coastal sandy soils. Its climate is of subtropical maritime monsoons, mild and humid with abundant rainfall, with approximately 1000 mm average annual rainfall. From July to August, typhoons and summer monsoons bring heavy rain, with single maximum rainfall events exceeding 200 mm. The dry season occurs from November to January of the following year, with rainfall accounting for 10% of the annual total, and large interannual variability, with a coefficient of variation of 0.25–0.30. In terms of marine hydrology, it experiences regular semi-diurnal tides, with tidal currents primarily reciprocating alongshore flows. The flood and ebb currents in the open waters of the macrotidal Taiwan Strait are predominantly in the NE–SW direction, with a measured maximum tidal range of 6.52 m, an average tidal range of 4.23–4.52 m, and a minimum tidal range of approximately 1.9 m. The prevailing wind direction is NNE–NE, with an average annual wind speed of 3.0–3.5 m/s, and a dominant wave direction of SSW, with normal wave heights of 0.5–1.2 m, which can reach 3–5 m during typhoons. Strong tides, winds, and waves jointly modify the coastal geotechnical materials, with this dynamic environment strongly affecting the structure and mechanical properties of beach sand. Further, coastal sandy soils are formed in a littoral depositional environment, influenced by tidal sorting and wave transportation. Particle size distribution shows clear patterns, primarily consisting of medium and fine sand, with local lenses of coarse sand and sandy gravel. The main component of sand particles is quartz (70–80%), followed by feldspar and minor dark minerals, generally containing 3–8% marine bioclastic debris (shells, coral, foraminifera, etc.), a typical indicator of littoral deposition.
The mechanical properties of sandy soils in the Quanzhou coastal zone exhibit significant regional differentiation and environmental dynamic sensitivity. The core influencing mechanisms are fourfold. First, long-term regulation by marine dynamics: Cyclic tidal and wave loading cause diurnal fluctuations of 2–3 m in the groundwater level, inducing periodic changes in effective stress and pore water pressure, leading to a 20–30% attenuation in the ultimate bearing capacity of the foundation. High tide levels can easily trigger sand liquefaction, exacerbating stability risks. Second, the prominent role of bioclastic material: The 8–15% composition of angular shell and coral fragments enhances interparticle interlocking and frictional effects, significantly altering the shear strength of the sand and the evolution laws of foundation bearing capacity. Third, the depositional environment dictates property differentiation. The composition and structure of sandy soils vary significantly along different shore segments: the Chongwu coast is dominated by medium–coarse sand with a relatively high shell content; Xisha Bay and Qingshan Bay are dominated by fine sand with a high content of coral fragments; and Shenhu Bay is composed predominantly of medium sand with shells as the main impurity. Fourth, the deteriorating effect of the high-salinity environment: Seawater erosion and infiltration lead to salt enrichment, accelerating the development of cracks in sand particles and the deterioration of the microscopic pore structure, resulting in mechanical strength attenuation. These characteristics lead to spatial heterogeneity in the mechanical properties and foundation bearing capacity of the sand. The core intrinsic influencing factors include the particle size distribution, the natural moisture content, the relative density, consistency limits, compressibility indices, and shear strength parameters. These parameters are coupled and collectively govern the engineering mechanical response of sandy soil foundations.
3. Physical Model Test Apparatus
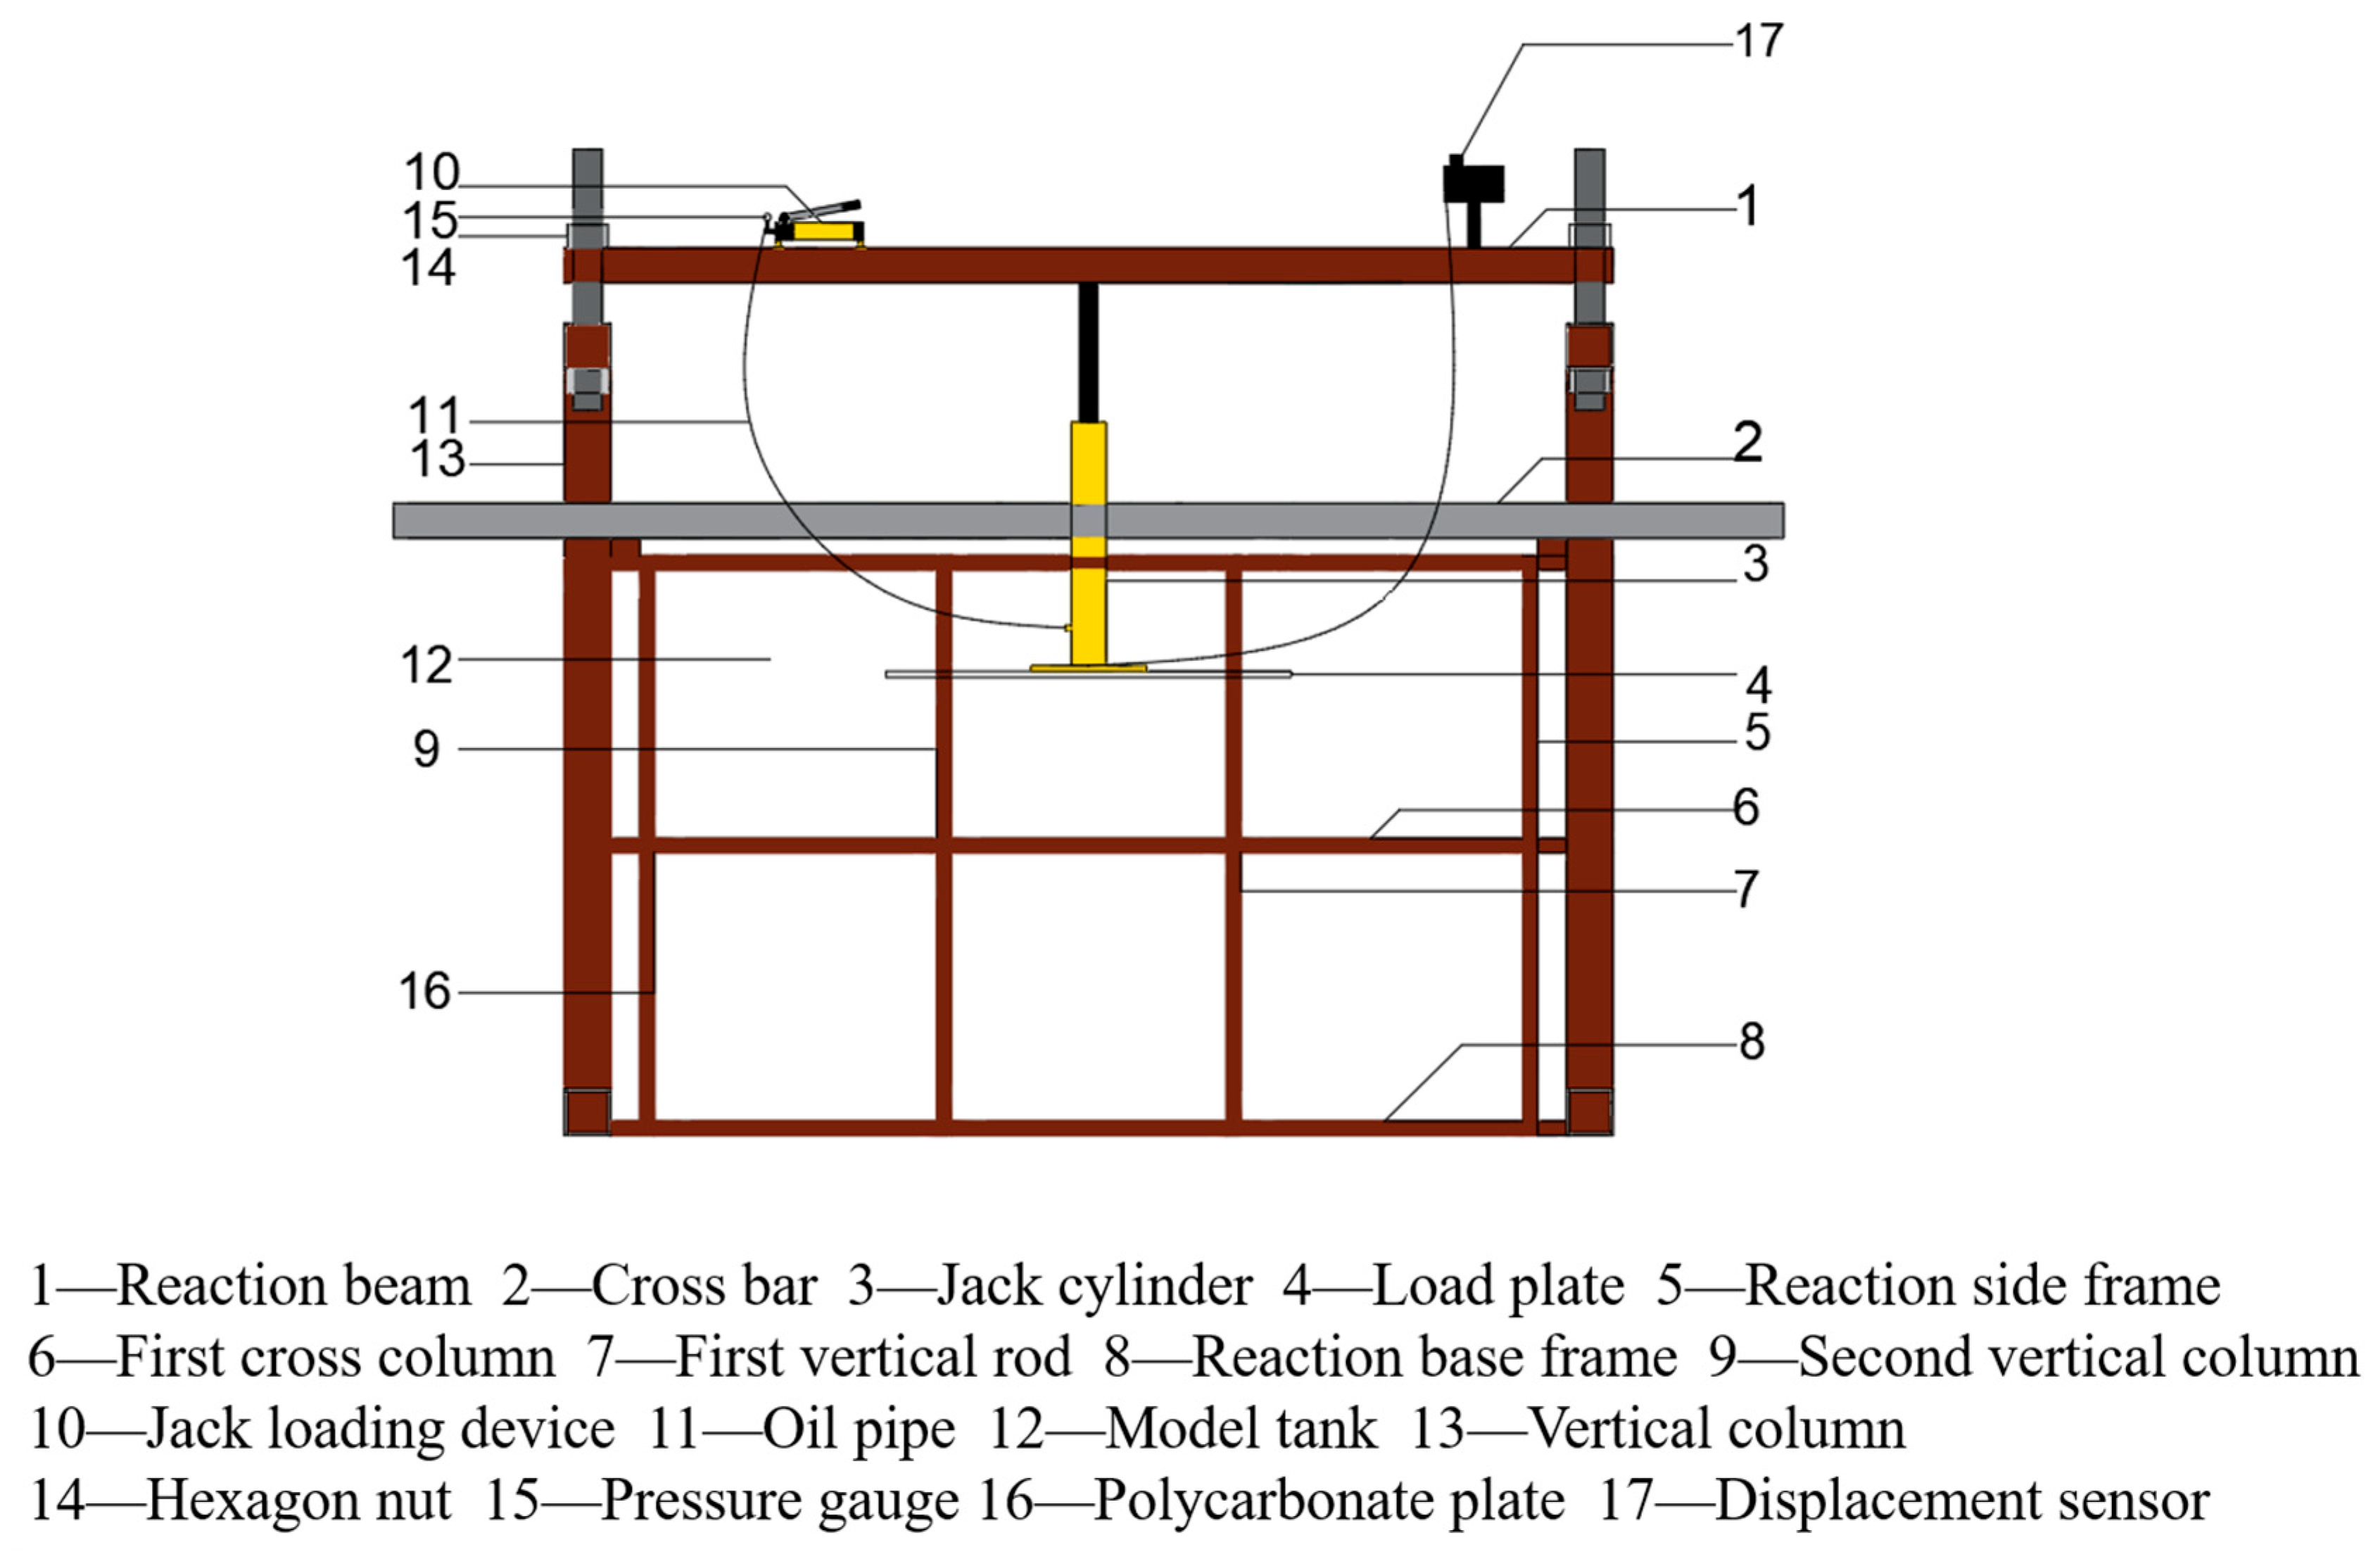
The static plate load test apparatus used in this study was designed to measure the bearing capacity of beach sandy soil foundations. It consisted of a high-stiffness reaction frame, a hydraulic loading system, pressure sensors, displacement sensors, and a central data acquisition unit, with the hydraulic loading system being driven by a servo motor and a hydraulic pump, which enabled stable and continuous loading. The pressure sensors recorded the applied load in real time, while the displacement sensors measured the settlement of the loading plate.
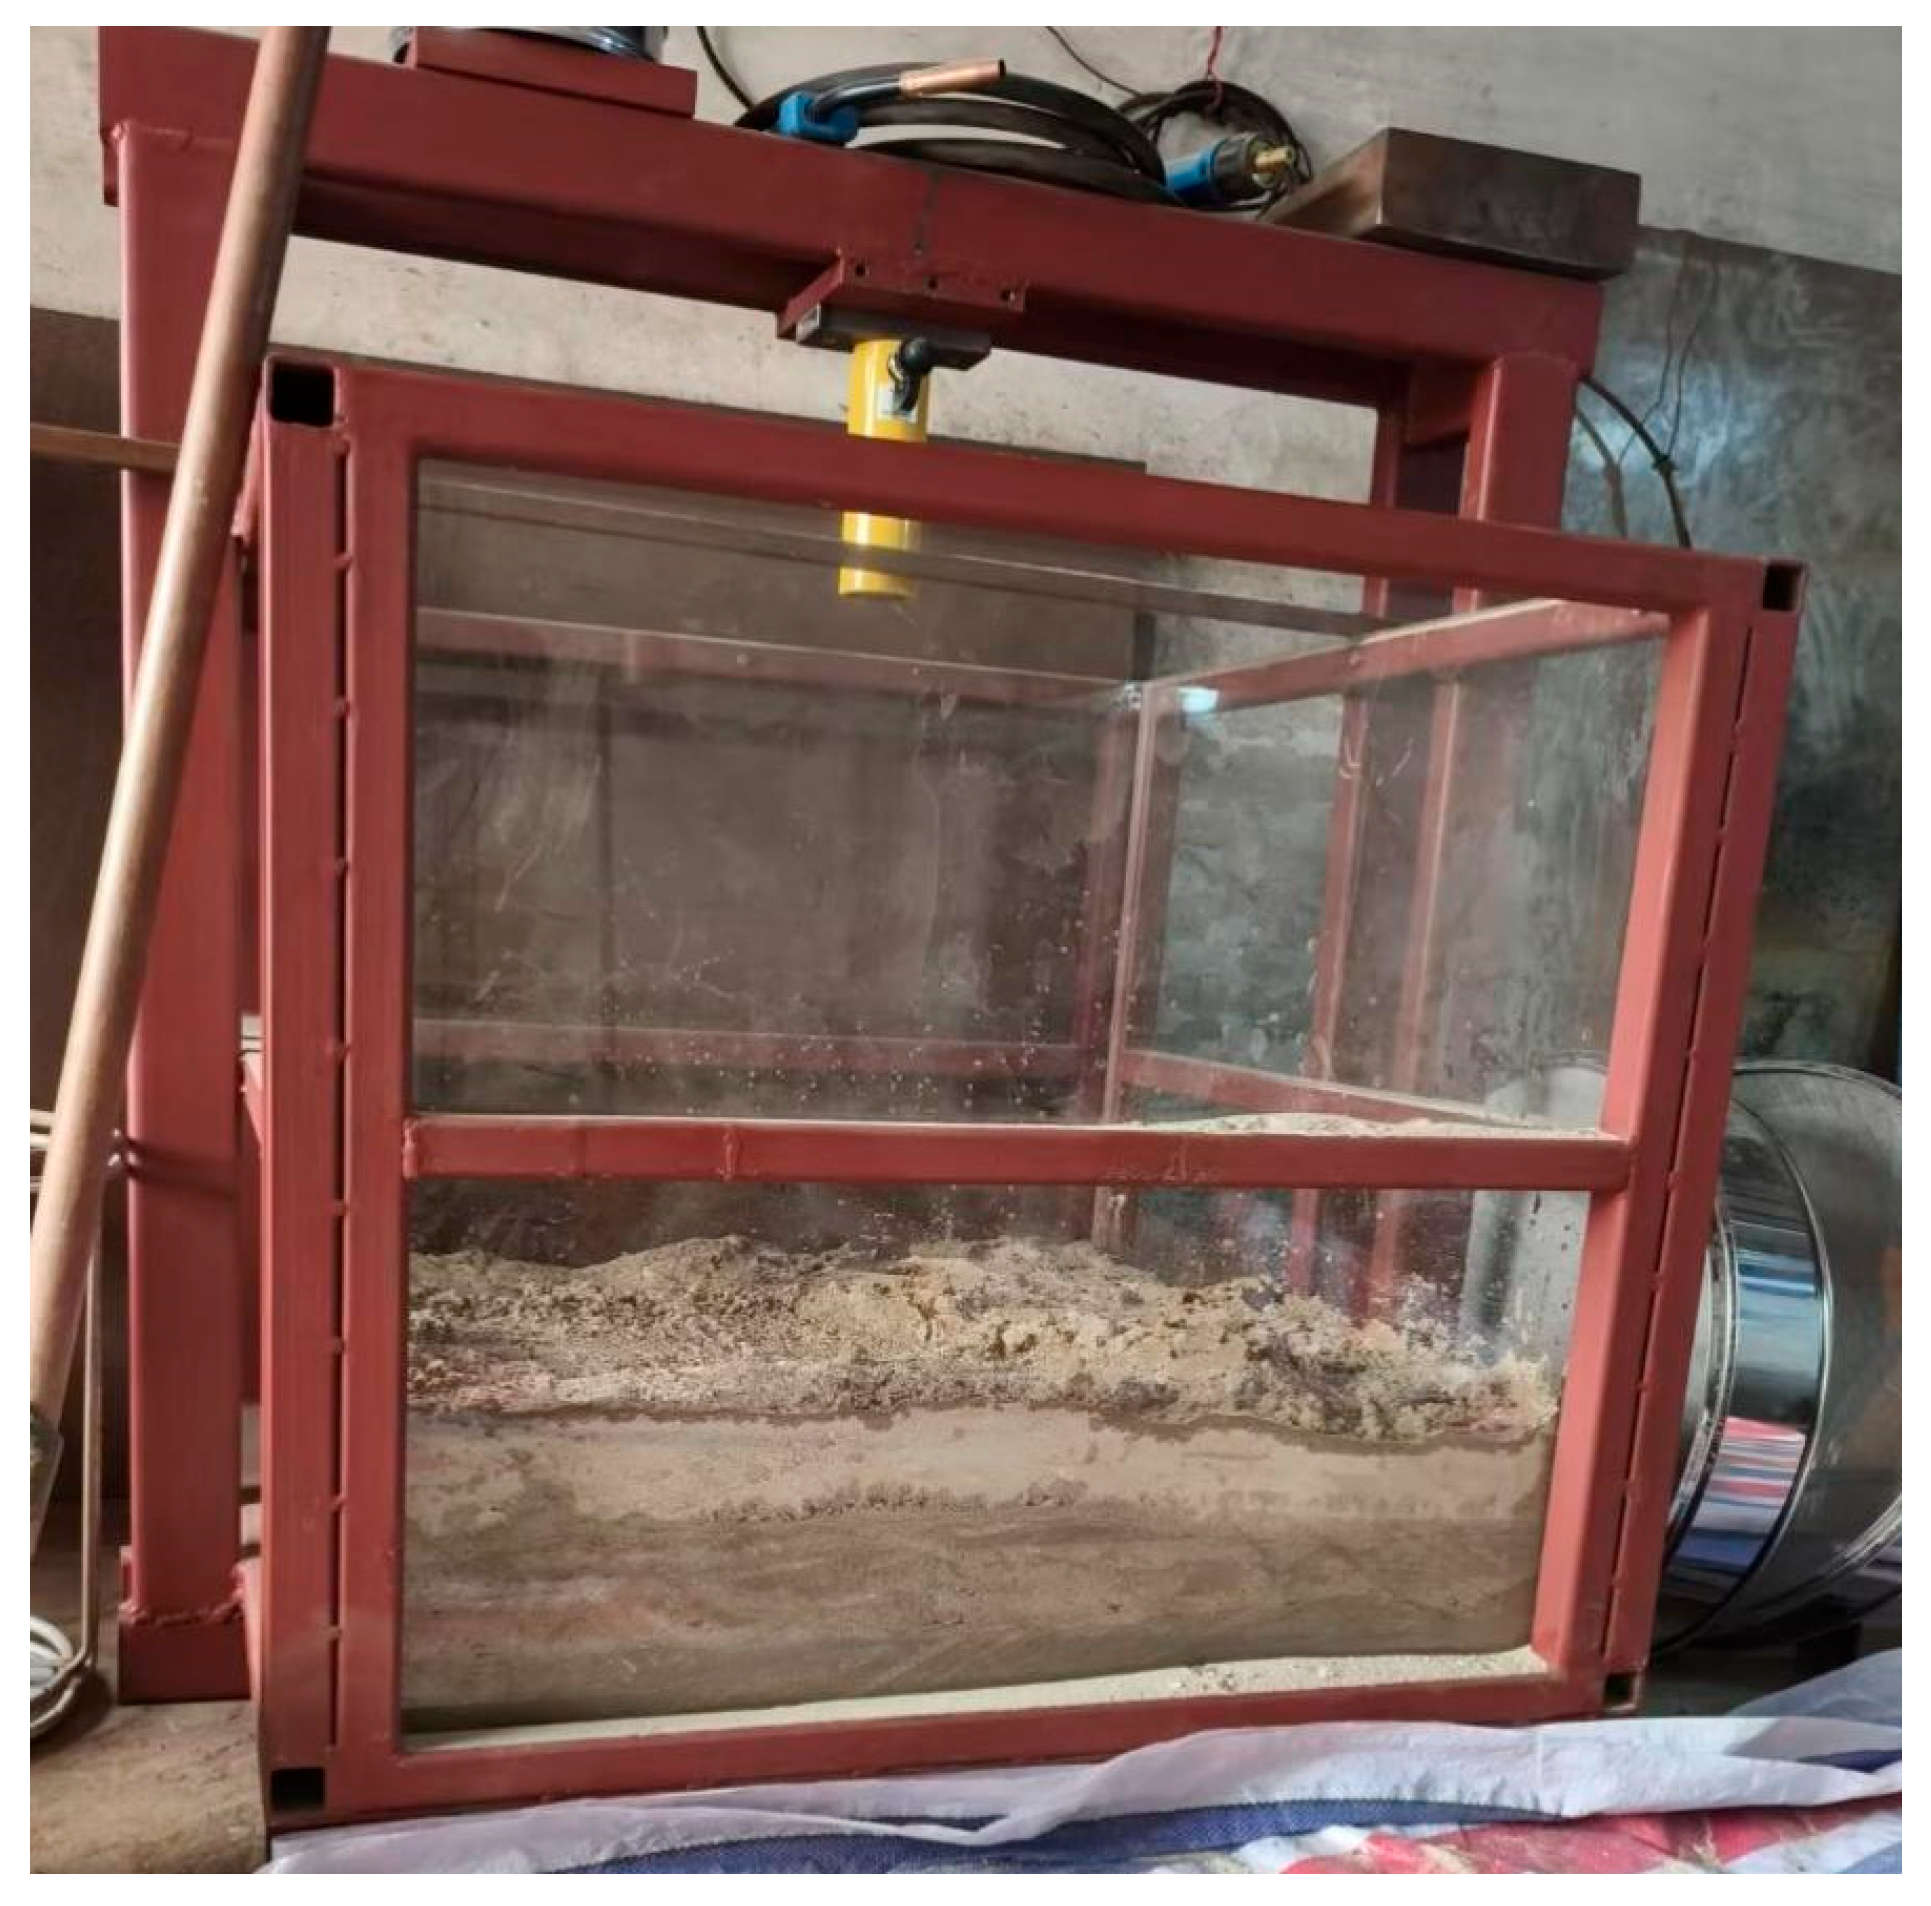
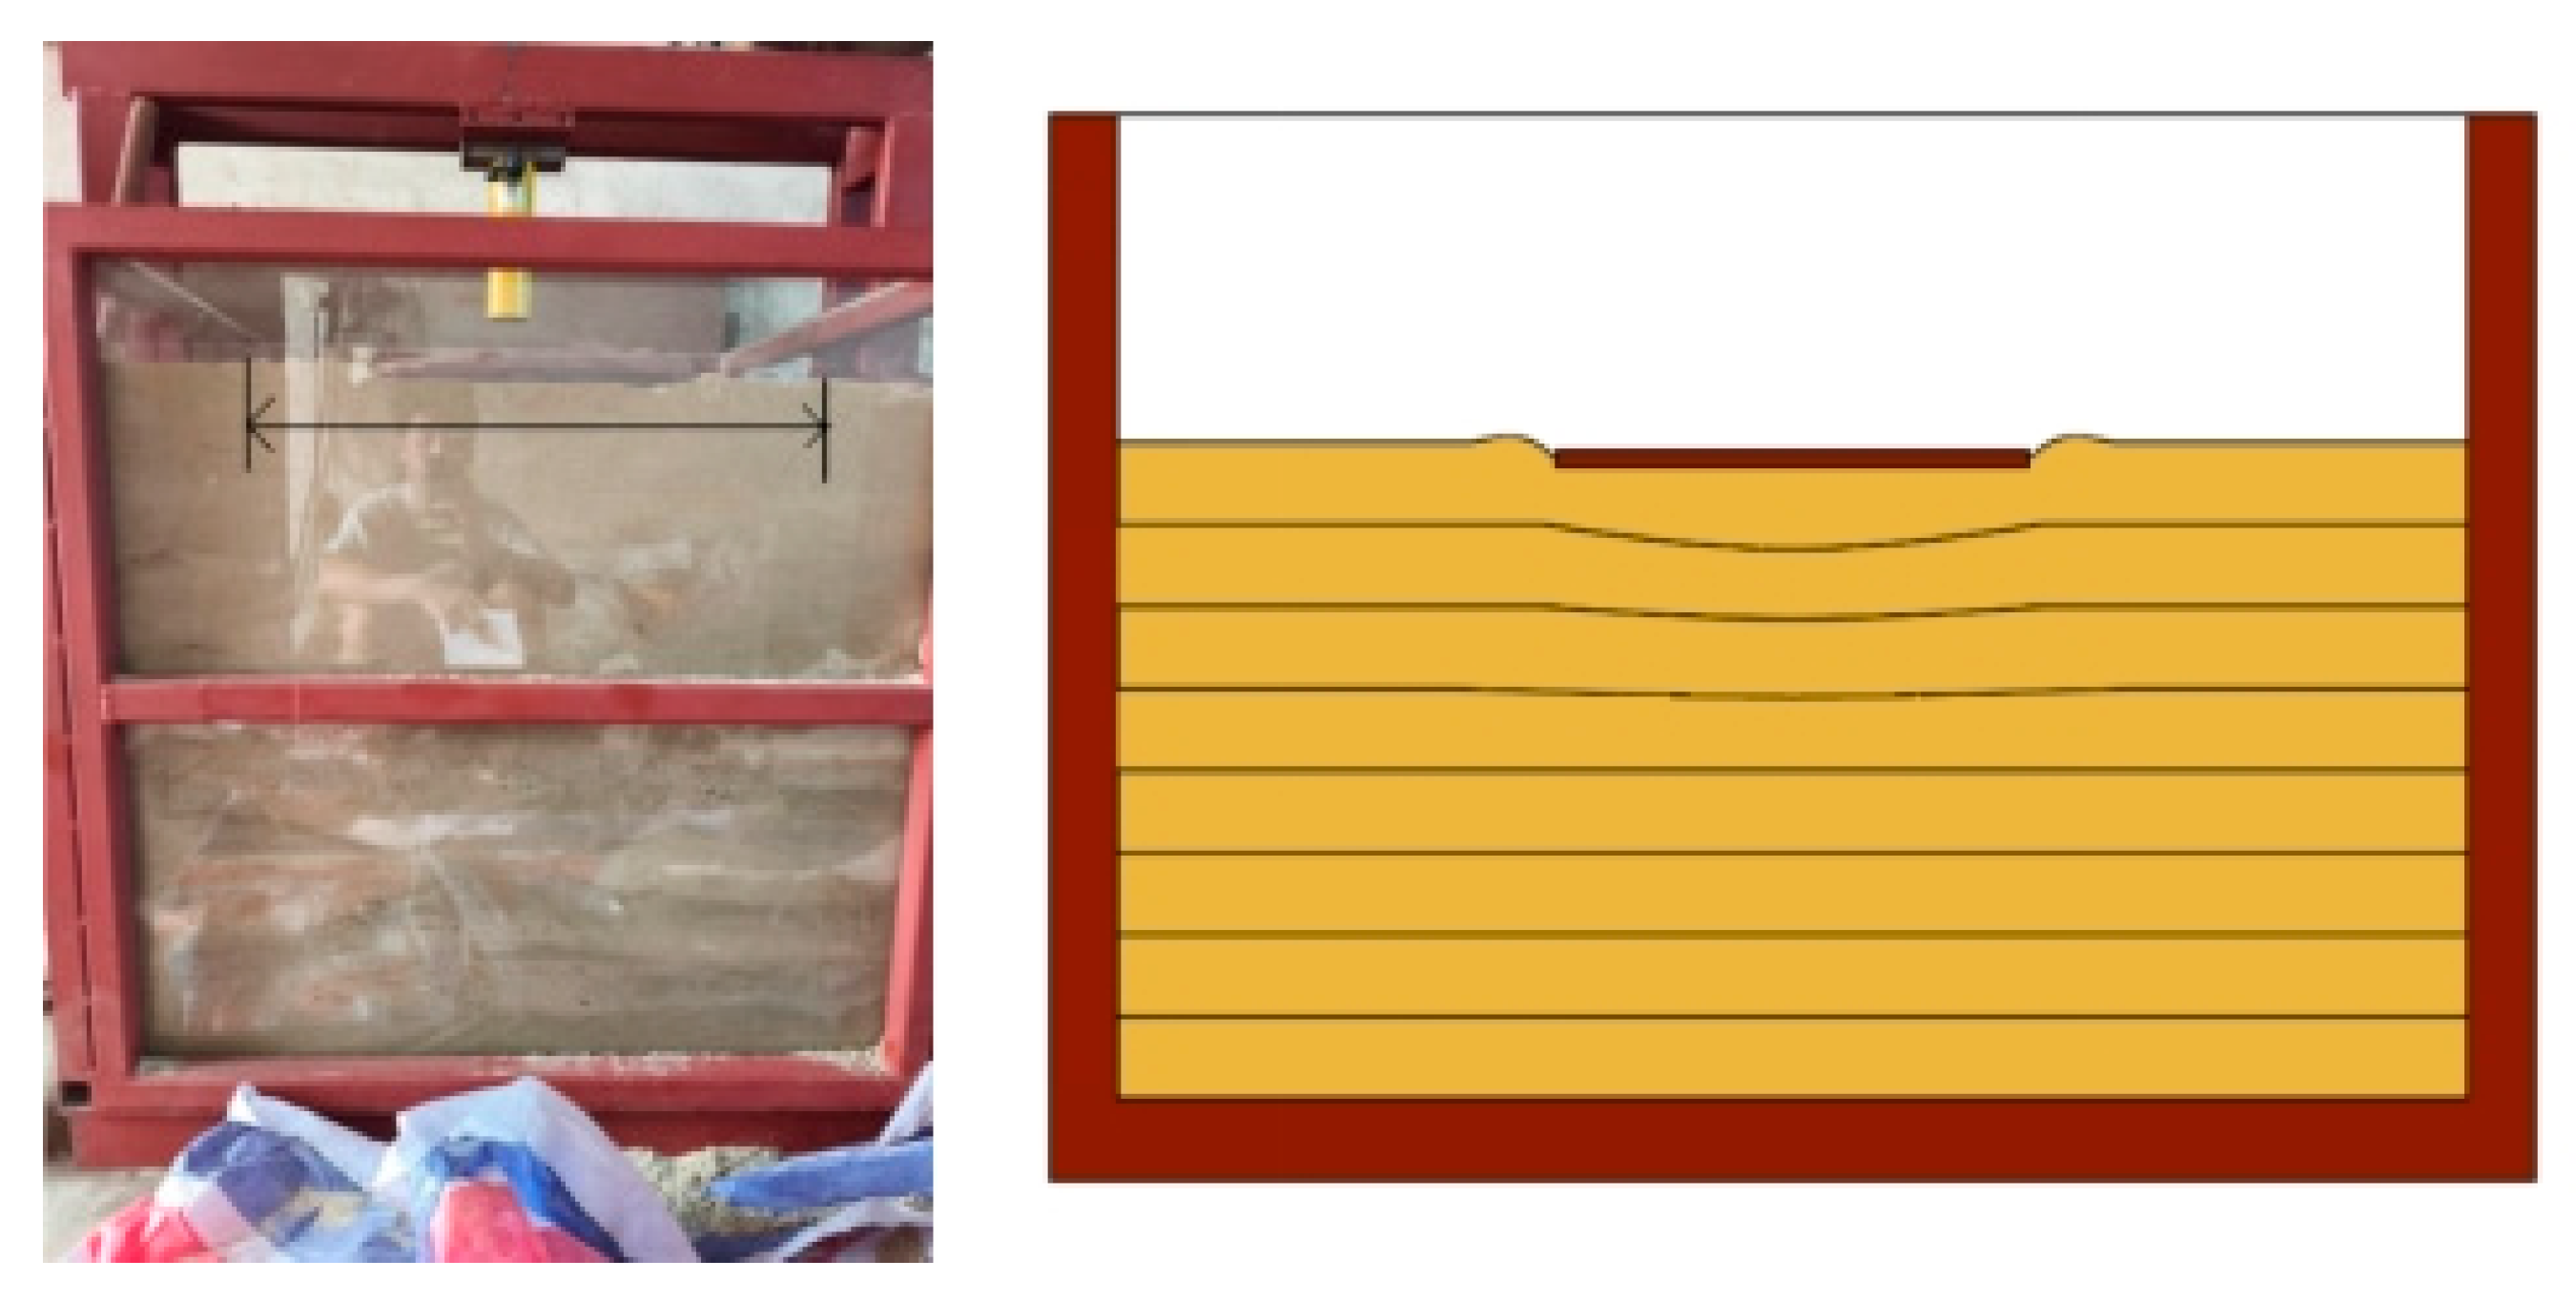
The main reaction frame had dimensions of 2.0 m × 2.0 m × 1.2 m and was fabricated of Q345B steel plates to ensure sufficient stiffness during loading, with the loading plate a square Q345B steel plate with a side length of 0.70 m and a thickness of 20 mm. During the test, the loading plate was placed at the center of the model ground surface. Transparent polycarbonate plates were installed around the model box to allow for visual observation of soil deformation and failure development. The design drawing and actual apparatus are shown in
Figure 1 and
Figure 2, respectively.
3.1. Scale Effect and Limitations
The model box used in this study has internal dimensions of 2 m (length) × 2 m (width) × 1.2 m (height), and the square loading plate has a side length of 0.7 m. The ratio of the model box width to the loading plate width is approximately 2.86, which is slightly lower than the value of 3–4 recommended by ASTM D1194-94 (1994) [
29] to fully eliminate boundary effects. Therefore, a certain degree of scale effect may exist, and the absolute values of bearing capacity obtained from these model tests should be interpreted with caution when directly extrapolated to full-scale foundations.
To evaluate the potential influence of scale effects, we conducted a series of preliminary tests using loading plates of three different sizes (0.5 m, 0.6 m, and 0.7 m) under identical soil conditions (Dr = 52%, ω = 8%, well-graded sand). The results showed that the measured ultimate bearing capacity increased by about 12% when the plate size was increased from 0.5 m to 0.7 m. This relatively small variation suggests that within the tested size range, the comparative trends observed among different gradation, moisture content, and density conditions are reliable, although the absolute capacity values may be slightly overestimated compared to a truly infinite half-space. No significant stress concentration was detected by miniature earth pressure cells installed near the sidewalls, indicating that the boundary effect does not qualitatively alter the failure mechanisms identified in this study.
Another scale-related limitation concerns the particle size to model dimension ratio. The mean grain size D
50 of the tested sands ranges from 0.3 mm to 0.8 mm, and the loading plate width (700 mm) is more than 800 times larger than D
50, satisfying the general requirement (B/D50 > 50) for reducing particle-size effects in model tests on sandy ground [
30]. Therefore, the discrete nature of the granular material does not compromise the continuum assumption in this study.
In summary, while minor scale effects are present due to the finite model box size, they do not undermine the main conclusions regarding the relative influence of gradation, moisture content, and relative density. However, when applying the proposed semi-empirical bearing capacity model to field foundations with widths significantly larger than 0.7 m, an additional safety factor of 1.2–1.3 is recommended to account for potential scale effects. This limitation should be considered in practical engineering applications.
3.2. Sample Preparation and Compaction Method
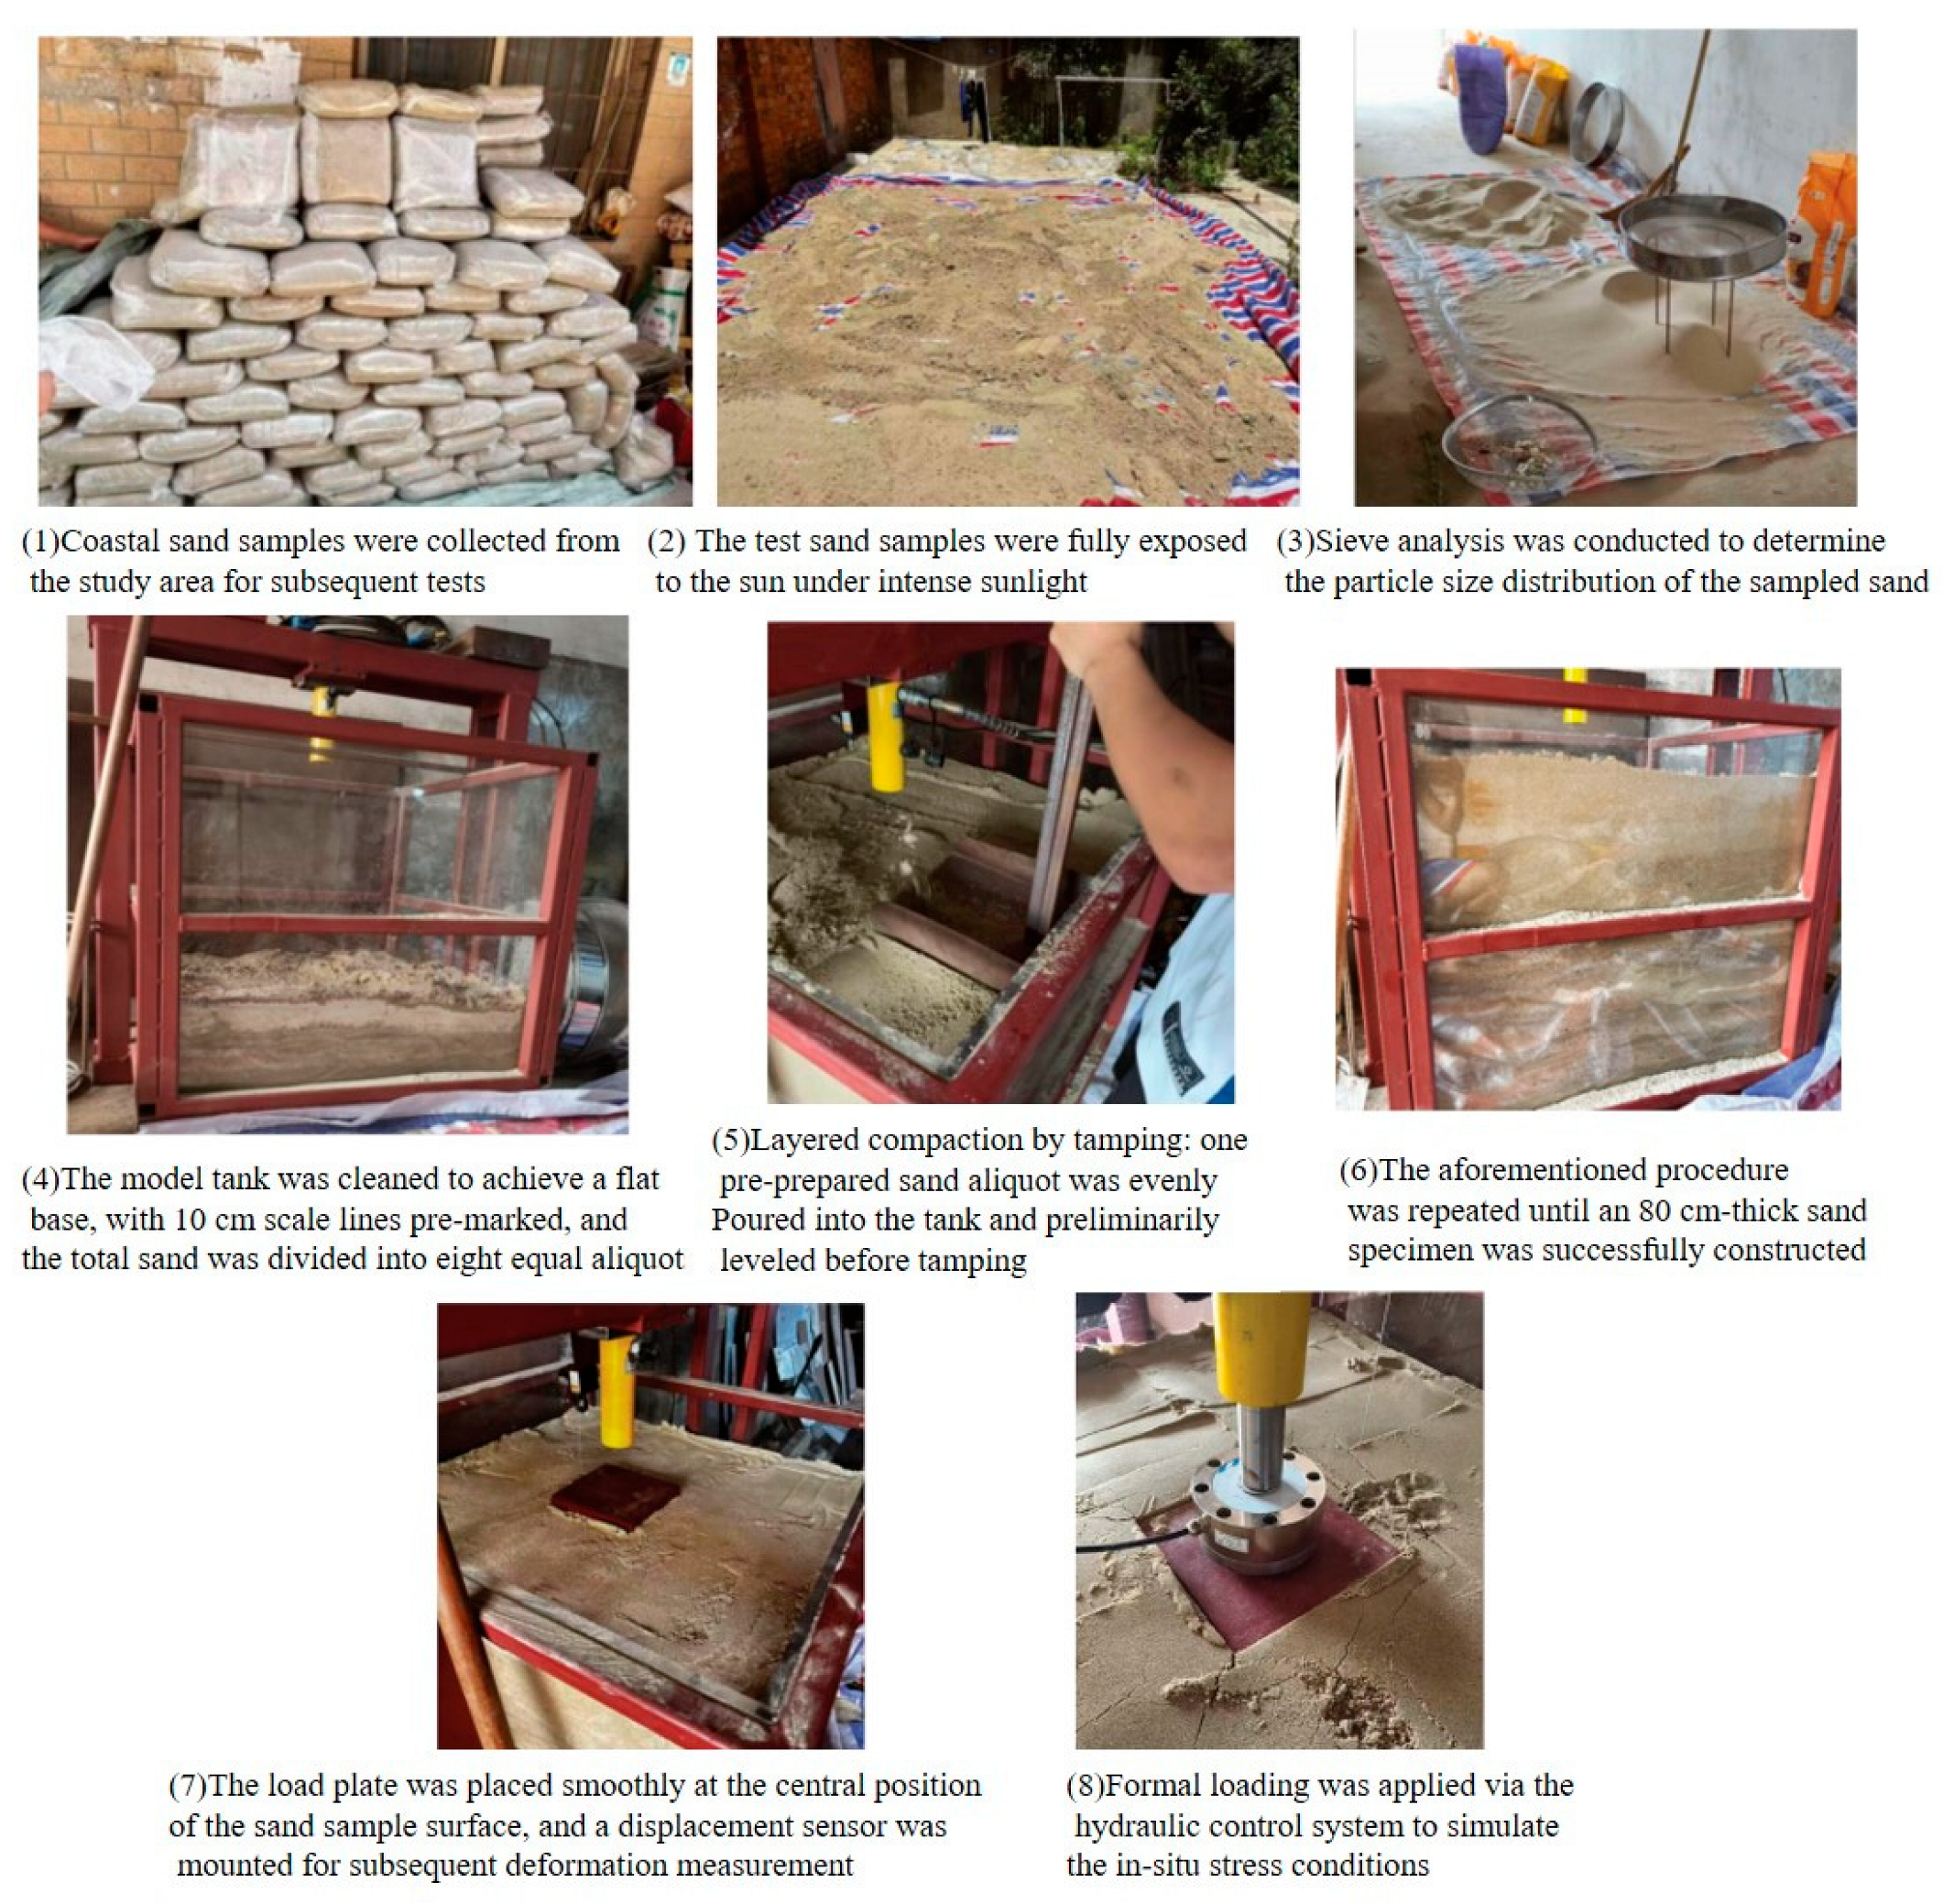
The coastal sand samples utilized in the model test were prepared using the layered compaction method to ensure precise control over the target relative density and water content. Prior to sample preparation, the sand underwent air drying and sieving to achieve the desired particle size distribution. According to the designed test protocol, the mass of dry sand required for each test was calculated based on the target relative density. For tests involving varying water contents, the required amount of water was determined based on the target water content and the mass of dry sand. The water was uniformly sprayed onto the dry sand, and the mixture was thoroughly stirred to ensure a homogeneous water distribution. Subsequently, the mixed sand was sealed for an adequate duration before laying to minimize local variations in humidity. The model box was filled in eight layers, with each layer approximately 10 cm thick. Each layer was compacted using a 20 kg steel rammer dropped from a height of 40 cm. The number of drops per grid cell (30 cm × 30 cm) was pre-calibrated: 6 drops for Dr = 40%, 22 drops for Dr = 65%, with linear interpolation applied for intermediate densities. After compaction of each layer, the density was verified using a sand cone device (with a tolerance of ±2%), and the surface was scarified. This procedure ensured high repeatability (variation < ±1.5% between repetitions), reducing artificial bedding and enhancing continuity between adjacent layers. Upon completion of compaction for all layers, the sample surface was carefully leveled, and the loading plate was positioned at the center of the model ground. All test groups adhered to the same preparation procedure to facilitate comparison of the effects of water content, particle size distribution, and relative density on bearing capacity under consistent sample preparation conditions.
3.3. Boundary Effect Control and Evaluation
Boundary effects are important in model tests of shallow foundation bearing capacity because the side walls and bottom of the model box may restrict the development of the soil failure zone and affect the measured load–settlement response. In this study, the model box was designed with an internal plane size of 2.0 m × 2.0 m and a height of 1.2 m. The square loading plate had a side length of 0.70 m and was placed at the center of the model ground surface. Therefore, the ratio between the model box width and the loading plate width was approximately 2.86.
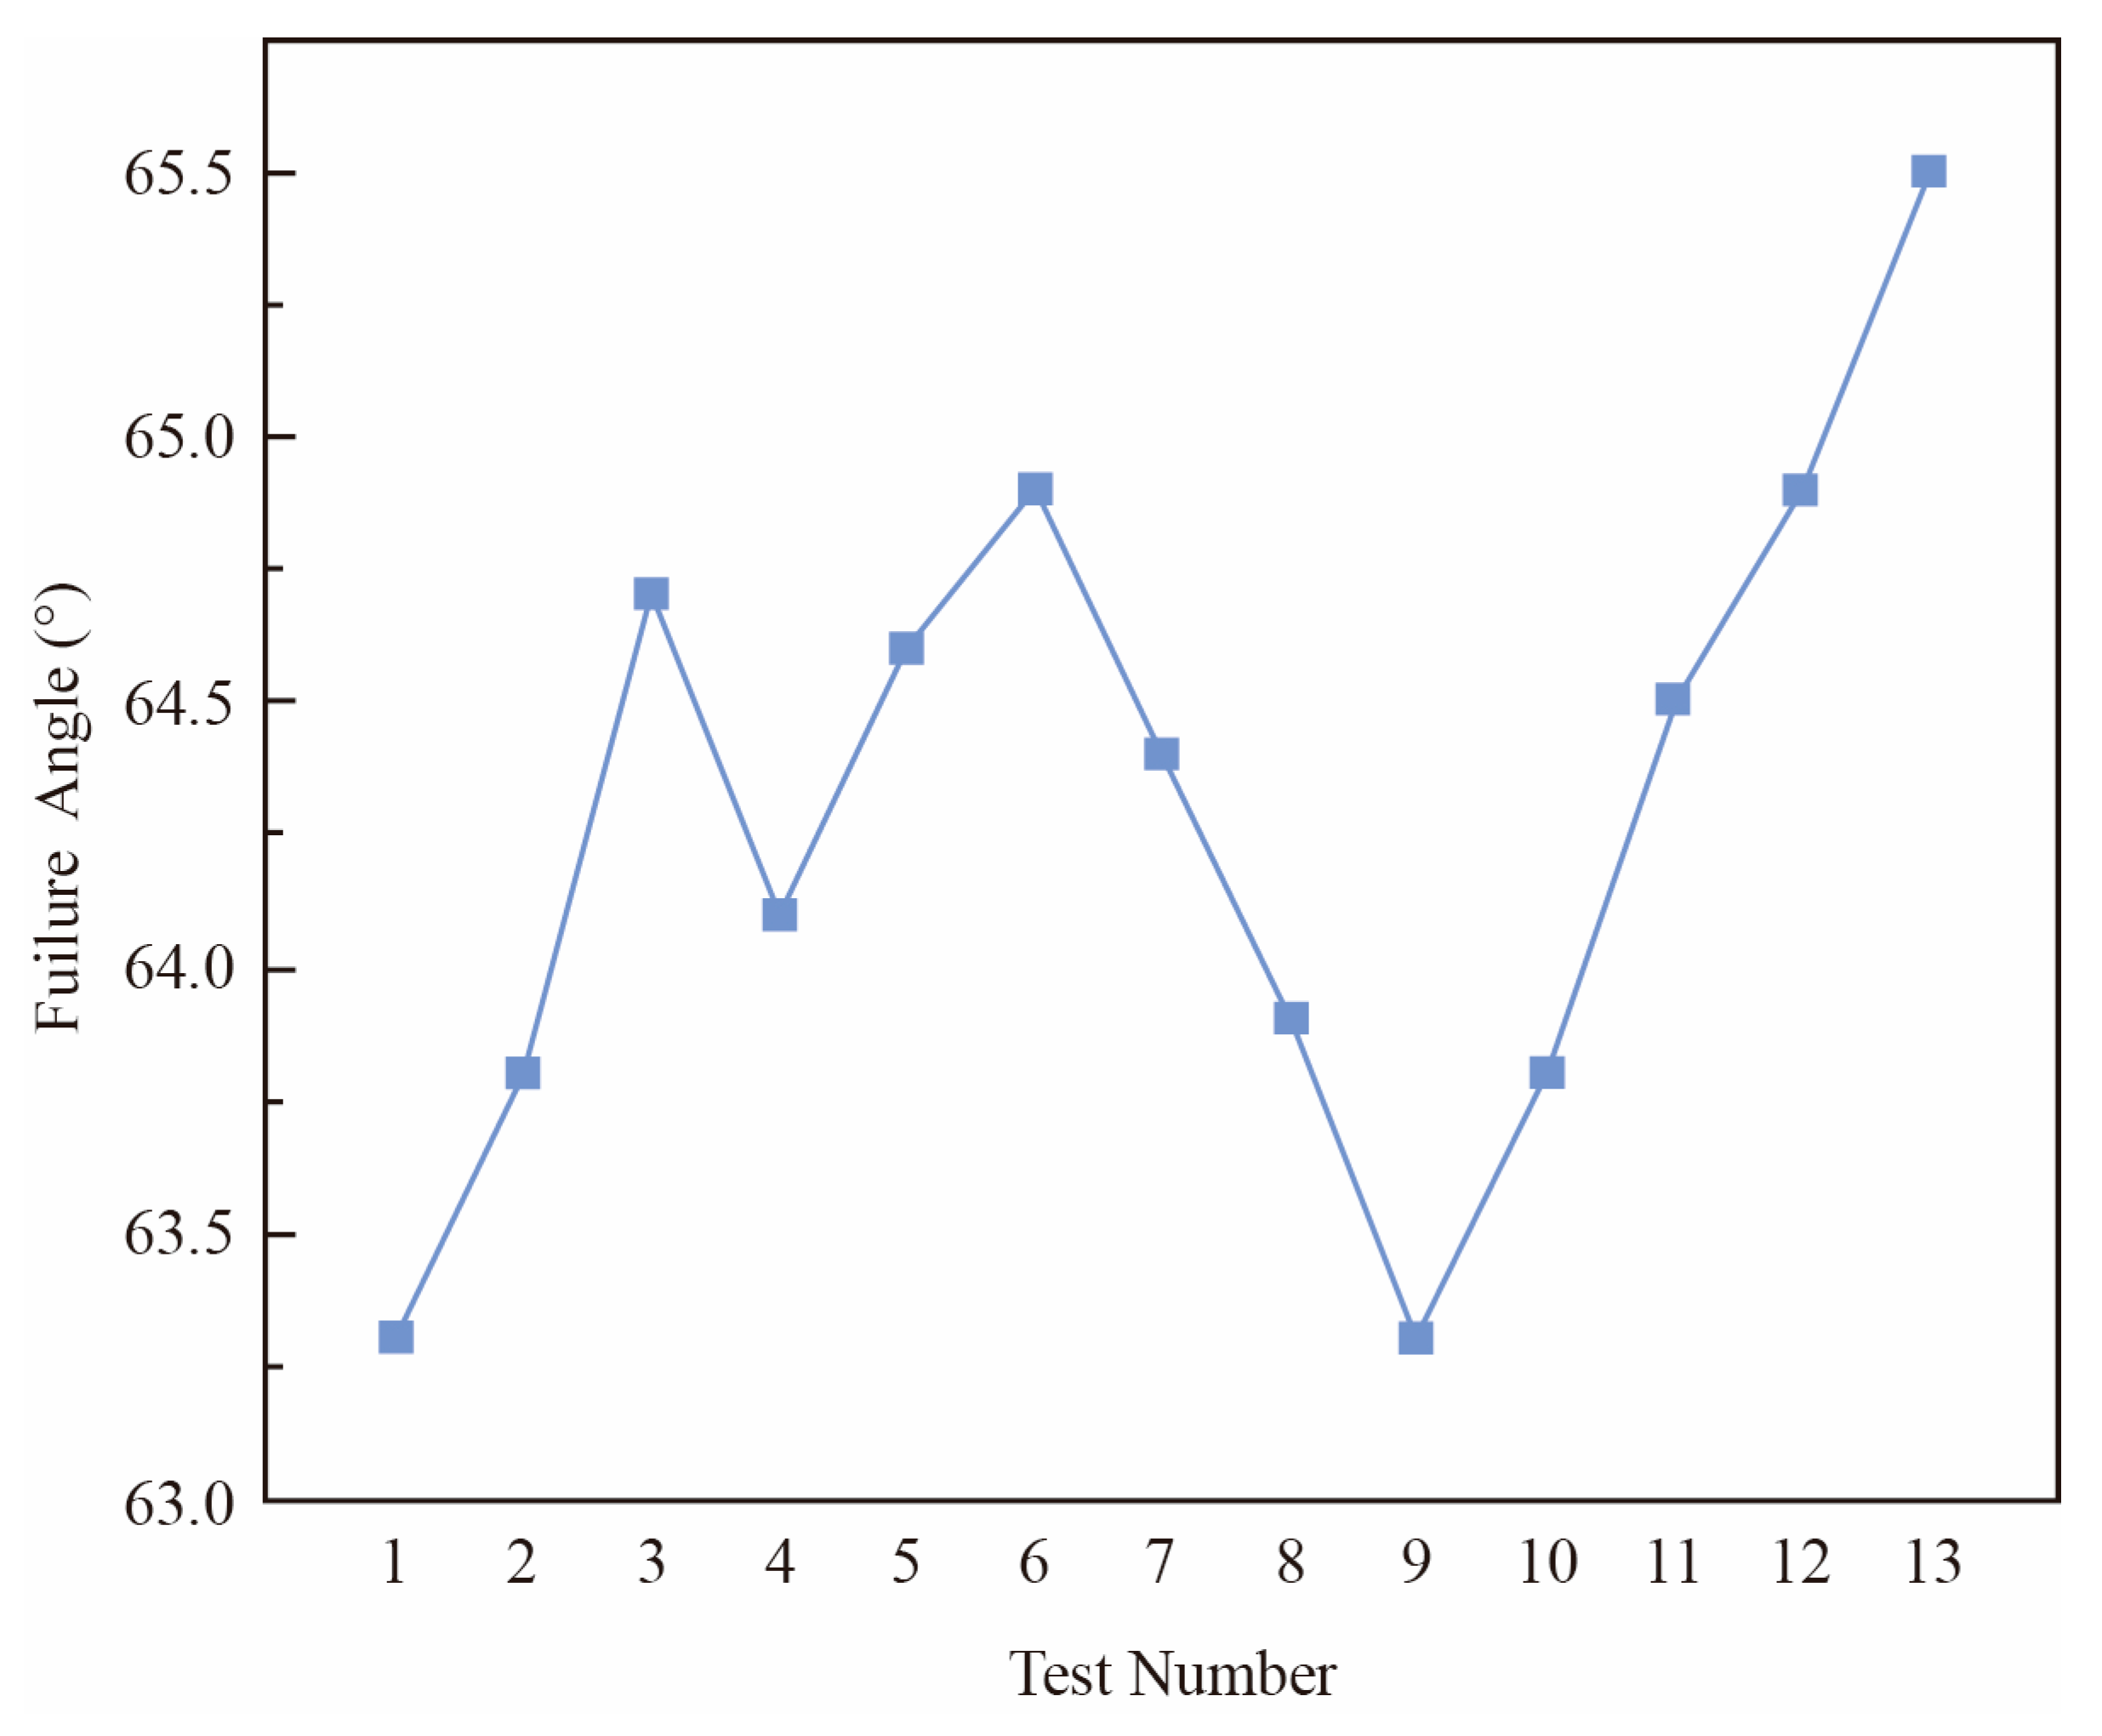
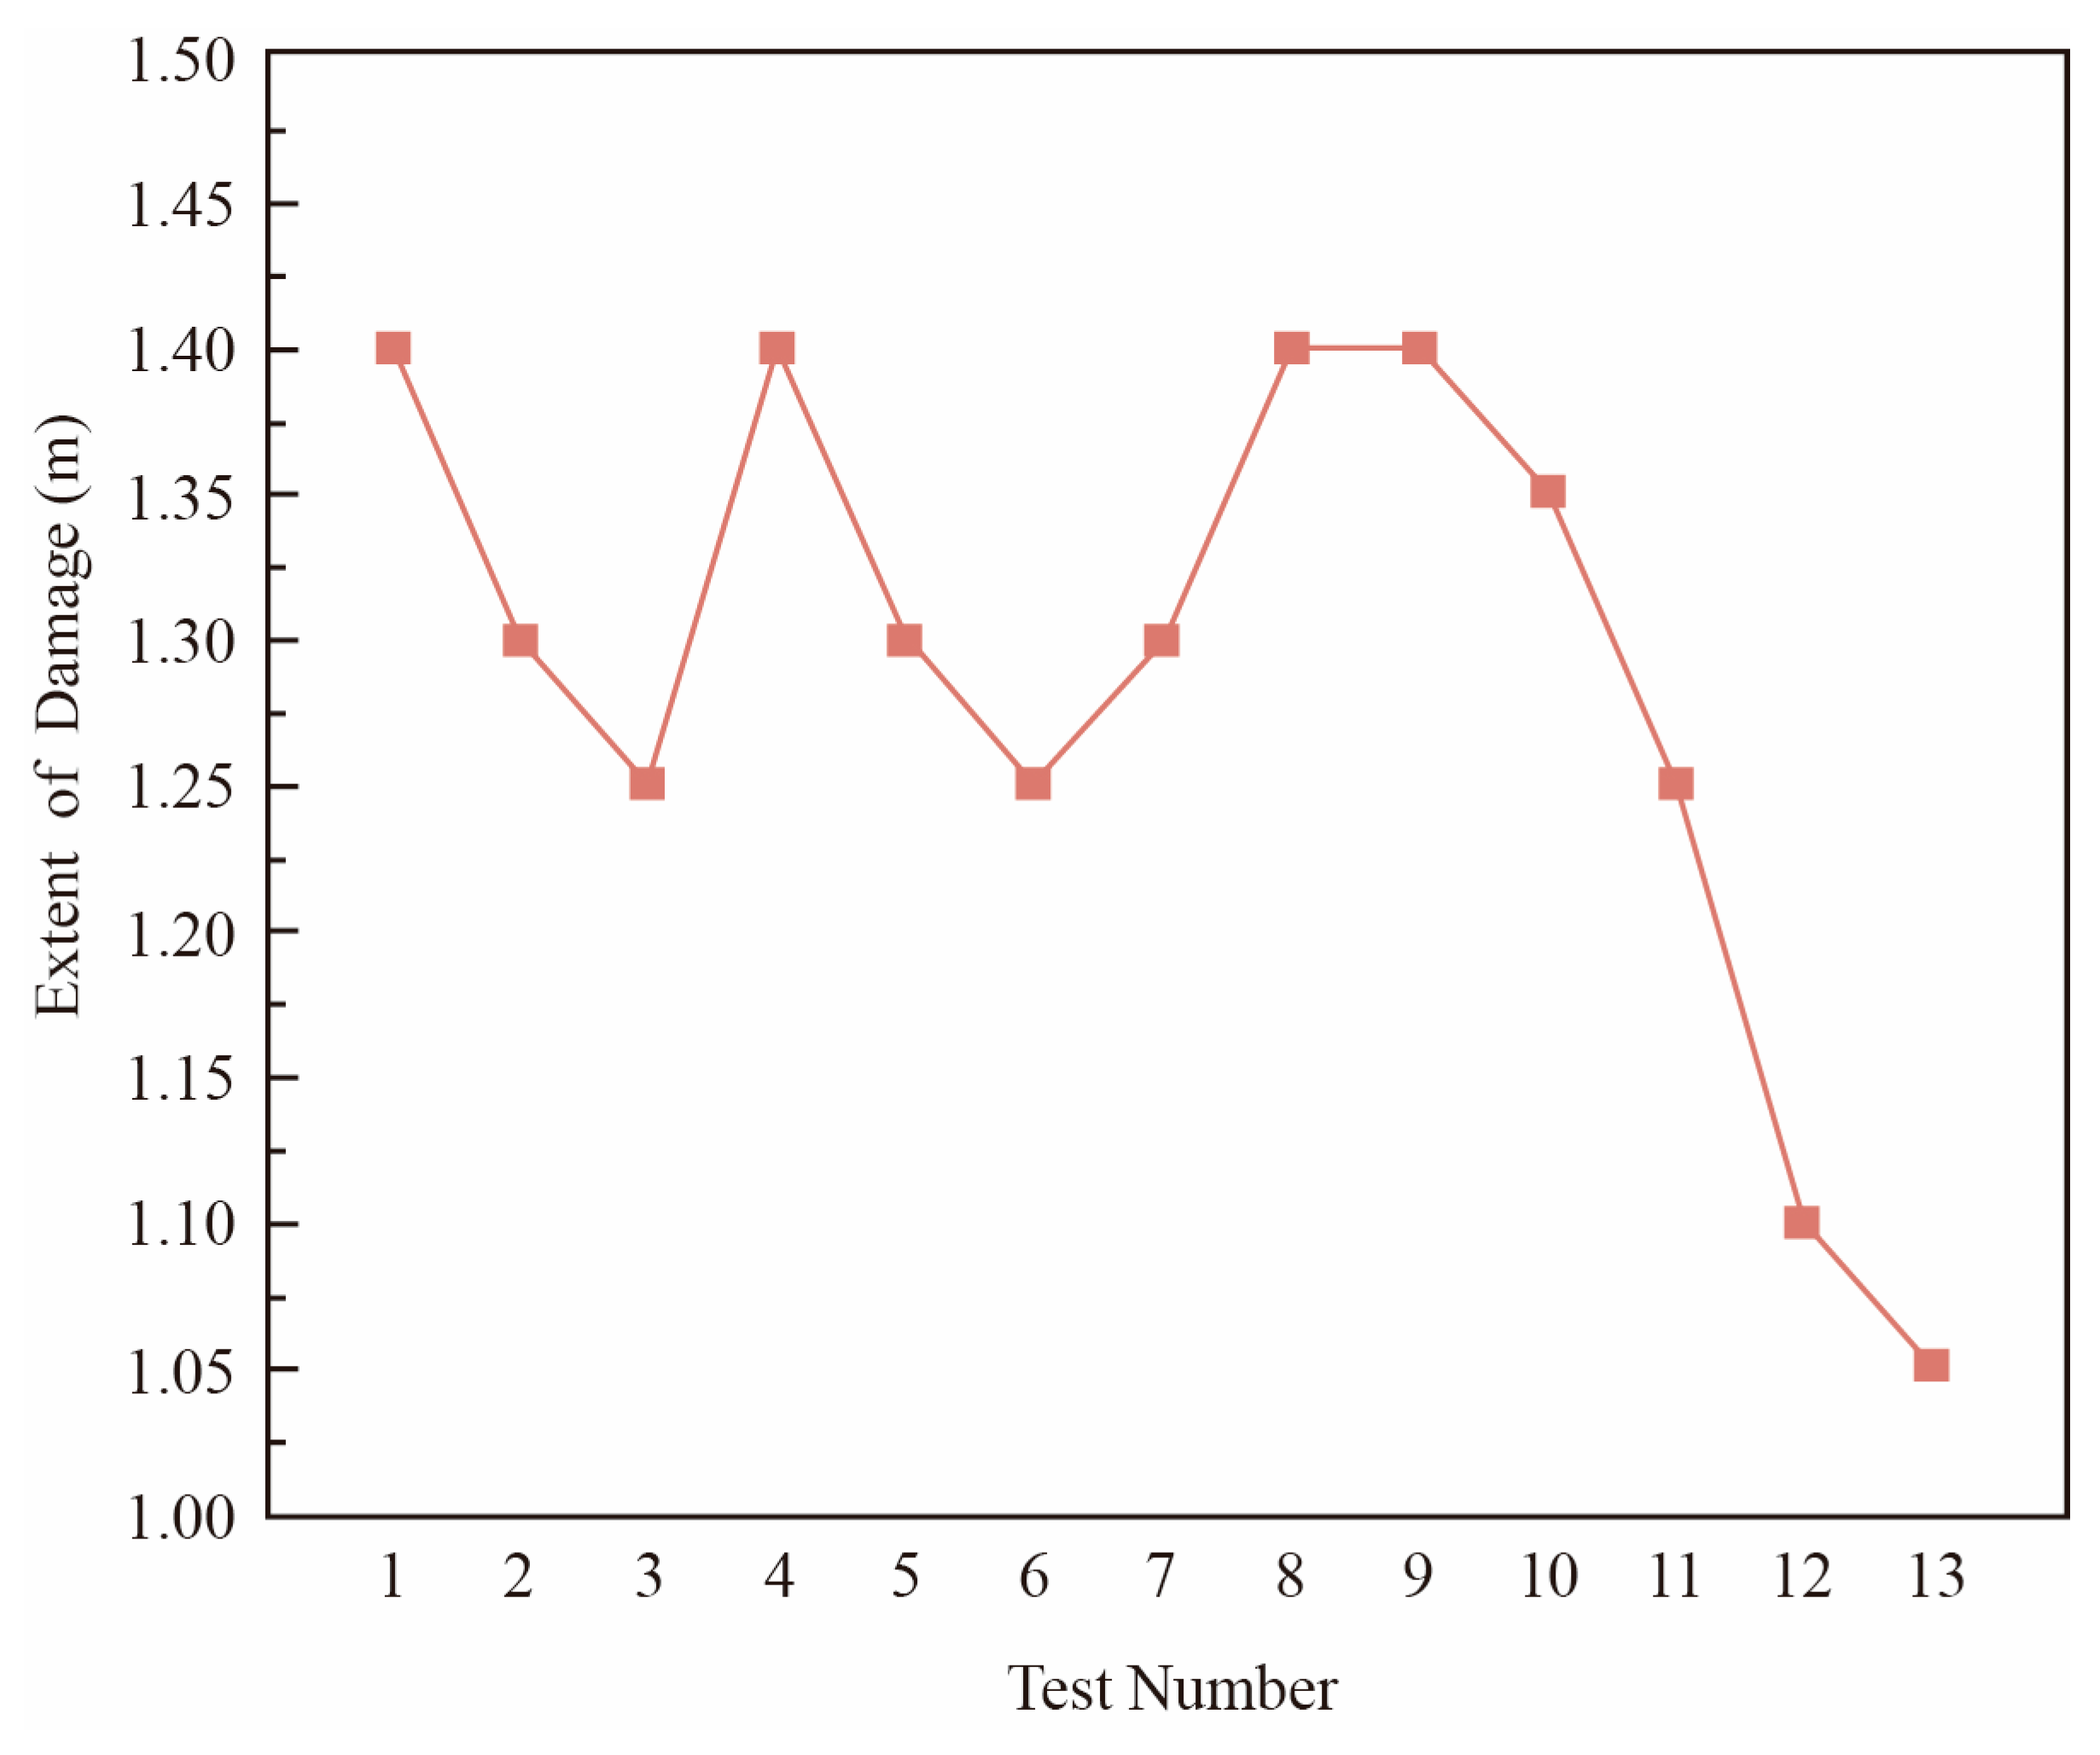
During the tests, the deformation and failure range of the sand foundation were recorded. The observed failure range under different test conditions was approximately 1.05–1.40 m, and the failure angles were concentrated between 63.3° and 65.5°. The failure zone mainly developed beneath and around the loading plate, and no obvious contact or truncation of the shear failure surface by the side wall was observed during the tests. The soil deformation was mainly concentrated in the central loading area. The settlement curves also showed continuous elastic deformation, elastic–plastic transition, and shear failure stages, without abnormal fluctuation or sudden change caused by side-wall restraint.
To further reduce boundary interference, the loading plate was arranged at the center of the model box, and the distance from the edge of the loading plate to each side wall was kept the same. The side walls of the model box were rigid enough to maintain the test geometry, and the transparent side plates allowed visual observation of the deformation zone. Based on the observed failure range, failure angle, and the regularity of the load–settlement curves, the boundary effect was considered limited in this model test system. However, because the box width-to-plate width ratio was finite, a possible residual boundary effect cannot be completely excluded. This limitation has been added to the discussion of model applicability.
Although the boundary effect was controlled and evaluated through the geometric arrangement and deformation observations, it should be noted that the model test still has a finite boundary size. Therefore, the experimental results are more suitable for revealing the relative influence of moisture content, particle size distribution, and relative density on bearing capacity, rather than directly representing full-scale field bearing capacity without correction. For large-scale engineering applications, the model results should be used together with in situ plate load tests or numerical simulations to further consider scale and boundary effects.
5. Model Test Results
5.1. Settlement Curve Analysis
The overall model test process is shown in
Figure 6. The load–settlement curves under different particle size distributions are shown in
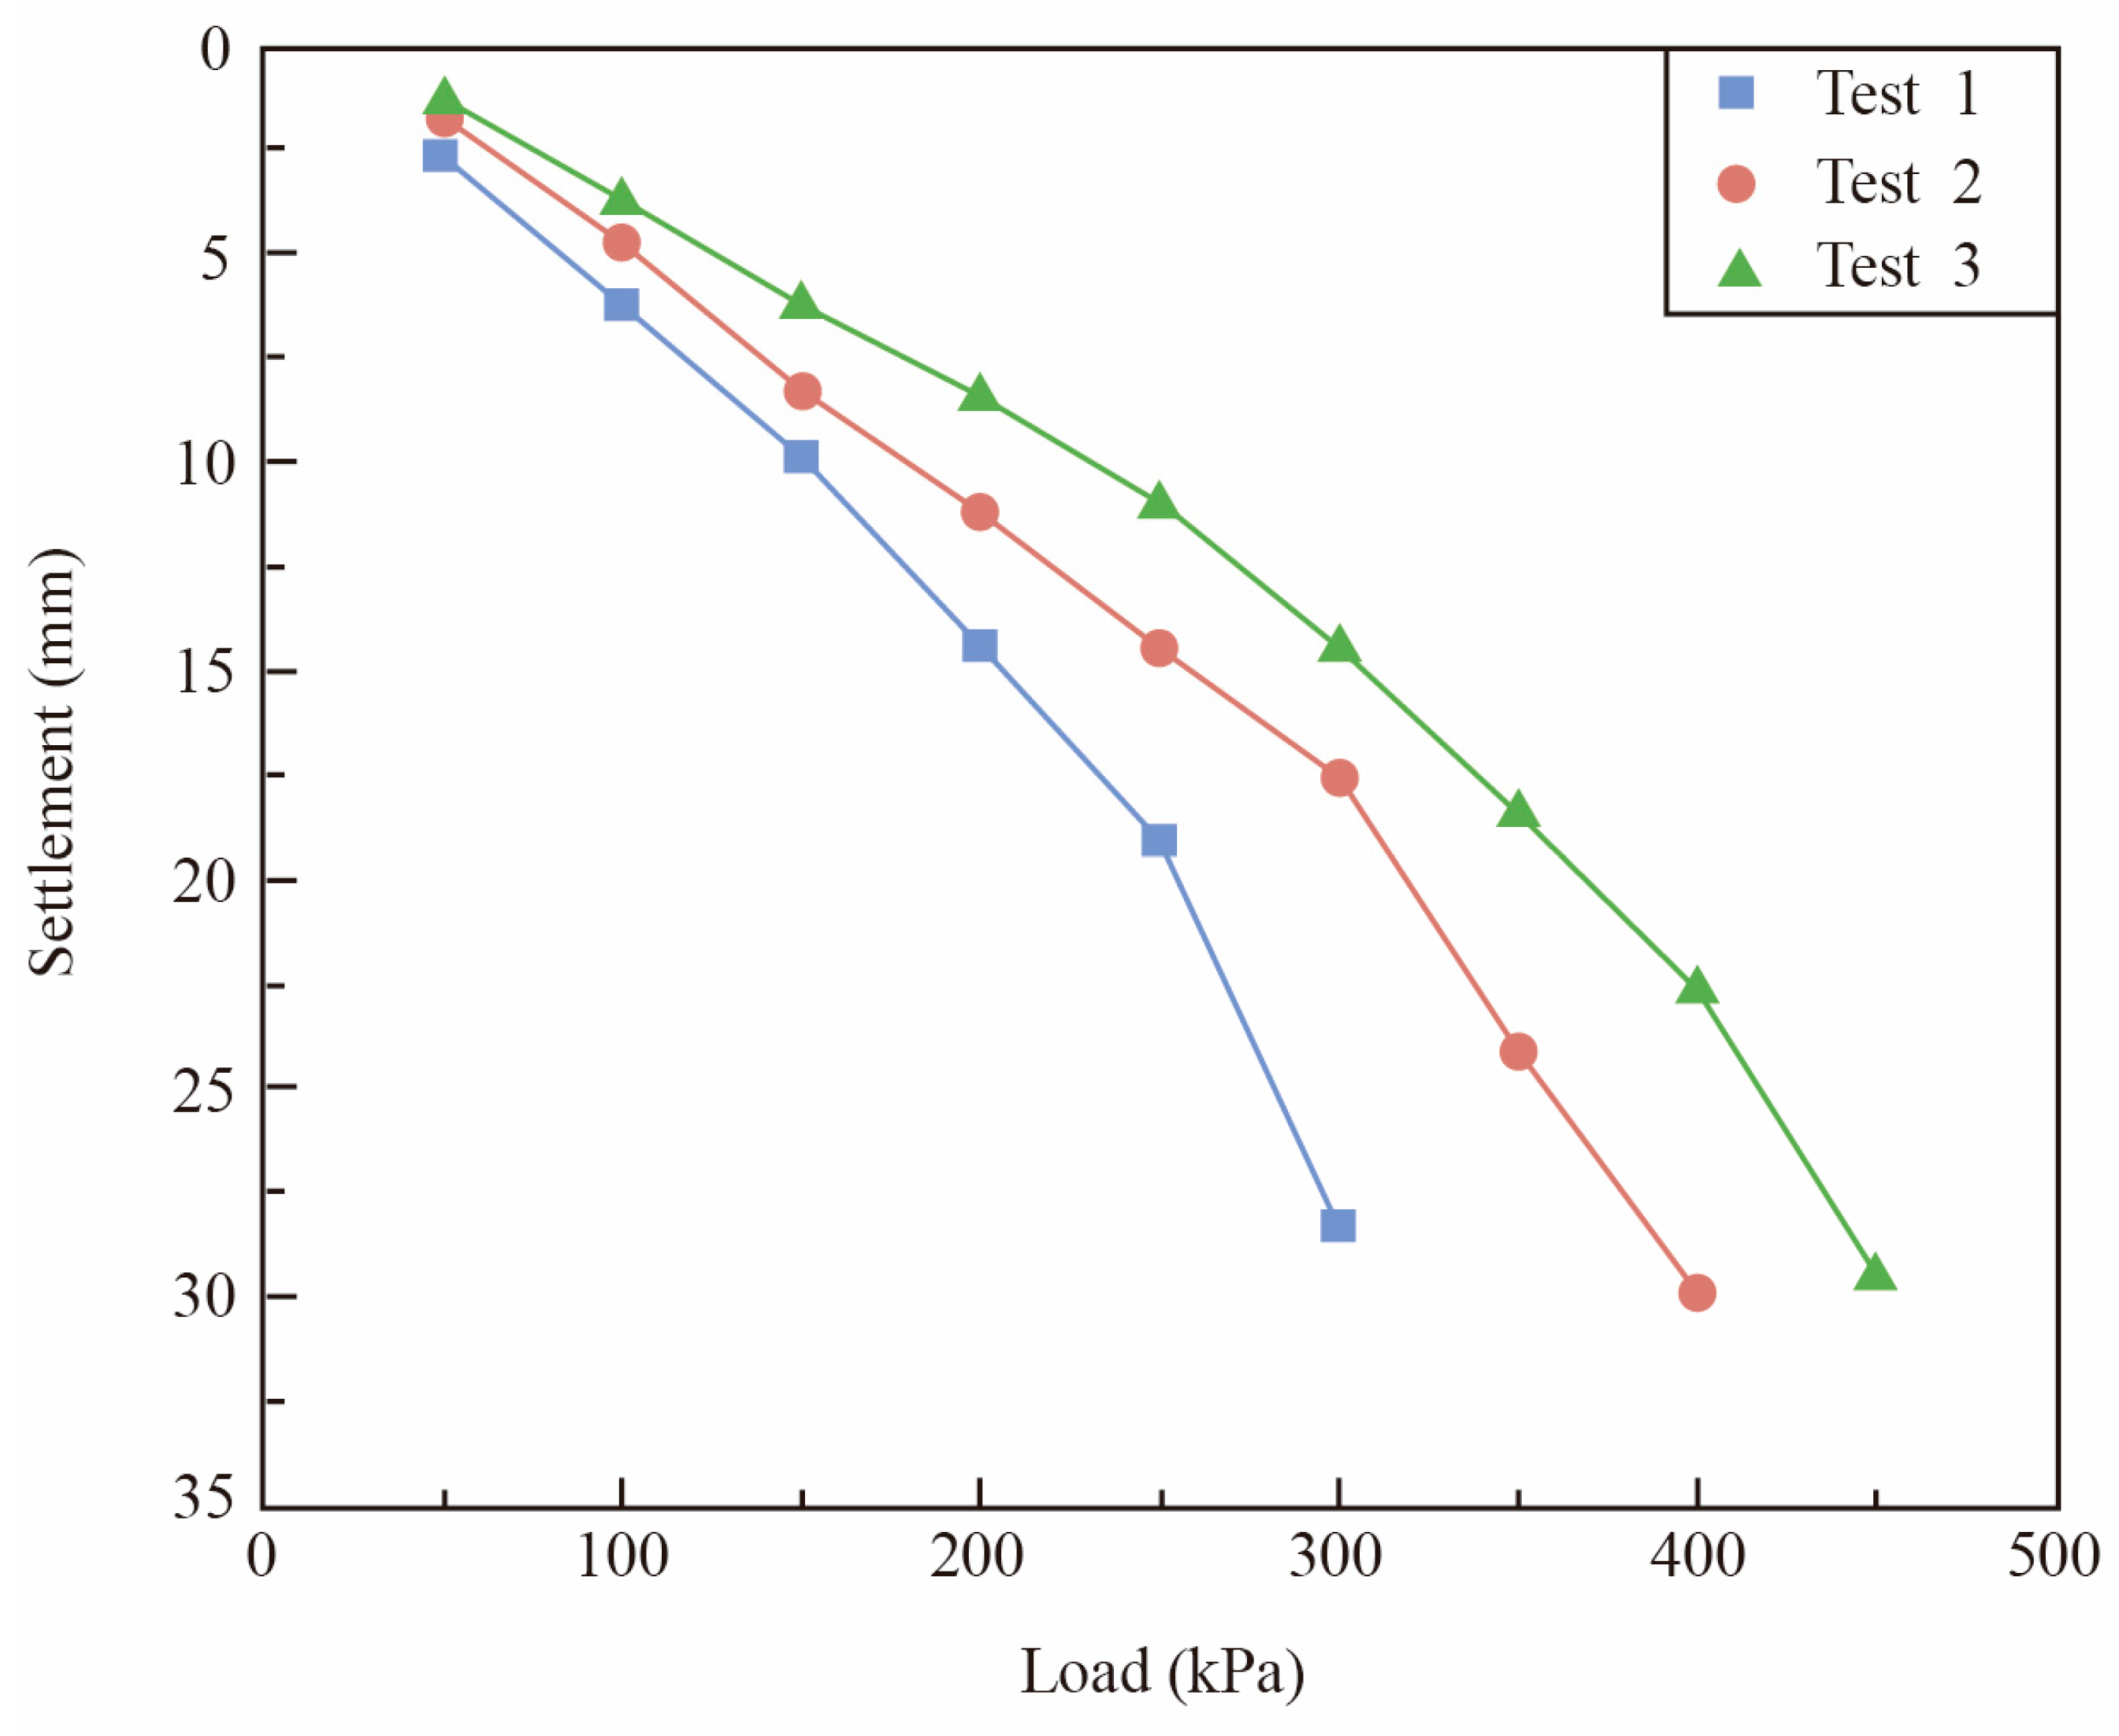
Figure 7. The results indicate that gradation has a significant influence on soil compressibility and bearing performance, while under the same load level, the settlement decreased as the gradation improved. At 100 kPa, the settlements of poorly graded, moderately graded, and well-graded sands were 6.2 mm, 4.7 mm, and 3.7 mm, respectively, and at 300 kPa, the corresponding settlements were 28.3 mm, 17.8 mm, and 14.5 mm. These results indicate that well-graded sand has stronger resistance to deformation and higher bearing potential.
The load–settlement curves under different moisture contents are shown in
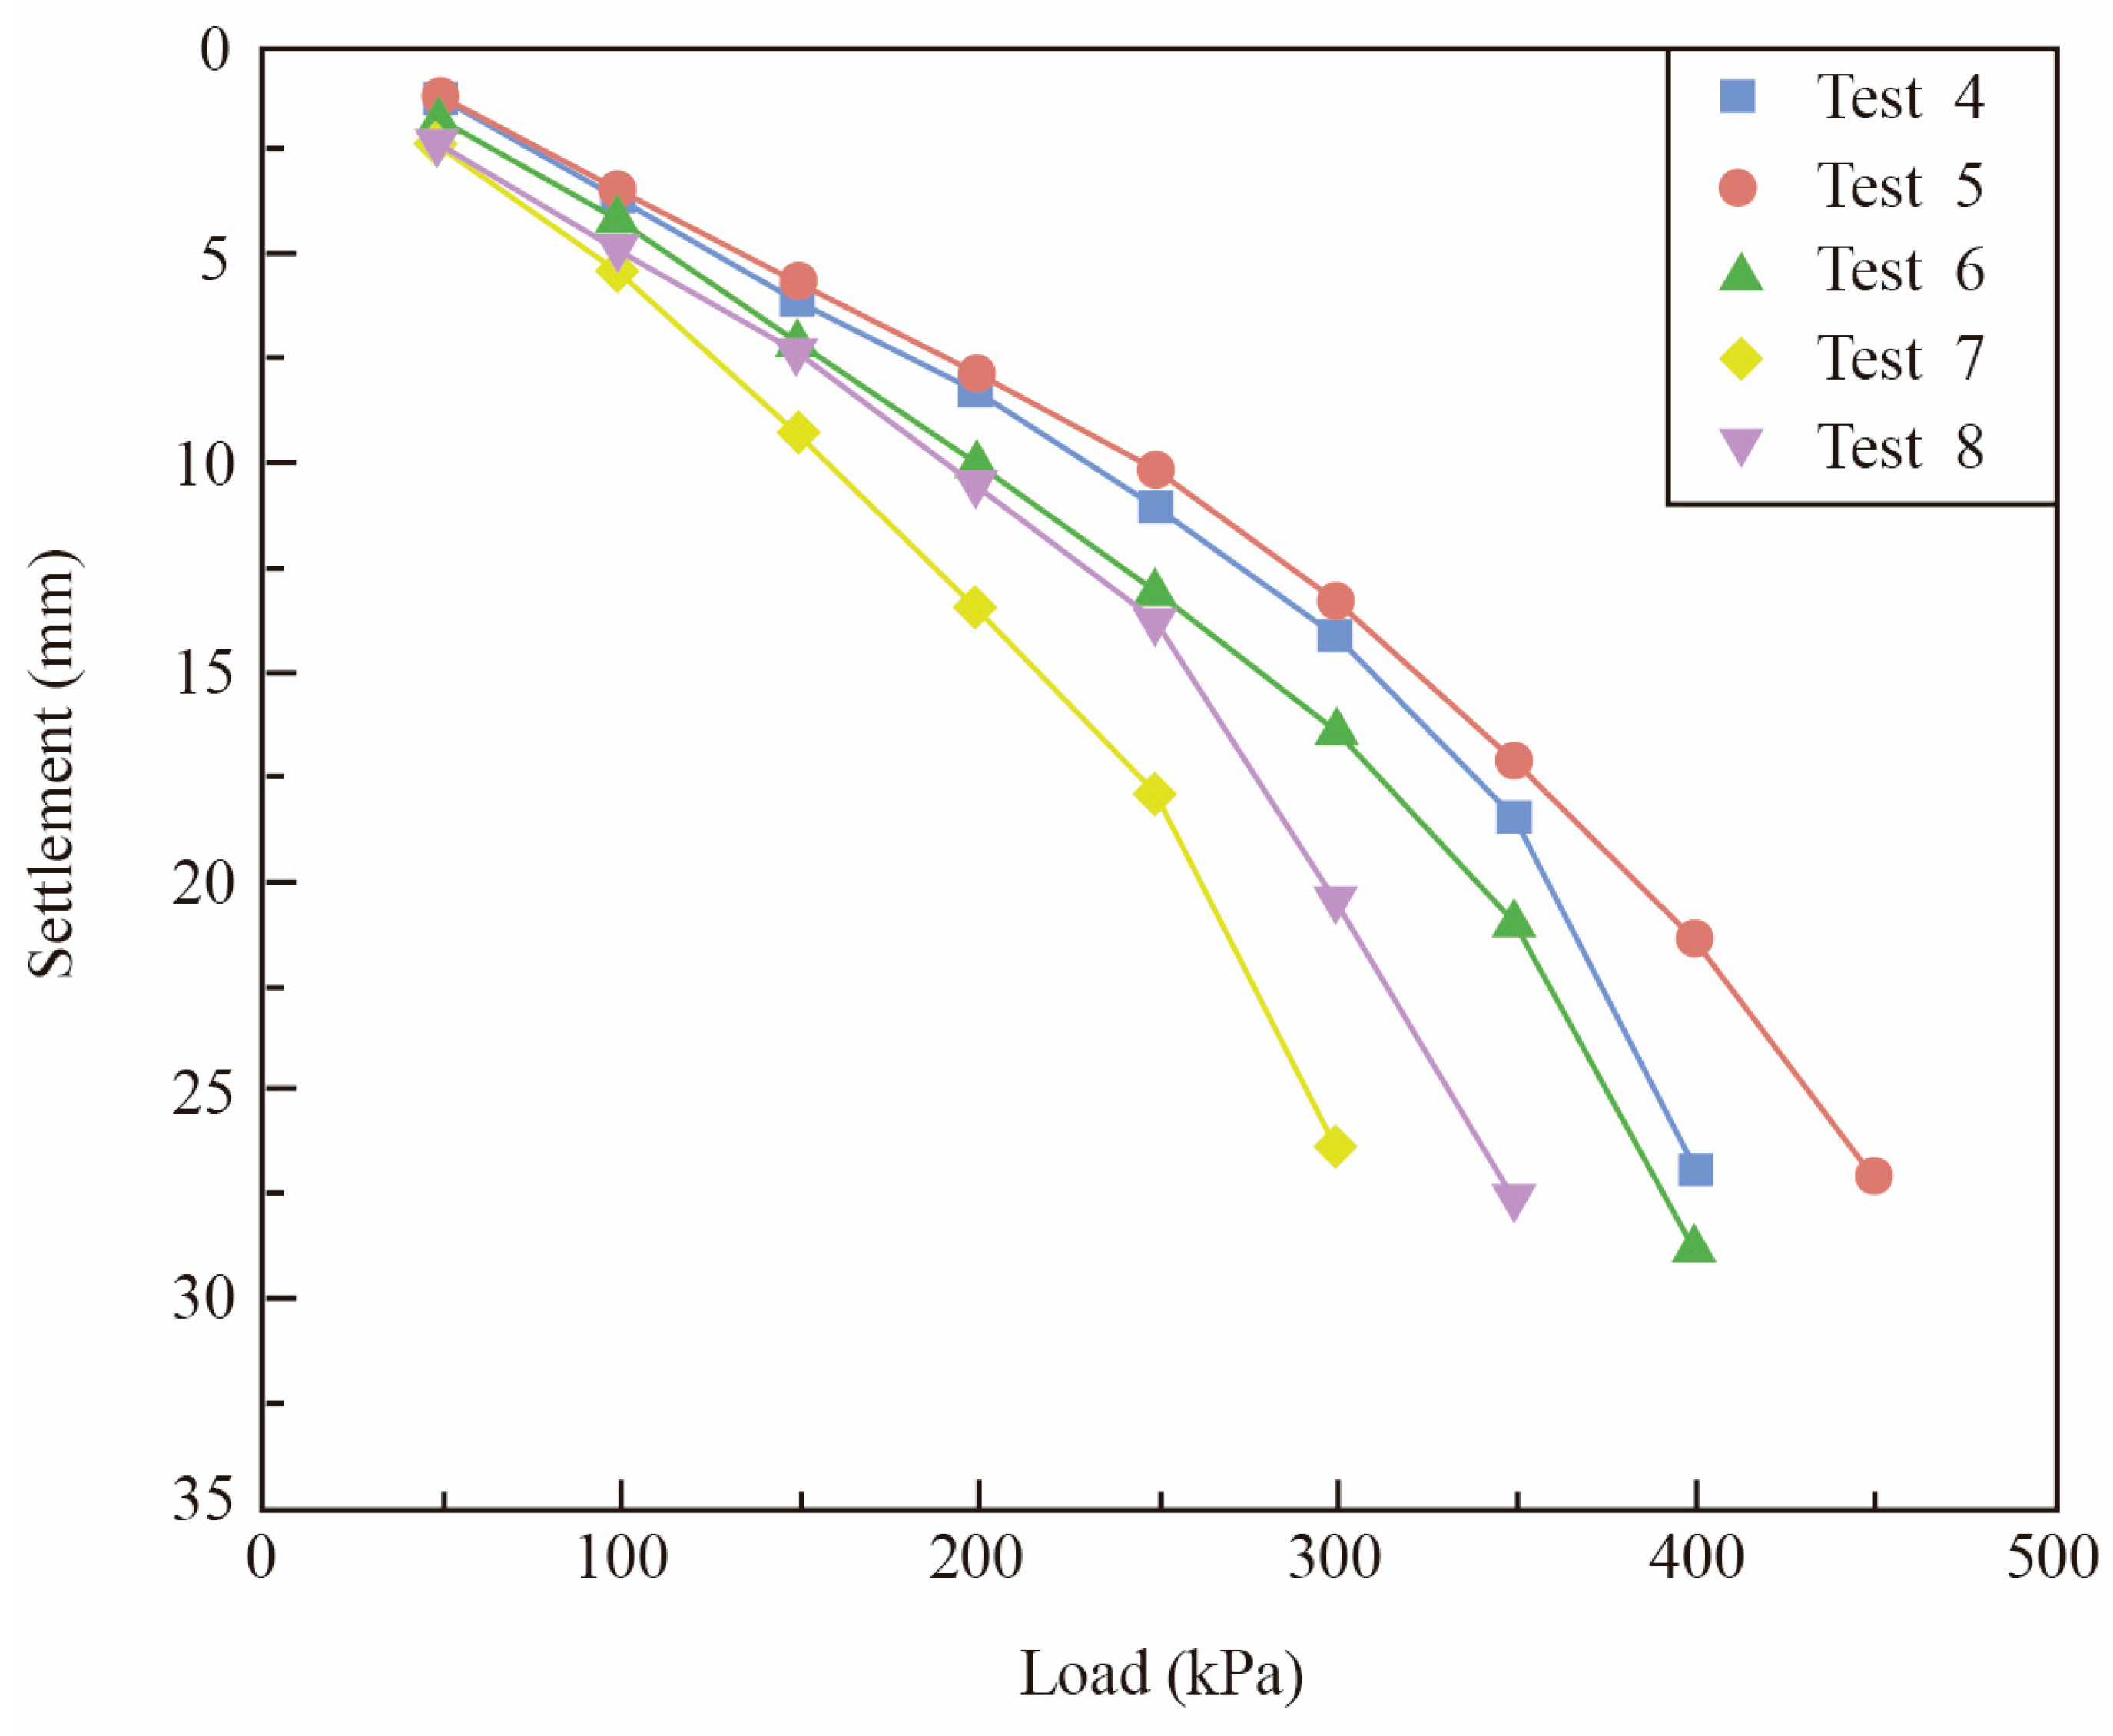
Figure 8. Moisture content had a non-monotonic effect on the deformation behavior of the sand. As the moisture content increased from 4% to 12%, the settlement first decreased and then increased under the same load. The best deformation resistance was observed at a moisture content of approximately 7%. When the moisture content exceeded this value, excess pore water weakened the interparticle contact and reduced the bearing capacity.
The load–settlement curves under different relative densities are shown in
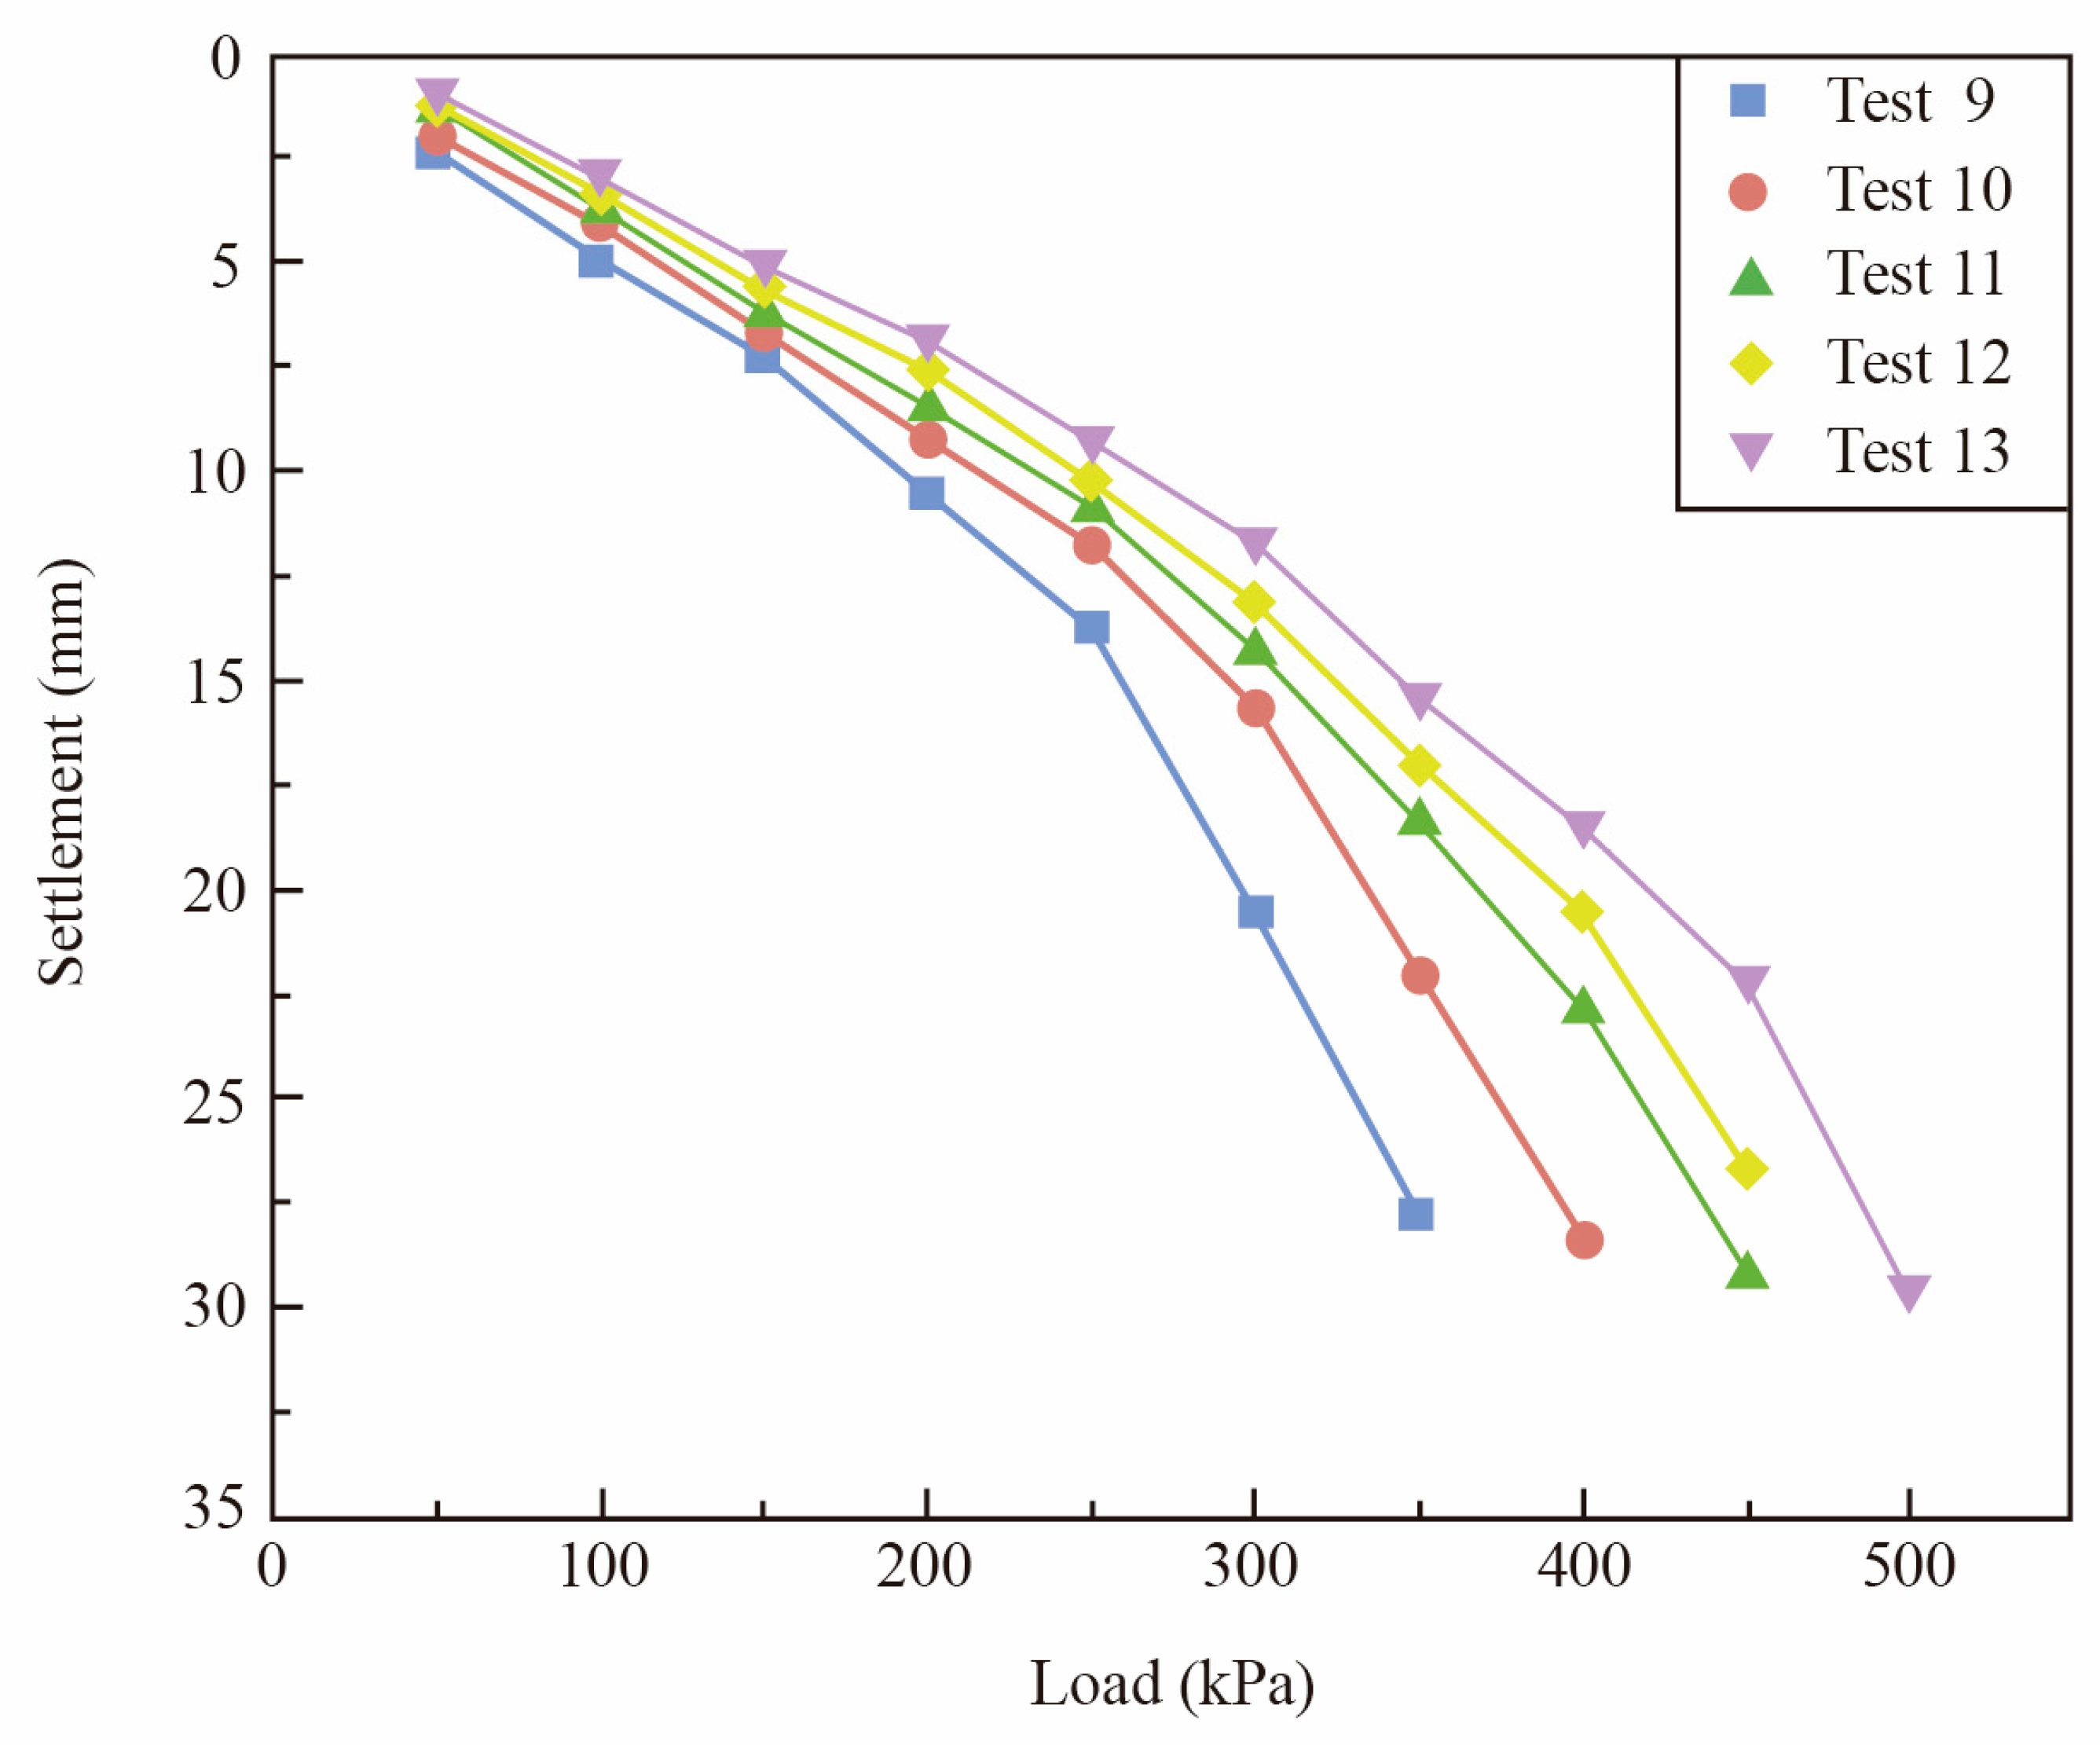
Figure 9. The settlement decreased significantly as the relative density increased, and at 200 kPa, the settlement decreased from 9.2 mm to 6.9 mm when the relative density increased from 46% to 64%. Meanwhile, at 400 kPa, the settlement decreased from 28.4 mm to 18.5 mm. These results show that increasing relative density improves the compactness of the sand, enhances deformation resistance, and increases bearing capacity.
5.2. Analysis of Subgrade Deformation and Failure Modes
The load–settlement curves obtained from the static plate load tests showed a typical steep-drop trend. At the initial loading stage, the curves were approximately linear, indicating that the sand mainly underwent elastic deformation. When the load approached approximately 200 kPa, the curves began to bend, suggesting the development of plastic shear strain in the foundation soil. When the load increased to about 250 kPa, settlement increased rapidly, and the applied load could no longer be maintained, indicating that the dominant failure mode of the Quanzhou coastal beach sand was general shear failure.
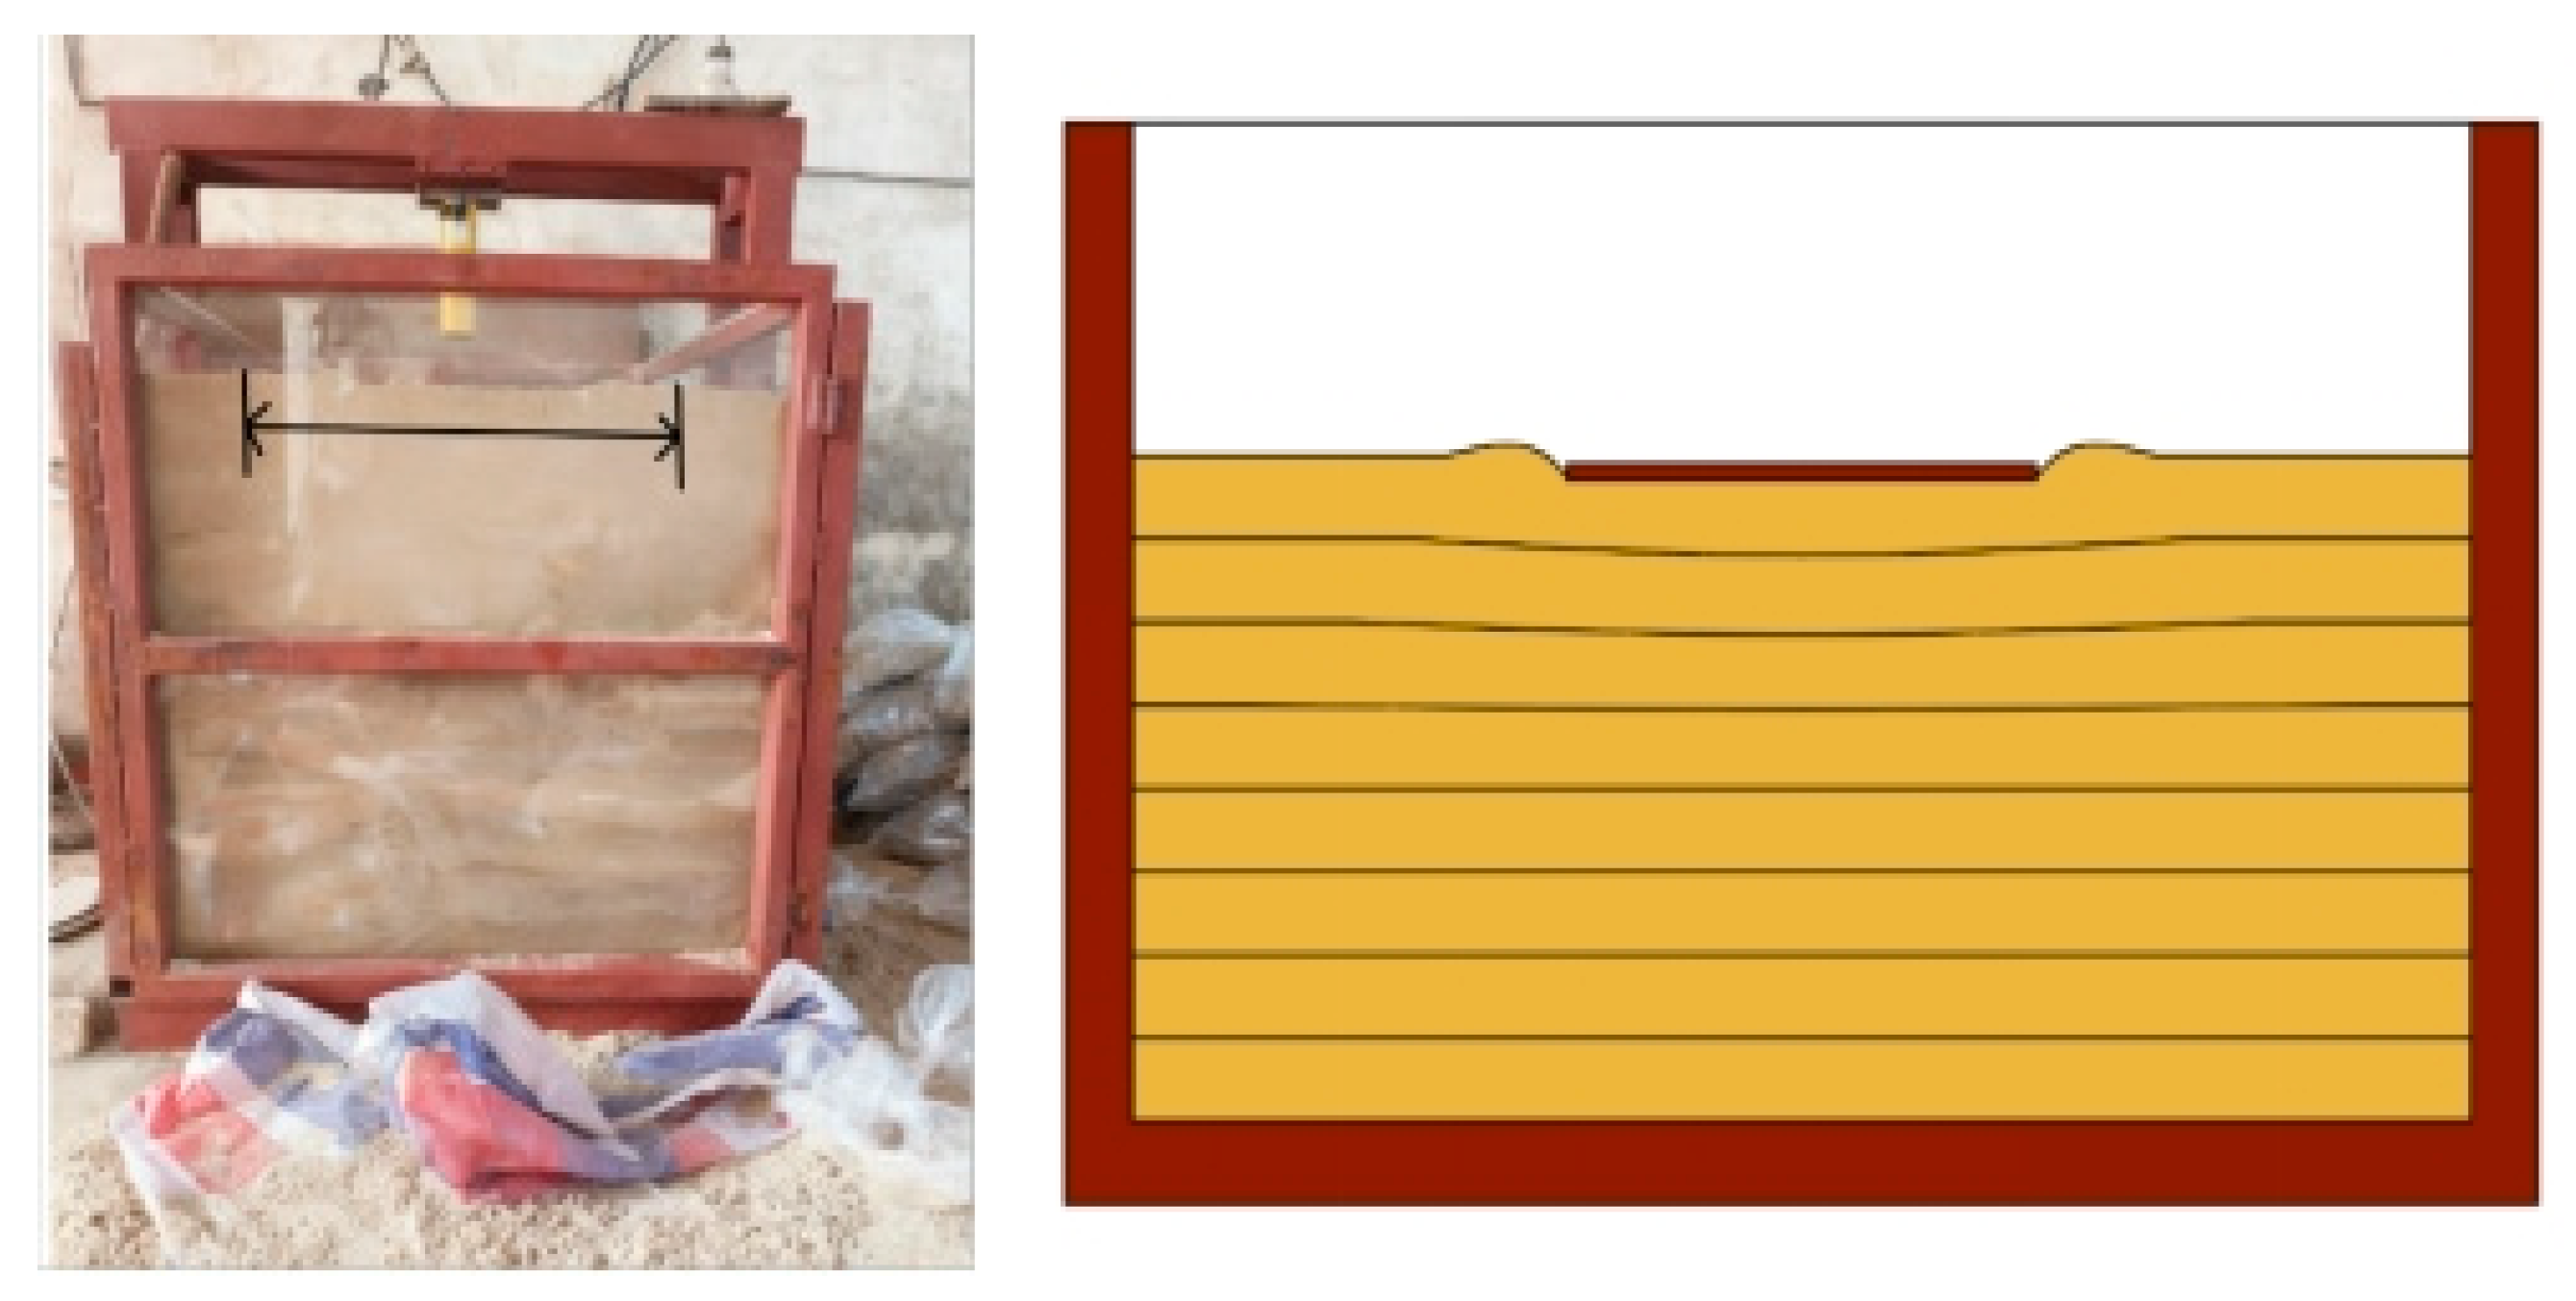
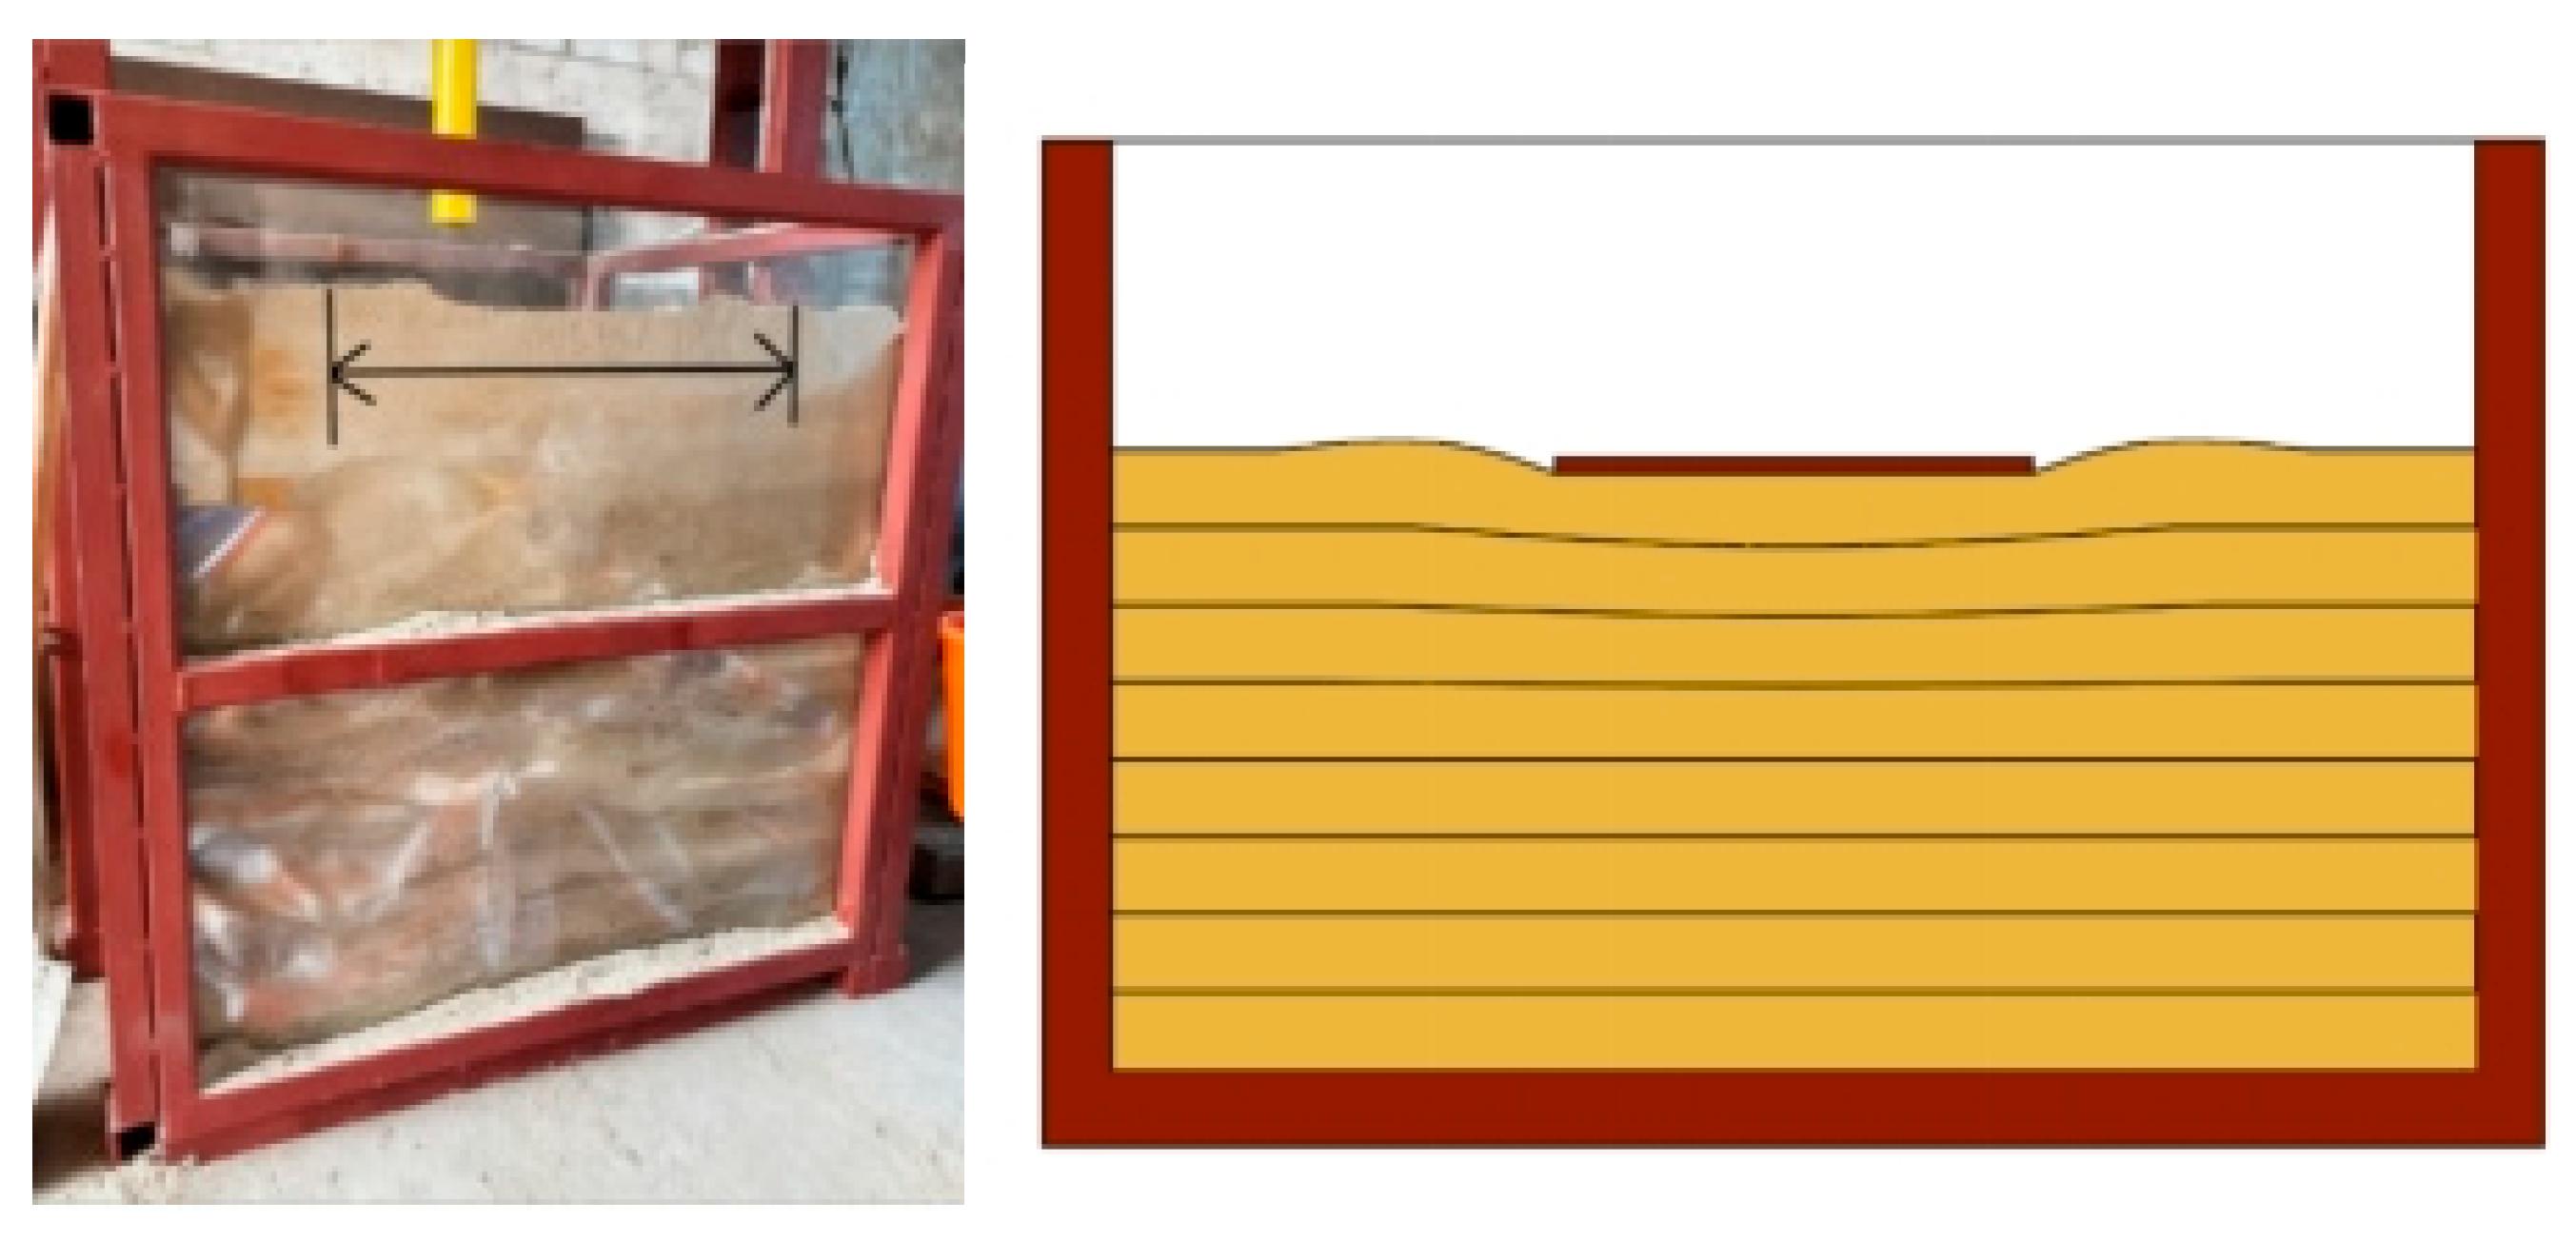
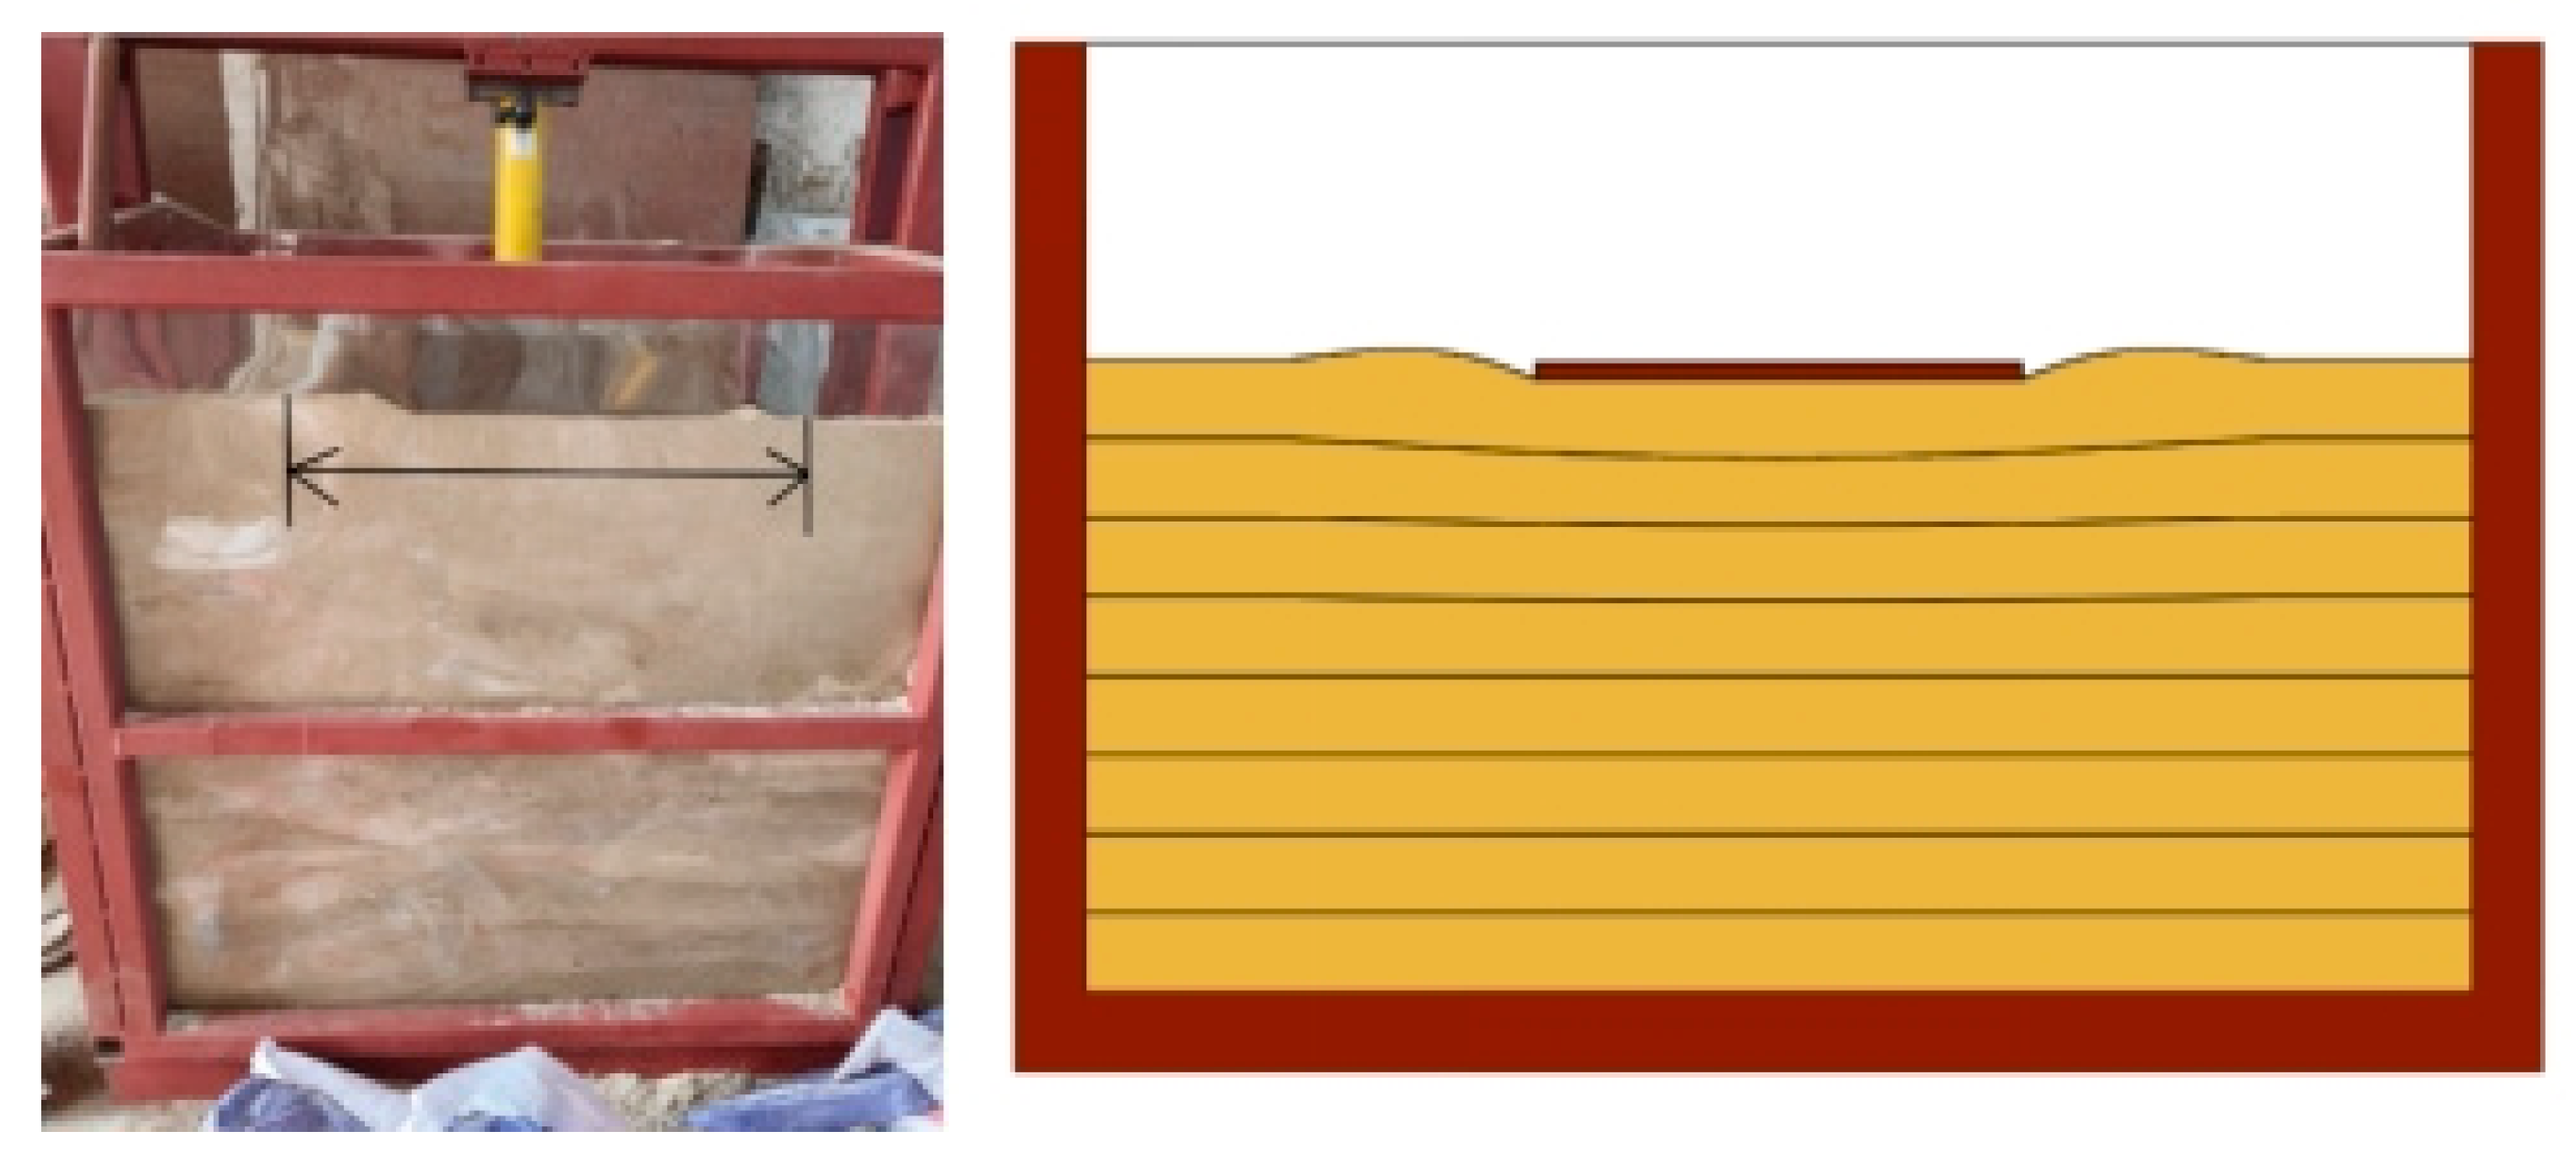
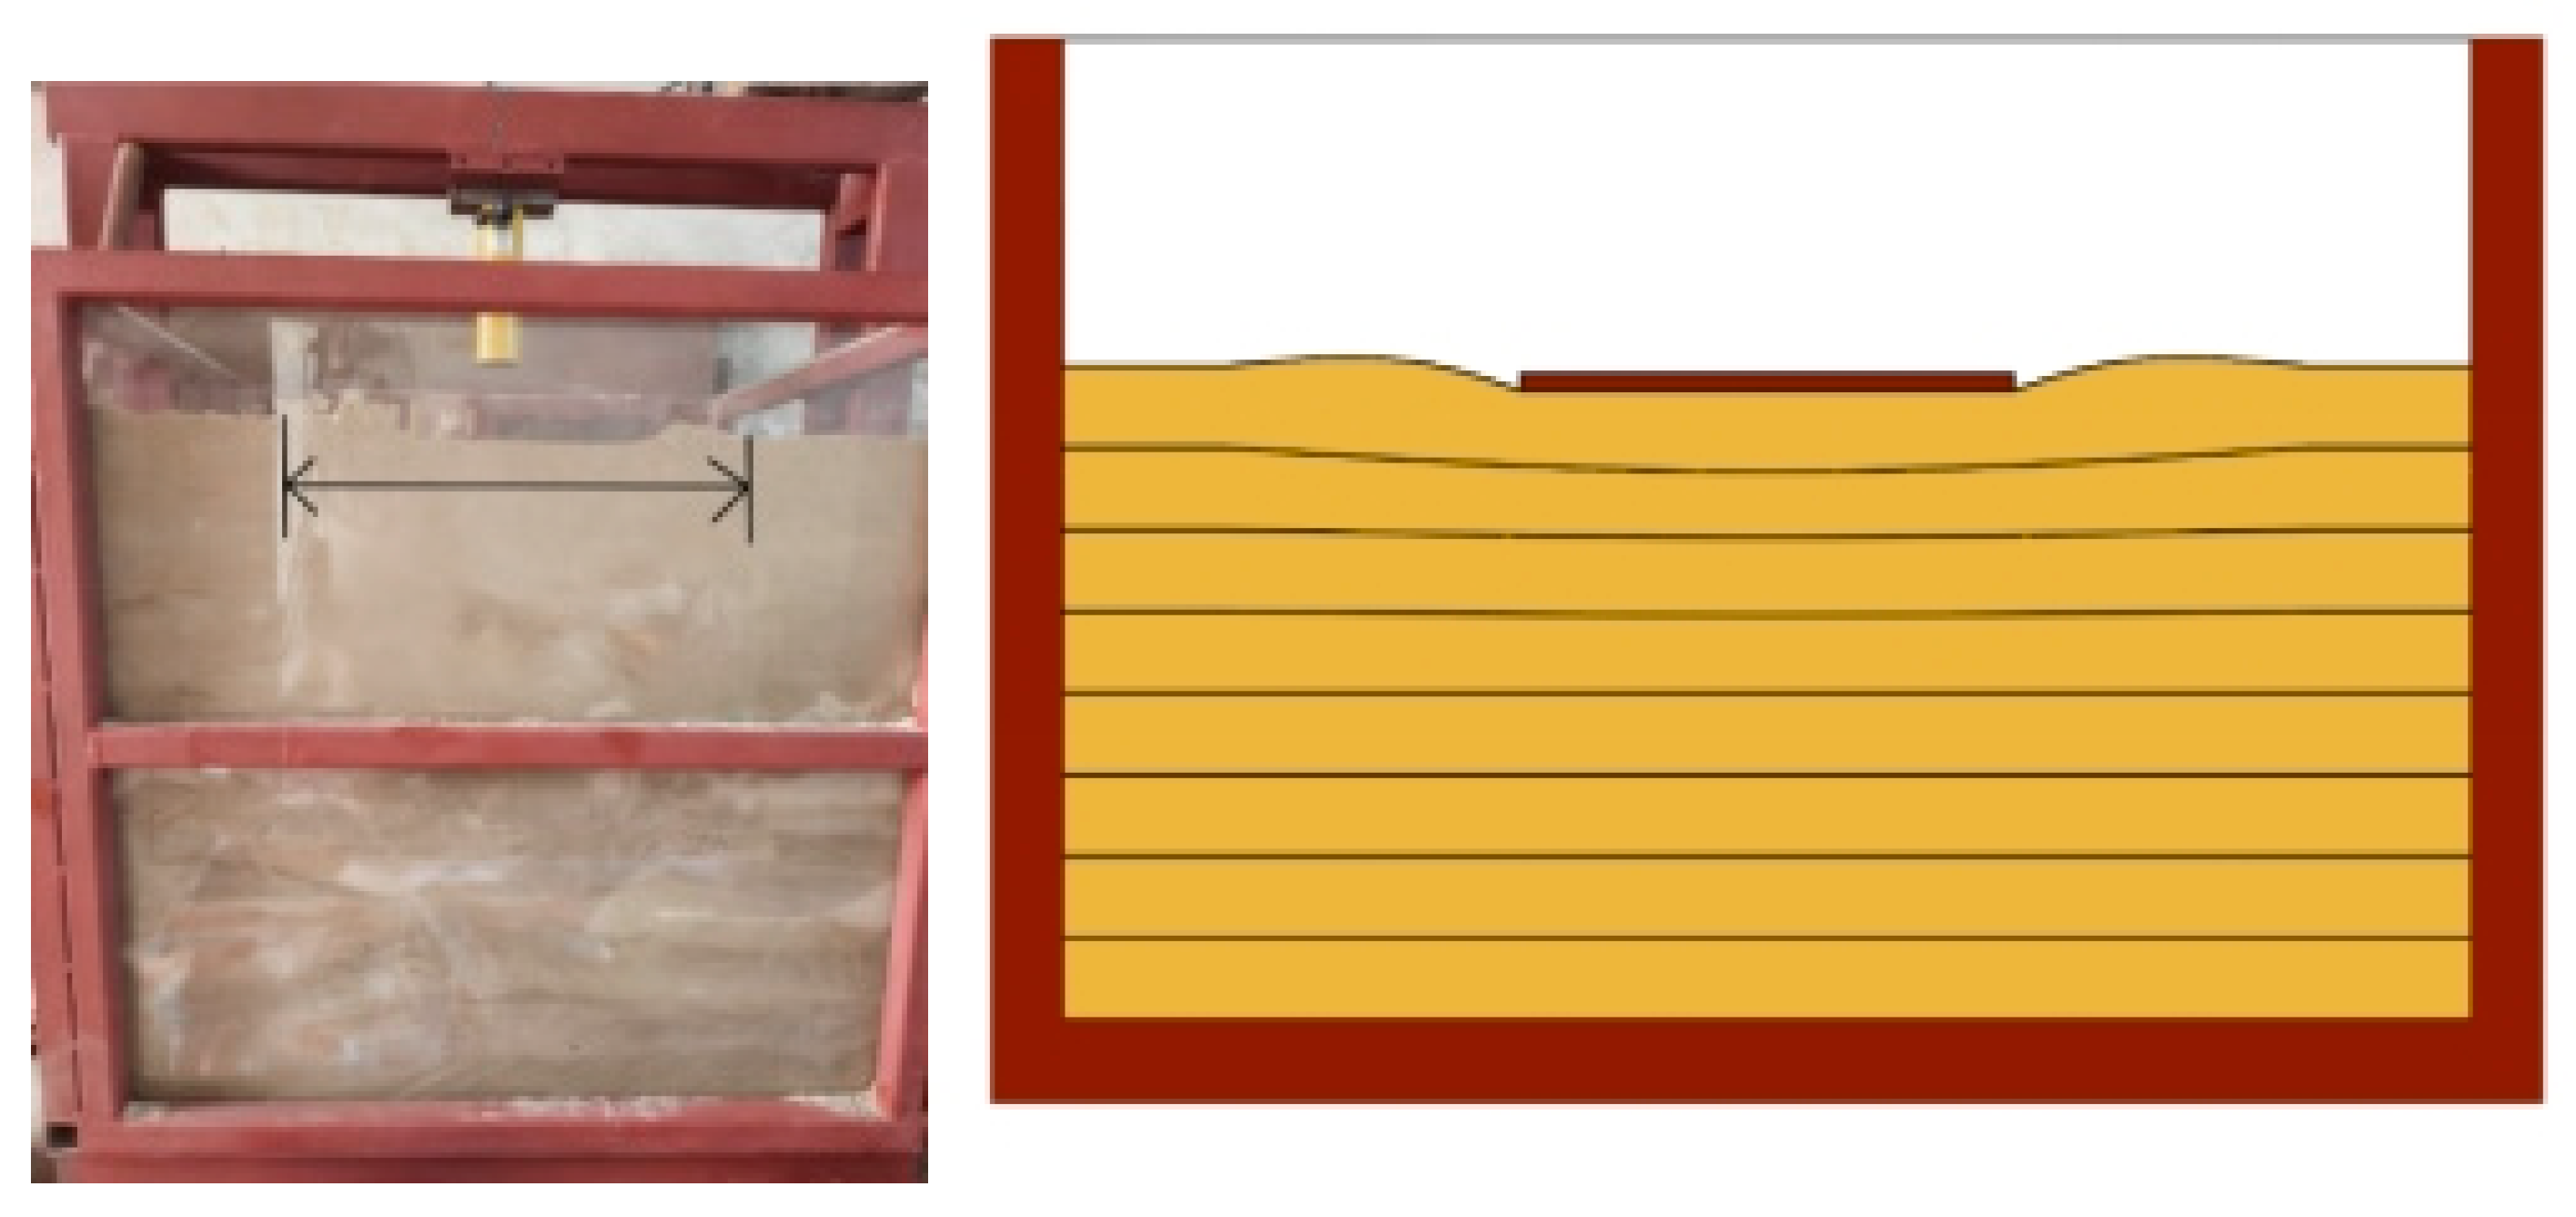
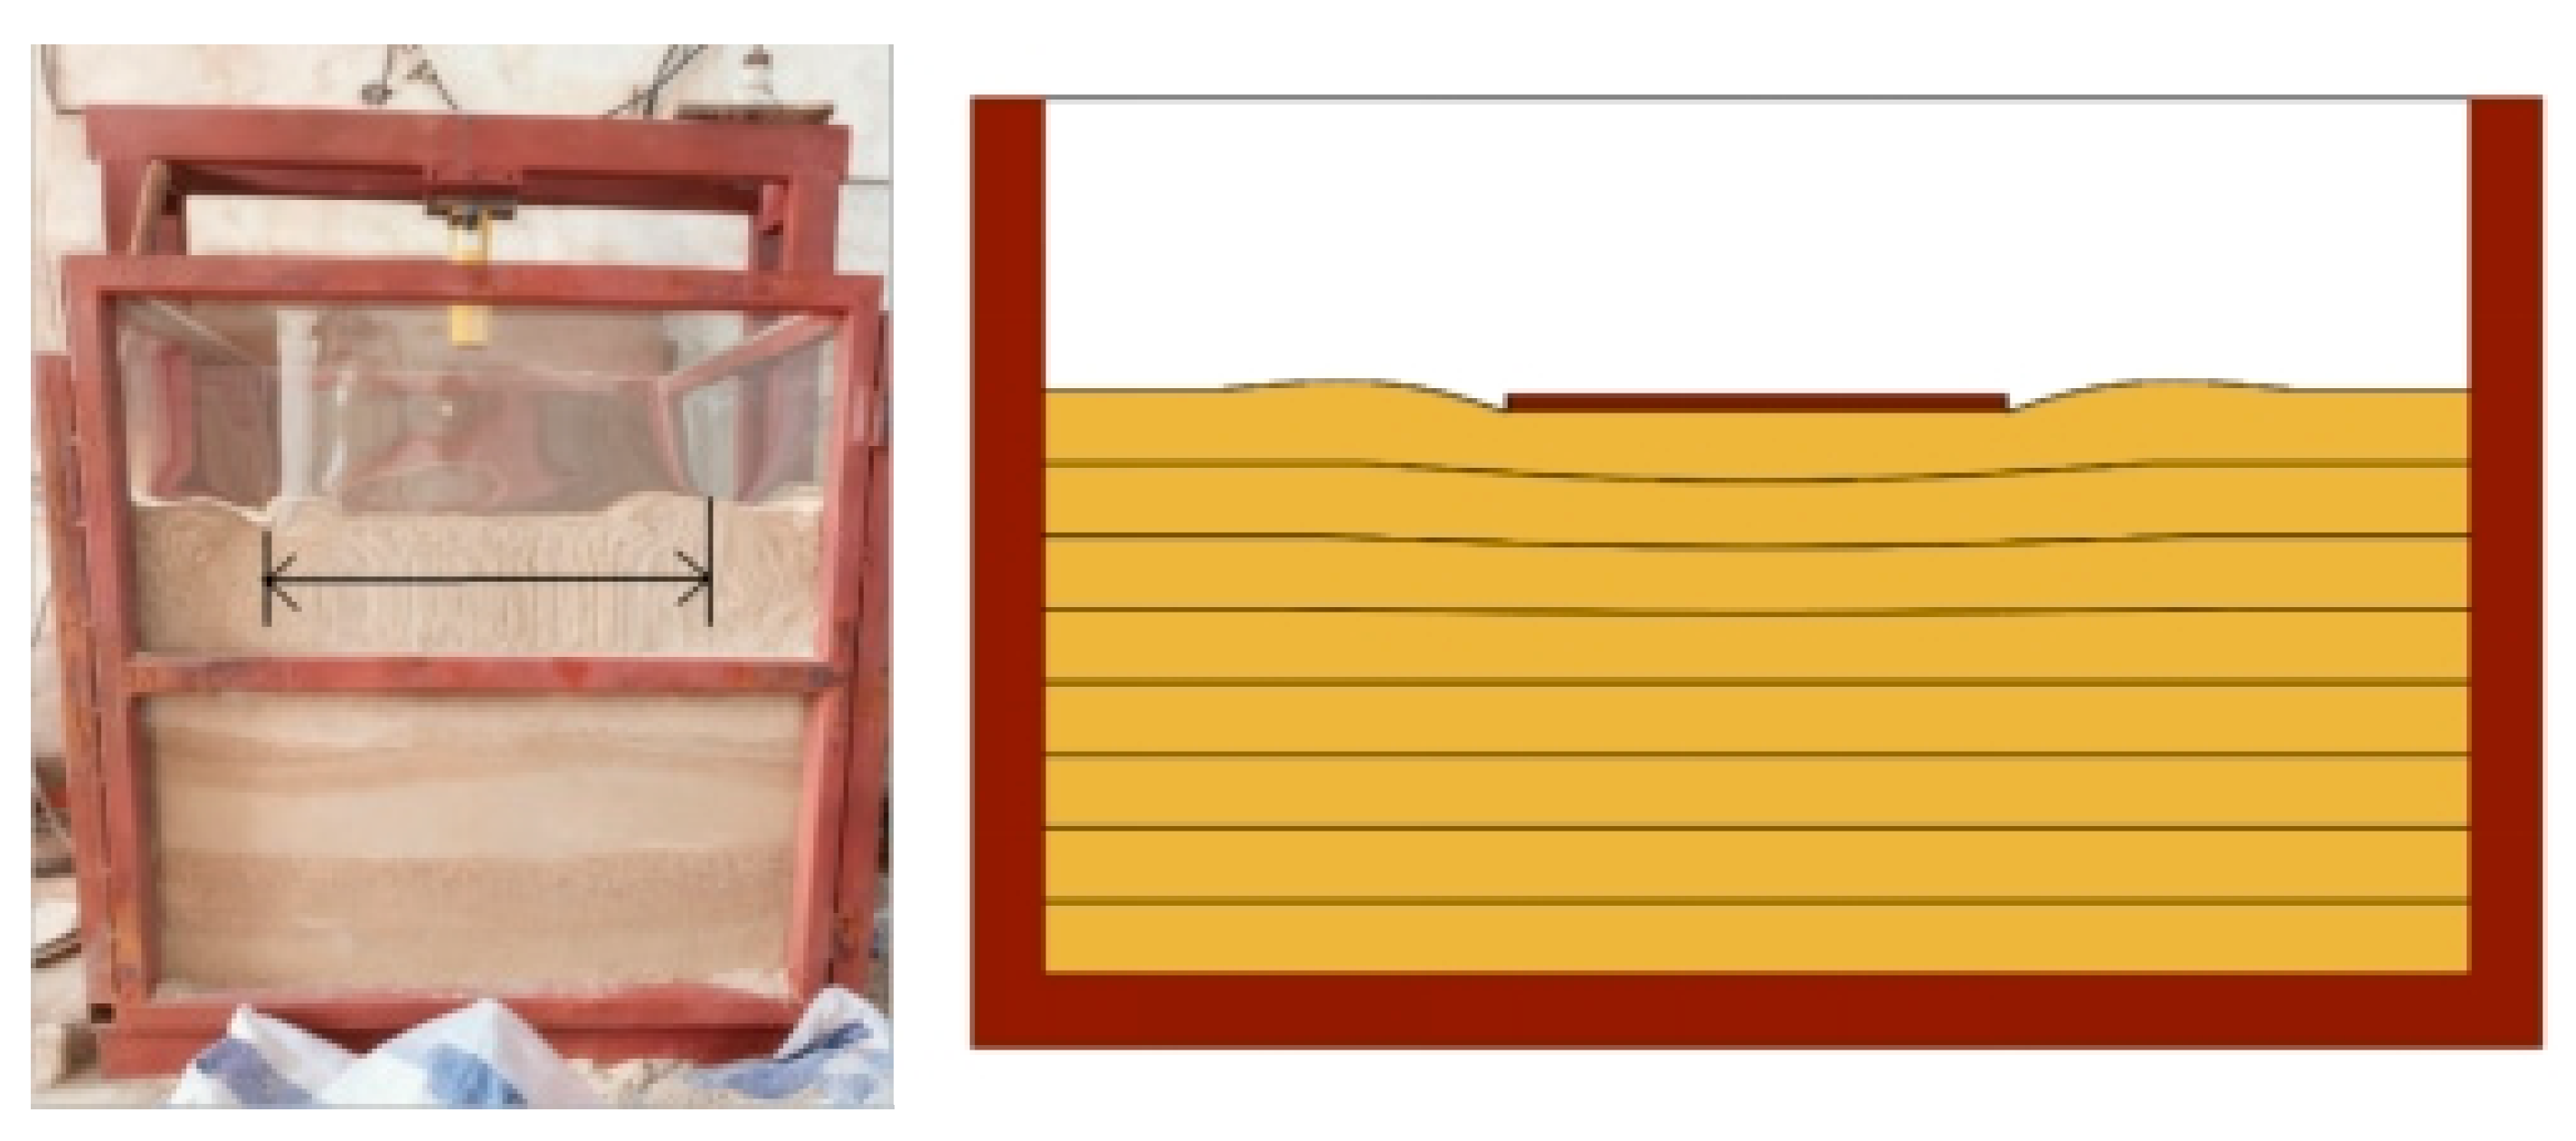
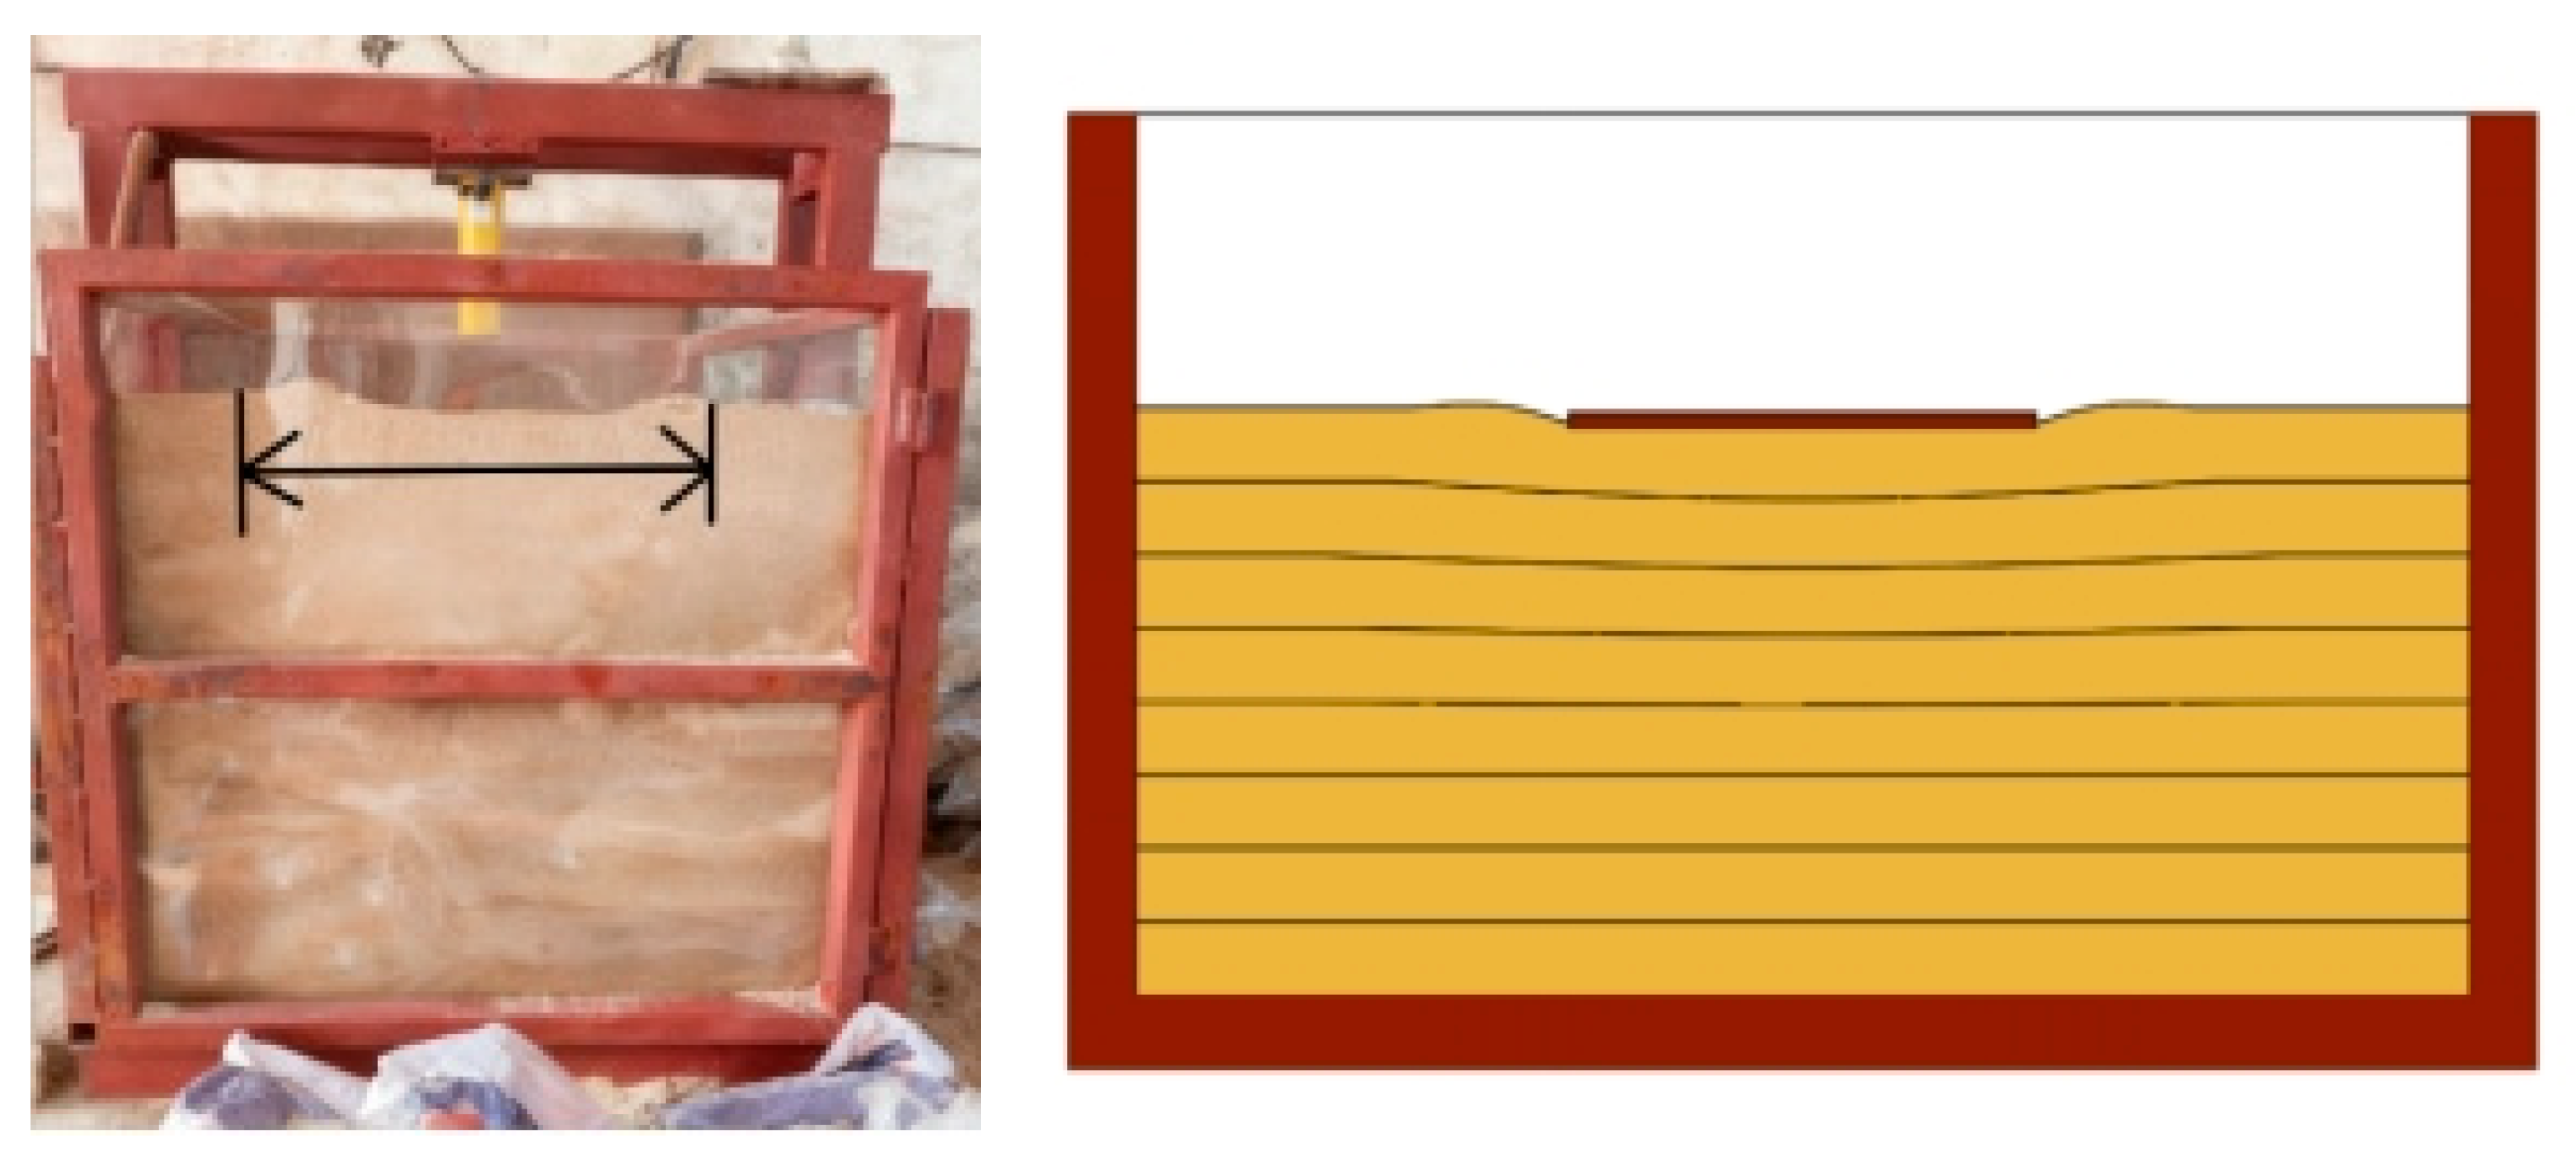
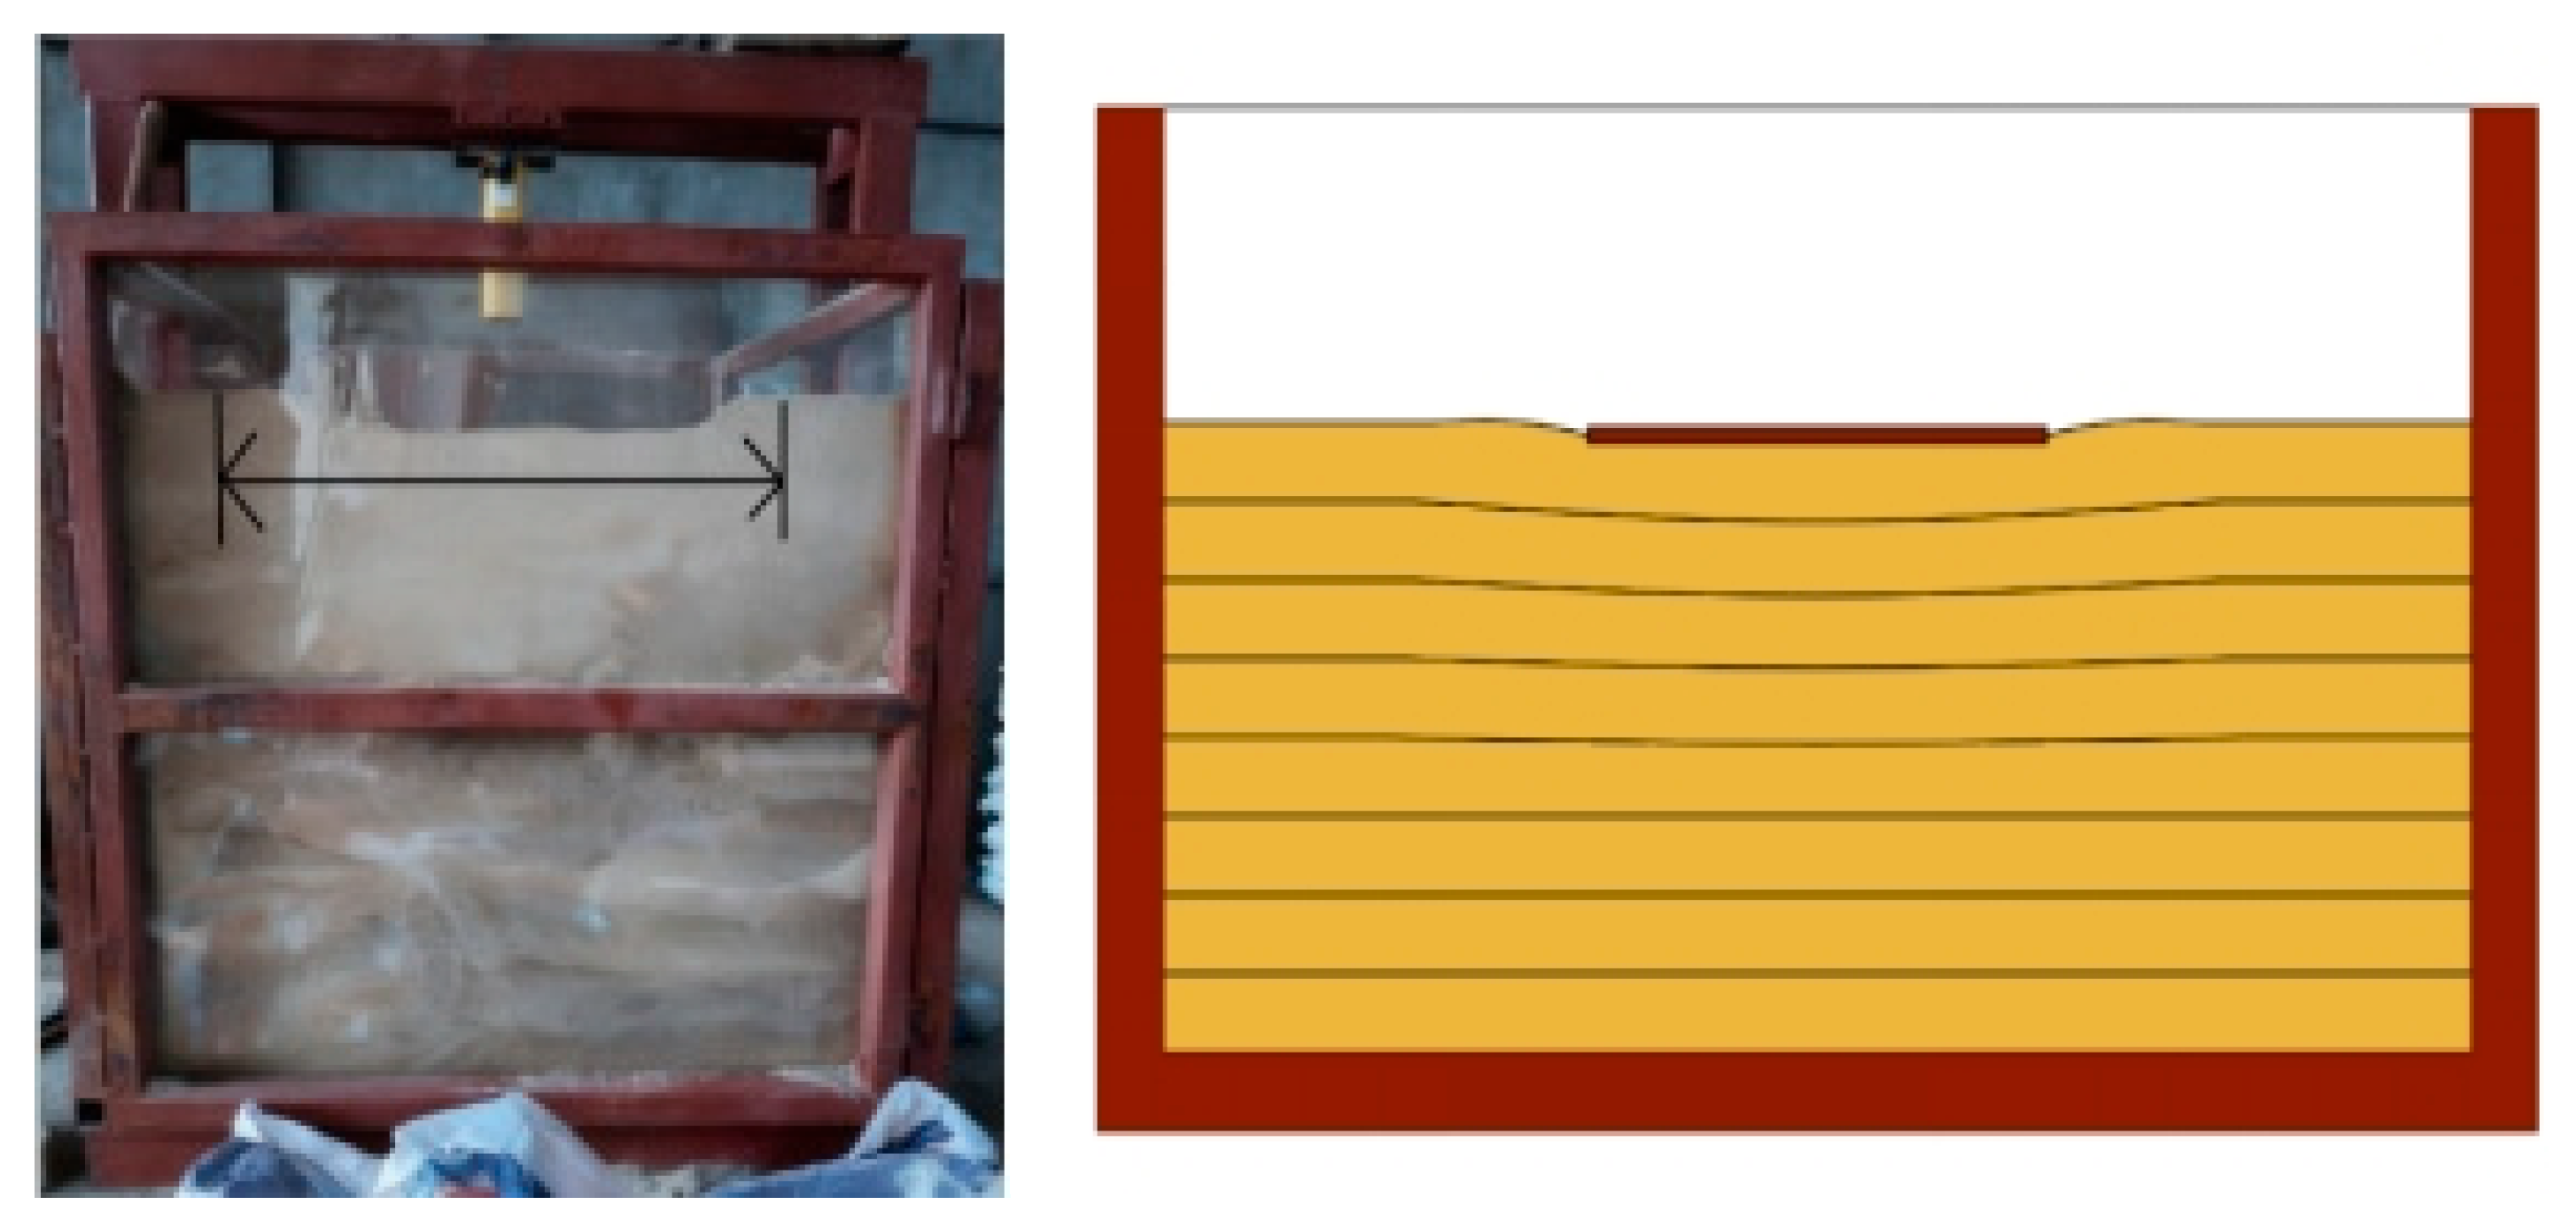
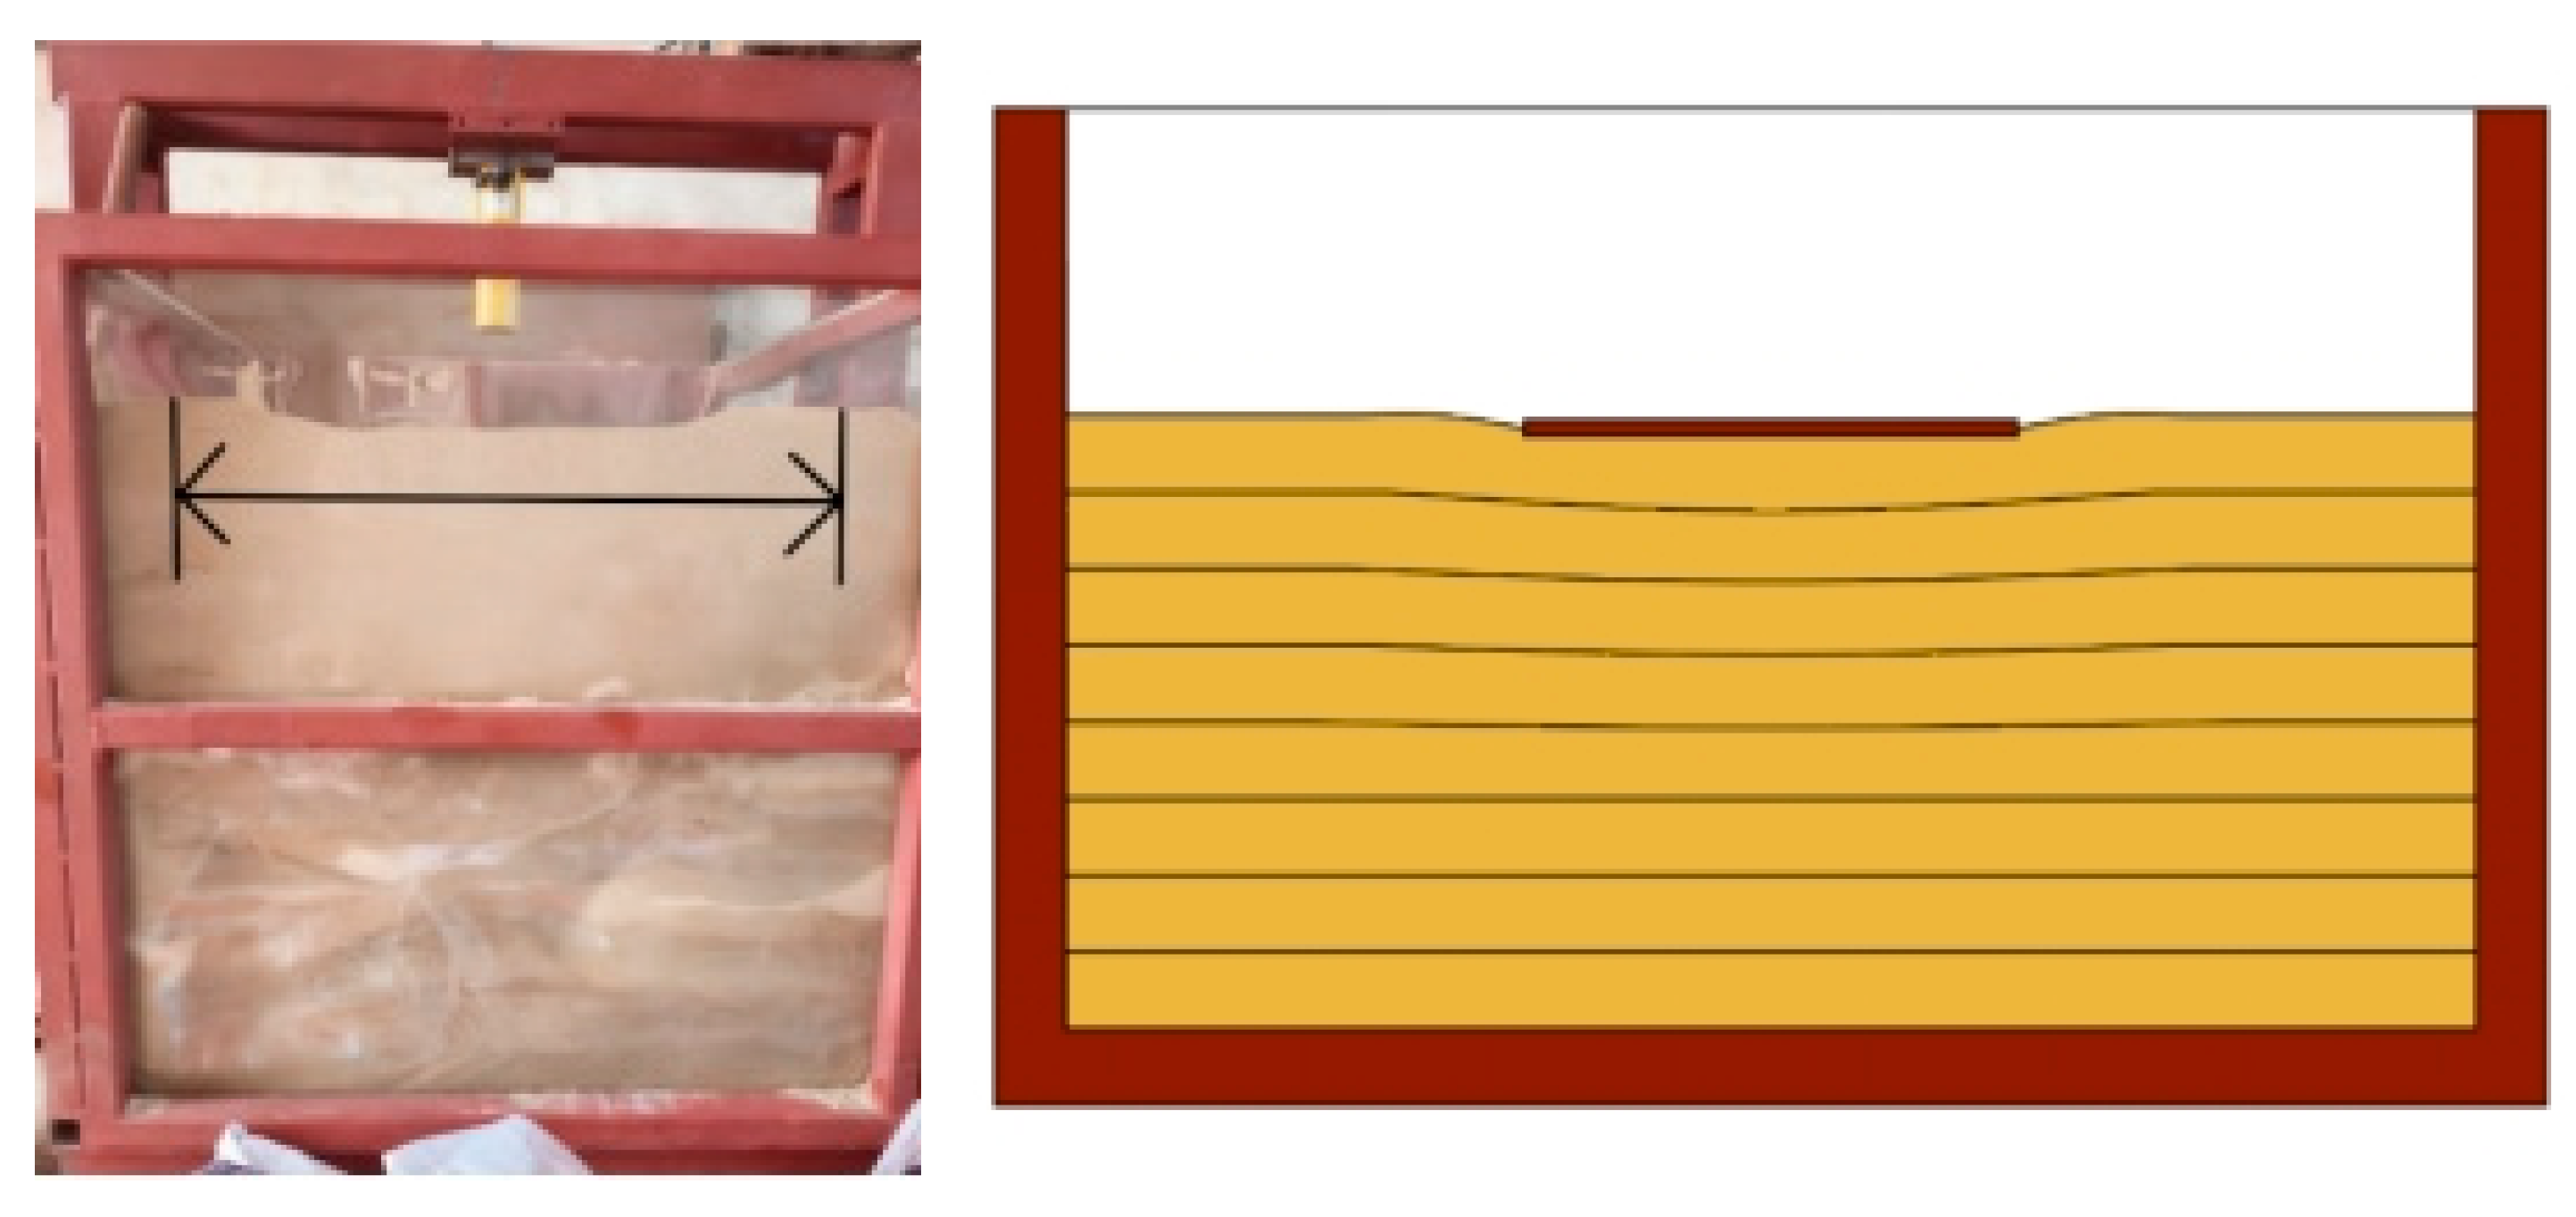
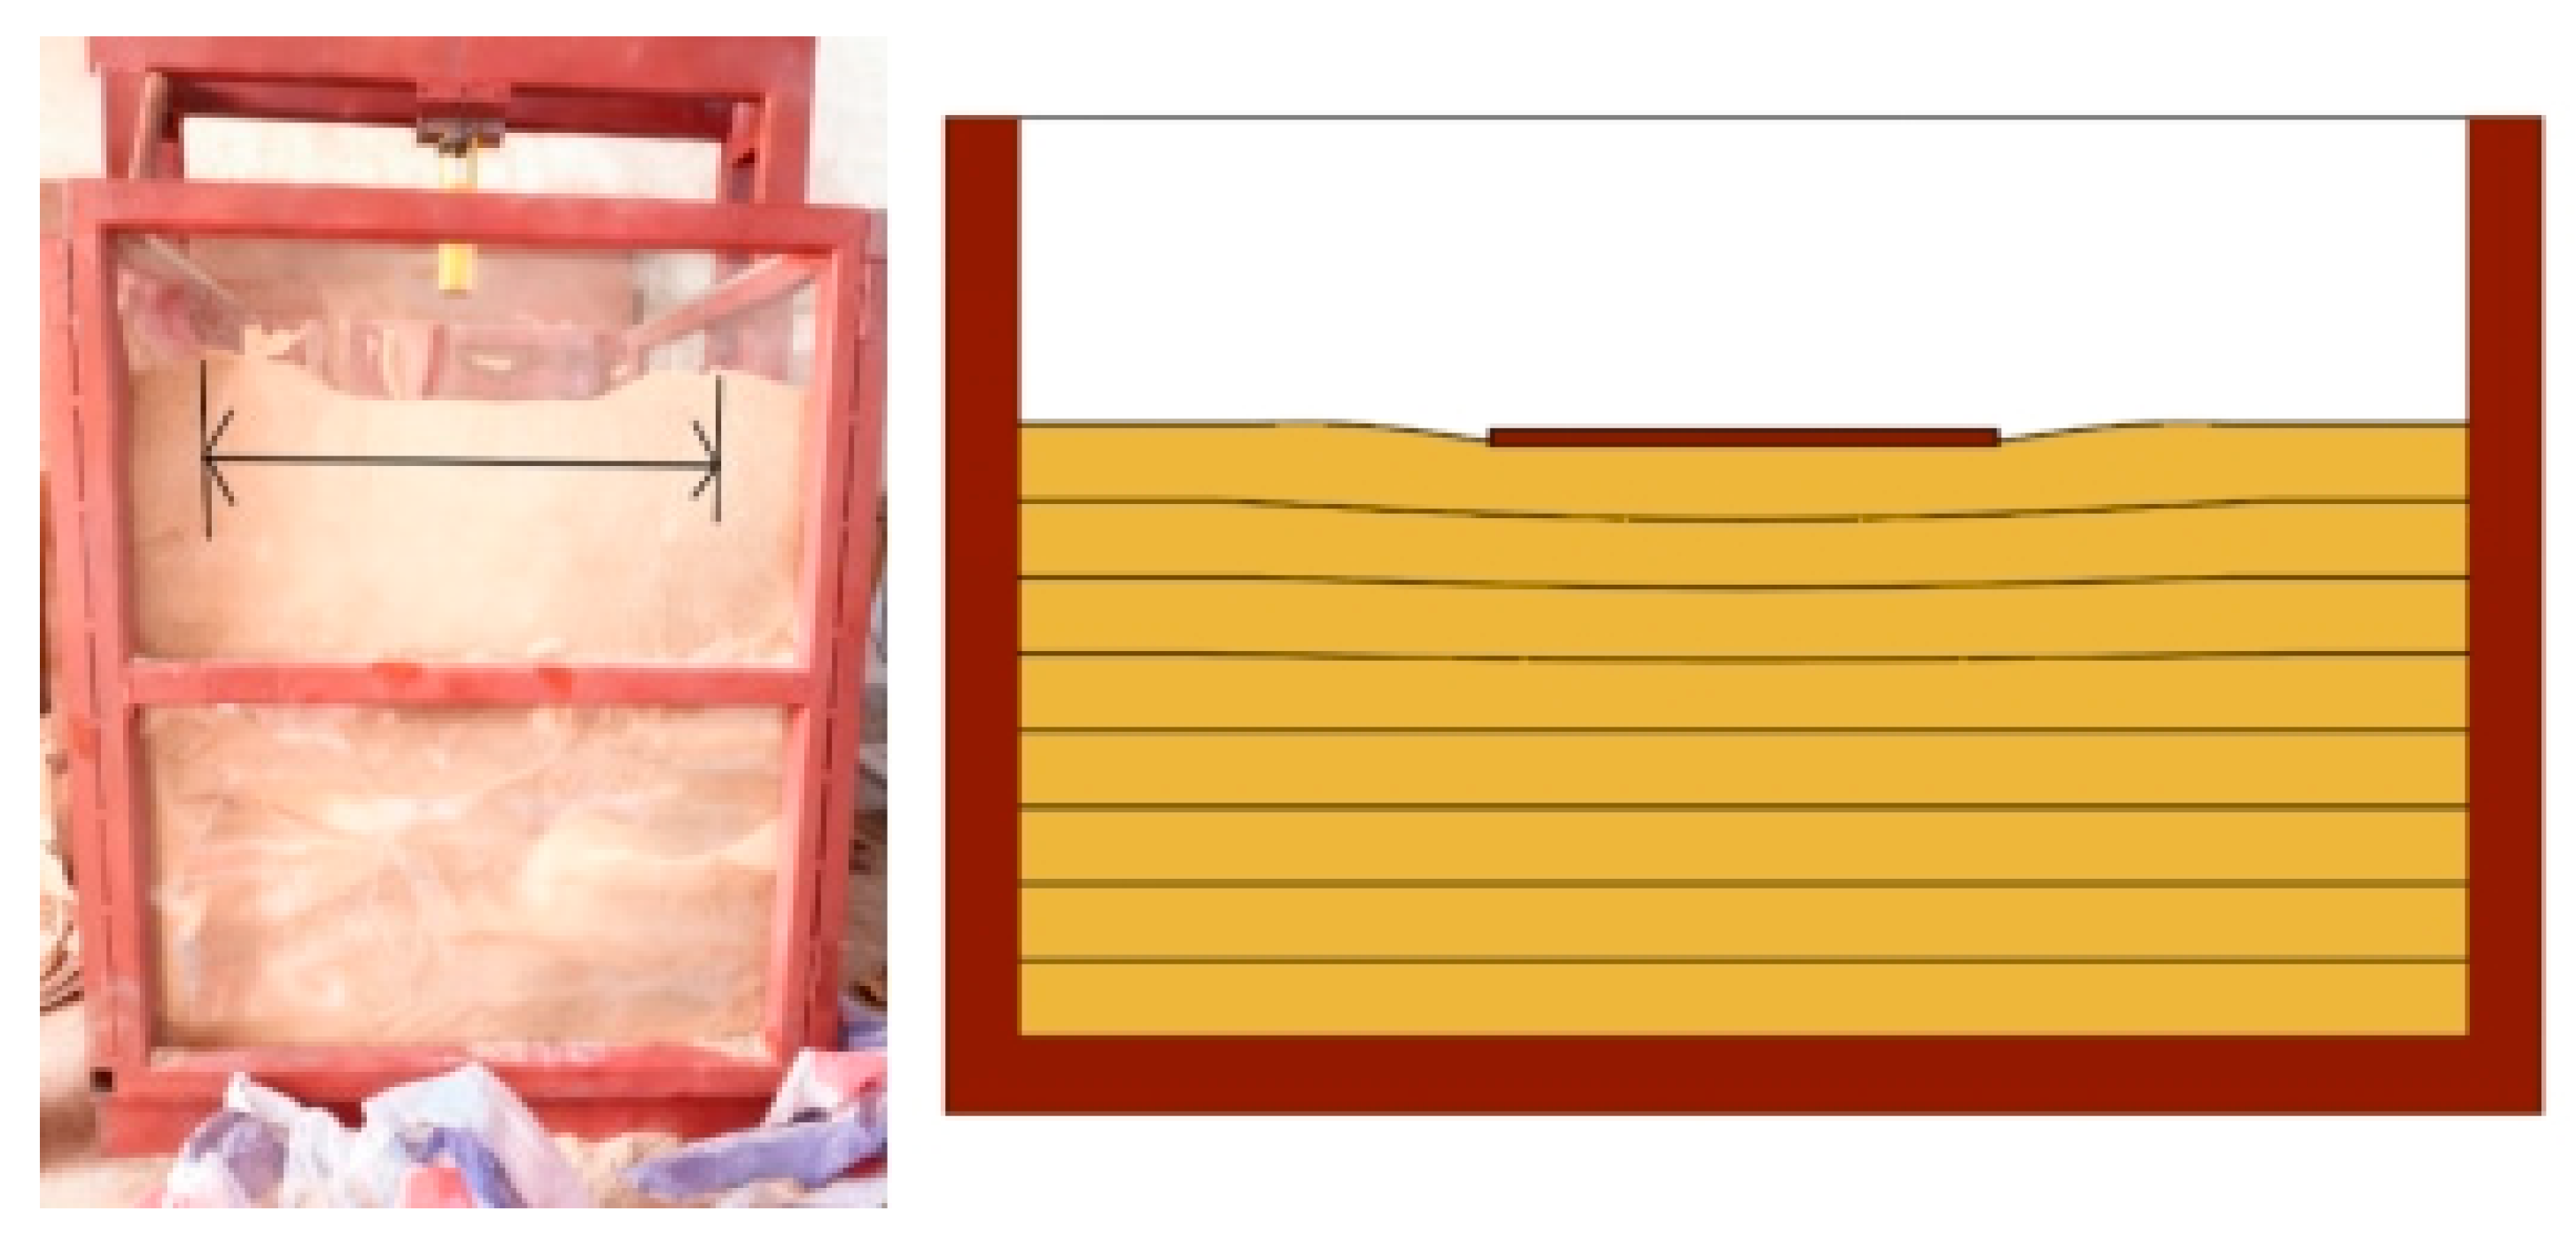
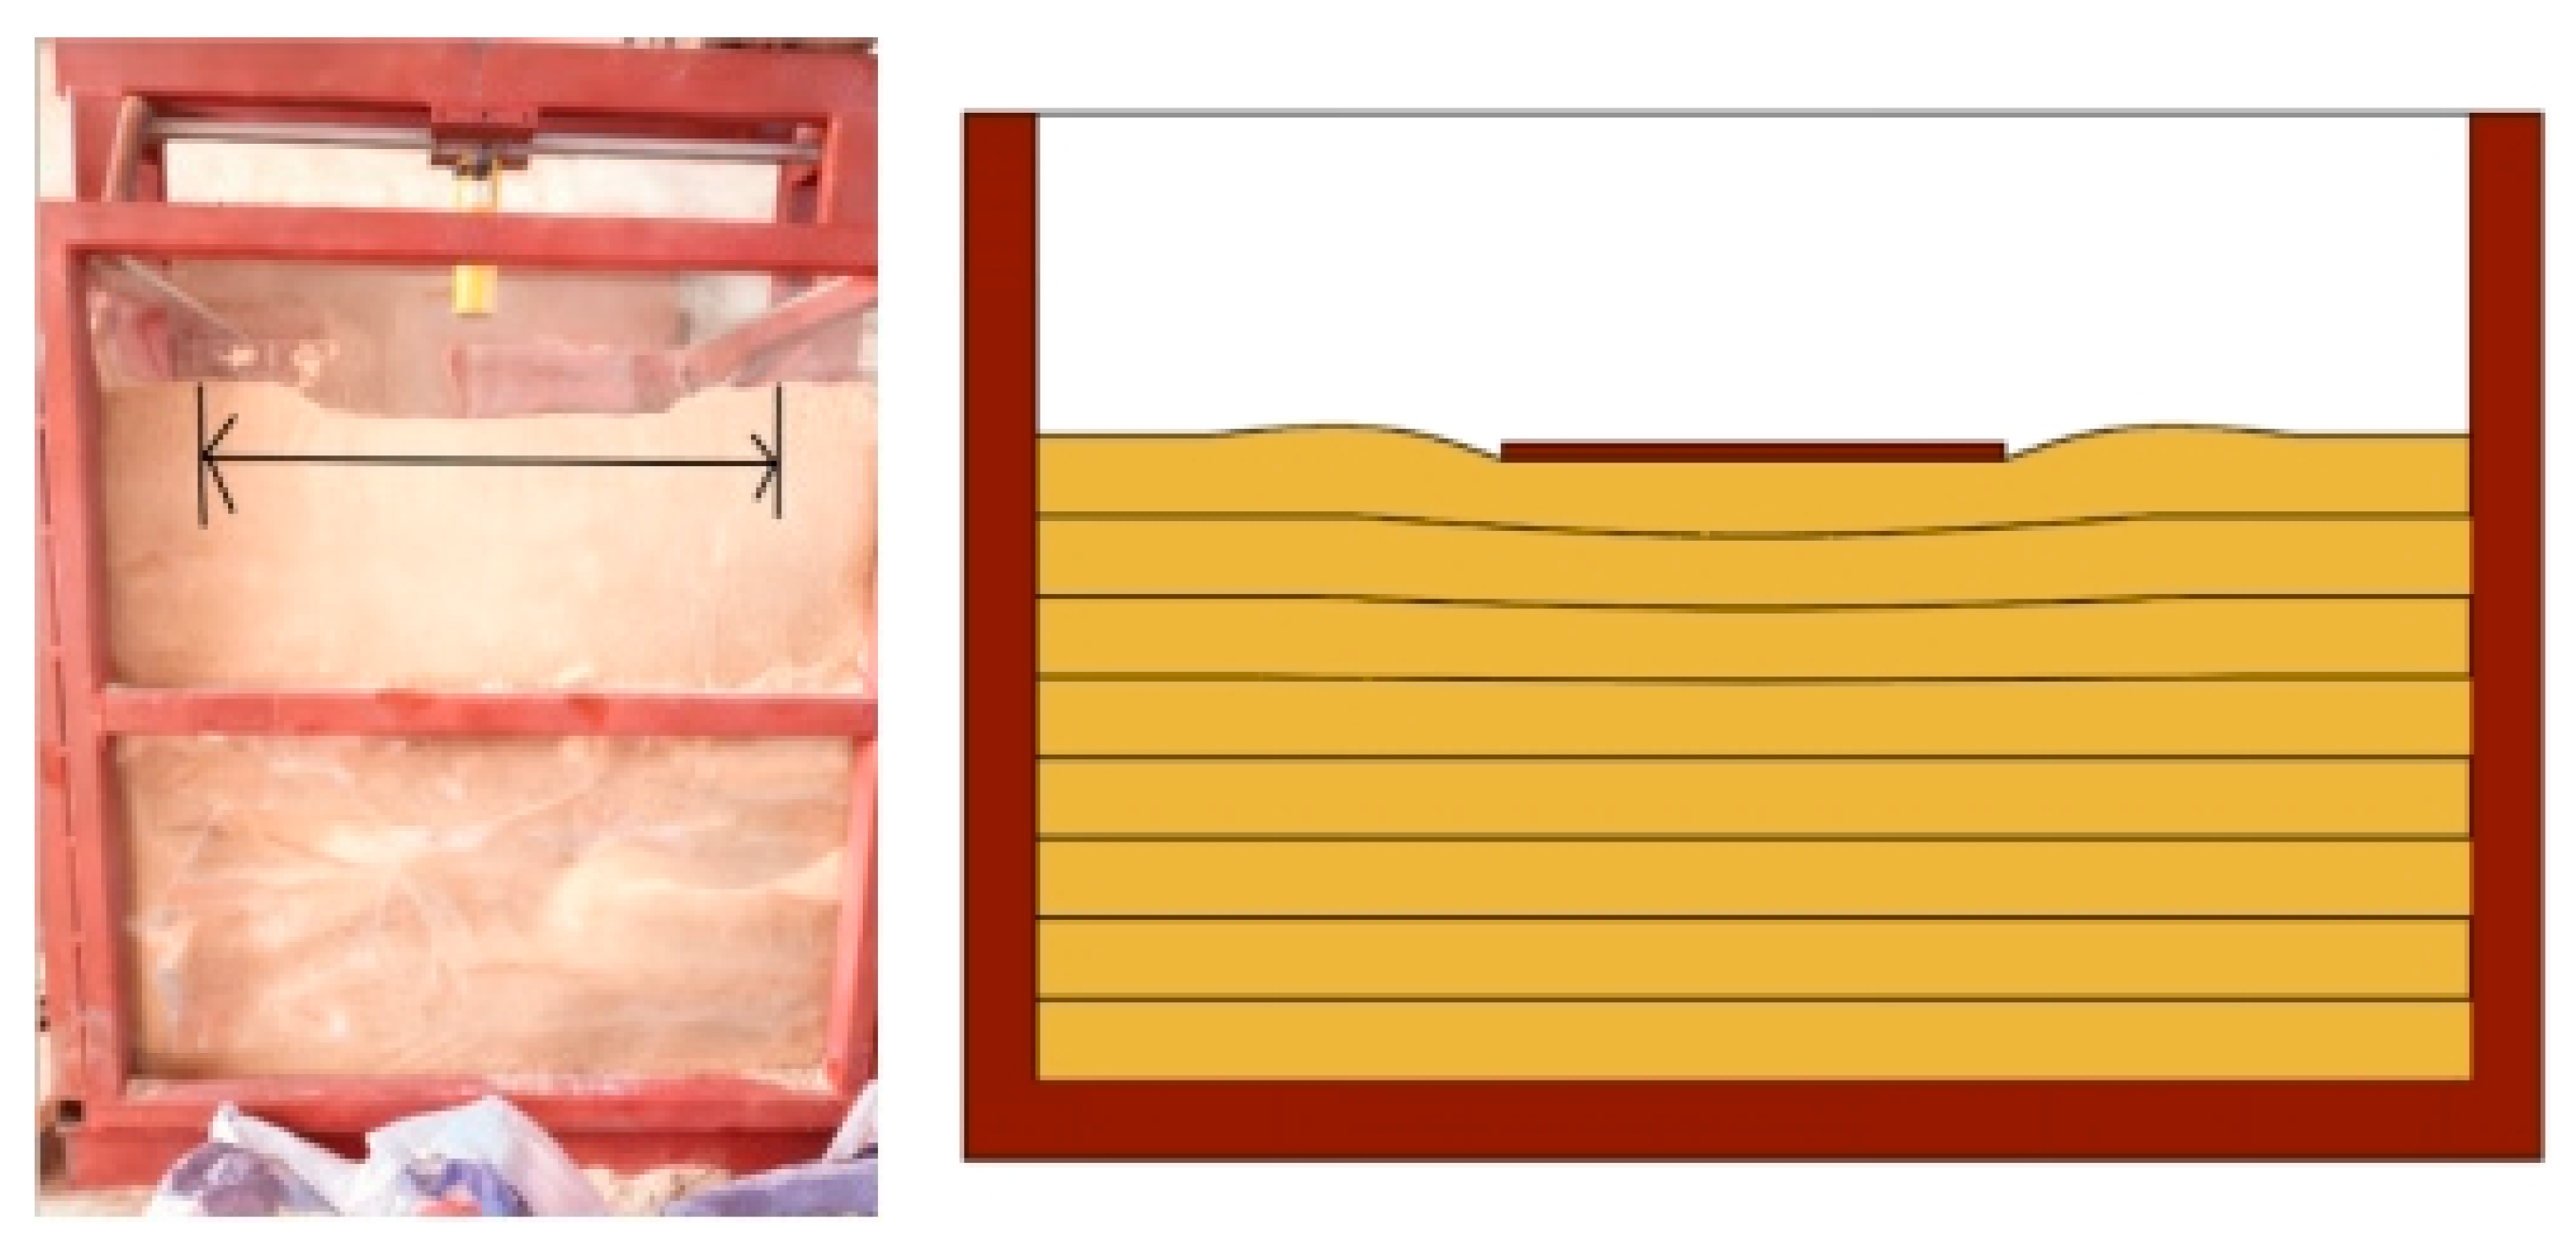
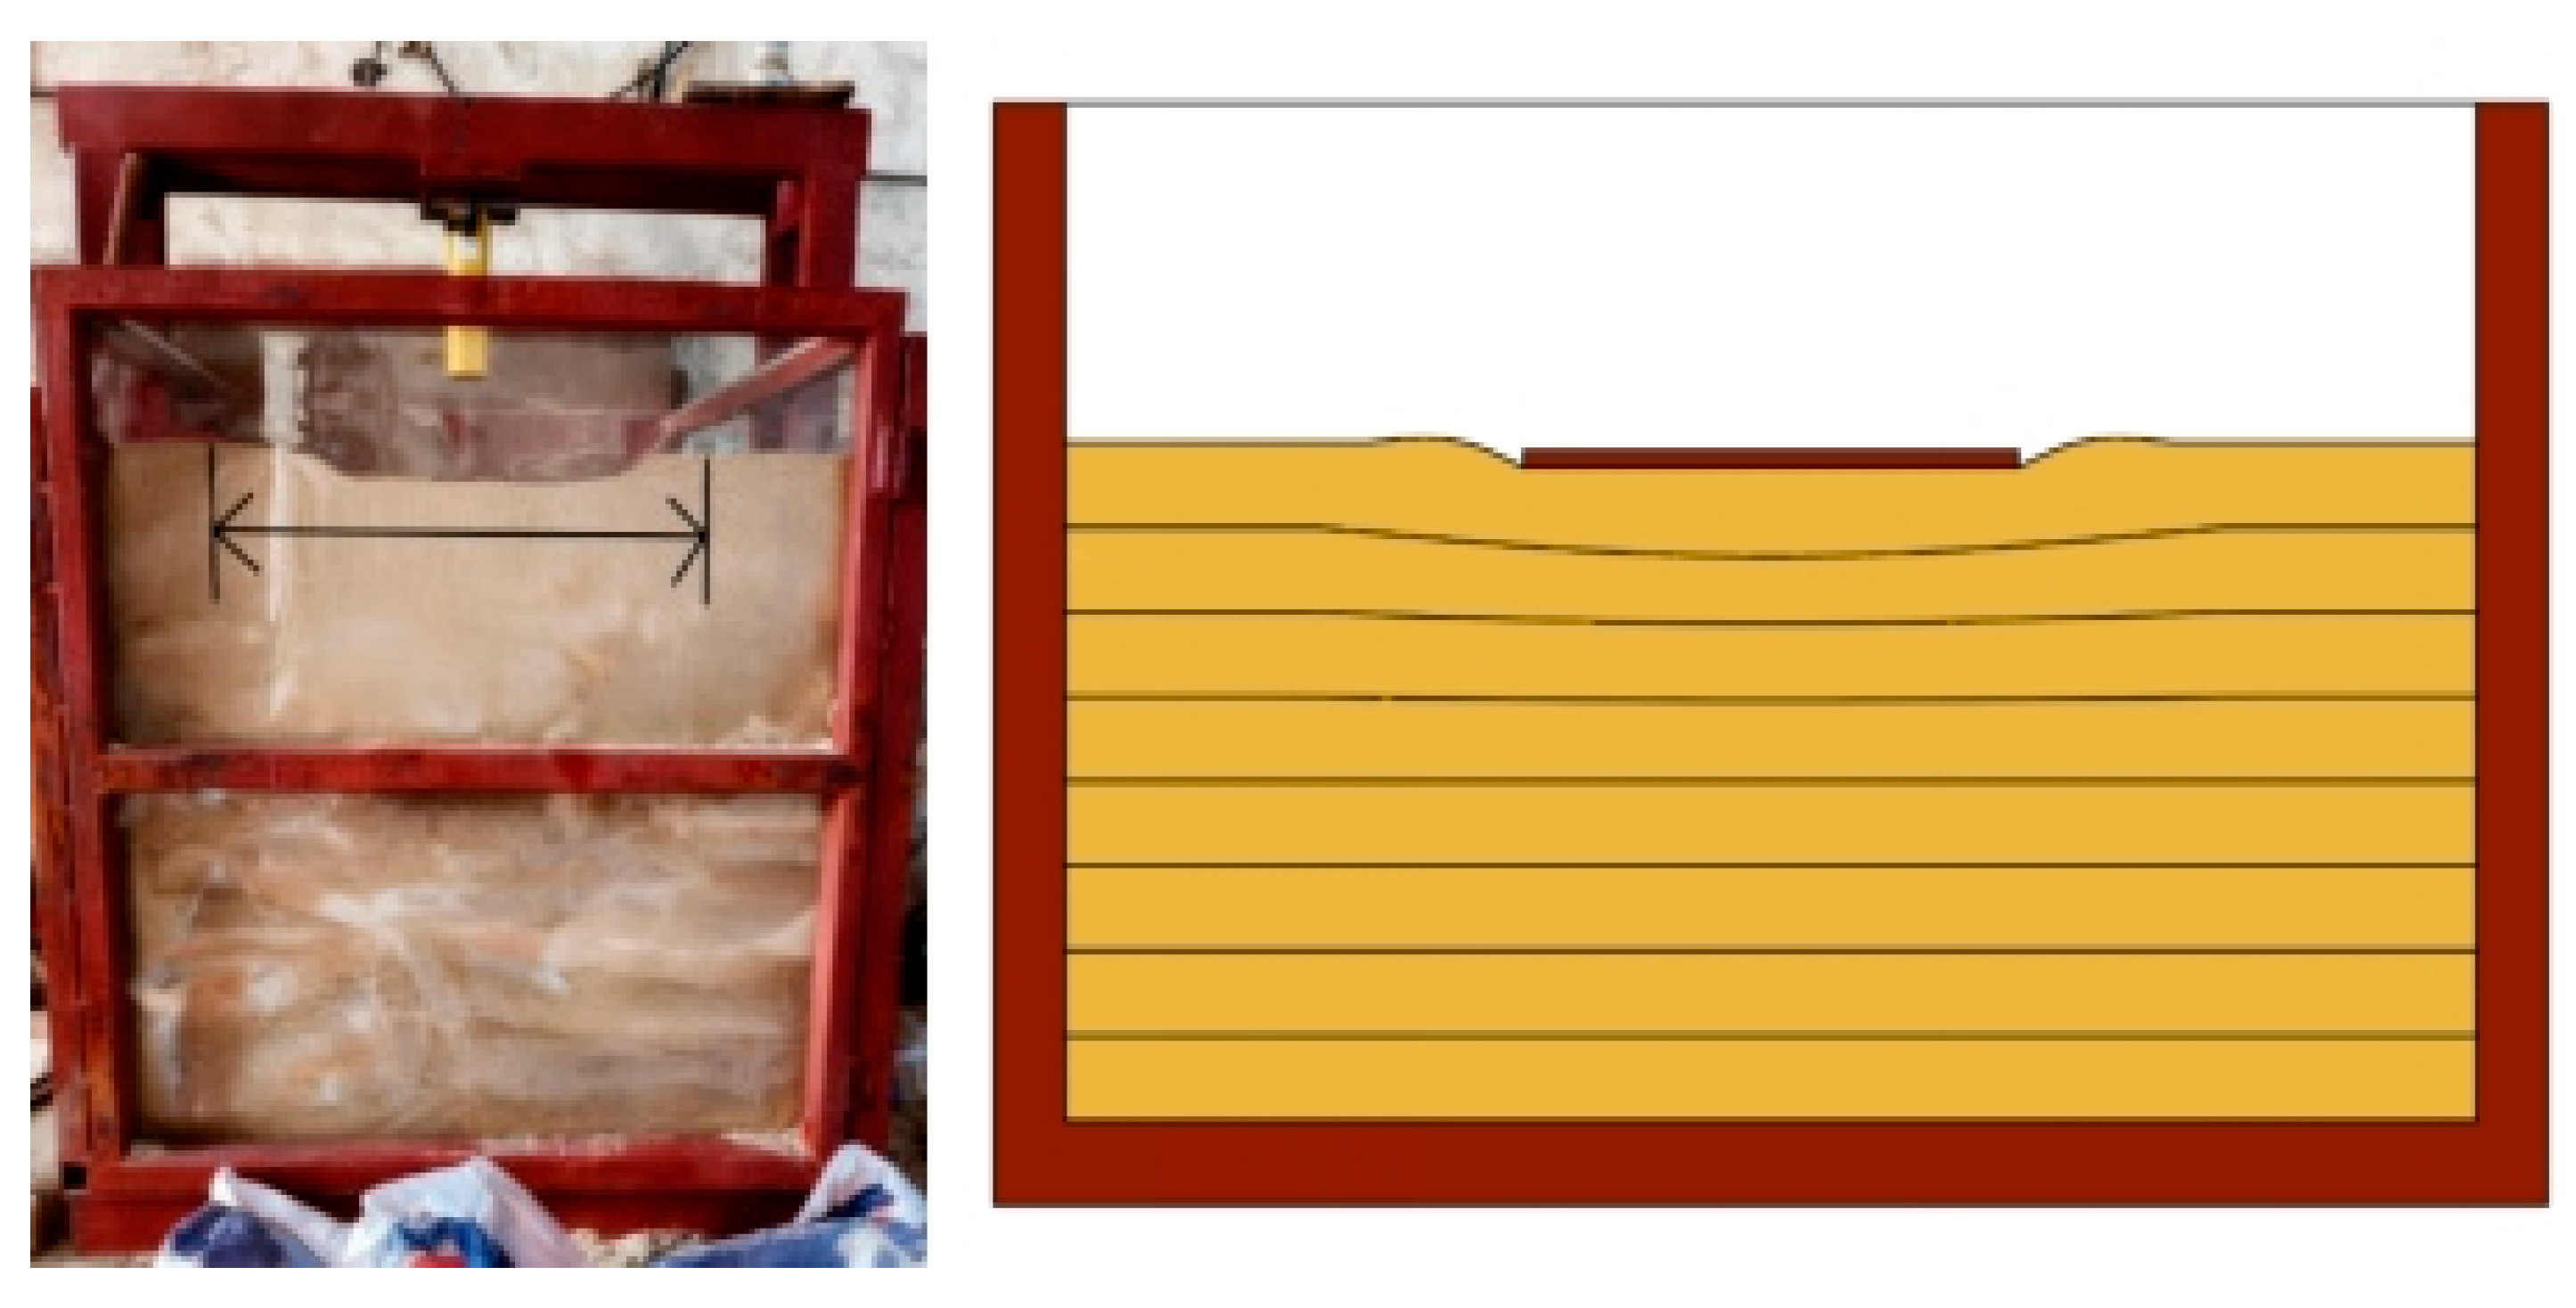
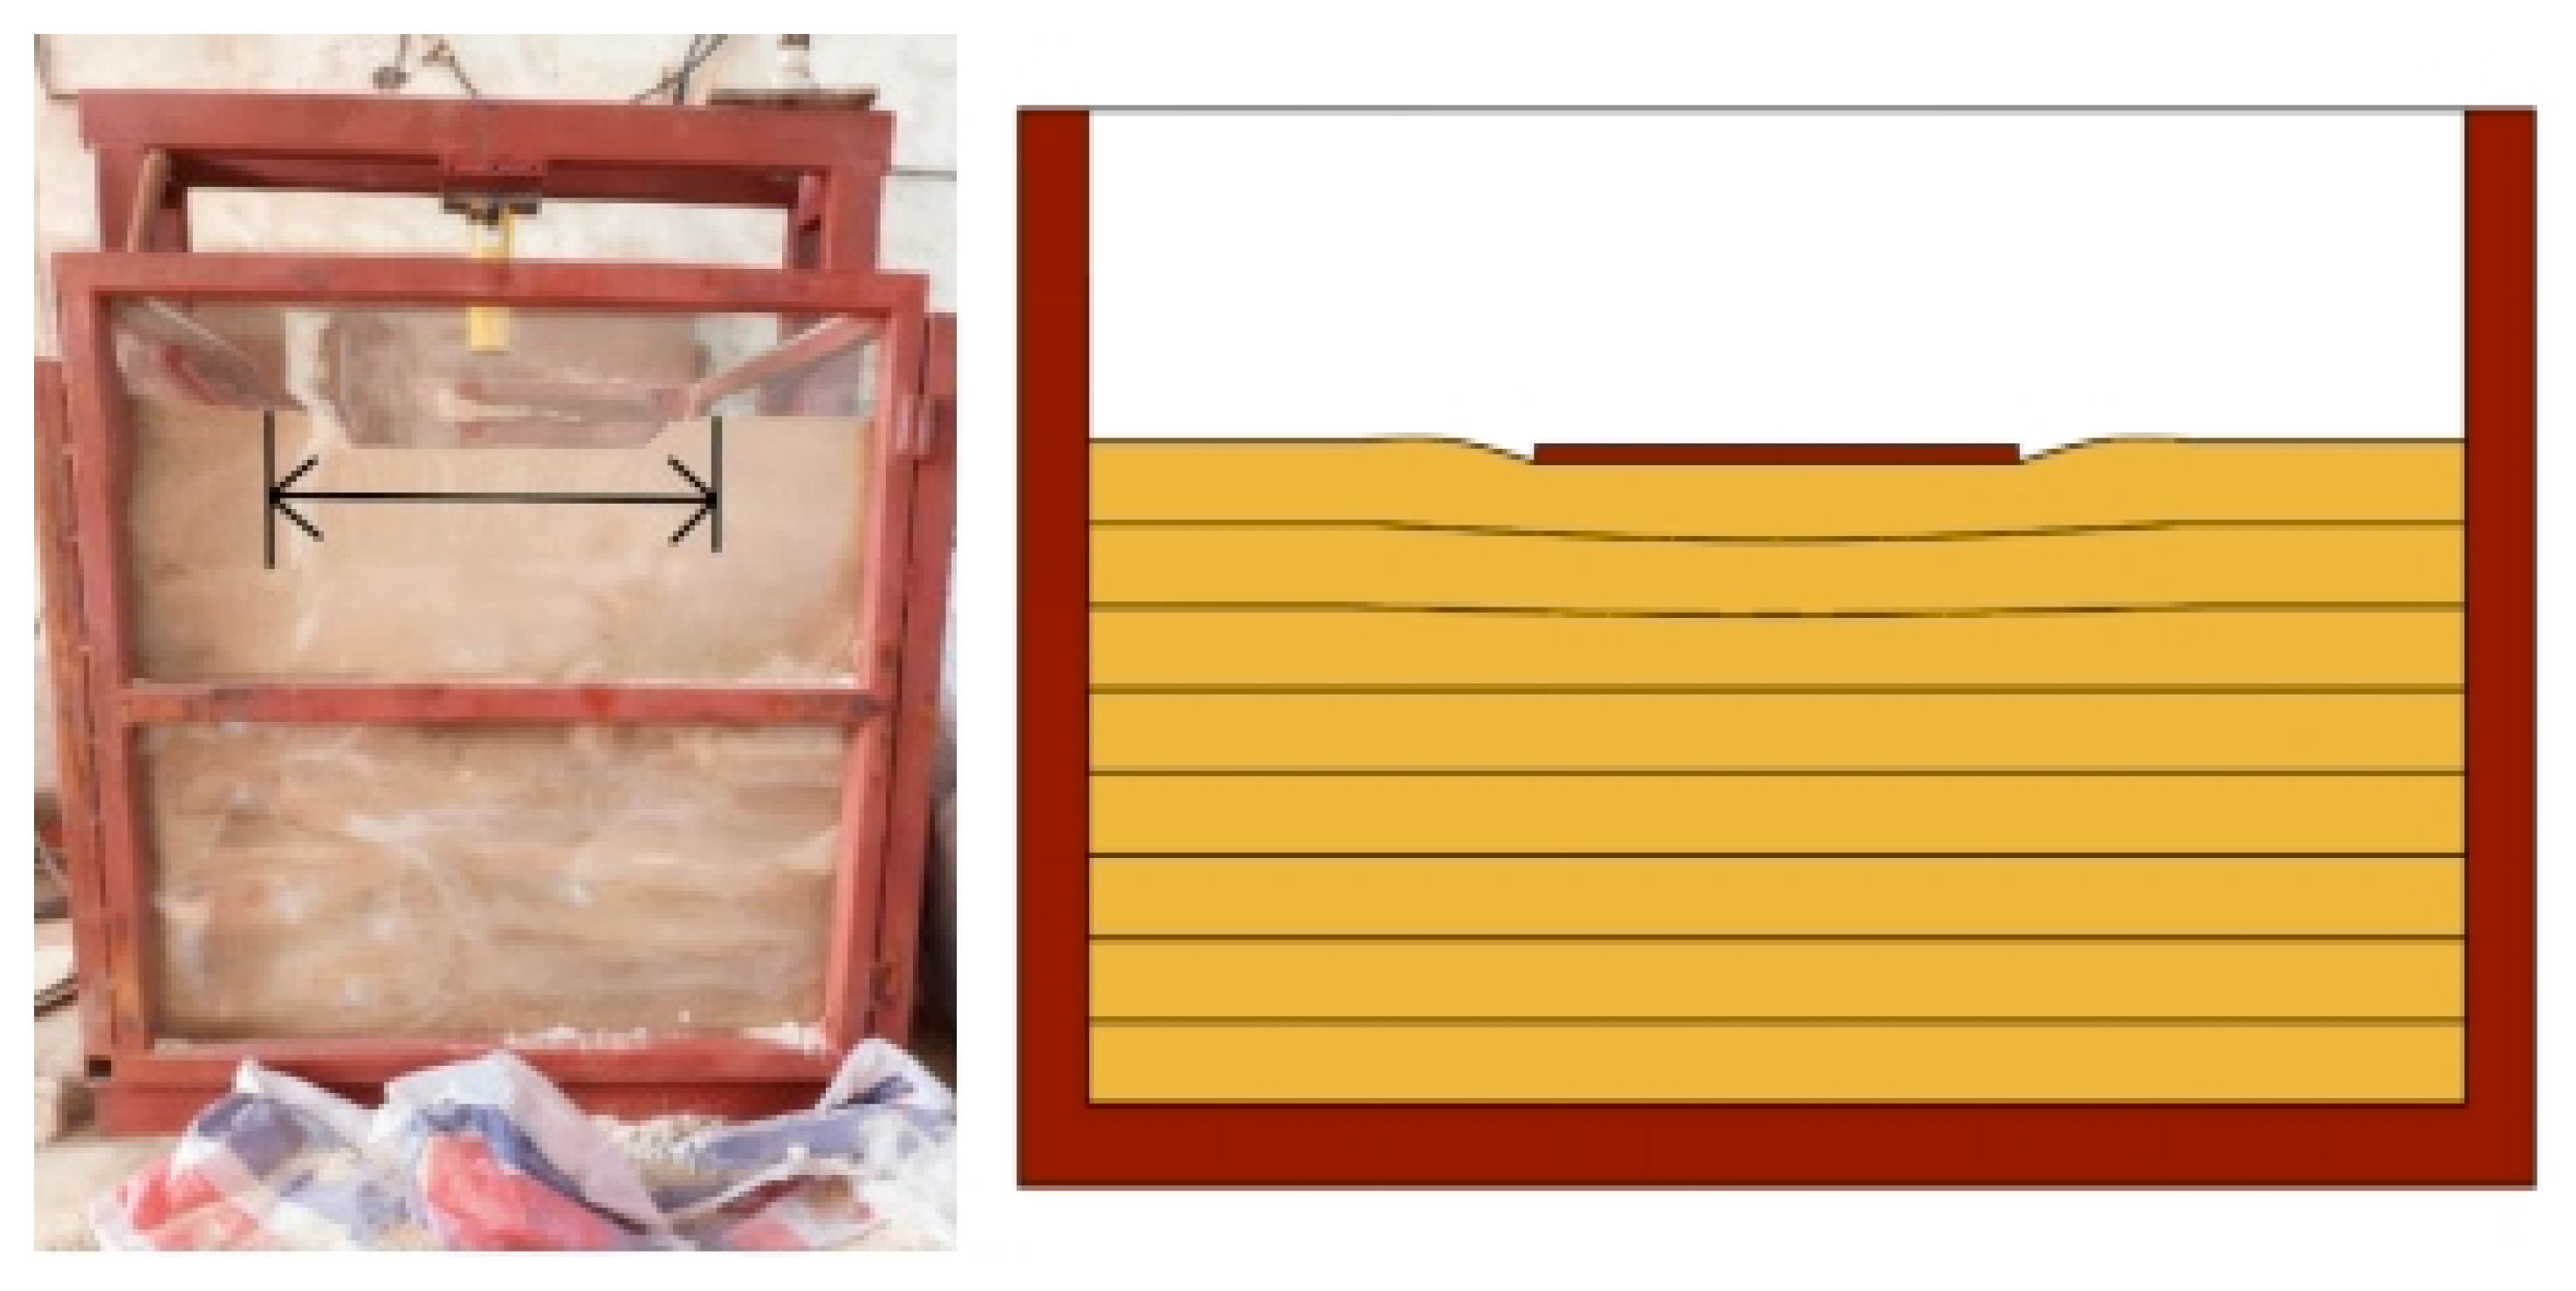
The deformation images from the 13 test groups further show that the failure mode was affected by particle size distribution, moisture content, and relative density. Improved gradation reduced the settlement and limited the lateral extent of the failure zone. A suitable moisture content enhanced the deformation resistance of the sand, whereas excessive moisture content led to larger settlement and more extensive surface heave. Increasing relative density resulted in a denser soil structure, a larger failure angle, and a smaller failure zone extent. Representative foundation deformation patterns for Tests 1–13 are shown in
Figure 10,
Figure 11,
Figure 12,
Figure 13,
Figure 14,
Figure 15,
Figure 16,
Figure 17,
Figure 18,
Figure 19,
Figure 20,
Figure 21 and
Figure 22. The variations in failure angle and failure zone extent are summarized in
Figure 23 and
Figure 24, respectively.
Through systematic comparative analysis of the subgrade deformation diagrams obtained from 13 groups of tests, significant differences in subgrade deformation and failure modes were observed under varying density, particle size distribution, and moisture content conditions, characterized as follows:
- (1)
In the particle size distribution effect group (Tests 1 to 3), as gradation improved from “poor” to “good”, the rate of settlement development slowed markedly. At a 300 kPa load, settlement decreased from 28.3 mm (Test 1) to 14.5 mm (Test 3), a reduction of 48.8%. The failure angle increased slightly from 63.3° to 64.7° (2.2% increase), the failure range decreased from 1.40 m to 1.25 m (10.7% reduction), and the failure mode transitioned from typical general shear failure with pronounced heave of the surrounding soil at lower loads to a more localized shear failure with less pronounced heave at higher failure loads.
- (2)
In the moisture content effect group (Tests 4 to 8), as the moisture content increased from 4% to 12%, the sand’s mechanical properties changed significantly. The deformation modulus (stiffness indicator) first increased from 15.71 MPa (Test 4) to 22.57 MPa (Test 6), a 43.6% increase, then decreased to 12.01 MPa (Test 8), a 46.7% decrease. The failure angle initially increased steadily from 64.1° (Test 4) to 64.9° (Test 6), a 1.24% rise, then decreased to 63.9° (Test 8), a 1.54% drop. Further, the failure range first decreased from 1.40 m to 1.25 m, then increased back to 1.40 m, while the heave range at failure first decreased and then increased, evolving from localized slight heave to widespread large-scale heave.
- (3)
In the density effect group (Tests 9 to 13), as relative density increased from 40% to 65%, settlement control improved significantly. At 300 kPa load, settlement decreased from 20.5 mm (Test 9) to 11.7 mm (Test 13), decreasing by 43.0%. The failure angle increased from 63.3° to 65.5°, increasing by 3.5%, while the failure range decreased from 1.40 m to 1.05 m, a 25.0% reduction. Soil engineering characteristics transitioned from a soft state with larger settlements, earlier failure, and high compressibility to a dense state with good settlement control, higher failure load, and a more gradual failure mode. The characteristic bearing capacity value increased from 150 kPa to 225 kPa, a 50% increase.
5.3. Analysis of Key Bearing Capacity Parameters
- (1)
Proportional Limit Load (
p0):
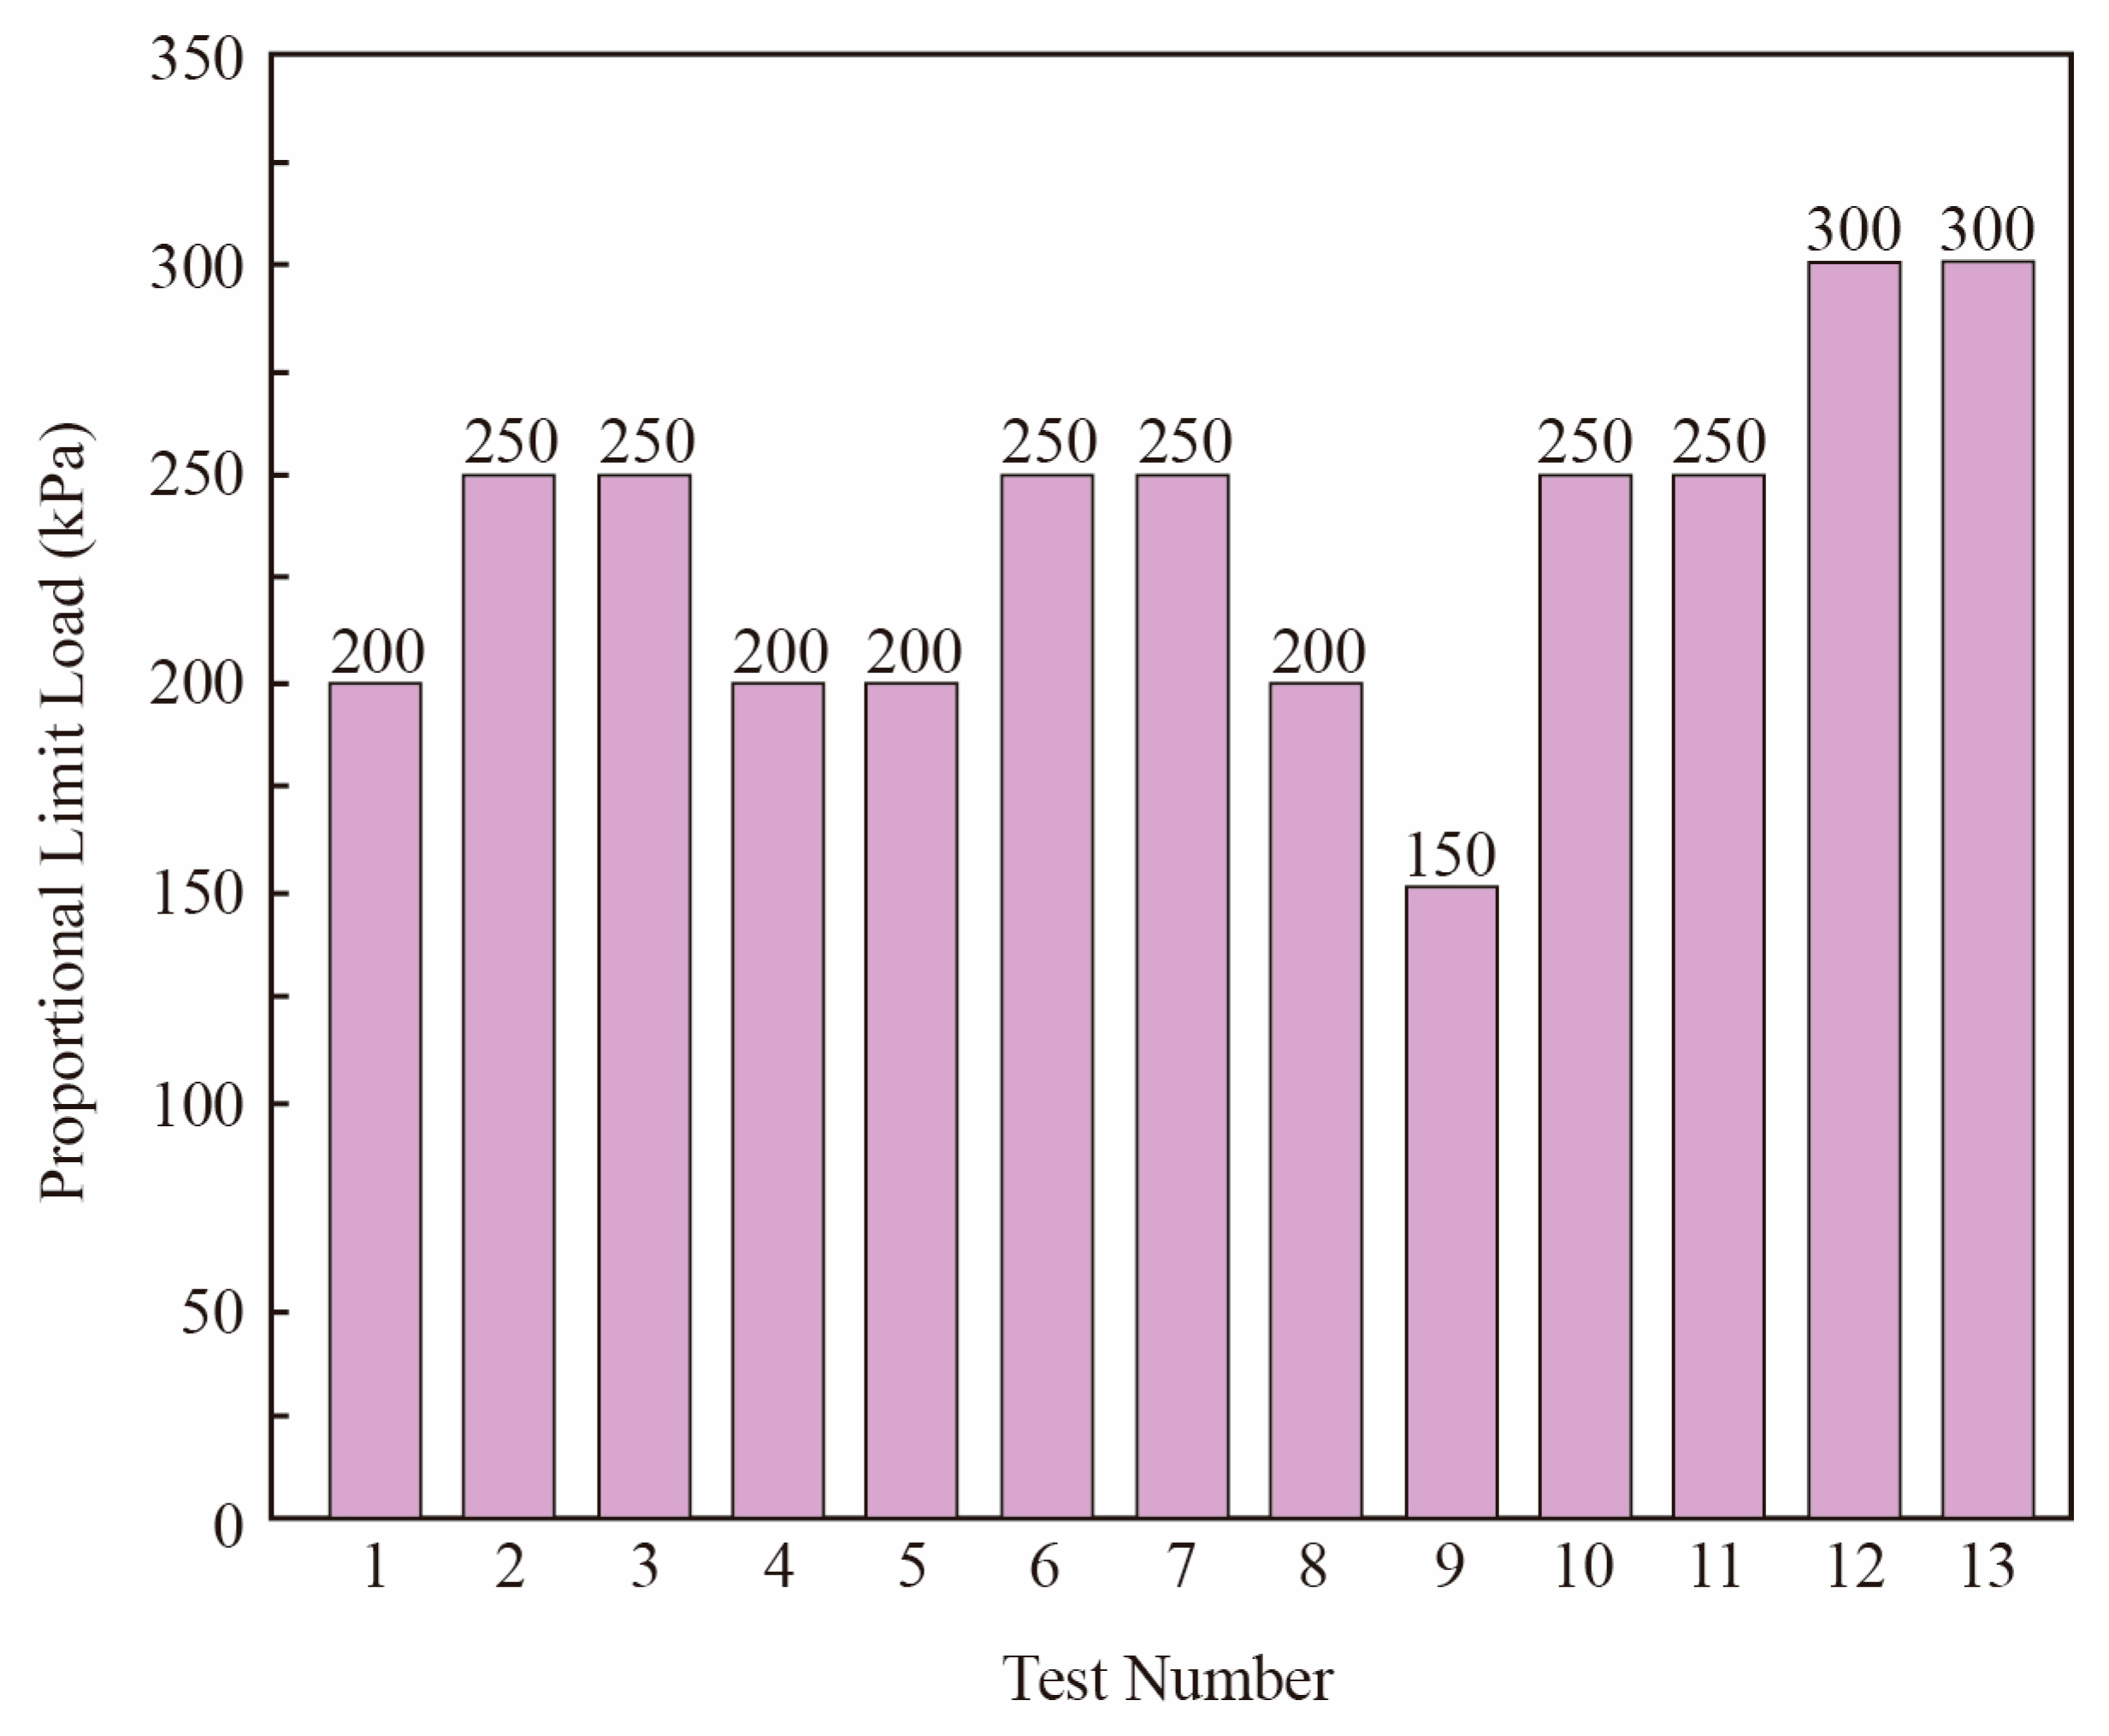
Figure 25 shows the proportional limit load
p0 of coastal beach sand foundations under different test conditions. According to the Standard for Geotechnical Testing Method (GB/T 50123-2019) [
31], as particle size distribution optimizes from “poor” to “good”, the mechanical performance of the sand subgrade improves significantly, and
p0 increases from 200 kPa to 250 kPa, a 25% increase. As moisture content varies from 4% to 12%,
p0 first increases from 200 kPa to 250 kPa and then decreases back to 200 kPa. The mechanical performance of the sand subgrade is first enhanced and then weakened, peaking at a moisture content of around 7%. As relative density increases from 40% to 64%, the mechanical performance of the sand subgrade shows a monotonic improvement, with
p0 increasing from 150 kPa to 300 kPa, a 100% increase.
- (2)
Ultimate Load (
pᵤ):
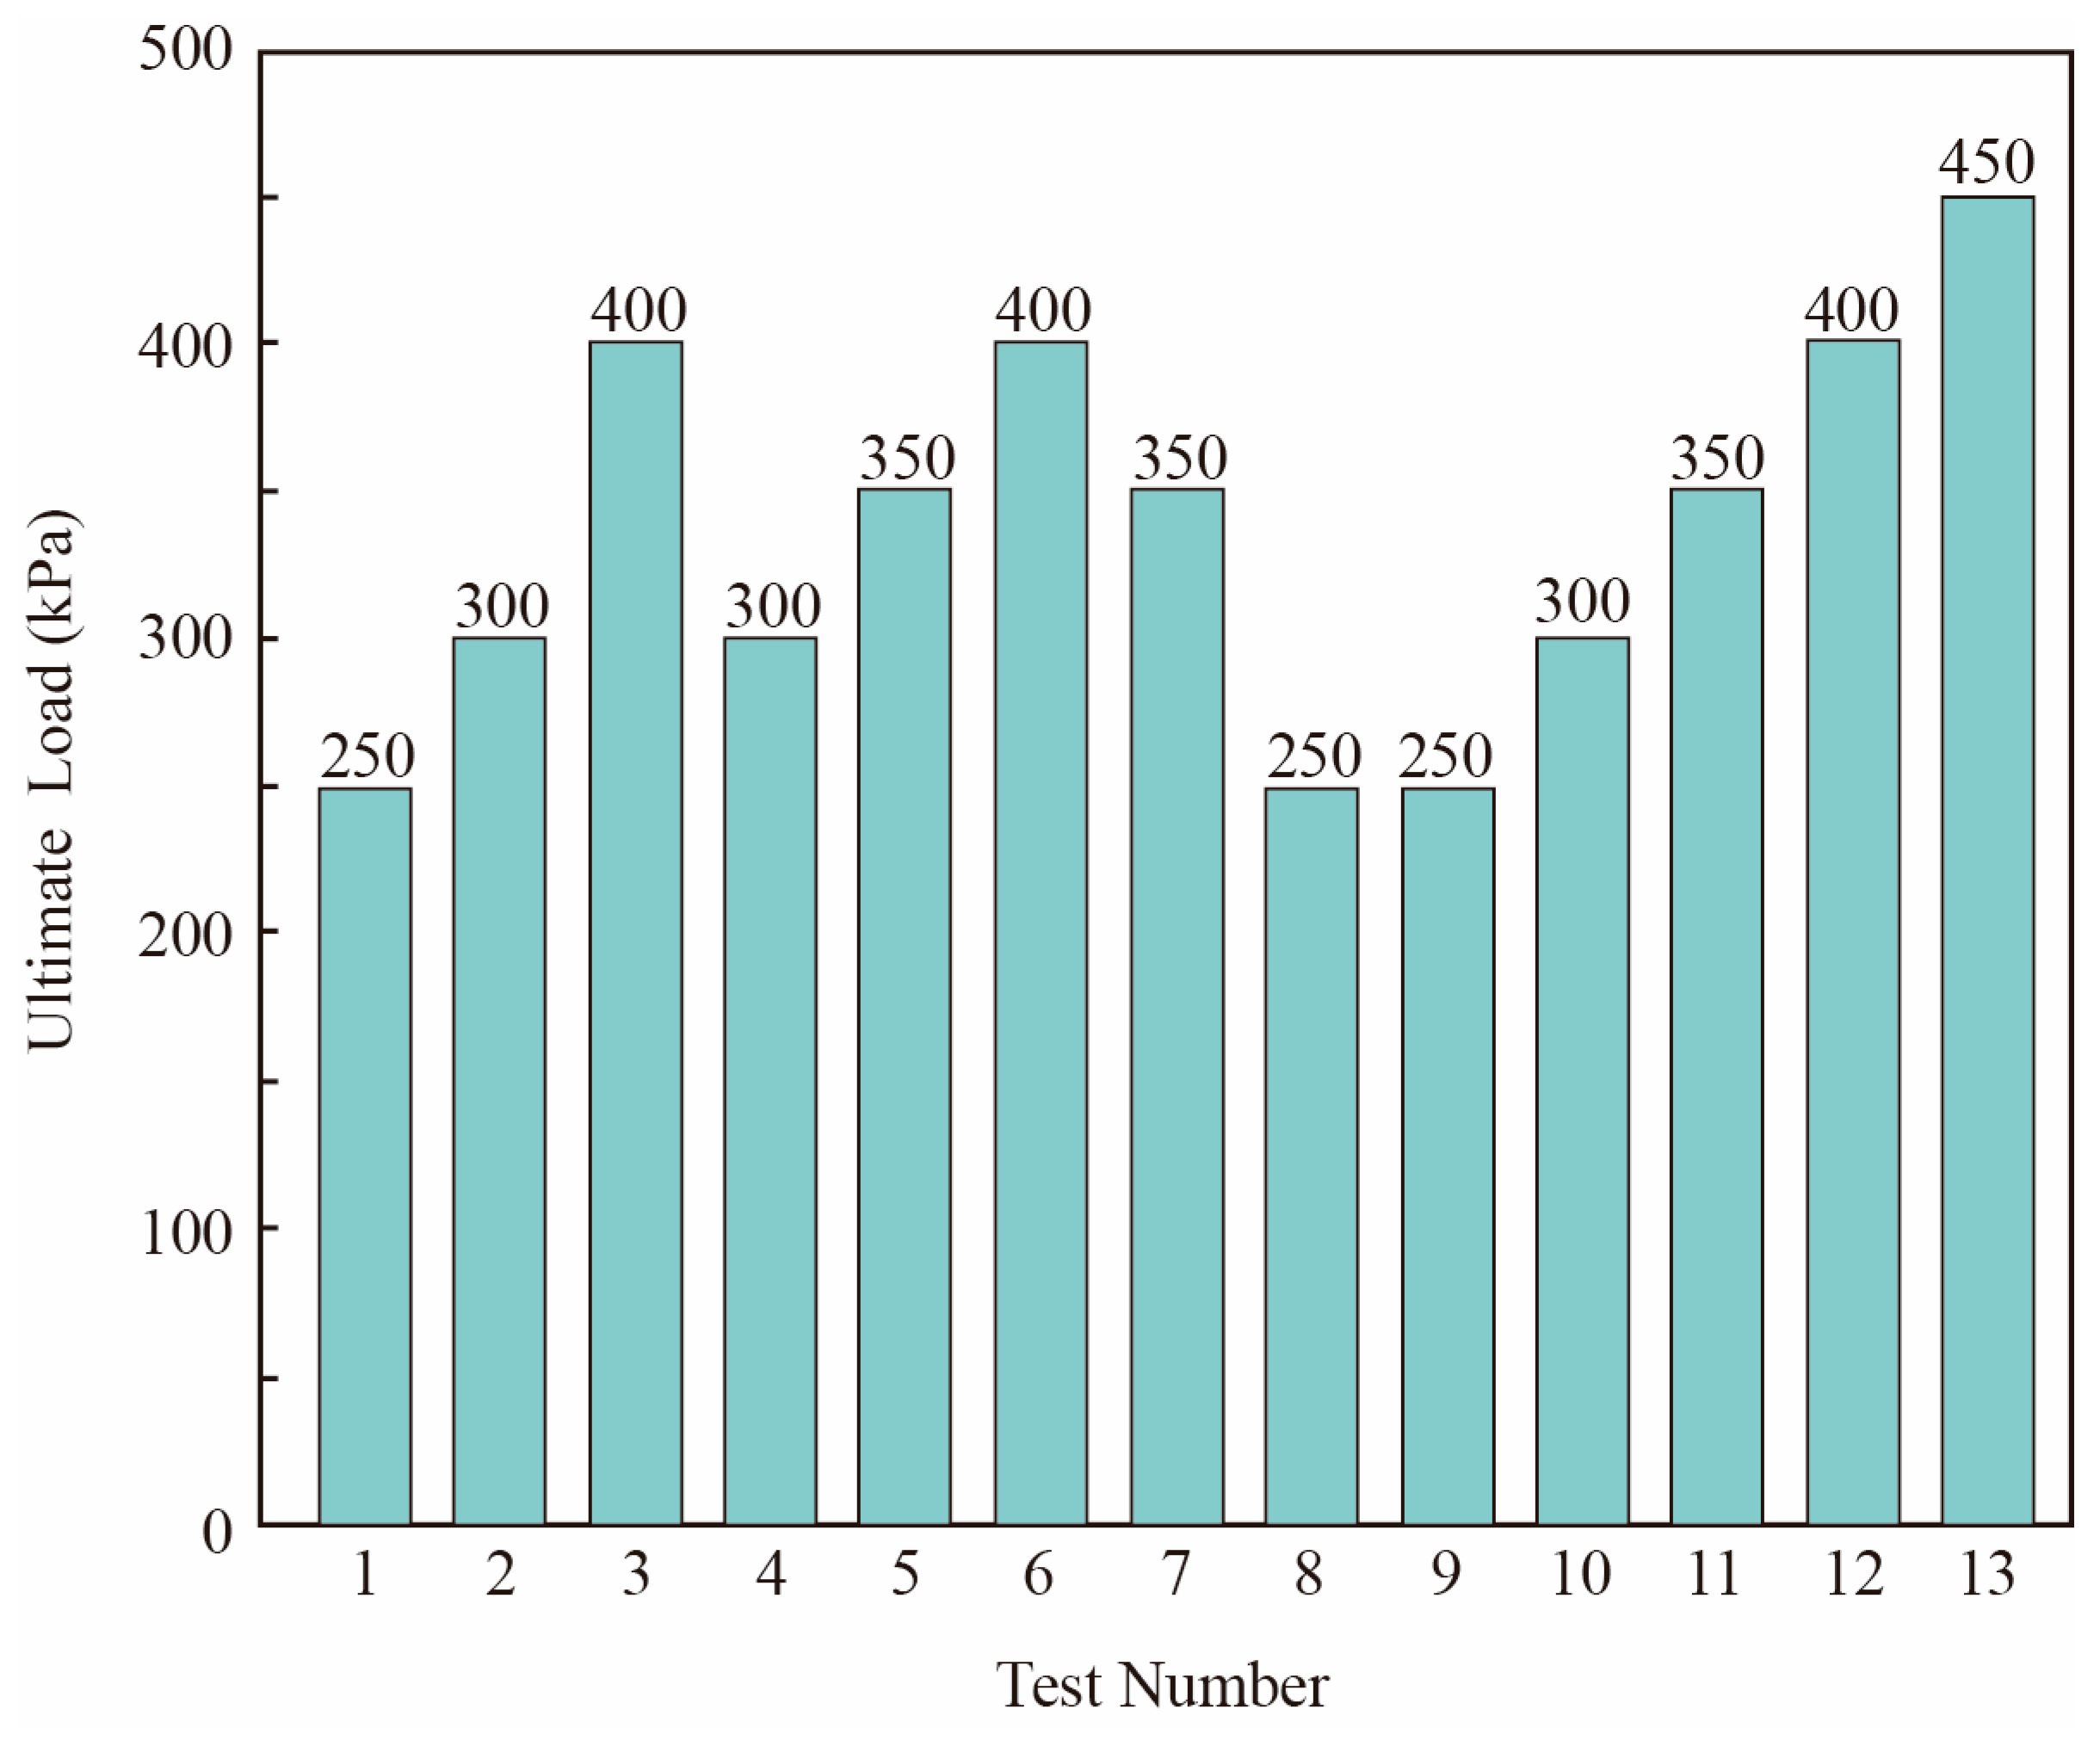
Figure 26 shows the ultimate load
pᵤ of coastal beach sand foundations under different test conditions. Based on the settlement curves, as particle size distribution optimizes from “poor” to “good”,
pᵤ increases from 250 kPa to 400 kPa, a 60% increase. When the load reaches 400 kPa, the settlement of well-graded sand is only 22.7 mm, 23.8% lower than that of fairly graded sand (29.8 mm). As moisture content varies from 4% to 12%,
pᵤ first increases from 300 kPa to 400 kPa and then decreases to 250 kPa, indicating a peaking effect at around 7% moisture content. As relative density increases from 40% to 64%,
pᵤ shows a monotonic increase from 250 kPa to 450 kPa, an 80% increase.
- (3)
Characteristic Bearing Capacity Value (
fₐ):
Figure 27 shows the characteristic bearing capacity value
fₐ under different test conditions. As particle size distribution improves from “poor” to “good”,
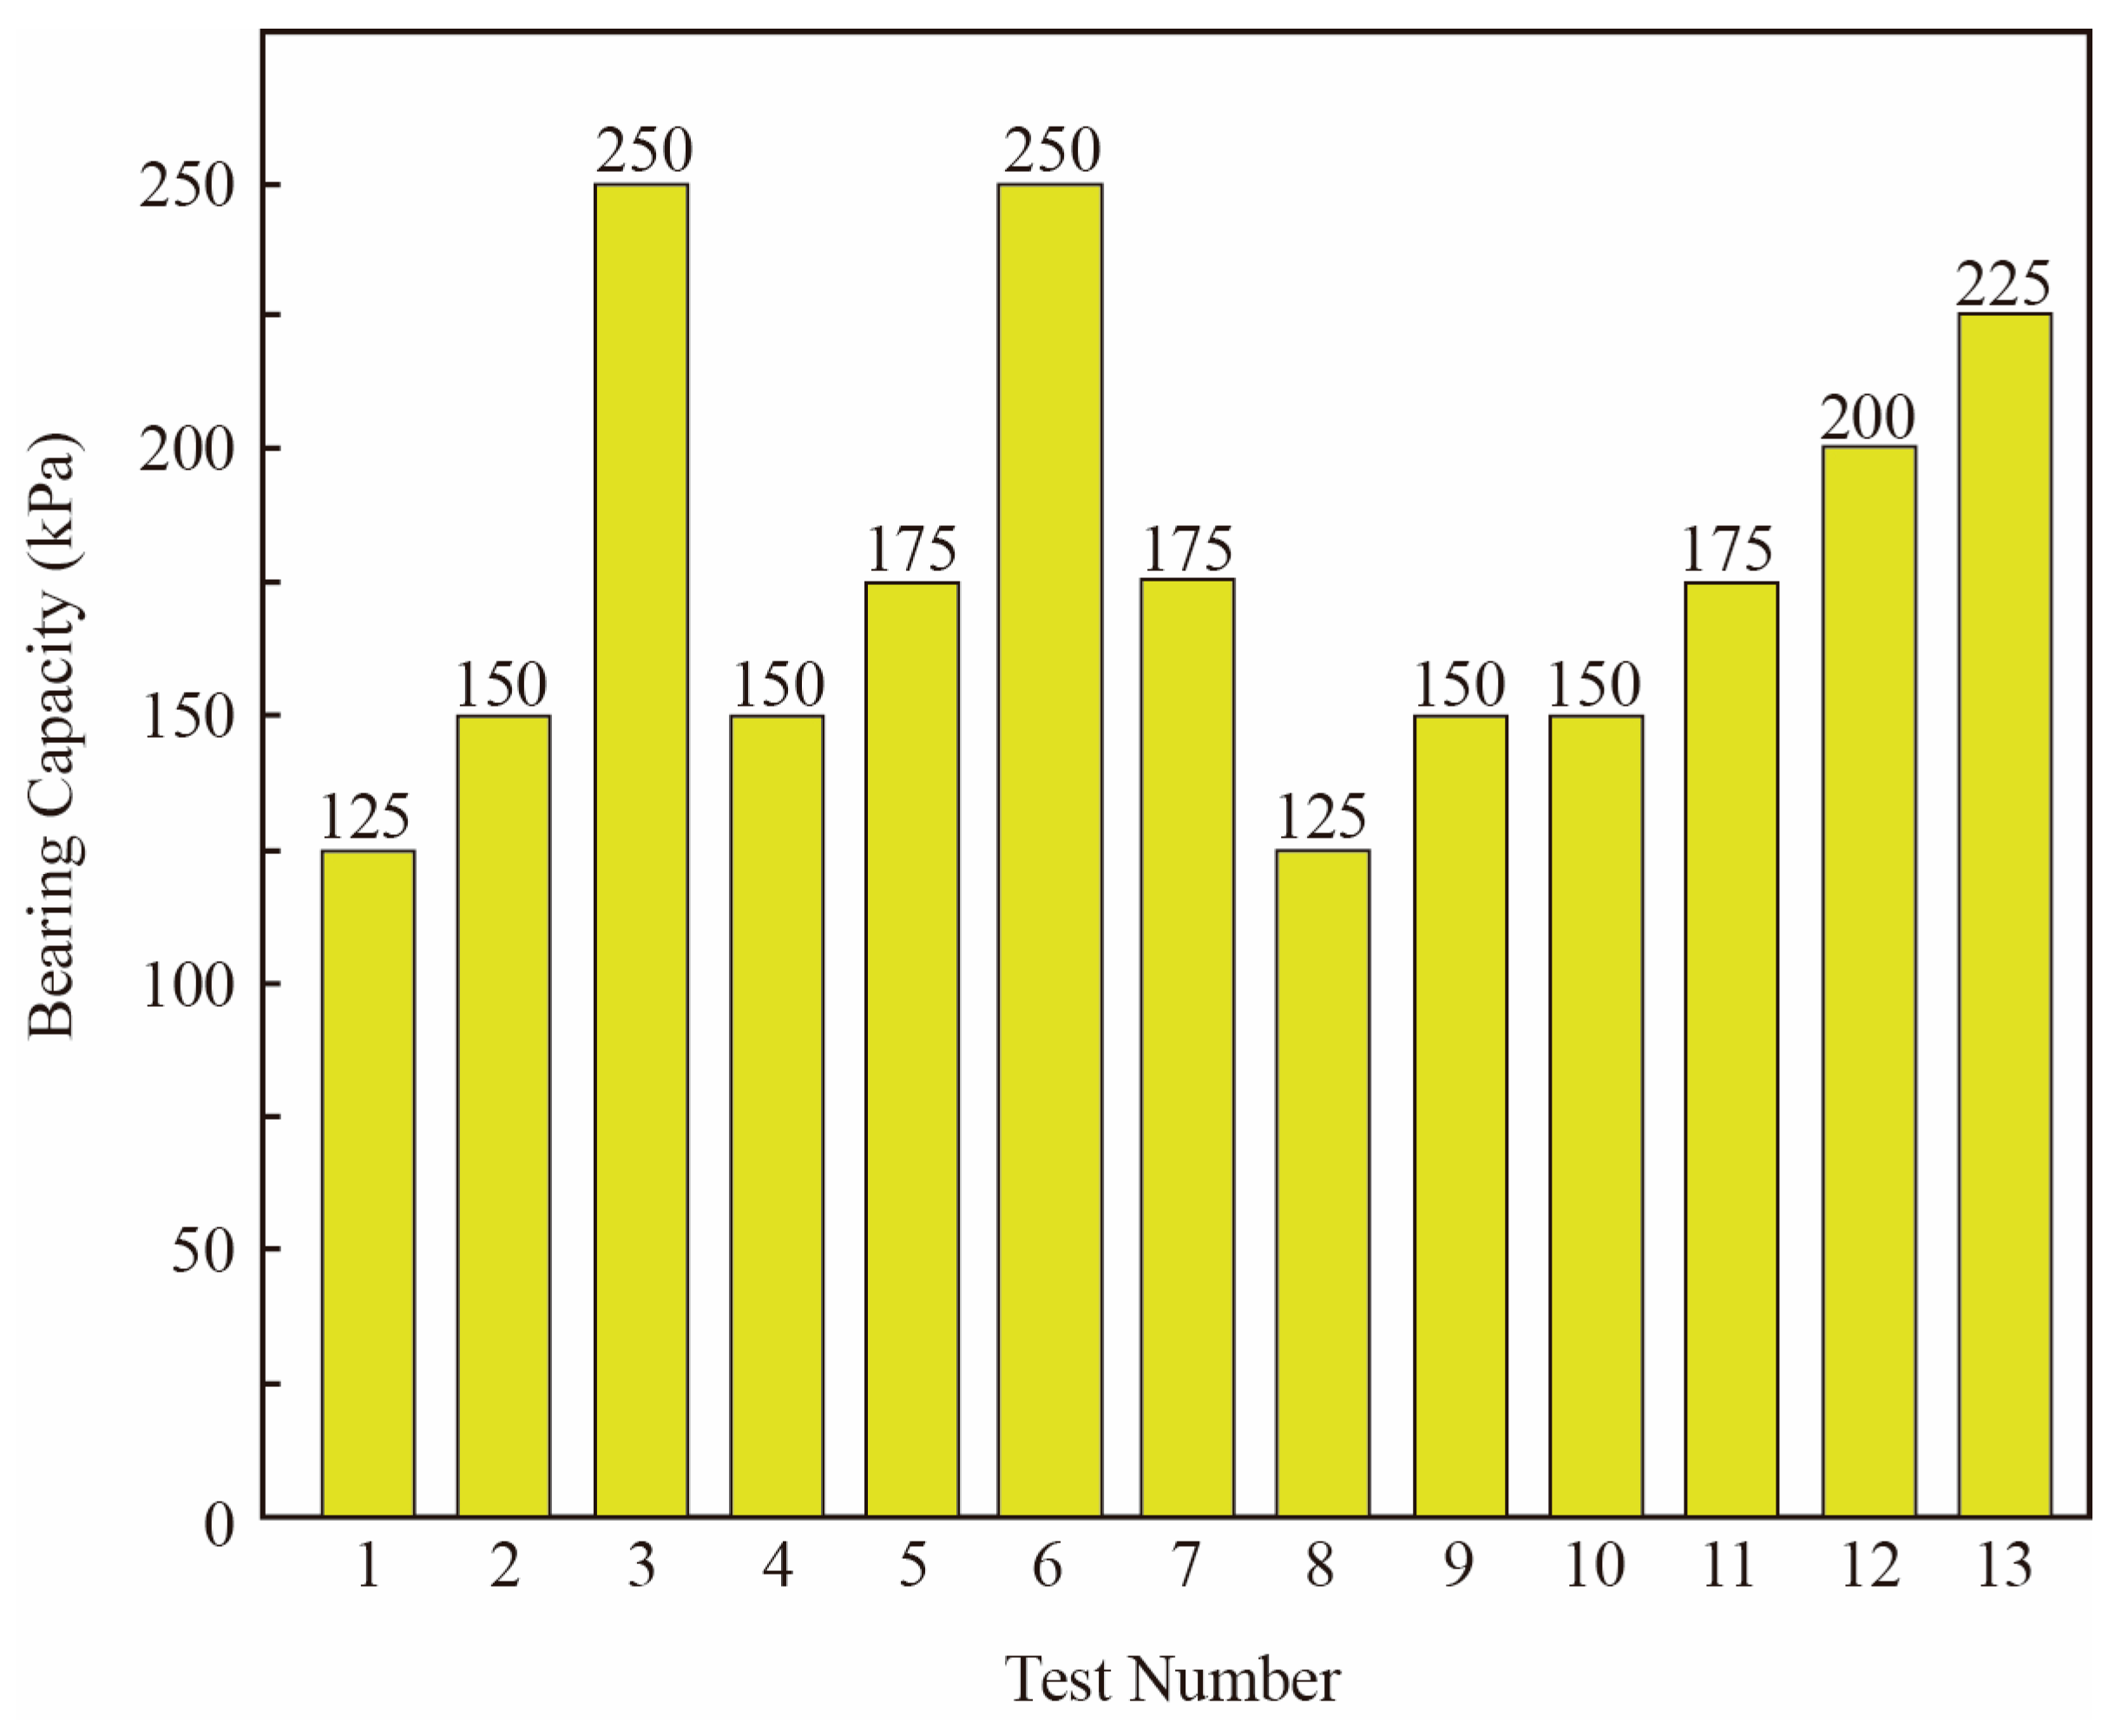
fₐ increases from 125 kPa to 250 kPa, a 100% increase. As moisture content varies from 4% to 12%,
fₐ first increases from 150 kPa to 250 kPa and then decreases to 125 kPa, with the optimum at around 7% moisture content. As relative density increases from 40% to 64%,
fₐ shows a monotonic increase from 150 kPa to 225 kPa, a 50% increase.
- (4)
Deformation Modulus (E
0):
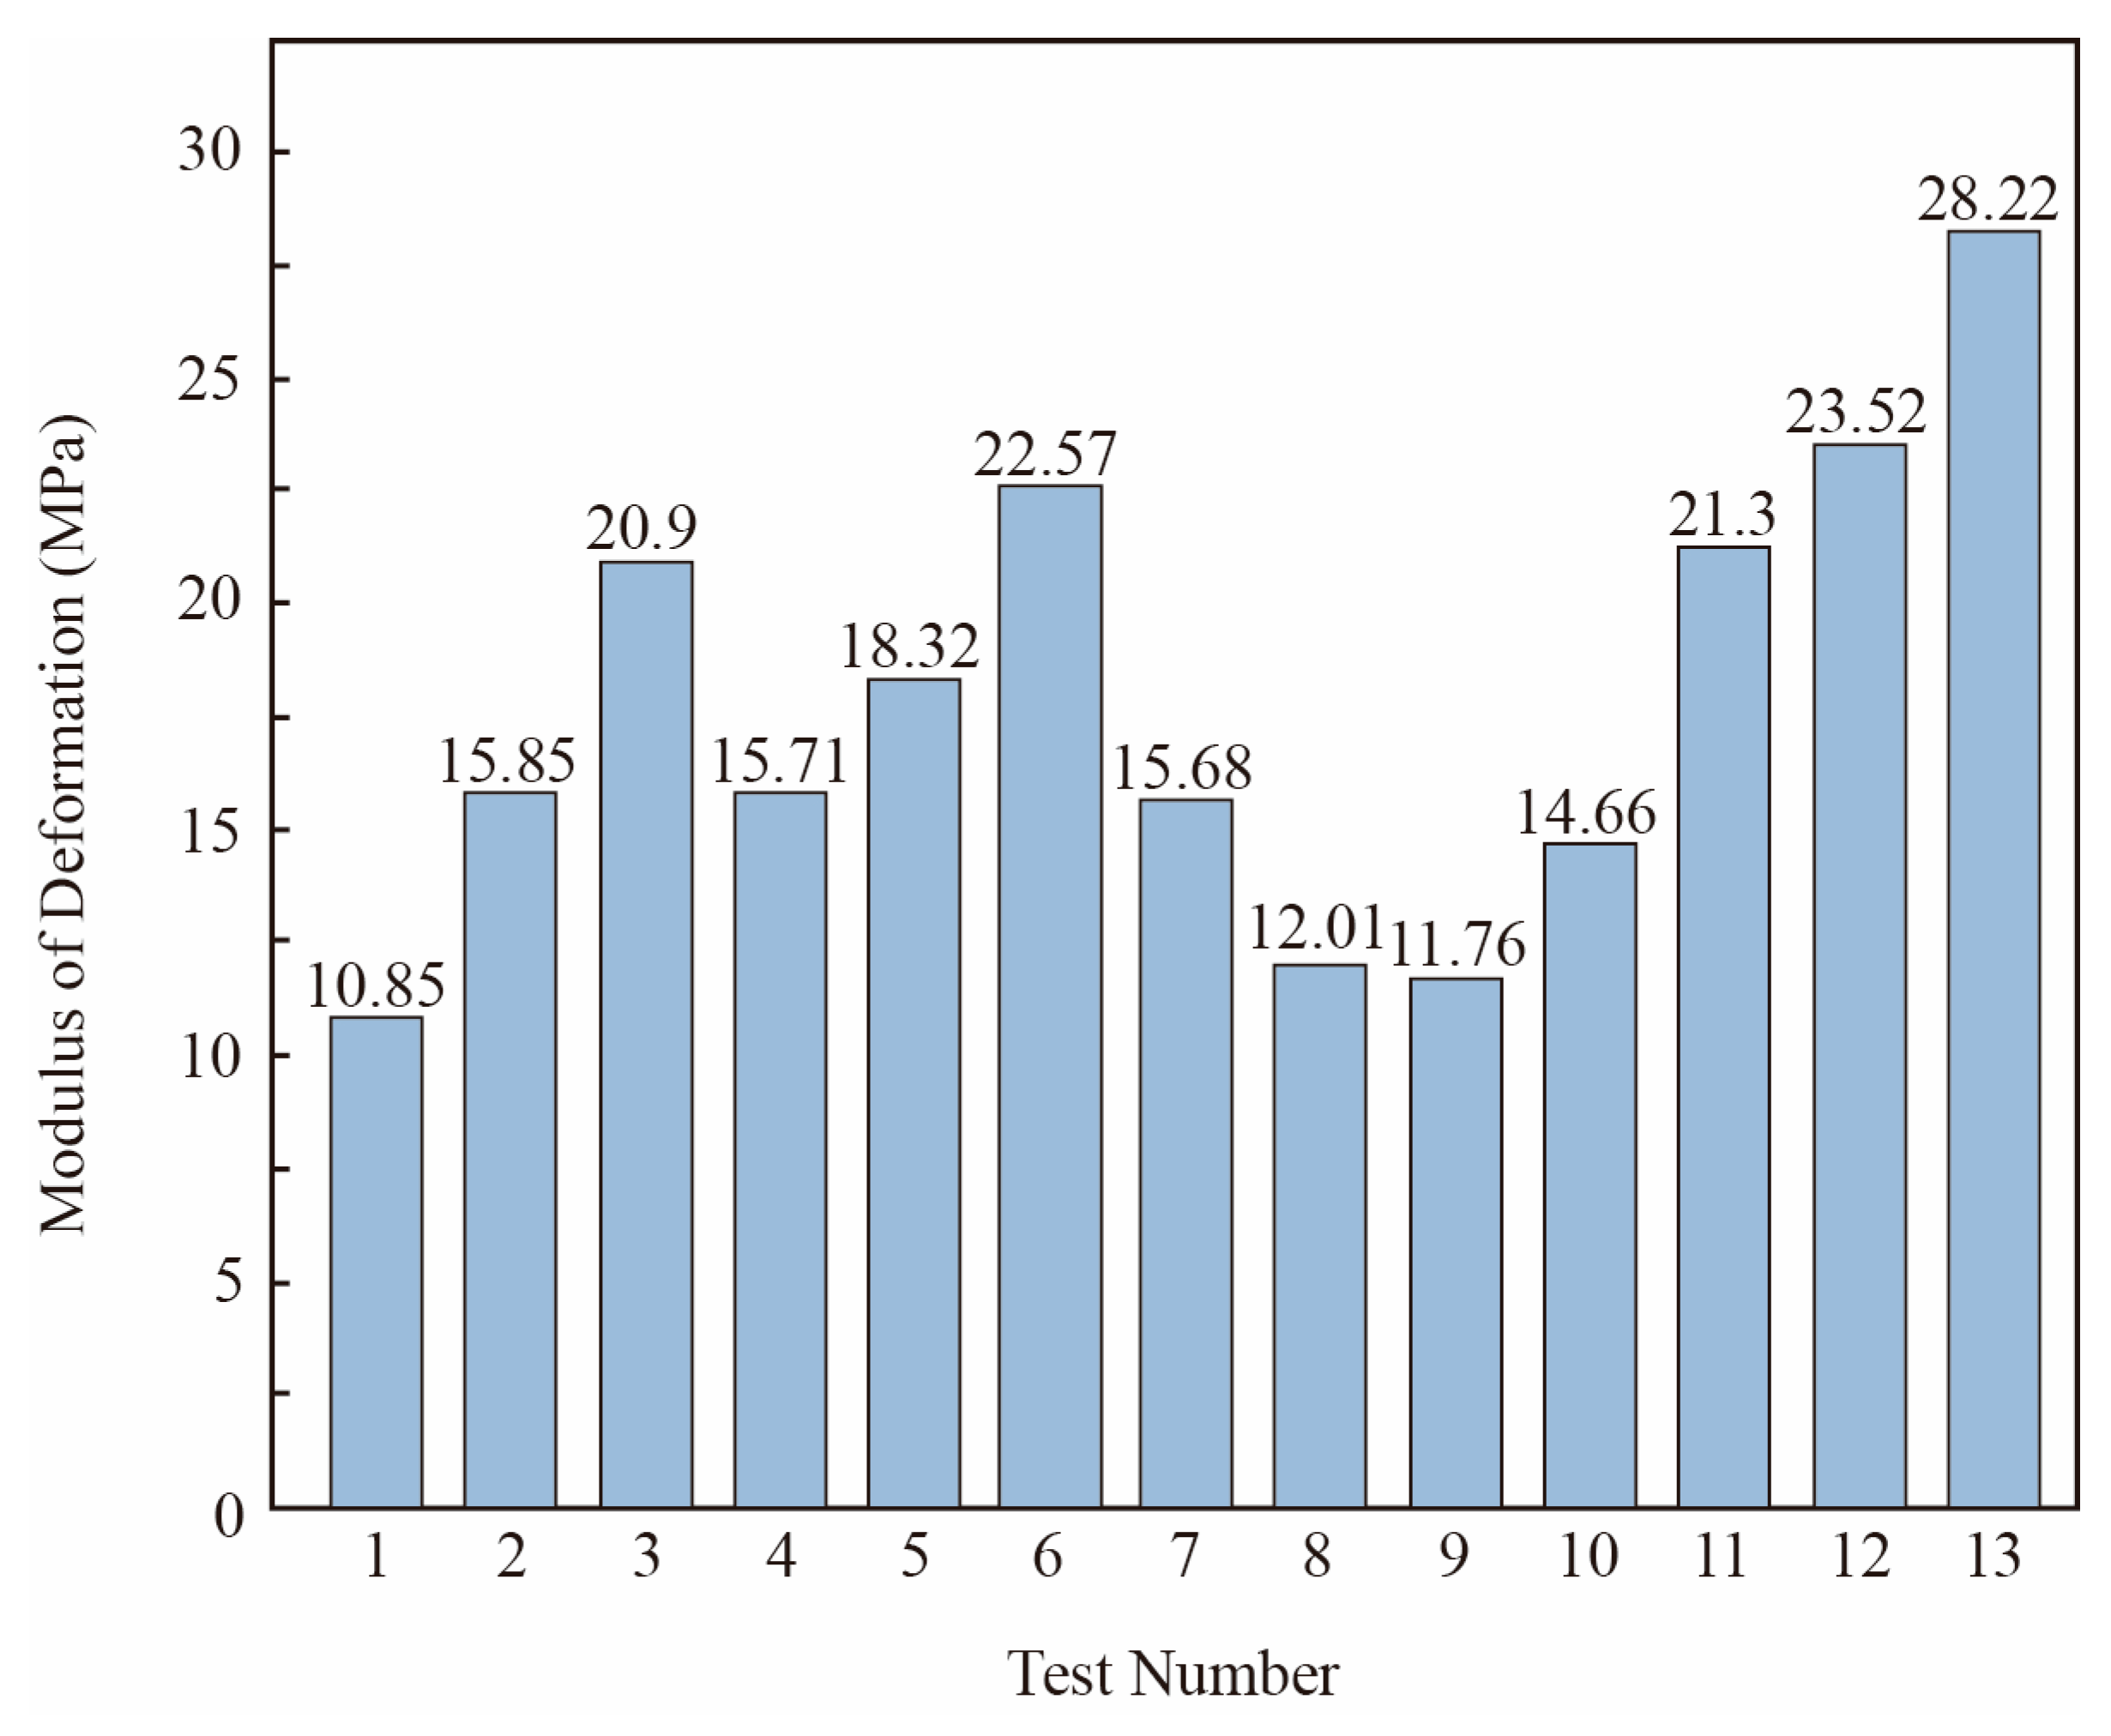
Figure 28 shows the deformation modulus E
0 of coastal beach sand foundations under different test conditions. The deformation modulus was further determined based on the Boussinesq elastic theory formula:
where
E0 is the deformation modulus of the tested soil layer (kPa);
μ is Poisson’s ratio of the soil (0.30 for sand);
Dc is the diameter of the bearing plate (cm);
p is the unit pressure (kPa);
s is the settlement corresponding to the applied pressure (cm);
ac is the side length of the bearing plate (cm).
Analysis of the determined results revealed that, as particle size distribution improves from “poor” to “good”, the deformation modulus increases from 10.85 MPa to 20.9 MPa, a 92.6% increase. As moisture content varies from 4% to 12%, the deformation modulus first increases from 15.71 MPa to 22.5 MPa, then decreases to 12.01 MPa, with the optimum at around 7% moisture content. As relative density increases from 40% to 64%, the deformation modulus shows a monotonic increase from 11.76 MPa to 28.22 MPa, a 139.97% increase.
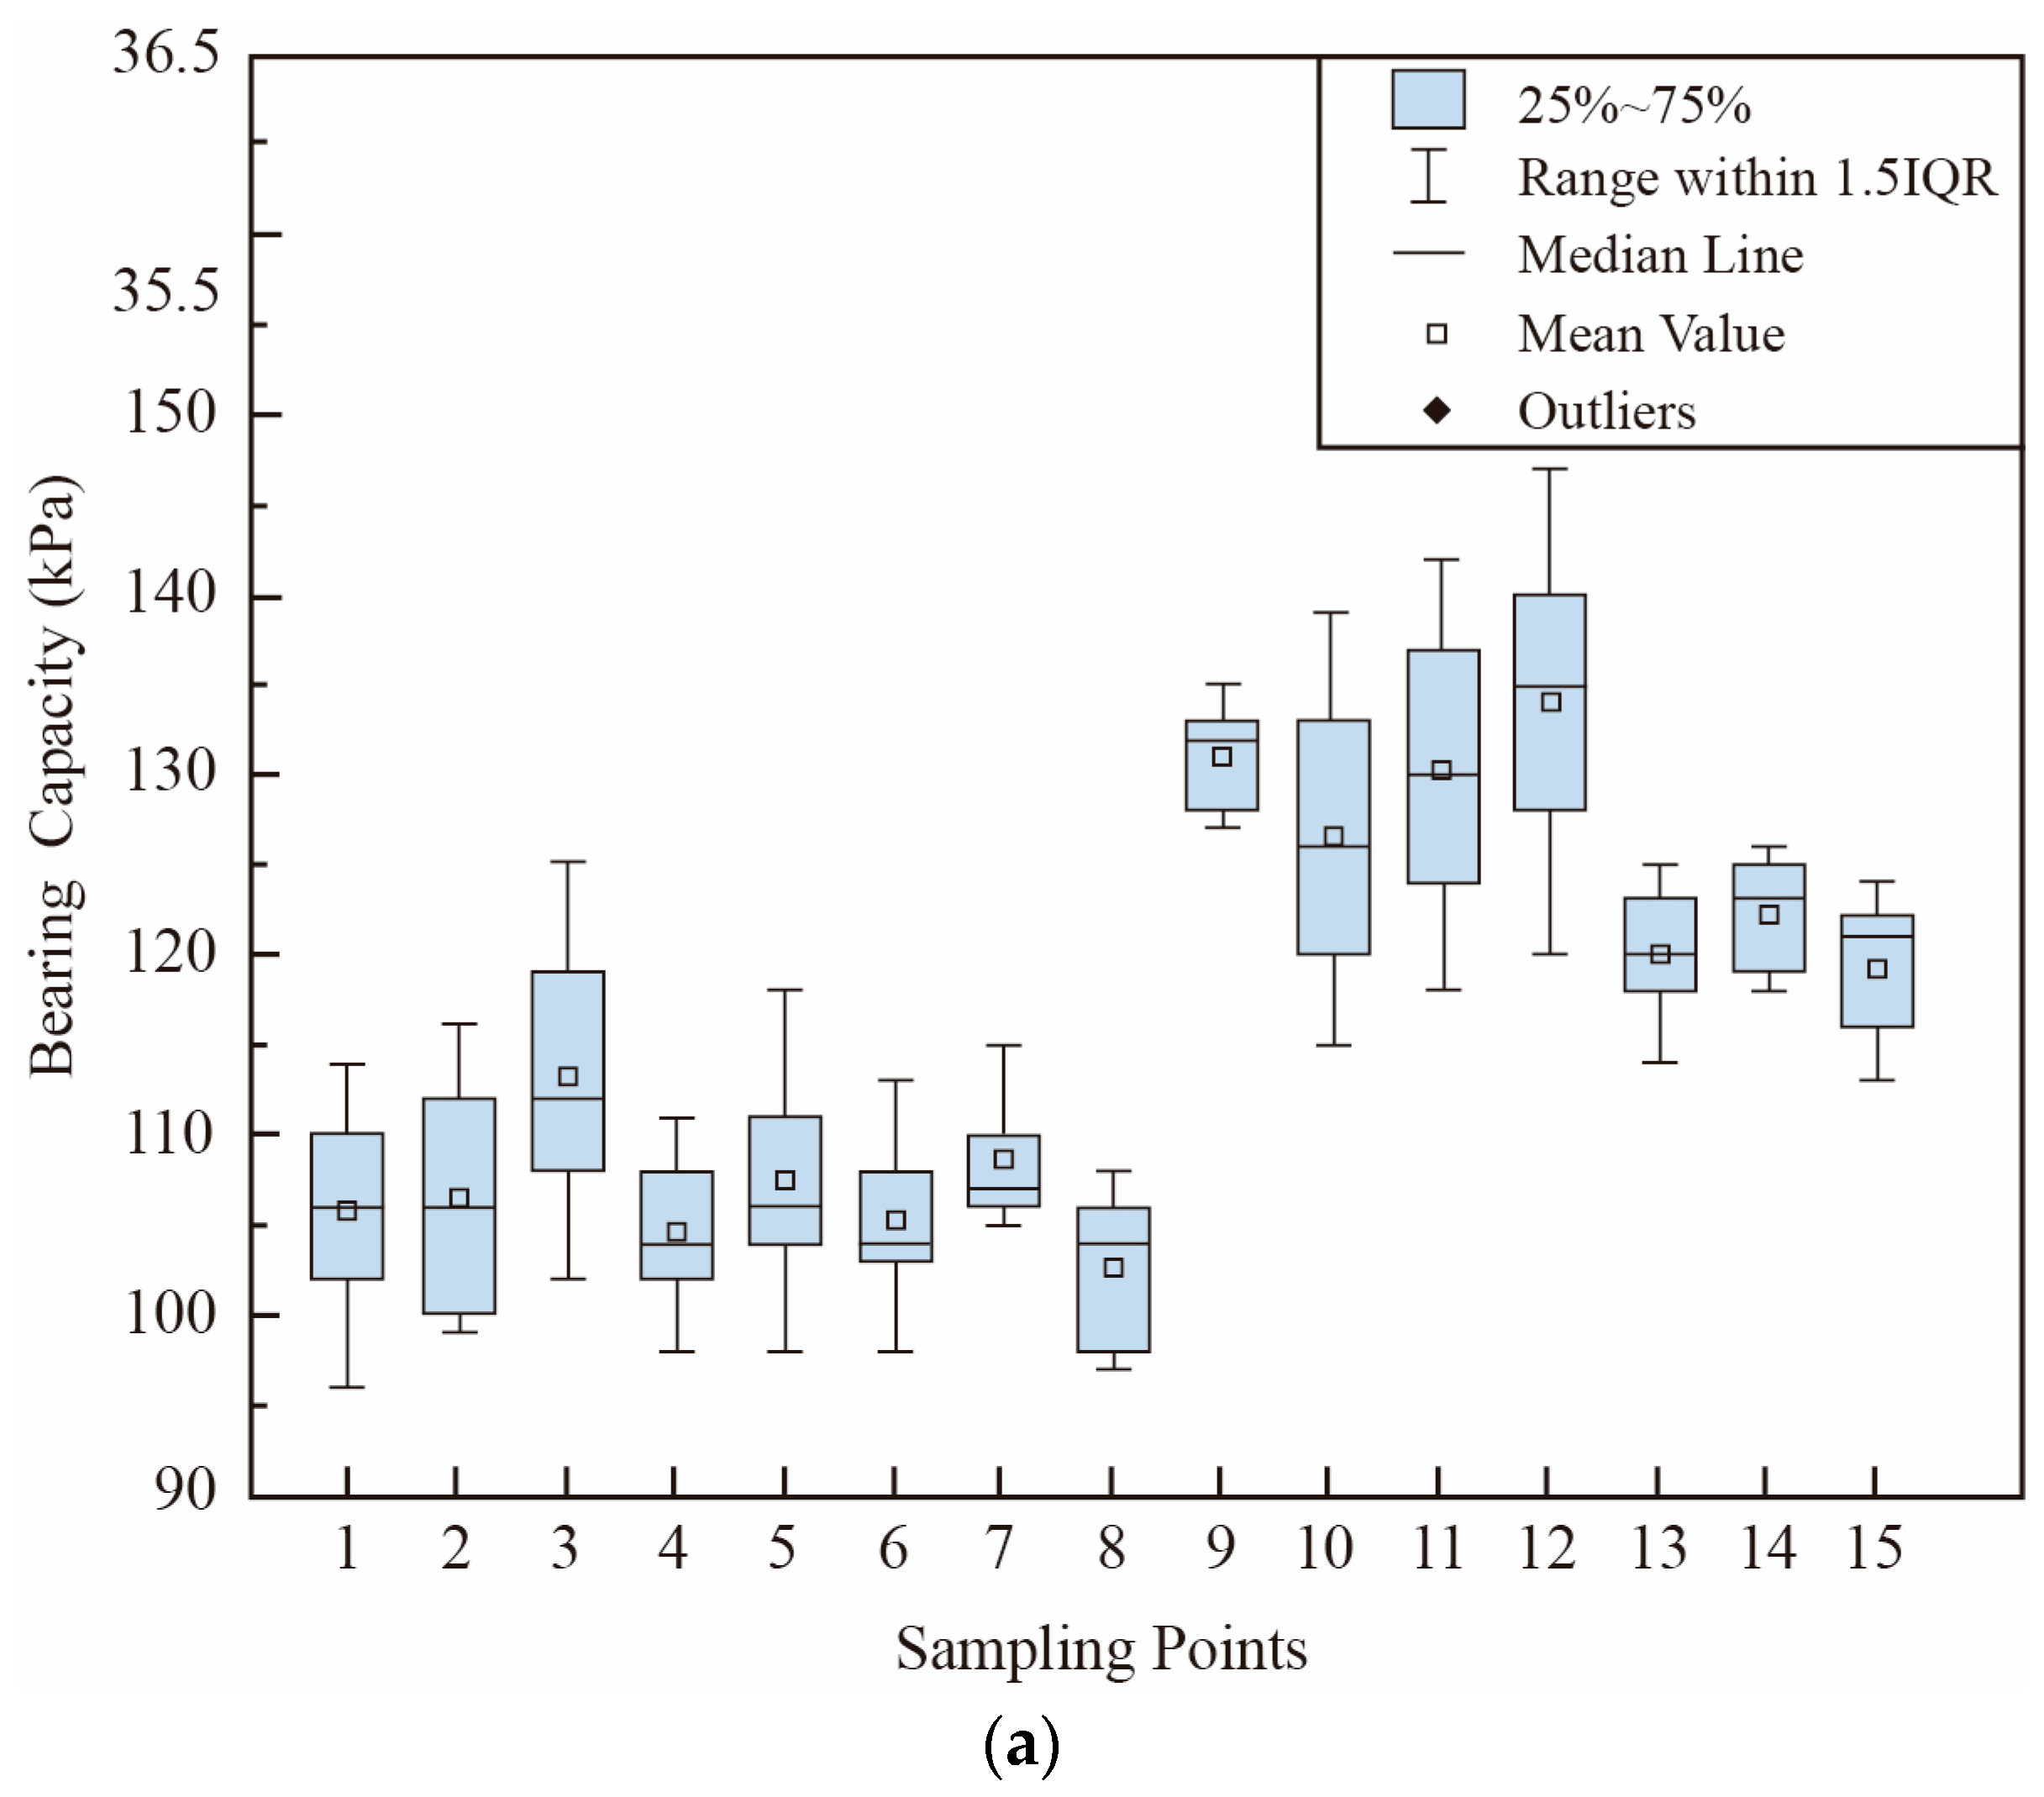
Based on the static load test data and the methods for determining key parameters of coastal sand bearing capacity, the key parameters corresponding to each test number were determined. Through calculations, the following data plots were obtained. In well-graded sand, fine particles fill the voids between coarse particles. This improves particle interlocking and frictional resistance. As a result, the bearing capacity and deformation resistance increase. Particle size distribution is the most fundamental factor, setting the upper limit of bearing capacity achievable through compaction. Moisture content exhibits a threshold control effect on sand subgrade performance: when moisture content is within 7%, the bonding effect of capillary water dominates, and mechanical performance remains stable. Once moisture content exceeds 7%, the negative impact of free water grows exponentially; excess free water filling the interparticle voids significantly weakens the effective stress between sand particles, thereby reducing shear strength and bearing stability. Density has a dominant influence on sand subgrade performance. Within the optimal density range of “Dr = 52–65%”, sand particles are closely packed, achieving optimal effective stress transfer efficiency and particle interlocking. Density is the most direct factor affecting the bearing capacity of coastal sand. Bearing capacity can be increased directly and reliably by controlling density.
Overall, the three groups of p–s curves all exhibit the typical characteristics of “elastic linear deformation—elastic–plastic transition—shear failure steep drop”. Under the same influencing factor, parameters change regularly without abnormal fluctuations. The layered compaction process effectively controlled sample uniformity, avoiding test deviations, and the method of averaging parallel tests eliminated accidental errors, revealing the common response patterns of coastal sand subgrades under load. Further comparison indicates that the three factors affect different aspects of the bearing behavior of coastal beach sand. Particle size distribution mainly controls the packing structure and the potential upper limit of bearing capacity. Moisture content presents a threshold effect and controls the transition between capillary strengthening and water-induced weakening. Relative density shows the most stable and direct positive correlation with the proportional limit load, ultimate load, characteristic value of bearing capacity, and deformation modulus. Therefore, relative density can be regarded as the dominant controllable factor in engineering compaction, while particle size distribution and moisture content should be considered as important structural and environmental factors.
Figure 25.
Proportional limit load of coastal beach sand foundations under different test conditions.
Figure 25.
Proportional limit load of coastal beach sand foundations under different test conditions.
Figure 26.
Ultimate load of coastal beach sand foundations under different test conditions.
Figure 26.
Ultimate load of coastal beach sand foundations under different test conditions.
Figure 27.
Characteristic value of bearing capacity of coastal beach sand foundations under different test conditions.
Figure 27.
Characteristic value of bearing capacity of coastal beach sand foundations under different test conditions.
Figure 28.
Deformation modulus of coastal beach sand foundations under different test conditions.
Figure 28.
Deformation modulus of coastal beach sand foundations under different test conditions.
5.4. Comprehensive Evaluation and Comparison with Previous Studies
To further evaluate the bearing behavior of coastal sandy soils in Quanzhou Bay, the test results were comprehensively analyzed from four aspects: bearing capacity parameters, deformation resistance, failure mode, and influencing mechanism. The proportional limit load, ultimate load, characteristic bearing capacity value, and deformation modulus showed consistent variation trends under different test conditions. Improved particle size distribution, suitable moisture content, and increased relative density all contributed to the enhancement of foundation bearing performance, but their mechanisms and influence patterns were different.
For particle size distribution, the improvement from poorly graded sand to well-graded sand significantly increased the ultimate load and deformation modulus. This is mainly because fine particles can fill the voids between coarse particles, which improves particle interlocking and load transfer efficiency. Similar conclusions were reported by [
15], who found that particle grading and particle shape strongly affect density, dilatancy, and shear strength of sands. Ref. [
16] also indicated that gradation and particle morphology have important effects on the compressibility of calcareous sand. The present test results are consistent with these studies, but they further show that the gradation effect is also significant for beach sands in the Quanzhou coastal zone under plate loading conditions.
For moisture content, the bearing capacity did not change monotonically with increasing water content. The test results showed that the mechanical properties of the sand were optimal at a moisture content of approximately 7%. When the moisture content was lower than this value, a certain amount of capillary water could increase apparent cohesion and improve the contact state between particles. When the moisture content exceeded this value, excess pore water weakened the effective stress and reduced the shear strength of the sand. This phenomenon is consistent with the bearing behavior of unsaturated sandy soils reported by [
22], who emphasized that the bearing capacity of unsaturated sand is closely related to the change in water content and matric suction. Ref. [
21] also pointed out that moisture content is an important parameter for evaluating the bearing capacity of sandy coastal soils. Compared with these studies, the present work provides experimental evidence for the threshold effect of moisture content in Quanzhou beach sand.
Relative density showed the most stable and direct influence on the bearing behavior. As the relative density increased from 40% to 65%, the proportional limit load, ultimate load, characteristic bearing capacity value, and deformation modulus all increased significantly. This indicates that densification improves the contact network between particles, enhances frictional resistance, and restricts settlement development. Similar observations were obtained in model tests on sand foundations by [
8,
9], in which denser sand foundations exhibited higher bearing capacity and more concentrated shear failure zones. The present results agree with these findings and further quantify the effect of relative density on coastal sand foundations in the Quanzhou Bay area.
From the perspective of failure mode, the p–s curves obtained in this study generally showed three stages: elastic deformation, elastic–plastic transition, and shear failure. The failure mode was mainly general shear failure. With increasing relative density or improved gradation, the settlement decreased, the failure angle slightly increased, and the failure range became smaller. This indicates that the foundation gradually changed from a loose and easily deformable state to a denser state with stronger deformation resistance. These results are consistent with the classical bearing capacity mechanism of shallow foundations on sand and with the model test observations reported by [
9].Overall, the three influencing factors play different roles in the bearing behavior of coastal sand. Particle size distribution controls the packing structure and the potential upper limit of bearing capacity. Moisture content controls the transition between capillary strengthening and water-induced weakening. Relative density directly controls the compactness, settlement response, and deformation modulus of the sand foundation. Therefore, the influence of these factors should not be evaluated only by a single index. For engineering applications, particle size distribution determines whether the sand has good structural potential, moisture content determines whether this potential can be maintained under coastal wetting conditions, and relative density determines whether the potential can be effectively mobilized through compaction.
Compared with previous studies, the main contribution of this study is that it combines field sampling, model plate load tests, and parameter-based bearing capacity modeling for beach sands in the Quanzhou coastal zone. Existing studies mainly focused on general sand, calcareous sand, unsaturated sand, or reinforced sand foundations, whereas the present study focuses on naturally deposited coastal beach sand affected by tidal and wave environments. The test results provide regional bearing capacity parameters and reveal the coupled influence of gradation, moisture content, and relative density. These findings can provide a useful reference for coastal foundation design, temporary trafficability assessment, and beach engineering construction in Quanzhou Bay and similar coastal areas.
6. Sand Bearing Capacity Models
6.1. Establishment of Sand Bearing Capacity Models
Determining foundation bearing capacity is essential for subgrade construction, and numerous formulas for calculating foundation bearing capacity exist in classical soil mechanics [
5,
6]. To assess the applicability of various models for predicting the bearing capacity of sandy soil foundations on Quanzhou beaches, the L. Prandtl–Reissner bearing capacity model was selected and amended to obtain a semi-empirical model better suited to the beach sandy soil foundations in Quanzhou. Although previous prediction models have often required the internal friction angle as an input parameter, this is not easy to determine rapidly in field conditions because it usually requires laboratory shear tests. Therefore, this study aimed to develop a practical model based on easily measurable physical parameters. The selected parameters include moisture content, particle size distribution, and relative density, and to establish this model, we used the L. Prandtl–Reissner ultimate bearing capacity formula as the theoretical basis for strip foundations, referenced from the Engineering Geological Manual (5th Edition). The original form of the equation is given as Equation (3):
where
fu is the ultimate bearing capacity (kPa);
ck is cohesion (kPa);
γ0 is the unit weight of soil below the foundation base (kN/m
3);
d is the foundation embedment depth (m);
b is the foundation width (m); and
Mb,
Md, and
Mc are the bearing capacity factors, determined by Equations (4)–(6):
Given that the triaxial compression test reveals the cohesion of coastal sand samples to be virtually nil, and with only the surface bearing capacity taken into account, only the first term of fu is considered. By substituting the value of Mb, the bearing capacity formula is derived as presented in (7).
Because the tested coastal beach sand had nearly zero cohesion and the loading plate was placed on the ground surface, the cohesion term and embedment-depth term were neglected. Therefore, Equation (3) was simplified to Equation (7).
Equation (7) indicates that the internal friction angle φ is the key parameter controlling the theoretical ultimate bearing capacity of cohesionless coastal beach sand. However, direct determination of φ generally requires laboratory shear tests, which are time-consuming and inconvenient for rapid field evaluation. Therefore, this study attempted to express tan φ using easily measurable physical parameters of beach sand.
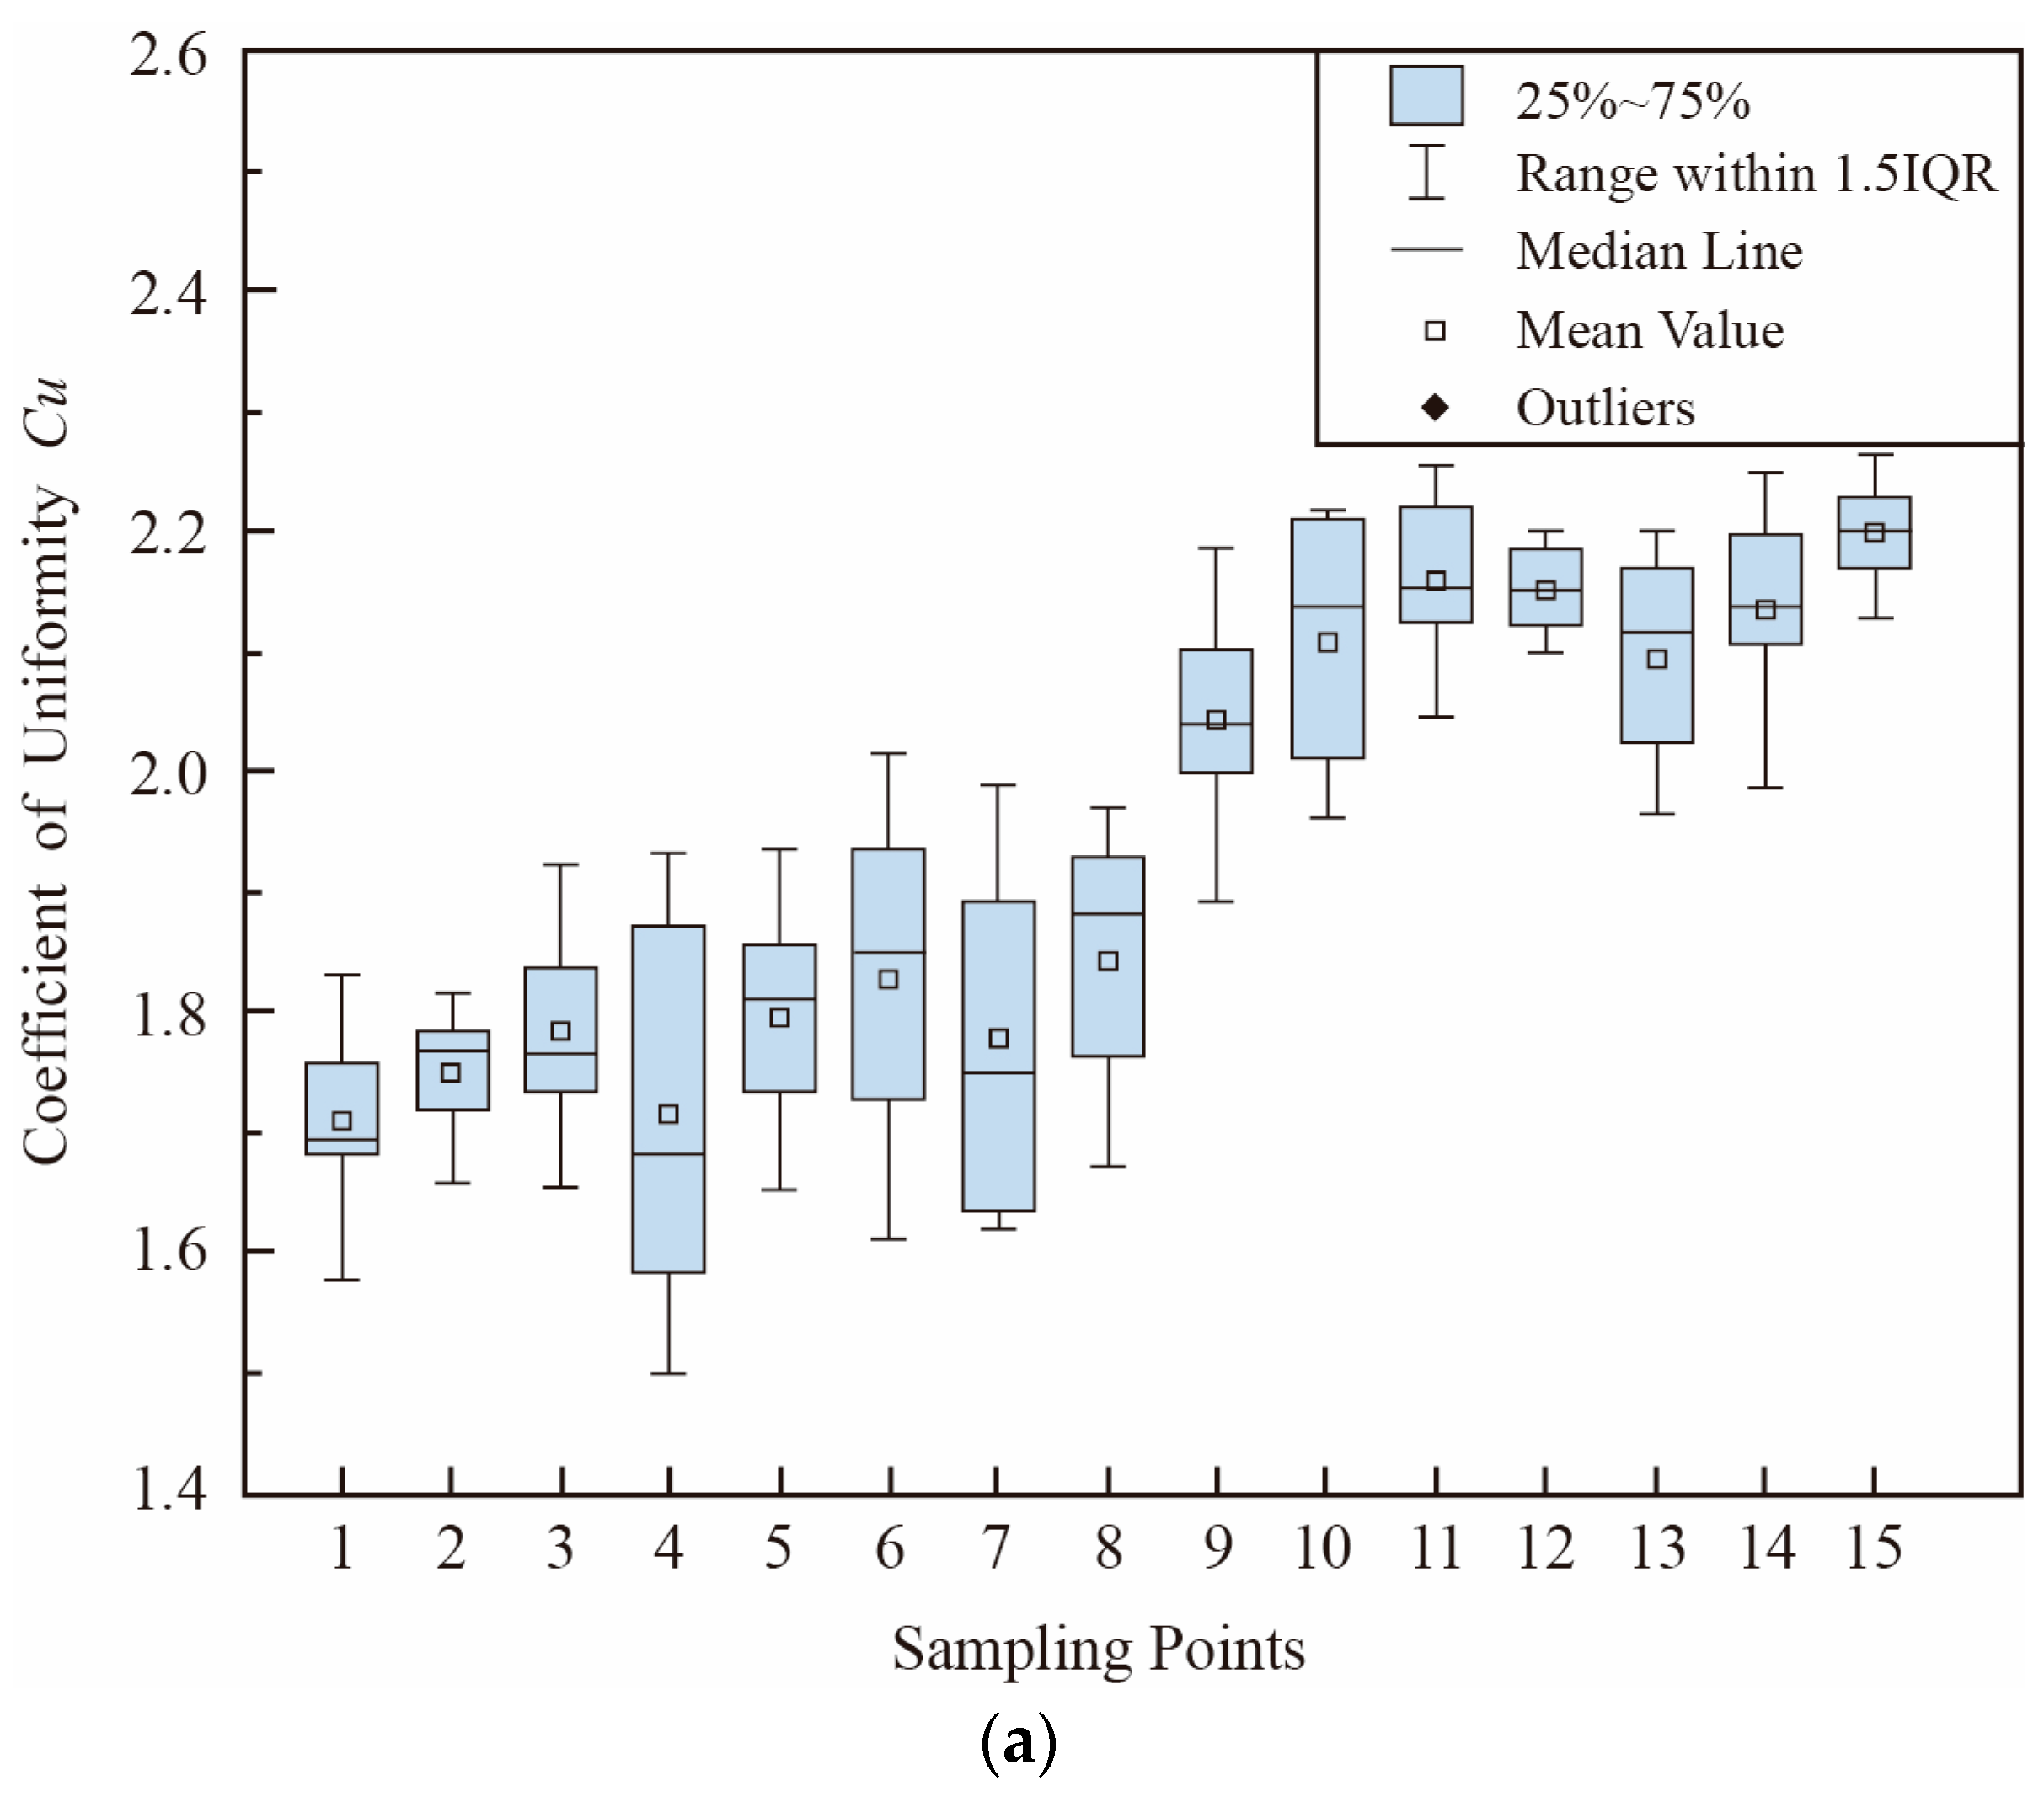
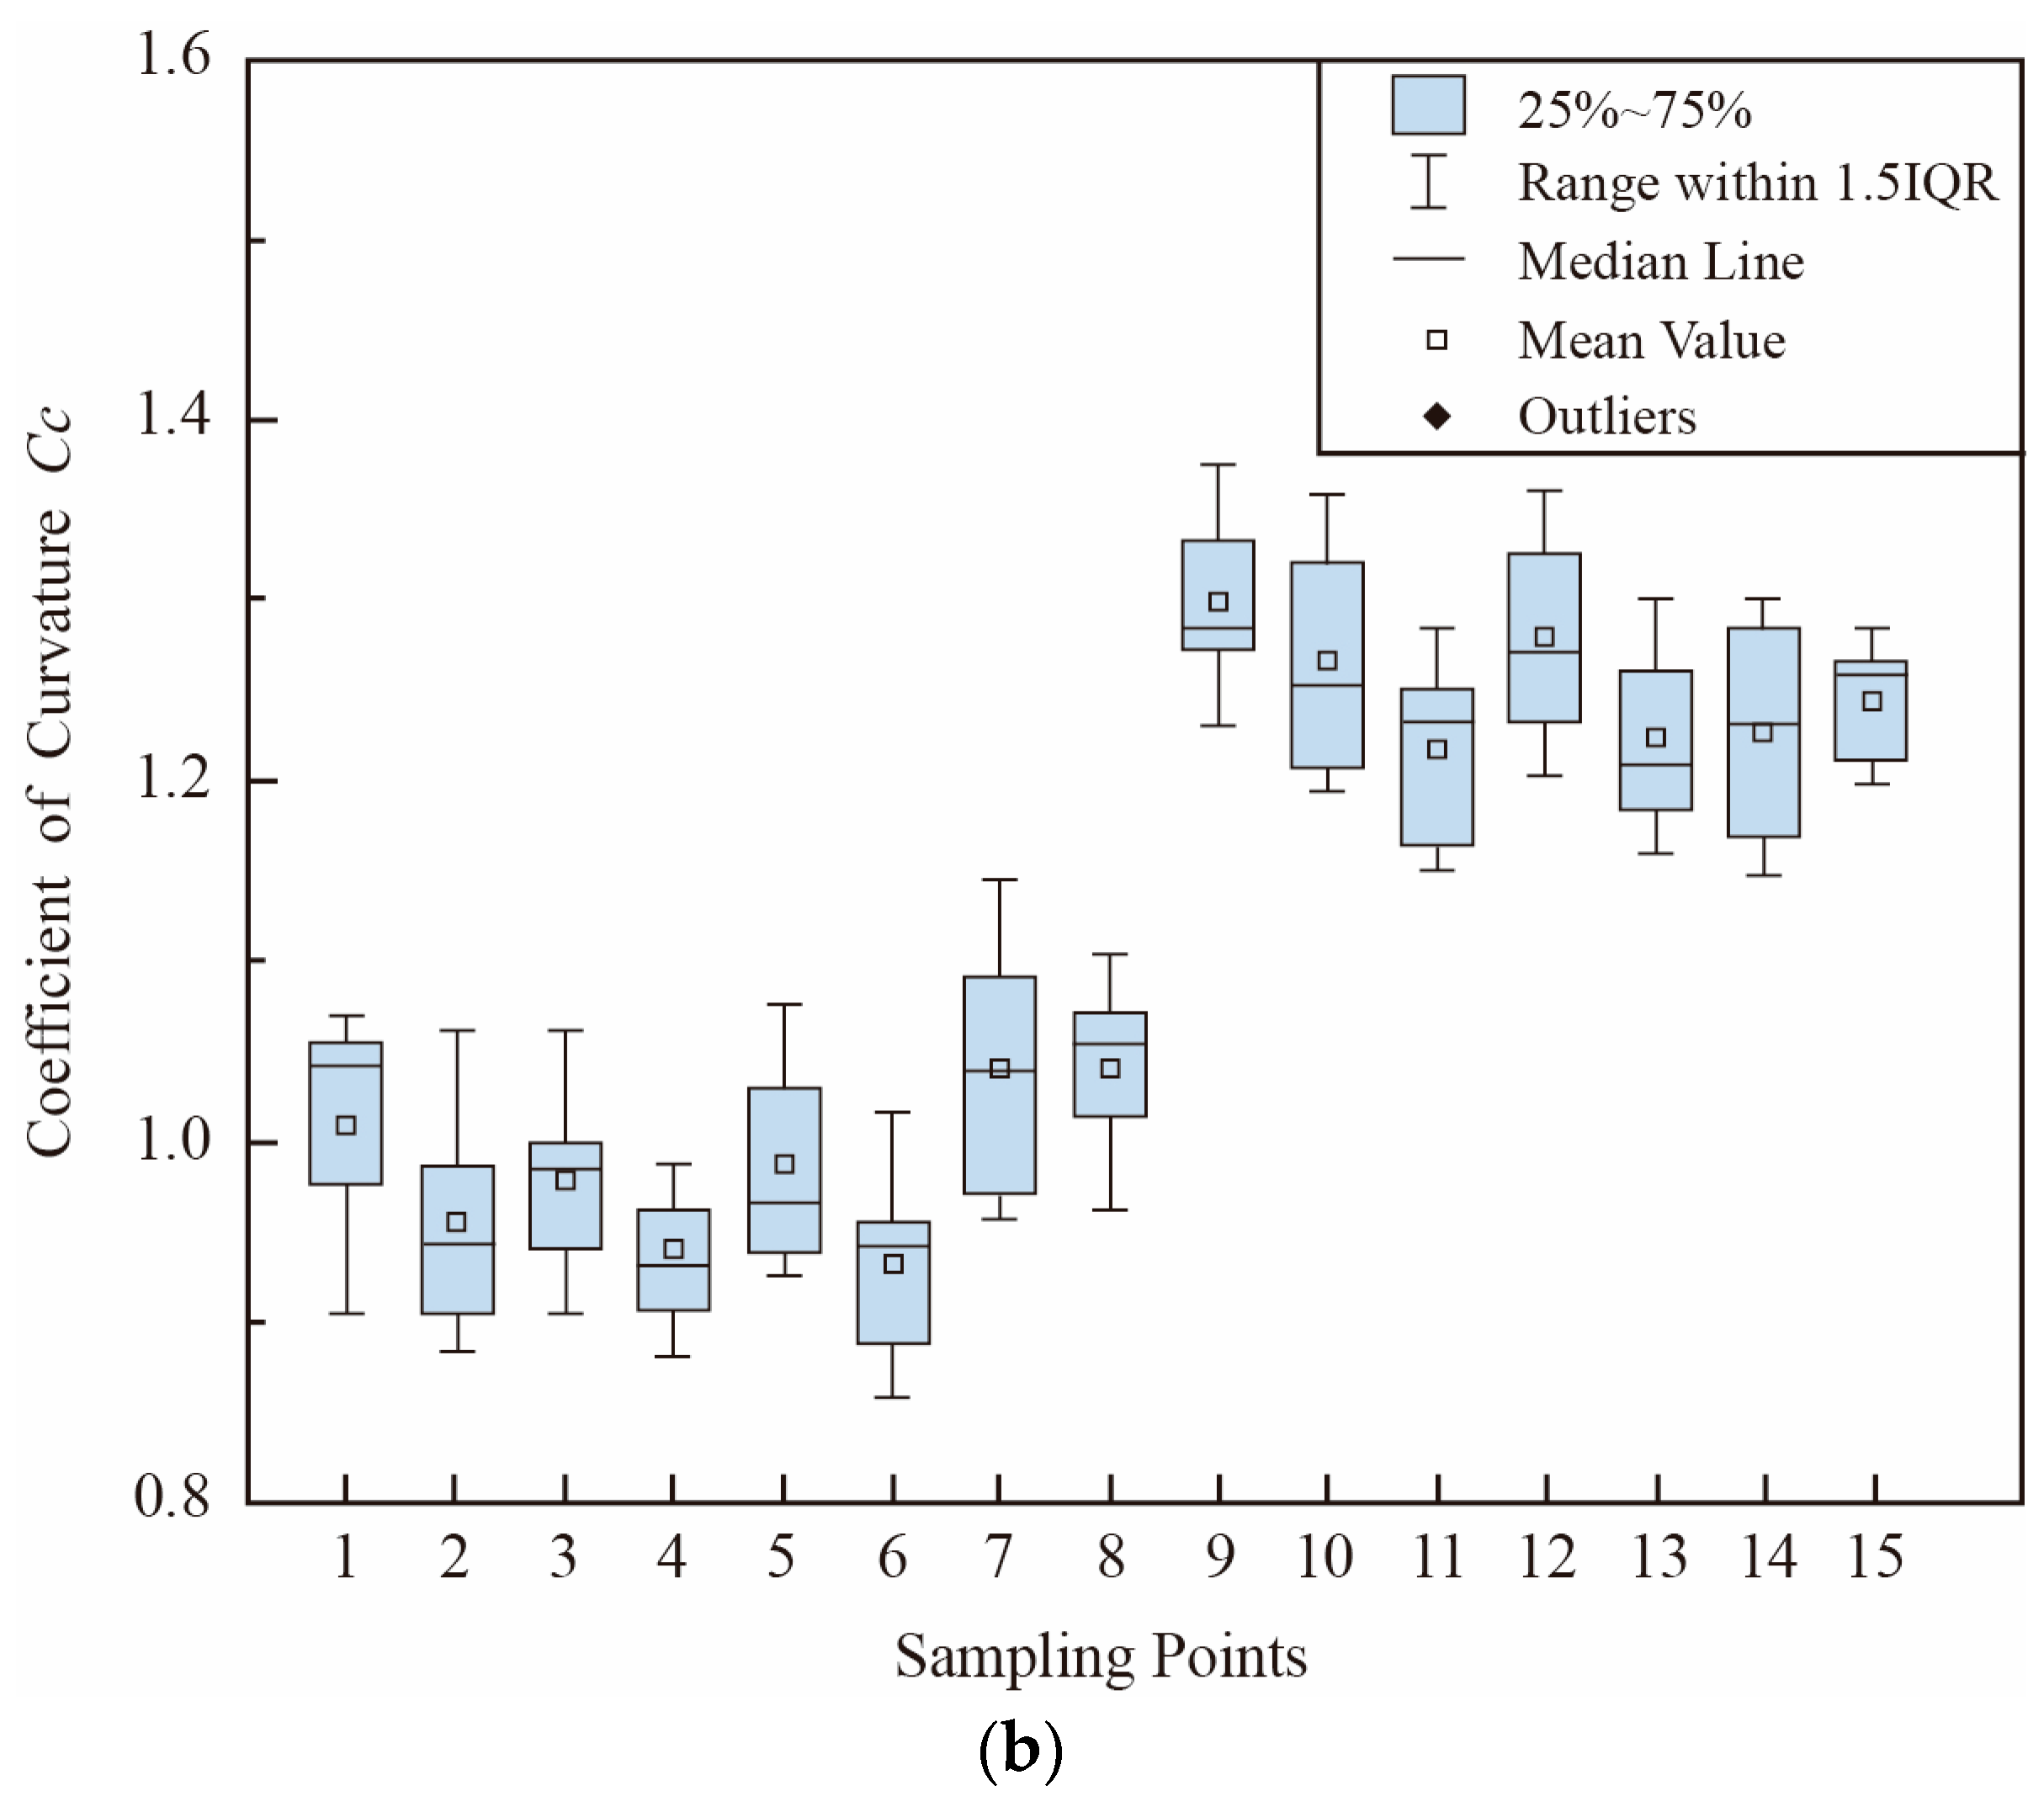
The selected parameters included moisture content ω, uniformity coefficient Cu, coefficient of curvature Cc, and relative density Dr. The basis for selecting these parameters is as follows: Moisture content reflects the water state of the sand and affects capillary action, apparent cohesion, and effective stress. The uniformity coefficient Cu represents the width of particle size distribution, while the coefficient of curvature Cc reflects the continuity of gradation. These two parameters jointly describe the gradation condition and particle packing potential. Relative density Dr directly reflects the compactness of the sand skeleton and strongly affects interparticle contact and shear resistance.
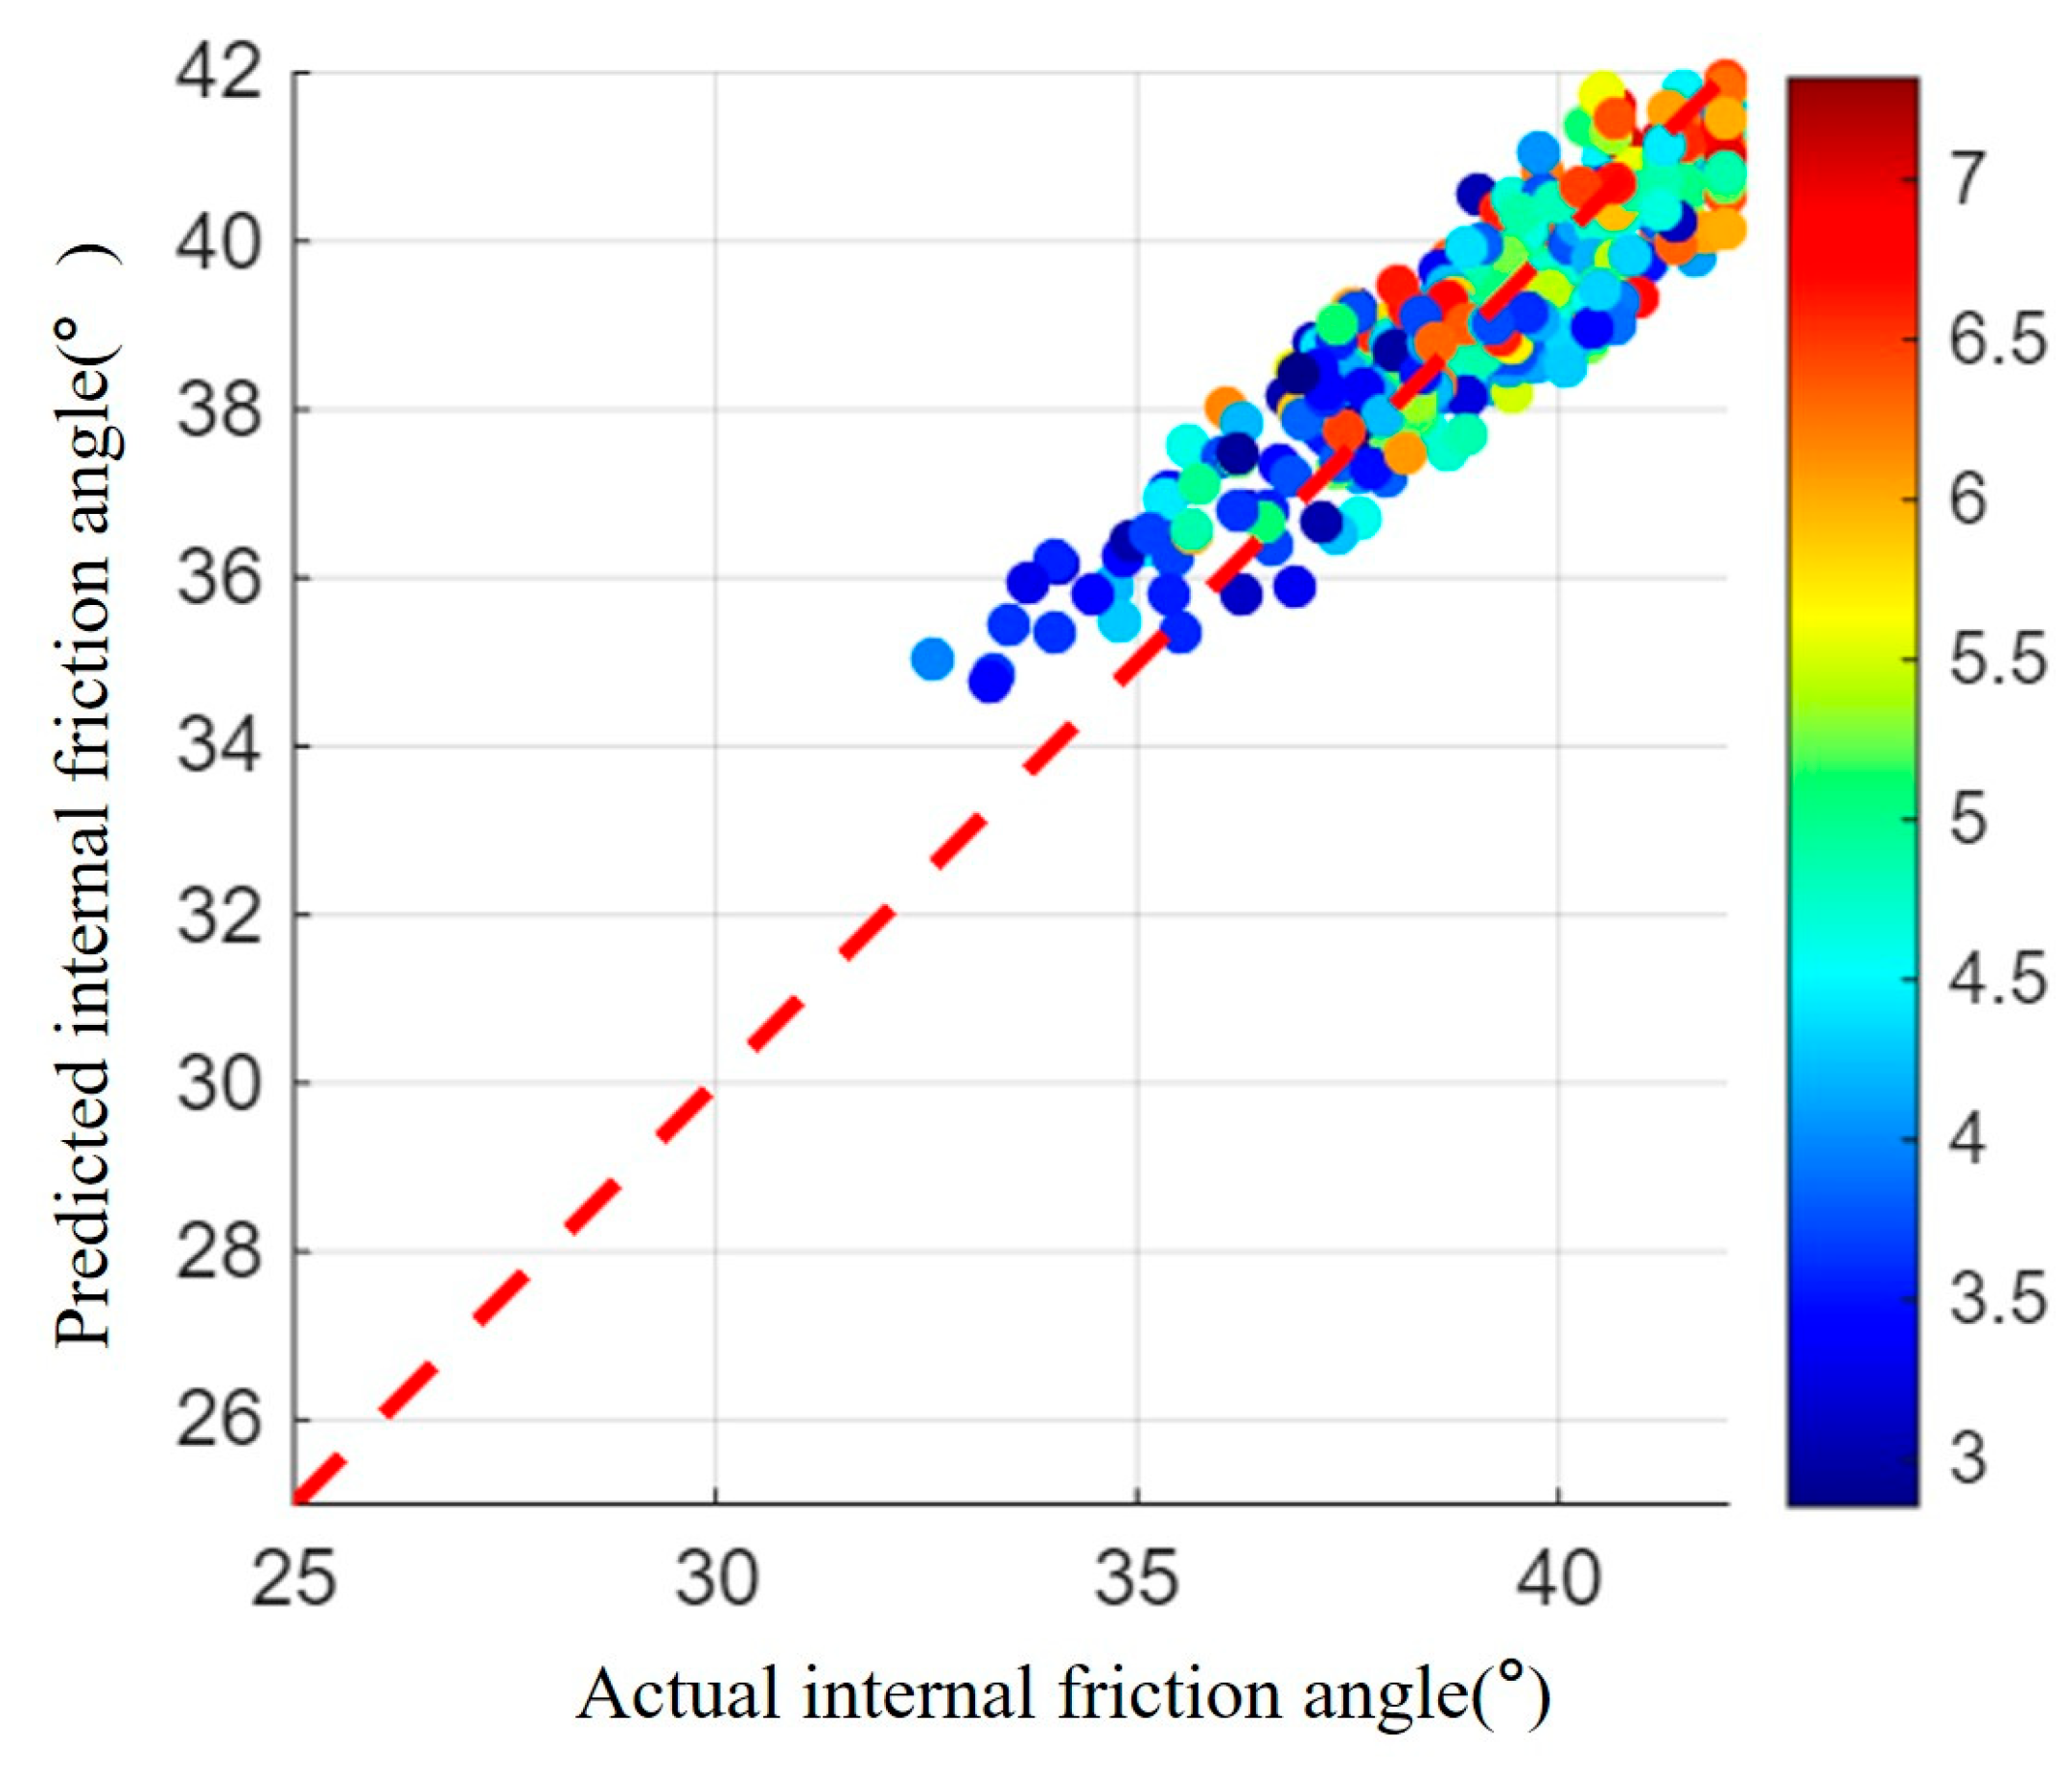
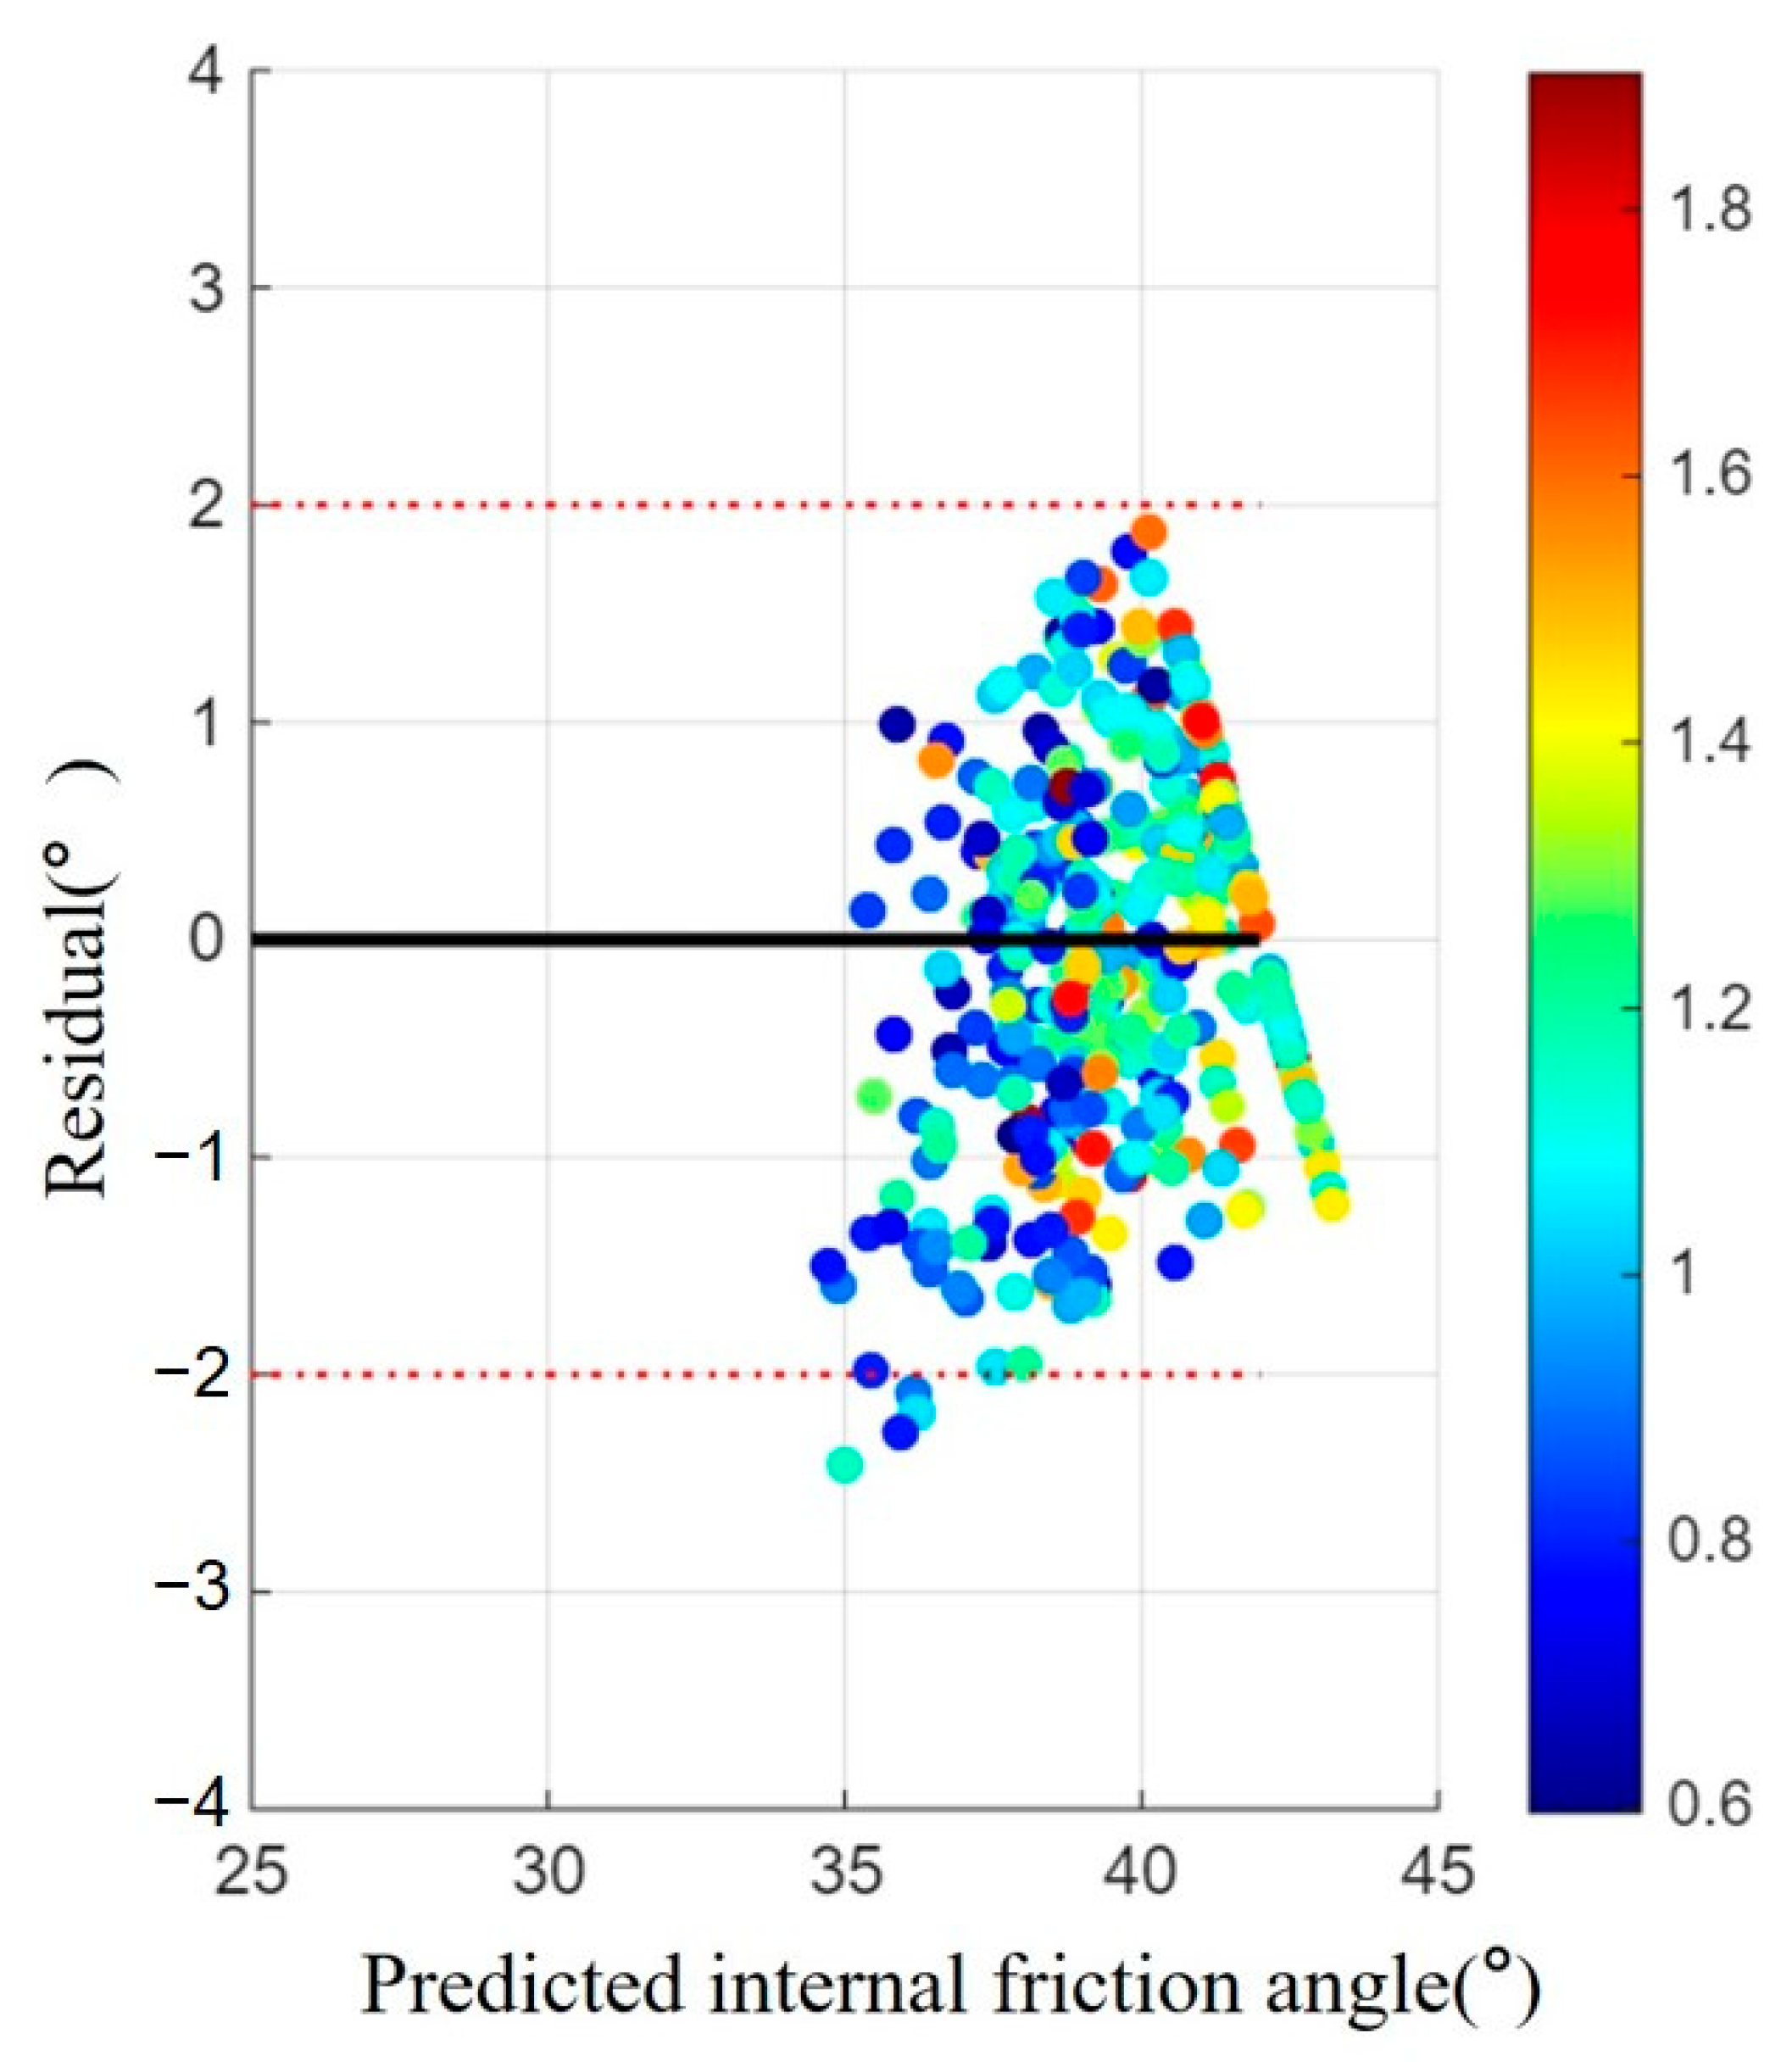
Based on the measured physical parameters and internal friction angles of the tested sand samples, a regression relationship between tan φ and ω, Cu, Cc, and Dr was established using the least-squares fitting function in MATLAB R2015a (MathWorks, Natick, MA, USA). The fitting objective was to minimize the residual between the measured and predicted internal friction angles. The fitted equation is expressed as Equation (8).
where ω is the moisture content, Cu is the uniformity coefficient, Cc is the coefficient of curvature, and Dr is the relative density. The fitted relationship links the physical state parameters of the sand to the internal friction angle. By substituting Equation (8) into Equation (7), a semi-theoretical and semi-empirical bearing capacity model was obtained, retaining the physical basis of the Prandtl–Reissner bearing capacity theory and improving its applicability to coastal beach sand by introducing easily measurable field parameters.
By integrating Equations (7) and (8), we derived a model for the bearing capacity of shallow beach ground foundations. This model takes into account the influences of sandy soil’s grain size distribution, moisture content, and relative density. Such a design not only streamlines the measurement procedure and enhances the model’s practicality and operability, but also offers a more efficient predictive tool for engineering applications, enabling the swift and precise acquisition of necessary data in field conditions.
Figure 29 compares the measured and predicted internal friction angles and is used to evaluate the fitting accuracy of the regression relationship.
Figure 30 presents the distribution of fitting residuals for the internal friction angle prediction model.
6.2. Model Discussion and Validation
In the bearing capacity analysis, three primary influencing factors were identified: moisture content, particle size distribution, and density. The models established also consider these three factors. These quantities are physical parameters of coastal soil samples, and the static load test values for coastal sand represent actual field values. The field environment may dynamically influence the values of these parameters. However, the models established provide a reference range for quickly determining bearing capacity in the field.
To quantitatively analyze the influence of different factors on bearing capacity, a single-factor analysis with controlled variables was conducted using the semi-empirical model. This explored the direct impact of moisture content, particle size distribution, and density on bearing capacity.
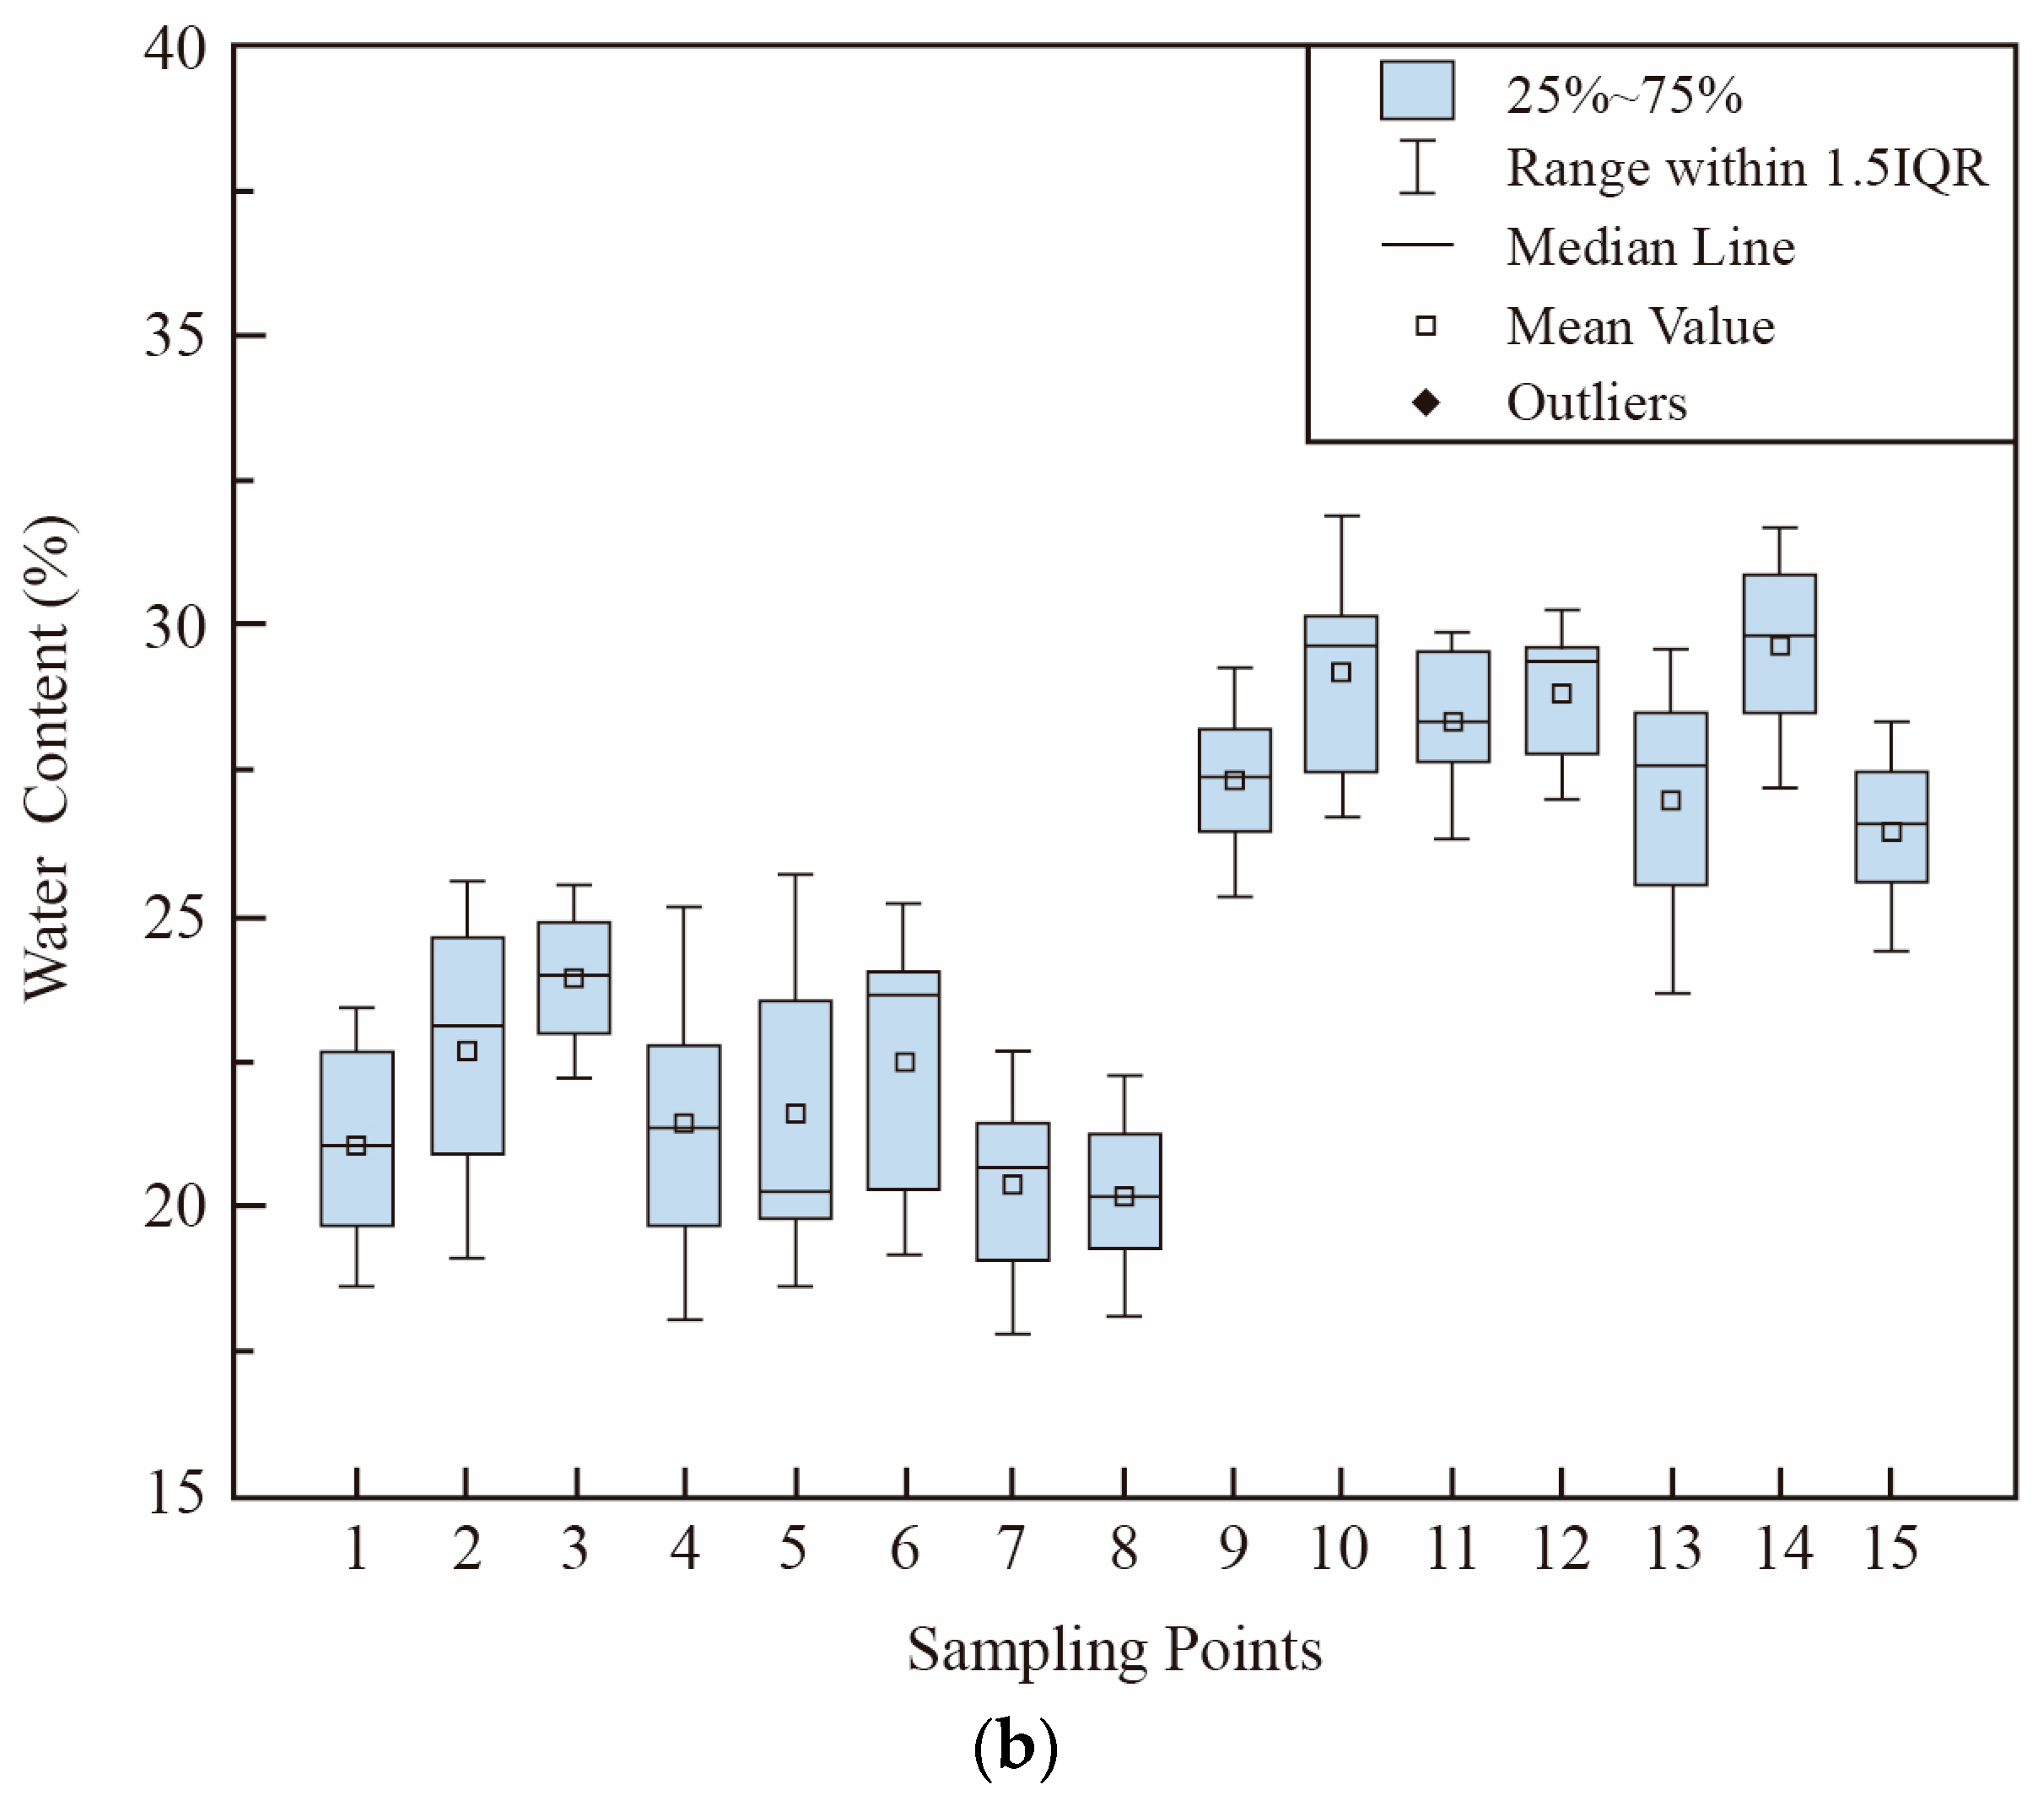
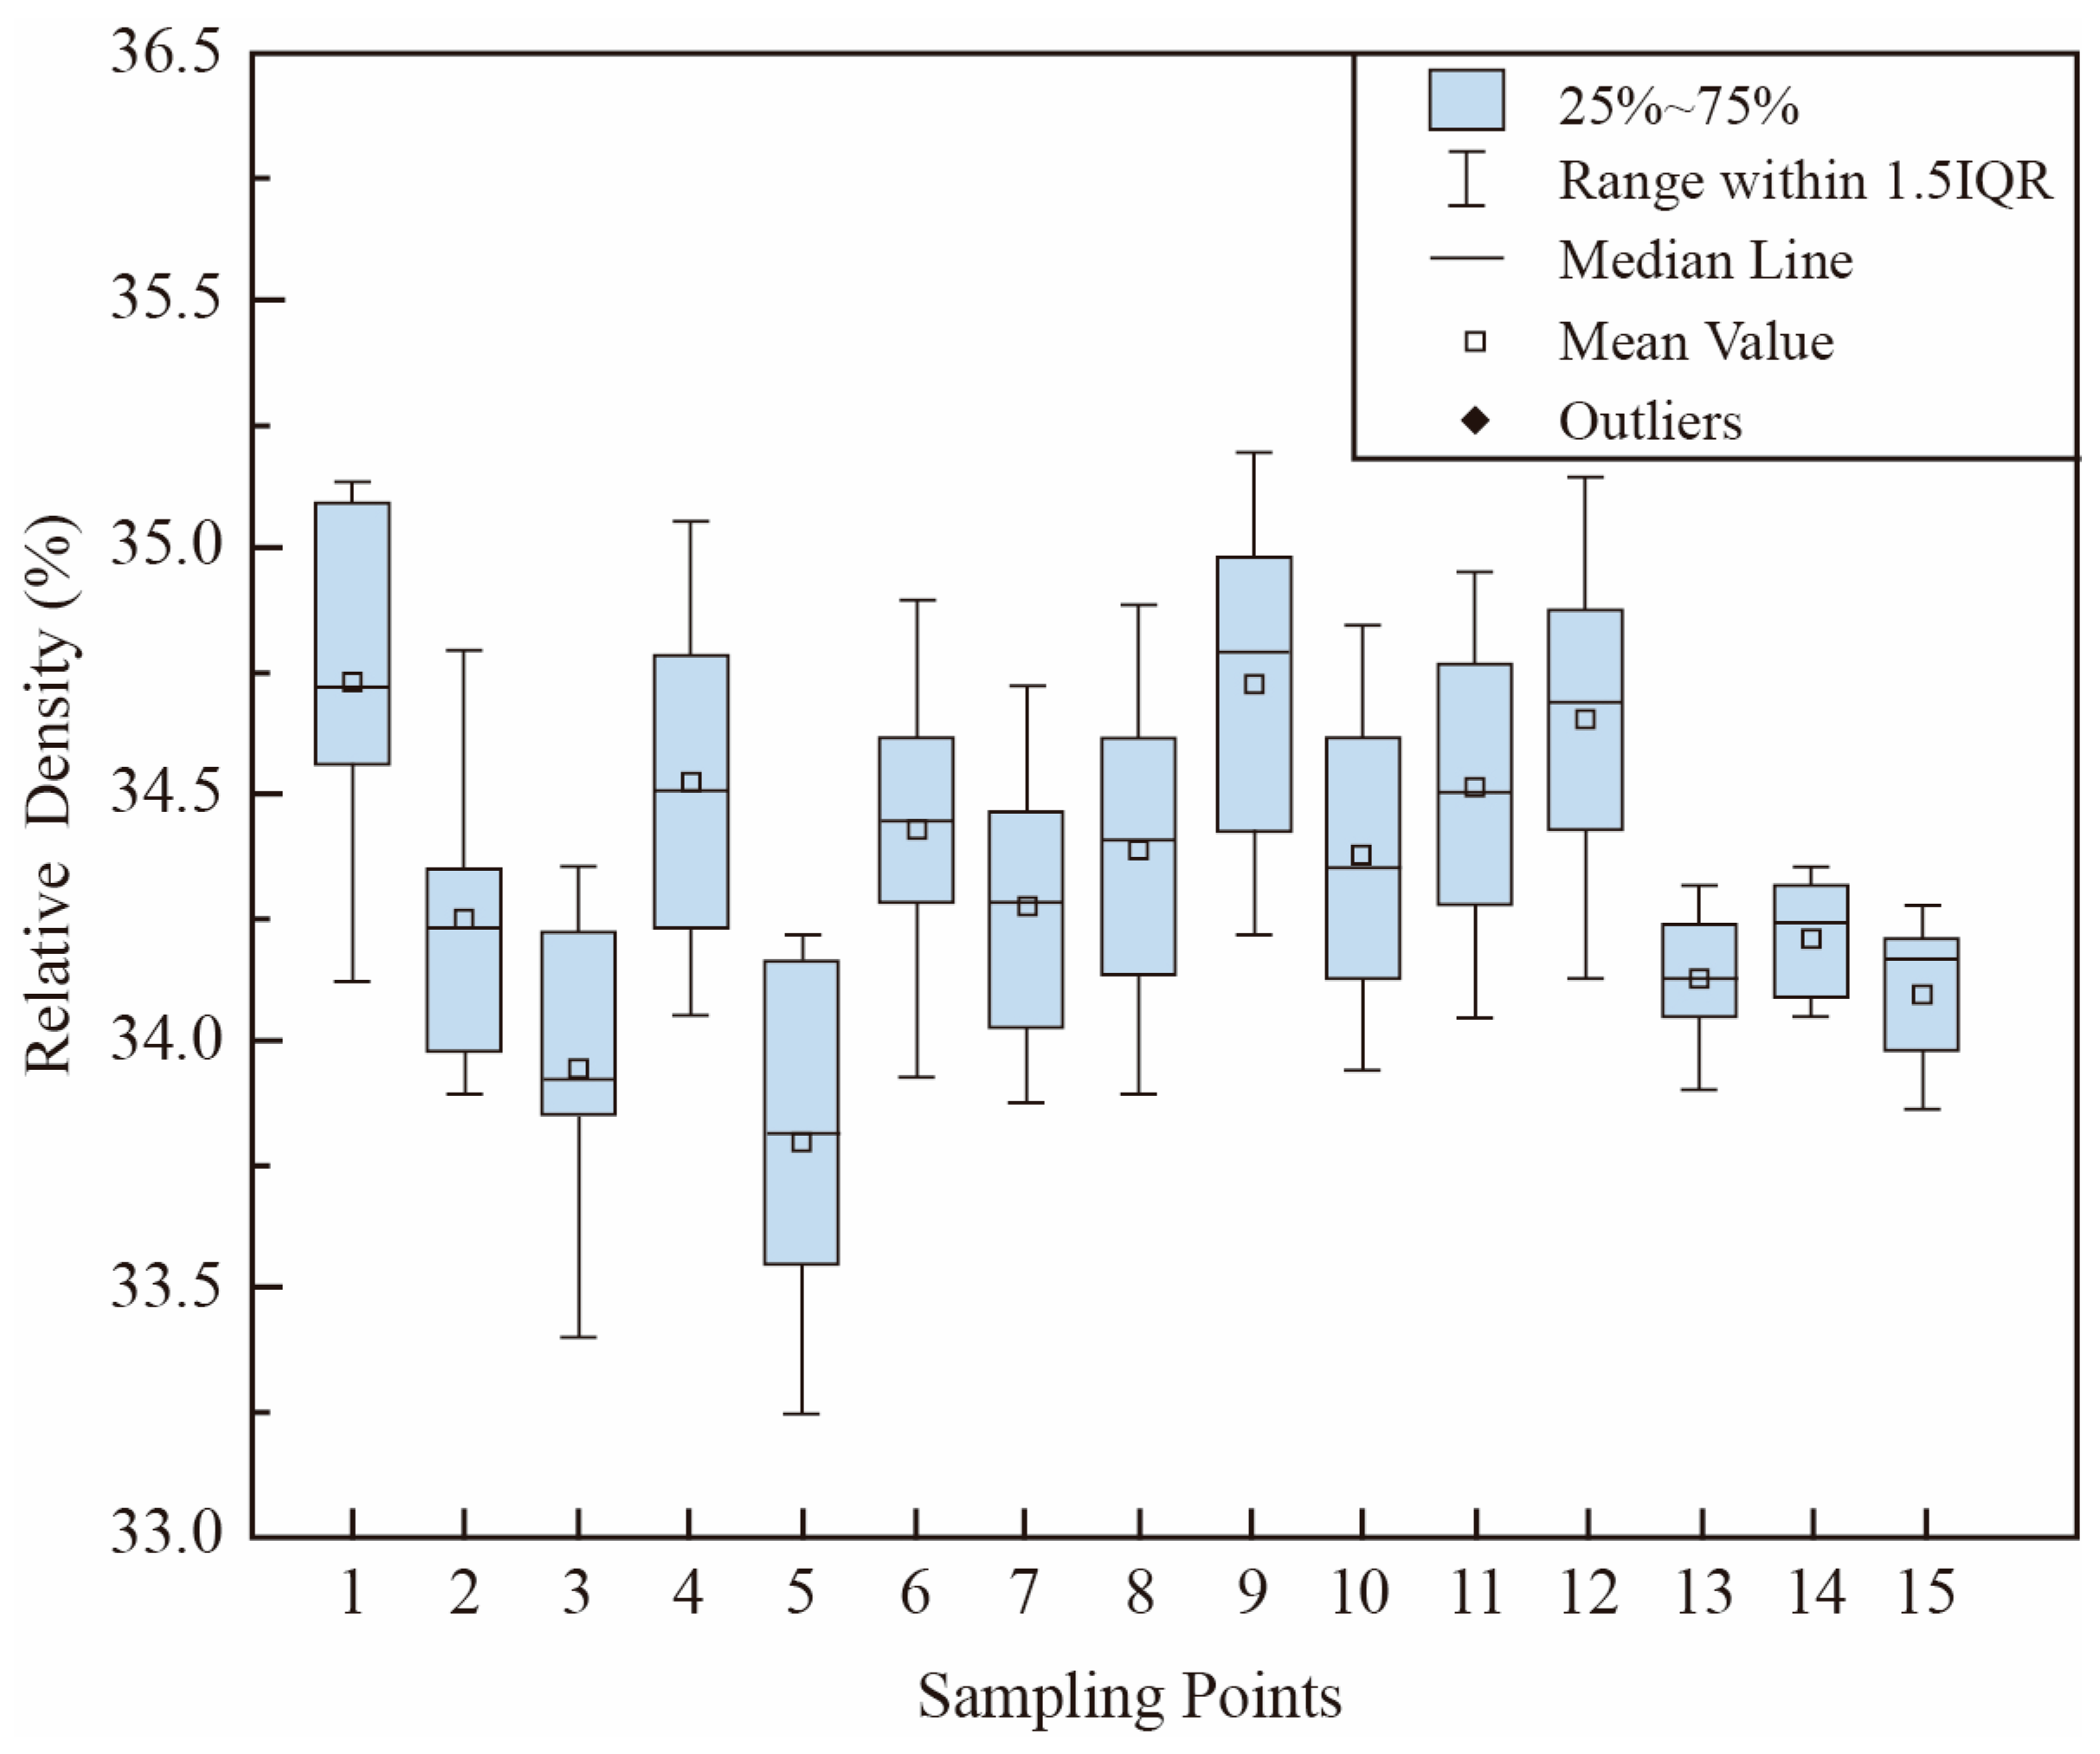
First, suitable fixed values were chosen for each variable. After removing extreme values, the mean of each single factor was selected as the fixed value: moisture content ω= 0.08, particle size distribution parameters Cu = 3.62, Cc = 0.83, relative density Dr = 0.52, and friction angle φ = 33°. These values reasonably represent typical moisture content, particle distribution, density, and soil mechanical properties of the tested sand. Subsequently, a variation range was selected for each single factor: moisture content ω from 0.04 to 0.12, uniformity coefficient Cu from 3.62 to 6.3, coefficient of curvature Cc from 0.83 to 1.44, and internal friction angle φ from 15° to 40°. The relationship between moisture content and subgrade bearing capacity is initially positive, then negative. In the range of 4% to 7% moisture content, each 1% increase in moisture content increases bearing capacity by 12.5 kPa. In the range of 7% to 12% moisture content, each 1% increase in moisture content decreases bearing capacity by 17.5 kPa. Relative density is positively correlated with subgrade bearing capacity. In the range of 0.4 to 0.65 relative density, each 1% increase in relative density increases bearing capacity by 2.8 kPa. The uniformity coefficient is positively correlated with subgrade bearing capacity. In the range of 3.62 to 6.3 for Cu, each unit increase in Cu increases bearing capacity by 21.43 kPa. The coefficient of curvature is positively correlated with subgrade bearing capacity. In the range of 0.5 to 2.5 for Cc, each 0.1 increase in Cc increases bearing capacity by 9.6 kPa.
To verify the applicability of the proposed semi-empirical bearing capacity model, the predicted bearing capacities were compared with the results obtained from the static plate load tests. The validation data were taken from the 52 groups of laboratory tests conducted in this study, including different moisture contents, particle size distributions, and relative densities. These test groups covered the main parameter ranges of the Quanzhou coastal beach sand and were therefore suitable for evaluating the predictive performance of the model.
The relative error between the predicted value and the measured value was calculated as follows:
where
δi is the relative error of the
i-th test,
fu,pred,i is the predicted ultimate bearing capacity, and
fu,test,i is the ultimate bearing capacity obtained from the static plate load test. The average relative error was calculated as follows:
where
n is the number of validation tests.
The validation results show that the predicted values were generally close to the measured values. The average relative error of the proposed semi-empirical model was 10.35%. Most prediction errors were within an acceptable range for geotechnical engineering applications. The scatter distribution of the predicted and measured bearing capacities also showed that the data points were mainly distributed near the 1:1 line, indicating that the model can reasonably reflect the bearing capacity variation of coastal beach sand under different physical states.
Compared with the traditional bearing capacity formula, the proposed model showed better applicability to the tested coastal beach sand. The traditional Prandtl–Reissner formula mainly depends on the internal friction angle and unit weight. However, it does not directly include the effects of moisture content, particle size distribution, and relative density. For coastal beach sand, these parameters strongly affect interparticle contact, capillary action, effective stress, and particle interlocking. Therefore, the direct use of the traditional formula may lead to large deviations when the physical state of the sand changes significantly. In contrast, the proposed model introduces easily measurable physical parameters into the prediction of the internal friction angle and then combines them with the theoretical bearing capacity equation. This improves both the physical interpretability and engineering practicality of the model.
The model validation also indicates that relative density has the most stable influence on the prediction results, whereas moisture content introduces greater variability because of the threshold effect associated with capillary water and free pore water. The prediction accuracy is relatively high when the moisture content is close to the optimal range. When the moisture content is too high, the weakening effect of pore water becomes more significant, and the prediction error may increase. Therefore, moisture content should be carefully measured in field applications.
It should be noted that the proposed model was established and validated using coastal beach sand samples from Quanzhou Bay. The model is applicable to sandy soils with similar particle composition, gradation characteristics, density range, and moisture content conditions. For other coastal areas with different mineral composition, shell fragment content, salinity, or depositional environment, further calibration using local test data is recommended. In addition, the present validation was mainly based on laboratory static plate load tests. Future work should include in situ plate load tests and long-term field monitoring data to further verify the model under real coastal environmental conditions.




 ,
,