Article

A Parametric Analysis of Bi-Cable Three-Tower Suspension Bridge

1
China Construction Infrastructure Co., Ltd., Beijing 100029, China
2
Jiangxi Communications Design and Research Institute Co., Ltd., Nanchang 330000, China
3
Department of Bridge Engineering, College of Civil Engineering, Tongji University, No. 1239 Siping Road, Shanghai 200092, China
*
Author to whom correspondence should be addressed.
Buildings 2026, 16(11), 2092; https://doi.org/10.3390/buildings16112092
Submission received: 21 April 2026 / Revised: 18 May 2026 / Accepted: 21 May 2026 / Published: 24 May 2026

Abstract

The bi-cable system enhances the vertical stiffness of the middle pylon, enabling the use of a traditional pylon in multi-pylon suspension bridges. However, research on multi-pylon suspension bridges utilizing a bi-cable system remains in its early stages, with parameter analysis still being limited. The benefits of bi-cable systems in long-span three-tower suspension bridge configurations remain unclear. This paper presents an analysis of three-tower suspension bridges with spans ranging from 1500 to 2500 m, using a simplified calculation method for a bi-cable system and incorporating the elastic deformation of hangers. The effects of the top cable load distribution factor, tower stiffness, sag-to-span ratio, and side-to-main span ratio on static performance are examined, and reasonable value ranges for each parameter are proposed.

1. Introduction

The middle tower of a three-tower suspension bridge lacks effective longitudinal constraints at the tower top, resulting in insufficient overall vertical stiffness. When a rigid central tower is adopted to enhance stiffness, it becomes difficult to simultaneously satisfy the anti-sliding stability requirements between the main cable and the saddle at the tower top. Therefore, a critical mechanical issue in multi-tower suspension bridge systems is to achieve a balance between improving global vertical stiffness and ensuring cable–saddle anti-sliding stability.
The bi-cable system has been proposed as a promising solution to improve the vertical stiffness of the middle tower in multi-tower suspension bridges. Jennings [1] investigated the force characteristics of different main cable configurations in both two-tower and multi-tower suspension bridges and demonstrated that the bi-cable system can effectively enhance the overall structural stiffness.
In terms of theoretical analyses for three-tower suspension bridges, early foundational research was conducted by Sato [2], Hayashikawa [3], and Jennings [4], who analyzed multi-tower suspension bridge systems based on deflection theory. Choi [5] introduced a nonlinear static analysis method for multi-span suspension bridges by simplifying main cables and stiffening girders into an equivalent beam system, thereby calculating the deformation and internal forces of the bridge. Thai [6] and Choi [7] proposed simplified analytical methods for the initial equilibrium states of three-tower suspension bridges, calculating the initial geometry and longitudinal tension constraints of the main cables. Zhang [8] developed an analytical approach for determining the anti-sliding coefficient of main cables applicable to multi-tower suspension bridges by investigating the frictional mechanisms between the cables and saddles. Choi [9] and Song [10] employed equivalent spring models to simplify the analytical procedures of multi-tower suspension bridges based on various theoretical frameworks. Chai [11] proposed two formulas to calculate the longitudinal restraint forces of double-cable systems as well as the load distribution between cables, and discussed the impact of these longitudinal forces on bridge towers. Jia [12] established a simplified static characteristic calculation approach and derived explicit formulas for the main cable forces, deflection of rigid girders, anti-slip safety factors at tower foundations, and tower bending moments for three-tower suspension bridges. Jia [13], utilizing the gravity stiffness method based on deflection theory, derived static characteristic formulas for three-tower suspension bridges with double-cable systems under both live load and dead load conditions. Chen [14] proposed a method based on deflection theory combined with the “substitute beam” approach to calculate internal forces and deformation responses of three-tower suspension bridges under live load conditions. In addition, relevant studies on long-span suspension bridge shape finding and bridge analysis/optimization methods [15,16,17] provide useful references for structural analysis and preliminary design.
In the parametric analysis of the mechanical performance of multi-tower suspension bridges, researchers have conducted studies based on various multi-tower bridge models. Related studies on parameter sensitivity and stiffness-based structural analysis in bridge engineering [18,19] also provide useful references for understanding structural response characteristics. The parameters involved in these analyses are presented in Table 1.
In terms of engineering examples, due to the complexity of the spatial main cable profile, the construction of the main cables presents significant challenges. Currently, in engineering practice, it is primarily applied to self-anchored suspension bridges with relatively small spans [29,30].
In summary, although the bi-cable system shows potential for improving the performance of three-tower suspension bridges, it is still at an early stage of development. Existing parametric studies primarily address general parameters common to conventional multi-tower suspension bridges, while systematic investigations on key parameters specific to bi-cable systems remain limited. To address this gap, this study focuses on three-tower suspension bridges with spans ranging from 1500 m to 2500 m. Based on theoretical formulations and computational analysis, the effects of key design parameters on structural performance are systematically investigated, and recommended parameter ranges are proposed to provide design-oriented insights into the application of bi-cable systems.

2. Model

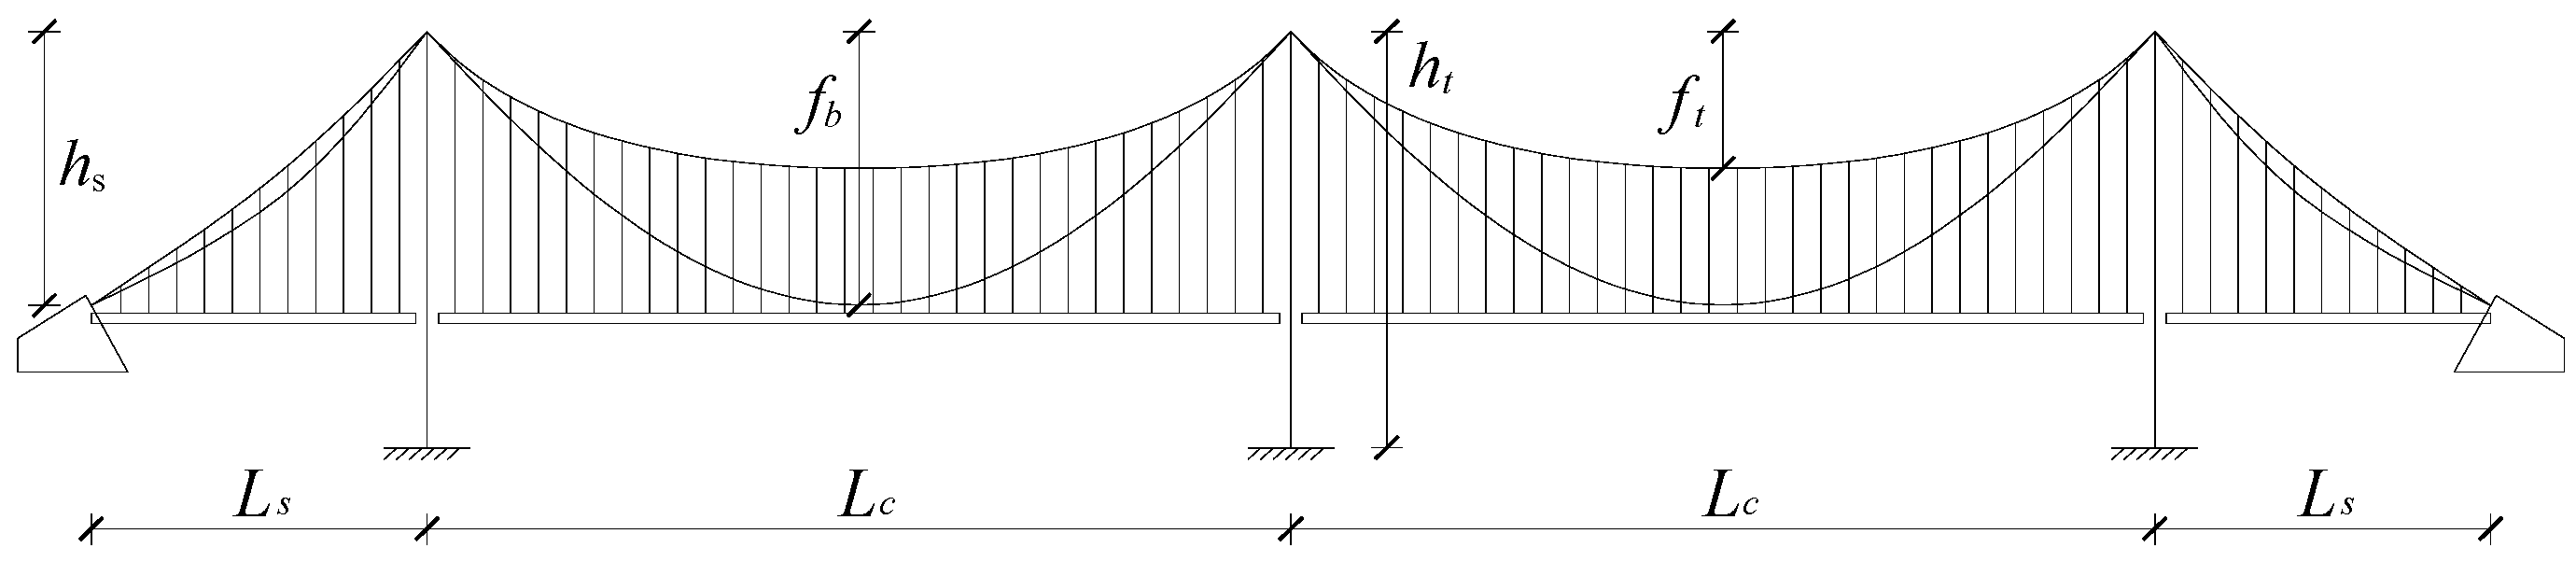
This paper will perform a parametric analysis based on the approximate static calculation method proposed by Jia [21], which considers the elastic deformation of hangers in bi-cable three-tower suspension bridges. In this study, a three-tower four-span planar analytical model is adopted. For convenience of derivation, the two main spans are assumed to be equal in length, and the side tower and middle tower are assumed to be equal in height. The analysis is based on the gravity stiffness method derived from deflection theory. Since the axial stiffness of the main cables is much greater than the bending stiffness of the stiffening girder, the bending stiffness of the stiffening girder is neglected in the approximate calculation, and the loads are assumed to be carried by the cable system. The stiffening girder is simplified as a simply supported girder in each span, and the elastic elongation of the hanger between the top and bottom cables in the main span is taken into account in the analytical procedure. A three-tower four-span suspension bridge is adopted as the fundamental structural model, and the general layout of this analytical model is illustrated in Figure 1, where Ls and Lc denote the side span and main span lengths, respectively, fb and ft denote the sags of the bottom and top cables in the main span, respectively, and hs and ht denote the corresponding vertical geometric parameters of the bridge layout shown in the figure. The primary parameters of the baseline structural model are defined as follows:
Vertical layout: the sag-to-span ratios for the top and bottom cables are set at 1 / 20 and 1 / 8 , respectively. The hanger spacing is 16 m, and the side-to-main span ratio is 0.3 . Vertical curvature of the bridge deck is not considered, and the bottom elevations of the stiffening girders remain constant across all spans. The heights of the central and side towers are identical, with the vertical distance from the top surface of the tower foundation to the bottom of the stiffening girder being 80 m. The vertical distance between the bottom of the stiffening girder and the centerline of the main cable at mid-span is 8 m. The girder depth is set to 3.5   m for the 1500 m main-span scheme, and 4.0   m for the 2000   m and 2500   m main-span schemes.
Support conditions for the stiffening girder (main girder): all spans are configured as simply supported girders.
Strength specifications for main cables and hangers: the allowable tensile stress for main cable wires is σ   =   1860   M P a , with a stress safety factor of 2.3 . The elastic modulus of the main cables is taken as 2.0 × 10 5   M P a . The hangers consist of pin-connected prefabricated parallel-wire strands, with an allowable tensile stress of σ = 1770   M P a , a stress safety factor of 3.0 , and an elastic modulus of 1.95 × 10 5   M P a .
Load intensities: with pedestrian loads temporarily excluded, the cross-section is configured for two-way eight-lane traffic, resulting in a uniformly distributed live load ( q l ) of 39   k N / m . In the present study, the live load is represented as a uniformly distributed line load acting in the bridge longitudinal direction. Secondary permanent loads (including deck pavement, railings, and other ancillary facilities) are assumed as 70   k N / m . The self-weight intensity of the stiffening girder is taken as 150   k N / m .

3. Parametric Analysis

3.1. Influence of the Dead Load Distribution Factor of the Top Cable

The basic structure depicted in Figure 1 is adopted as the object of analysis, with both side and middle towers having longitudinal stiffness values of 3   M N / m . The deck dead load qb, including the self-weight of the stiffening girder and the secondary dead load, is carried by the top and bottom cables. The top cable carries αqb, while the bottom cable carries (1 − α)qb. Thus, the dead load distribution factor of the top cable, α, is defined as α = qb,t/qb, where qb,t is the portion of deck dead load carried by the top cable. The live load distribution factor is defined as the proportion of live load effect carried by each cable under the specified loading condition.
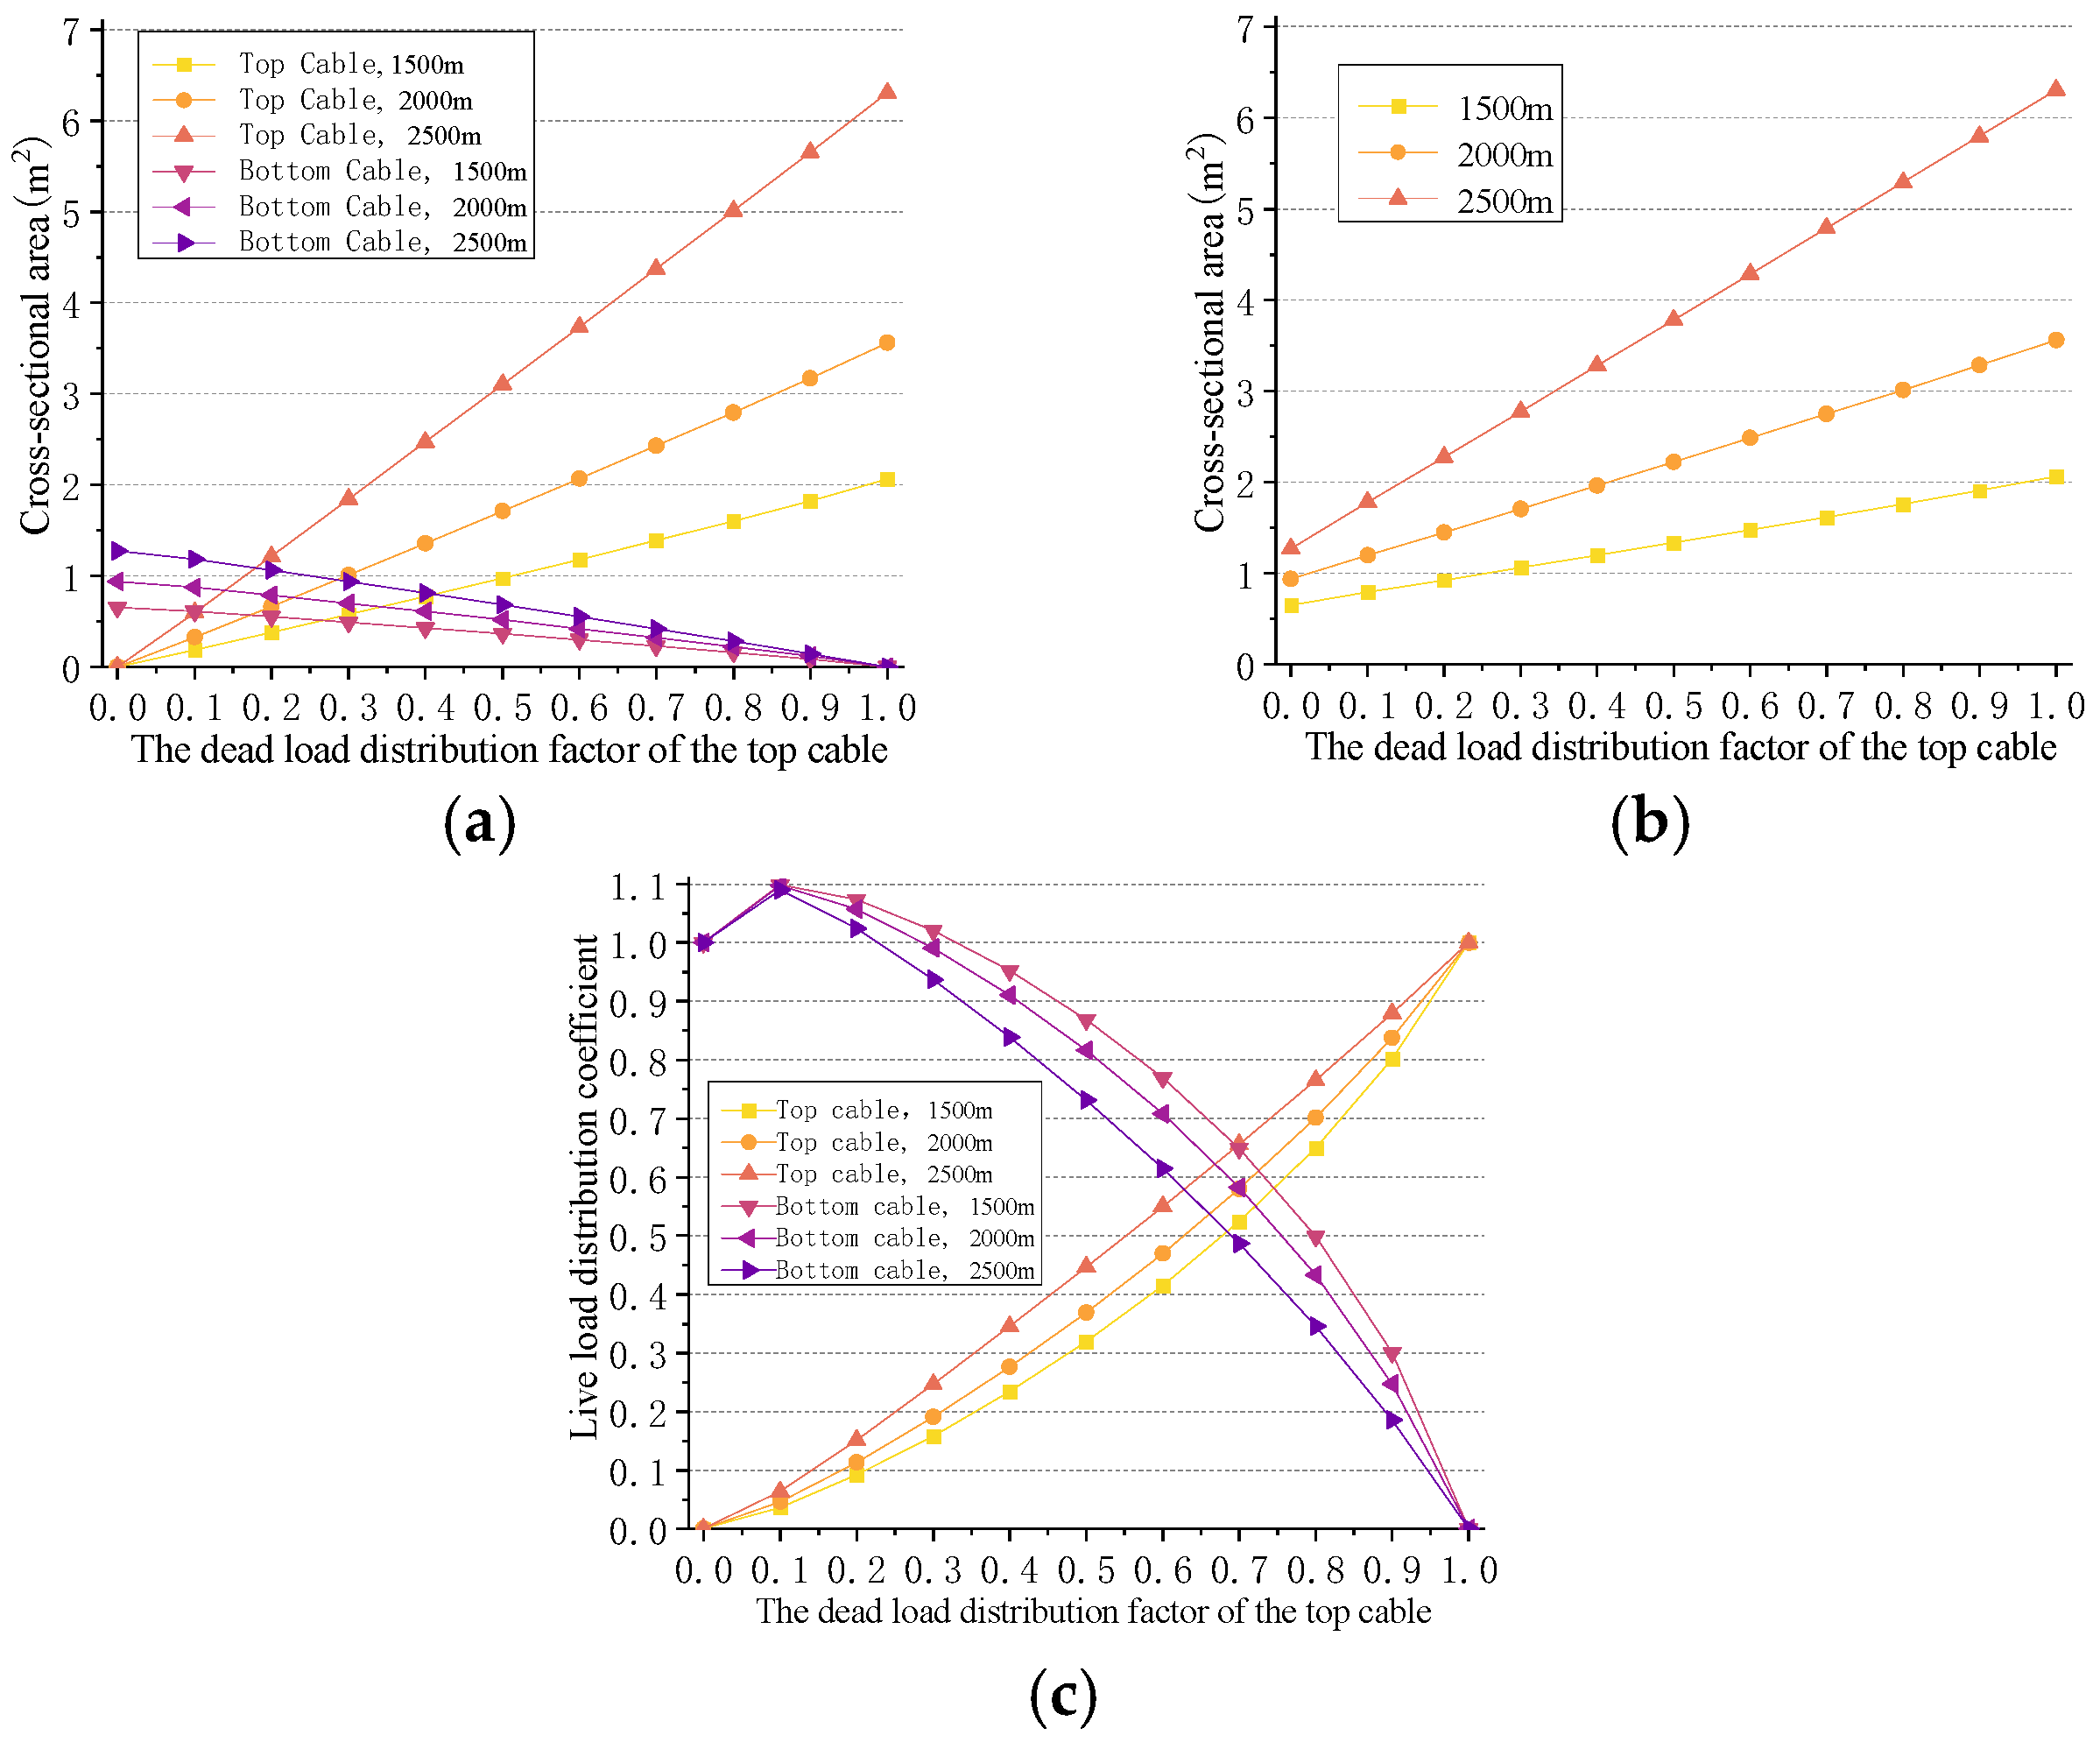
The relationship between the dead load distribution factor of the top cable α and the corresponding top and bottom cable cross-sectional areas, as well as their live load distribution factors, is illustrated in Figure 2. Specifically, when α = 0, the cross-sectional area of the top cable becomes zero, causing the structure to degenerate into a single-cable system with only the bottom cable. Conversely, when α   =   1 , the cross-sectional area of the bottom cable becomes zero, resulting in the structure degenerating into a single-cable system with only the top cable.
As shown in Figure 2, with the increase in the dead load distribution factor of the top cable α, the increase in the top cable cross-sectional area is much larger than the decrease in the bottom cable area. As a result, the total cross-sectional area of both the top and bottom cables increases linearly. Furthermore, the rate of change in cross-sectional area is greater as the main span length increases. The live load distribution factor for the top cable also increases with the rise in α, while the live load distribution factor for the bottom cable decreases. When α is fixed, the ratio of the areas of the top and bottom cables increases with the increase in the main span length, leading to a greater proportion of the live load being carried by the top cable.
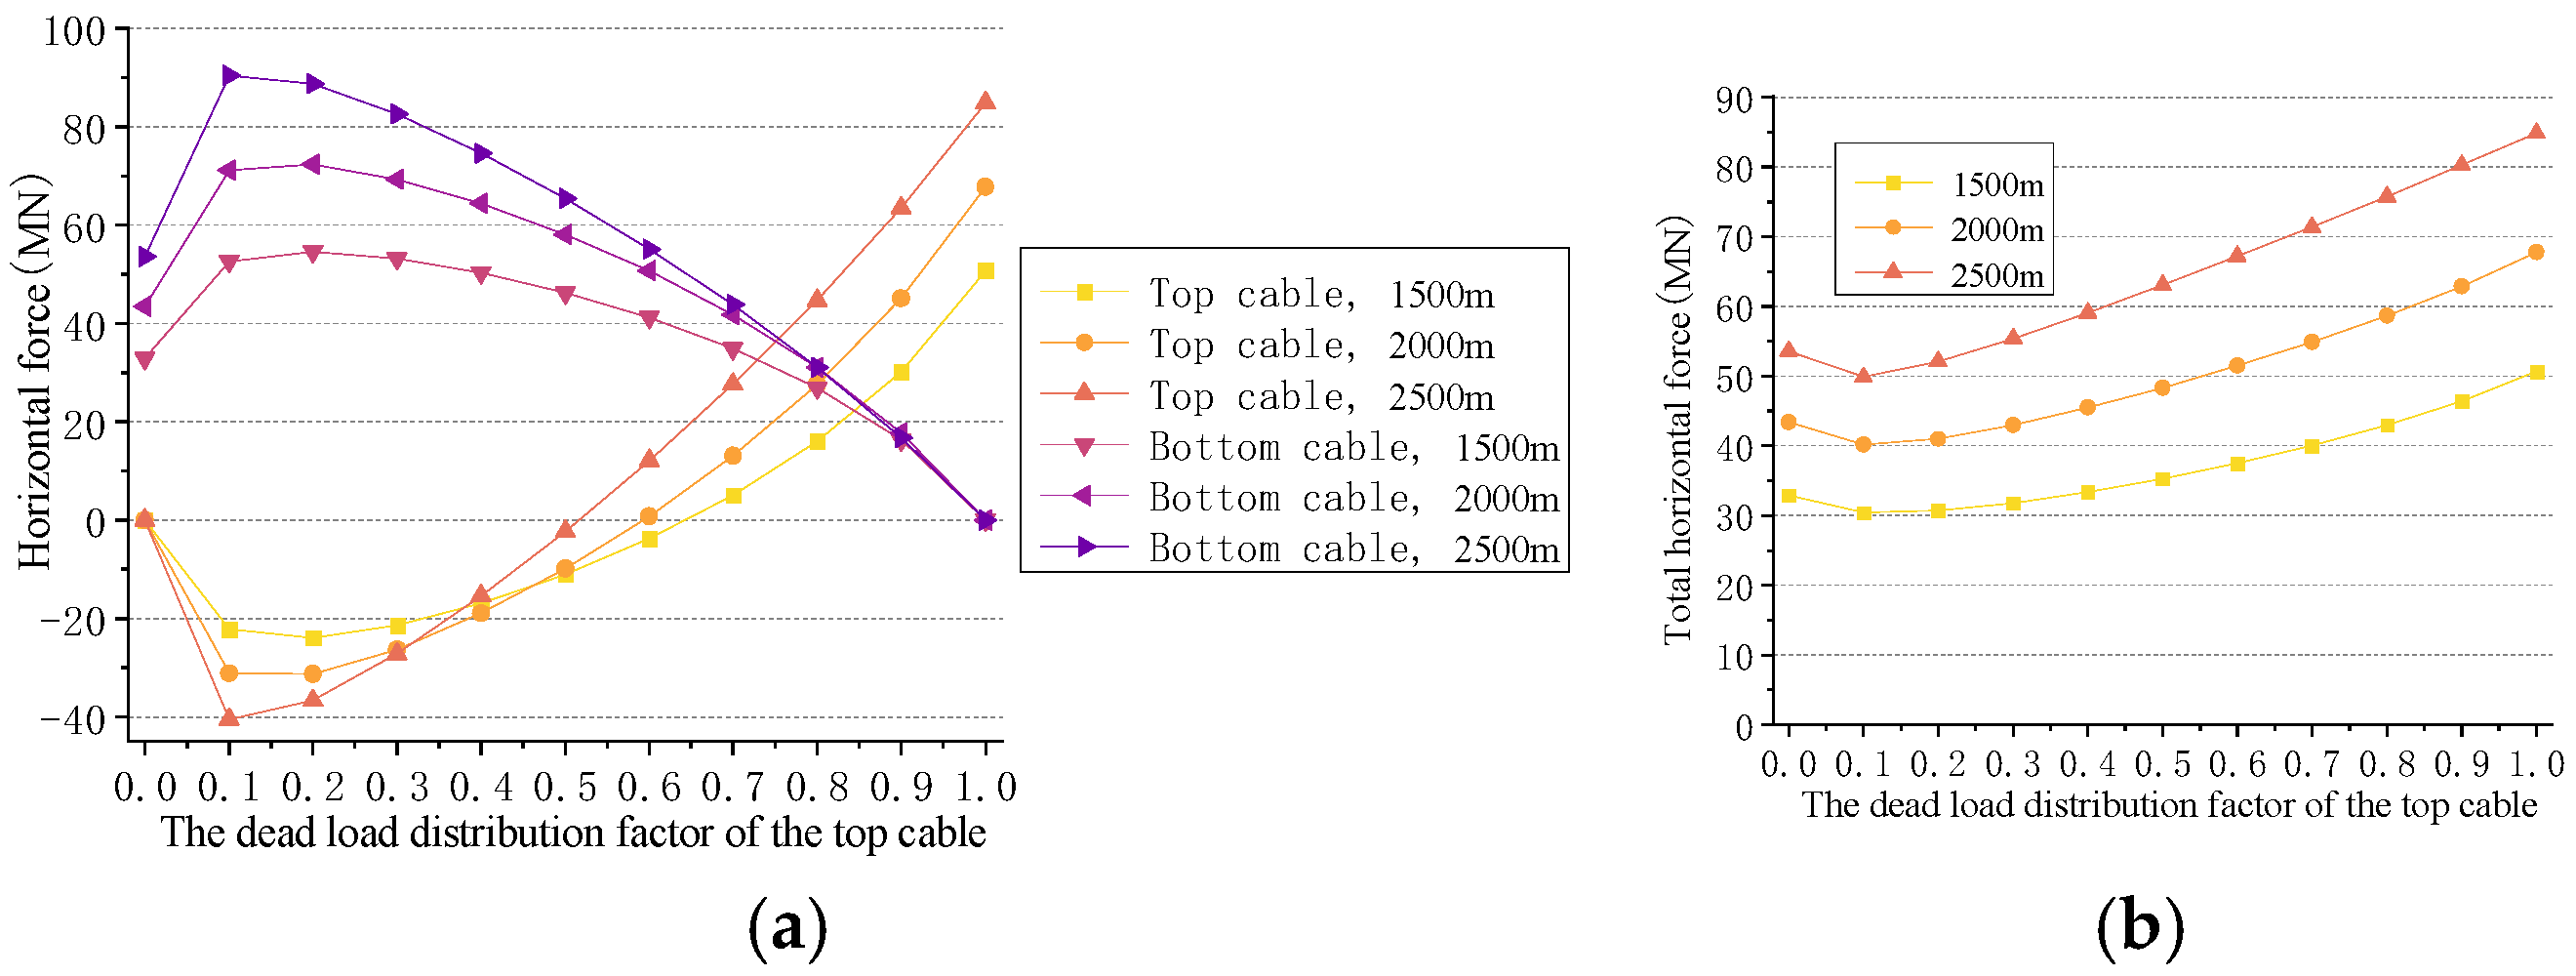
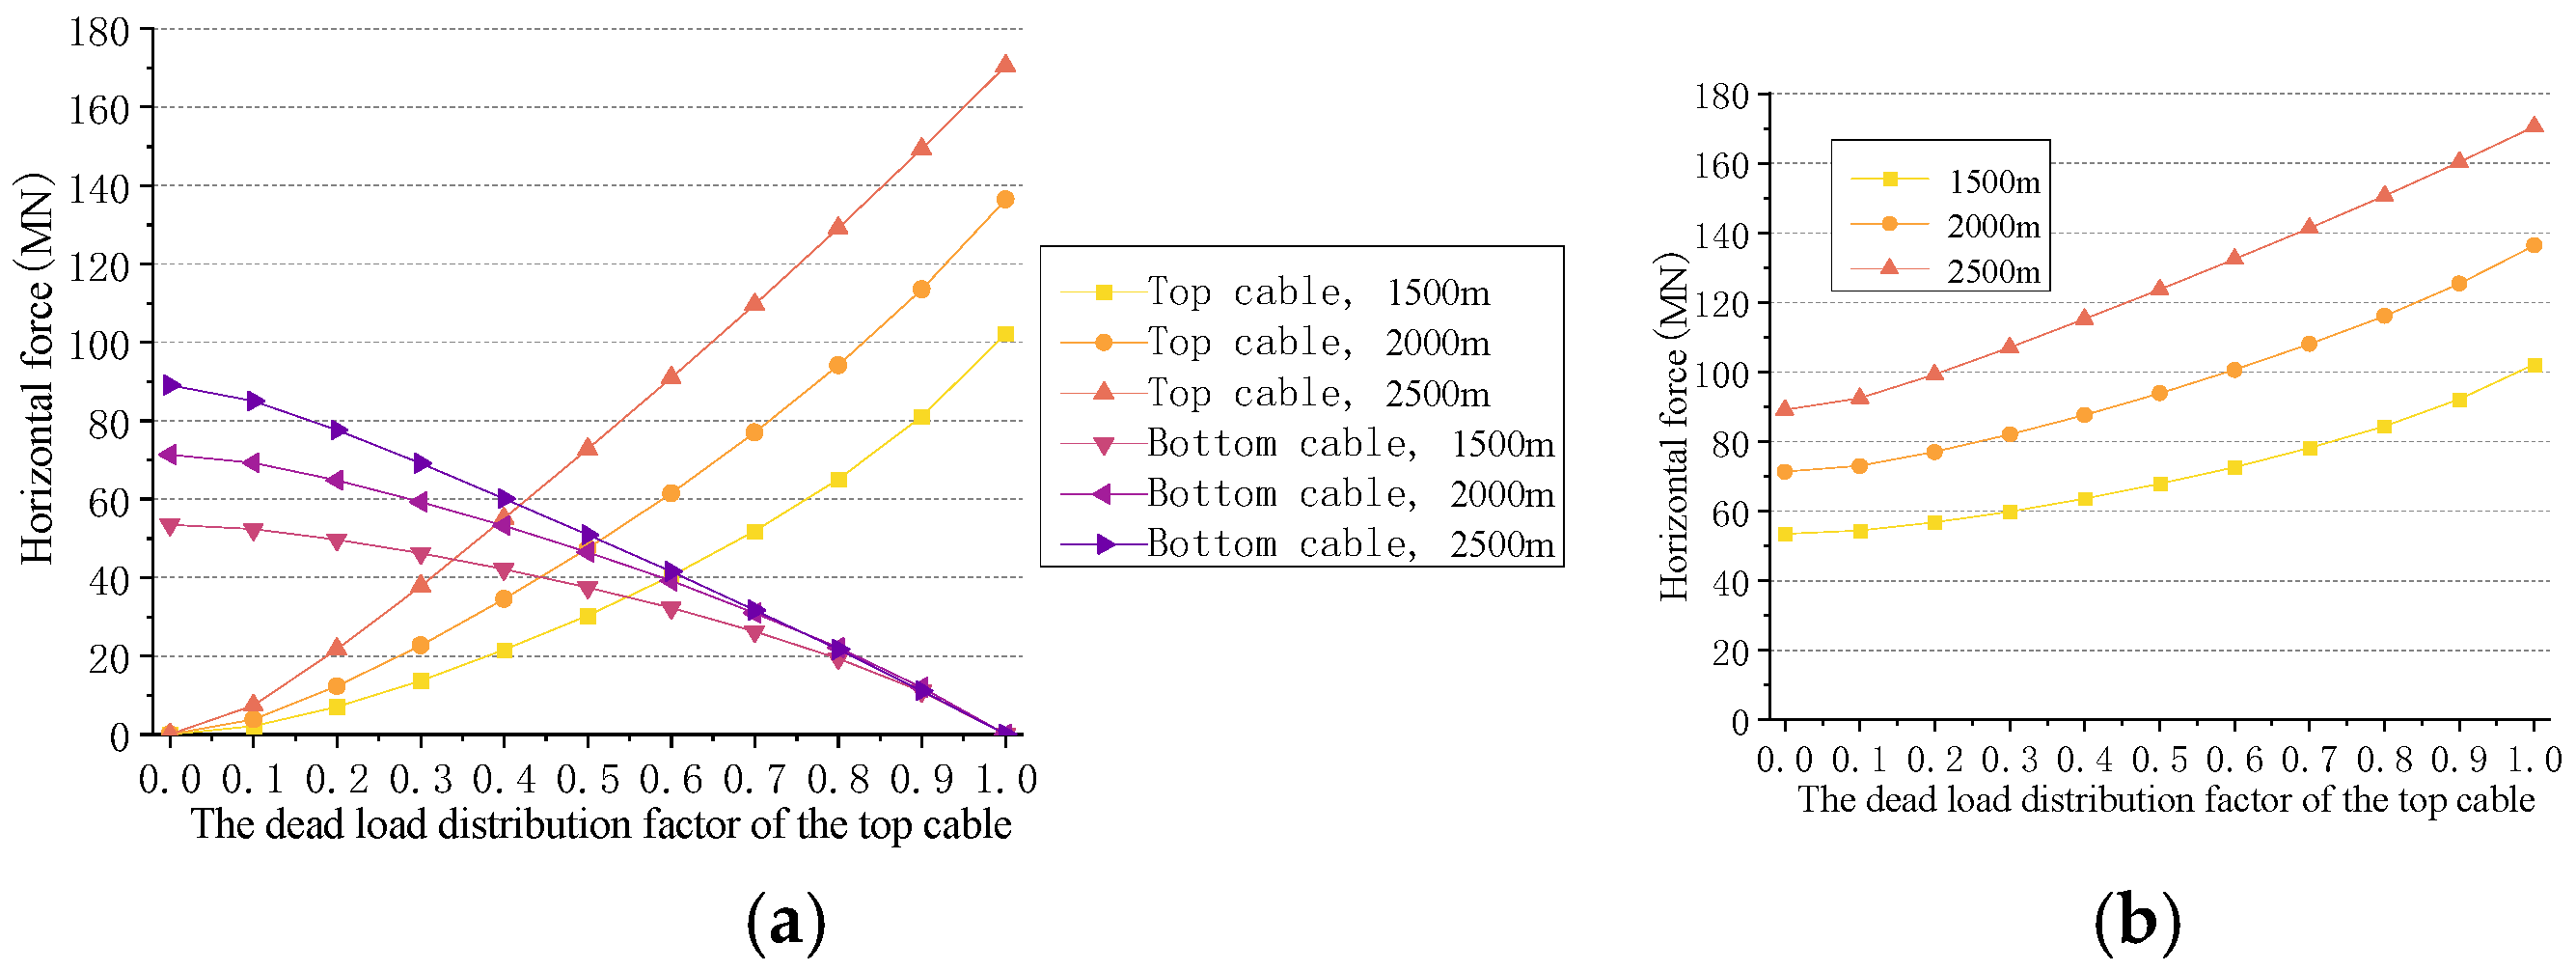
The live load horizontal forces of the main cables in the main span under different operating conditions are shown in Figure 3 and Figure 4. As α increases, the live load horizontal force in the bottom cable decreases gradually in both conditions, while the live load horizontal force in the top cable, as well as the total horizontal force, increases progressively. In the case of single main-span loading, when α is small, the top cable’s cross-sectional area and its live load distribution factor are also small. After displacement occurs at the top of the central tower, the top cable undergoes an unloading phenomenon. This is because, under single main-span loading, the non-loaded span and the towers provide longitudinal restraint to the loaded span, leading to force redistribution after the middle tower top displaces. When α is small, the top cable carries only a limited proportion of the live load; therefore, the reduction in horizontal force caused by the tower top displacement may exceed the direct live load contribution in the top cable, causing its live load horizontal force increment to become negative. When α increases to between 0.5 and 0.6, the live load horizontal force in the top cable begins to become positive.
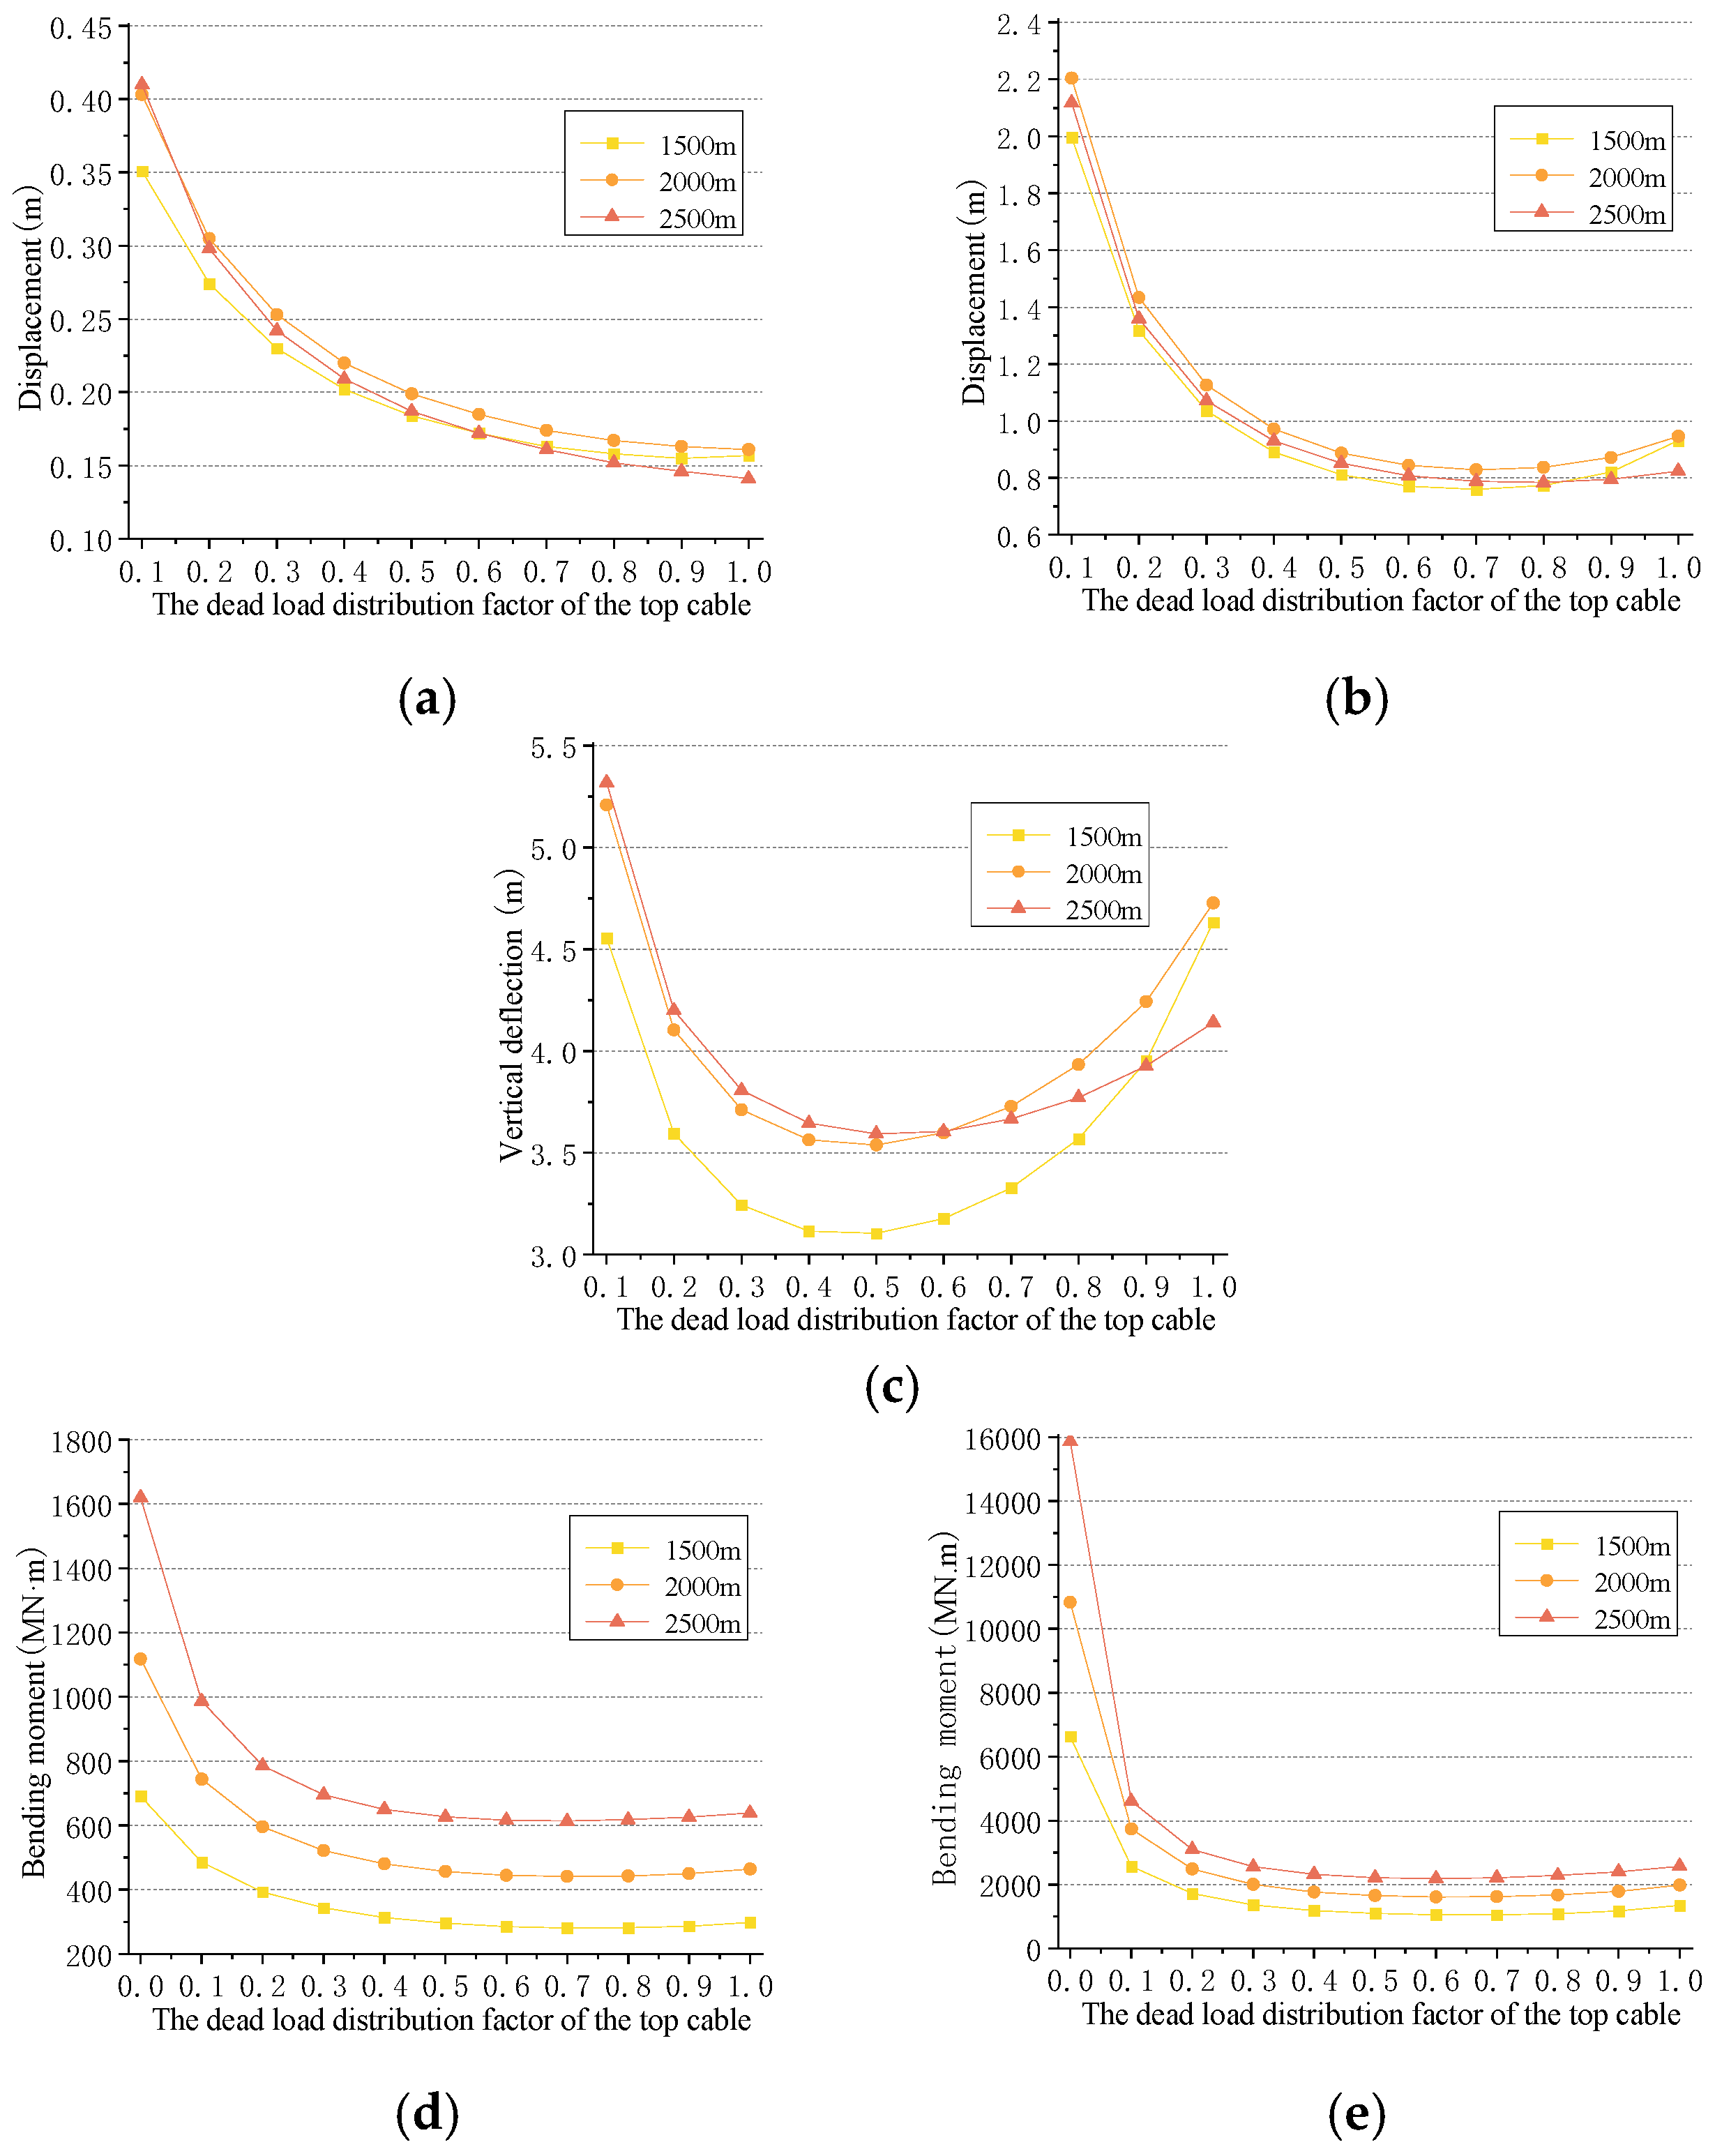
The forces on the tower and the vertical deflection at the mid-span of the stiffening girder under live load are shown in Figure 5. Due to the small longitudinal stiffness of the central tower, when α = 0 , both the tower top displacement and the vertical deflection of the stiffening girder are quite large; therefore, these results are not presented here.
From Figure 5, the following observations can be made:
1. As α increases, the cross-sectional area of the side span top cables increases, thereby strengthening their constraint on the side towers. Consequently, both the top displacement of the side towers and the bending moment at the tower base gradually decrease, and the slope of the curve also diminishes.
2. The constraint exerted by the main span top cable on the central tower increases with α, leading to a rapid reduction in both the top displacement of the central tower and the bending moment at the tower base. However, when α exceeds 0.6, the top cable begins to carry a larger proportion of the live load, causing the displacement and bending moment at the central tower top to gradually increase, though the change is minimal.
3. As α increases, the reduction in the central tower top displacement gradually increases the vertical stiffness of the structure. However, with the increasing load borne by the top cable and the small sag-to-span ratio, the elastic elongation under live load also gradually increases, leading to a decrease in vertical stiffness. The maximum vertical stiffness of the structure occurs when α is between 0.4 and 0.5.
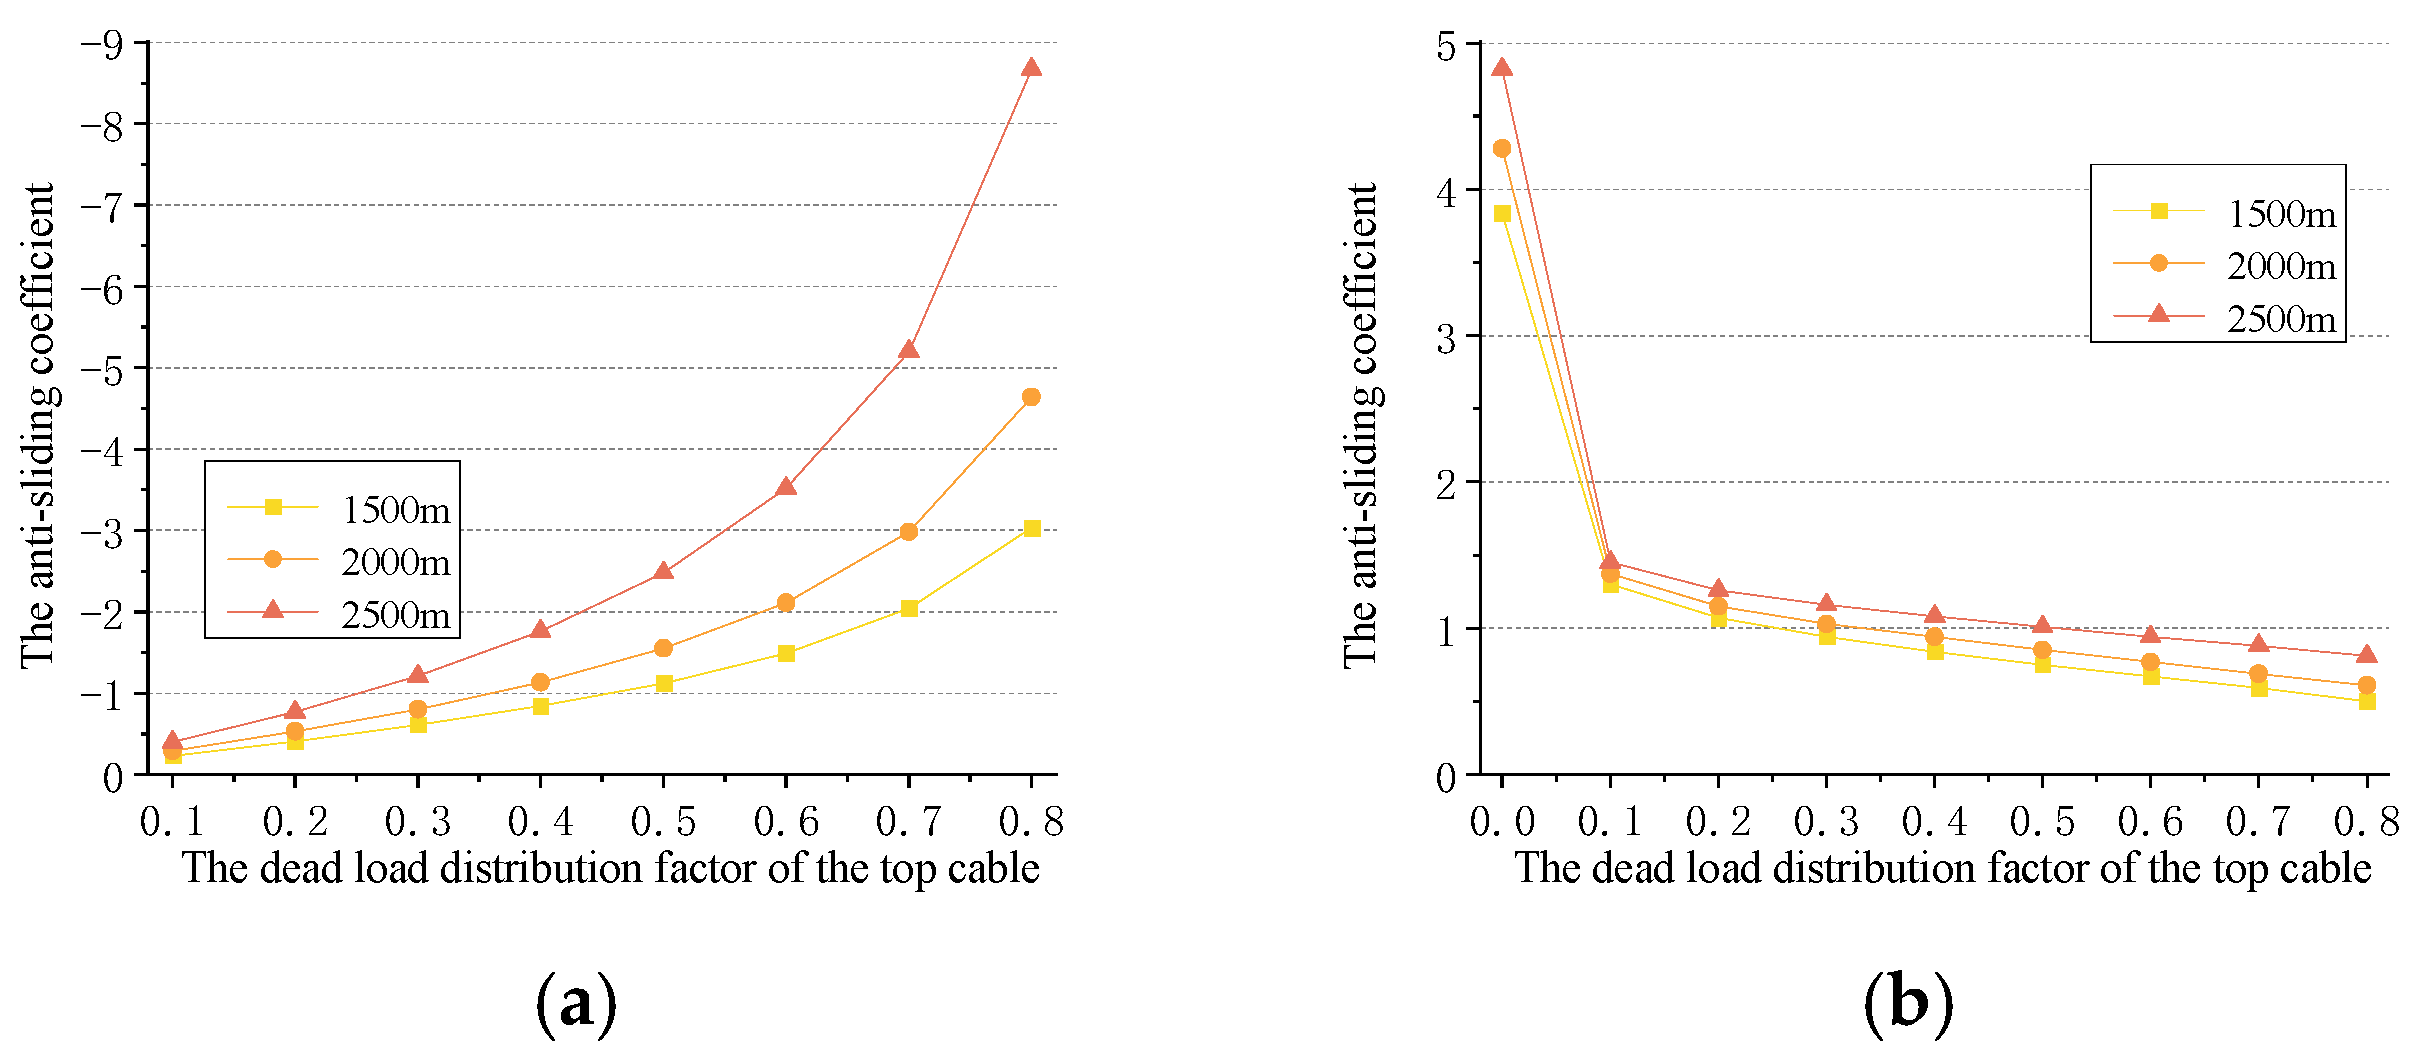
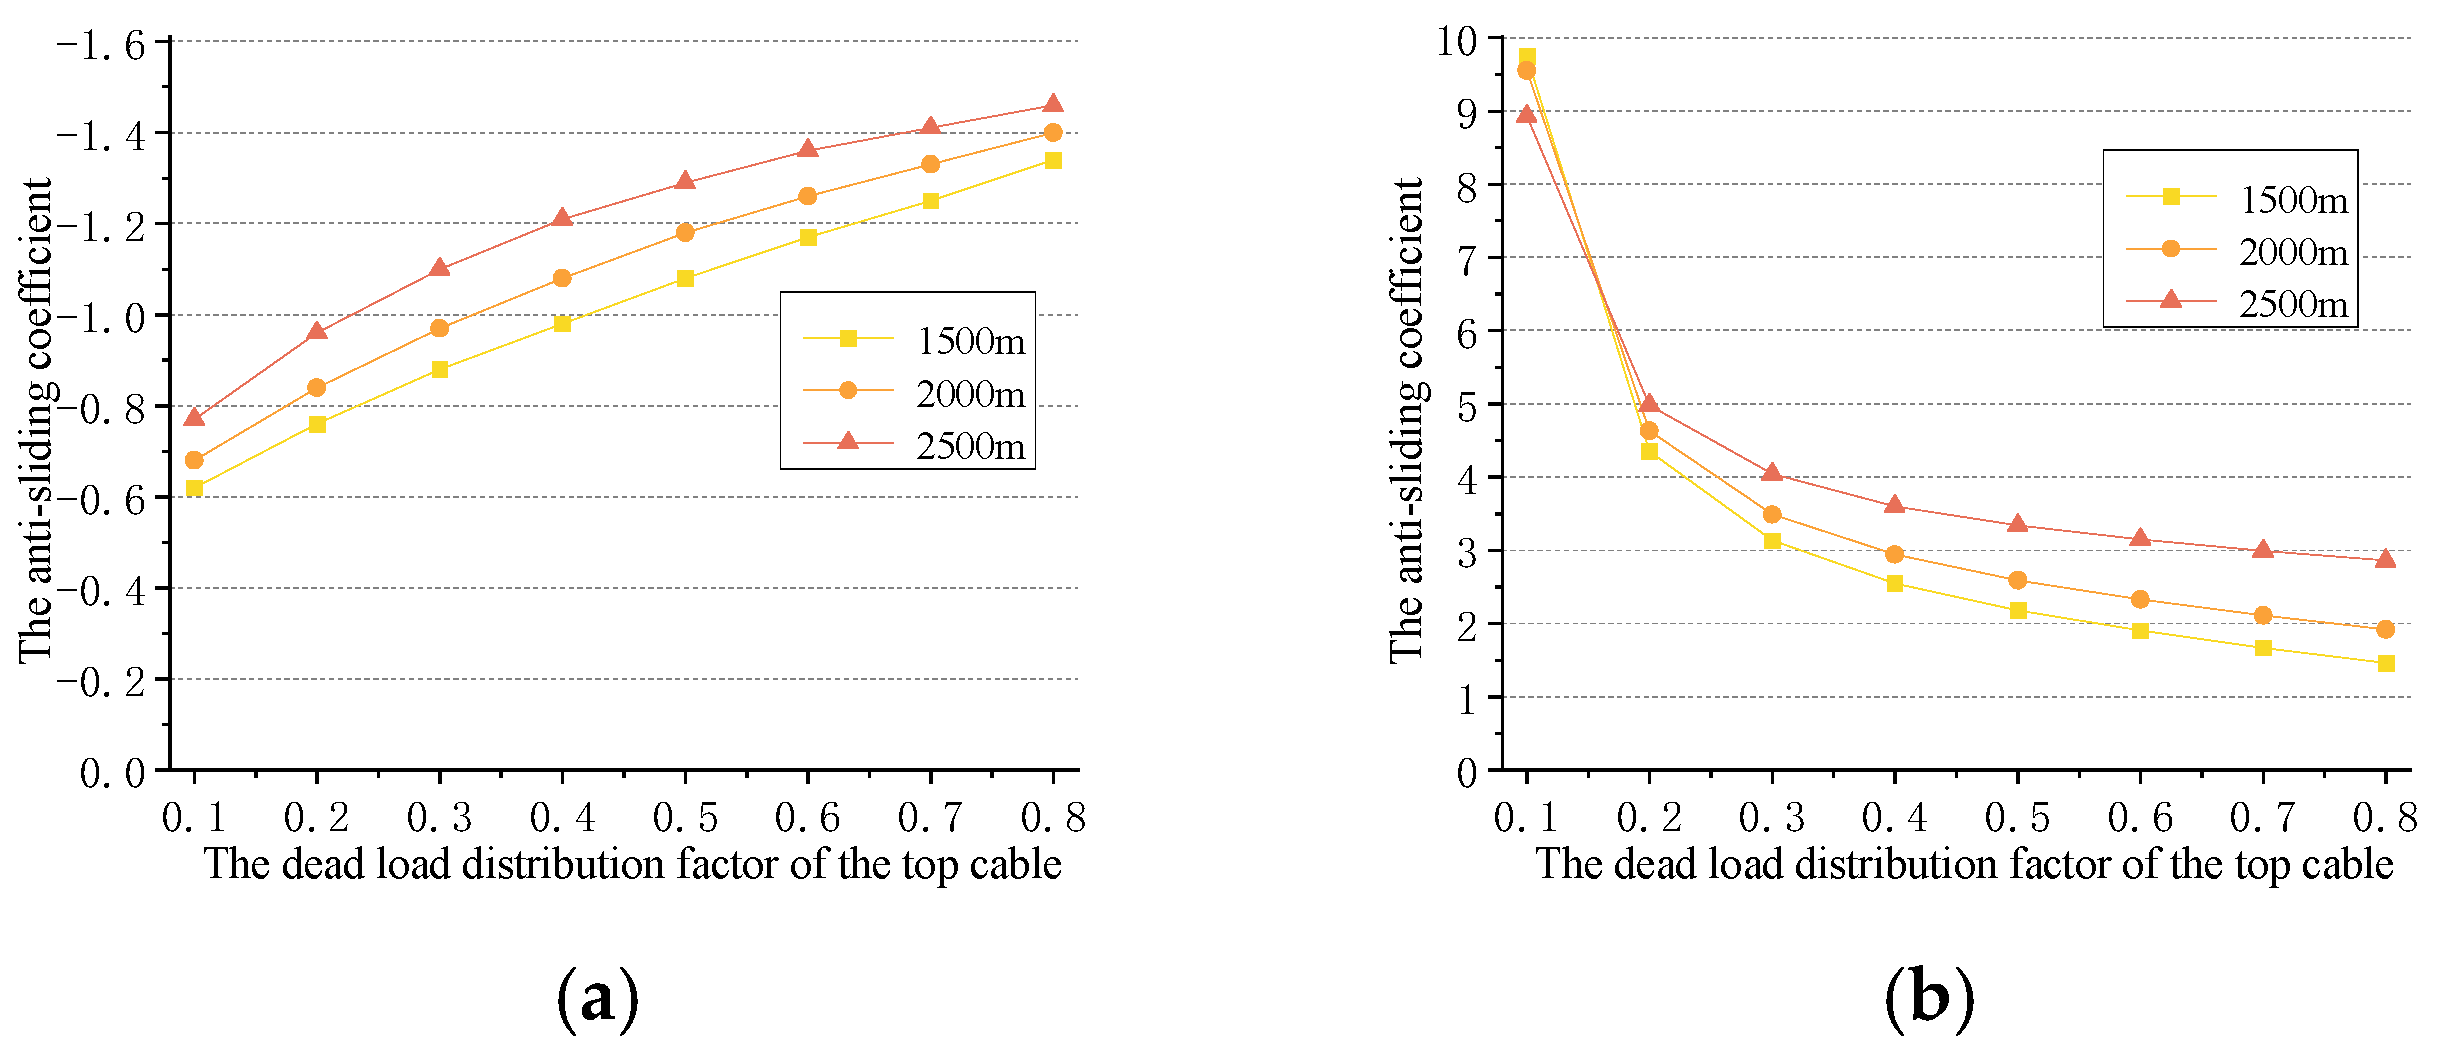
The anti-sliding coefficient between the cable and the saddle at the top of the middle tower under single main-span loading is shown in Figure 6. Here, the anti-sliding coefficient denotes the safety factor against relative slip at the cable–saddle interface. In this paper, the anti-sliding coefficient of a tower refers to the corresponding anti-sliding safety factor at the cable–saddle interface at the top of that tower.
As shown in Figure 6a, the anti-sliding coefficient of the top cable is negative, indicating that the horizontal force in the main cable on the non-loaded side of the central tower exceeds that on the loaded side. As α increases, the anti-sliding coefficient of the top cable gradually increases. The larger the main span, the greater the dead load axial force, indicating an improvement in anti-sliding performance. To meet the design requirement of an anti-sliding coefficient of no less than 2, the critical values of α for the 1500 m, 2000 m, and 2500 m main-span schemes are 0.7, 0.6, and 0.43, respectively. If a smaller α is adopted, the top cable may experience slippage.
As shown in Figure 6b, for the bi-cable system, the horizontal force in the bottom cable on the non-loaded side decreases, which leads to a rapid reduction in the anti-sliding coefficient of the bottom cable. As α increases, the anti-sliding coefficient continues to decrease with the reduction in the dead load of the bottom cable. The critical value of α for the bottom cable to meet the anti-sliding requirements is less than 0.1.
The anti-sliding coefficient between cable and saddle at the top of the side towers under double main-span loading is shown in Figure 7.
As shown in Figure 7a, the anti-sliding coefficient of the top cable is negative, indicating that the horizontal force of the main cable in the side span adjacent to the side tower exceeds that in the main span. As α increases, the displacement at the top of the side tower gradually decreases, and the anti-sliding coefficient of the top cable increases. However, it still fails to meet the anti-sliding requirements.
As shown in Figure 7b, the anti-sliding coefficient of the bottom cable decreases as α increases. When α is less than 0.5, the schemes with a main span greater than 1500 m can meet the anti-sliding requirements for the bottom cable of the side tower.

3.2. Influence of Tower Stiffness

3.2.1. Influence of Side Tower Stiffness

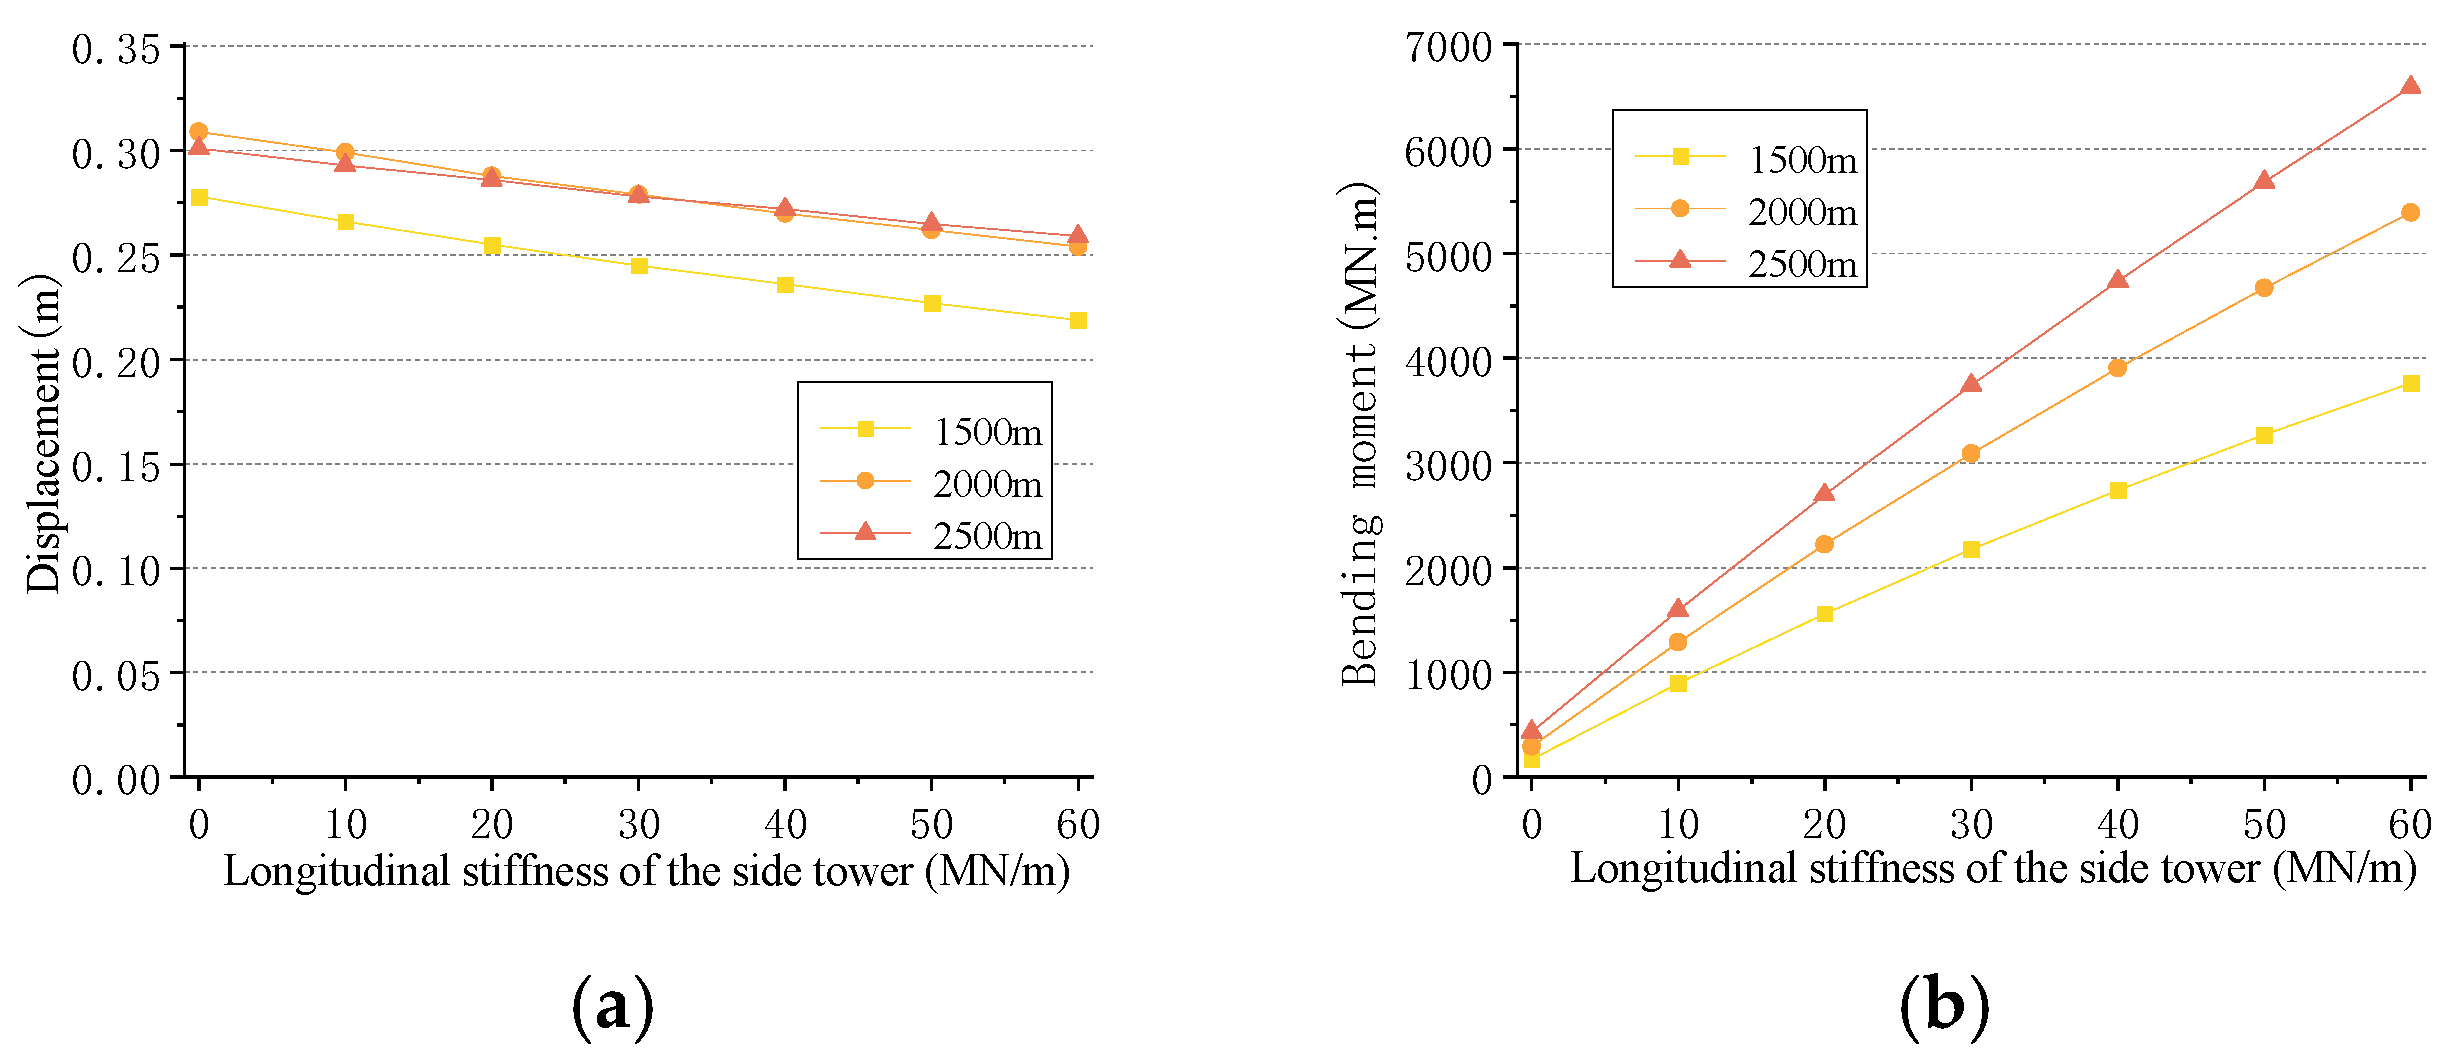
The longitudinal stiffness of the side tower has minimal influence on the forces in the main span but significantly affects the forces on the side tower itself, as shown in Figure 8. In this paper, the longitudinal stiffness of the tower refers to the equivalent restraint stiffness corresponding to the longitudinal displacement of the tower top. As the longitudinal stiffness of the side tower increases, the displacement at the tower top decreases linearly, while the bending moment at the tower base increases rapidly.
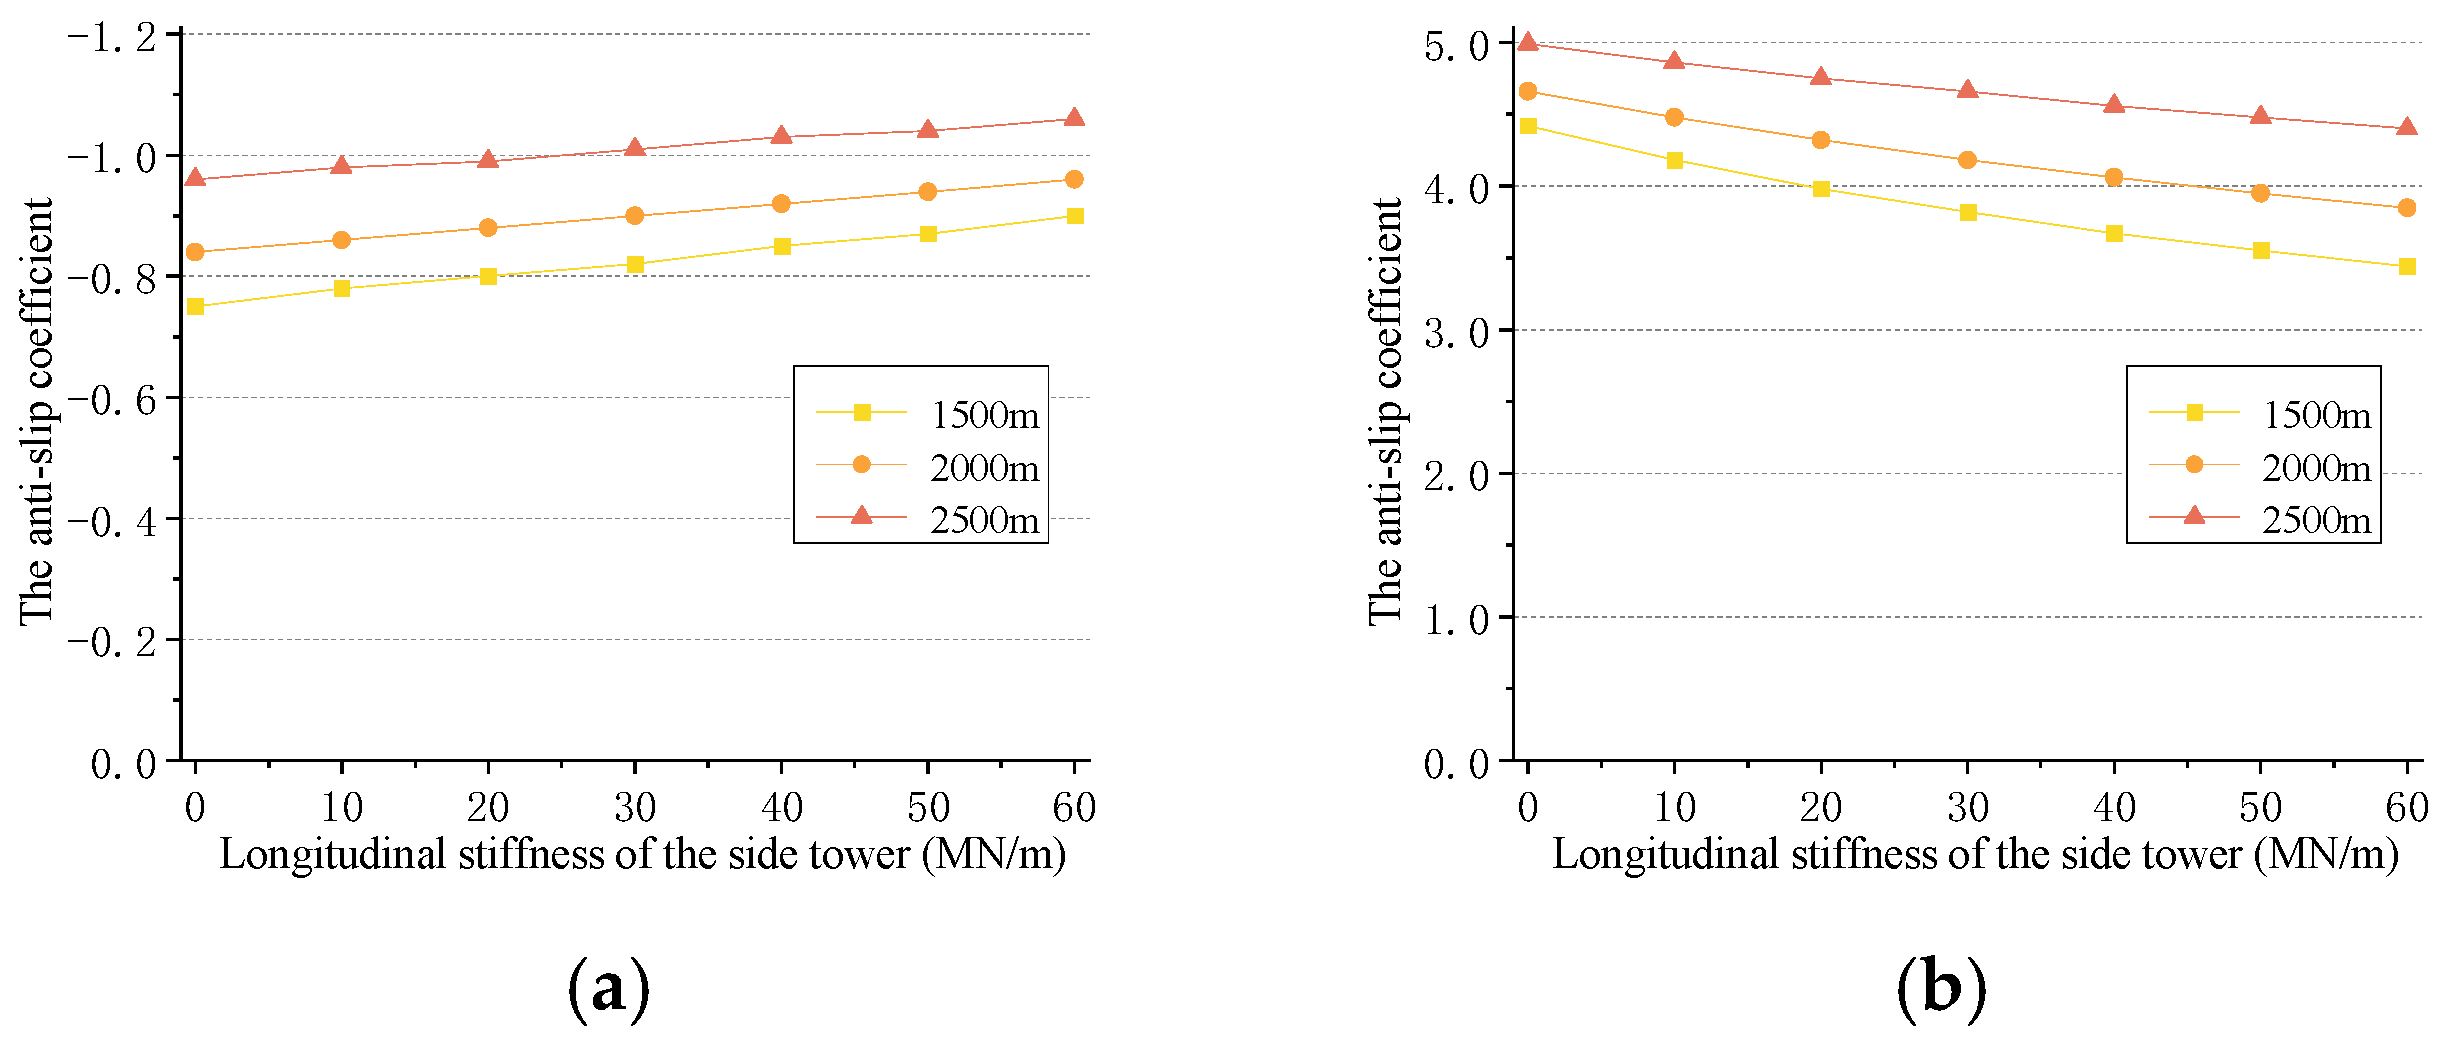
The anti-sliding coefficient between the cable and the saddle at the top of the side tower is shown in Figure 9. As the longitudinal stiffness of the side tower increases, the anti-sliding coefficient of the top cable increases linearly, though the rate of increase is relatively low, while the anti-sliding coefficient of the bottom cable gradually decreases.
Therefore, increasing the longitudinal stiffness of the side tower has little effect on enhancing the anti-sliding coefficient of the top cable. To reduce the bending moment in the side tower’s body, a smaller longitudinal stiffness for the side tower should be adopted, provided that it meets the force requirements of the side tower itself.

3.2.2. Influence of Middle Tower Stiffness

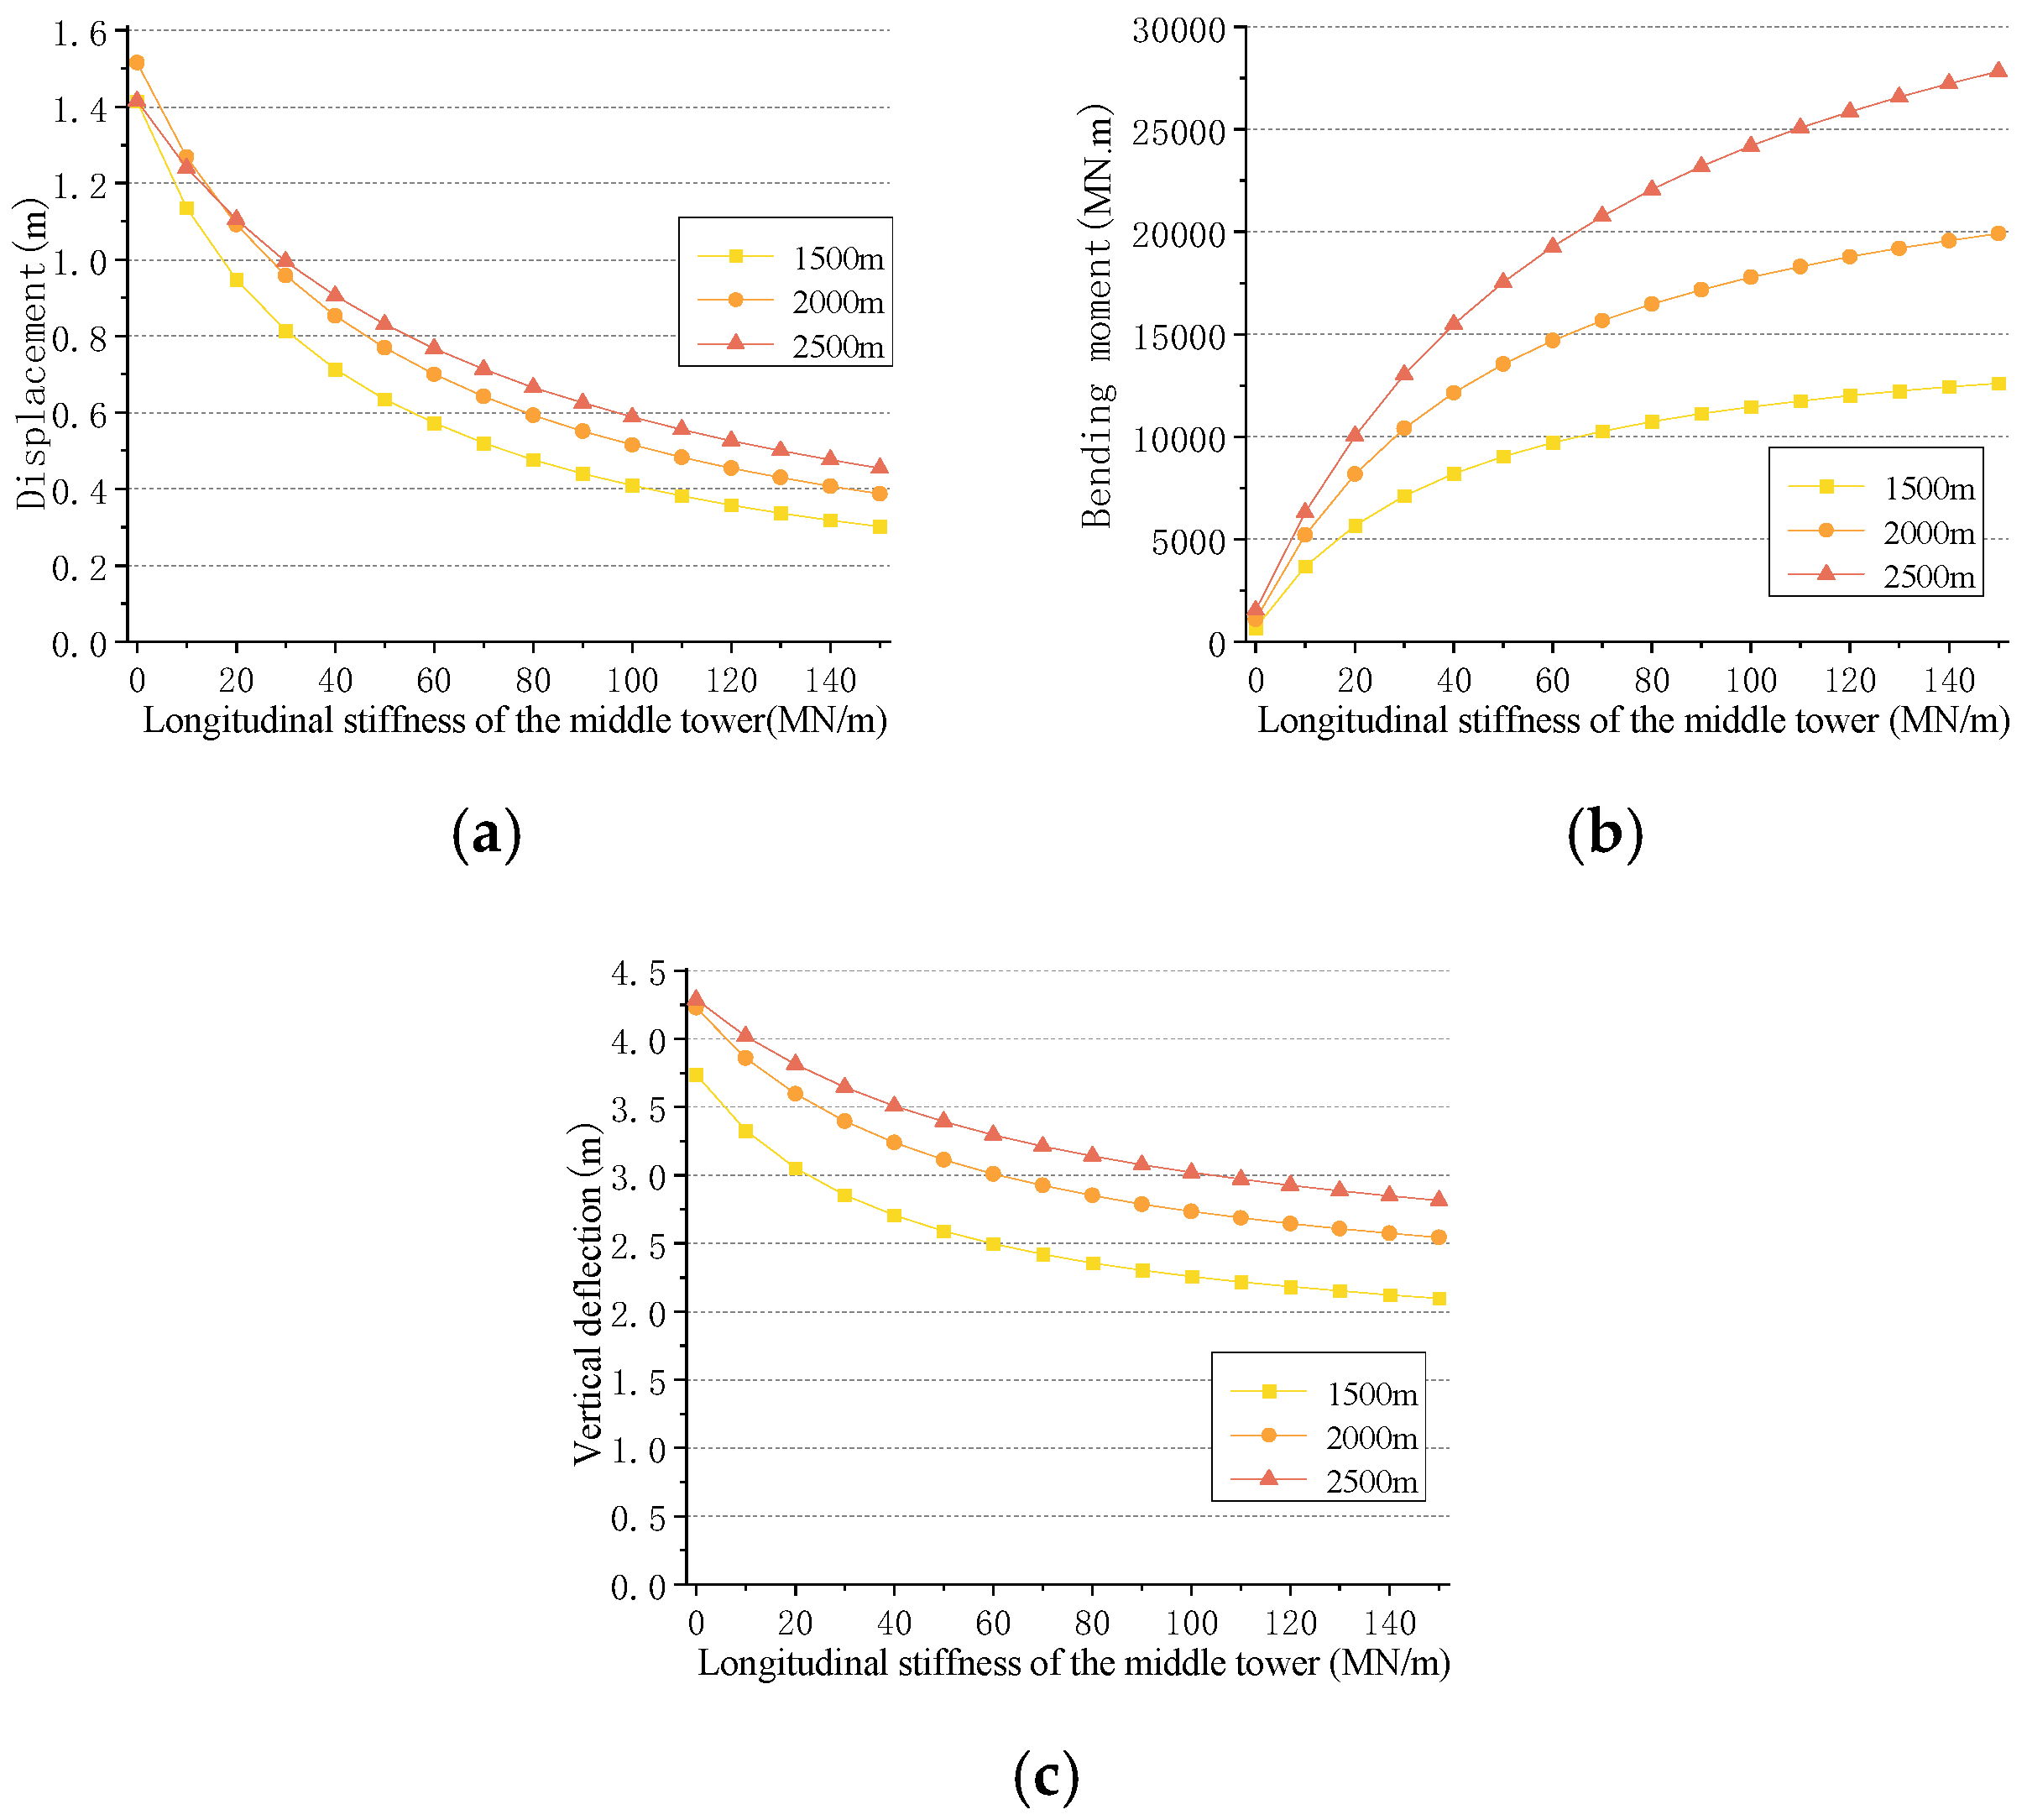
The influence of the longitudinal stiffness of the middle tower on the forces acting on the middle tower and the vertical stiffness of the structure is shown in Figure 10. As the longitudinal stiffness of the middle tower increases, the displacement at the top of the tower gradually decreases, but the bending moment at the base of the middle tower increases rapidly. Additionally, the larger the main span, the faster the bending moment increases. The vertical deflection of the stiffening girder decreases gradually with the increase in the longitudinal stiffness of the central tower. However, due to the significant gravitational stiffness provided by the cable system and its strong constraint on the longitudinal displacement of the tower top, even without considering the stiffness of the central tower, the sag-to-span ratio can still be controlled within 1/400.
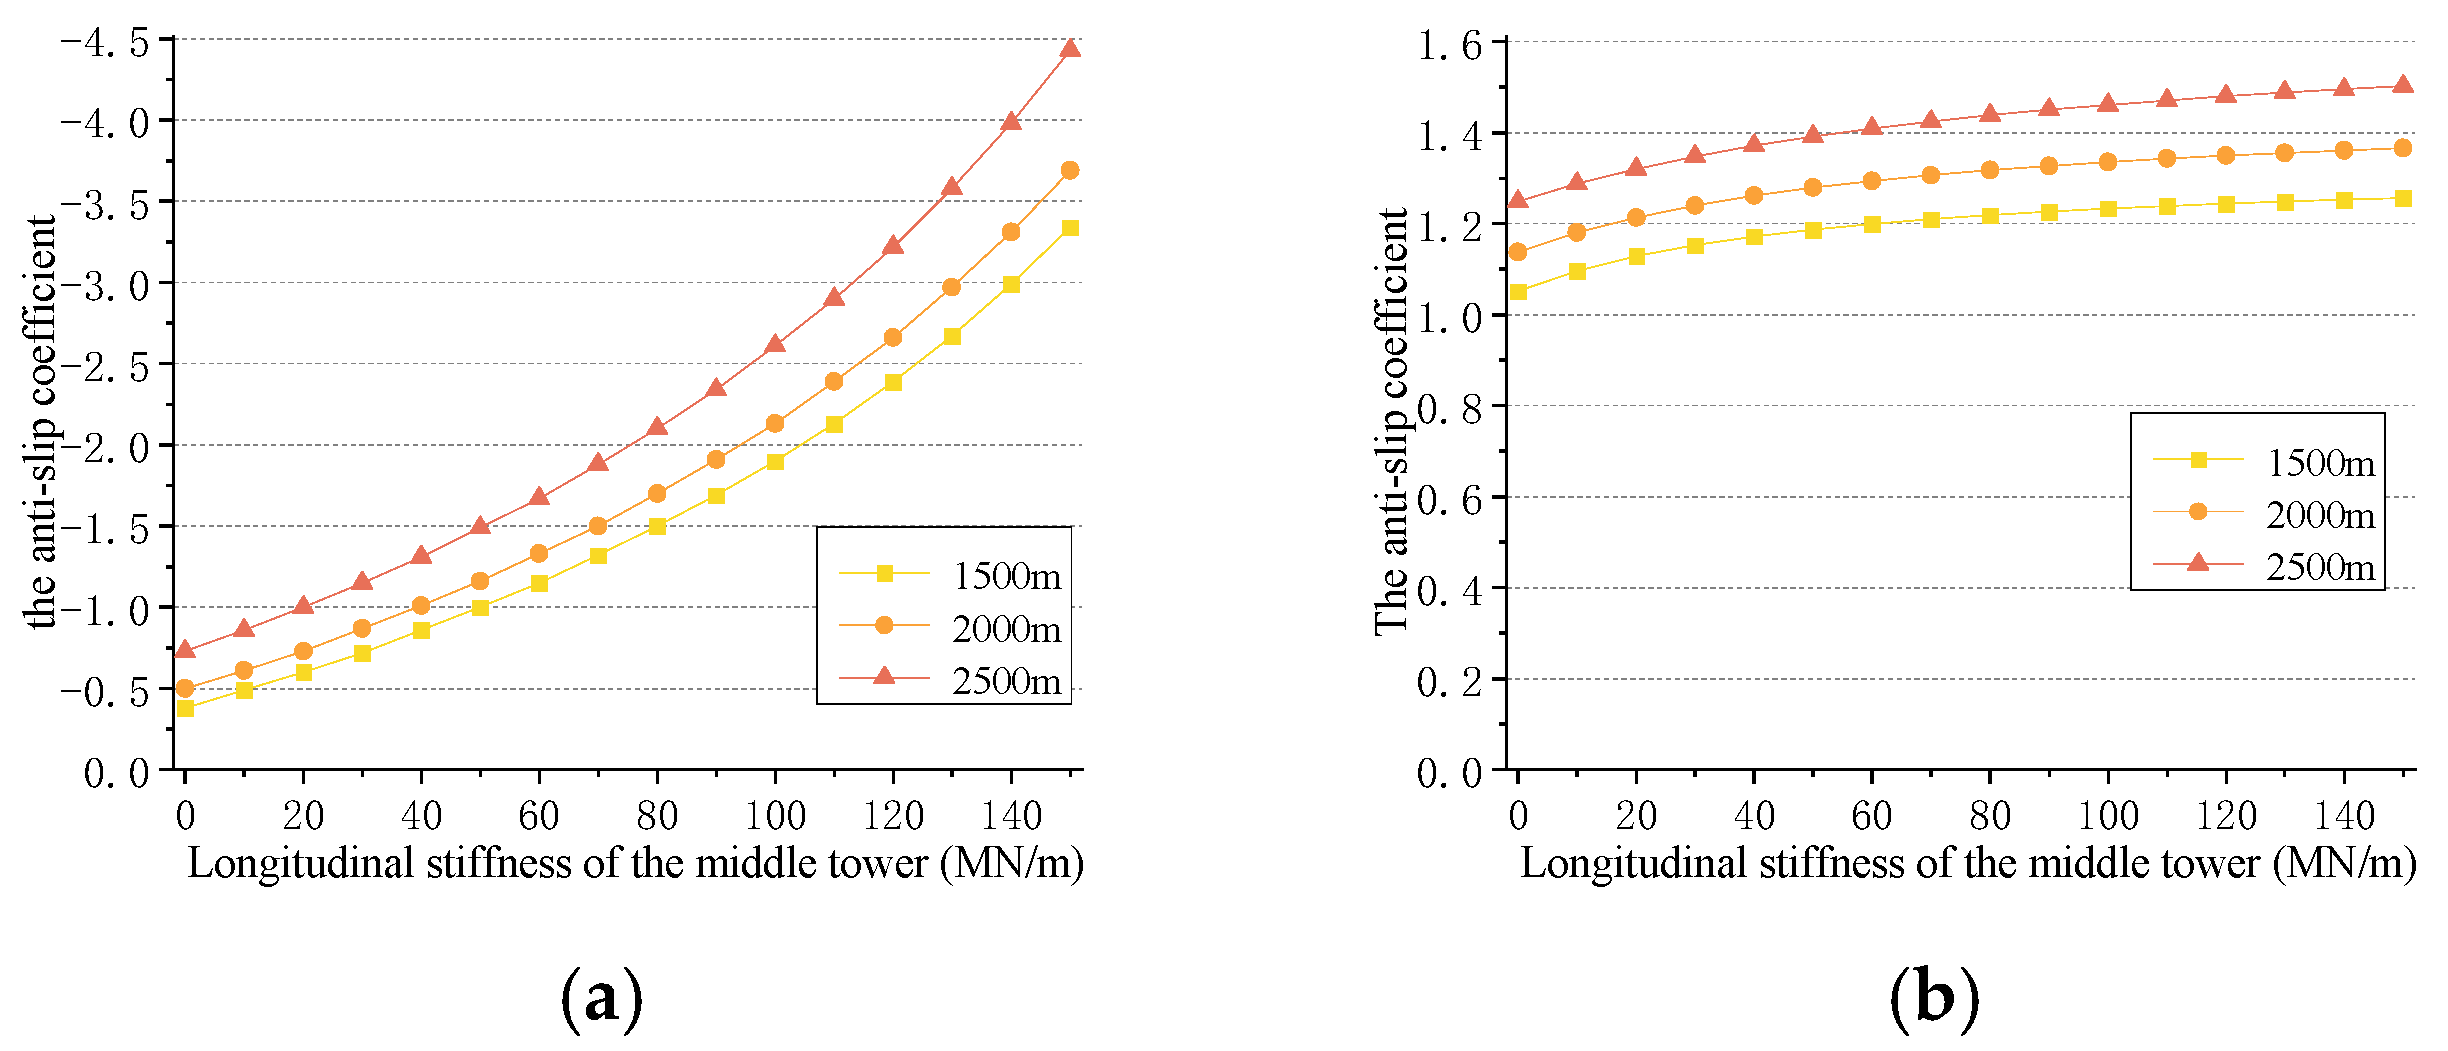
The anti-sliding coefficients of the cable saddles at the top of the middle tower are presented in Figure 11. Contrary to single-cable systems, the anti-sliding coefficients of both top and bottom cables in bi-cable systems increase gradually as the longitudinal stiffness of the middle tower increases. This is due to the higher equivalent horizontal stiffness provided by the bi-cable system. Increasing the longitudinal stiffness of the middle tower reduces its top displacement, consequently decreasing the live load horizontal forces in the top and bottom cables on the non-loaded spans, thus mitigating the imbalance in cable horizontal forces on either side of the middle tower. The impact is particularly significant for the top cable, whereas it is comparatively smaller for the bottom cable. However, to meet the standard requirements for the anti-sliding coefficient of the top cable, the critical longitudinal stiffness of the middle tower for a bi-cable three-tower suspension bridge with a main span of 2500   m needs to reach approximately 70   M N / m . Moreover, bridges with shorter main spans would require even higher critical tower stiffness. Therefore, adopting an A-shaped middle tower is necessary to satisfy the anti-sliding requirements for the top cable.
From the above analysis, it can be concluded that the bi-cable three-tower suspension bridge system should adopt a longitudinal single-column middle tower. A smaller longitudinal stiffness for the middle tower can effectively reduce the bending moment in the tower’s body, while ensuring the structure’s vertical stiffness meets design requirements. However, the anti-sliding issues of the top and bottom cables must be addressed.

3.3. Influence of the Sag-to-Span Ratio

3.3.1. Influence of the Bottom Cable Sag-to-Span Ratio

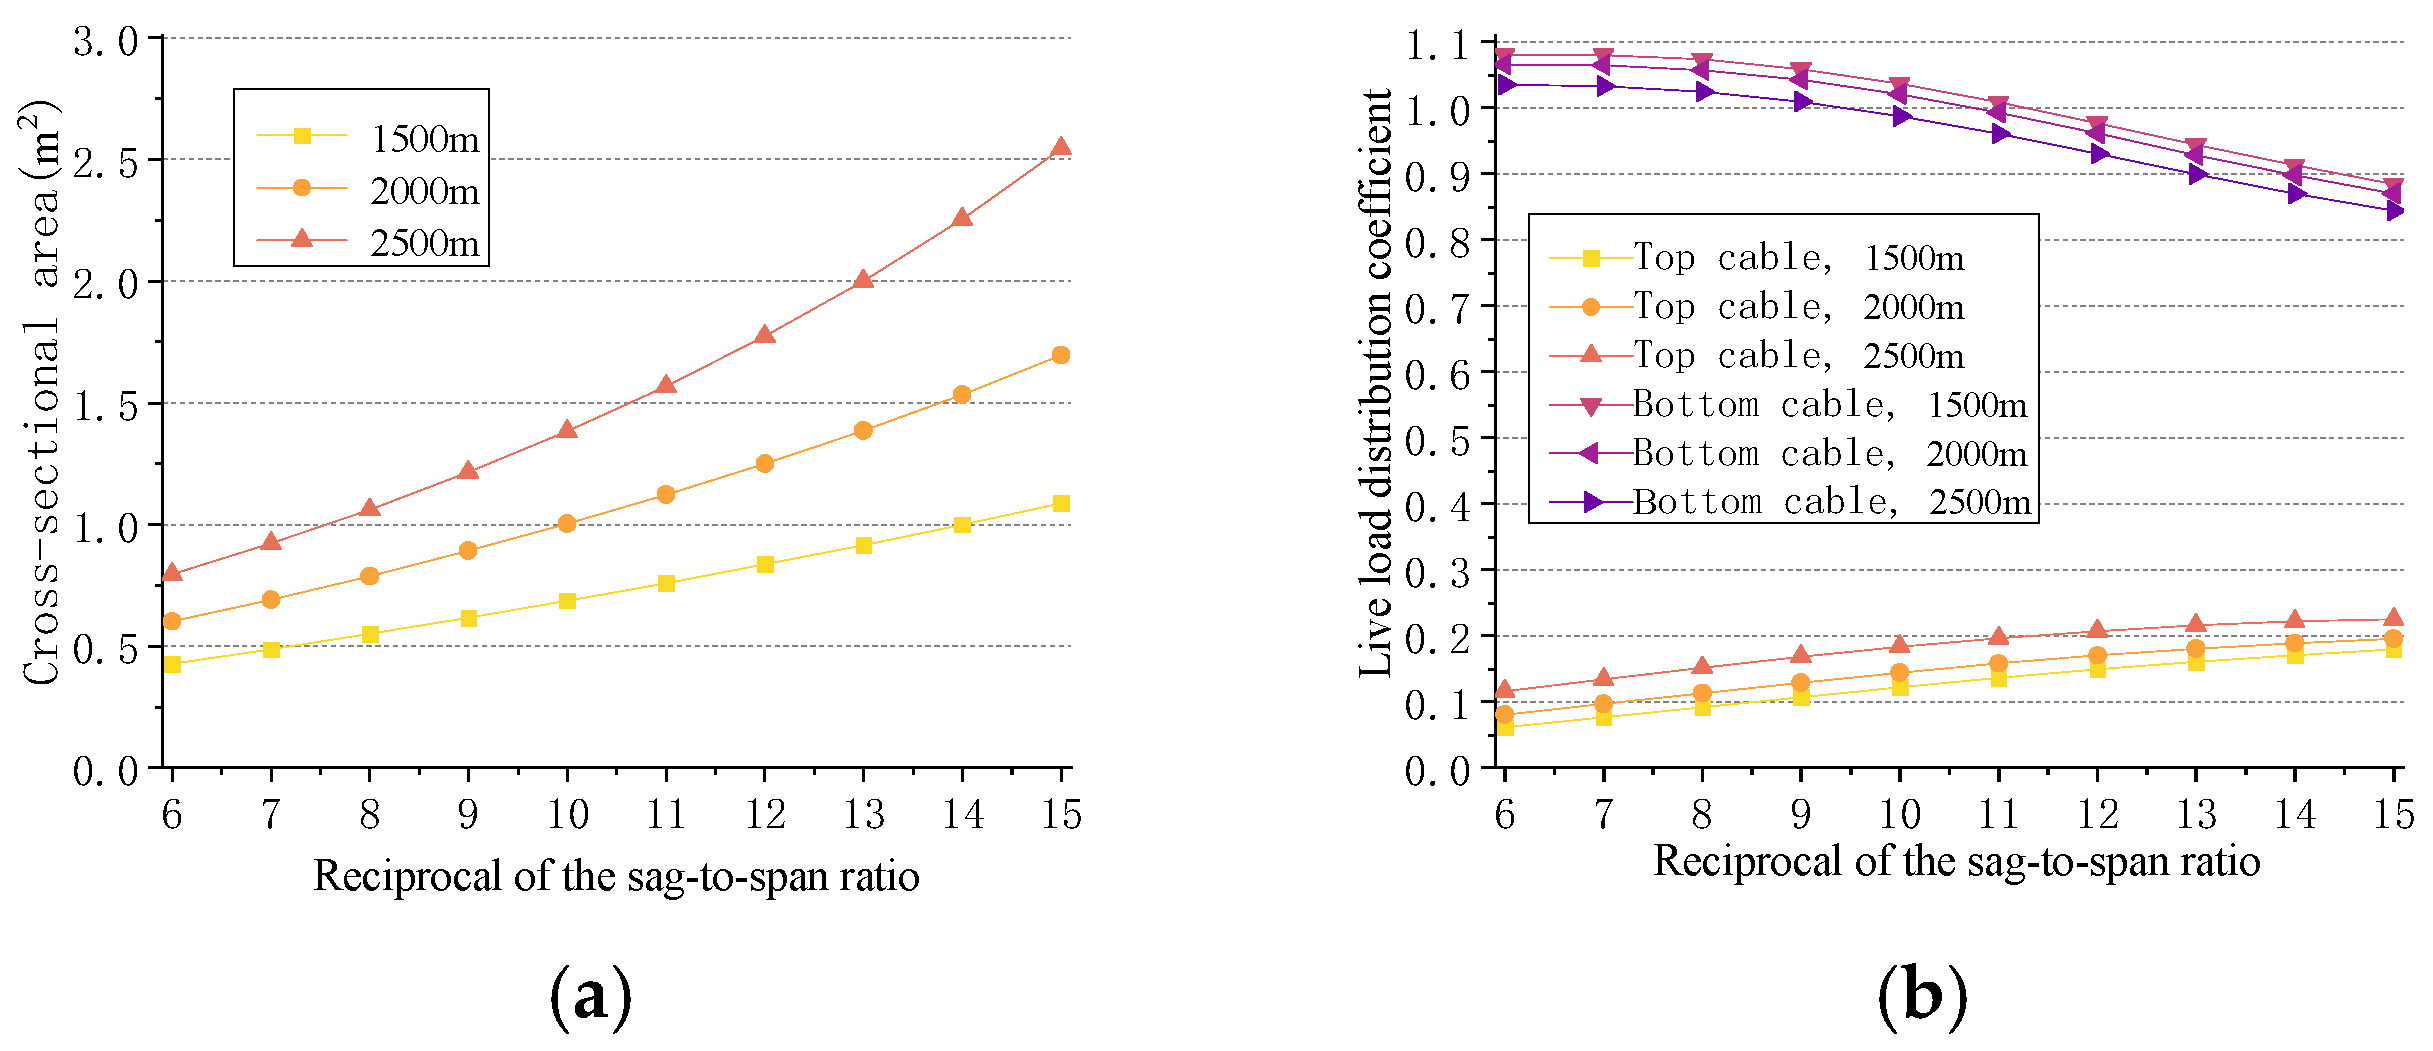
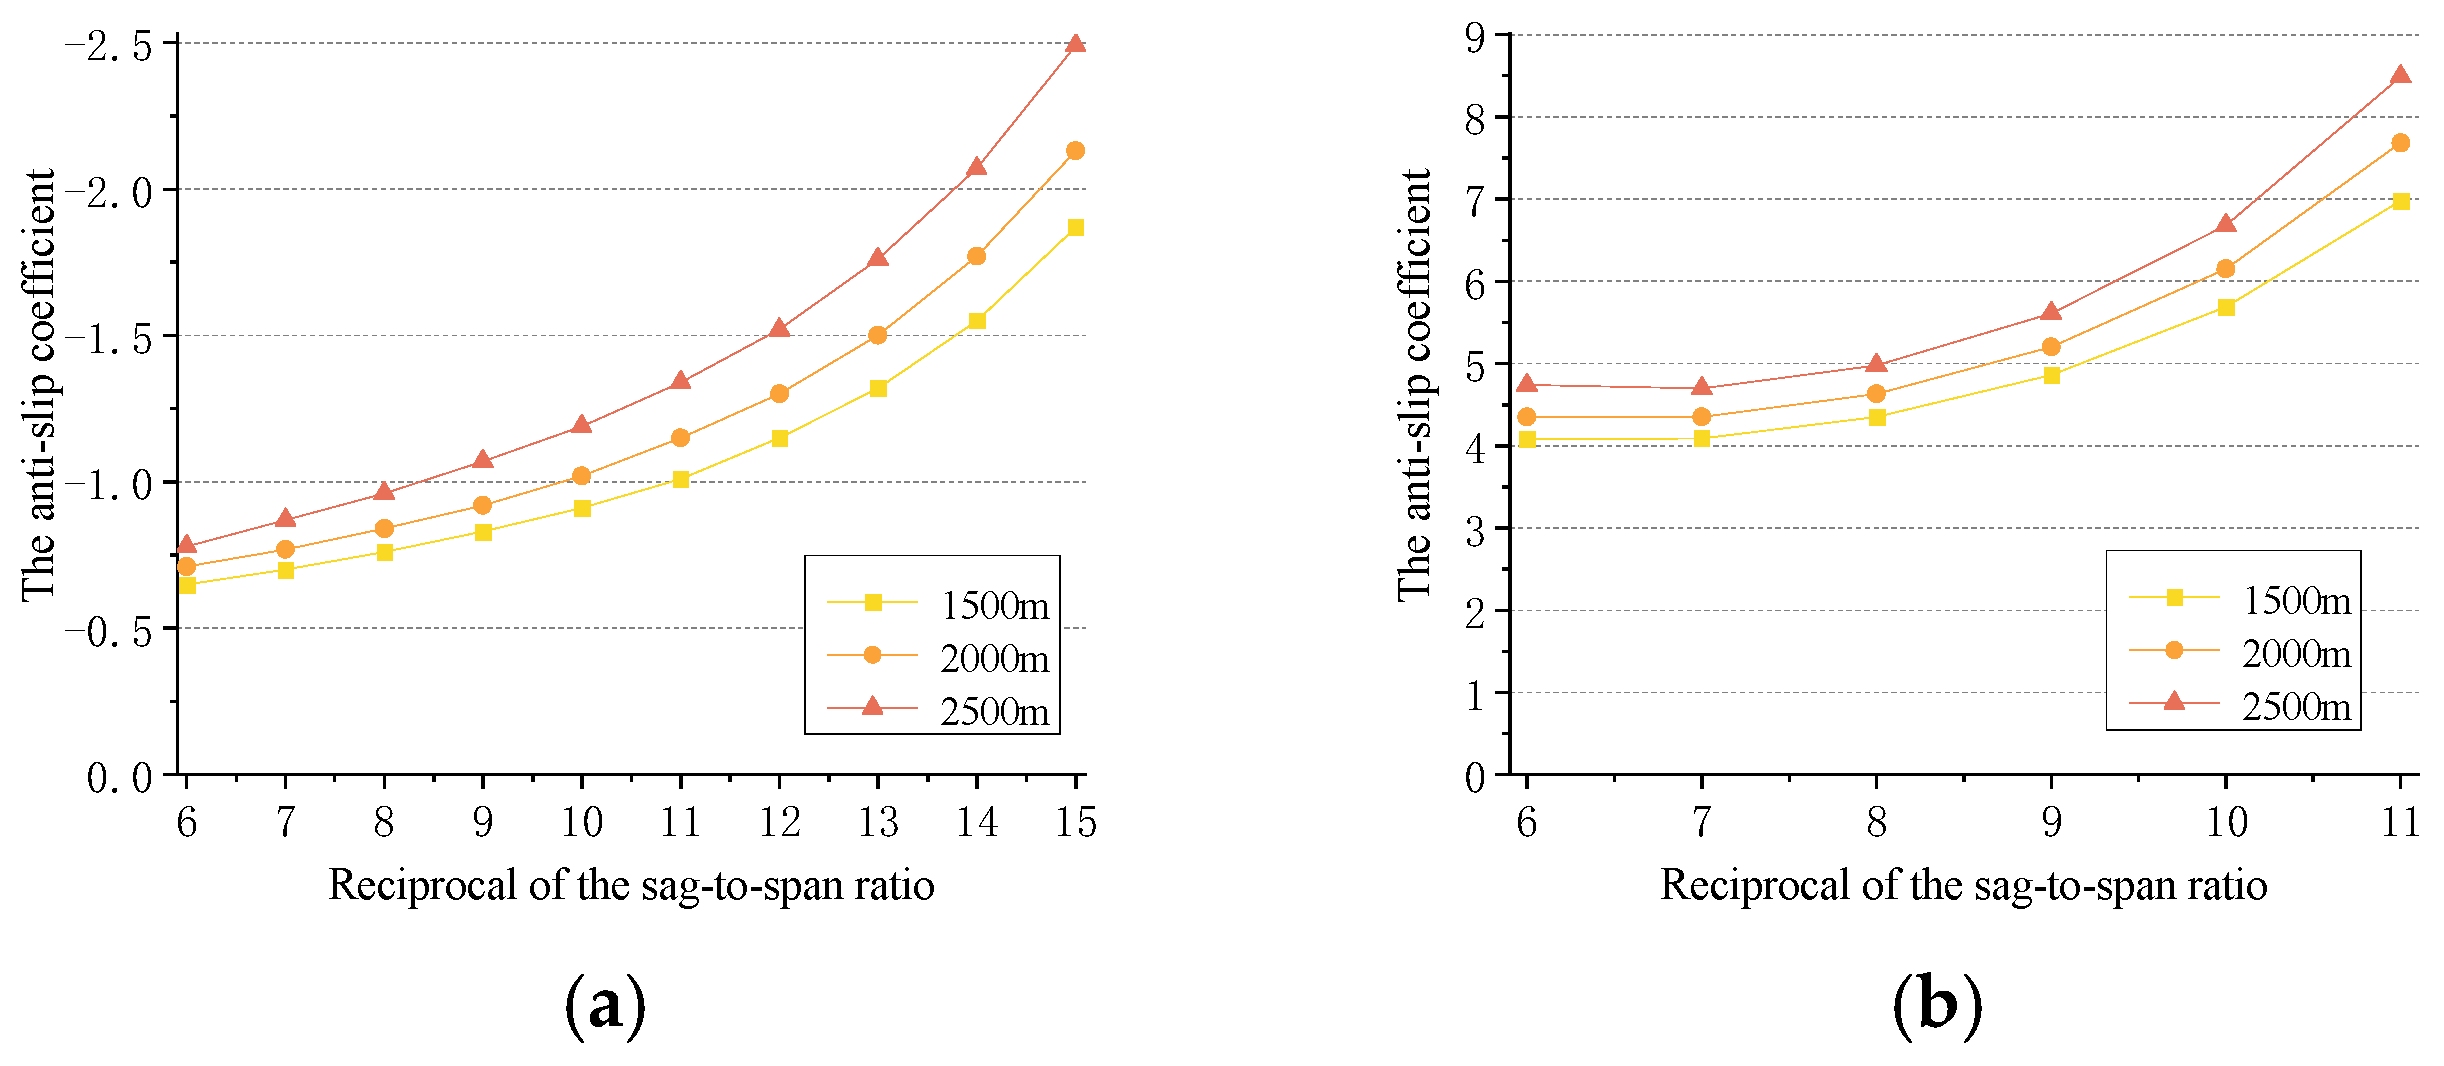
While maintaining a constant sag-to-span ratio of 1/20 for the top cable, Figure 12 illustrates the relationship between the bottom cable area and its live load distribution coefficient when the sag-to-span ratio of the bottom cable varies within the range of 1/6 to 1/15, with the horizontal axis representing the reciprocal of the sag-to-span ratio. With the decrease in the bottom cable sag-to-span ratio, the cross-sectional area of the bottom cable increases, but its vertical stiffness gradually decreases, resulting in a reduction in the live load distribution coefficient of the bottom cable. Consequently, the live load distribution coefficient of the top cable increases, accompanied by a slight increase in the top cable area, although this change is relatively minor.
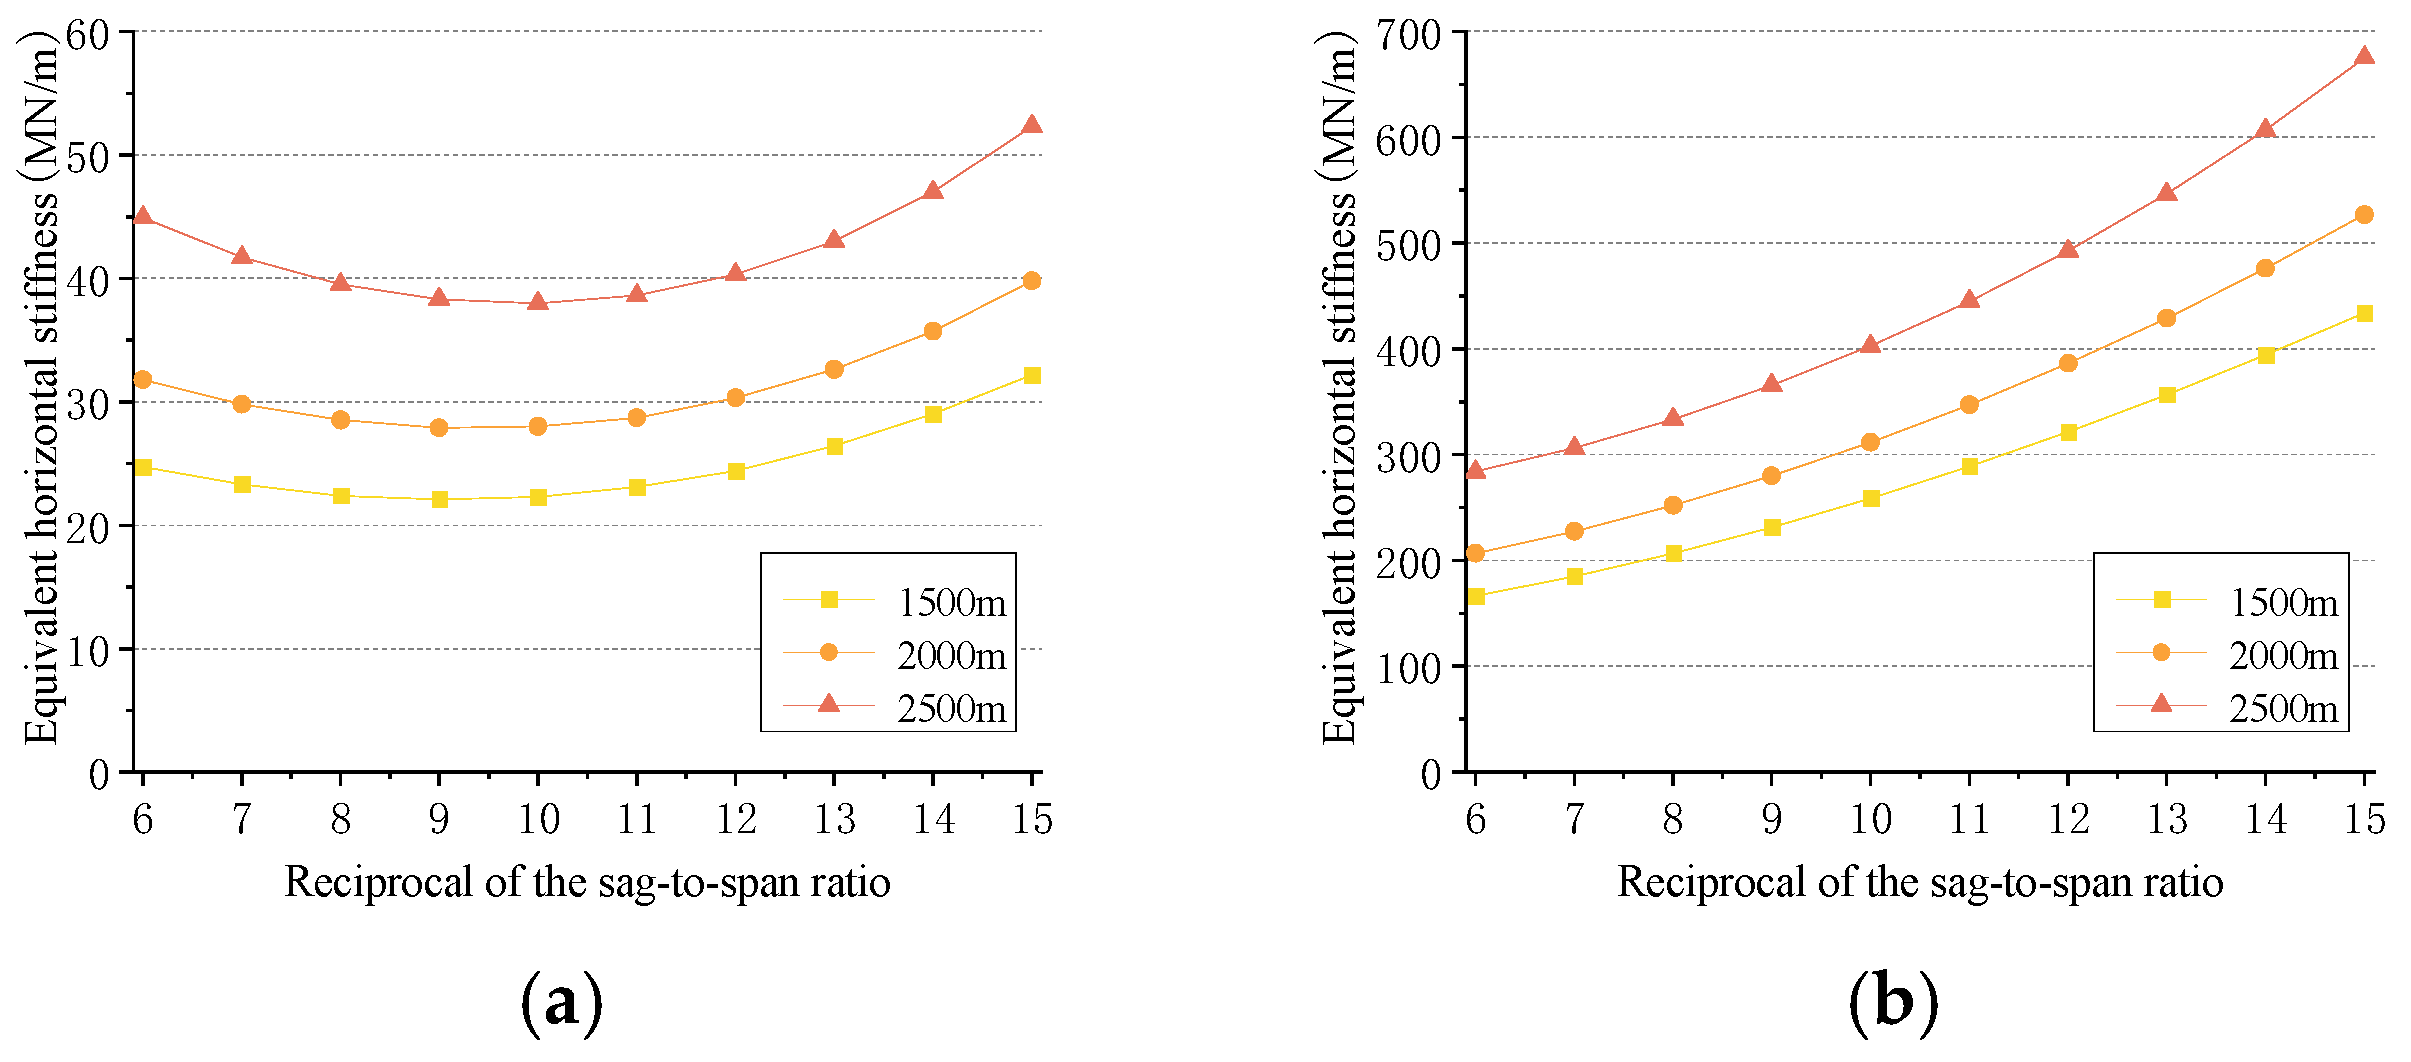
Figure 13 illustrates the equivalent horizontal stiffness of the main cables for different bottom cable sag-to-span ratios. For the main span, as the sag-to-span ratio decreases, the equivalent horizontal stiffness of the bottom cable progressively increases. Simultaneously, the vertical sag difference between the top and bottom cables decreases, leading to reduced load transfer from the bottom cable to the top cable in the unloaded spans when displacement occurs at the top of the central tower. Consequently, the equivalent horizontal stiffness of the top cable gradually decreases. Thus, the combined equivalent horizontal stiffness of the top and bottom cables initially decreases and subsequently increases. Due to the increase in the cross-sectional areas of both the top and bottom cables, the equivalent stiffness of the side span main cable monotonically increases as the bottom cable sag-to-span ratio decreases.
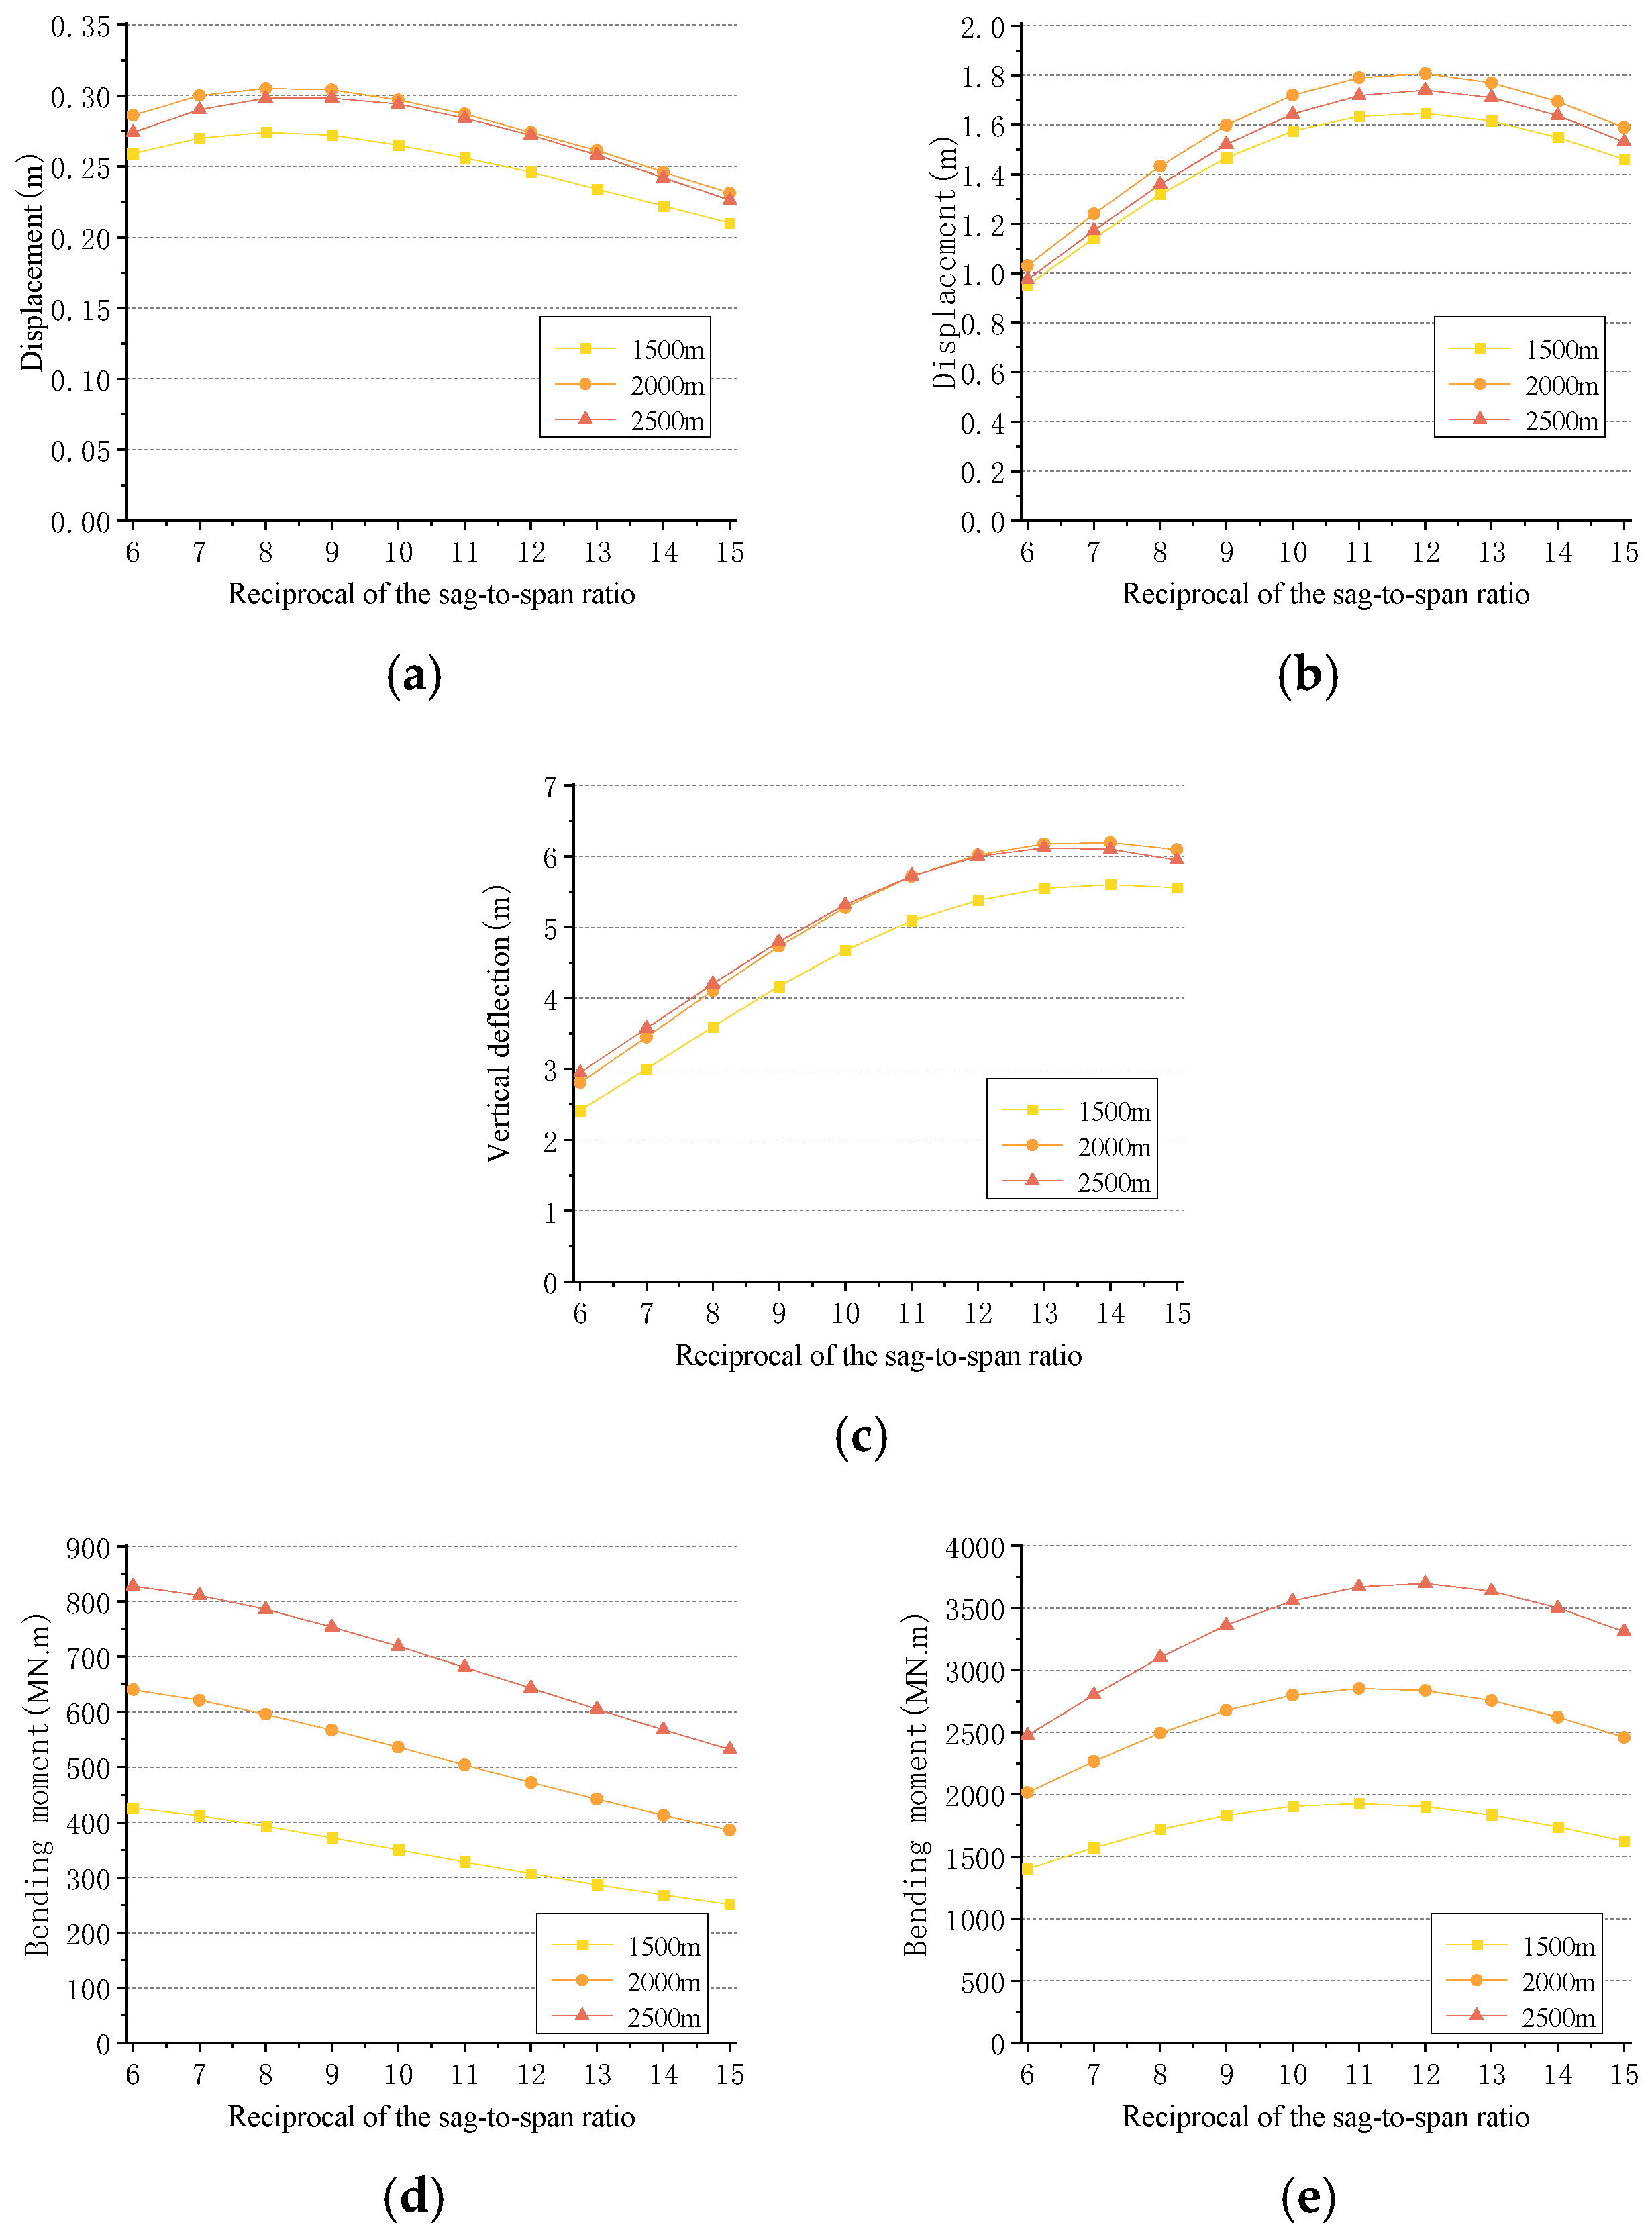
Figure 14 illustrates the forces acting on the towers and the vertical deflection at mid-span of the stiffening girder under loading conditions. Influenced by changes in the equivalent horizontal stiffness of the main span top and bottom cables, the top displacements of both side and middle towers, as well as the bending moments at the base of the middle tower, initially increase and subsequently decrease. In contrast, the bending moment at the base of the side towers decreases monotonically. A larger vertical sag difference between the top and bottom cables enhances the structure’s vertical stiffness; therefore, adopting a larger sag-to-span ratio for the bottom cable is beneficial for improving vertical stiffness. To maintain the deflection-to-span ratio within the limit of 1/400, the bottom cable sag-to-span ratio should exceed 1/8 when the main span length is 1500 m and only needs to exceed 1/9 when the main span length surpasses 2000 m.
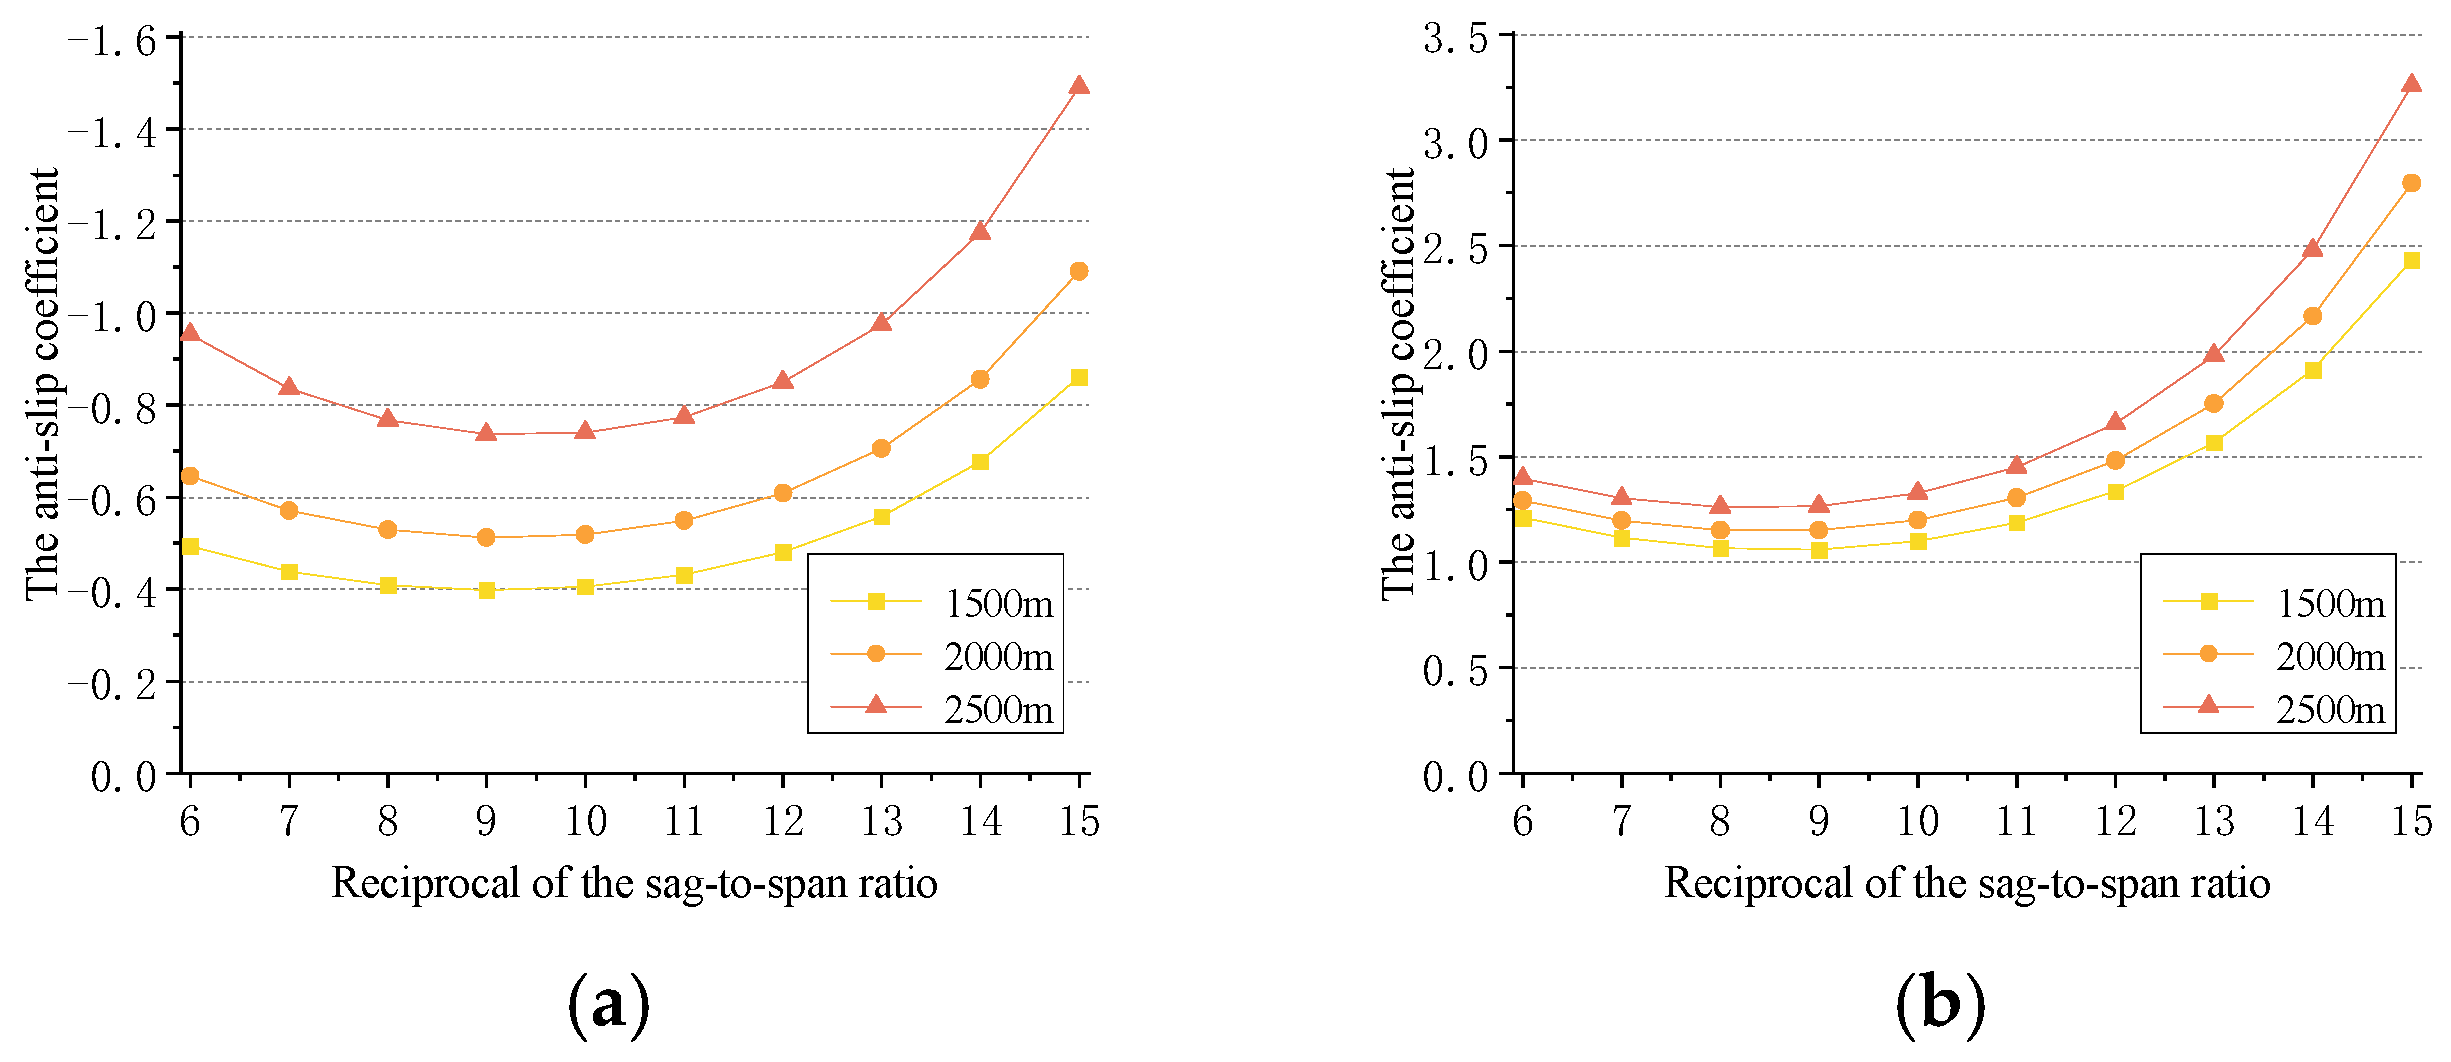
The anti-sliding coefficients between the cable and the saddle at the tops of the middle and side towers are shown in Figure 15 and Figure 16, respectively. As the sag-to-span ratio of the bottom cable decreases, the anti-sliding coefficients of both the top and bottom cables at the top of the middle tower initially decrease and then increase. This is because a decrease in the bottom cable sag-to-span ratio increases the equivalent horizontal stiffness of the bottom cable, but at the same time reduces the vertical sag difference between the top and bottom cables, thereby weakening the load transfer from the bottom cable to the top cable in the unloaded spans. Under the combined influence of these two effects, the anti-sliding coefficients show a non-monotonic trend. In contrast, the anti-sliding coefficients at the side towers increase monotonically. Therefore, selecting a smaller sag-to-span ratio for the bottom cable can improve the anti-sliding performance of the main cables.
In summary, for the bi-cable three-tower suspension bridge system, the sag-to-span ratio of the bottom cable can be selected within the range of 1/6 to 1/9. As the bottom cable sag-to-span ratio increases, the vertical stiffness of the structure increases, the displacement at the top of the central tower and the bending moment in the tower decrease, but the height of the tower also increases. Currently, the tallest suspension bridge towers in the world, such as the Akashi Kaikyō Bridge and the Sutong Bridge, have a tower height of approximately 300 m. Due to the construction difficulties associated with very tall towers, the choice of the bottom cable sag-to-span ratio is constrained by the tower height. For instance, when the main span reaches 2000 m, with a bottom cable sag-to-span ratio of 1/8, considering a 60 m clearance from the water surface to the bottom of the stiffening girder, the tower height would be around 320 m, which is feasible for construction. However, when the main span is reduced to 1500 m, the bottom cable sag-to-span ratio can be increased to 1/6, offering a broader selection range. Nevertheless, within the range of 1/6 to 1/9, the anti-sliding coefficient of the main cable is quite low, leading to potential saddle slip issues.

3.3.2. Influence of the Top Cable Sag-to-Span Ratio

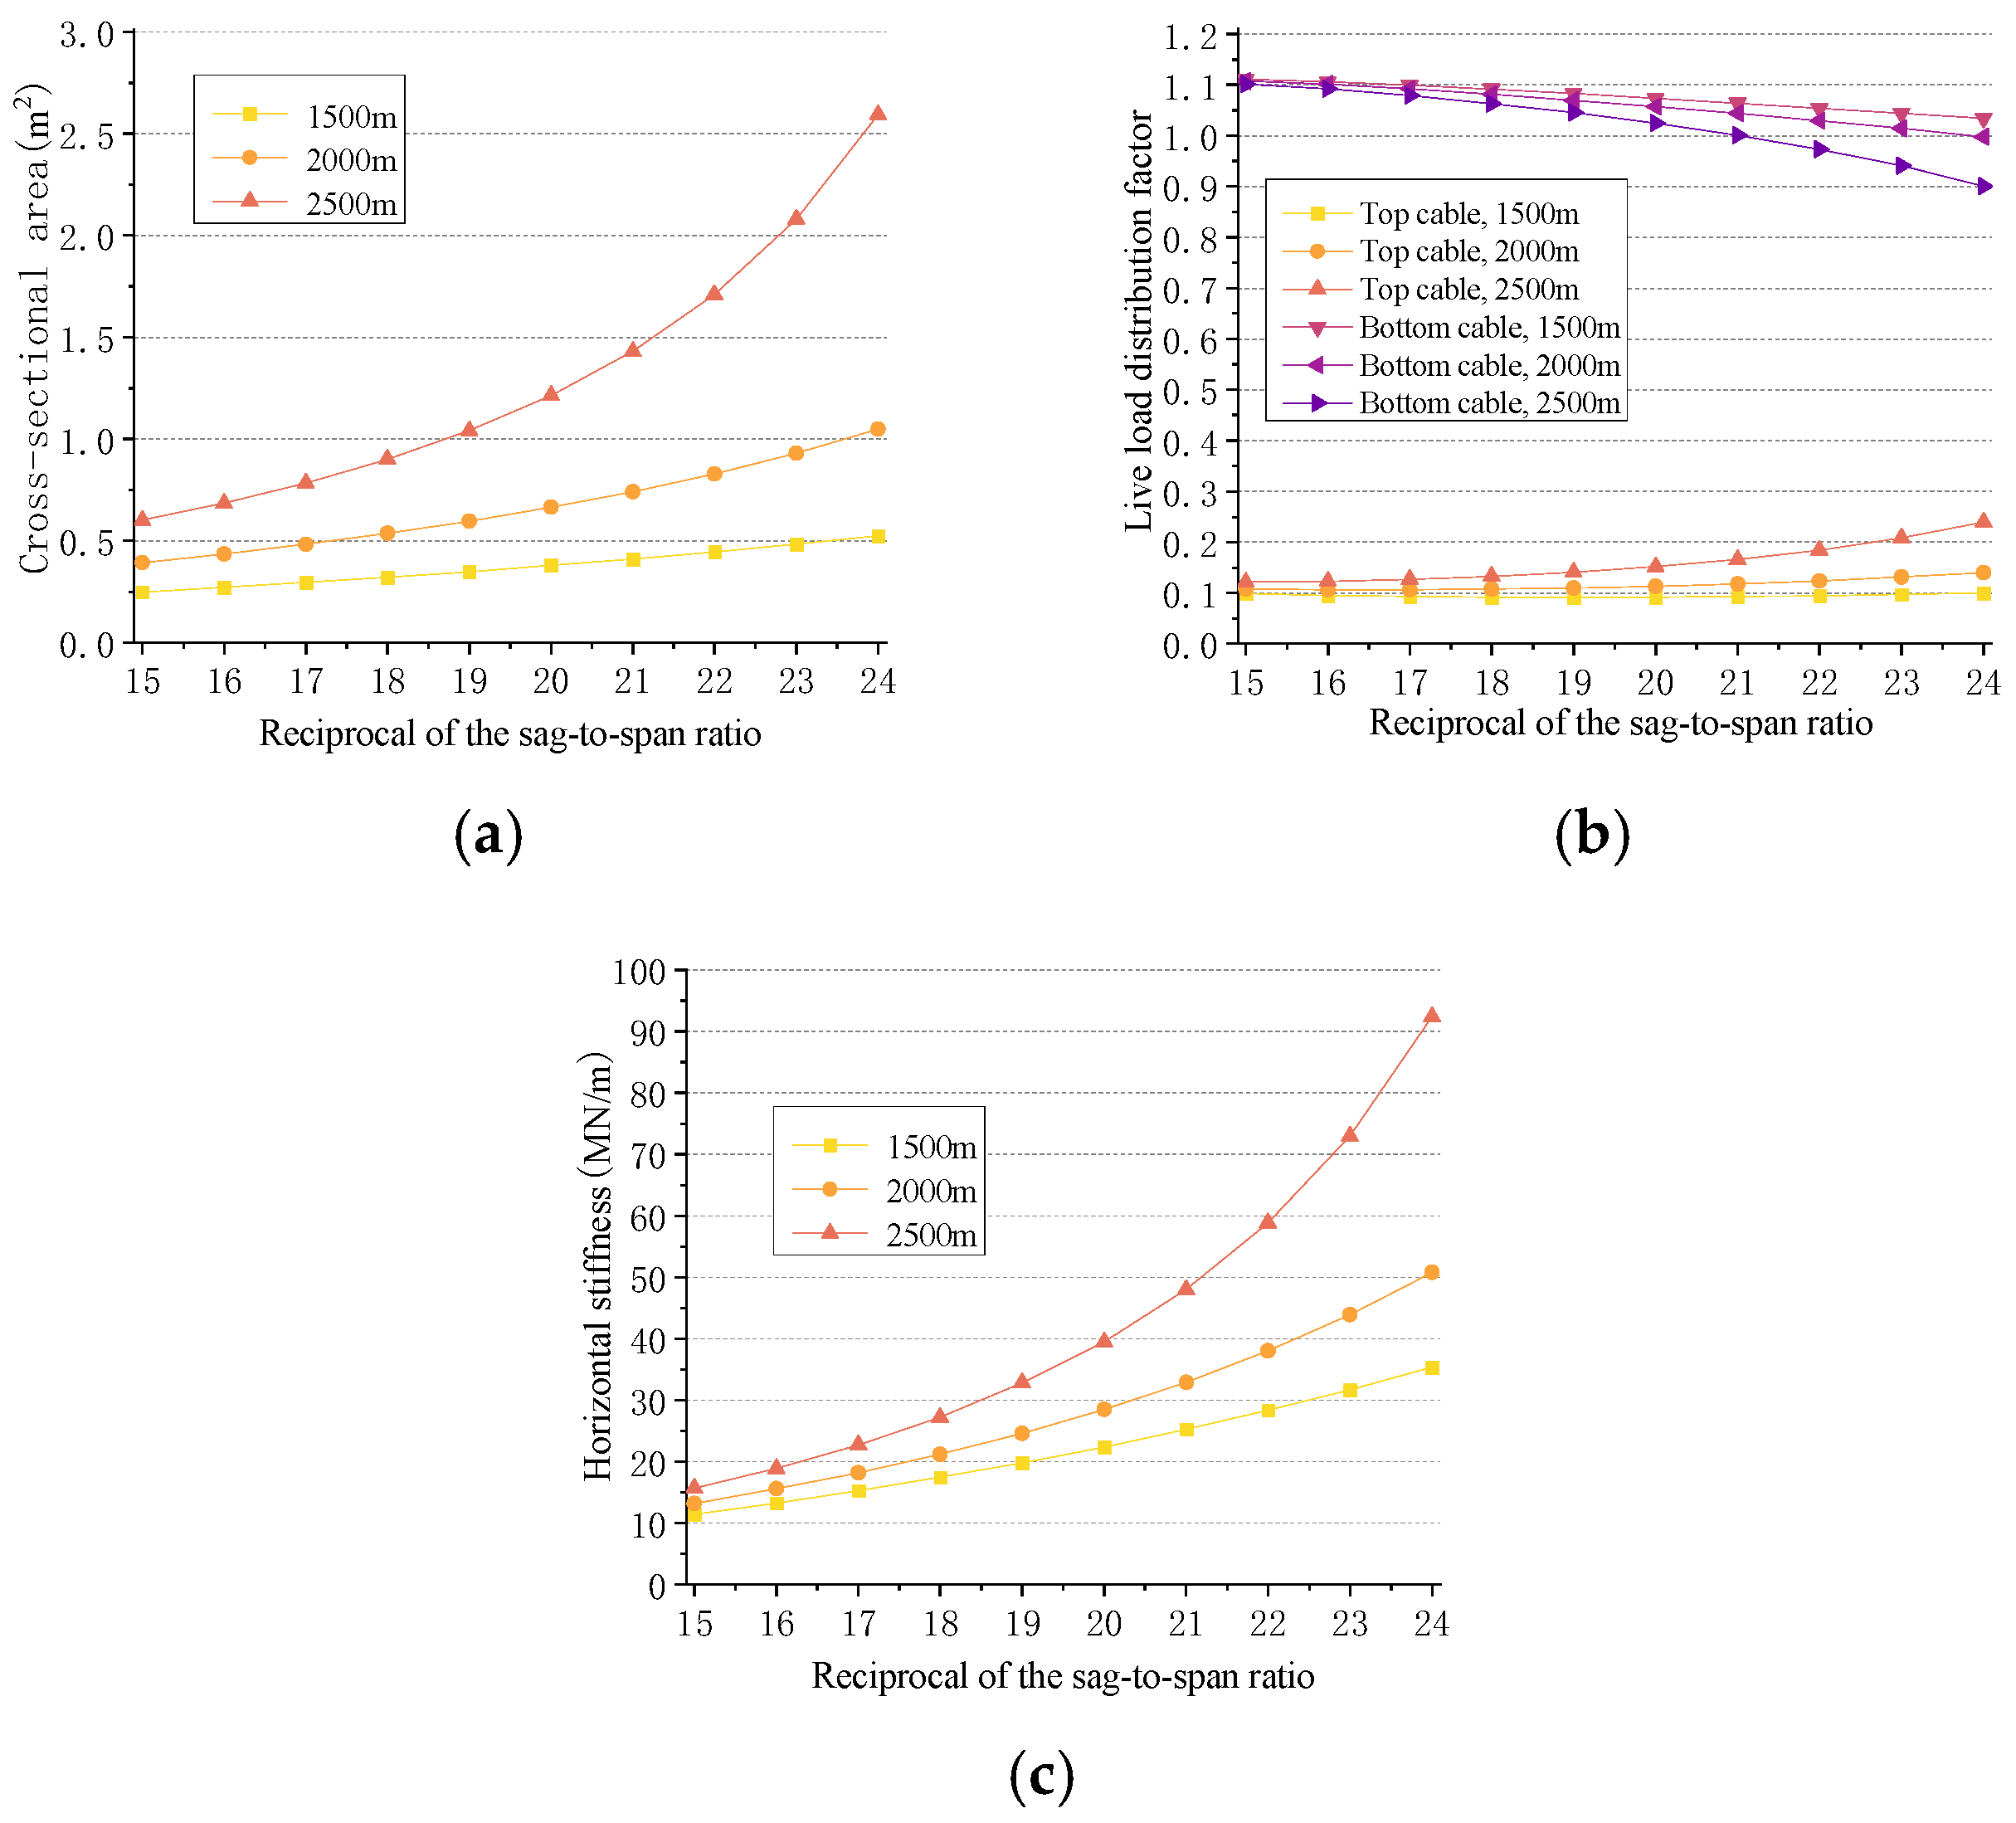
Maintaining the bottom cable sag-to-span ratio at 1/8, Figure 17 illustrates the main cable characteristics and live load distribution coefficients as the top cable sag-to-span ratio varies from 1/15 to 1/24. The horizontal axis represents the inverse of the sag-to-span ratio. As the top cable sag-to-span ratio decreases, the cross-sectional area, equivalent horizontal stiffness, and live load distribution coefficient of the top cable gradually increase. The growth rate accelerates as the sag-to-span ratio becomes smaller and the main span length increases. Meanwhile, the live load distribution coefficient of the bottom cable decreases, and its cross-sectional area and equivalent horizontal stiffness slightly decrease, though the changes are minimal. As a result, the total equivalent horizontal stiffness of the main and side span cables increases rapidly with a reduction in the top cable’s sag-to-span ratio.
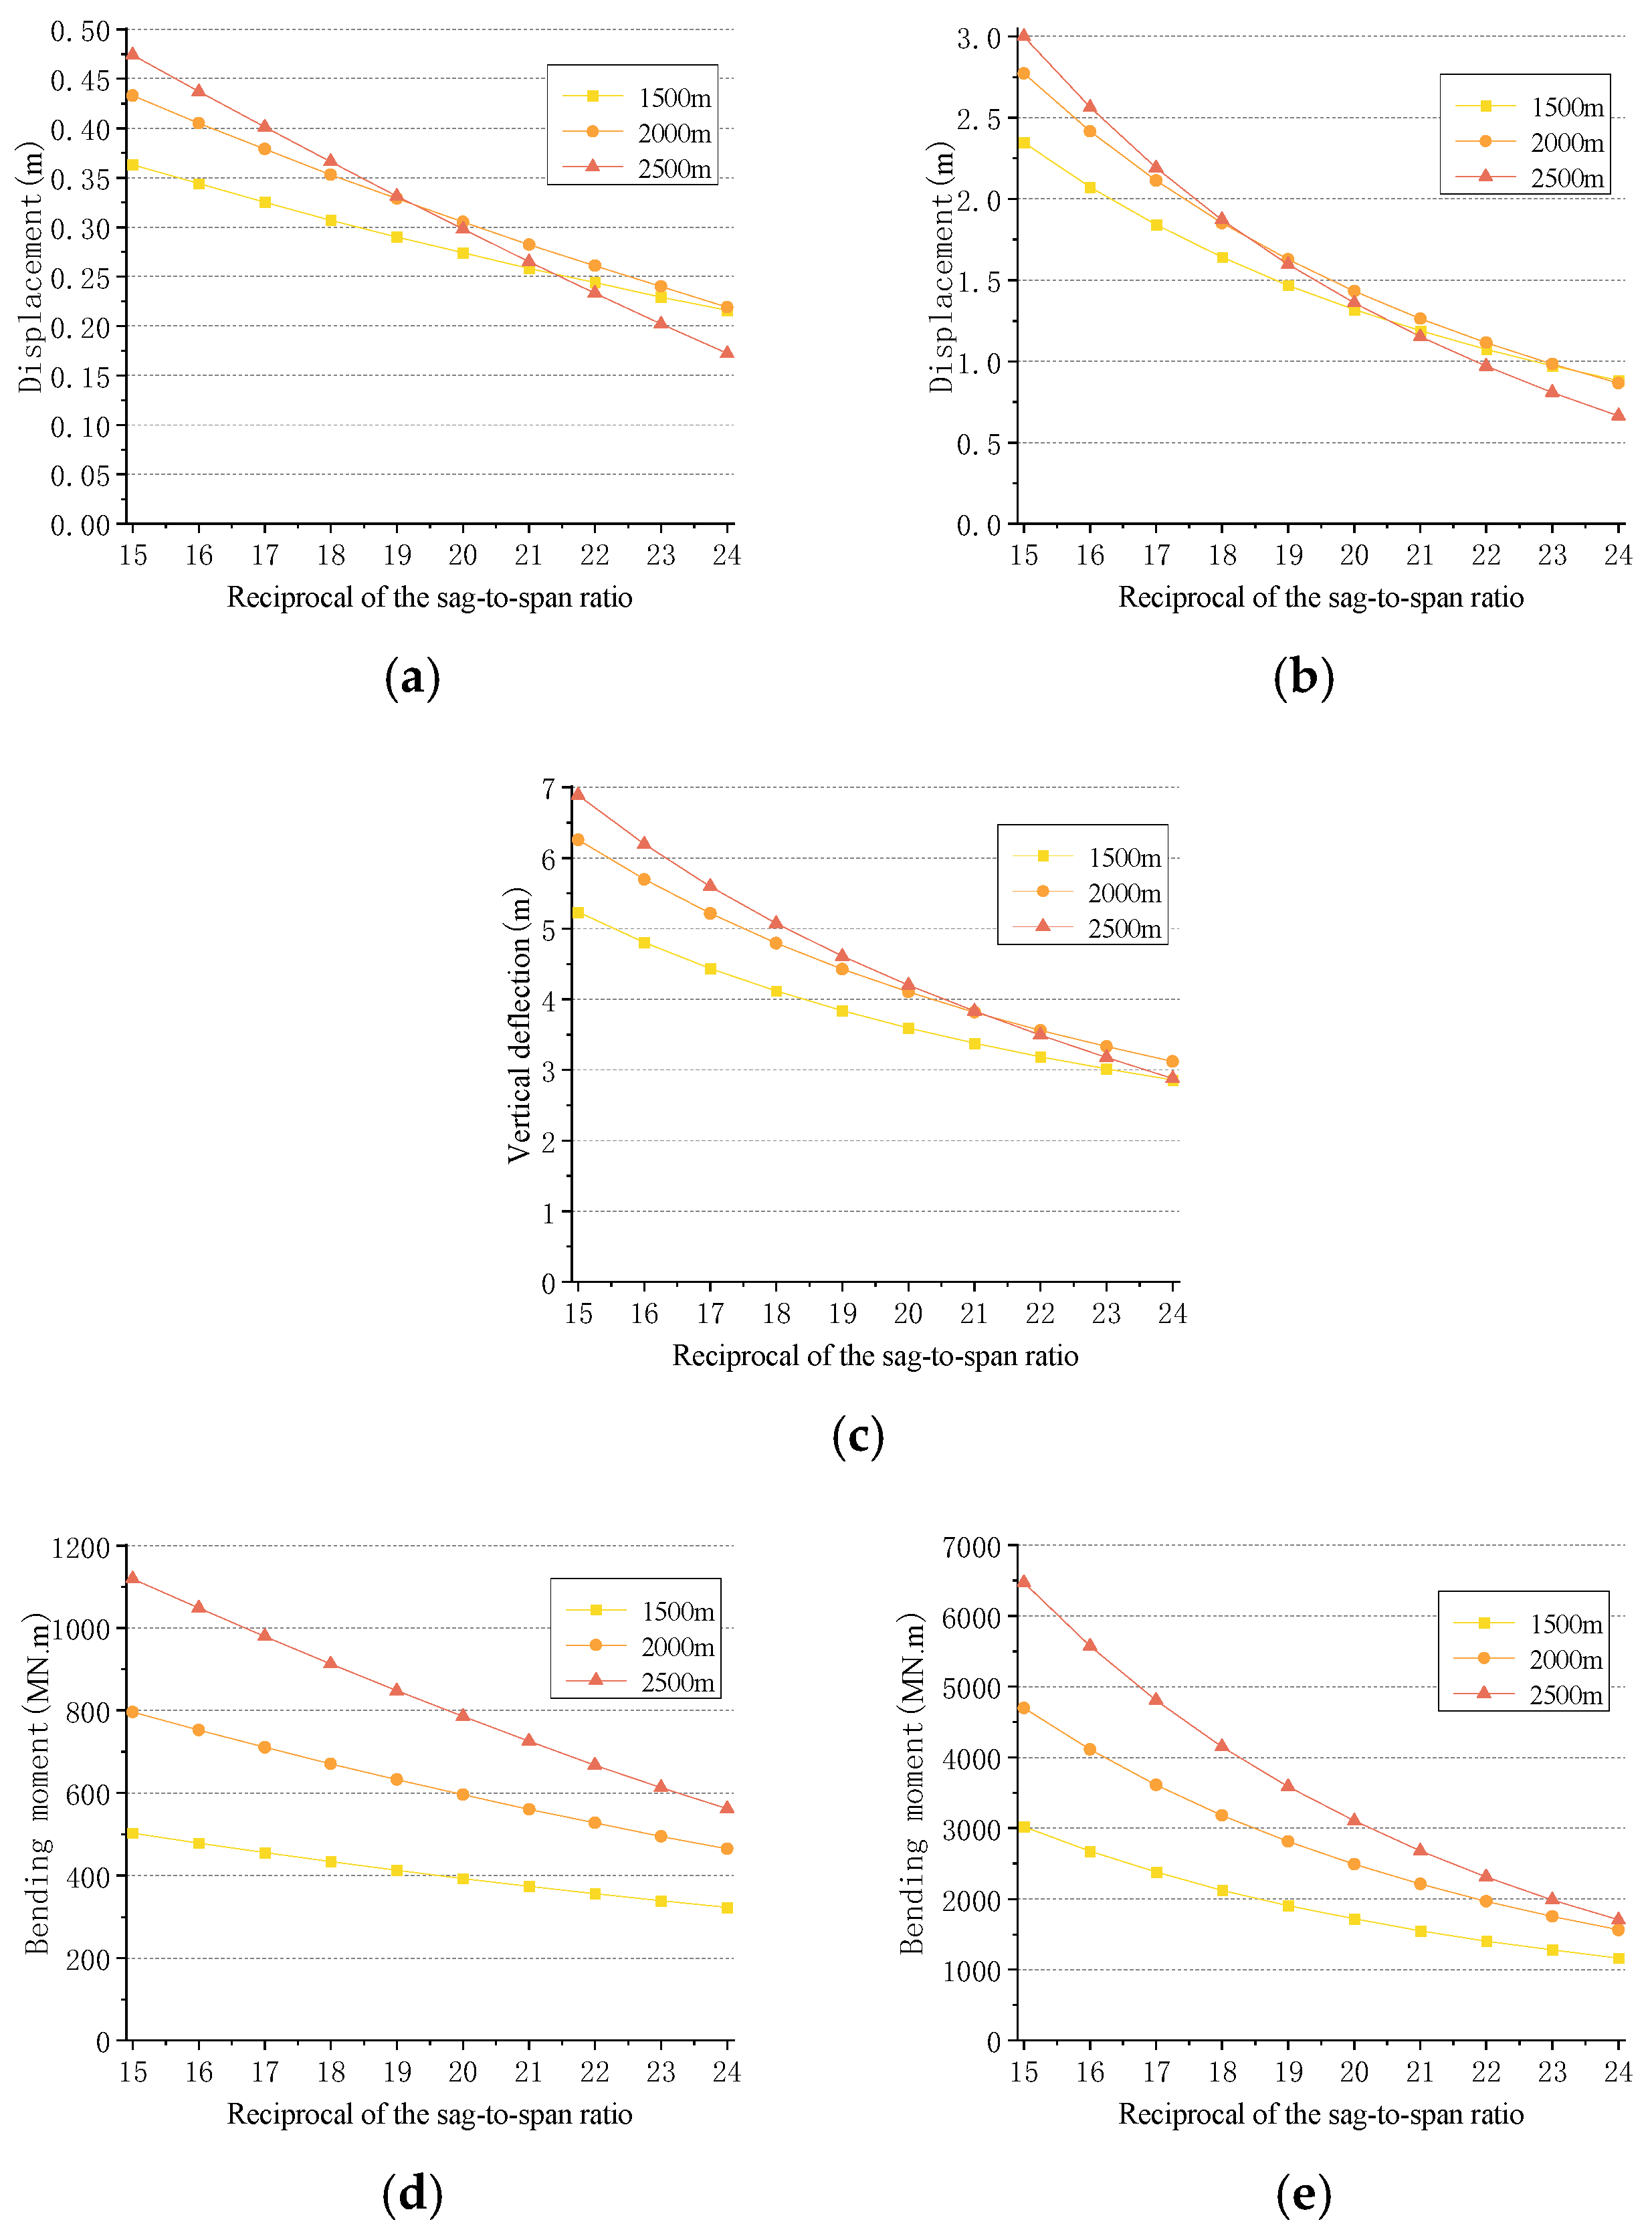
The force on the tower and the vertical deflection of the stiffening girder at mid-span under live load are shown in Figure 18. As the sag-to-span ratio of the top cable decreases, the horizontal equivalent stiffness of the top cable increases, leading to a gradual reduction in the displacement at the tower top and the bending moment at the tower base. Additionally, the sag difference between the top and bottom cables increases, resulting in a continuous increase in the structural vertical stiffness. Therefore, adopting a smaller top cable sag-to-span ratio can reduce the forces on the tower and enhance the vertical stiffness of the structure. If the deflection-to-span ratio is limited to 1/400, when the main span is 1500 m, the top cable sag-to-span ratio needs to be smaller than 1/20; for main spans greater than 2000 m, the top cable sag-to-span ratio should be less than 1/18.
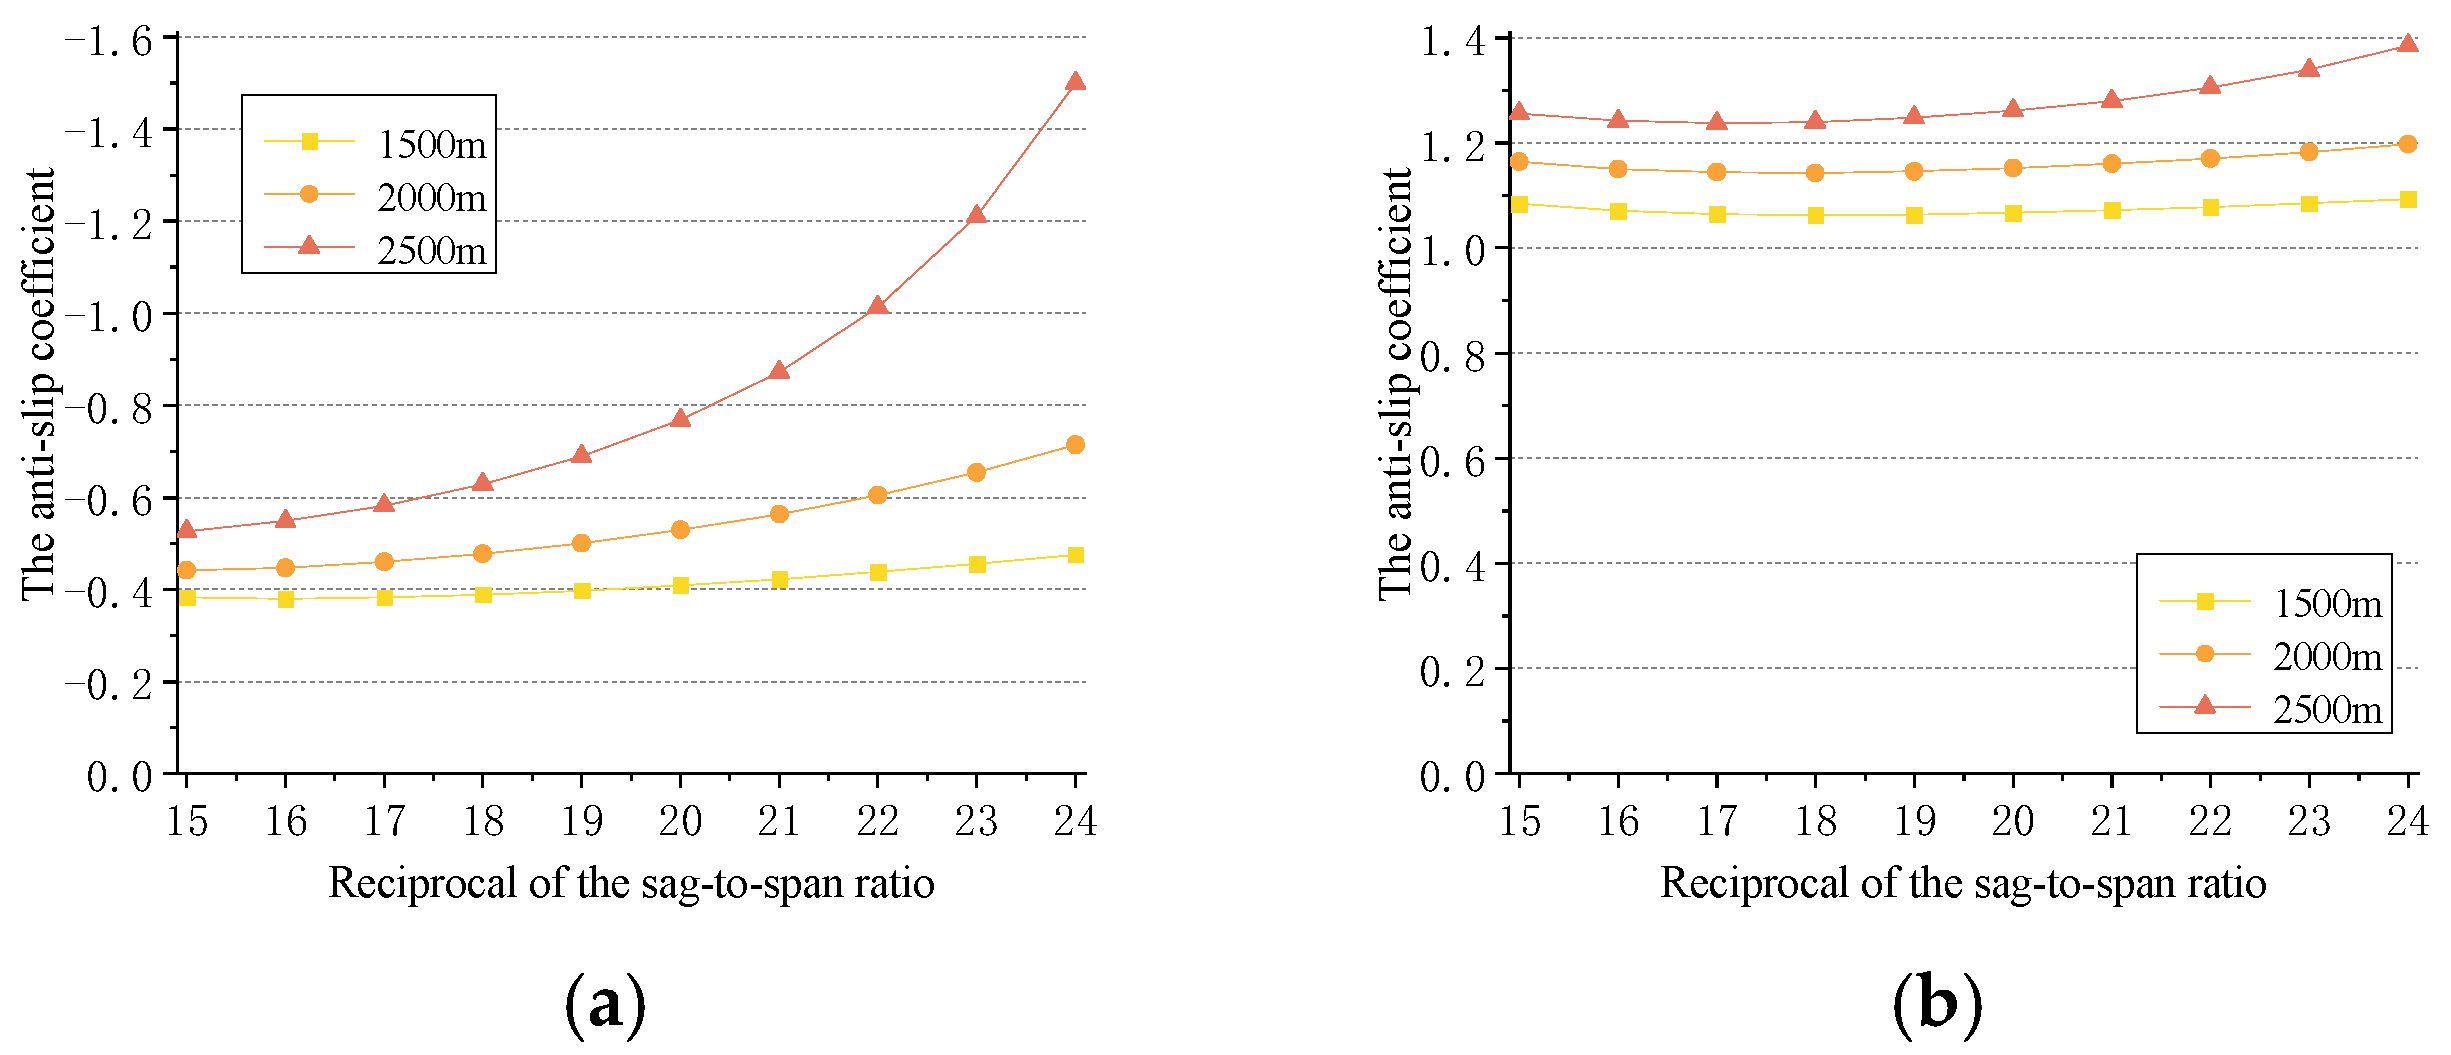
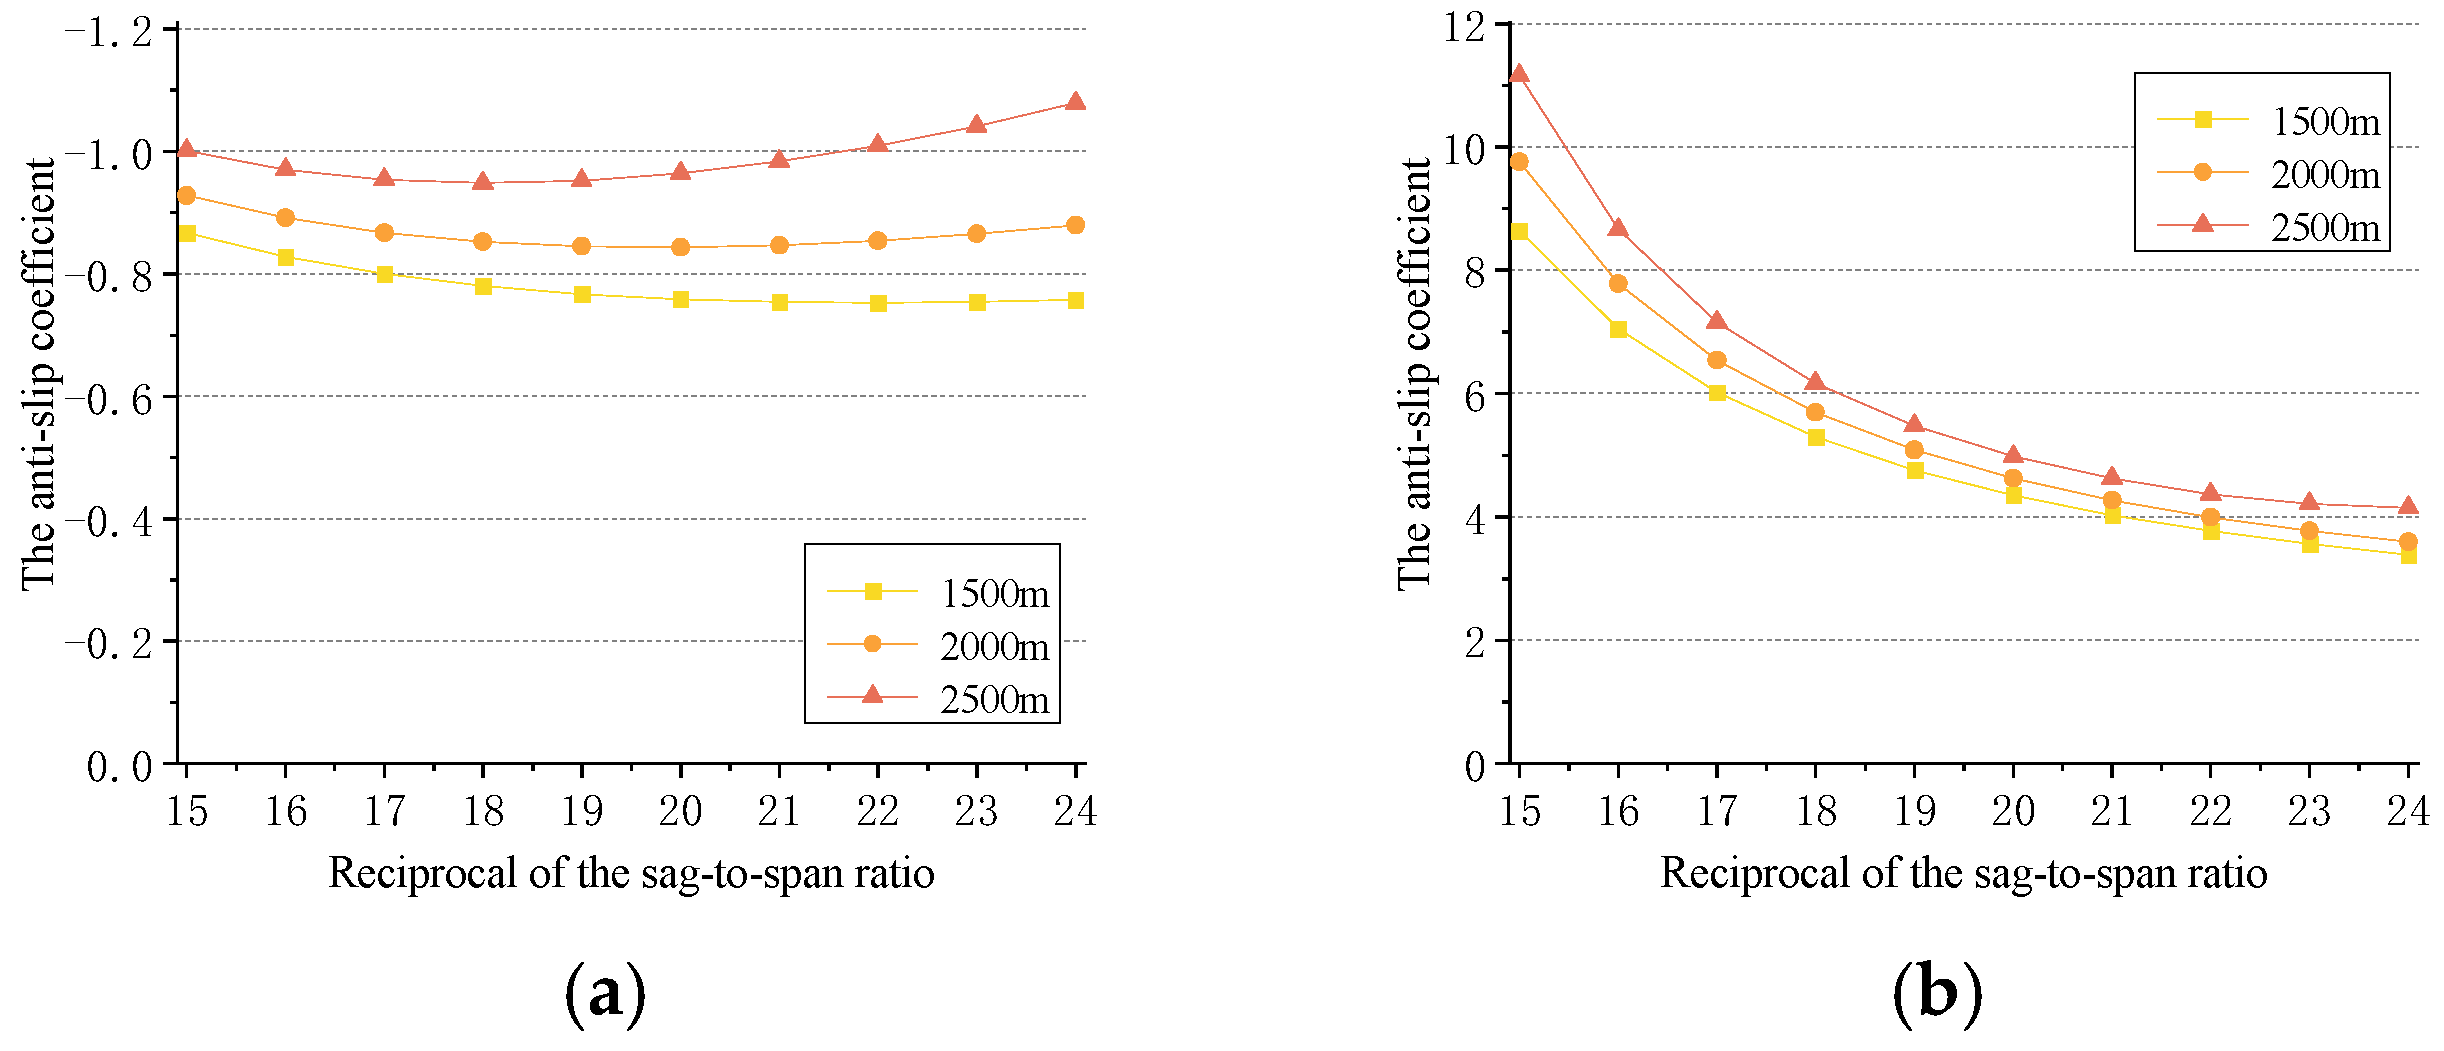
The anti-sliding coefficient between the cable and the saddle at the top of the middle and side towers is shown in Figure 19 and Figure 20. As the sag-to-span ratio of the top cable decreases, the anti-sliding coefficient of the top cable on the middle tower gradually increases, with a larger increase as the main span lengthens. Conversely, the anti-sliding coefficients of the bottom cable on the middle tower and the top cable on the side tower first decrease and then increase, but the changes are minimal. The anti-sliding coefficient of the side tower’s bottom cable decreases with the reduction in the top cable sag-to-span ratio, but it remains well above the required specification, meaning that there will be no saddle slip issue for the bottom cable at the side tower’s top saddle. Therefore, adopting a smaller top cable sag-to-span ratio can help improve the anti-sliding performance of the main cables, though the increase is not significant.
In summary, when the sag-to-span ratio of the top cable is relatively small, the vertical stiffness of the structure increases and the forces acting on the towers decrease. Therefore, selecting a top cable sag-to-span ratio between 1/19 and 1/21 ensures the desired mechanical performance. Specifically, for smaller main span lengths, a slightly smaller sag-to-span ratio for the top cable may be chosen to enhance the structural stiffness.

3.4. Influence of Side-to-Main Span Ratio

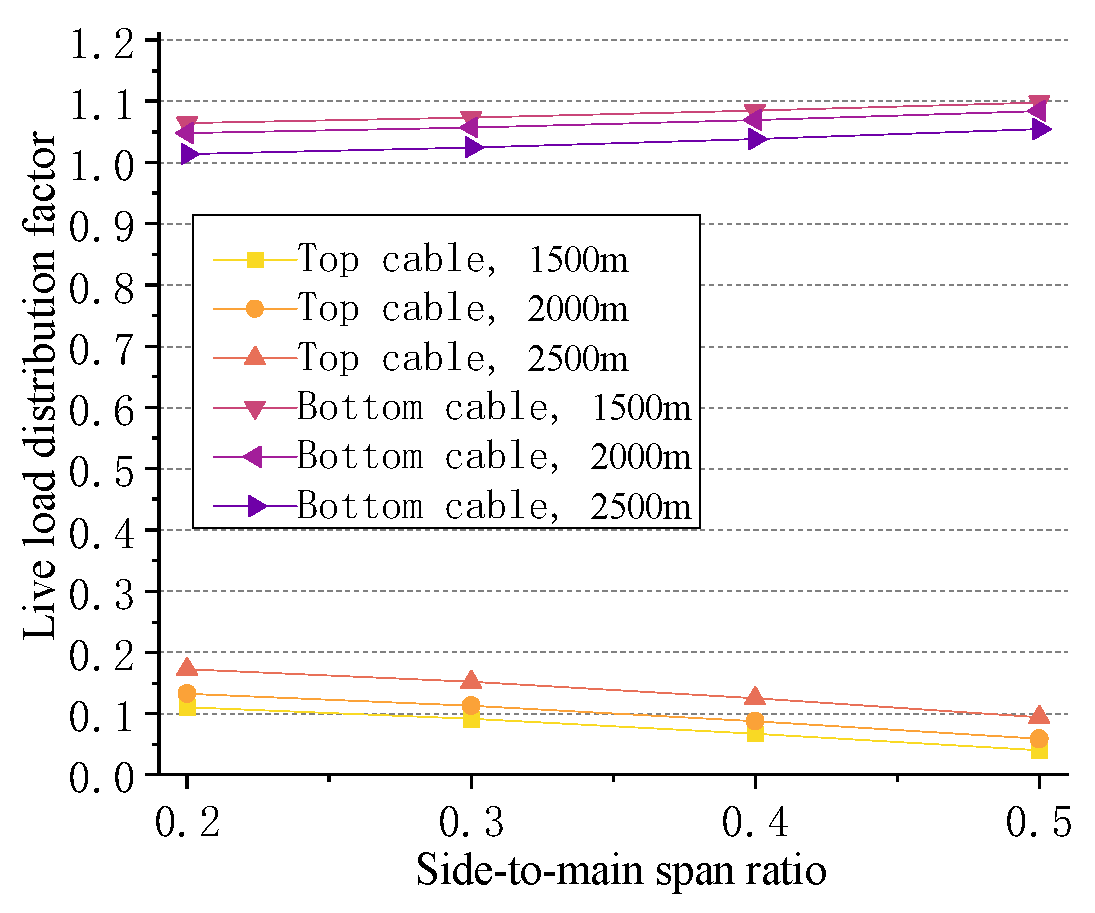
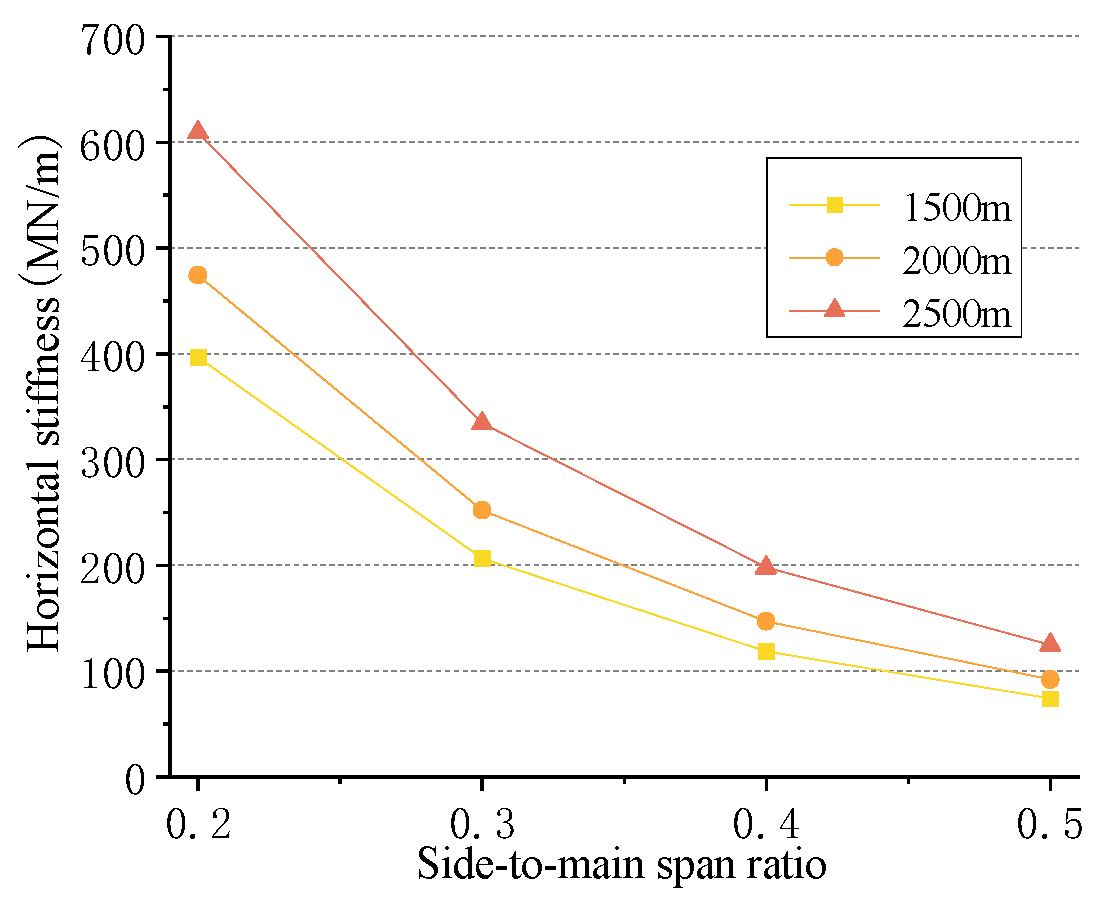
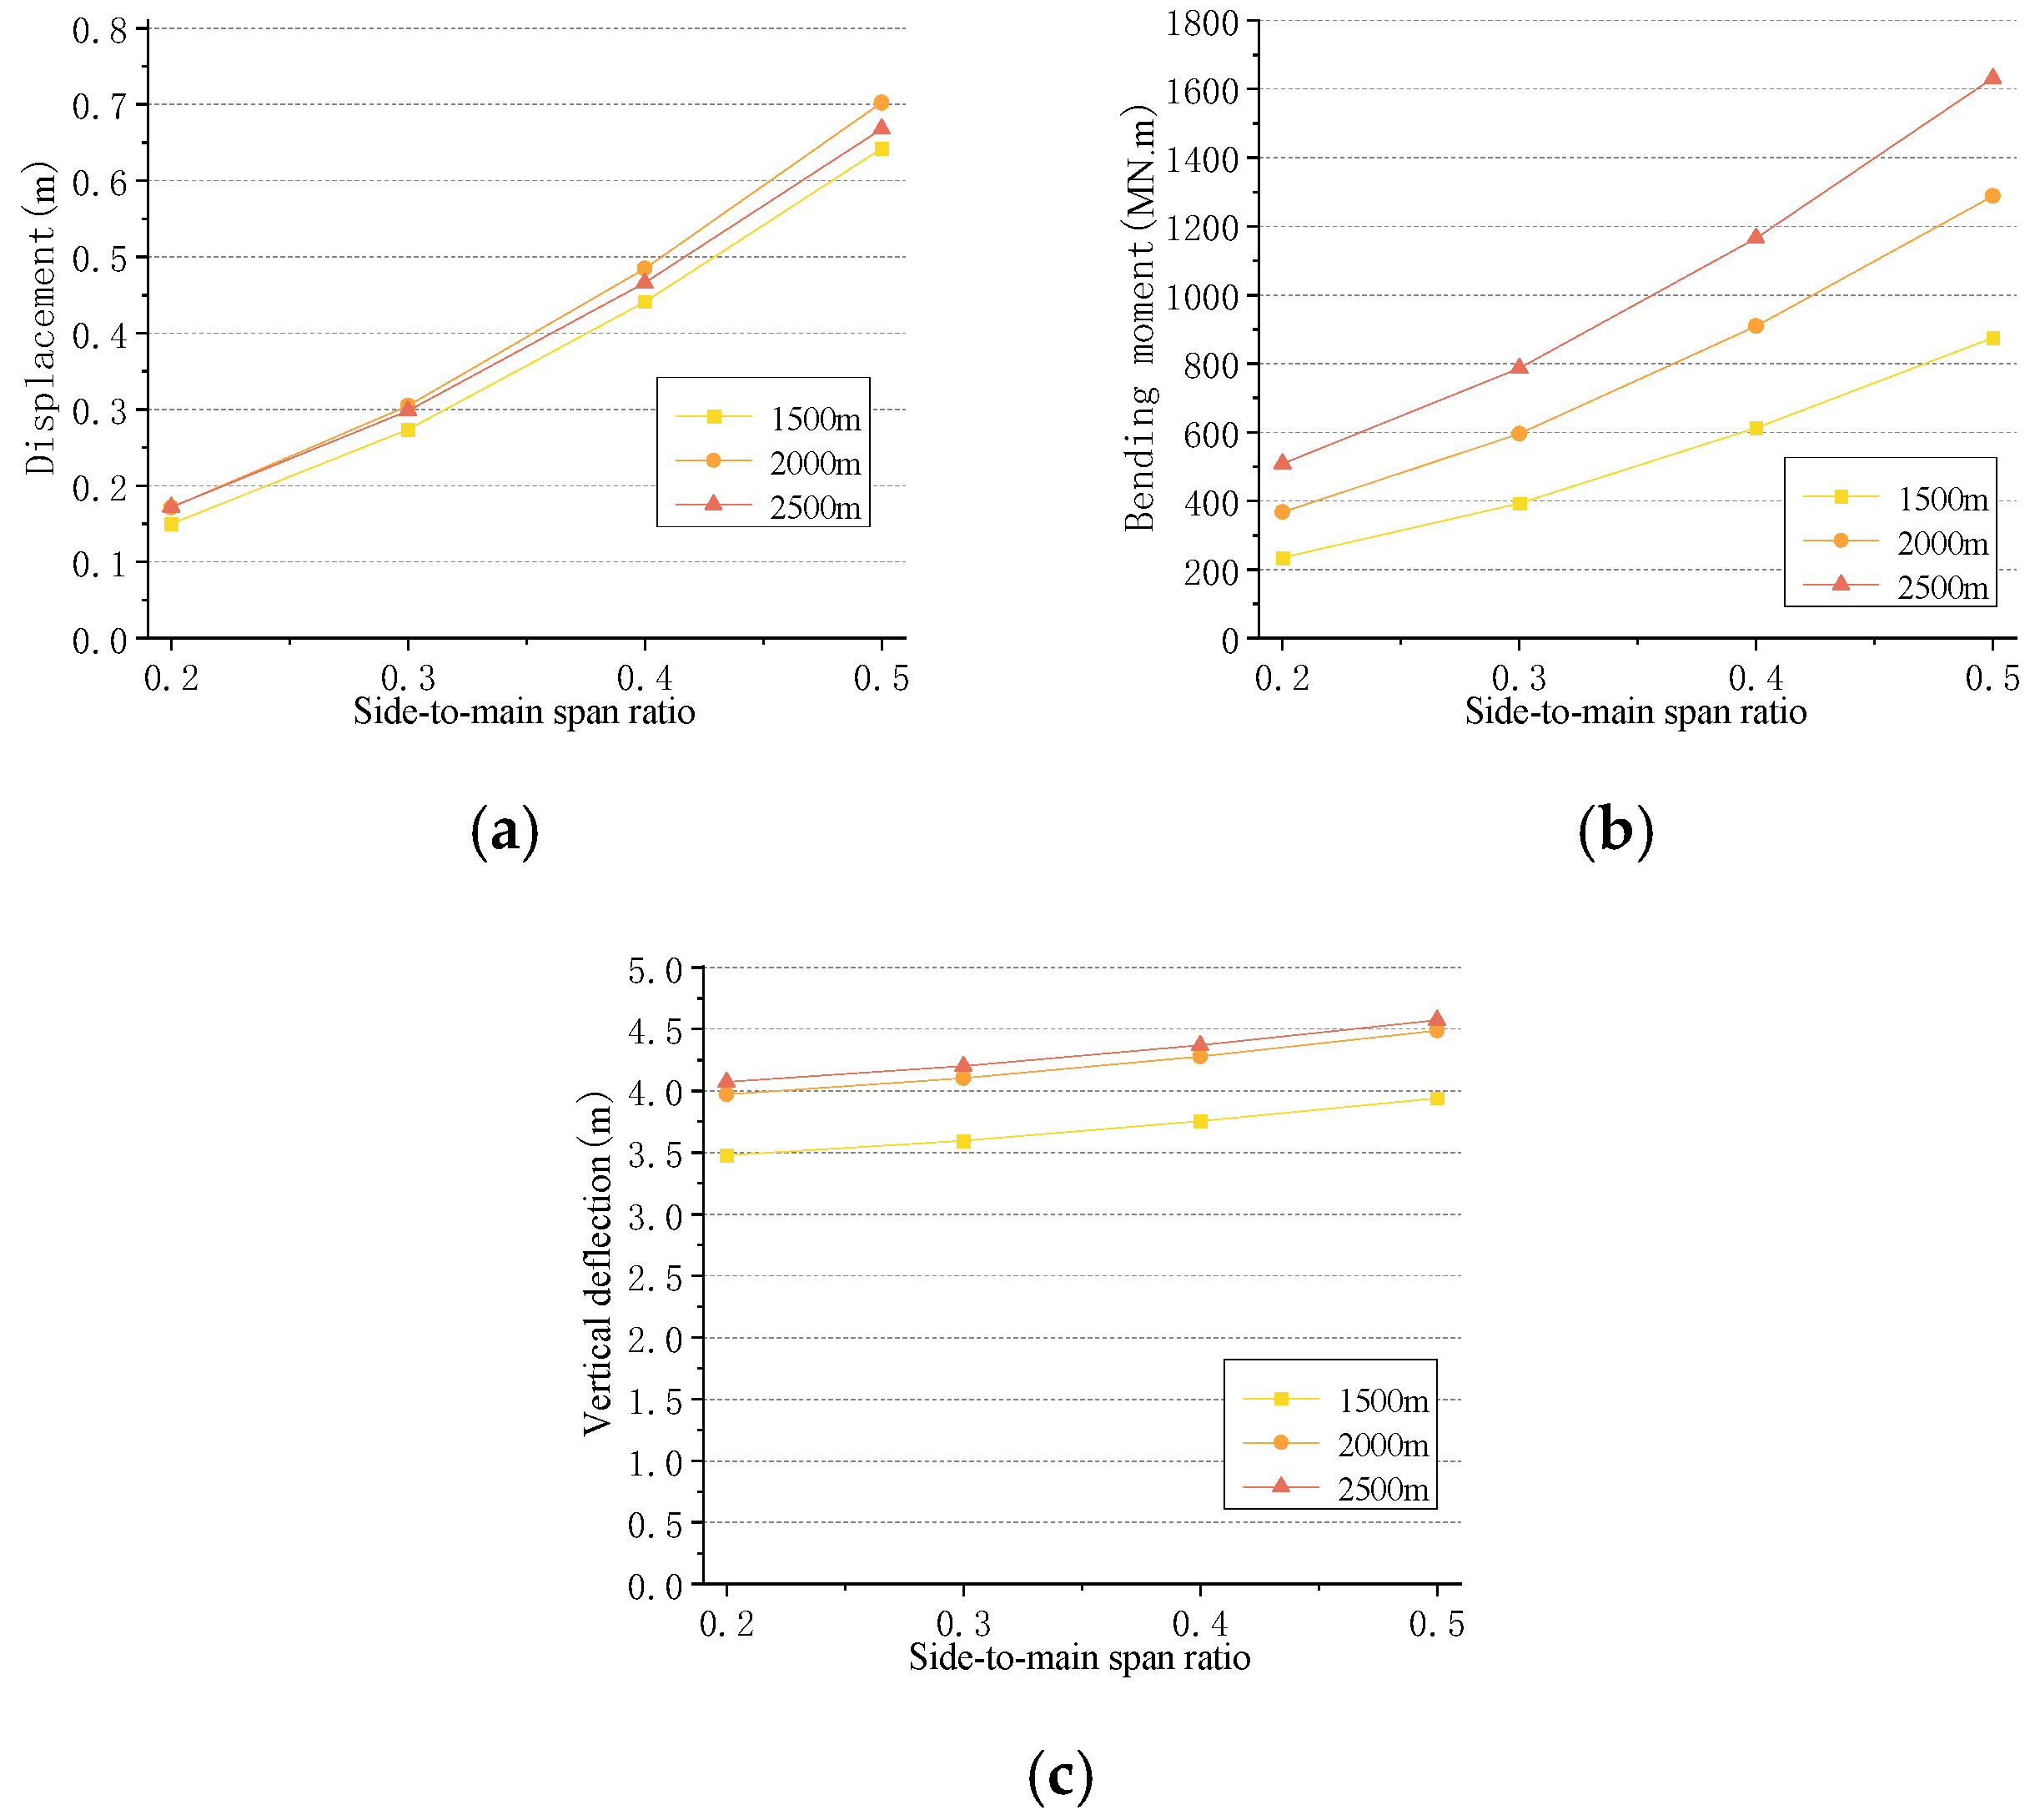
The influence of the side-to-main span ratio, ranging from 0.2 to 0.5, on the structural forces is illustrated in Figure 21, Figure 22 and Figure 23. As the side-to-main span ratio increases, the horizontal equivalent stiffness of the side span main cable rapidly decreases, significantly weakening its restraining effect on the side tower. This leads to a sharp increase in the displacement at the top of the side tower and the bending moment at the tower base under live load, while the vertical stiffness of the structure also decreases, although the impact on the central tower’s forces remains minimal. Under live load, the horizontal displacement of the main cable in the main span increases further, and the load transferred from the top cable to the bottom cable increases as well. Consequently, the live load sharing coefficient of the bottom cable increases, while that of the top cable decreases, with the latter being more significantly affected.
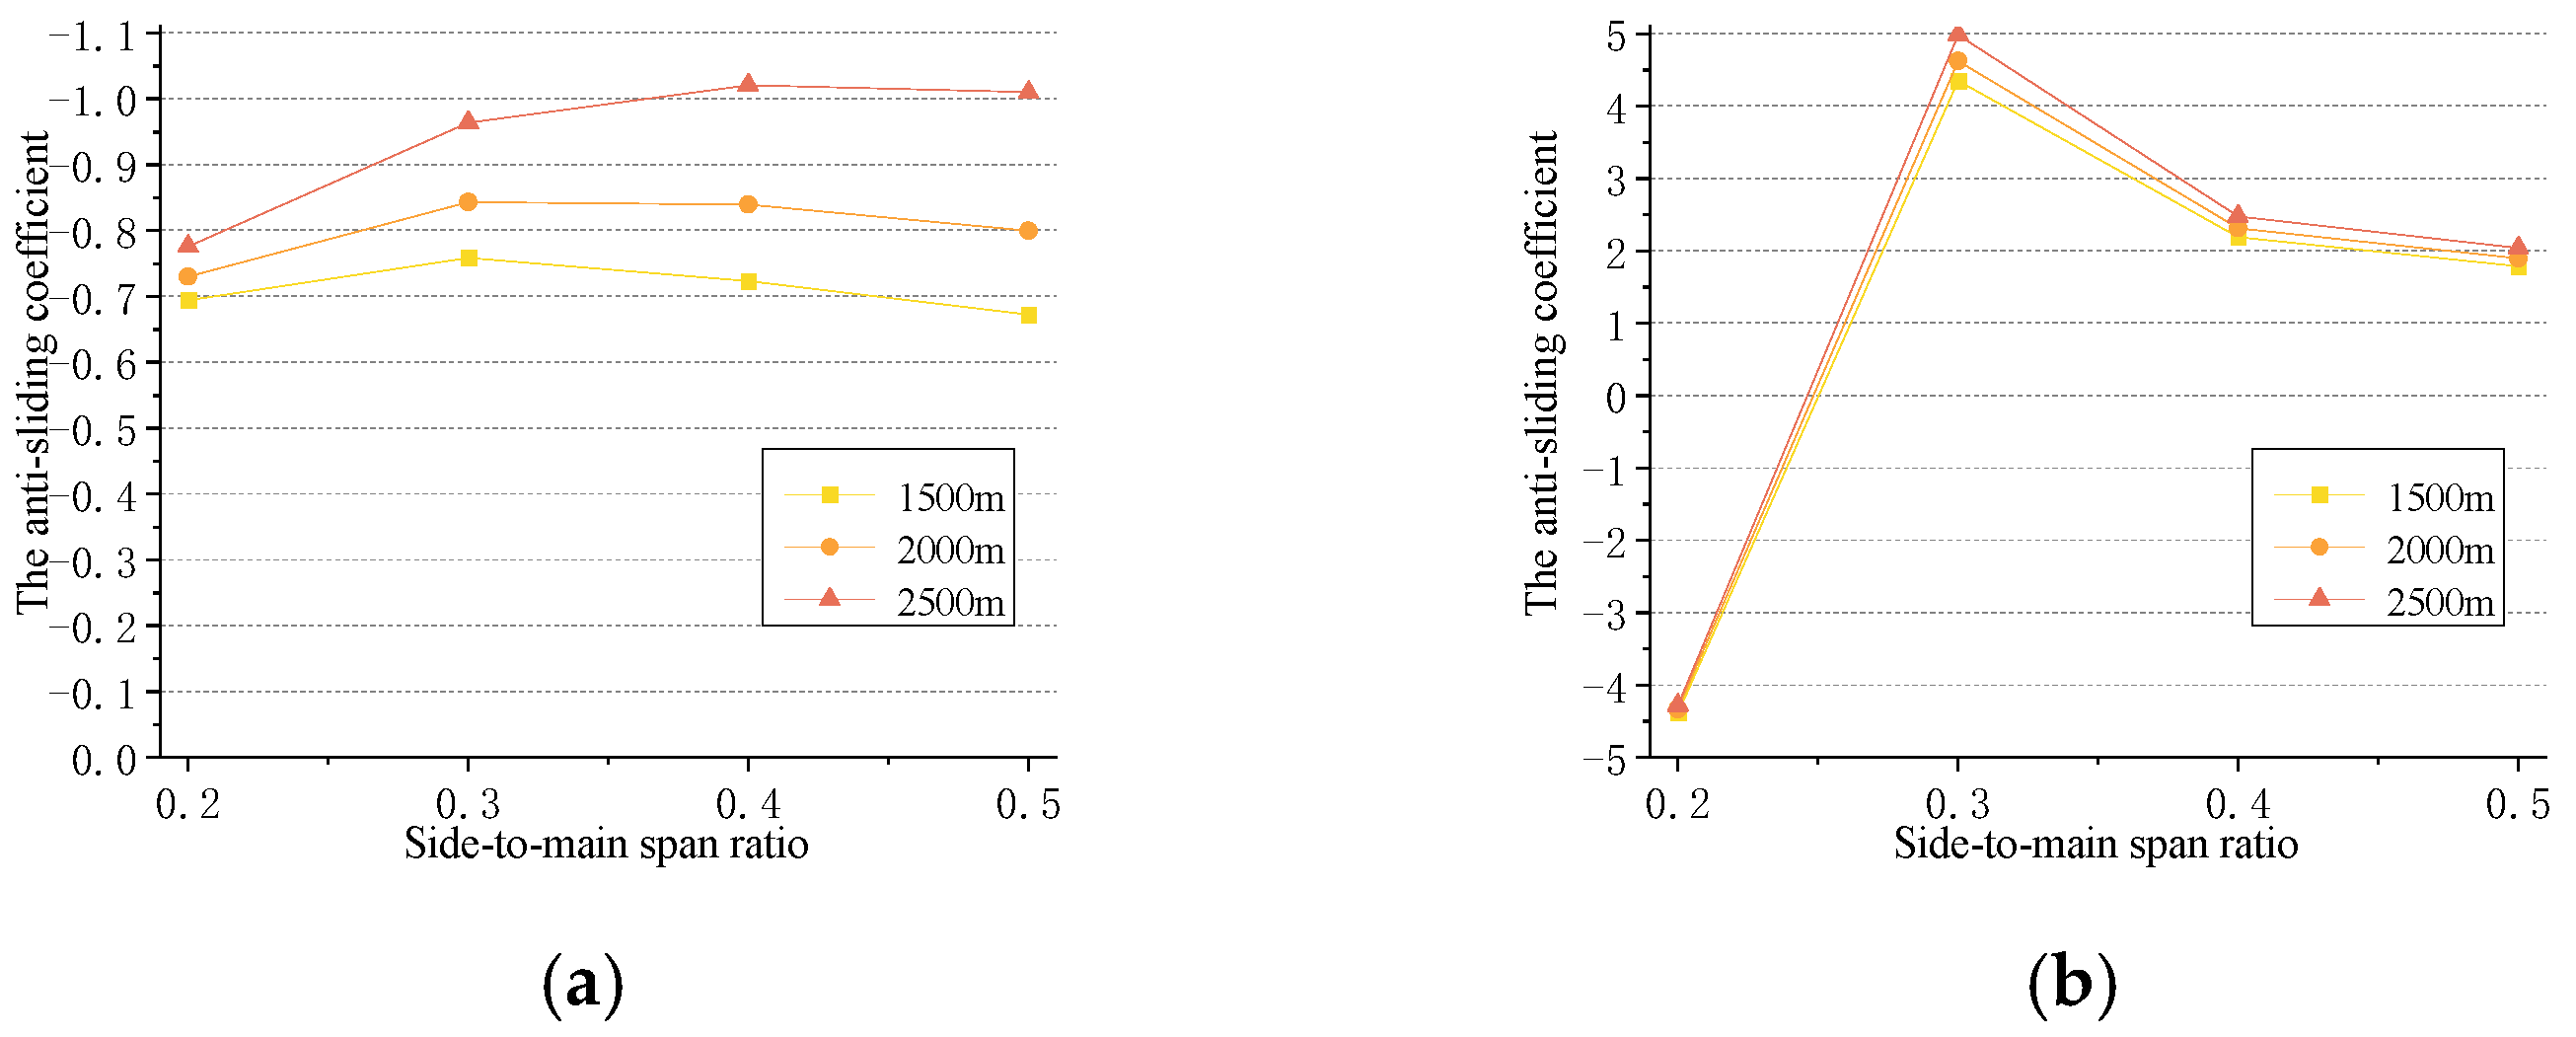
The anti-sliding coefficients between the cable and the saddle at the top of the side tower are presented in Figure 24. With an increasing side-to-main span ratio, the horizontal inclination angle of the top cable in the side span gradually decreases, reducing the axial force difference between the cables on each side of the side tower. However, the increasing displacement at the top of the side tower leads to a greater imbalance in the horizontal forces of the top cable on either side. As a result, the anti-sliding coefficient of the top cable initially increases and subsequently decreases. In contrast, the anti-sliding coefficient of the bottom cable primarily depends on the imbalance in horizontal forces between both sides of the side tower, causing it to decrease consistently as the side-to-main span ratio increases. When the side-to-main span ratio is 0.2, the horizontal inclination of the side span bottom cable becomes excessively large, resulting in an axial force in the side span bottom cable greater than that in the main span under live load; thus, the anti-sliding coefficient becomes negative.
In summary, the side-to-main span ratio significantly affects the forces on the side tower. A larger side-to-main span ratio leads to more unfavorable forces on the side tower. However, an excessively small side-to-main span ratio will cause a disproportionate horizontal inclination angle and axial force difference between the main cables on either side of the side tower. This is especially problematic in the cable-free state, where the saddle displacement at the side tower becomes large, posing challenges for both the structural design of the side tower saddle and the construction of the main cables.

3.5. Influence of Bridge Span Layout

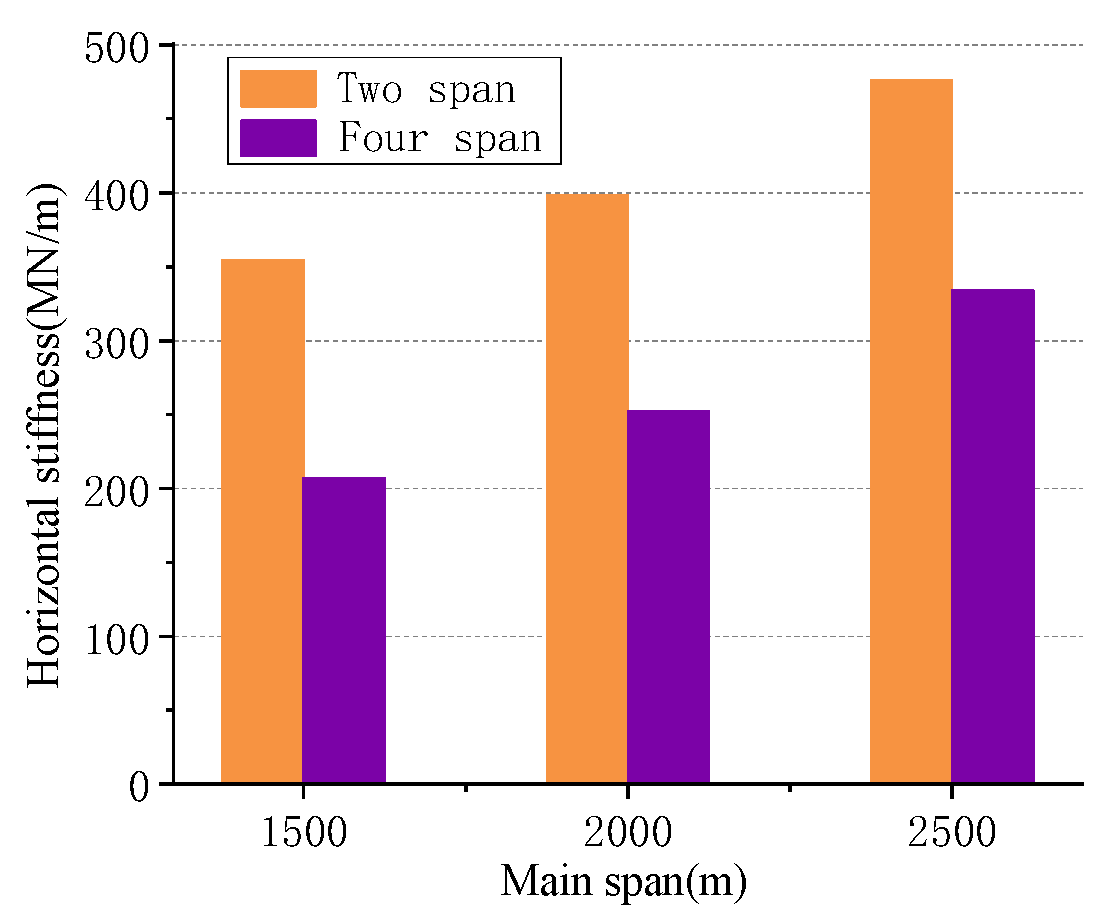
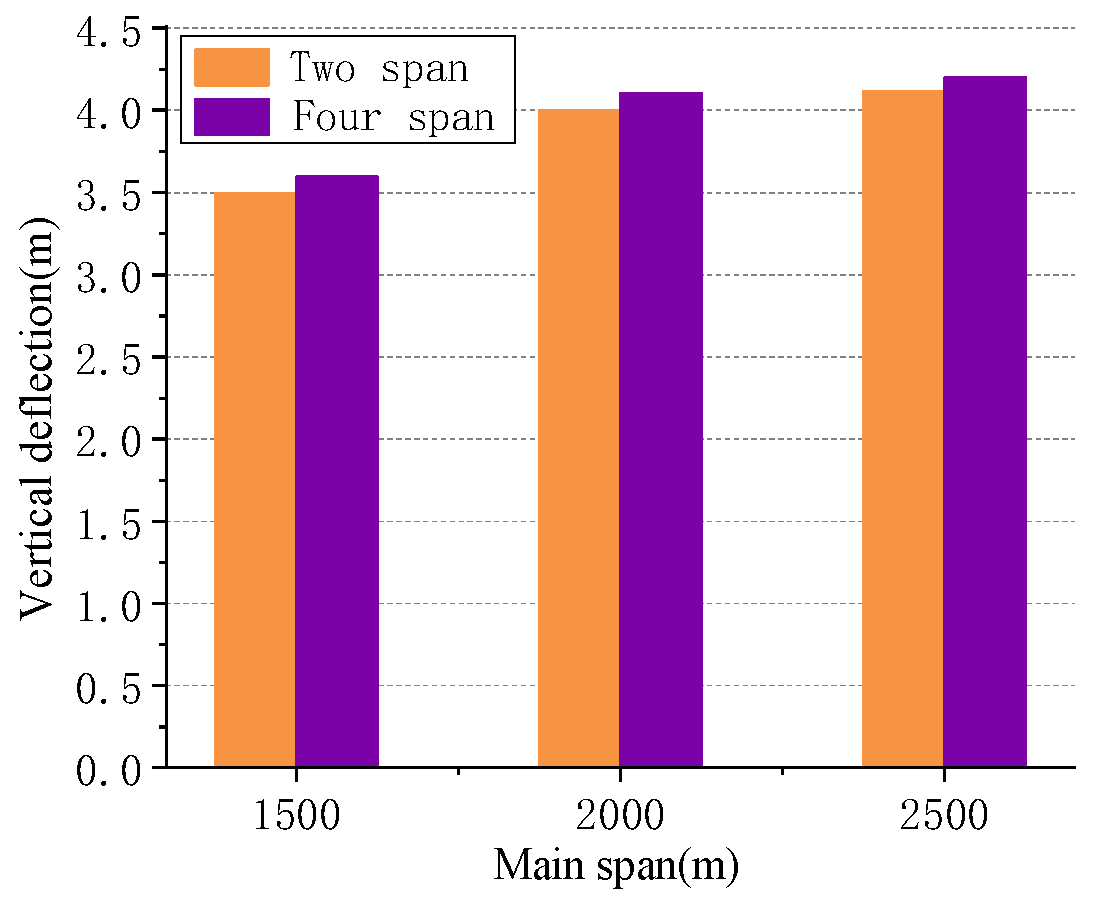
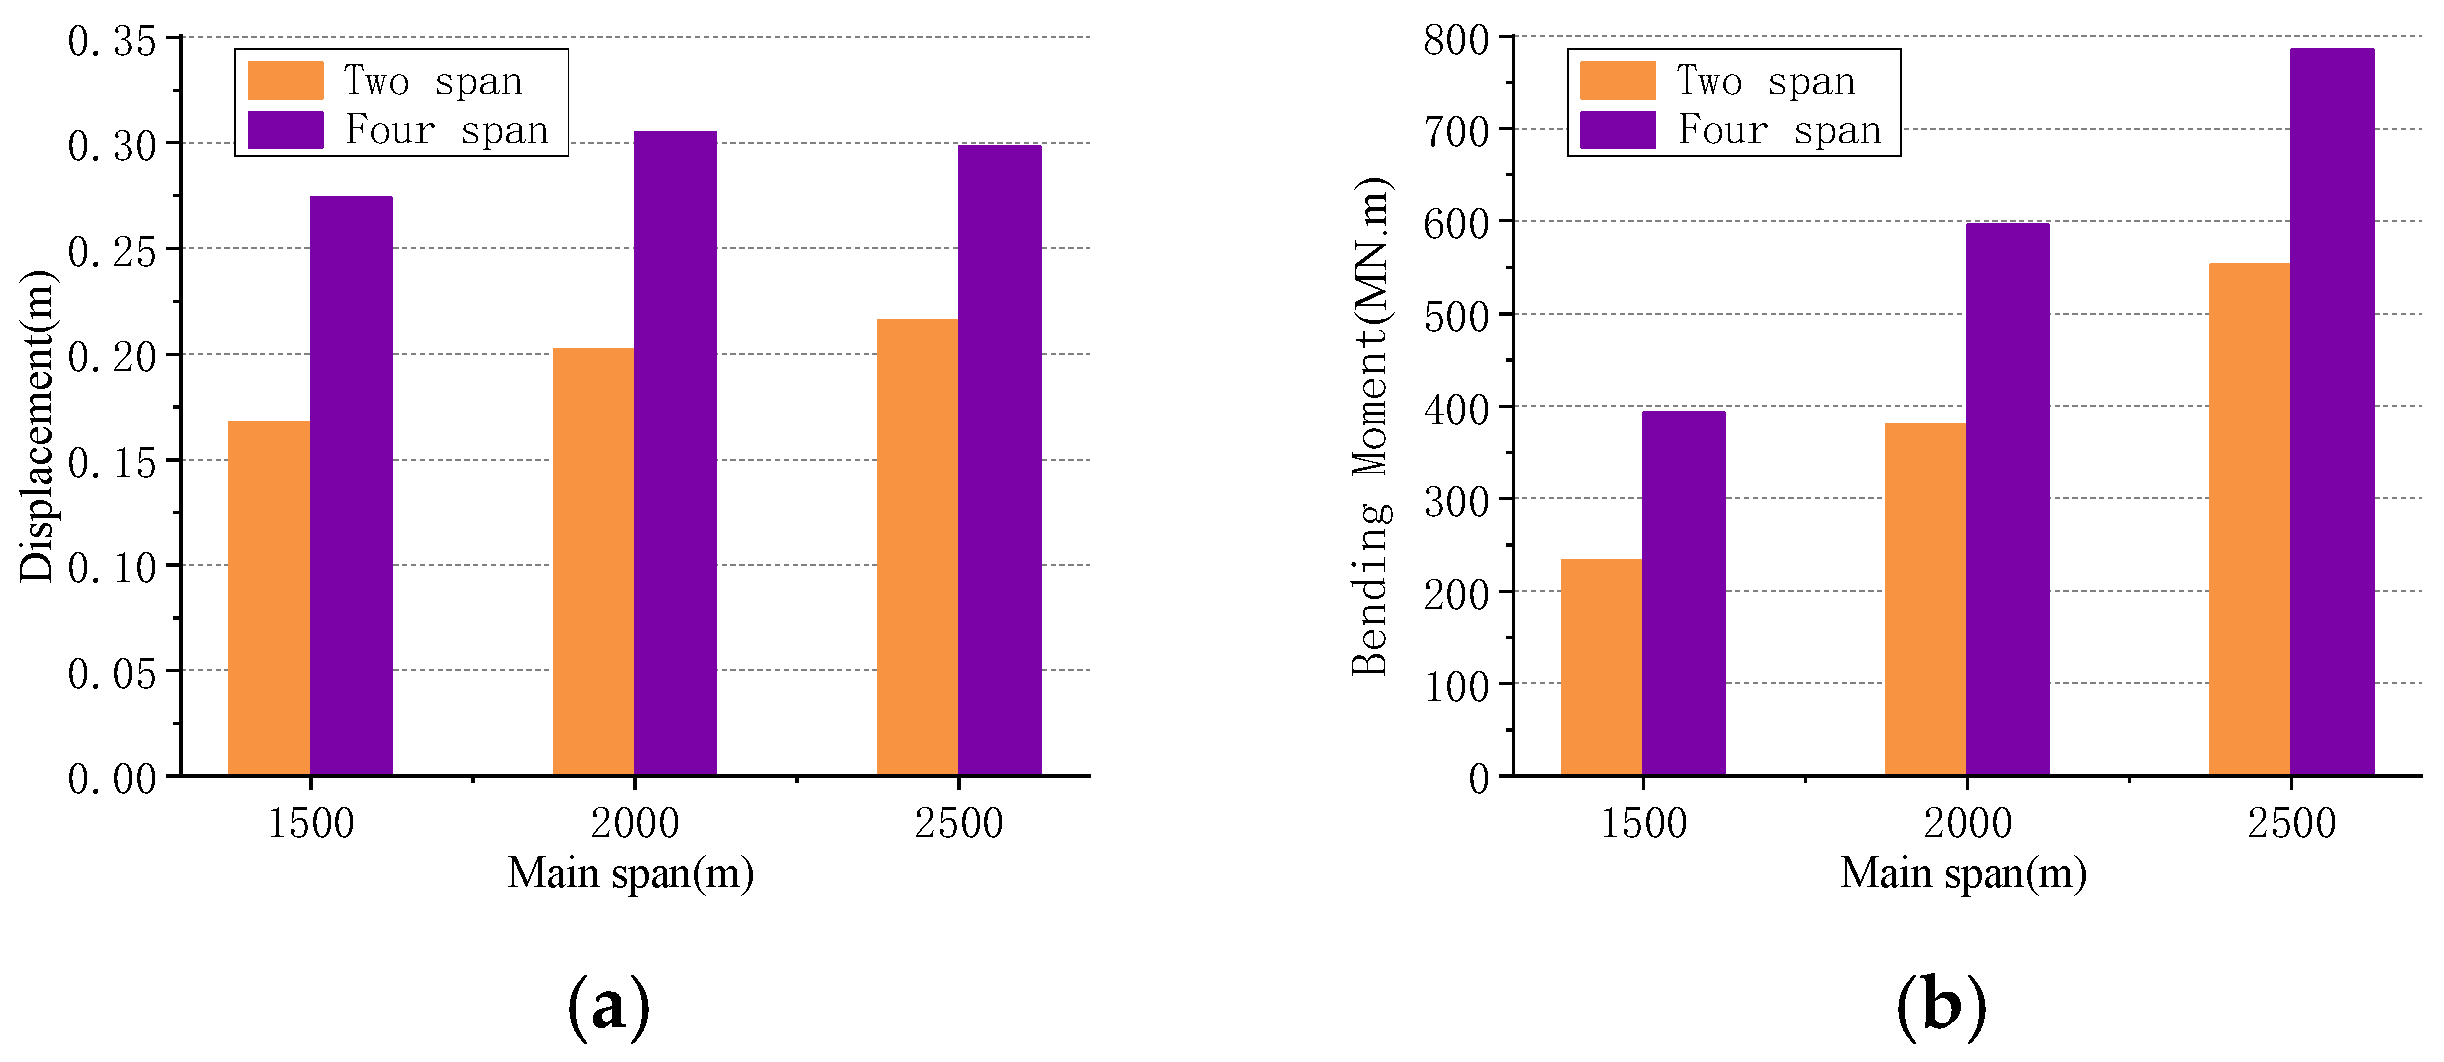
Taking the basic structure shown in Figure 1 as the research object, two bridge span layouts—the four-span system shown in Figure 1 and the two-span system in which the side span does not suspend the stiffening girder—are analyzed. The impact of different span arrangements on the structural responses is presented in Figure 25, Figure 26 and Figure 27. Compared to the four-span system, the two-span system, where the side span does not suspend the stiffening girder, exhibits a larger horizontal equivalent stiffness of the side span main cables. This results in a stronger constraint on the top of the side tower, leading to smaller displacements of the side tower top and reduced bending moments at the base under live load, with a slight reduction in the vertical deflection of the main span stiffening girder, though this decrease is limited to within 3%. Moreover, as the main span length increases, the differences between the two systems become less significant. The bridge span arrangement has minimal impact on the forces acting on the central tower.
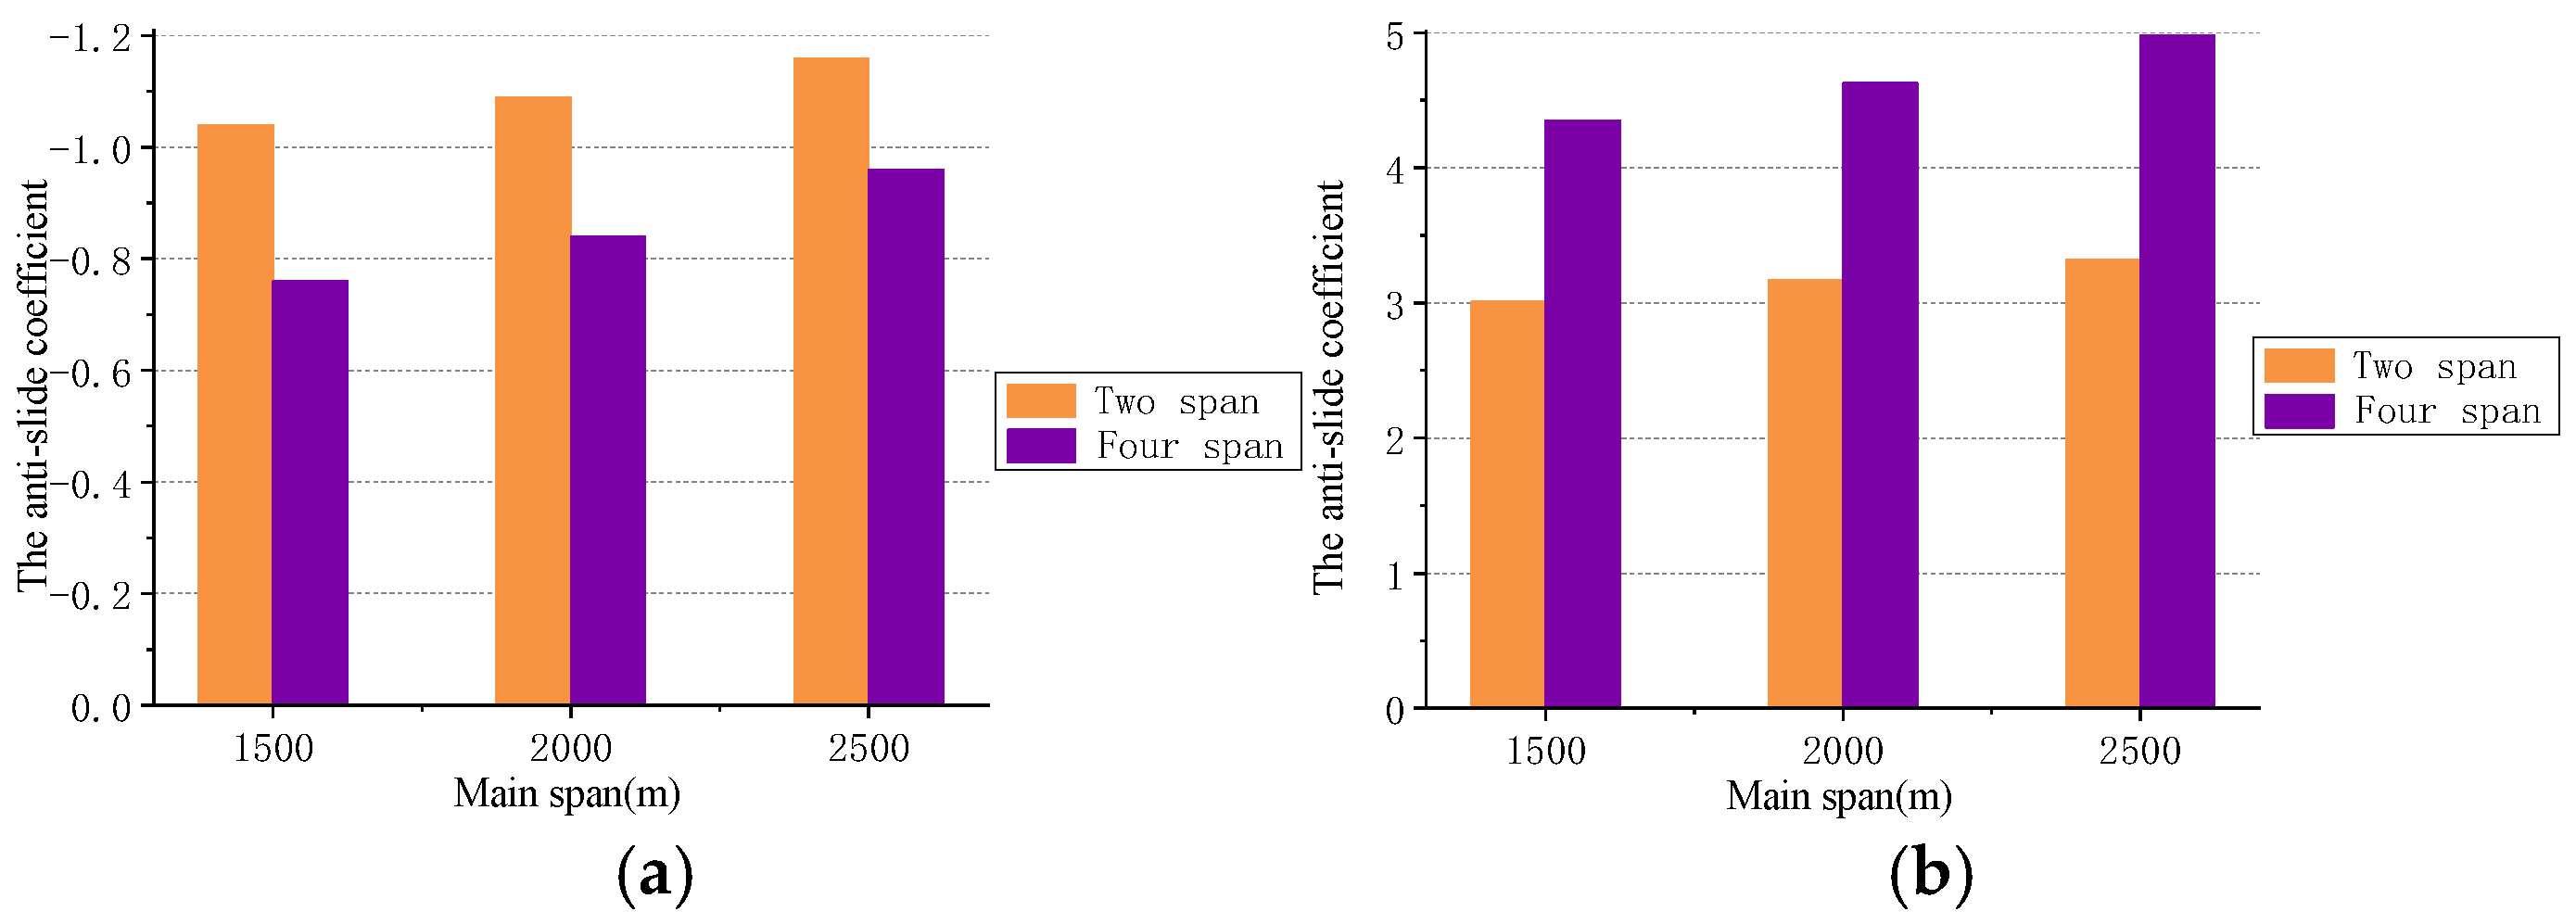
The anti-sliding coefficients between the cable and the saddle at the top of the side tower are shown in Figure 28. Since the horizontal force of the top cable on the side span is greater than that of the main span, a smaller displacement at the side tower top is beneficial for improving the anti-sliding coefficient of the top cable. Conversely, as the horizontal force of the main span’s bottom cable exceeds that of the side span bottom cable, a larger displacement at the side tower top favors an increase in the anti-sliding coefficient of the bottom cable. Therefore, the two-span system exhibits a larger anti-sliding coefficient for the top cable, while the four-span system demonstrates a larger anti-sliding coefficient for the bottom cable.

4. Conclusions

In this paper, the mechanical performance of the bi-cable three-tower suspension bridge was analyzed through theoretical analysis and parametric calculations, and the conclusions are as follows:
(1) Adopting a smaller dead load distribution coefficient for the top cable enhances the load-bearing efficiency of the bottom cable, reduces bending moments in the towers, and improves the bottom cable’s anti-sliding performance. However, this approach simultaneously results in a decreased anti-sliding coefficient for the top cable.
(2) Adopting a smaller longitudinal stiffness for the side tower can effectively reduce the bending moment in the tower shaft while having minimal impact on other structural force indicators. Therefore, the side tower only needs to meet its own structural force requirements.
(3) Owing to the significant gravitational stiffness and strong longitudinal constraint provided by the bi-cable system at the top of the middle tower, the structure maintains sufficient vertical stiffness even without considering the longitudinal stiffness of the middle tower. Reducing the middle tower’s longitudinal stiffness markedly decreases its bending moment, allowing the adoption of a conventional single-column middle tower in the longitudinal direction, thereby reducing the material consumption for the tower shaft and foundation. Conversely, increasing the middle tower’s longitudinal stiffness notably improves the anti-sliding coefficients of the main cables at the middle tower, especially enhancing the anti-sliding performance of the top cable.
(4) The vertical stiffness of the structure is primarily influenced by the sag difference between the top and bottom cables, with a larger sag difference resulting in greater vertical stiffness. As the sag-to-span ratio of the bottom cable increases, the load on the middle tower decreases, but this simultaneously increases the load on the side towers. Additionally, the anti-sliding coefficient of the main cable becomes very small, leading to potential saddle slippage issues. Given the challenges of constructing exceptionally tall towers, the selection of the bottom cable’s sag-to-span ratio is also constrained by the tower height. Conversely, as the sag-to-span ratio of the top cable decreases, the vertical stiffness of the structure increases, and the load on the towers decreases. Selecting a top cable sag-to-span ratio between 1/19 and 1/21 can effectively meet both mechanical and economic performance requirements.
(5) The side-to-main span ratio has a significant impact on the forces exerted on the side towers. As the side-to-main span ratio increases, the forces on the side towers become less favorable.
(6) Compared to the four-span system, the two-span system results in smaller displacements at the top of the side towers and reduced tower bottom bending moments, with a slight increase in the vertical stiffness of the structure. However, when considering economic performance, the choice of span arrangement should also take into account the terrain and geological conditions of the side spans.

Author Contributions

Conceptualization, T.L.; methodology, T.L. and W.C.; formal analysis, T.L., Y.W. and W.C.; investigation, W.C., L.J. and K.L.; Data curation, L.J. and K.L.; writing—original draft preparation, T.L.; writing—review and editing, W.C. and Y.W.; supervision, L.J. and W.C.; project administration, W.C. All authors have read and agreed to the published version of the manuscript.

Funding

This work was supported Jiangxi Provincial Department of Transportation Science and Technology Project (2024ZG002) and project supported by Jiangxi Provincial Natural Science Foundation (220252BAC240360).

Data Availability Statement

The data of this study are available from the corresponding author upon reasonable request.

Acknowledgments

The authors sincerely thank the people who assisted in the writing and publication process of the paper.

Conflicts of Interest

Authors Tie Li, and Yangfeng Wei were employed by the company China Construction Infrastructure Co., Ltd.; Author Wenjun Chen was employed by the company Jiangxi Communications Design and Research Institute Co., Ltd. The remaining authors declare that the research was conducted in the absence of any commercial or financial relationships that could be construed as a potential conflict of interest.

References

  1. Jennings, A. Deflection theory analysis of different cable profiles for suspension bridges. Eng. Struct. 1987, 9, 84–94. [Google Scholar] [CrossRef]
  2. Sato, K. Deflection theory of multispan suspension bridges considering deflection of towers and its numerical examples of various influence lines. Proc. Jpn. Soc. Civ. Eng. 1971, 1971, 11–22. [Google Scholar] [CrossRef] [PubMed]
  3. Hayashikawa, T.; Watanabe, N. Suspension bridge response to moving loads. J. Eng. Mech. Div. 1982, 108, 1051–1066. [Google Scholar] [CrossRef]
  4. Jennings, A. Gravity stiffness of classical suspension bridges. J. Struct. Eng. 1983, 109, 16–36. [Google Scholar] [CrossRef]
  5. Choi, D.-H.; Gwon, S.-G.; Yoo, H.; Na, H.-S. Nonlinear static analysis of continuous multi-span suspension bridges. Int. J. Steel Struct. 2013, 13, 103–115. [Google Scholar] [CrossRef]
  6. Thai, H.-T.; Choi, D.-H. Advanced analysis of multi-span suspension bridges. J. Constr. Steel Res. 2013, 90, 29–41. [Google Scholar] [CrossRef]
  7. Choi, D.-H.; Na, H.-S.; Gwon, S.-G. Initial equilibrium state analysis of cable members for preliminary analysis of multi-span suspension bridge under dead load. J. Korean Soc. Civ. Eng. 2016, 36, 21–29. [Google Scholar] [CrossRef]
  8. Zhang, Q.; Li, Q.; Zhou, L. Theoretical Analysis of Cable-saddle Friction Characteristics for Suspension Bridges. China J. Highw. Transp. 2014, 27, 44–50. [Google Scholar] [CrossRef]
  9. Choi, D.-H.; Gwon, S.-G.; Na, H.-S. Simplified analysis for preliminary design of towers in suspension bridges. J. Bridge Eng. 2014, 19, 4013007. [Google Scholar] [CrossRef]
  10. Song, T.; Wang, B.; Song, Y. A simplified calculation method for multi-tower self-anchored suspension bridges based on frame structure theory model. Int. J. Steel Struct. 2022, 22, 373–388. [Google Scholar] [CrossRef]
  11. Chai, S.; Xiao, R.; Li, X. Longitudinal restraint of a double-cable suspension bridge. J. Bridge Eng. 2014, 19, 6013002. [Google Scholar] [CrossRef]
  12. Jia, L.; Zhang, C.; Jiang, Y.; Cheng, J.; Xiao, R. Simplified calculation methods for static behaviors of triple-tower suspension bridges and parametric study. Int. J. Steel Struct. 2018, 18, 685–698. [Google Scholar] [CrossRef]
  13. Jia, L.; Jiang, Y.; Xiao, R.; Xu, D. Simplified method for static analysis of bi-cable triple-pylon suspension bridges. Adv. Struct. Eng. 2019, 22, 1175–1185. [Google Scholar] [CrossRef]
  14. Chen, Y.; Wang, S.; Zhong, J.; Lian, F. Study on static analytical method of multi-tower self-anchored suspension bridge. Appl. Sci. 2022, 12, 8499. [Google Scholar] [CrossRef]
  15. Choi, D.-H.; Na, H.-S.; Gwon, S.G.; Yoo, D.H.; Moon, C. A parametric study on the ultimate behaviors of multi-span suspension bridges. IABSE Symp. Rep. 2010, 97, 282–283. [Google Scholar]
  16. Song, C.; Xiao, R.; Sun, B. Improved method for shape finding of long-span suspension bridges. Int. J. Steel Struct. 2020, 20, 247–258. [Google Scholar] [CrossRef]
  17. Song, C.; Xiao, R.; Sun, B.; Wang, Z.; Zhang, C. Cable force optimization of cable-stayed bridges: A surrogate model-assisted differential evolution method combined with B-Spline interpolation curves. Eng. Struct. 2023, 283, 115856. [Google Scholar] [CrossRef]
  18. Song, C.; Sun, B.; Zhang, C.; Xiao, R. High-dimensional reliability-based structural design optimization: A surrogate model-assisted decoupled method based on importance sampling quantiles. Eng. Struct. 2025, 327, 119549. [Google Scholar] [CrossRef]
  19. Mao, Y.; Xiao, F.; Tian, G.; Rakicevic, Z. Sensitivity analysis and sensor placement for damage identification of steel truss bridge. Structures 2025, 73, 108310. [Google Scholar] [CrossRef]
  20. Xiao, F.; Tian, G.; Mao, Y.; Xiang, Y. Stiffness separation method for damage identification of steel truss bridge: Exploring diverse separation interfaces. Struct. Control Health Monit. 2025, 2025, 1827097. [Google Scholar] [CrossRef]
  21. Jia, L.; Wang, J.; Jiang, Y.; Xu, R. A parametric study of long-span triple-tower suspension bridge. Adv. Struct. Eng. 2020, 23, 3185–3194. [Google Scholar] [CrossRef]
  22. Cao, H.; Qian, X.; Zhou, Y.; Chen, Z.; Zhu, H. Feasible range for midtower lateral stiffness in three-tower suspension bridges. J. Bridge Eng. 2018, 23, 6017009. [Google Scholar] [CrossRef]
  23. Cao, H.; Chen, Y.; Li, J.; Liu, S. Static characteristics analysis of three-tower suspension bridges with central buckle using a simplified model. Eng. Struct. 2021, 245, 112916. [Google Scholar] [CrossRef]
  24. Liu, S.; Chen, Z.; Cao, H.; Shao, C. An analytical model for three-tower self-anchored suspension bridges with longitudinal tower-girder connections. Structures 2023, 48, 1455–1467. [Google Scholar] [CrossRef]
  25. Ma, X.; Sun, Q.; Li, Z.; Fan, J.; Liu, Y.; Liu, J.-Z. Deformation and internal force of multitower suspension bridges: Numerical modeling and analytical analysis. Adv. Struct. Eng. 2024, 28, 811–827. [Google Scholar] [CrossRef]
  26. Jiao, C.; Li, A.; Wang, H. Analysis on Parameters of Dynamic Property of Triple-pylon Suspension Bridge. J. Highw. Transp. Res. Dev. (Chin. Ed.) 2010, 27, 51–55. [Google Scholar]
  27. Li, W.; Wang, Y.; Sun, Y.; Wu, H.; Li, P. Effect of structural connections on three-pylon suspension bridges based on analyzing influence lines. J. Harbin Inst. Technol. (Chin. Ed.) 2017, 49, 170–174. [Google Scholar]
  28. Zhang, W.; Yang, C.; Wang, Z.; Liu, Z. An analytical algorithm for reasonable central tower stiffness in the three-tower suspension bridge with unequal-length main spans. Eng. Struct. 2019, 199, 109595. [Google Scholar] [CrossRef]
  29. Zhang, J.; Huang, H.; Liu, A.; Mei, L.; Li, Y. An overall bridge model test study on the mechanical behaviors in the process of system transformation of self-anchored suspension bridge with spatial cable system. China Civ. Eng. J. 2011, 44, 108–115. [Google Scholar] [CrossRef]
  30. Li, C.; Yao, M.; Ke, H. Calculation Method on Lean Busbar Saddle’s Position of Suspension Bridge with Spatial Cables. China J. Highw. Transp. 2009, 22, 48–53, 59. [Google Scholar] [CrossRef]
Figure 1. Schematic diagram of the bridge layout for the calculation.
Buildings 16 02092 g001
Figure 2. Influence of the dead load distribution factor of the top cable on the main cable cross-sectional area and live load distribution factor. (a) Cross-sectional area of the top and bottom cable. (b) Total cross-sectional area of the main cable. (c) Live load distribution coefficient.
Buildings 16 02092 g002
Figure 3. Horizontal forces of the main cable under live load at single main span. (a) Individual horizontal forces. (b) Total horizontal forces.
Buildings 16 02092 g003
Figure 4. Horizontal forces of the main cable under live load at double main span. (a) Individual horizontal forces. (b) Total horizontal forces.
Buildings 16 02092 g004
Figure 5. Influence of the top cable dead load distribution factor on tower forces and vertical deflection of the stiffening girder. (a) Longitudinal displacement at the top of the side tower. (b) Longitudinal displacement at the top of the middle tower. (c) Vertical deflection at mid-span of the stiffening girder. (d) Bending moment at the bottom of the side tower. (e) Bending moment at the bottom of the middle tower.
Buildings 16 02092 g005
Figure 6. Influence of the dead load distribution factor of the top cable on the anti-sliding coefficient of the middle tower. (a) Top cable. (b) Bottom cable.
Buildings 16 02092 g006
Figure 7. Influence of the dead load distribution factor of the top cable on the anti-sliding coefficient of the side tower. (a) Top cable. (b) Bottom cable.
Buildings 16 02092 g007
Figure 8. Influence of side tower stiffness on the forces acting on the side tower. (a) Longitudinal displacement at the top of the tower. (b) Bending moment at the bottom of the tower.
Buildings 16 02092 g008
Figure 9. Influence of side tower stiffness on the anti-sliding coefficient between the cable and the saddle at the top of the side tower. (a) Top cable. (b) Bottom cable.
Buildings 16 02092 g009
Figure 10. Influence of middle tower stiffness on the forces of the middle tower and the vertical deflection of the stiffening girder. (a) Longitudinal displacement at the top of the middle tower. (b) Bending moment at the base of the middle tower. (c) Vertical deflection of the stiffening girder.
Buildings 16 02092 g010
Figure 11. Influence of the middle tower stiffness on the anti-sliding coefficient between the saddle and the cable at the top of the middle tower. (a) Top cable. (b) Bottom cable.
Buildings 16 02092 g011
Figure 12. Influence of the bottom cable sag-to-span ratio on the cross-sectional area of the bottom cable and the live load distribution coefficient. (a) Cross-sectional area of the bottom cable. (b) Live load distribution coefficient.
Buildings 16 02092 g012
Figure 13. Influence of the bottom cable sag-to-span ratio on the equivalent horizontal stiffness of the main cable. (a) Main span. (b) Side span.
Buildings 16 02092 g013
Figure 14. Influence of the bottom cable sag-to-span ratio on the forces in the tower and the vertical deflection of the stiffening girder. (a) Longitudinal displacement at the top of the side tower. (b) Longitudinal displacement at the top of the middle tower. (c) Vertical deflection of the stiffening girder. (d) Bending moment at the bottom of the side tower. (e) Bending moment at the bottom of the middle tower.
Buildings 16 02092 g014
Figure 15. Influence of the bottom cable sag-to-span ratio on the anti-sliding coefficient between the cable and the saddle at the top of the middle tower. (a) Top cable. (b) Bottom cable.
Buildings 16 02092 g015
Figure 16. Influence of the bottom cable sag-to-span ratio on the anti-sliding coefficient between the cable and the saddle at the top of the side tower. (a) Top cable. (b) Bottom cable.
Buildings 16 02092 g016
Figure 17. Influence of the top cable sag-to-span ratio on main cable characteristics and live load distribution factor. (a) Cross-sectional area of the top cable. (b) Live load distribution factor. (c) Horizontal stiffness of the main cable at the main span.
Buildings 16 02092 g017
Figure 18. Influence of the top cable sag-to-span ratio on the forces in the tower and the vertical deflection of the stiffening girder. (a) Longitudinal displacement at the top of the side tower. (b) Longitudinal displacement at the top of the middle tower. (c) Vertical deflection of the stiffening girder. (d) Bending moment at the bottom of the side tower. (e) Bending moment at the bottom of the middle tower.
Buildings 16 02092 g018
Figure 19. Influence of the top cable sag-to-span ratio on the anti-sliding coefficient between the cable and the saddle at the top of the middle tower. (a) Top cable. (b) Bottom cable.
Buildings 16 02092 g019
Figure 20. Influence of the top cable sag-to-span ratio on the anti-sliding coefficient between the cable and the saddle at the top of the side tower. (a) Top cable. (b) Bottom cable.
Buildings 16 02092 g020
Figure 21. Influence of the side-to-main span ratio on the horizontal stiffness of the main cable in the side span.
Buildings 16 02092 g021
Figure 22. Influence of the side-to-main span ratio on the live load distribution factor.
Buildings 16 02092 g022
Figure 23. Influence of the side-to-main span ratio on the structural forces acting on the side tower and the vertical deflection of the stiffening girder. (a) Longitudinal displacement at the top of the side tower. (b) Bending moment at the bottom of the side tower. (c) Vertical deflection of the stiffening girder.
Buildings 16 02092 g023
Figure 24. Influence of the side-to-main span ratio on the anti-sliding coefficient between the cable and the saddle at the top of the side tower. (a) Top cable. (b) Bottom cable.
Buildings 16 02092 g024
Figure 25. Influence of the span layout on the horizontal stiffness of the main cable in the side span.
Buildings 16 02092 g025
Figure 26. Influence of the span layout on the vertical deflection of the stiffening girder.
Buildings 16 02092 g026
Figure 27. Influence of bridge span layout on the structural forces acting on the side tower. (a) Displacement at the top of the side tower. (b) Bending moment at the bottom of the side tower.
Buildings 16 02092 g027
Figure 28. Influence of bridge span layout on the anti-sliding coefficient between the cable and saddle at the top of the side tower. (a) Top cable. (b) Bottom cable.
Buildings 16 02092 g028
Table 1. Summary of parameter analysis research.
ResearcherChoi
[20]
Jia
[21]
Cao
[22,23]
Liu
[24]
Ma
[25]
Jiao
[26]
Li
[27]
Zhang
[28]
Side-to-main span ratio
Sag-to-span ratio
Dead load to live load ratio
Tower–beam connection
Main span
Tower stiffness
Main cable stiffness
Main cable and main beam connection
Ratio of longitudinal stiffness between middle tower and main cable
Ratio of bending moment between middle tower and main cable
Main beam stiffness
Hanger stiffness
Tensile strength of main cable
Sliding friction coefficient
Disclaimer/Publisher’s Note: The statements, opinions and data contained in all publications are solely those of the individual author(s) and contributor(s) and not of MDPI and/or the editor(s). MDPI and/or the editor(s) disclaim responsibility for any injury to people or property resulting from any ideas, methods, instructions or products referred to in the content.