1. Introduction
Traditional Hakka settlements in southern China provide a valuable context for building-environment research in hot–humid regions because they preserve climate-responsive spatial configurations shaped through long-term adaptation to local climatic conditions [
1,
2]. These settlements illustrate how traditional spatial organization can support passive microclimate regulation under hot–humid conditions [
1,
3,
4]. This context differs from much of conventional green-building research, which often focuses on performance optimization in newly designed buildings [
5,
6]. In traditional settlements, the key question is how environmental knowledge embedded in existing spatial systems can be identified, tested, and translated into practical guidance for climate-responsive design and environmental performance improvement.
Hot–humid built environments are facing increasing risks of heat stress, weak air movement, and moisture-related discomfort under climate change and more frequent extreme heat events [
7,
8]. Dense settlements are especially vulnerable because high spatial compactness, limited ventilation, and restricted access to mechanical conditioning can intensify both outdoor and indoor thermal stress [
9,
10]. At the same time, many traditional settlements preserve spatial features that influence local microclimate, including site selection, street morphology, courtyards, patios, building orientation, and construction techniques [
4,
11,
12,
13]. These features can affect shading, airflow guidance, heat storage, and thermal buffering. However, rapid rural renewal has often introduced demolition, reconstruction, or incompatible alterations that disrupt ventilation paths, weaken shading interfaces, degrade blue–green elements, and harden ground surfaces [
9,
14,
15,
16]. A practical question therefore arises: how can environmental performance be improved in hot–humid settlements without undermining the spatial structures that support passive microclimate regulation?
Existing studies on the climatic adaptability of traditional architecture and settlements can be grouped into three main strands. The first examines passive climatic strategies and their environmental mechanisms in vernacular architecture across different regions [
4,
17,
18]. Previous studies have shown that traditional buildings regulate thermal conditions through the combined effects of building envelopes, openings, courtyard organization, and the thermophysical properties of materials [
11]. In the Mediterranean region, for example, vernacular buildings often rely on massive envelopes, relatively small openings, and semi-outdoor transitional spaces associated with courtyards to reduce solar heat gain, enhance thermal buffering, and promote natural ventilation [
19,
20,
21]. In the Middle East and North Africa, deep shading and ventilation shafts are commonly used to maintain indoor thermal balance under extreme climatic conditions [
22,
23]. In hot–humid regions such as Southeast Asia, studies have emphasized natural ventilation, solar shading, and humidity control, highlighting the role of spatial openness and airflow organization in thermal comfort [
24,
25]. Taken together, these studies demonstrate the climatic adaptability of vernacular architecture, but they focus mainly on individual buildings or isolated spatial elements rather than on linked spatial systems.
The second strand emphasizes quantitative evaluation through microclimate simulation, CFD-based wind analysis, and thermal-comfort assessment [
9,
26,
27]. CFD has been widely used to examine wind-speed distribution, airflow patterns, and ventilation efficiency under different spatial configurations, thereby supporting the optimization of orientation, openings, and settlement layout [
28,
29]. More recent studies have combined wind simulation with thermal analysis and comfort evaluation to investigate the climatic adaptability of traditional spatial units such as courtyards, alleys, and patios [
27,
30,
31]. Parametric design and environmental simulation have further enhanced the flexibility of performance-oriented research [
32]. Existing evidence indicates that street scale, courtyard enclosure, patio configuration, building orientation, and vegetation or surface conditions can all affect local wind–thermal environments and human thermal comfort in traditional settlements [
27,
30,
31]. However, much of this work still treats ventilation, shading, cooling, and humidity as relatively separate effects and remains focused on single buildings, courtyards, alleys, or localized public spaces rather than on linked vernacular spatial sequences at the settlement scale.
The third strand is associated with growing interest in sustainable building, low-carbon regeneration, and heritage-compatible environmental improvement [
33,
34,
35,
36]. Recent studies have attempted to connect traditional climate-responsive strategies with contemporary green technologies, regeneration pathways, and performance evaluation methods [
29,
37]. Two questions are central to this line of work: how traditional climatic mechanisms can be translated into technical pathways for regeneration and contemporary design without compromising historical authenticity [
35,
37], and how material compatibility, reversibility, and environmental performance can be balanced [
35,
38,
39,
40]. Overall, this body of research marks a shift from identifying passive mechanisms to applying them in conservation and regeneration practice.
Despite these advances, several gaps remain in research on traditional settlements in hot–humid regions. These gaps can be summarized as follows:
(1) Much of the literature still focuses on the climatic role of individual elements, such as courtyards, alleys, water bodies, vegetation, and building envelopes, while less attention has been paid to how linked vernacular spatial systems jointly shape microclimate and thermal comfort in daily use.
(2) Ventilation, shading, cooling, and humidity are often assessed separately, although their combined effects on pedestrian- and occupancy-related thermal stress remain insufficiently quantified in compact hot–humid settlements.
(3) Limited field calibration, weak simulation validation, and the separate treatment of wind and thermal processes reduce the usefulness of some studies for performance-based retrofit analysis.
The key unresolved issue, therefore, is not only how individual vernacular elements perform, but also how linked spatial sequences can be quantified and applied in retrofit-oriented environmental assessment.
Hakka settlements in southern Jiangxi provide an appropriate context for addressing these questions. The region has a typical hot–humid monsoon climate, with hot–humid summers and cold damp winters, in which ventilation, shading continuity, thermal buffering, and moisture regulation are important to environmental performance [
41,
42]. Many traditional Hakka settlements still preserve cold alleys, courtyards, patios, halls, and gray spaces [
43,
44]. Together, these elements form an intact spatial system for examining how vernacular morphology redistributes airflow, thermal exposure, and humidity across linked settlement, transitional, and indoor spaces. Under the current pressures of rural renewal and heritage revitalization, this issue is relevant not only to the interpretation of vernacular climatic adaptation, but also to the development of retrofit strategies that improve environmental performance without undermining spatial authenticity [
33,
38]. The value of the present case lies in its use as a compact hot–humid settlement in which a sequence-based analytical workflow can be tested and refined for comparable conservation-oriented contexts.
This study develops a sequence-based microclimate assessment framework for linked vernacular spatial systems, using a compact Hakka settlement in southern Jiangxi, China, as a methodological case. Unlike studies that analyze streets, alleys, courtyards, patios, or buildings as isolated units, this framework examines how microclimatic conditions are redistributed across connected settlement and building spaces. It addresses three related questions: (1) how linked vernacular spatial sequences shape microclimatic gradients across settlement spaces relevant to building use; (2) how airflow, radiant conditions, humidity, and thermal buffering jointly influence thermal stress in compact hot–humid environments; and (3) how these mechanisms can inform retrofit assessment under conservation constraints. To address these questions, the study combines field measurements, calibrated numerical simulation, PET-based thermal-comfort assessment, indoor thermal-response analysis, and parametric testing. Cold alleys, courtyards, patios, halls, semi-open transitional spaces, and interior rooms are examined as parts of a connected environmental sequence, and the analysis investigates how key morphological variables influence airflow, air temperature, humidity, and thermal-environment responses relevant to comfort interpretation.
Compared with previous studies that focus mainly on outdoor spaces, isolated spatial units, or the morphology-sensitive performance of streets and alleys, this study organizes field measurements, validated simulation, comfort evaluation, and parametric testing around a linked vernacular spatial sequence. The main contributions of this study can be summarized as follows:
(1) Sequence-based conceptual framing. This study interprets the Hakka cold alley–courtyard–hall–patio–room configuration as a linked vernacular spatial sequence rather than as a collection of independent elements.
(2) Field-calibrated and PET-linked assessment workflow. This study integrates field measurements, validated simulation, PET-based comfort interpretation, indoor thermal-response analysis, and parametric testing to evaluate coupled microclimatic responses across connected spaces.
(3) Retrofit-oriented interpretation under conservation constraints. This study translates coupled microclimatic responses into multi-indicator evidence for preliminary heritage-compatible retrofit assessment.
In addition, the study derives case-based geometry-performance tendencies for representative transitional spaces, thereby offering context-sensitive references for preliminary assessment in comparable compact hot–humid vernacular settlements, subject to local validation.
2. Methods
This study uses Luwu Village, a compact vernacular Hakka settlement in southern Jiangxi, China, as the case for analyzing the influence of linked vernacular spatial sequences on indoor and outdoor wind–thermal environments in a hot–humid climate. In this paper, the term “linked vernacular spatial sequence” refers to the connected spatial organization formed by cold alleys, courtyards, halls, patios, semi-open interfaces, and interior rooms. This concept describes the physical continuity and environmental coupling among settlement spaces and building spaces, rather than the transient thermal sensation or physiological strain experienced by occupants moving between indoor and outdoor environments. These linked spaces are examined as environmental nodes through which airflow, solar exposure, air temperature, humidity, and thermal buffering are redistributed. The study combines field measurements, calibrated simulation, PET-based thermal-comfort assessment, and parametric analysis.
2.1. Overview of the Study Area
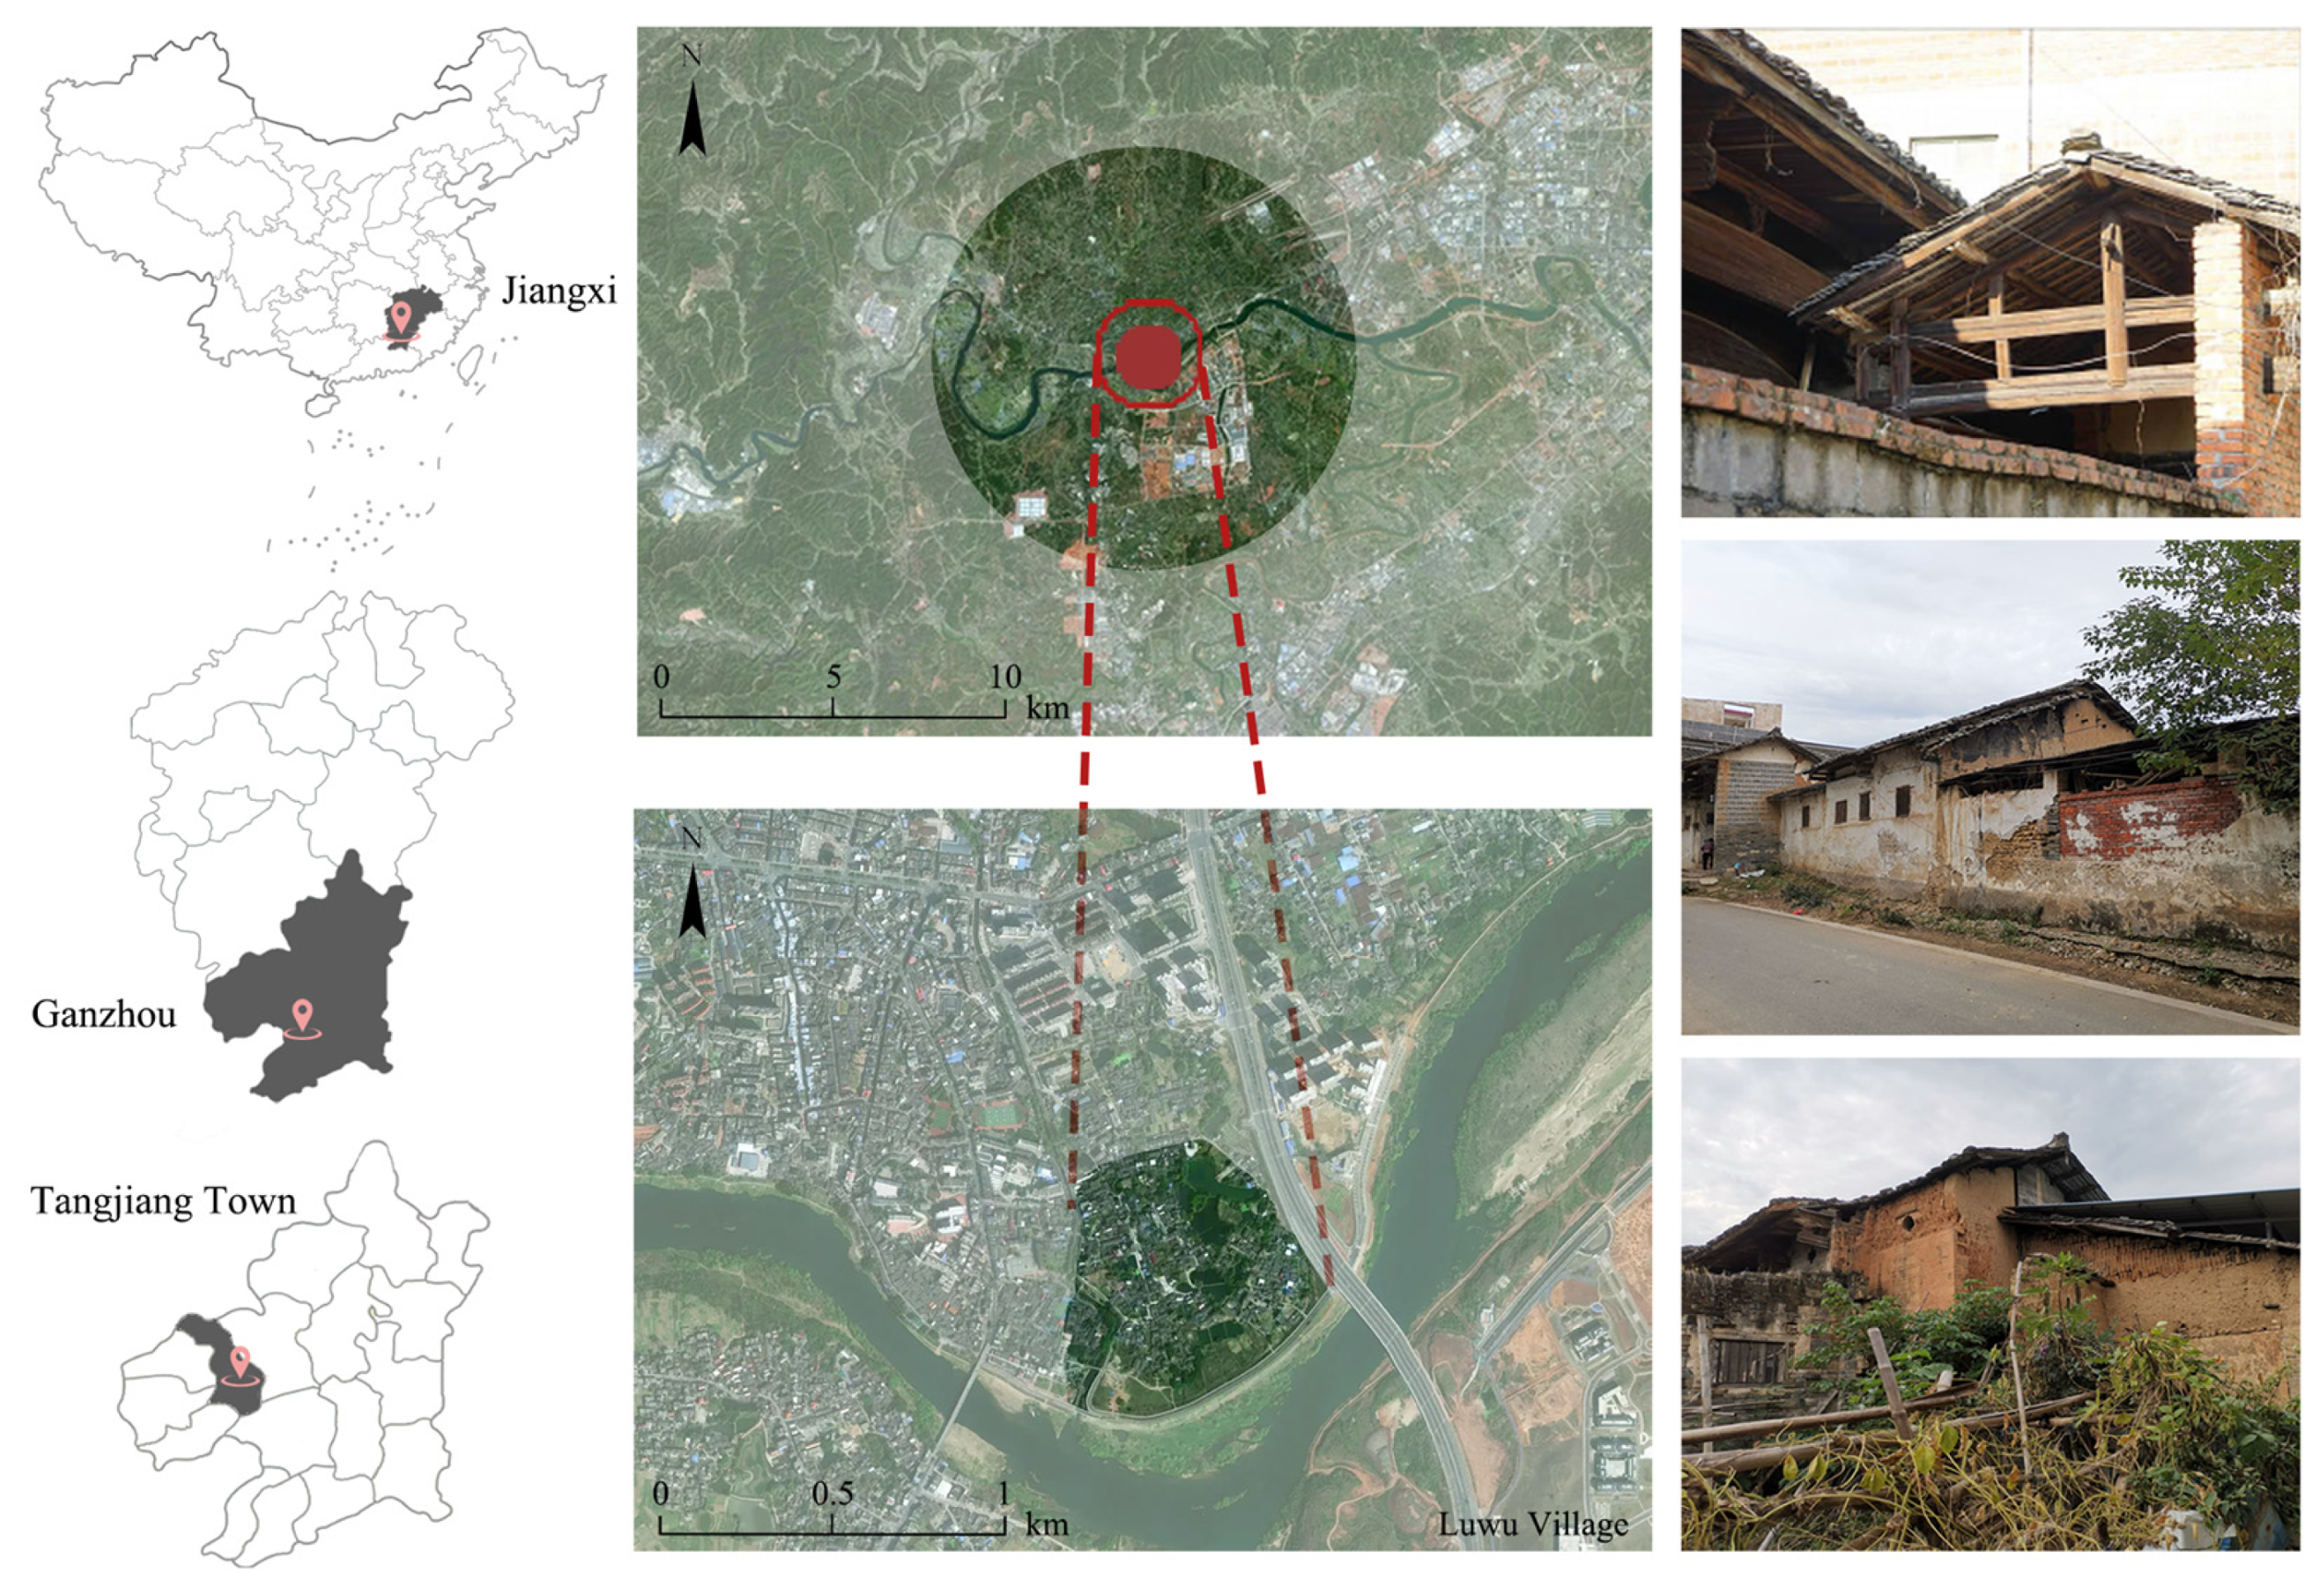
This study focuses on Luwu Village, a traditional Hakka settlement in Tangjiang Town, Ganzhou, southeastern Jiangxi Province, China (
Figure 1). The village is located in a typical hot–humid monsoon climate zone characterized by hot–humid summers, cold damp winters, and seasonally distinct prevailing winds. According to meteorological records from the Ganzhou Meteorological Bureau, southerly winds prevail in summer, northerly winds in winter, and the annual air temperature ranges from approximately 8 °C in January to 34 °C in July. These conditions make the region suitable for examining thermal comfort and microclimate regulation in compact settlement fabrics.
Luwu Village was selected because it preserves a relatively complete arrangement of water bodies, narrow alleys, courtyards, patios, halls, semi-open interfaces, and thick masonry or rammed-earth envelopes. These features are directly relevant to airflow, shading, thermal exposure, humidity, and thermal buffering across linked settlement, transitional, and indoor spaces. At the settlement scale, the village is organized around a central pond and a compact network of streets, alleys, buildings, and vegetation. At the building scale, the cold alley–patio–hall sequence, together with thick walls and semi-open interfaces, provides a suitable setting for examining environmental gradients under hot–humid conditions.
A representative building cluster centered on the core pond was selected as the main study area for field measurement, model validation, and retrofit-oriented analysis. The cluster includes traditional dwellings, later additions, water bodies, alleys, courtyards, patios, halls, and semi-open interfaces, and it captures the main spatial nodes and connectivity patterns required for sequence-based assessment. It also reflects the mixed spatial fabric commonly encountered in regeneration and retrofit contexts. Luwu Village is therefore used here as a compact hot–humid case for integrating field measurements, validated simulation, and parametric testing, and provides the empirical basis for model validation, mechanism interpretation, and geometry-performance analysis.
2.2. Field Measurements
Field measurements were carried out to identify environmental gradients across representative outdoor, semi-open/intermediate, and indoor spatial nodes and to provide calibration and validation data for the numerical simulations. The measurements were node-based, meaning that environmental variables were recorded at fixed locations rather than along occupant movement trajectories. The measured data were also used for PET-based comparative thermal-stress assessment at each node.
2.2.1. Measurement Point Layout
The measurement campaign was organized along a linked vernacular spatial sequence including pond-edge/open street, cold alley, courtyard, hall, patio, semi-open transitional space, and indoor rooms. These spaces were treated as fixed environmental nodes within a connected spatial system. This arrangement allowed the comparison of airflow, thermal exposure, humidity, and thermal buffering across connected spaces, while maintaining consistency with the subsequent simulation and PET analyses. It should be noted that the measurement design did not track occupants moving through the sequence; instead, it compared the microclimatic conditions of representative spatial nodes.
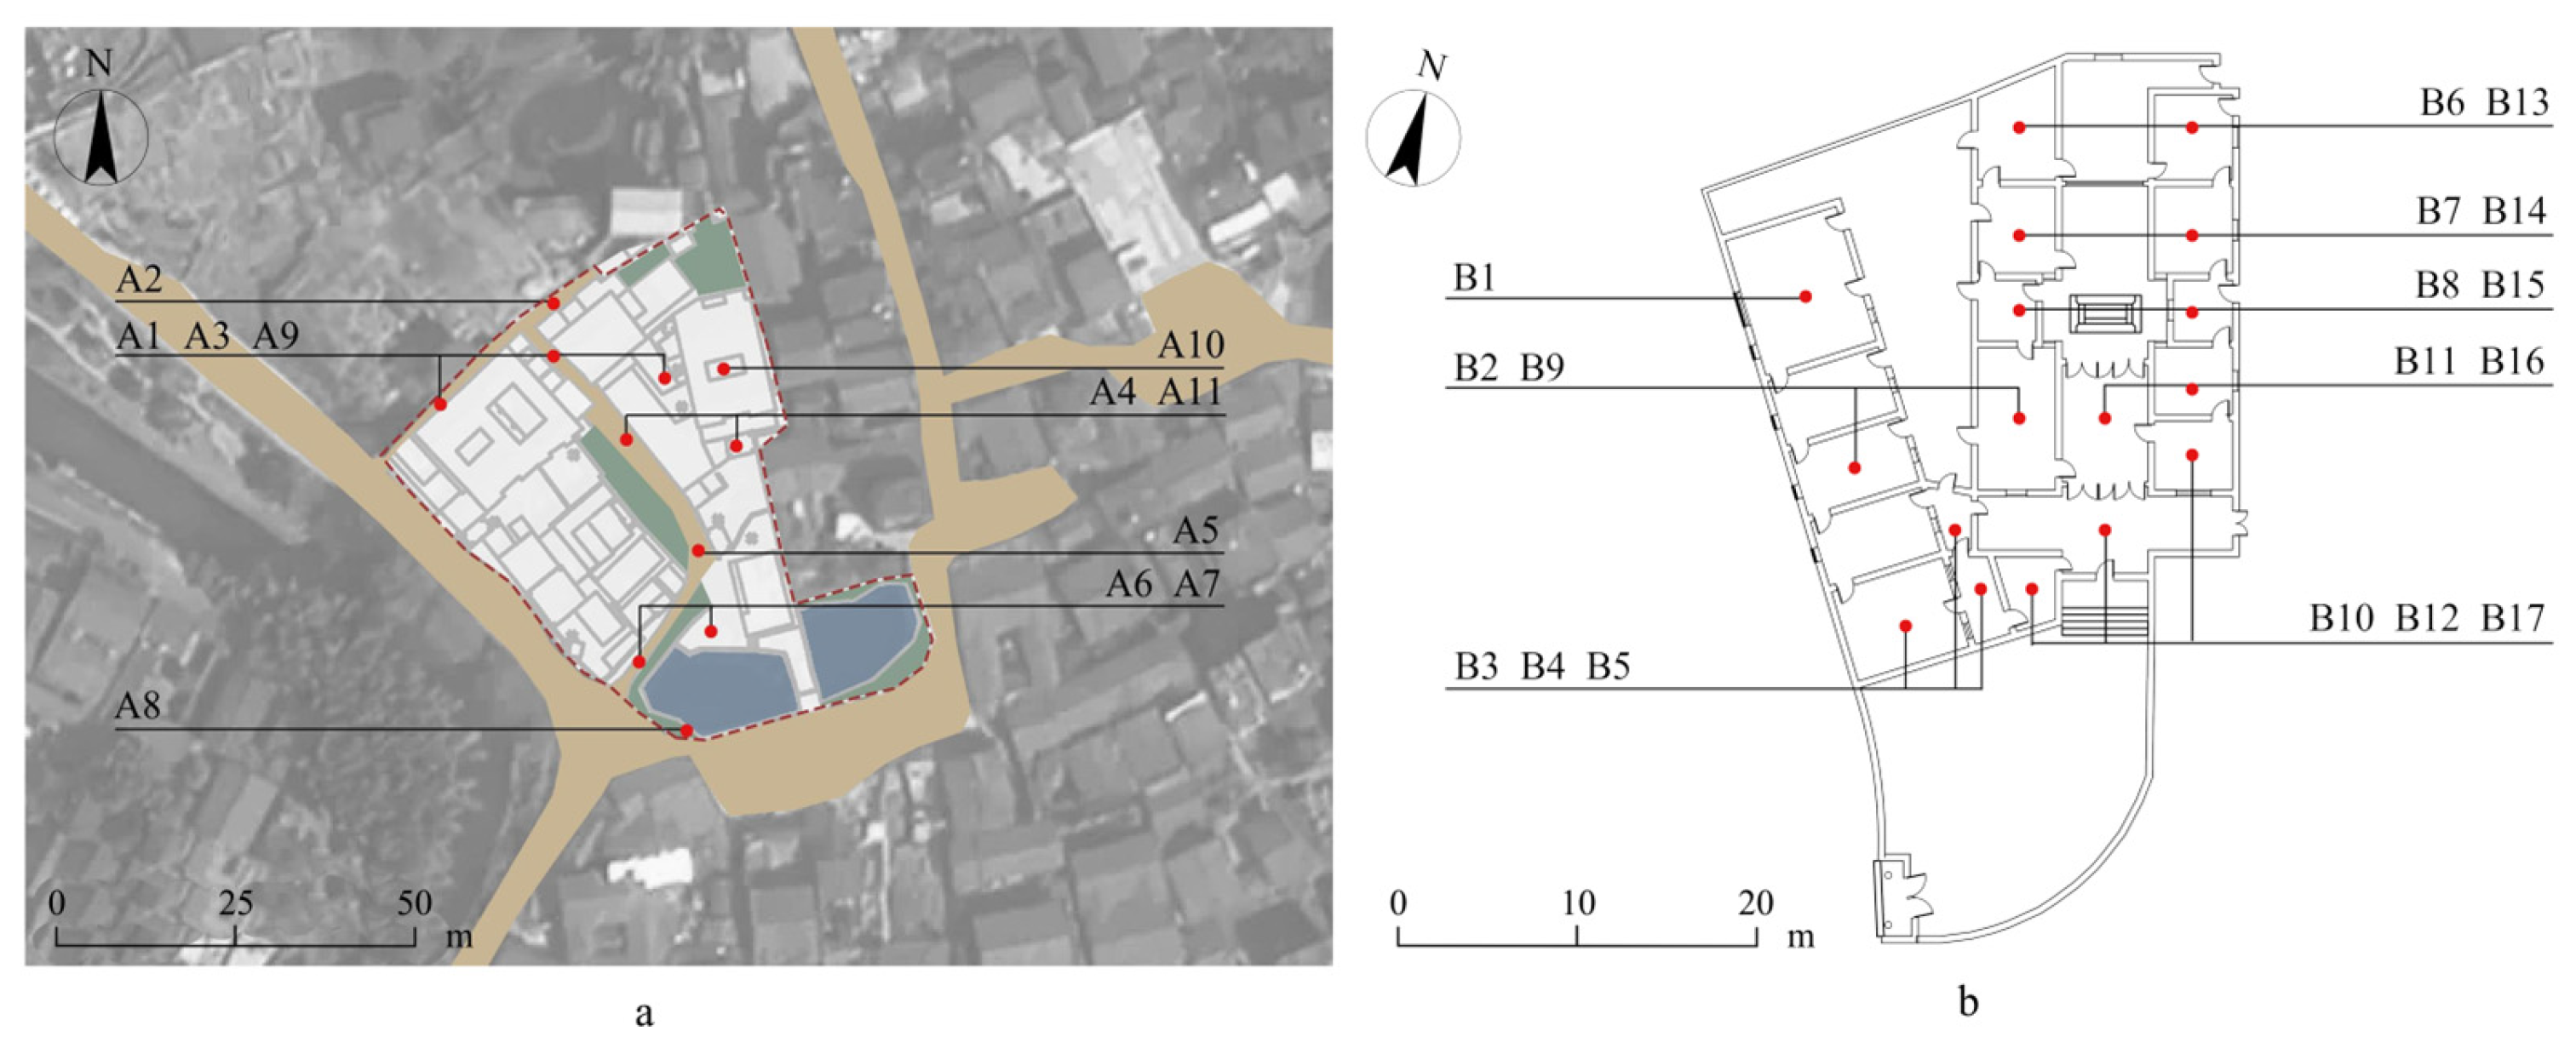
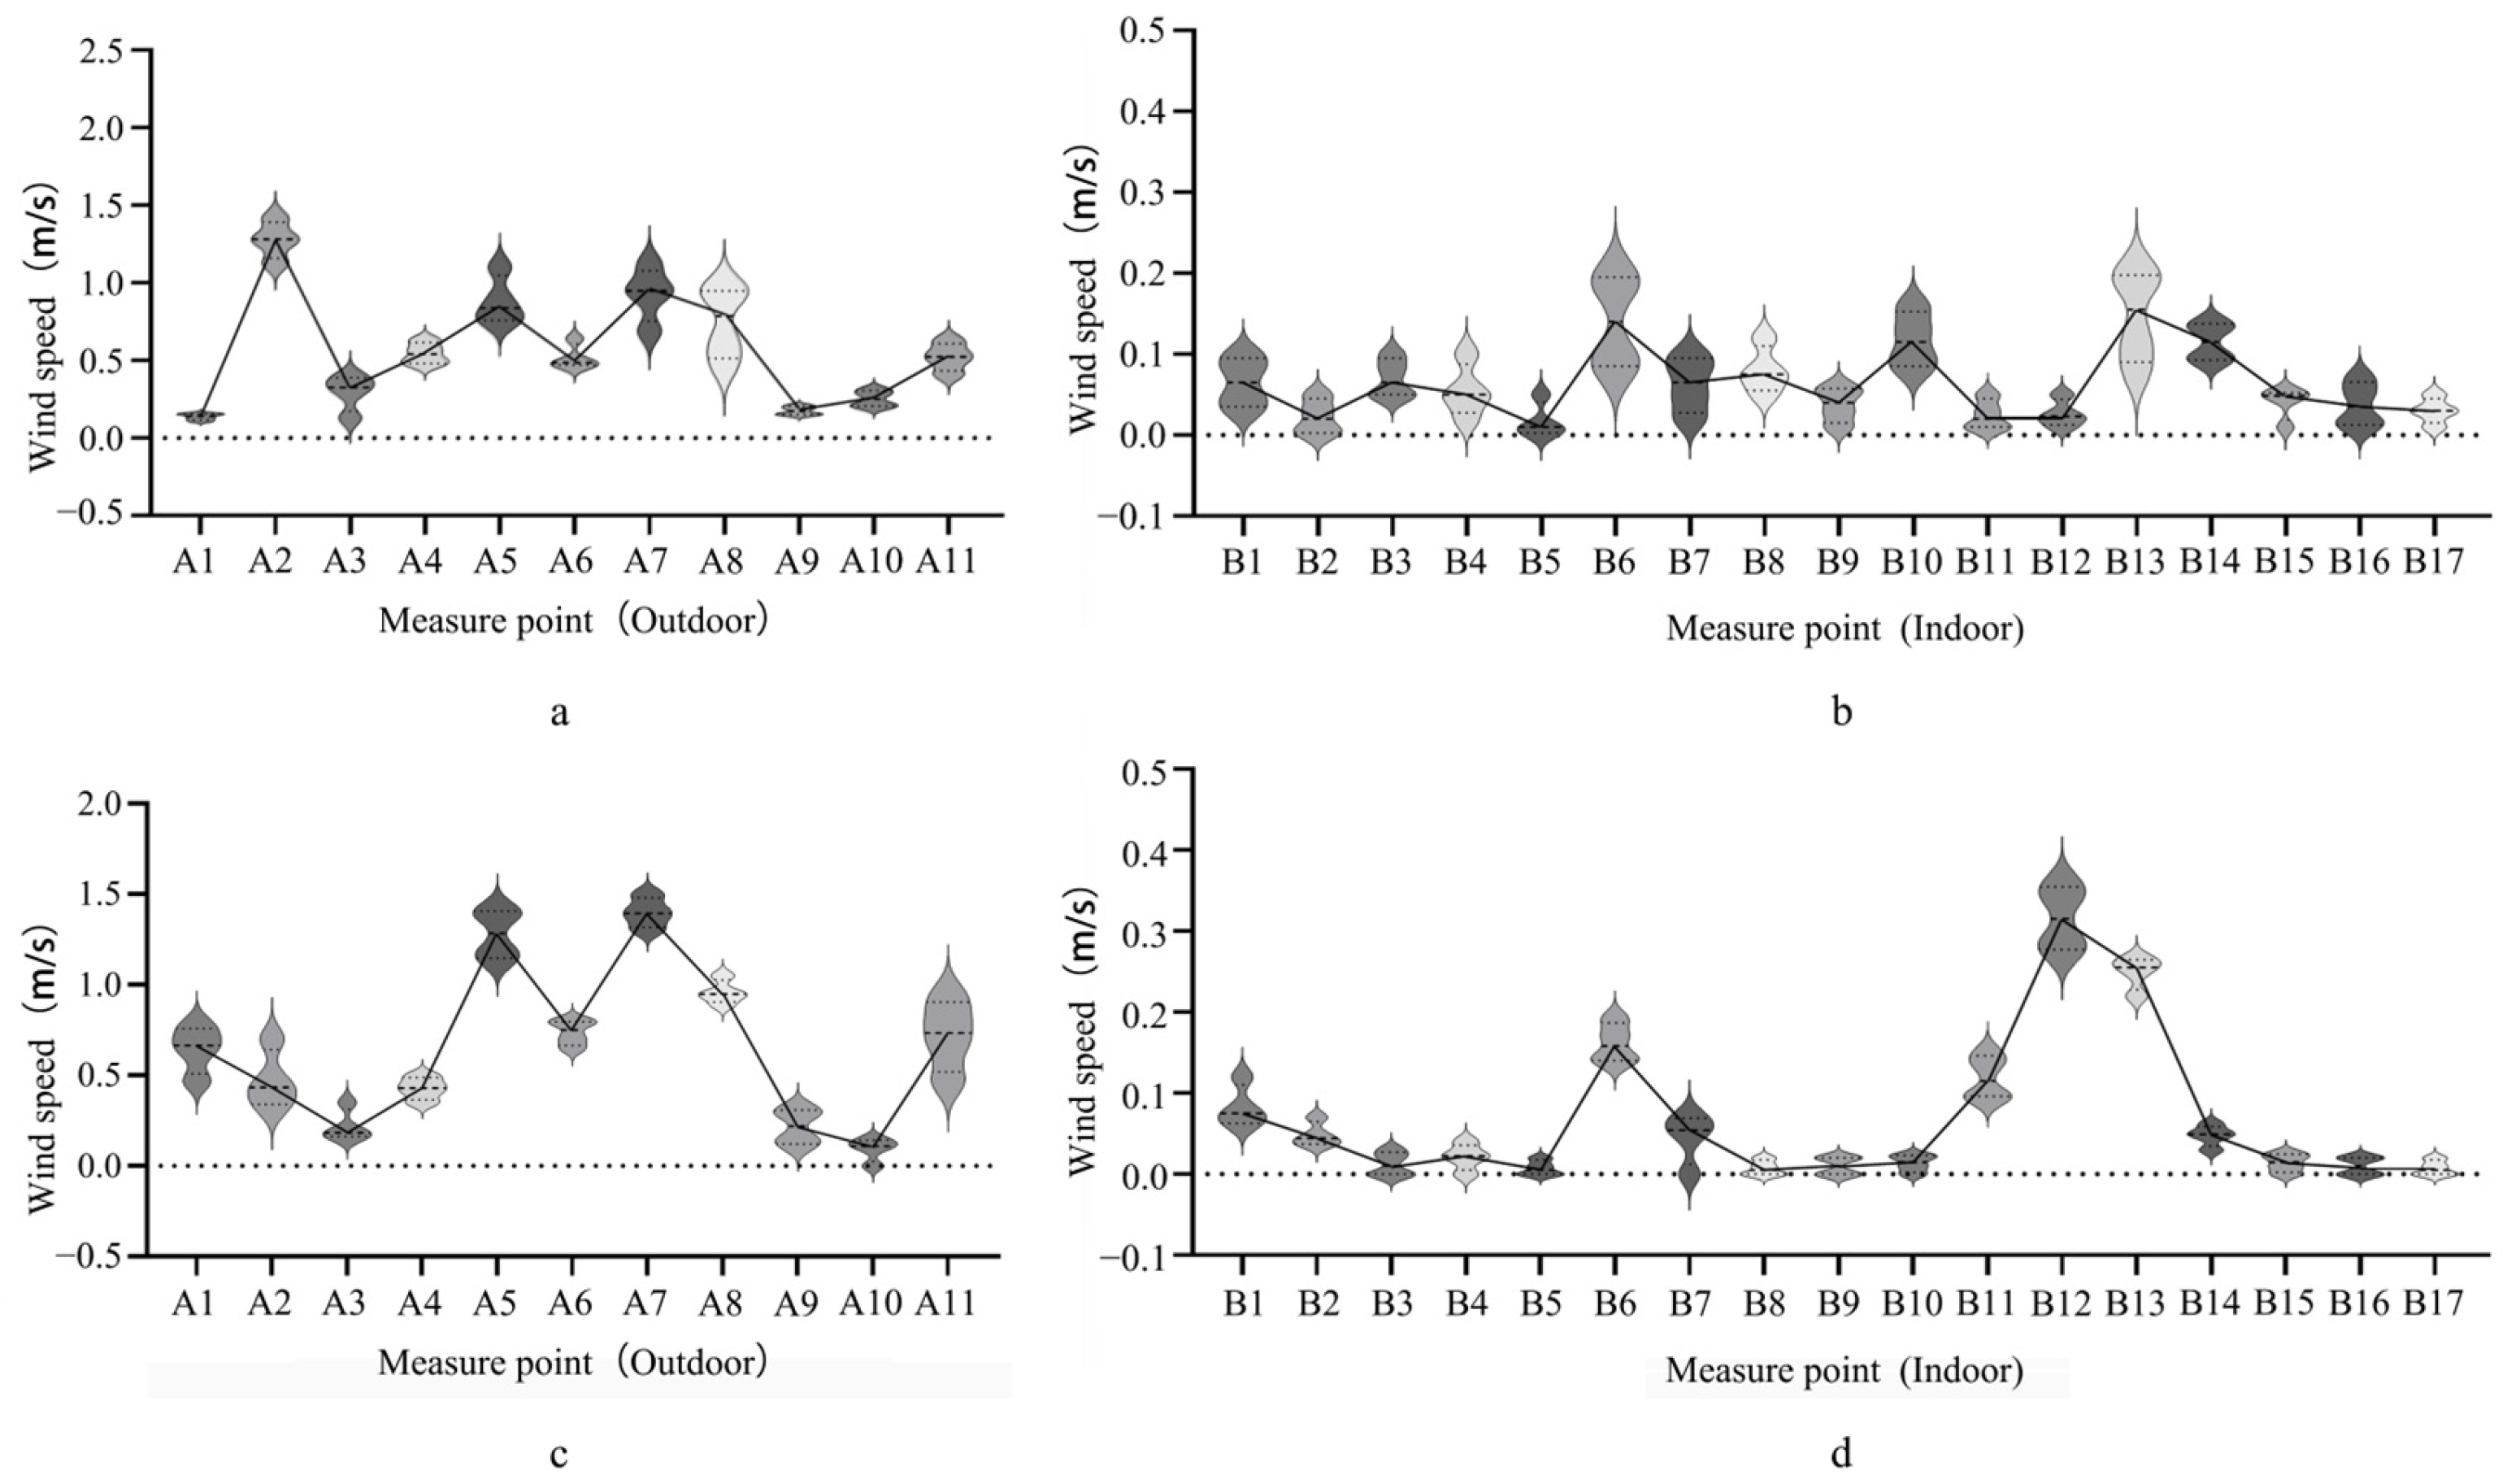
The field campaign focused on Building No. 1 in Shatangli, Luwu Village, together with adjacent dwellings and surrounding outdoor spaces. This cluster includes the principal spatial types typical of compact Hakka settlements in southern Jiangxi, including pond-edge spaces, cold alleys, courtyards, patios, halls, bedrooms, and semi-open interfaces. Measurement points were selected to represent the dominant environmental conditions within this linked spatial system, including open outdoor reference spaces, narrow shaded alleys, semi-open courtyards and patios, transitional halls, enclosed bedrooms, and spaces adjacent to the pond or settlement edge. A total of 11 outdoor points (A1–A11) and 17 indoor points (B1–B17) were arranged, as shown in
Figure 2. All sensors were installed at 1.5 m above ground level to represent pedestrian-level exposure and support thermal comfort analysis. Where necessary, shielding and local protection measures were adopted to reduce errors caused by direct solar radiation and local thermal disturbance.
2.2.2. Measurement Period and Variables
Field monitoring was conducted on representative sunny days in summer and winter of 2025: 3, 5, and 7 July for summer and 12, 14, and 16 December for winter. These days were selected because they represented relatively stable and typical seasonal conditions in the local hot–humid monsoon climate, without rainfall or strong synoptic disturbance.
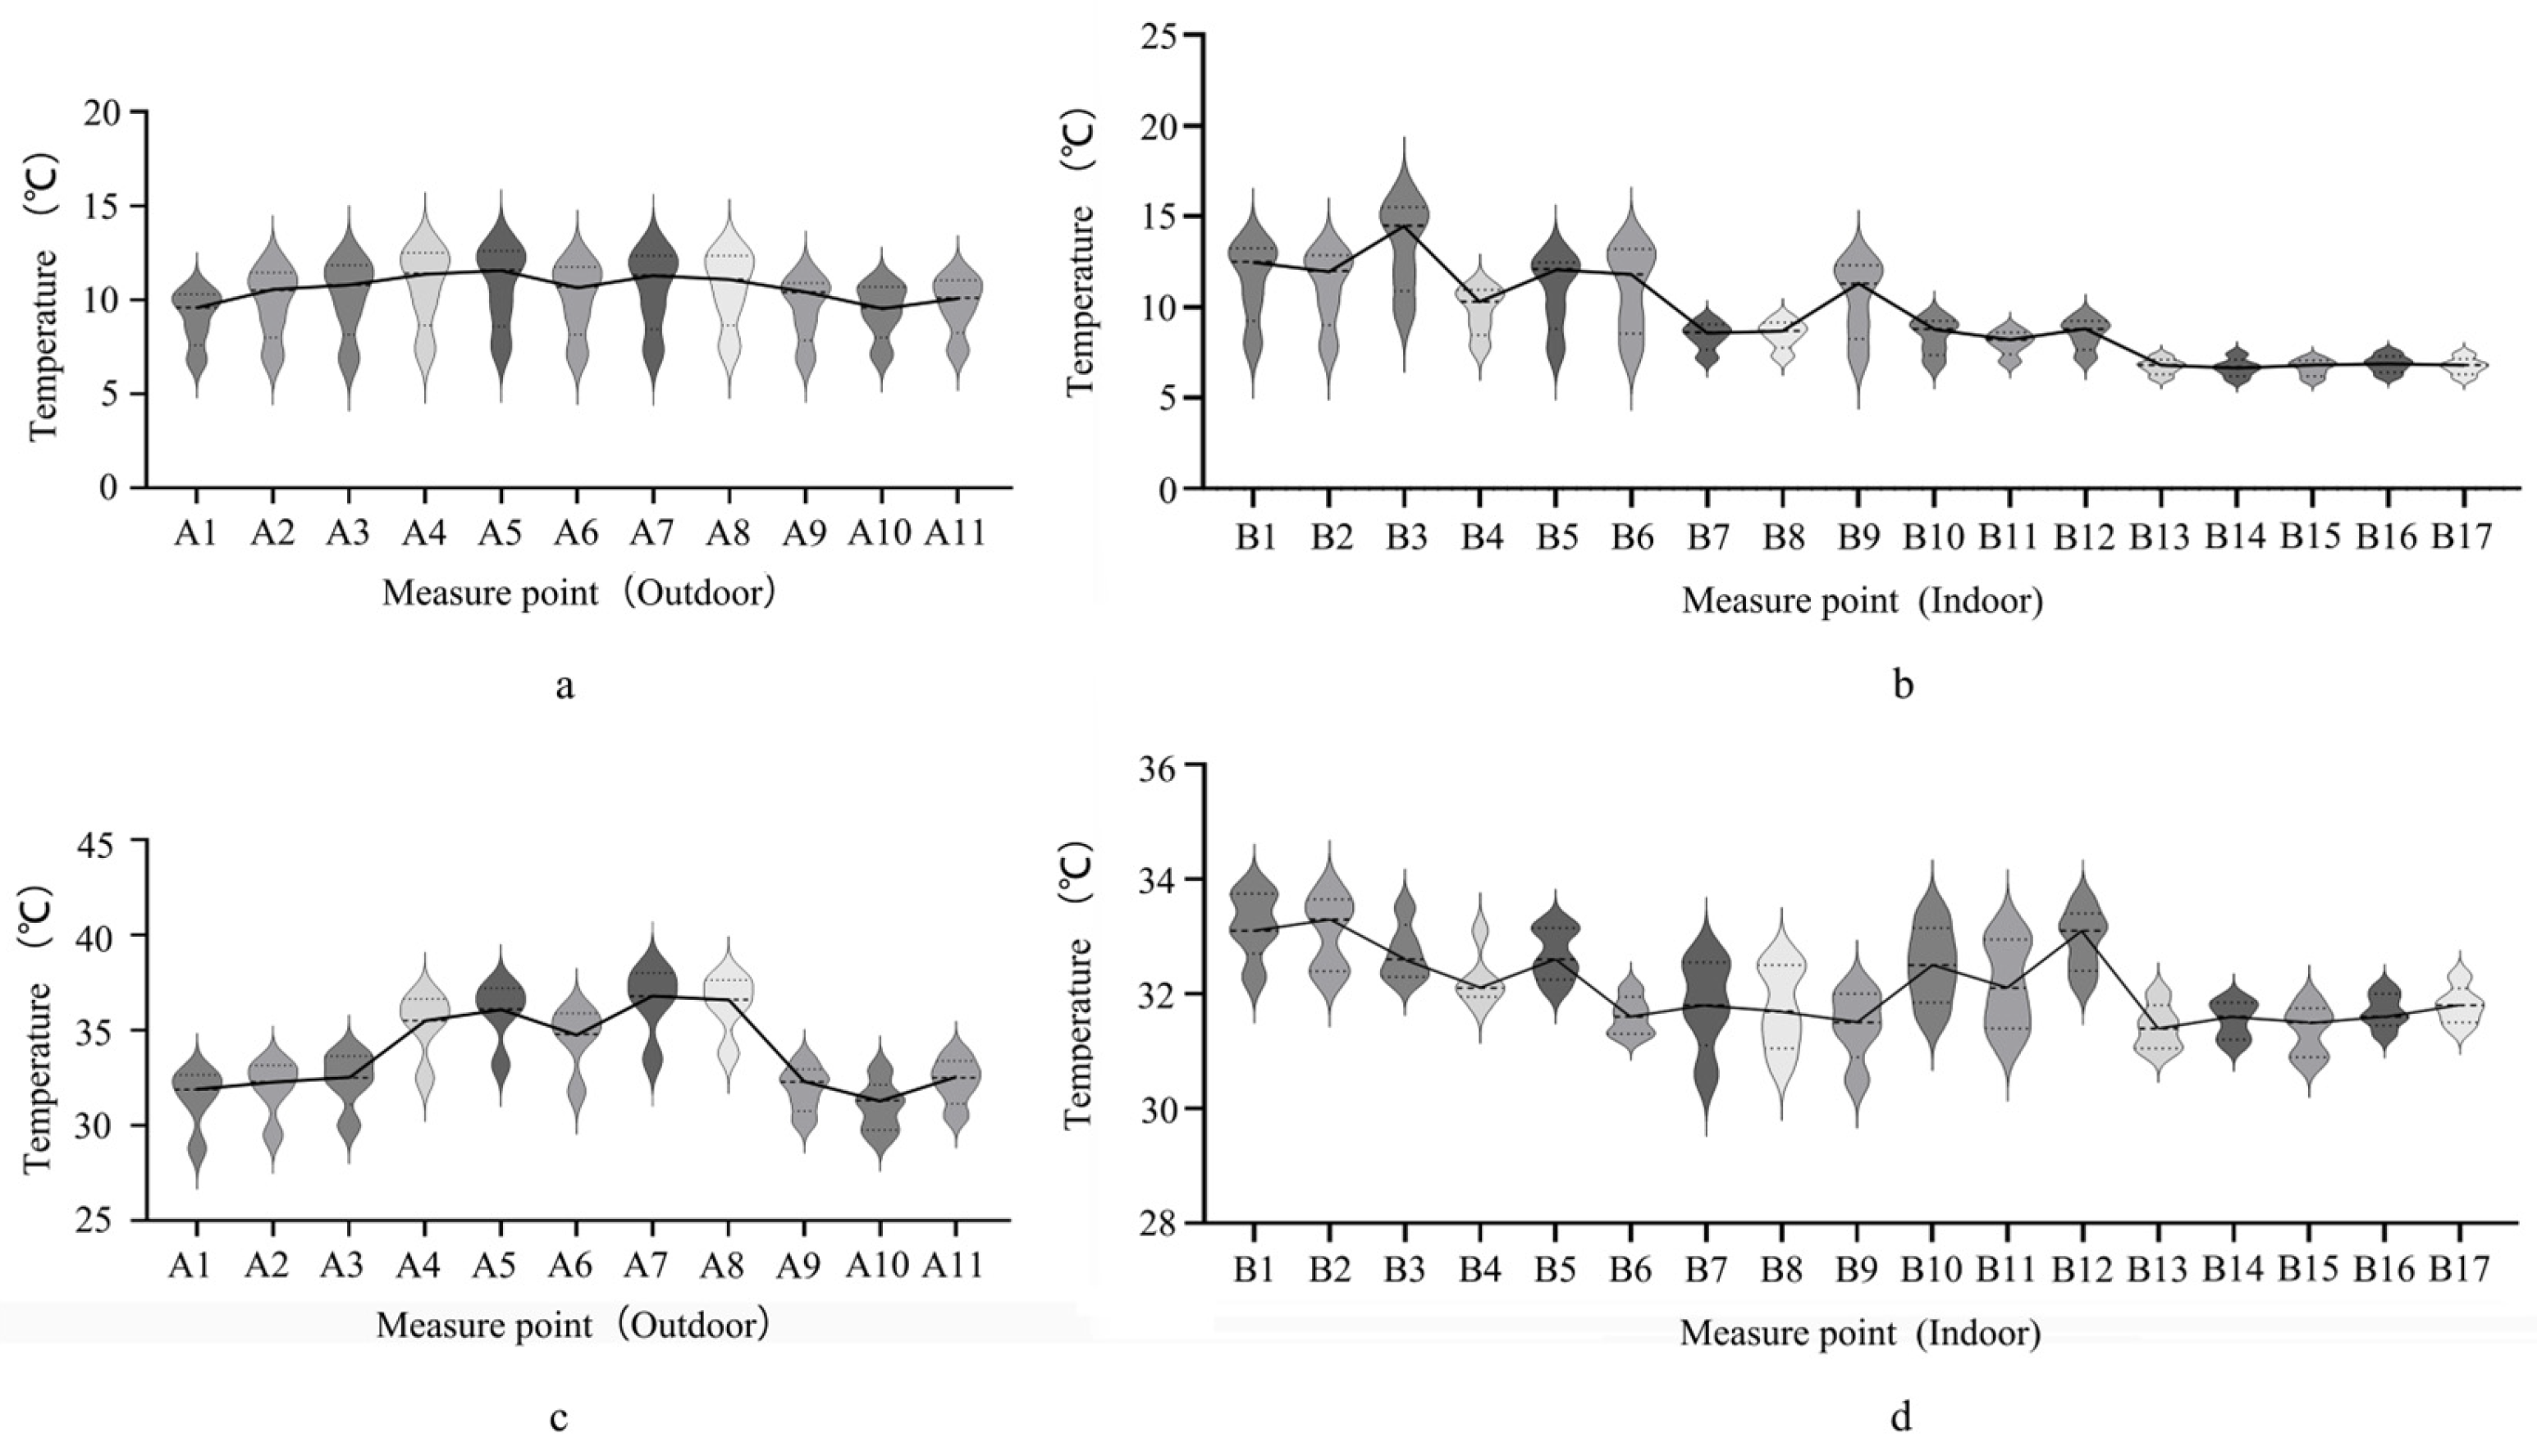
Measurements were recorded from 9:00 AM to 4:00 PM at 10 min intervals to capture daytime conditions when pedestrian-level thermal stress, solar exposure, and inter-space thermal differences were most pronounced. In addition, nighttime air-temperature measurements were conducted from 7:00 PM to 8:00 PM to compare the short-term cooling-storage capacity and thermal-buffering performance of representative spaces, especially cold alleys, patios, and other transitional zones. The recorded data were averaged by monitoring period for comparative analysis and model validation.
The monitored variables included air temperature (Ta), black globe temperature (Tg), relative humidity (RH), and average wind speed (v). Air temperature and relative humidity were used to characterize basic thermal and moisture conditions, black globe temperature was used to represent combined radiative effects, and average wind speed was used to indicate local ventilation conditions. Together, these variables provided the input for the analysis of airflow, thermal conditions, and PET-based thermal comfort. Instrument models, measurement ranges, and accuracies are summarized in
Table 1.
The representative monitoring periods were also used to define the seasonal boundary conditions for model calibration and comparative simulation. In parallel, annual indoor thermal simulation was used to examine how the spatial relationships observed during the monitored periods were reflected in longer-term indoor thermal response.
2.2.3. Thermal Comfort Index and PET Calculation
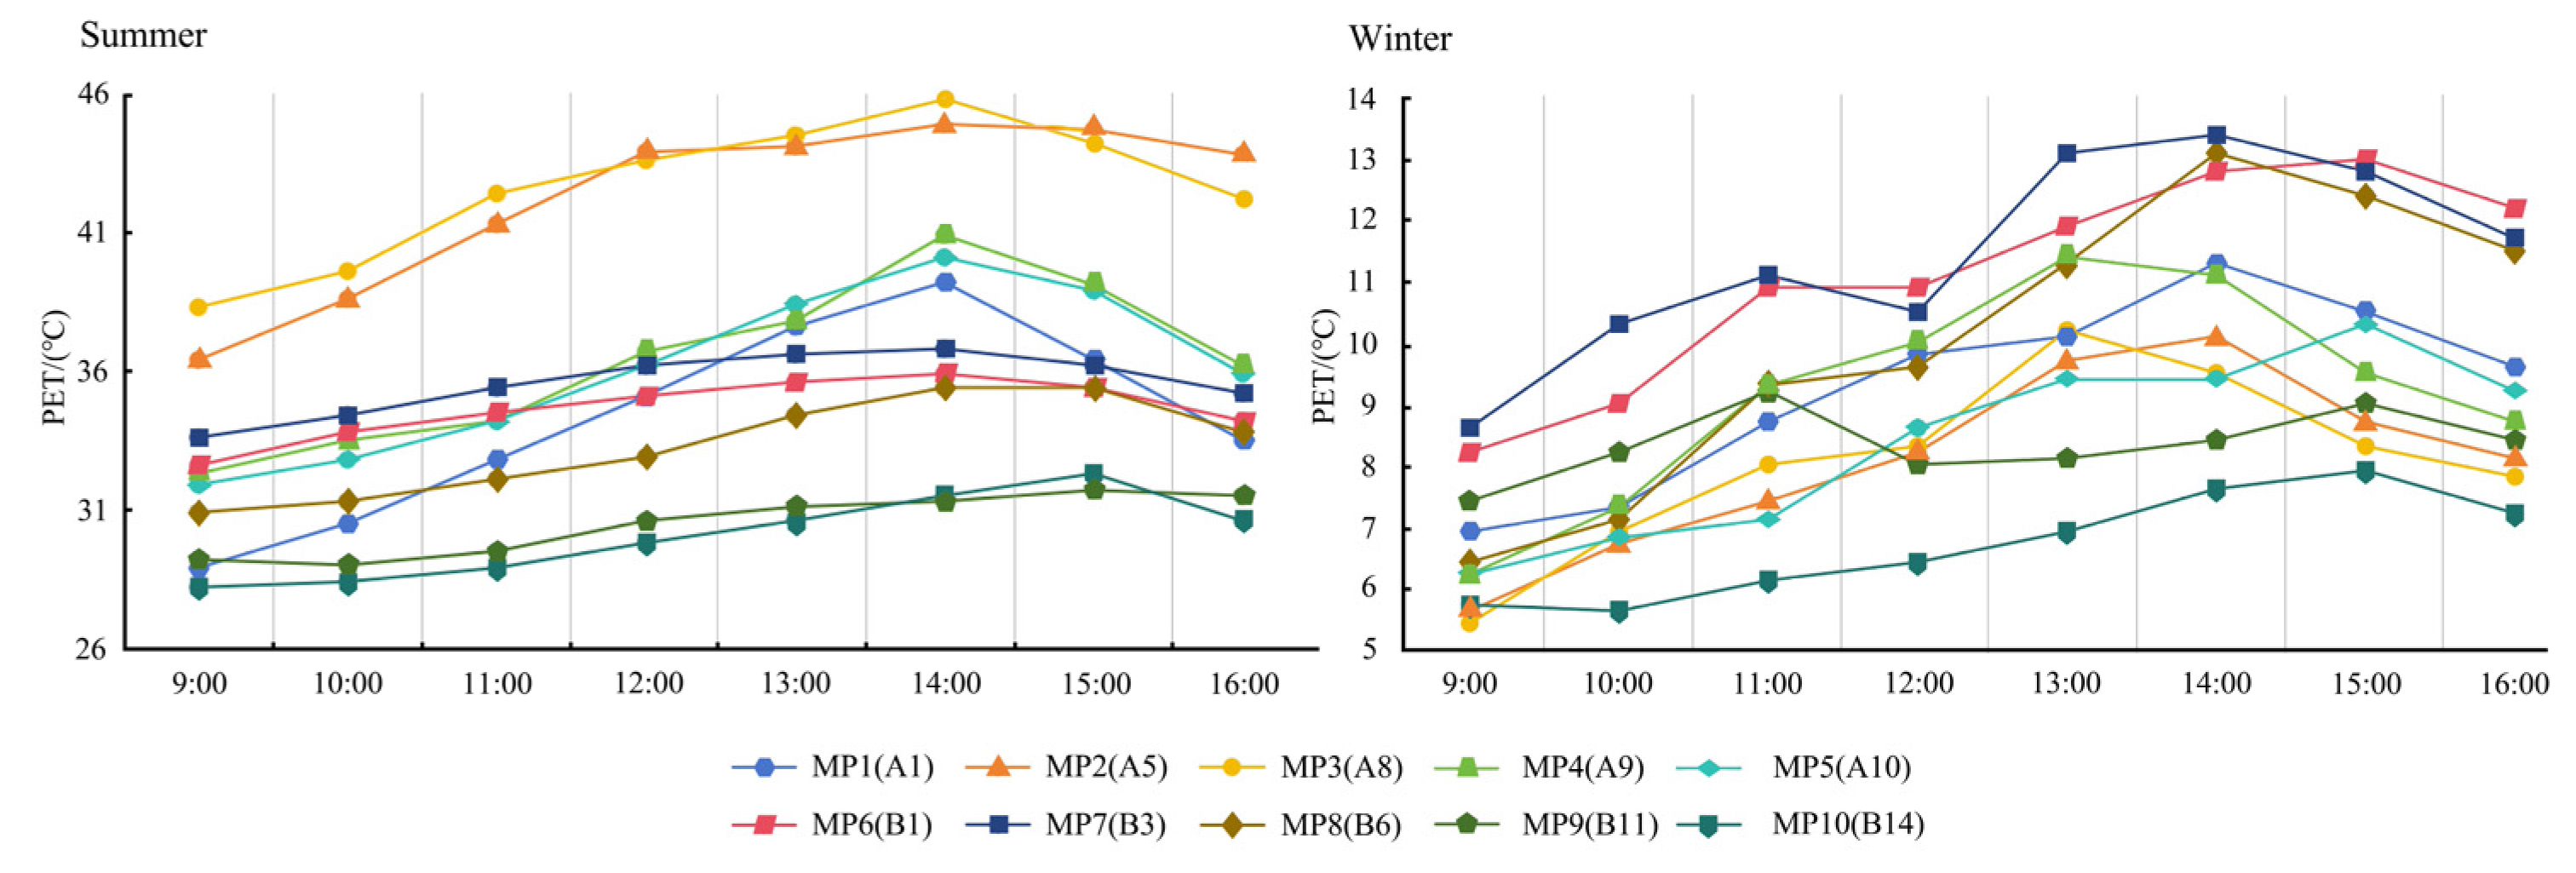
Thermal comfort was evaluated using the Physiological Equivalent Temperature (PET) index, which integrates air temperature, relative humidity, wind speed, and mean radiant temperature (Tmrt) and expresses the resulting thermal condition in degrees Celsius. PET was selected because this study aimed to compare thermal-stress differences across linked outdoor, semi-open, transitional, and naturally ventilated indoor spaces under consistent field-measurement and personal-parameter settings. Compared with UTCI, which is mainly oriented toward standardized outdoor exposure, and SET*, which generally requires more detailed indoor heat-balance assumptions, PET is widely used in outdoor and semi-outdoor microclimate studies and can be calculated directly from the measured variables and globe-derived Tmrt in RayMan Pro 2.1. Therefore, PET was used as a comparative index for the present sequence-based spatial assessment, rather than as a prediction of individual thermal sensation under varying activity, clothing, or acclimatization conditions. Its humidity-related limitations under hot–humid conditions are acknowledged in the Discussion.
PET values were derived from field measurements. For outdoor PET, air temperature, relative humidity, wind speed, and globe temperature were taken directly from the outdoor monitoring points, and Tmrt was calculated from globe temperature using the standard ISO 7726:1998 [
45] globe-based formulation for a 150 mm black globe. No non-standard globe-diameter correction was applied [
46]. For indoor PET, the same variables were obtained from the indoor monitoring points. Because measured indoor air velocities in some enclosed spaces approached near-calm conditions, a minimum wind speed of 0.05 m/s was applied in the PET calculation to maintain comparability across indoor and transitional spaces.
For all PET calculations, personal parameters were set at a metabolic rate of 1.2 met and clothing insulation of 0.5 clo in summer and 1.0 clo in winter. These settings were applied consistently across representative monitoring points to support inter-space comparison under typical occupancy assumptions. PET was used here as a comparative comfort metric for evaluating how linked spatial configurations moderated thermal stress under representative seasonal conditions.
2.3. Software Simulation
A numerical model of the representative building cluster in Luwu Village was established based on field survey, on-site measurement, and geometric documentation. The simulation framework included outdoor thermal simulation, indoor and outdoor wind-environment simulation, indoor thermal-response analysis, and parametric testing of representative spatial units. Consistent with the field measurements, the simulations were used to examine spatial redistribution and coupling of environmental variables across fixed spatial nodes, rather than transient comfort responses associated with occupant movement.
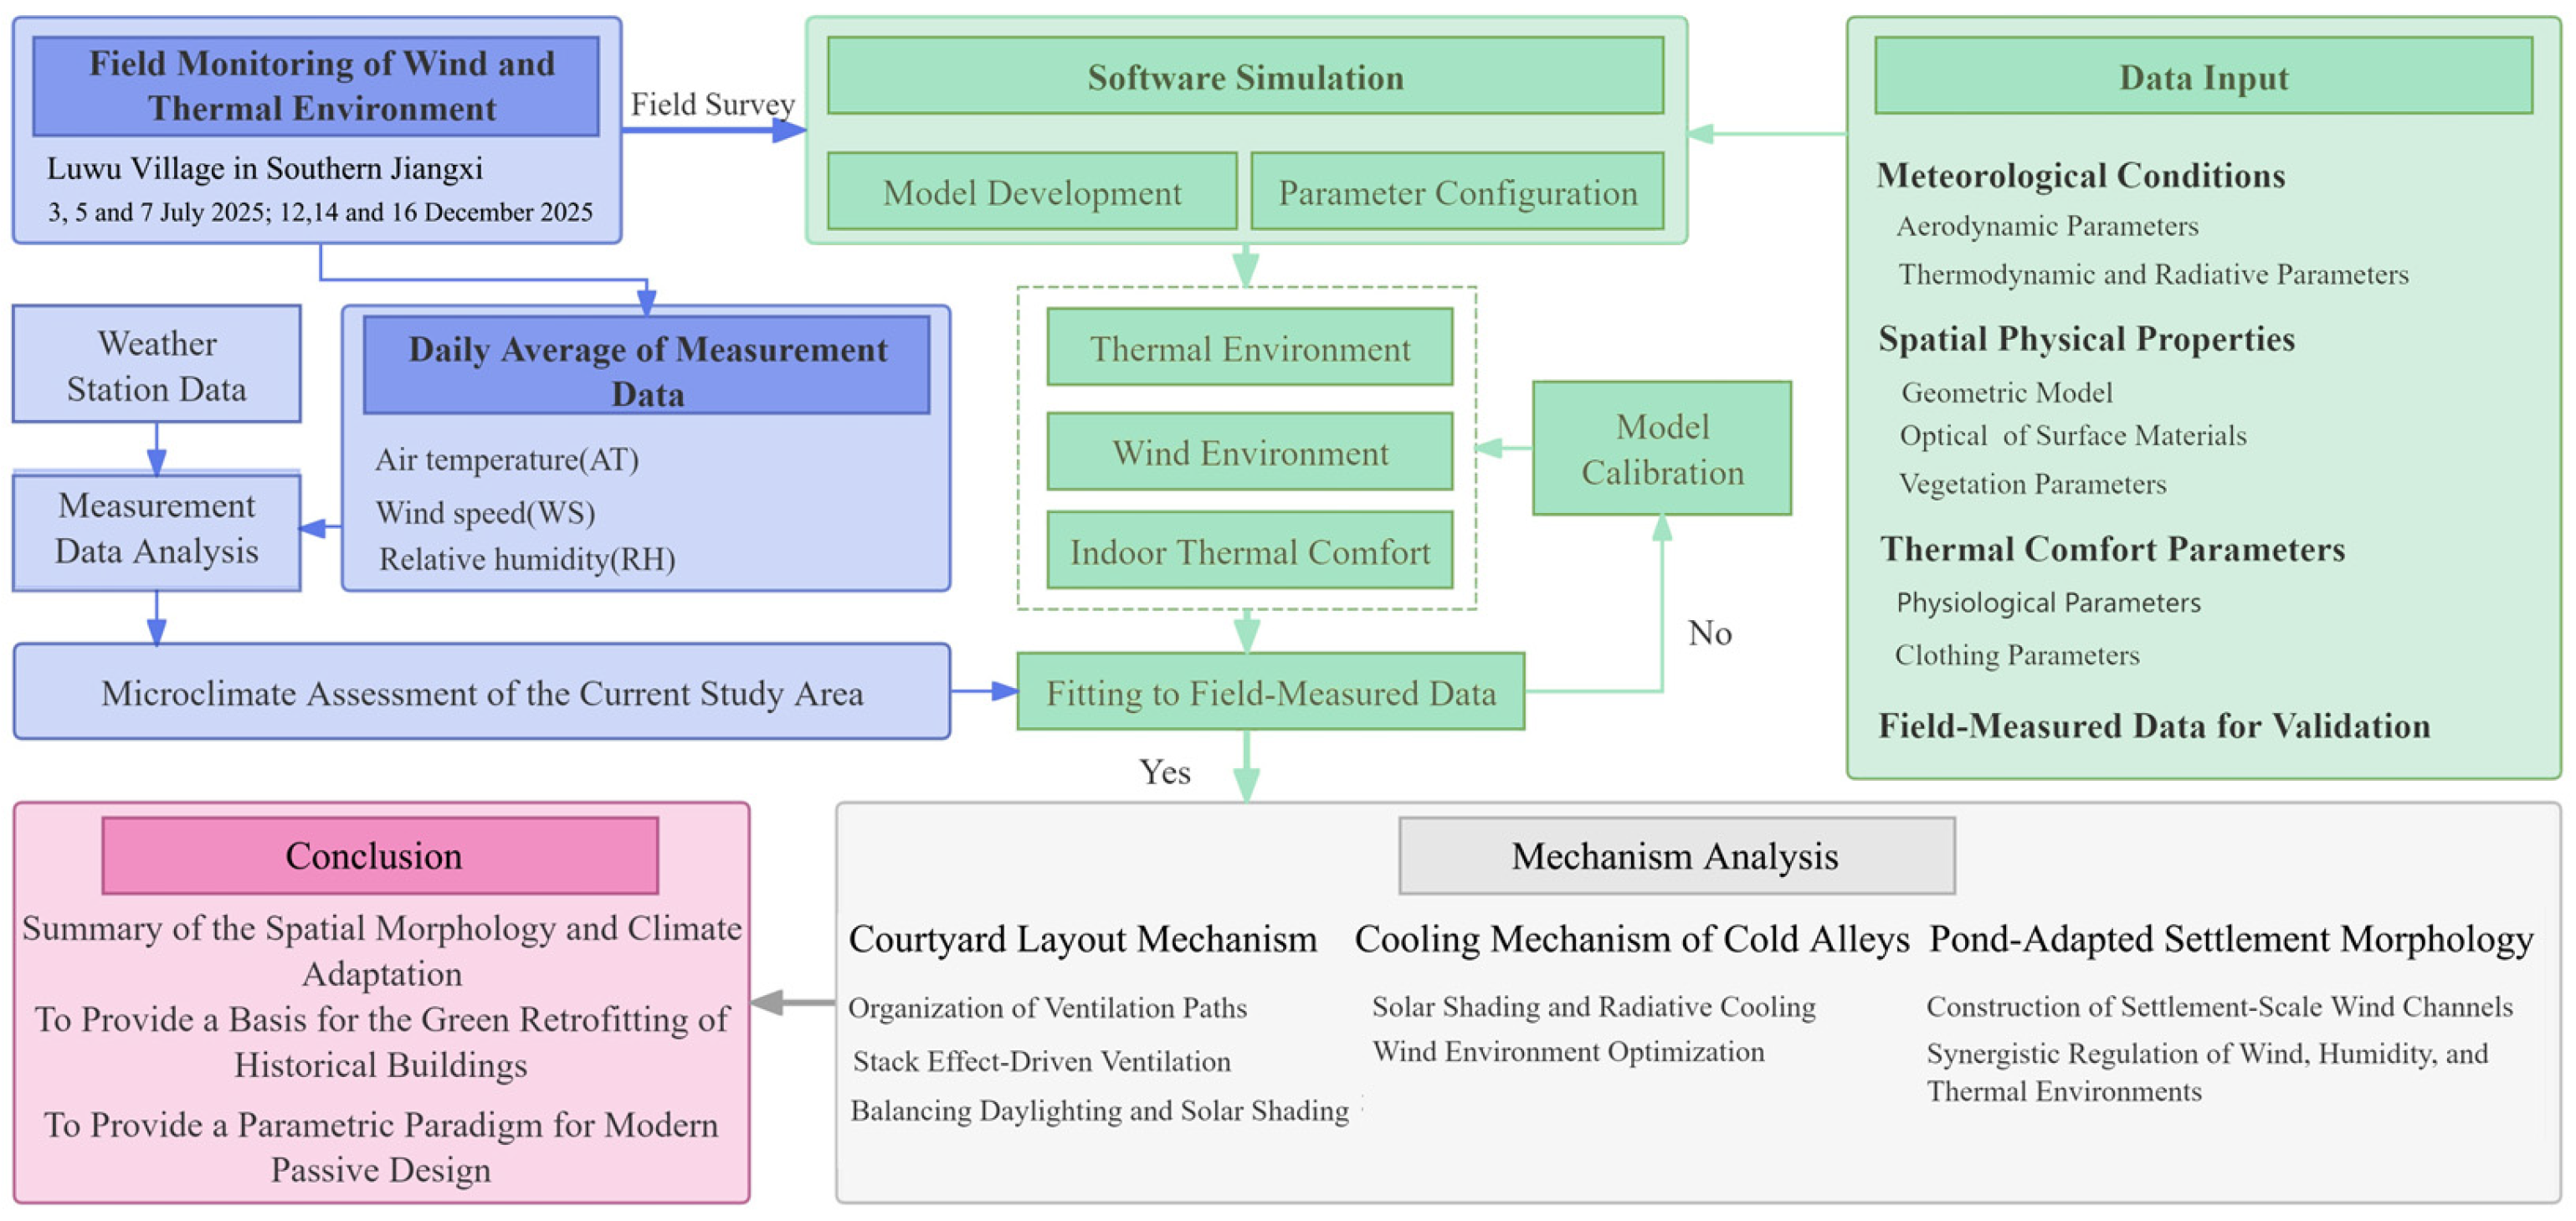
THSware (Version 2023, Tsinghua University and Beijing THSWARE Technology Co., Ltd., Beijing, China) was used because it integrates CFD-based airflow analysis and building thermal-environment calculation within a single workflow. The procedure included geometric model construction, parameter assignment, boundary-condition definition, numerical solution, result extraction, and comparison with field measurements. The methods, variables, and protocols are summarized in
Figure 3 and
Table 2.
2.3.1. Geometric Model and Simplification
The geometric model was simplified to preserve the main spatial characteristics relevant to settlement microclimate regulation while improving reproducibility. Building volumes retained their original footprints, heights, and principal enclosure relationships, whereas secondary roof details such as ridge ornaments and curved eaves were simplified as flat or low-slope surfaces. Openings, including doors, windows, and corridor interfaces, were retained with their actual positions and dimensions because of their relevance to airflow transmission and indoor–outdoor coupling, while small-scale elements such as frames, mullions, and decorative details were omitted.
Vegetation was represented as porous-media blocks with assigned canopy height, crown diameter, and shading properties. Ground surfaces were classified as bluestone pavement, bare soil, and water bodies, with corresponding thermal and radiative properties. These simplifications preserved the dominant airflow paths, shading continuity, surface heat exchange, and sequence-related spatial relationships while avoiding unnecessary geometric complexity. The model therefore retained the spatial attributes most relevant to the present analysis, including alley enclosure, courtyard openness, patio connectivity, hall transition, and room depth.
2.3.2. Boundary Conditions, Mesh, and Solver Settings
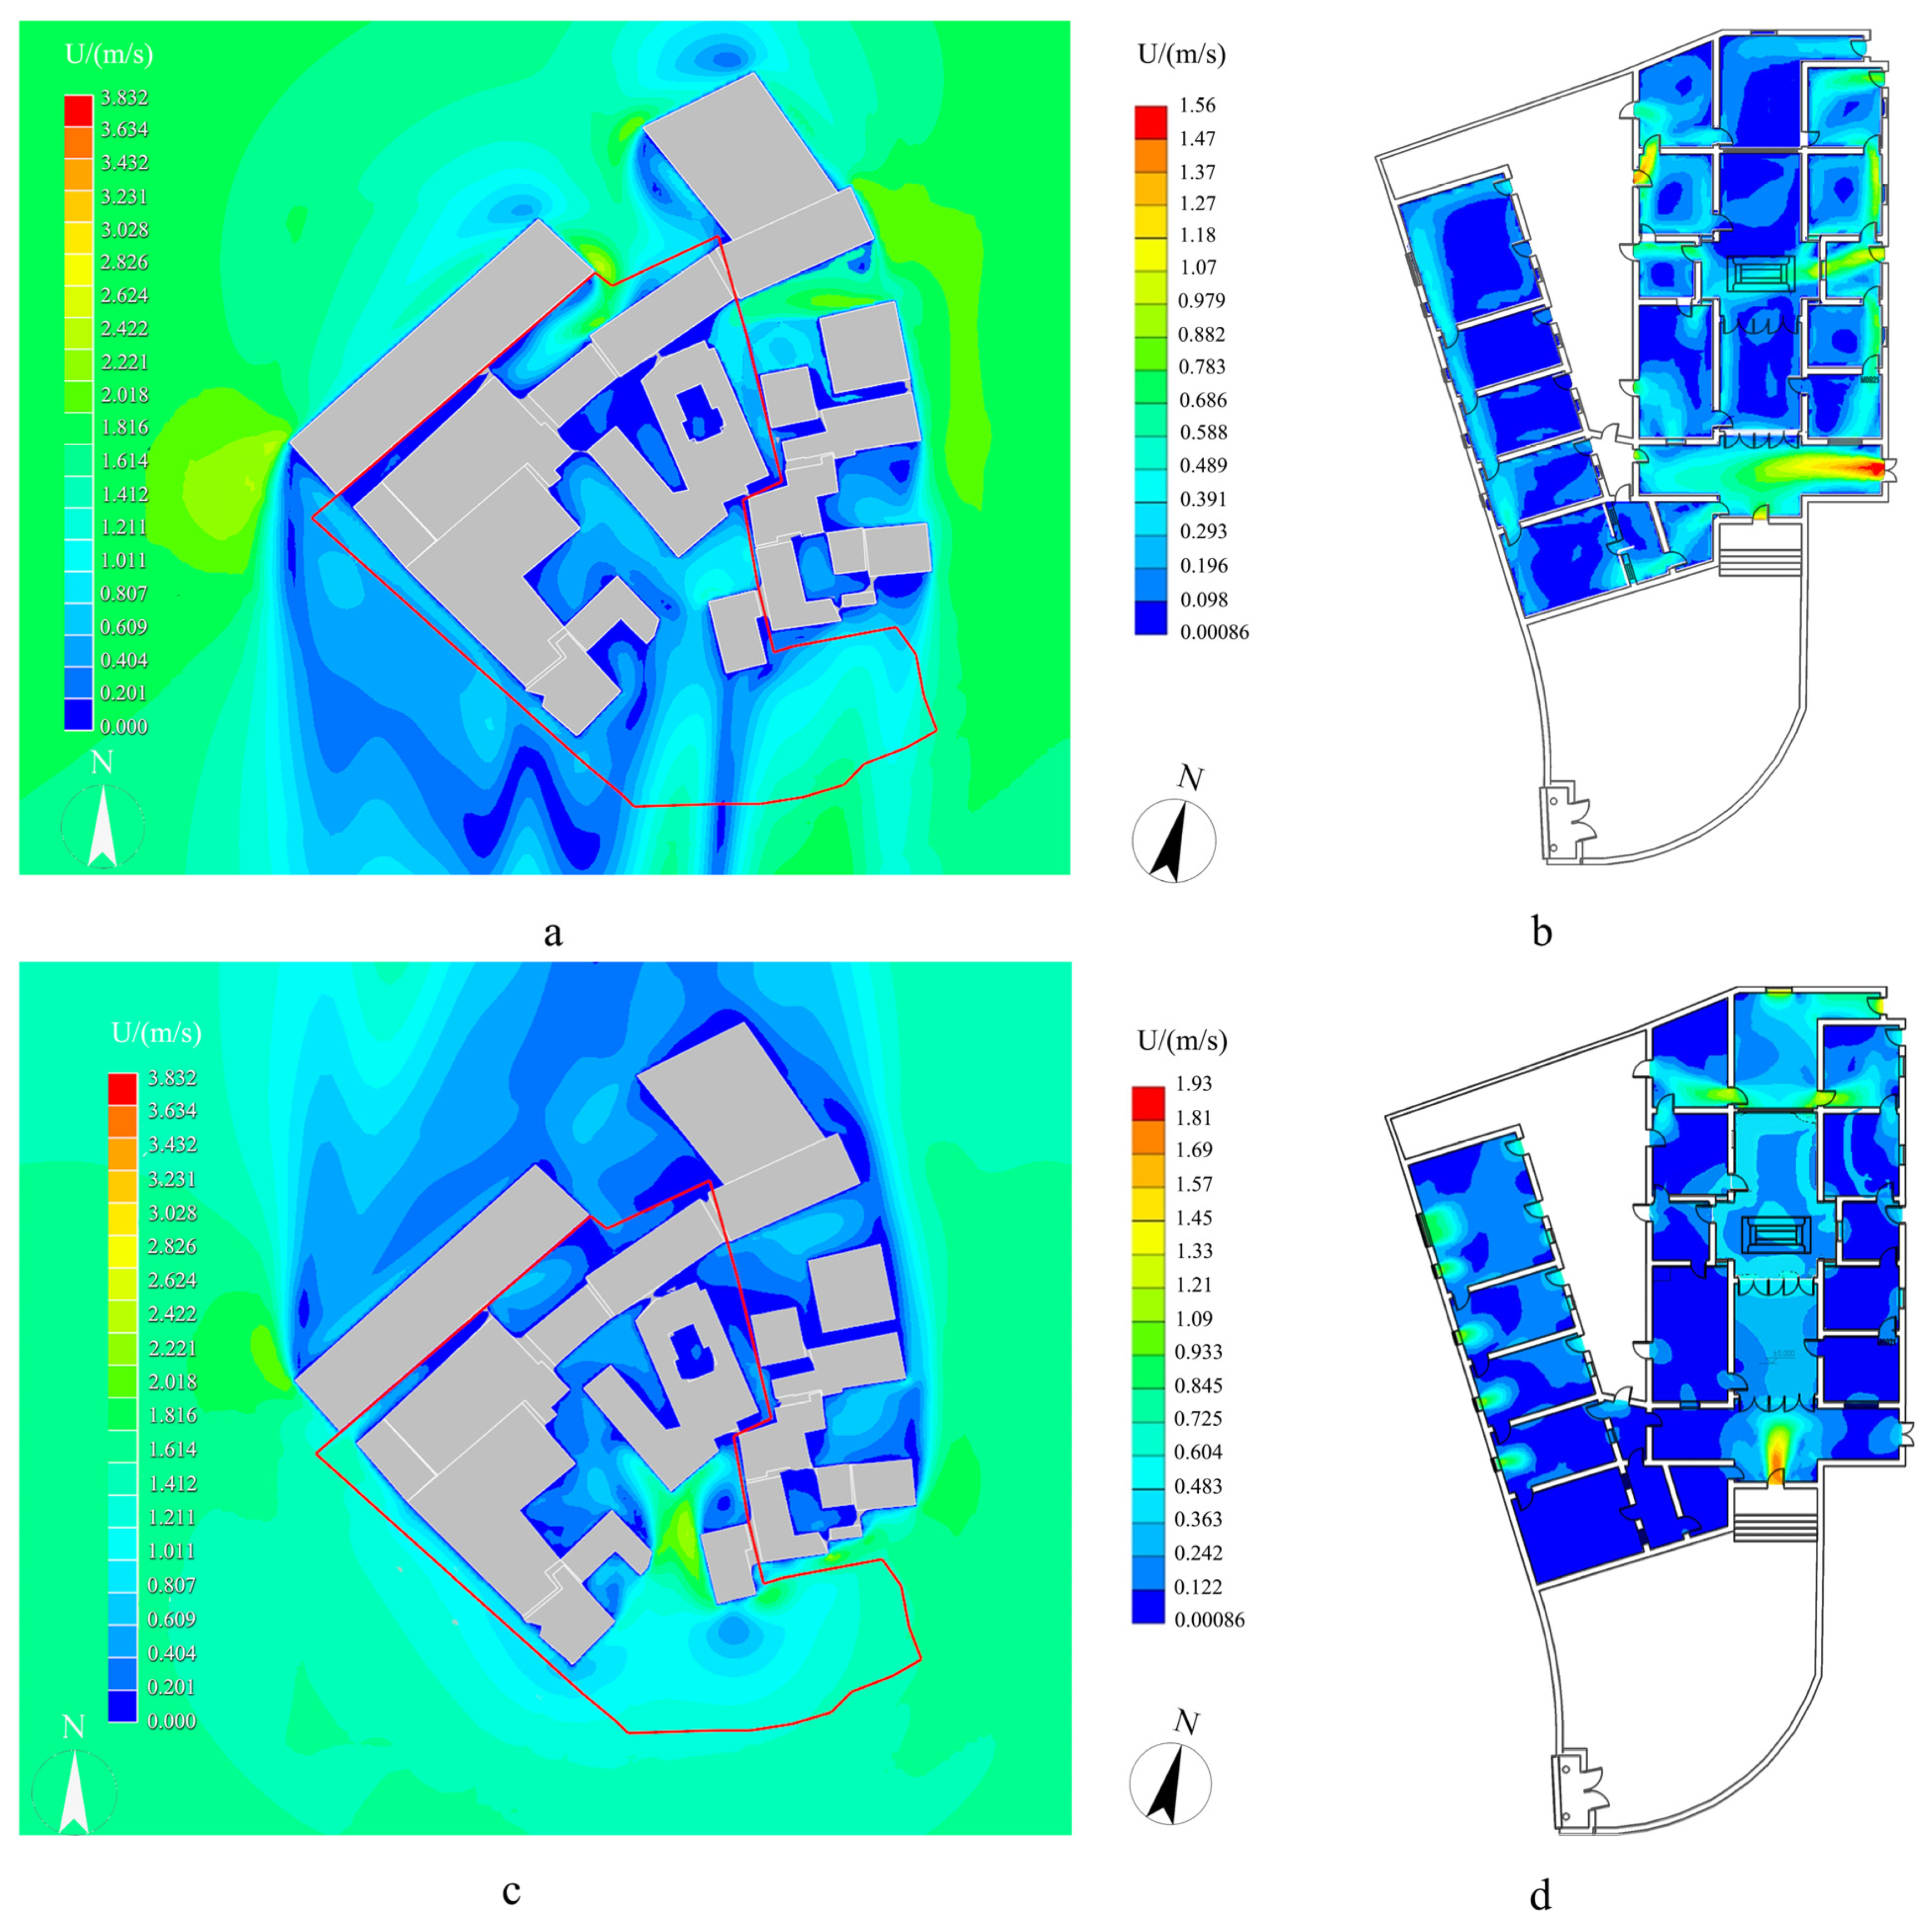
Simulation parameters were defined according to the climatic conditions of Ganzhou, measured site characteristics, and settlement morphology. For wind-environment simulations, the prevailing summer wind was set to south (S) with an inlet speed of 2.8 m/s, while the prevailing winter wind was set to north (N) with an inlet speed of 3.3 m/s. The site was classified as rural terrain, with a surface roughness index of 0.16. For thermal-environment simulations, ambient air temperatures were set at 35 °C in summer and 12 °C in winter, corresponding to the representative field conditions. Material properties were assigned according to observed surface conditions. Solar absorption coefficients were set to 0.85 for bluestone pavement, 0.65 for water bodies, and 0.75 for vegetation canopy; trees were represented using a shading coefficient of 0.6. For the outdoor CFD simulations, the calculation domain included the selected building cluster, adjacent streets, pond-edge space, vegetation, and surrounding open buffer zones for stable inflow and outflow development. The boundaries were extended to reduce artificial blockage and boundary interference. In the present model, the domain boundary was set at approximately five times the characteristic building height upstream, laterally, and above the highest roof level, and approximately ten times the characteristic building height downstream. This domain retained the local settlement morphology around the measurement area while limiting boundary effects on the airflow field within the linked vernacular spatial sequence.
Solar-radiation boundary conditions were defined using the typical meteorological year (TMY) dataset for Ganzhou from the China Meteorological Data Service Center. The thermal simulations adopted representative summer and winter clear-sky conditions consistent with the field measurement days. Solar position was determined from site location, date, and simulation hour, and geometric shading by buildings, patios, courtyards, and vegetation was calculated from the three-dimensional model. Both short-wave solar radiation and long-wave radiative exchange among buildings, ground surfaces, and the sky were considered. These radiation-related settings were kept consistent across measurement-based comparison and parametric scenarios. Cloud variability was not resolved separately because validation measurements were conducted under representative clear-sky conditions.
For CFD simulations, a hybrid tetrahedral–hexahedral mesh was generated using the built-in THSware mesher. Local refinement was applied around building corners, alley entrances, courtyard and patio openings, window and door interfaces, pedestrian-level zones, narrow cold alleys, and semi-open interfaces. The minimum cell size was 0.1 m, and the mesh growth rate was 1.2. Grid independence was examined using coarse, medium, and fine meshes of approximately 1.2 million, 2.8 million, and 5.5 million cells, respectively. The comparison focused on mean pedestrian-level wind speed at 1.5 m and indoor air velocity at representative points. Differences between the medium and fine meshes were less than 3.2% for mean pedestrian-level wind speed and less than 4.5% for indoor air velocity. The medium mesh was therefore adopted to balance numerical stability, computational cost, and spatial resolution for sequence-level comparative analysis.
The steady-state RANS equations were solved using the standard k-ε turbulence model with scalable wall functions. This model was adopted because the present CFD analysis aimed to reproduce the comparative airflow hierarchy and wind-speed attenuation across linked spaces under representative wind-driven conditions, for which steady RANS remains widely used in pedestrian-level and urban ventilation studies [
47,
48]. Nevertheless, the standard k-ε model may introduce bias in regions with flow separation and recirculation, where turbulent kinetic energy can be overpredicted [
49]. In the present study, the model was therefore used primarily for comparative spatial analysis rather than for the detailed reconstruction of local turbulent structures, and the resulting geometry-performance relationships should be interpreted as case-bounded references [
50]. Pressure–velocity coupling was handled using the SIMPLE algorithm, and second-order upwind discretization was applied to the governing equations. Convergence was assumed when residuals fell below 1.0 × 10
−4 and monitored wind speeds at control points varied by less than 0.01 m/s over 200 iterations.
2.3.3. Wind and Thermal Simulation Settings
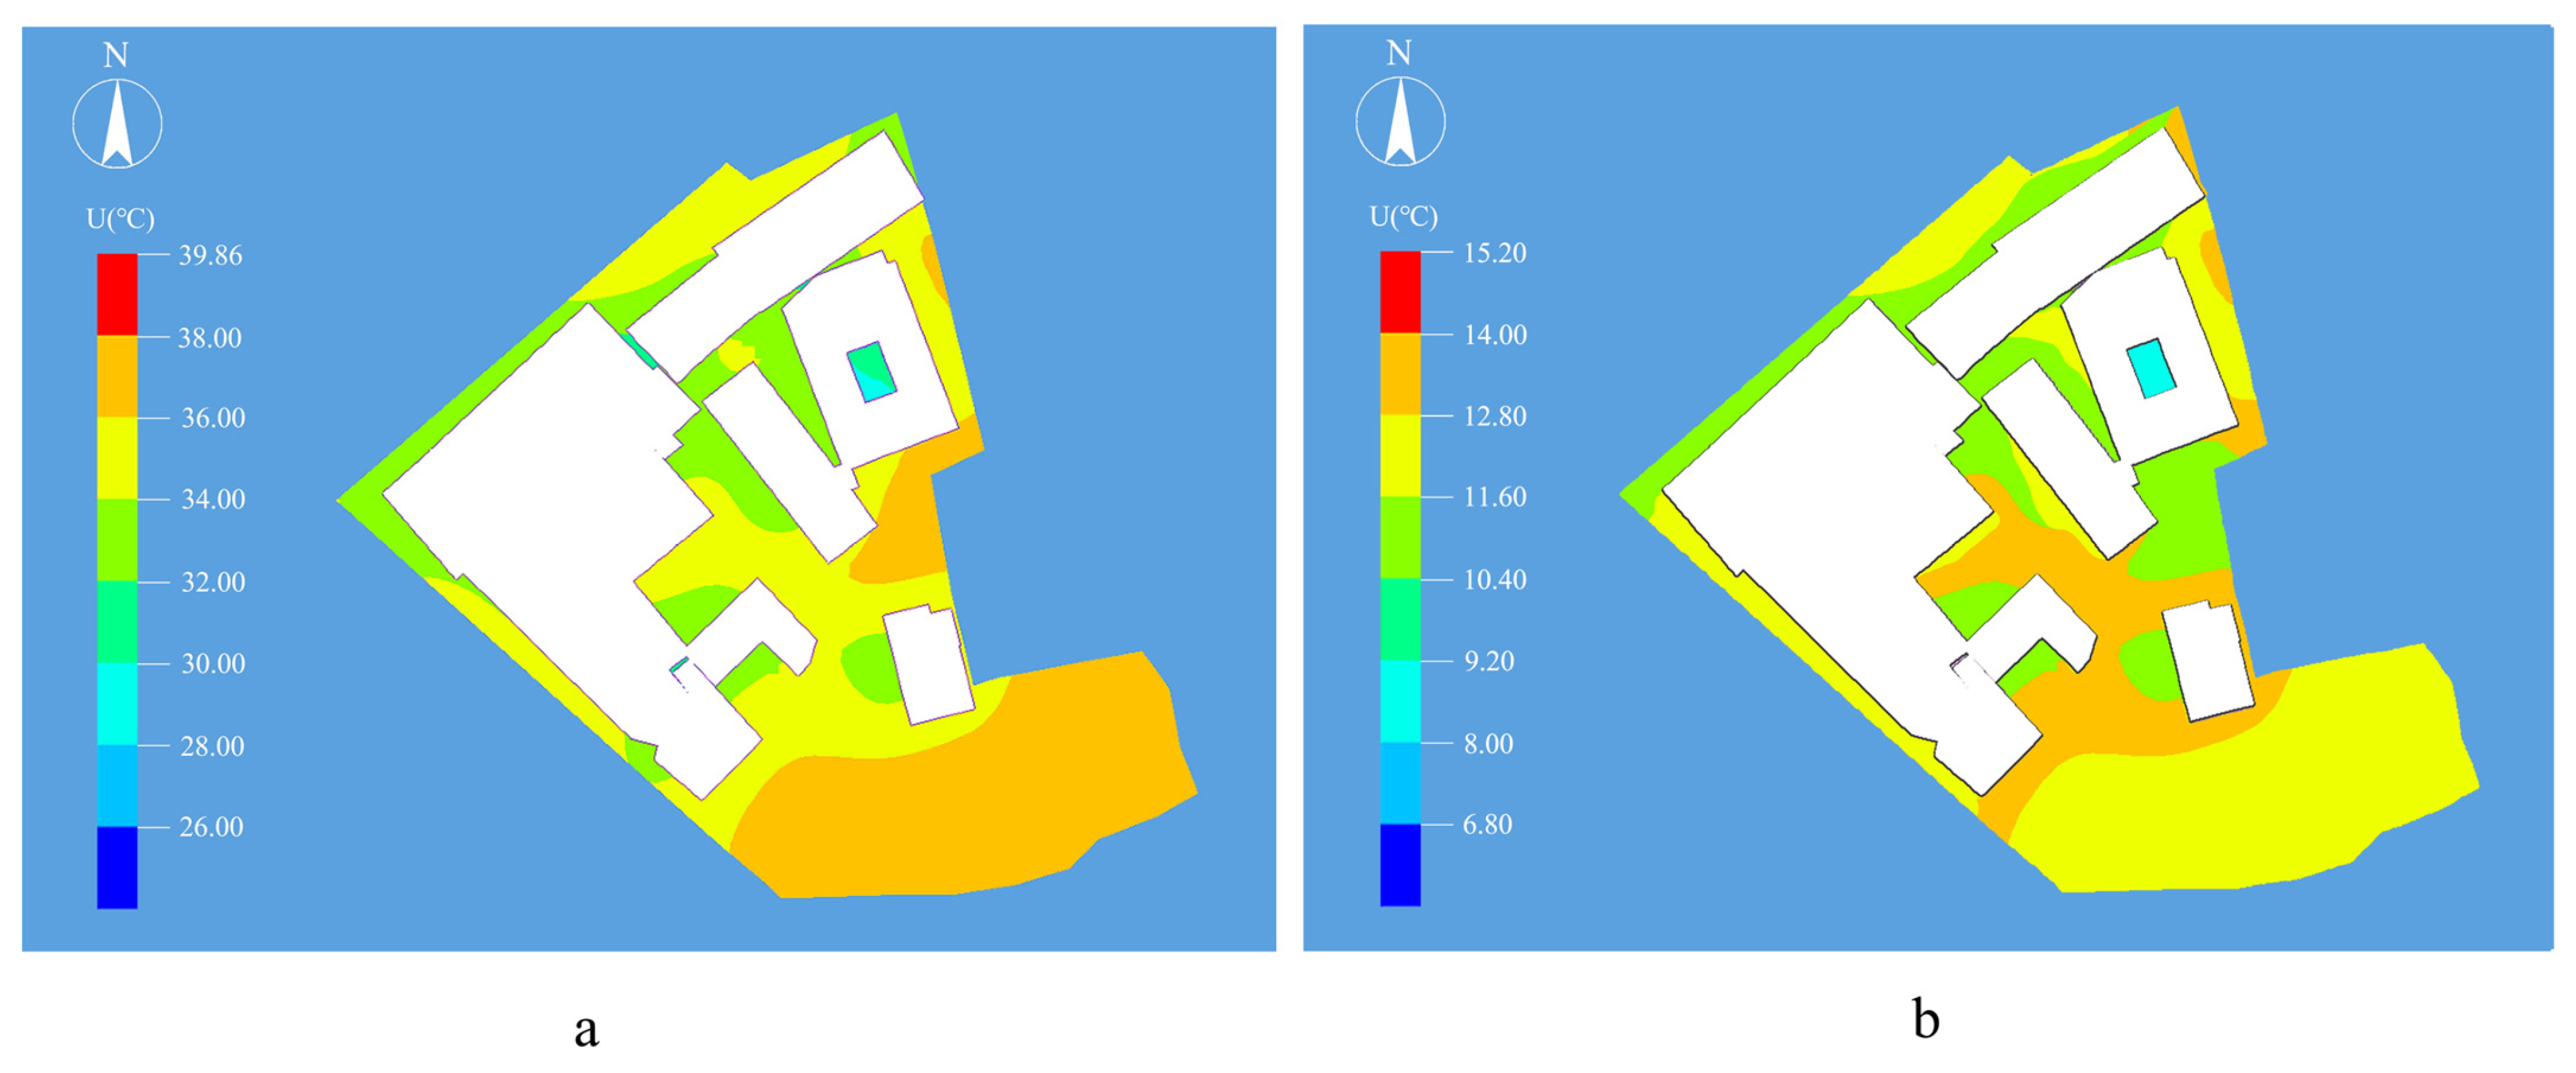
Outdoor thermal simulations considered solar radiation, air movement, surface heat transfer, and long-wave radiative exchange between buildings and ground surfaces. Typical meteorological data for Ganzhou were used, with emphasis on representative summer and winter conditions corresponding to the field campaign. These simulations identified the spatial distribution of air temperature and radiation-related thermal exposure across exposed, shaded, and semi-enclosed spaces.
Indoor and outdoor wind-environment simulations were used to analyze wind-speed distribution, airflow paths, local ventilation differences, and airflow attenuation across spatial types. Particular attention was given to cold alleys, courtyards, patios, halls, semi-open interfaces, and interior rooms as connected airflow nodes extending from open settlement edges to buffered interior zones.
The wind and thermal simulations were implemented in a one-way sequential manner rather than as fully coupled simulations. Buoyancy feedback induced by air-temperature differences was not included in the steady-state RANS simulations. LES or fully buoyancy-coupled transient simulations could provide more detailed information on turbulent structures and local recirculation, but they require substantially higher computational cost and more detailed transient boundary conditions. Since the representative cases were primarily wind-driven, this study focused on relative ventilation performance, spatial airflow hierarchy, and sequence-level environmental differences, rather than fine-scale turbulent structures. This approach is therefore aligned with sequence-level interpretation and retrofit-oriented decision support, although its influence on near-ground airflow in weakly ventilated or strongly stratified semi-enclosed spaces is acknowledged as a limitation.
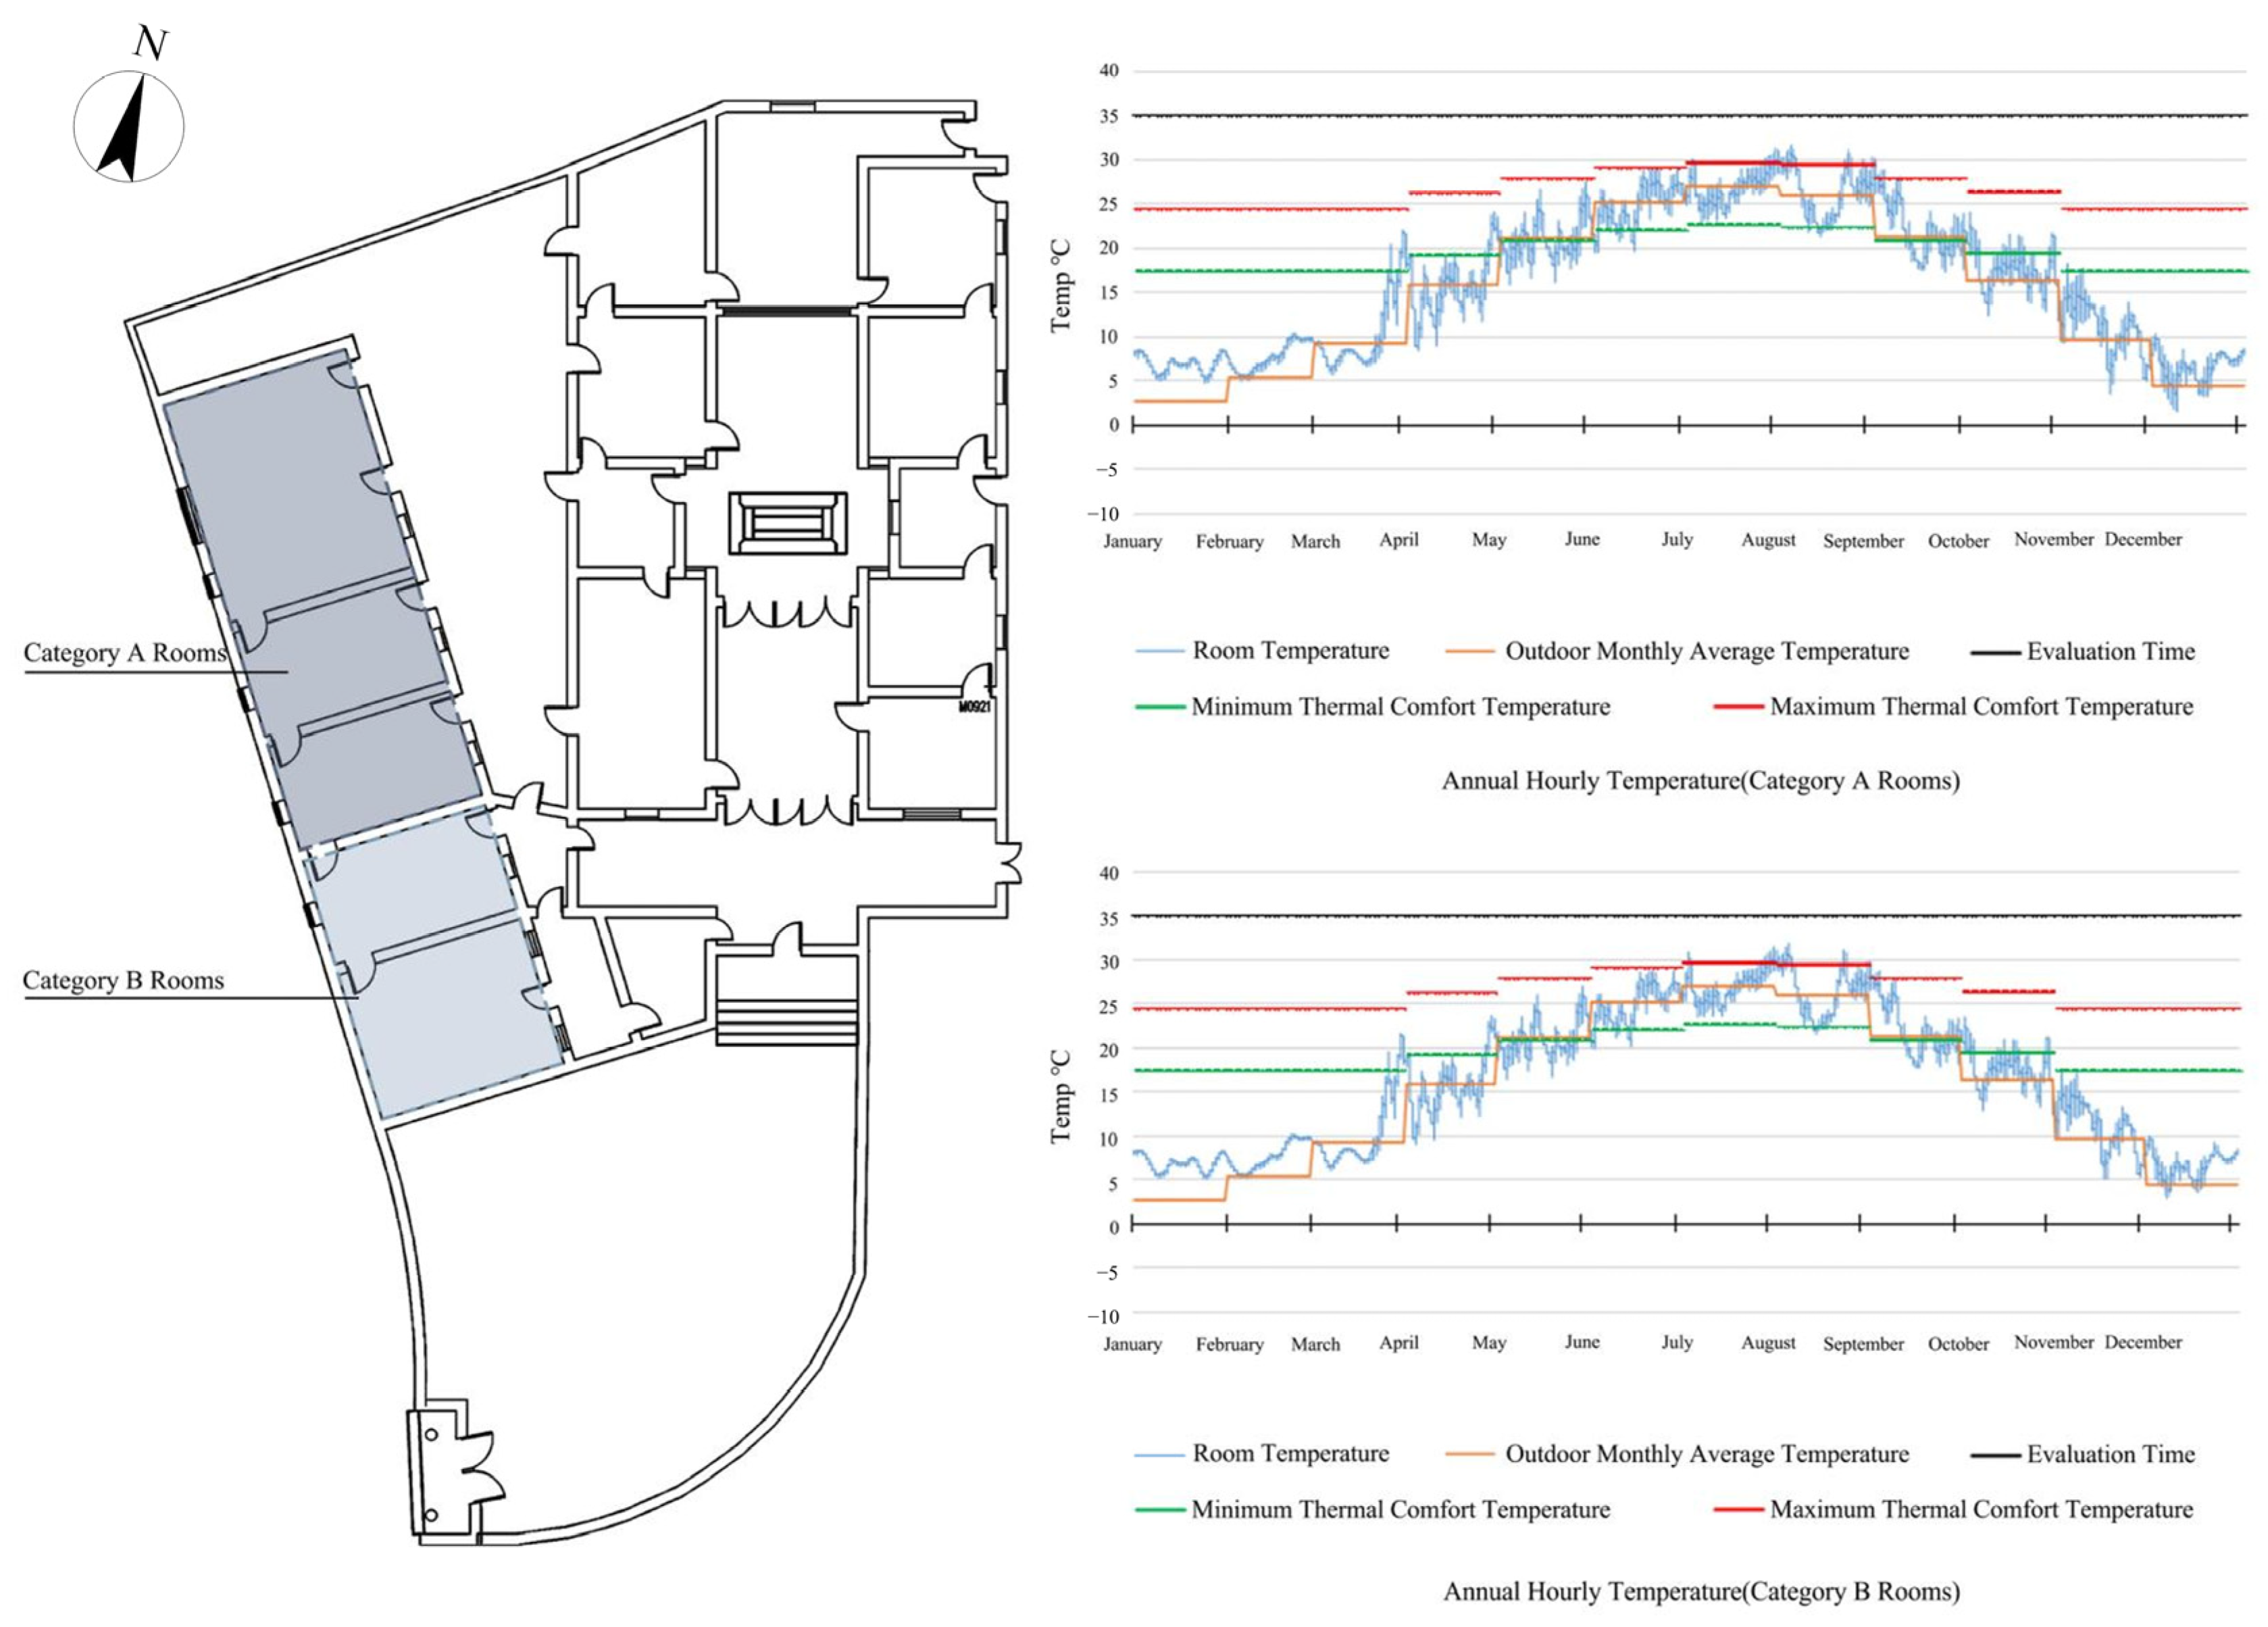
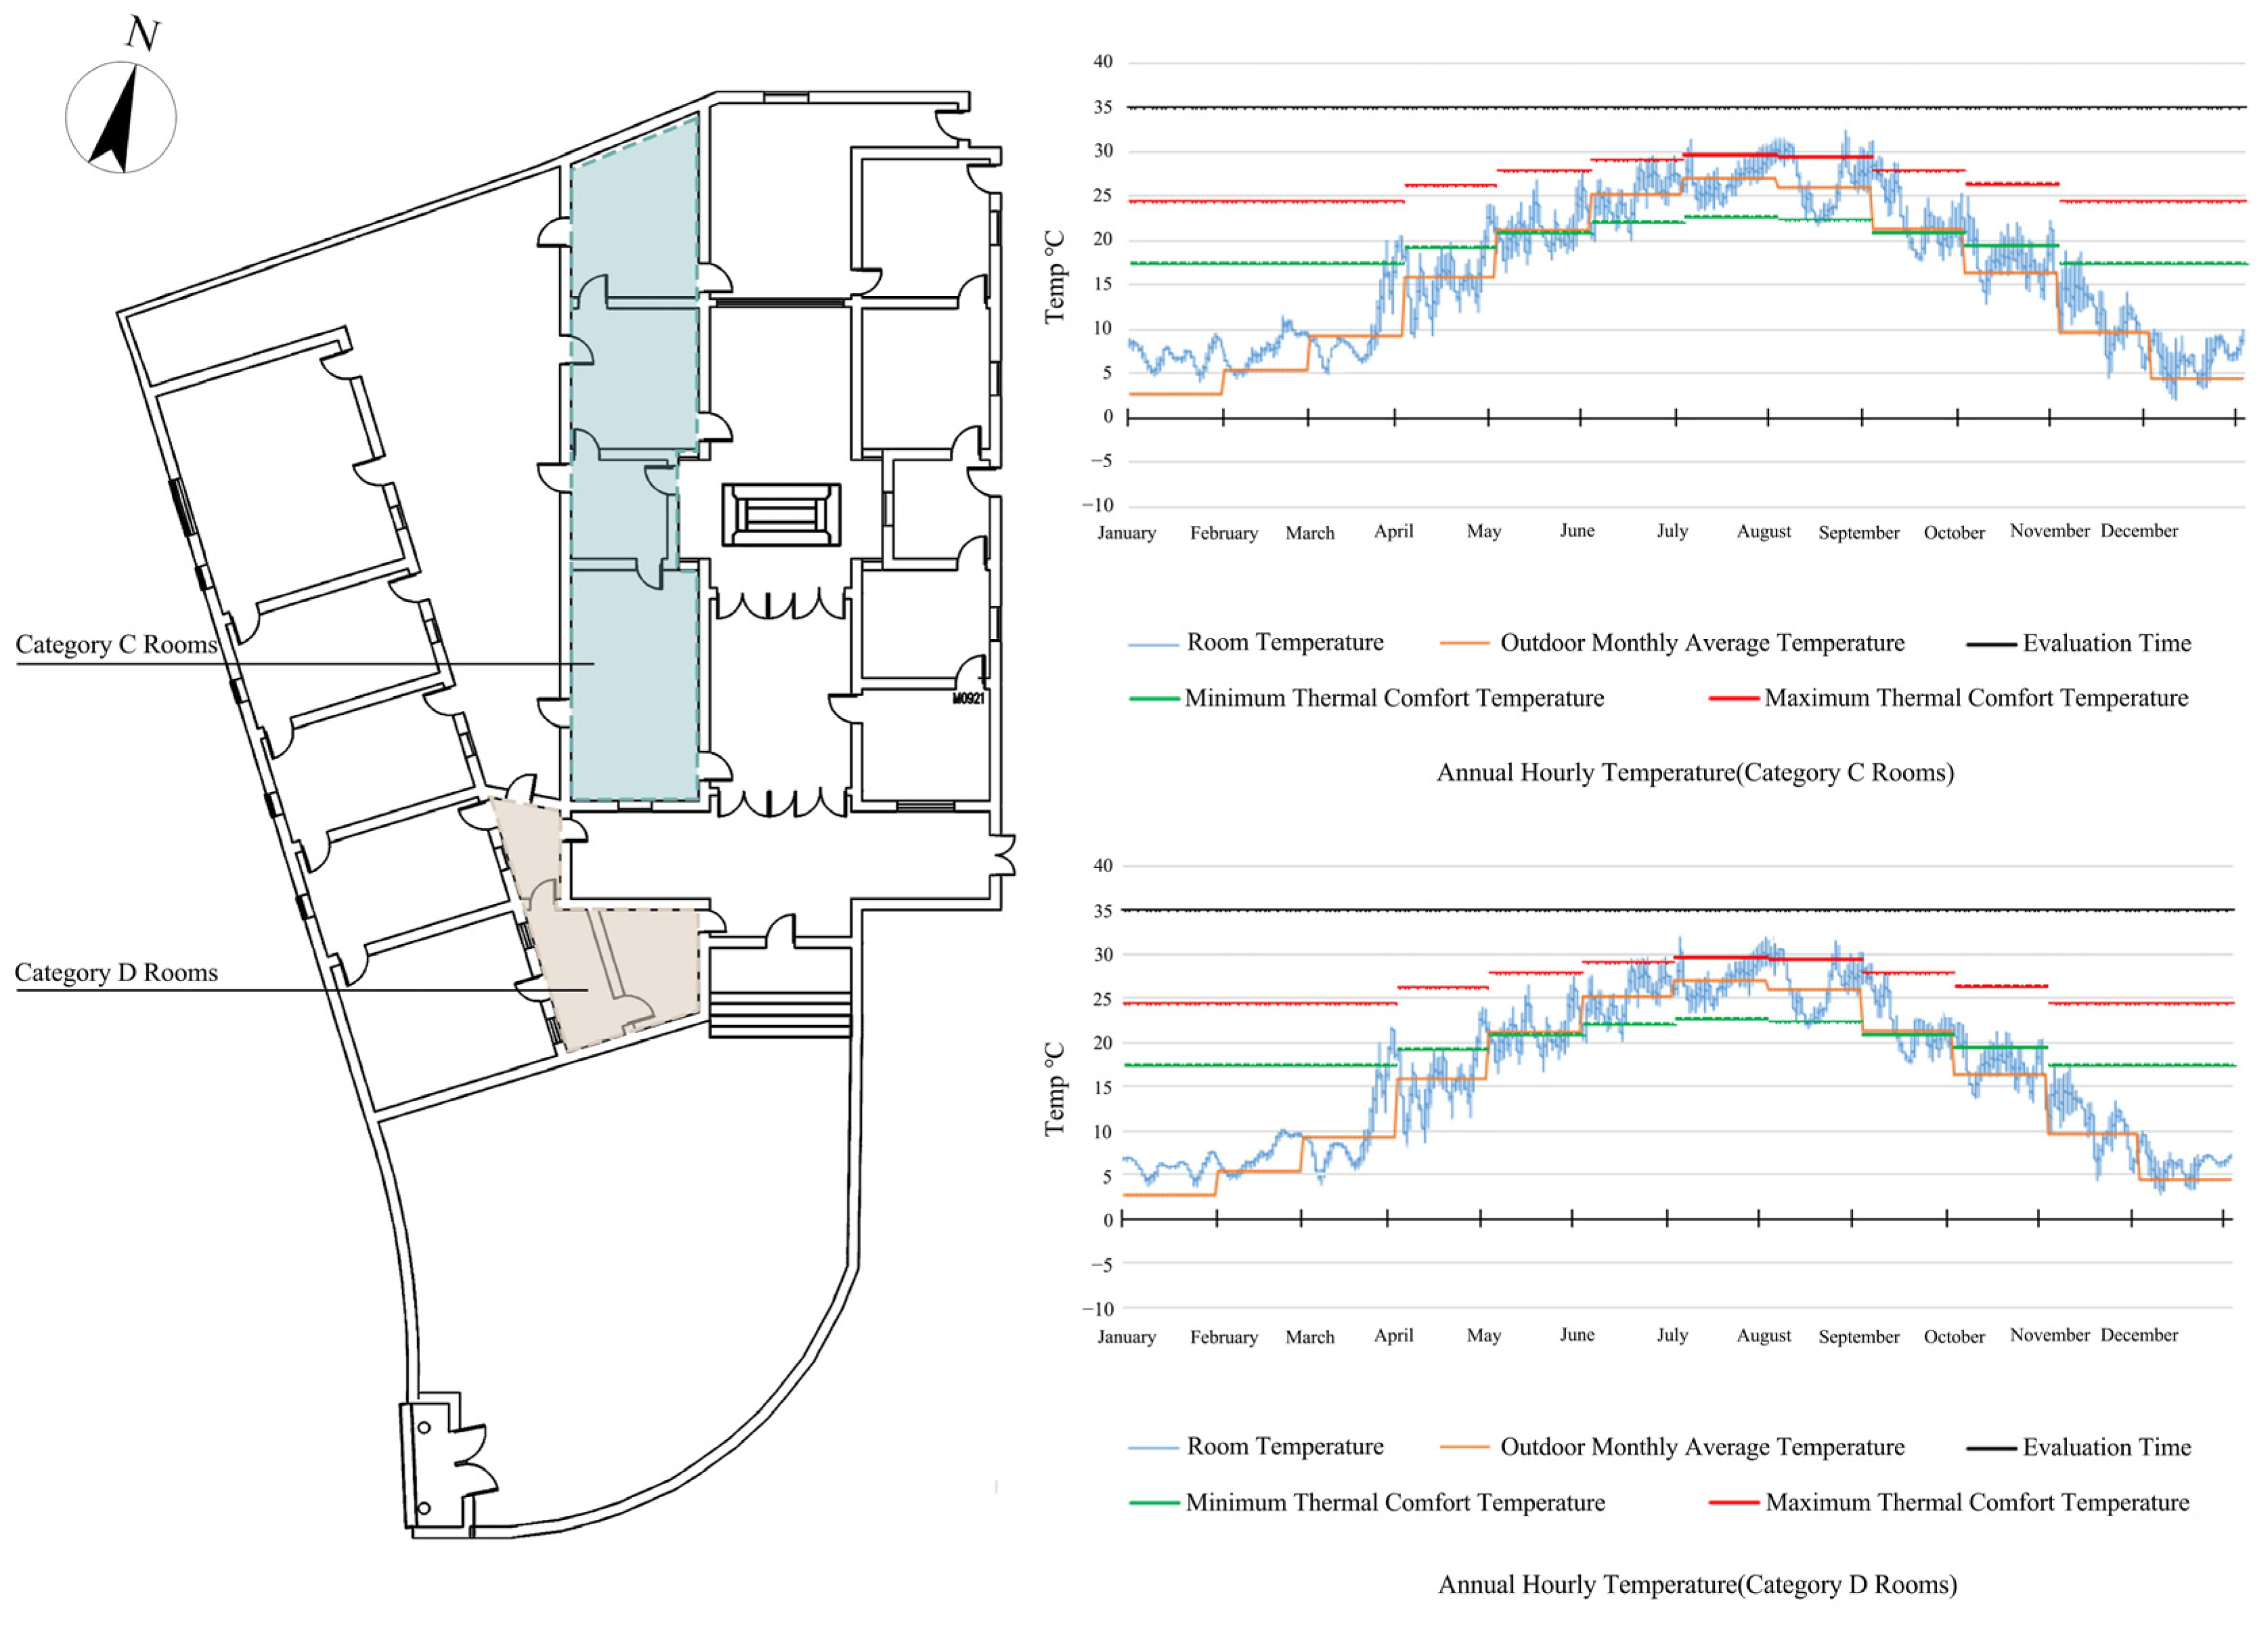
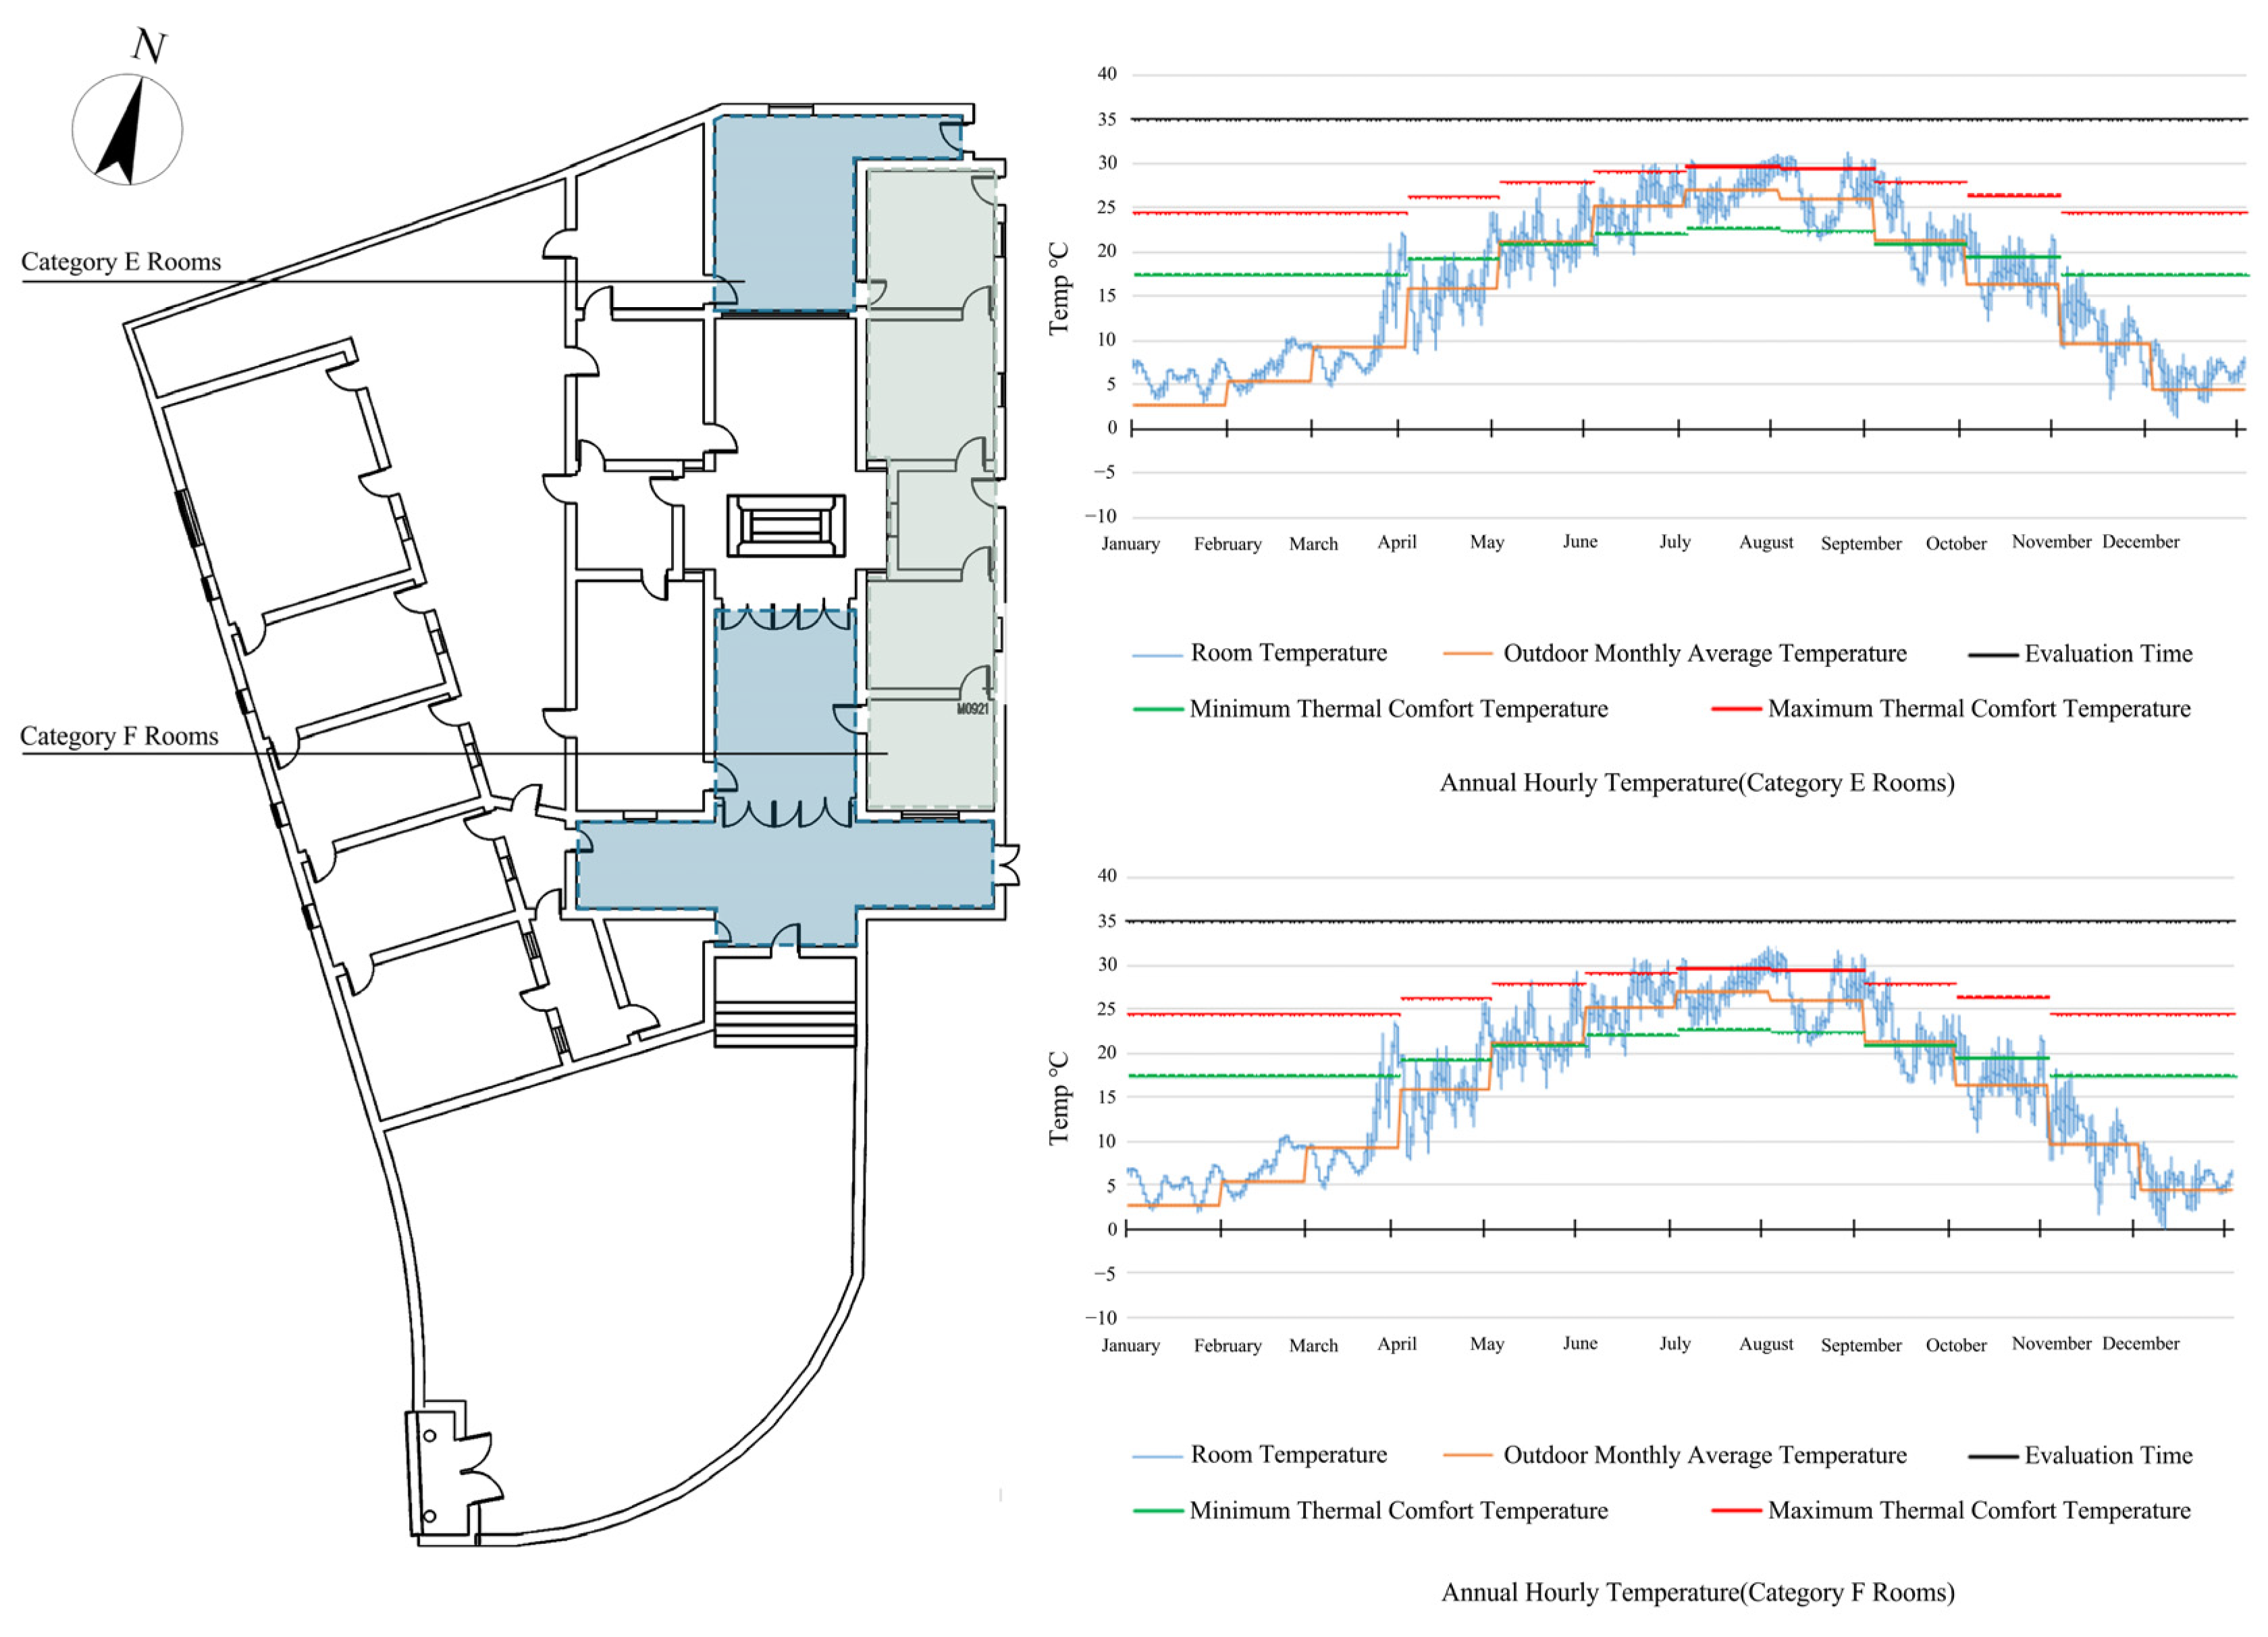
Indoor thermal simulations were used to interpret room-level thermal response under annual climatic conditions and to examine how the representative sequence relationships observed during the monitored periods were reflected in longer-term indoor temperature behavior. For the indoor overheating assessment, thermal comfort limits were evaluated using the non-mechanical heating/cooling evaluation method in GB/T 50785-2012, Evaluation Standard for Indoor Thermal and Humid Environment in Civil Buildings [
51]. Because the studied Hakka dwellings are naturally ventilated residential buildings without active cooling systems, the summer upper comfort threshold was taken as an operative temperature of 28 °C, corresponding to Grade II evaluation. In the THSware indoor thermal comfort evaluation module, the comfort range was determined based on the residential-building function and local meteorological conditions.
In the wind-environment simulations, doors, windows, patio openings, and corridor interfaces were represented according to their measured positions, dimensions, and observed opening states. During field measurements, operable doors and windows were kept open to represent the naturally ventilated condition of the dwellings. Accordingly, major operable openings were modeled as open flow passages. A small number of doors or windows that could not be opened because of aging, damage, blockage, or sealed conditions were treated as closed in both the field condition and the simulation model. This setting reproduced the measured ventilation condition along the linked vernacular spatial sequence. No full matrix of partial-opening scenarios was conducted. Partial opening would reduce effective opening area, increase flow resistance, weaken cross-ventilation, and increase airflow stagnation in deeper indoor spaces. Thus, the reported indoor airflow results represent the measured open-state condition of available openings rather than all possible occupant-controlled states. Partial or intermittent opening is acknowledged as a source of uncertainty for future sensitivity analysis.
Internal heat gains were simplified. No high-intensity or time-varying heat-gain schedule from occupants, appliances, or lighting was imposed. The indoor thermal-response analysis focused on relative differences among room types caused by orientation, envelope buffering, and linkage to patios, halls, and cold alleys. This approach supports evaluation of airflow–temperature relationships across the sequence, while acknowledging that additional internal heat gains could influence weakly ventilated spaces and should be considered in future studies.
The simulation framework was evaluated by its ability to reproduce relative spatial hierarchy, attenuation trends, and comparative performance differences among linked spaces rather than instantaneous microclimatic fluctuations. The validated simulations were then used to support the interpretation of airflow, thermal exposure, humidity-related effects, thermal buffering, and geometry-sensitive retrofit analysis.
2.3.4. Parametric Setup and Evaluation Criteria
A parametric response analysis was conducted for two representative spatial units, namely cold alleys and courtyards, to examine retrofit-relevant geometry-performance relationships. These units were selected because they are key nodes within the linked vernacular spatial sequence and showed clear thermal and ventilation differences in both field measurements and validated simulations.
For cold alleys, the tested parameters included alley width and height-to-width ratio (H/W), while the longitudinal connection pattern and surrounding built context were kept consistent with the measured case. For courtyards, the tested parameters included openness, depth, and height-to-width ratio (H/W). In all scenarios, non-target variables, including prevailing wind direction, inlet wind speed, surrounding building arrangement, material settings, and seasonal boundary conditions, were held constant so that performance differences could be attributed primarily to geometric variation.
Scenario performance was evaluated using air temperature, pedestrian-level wind speed, and relative humidity where relevant. PET-based comfort interpretation was anchored primarily in the measured representative cases, while the parametric scenarios were used to examine airflow-temperature and thermal–environmental tendencies rather than full-scenario PET-based comfort optimization. Because no single indicator can adequately represent microclimatic quality in hot–humid settlements, performance was assessed through multi-indicator comparison rather than by optimizing a single variable. Preferred responses were identified where airflow-temperature performance indicated reduced summer thermal exposure without excessive stagnation or humidity retention.
For cold alleys, the analysis sought geometric ranges that maintained continuous shading, allowed moderated low-velocity air transport, and reduced pedestrian-level thermal stress. For courtyards, the analysis examined how openness, depth, and enclosure influenced ventilation potential, attenuation with spatial depth, thermal buffering, and comfort-related environmental moderation. The results were interpreted as geometry-sensitive response patterns under explicit case conditions rather than as universal optima.
The resulting geometry-performance tendencies within the tested ranges represent case-validated responses under the specific boundary conditions of Luwu Village, including its compact settlement fabric, prevailing wind environment, material characteristics, and linked spatial sequence. They should therefore be understood as context-sensitive performance references. For compact hot–humid vernacular settlements with comparable climatic and spatial conditions, these ranges may serve as engineering references for preliminary retrofit judgment, provided that local calibration is undertaken.
2.4. Model Calibration and Validation
Simulation results were calibrated and validated against field measurements under the same seasonal conditions, spatial locations, and variable definitions. The purpose was to determine whether the model reproduced the measured environmental hierarchy, inter-space gradients, and dominant response patterns required for subsequent mechanism interpretation and parametric analysis.
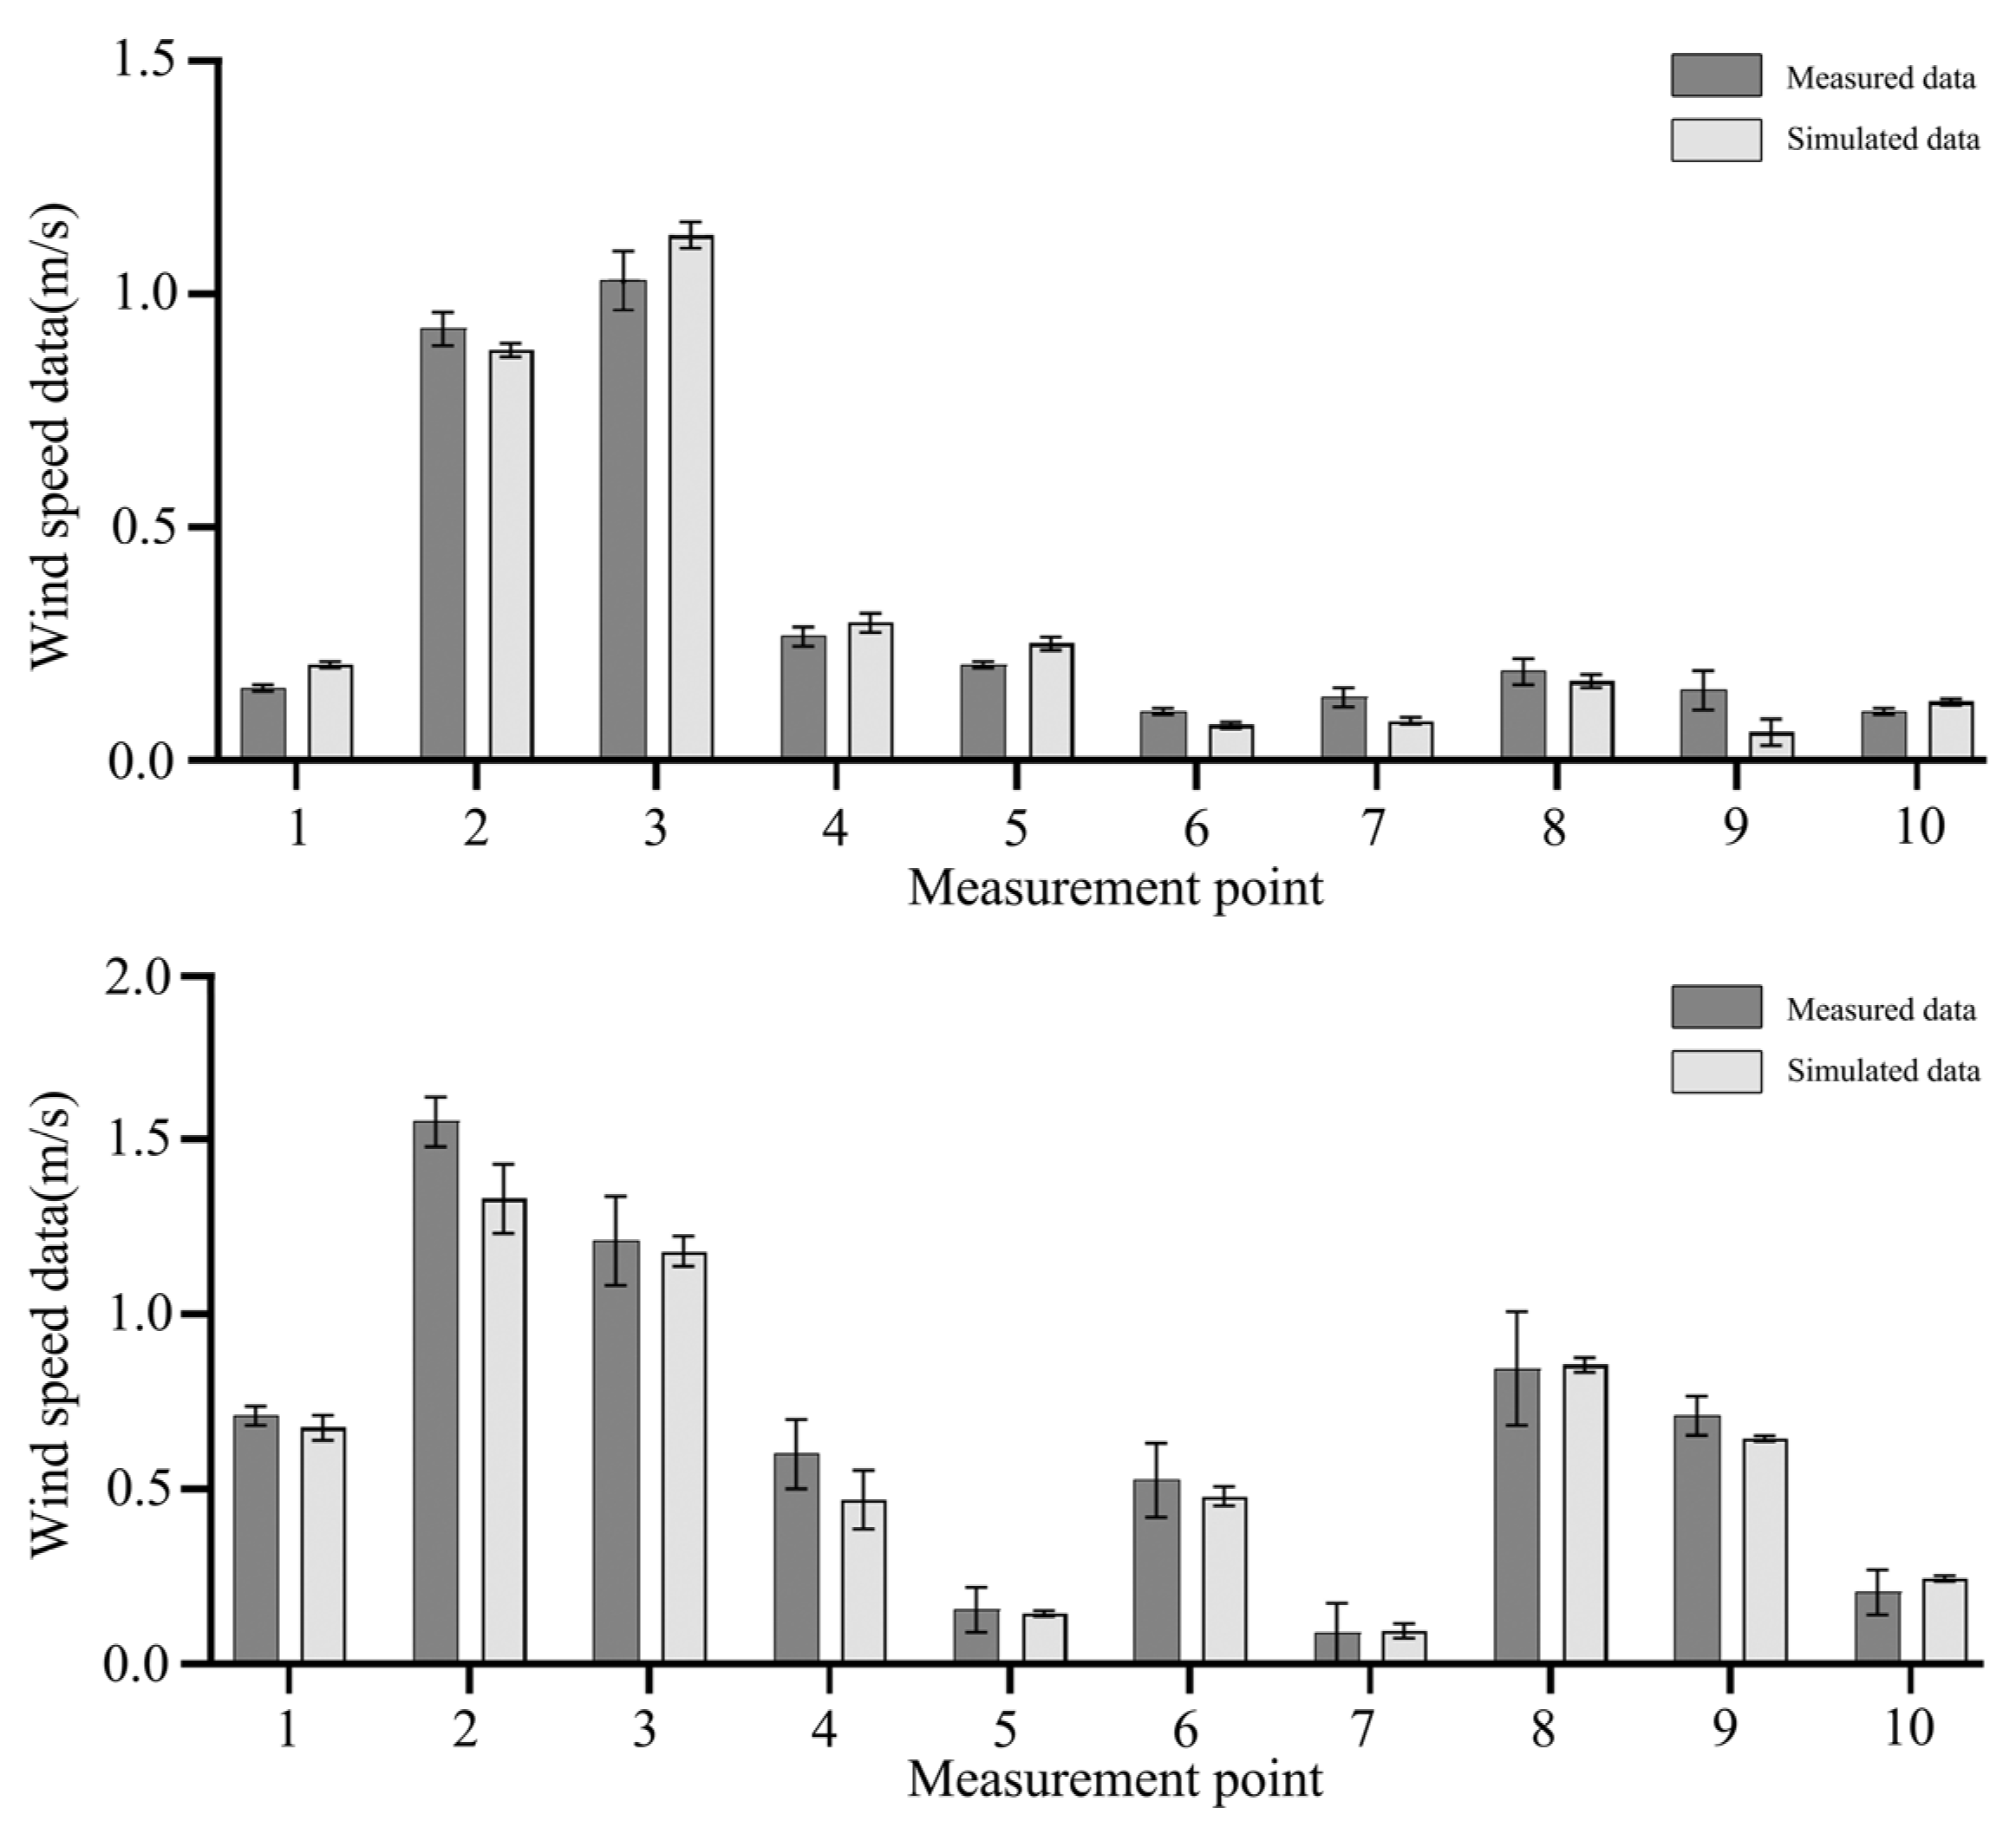
Validation focused primarily on outdoor air temperature and outdoor wind speed, which formed the main empirical basis for evaluating thermal stratification, ventilation attenuation, and comfort-related environmental differences within the settlement. Where data were available, selected indoor air temperature and indoor air velocity results were also used as supplementary references to assess indoor–outdoor coupling. Because the study focuses on comparative sequence analysis rather than complete reconstruction of all transient microclimatic variables, validation was limited to the variables most directly governing spatial thermal hierarchy and ventilation differentiation under the present framework.
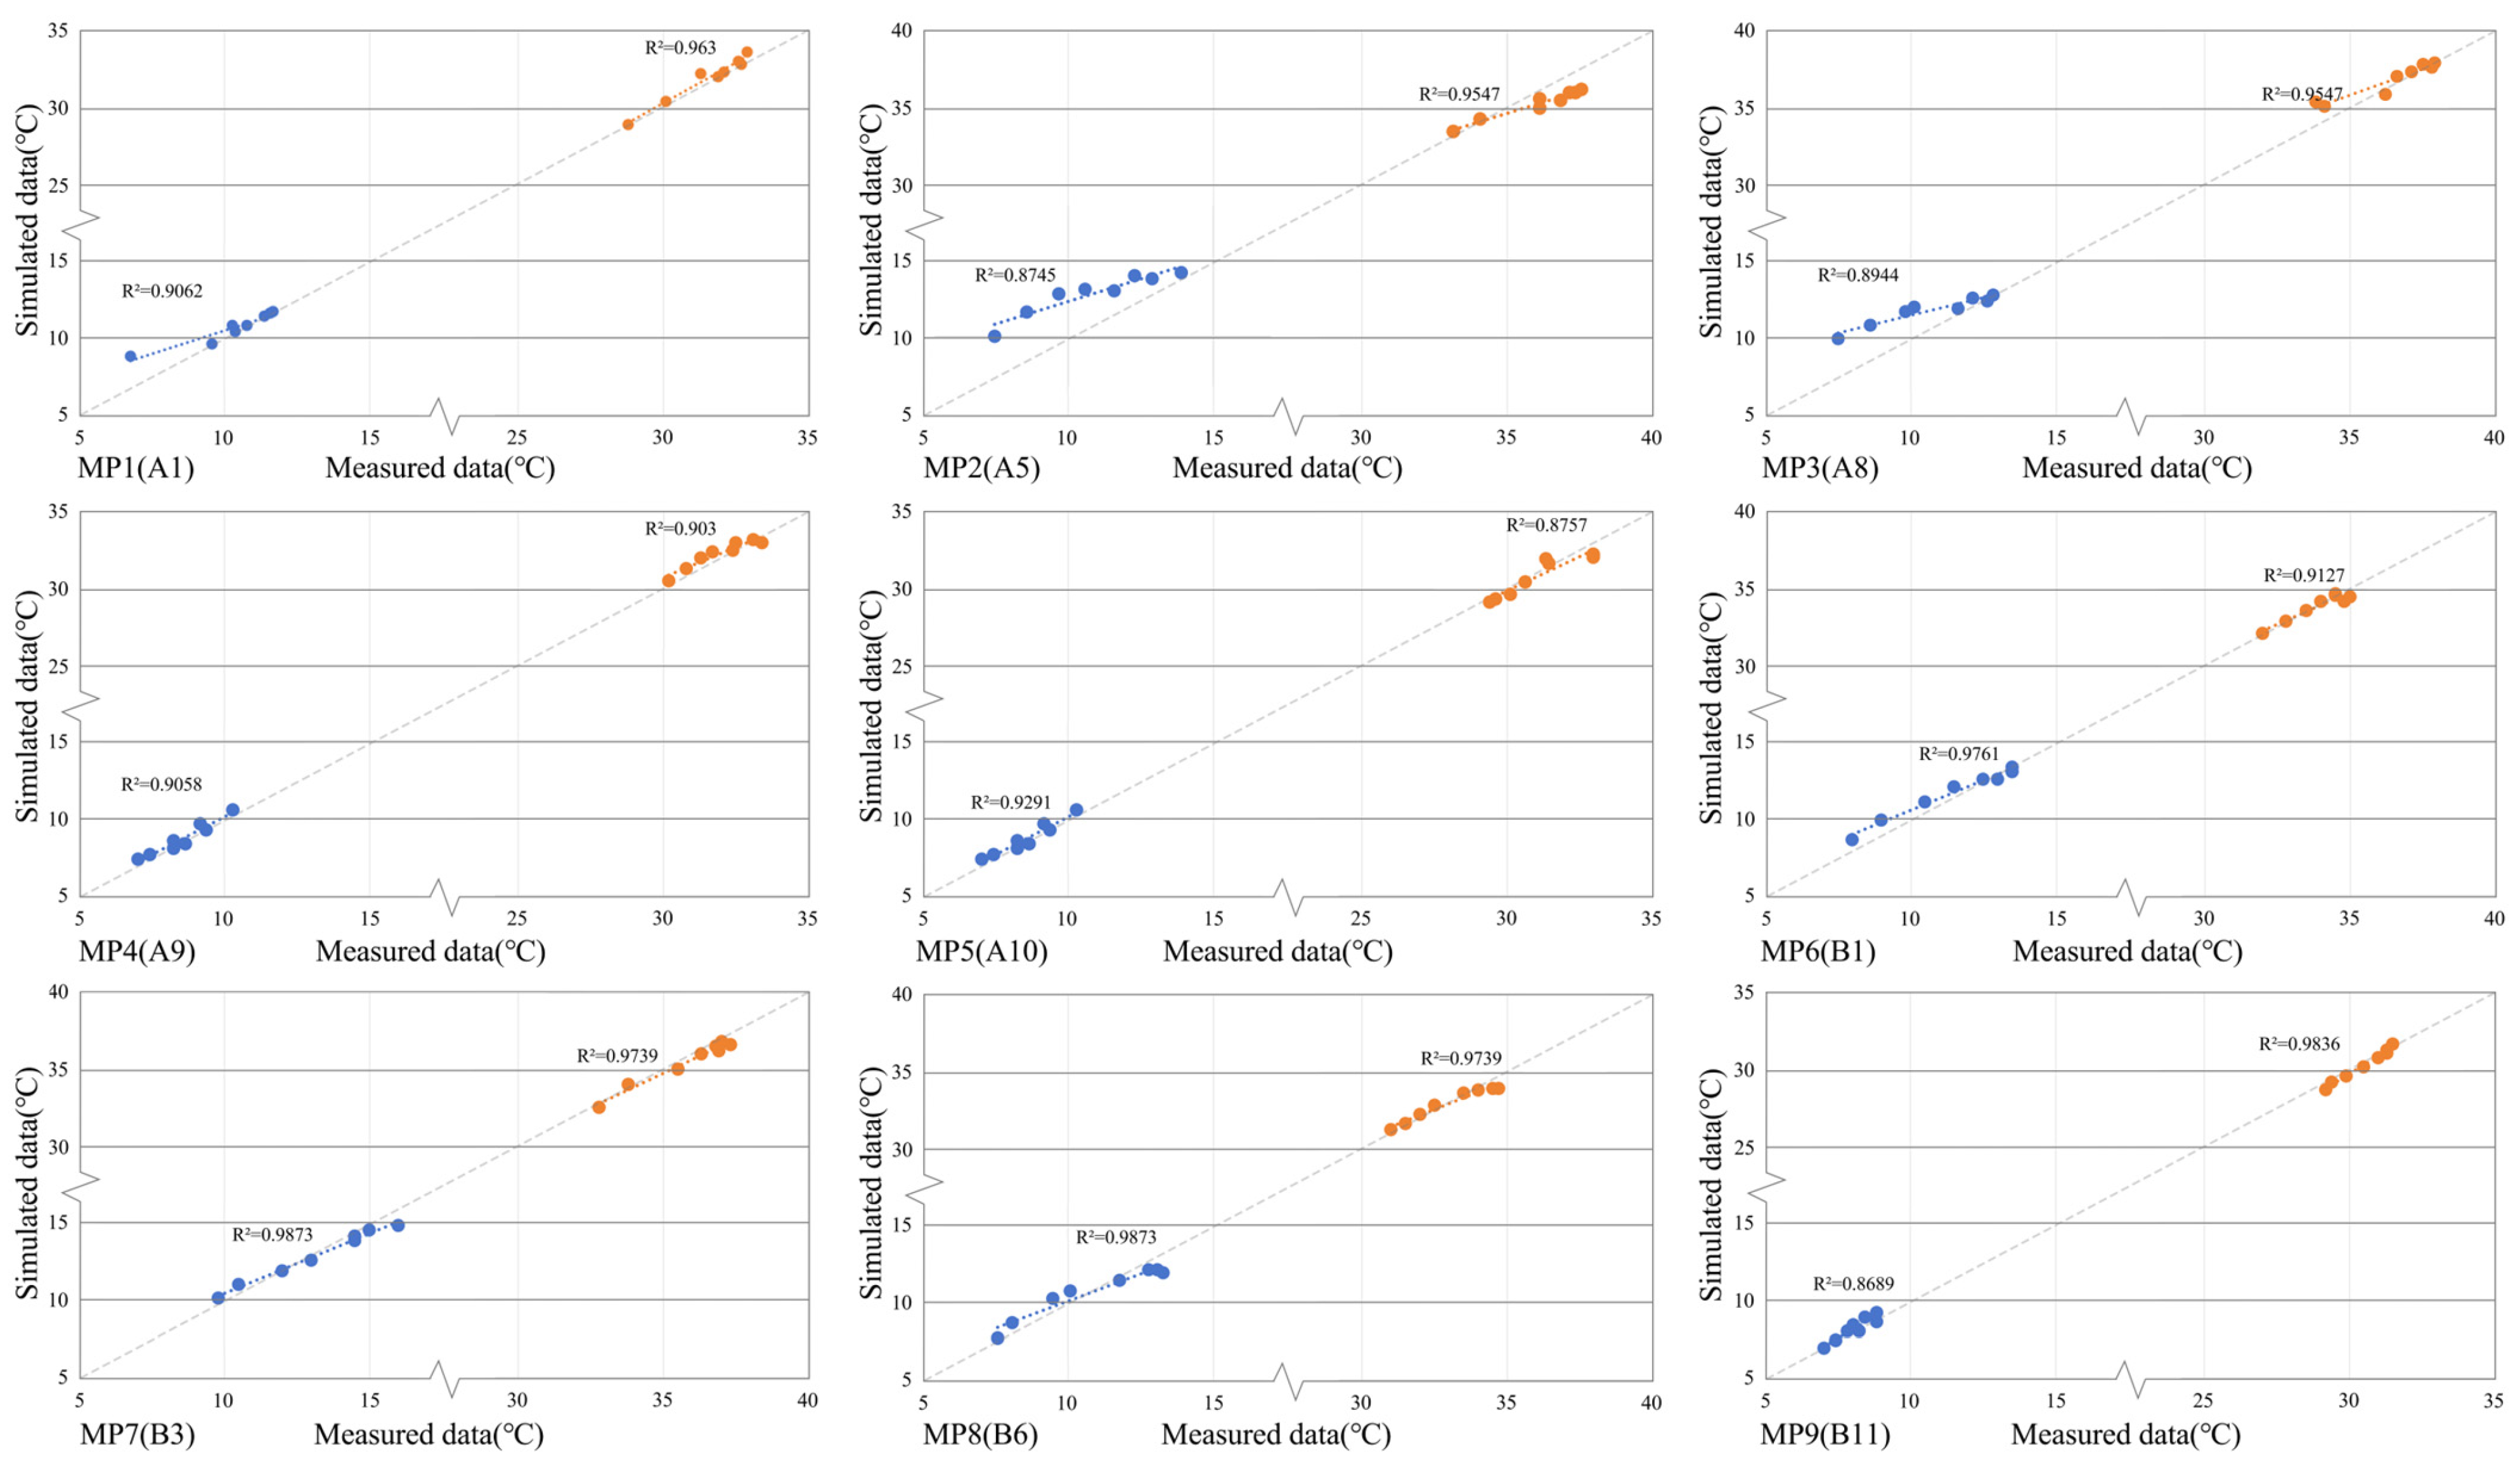
Because temperature and airflow exhibit different temporal characteristics in compact vernacular settlements, different validation strategies were adopted for air temperature and wind speed. For air temperature, simulated and measured values at representative monitoring points were matched by spatial position and observation period and compared directly. Model performance was evaluated using the coefficient of determination (R2), mean absolute error (MAE), and root mean square error (RMSE), which were used to assess whether the model reproduced the measured temperature hierarchy and the magnitude of thermal differences among exposed, shaded, semi-enclosed, and buffered spaces.
For wind speed, direct point-by-point time-series comparison was not adopted because local airflow in compact traditional settlements is highly sensitive to short-term gusts, local obstruction, and transient boundary disturbances. Instead, period-averaged measured and simulated wind speeds at representative points were compared under the same seasonal boundary conditions, and agreement was evaluated using MAE, RMSE, and relative error (RE). In addition to these point-based metrics, the wind model was assessed by its ability to reproduce the measured hierarchy of high-, medium-, and low-ventilation spaces and the attenuation trend from open spaces to transitional and enclosed areas.
The validation therefore assessed whether the model was adequate for comparative spatial analysis under representative seasonal boundary conditions in Luwu Village. Once satisfactory agreement was achieved, the model was used for wind analysis, thermal analysis, PET-related comfort interpretation, and case-based parametric testing. The resulting parameter ranges were treated as case-specific references.
4. Discussion
4.1. Multi-Scale Spatial Mechanisms of Sequence-Based Microclimate Regulation
4.1.1. Overall Spatial Pattern and Regional Microclimate
The field measurements, validated simulations, and PET results show that the microclimatic performance of Luwu Village is best understood as a linked environmental sequence rather than as a collection of isolated climatic elements. Airflow, radiation-related thermal conditions, humidity, and thermal buffering were redistributed across connected outdoor, transitional, and indoor spaces.
This pattern can be interpreted at three spatial levels. At the regional level, the hot–humid monsoon climate highlights the importance of shading continuity, moderated ventilation, and moisture regulation. At the settlement level, pond-edge spaces, streets, vegetation, ground surfaces, and enclosure conditions shape wind paths and define exposed or buffered zones. At the building level, cold alleys, courtyards, halls, patios, semi-open interfaces, and interior rooms progressively filter outdoor climatic forcing. In this compact hot–humid settlement, the linked sequence is therefore a more relevant microclimatic unit than any single courtyard, alley, patio, or room considered in isolation.
The effects of ponds and vegetation also depended on spatial position. They were not uniformly beneficial, but varied with openness, airflow paths, local shading, and seasonal boundary conditions. The sequence-dependent logic identified here should be understood as a case-based mechanism under the hot–humid monsoon conditions of Luwu Village. Environmental redistribution across connected vernacular spaces can also be identified, quantified, and used in retrofit-oriented assessment.
4.1.2. Street Morphology and Ventilation Performance
Street spaces in the selected area can be broadly divided into two types: narrow, highly enclosed cold alleys, such as A1, and more open ordinary streets, such as A4, A5, and A6. Measurements and simulations showed clear wind–thermal differences between these types. These differences were mainly related to geometric scale, height-to-width ratio (H/W), surface material, and surrounding building density.
Cold alleys are characterized by large H/W ratios and continuous linear forms. The cold alley at A1, for example, had an H/W ratio of about 3:1. Its simulated mean summer wind speed was about 0.61 m/s, close to the measured mean value of about 0.7 m/s. This agreement supports the interpretation of its airflow pattern. The environmental advantage of the cold alley did not depend primarily on high wind speed. Instead, it resulted from persistent shading, reduced surface heat storage, and continuous low-speed air exchange.
During summer daytime, the enclosing walls reduced solar exposure, and the blue–gray brick pavement limited heat absorption. As a result, the air temperature in the cold alley was about 2.5 °C lower than in adjacent ordinary streets. The alley also benefited from its connection with nearby courtyards. Under prevailing summer southerly winds, part of the airflow entering the main courtyard was redirected into the alley through side openings. The simulated pressure difference near the alley entrance was about 0.4 Pa, producing continuous low-speed longitudinal airflow of about 0.2–0.4 m/s. Although this airflow was not strong enough to create a pronounced wind sensation, it reduced heat accumulation and contributed to local thermal moderation.
Ordinary streets generally maintained higher air temperature and PET values than cold alleys, despite locally higher wind speeds around midday and afternoon. This indicates that stronger airflow does not necessarily reduce pedestrian-level thermal stress under hot–humid conditions when radiant exposure remains high. For compact hot–humid settlements, radiant-load reduction with maintained sequence ventilation should therefore be prioritized over airflow maximization alone. Cold alleys should be understood as linear microclimatic corridors within the settlement network, rather than as residual gaps in a dense built fabric.
4.1.3. The Courtyard–Hall–Patio Sequence as an Environmental Buffering System
The courtyard–hall–patio configuration in traditional dwellings operates as a segmented environmental transition sequence rather than as a simple through-ventilation passage. Opening position, spatial turning, semi-outdoor gray spaces, and vertical exchange together organize airflow and heat transfer and create a relatively gradual gradient between the hot outdoor environment and indoor occupied space.
Under prevailing summer winds, indoor airflow generally remained low, but localized enhancement occurred near entrances, door openings, constricted passages, and patio-adjacent areas. After entering the building, external airflow accelerated in locally constricted spaces and then attenuated along halls and adjacent rooms. It finally exchanged with outdoor air around the patio. In this configuration, the patio functioned more as an air-exchange and pressure-release node than as a high-velocity airflow channel. Its contribution was to maintain air renewal and heat release within the building, rather than to increase indoor wind speed overall.
From a thermal perspective, this sequence mainly suppressed sharp indoor temperature fluctuations through low-speed ventilation and thermal buffering. Compared with fully exposed outdoor spaces, environmental change within the courtyard–hall–patio sequence was more gradual. This moderation resulted from reduced short-wave solar exposure in courtyards and patios, the thermal inertia of traditional envelopes, and segmented airflow organization. These factors promoted progressive attenuation and redistribution rather than abrupt indoor–outdoor exchange.
Compared with courtyard-only studies, these results suggest that courtyards and patios should not be treated as self-contained thermal units. Their performance depended on their linkage to halls, alleys, interfaces, and adjacent rooms. This helps explain why similar courtyard geometries can produce different environmental outcomes under different sequence structures. It also explains why courtyard and patio proportions affected performance. When the H/W ratio remained within a balanced range, ventilation input and thermal buffering were more likely to remain in equilibrium. When the space became excessively deep or enclosed, airflow momentum decayed rapidly with spatial depth, even if local acceleration occurred near the entrance. This led to insufficient ventilation in deeper zones. Thermal improvement in these traditional spaces therefore depended on maintaining a reasonable gradient between outdoor and indoor conditions rather than maximizing a single variable.
4.1.4. Wind–Heat–Humidity Coupling Across the Settlement Sequence
Thermal comfort in Luwu Village cannot be explained by air temperature or wind speed alone. The results point to coupled effects of airflow, radiation, humidity, and material heat storage, so microclimate regulation in the settlement is better understood as a wind–heat–humidity system than as a simple sum of local cooling effects.
Three broad microclimatic zones can be identified. The first comprises relatively high-wind spaces dominated by convective heat exchange. In spaces such as A6, wind speed reached about 2.1–2.4 m/s, and thermal-stress reduction was mainly associated with enhanced convective heat removal. The second comprises low-wind buffered spaces, including courtyards, corridors, and patio-adjacent areas. In these spaces, thermal improvement depended more on shading, reduced radiative load, material thermal inertia, and evaporative cooling from vegetation and water. The third comprises more stable indoor or semi-enclosed spaces, where environmental stability was more important than airflow maximization. Although the dominant mechanisms differed, similar PET improvement could still occur, indicating that comfort-related performance was jointly shaped by air transport and heat-source reduction.
This coupling was particularly evident in semi-enclosed spaces adjacent to patios. Thermal improvement there did not rely on strong ventilation, but on local rebalancing of the energy environment. Enclosure and shading reduced radiative heat load, while water and vegetation provided latent cooling through evaporation and transpiration. Limited air exchange was sufficient for reductions in air temperature and mean radiant temperature to offset part of the discomfort associated with higher humidity. As a result, PET still showed a net improvement. This interpretation is based on measured co-variation among air temperature, relative humidity, wind speed, and globe temperature at representative points, rather than on a separate quantitative decomposition of the humidity contribution to PET.
This coupling also has clear boundary conditions. Humidity-related cooling contributes to comfort only when ventilation paths and release nodes remain effective. Once connectivity weakens and air exchange becomes insufficient, increased humidity can shift from latent-cooling benefit to stagnant moisture risk. Climatic adaptability in traditional settlements should therefore be understood as maintaining balance among air transport, radiation control, and humidity regulation. Semi-enclosed spaces adjacent to patios could achieve lower air temperature, but this was often accompanied by higher relative humidity. Greater openness could enhance local airflow, but it might weaken shading continuity. Deeper enclosure could improve thermal buffering, but it also intensified ventilation attenuation. The environmental task was therefore not to maximize a single variable, but to identify configurations in which airflow, radiation, humidity, and buffering remained in favorable balance.
4.2. Parameter-Response Analysis of Spatial Morphology and Thermal–Environmental Performance
The parametric analysis was designed as a comparison of case-based geometric scenarios derived from representative cold-alley and courtyard/patio types in Luwu Village, rather than as a full continuous optimization exercise. Accordingly, the reported results should be interpreted as geometry-performance tendencies within the tested scenario set under explicit boundary conditions. Because a complete PET recalculation was not performed for all parametric scenarios, the results are reported primarily in terms of airflow-temperature and thermal–environmental tendencies. PET-based comfort interpretation therefore remains anchored mainly in the measured representative cases rather than being treated as a direct output of the full scenario matrix.
4.2.1. Performance Response of Geometric Parameters of Cold Alleys
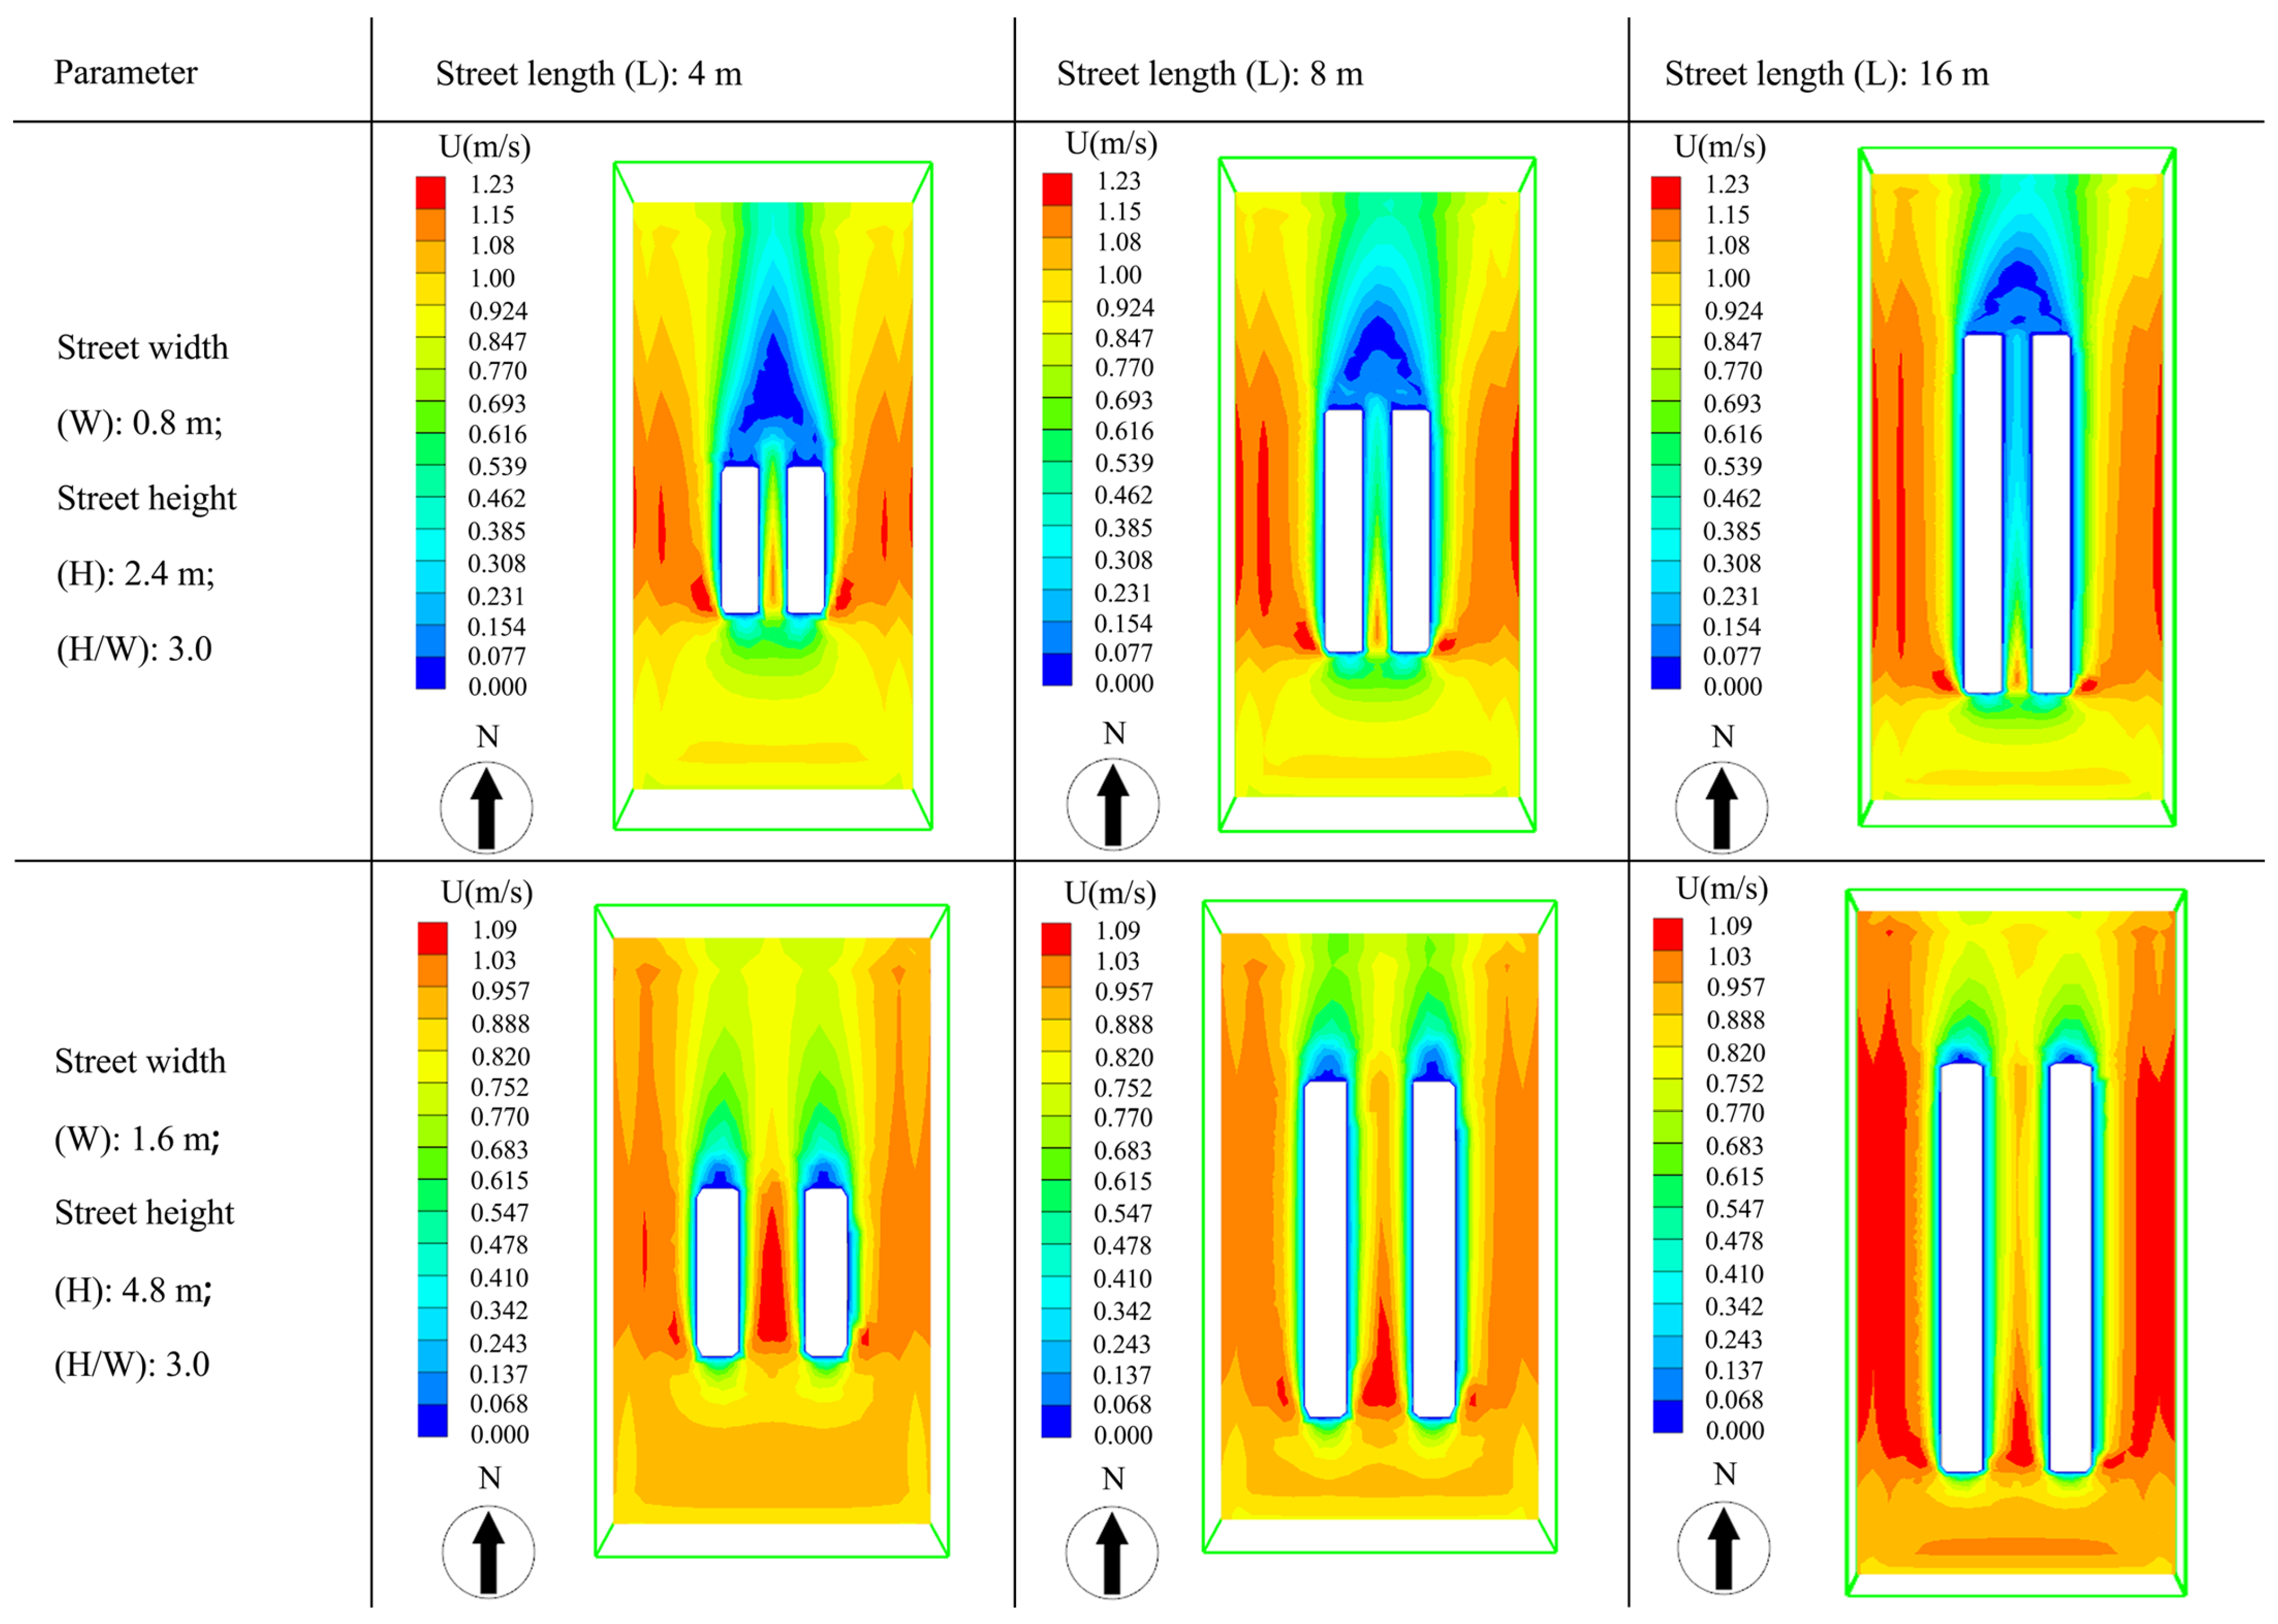
Cold alleys are key transitional spaces within the linked cold alley–courtyard–hall–patio–room sequence of Luwu Village. To examine their geometry-related environmental response, six idealized cold-alley scenarios were constructed from representative alley types observed in the village. These scenarios reflected the main width and enclosure combinations in the study area and were used for case-based comparison.
Figure 14 presents the tested configurations and corresponding simulation results.
Under the tested summer boundary conditions, the scenarios showed clear differences in airflow attenuation and thermal moderation. Narrower and more enclosed alleys generally maintained stronger shading continuity and lower air-temperature exposure, but excessive confinement also suppressed local air movement. Wider alleys allowed greater ventilation, but reduced shading continuity and weakened thermal moderation during peak summer exposure. Within the tested case-based scenarios, alley widths of about 0.8–1.4 m combined with an H/W ratio close to 3:1 showed relatively favorable airflow-temperature performance, supporting shading continuity, moderated low-speed air transport, and reduced summer thermal exposure. The tested cold-alley matrix included only six representative idealized scenarios, rather than a dense continuous parametric scan. This range should be interpreted as a case-based reference within the present scenario set, rather than as a universal optimum.
As shown in
Figure 14, cold-alley performance in compact hot–humid settlements cannot be judged by wind speed alone. Scenarios with the highest local air movement did not necessarily show the most favorable airflow-temperature tendency, because increased openness also weakened enclosure-based shading. The comparison of cold-alley scenarios indicates that relatively favorable performance relies on balancing moderated ventilation with radiant-load reduction, rather than simply increasing alley width or airflow.
4.2.2. Courtyard Openness, Depth, and the Attenuation Pattern of Ventilation
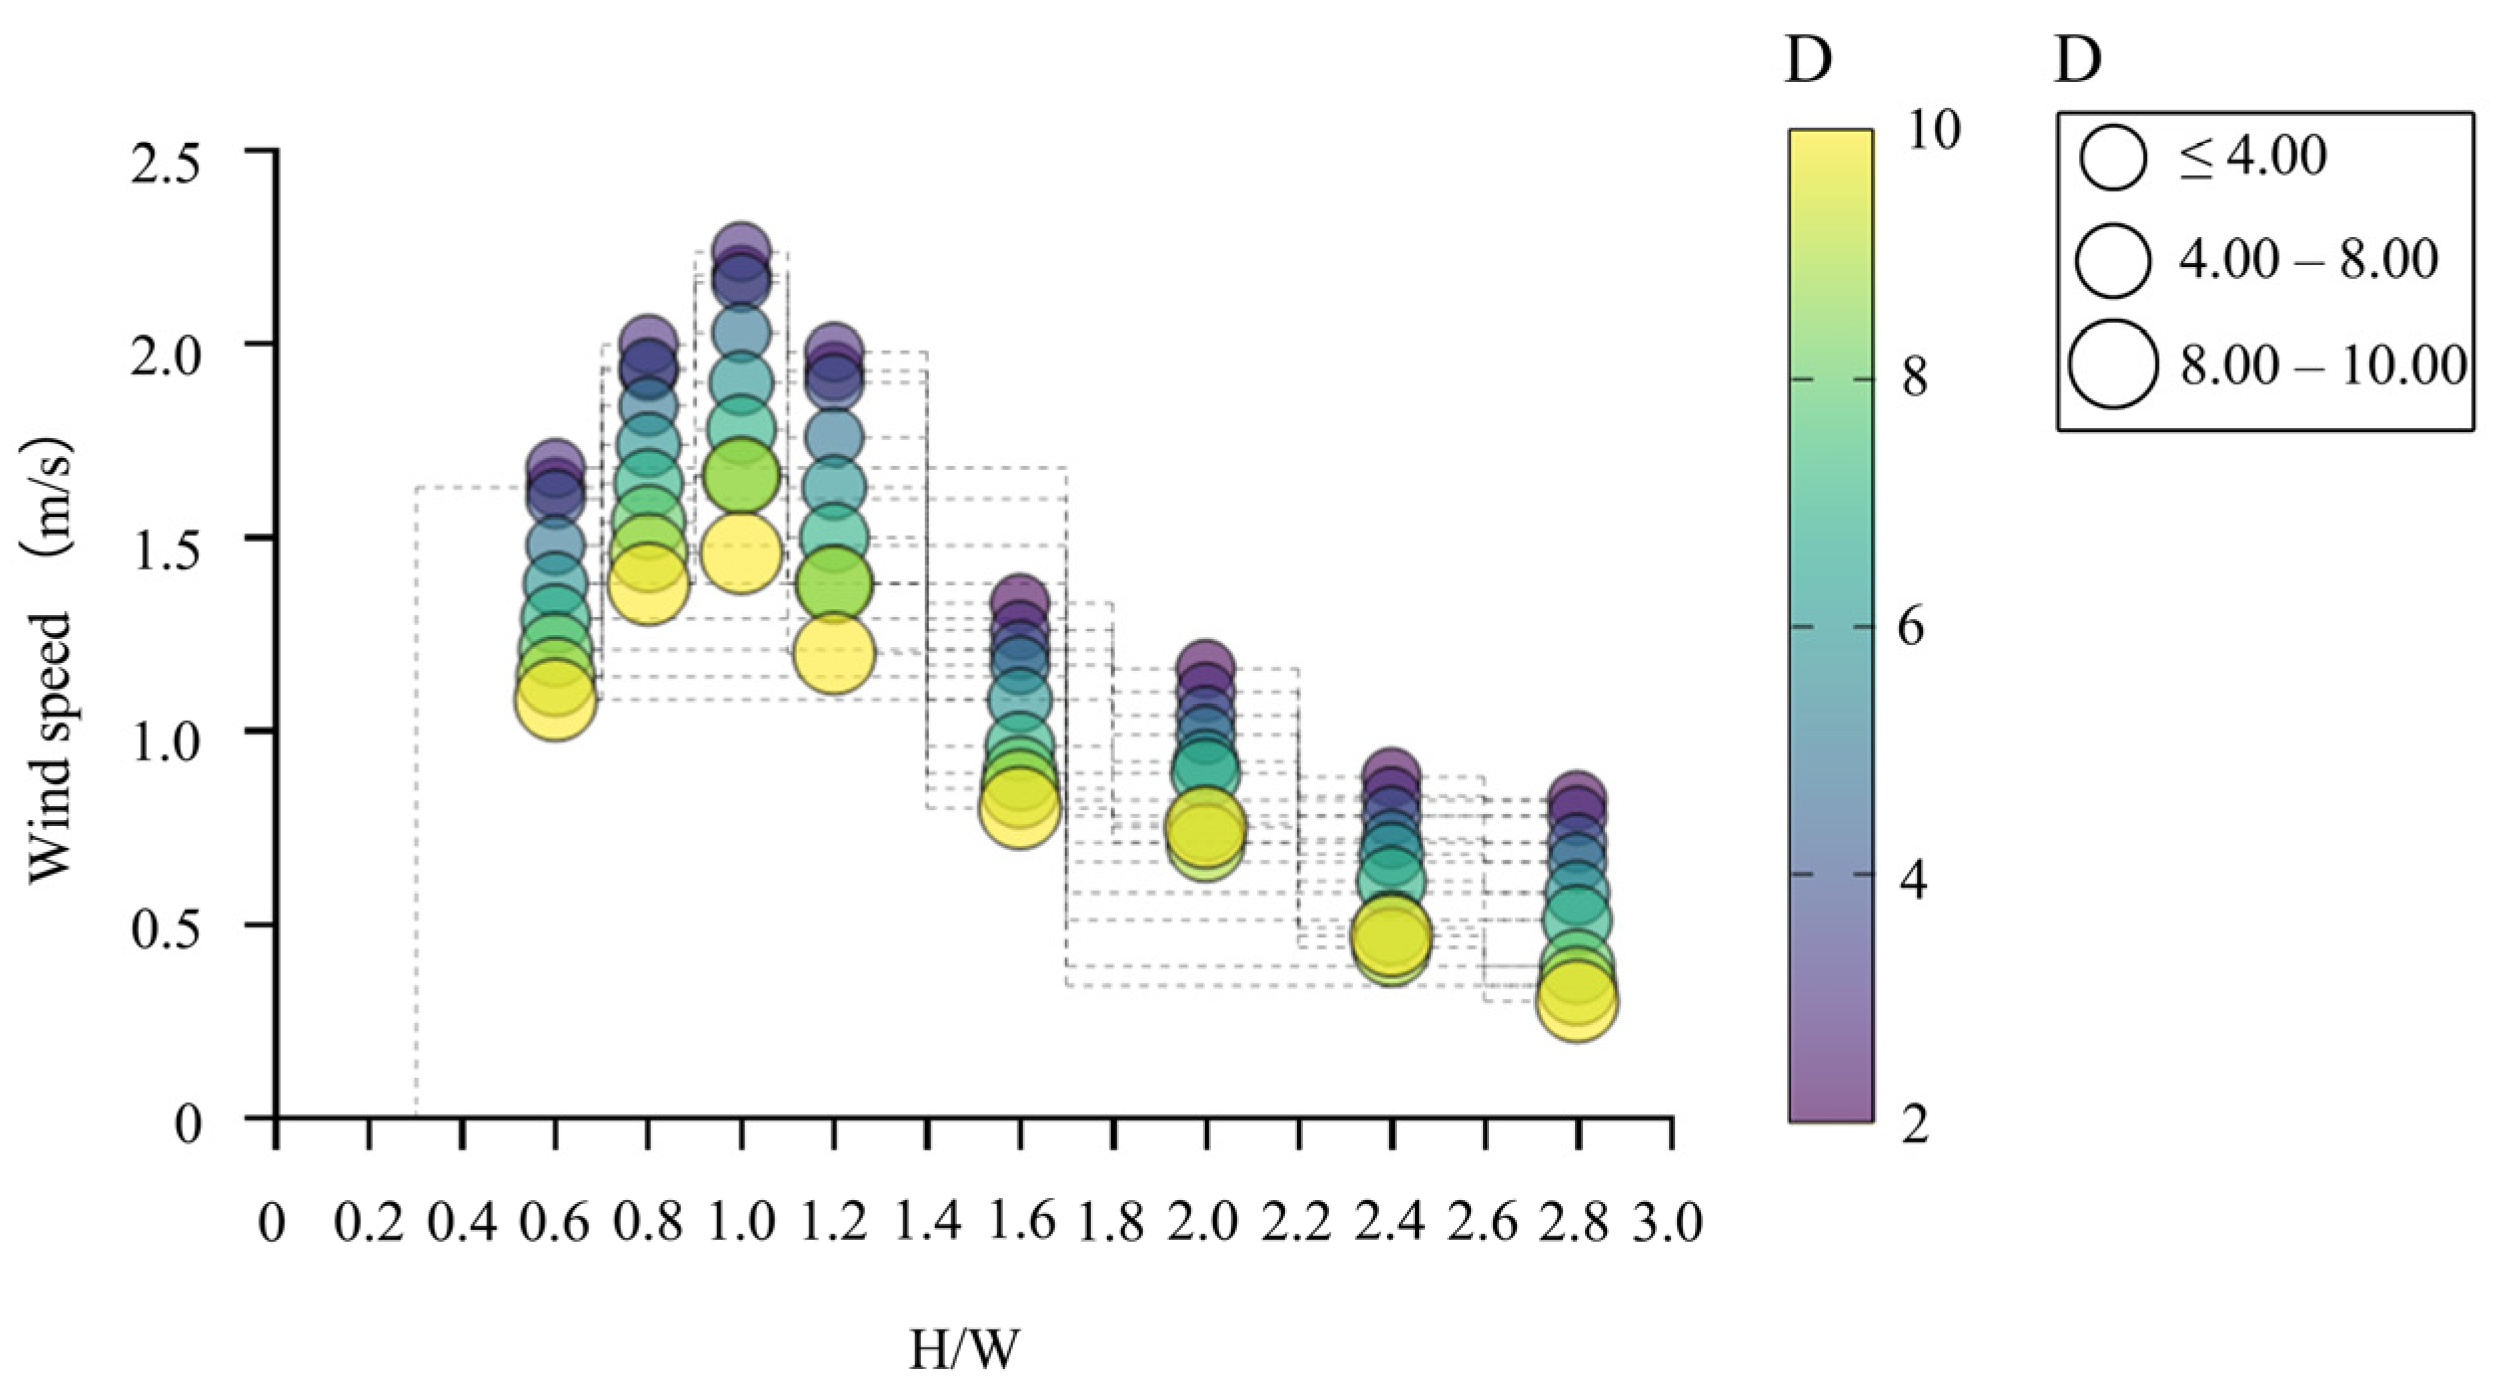
Compared with the cold-alley analysis, the courtyard/patio analysis used a broader geometric matrix. A total of 72 independent courtyard/patio configurations were tested. The matrix was derived from the measured dimensions of the representative building cluster in Luwu Village, especially the patio and courtyard dimensions observed in Shatangli No. 1, and was then extended within a case-relevant range to examine broader response tendencies under comparable boundary conditions.
Figure 15 presents the simulated response patterns of the courtyard/patio matrix.
For presentation and interpretation, courtyard/patio depth was grouped into three intervals (D ≤ 4 m, 4–8 m, and 8–10 m). These intervals were used as interpretive categories to facilitate comparison of response tendencies with increasing spatial depth, rather than as universal threshold values. The H/W range was likewise defined with reference to the measured local geometry and then extended moderately to test how increasing the enclosure affected airflow attenuation and thermal moderation.
As shown in
Figure 15, airflow response varied jointly with enclosure and spatial depth. Shallow and relatively open cases generally allowed stronger ventilation penetration, but their thermal moderation was weaker because of reduced buffering and greater exposure. As depth increased, airflow attenuation became more pronounced, especially in the deeper parts of the space, while thermal buffering became stronger. Excessively deep or strongly enclosed courtyards did not further improve airflow-temperature balance. This is because airflow decay with spatial depth could become too strong. The results suggest that environmental performance depends on balancing openness, enclosure, and depth, rather than maximizing any single geometric variable.
These results also help explain why courtyards and patios in Luwu Village should not be interpreted as isolated climatic units. Their environmental role depends on how they are linked to halls, cold alleys, semi-open interfaces, and adjacent rooms. The same nominal H/W value may therefore lead to different environmental effects when embedded in different sequence conditions. The courtyard matrix should thus be understood as a case-based comparative framework for examining geometry-sensitive response patterns within the linked vernacular spatial system, rather than as a universal design chart.
4.2.3. From Parameter-Response Findings to Retrofit Decision Guidance
Taken together, the cold-alley and courtyard analyses show that microclimate improvement in hot–humid heritage settlements does not depend on maximizing a single variable. In both spatial units, favorable airflow-temperature tendencies appeared not at geometric extremes, but within ranges that maintained a balance among airflow delivery, shading continuity, attenuation control, and thermal buffering. This finding highlights the importance of context-sensitive design guidance. The main output of this analysis is therefore a decision logic for identifying where geometric adjustment is likely to improve or degrade environmental performance under conservation constraints.
Three levels of retrofit guidance can be derived. First, intervention should prioritize the preservation of linked spatial sequences rather than the isolated optimization of single spaces. A cold alley, courtyard, patio, or hall may not perform effectively if the surrounding sequence is interrupted. Second, geometric modification should preserve or restore balanced performance ranges, rather than pursue maximum openness, enclosure, or wind speed. Third, evaluation should remain a multi-indicator, because the same geometric change may improve one variable while weakening another.
The distinction between universal prescription and context-sensitive transfer is critical. The dimensional ranges identified in Luwu Village are not intended as universal thresholds for all hot–humid settlements. For comparable compact hot–humid vernacular settlements, however, they may serve as performance-informed engineering references for preliminary judgment, provided that local calibration and validation are undertaken. The most transferable output is the workflow for identifying dominant sequence roles, calibrating environmental responses, testing parameter trade-offs, and deriving retrofit guidance under explicit local boundary conditions. For conservation-oriented practice, this means avoiding excessive widening of cold alleys where shading continuity would be weakened. It also means avoiding courtyard deepening or enclosure intensification where ventilation to adjacent spaces is already insufficient. Interface modification should be assessed according to its effects on both sequence continuity and local buffering capacity. In this way, traditional spatial knowledge can be translated into performance-sensitive geometric management under heritage constraints.
4.3. Comparison with Previous Studies and Engineering Significance of the Sequence-Based Framework
Semi-enclosed spaces in Luwu Village, including cold alleys, courtyards, and patios, substantially alleviated thermal stress during typical summer heat-peak periods. This pattern is consistent with previous studies on vernacular settlements in China and other regions. These studies have shown that, compared with fully exposed spaces, semi-enclosed environments improve thermal conditions mainly through shading, reduced short-wave solar input, lower mean radiant temperature (MRT/Tmrt), and moderated natural ventilation. In the present case, PET reductions from exposed spaces to cold alleys, patios, and courtyards formed a stable gradient during the afternoon heat peak. This further supports the dominant role of enclosure and shading in summer thermal-stress reduction. These findings also align with courtyard studies showing that enclosing geometry can reduce daytime heat stress and provide thermal buffering under warm conditions. Evidence from Mediterranean courtyard environments, for example, has shown that courtyard configuration can moderate summer thermal conditions while also shaping winter buffering effects [
54]. Similarly, parameter-based studies have shown that courtyard geometry, opening conditions, and envelope characteristics can significantly influence environmental performance, although favorable geometric ranges vary with climate and spatial context [
55].
At the same time, the present study differs from the most relevant strands of the existing literature in the way the analytical framework is organized. First, compared with studies that focus mainly on thermal comfort improvement in outdoor spaces of traditional settlements, the present study extends the scope of analysis to a linked vernacular spatial sequence. It does not only compare exposed and shaded outdoor locations. Instead, it traces how airflow, radiant load, humidity, and thermal buffering are redistributed from open settlement edges through cold alleys, courtyards or patios, halls, semi-open interfaces, and interior rooms. The contribution therefore lies not simply in simulating multiple spaces within one model, but in treating them as a connected environmental chain relevant to daily use and building occupation.
Second, compared with studies that analyze alleys, courtyards, patios, or rooms as separate climatic units, this study interprets these spaces as connected nodes within a continuous environmental sequence. This helps explain why the same spatial type may perform differently under different linkage conditions. In Luwu Village, for example, the environmental role of a courtyard or patio cannot be fully understood without considering its connections to halls, cold alleys, semi-open interfaces, and adjacent rooms. The sequence-based perspective therefore shifts the focus away from the isolated performance of individual vernacular elements. Instead, it emphasizes the coupled redistribution of environmental effects across linked spaces.
Third, compared with parametric studies focused mainly on morphology-sensitive optimization of streets, alleys, or courtyards, this study places geometry-performance analysis within a field-calibrated and multi-indicator workflow. Rather than deriving a universal optimum for a single spatial type, it combines field measurements, validated simulation, PET-based comfort interpretation, indoor thermal-response analysis, and parametric testing. This produces context-bounded retrofit evidence under explicit hot–humid boundary conditions. Its methodological value lies in integrating measurement, validation, comfort interpretation, and parameter testing within a sequence-based workflow for conservation-oriented retrofit assessment.
This comparison also clarifies the meaning of the sequence-based framework. A sequence is not defined merely by the inclusion of several connected spaces in a settlement-scale CFD or thermal model. Rather, it refers to an analytical organization in which representative spaces are selected, measured, interpreted, and tested according to their position within a linked vernacular spatial sequence. Within this framework, airflow, radiant conditions, humidity, and thermal buffering are evaluated as interacting processes redistributed across connected environmental nodes, rather than as isolated variables attached to isolated spaces. The framework is therefore suited to compact hot–humid vernacular settlements, where thermal comfort depends on the balance among exposure, shading, ventilation, moisture, and buffering.
The case of southern Jiangxi Hakka settlements further shows that this issue is regionally specific. Under hot–humid monsoon conditions, thermal comfort cannot be improved simply by increasing openness or ventilation intensity. Stronger airflow in exposed spaces does not necessarily offset high radiant load. In contrast, shaded and semi-enclosed spaces may reduce thermal stress under moderate or even weak airflow, while patio-adjacent spaces may involve a cooling–moisture trade-off. Climatic adaptability in such settlements therefore depends on the coordinated action of linked intermediate spaces, rather than on maximizing one variable or optimizing one isolated unit.
From an engineering perspective, the value of the present framework lies in translating vernacular spatial logic into a tool for preliminary retrofit appraisal under conservation constraints. The findings remain case-validated and should not be interpreted as universal optimal values. However, for compact hot–humid vernacular settlements with comparable climatic and spatial conditions, the sequence-based and locally calibratable workflow developed here can support judgment on how modifications to cold alleys, courtyards, patios, halls, and semi-open interfaces may affect the coupled redistribution of wind, heat, moisture, and thermal buffering. Its wider significance lies less in any single geometric threshold than in an assessment logic that is compatible with heritage conservation and adaptable through local validation.
4.4. Retrofit Implications, Applicability, and Boundary Conditions
This study does not propose a fixed dimensional template derived from a single settlement. Instead, it provides a sequence-based framework for comparative retrofit assessment under conservation constraints, together with performance-informed reference ranges for preliminary judgment in comparable contexts. Three priorities emerge for engineering-oriented practice: preserving continuous ventilation paths across linked spaces, applying small-scale geometric refinement based on parameter-response relationships, and coordinating multiple environmental factors with radiant-load reduction as the primary control objective under hot–humid conditions.
Retrofit should first prioritize the protection and restoration of continuous ventilation paths, rather than isolated local modification. In Luwu Village, environmental performance depended on the continuity of airflow transmission, shading, and thermal buffering across cold alleys, courtyards, halls, patios, semi-open interfaces, and interior rooms. In practice, the first diagnostic step is to determine whether critical sequence connections remain intact, including air-intake paths, semi-open interfaces, interior distribution routes, and exhaust nodes. Where these paths have been disrupted by later partitions, blockage, interface closure, or incompatible additions, restoring continuity should be treated as a primary low-impact retrofit action.
Spatial intervention should rely on small-scale geometric refinement based on parameter-response relationships rather than fixed typological assumptions or large-scale formal replacement. In the present case, the environmental performance of cold alleys and courtyards was nonlinear: narrower alleys were not always better, greater courtyard openness did not automatically improve ventilation delivery, and stronger enclosure did not necessarily lead to better comfort. In Luwu Village, relatively favorable performance was observed in tested cold-alley scenarios with widths of 0.8–1.4 m and a height-to-width ratio (H/W) of about 3:1. Although these values are case-based, they may serve as engineering references for preliminary design and retrofit evaluation in comparable compact hot–humid vernacular settlements, provided that they are verified under local conditions.
Heritage-compatible retrofit in hot–humid settlements also requires multi-factor coordination. Radiant-load reduction should be treated as the primary control objective, while sequence ventilation should be maintained rather than simply intensified. In spaces dominated by radiant heat load, priority should be given to continuous shading and reduced radiative exposure. In deep or weakly ventilated spaces, sequence connectivity and sustained air exchange should be prioritized. Blue–green areas should be assessed not only for their cooling potential, but also for their interaction with local humidity retention and airflow continuity. Under conservation constraints, preferred measures should remain small-scale, reversible, and performance-sensitive, so that environmental improvement can be achieved with minimal alteration to historically evolved spatial structures.
The applicability of the proposed framework should be understood within explicit boundary conditions. The reported performance intensities and geometry ranges were derived from a low-rise compact settlement in a hot–humid monsoon climate under the specific material, spatial, and morphological conditions of Luwu Village, and should therefore be revalidated before direct transfer to settlements with different densities, building heights, climatic regimes, or sequence structures. On this basis,
Table 7 summarizes the main intervention directions and control priorities for heritage-compatible microclimate retrofit.
4.5. Limitations and Future Research Directions
Several limitations should be acknowledged. First, field observations were limited to representative summer and winter days and focused mainly on daytime conditions. The results therefore capture dominant spatial differences and representative comfort contrasts under typical conditions, rather than providing a full annual assessment of microclimatic resilience. Second, the geometry ranges and response intensities identified in this study are case-based and should not be transferred directly to other settlements without local revalidation. Third, the simulations involve uncertainty related to boundary conditions, inflow turbulence, simplified material properties, opening states, internal heat gains, parameterized vegetation and water processes, and one-way wind–thermal coupling. Buoyancy feedback was not incorporated into the momentum equations, and partial or intermittent opening states and internal gains may also affect indoor airflow. These factors should be examined in future sensitivity analyses. The model should therefore be understood mainly as a comparative tool for identifying relative spatial differences and parameter-response patterns, rather than for reproducing every local fluctuation.
Fourth, the comfort analysis used PET with fixed clothing insulation values to support standardized inter-space comparison, while behavioral and psychological adaptation were not captured through subjective surveys. PET should also be interpreted cautiously under hot–humid conditions because it may underrepresent moisture-related discomfort where lower air temperature is accompanied by higher humidity. In patio-adjacent and semi-enclosed spaces, lower PET values therefore indicate reduced heat stress mainly associated with shading, radiant-load reduction, and thermal buffering, rather than unequivocally better overall comfort. Humidity accumulation remains a residual retrofit risk. Because the parametric simulations were reported mainly through airflow and air-temperature responses without full-matrix PET recalculation, the dimensional tendencies should be interpreted as case-based references rather than PET-based optima. The humidity-related trade-off should be understood as a field-supported coupled interpretation, not as a single-factor sensitivity result.
These limitations constrain the absolute generalization of the reported intensities and dimensional ranges, but they do not negate the comparative sequence-based findings obtained under the stated boundary conditions of the present study. The main contribution therefore remains the validated interpretation of linked spatial behavior and the associated decision logic, while the reported parameter ranges may still serve as performance-informed references for preliminary judgment in comparable contexts, subject to local validation.
Future research can extend the present study in several directions. Longer-term and cross-seasonal monitoring is needed to incorporate transitional seasons, nocturnal processes, and extreme events. The framework should also be tested across multiple settlements and morphological types using comparable measurement and simulation protocols. In addition, the modeling chain can be refined through improved treatment of vegetation–soil–evapotranspiration interaction, water evaporation, sensitivity and uncertainty analysis, and the integration of subjective thermal sensation and behavioral adaptation data. For operational applications, future studies may further couple the sequence-based microclimate assessment framework with reinforcement learning methods for smart control of natural or hybrid ventilation systems. Open-source tools such as BuildingGym could provide a useful platform for training and evaluating adaptive ventilation-control strategies under varying outdoor climate, occupancy, and comfort constraints [
56,
57].
5. Conclusions
The results show that the microclimatic performance of compact hot–humid vernacular settlements is shaped by settlement-to-interior environmental coupling across linked vernacular spaces rather than by isolated spatial elements. In the studied Hakka settlement, cold alleys, courtyards, patios, halls, semi-open interfaces, and interior rooms formed a connected environmental sequence that redistributed airflow, radiant load, humidity, and thermal buffering. Four main conclusions can be drawn.
(1) Thermal comfort in compact hot–humid settlements depended more on coupled sequence effects than on ventilation enhancement alone. Open spaces generally had stronger airflow but remained more thermally stressful under high radiant load, whereas transitional spaces performed better when shading continuity, moderated air movement, humidity conditions, and buffering effects remained in balance across the linked sequence. For heritage-compatible retrofit, this suggests that improving a single variable, such as wind speed, is less effective than maintaining coordinated environmental control across connected spaces.
(2) Cold alleys and patio-adjacent semi-enclosed spaces revealed the main summer comfort mechanisms and trade-offs within the sequence. During the summer afternoon peak, cold alleys reduced air temperature by about 2.5 °C and PET by about 8.5 °C relative to ordinary streets, while semi-enclosed spaces adjacent to patios reduced air temperature by about 4.0 °C but increased relative humidity by about 8–12%. These results suggest that intervention in hot–humid settlements should prioritize radiant-load reduction while maintaining airflow, and that spaces near patios and blue–green interfaces should be evaluated through multi-indicator assessment rather than temperature reduction alone.
(3) The effects of the linked spatial sequence extended into indoor thermal response. Annual simulation results showed that overheating risk differed substantially among room types according to orientation, ventilation pathway, and proximity to transitional spaces. Type B and Type C rooms showed the highest warm-season exceedance durations, at about 6.89% and 8.78%, respectively, whereas rooms aligned with cross-ventilation paths or adjacent to cold alleys performed better. Indoor retrofit in such settlements should therefore focus not only on room-level openings or orientation, but also on preserving and strengthening the transitional sequence linking rooms to shaded and ventilated intermediate spaces.
(4) The most transferable outcome of the study is the retrofit logic derived from the sequence-based and scenario-based geometry comparison rather than any fixed geometric value. The tested geometric responses were context-bounded and case-dependent; they should be understood as airflow-temperature tendencies rather than PET-based thermal comfort optima. Within the tested cold-alley scenarios, widths of about 0.8–1.4 m and a height-to-width ratio close to 3:1 showed comparatively favorable airflow-temperature performance under the stated boundary conditions. These results provide a practical basis for sequence-based retrofit assessment and preliminary judgment in comparable compact hot–humid vernacular settlements, provided that local validation is undertaken.
Several limitations should also be acknowledged. The analysis was based on a single compact settlement and on representative seasonal measurements rather than full long-term monitoring. The simulation involved simplifications in boundary conditions, material properties, vegetation and water-related processes, and the one-way sequential treatment of wind and thermal environments. In addition, thermal comfort was interpreted primarily through PET without subjective thermal sensation data. Future research should extend the framework through longer-term and cross-seasonal monitoring, comparison across multiple settlement types, improved treatment of vegetation, evaporation, and uncertainty effects, and the integration of behavioral and subjective comfort data.
Overall, the value of the present study lies not in proposing universal dimensional prescriptions, but in showing how a compact vernacular case can be used to develop a validated analytical framework linking sequence continuity, coupled environmental assessment, and scenario-based geometry comparison to retrofit-oriented decision-making in comparable hot–humid contexts, while also providing performance-informed reference ranges for preliminary design and evaluation under similar boundary conditions.