Article

Comparison of Operative Temperature Distribution in Radiator- and Floor-Heated Rooms

Department of Building Services and Building Engineering, Faculty of Engineering, University of Debrecen, Otemeto Str. 2-4, 4028 Debrecen, Hungary
*
Author to whom correspondence should be addressed.
Buildings 2026, 16(10), 1953; https://doi.org/10.3390/buildings16101953

Submission received: 17 April 2026 / Revised: 8 May 2026 / Accepted: 12 May 2026 / Published: 14 May 2026
(This article belongs to the Special Issue Built Environment and Thermal Comfort)

Abstract

Both developed and developing countries are striving to reduce building energy consumption. Heating still accounts for an important share of the total energy used in buildings. Many studies compare different heating modes, but few take into account that, first of all, in heated rooms, similar operative temperatures should be provided. In this study, operative temperatures in different locations of a heated room have been analysed, assuming two different heating systems. In addition, the operative temperature distribution can be further disturbed by the room geometry (one or more external walls, or family house) and the room’s position in the building (ground floor, intermediate floor, or top floor). The operative temperature distribution was analysed at nine locations across 525 different room models for radiator and floor heating. The conducted research proved that, at the p = 0.05 significance level, the differences in operative temperatures across locations in a radiator-heated room are significant. Differences in operative temperatures across locations in a floor-heated room are significant and the number of external walls (one, two, or three) also have a significant effect on operative temperatures in a heated room. The differences in operative temperatures at the same location in a heated room with different dimensions can be significant. The differences between the mean operative temperatures in a room (radiator-heated or floor-heated) are not significant if the room has different positions in a multilevel building (ground floor, intermediate level, or top level). To compare two heating systems energetically, a complex analysis should be conducted, and efforts should be made to ensure similar operative temperatures at the most critical locations.

1. Introduction

Decarbonisation of building stock is one of the most important global goals. Despite energy-saving measures implemented in the European Union over the last two decades, the share of energy consumption in buildings has shown no significant decrease [1,2]. Ürge-Vorsatz et al. reported that globally, over 60% of residential energy is used for thermal purposes [3]. Within this, space heating accounts for 32–33% of the global building energy use. Gonzales-Torres et al. found that heating, ventilation, and air conditioning account for 32% of the total energy use in the residential sector [4]. Obviously, the amount of energy used for heating is strongly influenced by the climate conditions. For example, Wang et al., taking climate change into account, have shown that, on average, space heating may account for 73.3–74.5% of the mid-century total natural gas consumed in buildings across two climate regions in the USA [5]. Laskari et al. found that in the European Union, the residential sector accounted for 26% of the final energy consumption, and the main use of household energy was for space heating, which accounted for 64% of this consumption [6]. Heating buildings is an important component of global energy consumption, estimated at almost one-third of the total energy consumption, around 64% of the total energy used in buildings in European countries, and even 74% of the total energy used in buildings in some regions of the USA. This is why intensive research is carried out to develop new energy-conscious heating methods [7,8,9], to provide optimal heating solutions for designers [10,11,12], and to develop system optimisation methods for operators [13,14,15]. It should be noted that using novel insulation materials [16] can substantially reduce buildings’ heat demand, so the heating share of a building’s total energy use will be much lower. However, even for nearly zero-energy buildings, heating remains the largest share of the building’s total energy use [17]. Different heating technologies use different energy sources, so we continue to help stakeholders choose the best heating solution. Comparisons of heating systems are made by analysing their heating costs, environmental impact, and thermal comfort. Martinopoulos et al. compared heating systems in EU countries based on efficiency and fuel costs [18]. District heating, local heating, and central heating systems were compared, considering operating temperatures, fuel costs across EU countries, and energy sources [18]. However, the provided thermal comfort in the building was not taken into account. The same authors analysed and compared various heating systems in the Mediterranean climate [19]. Although the operative temperature was identified as an important design parameter, the paper also stated that thermal comfort fell outside its scope. Obyn and van Moeseke evaluated and compared heating systems based on their investment, operating, and long-term costs, as well as the emissions and primary energy consumption they generate [20]. Thermal comfort is mentioned in the paper once when internal gains are discussed. Ovchinnikov et al. reviewed different studies on low-temperature hydronic heating systems [21]. In some papers, thermal comfort was evaluated using a simulation programme and the deterministic PMV (predictive mean vote) method, but it is not specified how many locations were considered or exactly where in the analysed building the PMV was calculated. Oravec et al. performed a complex analysis of six radiant wall, floor, and ceiling systems with respect to their thermal output, required heating surface area, controllability, short- and long-term energy storage, suitability for installation in existing buildings, and construction costs [22]. The findings of this study are extremely important for designers and operators, but the thermal comfort assessment of different heating systems was not the goal of the performed study. Bojic et al. studied the energy and exergy performances of low-temperature heating systems [23]. The mean temperatures of the external walls are presented, and it is concluded that the air temperatures set by thermostats show that all the systems give satisfactory results without significant deviations. Air temperature is one component of the operative temperature, and the locations where the thermostats are installed in the rooms are not mentioned. Pineau et al. examined the performance of six heating systems in low-energy houses, but thermal comfort was not the study’s goal [24]. Wang et al. compared four typical space-heating systems experimentally [25]. The operative temperature diagram is presented, but it is not known where in the test room the measurement was taken. Vadiee et al. compared floor heating and radiator heating in a family home [26]. However, it is not known whether the thermal comfort conditions in heated spaces were similar across the analysed cases. Sarbu and Sebarchievici presented the operative temperature for floor heating and radiator heating [27]. The operative temperature was calculated at different distances from the window. Wu et al. conducted a comprehensive study and analysed the indoor air distribution and thermal environment for different combinations of radiant heating systems and mechanical ventilation systems [28]. The predictive mean value was determined in four different locations of the heated room. Kalmar et al. compared the energy use of low temperature radiant heating (combined floor and ceiling heating) and traditional radiator heating at an equal operative temperature in the middle of the heated room [29]. There are many publications comparing heating systems from the perspectives of heat source and environmental impacts [30,31,32,33,34]. The analysis of the operative temperature in the heated rooms or building was outside the scope of these studies. Kazanci et al. compared three heating systems from an exergy perspective [35]. The study provides important data on the exergy consumed, but the operative temperature provided by the heating systems in the rooms was not examined.
As can be observed, many studies compare and analyse the performance of heating systems, but only a few also take into account the provided operative temperature. However, this should be the basic condition. Heating systems are designed not only to meet a room’s heat demand but also to provide appropriate thermal comfort for occupants. Nevertheless, there are plenty of technical solutions for delivering heat in the room: radiators, fan coils, low-temperature radiant heating, floor convectors, ventilation, etc. The thermal sensation at a specific location in a room depends on the operative temperature. This research aims to draw researchers’ attention to the fact that in a heated room, the distribution of operative temperature is not uniform and depends on the installed heating system, the number of external building elements (walls, floor, and ceiling), and the room geometry. To compare the energy consumption of heating systems appropriately, identical indoor thermal comfort parameters should be ensured in the heated rooms.

2. Research Methods

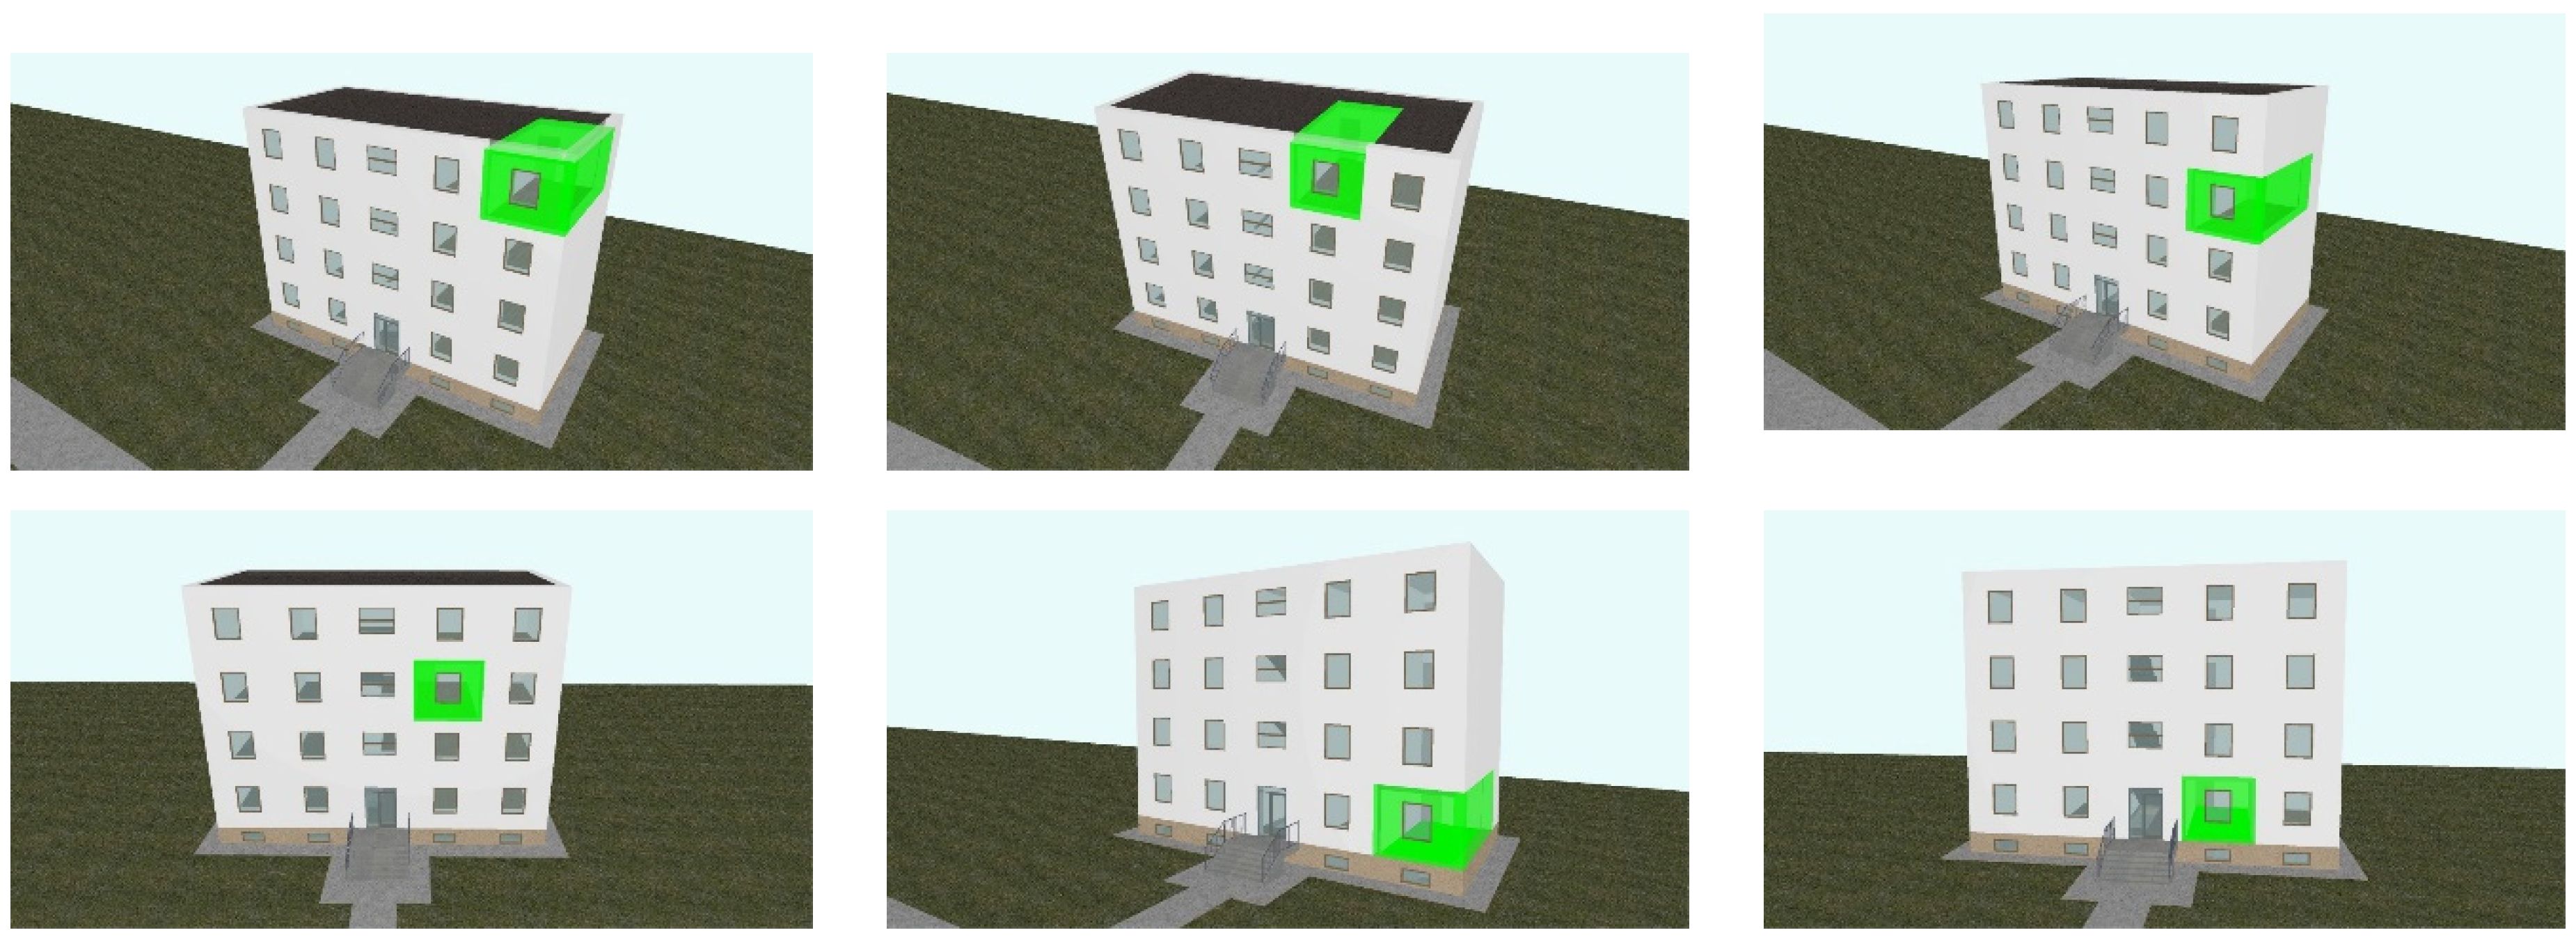
Operative temperatures have been determined in rooms with different net floor areas, located on different floors of a multilevel residential building or in a single-family house. The analysed room can have one, two, or three external walls, could have the floor slab above an unheated cellar or a heated room, and could be situated below a flat roof, under an unheated attic, or under a heated room with a similar indoor set-point temperature (Figure 1).
The analysed rooms are square-shaped (3.0 m × 3.0 m; 3.5 m × 3.5 m; 4.0 m × 4.0 m; 4.5 m × 4.5 m; 5.0 m × 5.0 m; 5.5 m × 5.5 m; 6.0 m × 6.0 m) and the room height in each analysed case is 2.7 m. The height of the window is always 1.5 m, while the width is always half of the wall length. The windows-to-wall ratio in each case was 27.77%. The overall heat transfer coefficients (U-values) for the external building elements are presented in Table 1.
Thus, in total, 525 room types were analysed (five positions of the room in the building, seven room geometries, one, two, or three external walls, and five U-values of the external walls). Each analysed room got a code depending on the position, number of external walls, and overall heat transfer coefficient as follows: a family house—FH; the ground floor in a multifamily building with a slab above the cellar—FC; the intermediate level in a multifamily building—M; the top level in a multifamily building—FR (a flat roof) or A (a room under an unheated attic). Therefore, code FH2EW05 is a room in a family house with two external walls, each with an overall heat transfer coefficient of 0.5 W/m2K. The coding of rooms is explained in detail in Appendix A.
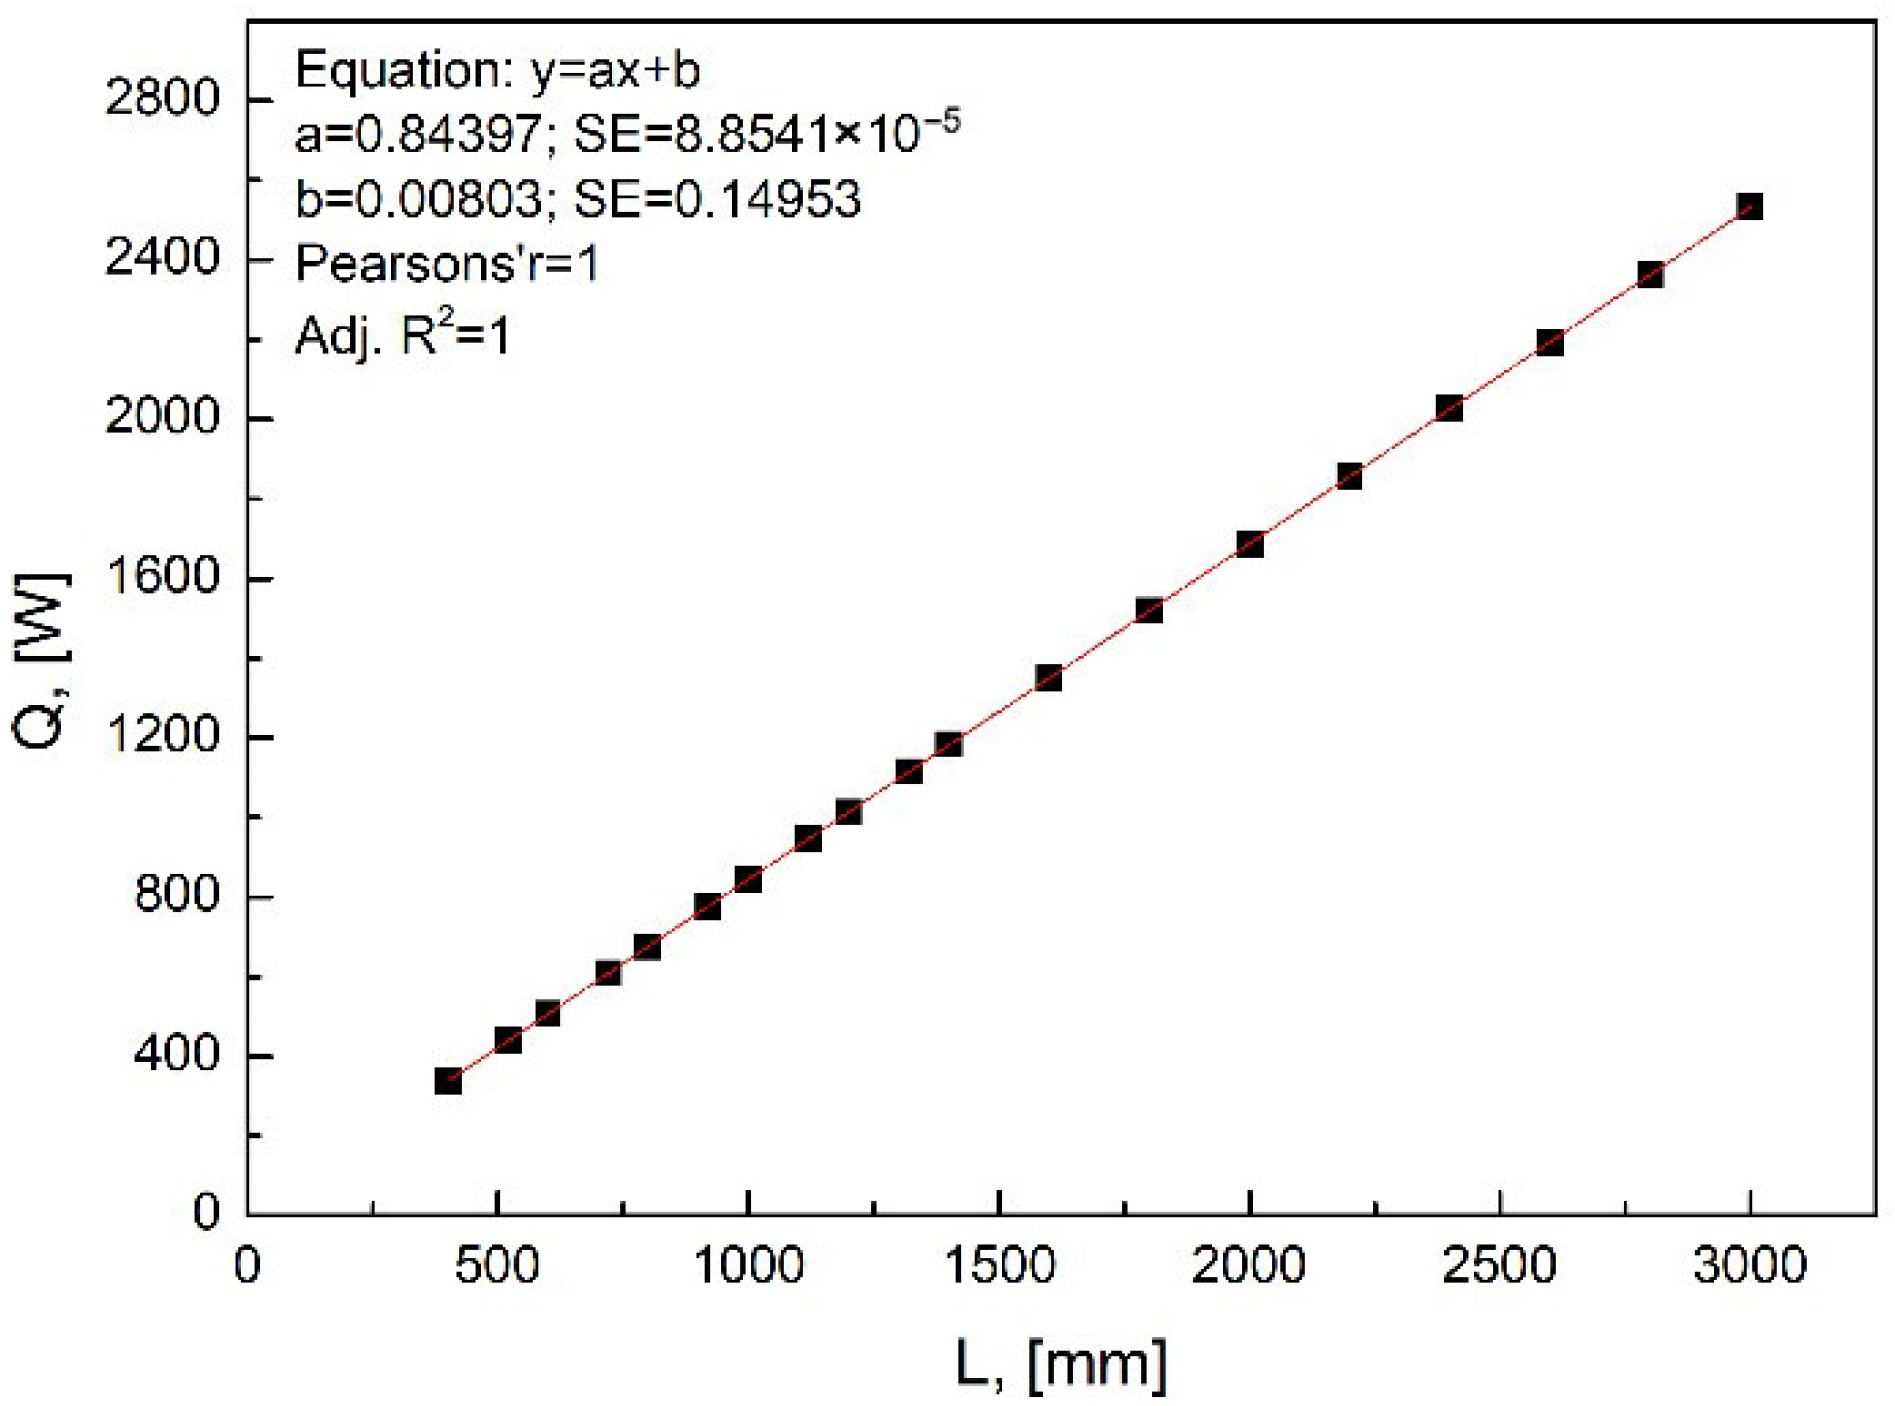
Heating using a radiator and floor heating were analysed. The heat demand of the rooms was calculated using the methodology recommended in standard EN 12831-1:2017, [36]. For radiator heating, the output and surface temperatures of the radiators were determined based on the design catalogue for Vogel and Noot Vonoplan 11-type radiators. From the design catalogue, the output of radiators has been determined as tsupply = 75 °C, treturn = 65 °C and indoor set-point temperature ti = 20 °C. The radiator output values, depending on radiator length, are shown in Figure 2.
The length of the radiator was always considered equal to the width of the window, and the required mean logarithmic temperature difference was calculated based on the room’s heat demand using Equation (1):
Δ t l n = Δ t l n 0 Q r a d Q r a d 0 n
where Δtln0 is the nominal logarithmic temperature difference, K (in our case 49.83 K); Qrad is the heat needed to be delivered by radiator (equal to the demand of the analysed room), [W]; Qrado is the heat delivered by the radiator under nominal conditions (given in the design catalogue) (tsupply = 75 °C, treturn = 65 °C and indoor set-point temperature ti = 20 °C), [W]; n is the radiator exponent (this value depends on the radiator materials and construction, and is, in our case, n = 1.303).
If the logarithmic temperature difference is known, then, depending on the temperature drop ( Δ t d r o p = t s u p p l y t r e t u r n ), the supply temperature can be determined using Equation (2):
t s u p p l y = t i + β β 1 Δ t d r o p
where
β = e Δ t d r o p Δ t l n
while the return temperature is:
t r e t u r n = t s u p p l y Δ T d r o p
The radiator surface temperature was taken into account as the average of supply and return temperatures:
t r a d i a t o r = t s u p p l y + t r e t u r n 2
For floor heating, the total heat transfer coefficient (htot) was set to 11 W/m2K, as recommended by Shinoda et al. [37]. The floor temperature is given by Equation (6):
t f l o o r = t i + Q f l o o r h t o t A f l o o r
where Qfloor is the heat delivered by floor heating (equal to the heat demand of the analysed room), [W]; Afloor is the net floor area of the analysed room, [m2].
The mean radiant temperature was calculated using Equation (7):
t ¯ r = F A j P T j 4 4 273
where FAj-P are the angle factors between the sitting person (in one of the locations of the analysed room) and the j surrounding building element; Tj is the surface temperature of the j building element, [K].
The surface temperature of the building elements (slabs, walls, and doors) separating internal heated spaces was assumed to be equal to the indoor set-point temperature. The surface temperature of the external building elements (walls, windows, and slabs) was determined using Equation (8):
t j = t i t i t e U j h i
where tj is the internal surface temperature of the j external building element, [°C]; Uj—is the U-value of the j external building element, [W/m2K]; hi is the heat transfer coefficient on the internal surface of the building element, [W/m2K]. In the calculation, hi was considered 8 W/m2K for external walls and windows, 6 W/m2K for a slab above the cellar, 10 W/m2K for a flat roof and a slab under the attic.
The operative temperature to is given by Equation (9):
t o = h c t i + h r t ¯ r h c + h r
where · t ¯ r is the mean radiant temperature in the room, [°C]; hc is the convective heat transfer coefficient of the human body, [W/m2K]; hr is the radiant heat transfer coefficient of the human body, [W/m2K].
Since there is no forced air circulation in the analysed rooms, the convective heat transfer coefficient depends on the temperature difference between the occupant’s clothing surface temperature (tcl) and the indoor set-point temperature:
h c = 2.38 · t c l t i 0.25                     [ W / m 2 K ]
The radiant heat transfer coefficient can be determined depending on the temperature difference between the occupant’s clothing surface temperature and the indoor set-point temperature:
h r = 5.67 · 10 8 · ε · A r A D u · t c l + 273 4 t ¯ r + 273 4 t c l t ¯ r           [ W / m 2 K ]
where Ar is the effective radiant surface of the human body, [m2]; ADu is the Du Bois surface of the human body, [m2]; ε is the emission coefficient of the clothing surface and the human body uncovered by clothing.
The ratio Ar/ADu is 0.7 for a sitting person, while the emission coefficient ε was assumed to be 0.9. In the calculation, the clothing temperature was assumed to be 28 °C, the convective heat transfer coefficient was 4.00 W/m2K, and the radiant heat transfer coefficient was 3.76 W/m2K.
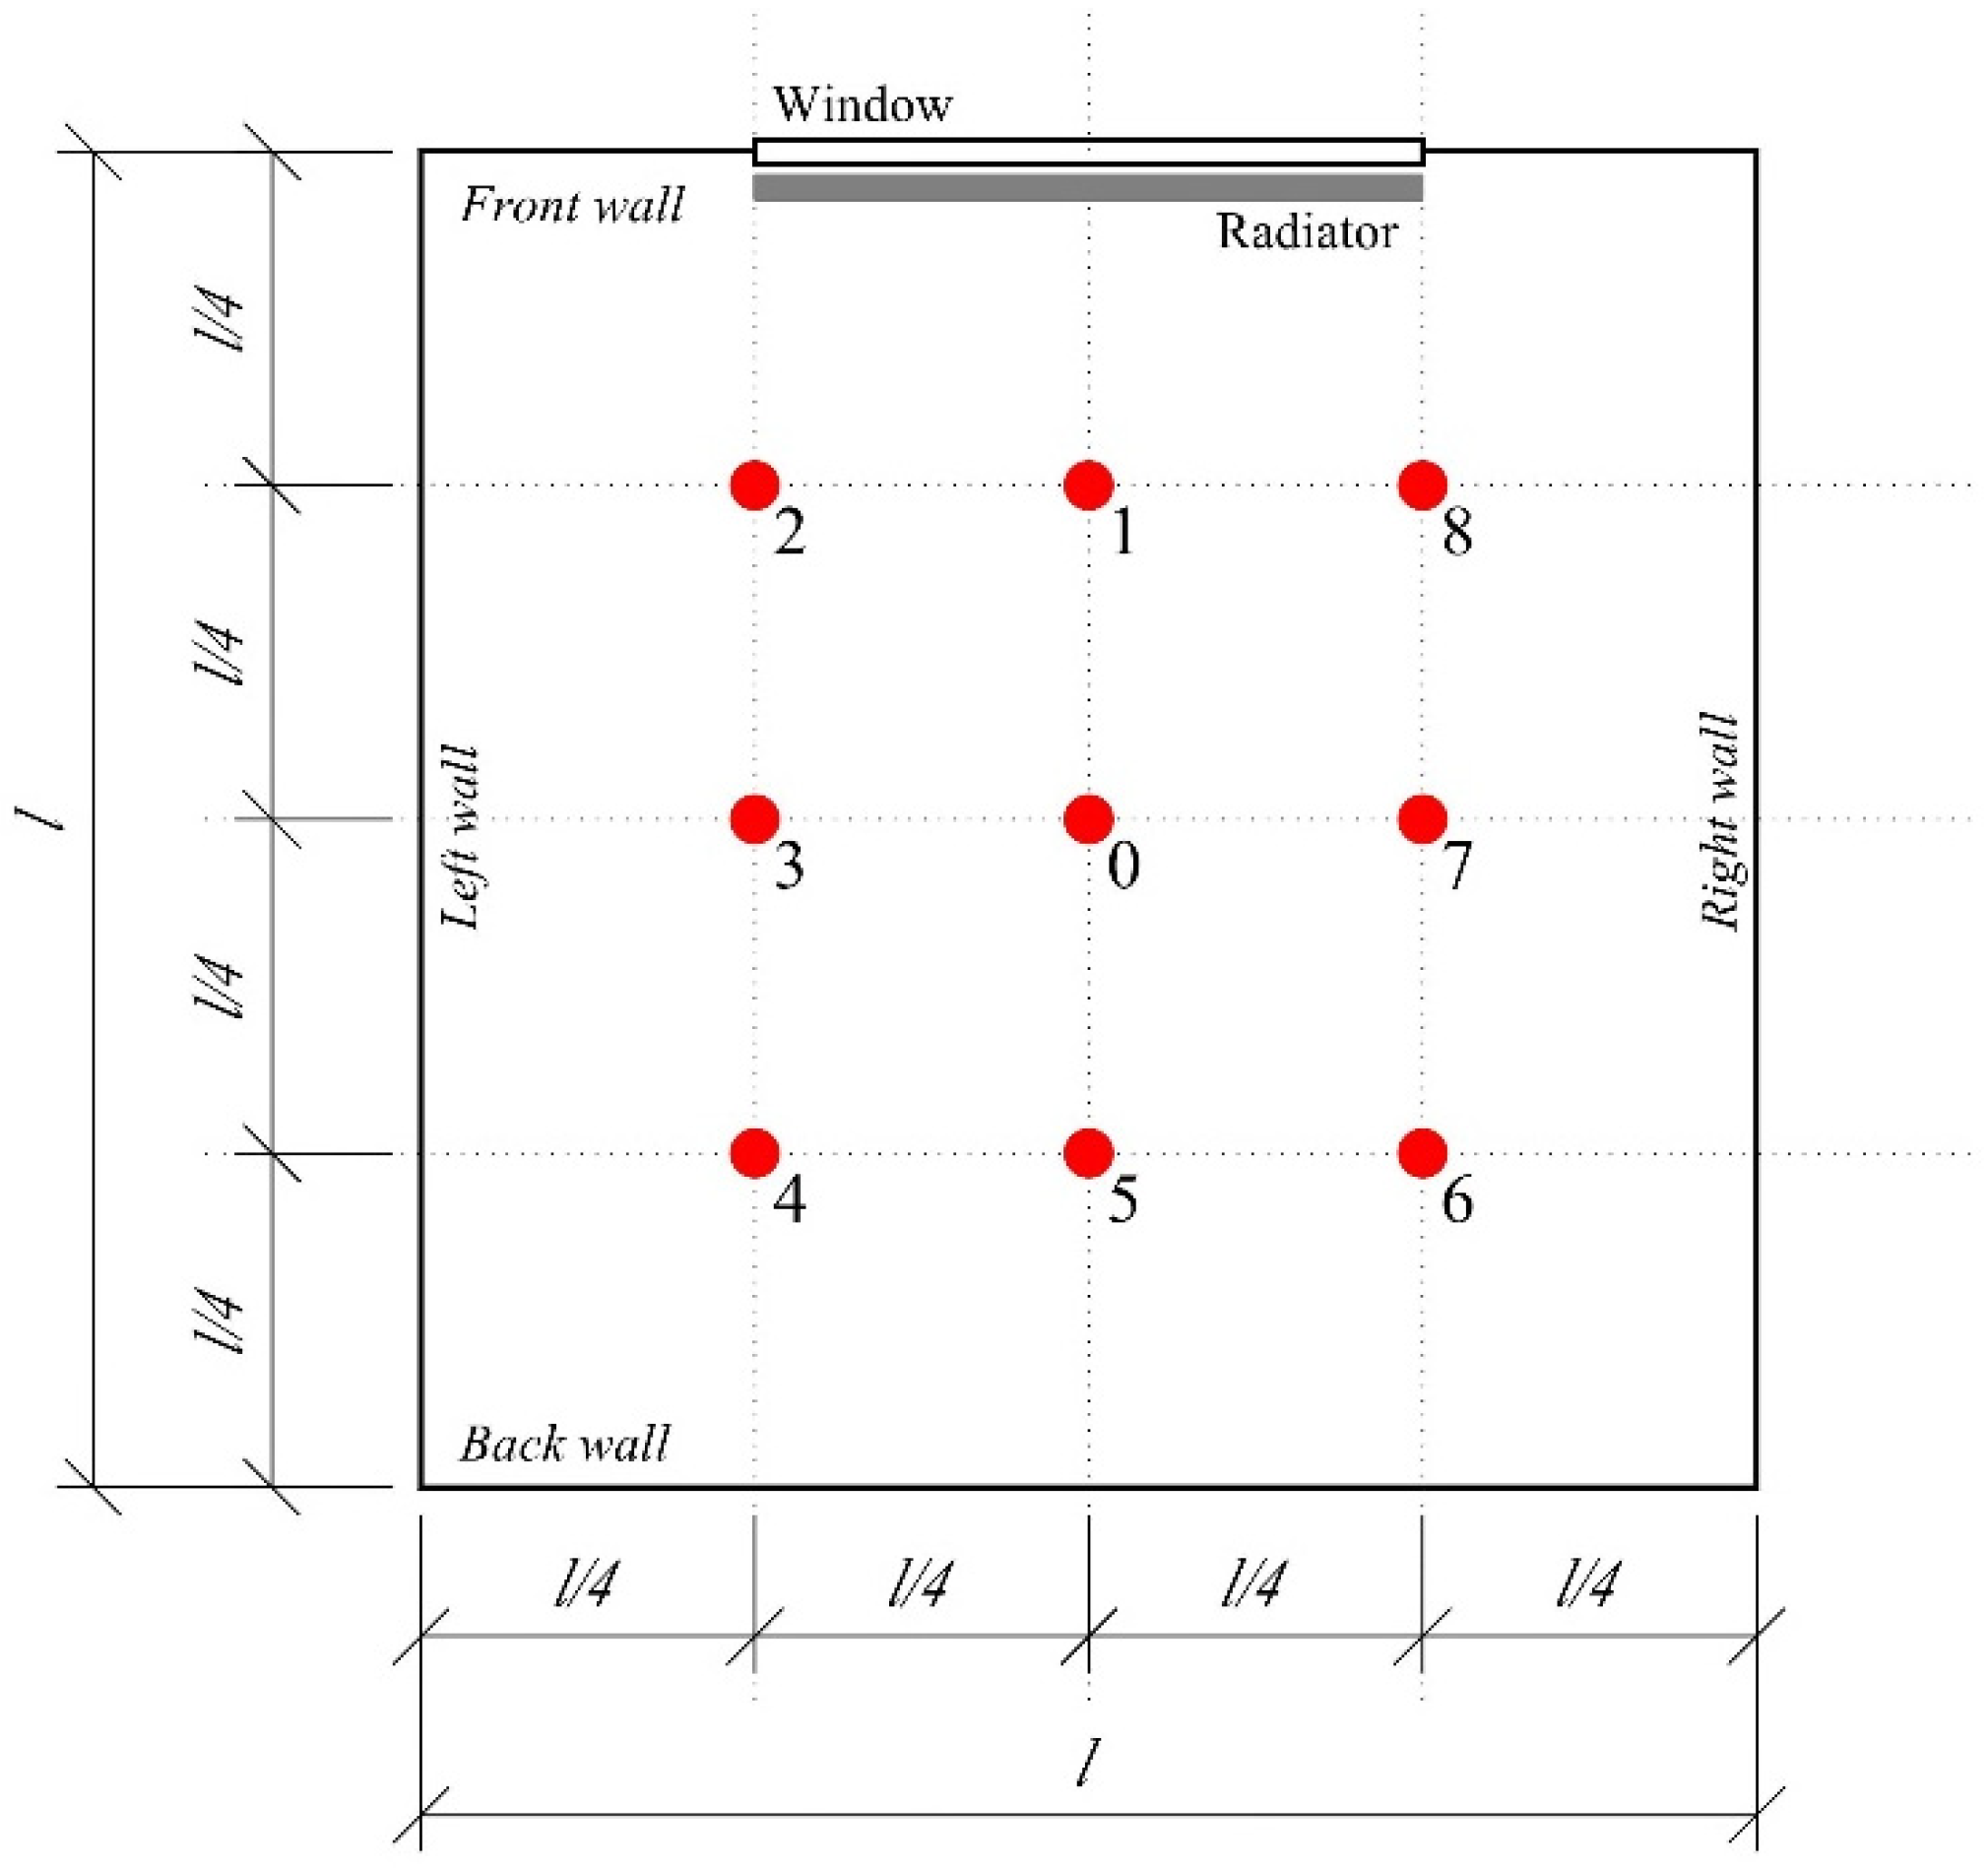
The angle factors were determined based on Fanger’s diagrams for a sitting person with their face oriented toward the window [38]. Using the angle factors and the internal surface temperatures, the mean radiant temperatures were calculated at nine locations in the heated space. Location “0” was in the middle of the room. The distance between the locations in each case was a quarter of the room’s wall length (Figure 3). The layout of the locations was chosen to cover the occupational zone for each room geometry, in accordance with the prescriptions of the ANSI/ASHRAE Standard 55-2017 [39].

3. Results

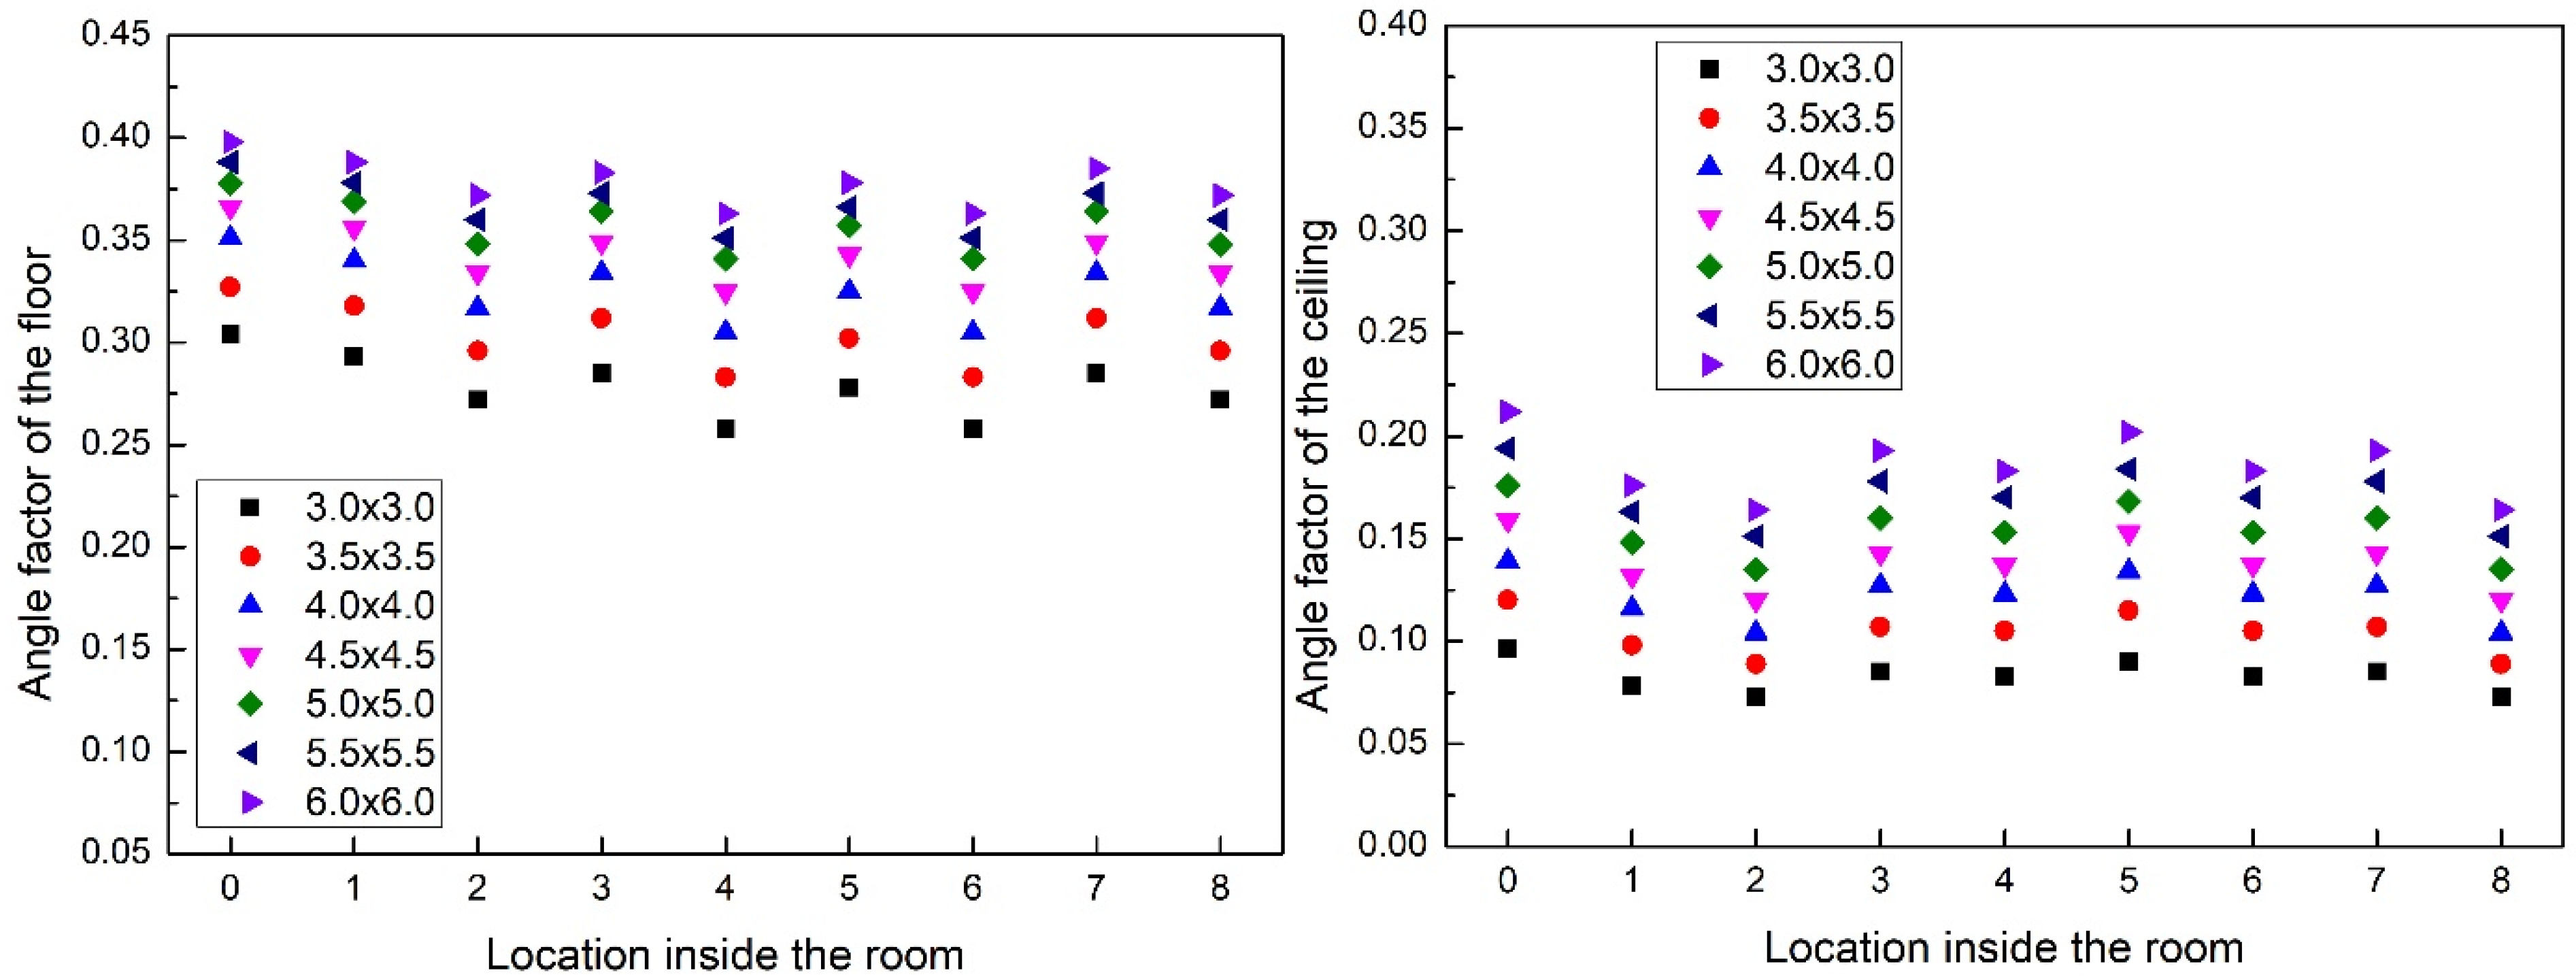
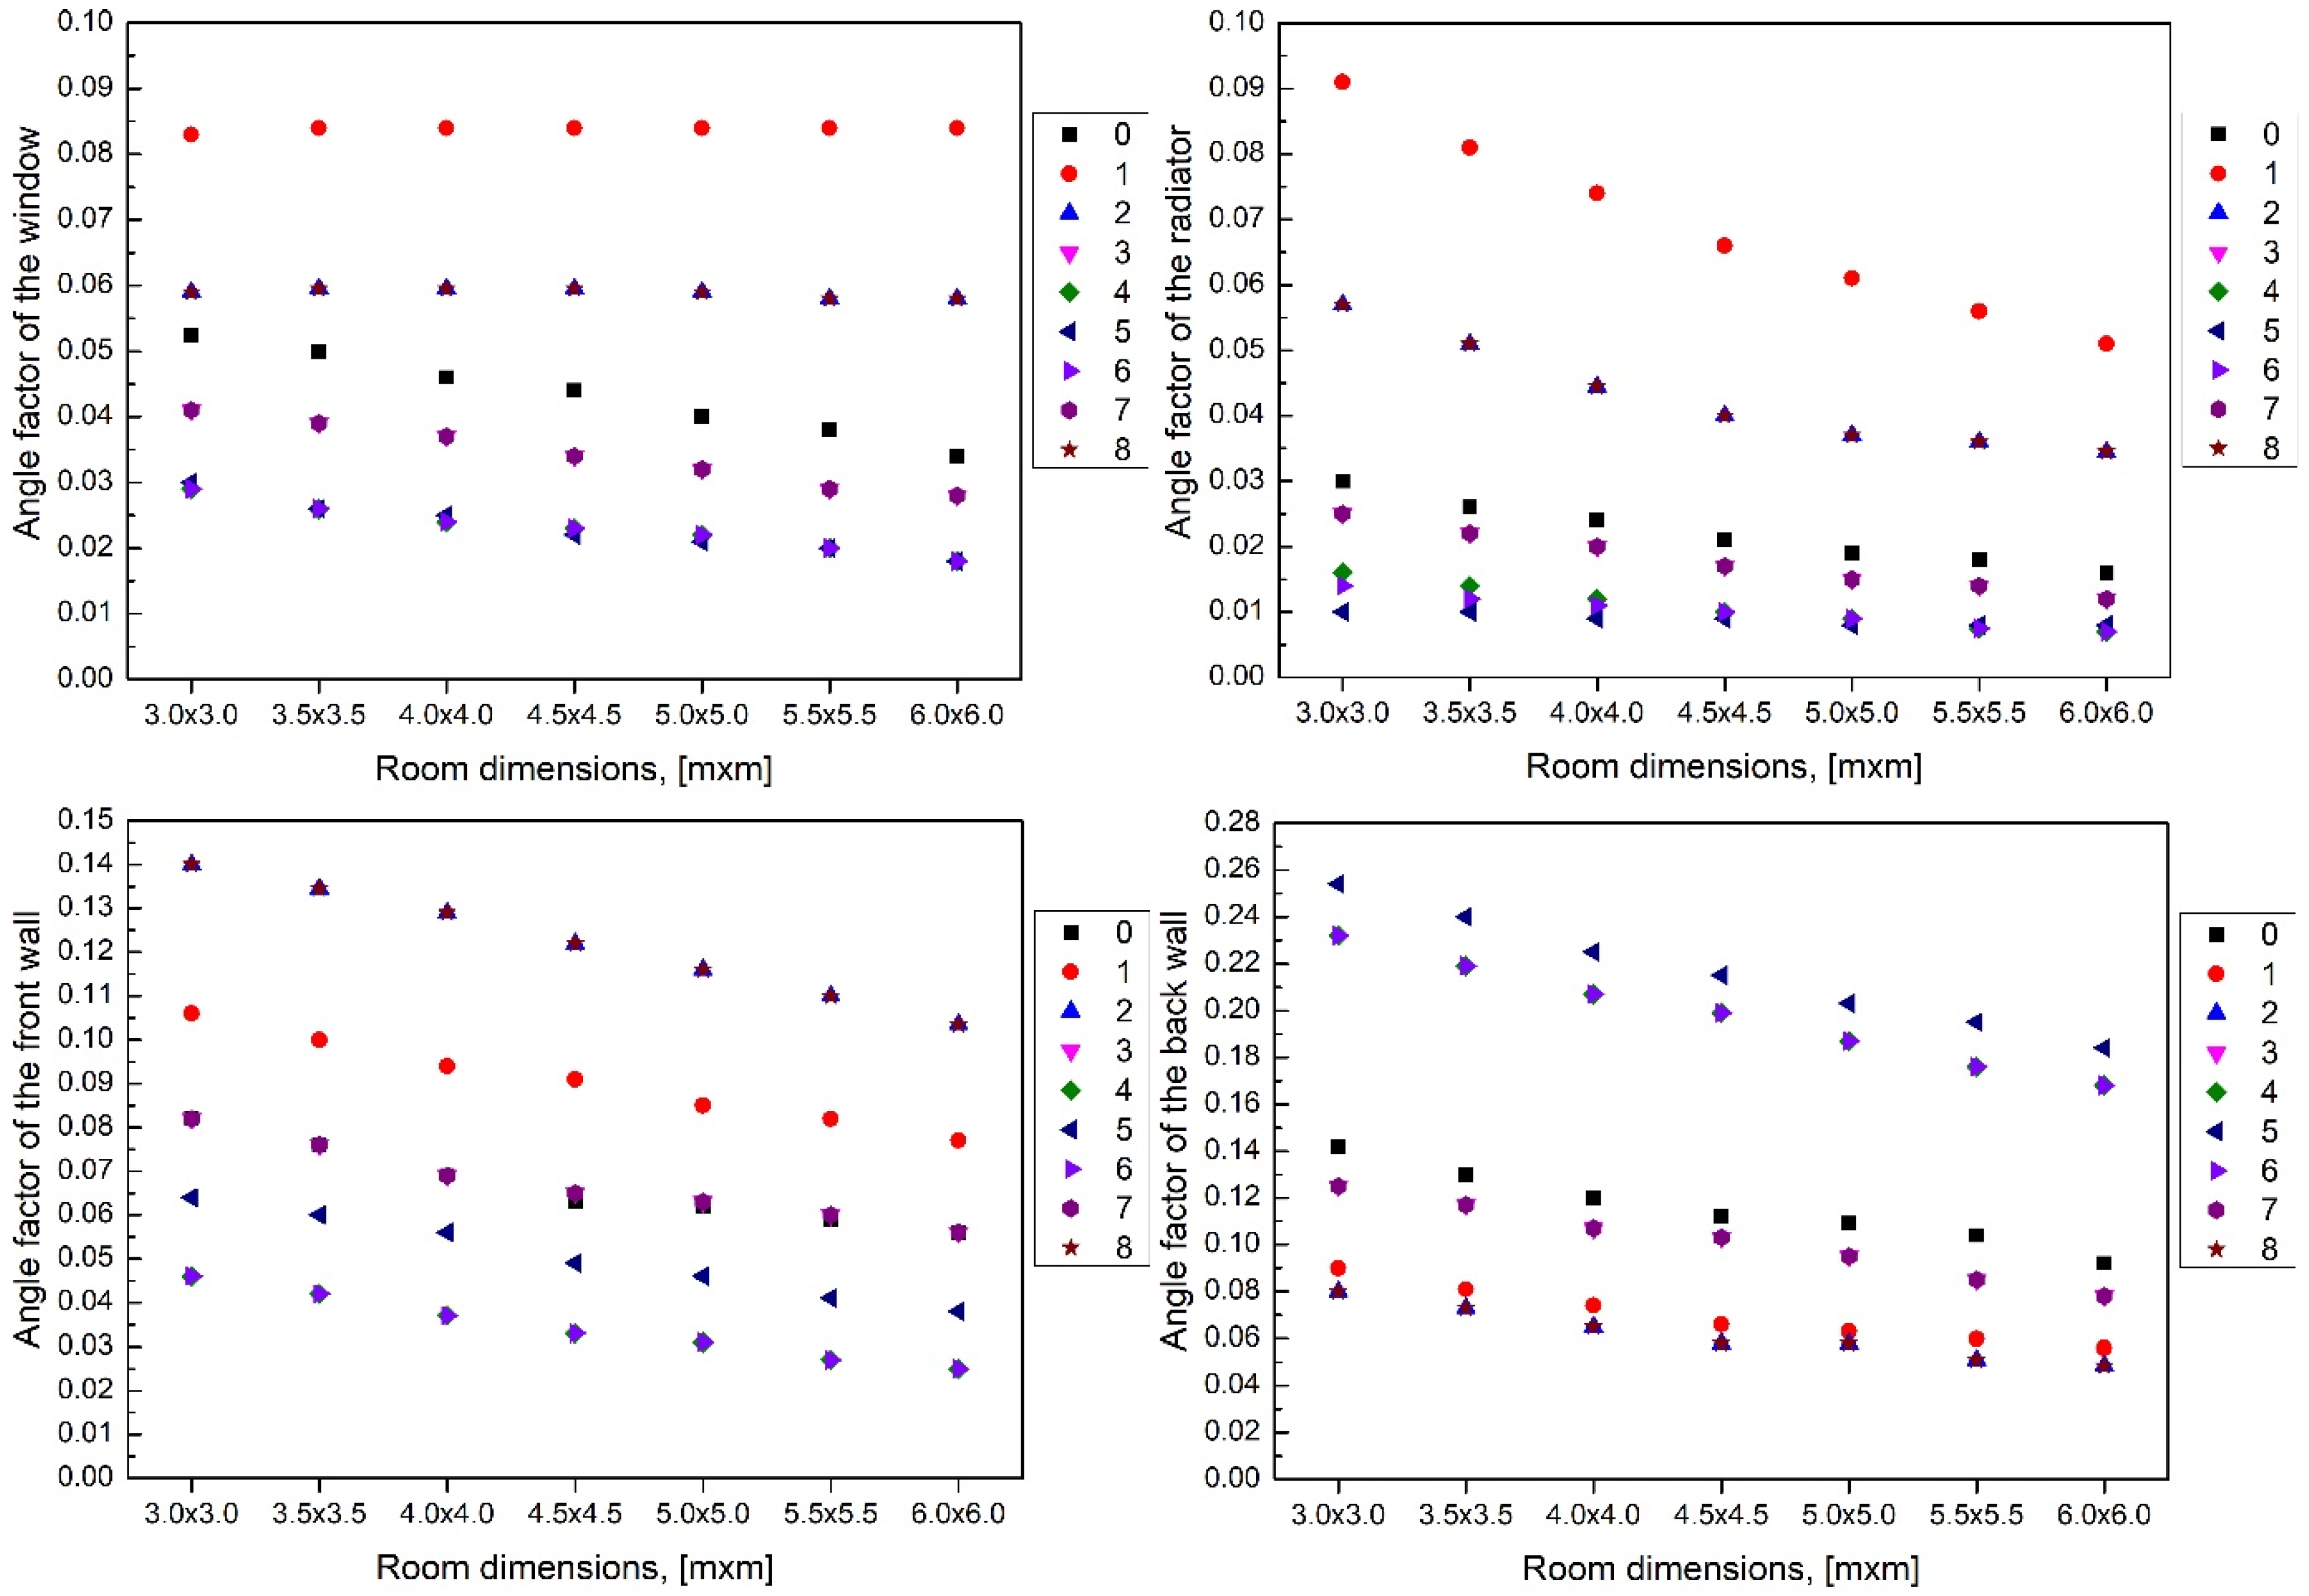
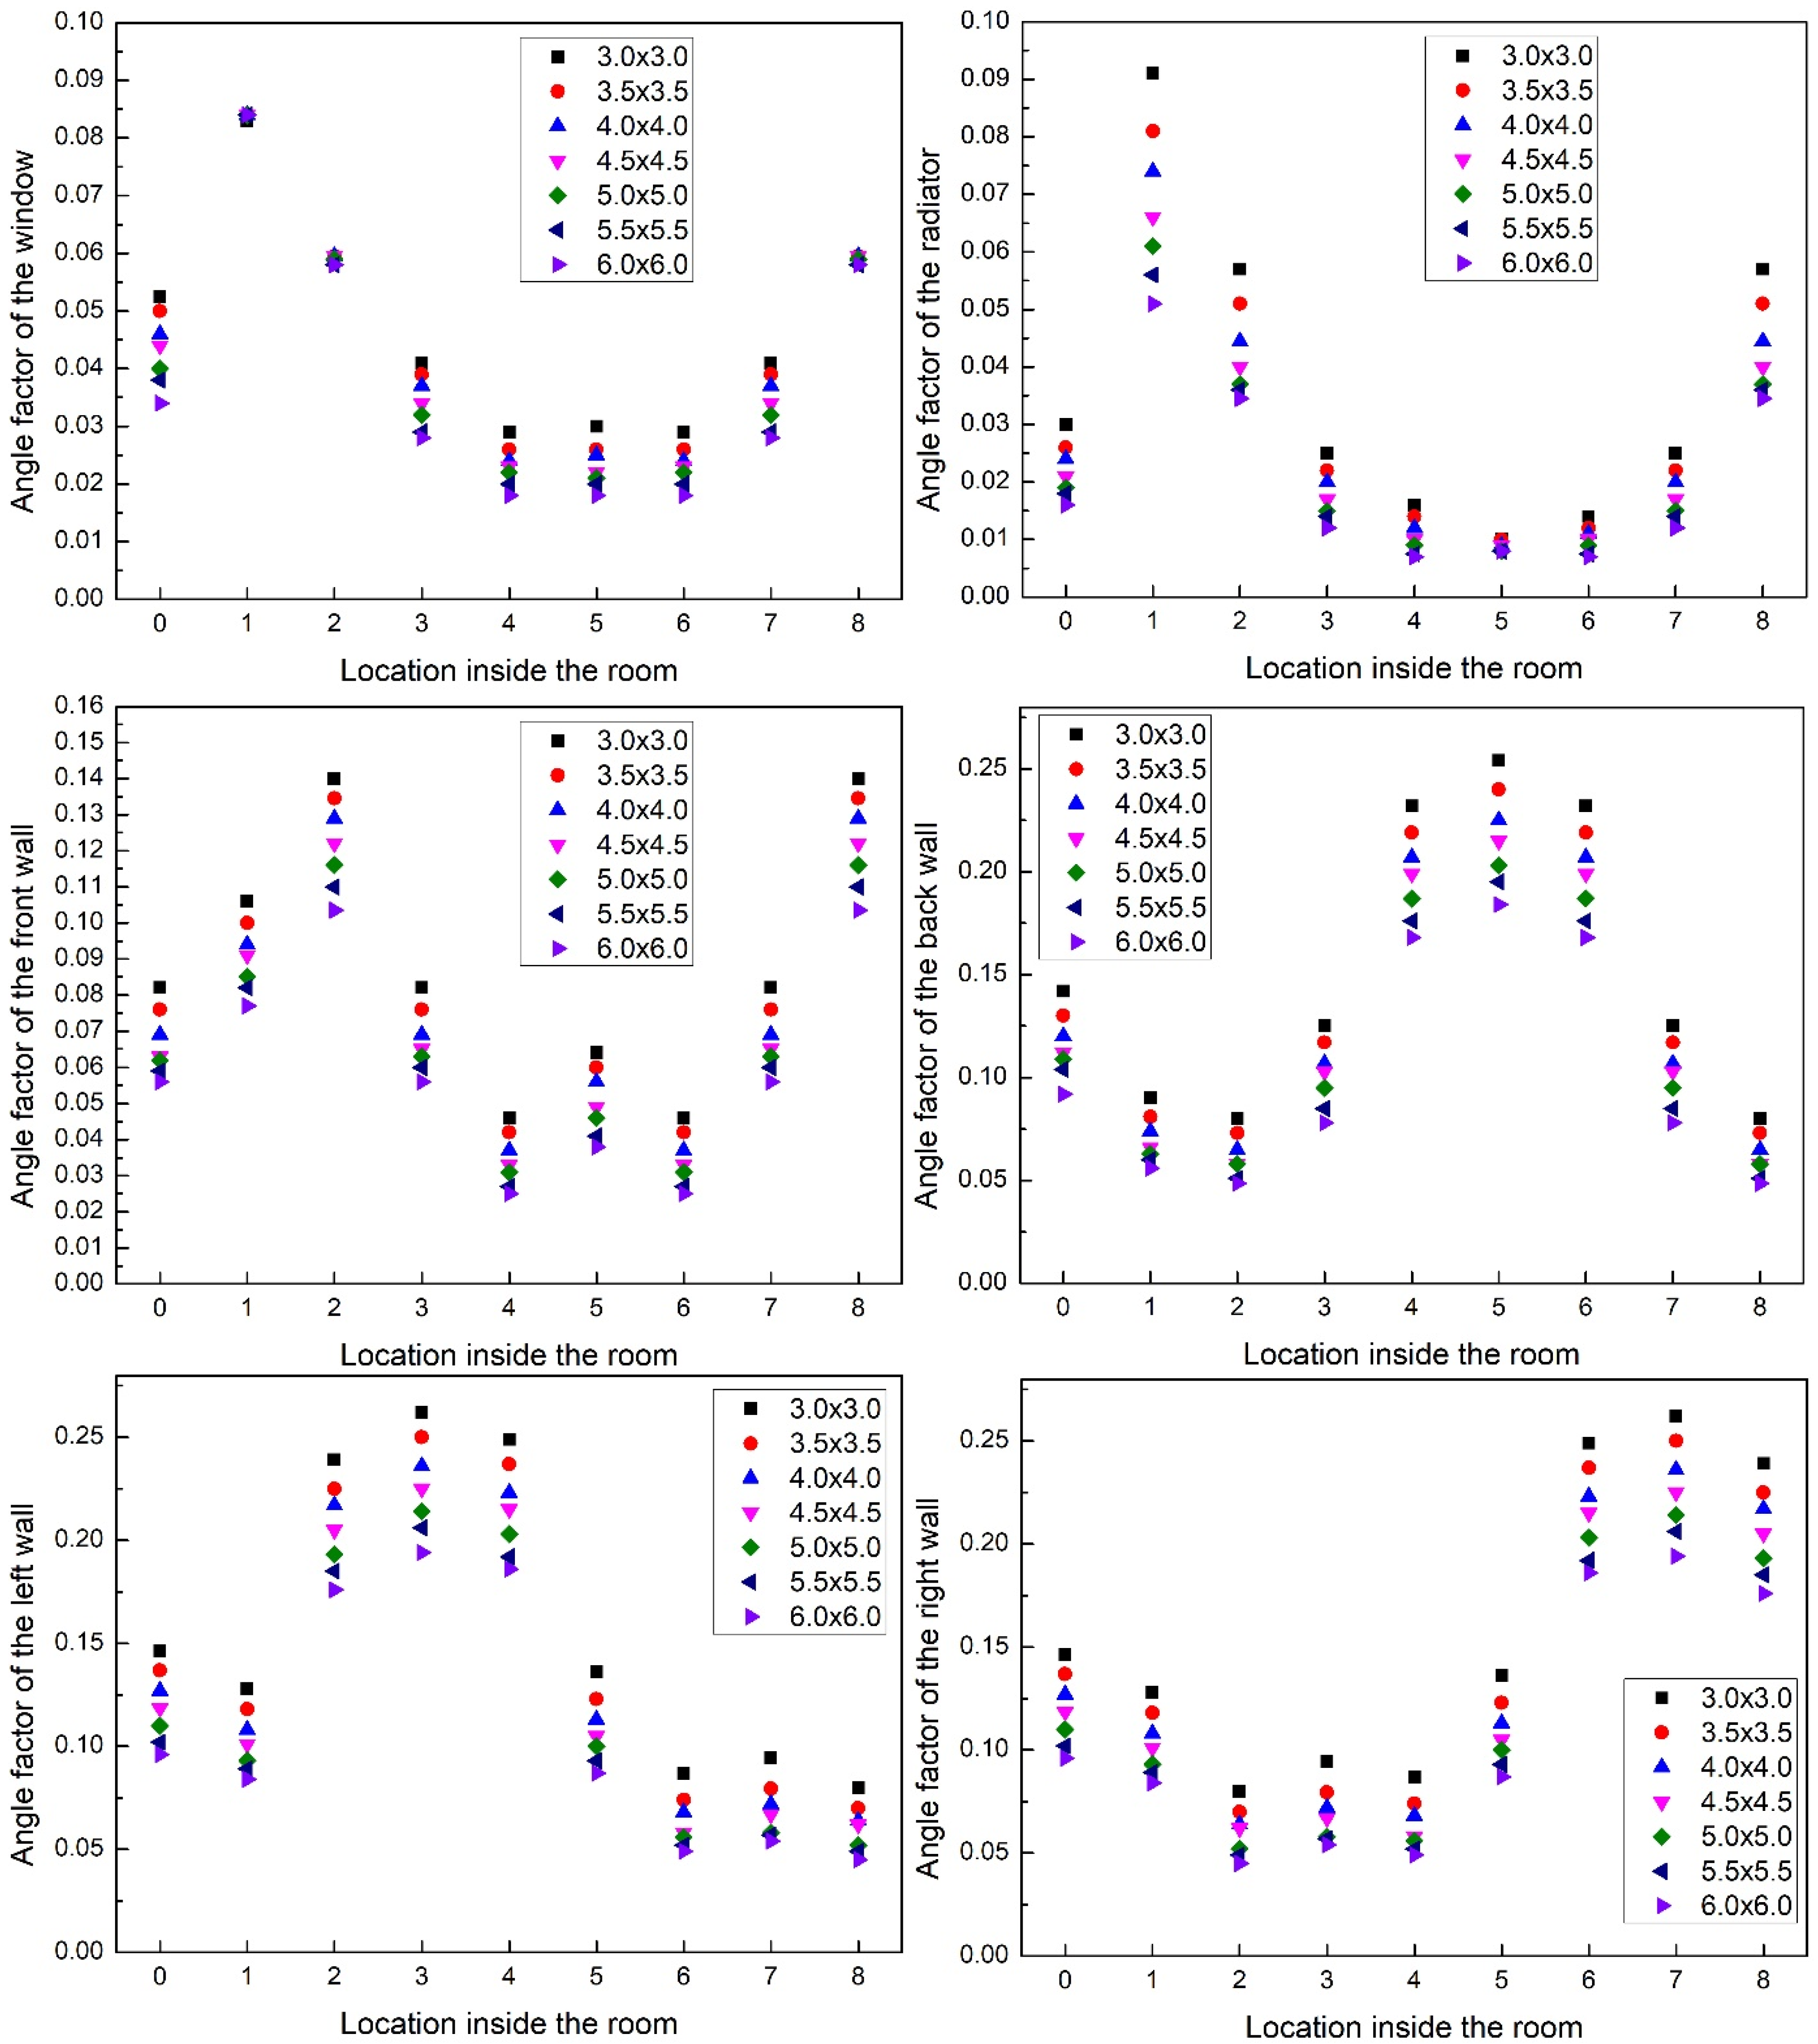
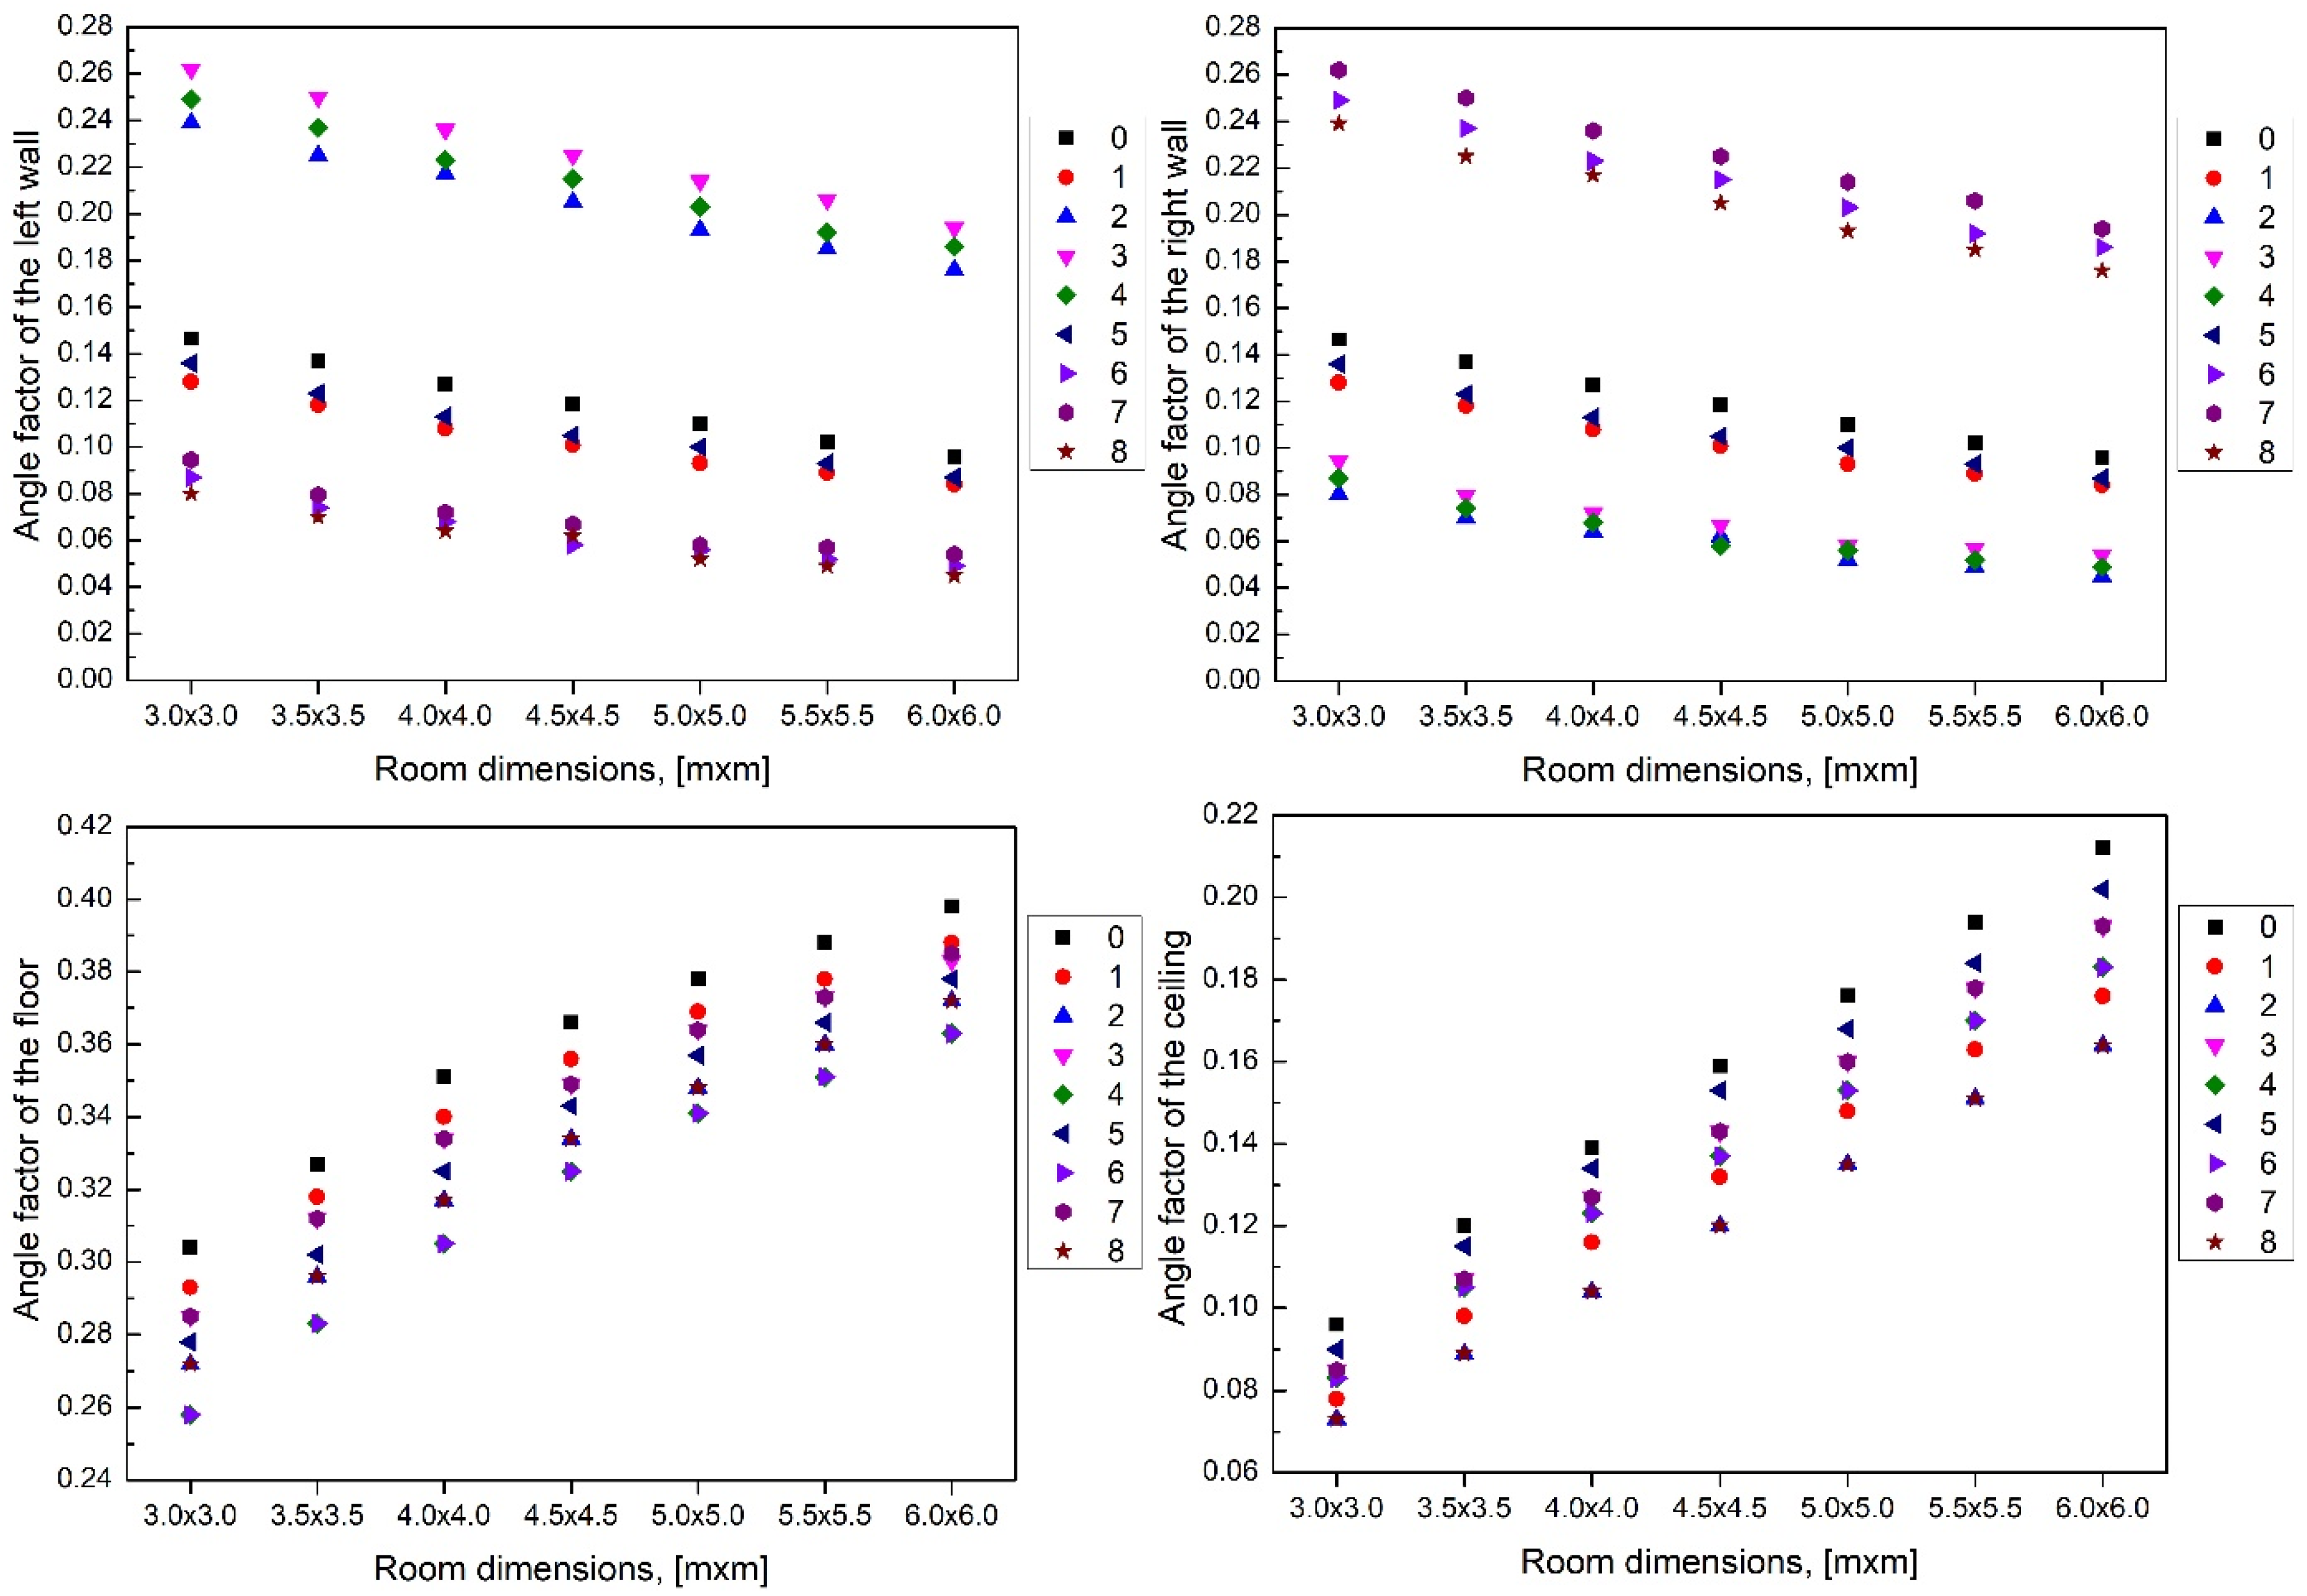
For radiator heating, the angle factors of the surrounding building elements and the radiator are shown in Figure 4 (for a given location and different room dimensions) and Figure 5 (for a given room and different locations). It can be observed that, between the angle factors of a given building element, the differences are substantial depending on the location in the room. These differences also depend on the room geometry.
For the floor and ceiling, the smallest angle factor values are obtained for the smallest room (3.0 m × 3.0 m × 2.7 m), while for the radiator, window, and walls, the angle factors are the highest for this room. The angle factors of the floor are almost twice those of the ceiling in the analysed rooms. Huge differences can be observed in the angle factors of the window, radiator, front wall, and back wall between locations 1, 2, and 8 and locations 4, 5, and 6 for each room geometry. In location 0, the radiator angle factor is almost double in the smallest room (3.0 m × 3.0 m × 2.7 m) as compared to in the largest room (6.0 m × 6.0 m × 2.7 m).
For all building elements except the ceiling and floor, the angle factors are lower for larger rooms. The differences in the angle factors across locations are significant within a given room. Moreover, the differences in the angle factors of the floor and ceiling across different room geometries are significant.
In the case of floor heating, the angle factors for the window, the left, right, and back walls, the ceiling, and the floor are the same, while the angle factor for the front wall increased with the radiator’s angle factor.
The calculations were performed for all 525 rooms (nine locations, each with two heating modes), but only a few results are presented for a mid-level room of a multifamily building, a room in a single-family house, and a U-value of 0.5 W/m2K for the external walls.
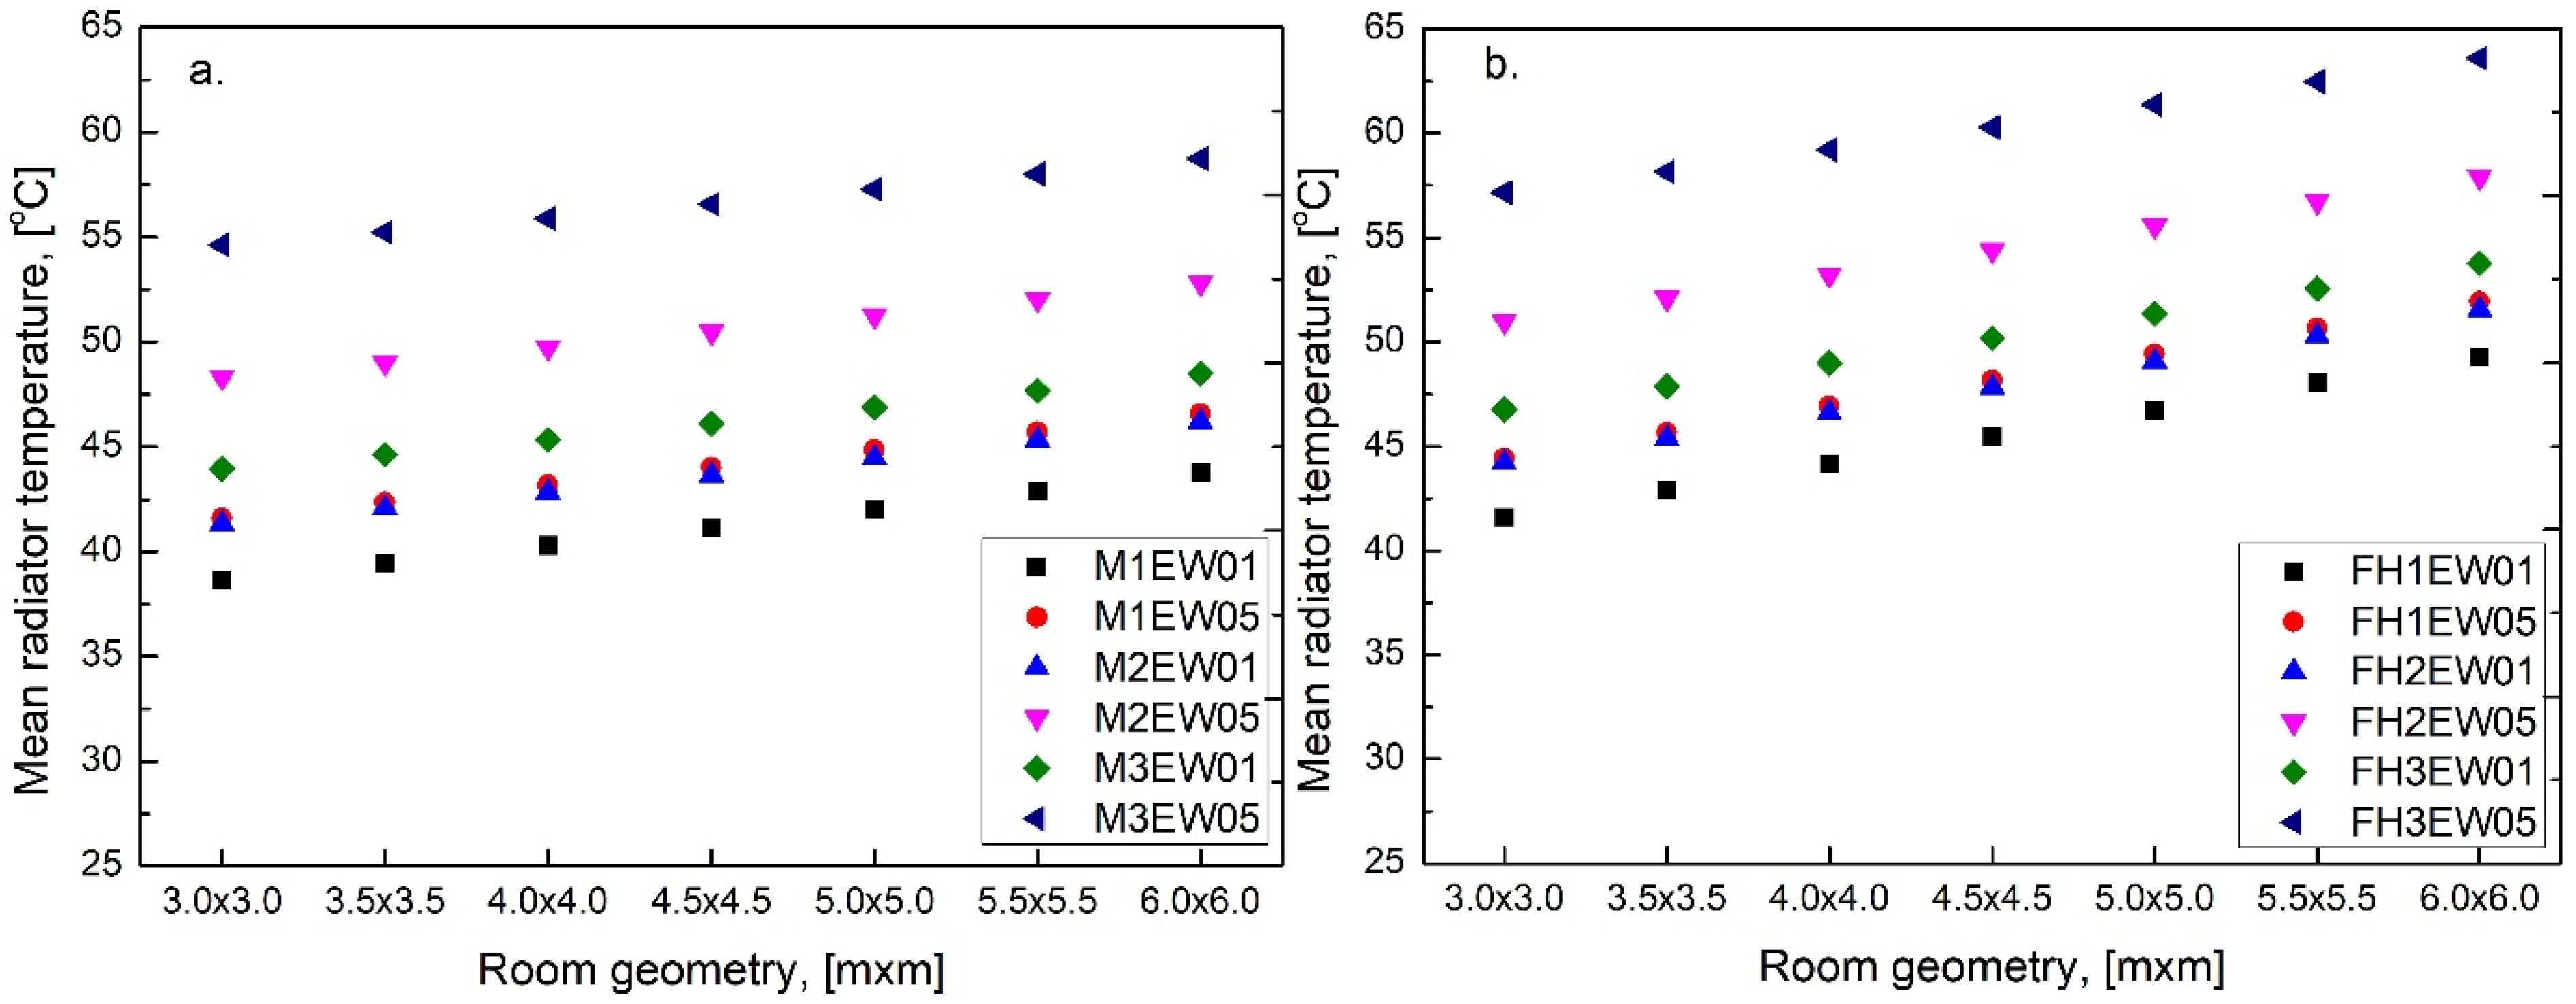
Using Equation (5), the mean radiator temperature was determined. For different room geometries, the obtained values are shown in Figure 6.
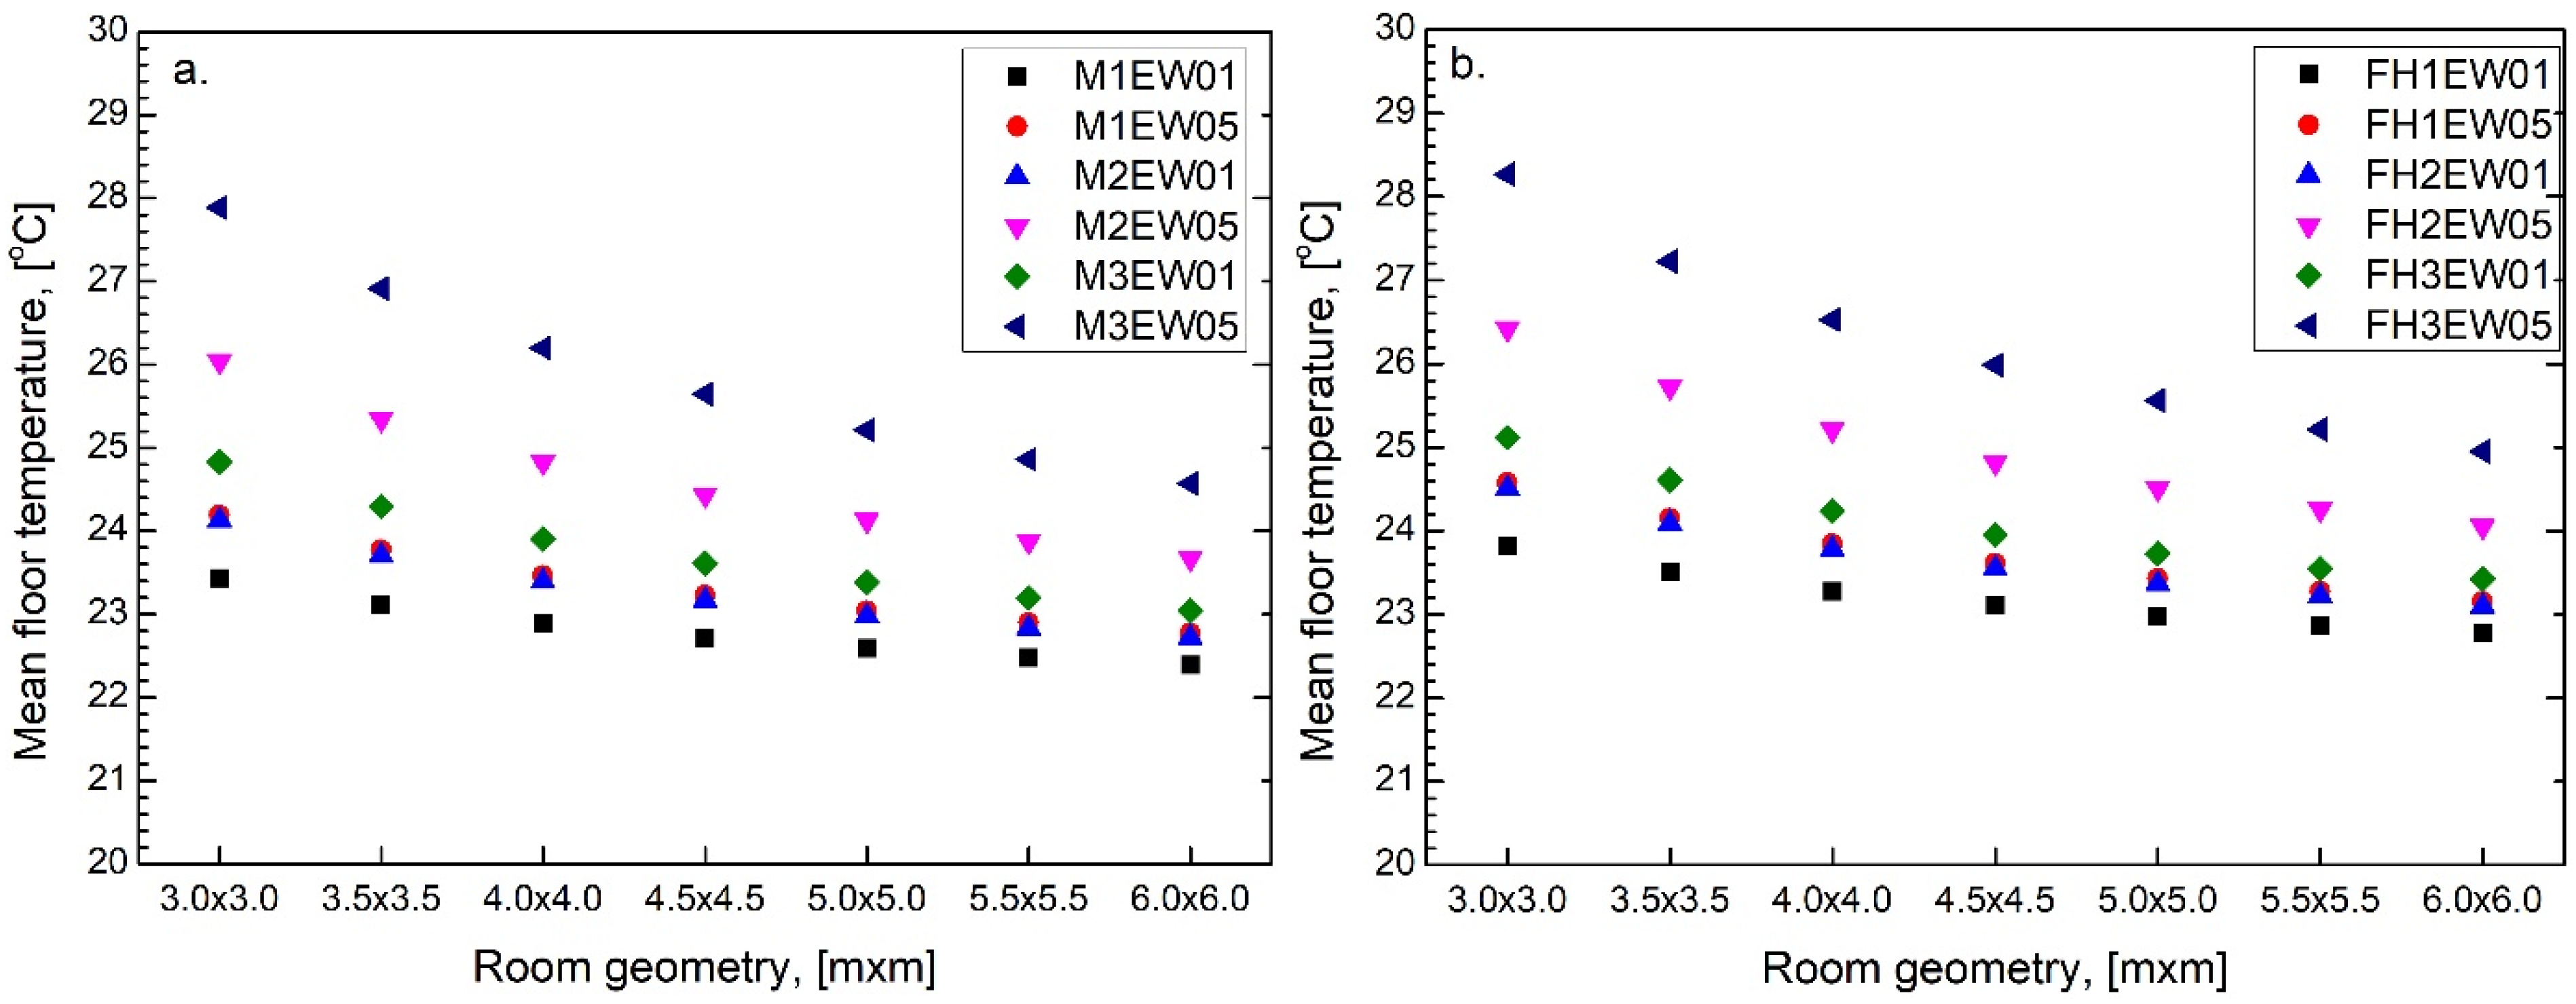
Using Equation (6), the mean floor temperatures were determined for rooms with different geometries and locations, with different numbers of external walls and U-values (Figure 7).
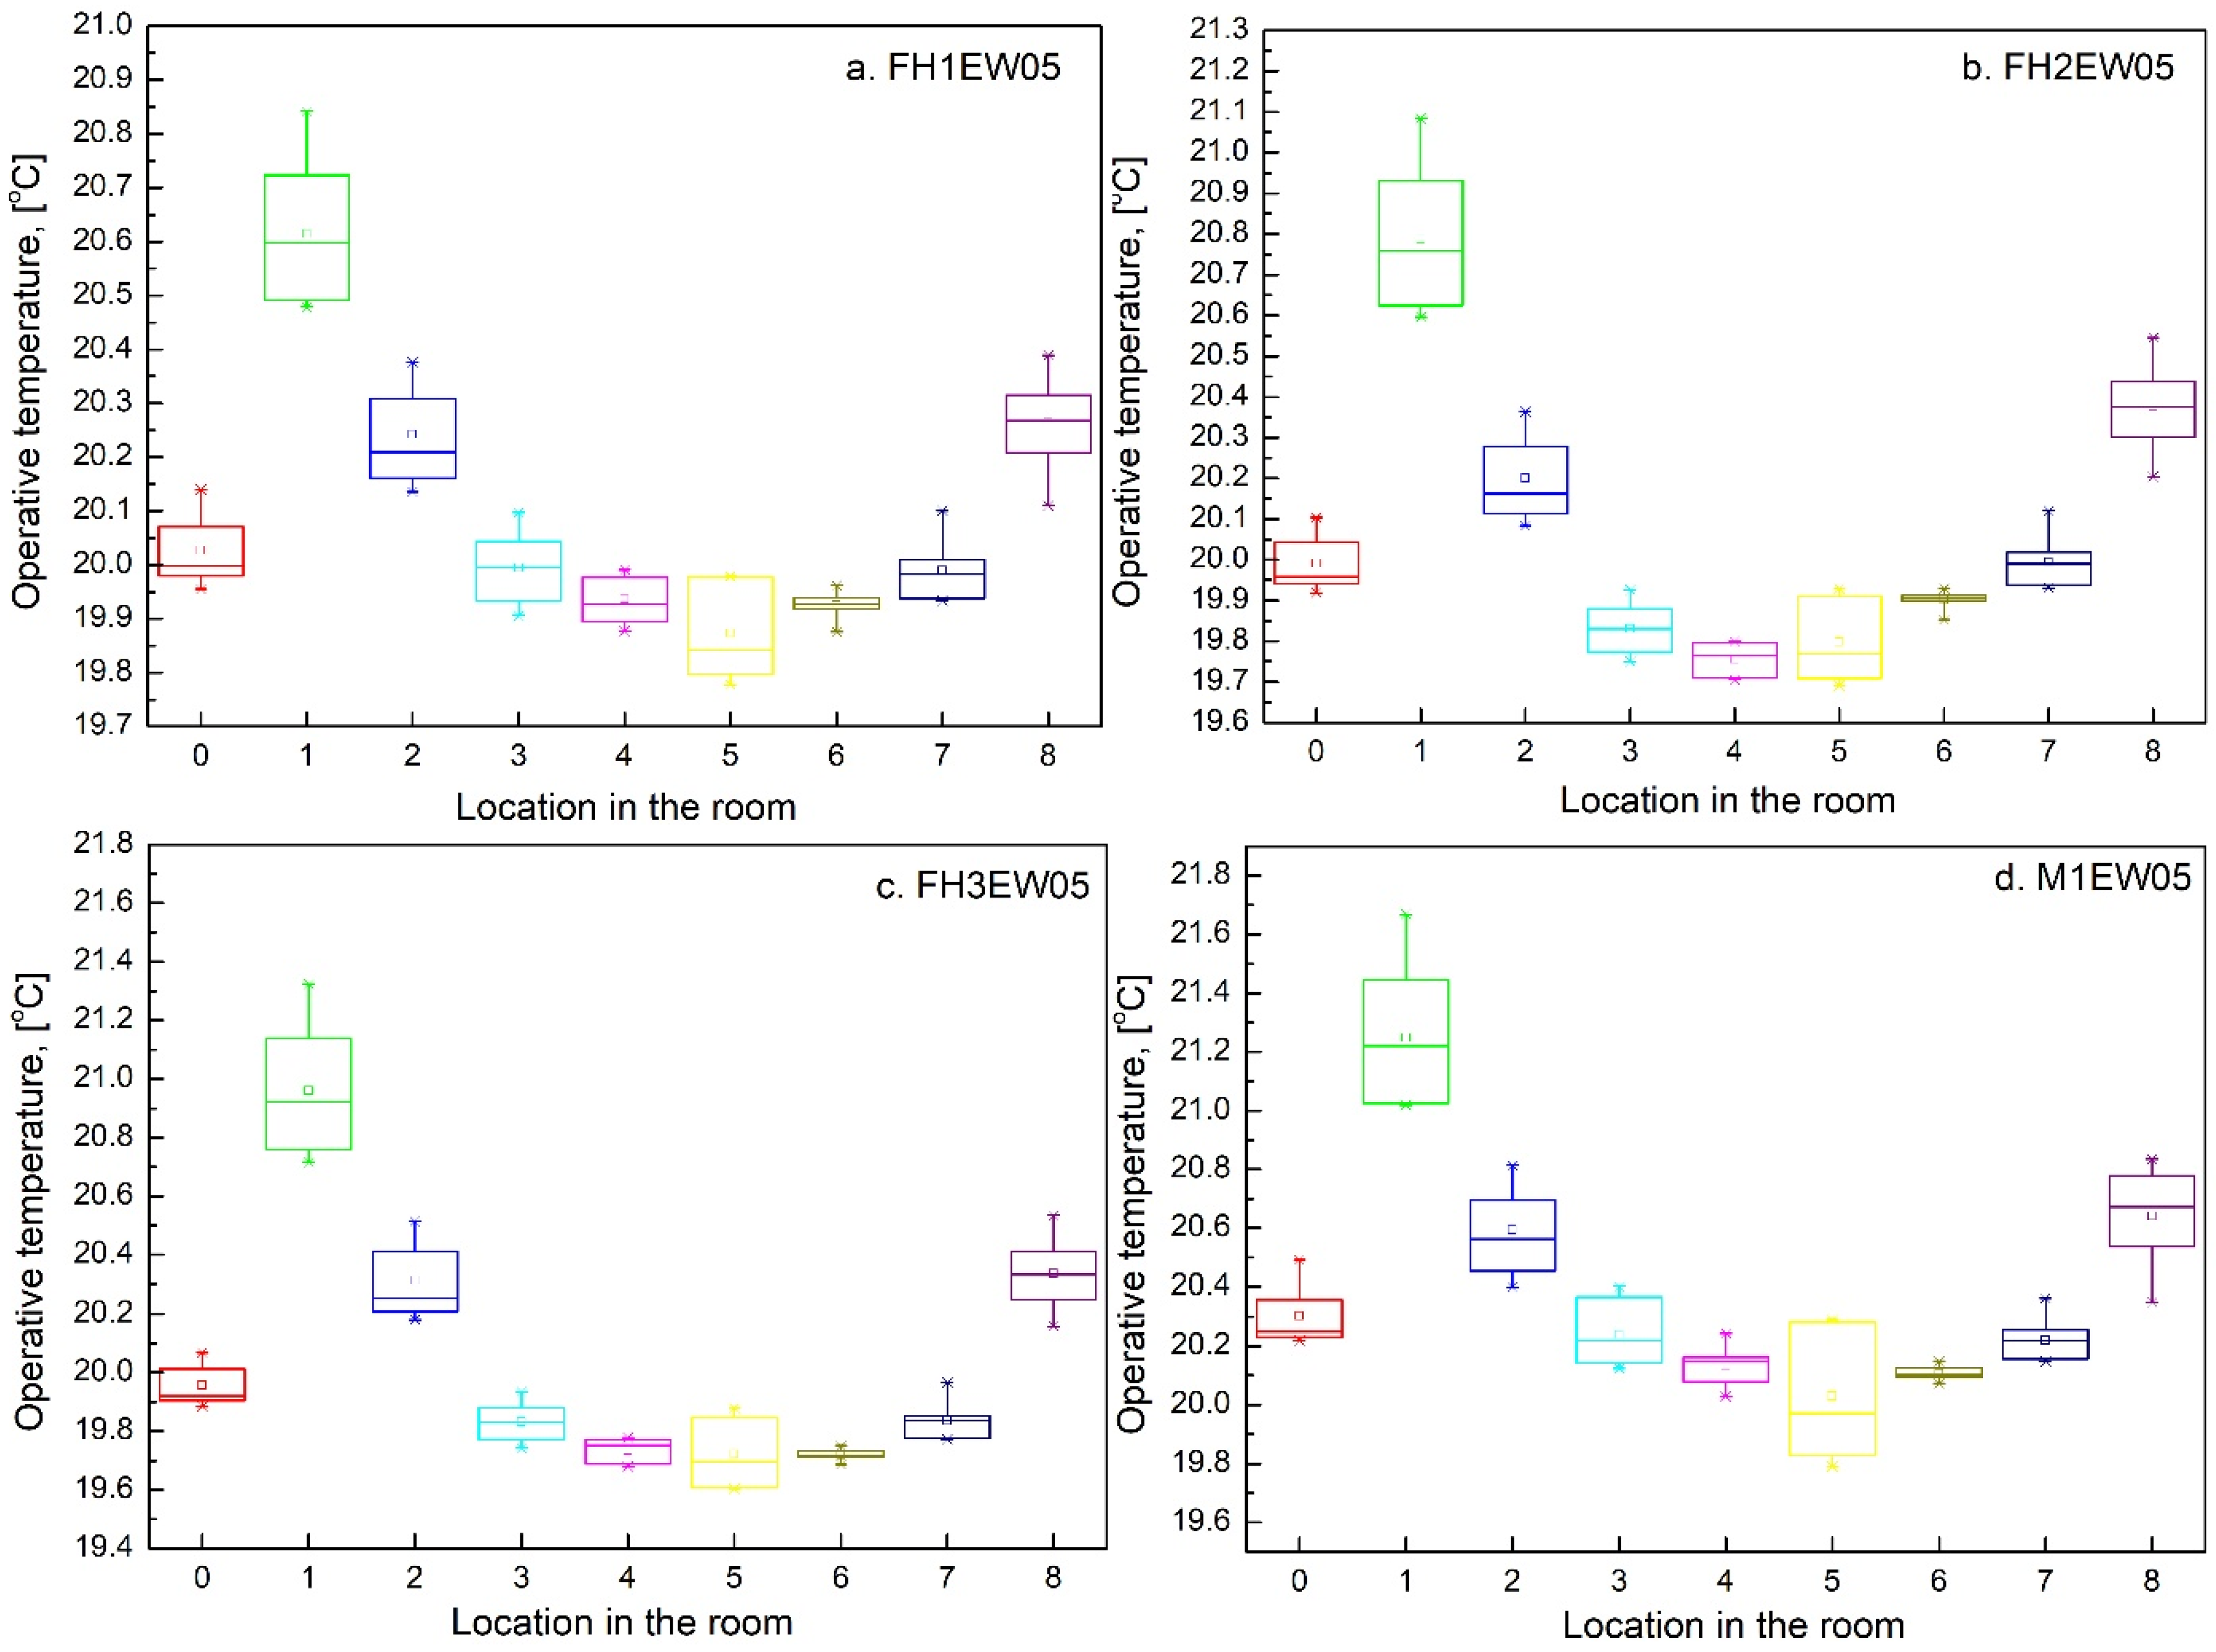
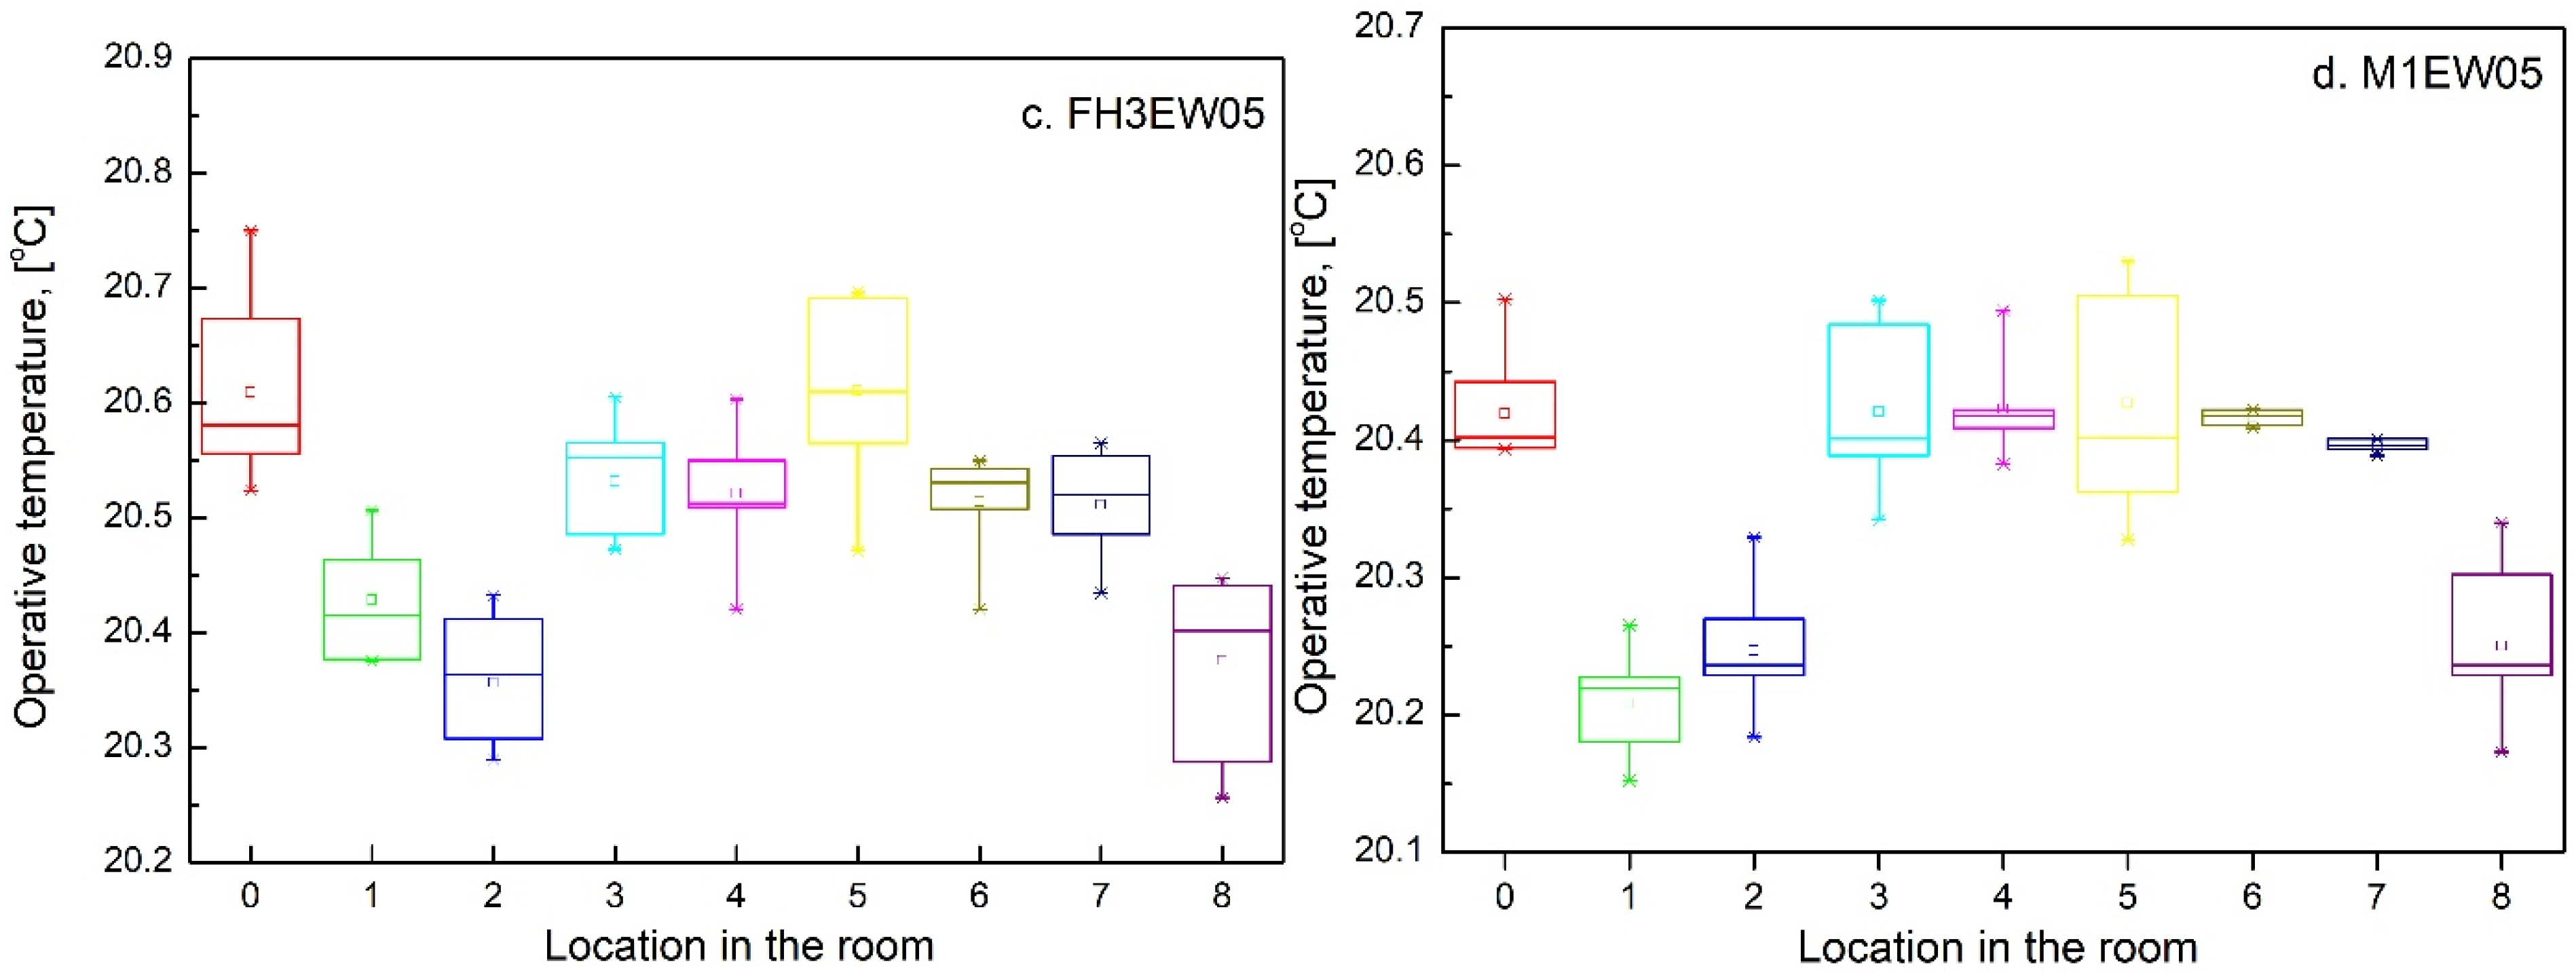
It can be seen that the floor temperatures are higher for smaller rooms. The operative temperatures in different locations of the analysed rooms are shown in Figure 8. For the graphical presentation of the results, the boxplot method was chosen. A boxplot displays five sample quantiles: the minimum, lower quartile, median, upper quartile, and maximum. For a certain location, the statistical dataset was provided by different geometries. Obviously, in the locations closest to the radiator (1, 2, 8), the highest operative temperatures were observed, while in location 5, the lowest operative temperature was observed. The effect of the cold window is neutralised by the warm radiator. Moreover, because of the high angle factors at location 1, the effect of the warm radiator on the operative temperature is pronounced, resulting in the highest operative temperatures. The operative temperatures obtained in the middle of the room (location 0) differed significantly from the average of the operative temperature values obtained at all the analysed locations. Furthermore, it can be seen that the number of external walls influences the operative temperatures in different locations of the rooms (e.g., the operative temperature in location 1 increases while the operative temperatures in locations 4 and 5 decrease). Increasing the number of external walls increases the room’s heat demand. For a similarly sized room in a family house, this will lead to a higher mean radiator temperature. This higher temperature will result in a higher operative temperature at location 1. When a room is located at an intermediate level in a multifamily building and has only one external wall, the operative temperatures are as high as those in a room with three external walls in a family house. This is because the room has only one cold wall with a window, whereas in the family house, with three external walls, only one wall is an internal wall; all other building elements are “cold”.
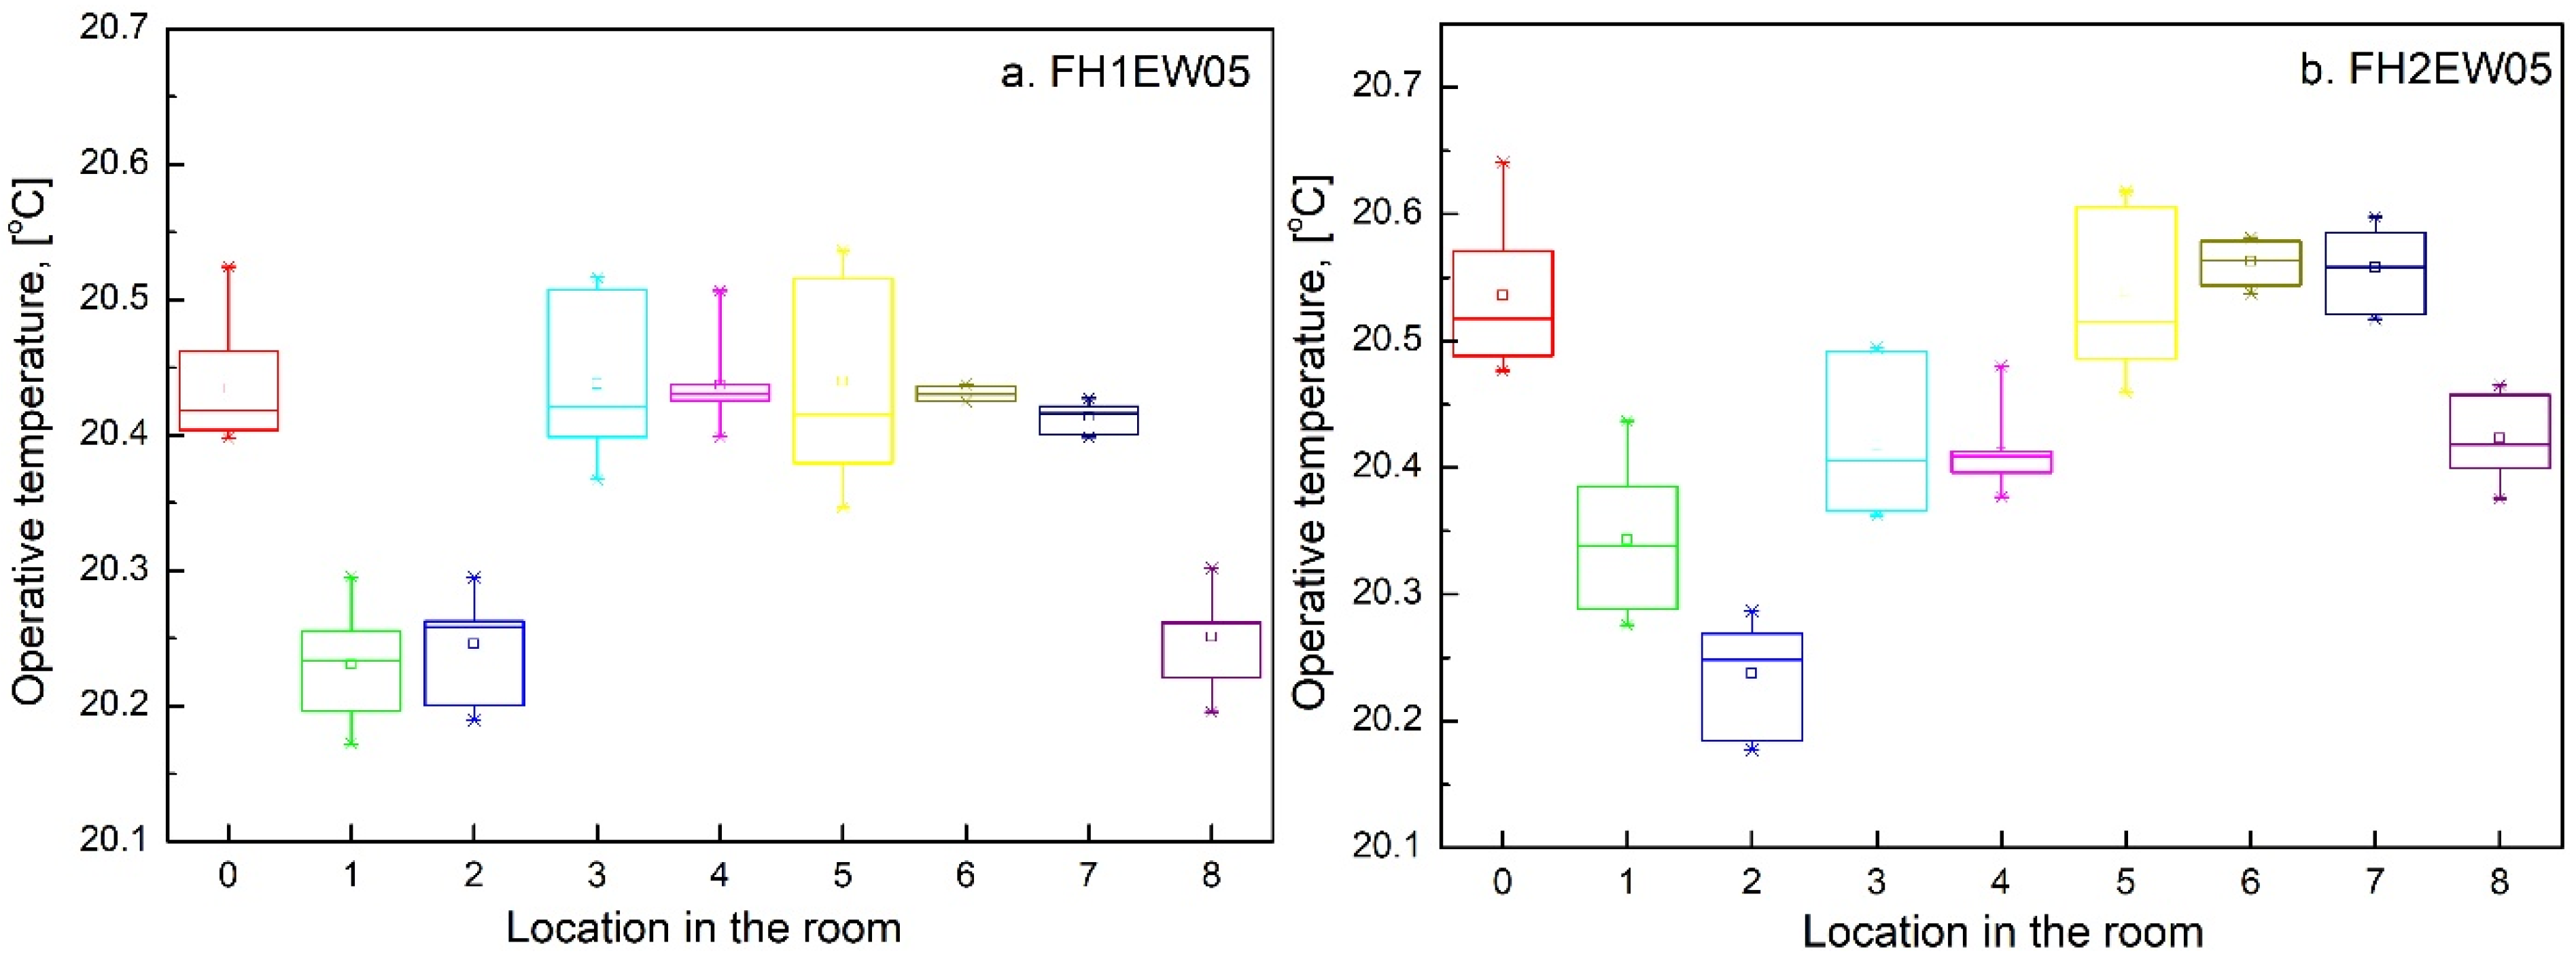
The operative temperatures in floor-heated rooms are presented in Figure 9. For a certain location, the statistical dataset was provided by different geometries.
In this case, the cold effect of the window and external walls is not compensated by the radiator, so the locations with the lowest operative temperatures are 1, 2, and 8.
The mean, minimum and maximum operative temperature values across the nine locations in a room with 3.0 m × 3.0 m × 2.7 m dimensions, two external walls and a 0.5 W/m2K U-value each are presented in Table 2.
It should be noted that in the case of radiator heating:
-
If the U-value decreases, the minimum and mean operative temperatures increase, while the maximum temperature decreases.
-
Increasing the size of the room decreases the mean and maximum operative temperatures, while the minimum temperature increases.
-
If the room has only one external wall, the minimum and mean operative temperatures increase, while the maximum operative temperature decreases. If the room has three external walls, the maximum values increase, while the minimum and mean values decrease.
In the case of floor heating:
-
If the U-value of the external walls decreases, the mean and maximum operative temperatures decrease, and the minimum temperatures increase;
-
As the room size increases, the mean and maximum operative temperatures decrease, while the minimum operative temperatures increase.
-
If the room has only one external wall, the minimum, mean, and maximum operative temperatures decrease. On the contrary, if the room has three external walls, the minimum, mean, and maximum operative temperatures increase.
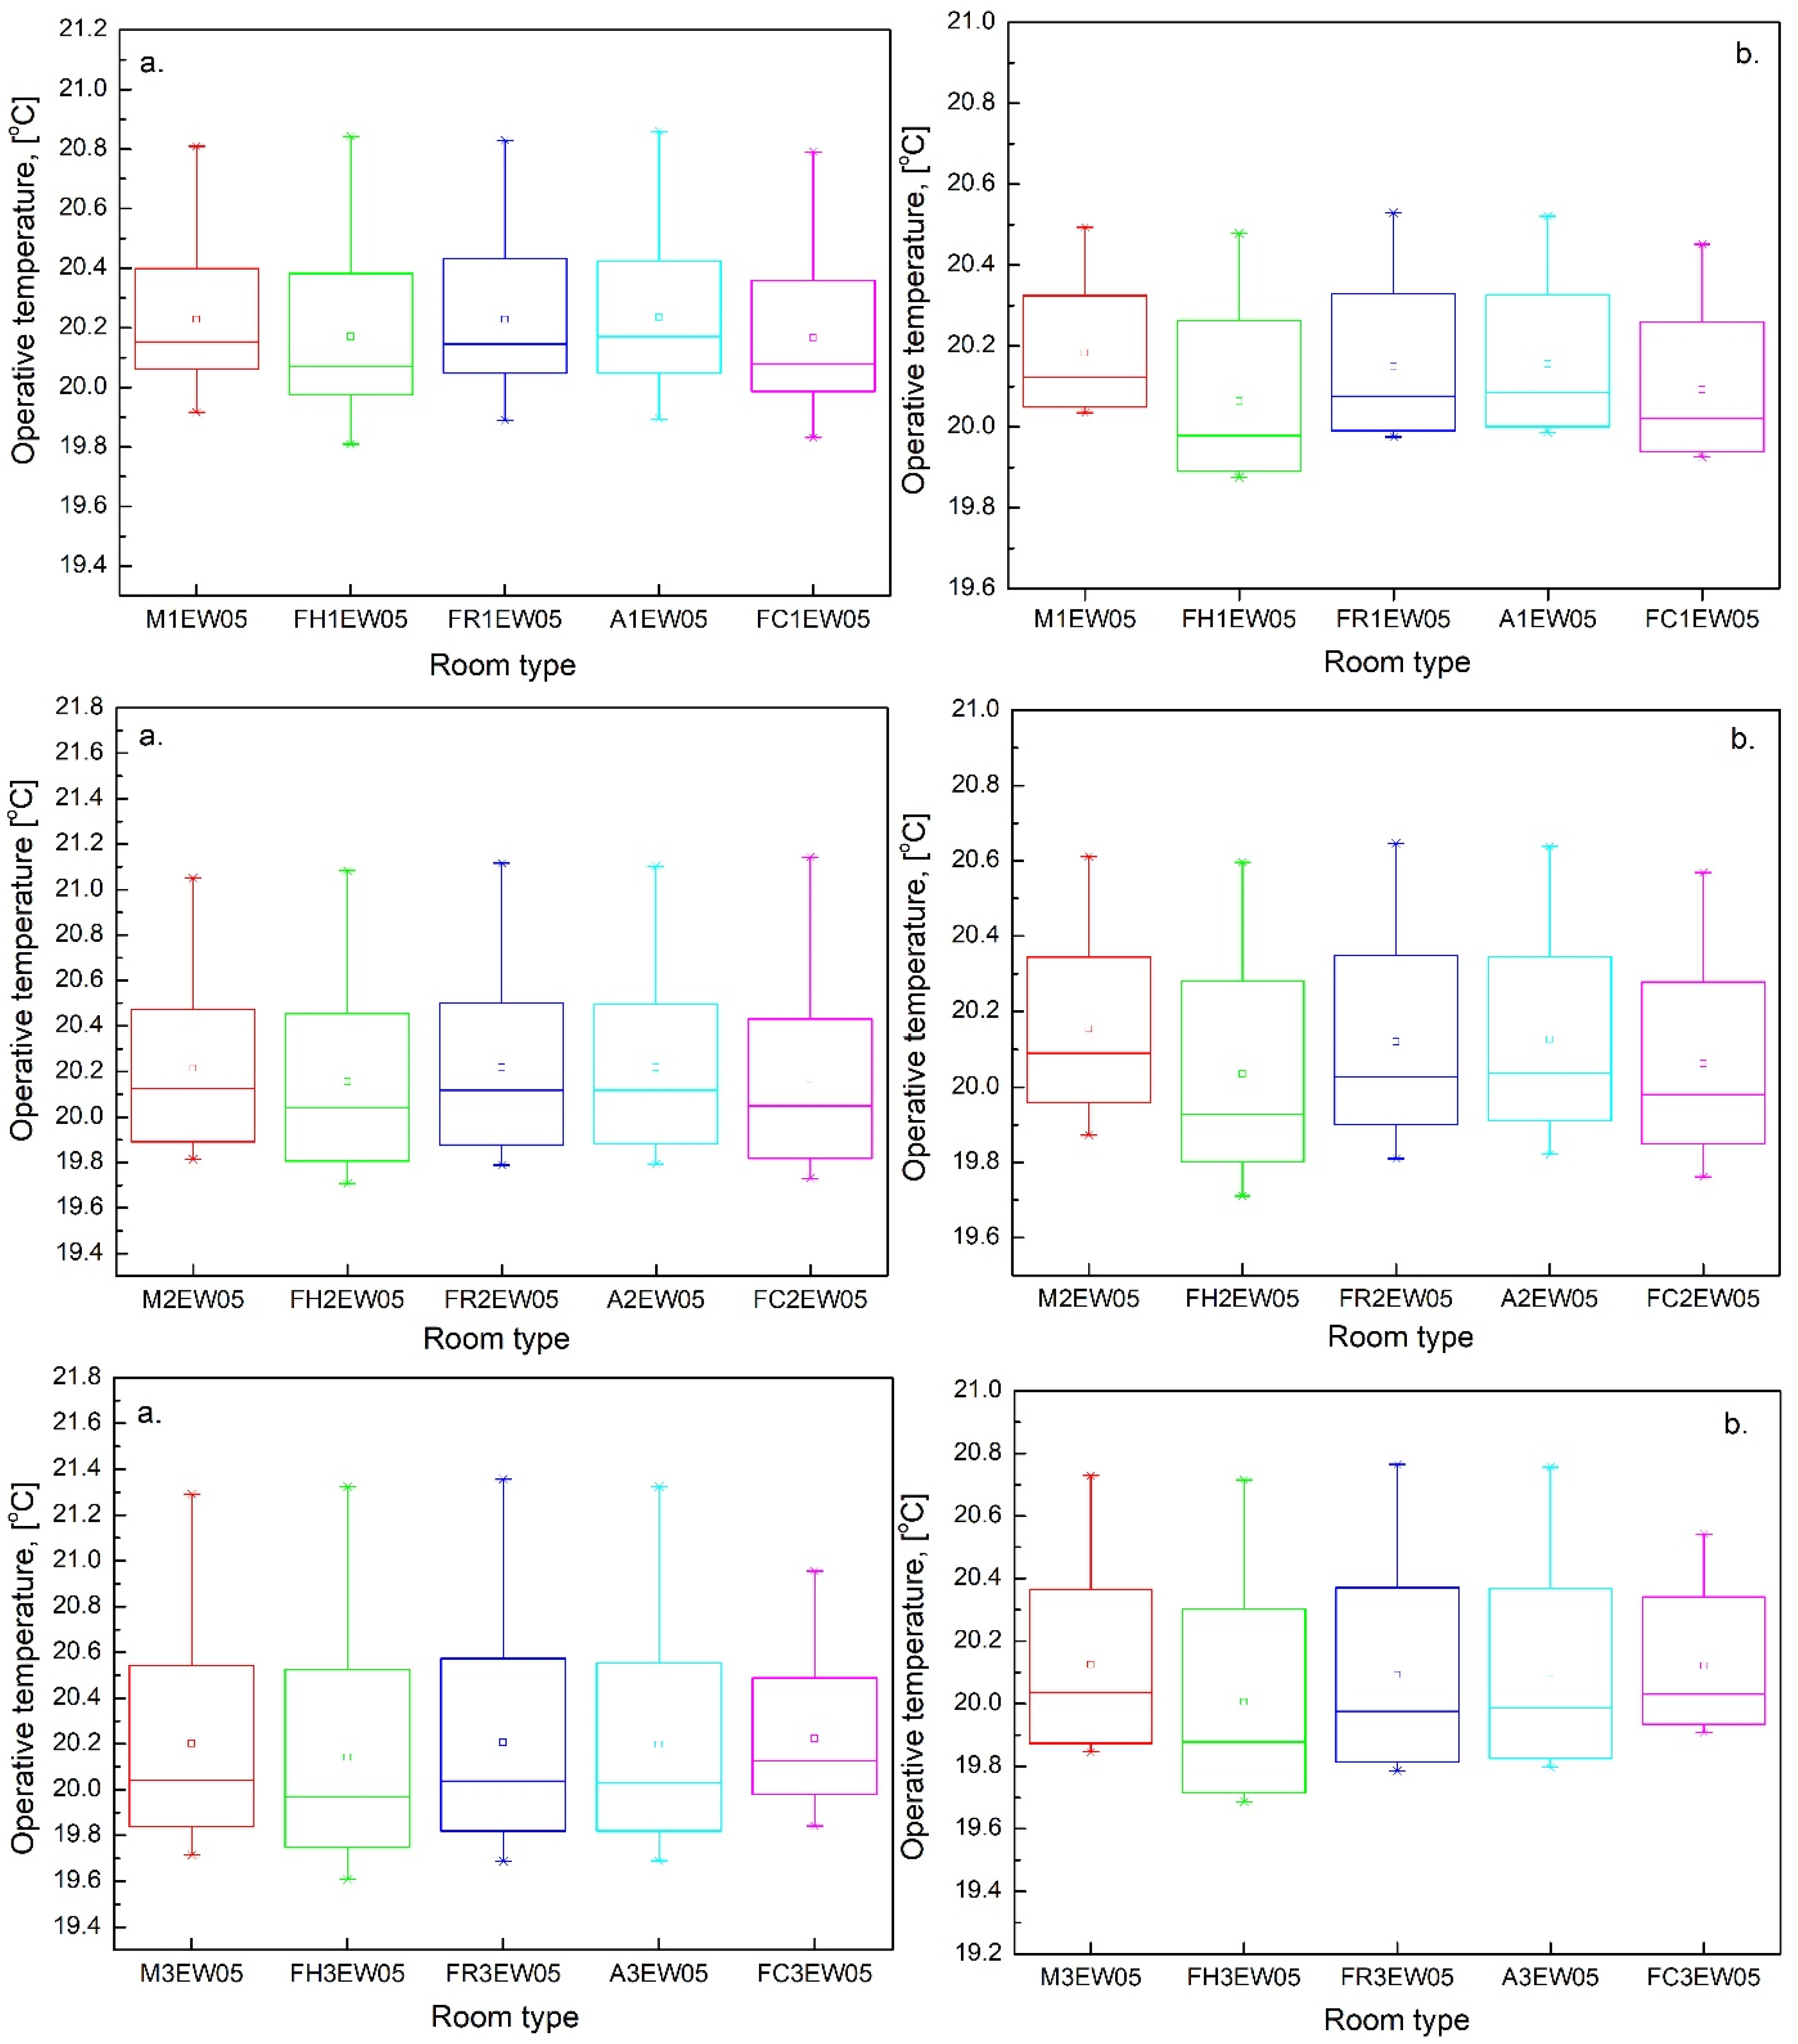
The operative temperatures in radiator-heated rooms with different positions of the room in the building can be seen in Figure 10 (a.: 3.0 m × 3.0 m × 2.7 m; b.: 6.0 m × 6.0 m × 2.7 m). For statistics, the dataset of operative temperatures is given by locations in the rooms.
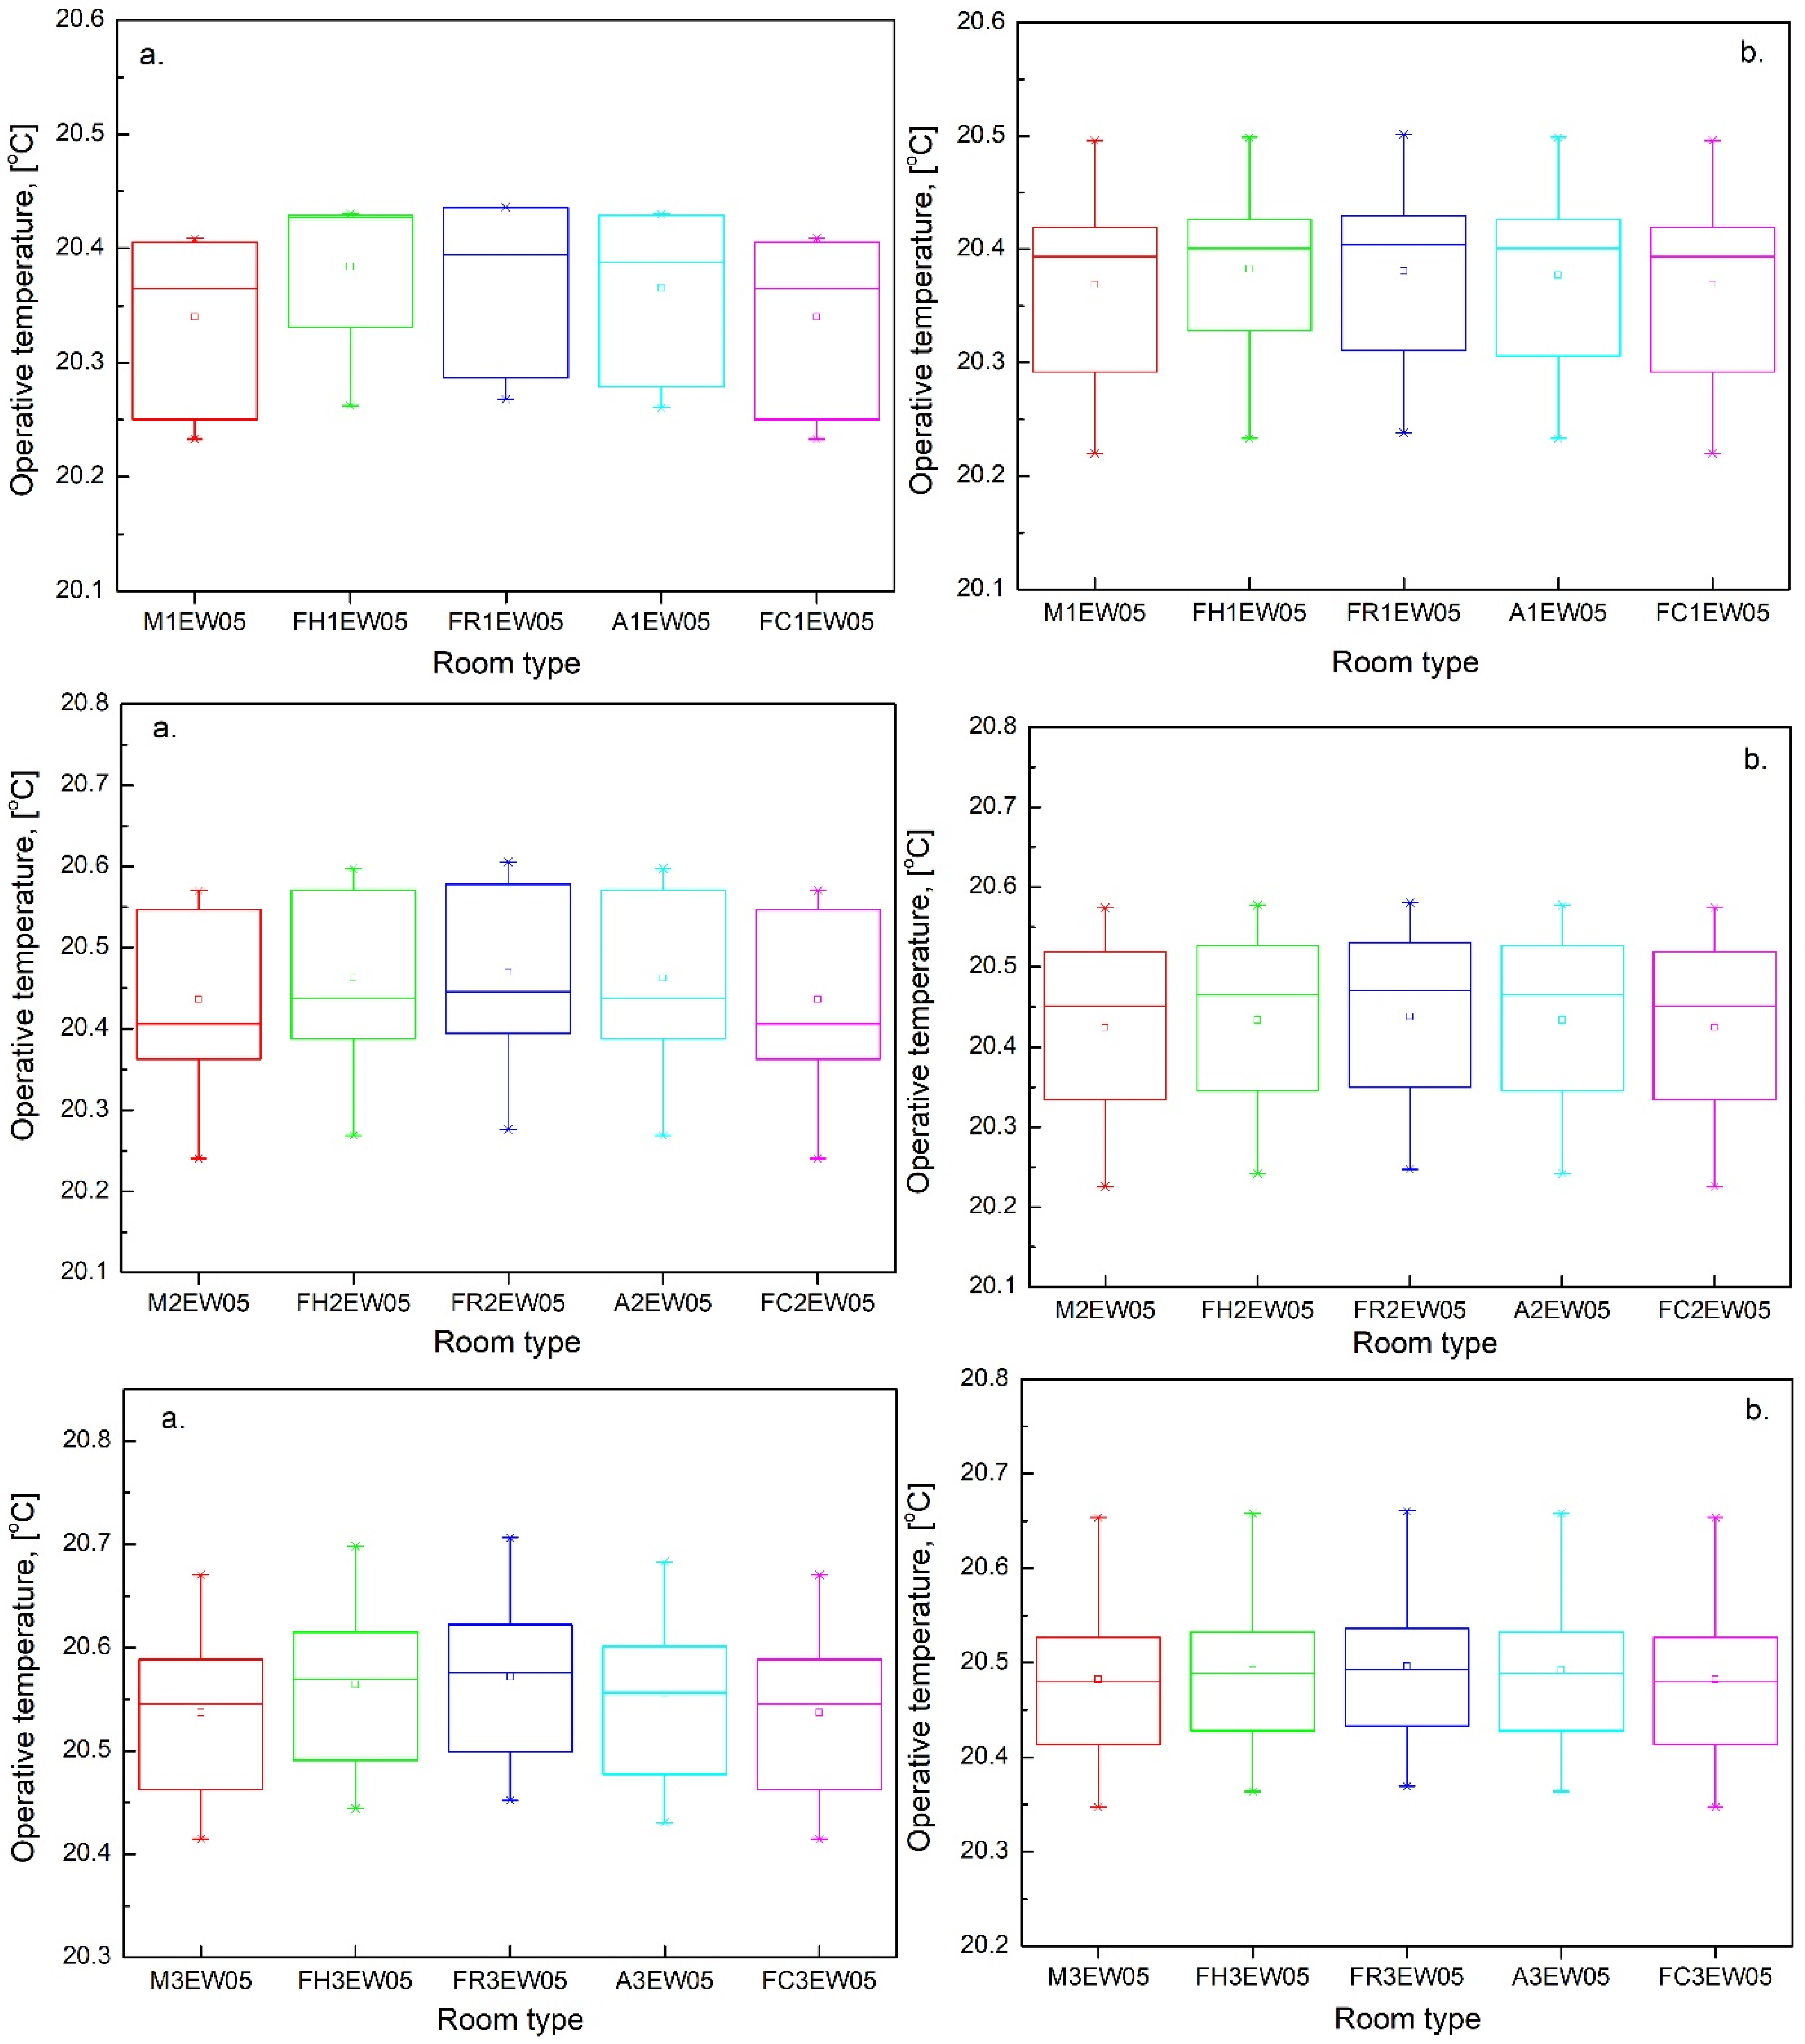
The operative temperatures in the floor-heated rooms with different positions of the room in the building can be seen in Figure 11 (a.: 3.0 m × 3.0 m × 2.7 m; b.: 6.0 m × 6.0 m × 2.7 m). For statistics, the dataset of operative temperatures is given by the locations in the rooms.
It can be observed that, for a given number of external walls, there is no significant difference in the operative temperatures.
It can be observed that the differences in operative temperatures are significant between rooms with one, two, or three external walls. As the room’s net floor area increases, the influence of vertical surfaces decreases while that of horizontal surfaces increases (the internal height is always 2.7 m). Because the operative temperature is analysed for a sitting person (0.6 m from the floor), the increase in floor area leads to a higher floor angle factor. This would be advantageous for floor heating. In larger rooms, the heat demand is higher, but the floor area is larger as well, so the floor temperature decreases. Ultimately, in larger rooms, the operative temperature will decrease at the same locations. By contrast, in radiator-heated rooms, the operative temperature discrepancies between locations 1 and 5 will increase in larger rooms. This is because higher heat demand leads to higher supply temperatures, and in locations close to the radiator, the operative temperature increases. However, the effect of the warm radiator decreases at locations 4, 5, and 6 due to the lower angle factors there.

4. Discussion

The heat demand of a room during the heating period can be met by various heating systems: radiators, floor heating, wall heating, fan coils, etc. Our research focused on the radiator and floor heating modes. Because of the larger heating surface and a higher heat delivered by radiation, a higher mean radiant temperature is obtained in the case of floor heating than in the case of radiator heating. Moreover, the supply and return temperatures required for floor heating are lower than those for radiator heating. This will lead to higher energy efficiency in condensing boilers and heat pumps, and lower heat losses in distribution pipes. However, the auxiliary heat losses of the embedded heating layers should not be forgotten [40,41,42]. When the energy performance of heating systems is compared, in most cases, the operative temperatures in the heated room or building are not analysed. However, this is extremely important. How can two heating modes be compared if the operative temperatures in the heated spaces differ? Nevertheless, there are a few exceptions. Sarbu and Sebarchievici compared the radiator and floor heating systems and provided data on the mean radiant temperature and the predicted mean vote along a line at different distances from the window [27]. However, there is no information about other locations in the room in the occupational zone. This research proved that there are significant differences between the operative temperatures in different locations in a room. In the case of radiator heating, the operative temperatures were highest at the locations close to the radiator. On the contrary, if a floor heating system is used, the operative temperatures will be lowest in these locations due to the cool window. Moreover, if the goal is to achieve similar operative temperatures in the middle of the room, with radiator heating, the radiator’s mean temperature should be increased [29]. As a result, the operative temperatures in locations close to the radiator will also increase, so in certain locations the differences between the operative temperatures provided by the analysed heating systems will increase further. Mihren and Holmberg used computational fluid dynamics (CFD) simulations to show the temperature distribution in a room with wall, floor, and radiator heating under different ventilation modes, and presented their results across multiple vertical planes [42]. The simulation was performed mainly to analyse airflow patterns in the room, not to compare operative temperatures across different heating systems. However, their results align well with those from this study and demonstrate the need for a comprehensive comfort analysis when comparing the energy performance of different heating systems.

5. Conclusions

Energy saving and reduction in environmental pollution are two of the most important goals in the building sector. Despite stringent requirements related to the energy performance of buildings, heating accounts for the largest share of a building’s total energy consumption. Many studies have analysed and compared different heating systems (all-air, radiator, and low-temperature radiant) to identify the concept that minimises energy consumption. However, most of these studies ignored that heating systems should provide similar thermal comfort conditions in the heated rooms.
For radiator heating in the locations closest to the radiator (1, 2, 8), the highest operative temperatures have been obtained, while in location 5, the operative temperature was the lowest. The operative temperature at the midpoint of the room (location 0) differs significantly from the average operative temperature across all analysed locations. Furthermore, the number of external walls influences operative temperatures across different room locations (e.g., the operative temperature in location 1 increases, while the operative temperatures in locations 4 and 5 decrease).
In the case of floor heating, when the room has only one external wall, the lowest operative temperature is recorded at location 1 due to the external wall and the “cold” window. As the number of external walls increases, the operative temperature decreases in locations near the external corners.
The conducted research proved that:
-
The differences in operative temperatures across different locations in a radiator-heated room are significant.
-
The differences in operative temperatures across different locations in a floor-heated room are significant.
-
The number of external walls (one, two or three) has a significant effect on the operative temperatures in a heated room.
-
The differences between the operative temperatures at the same location in a heated room with different dimensions can be significant.
-
The differences in mean operative temperatures in a room (radiator-heated or floor-heated) are not significant across different positions in a multilevel building (ground floor, intermediate level, or top level).
-
Using statistics is misleading, because no significant difference between the mean operative temperatures in rooms with different positions or geometries can be detected, regardless of the heating method used. The operative temperatures in two rooms can differ significantly in most locations, even when they are identical at the centre of each room. Moreover, the thermal comfort in two rooms can differ across most locations, even when their mean operative temperatures are identical.
Different heating modes should be compared carefully, taking into account the indoor comfort parameters of the heated rooms. Providing similar operative temperatures across multiple locations in a room using different heating modes is practically impossible. Still, a complex analysis should be conducted, and efforts should be made to ensure similar operative temperatures at the most critical locations. Critical locations are the positions of occupants in the heated space that, according to the room layout, are closest to the surfaces with the highest or lowest temperatures. These critical locations depend on the room dimensions, the number and U-values of the external walls, and the heating system used.

Limitations and Further Work

This work presents some limitations: only two heating systems are compared, and only seven floor-area geometries (all square) are analysed. For this reason, general conclusions about the operative temperature distribution in heated spaces that apply to all heating systems cannot be drawn. The research must continue analysing more geometries and heating systems. A methodology has to be developed which helps scholars, engineers, and stakeholders to compare different heating systems appropriately.

Author Contributions

Conceptualisation: F.K. and T.K.; Methodology: F.K. and T.K.; Investigation: F.K., S.H. and T.K.; Data Curation: S.H. and T.K.; Writing—Original Draft Preparation: F.K., S.H. and T.K.; Writing—Review and Editing: F.K., S.H. and T.K.; Visualisation: S.H. and T.K.; Supervision: F.K. All authors have read and agreed to the published version of the manuscript.

Funding

This research received no external funding. The APC was funded by the University of Debrecen.

Data Availability Statement

The raw data supporting the conclusions of this article will be made available by the authors on request.

Acknowledgments

Supported by the University of Debrecen Programme for Scientific Publication.

Conflicts of Interest

The authors declare no conflicts of interest.

Nomenclature

PMVpredicted mean vote
Uoverall heat transfer coefficient, [W/m2K]
FHroom in a family house
FCroom with floor slab above unheated ceiling
FRroom below a flat roof
Aroom below unheated attic
Mroom at mid-level of a multifamily building
tln0nominal logarithmic temperature difference, [K]
tlnlogarithmic temperature difference, [K]
Qradthe heat delivered by radiator (equal to the demand of the analysed room), [W]
Qradothe heat delivered by the radiator under nominal conditions (given in the design catalogue), [W]
tsupplysupply temperature of the central heating system, [°C]
treturnreturn temperature of the central heating system, [°C]
tiindoor set point temperature, [°C]
nthe radiator exponent
Δ t d r o p the difference between supply and return temperatures, [K]
correction factor
tradiatormean radiator temperature, [°C]
tfloormean floor temperature, [°C]
Qfloorthe heat delivered by floor heating, [W]
Afloorthe net floor area of the analysed room, [m2]
htotthe total heat transfer coefficient [W/m2K]
t ¯ r the mean radiant temperature in the room, [°C]
tclmean temperature of clothing surface and human body non covered with clothing, [°C]
tooperative temperature, [°C]
hcconvective heat transfer coefficient of the human body, [W/m2K]
hrradiant heat transfer coefficient of the human body, [W/m2K]
Arthe effective radiant surface of the human body, [m2]
ADuDu Bois surface of the human body, [m2]
εemission coefficient of clothing surface and human body uncovered by clothing

Appendix A

The code for a room has three segments. The first segment (a) indicates the building type or the room’s placement within the building. The second segment (b) indicates the number of external walls, while the third segment (c) indicates the U-value of the external walls.
  • The analysed room can be placed either in a single-family house or in a multilevel apartment building. In the latter case, the room can be placed on the ground floor (with a slab above the cellar), mid-level, or top level (with a flat roof or a slab under the attic).
The codes are:
Single houseFH
Ground floor of a multi-story buildingFC
Mid-level of a multi-story buildingM
Top level of a multi-story building with a slab under the atticA
Top level of a multi-story building with flat roofFR
b.
The room can have one, two or three external walls. The codes are:
One external wall1EW
Two external walls2EW
Three external walls3EW
c.
The U-value of external walls can be either 0.1 W/m2K; 0.2 W/m2K; 0.3 W/m2K; 0.4 W/m2K; or 0.5 W/m2K. The codes are:
U = 0.1 W/m2K01
U = 0.2 W/m2K02
U = 0.3 W/m2K03
U = 0.4 W/m2K04
U = 0.5 W/m2K05
Code FC2EW03 denotes a room on the ground floor of a multilevel apartment building with two external walls, each with a U-value of 0.3 W/m2K. Code FR3EW01 denotes a room at the top of a multilevel apartment building with a flat roof, having three external walls, each with a U-value of 0.1 W/m2K.

References

  1. Directive 2002/91/EC of the European Parliament and of the Council of 16 December 2002 on the Energy Performance of Buildings. Official Journal of the European Communities, 4 January 2003.
  2. Directive (EU) 2024/1275 of the European Parliament and of the Council of 24 April 2024 on the Energy Performance of Buildings. Official Journal of the European Union, 8 May 2024.
  3. Ürge-Vorsatz, D.; Cabeza, L.F.; Serrano, S.; Barreneche, C.; Petrichenko, K. Heating and cooling energy trends and drivers in buildings. Renew. Sustain. Energy Rev. 2015, 41, 85–98. [Google Scholar] [CrossRef]
  4. González-Torres, M.; Pérez-Lombard, L.; Coronel, J.F.; Maestre, I.R.; Yan, D. A review on buildings energy information: Trends, end-uses, fuels and drivers. Energy Rep. 2022, 8, 626–637. [Google Scholar] [CrossRef]
  5. Wang, C.; Song, J.; Shi, D.; Reyna, J.L.; Horsey, H.; Feron, S.; Zhou, Y.; Ouyang, Z.; Li, Y. Impacts of climate change, population growth, and power sector decarbonization on urban building energy use. Nat. Commun. 2023, 14, 6434. [Google Scholar] [CrossRef] [PubMed]
  6. Laskari, M.; de Masi, R.F.; Karatasou, S.; Santamouris, M.; Assimakopoulos, M.N. On the impact of user behaviour on heating energy consumption and indoor temperature in residential buildings. Energy Build. 2022, 255, 111657. [Google Scholar] [CrossRef]
  7. Yang, K.; Chai, Y.; Du, N.; Li, J.; Huo, Z.; Chen, Y. Conventional exergy and advanced exergy analysis of an innovative combined cooling, heating, and power system coupling solar-powered hydrogen production with fuel cell integration. Energy Convers. Manag. 2025, 346, 120440. [Google Scholar] [CrossRef]
  8. Said, M.A.; Aljibori, H.S.S.; Abed, A.M.; Togun, H.; Mohammed, H.I.; Mahdi, J.M.; Rahbari, A.; Sadeq, A.M.; Talebizadehsardari, P. Innovative pipe profile configurations for fast charging of phase change material in compact thermal storage systems for building heating applications. Case Stud. Therm. Eng. 2025, 69, 106036. [Google Scholar] [CrossRef]
  9. Jiang, L.; Sun, K.; Shen, X.; Bo, Y.; Liu, X.; Liu, H.; Zhang, Y.; Lei, H. An Innovative Rural Heating System Utilizing Coupled Cascade Thermal Storage: A Performance Analysis. Energy Sci. Eng. 2026, 14, 2307–2317. [Google Scholar] [CrossRef]
  10. Olympios, A.V.; Kourougianni, F.; Arsalis, A.; Papanastasiou, P.; Pantaleo, A.M.; Markides, C.N.; Georghiou, G.E. A holistic framework for the optimal design and operation of electricity, heating, cooling and hydrogen technologies in buildings. Appl. Energy 2024, 370, 123612. [Google Scholar] [CrossRef]
  11. Zhang, C.; Xie, Y.; Zhang, H.; Gu, Y.; Zhang, X. Optimal design and performance assessment for a solar powered electricity, heating and hydrogen integrated energy system. Energy 2023, 262, 125453. [Google Scholar]
  12. Lu, S.; Jia, Y.; Liang, B.; Wang, R.; Lin, Q.; He, Z. Optimal design and thermal performance study of a two-stage latent heat thermal energy storage technology for heating systems. Appl. Therm. Eng. 2023, 232, 121073. [Google Scholar] [CrossRef]
  13. Yang, X.; Pan, L.; Guan, W.; Tian, Z.; Wang, J.; Zhang, C. Optimization of the configuration and flexible operation of the pipe-embedded floor heating with low-temperature district heating. Energy Build. 2022, 269, 112245. [Google Scholar] [CrossRef]
  14. Zdravkovic, M.; Ciric, I.; Ignjatovic, M. Explainable heat demand forecasting for the novel control strategies of district heating systems. Annu. Rev. Control 2022, 53, 405–413. [Google Scholar] [CrossRef]
  15. Sun, T.; Wu, Y.; Qian, X.; Wang, B. Interval optimal scheduling method of integrated energy system with ground source heat pump based on quantum derivative algorithm. Energy Rep. 2025, 13, 4151–4161. [Google Scholar] [CrossRef]
  16. Csontos, M.; Csík, A.; Lakatos, A. Analysis of the thermal properties of sprayed polyurethane foams with and without aerogel incorporation. Int. Commun. Heat Mass Transf. 2026, 174, 110947. [Google Scholar] [CrossRef]
  17. Kalmár, F.; Bodó, B.; Li, B.; Kalmár, T. Decarbonization Potential of Energy Used in Detached Houses—Case Study. Buildings 2024, 14, 1824. [Google Scholar] [CrossRef]
  18. Martinopoulos, G.; Papakostas, K.T.; Papadopoulos, A.M. A comparative review of heating systems in EU countries, based on efficiency and fuel cost. Renew. Sustain. Energy Rev. 2018, 90, 687–699. [Google Scholar] [CrossRef]
  19. Martinopoulos, G.; Papakostas, K.T.; Papadopoulos, A.M. Comparative analysis of various heating systems for residential buildings in Mediterranean climate. Energy Build. 2016, 124, 79–87. [Google Scholar] [CrossRef]
  20. Obyn, S.; van Moeseke, G. Comparison and discussion of heating systems for single-family homes in the framework of a renovation. Energy Convers. Manag. 2014, 88, 153–167. [Google Scholar] [CrossRef]
  21. Ovchinnikov, P.; Borodinecs, A.; Strelets, K. Utilization potential of low temperature hydronic space heating systems: A comparative review. Build. Environ. 2017, 112, 88–98. [Google Scholar] [CrossRef]
  22. Oravec, J.; Sikula, O.; Krajcík, M.; Arici, M.; Mohapl, M. A comparative study on the applicability of six radiant floor, wall, and ceiling heating systems based on thermal performance analysis. J. Build. Eng. 2021, 36, 102133. [Google Scholar] [CrossRef]
  23. Bojic, M.; Cvetkovic, D.; Marjanovic, V.; Blagojevic, M.; Djordjevic, Z. Performances of low temperature radiant heating systems. Energy Build. 2013, 61, 233–238. [Google Scholar] [CrossRef]
  24. Pineau, D.; Rivière, P.; Stabat, P.; Hoang, P.; Archambault, V. Performance analysis of heating systems for low energy houses. Energy Build. 2013, 65, 45–54. [Google Scholar] [CrossRef]
  25. Wang, Z.; Luo, M.; Geng, Y.; Lin, B.; Zhu, Y. A model to compare convective and radiant heating systems for intermittent space heating. Appl. Energy 2018, 215, 211–226. [Google Scholar] [CrossRef]
  26. Vadiee, A.; Dodoo, A.; Jalilzadehazhari, E. Heat Supply Comparison in a Single-Family House with Radiator and Floor Heating Systems. Buildings 2020, 10, 5. [Google Scholar] [CrossRef]
  27. Sarbu, I.; Sebarchievici, C. A study of the performances of low-temperature heating systems. Energy Effic. 2015, 8, 609–627. [Google Scholar] [CrossRef]
  28. Wu, X.; Fang, L.; Olesen, B.W.; Zhao, J.; Wan, F. Comparison of indoor air distribution and thermal environment for different combinations of radiant heating systems with mechanical ventilation systems. Build. Serv. Eng. Res. Technol. 2018, 39, 81–97. [Google Scholar] [CrossRef]
  29. Kalmar, T.; Bodo, B.; Han, S.; Li, B.; Kalmar, F. Comparative analysis of energy demand at an equal operative temperature in the case of radiator and low-temperature radiant heating. J. Build. Eng. 2025, 100, 111792. [Google Scholar] [CrossRef]
  30. Yang, L.; Zmeureanu, R.; Rivard, H. Comparison of environmental impacts of two residential heating systems. Build. Environ. 2008, 43, 1072–1081. [Google Scholar] [CrossRef]
  31. Chen, C.; Zhang, Y.; Ma, L. Assessment for central heating systems with different heat sources: A case study. Energy Build. 2012, 48, 168–174. [Google Scholar] [CrossRef]
  32. Tassou, S.A.; Marquand, C.J.; Wilson, D.R. Energy and Economic Comparisons of Domestic Heat, Pumps and Conventional Heating Systems in the British Climate. Appl. Energy 1986, 24, 127–138. [Google Scholar] [CrossRef]
  33. Mahmoud, M.; Ramadan, M.; Naher, S.; Pullen, K.; Olabi, A.G. The impacts of different heating systems on the environment: A review. Sci. Total Environ. 2021, 766, 142625. [Google Scholar] [CrossRef]
  34. Self, S.J.; Reddy, B.V.; Rosen, M.A. Geothermal heat pump systems: Status review and comparison with other heating options. Appl. Energy 2013, 101, 341–348. [Google Scholar] [CrossRef]
  35. Kazanci, O.B.; Shukuya, M.; Olesen, B.W. Exergy performance of different space heating systems: A theoretical study. Build. Environ. 2016, 99, 119–129. [Google Scholar] [CrossRef]
  36. MSZ EN 12831-1:2017; Energy Performance of Buildings—Method for Calculation of the Design Heat Load—Part 1: Space Heating Load, Module M3-3. Hungarian Committee of Standardisation: Budapest, Hungary, 2017.
  37. Shinoda, J.; Kazanci, O.B.; Tanabe, S.; Olesen, B.W. A review of the surface heat transfer coefficients of radiant heating and cooling systems. Build. Environ. 2019, 159, 106156. [Google Scholar] [CrossRef]
  38. Fanger, P.O. Thermal Comfort: Analysis and Applications in Environmental Engineering; Danish Technical Press: Copenhagen, Denmark, 1970. [Google Scholar]
  39. ANSI/ASHRAE Standard 55-2017; Thermal Environmental Conditions for Human Occupancy. American National Standards Institute: Washington, DC, USA, 2017.
  40. Kalmár, T.; Bodó, B.; Kalmár, F. Heat losses of low-temperature radiant heating systems. Energy Rep. 2023, 10, 1982–1995. [Google Scholar] [CrossRef]
  41. Shin, M.S.; Rhee, K.N.; Ryu, S.R.; Yeo, M.S.; Kim, K.W. Design of radiant floor heating panel in view of floor surface temperatures. Build. Environ. 2015, 92, 559–577. [Google Scholar] [CrossRef]
  42. Krajcík, M.; Šimko, M.; Šikula, O.; Szabó, D.; Petráš, D. Thermal performance of a radiant wall heating and cooling system with pipes attached to thermally insulating bricks. Energy Build. 2021, 246, 111122. [Google Scholar] [CrossRef]
Figure 1. Multifamily building with rooms situated at different levels (ground floor, intermediate floor and top floor) having one, two or three external building elements.
Buildings 16 01953 g001
Figure 2. Radiator output depending on length of radiator.
Buildings 16 01953 g002
Figure 3. Investigated locations in heated room.
Buildings 16 01953 g003
Figure 4. Angle factors in different locations of analysed rooms.
Buildings 16 01953 g004aBuildings 16 01953 g004b
Figure 5. Angle factors depending on the room dimensions.
Buildings 16 01953 g005aBuildings 16 01953 g005b
Figure 6. Mean radiator temperature in rooms with different geometries and locations, with different numbers of external walls and U-value, (a) room in a multifamily house, intermediate level, (b) room in a family house.
Buildings 16 01953 g006
Figure 7. Mean floor temperature in rooms with different geometries and locations, with different numbers of external walls and U-values, (a) room in a multifamily house, intermediate level, (b) room in a family house.
Buildings 16 01953 g007
Figure 8. Operative temperatures in different locations of radiator-heated rooms.
Buildings 16 01953 g008
Figure 9. Operative temperatures in different locations of floor-heated rooms.
Buildings 16 01953 g009aBuildings 16 01953 g009b
Figure 10. Operative temperatures in radiator-heated room. (a): 3.0 m × 3.0 m × 2.7 m; (b): 6.0 m × 6.0 m × 2.7 m.
Buildings 16 01953 g010
Figure 11. Operative temperatures in floor-heated room. (a): 3.0 m × 3.0 m × 2.7 m; (b): 6.0 m × 6.0 m × 2.7 m.
Buildings 16 01953 g011
Table 1. U-values of external building elements.
External Building ElementU, [W/m2K]
External walls0.1
0.2
0.3
0.4
0.5
Window1.0
Slab above cellar0.25
Slab below unheated attic0.15
Flat roof0.15
Table 2. Average, minimum and maximum values of operative temperatures in a 3.0 m × 3.0 m × 2.7 m room with two external walls (U = 0.5 W/m2K).
Room Typeto, [°C] (Radiator Heating)to, [°C] (Floor Heating)
MeanMinMaxMeanMinMax
M20.2119.8121.0520.4420.2420.57
FH20.1619.7121.0820.4620.2720.60
FR20.2219.7920.9120.4720.2720.60
A20.2219.8021.1020.4620.2620.60
FC20.2019.7321.0420.4420.2420.57
Disclaimer/Publisher’s Note: The statements, opinions and data contained in all publications are solely those of the individual author(s) and contributor(s) and not of MDPI and/or the editor(s). MDPI and/or the editor(s) disclaim responsibility for any injury to people or property resulting from any ideas, methods, instructions or products referred to in the content.