Article

Fragility Analysis of RC Frames Accounting for In-Plan Irregularity Using Artificially Introduced Incremental Eccentricity

by
Abdelghaffar Messaoudi
1,2,
Mahmoud Abd-Elwahab
3,4,
Hossameldeen Mohamed
3,5,
Rachid Chebili
1,
Hany Madkour
3,
Mohamed Zakaria
3 and
Hugo Rodrigues
2,*
1
Laboratory of Research in Civil Engineering, Department of Civil Engineering and Hydraulics, Faculty of Architecture, Urbanism, Civil Engineering and Hydraulics, Biskra University, Biskra 07000, Algeria
2
CERIS—Civil Engineering Research and Innovation for Sustainability, Civil Engineering Department, University of Aveiro, Campus Universitário de Santiago, 3810-193 Aveiro, Portugal
3
Faculty of Engineering, Aswan University, Aswan 81528, Egypt
4
Department of Civil and Building Engineering, University of Sherbrooke, Sherbrooke, QC J1K 2R1, Canada
5
CONSTRUCT-LESE, Faculty of Engineering, University of Porto, Rua Dr. Roberto Frias, 4200-465 Porto, Portugal
*
Author to whom correspondence should be addressed.
Buildings 2026, 16(11), 2086; https://doi.org/10.3390/buildings16112086
Submission received: 18 March 2026 / Revised: 23 April 2026 / Accepted: 19 May 2026 / Published: 23 May 2026
(This article belongs to the Collection Innovation in Structural Analysis and Dynamics for Constructions)

Abstract

Reinforced concrete (RC) buildings are the most common structural system in urbanising regions. In many cases, architectural constraints and uneven distribution of structural elements often create eccentricity between the centre of mass (CM) and the centre of rigidity (CR). This eccentricity may induce torsional effects during earthquakes that can significantly influence structural response and increase seismic vulnerability. This study investigates the impact of in-plan irregularity on the seismic performance of RC buildings using nonlinear numerical analyses. Three-dimensional models of four- and six-storey RC buildings with moment resisting frames were developed in OpenSees, where different levels of irregularity were introduced by artificially shifting the lumped mass to generate controlled eccentricities without modifying the structural configuration. Seismic performance was evaluated using nonlinear incremental dynamic analysis (IDA) based on forty ground motion records under bidirectional excitation. The results indicate that increasing CM–CR eccentricity amplifies inter-storey drift demands and elevates the probability of damage due to intensified torsional stresses. The adverse effect is most pronounced when eccentricity aligns with the direction of lower stiffness, whereas eccentricity in the stiffer direction has a limited impact on severe damage states, particularly for taller buildings. These findings provide valuable insights for risk-informed assessment, retrofitting, and prioritisation of existing plan-irregular RC buildings.

1. Introduction

Egypt was exposed to five major earthquakes in the past 30 years, such as the 1992 Cairo earthquake, the 1993 and 1995 Gulf of Aqaba earthquakes, and the 1998 Alexandria earthquake [1]. Egypt is categorised into five seismic zones, in terms of seismic effect, following the Egyptian code standards and regulations [2]. Aswan is in the midst of this classification, where it is located in zone 3 with a peak ground acceleration 0.15 g. However, the building taxonomy in the city of Aswan was found to have no seismic design (i.e., those buildings were constructed before the new load code) or to have insufficient construction details that are necessary to mitigate seismic risk. For example, most of Aswan’s buildings were constructed without complying with regularity clauses. Evaluating the seismic fragility of irregular RC structures during earthquake excitations is required. The seismic assessment of RC structures is almost impossible in the field. Consequently, it is crucial to simulate using a finite element numerical modelling approach.
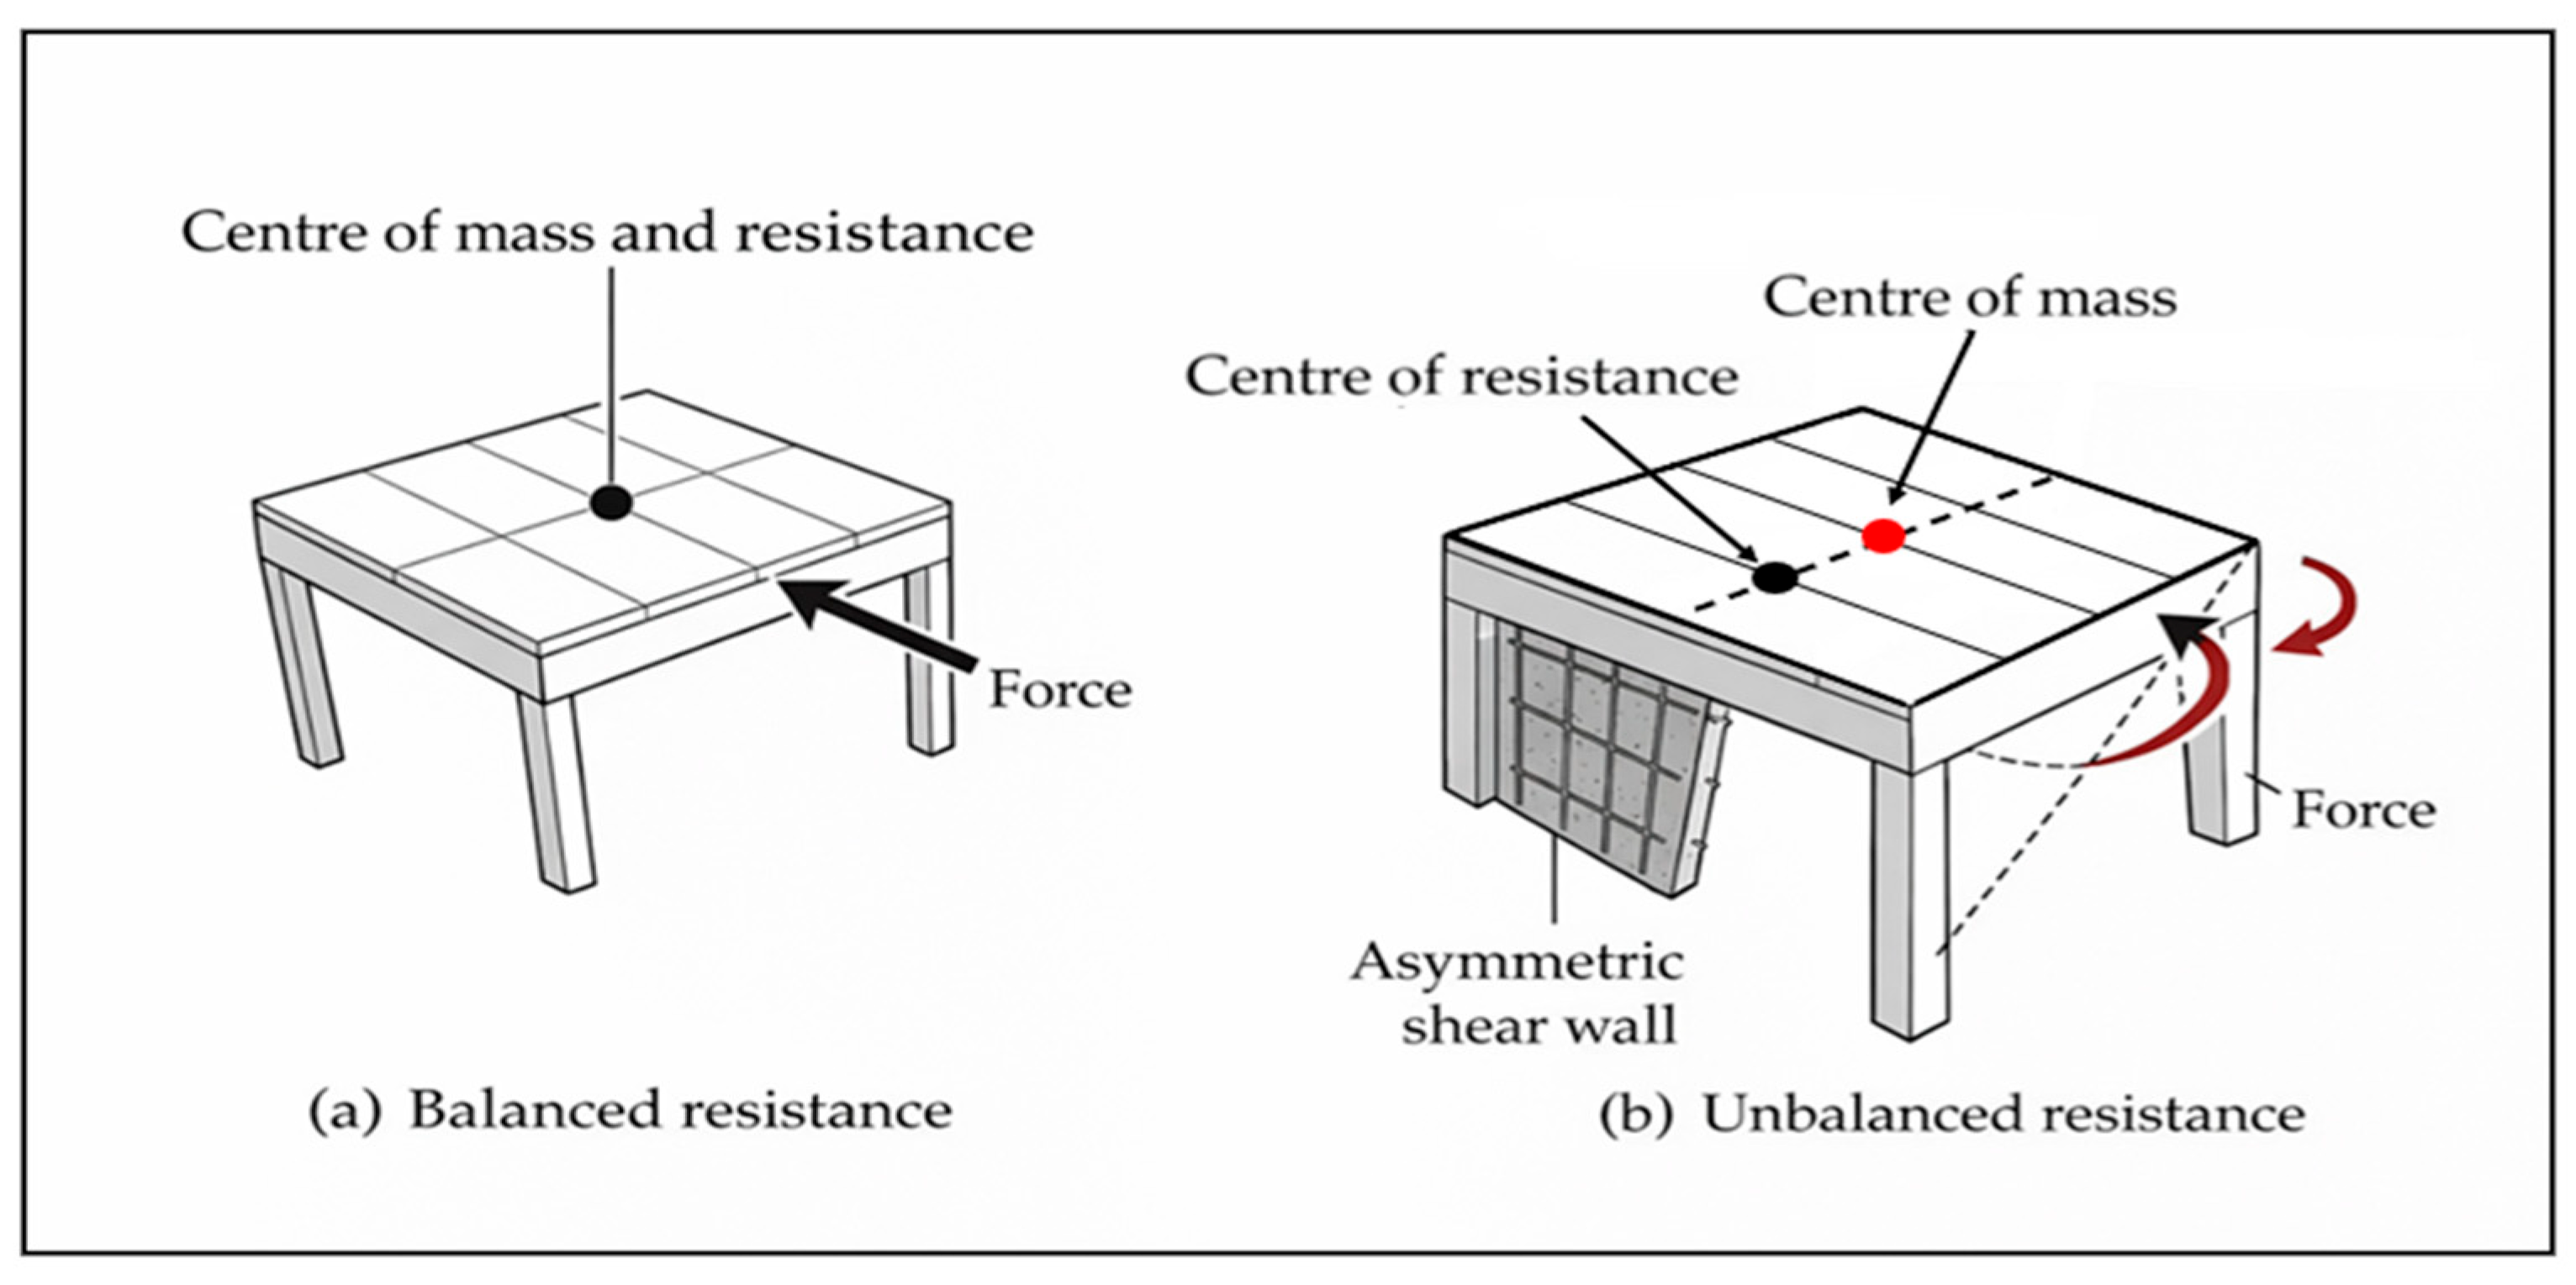
In this context, among all structural systems, RC buildings with moment resisting frames are the most commonly used structures typologies in Egypt. As a result of the high population growth in many cities and the lack of habitable land, this type of structure, due to its nature, is usually built with irregular architectural plans. In addition, poor distribution of structural elements across the building plan can also lead to irregularity (i.e., there is no coincidence between the centres of mass and centre of rigidity). In general, all existing buildings are considered to have an inherent degree of irregularity in floor plan. Such irregularity has a significant negative effect on seismic performance [3,4]. In a plan, irregularities occur due to the eccentricity between the centre of mass (CM) and the centre of rigidity (CR) of RC buildings. Plan irregularity can lead to severe damage to RC buildings as a result of expected high torsional stresses on the RC elements. Consequently, these stresses increase the likelihood of building collapse. Recent studies have also explored the nonlinear seismic response of asymmetric RC structures using advanced pushover and displacement-based approaches, highlighting the role of dynamic eccentricities and stiffness-related parameters in structural performance (Bakalis and Makarios, 2018; Bakalis and Makarios, 2019; Bakalis and Makarios, 2021) [5,6]. Figure 1 illustrates the torsion force induction in a structure with in-plan irregularity.
It has been shown that structures with irregularities in their plan or elevation experience significant damage during earthquakes compared to those with regular characteristics [3]. Elevation irregularity causes storey failures due to no uniform distribution of damage states across the height; on the other hand, plan irregularities cause nonuniform damage states among the columns within a single floor [3]. Since the irregularity of the plan leads to additional stresses on the structures due to the torsion effect, the overall structural behaviour of these buildings differs from that of regular buildings. Therefore, the irregularity leads to conventional failure mechanisms. Based on this observation, the real behaviour of these structures, considering the irregularity effect on their capacity to resist the action of an earthquake, needs to be assessed. Due to computational limitations and for the sake of simplicity, many studies used 2D models or unidirectional excitation regardless of the effect of plan irregularity [7,8,9]. Overlooking the effect of plan irregularity can lead to inadequate results.
It is important to clarify the conceptual framework adopted in this study regarding the definition of eccentricity in multi-storey buildings. As established in the literature (e.g., Chopra, Tso, Stafford-Smith, Anastassiadis, Makarios) [10,11,12,13,14], defining a unique static eccentricity in such systems is not rigorously precise due to floor-dependent variations in stiffness, mass distribution, and loading conditions. In multi-storey buildings, the centres of rigidity, twist, and shear generally do not coincide and may vary along the height of the structure.
In this study, the objective is not to redefine the theoretical concept of static eccentricity in a strict analytical sense. Instead, a practical engineering proxy is adopted to investigate its influence on seismic vulnerability through nonlinear fragility analysis. Within this framework, the centre of rigidity at each floor is employed as a conventional reference point—commonly used in engineering practice—to quantify plan irregularity and torsional imbalance for the purpose of parametric comparison.
Theoretical frameworks such as the optimum torsion axis proposed by Makarios and Anastassiadis (1997) [13] provide a rigorous approach for describing torsional behaviour in multi-storey systems. Subsequent studies have further developed this concept, including the formulation of real and fictitious elastic axes, their numerical verification, and practical methods for estimating torsional stiffness characteristics in asymmetric buildings (Makarios and Anastassiadis, 1998a,b; Makarios, 2005; Makarios et al., 2006; Makarios, 2008) [13,14,15,16,17]. Nevertheless, the implementation of these advanced frameworks requires complex formulations that fall beyond the scope of the present study, which aims to provide a comparative parametric assessment rather than a reformulation of torsional theory. These contributions are acknowledged as fundamental to the understanding of torsional response in asymmetric multi-storey structures.
While extensive literature has addressed the general influence of plan asymmetry, the specific novelty of this research lies in its targeted parametric methodology. The primary contribution of this study is the isolation of pure torsional response sensitivity in nonseismically designed RC frames through an artificially introduced incremental eccentricity framework. Unlike conventional studies that alter architectural layouts—thereby changing stiffness and mass distributions simultaneously—this approach isolates the eccentricity magnitude by systematically shifting the centre of mass. By evaluating this isolated parameter under bidirectional seismic excitation within a comprehensive incremental dynamic analysis (IDA) framework, this study precisely quantifies how eccentricity magnitude independently drives structural damage. This approach enables a robust probabilistic identification of the critical eccentricity thresholds that compromise the structural integrity of this highly vulnerable, gravity-designed building class, offering a sharper focus than broader asymmetrical studies.
In this context, the present study focuses on moment-resisting frame (MRF) systems to isolate the effects of plan asymmetry. This simplification is intentional and allows a controlled assessment of torsional response. It should be noted that the extension of this approach to dual systems (wall–frame structures) is beyond the scope of the present work and is recommended for future research.
To implement this methodology within a performance-based earthquake engineering (PBEE) framework, 3D numerical models of representative four- and six-storey RC buildings were developed using OpenSees software (Version 3.8.0) [18]. The nonlinear dynamic behaviour was evaluated utilising an ensemble of 40 selected ground motion records under bidirectional excitation. Based on the resulting incremental dynamic analysis (IDA) curves, fragility functions were developed for different damage limit states. This provides a comprehensive and quantitative assessment of the in-plan irregularity effects, facilitating a deeper understanding of the seismic performance and vulnerability of the considered RC buildings.

2. Methodology

In order to investigate the effect of plan irregularities that are found in the Aswan building taxonomy, Aswan’s residential RC buildings are considered as a case of study. Using a street survey of the building’s taxonomy of Aswan, it was found that most of the RC buildings can be categorised as mid-rise buildings (i.e., No. of storeys less than 6). As such, a residential RC building with four and six storeys was selected to reflect the building taxonomy in Aswan. The numerical models of these selected cases were modelled using three-dimensional finite element numerical models with inelastic behaviour of the materials to identify the behaviour of irregular RC structures. All the numerical models were implemented using the open-source software OpenSees [18].
One type of analysis was used to assess the seismic performance of the RC buildings and another for time history dynamic analysis. For the latter approach, the record-to-record variability was considered using incremental dynamic analysis. The IM-based approach was used to develop the fragility curve using various limit states for the considered RC buildings. In the following section, the essential information about the considered RC buildings is presented. In addition, the adopted modelling strategies are introduced.

2.1. Characteristics of the Buildings and the Study Cases

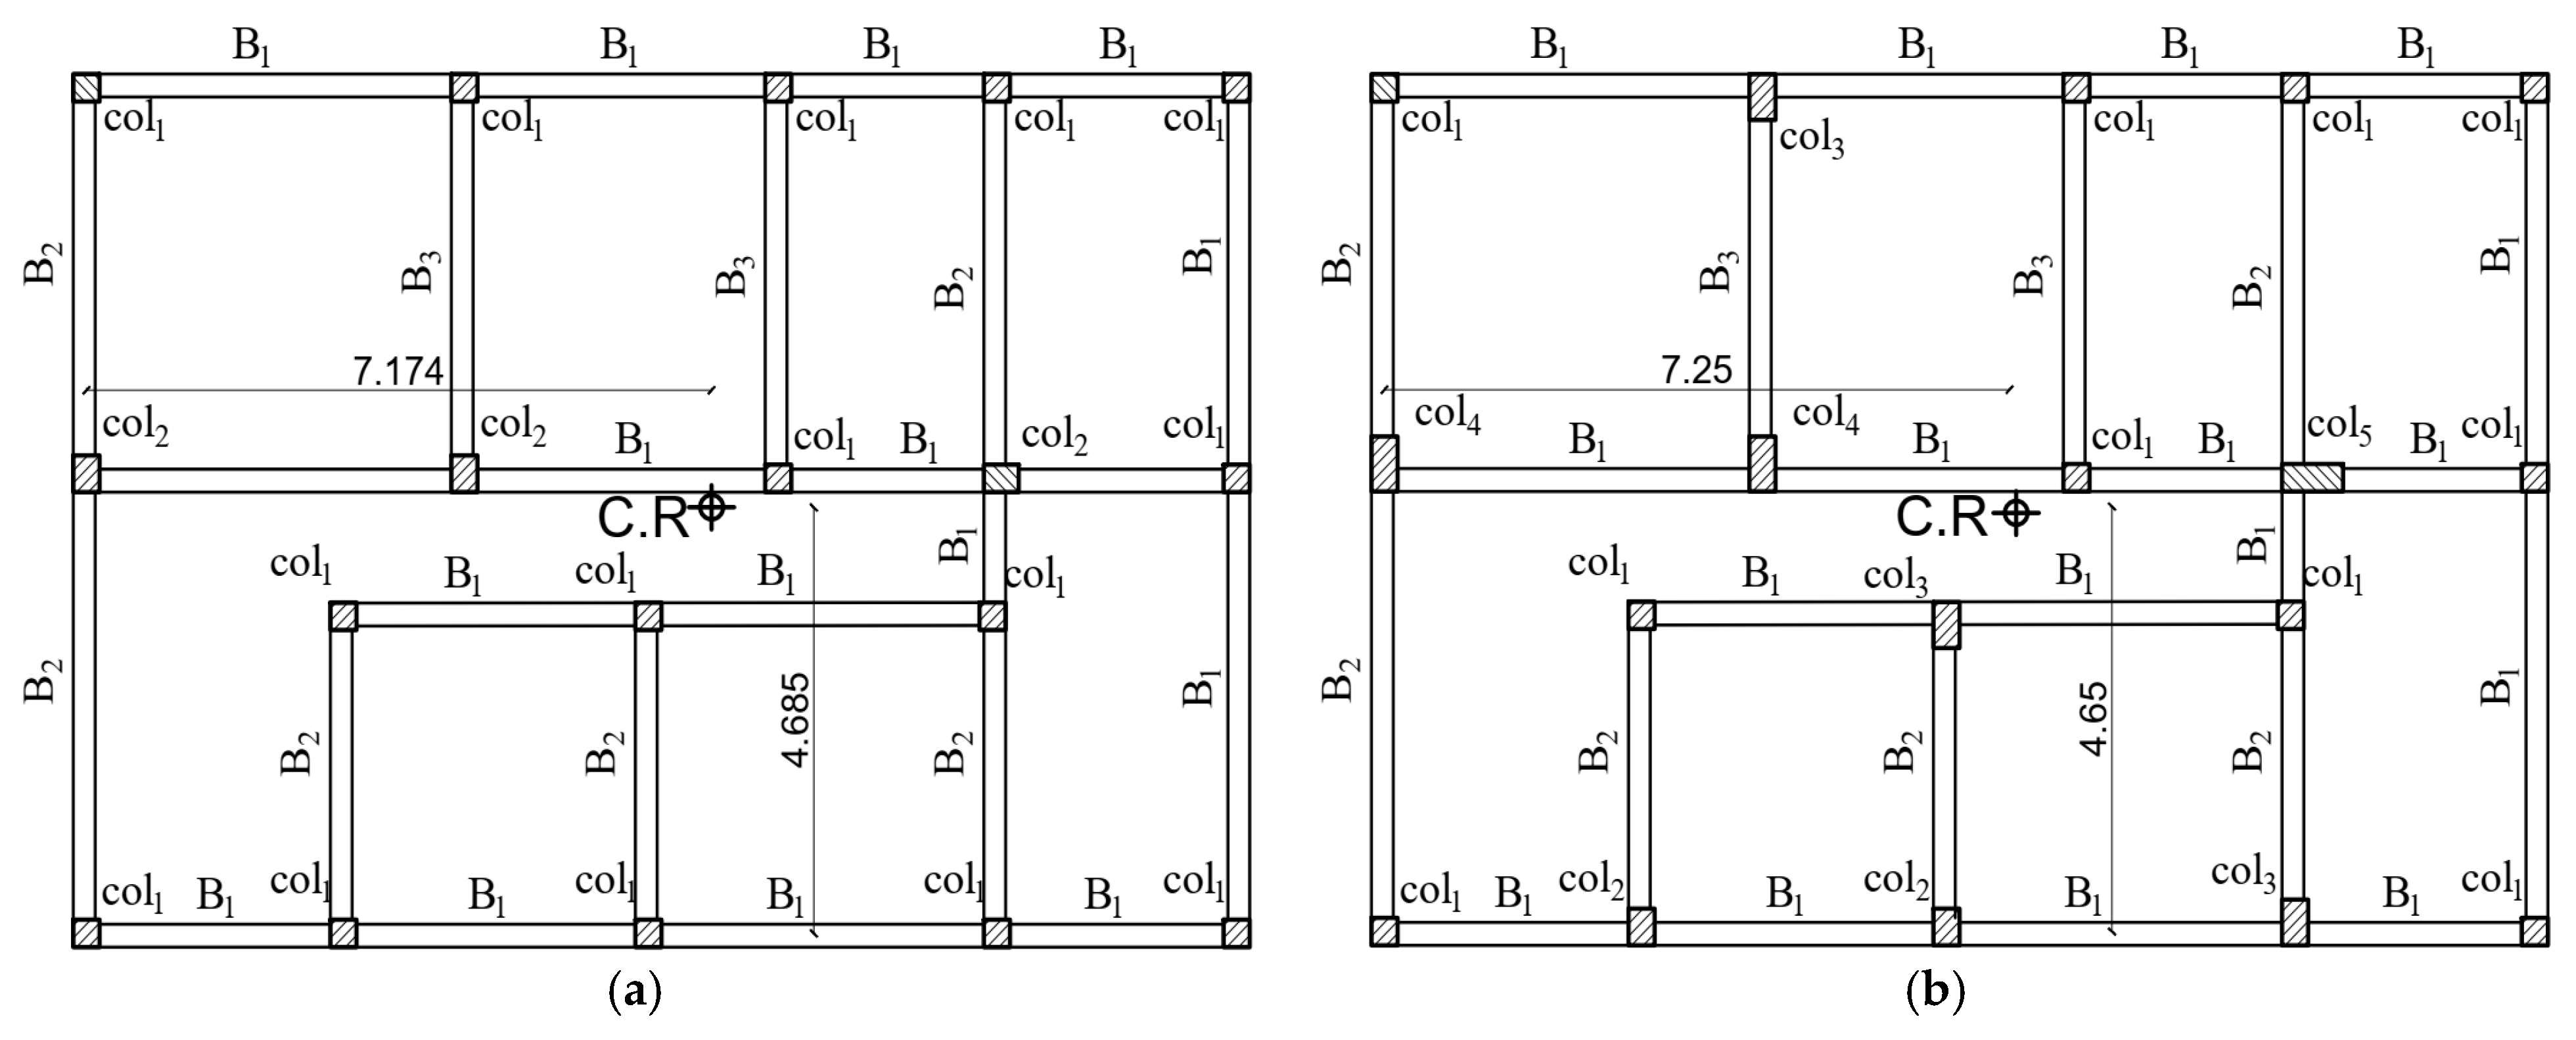
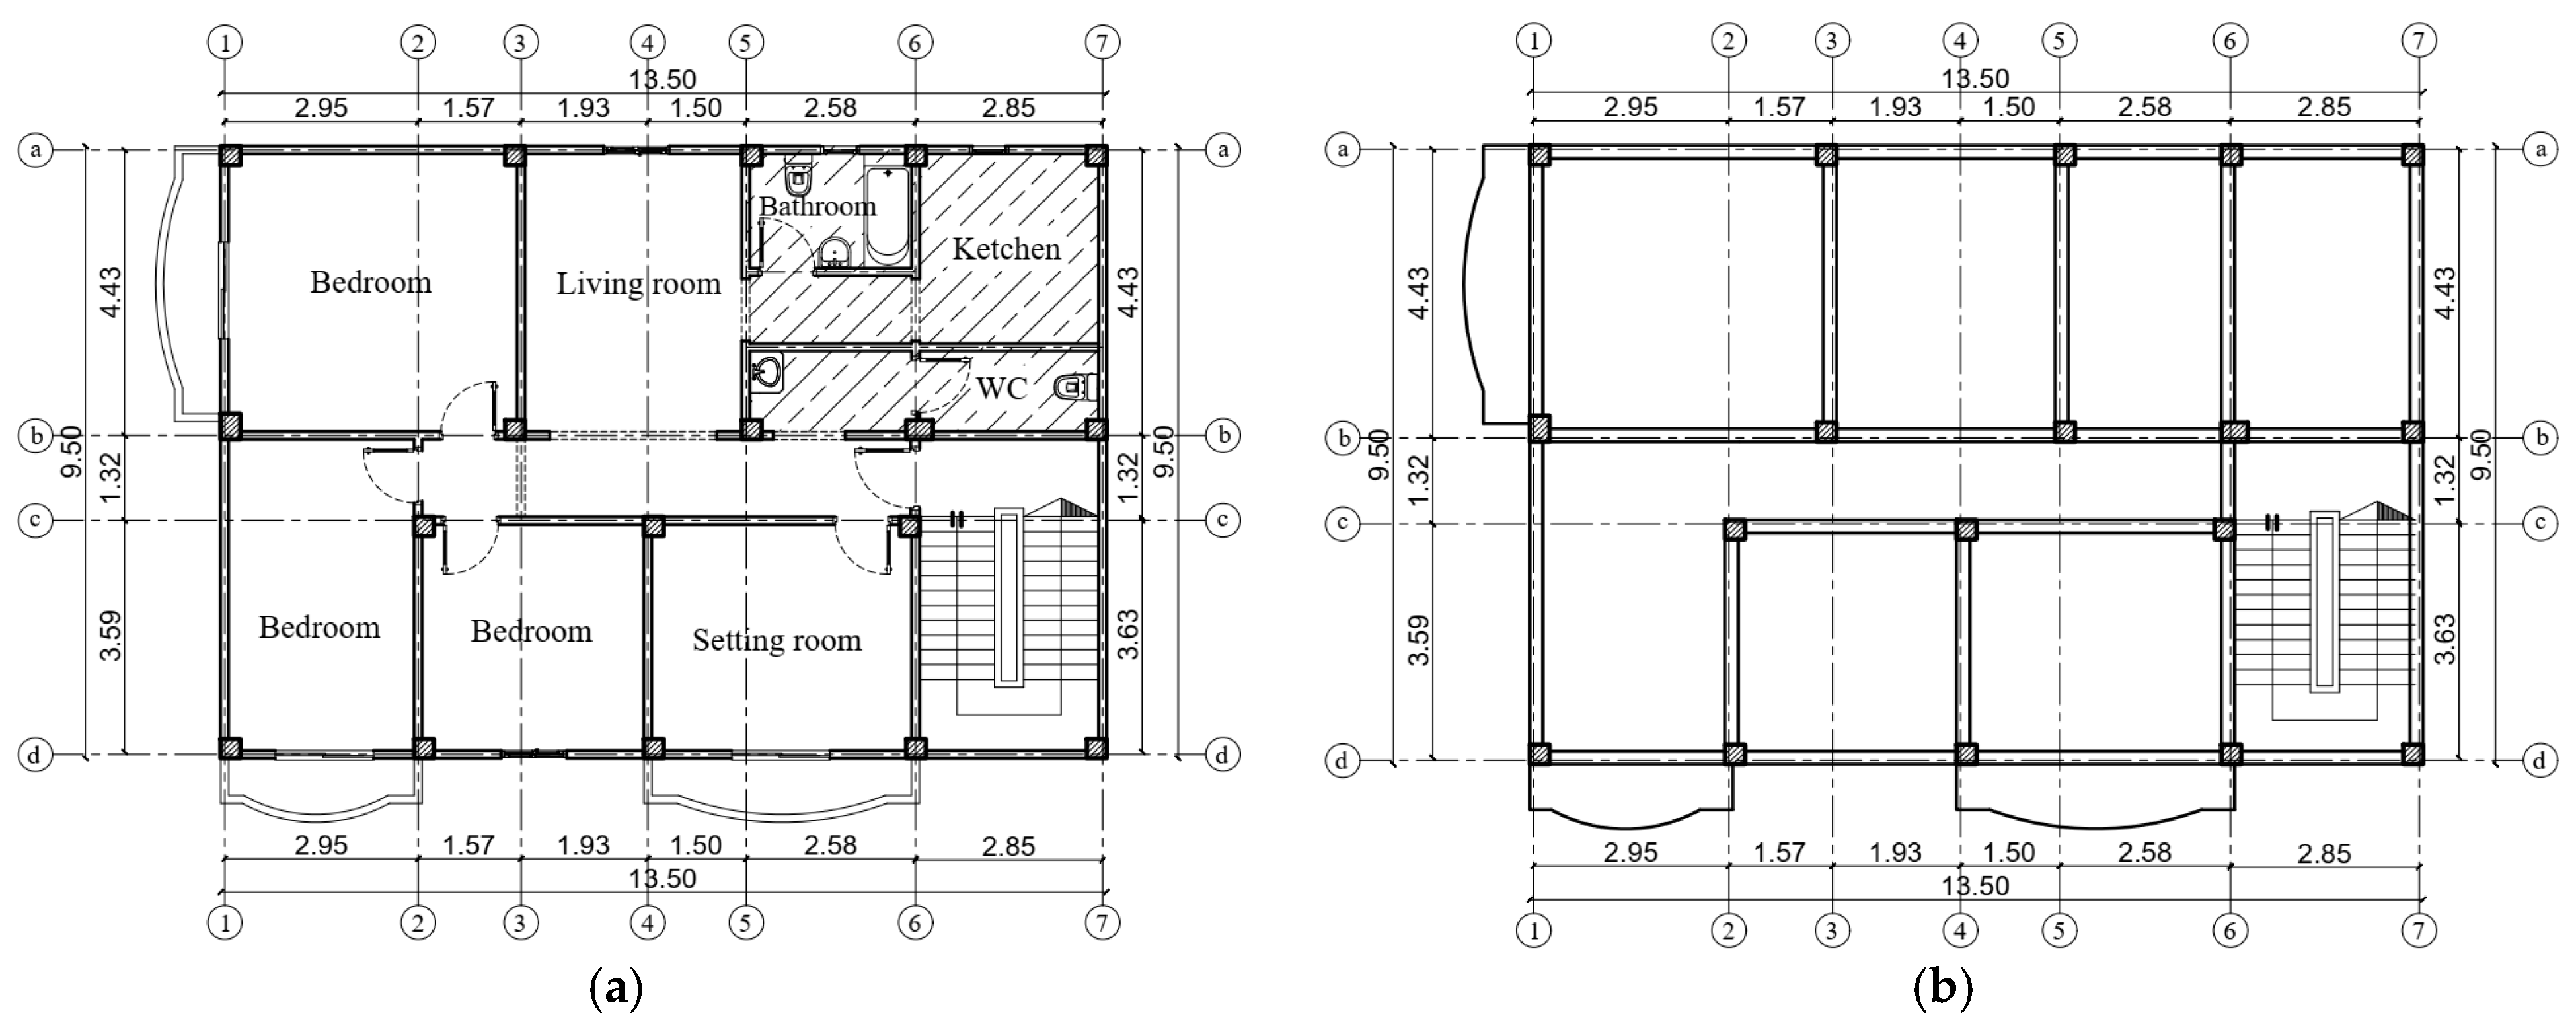
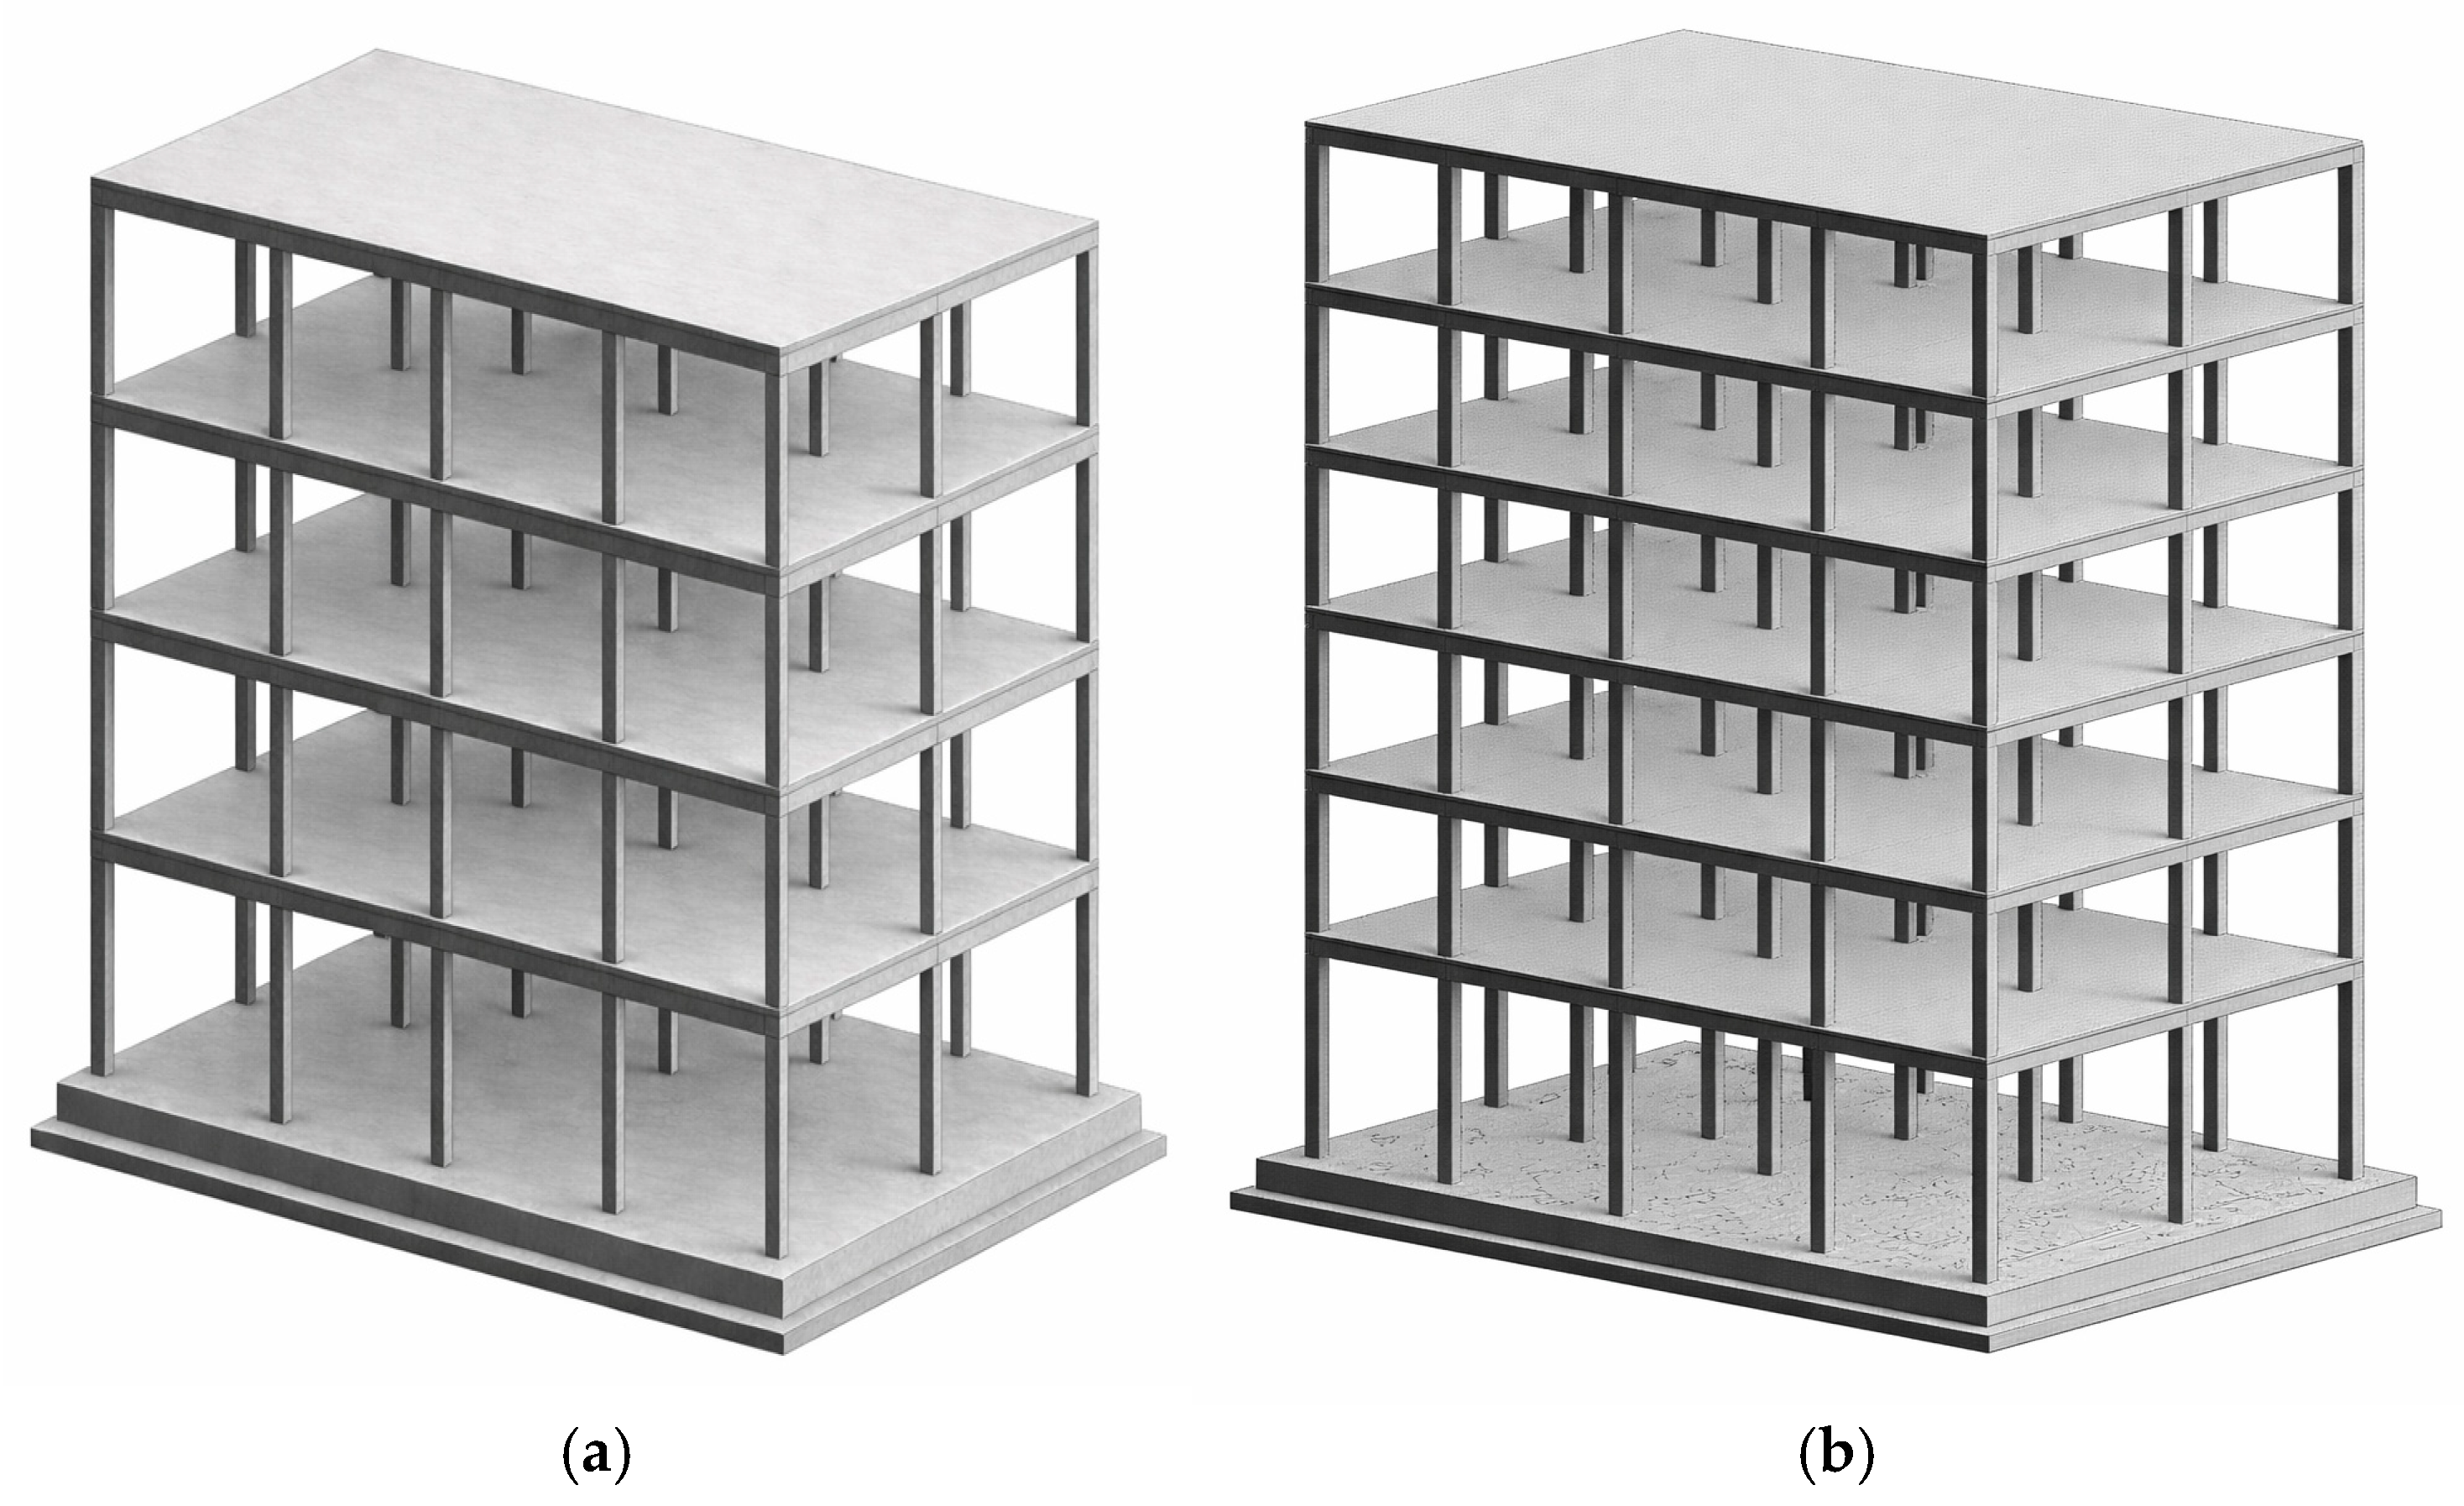
A residential RC building was chosen as a case study for the proposed procedures to evaluate the effect of in-plan irregularity on the overall structural behaviour of the building. The structural system and architectural layout of a typical floor are shown in Figure 2. The considered building has a typical floor height of 3.00 m, while the ground floor is 3.50 m high. The area of the considered building is 128.25 m2, with dimensions of 13.50 m and 9.5 m in the X-direction and Y-direction, respectively. As shown in Figure 3, two types of RC buildings were considered, with four and six storeys. To simulate the scenario of nonseismically designed structures, the two configurations were designed under gravity loads following the guidelines of the Egyptian code [2,19]. The considered dead loads and live loads are listed in Table 1. In terms of RC materials, the compressive strength of concrete (fcu) was 33.0 MPa, the yield stress of the steel (σy) was 500 MPa, and the steel elastic modulus (E) was 200 GPa. Figure 4 presents the resulting cross-section labels and allocates the centre of rigidity (CR) for the four-storey and six-storey buildings, respectively. The columns and beams’ cross-section details and dimensions are listed in Table 2 and Table 3, respectively. The thickness of all slabs was found to be 12 cm with #10@20 steel reinforcement.

2.2. Modelling Technique and Numerical Model Description

Based on the refinement and complexity of the model, modelling strategies of earthquake structural analysis are classified into three levels [20]. These levels are summarised below in ascending order of complexity and accuracy [20]:
(i)
Global models: the nonlinear response of a structure is concentrated at a selected degree of freedom. Such models are useful in the preliminary design phase for estimating inter-storey drifts and displacement ductility demand.
(ii)
Discrete finite element model: the structure is modelled as an assembly of interconnected elements that describe the hysteretic behaviour of reinforced concrete members. It is worth noticing that two types of element formulation are possible for the discrete finite element approach: lumped plasticity and distributed plasticity.
(iii)
Eventually, the micro finite element models or detailed finite element models are the most accurate due to their ability to simulate real behaviour by discretising the element and joint into a large number of finite elements mostly using solid elements. However, a high computational cost of this approach is inevitable due to the large number of involved elements.
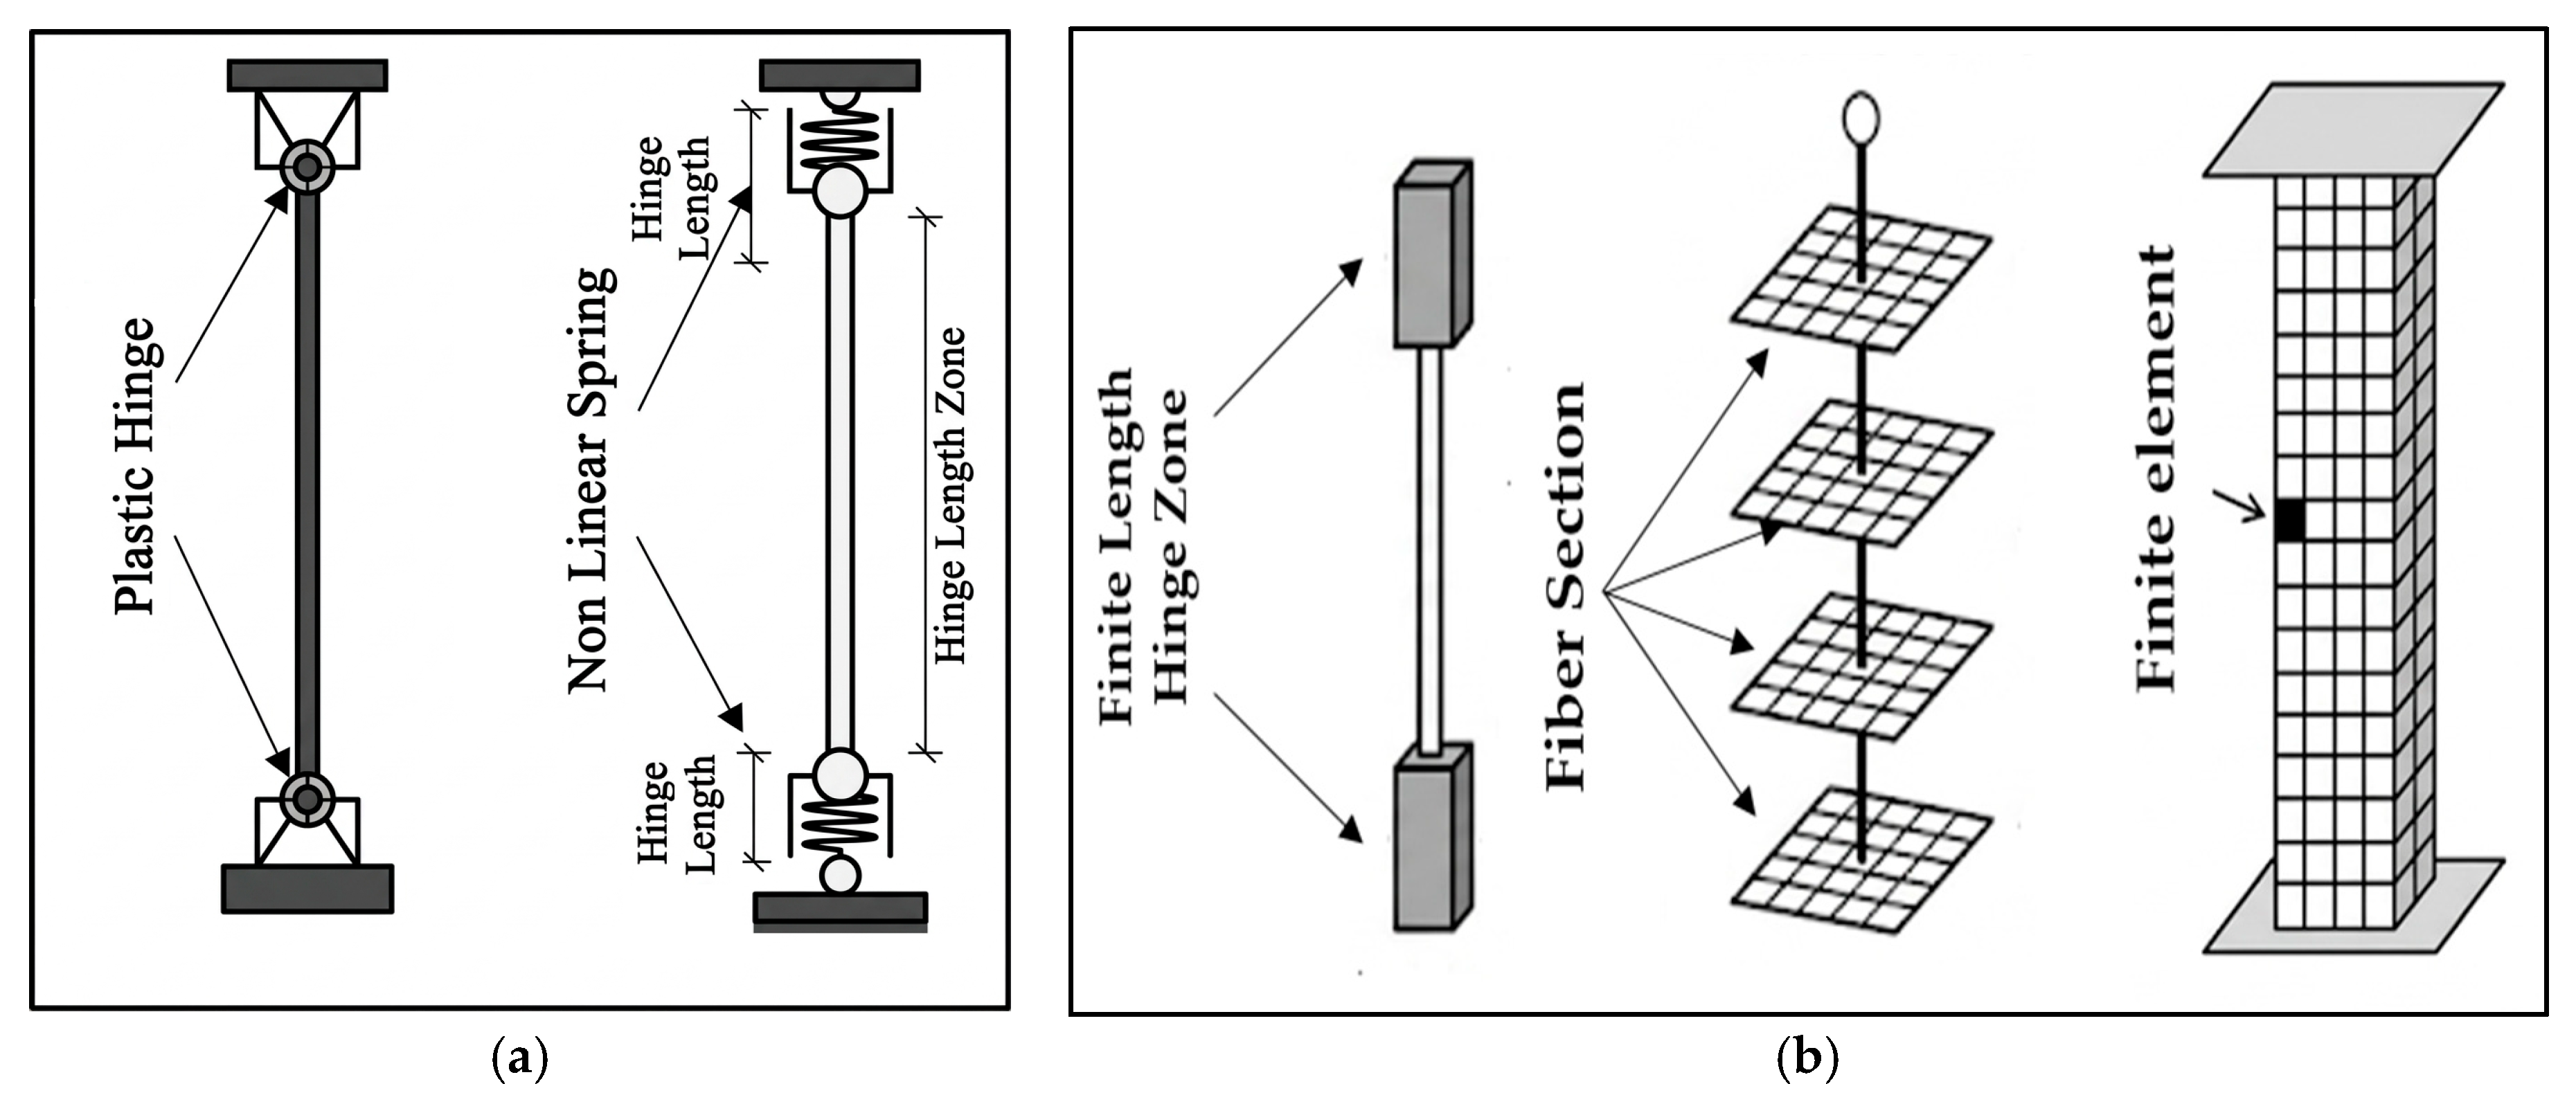
For the purpose of this study, the second type of modelling approach (i.e., discrete finite element approach) has been seen to provide a balance between accuracy and computational time efficiency. Figure 5 shows a graphical presentation of the referred techniques to model RC elements.
As described, the discrete modelling strategy comprises two major approaches for modelling the nonlinearities of materials. The following is a summary of those methods:
(i)
Lumped plasticity element: this approach, as illustrated Figure 5, lumps the material nonlinearity at a specific length of the element known as the plastic hinge length [21,22,23,24,25]. This length can be established according to the section dimensions and element geometry [26]. This approach provides an effective method for modelling and controlling plastic hinge formation.
(ii)
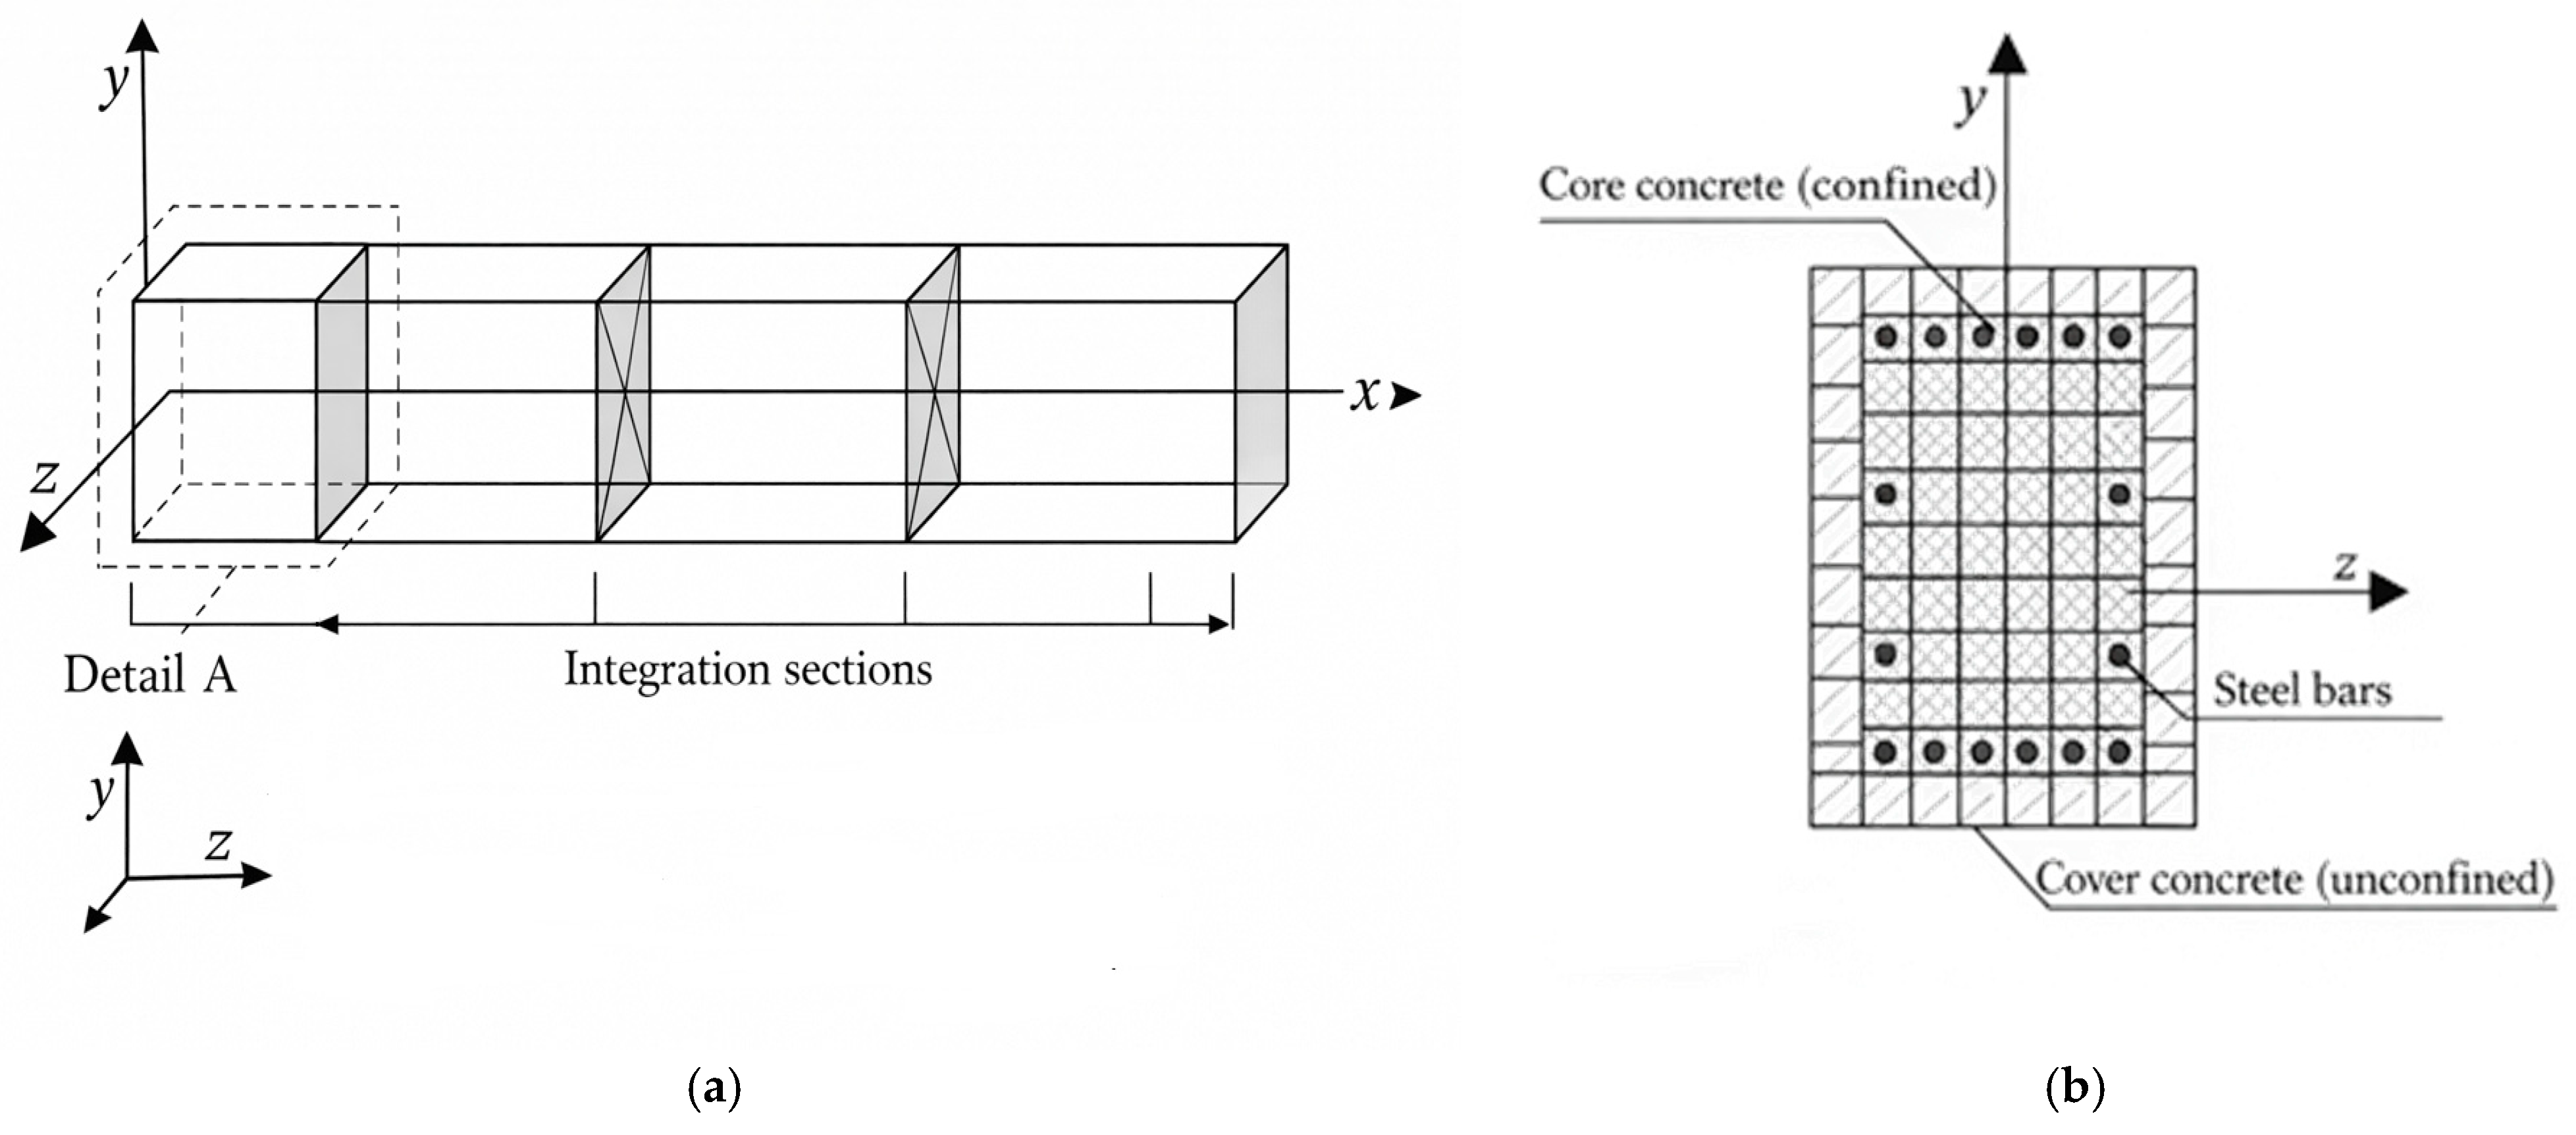
Distributed plasticity element: this approach presupposes that plasticity is evenly spread along the entire length of the member as shown Figure 5. It should be noted that the fibre sections serve as the foundation for the majority of distributed plasticity models. Consequently, the distributed plasticity approach provides a more precise characterisation for the nonlinear performance of the reinforced concrete components. In this approach, the global nonlinear behaviour of the elements is produced by weighted integration of the section behaviour, and the material nonlinearity is evenly spread along the entire length of the element therefore it exists at any section of the element as illustrated in Figure 5. Practically, just the behaviour of the chosen section at the integration point is captured because the element integrals are obtained numerically. The behaviour of the cross-section can be estimated either by applying the plasticity theory and the resulting stress and strain or by separating the cross-section into fibres as shown in Figure 6. A distributed plasticity element is applied in this study despite it requiring more computational effort compared to the lumped one. The main feature of this modelling strategy is that it ignores the predefined length and allows each section to resist the inelasticity over the whole response range (linear and nonlinear).
In order to assess the influence of in-plan irregularity on RC buildings under earthquake excitation, the considered structures were simulated using the open-source software OpenSees [18]. The buildings, whose geometric characteristics and dimensions are described in the previous section, were modelled as three-dimensional centre-line frame systems. Rigid diaphragm constraints were assigned at each floor level to simulate the in-plane stiffness of reinforced concrete slabs, which are assumed sufficiently rigid to ensure uniform lateral displacement distribution and realistic torsional response. The base of the structure was assumed to be fully fixed, with all translational and rotational degrees of freedom restrained. The structural mass was lumped at the floor diaphragm nodes and explicitly assigned to both translational and rotational degrees of freedom to ensure consistent dynamic representation. To overcome potential numerical instability and accurately capture nonlinear behaviour, RC frame elements (i.e., beams and columns) were modelled using distributed plasticity elements with the actual cross-sectional dimensions, as detailed in Table 2 and Table 3. To isolate the effect of plan irregularity, nonstructural components such as infill panels were not considered in the model. A Rayleigh damping model corresponding to 5% critical damping in the fundamental modes was adopted for all considered frames.
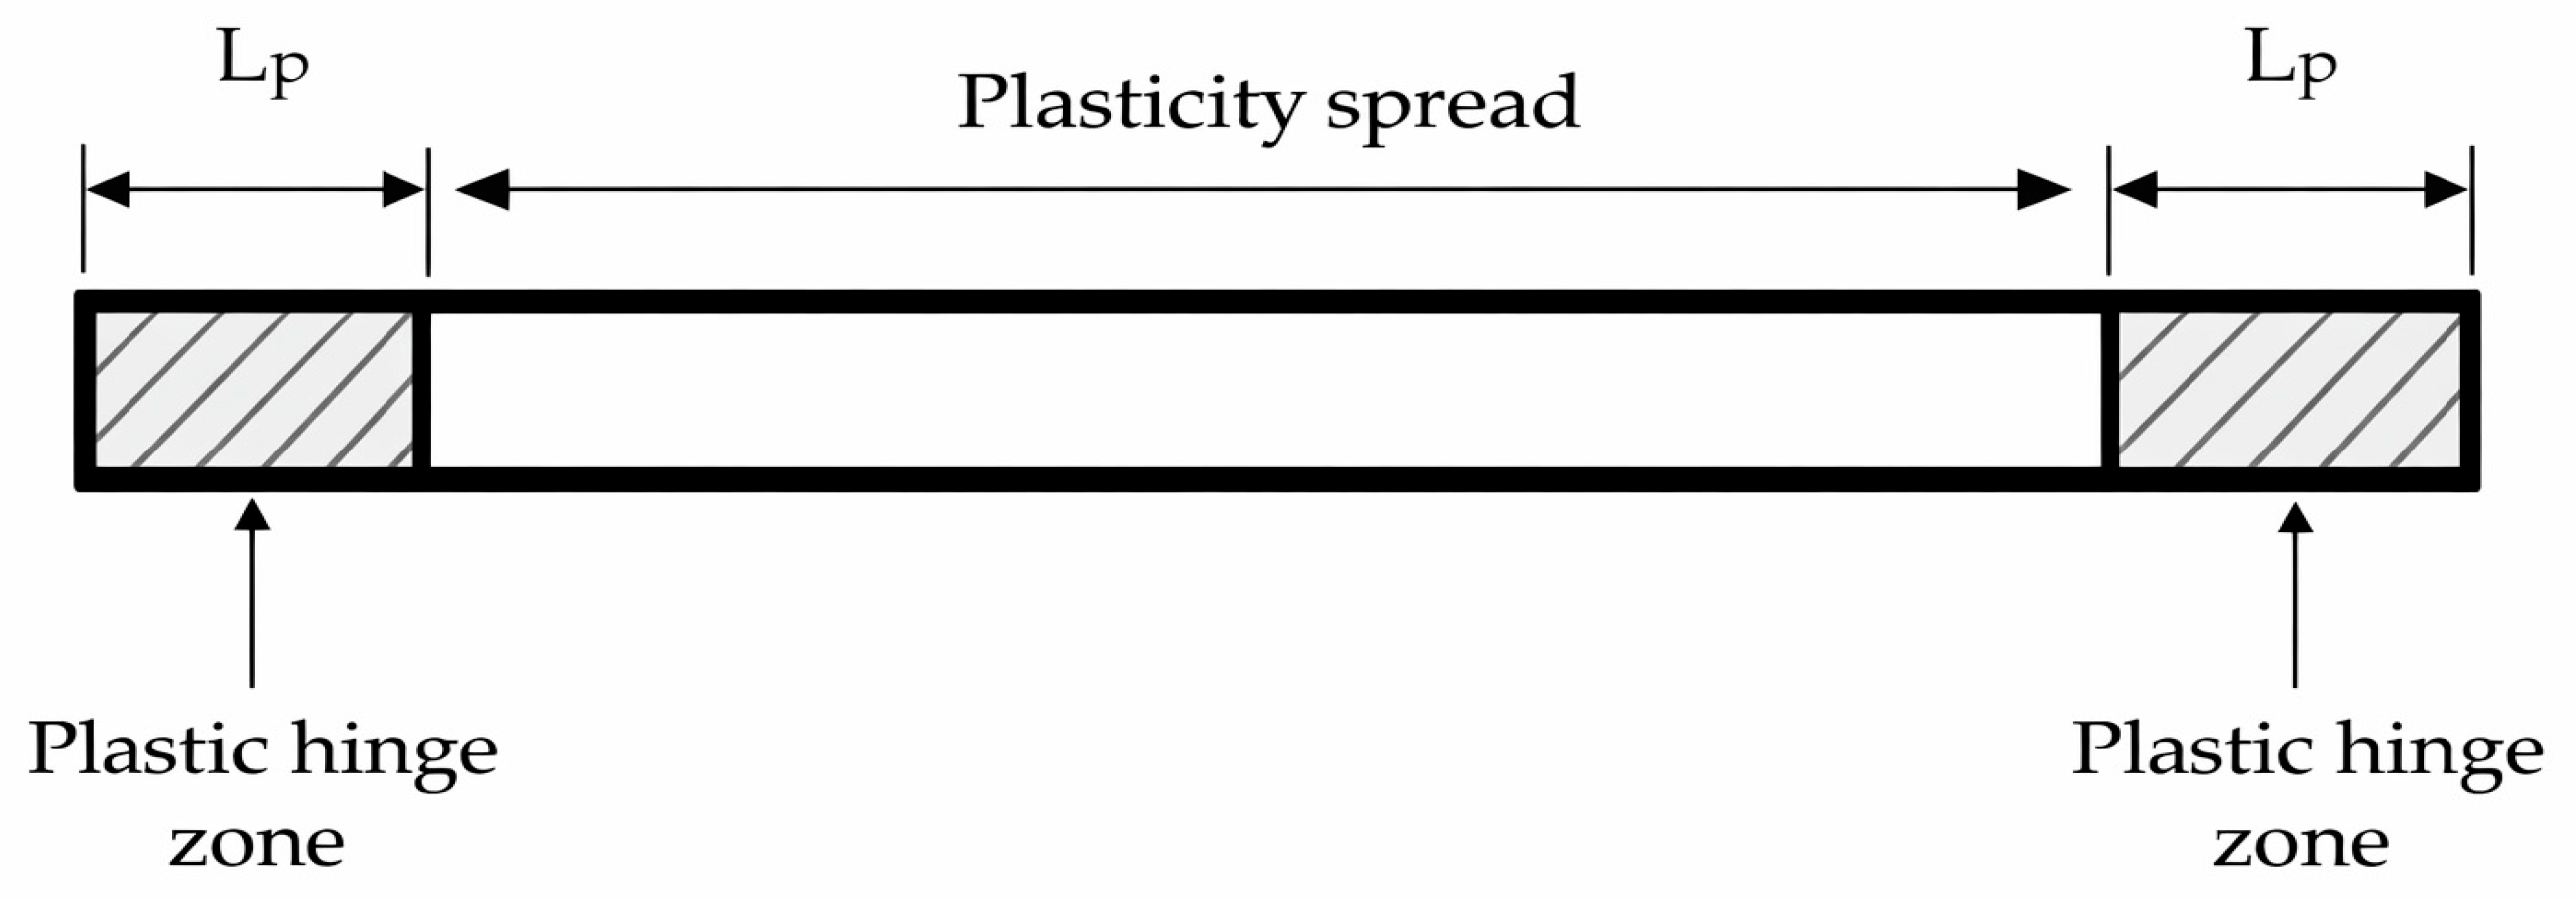
The elements were modelled using force-based elements known as a beam with hinges available in OpenSees as shown in Figure 7. The fibre sections were considered not only at ends of the elements but along the elements to model the conceivable nonlinearity of the central part of the element. The plastic hinge length Lp was identified using the following equation proposed by Paulay and Priestley [28]:
L p = 0.08 L e + 0.022 d b f y
where Le is the length of the element in m, db is the diameter of the steel reinforcement bars in mm, and fy is the yield stress of the steel bars in MPa.
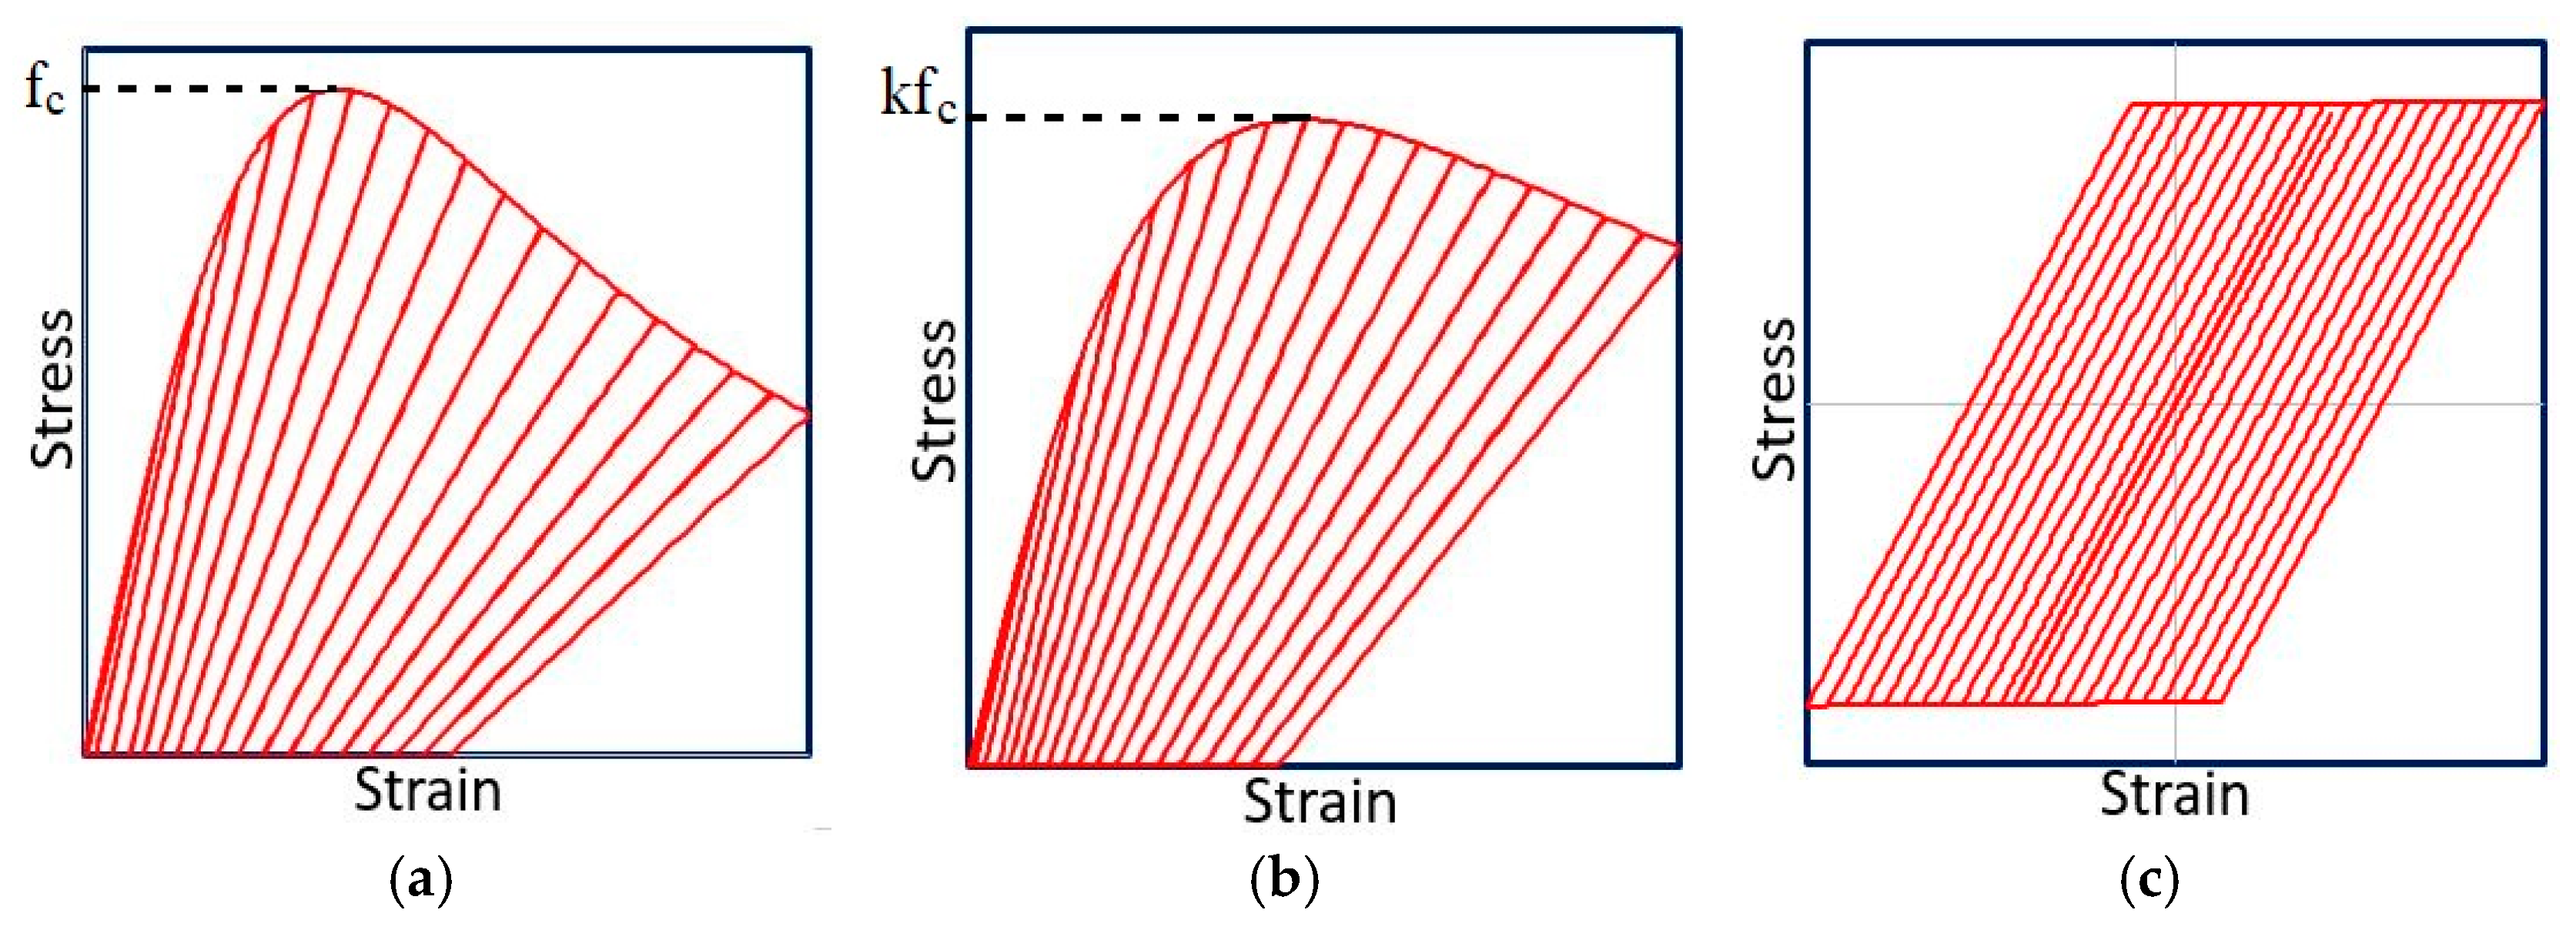
As previously indicated, the RC cross-sections were discretised using a fibre model consisting of three different uniaxial materials provided in OpenSees: unconfined concrete, confined concrete, and steel. The Concrete04 model, originally proposed by Popovics [29], was adopted for both confined and unconfined concrete regions, as it accurately captures nonlinear compressive behaviour and post-peak softening under cyclic loading. For the unconfined concrete, a compressive strength ( f c u ) of 33.0 MPa, peak strain ( ε c ) of 0.002, ultimate strain ( ε c u ) of 0.025, and an elastic modulus ( E c ) of 28.7 GPa were adopted. To account for the confinement effect provided by transverse reinforcement, the confined core concrete was modelled using a confinement factor based on the expression proposed by Kent and Park [30], resulting in enhanced properties of ( f c u = 35.2) MPa, ( ε c = 0.00266), and ( ε c u = 0.0333), while maintaining the same elastic modulus. These values are reported in absolute terms, while compression is taken as negative in the numerical model. The reinforcing steel was modelled using the Steel01 material model, which follows a uniaxial bilinear stress–strain relationship with kinematic hardening defined by the elastic modulus ( E s = 200) GPa, yield strength ( f y = 500) MPa, and strain-hardening ratio ( b = 0.005). The stress–strain curves of the considered materials are demonstrated in Figure 8.
It is important to acknowledge the interpretation limits of the adopted modelling strategy. In this study, in-plan eccentricity was introduced primarily by shifting the centre of mass (CM) rather than altering the structural layout or the distribution of rigid-body properties. This mass-offset approach is intentionally designed as an idealised parametric framework to isolate and quantify the structural sensitivity strictly regarding the magnitude of eccentricity. Consequently, the numerical results and the derived fragility curves should be interpreted as an idealised sensitivity trend of mass offset. While this controlled approach provides fundamental mechanical insights into the torsional vulnerability of nonseismically designed frames, it does not simulate specific, complex real-world architectural configurations where eccentricity typically arises from asymmetric stiffness distributions. Furthermore, this modelling framework allows isolating the sensitivity of the structural response to controlled eccentricity levels without introducing additional uncertainties associated with modifying stiffness distributions or structural configurations.
The seismic performance assessment in this study is based on nonlinear time history analysis (NTHA), from which the fragility curves are derived through an incremental dynamic analysis (IDA) framework. This approach inherently captures the actual dynamic behaviour of the structures, including material and geometric nonlinearities, torsional coupling effects, redistribution of internal forces, and higher-mode contributions.
Therefore, the conclusions drawn in this study are not based on linear assumptions but rather on the nonlinear seismic response of the structural systems. This modelling strategy mitigates the limitations typically associated with simplified static representations and provides a more realistic evaluation of seismic vulnerability. It is emphasised that the adopted nonlinear time history analysis framework explicitly captures the seismic response beyond the elastic range, ensuring that the structural behaviour is evaluated under realistic nonlinear conditions.

3. Description of Analysis Procedure

This section presents a seismic vulnerability assessment with different levels of eccentricity using the incremental dynamic analysis (IDA). In this study, four- and six-storey buildings with different levels of eccentricity in the two directions were considered: EX1, EX2, EY1, and EY2 which correspond to 7.4%, 22.2%, 10.5%, and 21% of the dimensions of the building in X- and Y-direction respectively. In addition, the regular counterparts (NO-ECC) were analysed, and their results were used as the reference case. The results from incremental dynamic analysis (IDA) were discussed and analysed to assess the influence of plan irregularities on the overall behaviour of nonseismically designed buildings. Subsequently, fragility curves were developed based on the engineering demand parameters obtained from the IDA results to compare the seismic performance of the irregular buildings with their regular counterparts.
As aforementioned, incremental dynamic analysis (IDA) is a procedure in which seismic performance assessment is conducted to account for record-to-record variability. As such, a set of records are required. The procedure involves subjecting a structural model to a set of ground motion record, each scaled to multiple intensity levels, to generate structural response curves as a function of ground motion intensity [31]. In the following, the selected ground motions are described. In addition, the selection of engineering demand parameters is discussed, followed by the definition of damage limit states that are used to derive the fragility functions.

3.1. Ground Motion Record Selection Procedures

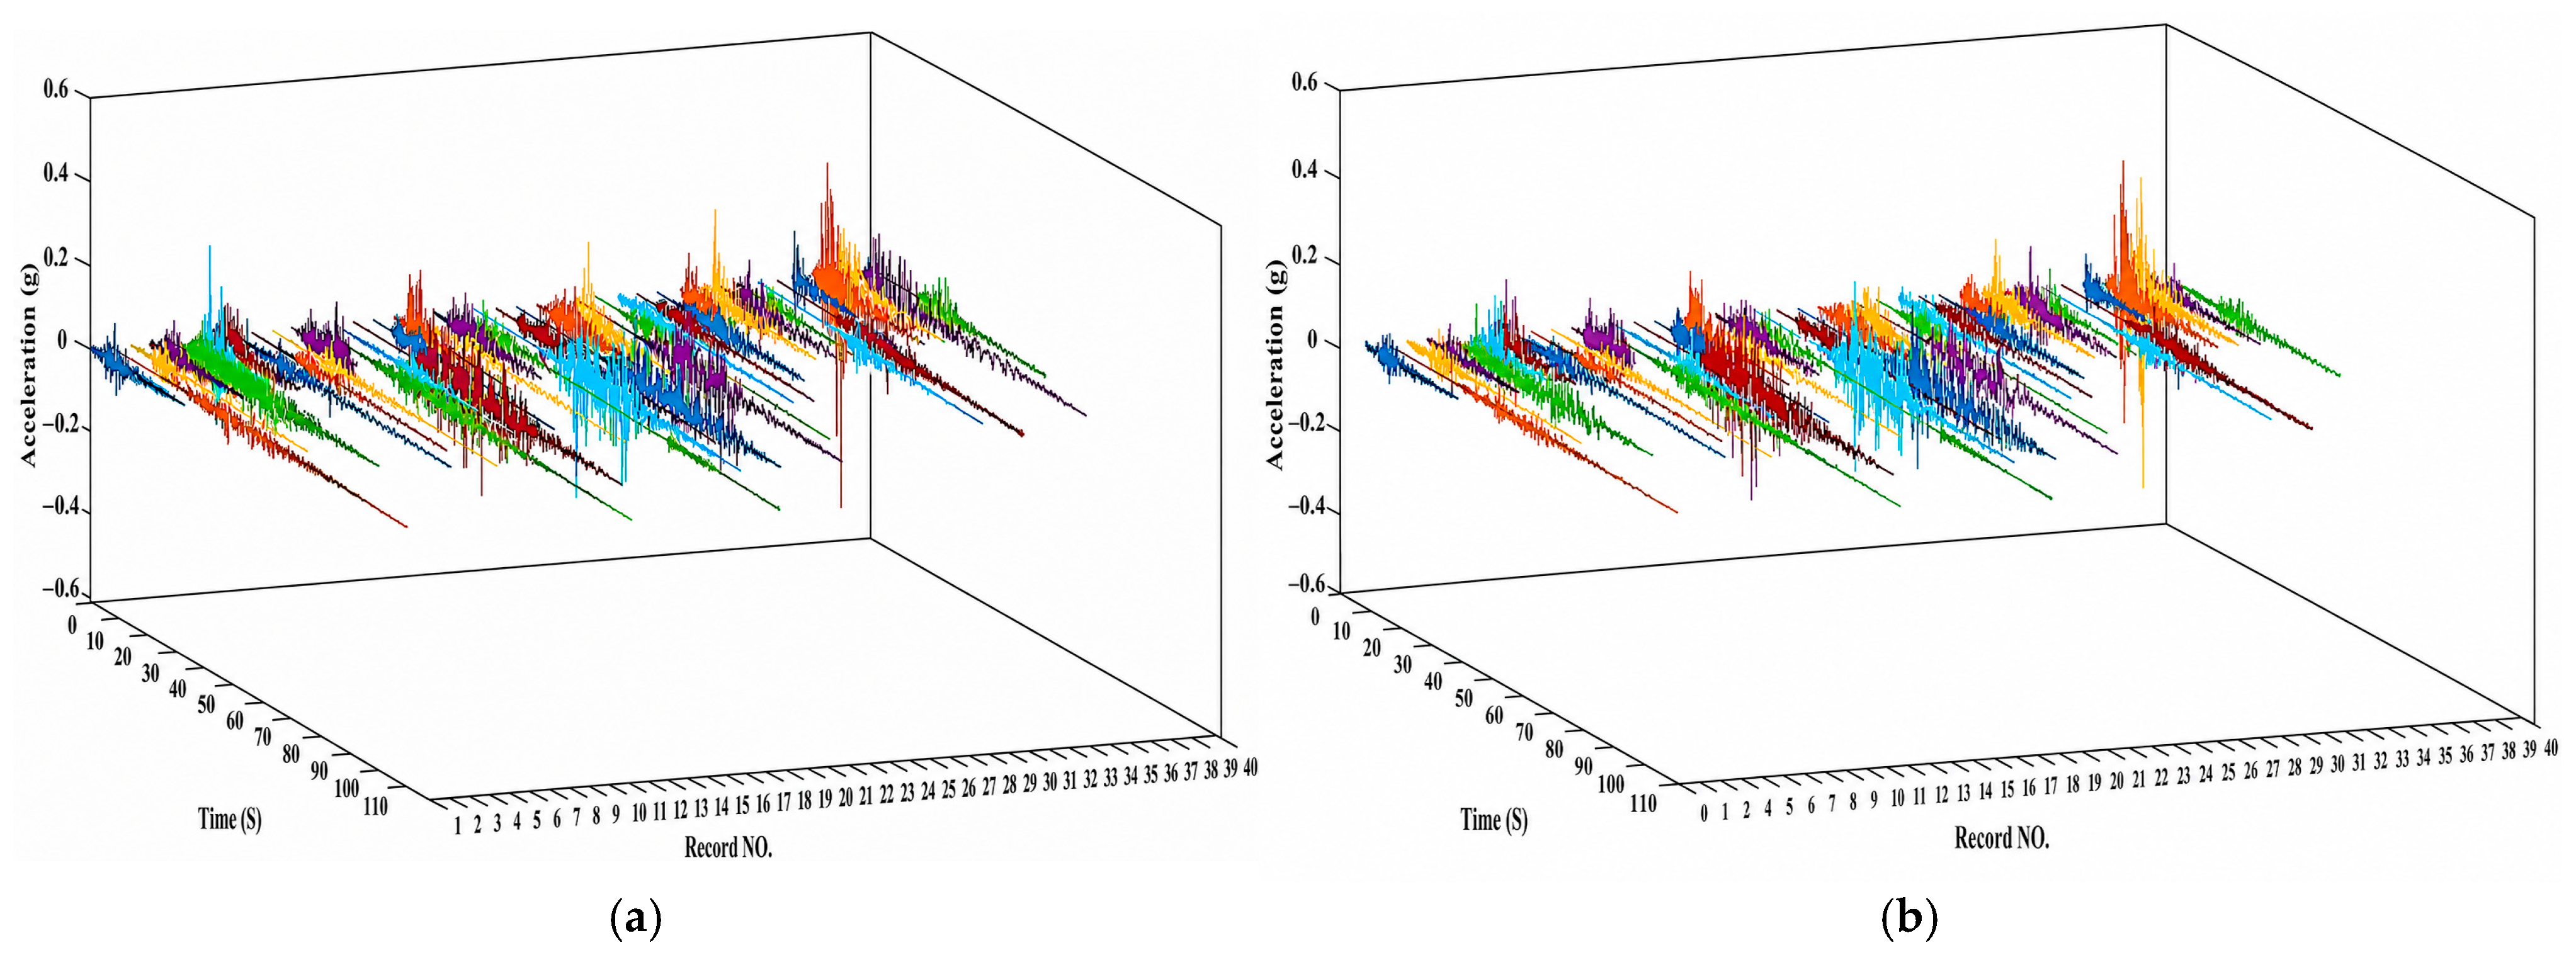
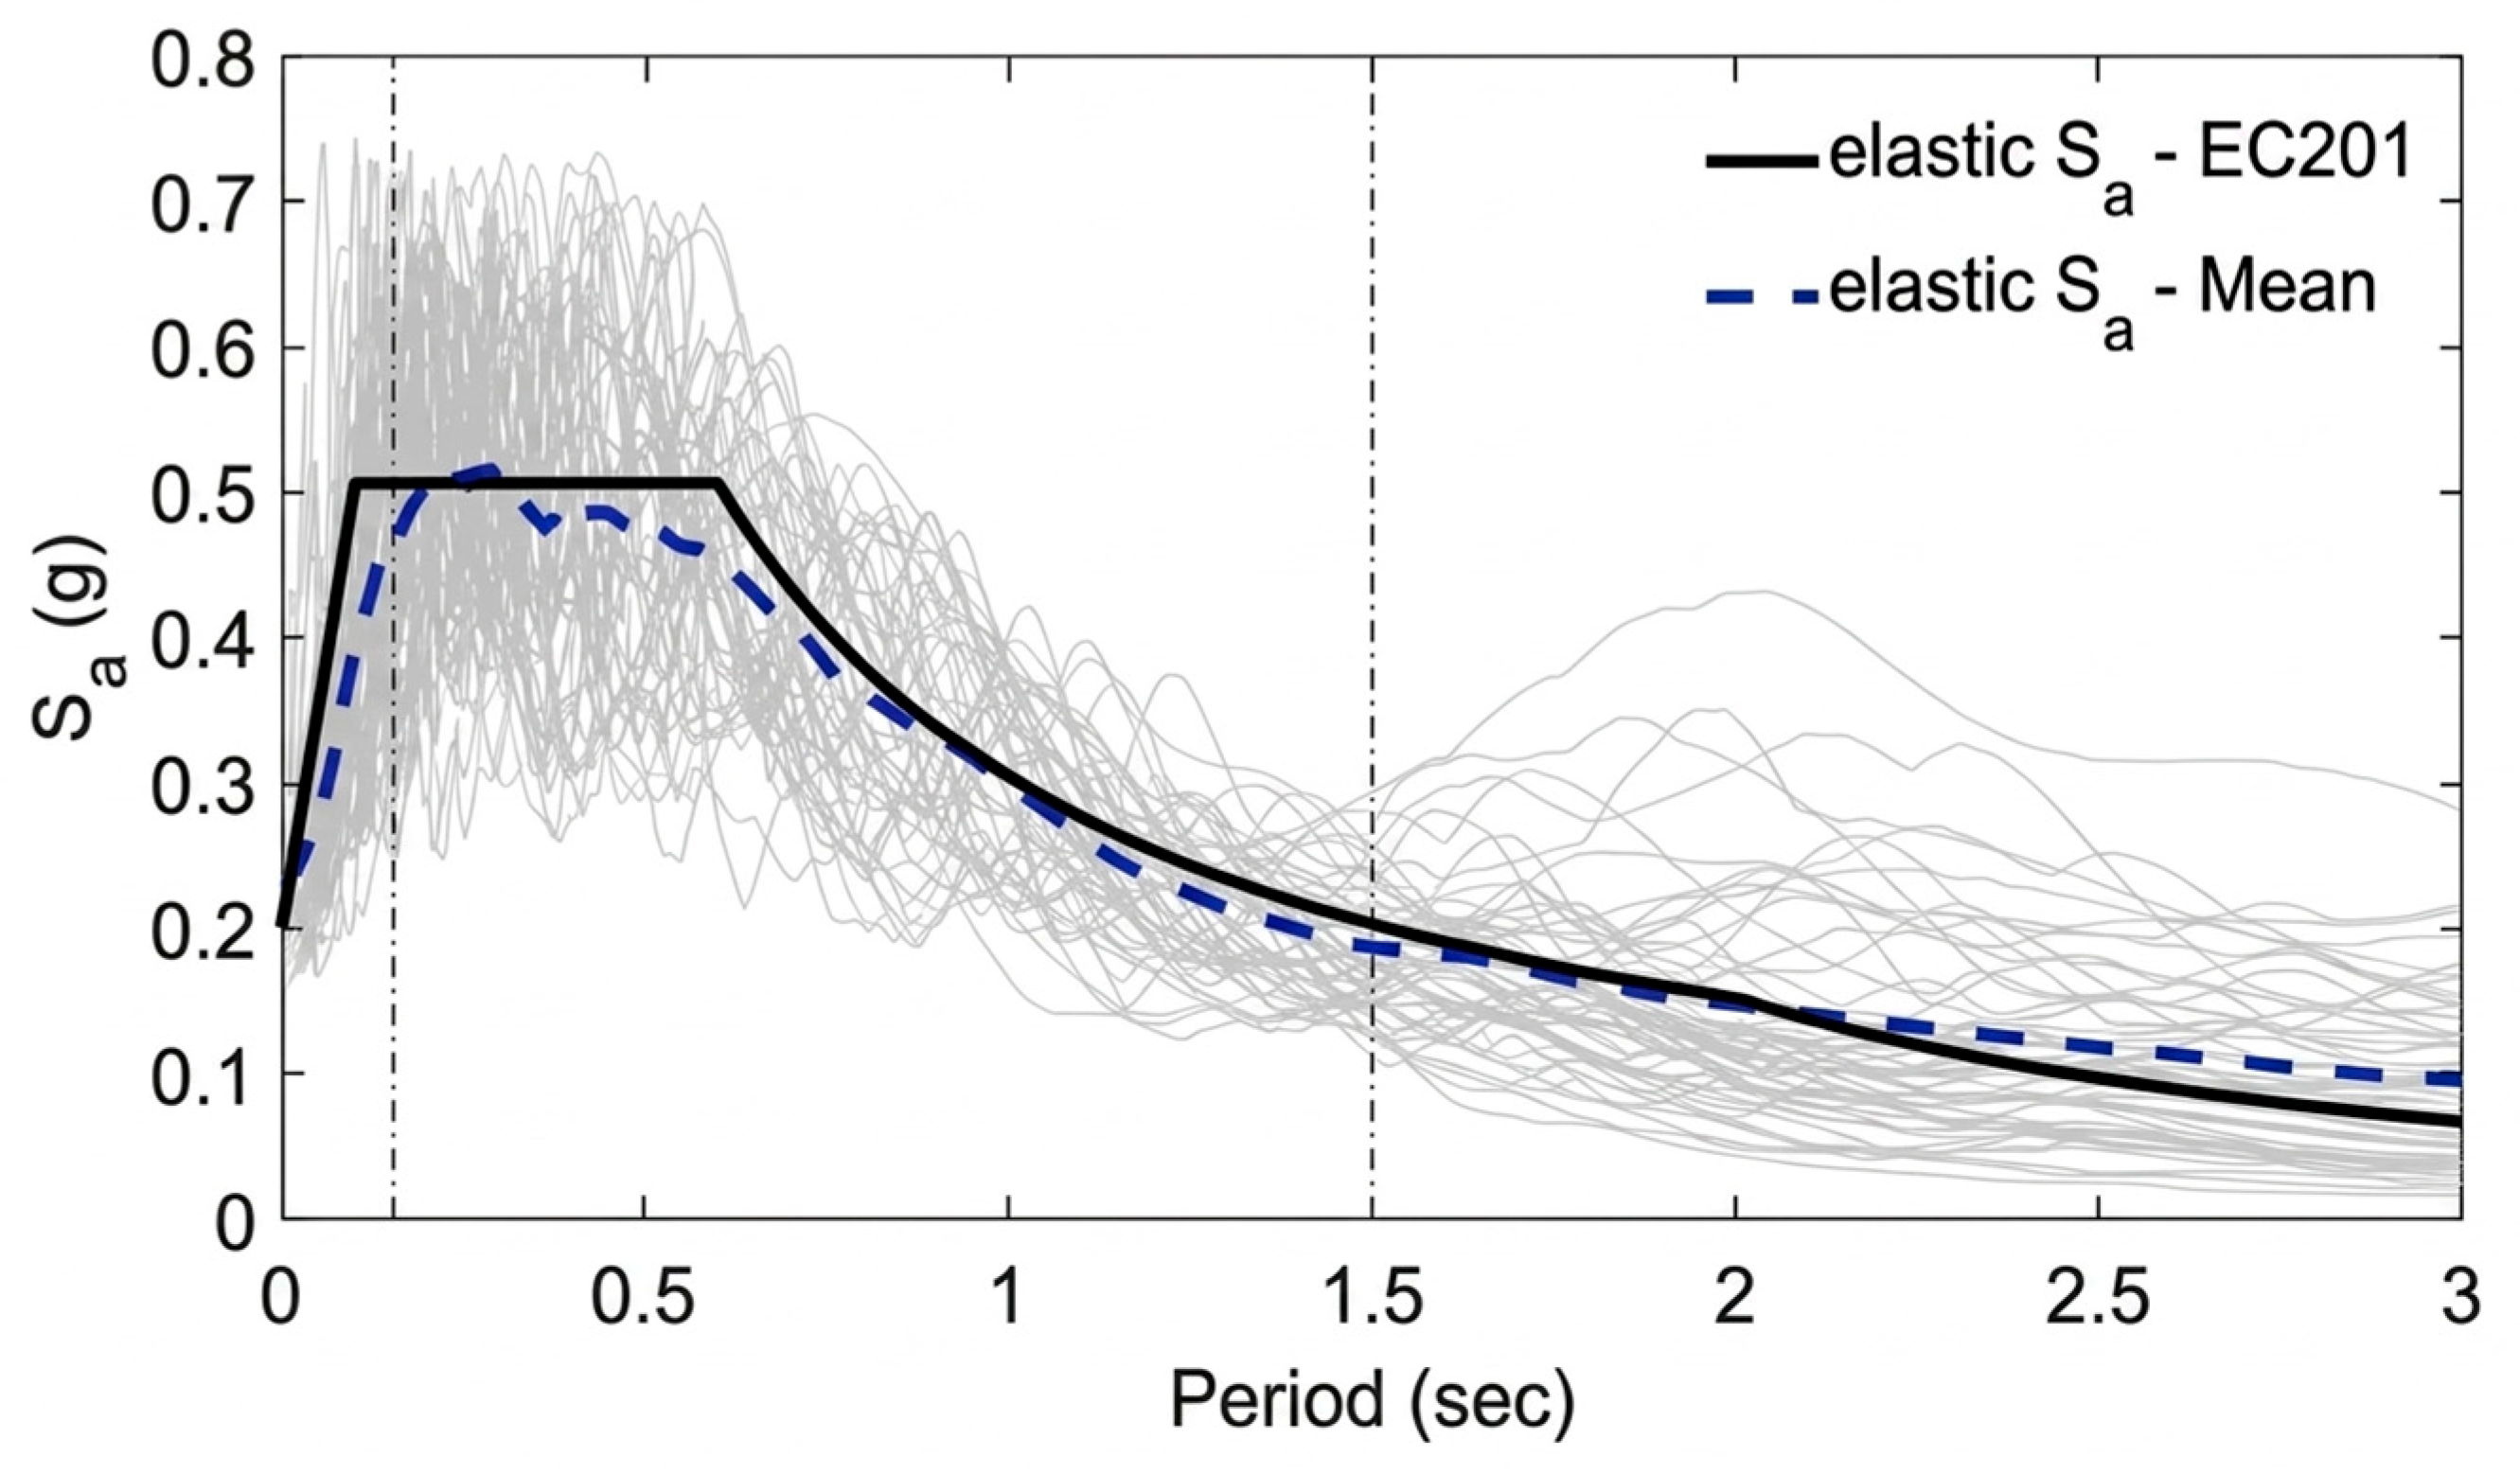
The incremental dynamic analysis (IDA) method is used to perform the seismic vulnerability evaluation of the study cases. To this end, 40 ground motion records, each record comprising two horizontal components, were selected to match the target design response spectrum of the Aswan territory, as defined in Egyptian load code [2] for zone 3 with a peak ground acceleration of 0.15 g, soil classification type B and spectrum acceleration type 1. These records were obtained from the database of the Pacific Earthquake Engineering Research Center (PEER) and the SelEQ platform [32] was used for record selection. The selected ground motion records were properly scaled to match the target response spectrum and the geometric mean response spectrum of each record by maintaining a ±50% bound between the scaled record and the target response spectrum. The same set of ground motion records was applied in both X- and Y-directions. The scaling of the records was performed based on peak ground acceleration (PGA), ensuring consistency with the adopted intensity measure in the IDA, and the same scaling factor was applied to both horizontal components of each record to preserve the characteristics of bidirectional excitation. The characteristics of the selected ground motions are summarised in Table 4, and the individual signal for each component is presented in Figure 9. Figure 10 shows the response spectrum of the selected ground motions along with their mean value (thick dashed line) and the target response spectrum (dashed black line). These records were obtained by enforcing that the average response spectrum of the selected records matches the target spectrum over the period range 0.15–1.5 s, which covers all fundamental periods of the selected structures [33]. PGA was selected as the intensity measure due to its simplicity and its suitability for comparative assessment of seismic response across different structural configurations, including plan-irregular buildings where torsional effects are present.

3.2. Engineering Demand Parameters and Definition of Damage Limit States

Engineering demand parameters such as inter-storey drift, top displacement, or floor acceleration are parameters used to characterise the state of structures (i.e., cracking, yielding, and collapse), which are subjected to seismic excitation depending on a predefined level of damage. The stiffness, strength, and ductility characteristics of a specific building have a significant impact on determining the structure’s response in terms of displacement or drift. Applied loads, confinement, and shear span are other variables that affect the structures’ deformation. The inter-storey drift ratio in a building is defined as the ratio of the displacement differences between two adjacent storeys to the height between the respective storeys. The designs of the structural components, such as the columns and the beams, are associated with inter-storey drift. Also, the inter-storey drift can be used as a damage index to define the global structural and nonstructural damage, which can be at the component level or the storey level. It is worth noting that the value of maximum inter-storey drift can be obtained by applying the following equation:
I D R m a x % = d j d j 1 h s × 100
where d is the maximum displacement at the storey j level with respect to the lower floor (j−1) and hs is the height between the respective storeys.
Several investigations and various international standards were found to propose the inter-storey drift limits for different types of RC buildings, such as bare RC frame buildings and masonry-infilled RC frame buildings, to identify the performance limit states for RC buildings [34,35,36,37,38]. In this study, the maximum inter-storey drift across the building height was considered as the structural demand to represent the structural behaviour of the structures. This demand parameter was selected due to its good correlation with structural losses and with a large part of nonstructural losses [39]. The damage limit states threshold that was proposed by Rossetto and Elnashai [38] was adopted in this study. As summarised in Table 5, six damage states (i.e., ranging from slight to collapse) were defined to identify the building damage states expressed as maximum inter-storey drift (IDRmax).
The damage states considered in this study are defined based on the inter-storey drift ratio ( I D R ) thresholds expressed as percentages. For each ground motion record and intensity level in the IDA, the maximum inter-storey drift ratio ( I D R m a x ) is computed across the building height. The exceedance of a given damage state is determined by directly comparing the computed IDRmax with the corresponding threshold value. A damage state is considered to be exceeded when the I D R reaches or exceeds the specified limit. This procedure is consistently applied for all structural configurations and ground motion records to derive the fragility curves and the associated exceedance probabilities.

3.2.1. Seismic Intensity Measures (IMs)

The seismic intensity measure (IM) is a measure that is normally used to express the intensity of an earthquake record. Thus, it serves as the connection between seismic risk and seismic demand analysis, and it is an essential parameter for performance-based studies. Based on the seismology characteristics of earthquakes, several IMs have been proposed and studied. These IMs include the 5% damped first-mode spectral acceleration Sa(T1), 5% damped first-mode spectral displacement Sd(T1), peak ground acceleration (PGA), energy released by the earthquake as in the European macroseismic scale [40,41] and peak ground velocity (PGV) [42], in addition to more advanced IM formulas with better detection performance such as fractional order IMs [43], average spectral acceleration [42,43,44,45,46,47], and vector IMs [47,48]. The PGA is one of the most well-known and widely used IMs [49], even with the high variability of the fragility curve developed based on PGA. The latter fact can be interpreted as the ability of PGA to be used for structures that have different dynamic characteristics. In this context and given the variability of the dynamic characteristics of the considered buildings, PGA will be used in this study to assess the seismic vulnerability of irregular buildings.
P G A = m a x   a t

3.2.2. Development of Fragility Curve

The vulnerability assessment of the study cases is evaluated through fragility curves. Fragility curves are a statistical tool that describe the exceedance probability of the state of building damage, given ground motion intensity. Fragility curves are a unique tool to assess the seismic performance of a given structure and work as fingerprints for the structure [50]. This function provides comprehensive information about the projected behaviour of the buildings during an earthquake event. As such, it is an essential tool for evaluating seismic risk, emergency planning, loss assessment, or risk mitigation plans. Generally, fragility is the likelihood that a structural, nonstructural, or geotechnical system response exceeds a critical level when subjected to a seismic excitation with a specified intensity (e.g., see [51,52,53,54,55,56], among others). Fragility curves can be developed using a variety of methods, including analytical, empirical, judgemental, and hybrid methods [57,58,59]. In this study, the fragility functions were derived using the dataset obtained from incremental dynamic analysis (IDA). A series of nonlinear time history analyses were performed using forty selected ground motion records scaled to different intensity levels in order to generate a wide range of intensity measures (IMs). For each record, the IDA results were expressed as capacity curves in terms of IM and engineering demand parameters (EDPs), where the EDP is represented by the maximum inter-storey drift ratio ( I D R m a x ).
The exceedance of predefined damage states (DSs) was evaluated based on I D R m a x , where a damage state is considered exceeded when the corresponding drift threshold (defined in Table 5) is reached or exceeded. When the exceedance point did not coincide exactly with a computed intensity level, linear interpolation between consecutive points of the IDA curves was used to estimate the corresponding IM value at exceedance.
The probability of exceedance at each intensity level was then calculated as the ratio of the number of records exceeding the specified damage state to the total number of records. The resulting discrete exceedance data were subsequently fitted using a log-normal cumulative distribution function. The fragility functions are therefore characterised by the median value (θ), corresponding to the intensity measure at 50% probability of exceedance, and the logarithmic standard deviation (β), which represents the dispersion of the data. The parameters (θ, β) were estimated using a maximum likelihood estimation (MLE) approach to ensure a statistically consistent fit to the IDA results. The fragility function was defined through a log-normal cumulative distribution function which is given as follows:
P D C I M = Φ l n I M l n θ β ^
where P D C I M is the probability that a ground motion with an IM will cause the structure damage state C, Φ [ ] is the standard normal cumulative distribution function (CDF), ln(θ) and β are the median of IMs in log scale and standard deviation of the IMs in log scale, respectively.

3.2.3. Considered Buildings

The buildings that were used in previous sections were used to perform the intended time history analysis. As such, four- and six-storey buildings with different levels of eccentricity in the two directions were considered: EX1, EX2, EY1, and EY2 which correspond to 7.4%, 22.2%, 10.5%, and 21% of the dimensions of buildings in X- and Y-directions respectively. In addition, the regular counterparts (NO-ECC) were analysed, and their results were used as the reference case. Table 6 summarises the characteristics of the considered cases. It is worth noting that the level of eccentricity was maintained below 25% to have a realistic range for such a case.

4. Results of the IDAs

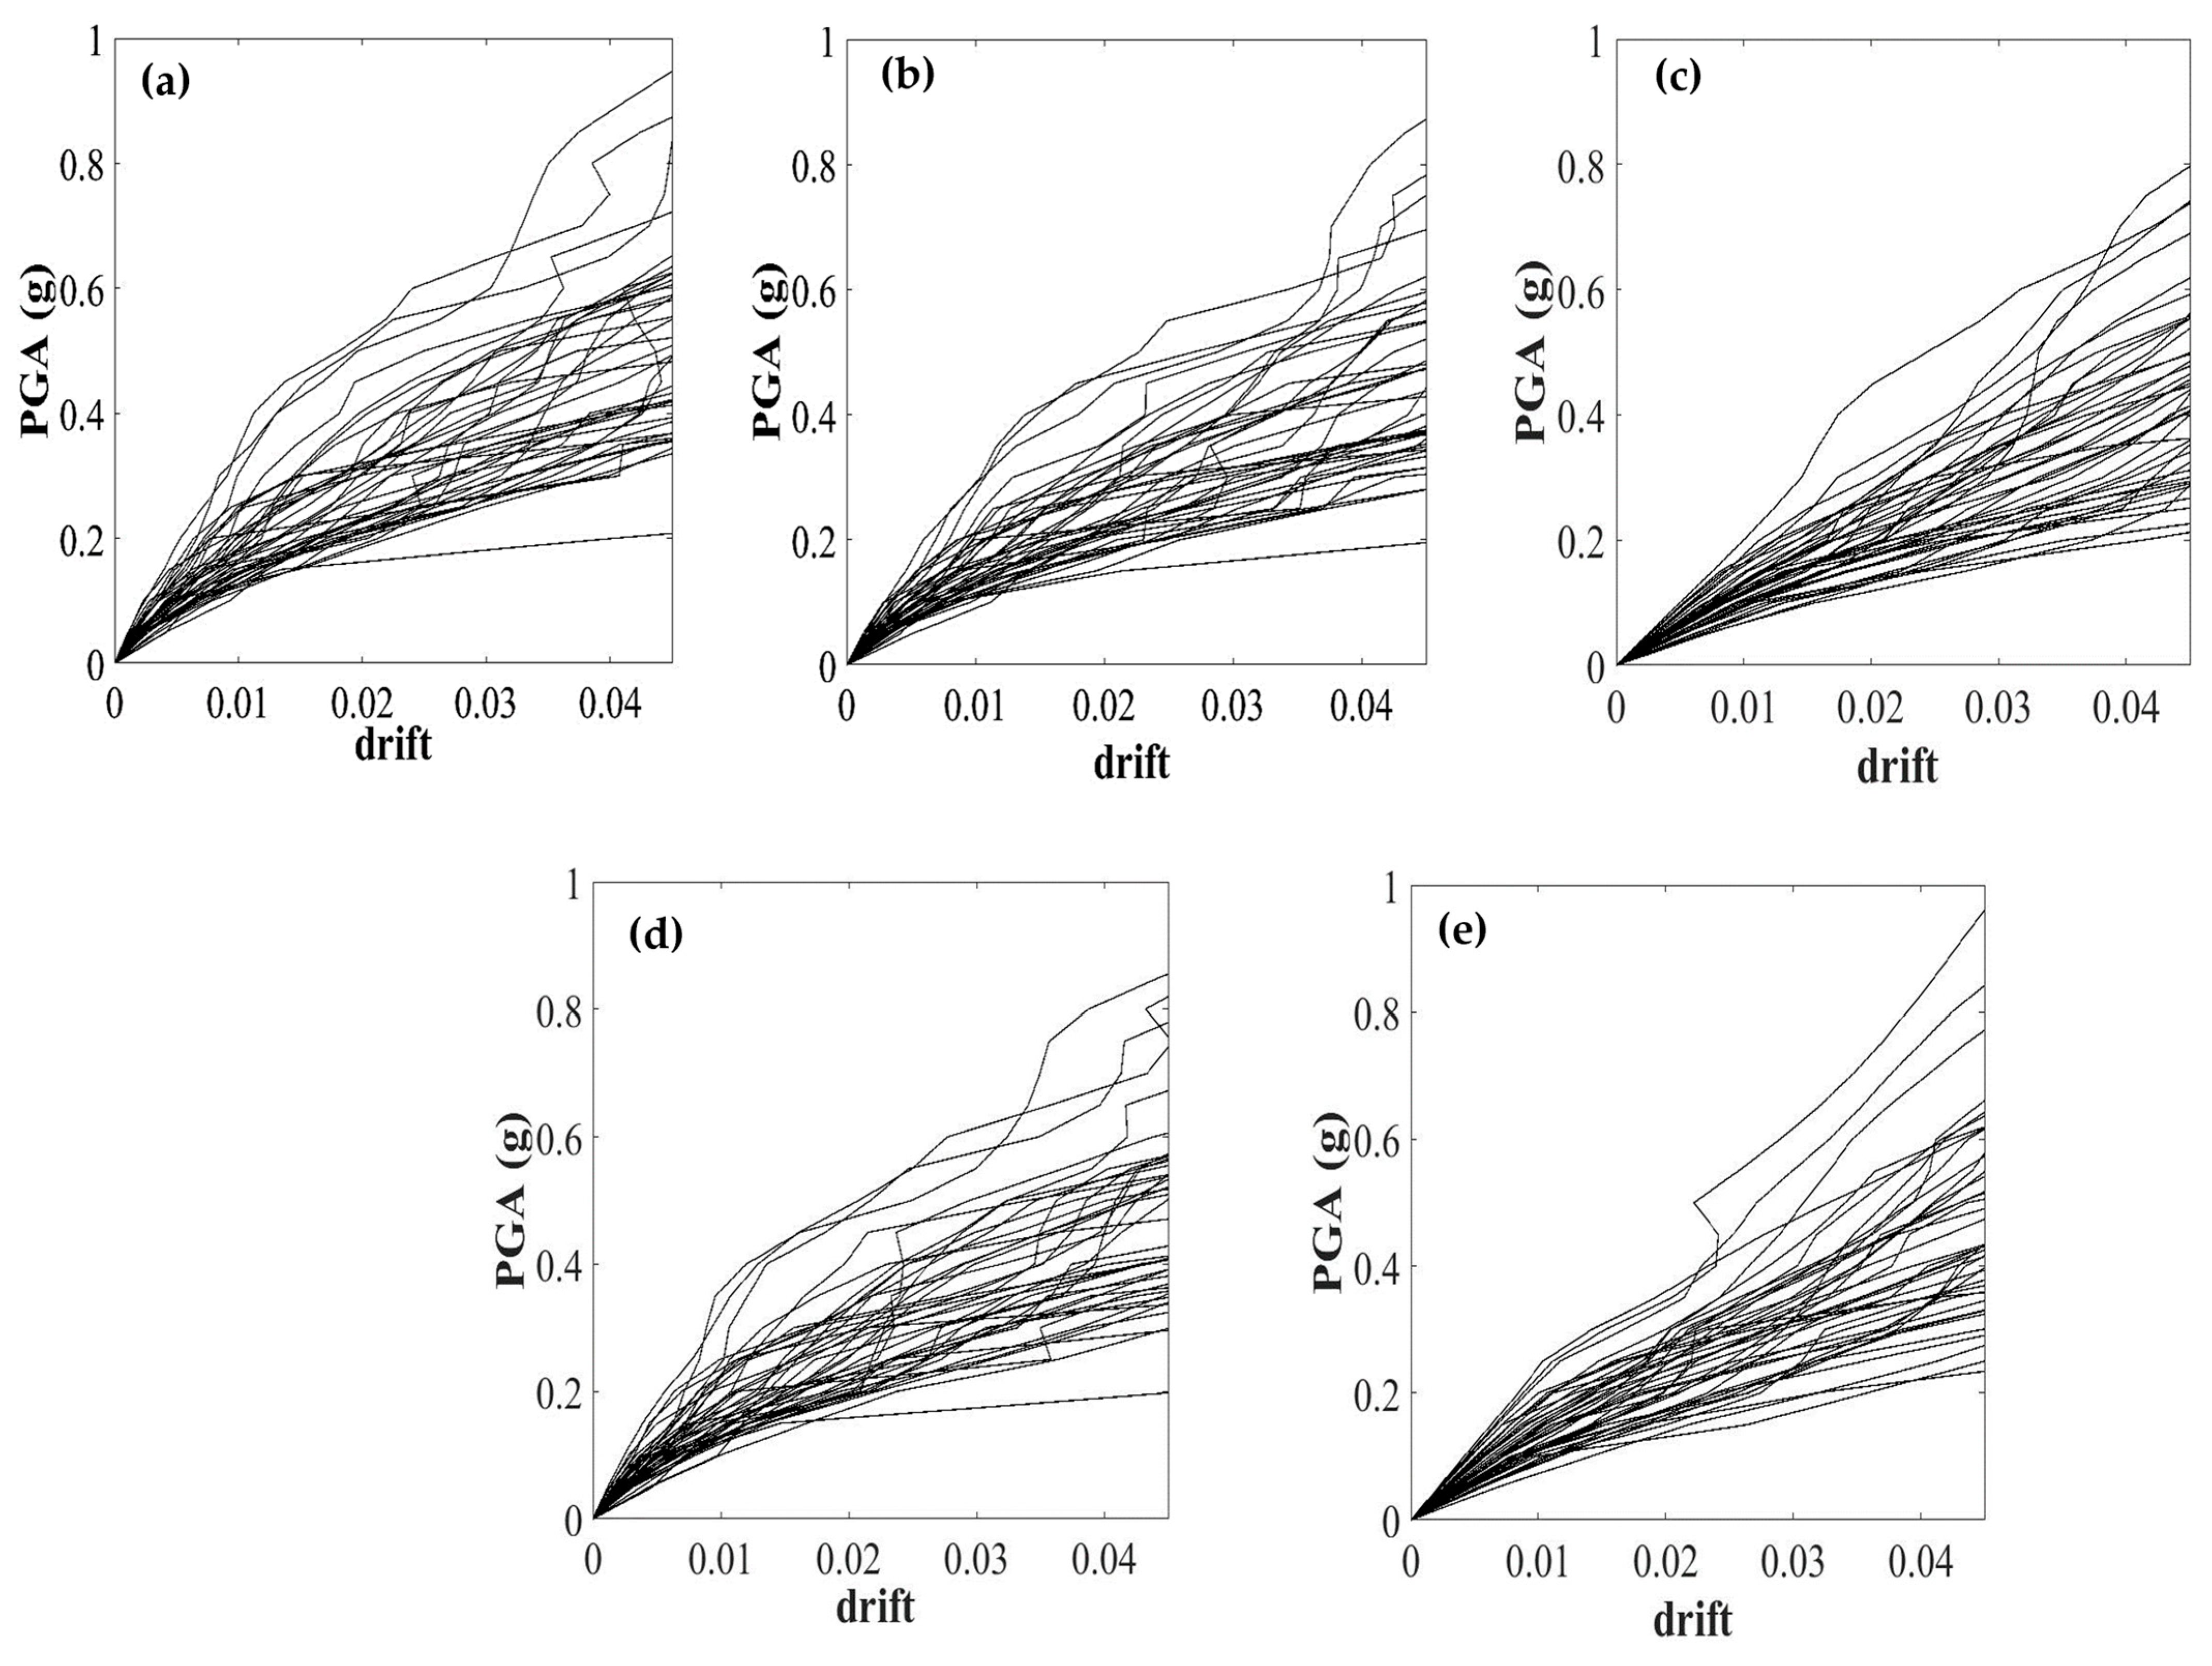
The selected ground motion records were used to perform the incremental dynamic analysis (IDA) for the considered buildings using three-dimensional models developed in OpenSees [18]. A total of 40 ground motion records were employed, and peak ground acceleration (PGA) was adopted as the intensity measure (IM). Each record was scaled to predefined PGA levels (e.g., 0.05 g, 0.10 g, 0.15 g, 0.20 g, etc.) using a scaling factor defined as the ratio between the target PGA and the original peak value of the record. For each scaled level, nonlinear time history analysis was conducted, and the structural response was evaluated in terms of the maximum inter-storey drift ratio (IDRmax). Considering torsional effects, the IDRmax values were obtained from the most critical locations, particularly at the building edges, and the resultant drift demand was calculated by combining the responses in both X- and Y-directions. The IDA curves represent the relationship between IDRmax and PGA for each record, and the analysis was continued incrementally until the collapse condition was reached, defined by exceeding the collapse drift threshold given in Table 5. The analyses were completed up to the defined collapse condition for all considered cases.
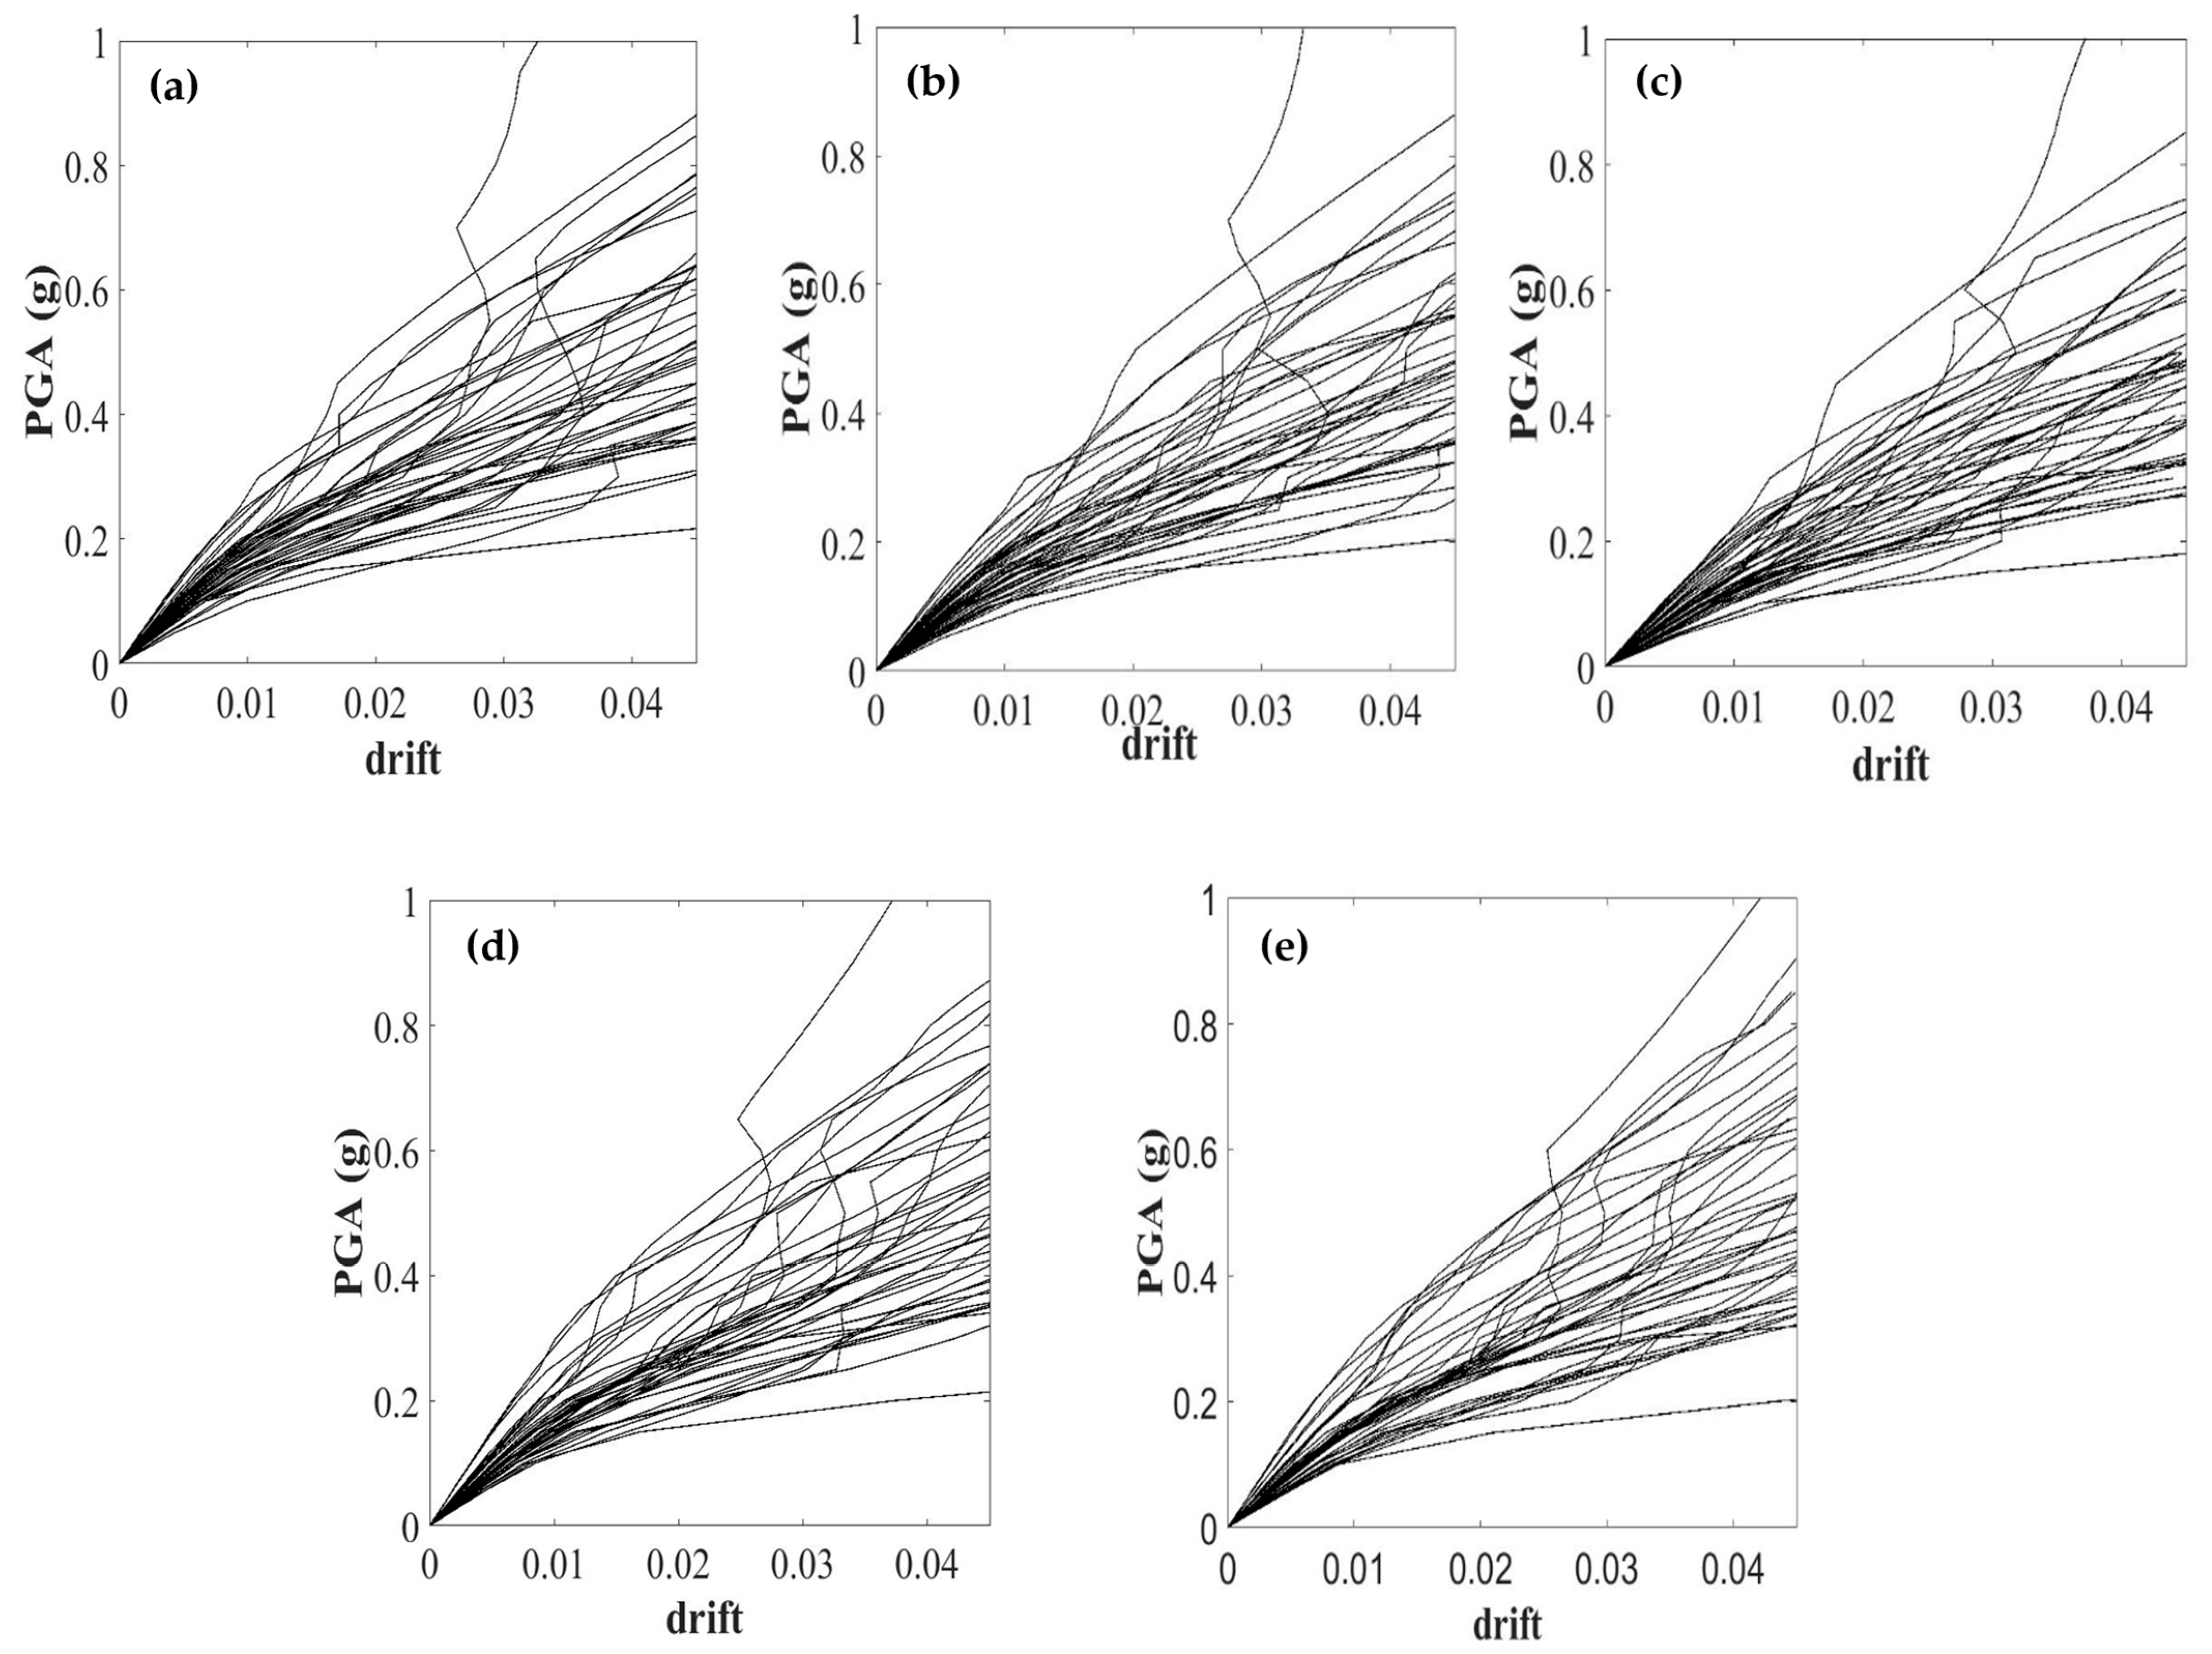
The IDA results presented in Figure 11 and Figure 12 indicate that plan eccentricity significantly modifies the nonlinear seismic response of the studied buildings. The irregular configurations systematically reach the same drift levels at lower PGA values than the regular configuration, indicating an increase in deformation demand. For the four-storey building, the PGA corresponding to approximately 2% drift decreases from about 0.26 g in the regular case to nearly 0.20 g in the most irregular configuration (EX2), representing a reduction of approximately 23%. Similar reductions are observed for larger drift levels (≈4%), confirming that plan eccentricity accelerates the development of nonlinear behaviour. This behaviour can be attributed to torsional amplification, which increases displacement demand at the edges of the structure and promotes earlier formation of nonlinear mechanisms.
In contrast, the six-storey building exhibits a noticeably smaller sensitivity to plan eccentricity. For the same drift level (≈2%), the PGA decreases from approximately 0.30 g in the regular configuration to about 0.26 g in the most irregular case, corresponding to a reduction of roughly 13%, while the reductions in the Y-direction remain below 7%. The smaller influence of eccentricity in the taller structure can be explained by its greater global flexibility, which allows a more uniform redistribution of seismic demand and reduces the relative amplification of torsional effects. Consequently, the IDA results indicate that low-rise buildings are more vulnerable to plan irregularity, a trend that is later reflected in the fragility curves derived from these.

5. Fragility Curve Results

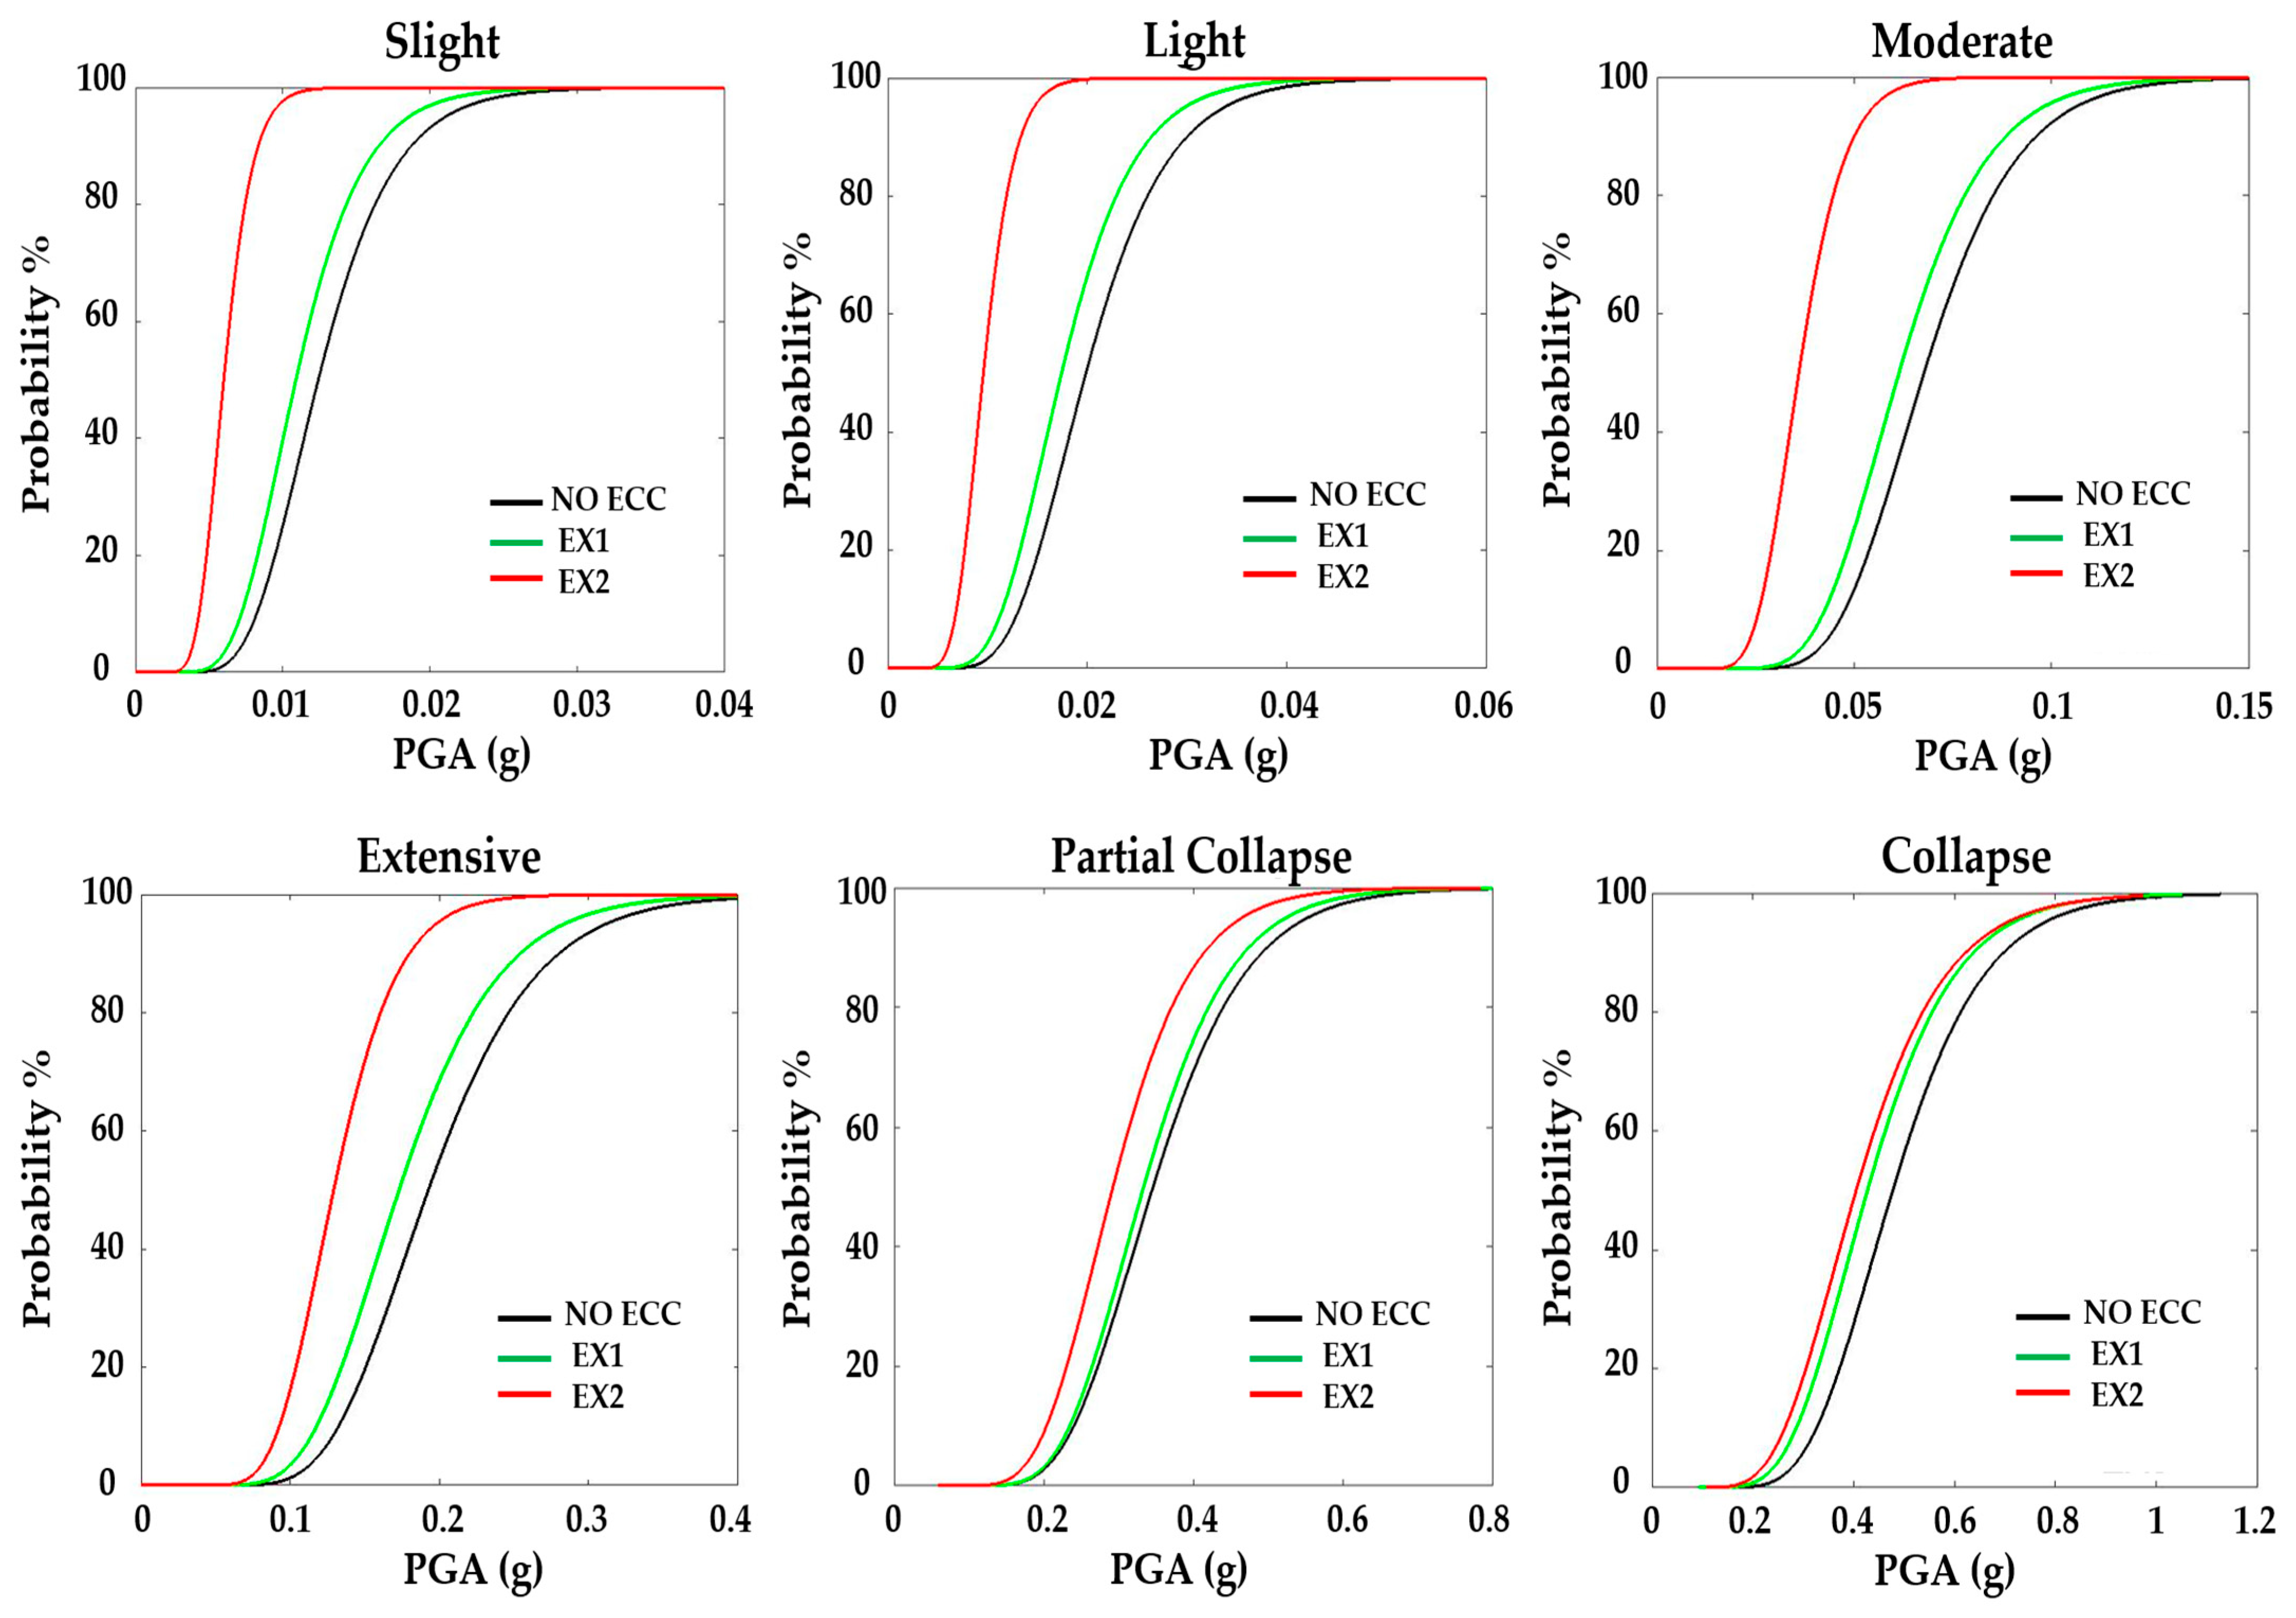
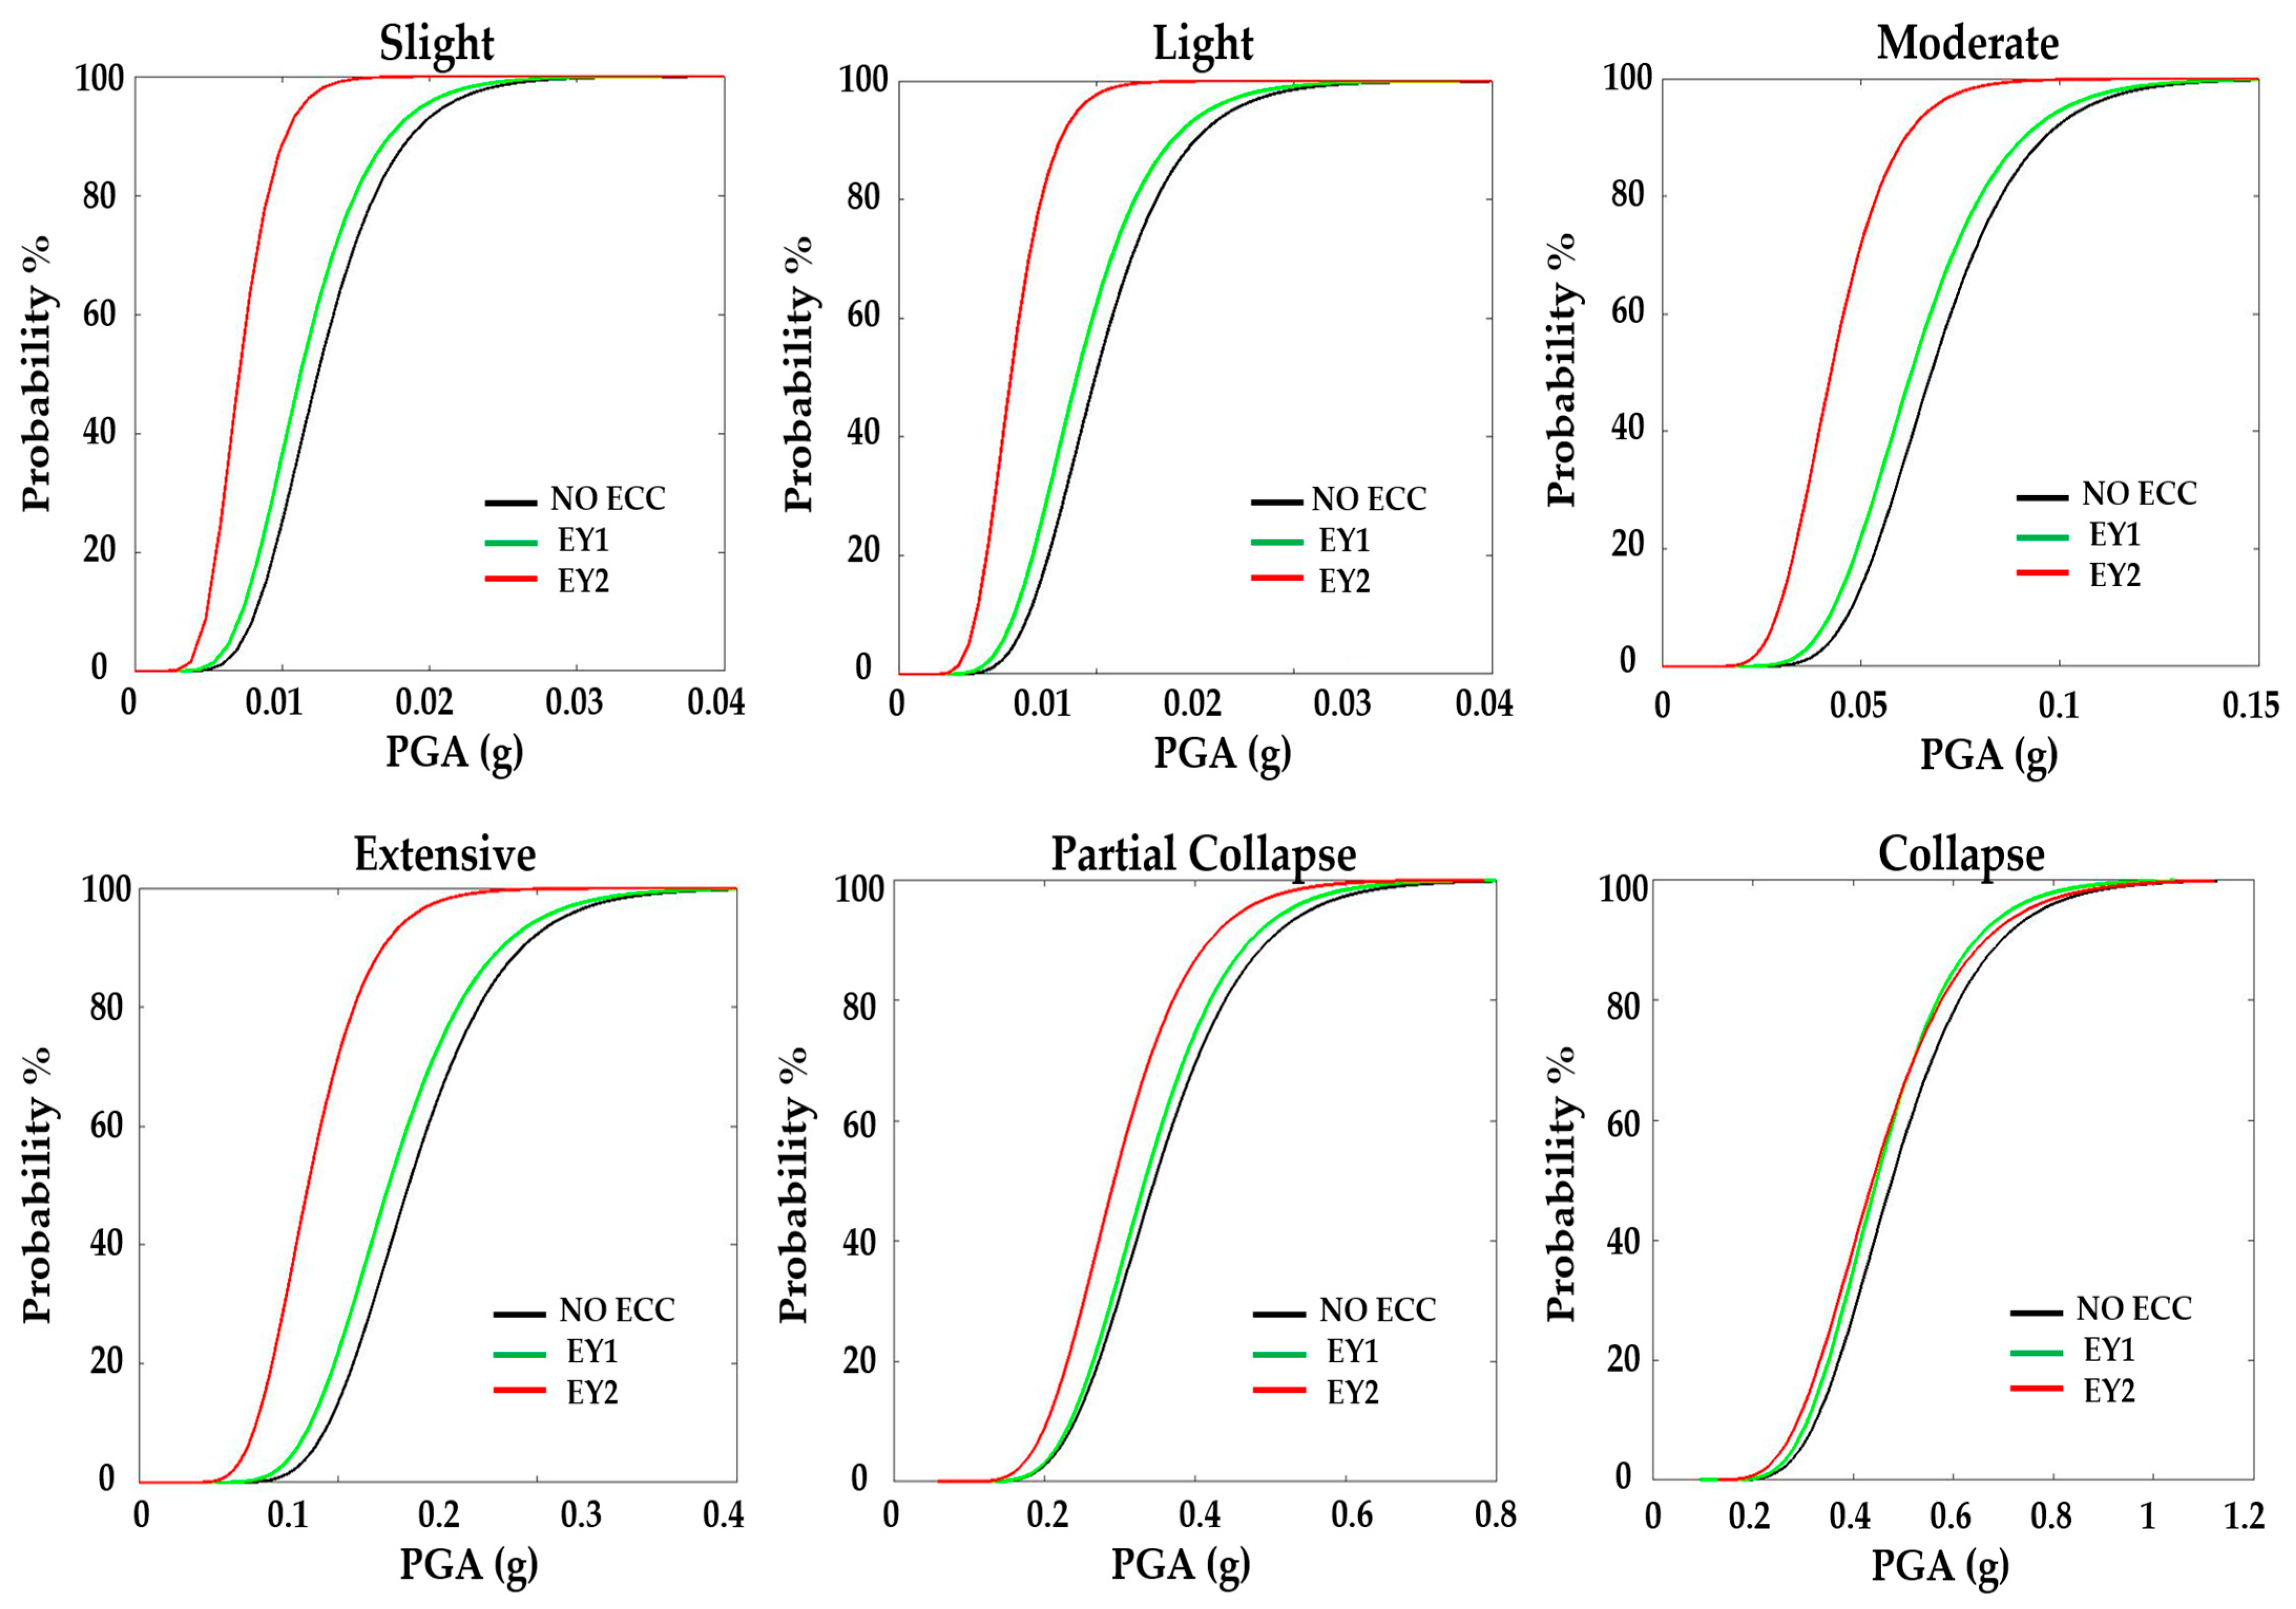
In order to estimate the effect of the eccentricity on the global performance of the considered buildings, the fragility curves for the four- and six-storey irregular buildings were compared to their regular counterparts. Figure 13 and Figure 14 present the fragility curves, at different limit damage states, for the four-storey building with two different imposed eccentricity directions in X and Y, respectively, along with the reference case (i.e., NO-ECC). As can be seen, the in-plane irregularity has a significant negative effect on the performance of the buildings and has a higher probability of damage, whereas the regular building case (NO-ECC) exhibits better performance for all the limit states. In addition, the buildings with eccentricity EX2 and EY2 are the ones performing the worst for all limit states due to the increase in the level of torsional stresses in those with higher eccentricity ratios. With regard to the performance of the cases, EX1 and EY1 are situated between the performance of NO-ECC and EX2 or EY2, respectively. For the final limit state (i.e., collapse), even though the lower tail of the fragility curves, which significantly influences the loss estimation indices, leads to a similar conclusion, the upper tail shows that the eccentricity does not have a significant impact between the two cases (i.e., EY1 and EY2).
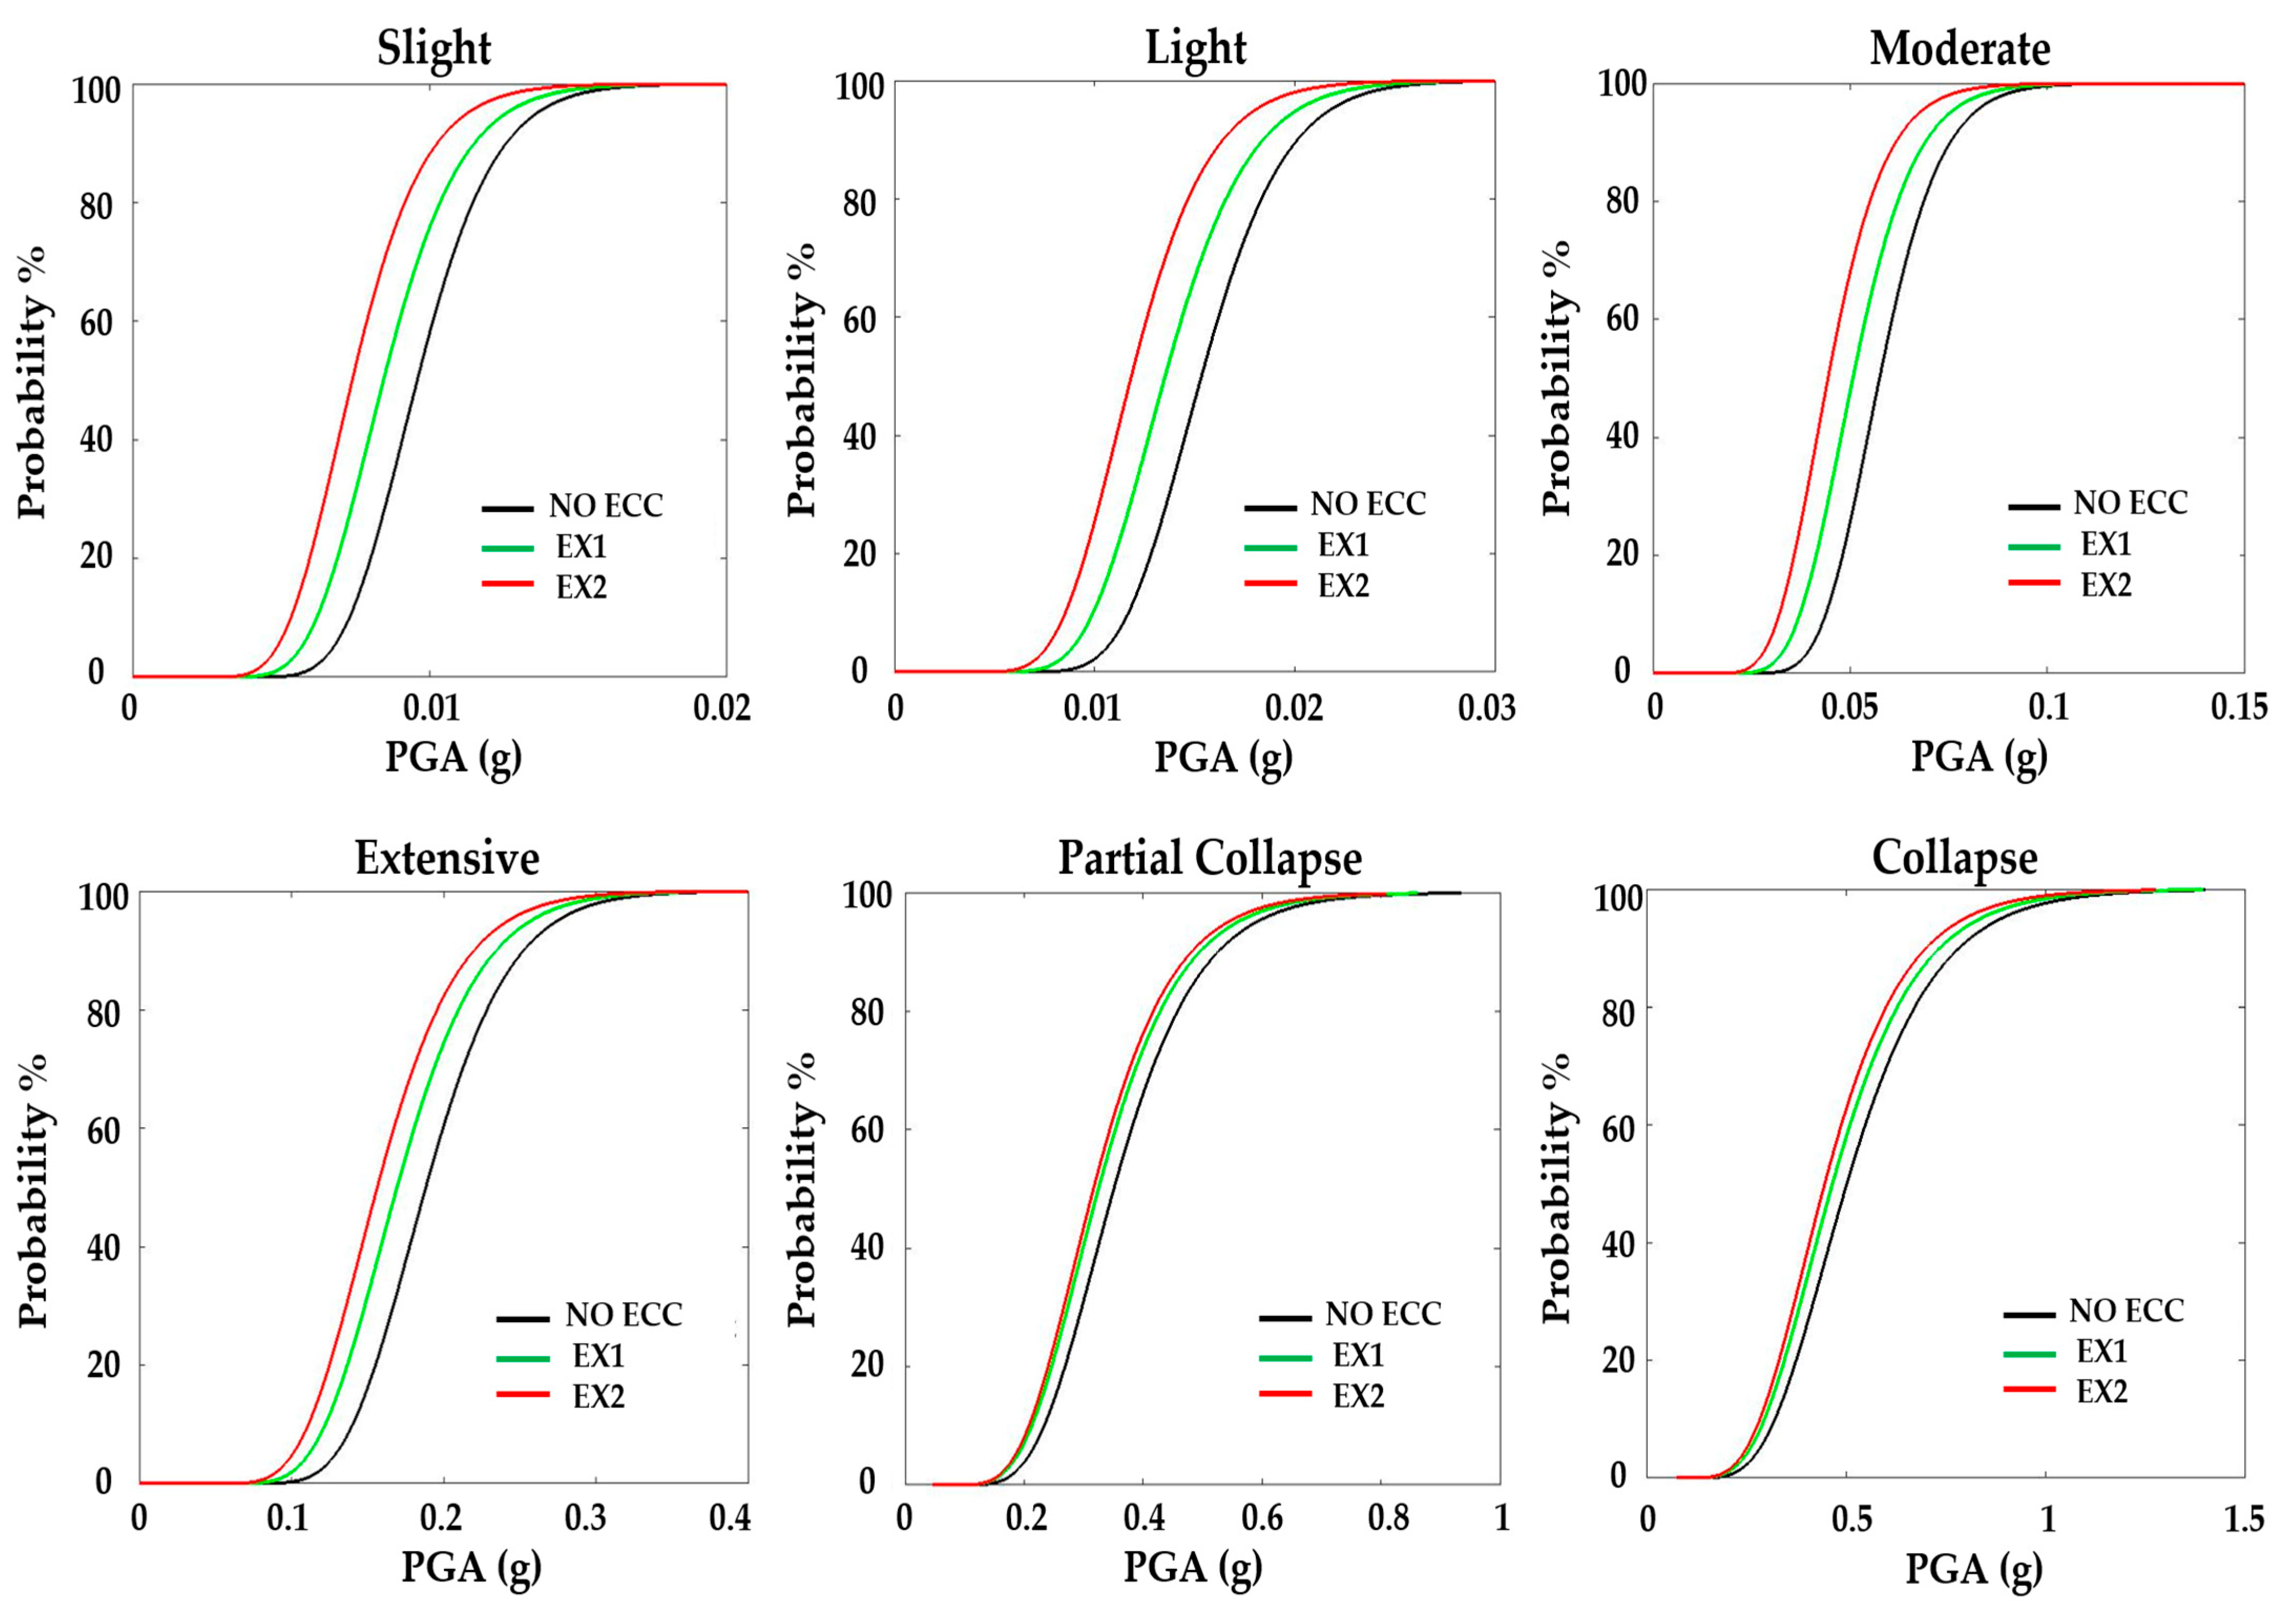
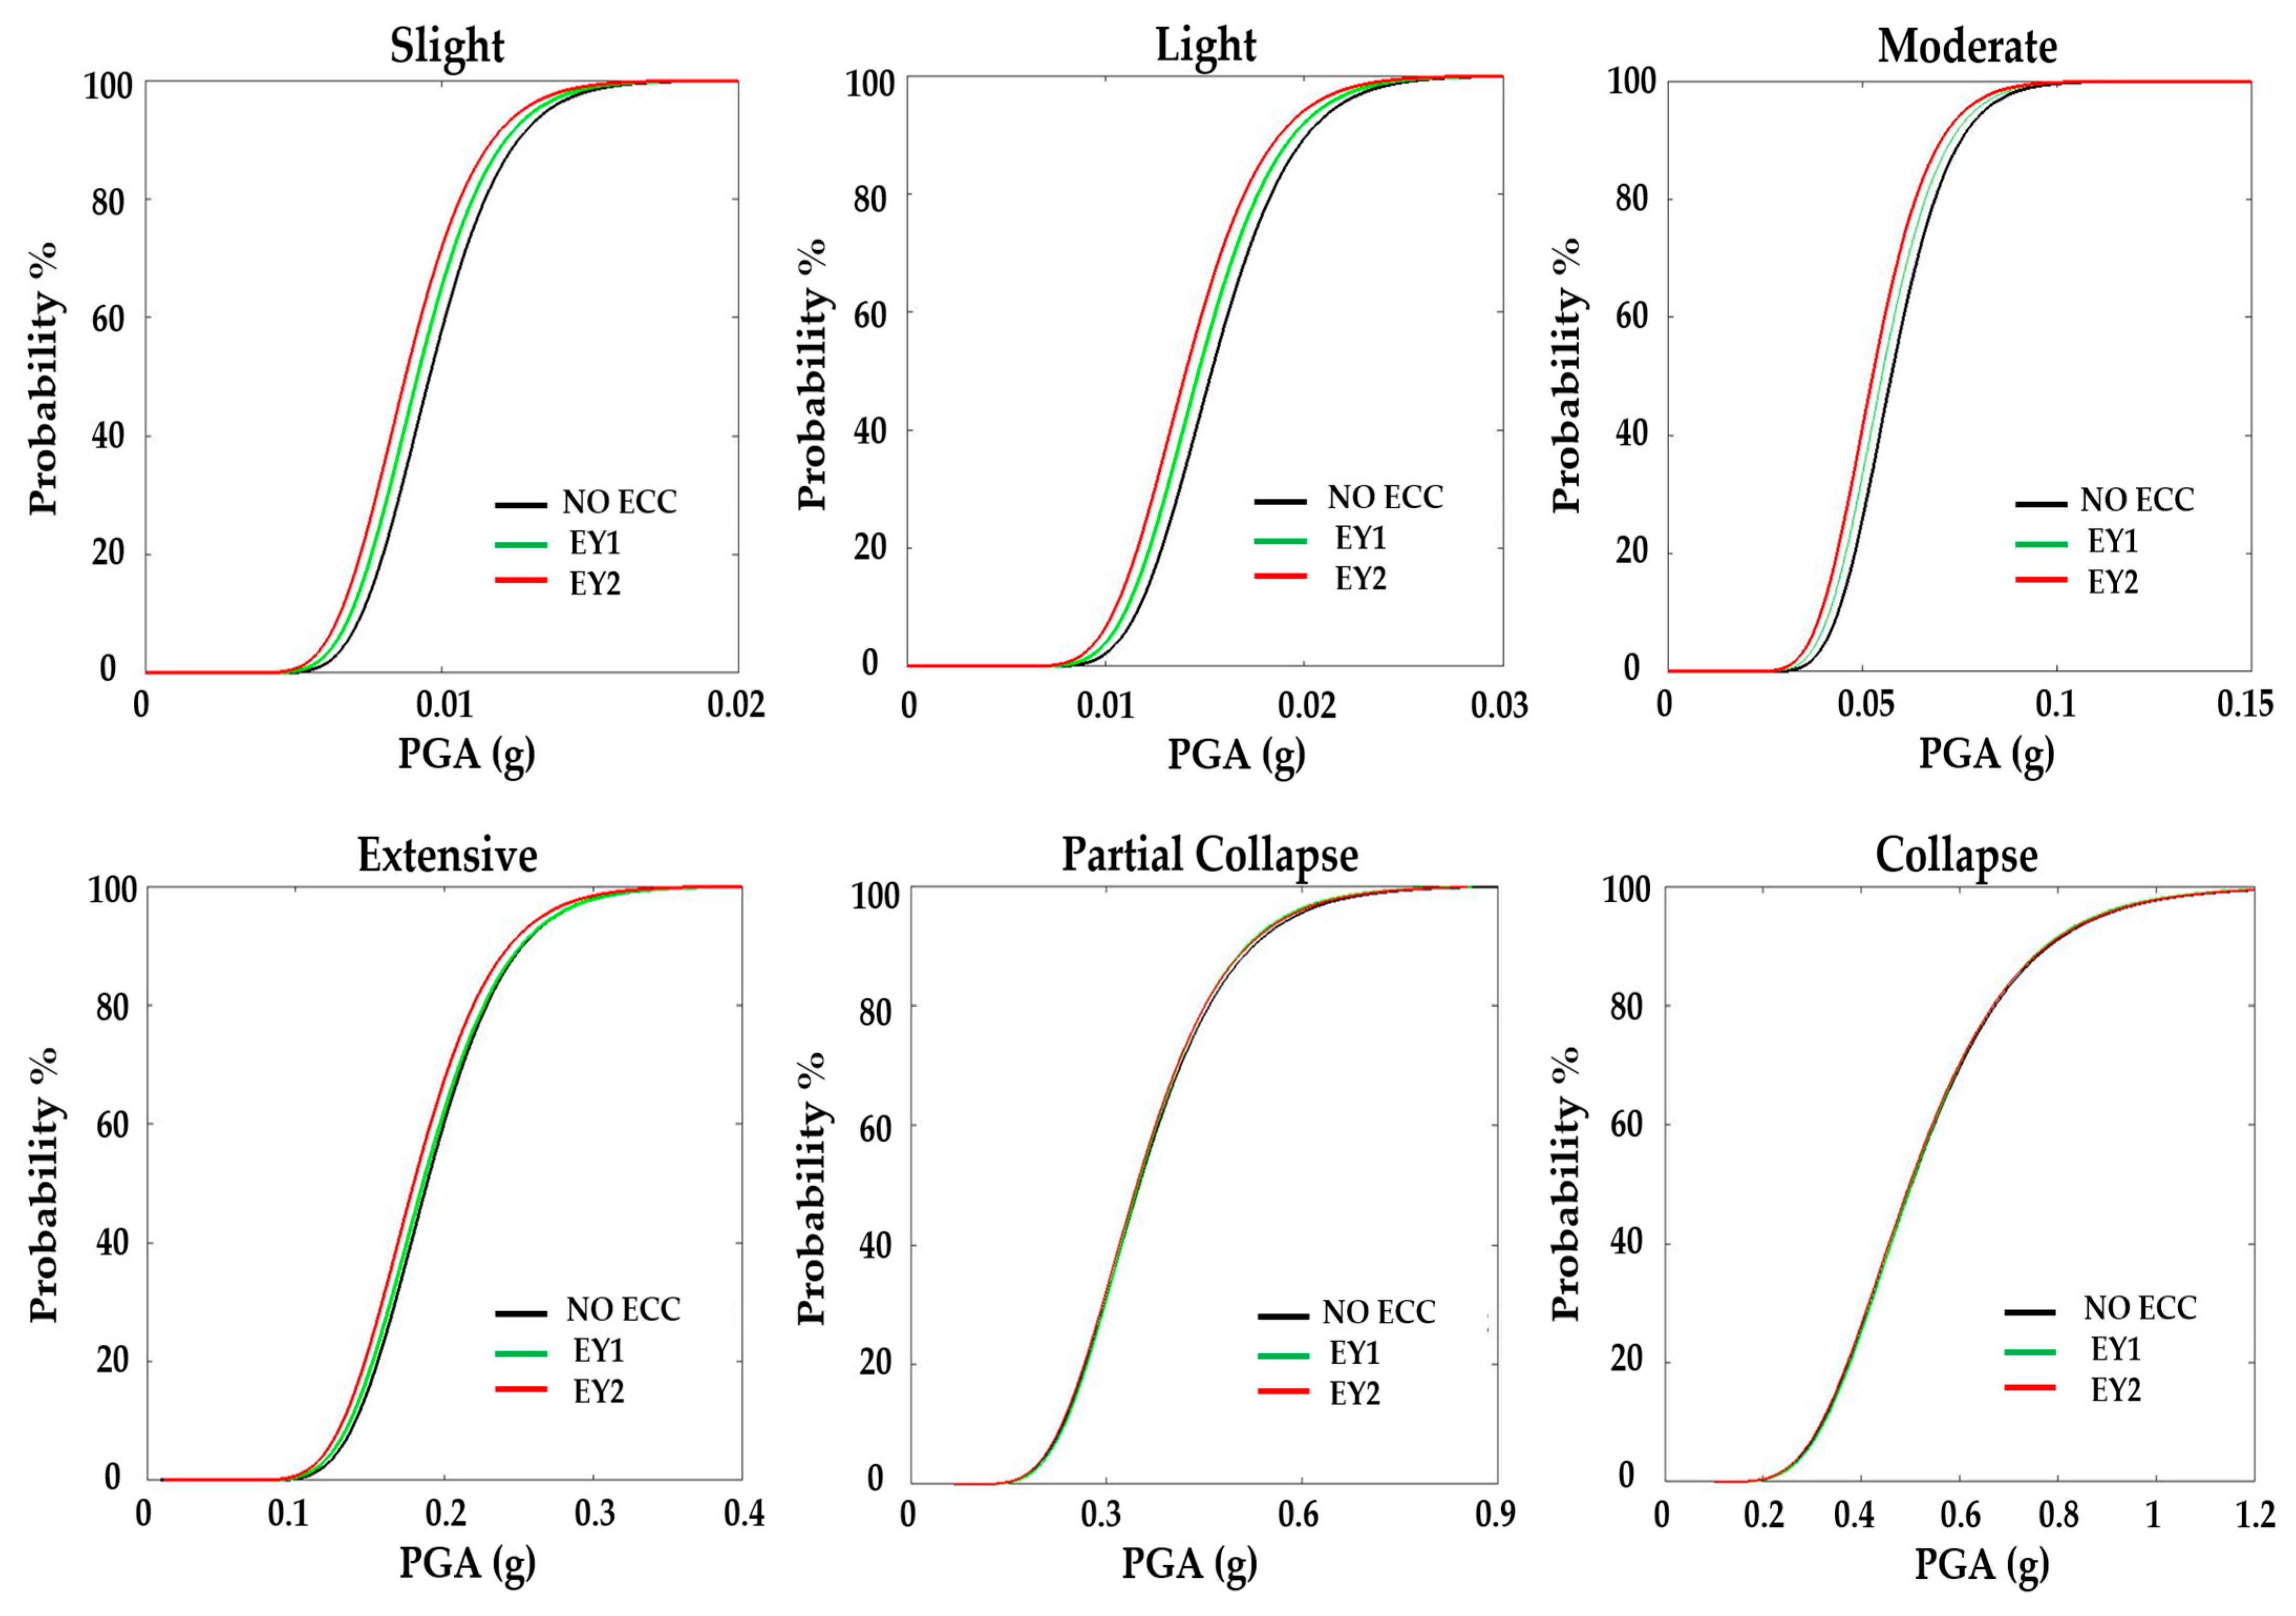
For the six-storey building, as illustrated in Figure 15 and Figure 16, a similar conclusion was found for the X-direction and Y-direction, respectively. However, the overall performance of the six-storey building is better, especially for the more severe limit states (i.e., the partial collapse and collapse limit states), compared with the performance of the four-storey building due to the increase in the lateral flexibility with increasing height. Despite the fact that the plan irregularity has a considerable influence on the vulnerability of the buildings, cases EY1 and EY2 show the opposite for the more severe limit states (i.e., the partial collapse and collapse limit states). Here the performance of the cases EY1 and EY2 is almost similar to that of the reference case NO-ECC for the more severe limit states. For the higher damage limit state, the latter observations can be attributed to reaching the ultimate capacity for the buildings either with/without eccentricity. As such, the effect of eccentricity fades.
The seismic fragility curves were analysed at the median exceedance probability (50%), and the corresponding peak ground acceleration (PGA) values were extracted for all structural configurations and damage states. These values provide a quantitative basis for evaluating the influence of plan eccentricity on the seismic vulnerability of the studied buildings.
(A)
Influence of eccentricity on the four-storey building in the X-direction
The four-storey building in the X-direction exhibited the most pronounced sensitivity to structural eccentricity among all the investigated cases. In the slight damage state, the median PGA decreased from 0.0125 g for the regular configuration to 0.0106 g for model EX1 and 0.0058 g for model EX2, corresponding to reductions of approximately 15% and 54%, respectively. A similar trend was observed in the light damage state, where the median PGA decreased from 0.0196 g to 0.017 g and 0.00937 g, resulting in reductions of 13% and 52%, respectively.
As the damage state progresses, the influence of eccentricity remains evident but gradually diminishes. For instance, in the moderate damage state, the PGA decreases by 8.8% for EX1 and 47% for EX2 relative to the regular model. In the extensive damage state, the reductions become 8.4% and 32.1%, whereas in the partial collapse state, they decrease to 5.5% and 16.2%, respectively. In the collapse state, the reductions are 10.5% and 15.8%. These results clearly demonstrate that torsional irregularity significantly accelerates the initiation and propagation of damage in low-rise structures subjected to seismic excitations in the X-direction.
(B)
Influence of eccentricity on the four-storey building in the Y-direction
For the four-storey building in the Y-direction, eccentricity also increases seismic vulnerability, although the magnitude of its influence is lower than that observed in the X-direction. In the slight damage state, the median PGA decreases from 0.01235 g for the regular model to 0.01115 g for EY1 and 0.00723 g for EY2, corresponding to reductions of 9.7% and 41.5%, respectively. Comparable reductions are observed for the light damage state, where the PGA decreases by 7.5% for EY1 and 42.2% for EY2.
In the moderate damage state, the PGA decreased from 0.0679 g to 0.06226 g and 0.04189 g, corresponding to reductions of 8.3% and 38.3%. Similar trends persisted for extensive damage, with reductions of 7.5% and 37.6%, and the differences became smaller for partial collapse and collapse, where the reductions ranged between 4% and 8%. These results confirm that eccentricity increases the fragility in the Y-direction, although its impact remains less severe than that in the X-direction.
(C)
Influence of eccentricity on the six-storey building in the X-direction
For the six-storey building in the X-direction, the effect of eccentricity remains observable across all damage states, but with a moderate magnitude compared with the four-storey case. In the slight damage state, the median PGA decreases from 0.00958 g in the regular configuration to 0.00845 g for EX1 and 0.00728 g for EX2, corresponding to reductions of 11.8% and 24.0%, respectively. In the light damage state, the reductions are 12.4% and 23.8%, whereas in the moderate damage state, they are 12.2% and 24.4%.
For higher damage levels, the influence progressively diminishes. For extensive damage, the reductions decrease to 10.7% and 17.4%, whereas for partial collapse, they become 7.1% and 10.3%. For collapse, the reductions are limited to 6.7% and 12.9%. Compared with the four-storey building, these results indicate that an increase in the structural height reduces the relative influence of torsional eccentricity on the seismic capacity of the system.
(D)
Influence of eccentricity on the six-story building in the Y-direction
The six-storey building in the Y-direction exhibited the lowest sensitivity to eccentricity among all the investigated configurations. In the slight damage state, the median PGA decreased only slightly from 0.00963 g for the regular model to 0.009114 g for EY1 and 0.00872 g for EY2, corresponding to reductions of 5.4% and 9.4%, respectively. In the light and moderate damage states, the reductions remained below 9%.
For the extensive damage state, the reductions are very small (0.8% for EY1 and 5.7% for EY2), and in the partial collapse state, the differences are almost negligible (0.3–0.6%). In the collapse state, the three configurations converge to the same median PGA value (0.495 g), indicating that eccentricity has no significant influence on the collapse capacity of the six-storey building in this direction.
(E)
Overall trends
The results reveal three main observations. First, plan eccentricity systematically increases seismic fragility, as reflected by the consistent reduction in the median PGA values relative to the regular configuration. Second, this effect becomes more pronounced as the eccentricity ratio increases, because the models with higher eccentricity levels always exhibit lower PGA values. Third, the influence of eccentricity is generally more significant in the early and intermediate damage states and decreases as the response approaches collapse.
From a structural mechanics perspective, this behaviour can be attributed to the torsional response induced by plan eccentricity, which produces a nonuniform distribution of lateral displacements and internal forces among the vertical resisting elements. This torsional amplification leads to earlier damage initiation in the most stressed components under lower seismic intensities.
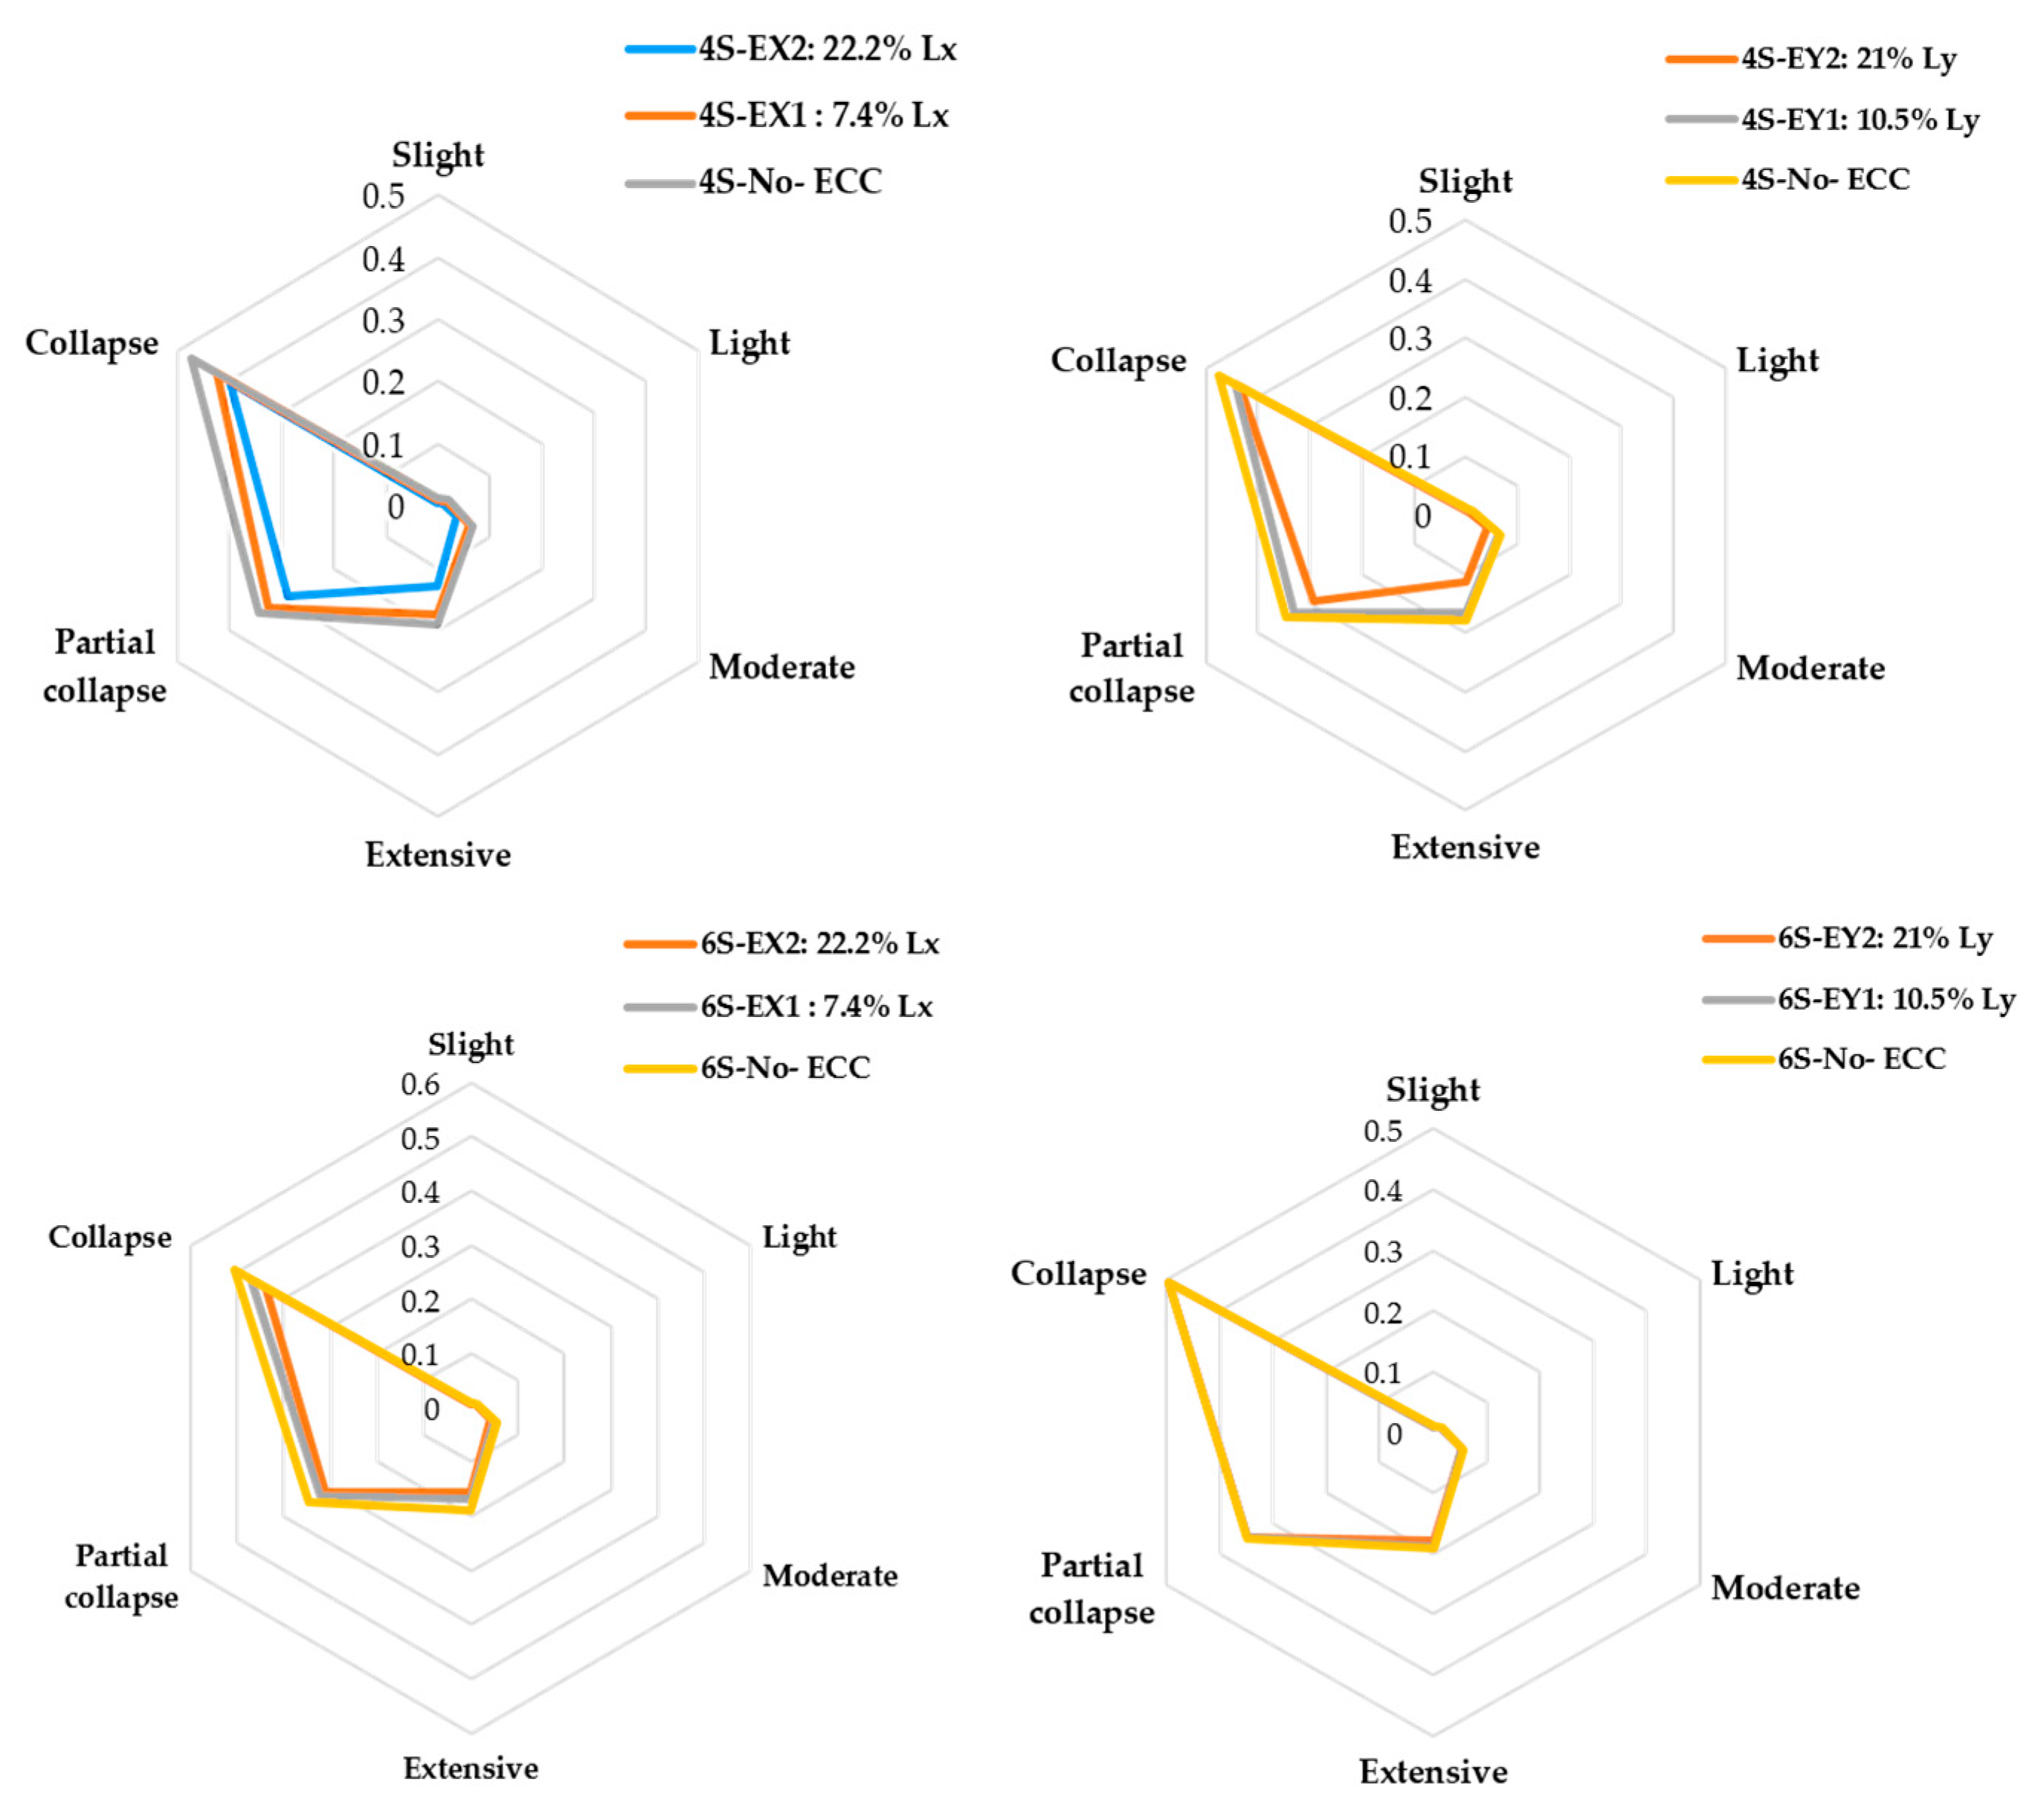
Overall, the results highlight that the detrimental effect of eccentricity strongly depends on both the building height and the direction of seismic excitation. The most critical case corresponds to the four-storey building subjected to X-direction loading, where the reduction in the median PGA exceeds 50% for the largest eccentricity ratio. Conversely, the six-storey building in the Y-direction shows only minor sensitivity to eccentricity, with complete convergence of the fragility curves in the collapse state. Figure 17 presents a radar diagram illustrating the variation of the median PGA corresponding to the same exceedance probability level for all structural configurations. The diagram provides a synthetic visualisation of the influence of plan eccentricity and building height on the seismic capacity of the studied structures across the different damage states.
To provide a more comprehensive quantitative summary, Table 7 reports the median PGA values at a 50% exceedance probability, together with the corresponding percentage reduction relative to the regular configuration for all investigated structural cases.
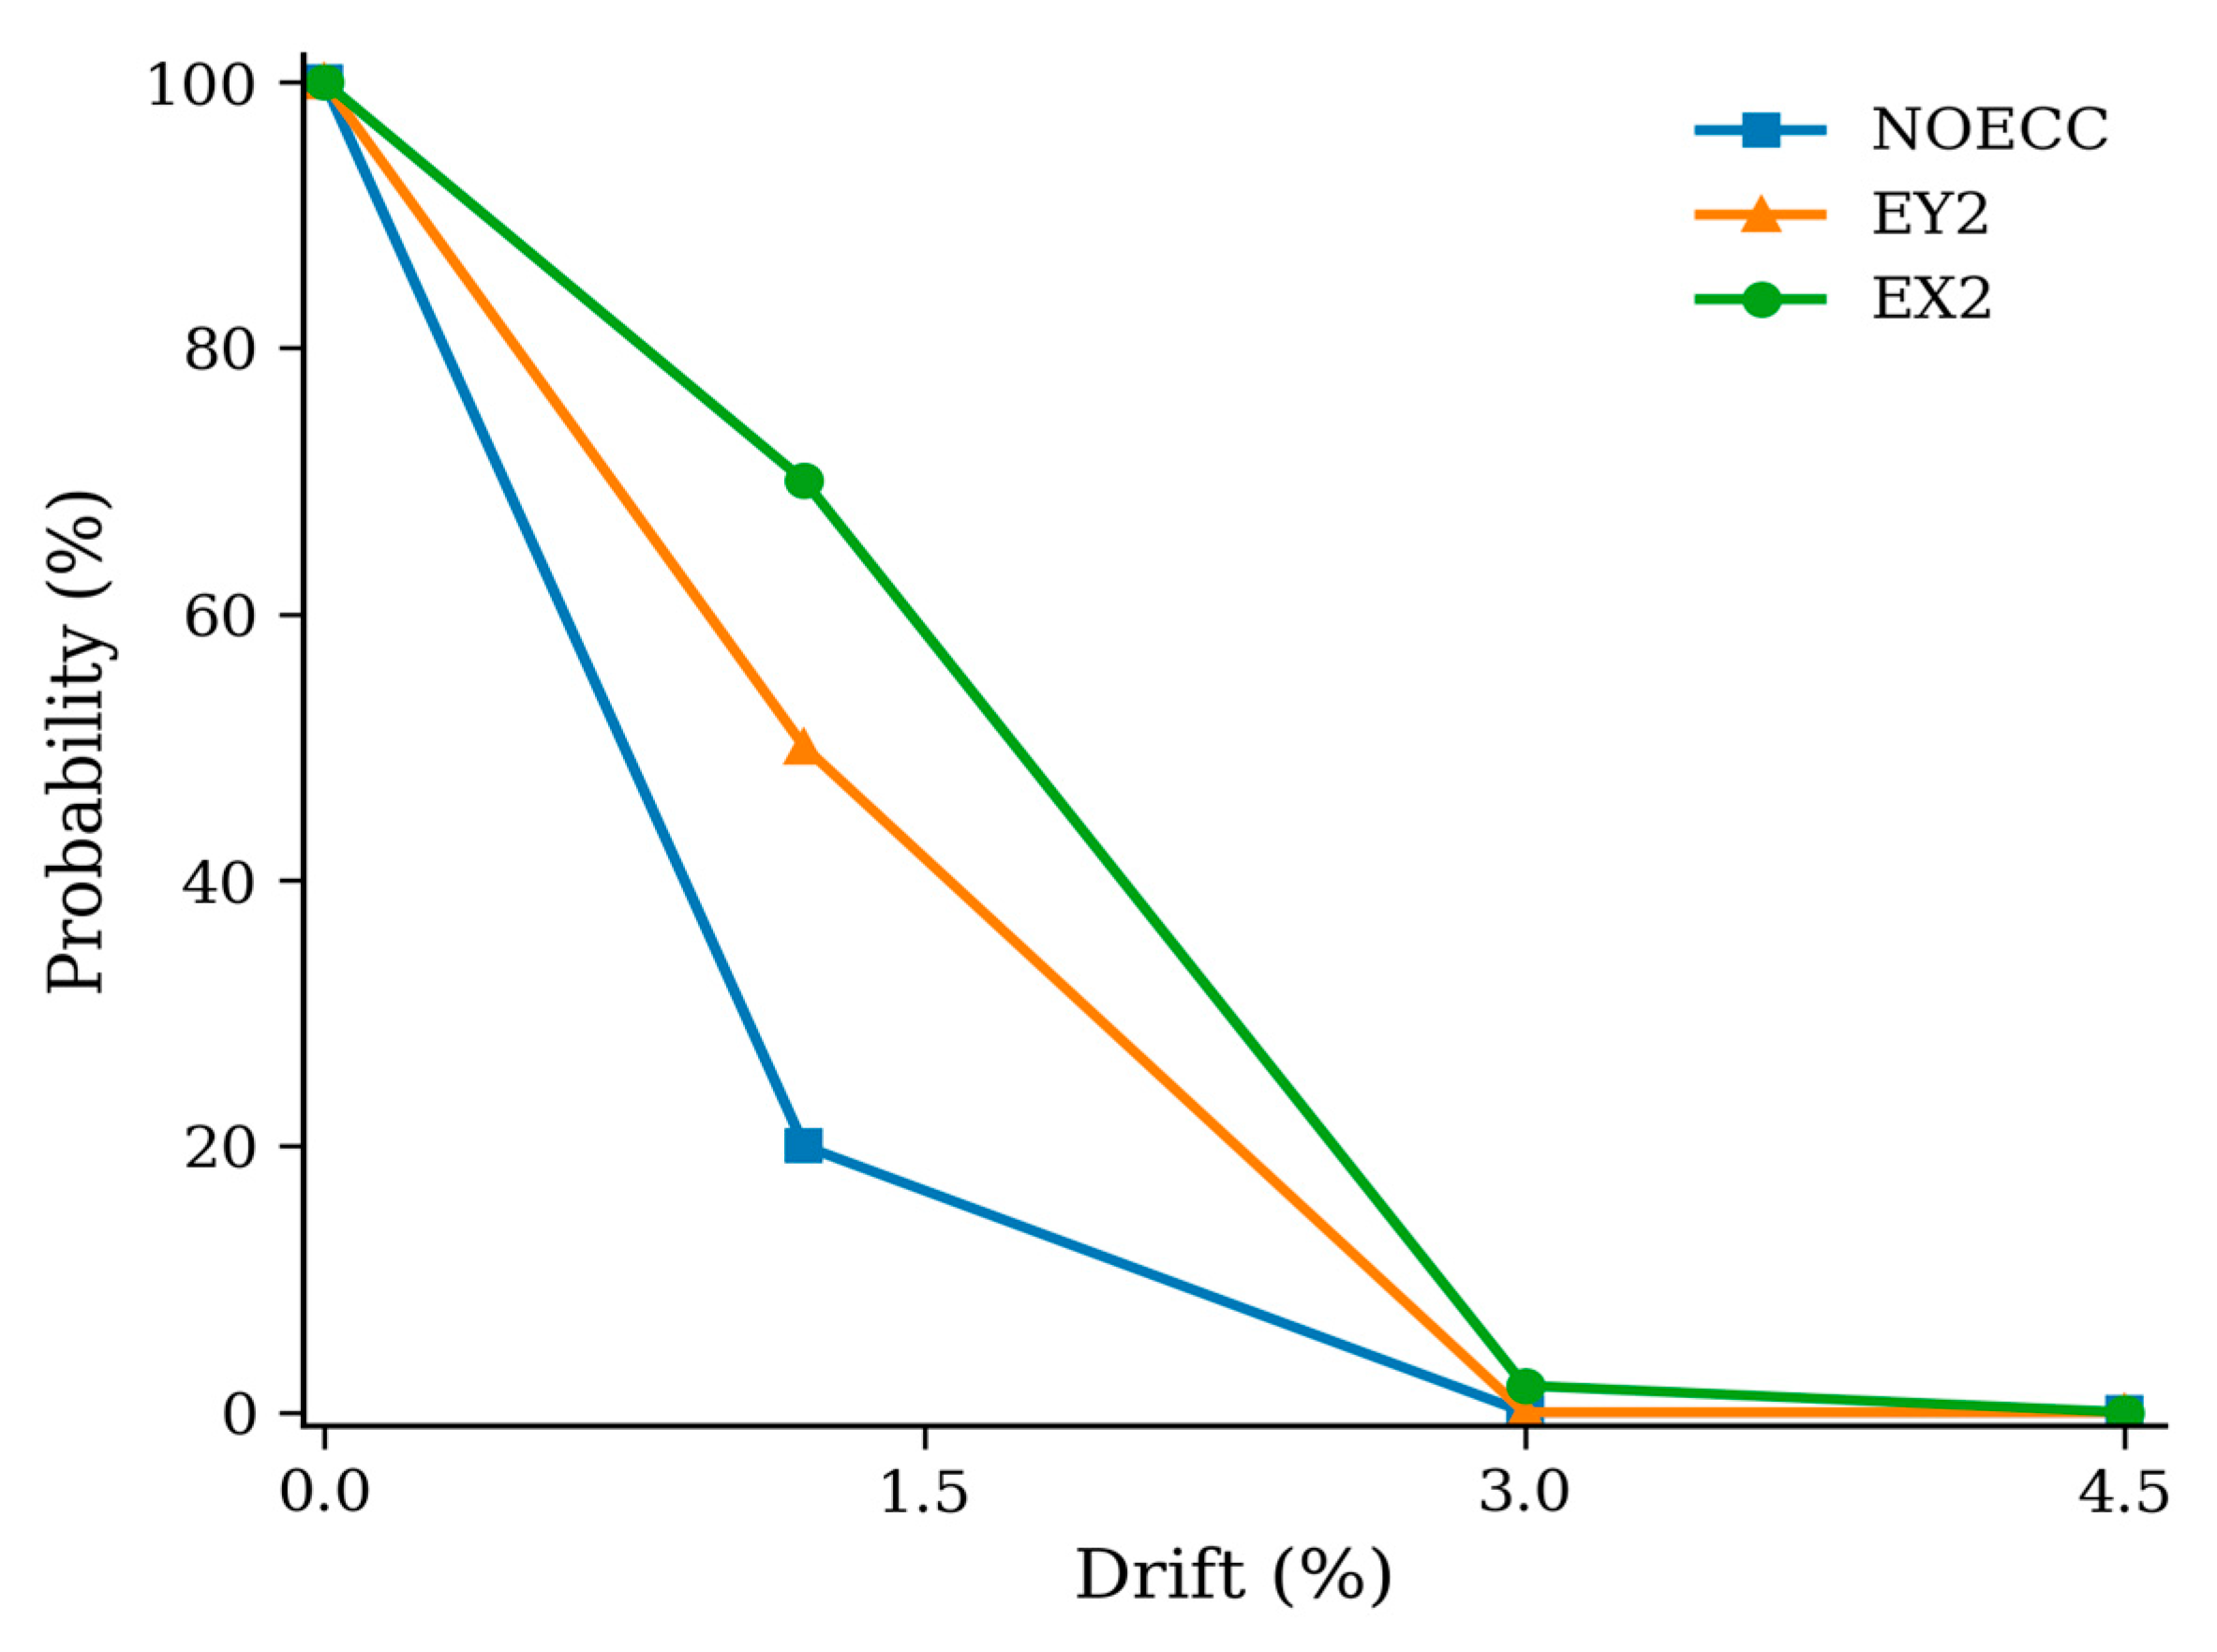
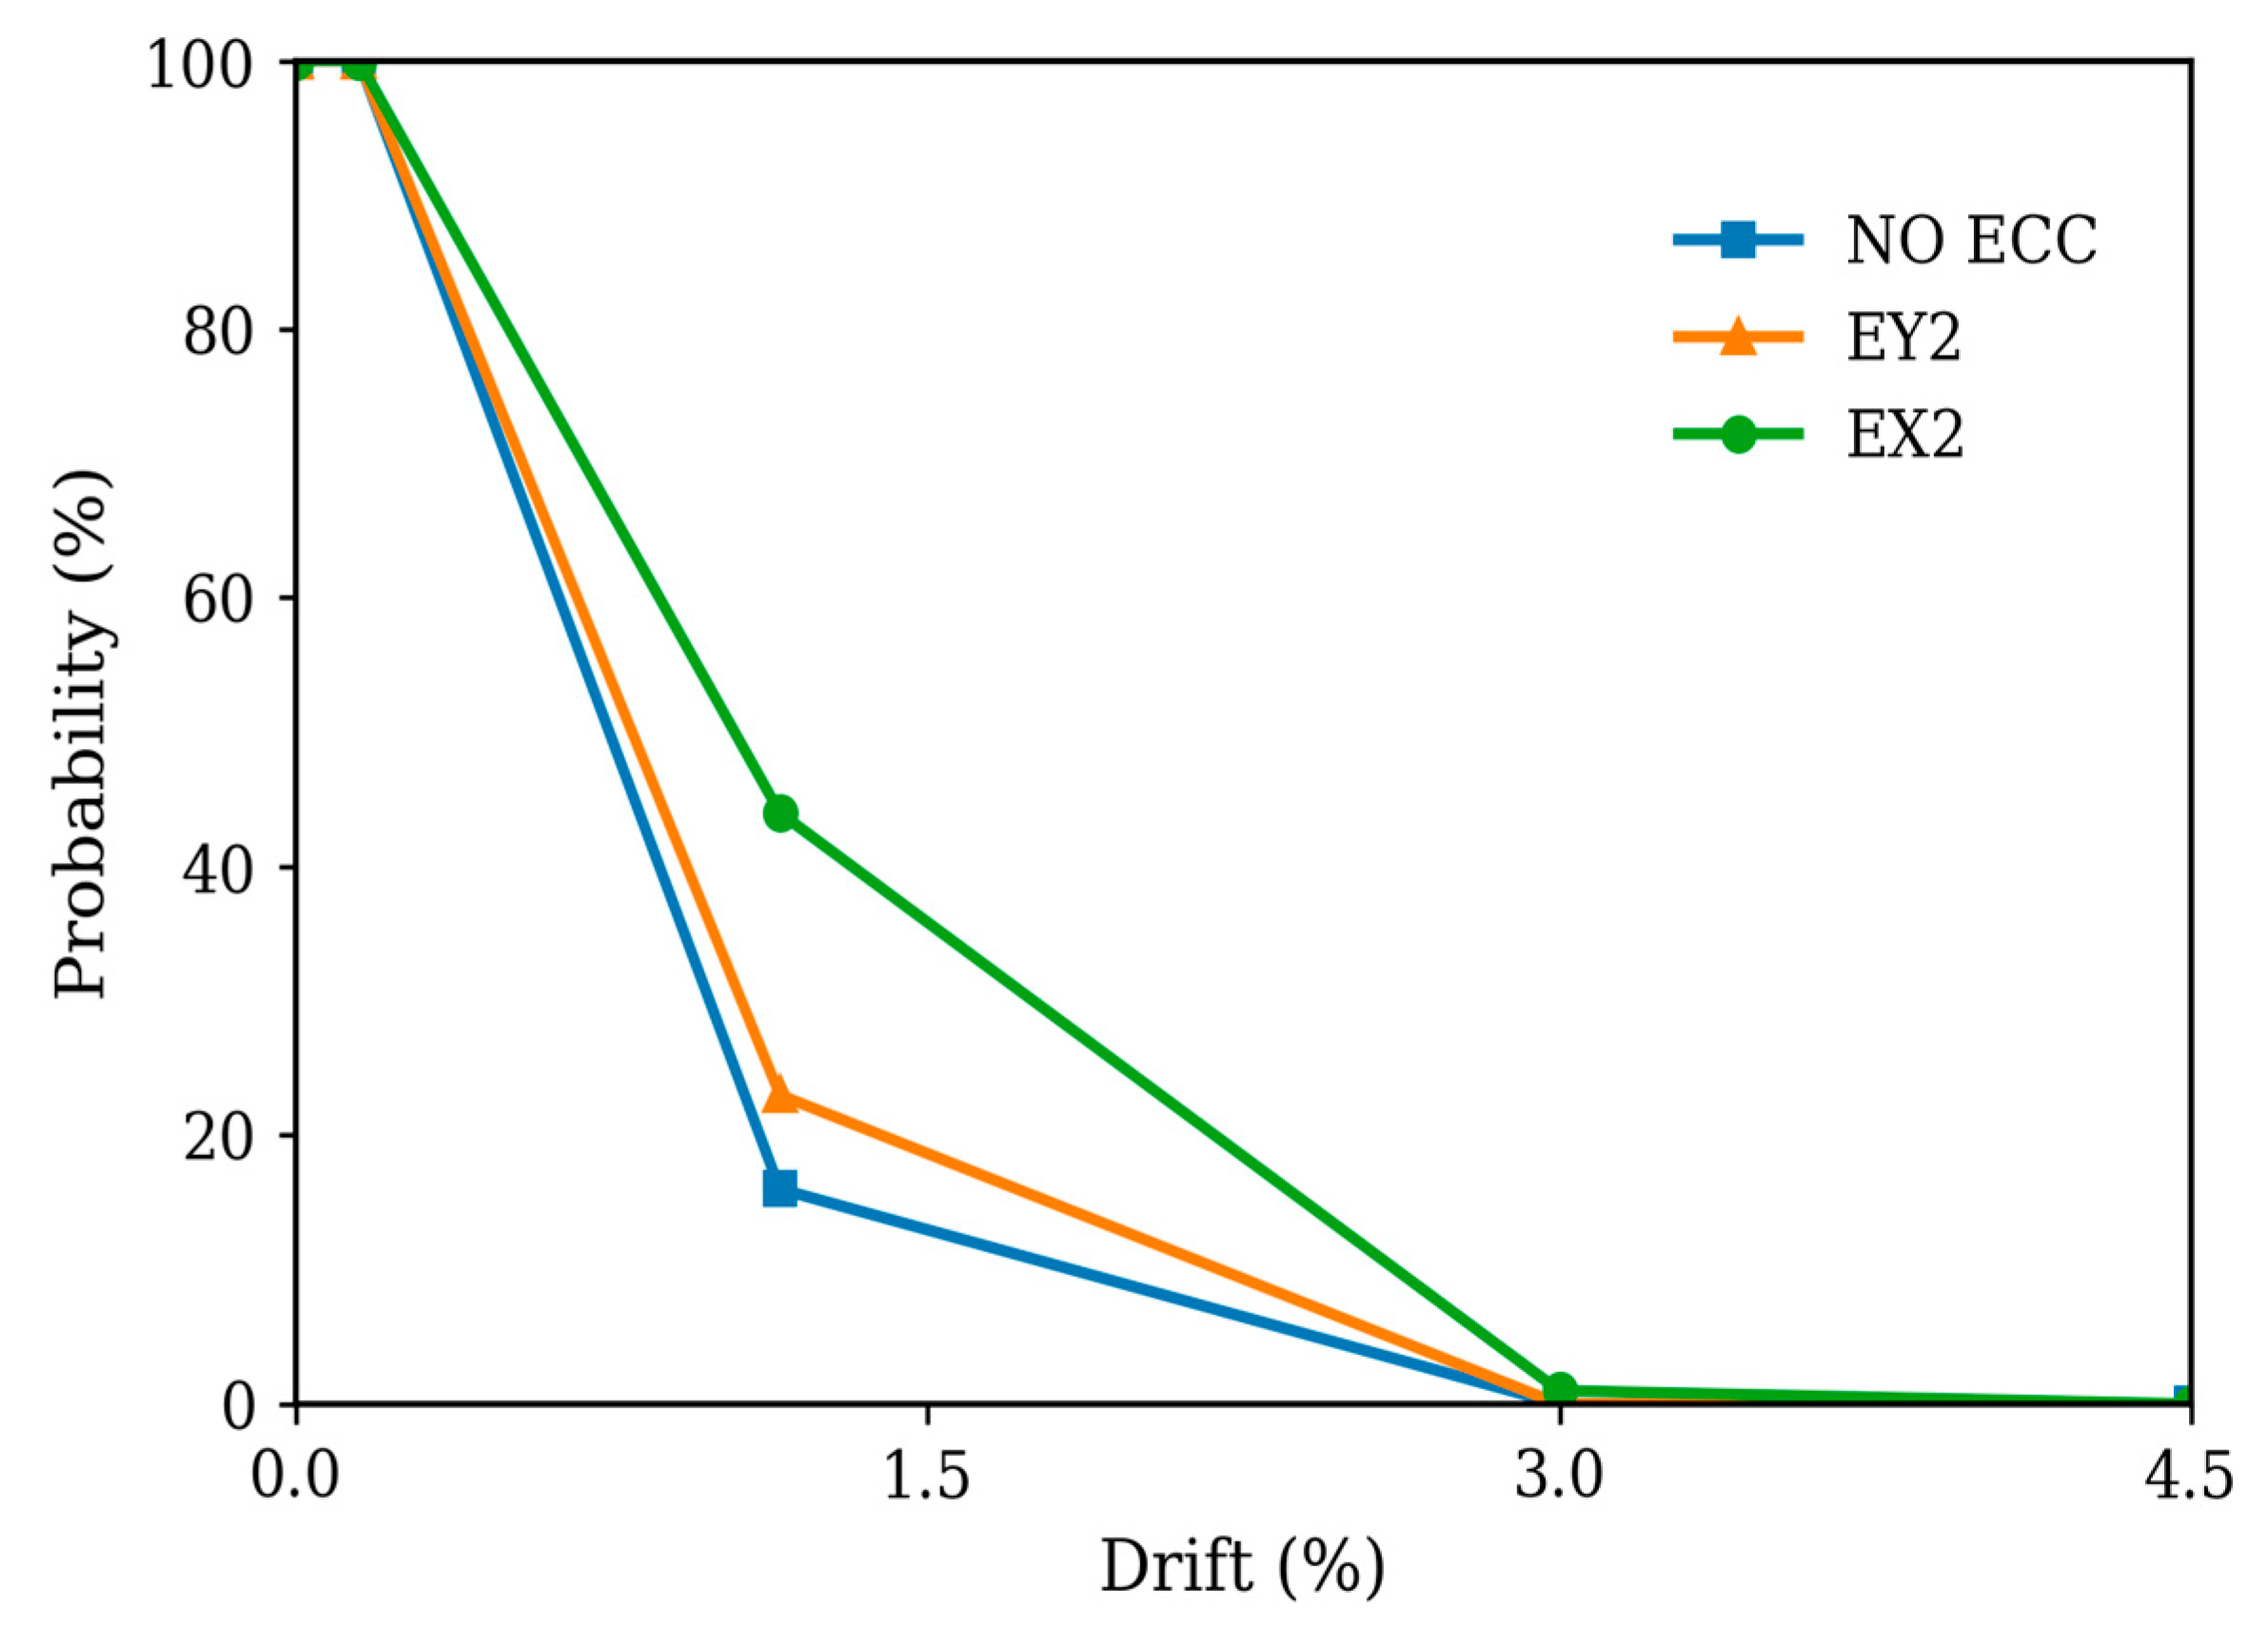
In order to estimate the behaviour of the considered buildings according to the criteria of the Egyptian code [2,19], the PGA has been imposed as 0.15 g which corresponds to Aswan. Figure 18 and Figure 19 present the relation between the predetermined exceedance probabilities for the considered damage limit state values at an IM equal to 0.15 g for the four- and six-storey buildings, respectively. As can be seen, increasing the eccentricity between CR and CM leads to an increase in the vulnerability of the buildings. Furthermore, the rate of the negative effect for the eccentricity in the X-direction is higher than in the Y-direction for both four- and six-storey buildings which implies that eccentricity has a higher impact in the case of the lower stiffness direction.

6. Conclusions

The present study focused on the effect of in-plan irregularity on the seismic performance of RC buildings using nonlinear dynamic analysis (IDA). Four- and six-storey residential RC buildings with different levels of eccentricity were simulated by the open-source software OPENSEES [6]. These models were analysed under bidirectional excitation using 40 ground motion records. The fragility curves were developed for different limit states for the considered RC buildings using incremental dynamic analysis (IDA) to assess the effect of the in-plan irregularity on the RC buildings.
Four- and six-storey buildings with different levels of eccentricity in both directions (EX1, EX2, EY1, and EY2) in addition to their regular counterparts (NO-ECC) were analysed. Forty ground motion records were selected to match with the target design response spectrum of the Aswan territory, as defined in the Egyptian load code [8,9]. These records were used to perform the incremental dynamic analysis (IDA) for the buildings. Then, the fragility curves were developed and used to compare the performance of the irregular buildings to that of their regular counterparts. Based on the fragility curves, the main conclusions are summarised as follows:
  • The buildings with plan irregularities exhibit higher seismic vulnerability compared to their regular counterparts, as reflected by the reduction in the median PGA values across the considered damage states. This reduction becomes more pronounced with increasing eccentricity levels, particularly for cases EX2 and EY2. For instance, in the four-storey building subjected to loading in the X-direction, the reduction in median PGA reaches approximately 54% in the slight and light damage states, highlighting the significant influence of torsional response and the resulting nonuniform distribution of drift demands.
  • Eccentricity has a limited influence on structural performance in the partial collapse and collapse damage states, where the median PGA values of different configurations become nearly identical. This convergence trend is observed across the considered structural cases, but it is more pronounced in the six-storey building, particularly in the Y-direction. This indicates that the relative influence of eccentricity becomes less significant as the structural response approaches collapse.
  • The six-storey building generally demonstrates improved performance in the partial collapse and collapse damage states compared to the four-storey building, with higher or comparable median PGA values observed across the considered configurations. This behaviour can be associated with the increased global flexibility of higher structures.
  • Increasing the eccentricity between the centre of mass (CM) and the centre of rigidity (CR) leads to increased seismic vulnerability of the buildings, as reflected by the reduction in median PGA values. Furthermore, eccentricity in the X-direction (lower stiffness direction) results in more pronounced reductions in seismic capacity compared to the Y-direction, highlighting the influence of directional stiffness on structural response.
  • The results highlight the importance of accounting for plan irregularity and directional stiffness in seismic design, as neglecting these effects may lead to an underestimation of seismic demand, particularly in the weaker stiffness direction.
Overall, the results demonstrate that plan eccentricity increases the vulnerability of RC buildings due to torsional response amplification and its interaction with structural stiffness and height. This study provides insight into their seismic performance; however, further research is needed to evaluate the influence of eccentricity under a wider range of structural configurations and seismic scenarios.

Author Contributions

Conceptualisation, A.M., M.A.-E., H.M. (Hany Madkour), R.C., H.M. (Hossameldeen Mohamed), M.Z. and H.R.; Methodology, A.M., M.A.-E., H.M. (Hany Madkour), R.C. and H.R.; Software, A.M., M.A.-E. and H.M. (Hany Madkour); Validation, A.M., M.A.-E., H.M. (Hany Madkour), H.M. (Hossameldeen Mohamed), M.Z. and H.R.; Formal analysis, A.M., M.A.-E. and H.M. (Hany Madkour); Investigation, A.M., M.A.-E., H.M. (Hany Madkour), H.M. (Hossameldeen Mohamed), M.Z. and H.R.; Resources, H.M. (Hossameldeen Mohamed) and M.Z.; Writing—original draft, A.M., M.A.-E., H.M. (Hany Madkour), H.M. (Hossameldeen Mohamed) and M.Z.; Writing—review and editing, R.C. and H.R.; Supervision, R.C., H.M. (Hossameldeen Mohamed), M.Z. and H.R. All authors have read and agreed to the published version of the manuscript.

Funding

The first and seventh authors acknowledge the financial support of the Foundation for Science and Technology (FCT, https://ror.org/00snfqn58) under Grant UID/6438/2025 (https://doi.org/10.54499/UID/06438/2025). The third author also acknowledges the support by Funding—UID/04708, https://doi.org/10.54499/UID/04708/2025, of the CONSTRUCT—Instituto de I&D em Estruturas e Construções—funded by Fundação para a Ciência e a Tecnologia, I.P./MCTES through national funds.

Data Availability Statement

The original contributions presented in this study are included in the article. Further inquiries can be directed to the corresponding author.

Conflicts of Interest

The authors declare no conflicts of interest.

References

  1. Hussein, H.M.; Elenean Abou, K.M. Source parameters of the significant earthquakes in Egypt, 1992–1998 inferred from the P-waves magnitude spectra of teleseismic seismograms. Geofizika 2008, 25, 1–26. [Google Scholar]
  2. EC-201; Egyptian Code for Calculating Loads and Forces in Structural Work and Masonry. Housing and Building National Research Center, Ministry of Housing, Utilities and Urban Planning: Cairo, Egypt, 2012.
  3. Zembaty, Z.; De Stefano, M. Seismic Behaviour and Design of Irregular and Complex Civil Structures II; Springer: Berlin/Heidelberg, Germany, 2016. [Google Scholar]
  4. Lavan, O.; De Stefano, M. Seismic Behaviour and Design of Irregular and Complex Civil Structures; Springer: Berlin/Heidelberg, Germany, 2013; Volume 24. [Google Scholar]
  5. Bakalis, A.P.; Makarios, T.K. Dynamic eccentricities and the ‘capable near collapse centre of stiffness’ of reinforced concrete single-storey buildings in pushover analysis. Eng. Struct. 2018, 166, 62–78. [Google Scholar] [CrossRef]
  6. Bakalis, A.; Makarios, T.; Athanatopoulou, A. Inelastic dynamic eccentricities in pushover analysis procedure of multi-story RC buildings. Buildings 2021, 11, 195. [Google Scholar] [CrossRef]
  7. Kaushik, S.; Dasgupta, K. Seismic damage in shear wall-slab junction in RC buildings. Procedia Eng. 2016, 144, 1332–1339. [Google Scholar] [CrossRef]
  8. Sezen, H.; Whittaker, A.S.; Elwood, K.J.; Mosalam, K.M. Performance of reinforced concrete buildings during the August 17, 1999 Kocaeli, Turkey earthquake, and seismic design and construction practise in Turkey. Eng. Struct. 2003, 25, 103–114. [Google Scholar] [CrossRef]
  9. Mohamed, H.; Romão, X. Seismic fragility analysis of RC frames with masonry infills. In Proceedings of the 16th European Conference on Earthquake Engineering, Thessaloniki, Greece, 18–21 June 2018. [Google Scholar]
  10. Chopra, A.K.; Goel, R.K. Capacity-Demand-Diagram Methods for Estimating Seismic Deformation of Inelastic Structures: SDF Systems; Pacific Engineering Research Center: Berkeley, CA, USA, 1999. [Google Scholar]
  11. Tso, W.K.; Dempsey, K.M. Seismic torsional provisions for dynamic eccentricity. Earthq. Eng. Struct. Dyn. 1980, 8, 275–289. [Google Scholar] [CrossRef]
  12. Smith, J.; Coull, A.; Structures, T.B. Analysis & Design; Wiley and Sons: New York, NY, USA, 1991. [Google Scholar]
  13. Makarios, T.; Anastassiadis, K. Real and fictitious elastic axes of multi-storey buildings: Applications. Struct. Des. Tall Build. 1998, 7, 57–71. [Google Scholar] [CrossRef]
  14. Makarios, T.; Anastassiadis, K. Real and fictitious elastic axes of multi-storey buildings: Theory. Struct. Des. Tall Build. 1998, 7, 33–55. [Google Scholar] [CrossRef]
  15. Makarios, T.K. Optimum torsion axis to multistorey buildings by using the continuous model of the structure. Struct. Des. Tall Spec. Build. 2005, 14, 69–90. [Google Scholar] [CrossRef]
  16. Makarios, T.; Athanatopoulou, A.M.; Xenidis, H. Numerical verification of properties of the fictitious elastic axis in asymmetric multistorey buildings. Struct. Des. Tall Spec. Build. 2006, 15, 249–276. [Google Scholar] [CrossRef]
  17. Makarios, T. Practical calculation of the torsional stiffness radius of multistorey tall buildings. Struct. Des. Tall Spec. Build. 2008, 17, 39–65. [Google Scholar] [CrossRef]
  18. McKenna, F. Open System for Earthquake Engineering Simulation; University of California: Berkeley, CA, USA, 2000. [Google Scholar]
  19. EC-203; Egyptian Code for the Design and Construction of Concrete Structures. Housing and Building Research Center: Cairo, Egypt, 2017.
  20. Taucer, F.; Spacone, E.; Filippou, F.C. A Fiber Beam-Column Element for Seismic Response Analysis of Reinforced Concrete Structures; Earthquake Engineering Research Center, College of Engineering, University of California: Berkeley, CA, USA, 1991; Volume 91. [Google Scholar]
  21. Clough, R.W. Inelastic earthquake response of tall buildings. In Proceedings of the 3rd World Conference on Earthquake Engineering, Auckland and Wellington, New Zealand, 22 January–1 February 1965; pp. 68–89. [Google Scholar]
  22. Giberson, M.F. The Response of Nonlinear Multi-Story Structures Subjected to Earthquake Excitation. PhD Thesis, California Institute of Technology, Pasadena, CA, USA, 1967. [Google Scholar]
  23. Hilmy, S.I.; Abel, J.F. Material and geometric nonlinear dynamic analysis of steel frames using computer graphics. Comput. Struct. 1985, 21, 825–840. [Google Scholar] [CrossRef]
  24. Powell, G.H.; Chen, P.F.-S. 3D beam-column element with generalized plastic hinges. J. Eng. Mech. 1986, 112, 627–641. [Google Scholar] [CrossRef]
  25. Ziemian, R.D.; McGuire, W. Modified tangent modulus approach, a contribution to plastic hinge analysis. J. Struct. Eng. 2002, 128, 1301–1307. [Google Scholar] [CrossRef]
  26. Calabrese, A.; Almeida, J.P.; Pinho, R. Numerical issues in distributed inelasticity modeling of RC frame elements for seismic analysis. J. Earthq. Eng. 2010, 14, 38–68. [Google Scholar] [CrossRef]
  27. Messaoudi, A.; Chebili, R.; Mohamed, H.; Furtado, A.; Rodrigues, H. The in-plane seismic response of infilled reinforced concrete frames using a strut modelling approach: Validation and applications. Buildings 2024, 14, 1902. [Google Scholar] [CrossRef]
  28. Paulay, T.; Priestley, M.J.N. Seismic Design of Reinforced Concrete and Masonry Buildings; Wiley: New York, NY, USA, 1992; Volume 768. [Google Scholar]
  29. Popovics, S. A numerical approach to the complete stress-strain curve of concrete. Cem. Concr. Res. 1973, 3, 583–599. [Google Scholar] [CrossRef]
  30. Kent, D.C.; Park, R. Flexural members with confined concrete. J. Struct. Div. 1971, 97, 1969–1990. [Google Scholar] [CrossRef]
  31. Vamvatsikos, D.; Cornell, C.A. Incremental dynamic analysis. Earthq. Eng. Struct. Dyn. 2002, 31, 491–514. [Google Scholar] [CrossRef]
  32. Araújo, M.; Macedo, L.; Marques, M.; Castro, J.M. Code-based record selection methods for seismic performance assessment of buildings. Earthq. Eng. Struct. Dyn. 2016, 45, 129–148. [Google Scholar] [CrossRef]
  33. Ricci, P.; De Risi, M.T.; Verderame, G.M.; Manfredi, G. Procedures for calibration of linear models for damage limitation in design of masonry-infilled RC frames. Earthq. Eng. Struct. Dyn. 2016, 45, 1315–1335. [Google Scholar] [CrossRef]
  34. Building Seismic Safety Council. FEMA 273: NEHRP Guidelines for the Seismic Rehabilitation Of Buildings; Federal Emergency Management Agency (FEMA): Washington, DC, USA, 1997.
  35. Structural Engineers Association of California. Performance Based Seismic Engineering of Buildings, Volumes I and II. Sacramento; Structural Engineers Association of California: Sacramento, CA, USA, 1995. [Google Scholar]
  36. Rossetto, T.; Elnashai, A. Derivation of vulnerability functions for European-type RC structures based on observational data. Eng. Struct. 2003, 25, 1241–1263. [Google Scholar] [CrossRef]
  37. Ghobarah, A. On drift limits associated with different damage levels. In International Workshop on Performance-Based Seismic Design; Department of Civil Engineering, McMaster University: Hamilton, ON, Canada, 2004; pp. 321–332. [Google Scholar]
  38. Rossetto, T.; Elnashai, A. A new analytical procedure for the derivation of displacement-based vulnerability curves for populations of RC structures. Eng. Struct. 2005, 27, 397–409. [Google Scholar] [CrossRef]
  39. Aschheim, M.; Hernández-Montes, E.; Vamvatsikos, D. Design of Reinforced Concrete Buildings for Seismic Performance: Practical Deterministic and Probabilistic Approaches; CRC Press: Boca Raton, FL, USA, 2019. [Google Scholar]
  40. Grünthal, G. European Macroseismic Scale 1998 (EMS-98); European Seismological Commission (ESC): Luxembourg, 1998. [Google Scholar]
  41. Musson, R.M.W.; Grünthal, G.; Stucchi, M. The comparison of macroseismic intensity scales. J. Seismol. 2010, 14, 413–428. [Google Scholar] [CrossRef]
  42. Vamvatsikos, D.; Cornell, C.A. Developing efficient scalar and vector intensity measures for IDA capacity estimation by incorporating elastic spectral shape information. Earthq. Eng. Struct. Dyn. 2005, 34, 1573–1600. [Google Scholar] [CrossRef]
  43. Shafieezadeh, A.; Ramanathan, K.; Padgett, J.E.; DesRoches, R. Fractional order intensity measures for probabilistic seismic demand modeling applied to highway bridges. Earthq. Eng. Struct. Dyn. 2012, 41, 391–409. [Google Scholar] [CrossRef]
  44. Bianchini, M.; Diotallevi, P.; Baker, J.W. Prediction of inelastic structural response using an average of spectral accelerations. In Proceedings of the 10th International Conference on Structural Safety and Reliability (ICOSSAR09), Osaka, Japan, 13–17 September 2009; pp. 2164–2171. [Google Scholar]
  45. Cordova, P.P.; Deierlein, G.G.; Mehanny, S.S.F.; Cornell, C.A. Development of a two-parameter seismic intensity measure and probabilistic assessment procedure. In The Second US-Japan Workshop on Performance-Based Earthquake Engineering Methodology for Reinforced Concrete Building Structures; Pacific Earthquake Engineering Research Center, University of California: Berkeley, CA, USA, 2000. [Google Scholar]
  46. Eads, L.; Miranda, E.; Lignos, D.G. Average spectral acceleration as an intensity measure for collapse risk assessment. Earthq. Eng. Struct. Dyn. 2015, 44, 2057–2073. [Google Scholar] [CrossRef]
  47. Kohrangi, M.; Bazzurro, P.; Vamvatsikos, D. Vector and scalar IMs in structural response estimation, Part II: Building demand assessment. Earthq. Spectra 2016, 32, 1525–1543. [Google Scholar] [CrossRef]
  48. Baker, J.W.; Cornell, C.A. Vector-valued intensity measures incorporating spectral shape for prediction of structural response. J. Earthq. Eng. 2008, 12, 534–554. [Google Scholar] [CrossRef]
  49. Kohrangi, M.; Vamvatsikos, D.; Bazzurro, P. Implications of IM selection for seismic Loss Assessment of 3D Buildings. Earthq. Spectra 2016, 32, 2167–2189. [Google Scholar] [CrossRef]
  50. Hancilar, U.; Çaktı, E.; Erdik, M.; Franco, G.E.; Deodatis, G. Earthquake vulnerability of school buildings: Probabilistic structural fragility analyses. Soil Dyn. Earthq. Eng. 2014, 67, 169–178. [Google Scholar] [CrossRef]
  51. Lin, T.; Harmsen, S.C.; Baker, J.W.; Luco, N. Conditional spectrum computation incorporating multiple causal earthquakes and ground-motion prediction models. Bull. Seismol. Soc. Am. 2013, 103, 1103–1116. [Google Scholar] [CrossRef]
  52. Bakhshi, A.; Asadi, P. Probabilistic evaluation of seismic design parameters of RC frames based on fragility curves. Sci. Iran. 2013, 20, 231–241. [Google Scholar]
  53. Modica, A.; Stafford, P.J. Vector fragility surfaces for reinforced concrete frames in Europe. Bull. Earthq. Eng. 2014, 12, 1725–1753. [Google Scholar] [CrossRef]
  54. Villar-Vega, M.; Silva, V.; Crowley, H.; Yepes, C.; Tarque, N.; Acevedo, A.B.; Hube, M.A.; Gustavo, C.D.; María, H.S. Development of a fragility model for the residential building stock in South America. Earthq. Spectra 2017, 33, 581–604. [Google Scholar] [CrossRef]
  55. Haran Pragalath, D.C.; Davis, R.; Sarkar, P. Reliability evaluation of RC frame by two major fragility analysis methods. ASIAN J. Civ. Eng. 2015, 6, 47–66. [Google Scholar]
  56. Zentner, I.; Gündel, M.; Bonfils, N. Fragility analysis methods: Review of existing approaches and application. Nucl. Eng. Des. 2017, 323, 245–258. [Google Scholar] [CrossRef]
  57. Kennedy, R.P.; Ravindra, M.K. Seismic fragilities for nuclear power plant risk studies. Nucl. Eng. Des. 1984, 79, 47–68. [Google Scholar] [CrossRef]
  58. Calvi, G.M.; Pinho, R.; Magenes, G.; Bommer, J.J.; Restrepo-Vélez, L.F.; Crowley, H. Development of seismic vulnerability assessment methodologies over the past 30 years. ISET J. Earthq. Technol. 2006, 43, 75–104. [Google Scholar] [CrossRef]
  59. Porter, K.; Kennedy, R.; Bachman, R. Creating fragility functions for performance-based earthquake engineering. Earthq. Spectra 2007, 23, 471–489. [Google Scholar] [CrossRef]
Figure 1. Torsion force induction in a structure with in-plane irregularity.
Buildings 16 02086 g001
Figure 2. Typical plan view for the considered building: (a) architectural plan and (b) structural system.
Buildings 16 02086 g002
Figure 3. A 3D view of the considered building: (a) four storeys and (b) six storeys.
Buildings 16 02086 g003
Figure 4. Cross-section labels and CR location: (a) four storeys and (b) six storeys.
Buildings 16 02086 g004
Figure 5. Plasticity model of RC elements: (a) Lumped plasticity element and (b) Distributed plasticity element.
Buildings 16 02086 g005
Figure 6. (a) Element discretisation showing integration section and (b) Section fibre discretisation [27].
Buildings 16 02086 g006
Figure 7. Beam with hinge element.
Buildings 16 02086 g007
Figure 8. The stress–strain curves of the considered materials: (a) Unconfined concrete (Concrete04), (b) Confined concrete (Concrete04) with k factor, (c) Steel01.
Buildings 16 02086 g008
Figure 9. Ground motion records: (a) component-x, (b) component-y.
Buildings 16 02086 g009
Figure 10. Target elastic design response spectrum for Aswan along with the scaled spectra for the forty ground motions and the mean response spectrum of the selected ground motions.
Buildings 16 02086 g010
Figure 11. IDA curves for the four-storey building with different levels of eccentricity: (a) NO-ECC, (b) EX1, (c) EX2, (d) EY1, and (e) EY2.
Buildings 16 02086 g011
Figure 12. IDA curves for the six-storey building with different levels of eccentricity: (a) NO-ECC, (b) EX1, (c) EX2, (d) EY1, and (e) EY2.
Buildings 16 02086 g012
Figure 13. Comparison between the fragility curves of the four-storey irregular building in X-direction and the regular counterparts for different limit states.
Buildings 16 02086 g013
Figure 14. Comparison between the fragility curves of the four-storey irregular building in Y-direction and the regular counterparts for different limit states.
Buildings 16 02086 g014
Figure 15. Comparison between the fragility curves of the six-storey irregular building in X-direction and the regular counterparts for different limit states.
Buildings 16 02086 g015
Figure 16. Comparison between the fragility curves of the six-storey irregular building in Y-direction and the regular counterparts for different limit states.
Buildings 16 02086 g016
Figure 17. Radar plot of the median PGA at 50% exceedance probability for all building configurations across different damage limit states.
Buildings 16 02086 g017
Figure 18. The probability of exceedance of the four-storey buildings with different levels of eccentricity at PGA equal to 0.15 g for different limit states.
Buildings 16 02086 g018
Figure 19. The probability of exceedance of the six-storey buildings with different levels of eccentricity at PGA equal to 0.15 g for different limit states.
Buildings 16 02086 g019
Table 1. The considered weight and loads, ECP-201 [2].
DescriptionUnitsPractice Value
Self-weight of concreteKN/m325.0
Floor coverKN/m21.50
Masonry wall weightKN/m318.0
Live loadKN/m22.0–3.0 *
* For stairs and balcony 3, other 2.
Table 2. The cross-section details of columns of four and six storeys.
No. of StoreysSampleSection (cm2)Reinforcement Steel
Four storeysCol130 × 308 Ø 12
Col230 × 4010 Ø 12
Six storeysCol130 × 308 Ø 12
Col230 × 4010 Ø 12
Col330 × 5012 Ø 12
Col430 × 6014 Ø 12
Col530 × 7016 Ø 12
Ø denotes the diameter of reinforcement bars in mm.
Table 3. The beams’ cross-section details of four and six storeys.
SampleSection (cm2)Reinforcement Steel
StartMiddleEnd
UpperLowerUpperLowerUpperLower
B125 × 505 Ø 122 Ø 123 Ø 124 Ø 125 Ø 122 Ø 12
B225 × 505 Ø 123 Ø 123 Ø 125 Ø 125 Ø 123 Ø 12
B325 × 502 Ø 124 Ø 123 Ø 126 Ø 122 Ø 124 Ø 12
Table 4. Characteristics of the selected ground motion records used in both X- and Y-directions.
Record
No.
Ground Motions
in X- and Y-Directions
DT (s)Scaling FactorRecord
No.
Ground Motions
in X- and Y-Directions
DT (s)Scaling Factor
1Northridge010.023.4821ChiChiTaiwan060.0052.758
2Chichi Taiwan0.0043.99922Chichi Taiwan0.0051.164
3Northridge010.023.13923Northridge010.012.619
4Northridge010.023.02524Loma Prieta0.0051.674
5Landers0.0052.29525Chichi Taiwan0.0051.443
6Kocaeli Turkey0.0051.34126ChiChiTaiwan040.0053.153
7Northridge010.011.42427BigBear010.024
8ChiChiTaiwan060.0053.3828ChiChiTaiwan060.0053.799
9ChiChiTaiwan060.005429Hector Mine0.013.014
10ChiChiTaiwan050.0043.89930Victoria Mexico0.012.866
11SuperstitionHills020.012.14431ChalfantValley020.0051.428
12Chichi Taiwan0.0043.99932Northridge010.011.834
13Northridge010.012.61433Loma Prieta0.0053.176
14Chichi Taiwan0.0050.95234Chichi Taiwan0.0053.812
15ChiChiTaiwan060.0053.4735Denali Alaska0.013.082
16Northridge010.021.52836Point Mugu0.0052.783
17ChiChiTaiwan050.0053.4337Loma Prieta0.0050.725
18Northridge010.022.44638Loma Prieta0.0050.958
19ChiChiTaiwan030.0052.83739Coalinga010.013.449
20Chichi Taiwan0.0050.90940BigBear010.013.329
Table 5. The considered damage limit states defined in terms of IDRmax [Adpated from 38].
Damage StateInter-Storey Drift (%)
Slight0.05
Light0.08
Moderate0.3
Extensive1.15
Partial collapse2.8
Collapse>4.36
Table 6. Characteristics of the considered cases.
No of StoreysModelEccentricity
Direction
Eccentricity
Level
Applied Analysis Method
Four storeysNO-ECCNo eccentricity0IDA
EX1X-direction7.4% LxIDA
EX2X-direction22.2% LxIDA
EY1Y-direction10.5% LyIDA
EY2Y-direction21% LyIDA
Six storeysNO-ECCNo eccentricity0IDA
EX1X-direction7.4% LxIDA
EX2X-direction22.2% LxIDA
EY1Y-direction10.5% LyIDA
EY2Y-direction21% LyIDA
Where Lx and Ly are the building dimensions in X- and Y-directions respectively.
Table 7. Median PGA values at 50% exceedance probability and corresponding percentage reduction relative to the regular configuration for all investigated cases.
StoreysDirectionDamage StateNO-ECCModel 1Model 2Reduction 1 (%)Reduction 2 (%)
Four storeysX-directionSlight0.01250.0106 (EX1—7.4% Lx)0.0058 (EX2—22.2% Lx)15.2053.60
Light0.01960.01700.0093713.2752.20
Moderate0.06710.06120.035588.7946.97
Extensive0.19000.17400.12908.4232.11
Partial collapse0.34500.32600.28905.5116.23
Collapse0.47500.42500.400010.5315.79
Y-directionSlight0.012350.01115 (EY1—10.5% Ly)0.00723 (EY2—21% Ly)9.7241.46
Light0.013000.012030.007527.4642.15
Moderate0.067900.062260.041898.3138.31
Extensive0.179300.165800.111807.5337.65
Partial collapse0.347000.331000.292104.6115.82
Collapse0.474000.445000.434306.128.38
Six storeysX-directionSlight0.009580.00845 (EX1—7.4% Lx)0.00728 (EX2—22.2% Lx)11.8024.01
Light0.015390.013480.0117312.4123.78
Moderate0.057580.050560.0435412.1924.38
Extensive0.189510.169290.1565510.6717.39
Partial collapse0.347800.323250.311917.0610.32
Collapse0.505600.471500.440306.7412.92
Y-directionSlight0.009630.009114 (EY1—10.5% Ly)0.00872 (EY2—21% Ly)5.369.45
Light0.015420.014700.014054.678.88
Moderate0.057600.054700.052405.039.03
Extensive0.190000.188400.179100.845.74
Partial collapse0.349000.348000.347000.290.57
Collapse0.495000.495000.495000.000.00
Model 1 corresponds to the configuration with lower eccentricity (EX1 in the X-direction and EY1 in the Y-direction), while Model 2 corresponds to the configuration with higher eccentricity (EX2 in the X-direction and EY2 in the Y-direction). The reduction percentage represents the relative decrease in median PGA with respect to the regular configuration (NO-ECC) at a 50% exceedance probability.
Disclaimer/Publisher’s Note: The statements, opinions and data contained in all publications are solely those of the individual author(s) and contributor(s) and not of MDPI and/or the editor(s). MDPI and/or the editor(s) disclaim responsibility for any injury to people or property resulting from any ideas, methods, instructions or products referred to in the content.