Abstract
Accurate identification of modal properties in a steel cantilever beam is crucial for enhancing numerical models and supporting structural health monitoring, particularly when numerical and experimental data are combined. This study investigates the modal system identification of a steel cantilever beam using finite element method (FEM) simulations, which are validated by experimental testing. The beam was bolted to a reinforced concrete block and subjected to dynamic testing, where natural frequencies and mode shapes were extracted through Frequency Domain Decomposition (FDD). The experimental outcomes were compared with FEM predictions from SAP2000, and discrepancies were analysed using the Modal Assurance Criterion (MAC). A model updating procedure was applied, refining boundary conditions and considering sensor mass effects, which improved model accuracy. The updated FEM achieved closer agreement with frequency deviations reduced to less than 4% and MAC values above 0.9 for the first three modes. Beyond validation, the research links the updated FEM results with a Building Information Modelling (BIM) framework to enable the development of a digital twin of the beam. A workflow was designed to connect vibration monitoring data with BIM, providing visualisation of structural performance through colour-coded alerts. The findings confirm the effectiveness of FEM updating in generating reliable modal representations and demonstrate the potential of BIM-based digital twins for advancing structural condition assessment, maintenance planning and decision-making in civil engineering practice.
1. Introduction
Contemporary engineering has seen a rising demand for Structural Health Monitoring and vibration control systems [1,2]. Understanding the dynamics within these systems is vital for achieving accurate results. Such work requires robust and reliable methods, especially when dealing with output-only systems’ data. Engineers perform dynamic system identification using numerical techniques, such as the finite element method or theoretical analysis [3]. Therefore, practical strategies are preferable as they can be simpler than necessary to explain damping. Consequently, experimental testing plays a key role in correlating FEM results with their assumptions, since some system characteristics cannot be fully understood through theoretical assumptions alone [4]. However, it must be emphasised that theoretical or numerical studies should not replace actual experimentation. This study, therefore, focuses on a combined experimental-numerical analysis of a steel cantilever beam. The behaviour of cantilever beams has been widely studied. For example, Lele et al. [5]. Examined transverse vibrations for crack sensing based on Timoshenko’s theory. Whalen studied changes in the second-order mode shapes cracked beam [6]. Shafiei and Khaji [7] investigated the issue of a moving load on a Timoshenko shaft with multiple cracks, analysing both free and forced vibrations in these beams. In reinforced concrete beams, Liu et al. [8]. performed experiments to extract dynamic characteristics, including ambient and forced vibration tests, for validating analytical and numerical models. Many other researchers, such as Corbally [9], Baghiee [10], Tondreau [11], Chen [12], and Colombia [13], also addressed crack detection, beam failure, reinforcement, and damage identification. Although significant progress has been made, the use of practical updating techniques to obtain a fully updated FEM model is still not well explored.
Digital technologies have changed how structural information is stored and used. Tools for digital documentation and modelling now support new ways of storing and using information. The Digital Twins (DT) concept first appeared in product life cycle management and is now applied in many fields. These applications share common ideas and benefits. It was first used in the product life-cycle management. Since then, it has been applied in several contexts in engineering. As a result, the term digital twin is used with different meanings in the literature. It is common to adapt the concept to each case. Even so, it is useful to define basic concepts as a common starting point [14,15,16].
Early definitions describe a Digital Twin (DT) as having three main parts: a physical entity, a virtual model, and a bi-directional data flow between them [17]. Some literature reviews, such as [14,16], analysed several definitions developed over the years and identified common aspects to provide a comprehensive description. One of these reviews focuses on industrial applications and includes only a short section on BIM, without proposing a new definition. The other review proposes the following definition: virtual representation of a physical system and its associated environment and processes that is updated through the exchange of information between the physical and virtual systems [15].
Applying digital twins to existing structures is promising. Built structures deteriorate due to ageing and external actions, so monitoring and maintenance are vital for preserving performance. Monitoring also helps to study anomalies, understand their causes and risks, and define thresholds.
Structural health monitoring (SHM) techniques are important because they help to detect damage and follow its development. These actions support stability and extend service life [18]. Identifying natural frequencies helps to avoid resonance and unwanted vibration amplification. Vibration monitoring allows managers to identify hazardous behaviour and to plan reinforcement or maintenance actions [19].
This research aims at modal system identification and FEM verification for civil engineering structures. Thus, the objectives of this research include an investigation into the practical application of using FEM models to analyse the modal measurements of cantilever beams [20]. The experiments are performed on a simple support cantilever, whose results agree numerically with the measured data. The applied methodology involves assessing FEM model compatibility using two pivotal metrics: The MAC issue and the Natural Frequency Variance problem [21]. Using the MAC technique in improving the FEM model resulted in excellent agreement between experimentally measured data, frequencies, and mode shapes [22]. These analyses show that FEM is adequate in explaining cantilever beam behaviour, and the result is close to experimental data. The study verifies cantilever beam modes using FEM and quantifies similarity with the Modal Assurance Criterion (MAC), then uses these validated results as inputs to a BIM environment. Modal analysis and structural identification are critical for understanding the dynamics of civil engineering structures. It starts with selecting a steel beam that is inset into a concrete box using the two steel screws spaced at intervals of 1.5 cm and 10 cm from the head of this beam. Such a was selected as a simplified laboratory specimen that allows precise control of boundary conditions and sensor locations, providing reliable reference data for FEM updating. Modal analysis, which originated in the mid-20th century in aerospace engineering, is now applied in civil engineering to determine the vibration modes and properties of structures that influence their dynamic behaviour.
Despite, a comprehensive workflow that begins with experimental testing, applies FEM updating, and then integrates the validated results into BIM to support DT applications has not been fully addressed [23]. In this study, experimental modal data are compared with FEM predictions using the modal assurance criterion (MAC), and the updated results are later integrated within a BIM environment. For this purpose, various test scenarios are conducted on a steel cantilever beam. Dynamic tests and simulations were performed on a cantilever beam with rigid support. Test results are compared to the first-step FEM model using MAC and CMAC analysis. After some modifications, the FEM model was updated, and MAC analysis was performed again. Eventually, after completing the identification procedure, the Final results reveal good compatibility between the FEM model and experimental results.
Although monitoring technologies have advanced, it is still a challenge to integrate them with BIM to create a useful workflow for engineers and managers. This paper addresses this problem by presenting an integrated system that connects vibration data with BIM visualisation using a custom software solution. Dynamic monitoring was integrated with a BIM model, to support the use of utilising the model as a digital twin (DT). The rectangular steel cantilever beam was used as the monitored element. The monitoring results were stored in a database and then linked to the BIM model. This process was carried out using a Python script (Python v3.13) based on pyRevit (version 5.1.0), which also applied graphic overrides to the element, indicating whether the structural element’s vibrations were within an acceptable threshold relative to its natural frequencies. In this study, FEM updating was used to provide the numerical baseline, BIM was employed as the digital environment for storage and visual checks, and the digital twin was applied to link both through data exchange and threshold-based decision support. This approach addresses the gap identified in previous studies, where these parts were treated separately. Although the tests were conducted at a laboratory scale, the steps were designed to be scalable to larger structures, as the identification relies on mode shapes, frequency ratios, and boundary compliance rather than absolute size.
The main contributions of this study are: (i) A combined experimental–numerical investigation was performed on a steel cantilever beam, where experimental modal identification and FEM updating were systematically applied to provide a controlled validation reference; (ii) a quantitative evaluation of model accuracy was conducted using the Modal Assurance Criterion (MAC) and cross-MAC, allowing for a clear assessment of the improvements achieved after updating the material properties and boundary conditions; and (iii) a direct integration of the updated modal results into a Building Information Modelling (BIM) environment was implemented, demonstrating how validated numerical and experimental data can be seamlessly incorporated into a digital twin framework to support structural monitoring and informed decision-making.
2. Materials and Methods
2.1. Experimental Mode Configuration
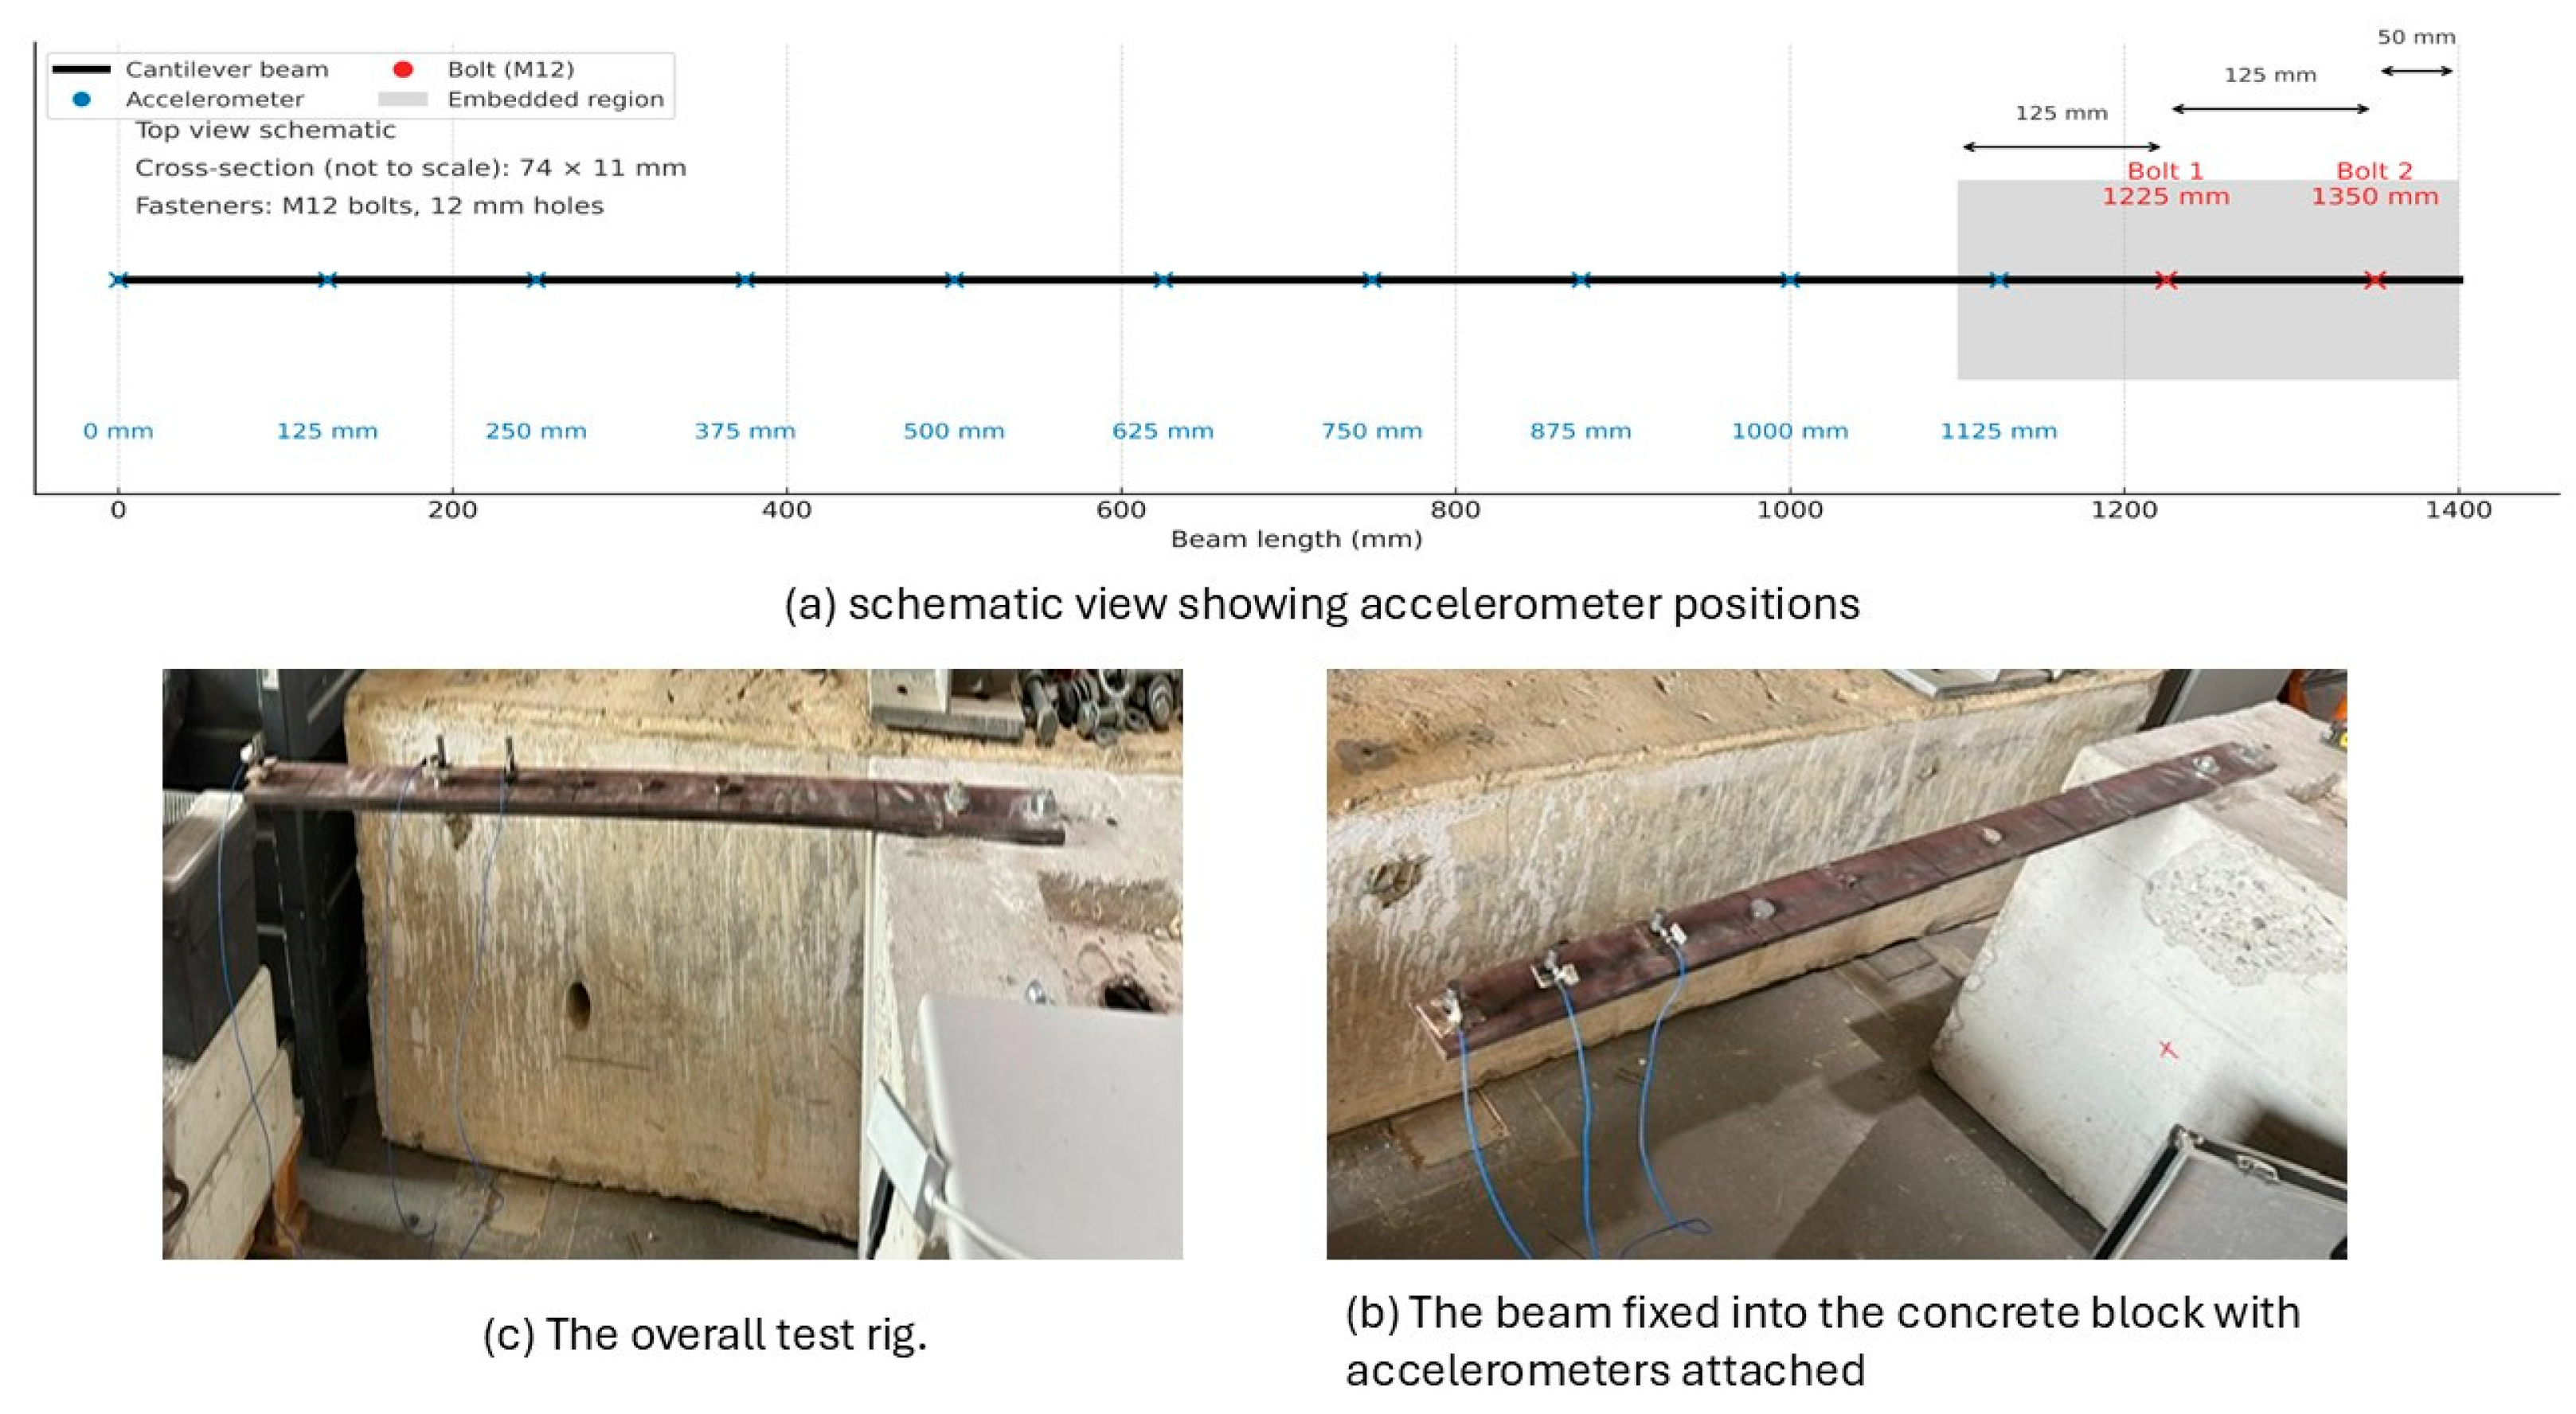
The experimental campaign was designed to provide high-quality data for finite element model updating and subsequent integration into a BIM-based digital twin workflow. A rectangular steel cantilever beam with a total length of 1400 mm, a cross-section of 74 × 11 mm, and a total mass of 7806 g was tested. The beam was fixed into a reinforced concrete block with two bolts positioned at 1225 mm and 1350 mm from the free end, leaving a 50 mm extension beyond the second bolt to complete the support condition. Seven accelerometer locations were defined at 0, 120, 285, 470, 655, 840, and 1025 mm, as illustrated in Figure 1a–c show the embedded beam and the overall test rig.
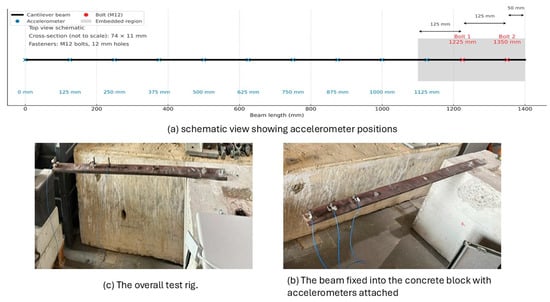
Figure 1.
Experimental setup of the steel cantilever beam: (a) schematic view showing accelerometer positions along the 1400 mm beam; (b) photograph of the beam fixed into the concrete block with accelerometers attached; (c) photograph of the overall test rig.
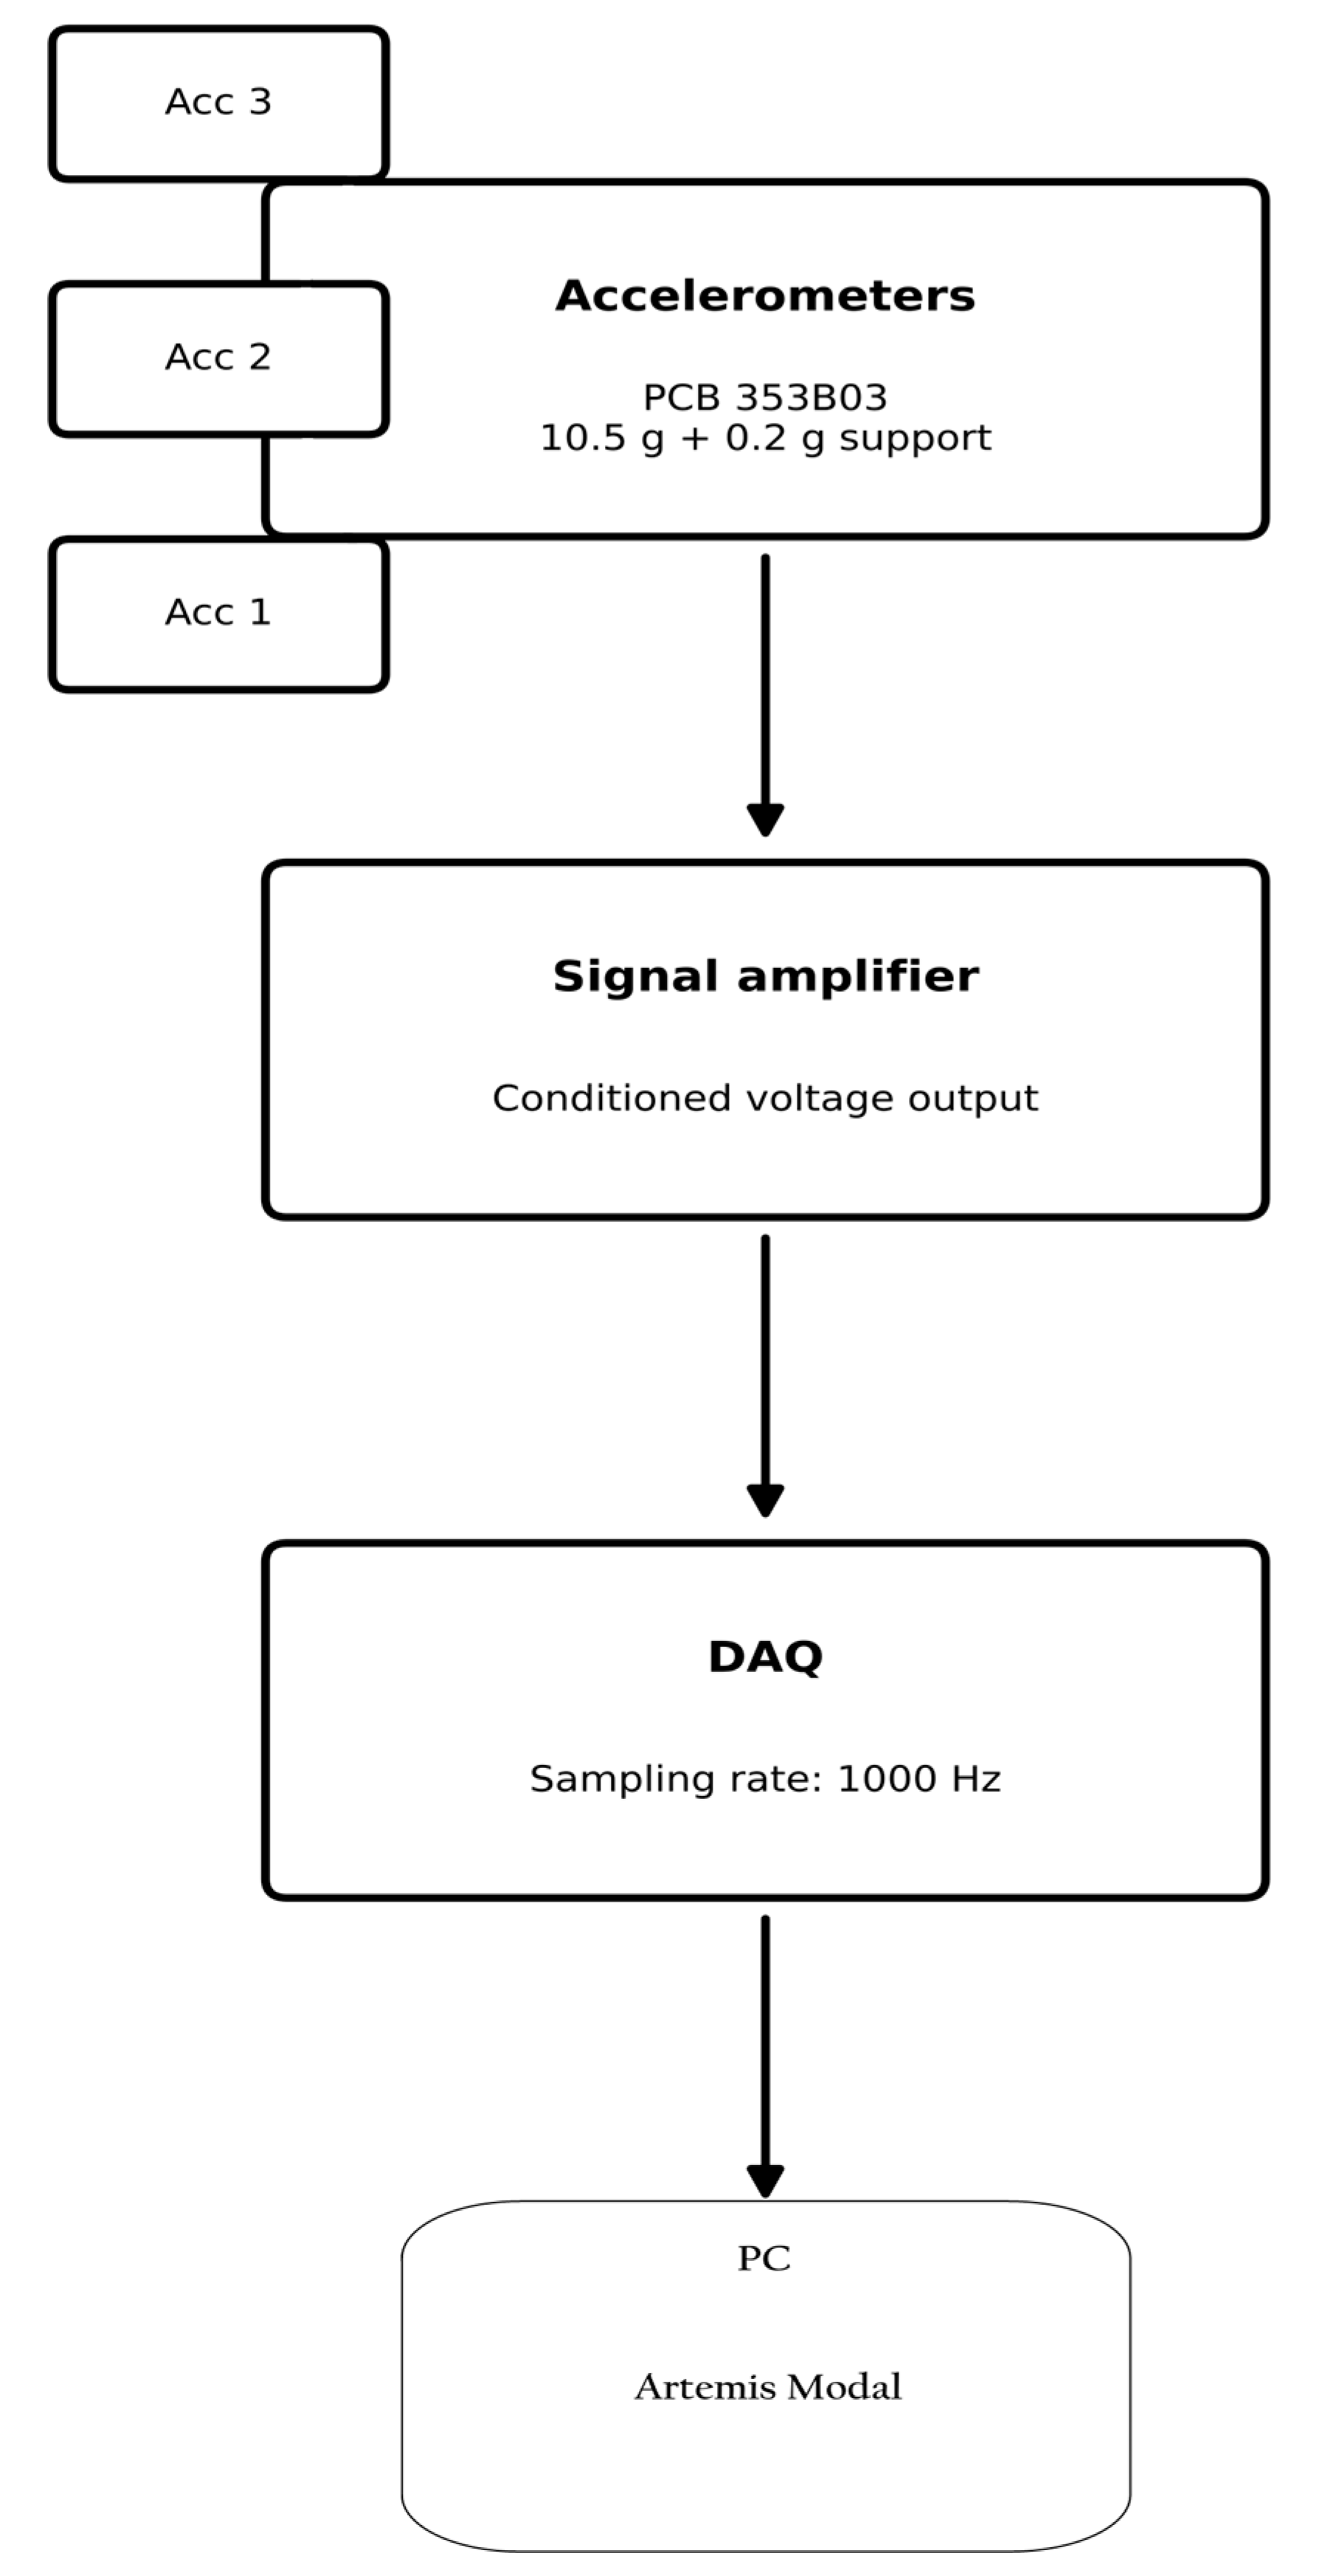
The wiring diagram of the experimental setup is presented in Figure 2, where accelerometer signals were transmitted through a signal amplifier to a DAQ system, and the responses were processed in Artemis Modal.
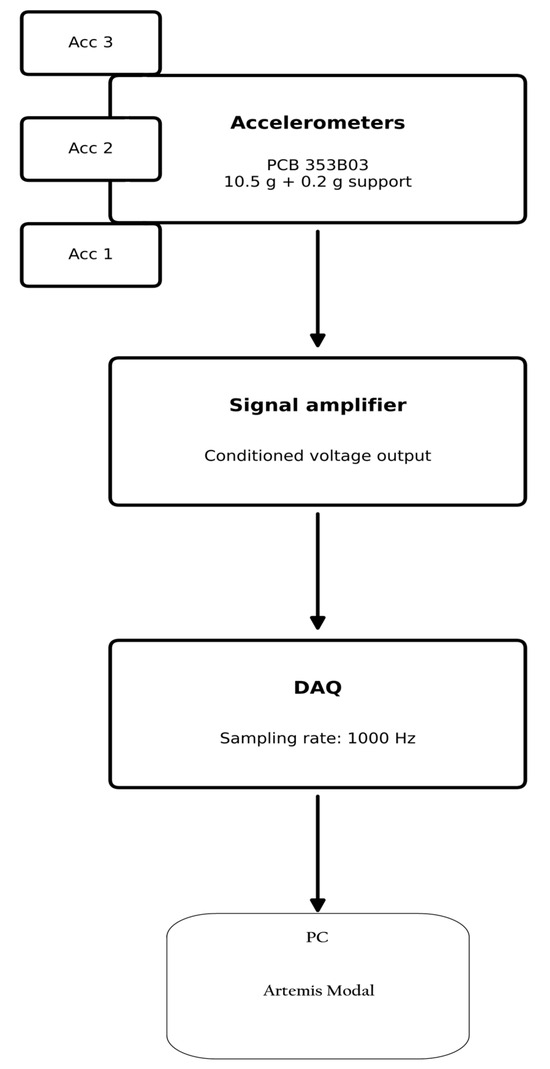
Figure 2.
Wiring diagram of the experimental setup. Accelerometer signals were transmitted through a signal amplifier to a DAQ system, and the responses were processed in Artemis Modal.
The experimental modal identification employed PCB Piezotronics Model 353B03 accelerometers (10.5 g plus 0.2 g support), https://www.pcb.com, a signal amplifier, and a DAQ system. Point impacts were applied at several positions to excite multiple vibration modes, and responses were recorded in Artemis Modal. The excitation was applied using a lightweight modal hammer, producing low-energy impacts estimated to peak at less than 50 N. This ensured that the response remained within the linear elastic range of the steel beam and that no local damage or plastic deformation was introduced during testing. The main properties of the steel cantilever beam and the instrumentation used in the experimental setup are summarised in Table 1.

Table 1.
Properties of the steel cantilever beam and instrumentation.
A specific point used in this study was the use of systematic sensor repositioning across several configurations. Instead of relying on a fixed sensor grid, accelerometers were relocated to cover different regions of the beam in successive tests. This strategy enabled the identification of nodal and antinodal areas that would otherwise remain hidden, and it provided redundancy for cross-validation of mode shapes. This approach reduces bias in modal parameter estimation and increases confidence in the extracted results.
2.2. Numerical Model
The finite element model of the cantilever beam was developed in SAP2000 to reproduce the geometry, boundary conditions, and material properties of the tested specimen. The beam was modelled with 3D deformable elements and fixed into a reinforced concrete block to simulate the embedded support condition. A dense mesh of 145 points, 448 edges, and 112 areas was used to capture local deformations and higher-order modes.
The physical parameters of the specimen were directly introduced into the model. The beam dimensions were 1400 mm in length, 74 mm in width, and 11 mm in thickness, with a total mass of 7806 g. The influence of the accelerometer mass was included to improve consistency with the experimental setup. The initial material properties corresponded to structural steel S355, with an elastic modulus of 2.10 × 10¹¹ Pa, a Poisson’s ratio of 0.30, and a density of 7850 kg/m3.
Initial FEM predictions did not fully match the measured frequencies, particularly at higher modes. To improve correlation, the model was updated by slightly reducing the stiffness parameters. The elastic modulus was adjusted to 1.93 × 10¹¹ Pa and the Poisson’s ratio to 0.27, which corresponds to about 92% of the nominal values for S355 steel. The initial and updated values are presented in Table 2.

Table 2.
Material properties of the steel beam before and after updating.
Presenting these material parameters highlights the minor modifications made to the FEM model during the updating process. These adjustments aim to improve consistency with the experimental observations and prepare the model for quantitative validation in the next section.
3. Results and Model Updating Strategy
This section presents the results in two stages. Test 1 compares the experimental data with the initial FEM model to identify the main differences. Test 2 repeats the measurements and compares them with the updated FEM model to show how the correlation improves. The order is: spectral identification by FDD, natural frequency comparison, mode shape comparison, and then MAC evaluation for shape similarity.
3.1. Results of Test 1—Initial FEM vs. Experiment
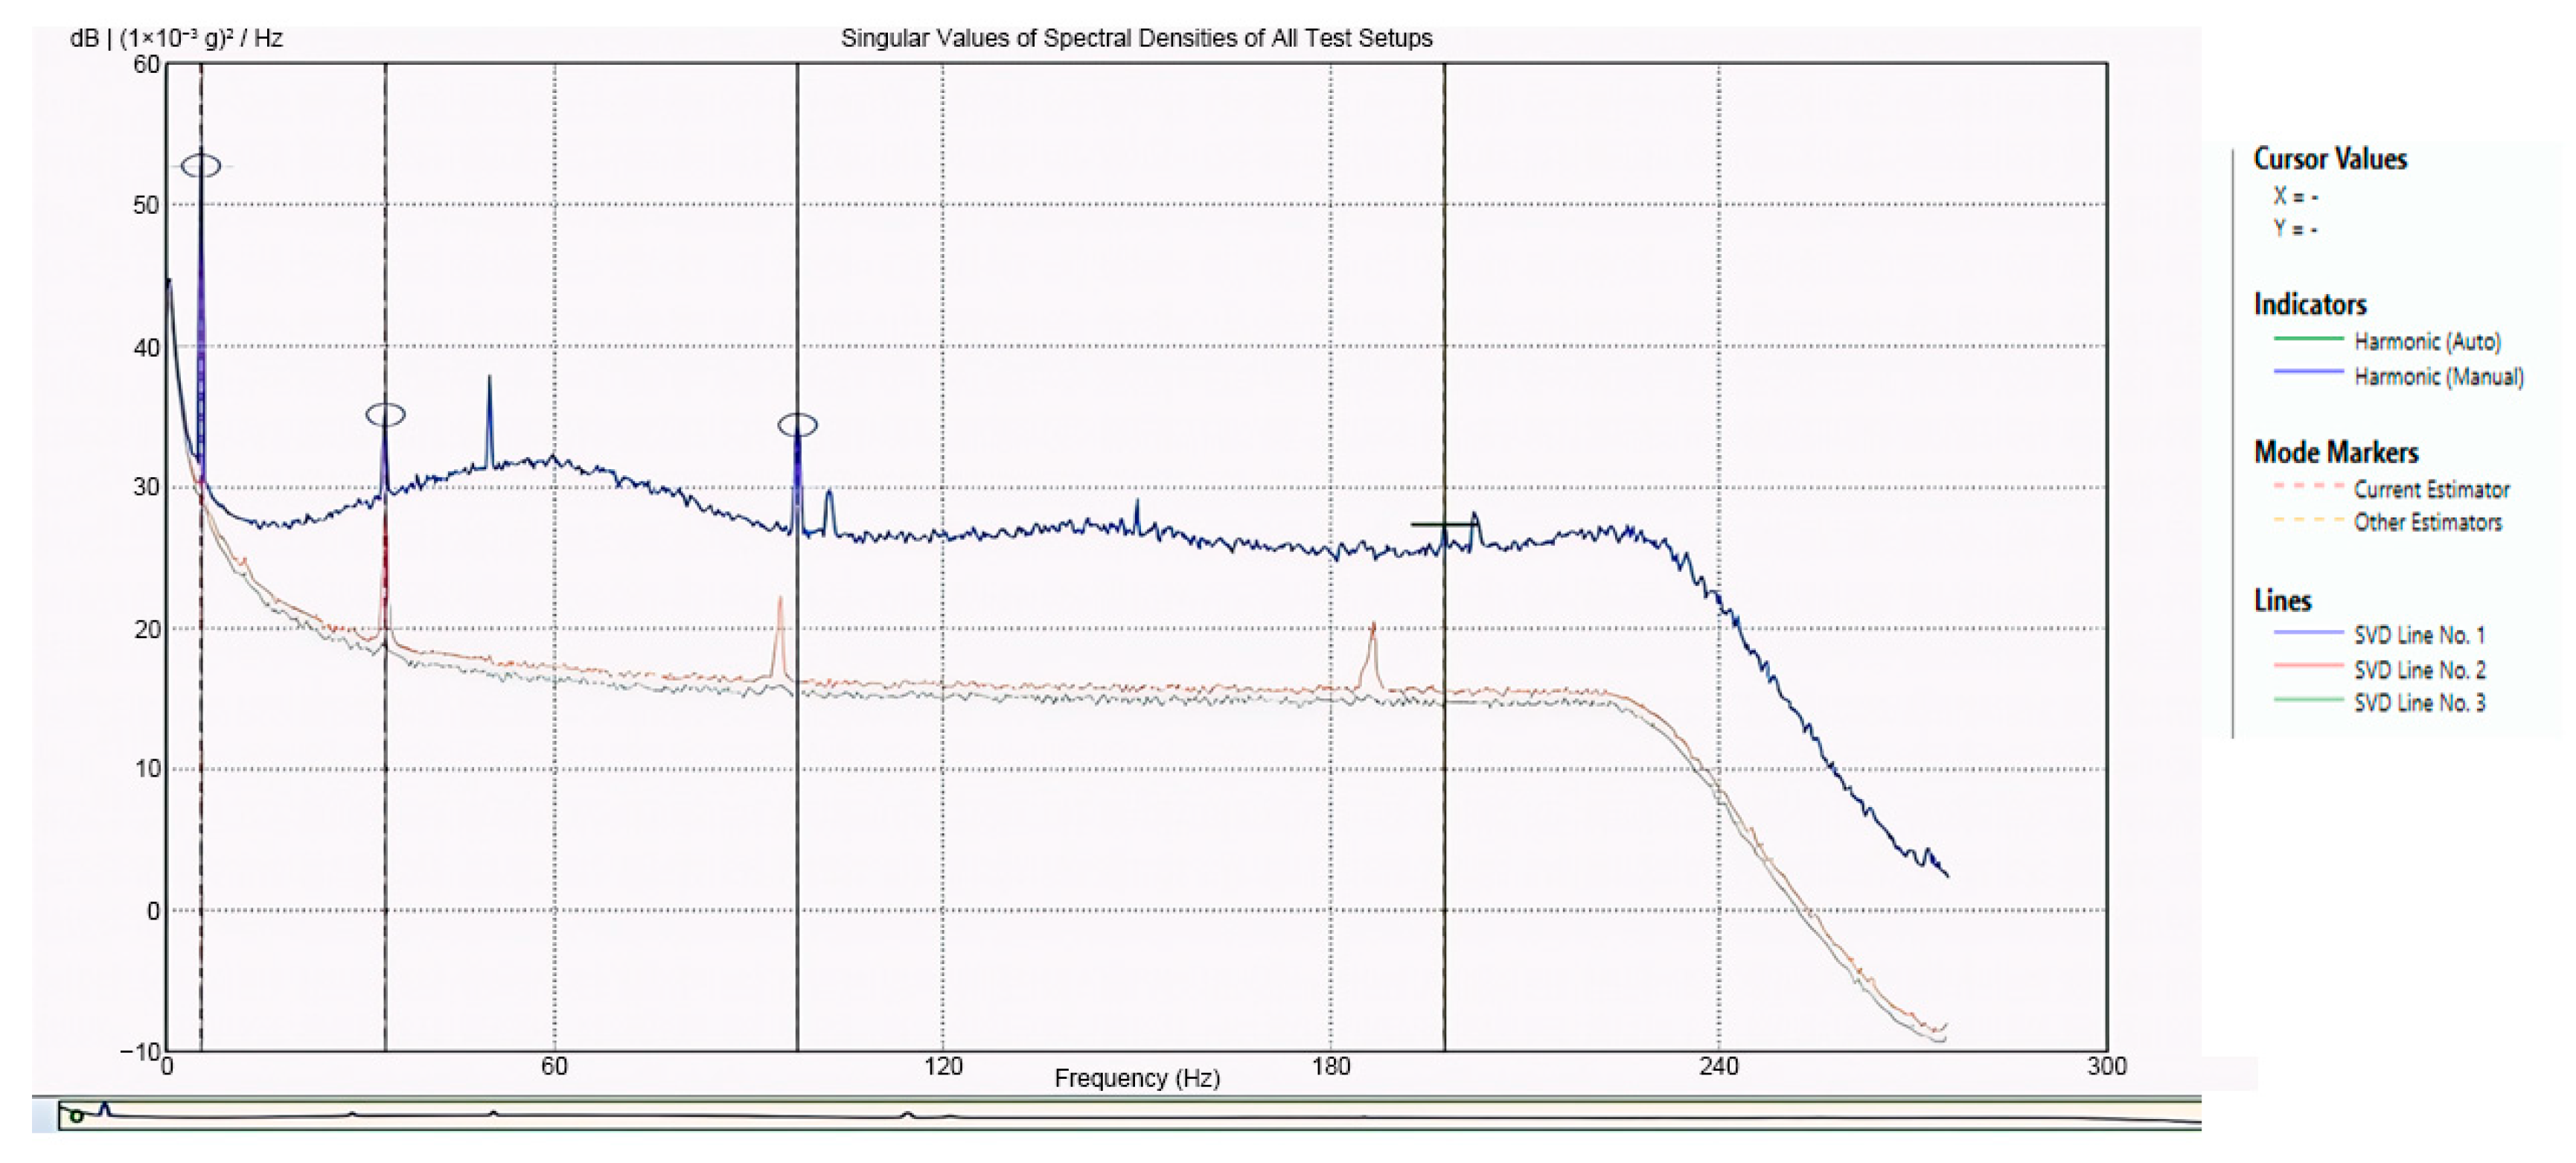
Natural frequencies were identified using operational modal analysis in Artemis Modal, employing the Frequency Domain Decomposition method. In this approach, the response data are divided into blocks, spectral density matrices are estimated for each block, and singular value decomposition is applied. Peaks in the first singular value indicate the natural frequencies, while the associated singular vectors at each peak give the operational mode shapes. This method is suitable here because the tests are output-only, the excitation is broadband, and FDD is robust to noise without requiring an input force measurement. The results of the spectral identification are shown in Figure 3.
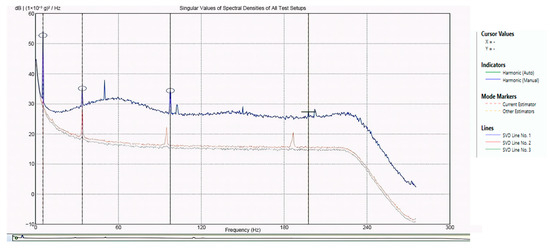
Figure 3.
Frequency Domain Decomposition spectrum from Artemis Modal showing the spectral peaks used to identify the natural frequencies of the cantilever beam.
In Artemis Modal, natural frequencies were identified using the Frequency Domain Decomposition (FDD) technique. This method estimates spectral density matrices from the measured acceleration responses and applies singular value decomposition. The peaks in the first singular value indicate the natural frequencies, while the corresponding singular vectors define the operational mode shapes. FDD was selected because it operates in output-only conditions, is robust to noise, and allows reliable frequency extraction without requiring input force measurements.
For the numerical model, natural frequencies were calculated using the eigenvalue solver in SAP2000. The model incorporated the same geometry, total mass, and boundary conditions described in Section 2.2, ensuring consistency with the experimental configuration. The eigenvalue analysis yielded undamped natural frequencies along with their corresponding mode shapes. These outputs provide a theoretical reference for comparison with the experimental data obtained from Artemis.
The first comparisons revealed that the FEM predictions were not entirely consistent with the measured results, especially for higher modes. To reduce these discrepancies, the mechanical properties of the beam were recalibrated. An iterative calibration phase was carried out in SAP2000 to identify the most suitable parameter set; only the final updated values are reported in Table 2 for brevity. In the final model, the elastic modulus was adjusted to 92% of the nominal value of S355 steel, while Poisson’s ratio was slightly reduced, and the density remained unchanged. These modifications account for residual stresses, imperfections, and ageing effects that lower the stiffness compared to catalogue values. The results of this adjustment, showing the experimental frequencies alongside both the initial and updated FEM predictions, are summarised in Table 3.

Table 3.
FEM and experimental natural frequency mode.
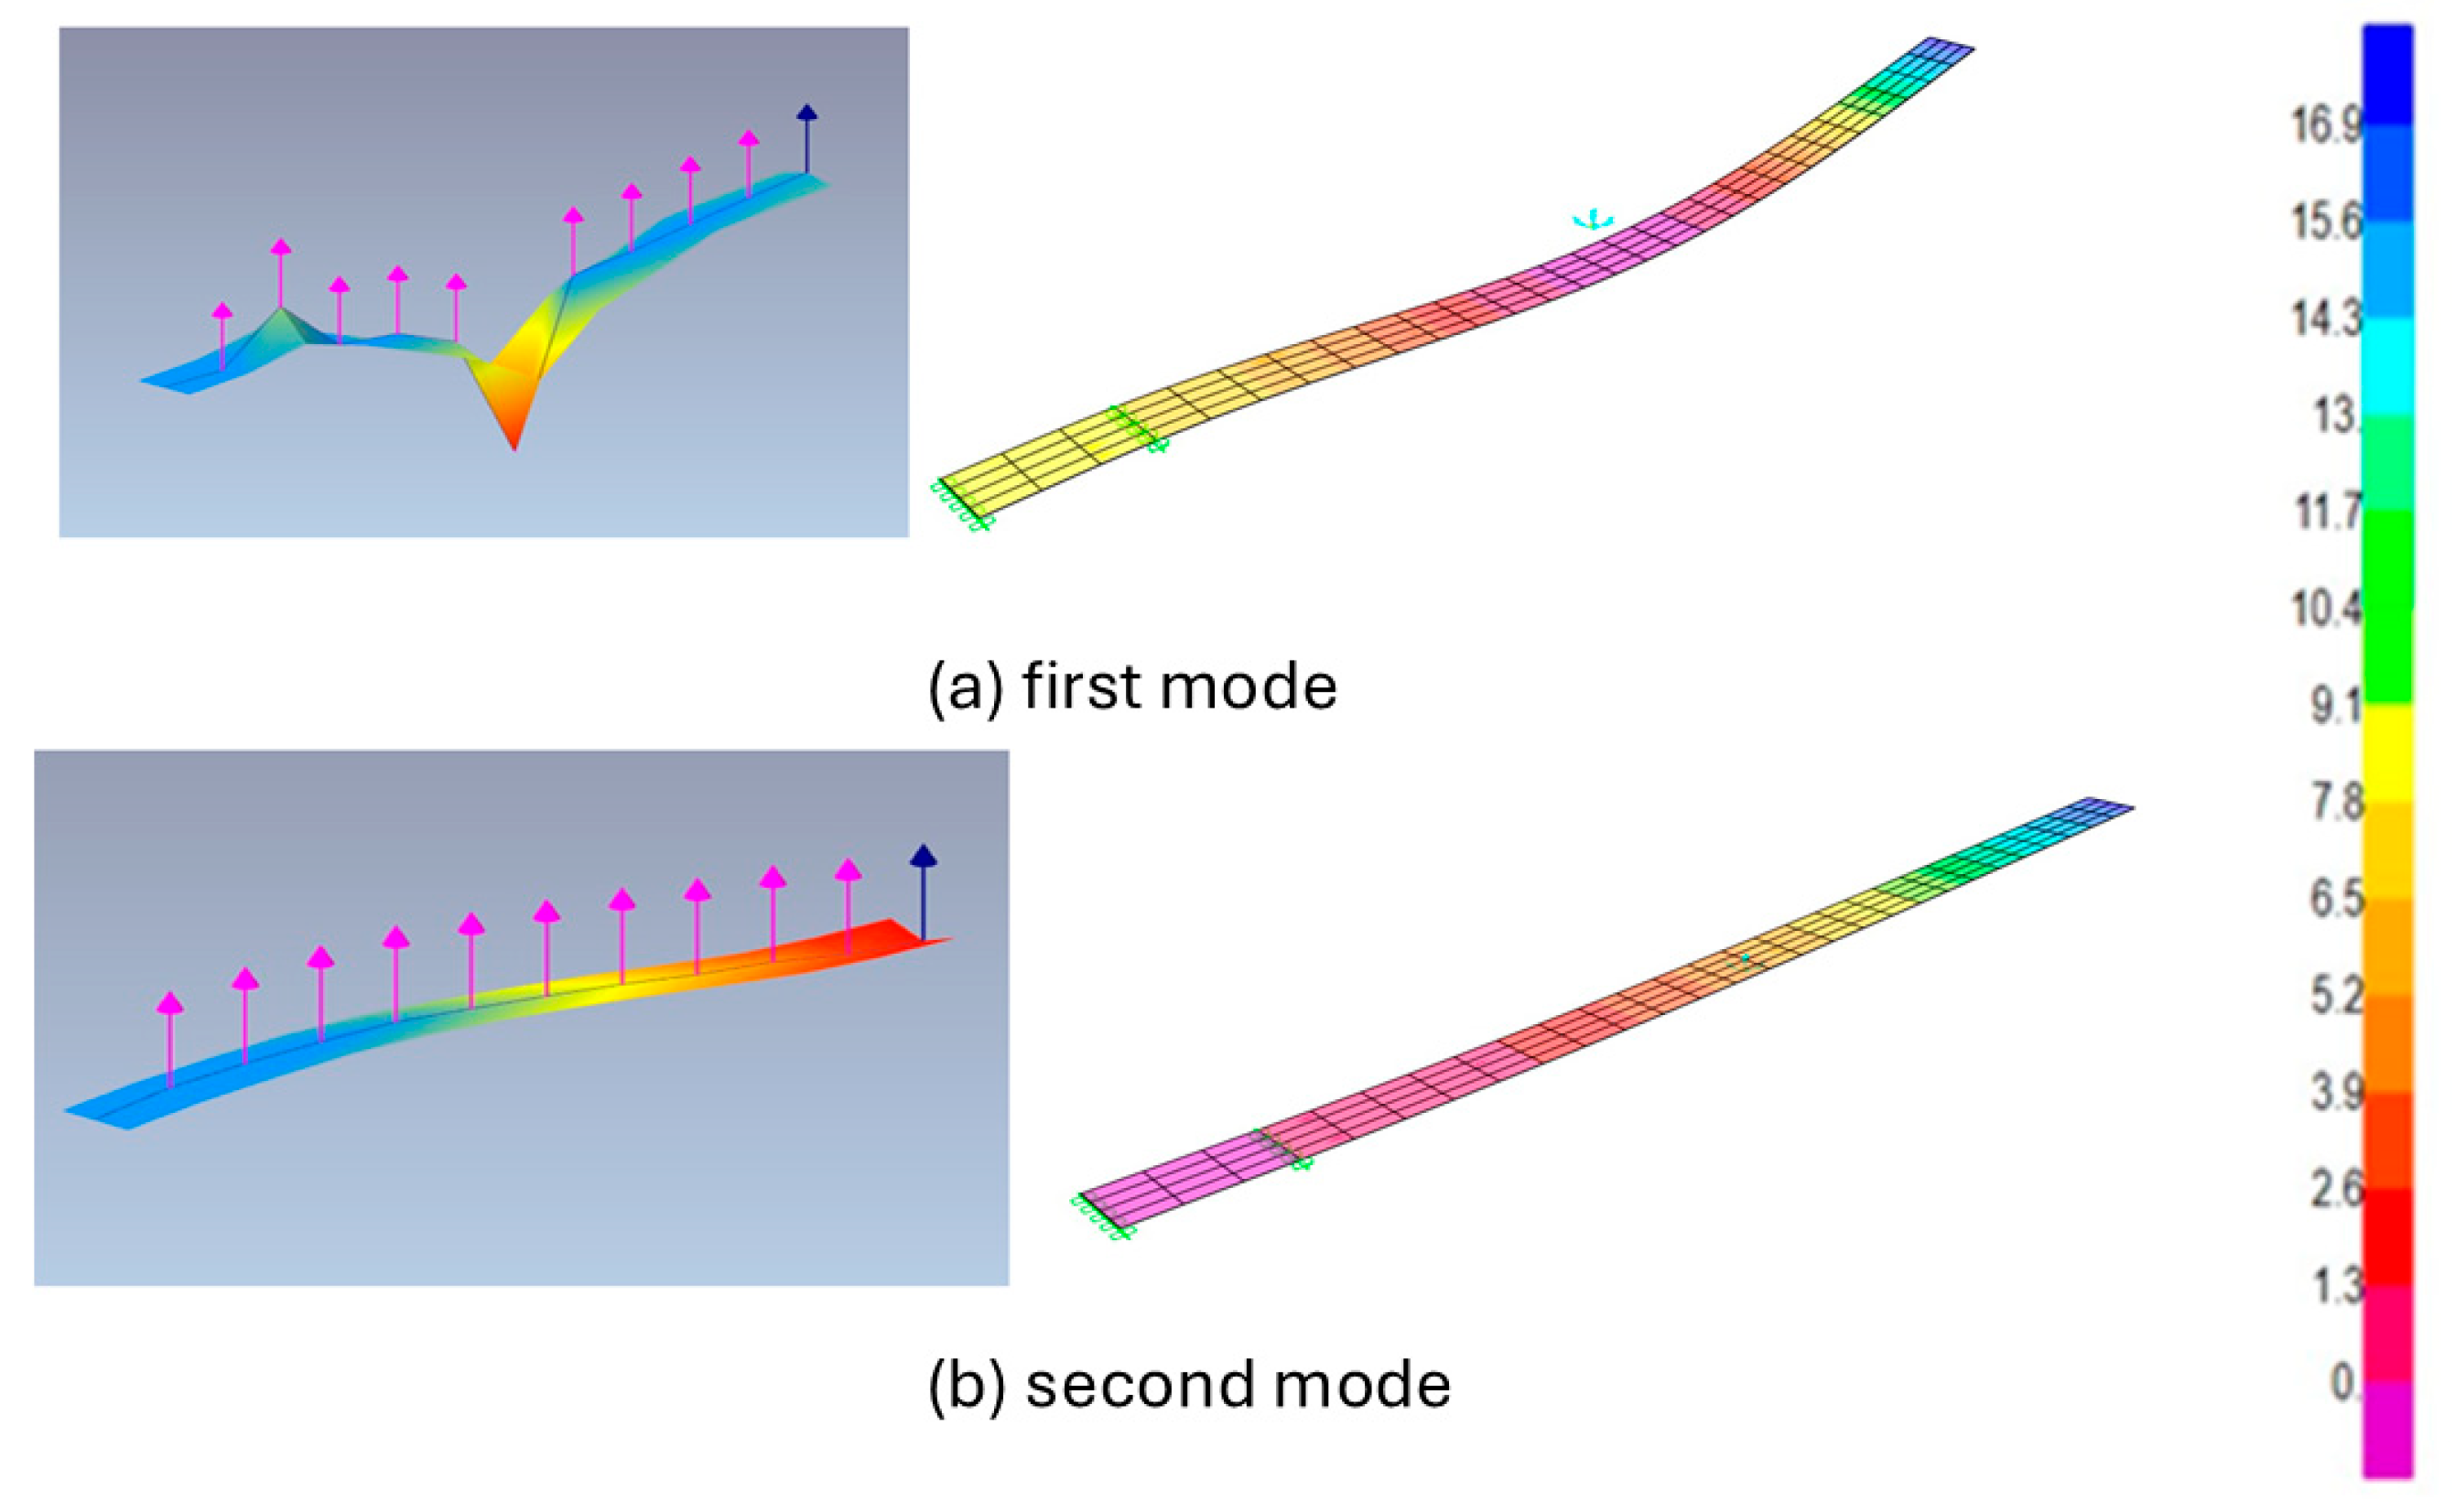
The first and second modes were extracted from Artemis and compared directly with the FEM predictions. These lower-order responses correspond to the fundamental flexural behaviour of the beam. The experimental results captured the expected bending patterns, and the FEM simulations accurately reproduced the general shape, although they showed measurable differences in frequency values. The comparison of these two modes provides an essential first step in validating the model performance at the most critical vibration orders. The corresponding results are presented in Figure 4.
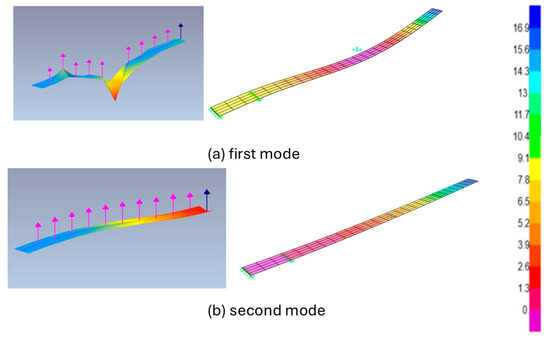
Figure 4.
Comparison of experimental and initial FEM mode shapes: Experimental modes from Artemis are on the left and numerical modes from SAP2000 are on the right (mode 1 and 2).
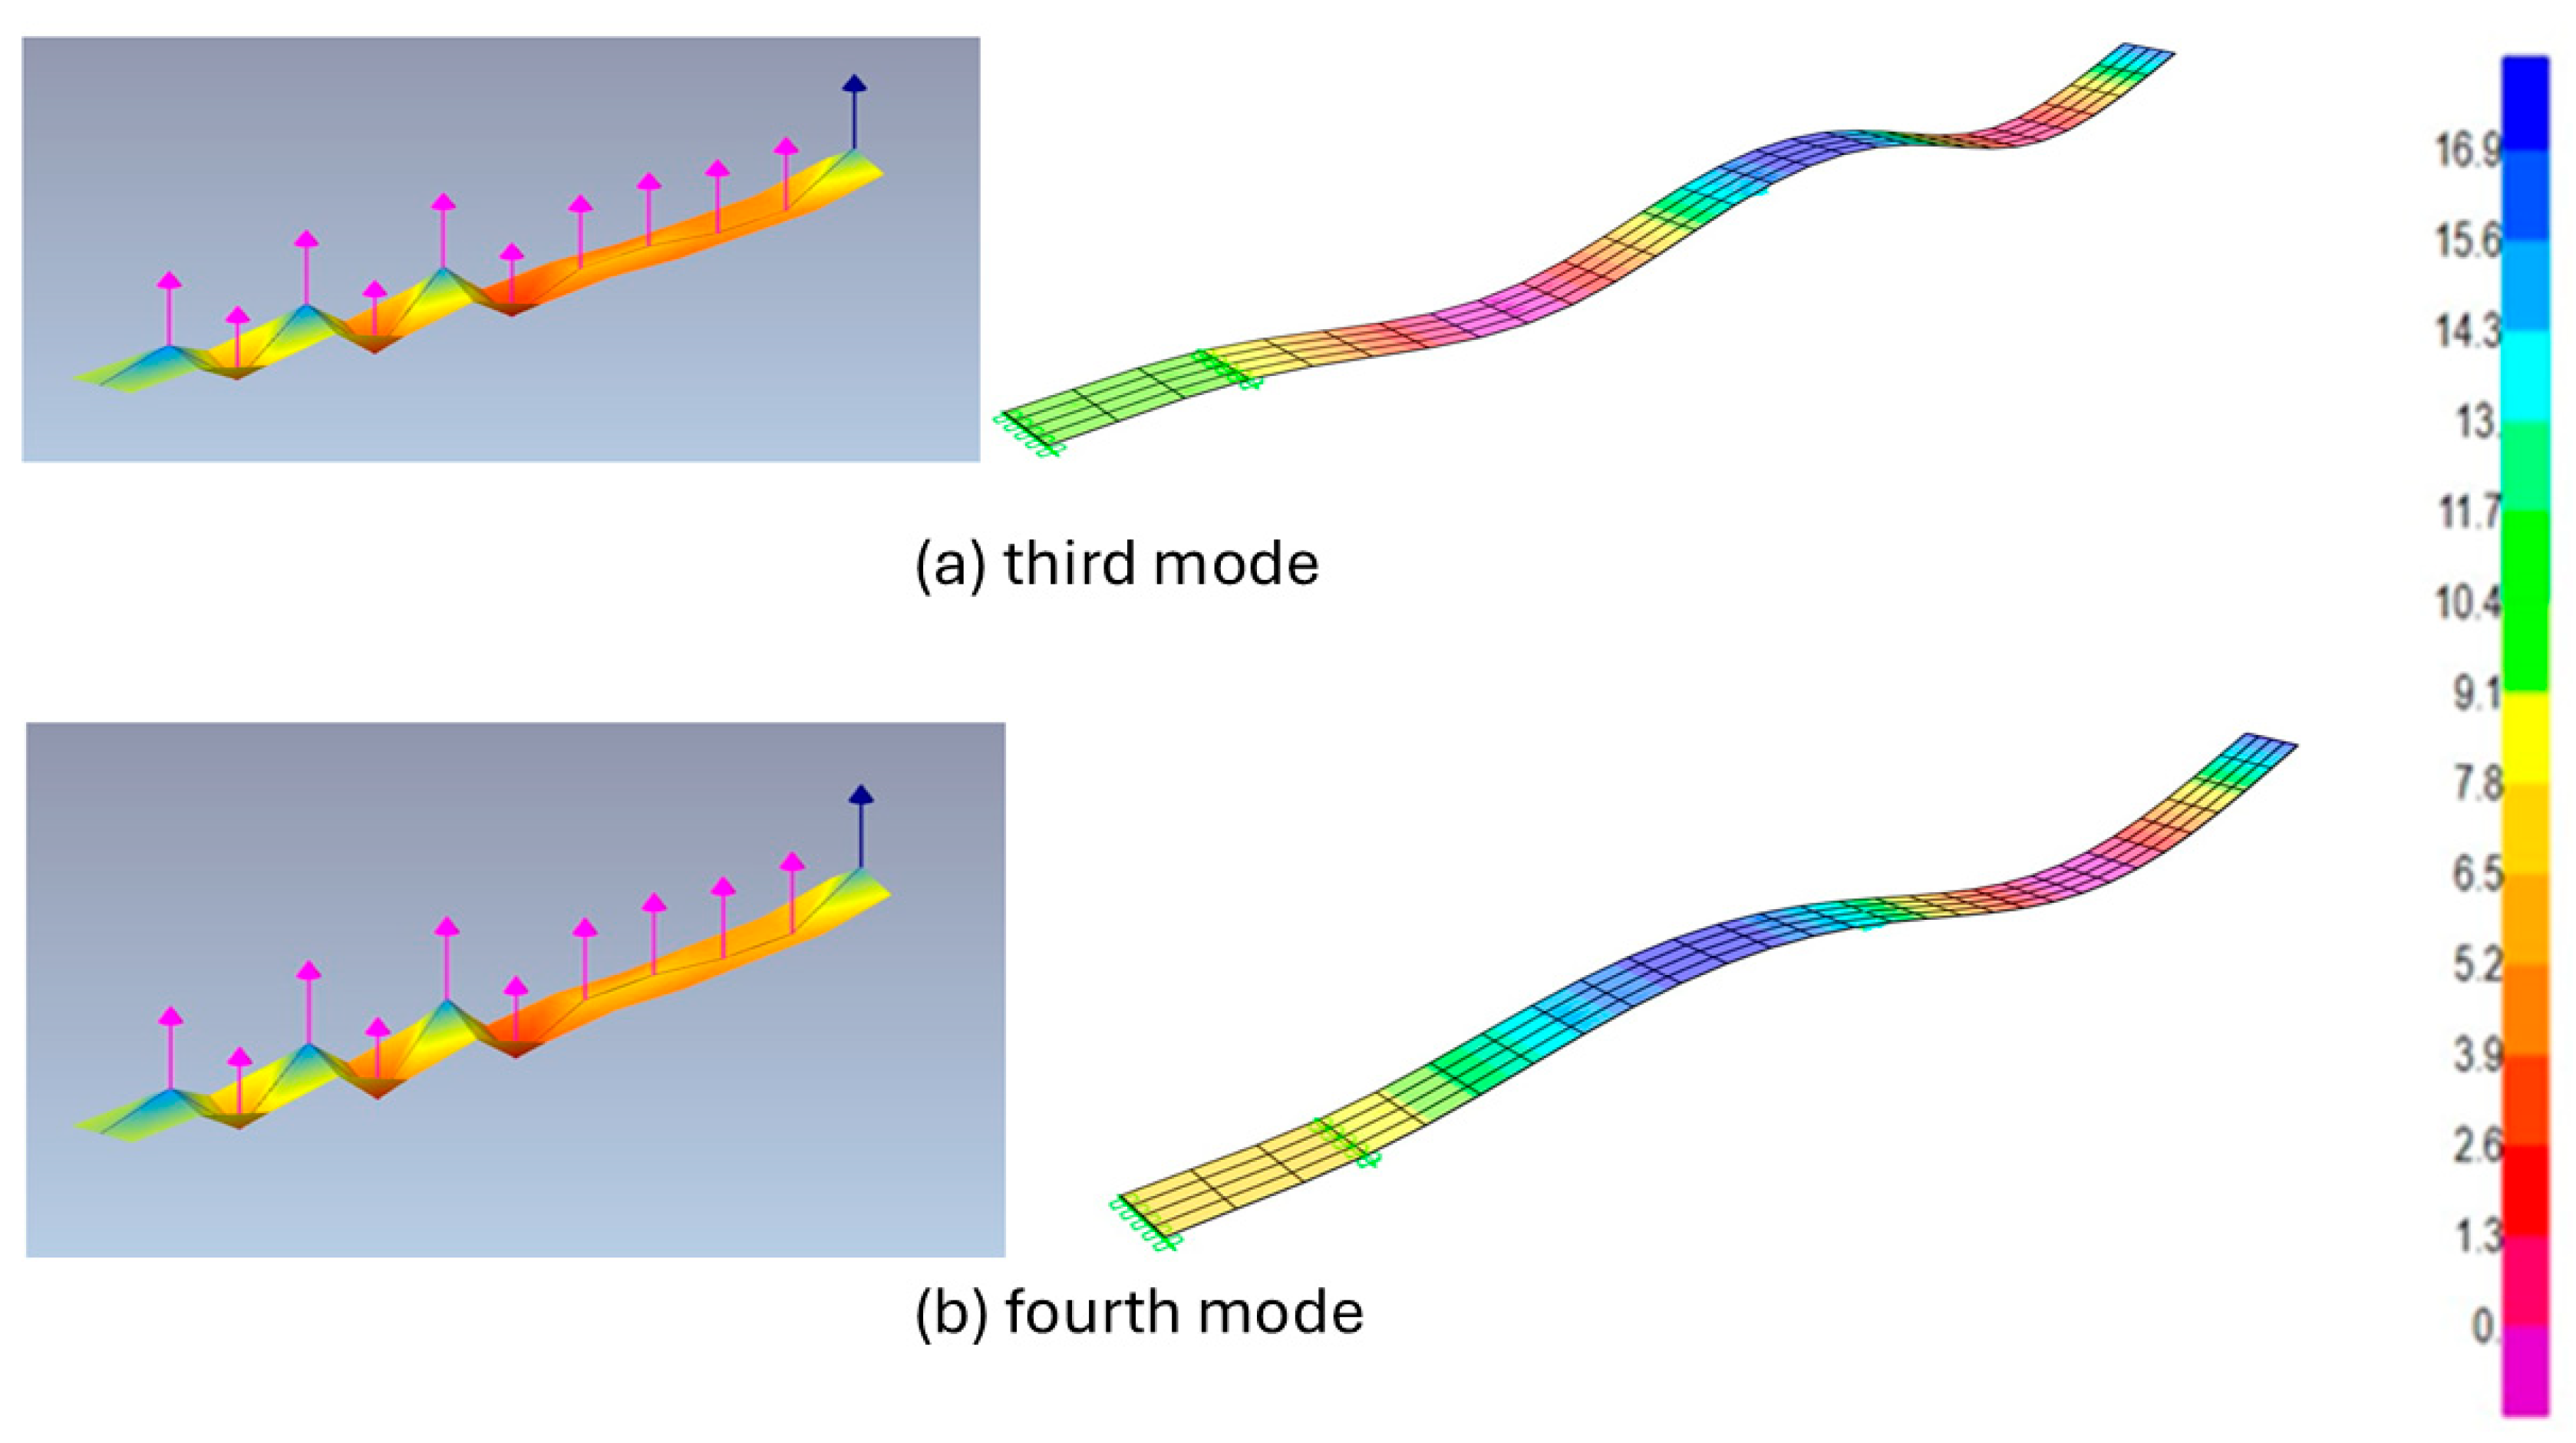
The analysis then extended to the third and fourth modes, which represent higher-order flexural responses. At this level, discrepancies between experimental and numerical predictions became more evident. Frequency differences were larger, and the experimental mode shapes were less consistent due to sensor spacing and boundary effects. These results illustrate the increased sensitivity of higher modes to measurement resolution and modelling assumptions. The third and fourth modes are shown in Figure 5.
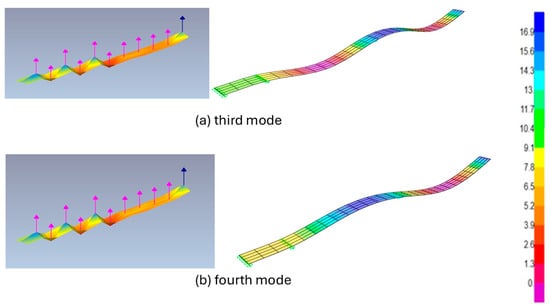
Figure 5.
Comparison of experimental and initial FEM mode shapes: Experimental modes from Artemis are on the left and numerical modes from SAP2000 are on the right (mode 3 and 4).
The fourth mode was excluded from the MAC evaluation because the available measurement grid did not provide sufficient spatial resolution to capture its shape reliably. For a prismatic beam, the spatial variation in the n-th bending mode contains n half-waves along the span. This limitation is consistent with previous findings, where it has been shown that higher-order mode shapes require finer spatial resolution to avoid aliasing, and that insufficient sensor density restricts the maximum identifiable mode order [24,25]. To resolve these oscillations, at least two measurement points are required per half-wave, leading to the conservative criterion.
With L = 1400 mm and n = 4, the requirement becomes Δx ≤ 175 mm. In the present setup, seven accelerometers were located at 0, 120, 285, 470, 655, 840, and 1025 mm, resulting in several gaps of approximately 185 mm. Since Δx, max ≈ 185 mm > 175 mm, the fourth mode cannot be captured with the spatial fidelity needed for a reliable MAC. An equivalent rule-of-thumb states that the largest mode order that can be correlated with confidence is
which gives n_max ≈ ⌊1400/(2 × 185)⌋ = 3. For this reason, the MAC analysis was limited to the first three modes, which are well resolved by the sensor grid and are also the most relevant for serviceability and resonance checks in practice. The third mode is retained because the measured DOFs still satisfy the resolution criterion, and because its frequency contributes to the validation of the updated stiffness in Section 3.2.
nmax ≈ ⌊L/(2Δx, max)⌋,
Although the FDD method is reliable for identifying frequencies under output-only conditions, accurate correlation of mode shapes also depends on spatial sampling and measurement quality. At higher modes, shorter wavelengths and closer nodal spacing make the results more sensitive to small errors in boundary conditions, sensor placement, or additional mass. These effects amplify distortions in the measured shapes, reducing their usefulness for quantitative correlation. For this reason, the MAC analysis was restricted to modes 1–3, while modes 3 and 4 remain reported through frequency values and qualitative shape plots to ensure completeness before the updating procedure. Mode shapes and natural frequencies alone are not sufficient to fully the beam response. Therefore, a well-established tool in experimental modal analysis, the Modal Assurance Criterion (MAC), was applied to quantify the similarity between numerical and experimental mode shapes. From the mathematical standpoint, given two vectors and representative of the mode shapes under comparison, the MAC is expressed as follows:
where the form of coherence function can be recognised, indicating the causal relationship between and .
This equitation is valid under the assumption of normal modes such as those obtained from FEM modal analyses. The MAC can be interpreted as a squared correlation coefficient that measures the degree of consistency between two mode shape vectors. The MAC value ranges from1 and 0. The higher the MAC values indicate a stronger correlation between the vectors. Values above 0.8–0.9 are generally considered indicators of good consistency. Conversely, low MAC values indicate weak correlation, and values below 0.1–0.2 are regarded as showing no meaningful consistency. In practice, the MAC is also used to distinguish between global and local modes.
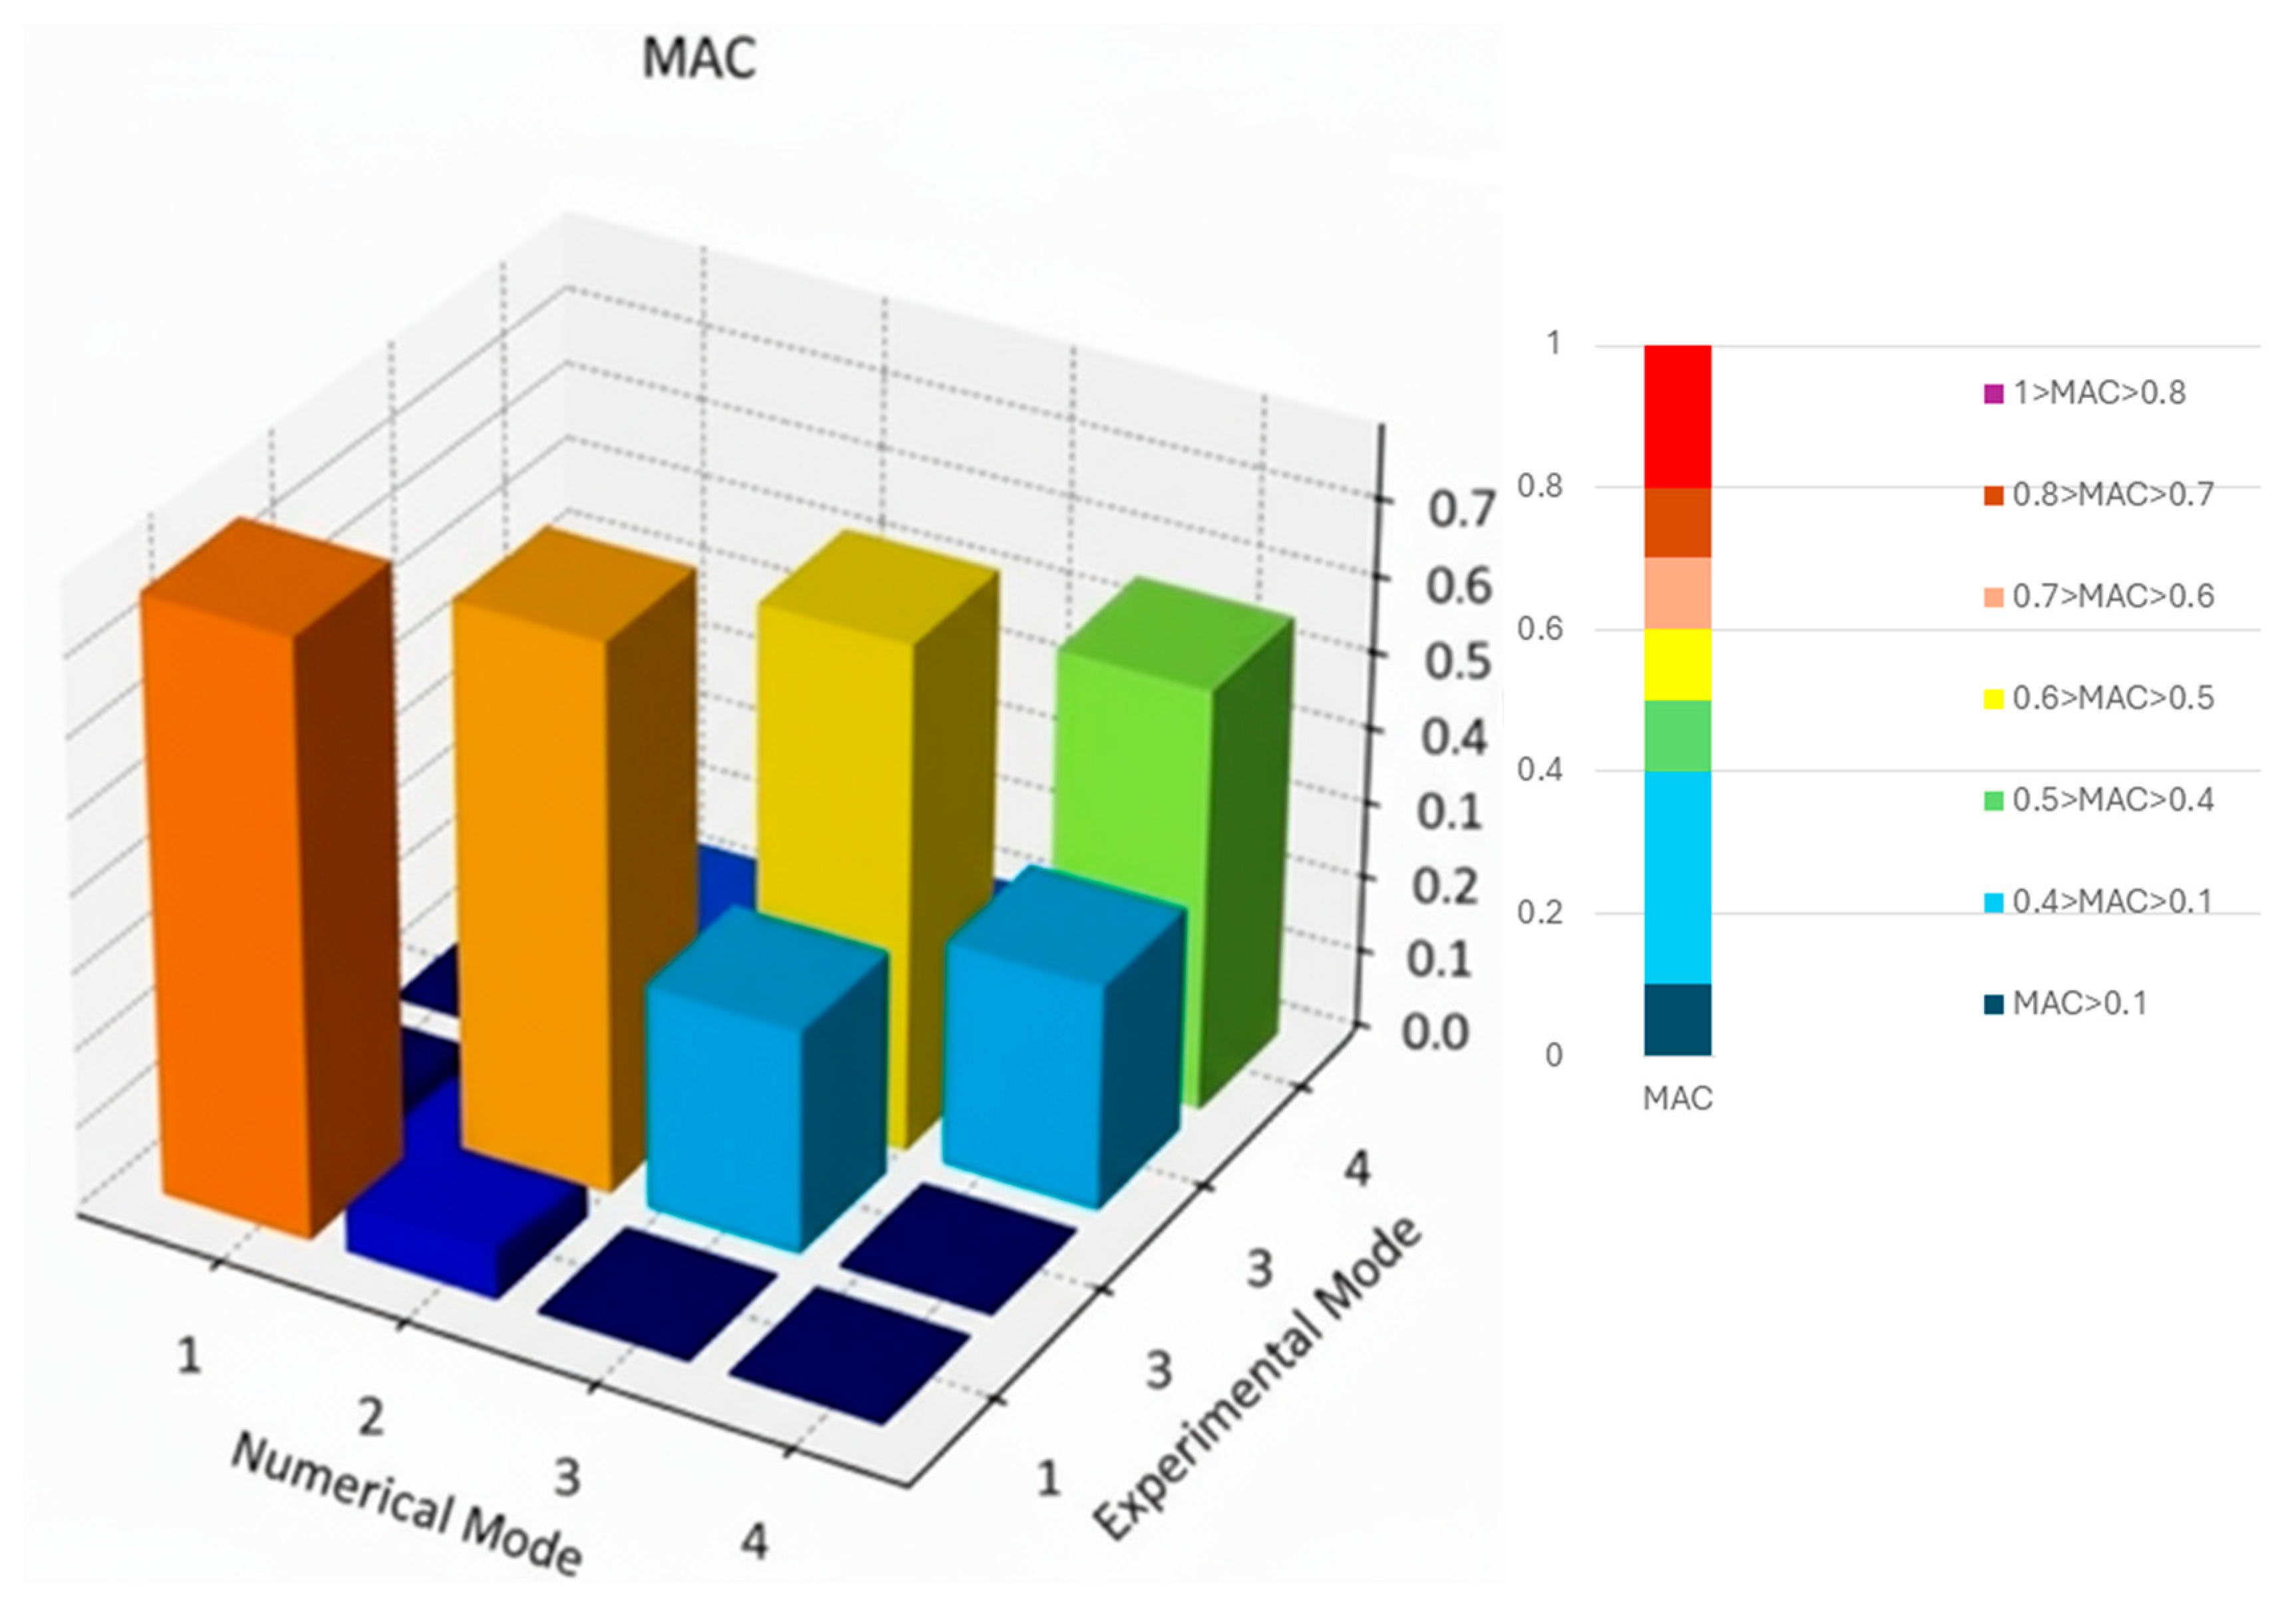
The MAC can therefore be used to compare two modal models directly. If the two mode shape vectors are linearly related, the MAC value will approach 1. If the vectors are linearly independent, the MAC value will be close to zero. The degree of similarity between the first three experimental and numerical mode shapes was then quantified using the Modal Assurance Criterion. The MAC definition and the results from Test 1 are presented in Figure 6.
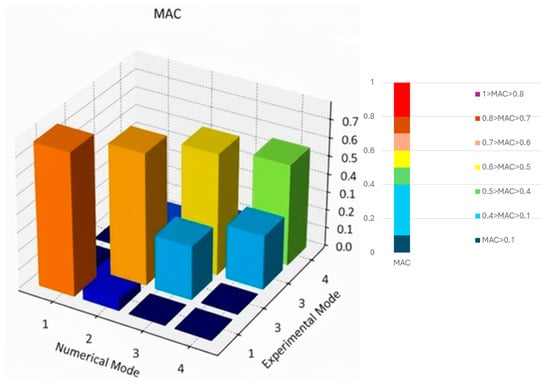
Figure 6.
Modal Assurance Criterion (MAC) matrix for the free-end boundary condition. The correlation between experimental mode shapes and numerical FEM modes was calculated, and high diagonal values confirm good agreement after model updating.
The Test 1 evaluation confirmed that the first mode shape correlated well between experiment and FEM, while the second mode showed moderate agreement, and the third mode revealed weaker consistency. These differences reflect both the simplified assumptions in the initial FEM and the limitations of the experimental sensor layout at higher frequencies. The analysis, therefore, demonstrated the need to recalibrate the FEM by adjusting material properties to represent the tested beam better. Section 3.2 presents the updated comparison, showing how these modifications improved frequency alignment, mode shape correlation, and MAC values. The findings from Test 1 highlighted both the strengths and the limitations of the initial FEM representation. While the first two modes provided useful correlation, the reduced accuracy in higher modes confirmed that boundary condition assumptions and sensor placement played a critical role in shaping the results. To address these issues, the second experimental campaign was designed with revised conditions, including a roller support and an improved accelerometer layout. These adjustments aimed to reduce uncertainties and provide more reliable data for comparison. Section 3.2 presents the updated FEM versus experimental results, demonstrating how these changes enhanced frequency alignment, mode shape correlation, and overall, MAC performance.
3.2. Test 2, the Experimental and Numerical
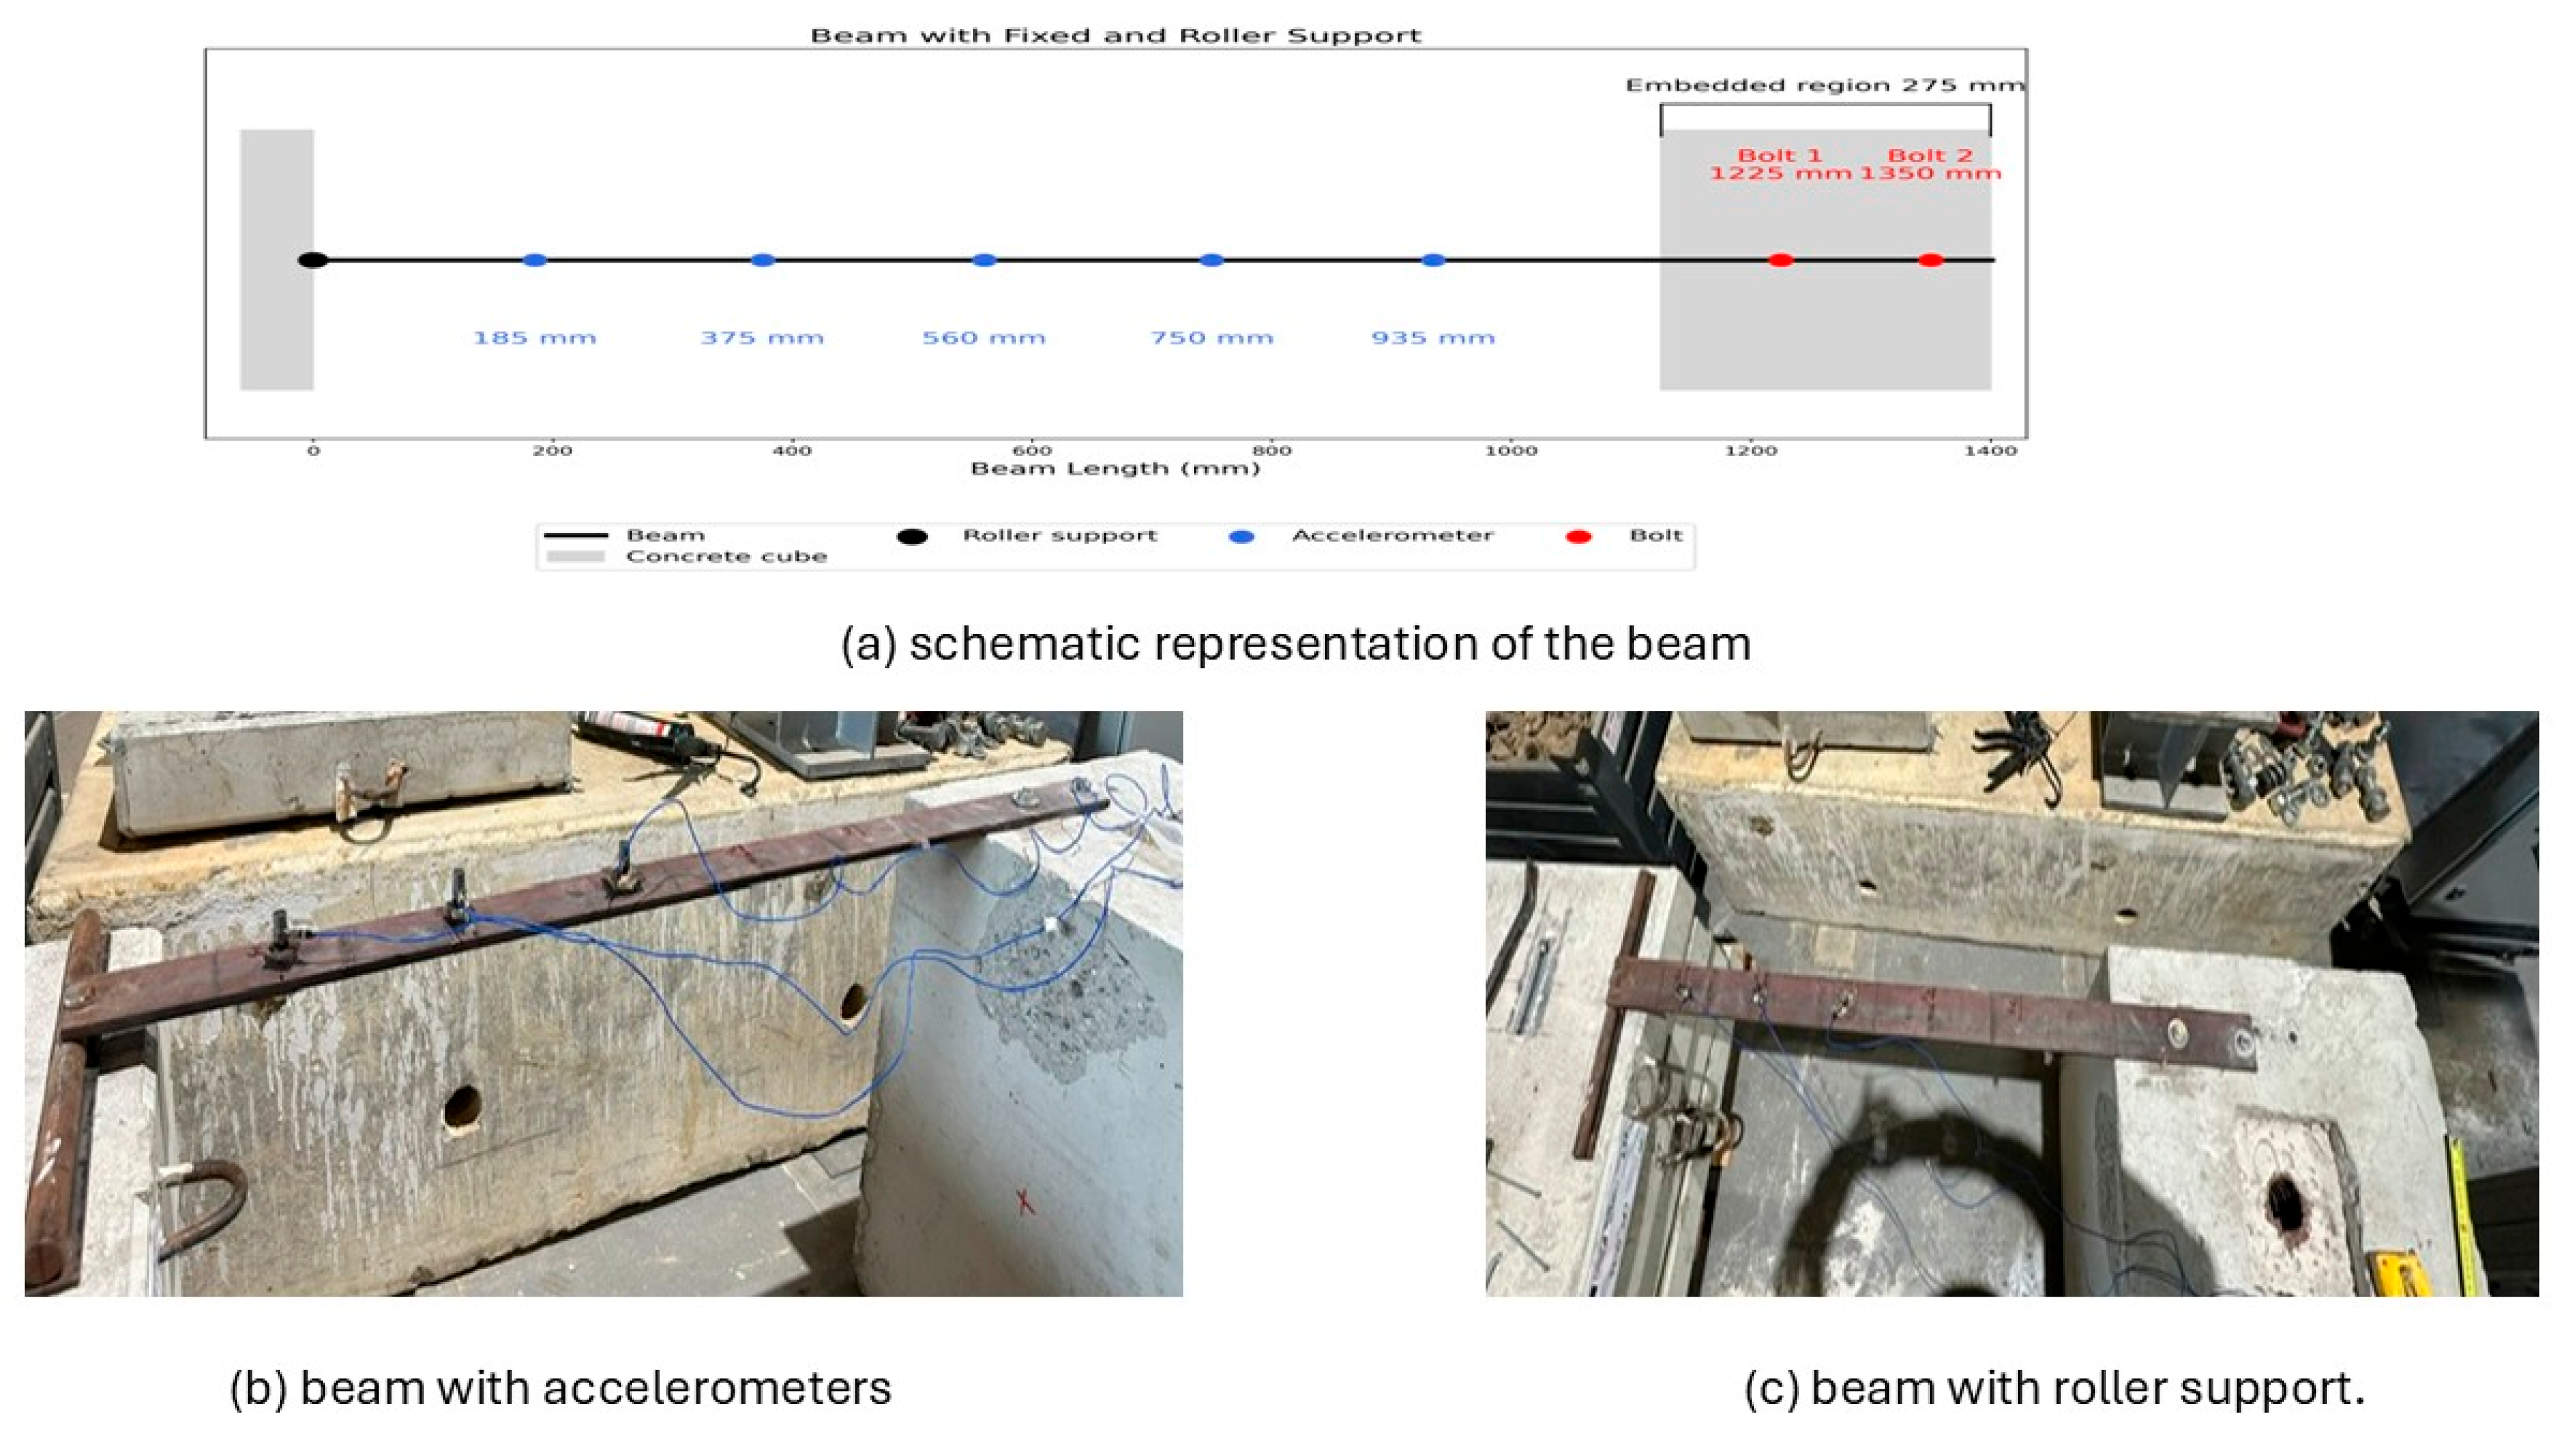
For the second test, the experimental configuration was modified to improve the quality of the measured data and reduce uncertainties identified in Test 1. A roller support was introduced at the free end of the beam to stabilise boundary conditions and minimise unwanted rotations during excitation. This addition reduced sensitivity to local imperfections and provided a more controlled testing environment. At the same time, the accelerometer layout was adjusted to enhance spatial coverage along the beam. Five sensors were distributed at 185, 375, 560, 750, and 935 mm from the fixed end, as shown in Figure 7. This new arrangement decreased the maximum spacing between adjacent sensors, which increased the resolution for capturing higher-order vibration modes.
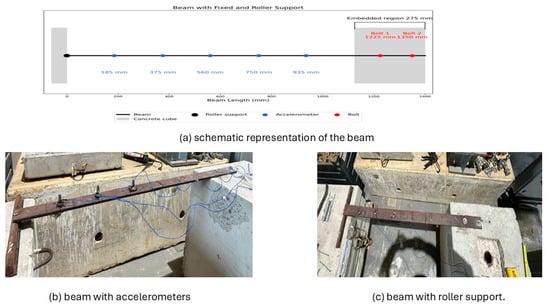
Figure 7.
Test 2 setup: (a) schematic of support and accelerometer layout; (b) beam with accelerometers; (c) beam with roller support.
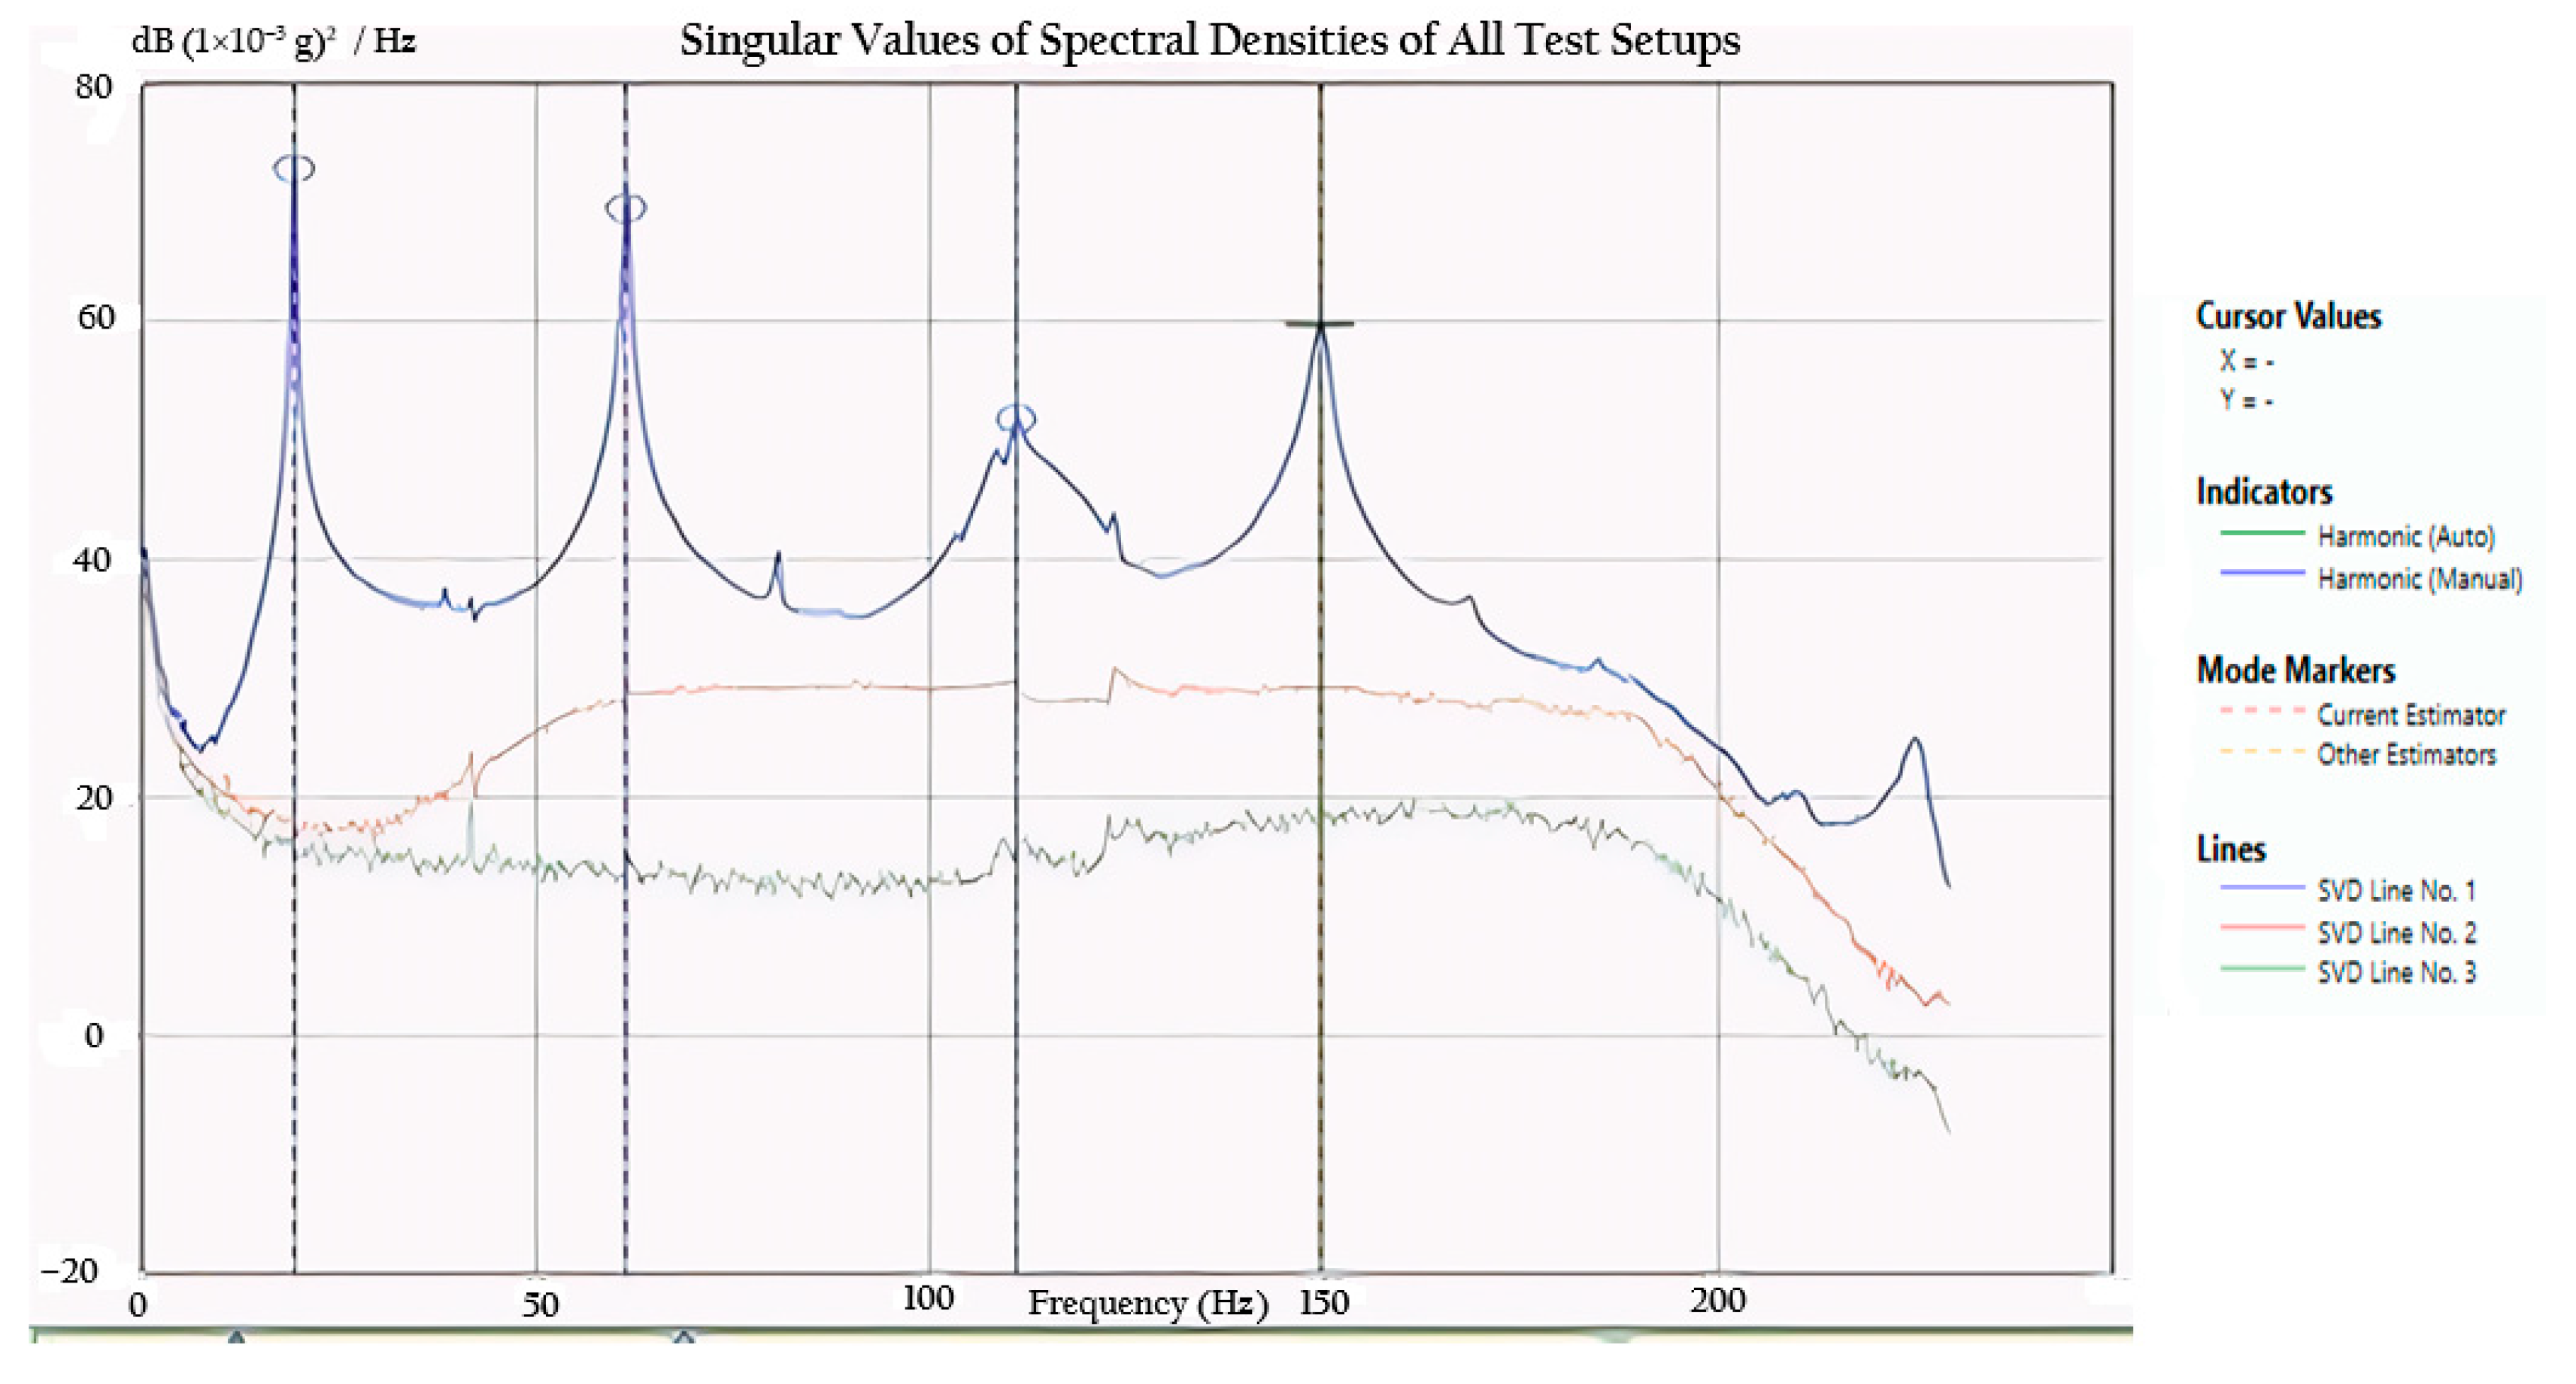
The bolts and concrete embedding remained unchanged, ensuring that the revised setup could be directly compared to the previous results while isolating the effects of the added support and sensor redistribution. Natural frequencies in Test 2 were identified using the same dual approach as in Test 1. In Artemis, the Frequency Domain Decomposition (FDD) method was applied to the measured acceleration responses. The technique decomposes the spectral density matrices and identifies natural frequencies from peaks in the singular value spectra, while the associated vectors describe the mode shapes. FDD was chosen because it operates in output-only conditions, is robust to noise, and does not require direct measurement of the input forces. The corresponding FDD spectrum for Test 2 is presented in Figure 8.
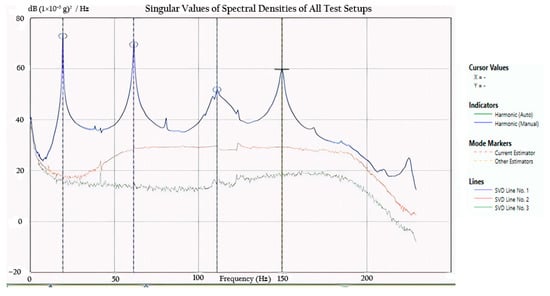
Figure 8.
Frequency Domain Decomposition (FDD) spectrum from Artemis in Test 2.
The natural frequencies obtained from both the updated FEM model and the second experimental campaign are summarised for the first four modes. These results are presented in Table 4, providing a direct comparison between the numerical predictions and the measured data.

Table 4.
Presents the comparison of FEM and experimental natural frequencies in Test 2.
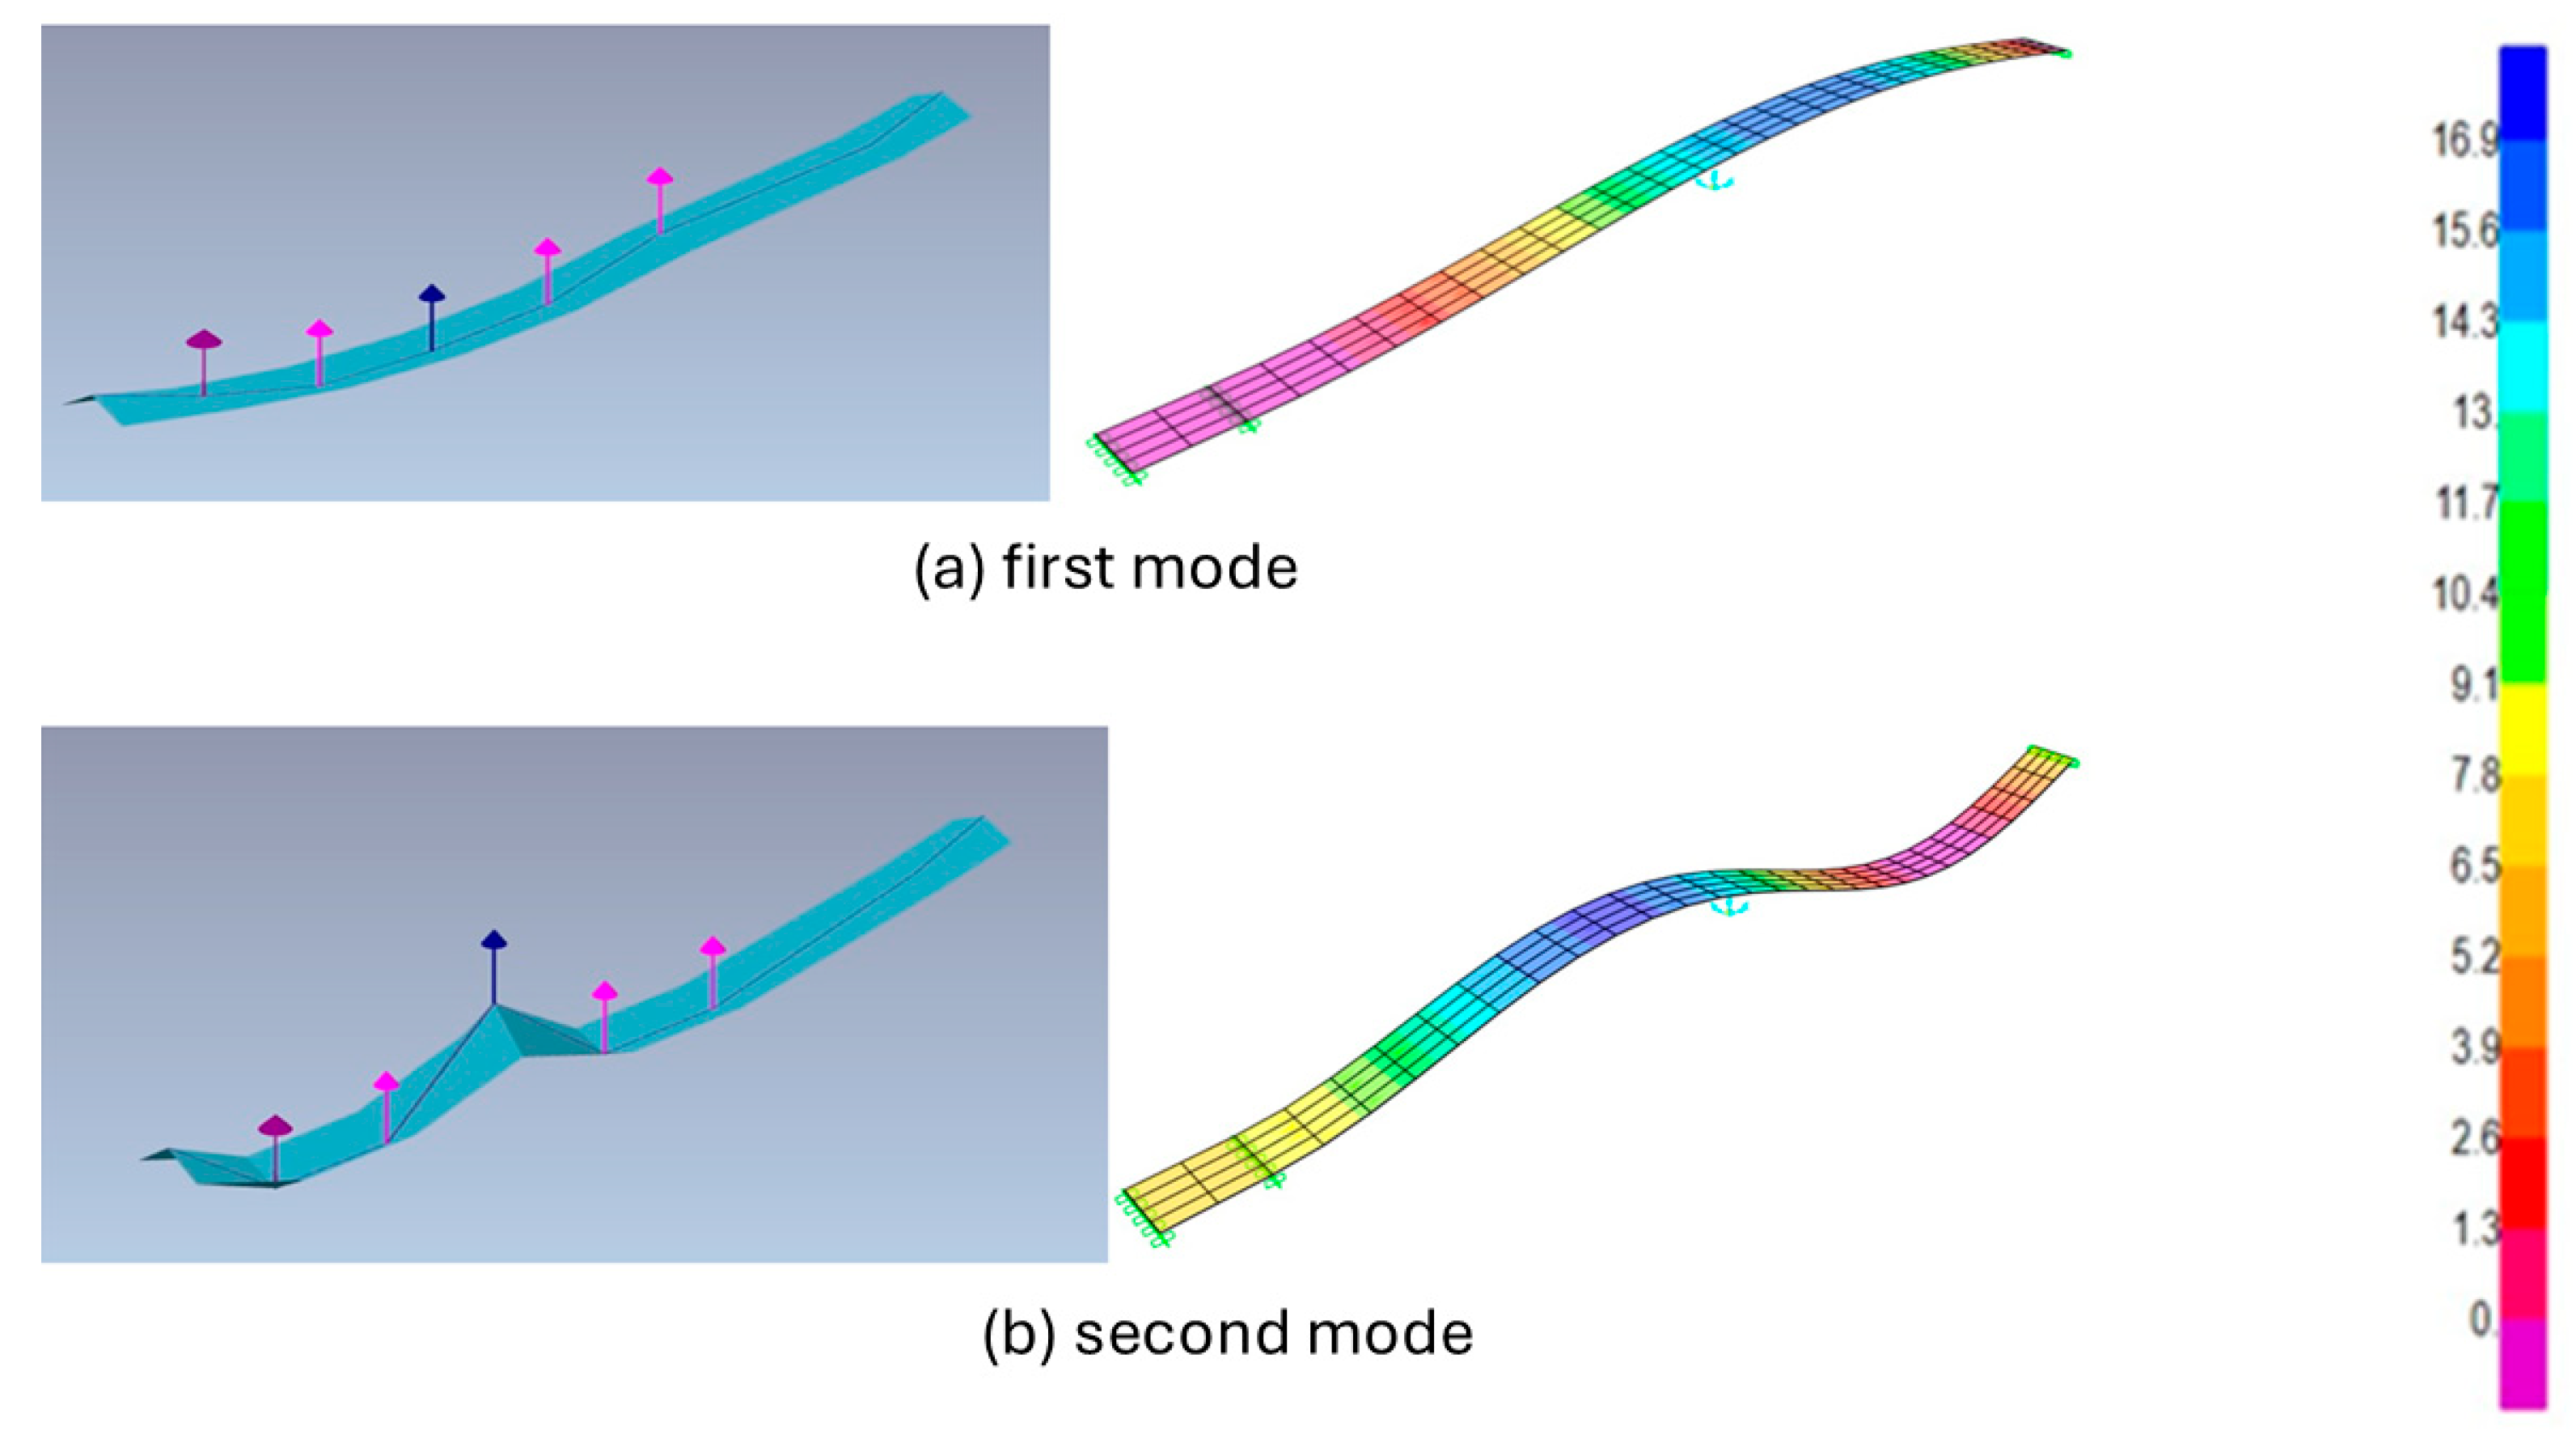
The comparison of mode shapes provides further evidence of the improved correlation achieved in Test 2. Figure 9 shows the first and second modes obtained from Artemis alongside the updated FEM predictions.
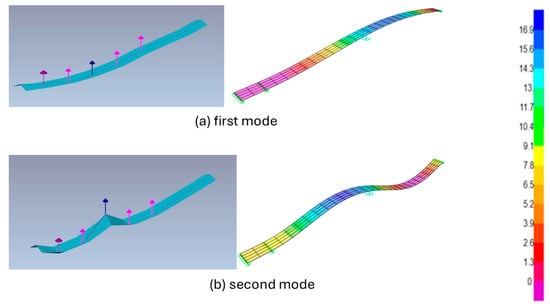
Figure 9.
Comparison of experimental and FEM mode shapes in Test 2: (a) first mode; (b) second mode.
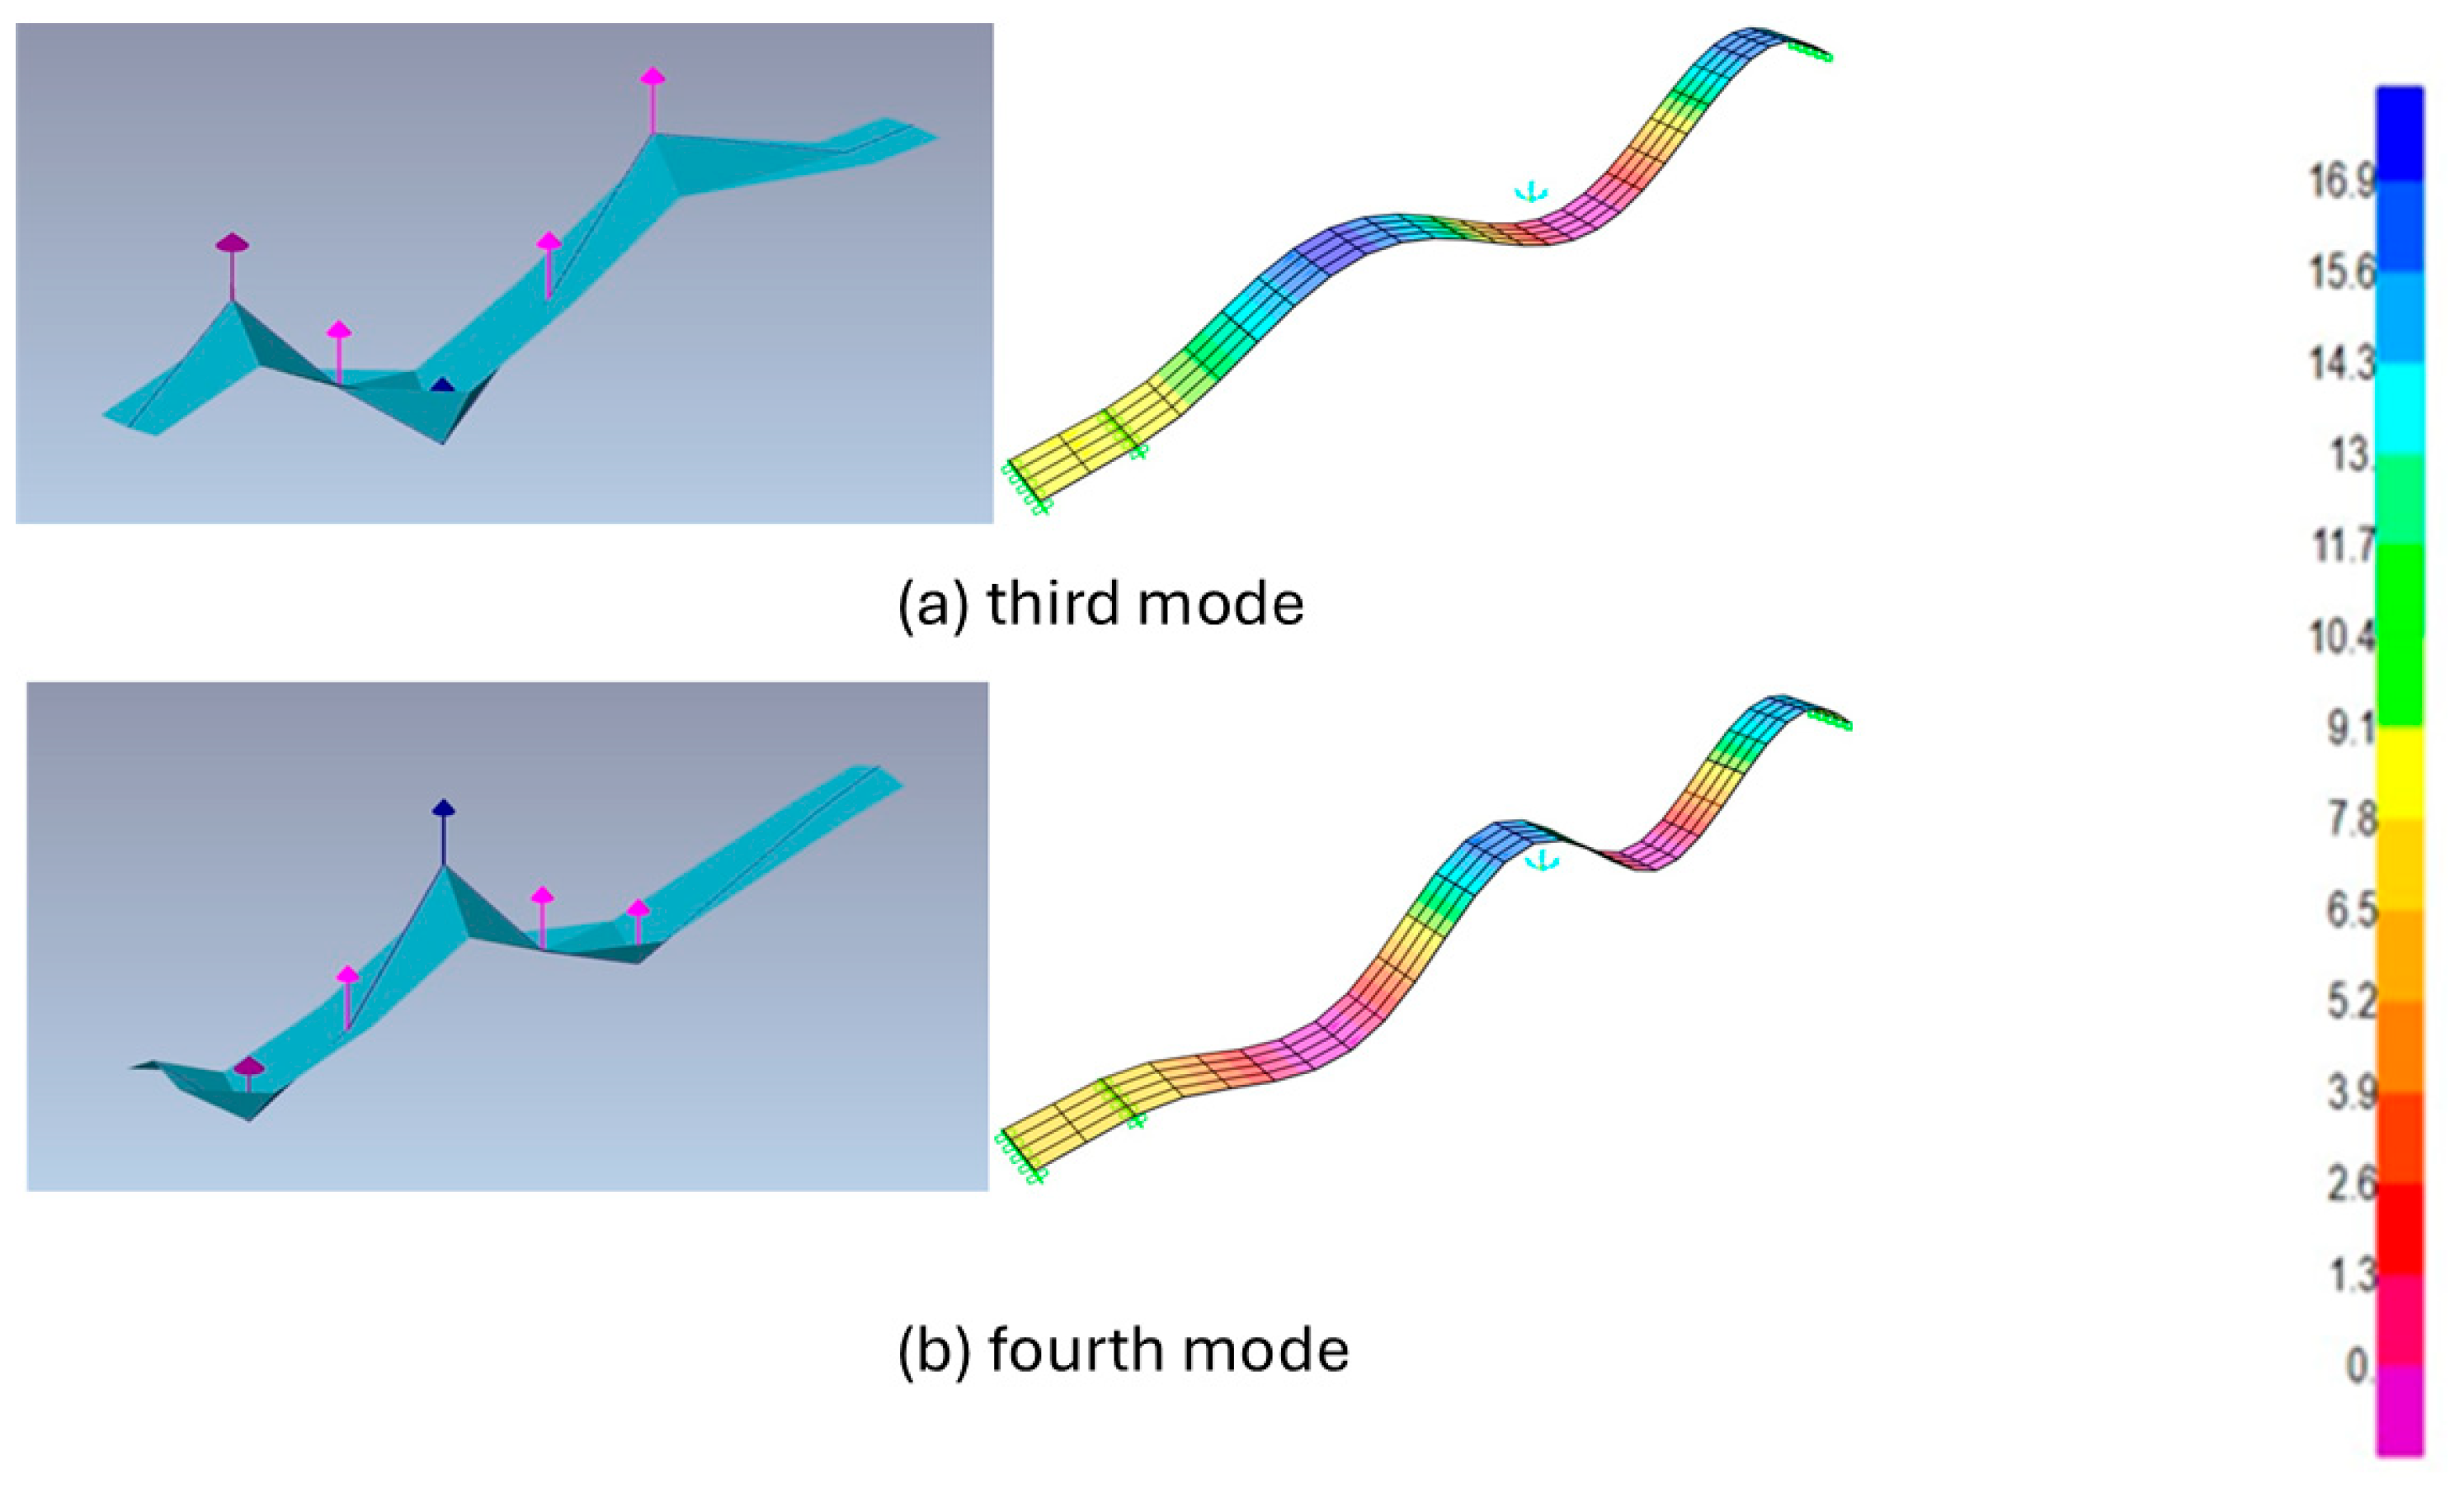
The bending patterns are consistent between the two approaches, and the frequency differences are much smaller than those observed in Test 1. This confirms that the roller support and recalibrated material properties improved the accuracy of the model for the lower-order modes. The third and fourth modes are presented in Figure 10.
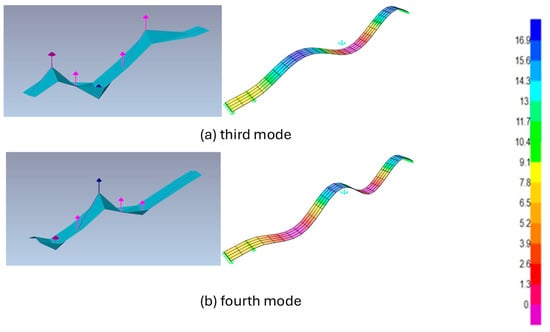
Figure 10.
Comparison of experimental and FEM mode shapes in Test 2.
At these higher orders, the updated FEM model also produced results that aligned more closely with the experimental data compared to Test 1. The third mode showed excellent agreement, with nearly identical deformation features and minimal frequency differences. The fourth mode, although still affected by sensor spacing and boundary sensitivity, showed significantly reduced discrepancies and provided a reliable representation of the beam’s dynamic behaviour.
The comparison of the first four mode shapes illustrated that the updated FEM model achieved a much closer match with the experimental results than in Test 1. The first two modes demonstrated consistent bending patterns and reduced frequency differences. In contrast, the higher modes confirmed that recalibrated properties and improved boundary modelling significantly enhanced the accuracy of the simulation. Although some sensitivity to sensor spacing remained in the fourth mode, the overall correlation was clearly improved.
To complement the qualitative agreement on mode shapes, a quantitative comparison of natural frequencies was conducted. The natural frequencies from the updated FEM model and the second experimental campaign are summarised for the first four modes, as shown in Table 4, which provides a direct comparison between numerical predictions and measured data.
The updated FEM methodology produces more accurate predictions for natural frequencies than the initial model. The first simulation of the FEM model produced significant errors between numerical data and experimental results across higher frequency modes. In Test 1, the first mode diverged by about 5%, while the second and third modes showed errors of just over 7%. The fourth mode differed by about 6%. These discrepancies arose because the initial FEM assumed ideal material properties and boundary conditions, which did not represent the real behaviour of the tested beam. To improve model accuracy in Test 2, Poisson’s ratio was recalibrated, and a roller support was introduced at the free end to represent the actual boundary conditions better. These changes reduced the frequency differences to about 3% in the first mode and below 4% for the other three modes, showing a clear improvement compared to Test 1. The results demonstrate that realistic boundary conditions and calibrated mechanical properties significantly reduced simulation errors, especially in the higher modes where accuracy is most sensitive.
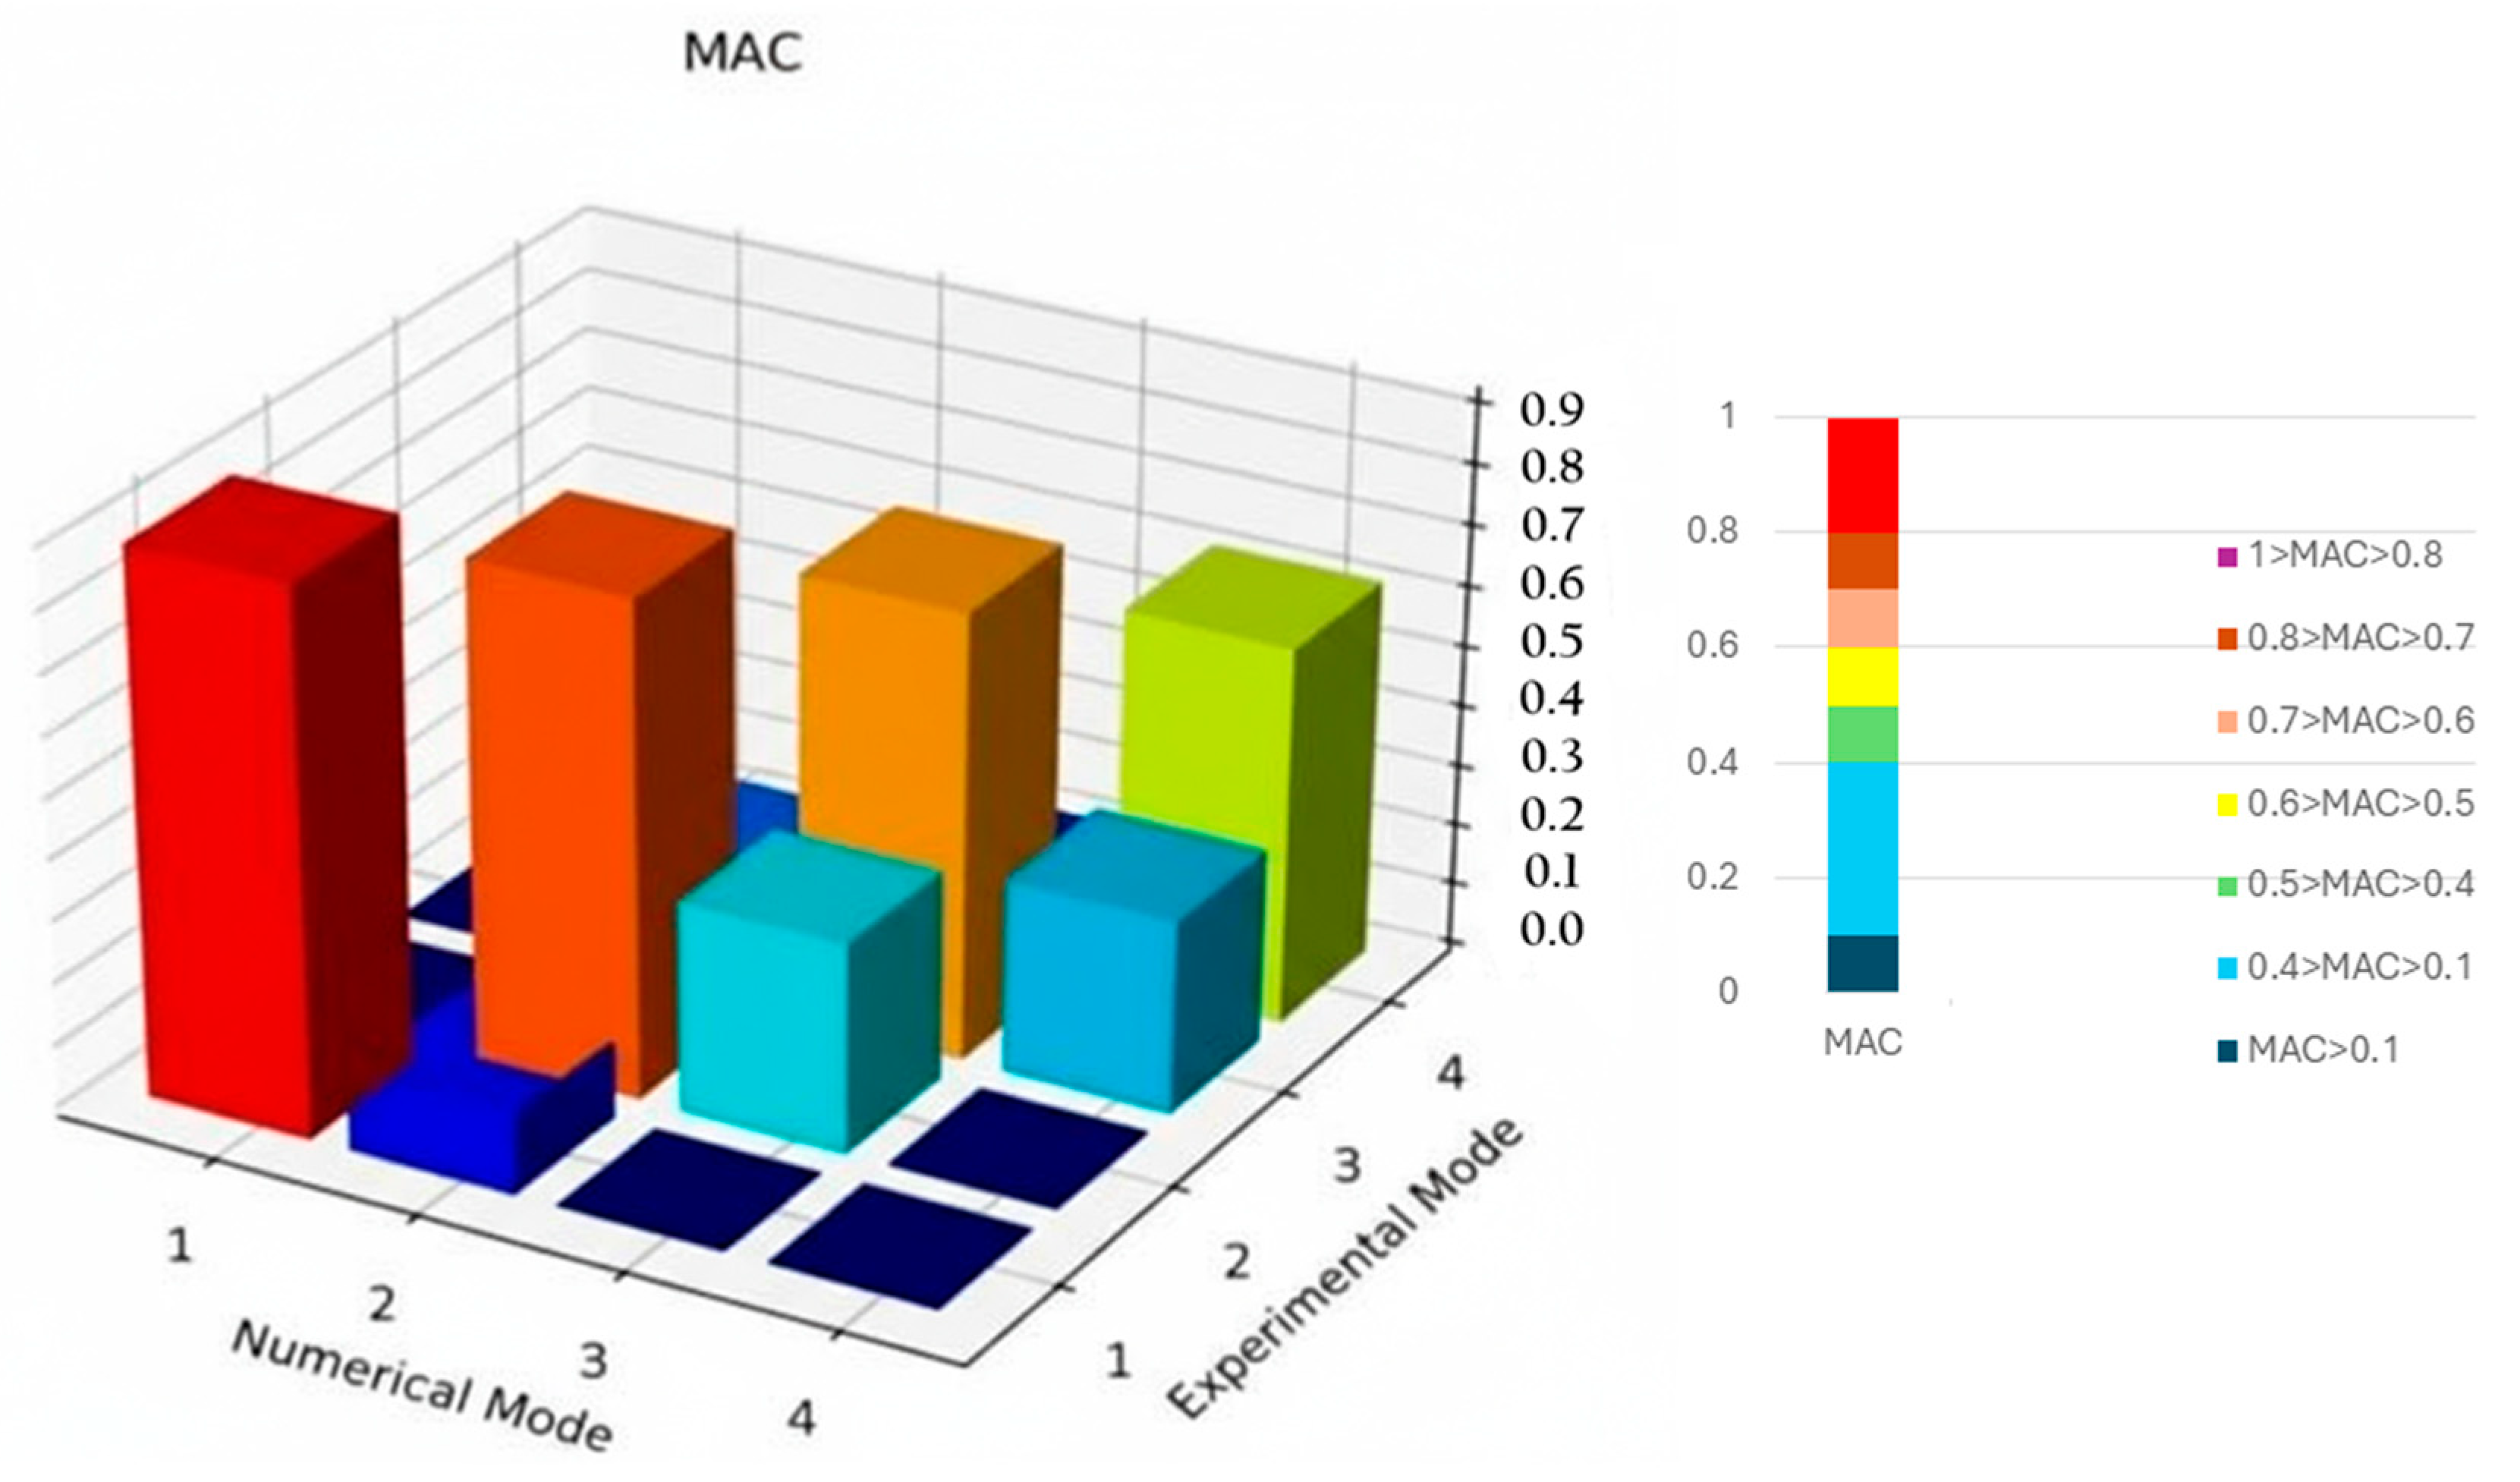
Overall, these updates improved the correlation of numerical predictions with experimental outcomes. The updated FEM matched the dynamic response more closely in the first mode and showed progressively improved alignment in the higher modes. The second mode also showed reduced error compared with the first test, confirming the benefit of recalibrated parameters. The largest improvements were observed in the third and fourth modes, which had shown the greatest discrepancies in Test 1. improvement because they had previously displayed the most significant discrepancies. The refined frequency data provided close agreement with the experimental values from the tests, validating the improved performance of the updated FEM model. These findings confirm that FEM analysis requires realistic boundary conditions and calibrated material properties to generate reliable and accurate structural predictions. FEM. The similarity of the mode shapes in Test 2 was then quantified using the Modal Assurance Criterion, and the MAC results are presented in Figure 11.
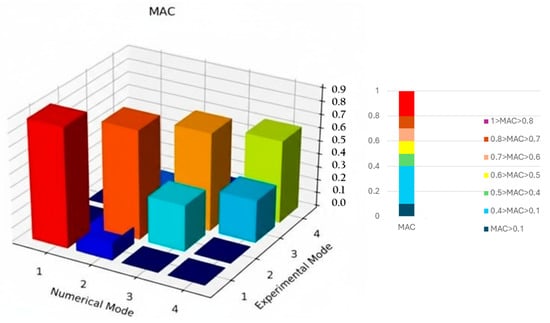
Figure 11.
MAC matrix for Test 2, Experimental mode shapes were compared with the initial FEM predictions, and the correlation values indicate the level of agreement before model updating.
The diagonal values exceeded 0.9 for the first and second modes, confirming a high level of correlation. The third mode also displayed a strong match, with values close to 0.9, while the fourth mode achieved a slightly lower but still acceptable correlation.
Off-diagonal terms remained close to zero, verifying that the identified modes are independent. Compared with Test 1, the updated FEM model provided a substantial improvement in the similarity of mode shapes across all frequencies. In summary, Test 2 demonstrated that refining the FEM material properties and introducing realistic boundary conditions significantly enhanced the accuracy of the numerical model. The updated configuration improved agreement in both frequency identification and mode shape correlation, confirming the importance of considering experimental deviations from idealised assumptions when applying FEM in structural dynamics. The results of Test 2 confirmed that updating the FEM model with realistic boundary conditions and calibrated material properties significantly improved agreement with the experimental data.
With this validated model in place, the next step was to integrate the updated modal information into a BIM environment to demonstrate how numerical and experimental results can be visualised and managed as part of a digital twin workflow. Section 4 presents this integration and outlines how the combined approach supports structural monitoring and decision-making. With the FEM model successfully updated and validated against experimental results, the study progressed to the integration stage. Section 4 introduces the digital twin implementation, where the updated modal information was connected to a BIM environment. This step demonstrates how laboratory data, numerical simulations, and monitoring outputs can be merged into a single framework to support structural assessment and decision-making in practice.
4. Digital Twin Implementation
SHM has emerged as a critical field in civil engineering, allowing for the assessment of structural integrity and performance through continuous or periodic measurement of structural responses. Knowing the natural frequencies of a structure is particularly significant, as it allows the identification of events in which vibrations occur in close frequencies, enabling managers to take actions aiming to avoid situations of resonance that would cause the structure to be damaged or collapse. It is therefore essential to pursue that the information collected is made available in useful manners to help decision-making towards the preservation of the monitored structures.
This section of the study aims to facilitate the transmission of SHM information by developing a system that integrates vibration data acquisition with a BIM framework, taking as an example the first test and incorporating the previously identified modal frequencies. The proposed system considered the following components: [1] real-time monitoring of structural vibrations via wireless sensor networks, [2] automated data storage in a centralised database, [3] direct visualisation of vibration data within the BIM environment, [4] automated assessment based on predefined threshold values, and [5] visual alerts for potential structural issues. This integrated approach enhances the efficiency and effectiveness of SHM practices aiming for the use as a DT, ultimately contributing to improved safety and maintenance strategies for built infrastructure.
Ref. [26] Performed similar study in which the authors used visual programming integrated with Revit, namely the add-in Dynamo, allied to an external package named Slingshot to enable communication to the database, update the data related to the elements and override the graphic properties according to established thresholds. Nevertheless, in recent Revit software versions the external package ceased working. The present study leverages different programming tools to achieve its objectives.
The development of the integrated system proceeded in several stages. Firstly, the vibration acquisition setup was designed and implemented, focusing on capturing real-time data from the steel cantilever beam. Next, a database in MySQL was developed to store and manage the collected vibration data. The BIM model was then created in Revit, with shared parameters carefully configured to enable seamless data association. Subsequently, a Python script for pyRevit was developed to automate the process of fetching data from the database and integrating it into the BIM model. This script also applied graphical overrides to indicate whether the structural element’s vibrations were within the acceptable thresholds based on its natural frequencies.
4.1. System Architecture
The proposed system consists of three main components: Data acquisition system (hardware), Database management system (server), and BIM integration module (client application). Figure 12 illustrates the overall system architecture and data flow.

Figure 12.
Overall System Architecture.
4.1.1. Data Acquisition System
The data acquisition system utilises an ESP32 microcontroller as the primary processing unit, selected for its wireless capabilities, computational efficiency, and energy management characteristics. The monitoring setup incorporates specialised components, including the ESP32-WROOM-32 module, PCB Piezotronics Model 353B03 accelerometers, signal conditioning circuits, and integrated power management modules.
The PCB Piezotronics Model 353B03 accelerometers are high-sensitivity, low-noise sensors specifically designed for structural vibration measurements. These piezoelectric accelerometers offer a sensitivity of 10 mV/g, a frequency range of 1 to 7000 Hz, and a measurement range of ±500 g, making them ideal for capturing subtle vibrations in steel structures.
The ESP32 microcontroller was configured to perform a preliminary processing of the information before transmitting the vibration data to the database server. By implementing Fast Fourier Transform (FFT) techniques through Arduino programming, the system transforms raw acceleration data collected at 1000 Hz into concise modal frequency information. The entire pre-processing of information involves capturing a fixed number of samples, converting time-domain signals to frequency-domain representations, and identifying peak frequencies within predefined ranges corresponding to the structure’s natural modes. This pre-processing significantly reduces data transmission requirements, as the microcontroller extracts and transmits only four key frequency values instead of hundreds of raw data points.
4.1.2. Database Management System
The system employs a MySQL database to store and manage vibration data. The primary database architecture includes three essential tables that work in conjunction to provide an adequate data management solution. The main table serves as the central repository for vibration frequency measurements, storing critical information about the monitored structural element. This table captures the unique identifier corresponding to the Revit element, the four modal frequencies extracted from vibration analysis, and the precise timestamp of each measurement. Additionally, another table maintains metadata about the monitored structural components, while a third one records critical system events, operational parameters, and diagnostic information.
The database server configuration has been designed to ensure reliable and secure operation. Implemented with MySQL Server 8.0, the system incorporates an automated backup mechanism to prevent data loss. Redundant storage solutions provide an additional layer of data protection, while API endpoints facilitate the retrieval and insertion of data.
4.1.3. BIM Integration Module
The main objectives of the BIM integration module include establishing a connection between the vibration monitoring database and the Revit platform, creating mechanisms for data retrieval and processing, and developing visual representation strategies that communicate the designated scenario regarding the health status of the selected structural element. This module leverages the pyRevit extension, which allows for customisation and integration of Python scripting capabilities within the Revit API. The versions used in this work were pyRevit v5.1.0 and Python 3.13 (CPython)
To facilitate data tracking and visualisation, custom shared parameters are explicitly defined for structural elements. These parameters include dedicated fields for storing the four modal frequencies (f1, f2, f3, f4) and a timestamp indicating the date and time relative to data update.
The integration module implements algorithms for assessing and visualising structural health status. These algorithms compare measured frequencies against predetermined baseline values, applying a colour-coded classification system that provides immediate visual feedback. The colour coding ranges from green (indicating normal structural conditions) to yellow (signalling potential concerns) and red (highlighting critical situations requiring immediate evaluation).
The pyRevit extension for the vibration monitoring system was developed using Python, specifically leveraging Python 3.13 and its integration capabilities with the Revit API. The development process utilised the standard Python libraries and the Revit API references to create a comprehensive solution for structural health monitoring visualisation.
The extension’s architecture relies on several important libraries, including mysql.connector for database connectivity, the Revit API accessed through the clr (Common Language Runtime) module, and Python’s standard decimal and datetime modules for precise numerical and temporal data handling. The clr.AddReference method enables direct interaction with the Revit API, allowing the script to access and modify Revit document elements. This approach allows the script to import necessary Revit API references and other required libraries, creating a bridge between the standard Python environment and Revit’s .NET-based API.
The pyRevit extension follows a structured sequence of operations once the proper libraries and modules have been imported. The workflow starts by retrieving selected elements from the Revit user interface using uidoc.Selection.GetElementIds(). This method captures the unique identifiers of structural components targeted for analysis. Then, for each selected element, the system queries the MySQL database using get_frequency_data_from_db(). This function retrieves frequency measurements associated with the specific element’s ID from the last 24 h of the latest entry. The analysis phase compares retrieved frequency data against standard frequencies. An algorithm identifies the worst-case scenario by calculating deviations in the four modal frequencies (f1, f2, f3, f4). Visual representation is implemented through the set_graphical_override() function, which translates analytical findings into the predefined colour-coded system based on specific thresholds. Lastly, a Revit transaction updates the shared parameters for the selected elements and applies the colour override based on the performed analysis. Considering the worst-case scenario entry, each of the four frequency parameters are updated, as well as the timestamp parameter according to that measurement.
Error handling was considered to manage potential issues during database connection, data retrieval, or Revit element modification. The workflow uses try-except blocks to ensure system resilience, preserve document integrity and simplify debugging processes.
The definition of concern levels was based on proximity to the natural frequency, with a 10% threshold for potential concerns and 5% for critical concerns. At the potential concern level, frequencies fall within a range that calls for close monitoring but does not necessarily require immediate intervention. In contrast, frequencies reaching the critical concern threshold indicate an imminent risk of resonance, where even minor deviations can significantly amplify vibrational amplitude. This poses a threat to structural stability, demanding prompt corrective action.
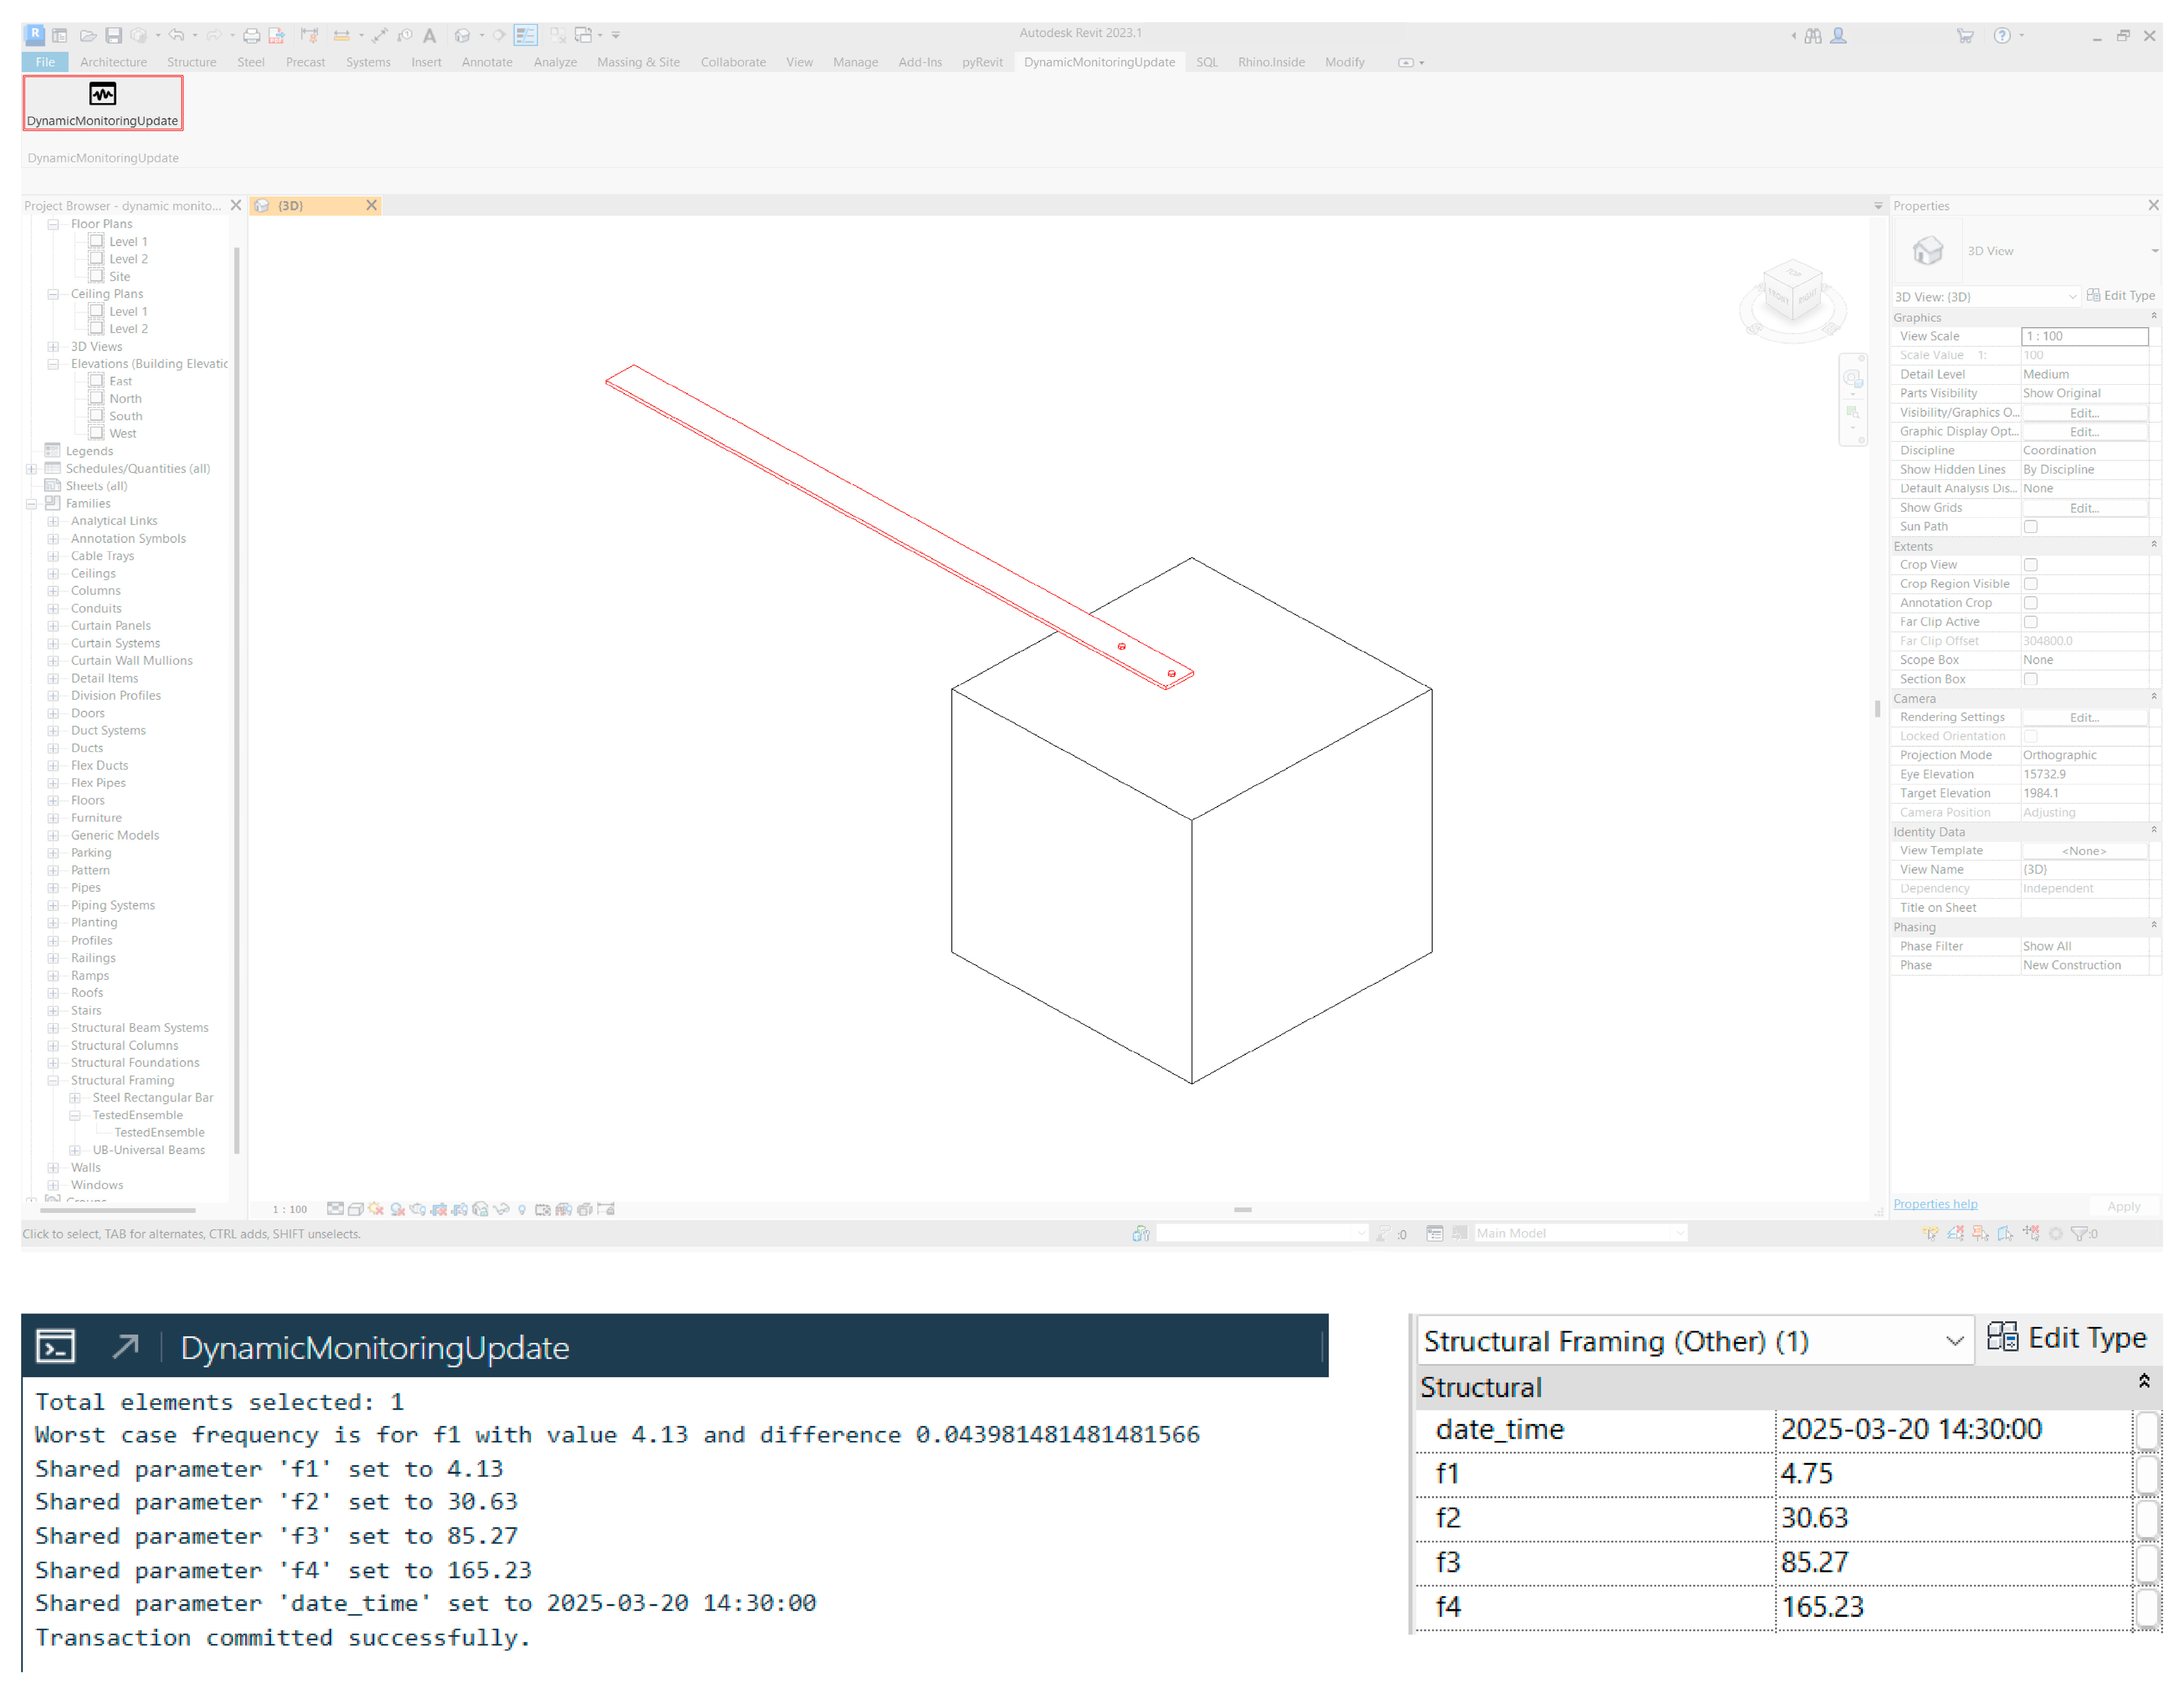
The extension ran successfully in Revit environment as shown in Figure 13, which showcases the updated parameters and their respective values, as well as the graphically overridden element.
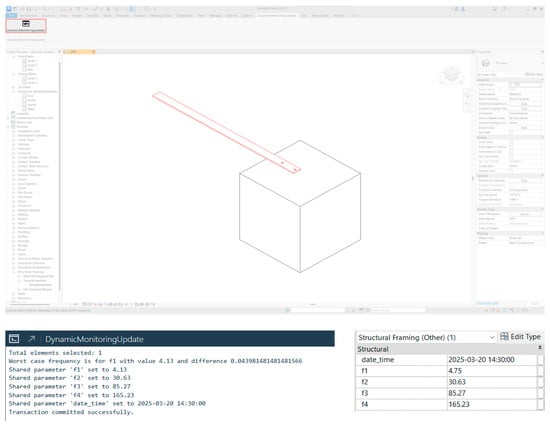
Figure 13.
(Top, red box) Button that runs the Python code in the Revit environment. (Centre) Graphically updated element. (Bottom left) A dialogue box is displayed after the tool has finished running. (Bottom right) Properties of the updated element after running the tool.
5. Discussion
The results of this study confirm the critical influence of boundary conditions in finite element model (FEM) validation. Two experimental tests with different support configurations showed that structural strongly affect modal parameters, with simplified assumptions leading to apparent deviations from the measured results. The Modal Assurance Criterion (MAC) proved effective in evaluating the correspondence between experimental and numerical mode shapes. In Test 1, deviations of 5–7% in the first three modes and about 6% in the fourth mode were observed. In comparison, in Test 2 the updated FEM reduced errors to below 4%, confirming that boundary conditions and calibrated material properties remain highly sensitive factors in modal analysis.
The comparison between experimental outcomes and FEM simulations improved understanding of structural behaviour but also emphasised the necessity of systematic calibration. By incorporating realistic boundary conditions and recalibrated material properties, the updated FEM provided greater accuracy and reliability. Structural health monitoring (SHM) benefits from such model improvements, since consistent identification of modal properties supports both damage detection and long-term performance evaluation.
In parallel, this study integration of SHM data with a Building Information Modelling (BIM) demonstrate to create a digital twin (DT) workflow. The workflow enabled vibration monitoring results to be visualised in the BIM environment through colour-coded alerts, bridging the gap between data acquisition and practical decision-making. Although promising, this still showed limitations, such as restricted virtual-to-physical interaction and continued reliance on human interpretation for corrective measures. These findings indicate the need for further development of tools that enable closer alignment between real-time monitoring, BIM environments and automated decision-support systems.
6. Conclusions
This study demonstrated that finite element model FEM updating is an effective approach for improving the accuracy of modal identification in steel cantilever beams. Experimental testing combined with numerical modelling confirmed that boundary conditions and material properties play a decisive role in achieving reliable simulation results. The updated FEM achieved closer agreement with measured frequencies and mode shapes, educing discrepancies to below 4% in Test 2 and validating the procedure as a practical tool for structural assessment.
The Modal Assurance Criterion (MAC) further confirmed strong correlation in the first three modes, highlighting the value of systematic calibration for both low- and higher-order responses. The integration of structural health monitoring (SHM) results into a Building Information Modelling (BIM) framework provided a foundation for digital twin development. The proposed workflow demonstrated how experimental and numerical results can be stored, visualised, and interpreted within a BIM environment, offering colour-coded feedback to support maintenance planning and risk evaluation.
Although the workflow showed promising results, limitations were identified, including restricted physical-to-virtual interaction and reliance on manual interpretation. Addressing these issues will require further development of automated links between real-time monitoring, BIM platforms, and decision-support systems. Future work may include expanding the set of monitored parameters, implementing web-based dashboards for wider accessibility, and incorporating machine learning techniques for anomaly detection and predictive maintenance. Overall, this research addresses the reviewers’ concerns by clarifying the relationship between FEM updating, SHM, and BIM integration, demonstrating a comprehensive workflow from laboratory testing to digital twin visualisation, and highlighting its contribution to advancing structural health monitoring and decision-making.
Author Contributions
Conceptualization, M.A.O., F.R. and H.R.; methodology, M.A.O., F.R. and H.R.; software, M.A.O. and G.S.; validation, M.A.O., F.R. and H.R.; formal analysis, M.A.O.; investigation, M.A.O., F.R. and H.R.; resources, F.R. and H.R.; data curation, M.A.O.; writing: original draft preparation, M.A.O. and G.S.; writing: review and editing, F.R. and H.R.; visualization, M.A.O. and G.S.; supervision, F.R. and H.R.; project administration, F.R. and H.R. All authors have read and agreed to the published version of the manuscript.
Funding
This work was funded by the Foundation for Science and Technology (FCT) under the PhD grant 2022.12719.BD was awarded to Mohammad Amin Oyarhossein, and under the PhD grant, UI/BD/154571/2022 was awarded to Gabriel Sugiyama. The work was also supported by the Foundation for Science and Technology (FCT)—Aveiro Research Centre for Risks and Sustainability in Construction (RISCO), Universidade de Aveiro, Portugal [FCT/UIDB/ECI/04450/2020].
Data Availability Statement
The raw data supporting the conclusions of this article will be made available by the authors on request.
Conflicts of Interest
The authors declare no conflict of interest.
Nomenclature
| BIM | Building Information Modelling |
| CMAC | Cross-Modal Assurance Criterion |
| DT | Digital Twin |
| FEM | Finite Element Model |
| FDD | Frequency Domain Decomposition |
| MAC | Modal Assurance Criterion |
| SHM | Structural Health Monitoring |
References
- Antunes, P.F.d.C.; Lima, H.F.T.; Alberto, N.J.; Rodrigues, H.; Pinto, P.M.F.; Pinto, J.d.L.; Nogueira, R.N.; Varum, H.; Costa, A.G.; Andre, P.S.d.B. Optical Fiber Accelerometer System for Structural Dynamic Monitoring. IEEE Sens. J. 2009, 9, 1347–1354. [Google Scholar] [CrossRef]
- Baghiee, N.; Reza Esfahani, M.; Moslem, K. Studies on damage and FRP strengthening of reinforced concrete beams by vibration monitoring. Eng. Struct. 2009, 31, 875–893. [Google Scholar] [CrossRef]
- Bourgeois, I.; Gregorio, L.T.; Di Rodrigues, H.; Fonseca, J.; Tavares, A.; Costa, A. Application of Sonic Tests and Modal Identification in the Characterization of Masonry Walls. Appl. Sci. 2023, 13, 3762. [Google Scholar] [CrossRef]
- Chen, H.; Kurt, M.; Lee, Y.S.; McFarland, D.M.; Bergman, L.A.; Vakakis, A.F. Experimental system identification of the dynamics of a vibro-impact beam with a view towards structural health monitoring and damage detection. Mech. Syst. Signal Process. 2014, 46, 91–113. [Google Scholar] [CrossRef]
- Colombi, P.; Fava, G. Experimental study on the fatigue behaviour of cracked steel beams repaired with CFRP plates. Eng. Fract. Mech. 2015, 145, 128–142. [Google Scholar] [CrossRef]
- Corbally, R.; Malekjafarian, A. A data-driven approach for drive-by damage detection in bridges considering the influence of temperature change. Eng. Struct. 2022, 253, 113783. [Google Scholar] [CrossRef]
- Crognale, M.; Potenza, F.; Gattulli, V. Fatigue Damage Identification by a Global-Local Integrated Procedure for Truss-Like Steel Bridges. Struct. Control Health Monit. 2023. [Google Scholar] [CrossRef]
- Duvnjak, I.; Damjanović, D.; Bartolac, M.; Skender, A. Mode shape-based damage detection method (Msdi): Experimental validation. Appl. Sci. 2021, 11, 4589. [Google Scholar] [CrossRef]
- Grieves, M. Digital twin: Manufacturing excellence through virtual factory replication. White Pap. 2014, 1, 1–7. Available online: https://www.3ds.com/fileadmin/PRODUCTS-SERVICES/DELMIA/PDF/Whitepaper/DELMIA-APRISO-Digital-Twin-Whitepaper.pdf (accessed on 20 October 2025).
- Jones, D.; Snider, C.; Nassehi, A.; Yon, J.; Hicks, B. Characterising the Digital Twin: A systematic literature review. CIRP J. Manuf. Sci. Technol. 2020, 29, 36–52. [Google Scholar] [CrossRef]
- Lele, S.P.; Maiti, S.K. Modelling of Transverse Vibration of Short Beams for Crack Detection and Measurement of Crack Extension. J. Sound Vib. 2002, 257, 559–583. [Google Scholar] [CrossRef]
- Li, H.; Ou, J. Structural Health Monitoring: From Sensing Technology Stepping to Health Diagnosis. Procedia Eng. 2011, 14, 753–760. [Google Scholar] [CrossRef]
- Liu, S.; Zhang, L.; Chen, Z.; Zhou, J.; Zhu, C. Mode-specific damage identification method for reinforced concrete beams: Concept, theory and experiments. Constr. Build. Mater. 2016, 124, 1090–1099. [Google Scholar] [CrossRef]
- Niccolucci, F.; Markhoff, B.; Theodoridou, M.; Felicetti, A.; Hermon, S. The Heritage Digital Twin: A bicycle made for two. The integration of digital methodologies into cultural heritage research. Open Res. Eur. 2023, 3, 64. [Google Scholar] [CrossRef]
- Oyarhossein, Building Health Monitoring of Hospital Facilities Supported by Digital Twins Models. Available online: www.techniumscience.com (accessed on 3 September 2025).
- Pastor, M.; Binda, M.; Harčarik, T. Modal assurance criterion. Procedia Eng. 2012, 48, 543–548. [Google Scholar] [CrossRef]
- Peng, Z.; Li, J.; Hao, H. Development and experimental verification of an IoT sensing system for drive-by bridge health monitoring. Eng. Struct. 2023, 293, 116705. [Google Scholar] [CrossRef]
- Rodrigues, H.; Duvnjak, I. Advanced Structural Health Monitoring From Theory to Applications. Available online: www.mdpi.com/journal/applsci (accessed on 3 September 2025).
- Scianna, A.; Gaglio, G.F.; La Guardia, M. Structure Monitoring with BIM and IoT: The Case Study of a Bridge Beam Model. ISPRS Int. J. Geo-Inf. 2022, 11, 173. [Google Scholar] [CrossRef]
- Shafiei, M.; Khaji, N. Analytical solutions for free and forced vibrations of a multiple cracked Timoshenko beam subject to a concentrated moving load. Acta Mech. 2011, 221, 79–97. [Google Scholar] [CrossRef]
- Sohn, H.; Farrar, C.R.; Hemez, F.M.; Shunk, D.D.; Stinemates, S.W.; Nadler, B.R.; Czarnecki, J.J. A Review of Structural Health Monitoring Literature Form 1996–2001; Los Alamos National Laboratory: Los Alamos, NM, USA, 2004.
- Tondreau, G.; Deraemaeker, A. Automated data-based damage localization under ambient vibration using local modal filters and dynamic strain measurements: Experimental applications. J. Sound Vib. 2014, 333, 7364–7385. [Google Scholar] [CrossRef][Green Version]
- VanDerHorn, E.; Mahadevan, S. Digital Twin: Generalization, characterization and implementation. Decis. Support Syst. 2021, 145, 113524. [Google Scholar] [CrossRef]
- Dorn, C.; Yang, Y. Automated modal identification by quantification of high-spatial-resolution response measurements. Mech. Syst. Signal Process. 2023, 186, 109816. [Google Scholar] [CrossRef] [PubMed]
- Zanarini, A. On the role of spatial resolution in advanced vibration measurements for operational modal analysis and model updating. In Proceedings of the ISMA2014-International Conference on Noise and Vibration Engineering, Leuven, Belgium, 15–17 September 2014; KU Leuven: Leuven, Belgium, 2014; pp. 678–692. [Google Scholar]
- Whalen, T.M. The behavior of higher order mode shape derivatives in damaged, beam-like structures. J. Sound Vib. 2008, 309, 426–464. [Google Scholar] [CrossRef]
Disclaimer/Publisher’s Note: The statements, opinions and data contained in all publications are solely those of the individual author(s) and contributor(s) and not of MDPI and/or the editor(s). MDPI and/or the editor(s) disclaim responsibility for any injury to people or property resulting from any ideas, methods, instructions or products referred to in the content. |
© 2025 by the authors. Licensee MDPI, Basel, Switzerland. This article is an open access article distributed under the terms and conditions of the Creative Commons Attribution (CC BY) license (https://creativecommons.org/licenses/by/4.0/).

