1. Introduction
With the rapid expansion of urban rail transit systems, subway stations—characterized by large construction scales, complex processes, and high material and energy consumption—have become major contributors to carbon emissions in infrastructure projects [
1,
2]. The realization of the “dual-carbon” goals (carbon peaking and carbon neutrality) in the transportation sector urgently requires systematic assessment and optimization of the carbon footprint during subway station construction [
3,
4]. Therefore, establishing a comprehensive and scientific low-carbon evaluation framework for subway station construction is of both theoretical and practical significance.
In recent years, extensive research has been conducted on carbon emissions in the engineering construction sector, yielding significant achievements in carbon accounting system development, prediction technology innovation, carbon-reduction strategy optimization, and the refinement of evaluation methods [
5,
6,
7,
8,
9]. These advances provide solid theoretical foundations and practical references for promoting low-carbon development across the industry.
As the basis of low-carbon research, carbon emission accounting has developed into a methodological system that covers all stages of the life cycle and accommodates multiple engineering types. In the field of building engineering, Xu Aiyan et al. [
10] established a P-GPS-LCA model based on LCA theory to systematically quantify the carbon emissions of eight types of prefabricated components and prefabricated buildings, showing that the production stage accounts for 96.42% of total emissions, with steel and cement being the major contributors. Zhao Yu et al. [
11] proposed an innovative carbon–emergy factor (Em-CEF) model, integrating emergy analysis with carbon emission factors to compare the materialization-stage emissions of green, prefabricated, and traditional buildings, offering a new perspective for assessing building sustainability. In transportation and municipal engineering, Chen Kunyang et al. [
12] quantified carbon emission intensity during Shenzhen metro operation, identifying key metrics such as per-kilometer and per-capita emissions. Focusing on metro tunnel projects, Guo Yalin et al. [
13] decomposed emissions into upstream material production, transportation, and onsite construction, demonstrating that the first two stages contribute over 95% of total emissions. Carbon accounting methods for special structures and specific construction processes have also been continuously developed. For example, Xu Xian et al. [
14] proposed a rapid carbon emission estimation formula for spatial grid structures based on material quantities; Zhang Yichen et al. [
15] developed a logistics-stage carbon model for prefabricated buildings, highlighting the critical role of vehicle load ratio in emission reduction; and Li Yiqian et al. [
16] established a full life-cycle carbon emission model for steel–concrete composite bridges that integrates both static and dynamic dimensions.
The accuracy of carbon emission prediction models directly determines the scientific validity of emission-reduction decision-making. Current studies have significantly enhanced prediction capabilities through multidisciplinary approaches. At the macro and regional levels, Li Xiaojuan et al. [
17] combined the GDIM model with scenario simulations to forecast the peak value and timing of carbon emissions in Fujian Province’s construction sector. Xiong Siqin et al. [
18] integrated a bottom-up model with Monte Carlo simulations to evaluate the likelihood of China achieving its road-traffic carbon-peaking target. Dynamic prediction and algorithm optimization have become research focal points: Su Xing et al. [
19] developed a dynamic LCA model using grey prediction and scenario analysis to predict time-varying parameters of building carbon emissions; Luo Lu et al. [
20] built a machine-learning-based method for estimating embodied carbon during scheme design, achieving a minimum mean absolute percentage error of 2.5%; and Tang Jianxin et al. [
21] proposed an improved LASSO-SSA-LSTM model that accurately captures fluctuations and trends in China’s transportation carbon emissions. Additionally, Zhang Dongyi et al. [
22] constructed an urban carbon emission forecasting model to quantify the potential of active versus passive mitigation strategies, while Zheng Lintao et al. [
23] integrated residential energy-use behavior into an operational carbon prediction model with only 4% deviation, providing early-stage support for engineering design.
Research on carbon-reduction measures has formed a coordinated development pattern encompassing technological innovation, structural optimization, and management enhancement. In material and technological innovation, Habib Ullah et al. [
24] showed that combining BIM technology with the reuse of prefabricated components can significantly reduce emissions; Li Sheng et al. [
25] found that coarse-aggregate UHPC can reduce emissions by 20% while balancing cost and sustainability; and Elkhayat Youssef et al. [
26] demonstrated that material substitution strategies can reduce early-stage building emissions by 21–23.8%, meeting regional climate objectives. Structural and construction optimization has also shown remarkable results: Qi Yinchuan et al. [
27] reported a 27.52% emission reduction by optimizing foundation-pit support systems. Chen Kunyang et al. [
28] found that a fully prefabricated metro station structure emits 6.55% less than a traditional cast-in-place design; and Hao Jianli et al. [
29] indicated that increasing the recycling rate of inert construction waste to 90% delivers significant carbon-reduction benefits. From a policy and management perspective, Du Qiang et al. [
30] confirmed that low-carbon design capability and corporate awareness are critical drivers of emission reduction. Wu Peng et al. [
31] identified material production and building operation as the primary emission sources, supporting staged mitigation policies; and Ma Yingqiang et al. [
32] demonstrated that sponge-city construction can reduce emissions by 47.31%, offering a paradigm for low-carbon municipal engineering.
Existing studies have established multi-dimensional and multi-level evaluation systems that validate the scientific soundness of calculation methods, prediction models, and carbon-reduction strategies. In methodology evaluation, Lu Yujie et al. [
33] developed a carbon-management ontology that was expert-validated and shown to excel in clarity and coverage, enabling real-time carbon management on construction sites. Mei Yuan et al. [
34] proposed a feed-forward neural network-based construction-stage carbon prediction model, which demonstrated high accuracy through engineering application and emphasized the importance of multi-source data integration. In assessing mitigation effectiveness, Chen Yuan et al. [
35] combined the entropy–TOPSIS and K-means methods to classify foundation construction carbon performance into four levels; Heydari Mohammad Hossein et al. [
36] developed an evaluation framework integrating carbon and economic benefits, achieving an average 24.92% emission reduction in case studies; and Zhang Donglin et al. [
37] introduced a comprehensive emission-reduction efficiency index that incorporates both emission reductions and embodied-carbon payback periods. Cross-scenario and cross-regional assessments further reveal differentiated characteristics. Pu Jing et al. [
38] found that Type I/II Chinese cities contribute over 85% of total urban rail emissions but exhibit lower carbon intensity. Wei Lingxiang et al. [
39] systematically evaluated metro systems’ contributions to low-carbon urban development; and Elkhayat Youssef et al. [
26] confirmed the regional applicability of material substitution strategies, providing references for location-specific mitigation practices.
Overall, the above literature indicates that existing research has achieved substantial progress in carbon accounting, prediction, and emission-reduction strategies for engineering construction, forming a multi-scenario, multi-method integrated research system. However, challenges remain, such as insufficient standardization of cross-regional data, difficulty in accurately predicting emissions under multi-factor coupling, and limited applicability of carbon-reduction strategies across engineering types. In particular, for complex municipal projects such as metro stations, current low-carbon performance evaluation frameworks often lack causal logic, objective quantification, and practical adaptability [
34,
40,
41]. This study makes three distinct contributions. First, it systematically applies the PSR framework to the low-carbon performance evaluation of subway station construction, developing a causal-structure-based indicator system. Second, it establishes a subway-station-specific indicator set comprising 17 metrics tailored to different construction methods. Third, it integrates obstacle-degree diagnosis with entropy-weighted TOPSIS, enabling not only ranking but also identification of key constraining factors for each scheme. This study focuses exclusively on the construction phase (i.e., the materialization phase) of subway stations. The operational and demolition phases are not within the scope of this research.
2. Evaluation Model for Low-Carbon Construction of Subway Stations
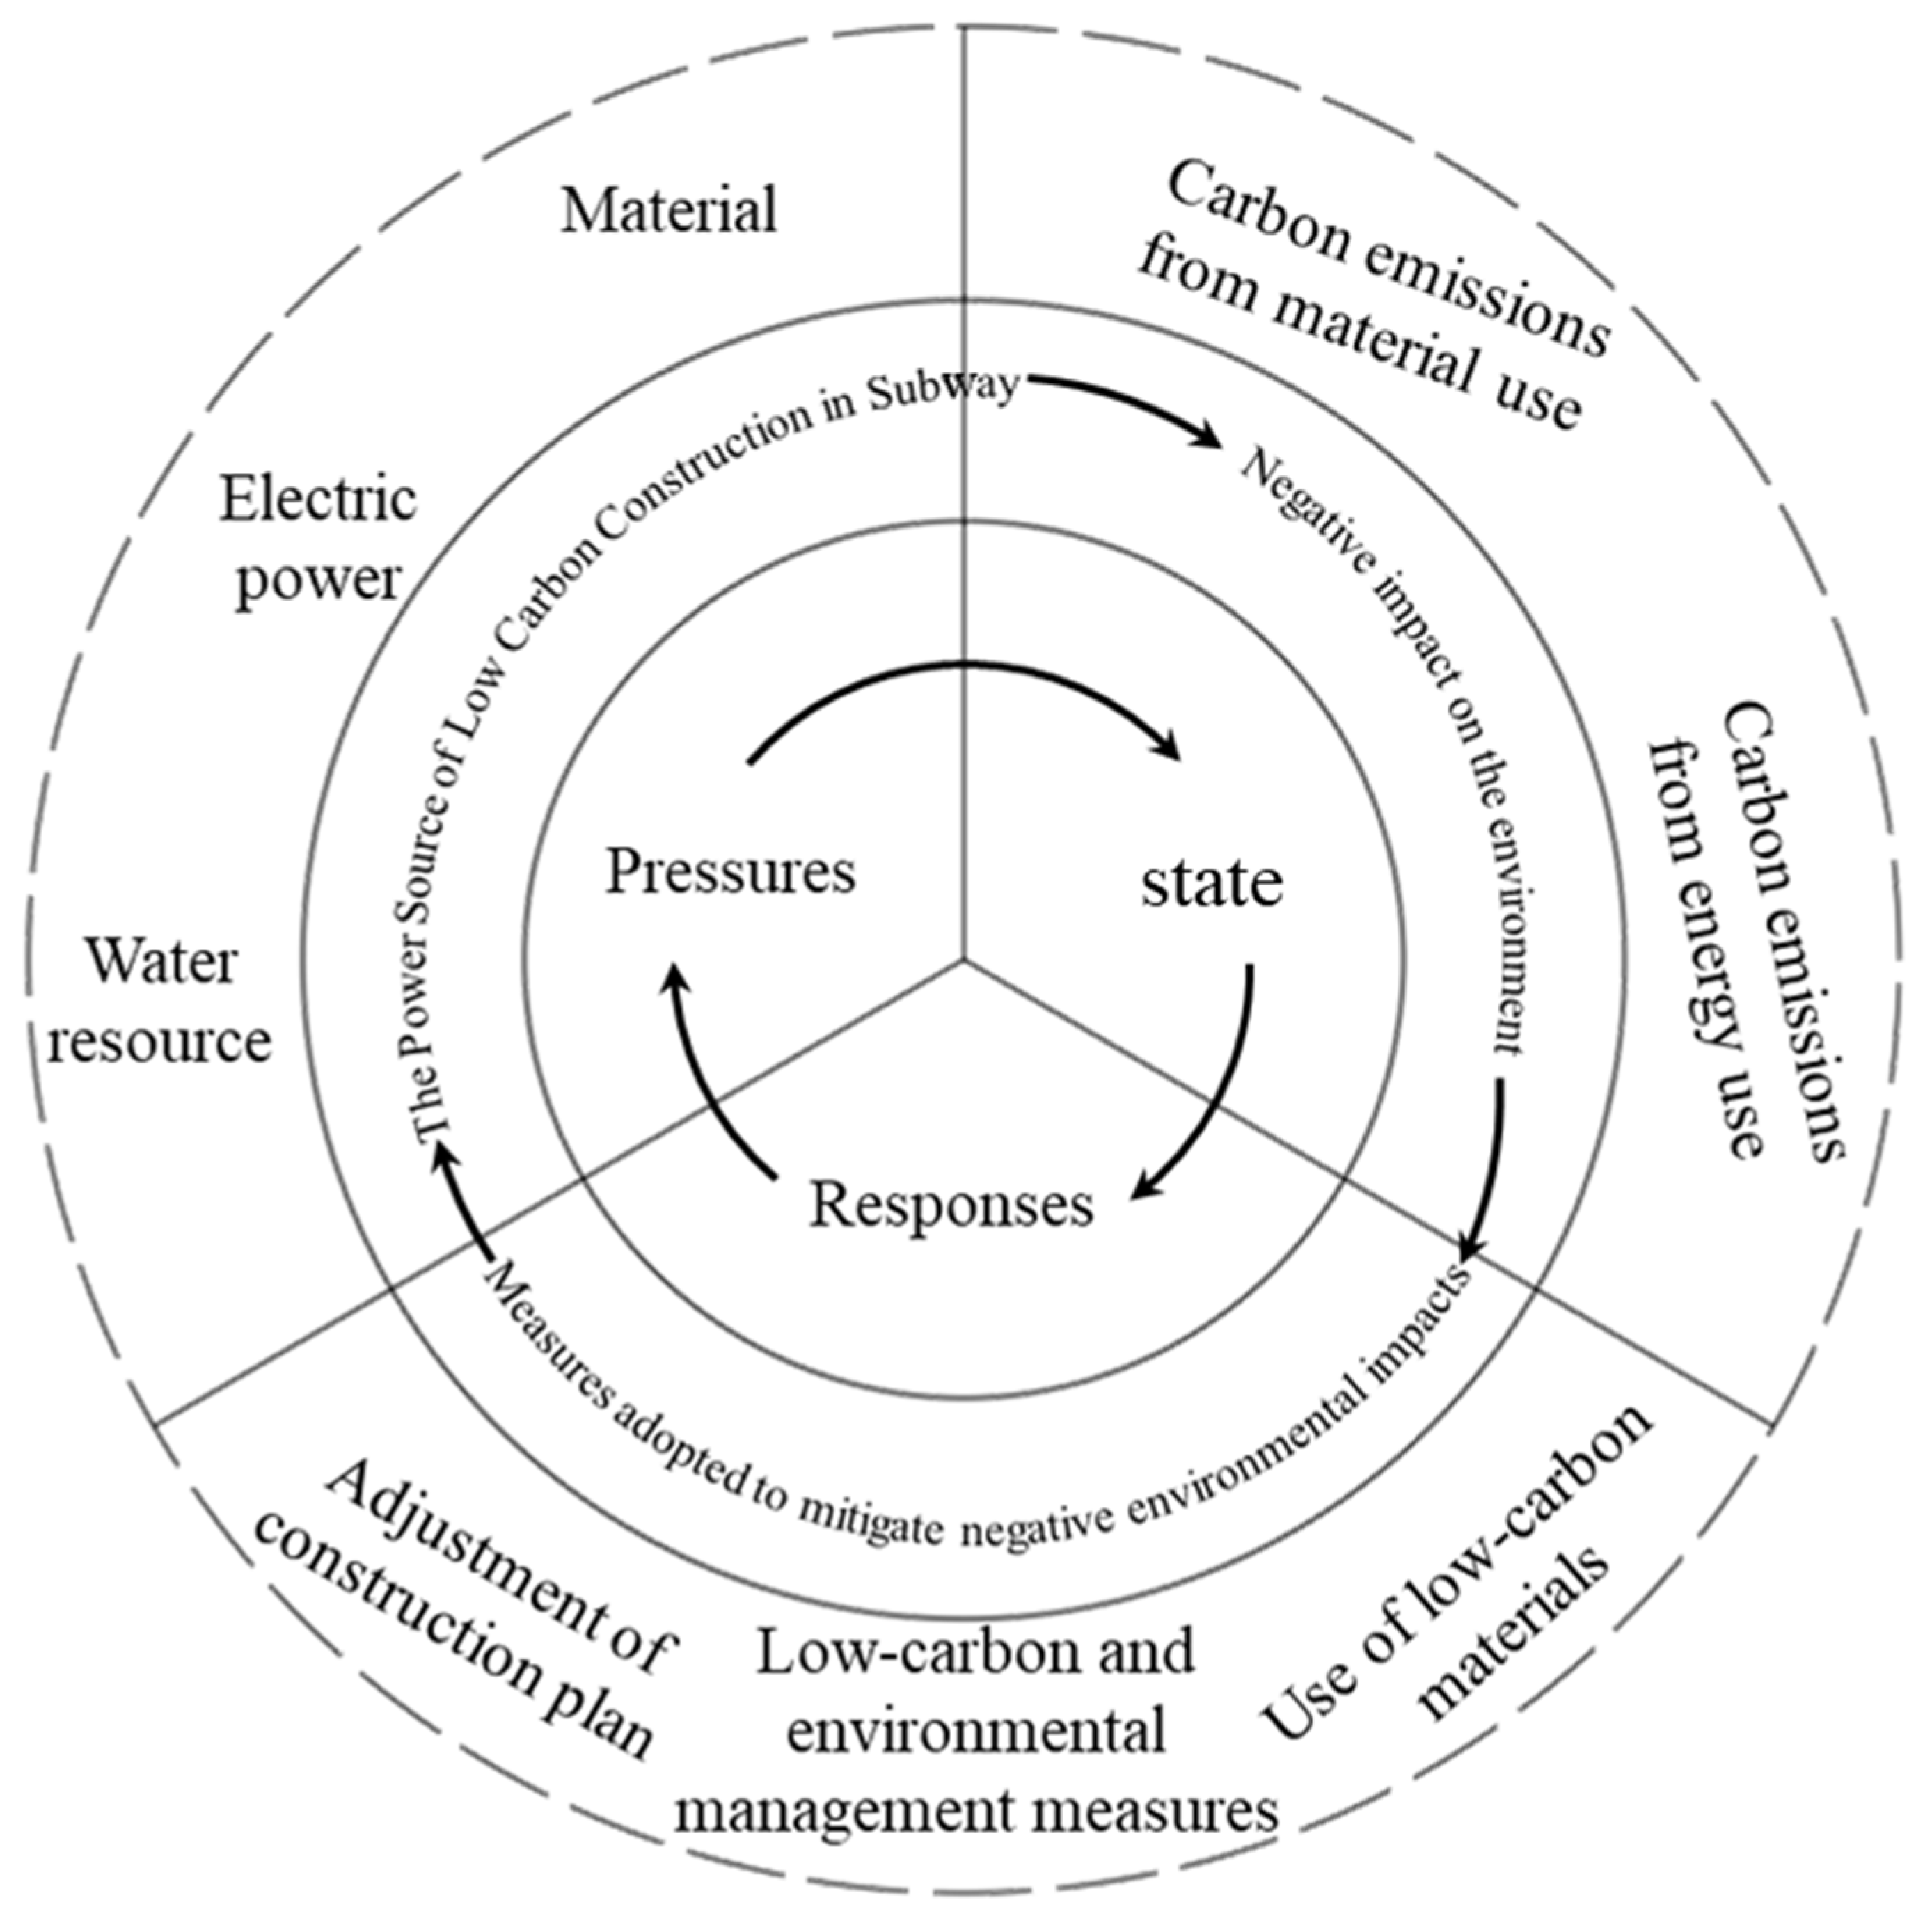
The pressure–state–response (PSR) model is based on causal relationships and involves the mutual influence and interaction between the pressure exerted by human activities on the environment, the changes in its state caused by pressure, and the response of humans to changes in environmental state as the process of formulating measures to mitigate environmental impacts. In this study, the PSR framework serves as a conceptual classification framework for logically grouping and structuring indicators, rather than a statistically validated causal inference model. According to the basic logic of the PSR model, the comprehensive evaluation index system for low-carbon construction of subway stations is mainly composed of three types of indicators: pressure, state, and response, as shown in the
Figure 1.
2.1. Principles for Selecting Evaluation Indicators
Scientific, comprehensive, and effective evaluation indicators can accurately reflect the real situation of low-carbon construction in subway stations. When selecting the pressure-, state-, and response-related indicators of the PSR model, the following principles should be followed.
- (1)
The principle of comprehensive objectivity
The evaluation indicators for low-carbon construction of subway stations should comprehensively and truthfully reflect the level of low-carbon construction of subway stations. Various evaluation indicators should not only comprehensively consider the internal and external factors of low-carbon construction of subway stations, but also accurately reflect the characteristics of subway station construction. They should be comprehensively considered from the perspective of the entire project system to reduce the influence of subjective factors on the evaluation indicators.
- (2)
Quantitative comparison principle
The selection of evaluation indicators should comprehensively consider both quantitative and qualitative indicators, and try to use quantitative indicators that can reflect the low-carbon level of subway stations. It is also necessary to consider the difficulty of collecting and processing relevant data.
- (3)
Clear hierarchy principle
The evaluation indicators should have a clear structure and clear hierarchy. There should be a small correlation between various indicators to avoid duplication or errors.
- (4)
The principle of combining motion and stillness
There is a causal logic between pressure, state, and response indicators, and there is a dynamic impact process, while evaluation indicators should not be adjusted frequently. The selection of evaluation indicators should combine dynamic and static aspects, which can reflect the dynamic changes of low-carbon construction level and ensure the relative stability of evaluation content.
2.2. Selection of Low-Carbon Construction Pressure Indicators
The pressure indicators represent the main driving factors influencing the low-carbon performance of subway station construction. These indicators primarily reflect the inputs of materials, energy, and construction complexity that exert environmental pressure during the construction process. Quantitative analysis of the carbon footprint during the materialization stage shows that pre-mixed concrete, steel, and fossil fuels contribute the largest share of emissions. In addition, factors such as electricity use, water consumption, and underground pipeline relocation play a critical role. The selection of pressure indicators is shown in
Table 1.
- (1)
Consumption strength of pre-mixed concrete in subway station construction
The consumption intensity of pre-mixed concrete is the ratio of the total consumption of pre-mixed concrete in subway stations to the building area of subway stations.
- (2)
Steel consumption intensity in subway station construction
The carbon footprint intensity of steel use is the ratio of the total amount of various types of steel used in subway station construction to the building area of the subway station.
- (3)
Fossil energy consumption intensity in subway station construction
The transportation of building materials and the use of mechanical equipment during the construction process of subway stations consume a large amount of fossil fuels such as gasoline and diesel. The energy consumption intensity can be calculated by the ratio of the total amount of various types of energy used in the construction process of subway stations to the building area of subway stations.
- (4)
Power consumption intensity during subway station construction
In addition to the use of fossil fuels, the construction of subway stations also consumes a large amount of electricity. As a clean energy source, the use of electricity can result in fewer carbon emissions than the use of fossil fuels. The intensity of electricity consumption can be calculated by the ratio of the total electricity consumption during the construction process of subway stations to the building area of subway stations.
- (5)
Water resource consumption intensity in subway station construction
The construction process of subway stations consumes a large amount of water resources and also generates a considerable amount of wastewater. The intensity of water resource consumption is the ratio of the total water consumption during the construction process of subway stations to the building area of subway stations.
- (6)
Ease of underground pipeline relocation
The ease of underground pipeline relocation reflects the complexity of adjusting the pipeline network during station construction. A higher value indicates easier relocation, which is more favorable for low-carbon construction. This indicator is quantified through standardized expert scoring on a five-level scale: very easy (0.8–1.0), relatively easy (0.6–0.8), moderate (0.4–0.6), relatively difficult (0.2–0.4), and very difficult (0–0.2).
2.3. Selection of State Indicators
State indicators measure the feedback of the environment to pressure, representing the negative impact of subway station construction on the surrounding environment. Changes in state indicators will cause changes in the low-carbon construction level of subway stations. The specific indicators selected for the state dimension of low-carbon construction are presented in
Table 2.
- (1)
Carbon emission intensity of pre-mixed concrete in subway station construction
The entire process of production, transportation, and use of pre-mixed concrete involves significant greenhouse gas emissions. According to the previous calculation, the carbon footprint of pre-mixed concrete production stage accounts for more than 30% of the carbon footprint of various building materials production stages in subway stations. The carbon footprint intensity of pre-mixed concrete is the ratio of the total carbon footprint of pre-mixed concrete in subway stations to the building area of subway stations.
- (2)
Carbon footprint intensity of steel used in subway station construction
The steel used in the construction process of subway stations includes various types of steel bars and profiles. The design service life of subway stations can reach up to 100 years. Therefore, without considering the recycling of steel bars, the carbon footprint formed by the use of a large amount of steel bars in the construction process of subway stations is also considerable, even exceeding that of concrete. The carbon footprint intensity of steel use is the ratio of the total carbon footprint formed by the use of various types of steel in the construction process of subway stations to the building area of subway stations.
- (3)
Carbon footprint intensity of fossil energy and electricity use in subway station construction
The carbon footprint during the construction phase of subway stations accounts for about 10% of the total carbon footprint during the materialization phase of subway stations. The carbon footprint during the construction phase of subway stations mainly comes from the use of fossil fuels such as gasoline and diesel, as well as electricity. The carbon footprint intensity of fossil energy and electricity use can be calculated by the ratio of the total carbon footprint formed by the use of various types of energy and electricity during the construction phase of subway stations to the building area of subway stations.
- (4)
Carbon footprint intensity per unit building area of subway stations
It is not convenient to list the carbon footprints formed by artificial and other building materials, except for the use of pre-mixed concrete, steel, and various types of energy and electricity. Therefore, the carbon footprint intensity per unit building area, which can represent the overall carbon footprint level of subway station construction, is selected as the evaluation indicator to reflect the overall low-carbon construction level of subway stations.
- (5)
Carbon footprint intensity per unit cost of subway stations
During the construction process of subway stations, the safety and economy of the plan often take priority over the low-carbon effect of the plan. On the premise of ensuring engineering safety, a comprehensive evaluation of the construction cost and carbon footprint level of subway stations is beneficial for the application and promotion of relevant low-carbon construction methods. The carbon footprint of subway station construction is calculated by the ratio of the total carbon footprint of subway station construction to the total construction area of subway stations.
- (6)
Abandoned earthwork volume
The amount of construction waste such as soil and stones generated during the construction process of subway stations. The generation, transportation, and treatment process of abandoned soil and rock all involve a large amount of greenhouse gas emissions, which exert certain pressure on the environment.
These indicators (S5 and S6) do not provide independent information beyond S1–S4 but reflect overall carbon efficiency. S5 enables cross-station comparison, while S6 reflects the trade-off between carbon emissions and economic cost.
2.4. Selection of Response Indicators
Response indicators are measures taken to reduce the environmental pressure caused by subway station construction and alleviate the negative impact of environmental pressure. The specific low-carbon construction indicators under the response dimension are listed in
Table 3.
- (1)
Application degree of low-carbon construction plan
This indicator reflects the extent to which low-carbon technologies, materials, and management measures are implemented during subway station construction. It comprehensively evaluates the adoption of energy-saving construction processes, recycling and reuse of temporary materials (such as steel structures, formwork, and mud purification systems), and the integration of high-efficiency machinery and optimized construction organization. A higher score indicates a greater degree of low-carbon practice adoption and management efficiency. Following the same standardized expert scoring system, this indicator is graded into five intervals: poor (0–0.2), relatively poor (0.2–0.4), average (0.4–0.6), good (0.6–0.8), and excellent (0.8–1.0).
- (2)
Engineering investment
Economic benefits are one of the important criteria for selecting construction plans for subway stations. On the premise of ensuring engineering safety, good economic benefits can enhance the competitiveness of low-carbon construction schemes for subway stations. Engineering investment (R2) reflects the economic cost of the construction scheme. Strictly speaking, within the PSR framework, economic cost does not fall into the category of “environmental response.” This indicator is retained in the response layer for practical engineering decision-making purposes, serving as an auxiliary constraint in the multi-criteria evaluation. The inclusion of R2 does not interfere with the main causal logic of the PSR framework (“pressure → state → response”), and its weight in the comprehensive evaluation is relatively small (approximately 0.058).
- (3)
Low-carbon and environmental management measures
Effective measures should be taken during the construction process of subway stations to reduce construction noise pollution. Waste mud must be treated by sedimentation to meet standards before being discharged. The construction site should be covered and enclosed to reduce dust pollution. As a qualitative indicator, low-carbon environmental protection management measures are divided into five levels: poor (0, 0.2), poor (0.2, 0.4), average (0.4, 0.6), good (0.6, 0.8), and good (0.8, 1.0).
- (4)
The degree of use of low-carbon construction machinery
The construction machinery used in the subway station construction process consumes a large amount of gasoline and diesel. Moreover, most construction machinery may increase its energy consumption and exceed pollutant emissions after high-intensity use. It is advisable to choose construction machinery and equipment that meet emission standards, prioritize electric powered machinery and equipment, timely maintain and upkeep machinery and equipment, and eliminate outdated equipment that does not meet emission standards and has low efficiency. As a qualitative indicator, the degree of use of low-carbon construction machinery is divided into five levels: poor (0, 0.2), poor (0.2, 0.4), average (0.4, 0.6), good (0.6, 0.8), and good (0.8, 1.0).
- (5)
Quantification of qualitative indicators
All qualitative indicators (P
6, R
1, R
3, R
4) were scored independently by 10 experts with extensive experience in subway construction and low-carbon management (5 from design institutes, 3 from construction companies, 2 from universities). A standardized five-level scoring system (0–1 range) was uniformly applied. The coefficient of variation for all qualitative indicators was less than 0.15, indicating good inter-rater consistency. The comprehensive evaluation index system for low-carbon construction of subway stations is established as shown in
Table 4.
The comprehensive evaluation index system for low-carbon construction of subway stations comprises 17 evaluation indicators, including 13 quantitative evaluation indicators and 4 qualitative indicators. In the comprehensive evaluation index system for low-carbon construction of subway stations, the value of quantitative evaluation indicators is calculated from the carbon footprint measurement results of the case engineering materialization stage. For quantitative indicators that cannot be directly calculated, an expert scoring method is used to determine based on the evaluation index level standard. The comprehensive evaluation index system for low-carbon construction of subway stations, mainly based on quantitative indicators and supplemented by qualitative indicators, can avoid subjective interference and ensure the scientific, comprehensive, and rational nature of the comprehensive evaluation of low-carbon construction of subway stations.
3. A Comprehensive Evaluation Model for Low-Carbon Construction of Subway Stations Based on PSR–TOPSIS Method
3.1. Determine Indicator Weights
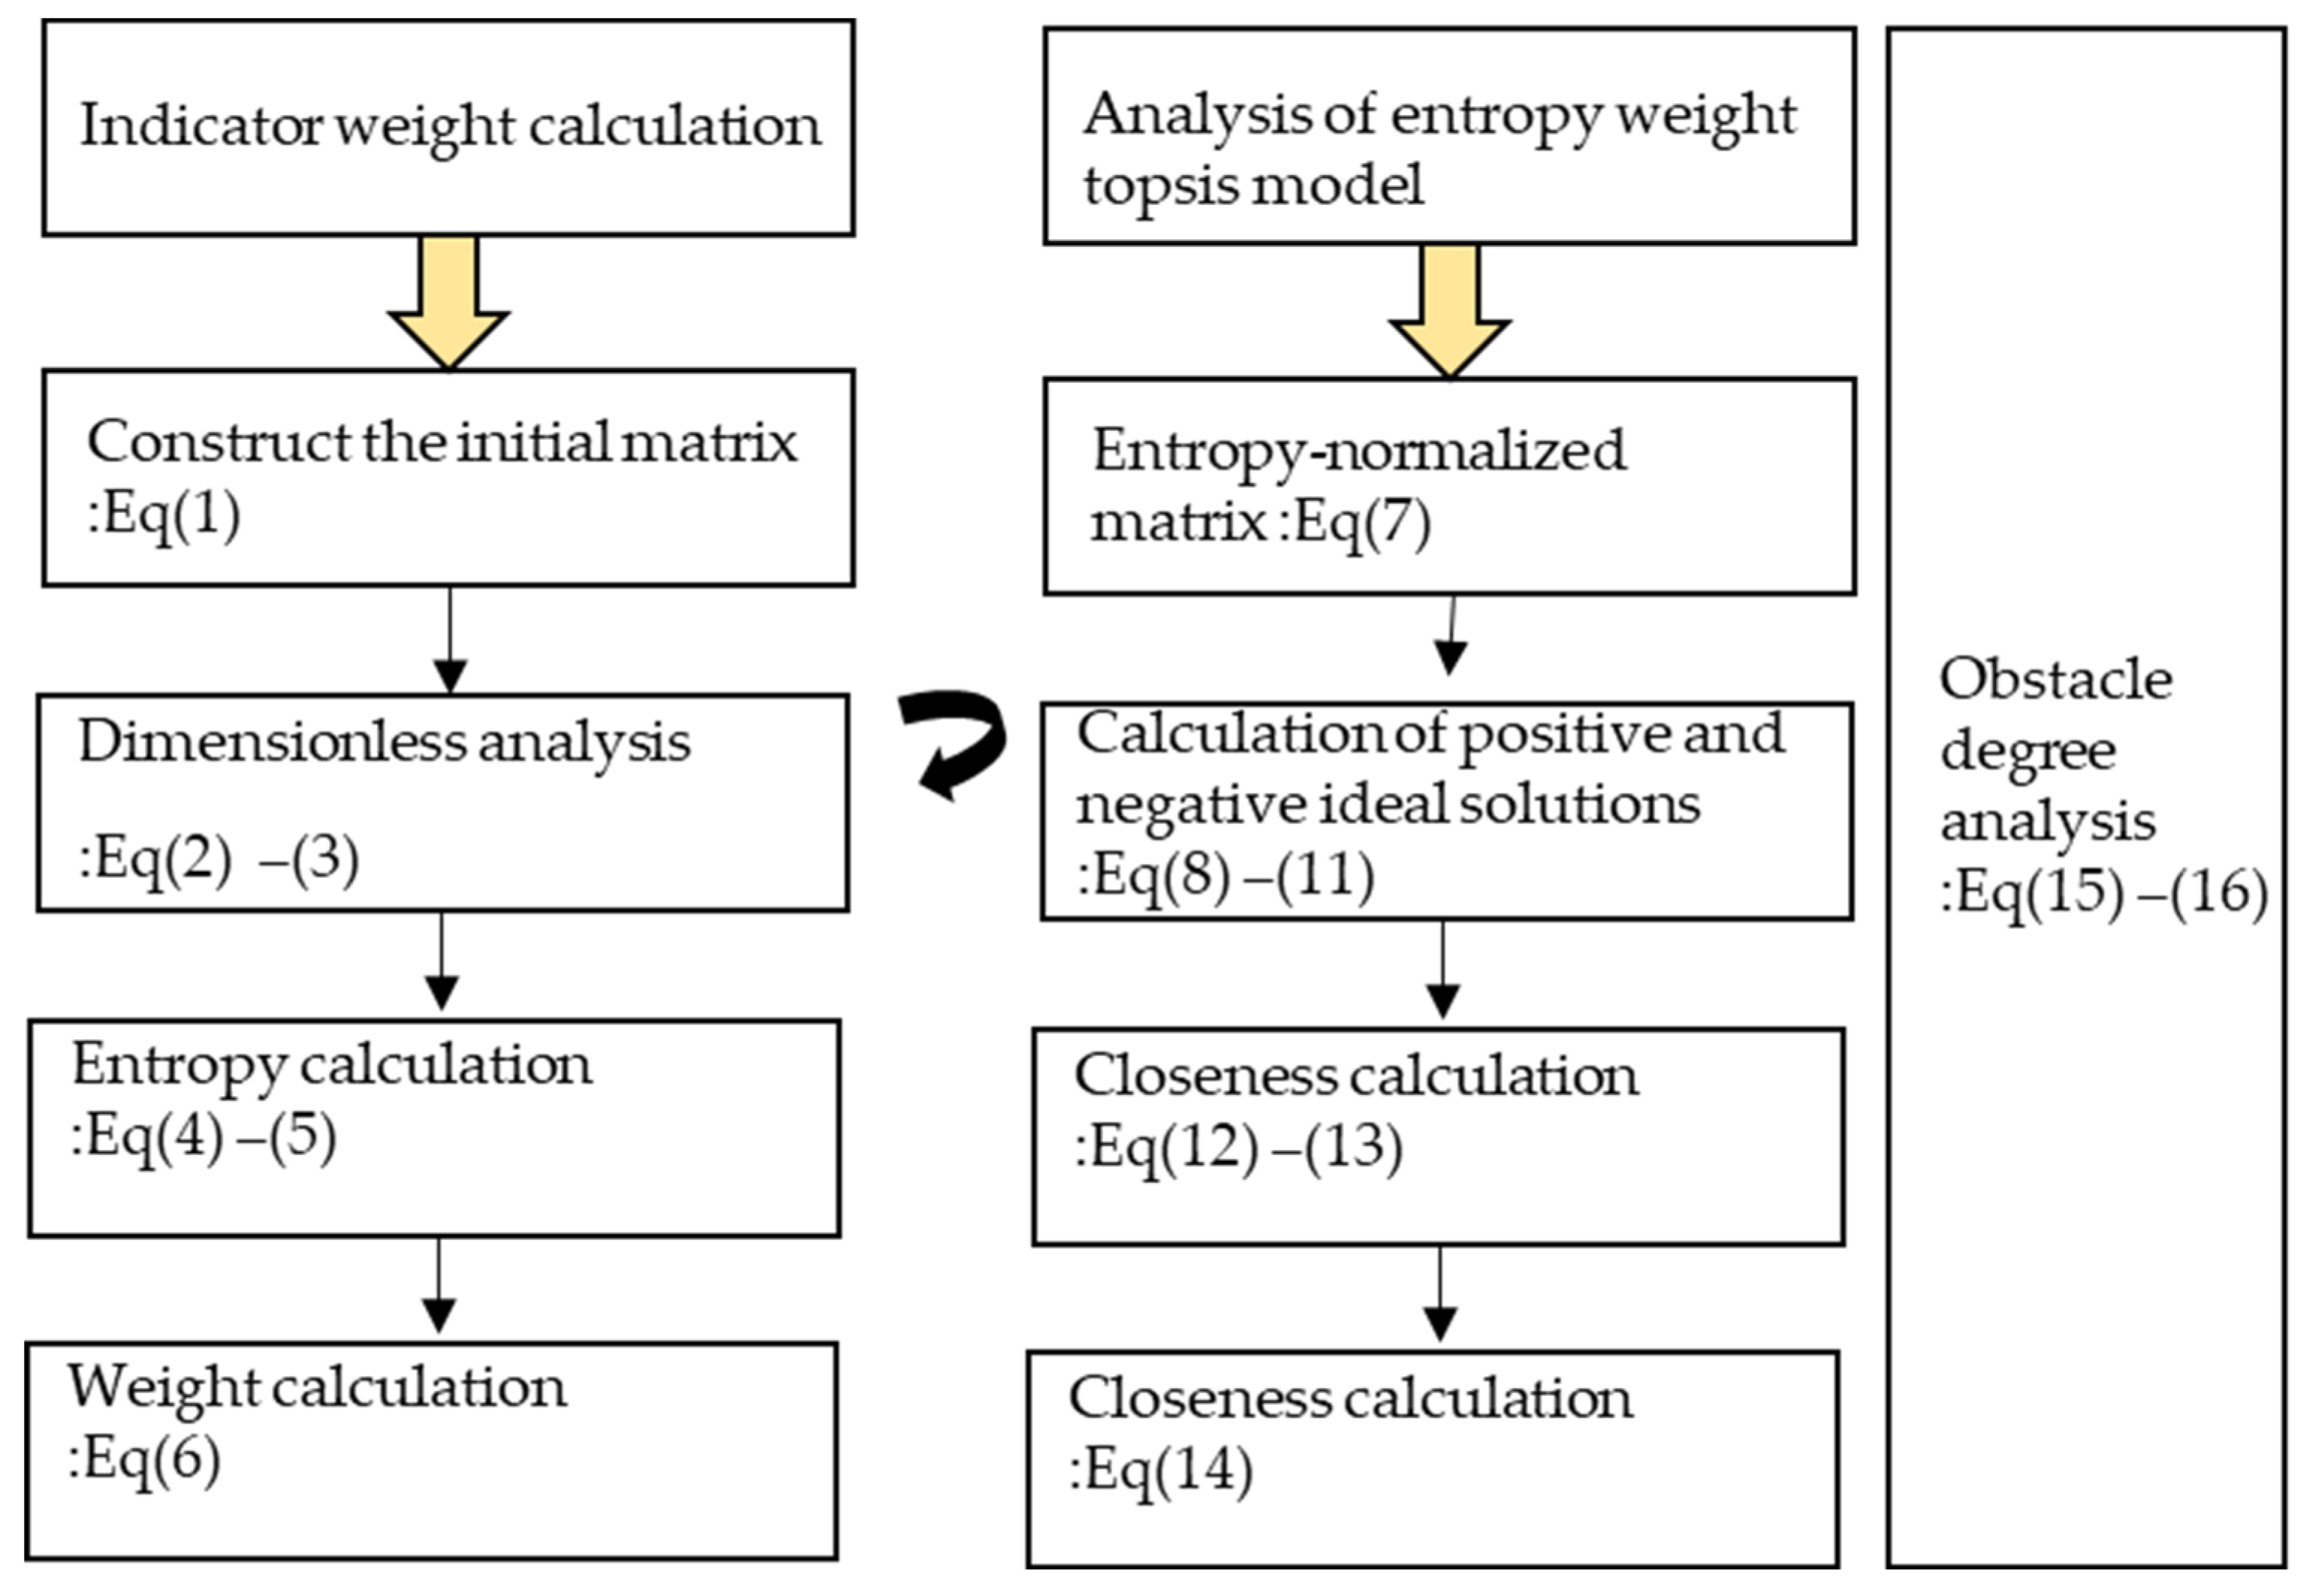
The pressure–state–response (PSR) model was adopted in this study because it effectively captures the cause–effect relationships between construction activities, environmental impacts, and management measures during the subway station construction process. The pressure component reflects the driving factors of carbon emissions such as material consumption and energy use; the state indicators quantify the resulting environmental and carbon footprint conditions; and the response indicators describe management and technological measures taken to mitigate emissions. The model calculation framework is shown in
Figure 2.
Compared with traditional evaluation models, the PSR framework provides a systematic, hierarchical, and feedback-oriented structure, allowing both quantitative measurement and interpretive analysis of low-carbon construction performance. Its causal chain logic—linking engineering actions, environmental states, and corrective responses—makes it particularly suitable for the complex, multi-phase nature of subway station projects. Therefore, PSR serves as a robust foundation for constructing a comprehensive and traceable low-carbon evaluation index system in this study.
In order to comprehensively evaluate the low-carbon construction level of subway stations, it is necessary to assign weights to the evaluation indicators in the comprehensive evaluation index system of low-carbon construction of subway stations based on the PSR model. The rationality of evaluation index weights deeply affects the reliability of the comprehensive evaluation results of low-carbon construction in subway stations. There are two main methods for determining the weights of evaluation indicators: subjective weighting and objective weighting. Subjective weighting methods mainly include the analytic hierarchy process, Delphi method, direct scoring method, direct ranking method, etc. The subjective weighting method integrates the views and opinions of different experts based on practical problems and their own knowledge and experience to determine the weights of various evaluation indicators. The subjective weighting method is easy to operate, but the indicator weights determined by this method are easily influenced by the subjective preferences of experts and lack objectivity. Objective weighting methods include the coefficient of variation method, entropy method, rough set method, multi-objective optimization method, etc. The objective weighting method relies on the measured data of evaluation indicators and determines their weights based on the amount of information contained in the measured data of evaluation indicators, without human interference. Although the weight of evaluation indicators determined by objective weighting method overcomes the disadvantage of subjective weighting method being deeply influenced by expert subjective preferences, the weight determined by objective weighting method may have certain differences from the importance of actual evaluation indicators. This article uses the entropy weight method to objectively assign weights to various evaluation indicators within the comprehensive evaluation index system for low-carbon construction of subway stations.
Entropy was originally a function in thermodynamics that describes the process of thermal motion. Since Claude Shannon introduced the concept of entropy into information theory, entropy is considered a measure of the disordered state within a system. The larger the entropy value, the less information it contains, and the greater the uncertainty. The entropy weighting method, as an objective weighting method, uses the entropy value of each indicator to reflect the amount of information provided by the evaluation indicator and determine its weight. The basic steps of the entropy weight method are as follows.
The entropy weight method is used for objective weighting. For a comprehensive evaluation system with m evaluation objects and
n evaluation indicators, the original data matrix is:
- (1)
Perform dimensionless processing on the raw data of evaluation indicators.
For positive indicators where larger data values are better:
For negative indicators where smaller data values are better:
- (2)
Calculate the information entropy of various evaluation indicators
:
- (3)
Calculate the weights of various indicators
:
3.2. Entropy-Weighted TOPSIS Model
The TOPSIS model, also known as the “approximate ideal solution sorting method”, is based on a normalized raw data matrix to calculate the ideal solution in the evaluation scheme. It measures the Euclidean distance between the evaluation object and the positive and negative ideal solutions and sorts them, measuring the relative closeness between the evaluation object and the optimal and worst solutions, and evaluating the superiority and inferiority of each scheme. The TOPSIS model does not have strict restrictions on the sample size, number of indicators, etc., of the data, and the calculation is relatively simple. The basic steps of the entropy-weighted TOPSIS model are as follows:
- (1)
Using the entropy weight method to calculate the entropy weight
, construct a weighted normalization matrix for evaluation indicators
X:
- (2)
Determine the positive ideal solution and negative ideal solution for the evaluation plan.
For positive ideal solutions :
When j is a positive indicator,
When j is a negative indicator,
For negative ideal solutions :
When j is a positive indicator,
When j is a negative indicator,
- (3)
Calculate the Euclidean distance between the evaluated solution and the positive and negative ideal solutions:
- (4)
Calculate the relative closeness of each evaluation plan
:
Finally, rank the relative closeness values ci of each evaluation scheme in descending order. The larger the ci, the closer the Euclidean distance between the evaluation scheme and the positive ideal solution, and the better the evaluation scheme.
Euclidean distance is adopted as the distance metric in this study, which is the conventional choice in TOPSIS and offers intuitive geometric interpretability. To test the sensitivity of this choice, Manhattan distance was also tested as an alternative metric. The ranking results remained unchanged, and the variations in relative closeness values were less than 1%. Mahalanobis distance, while theoretically appealing for handling correlated indicators, cannot be reliably estimated with only three samples due to the ill-conditioned covariance matrix. Future research with larger sample sizes may explore Mahalanobis distance as an alternative.
3.3. Construction of Low-Carbon Construction Evaluation Model for Subway Stations
Firstly, based on the PSR model, a low-carbon construction evaluation index system for subway stations is constructed, and the basic data for each evaluation index is determined. Among them, the measured values of each quantitative indicator in the evaluation index system are calculated based on the carbon footprint data of the physical and chemical stages of subway stations under this scheme. The basic data of each qualitative indicator in the evaluation index system is determined by the expert scoring method.
Secondly, the basic data of 17 evaluation indicators for each of the m subway station construction plans will be used to construct the original data matrix: .
To examine potential multicollinearity among the 17 indicators, a Pearson correlation analysis was conducted. Several pairs, such as P1–S1 (concrete consumption and its carbon emission) and P4–S4 (electricity use and its carbon emission), showed correlation coefficients exceeding 0.85. This indicates a degree of redundancy, which may inflate the influence of these aspects in the TOPSIS ranking. Nevertheless, these paired indicators are retained in this study to preserve the causal logic of the PSR framework (“pressure → state”). Future work could apply principal component analysis or structural equation modeling to reduce dimensionality while maintaining interpretability.
To calculate the entropy-weighted TOPSIS model, determine the relative closeness ci of each scheme, and rank them.
Finally, the closer the relative closeness value of the evaluated subway station construction plan is to 1, the closer the plan is to a positive ideal solution and the higher the low-carbon construction level of the subway station adopting this plan.
3.4. Analysis of Obstacle Factors for Low-Carbon Construction of Subway Stations
For the evaluation of low-carbon construction of subway stations, in addition to evaluating the level of low-carbon construction of subway stations, it is also necessary to identify the obstacles that affect the level of low-carbon construction of subway stations, in order to formulate corresponding strategies to improve the level of low-carbon construction of subway stations. In order to analyze the obstacle factors that affect the low-carbon construction level of subway stations, an obstacle degree model is introduced to analyze the obstacle factors in the comprehensive evaluation index system of low-carbon construction of subway stations. The diagnostic analysis of obstacles mainly uses three indicators: factor contribution, indicator deviation, and obstacle degree. Factor contribution degree represents the contribution of a single indicator to the overall goal, indicator deviation degree represents the difference between the actual value and the optimal value of the indicator, and obstacle degree reflects the degree of influence of various low-carbon construction evaluation indicators on the low-carbon construction level of subway stations. The calculation formulas for the deviation degree
Iij and obstacle degree
Oij of the indicators are as follows:
in Formula (15) is a positive indicator for dimensionless treatment using Formula (2) or a negative indicator for dimensionless treatment using Formula (3) in the low-carbon construction evaluation index system. is the weight of each indicator calculated by Formula (6).
The obstacle degree model provides a systematic approach to diagnose the relative influence of various factors hindering the improvement of system performance. It integrates the deviation degree of each indicator with its weighted contribution to quantify the extent to which each factor constrains the overall objective. In this study, it is used to reveal the main factors that limit the enhancement of low-carbon construction performance in subway stations, thereby supporting targeted optimization measures. The indicator deviation reflects the relative difference between the actual value of an indicator and its ideal value, representing the magnitude of deviation from the optimal low-carbon performance. The obstacle degree, in contrast, combines the indicator deviation with its weight to evaluate the overall hindering effect of that indicator on system performance.
The obstacle degree analysis is a model-internal diagnostic tool. The results reflect the relative influence of each indicator within the PSR–entropy–TOPSIS framework and should not be interpreted as experimentally or empirically validated causal barriers. Cross-validation with field surveys and expert interviews is recommended for practical decision-making.
3.5. Weight Determination of Low-Carbon Construction Evaluation Indicators
The matrix R composed of the original data of the comprehensive evaluation system for low-carbon construction in the case project is:
According to the entropy weight method, the basic steps for determining the weight of evaluation indicators are as follows.
Table 5 shows the weight results of various low-carbon construction evaluation indicators in the case.
The weights of all 17 indicators range narrowly between 0.0490 and 0.0634, with most concentrated between 0.058 and 0.063. This near-uniform distribution suggests that the three construction schemes do not exhibit strong variability across individual indicators. Consequently, the TOPSIS ranking differences primarily arise from cumulative additive effects rather than the dominance of a few key indicators.
The entropy weights presented above are derived from only three construction schemes for a single-case station. These weights are case-dependent and should not be generalized as universal weights for subway station low-carbon evaluation. Future research should employ larger sample sets or combined weighting methods to obtain more stable weights.
3.6. Sensitivity Analysis of Entropy-Based Weights
To verify the robustness of the entropy-based weighting results, the calculated weights of all 17 indicators were perturbed within ±10% and ±20% of their original values. The perturbed weights were substituted back into the entropy–TOPSIS evaluation model, and the relative closeness coefficients were recalculated using 500 Monte Carlo simulations. The detailed results of this sensitivity analysis are presented in
Table 6.
The ranking order of the three construction methods remained unchanged across all perturbation scenarios, and the maximum deviation in relative closeness was less than 3.5%. This confirms the robustness and stability of the PSR–entropy–TOPSIS framework.
4. Empirical Study on Comprehensive Evaluation of Low-Carbon Construction in Subway Stations
4.1. Project Overview and Basic Data
A subway station in Guangzhou is located at the intersection of Zhongshan Avenue and Chebei North Street. The main body of the station is an underground 4-story structure, with a total length of 166.65 m, a clear span of 25.25 m, and a depth of approximately 33.4 m. Three construction methods are compared: open-cut, cover excavation (sequential), and reverse cover excavation [
42].
This study adopts the IPCC emission factor method. Key assumptions include an electricity emission factor of 0.527 tCO
2/MWh, a diesel emission factor of 3.17 kgCO
2/kg, a gasoline emission factor of 2.98 kgCO
2/kg, a pre-mixed concrete emission factor of 298 kgCO
2/m
3 (full cycle), and a steel emission factor of 2.09 tCO
2/t (full cycle). The average transport distance for concrete is 15 km and for steel is 80 km. The functional unit is tCO
2e per square meter of building area. All calculations are based on a design-stage bill of quantities rather than real-time on-site monitoring data, as shown in
Table 7.
A sensitivity analysis on transport distance assumptions was conducted. Taking steel transport as an example, a 20% reduction in railway transport distance leads to a 16.3% decrease in transport-stage carbon emissions. However, the relative ranking of the three construction methods in terms of transport-stage emissions remains unchanged, confirming that the main conclusions of this study are robust to reasonable variations in transport distance assumptions.
This framework is designed to be adaptable to different geographical contexts. For international applications, users should replace the background parameters (electricity emission factors, material emission factors, transport distances) with locally appropriate values while keeping the indicator structure and evaluation logic unchanged. For example, the electricity emission factor for the European Union or the United States can be used when applying the model outside China.
4.2. Evaluation Results and Analysis of Low-Carbon Construction
- (1)
Comprehensive evaluation level of low-carbon construction in engineering
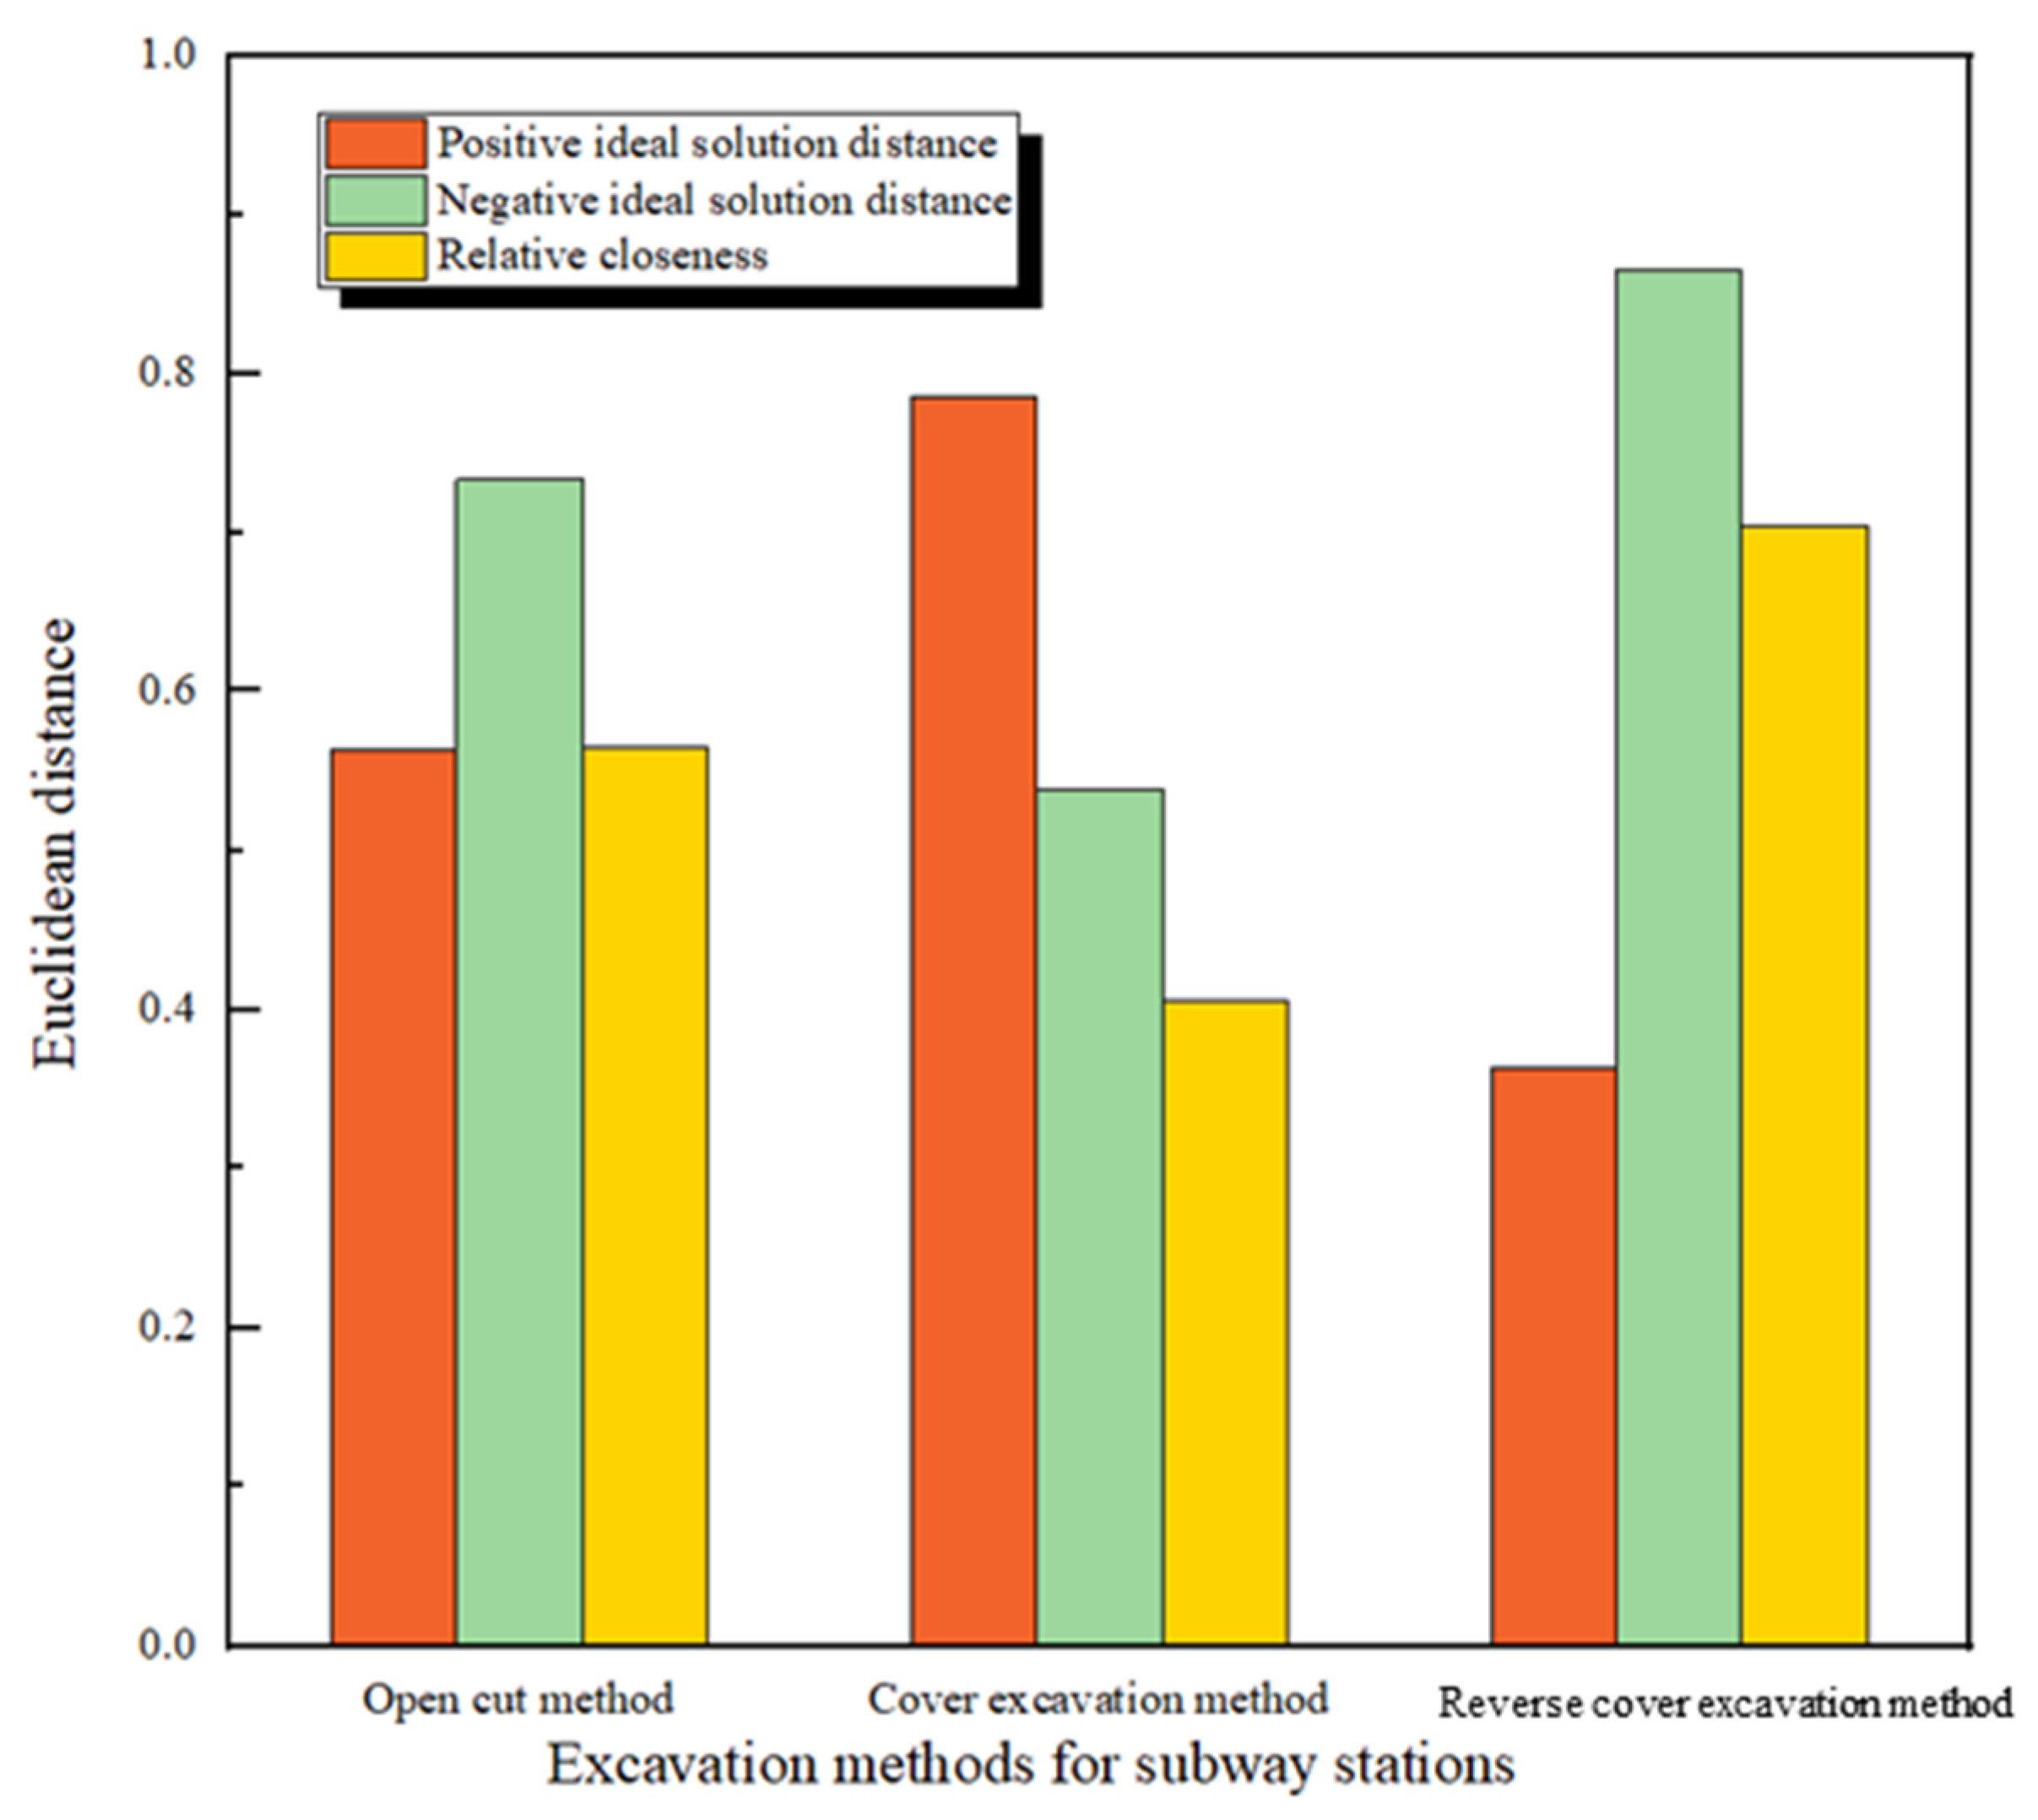
The calculation results of the Euclidean distance
d+ and
d− and relative closeness
ci between the evaluated scheme and the positive and negative ideal solutions using Formulas (12)–(14) are shown in
Figure 3:
From
Figure 3, it can be seen that the relative closeness ranking of the comprehensive evaluation indicators for low-carbon construction in subway stations is as follows: the cover excavation method scheme < the open-cut excavation method scheme < the reverse cover excavation method scheme. At present, there is no established evaluation index standard for green and low-carbon construction of subway stations. Based on the actual situation of the case station, this article divides the low-carbon construction evaluation standards of the case project into four levels, as shown in
Table 8:
According to the evaluation criteria in
Table 7, based on the calculation of the relative closeness of the comprehensive evaluation indicators for low-carbon construction of subway stations, it is determined that the low-carbon construction level of the open excavation method construction plan for this subway station is average, the low-carbon construction level of the cover excavation method construction plan is average, and the low-carbon construction level of the reverse cover excavation method construction plan is good.
- (2)
Weight analysis of low-carbon construction indicators for subway stations
In the evaluation index system of low-carbon construction in subway stations, the three indicators of electricity consumption intensity (P4), electricity use carbon footprint intensity (S4), and pre-mixed concrete use carbon footprint intensity (P3) of the case project have a relatively high weight, indicating that the construction process of subway stations needs to focus on the impact of the above three indicators on the level of low-carbon construction. Optimizing the mix design of pre-mixed concrete and establishing an intelligent production and transportation system for pre-mixed concrete can effectively reduce the carbon footprint of pre-mixed concrete in the physical and chemical stages of subway stations, and improve the level of low-carbon construction in engineering, without affecting the safety and normal use of subway station buildings.
4.3. Comparison of Three Construction Methods
For the building material production stage, the total carbon emissions for the open-cut, cover excavation, and reverse cover excavation methods are 66,356.61 tCO2e, 69,096.95 tCO2e, and 59,216.54 tCO2e, respectively, with corresponding intensities of 3.64 tCO2e/m2, 5.24 tCO2e/m2, and 3.03 tCO2e/m2. The cover excavation method requires a cover slab and additional concrete and steel supports, resulting in the highest material-related carbon emissions. The reverse cover method uses the constructed floor slab as support, eliminating temporary support requirements and achieving the lowest emissions.
For the transportation stage, the carbon emissions for the three methods are 638.25 tCO2e, 604.69 tCO2e, and 614.59 tCO2e, respectively, with intensities of 0.035 tCO2e/m2, 0.046 tCO2e/m2, and 0.032 tCO2e/m2. Concrete transportation accounts for 78–83% of transportation-stage emissions across all methods.
For the on-site construction stage, the carbon emissions for the three methods are 6510.99 tCO2e, 6269.76 tCO2e, and 6732.95 tCO2e, respectively, with intensities of 0.36 tCO2e/m2, 0.48 tCO2e/m2, and 0.39 tCO2e/m2. For the open-cut method, 86.47% of on-site emissions come from construction machinery (diesel-powered excavators, bulldozers, and dump trucks). For the cover excavation methods, smaller working areas lead to more use of smaller machinery and a more balanced distribution of electricity, gasoline, and diesel emissions.
4.4. Analysis of Obstacle Factors for Low-Carbon Construction
The analysis results of low-carbon construction obstacle factors for three construction schemes of subway stations: open-cut method, cover excavation method, and reverse cover excavation method are shown in
Table 9:
The obstacle degrees reported above reflect the relative influence of each indicator within the model framework. They should be interpreted as model-internal diagnostics, not as empirically validated causal barriers.
For the reverse cover method, if fossil energy consumption intensity (P3) is reduced by 20% through the adoption of electric machinery, the relative closeness ci increases from 0.645 to 0.712. If electricity consumption intensity (P4) is simultaneously reduced by 15%, ci further increases to 0.756.
5. Suggestions for Low-Carbon Construction of Subway Stations
The following suggestions are divided into two categories: model-derived suggestions and general experience-based suggestions. The pressure indicators in the comprehensive evaluation index system for low-carbon construction of subway stations should be considered in combination with the principles of material conservation, water conservation, energy conservation, and land conservation.
- (1)
Material-saving measures
The material-saving measures for low-carbon construction of subway stations include the use of local materials, the use of green building materials, optimized cutting, the use of recyclable materials, and material recycling [
43]. Using local materials can shorten the transportation distance of building materials and reduce material losses caused by transportation. Based on the carbon footprint calculation results during the transportation phase of building materials in
Section 4 of this article, for steel transported by a combination of railway and road transportation, the railway transportation distance is reduced by 20%, and the carbon footprint during the transportation phase will decrease by about 16.3%.
The emission reduction potential brought by material recycling is also considerable. Recycled steel carbon footprint factor = steel carbon footprint factor × (1 − regeneration rate) + regeneration rate × steel carbon footprint factor × 40%. According to the calculation of steel consumption data using the case study method, when the steel reinforcement regeneration rate is 50% and the regeneration rate of various types of steel is 90%, the emission reduction using recycled steel is as shown in
Table 10:
According to the calculation results in the table above, under the open-cut construction plan, using recycled steel can reduce the carbon footprint of the steel production process by 32.9%, resulting in a 11.24% decrease in the total carbon footprint of the subway station during the physical and chemical stage. The use of recycled steel in the construction process of subway stations can significantly reduce the carbon footprint intensity (S2) index of steel use and improve the low-carbon construction level of subway stations.
- (2)
Energy-saving measures
The energy-saving measures for low-carbon construction of subway stations mainly include fuel conservation, regular maintenance of construction machinery, and the use of renewable energy. The significant consumption of gasoline and diesel during the excavation and transportation of abandoned soil and rock in subway stations is the main source of the carbon footprint during the construction phase. Choosing a reasonable construction method and excavation plan for the foundation pit to reduce the quantity of abandoned soil and rock, optimizing the transportation plan for abandoned soil and rock, and controlling the transportation distance of abandoned soil and rock can all produce good emission reduction effects. In addition, adopting construction machinery and equipment that meet emission standards and regularly maintaining them, monitoring the energy consumption of construction machinery, can effectively reduce the energy carbon footprint intensity (S3) index.
- (3)
Land-saving measures
The land-saving measures for low-carbon construction of subway stations mainly include reasonable layout of construction sites and reducing the amount of abandoned earthwork. Reasonable layout of construction sites can reduce energy consumption caused by secondary handling of building materials. The construction process of subway stations generates a large amount of abandoned soil and construction waste from the demolition of temporary structures such as concrete supports, which encroaches on a large amount of land and puts significant pressure on the environment. When using the reverse excavation method for subway station construction, the structural beams and slabs of the subway station will replace the temporary pavement system and temporary support, which not only reduces the construction waste generated by the removal of temporary support, but also reduces the scope and time of occupying the original road.
- (4)
Water-saving measures
The water-saving measures for low-carbon construction of subway stations include water conservation, wastewater recycling, and the use of water-saving equipment. Measures such as reusing the precipitation treatment of foundation pits, dehydrating waste mud, and using water-saving equipment in office and living spaces not only avoid water resource waste, but also to some extent reduce the carbon footprint of subway stations during the physical and chemical stages.
From the evaluation of low-carbon construction level and obstacle analysis results of subway stations, it can be seen that the high level of low-carbon construction in the reverse cover excavation method scheme is also due to its good performance in various indicators such as the difficulty of underground pipeline relocation (P6), carbon footprint strength (S1) of pre mixed concrete, carbon footprint strength (S2) of steel, and engineering investment (R2). The reverse cover excavation method scheme not only has a cost advantage due to lower engineering investment compared to the other two schemes, but also greatly shortens the construction period, reduces dust and noise pollution at the construction site, and reduces the disturbance impact of subway station construction on the surrounding environment, making the low-carbon construction level of this scheme higher than the other two schemes. In addition, establishing a systematic, efficient, and scientific construction management system, strengthening the cultivation of low-carbon construction awareness among construction site personnel, selecting efficient and safe construction methods based on the actual situation of the project, and selecting low-carbon construction equipment can help gradually improve the low-carbon construction level of subway stations.