Article

Resilience Analysis of a Large-Span Stadium Under Typhoon-Induced Wind Hazards

1
Shenzhen Academy of Disaster Prevention and Reduction, China Earthquake Administration, Shenzhen 518003, China
2
China-Pakistan Belt and Road Joint Laboratory on Smart Disaster, Prevention of Major Infrastructures, Southeast University, Nanjing 210096, China
3
Department of Civil and Environmental Engineering, Hong Kong Polytechnic University, Hong Kong 999077, China
4
Hong Kong Polytechnic University Shenzhen Research Institute, Shenzhen 518057, China
*
Author to whom correspondence should be addressed.
These authors contributed equally to this work.
Buildings 2026, 16(10), 1914; https://doi.org/10.3390/buildings16101914
Submission received: 3 April 2026 / Revised: 29 April 2026 / Accepted: 7 May 2026 / Published: 12 May 2026
(This article belongs to the Section Building Structures)

Abstract

Large-span stadium roofs in coastal regions are highly vulnerable to typhoon-induced wind damage, and their post-event performance depends on both structural safety and functionality recovery. This study proposes a probabilistic framework to assess typhoon-induced damage, functionality degradation, recovery, and resilience of a large-span stadium roof system in Shenzhen, China. Progressive damage to the roof cover and the roof-supporting structure is evaluated by combining wind tunnel pressure data and structural analysis. The results show that the roof cover shows greater vulnerability than the supporting structure, with slight damage emerging at around 30 m/s, whereas structural damage requires higher wind speeds. A functionality-based recovery model is further developed by considering repair preparation, repair duration, and repair sequence constraints. The building generally exhibits a high resilience level, with a mean resilience index of 0.9550 and a median of 0.9589. The initial overall building functionality loss increases from about 7% under TY conditions to 20% under STY and 60% under Super TY, while the recovery duration increases by about 2–3 times and 5–6 times relative to the TY case, respectively. The proposed framework provides a practical basis for resilience-oriented performance assessment of large-span roof structures under typhoon hazards.

1. Introduction

Typhoons generated over the warm waters of the western North Pacific frequently make landfall along the southeastern coast of China, posing severe threats to coastal infrastructure, communities, and regional economies [1,2,3]. Recent destructive events have caused extensive structural damage, power outages, transportation disruptions, and substantial socio-economic losses in densely populated coastal cities [4,5]. Their impacts often extend well beyond landfall, as the recovery of damaged buildings and critical infrastructure may take months or even years, resulting in prolonged functional disruption. With rapid coastal urbanization, population, assets, and essential infrastructure are increasingly concentrated in typhoon-prone areas, while climate change may further intensify typhoon-related wind, rainfall, and compound hazards [6,7,8]. Enhancing the resilience of urban buildings is therefore critical for reducing disaster losses, accelerating post-event recovery, and supporting the safe and sustainable development of coastal cities.
Numerous studies have investigated the statistical characteristics, intensity evolution, and track variability of typhoons in the western North Pacific and their impacts on coastal China [9,10,11]. Building on this hazard characterization, extensive research has focused on the wind loads and aerodynamic behavior of buildings under strong wind and typhoon conditions. Wind tunnel experiments, field measurements, and computational fluid dynamics (CFD) simulations have been widely used to evaluate wind pressure distributions and aerodynamic loads on low-rise, mid-rise, and high-rise buildings [12,13,14,15]. Li et al. [10] experimentally and numerically investigated the aeroelastic response of flexible umbrella-shaped membrane structures under typhoon winds, showing pronounced non-Gaussian pressure and displacement responses, wind-speed-dependent dynamic amplification, and a stronger influence of wind velocity and membrane pretension than rise–span ratio. Fang et al. [16] investigated the wind-induced response of large-span membrane structures under typhoon winds, showing that higher wind velocities intensify pressure redistribution, induce asymmetric deformation, and increase stress concentration and axial forces in the cable-net system. These studies have shown that typhoon-induced wind loads can cause extreme cladding pressures and pronounced structural responses, such as large displacements, accelerations, and stress concentrations, thereby increasing the risk of functionality loss and serviceability problems [17,18].
Post-disaster surveys and analytical studies have documented widespread building damage caused by typhoons, including roof failure, façade damage, and structural system degradation [4,5]. To quantitatively assess structural damage risk, vulnerability and fragility analysis methods have been developed based on statistical analysis, reliability theory, and numerical simulation [19,20,21]. Recently, Wu et al. [22] developed a performance-based wind engineering framework for roof cladding based on roof-plate-unit vulnerability curves, while Phan et al. [23] assessed typhoon-induced fragility of roof cladding through wind tunnel tests, pull-through tests, and nonlinear finite-element simulations. In addition, Zhao et al. [24] evaluated the wind uplift resistance reliability of large-span standing seam metal roof systems by integrating wind tunnel testing, wind uplift testing, finite-element modelling, and probabilistic simulation. These studies have contributed to understanding the relationship between wind hazard intensity and structural damage probability, providing a basis for risk assessment and performance-based design [25,26,27]. In recent years, increasing attention has been paid to the concept of structural and urban resilience, which emphasizes not only structural safety but also the ability to resist, absorb, and recover from extreme hazard events [28,29]. Qin et al. [28] proposed a probabilistic simulation-based resilience assessment method for high-rise buildings under typhoon-induced wind and rain hazards, explicitly linking progressive cladding damage, internal pressure change, rain intrusion, and time-dependent functional recovery to quantify building-level resilience under extreme typhoon scenarios. Pantua et al. [30] proposed a framework to assess typhoon-induced failure risk and energy performance of roof-mounted PV systems, highlighting an integrated design strategy that balances structural resilience and energy generation for typhoon-resilient rooftop solar installations. Qiu et al. [31] developed a multi-hazard resilience assessment framework for prefabricated underground stations with large-span roof structures, integrating joint vulnerability, restorability, physical resilience, and community resilience to support resilient scheme selection in complex urban environments. In addition, several other resilience assessment frameworks have been proposed to evaluate the performance of buildings and urban systems under natural hazards, incorporating structural damage, functionality loss, and recovery processes [32,33,34,35,36,37,38,39,40]. These approaches provide important tools for quantifying the resilience of urban buildings and supporting resilience-based design and decision-making.
Despite these advances, existing resilience-based studies on wind-exposed buildings still have several limitations. Many studies rely on simplified wind intensity measures and do not explicitly account for the stochastic evolution of typhoon tracks and wind fields. In addition, most vulnerability and risk assessments focus mainly on damage probability, with limited quantitative linkage to functionality loss, recovery trajectory, and resilience index. Moreover, current typhoon-related resilience frameworks are largely oriented toward high-rise buildings or general urban infrastructure, whereas large-span roof systems remain insufficiently investigated. Therefore, there is a critical need to develop an experiment-based framework that integrates stochastic typhoon simulation, wind-tunnel-based roof pressure data, component-level damage assessment, and time-dependent recovery modelling for large-span roof buildings. Such a framework is essential for improving disaster risk mitigation strategies, enhancing urban resilience, and ensuring the sustainable development of coastal cities in typhoon-prone regions.
This paper is structured as follows. Section 2 presents the overall methodology, including the prototype large-span stadium model, the characterization of site-specific typhoon hazards, and the modeling framework for wind loads and structural damage. In addition, the functionality, recovery, and resilience assessment models are introduced. Section 3 describes the simulation procedures and provides detailed results, including synthetic typhoon scenarios, cladding damage analysis, and the evaluation of functionality degradation, recovery processes, overall roof system resilience, and parameter sensitivity. Finally, the main conclusions and key findings of this study are summarized in Section 4.

2. Methodology

Section 2 presents the overall methodological framework adopted in this study. It begins with the development of a prototype large-span stadium model and the characterization of site-specific typhoon hazards. Subsequently, the physical damage mechanisms induced by typhoon wind loads are modeled, with particular emphasis on wind load representation and damage assessment. Building upon this, a comprehensive framework for functionality evaluation, recovery modeling, and resilience assessment is established. Together, these components form an integrated approach for quantifying the impact of typhoon hazards on large-span structures and evaluating their post-disaster performance and resilience.

2.1. Prototype Large-Span Stadium and Wind Tunnel Tests

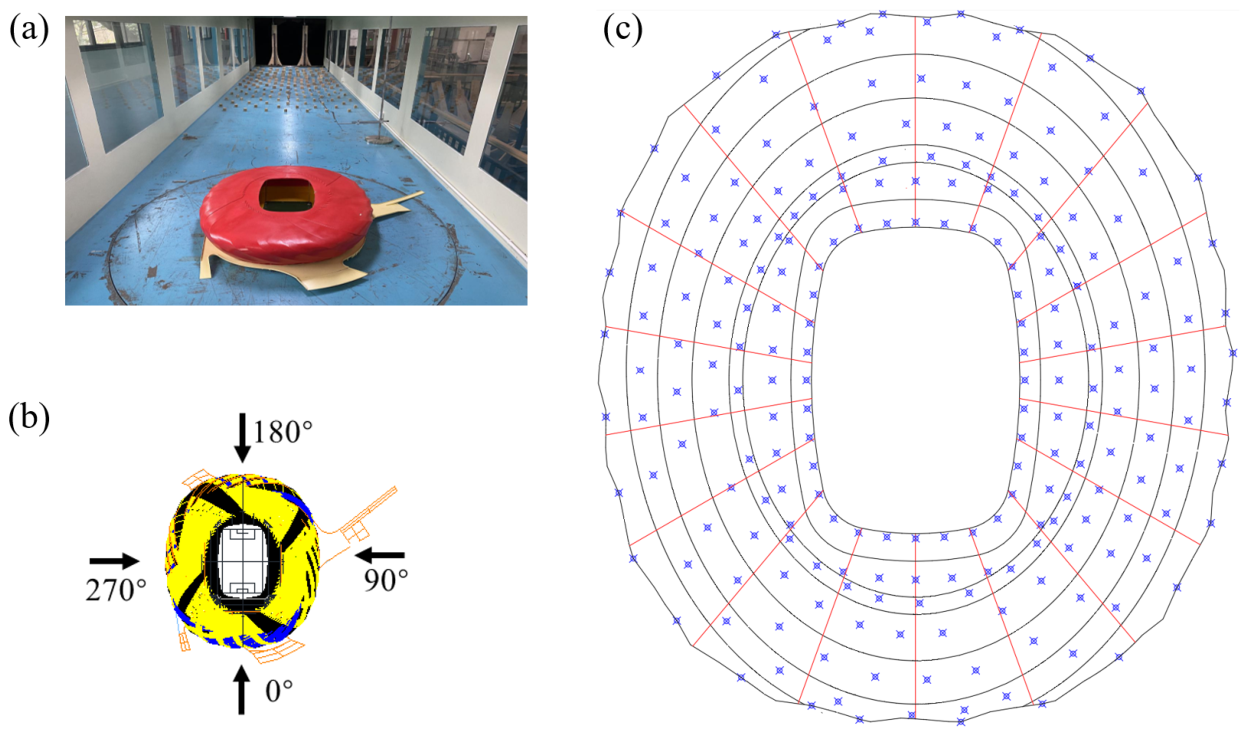
This study conducts a resilience assessment for a typical large-span stadium located in Shenzhen, China. The stadium has a total floor area of approximately 172,000 m2, with a major axis of about 286 m and a minor axis of approximately 258 m, representing a typical large-span spatial structure. The overall height of the stadium is approximately 60 m. Due to its lightweight characteristics, high flexibility, low structural damping, and a fundamental natural period that is close to the dominant period of wind excitation, the structure is particularly sensitive to wind-induced loads. The roof structure is supported by a steel spatial truss system, and the cladding consists of transparent rigid glass panels. As illustrated in Figure 1c, the roof is composed of 122 cladding units of varying sizes, forming a complex geometric configuration. The wind pressure resistance of the cladding is modeled as a lognormal random variable with a mean value of 4.87 kPa and a coefficient of variation (COV) of 0.20, based on the Chinese design standard GB/T 50009-2012 [41]. In addition, finite element analyses were performed for both the entire roof system and individual cladding units to quantify their wind-resistant capacities. The analysis of the global roof structure was used to determine the resistance of the roof-supporting system, while the component-level analysis of individual cladding units provided a basis for local performance evaluation. According to the numerical results, the wind pressure resistance of the roof-supporting structure was taken as a lognormal random variable with a mean value of 6.3 kPa and a coefficient of variation (COV) of 0.3.
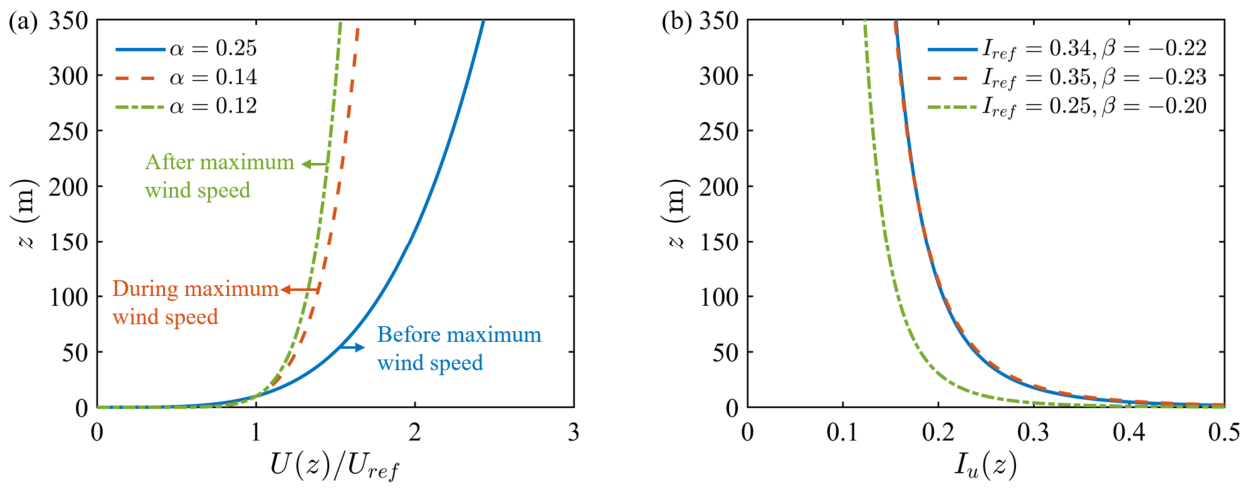
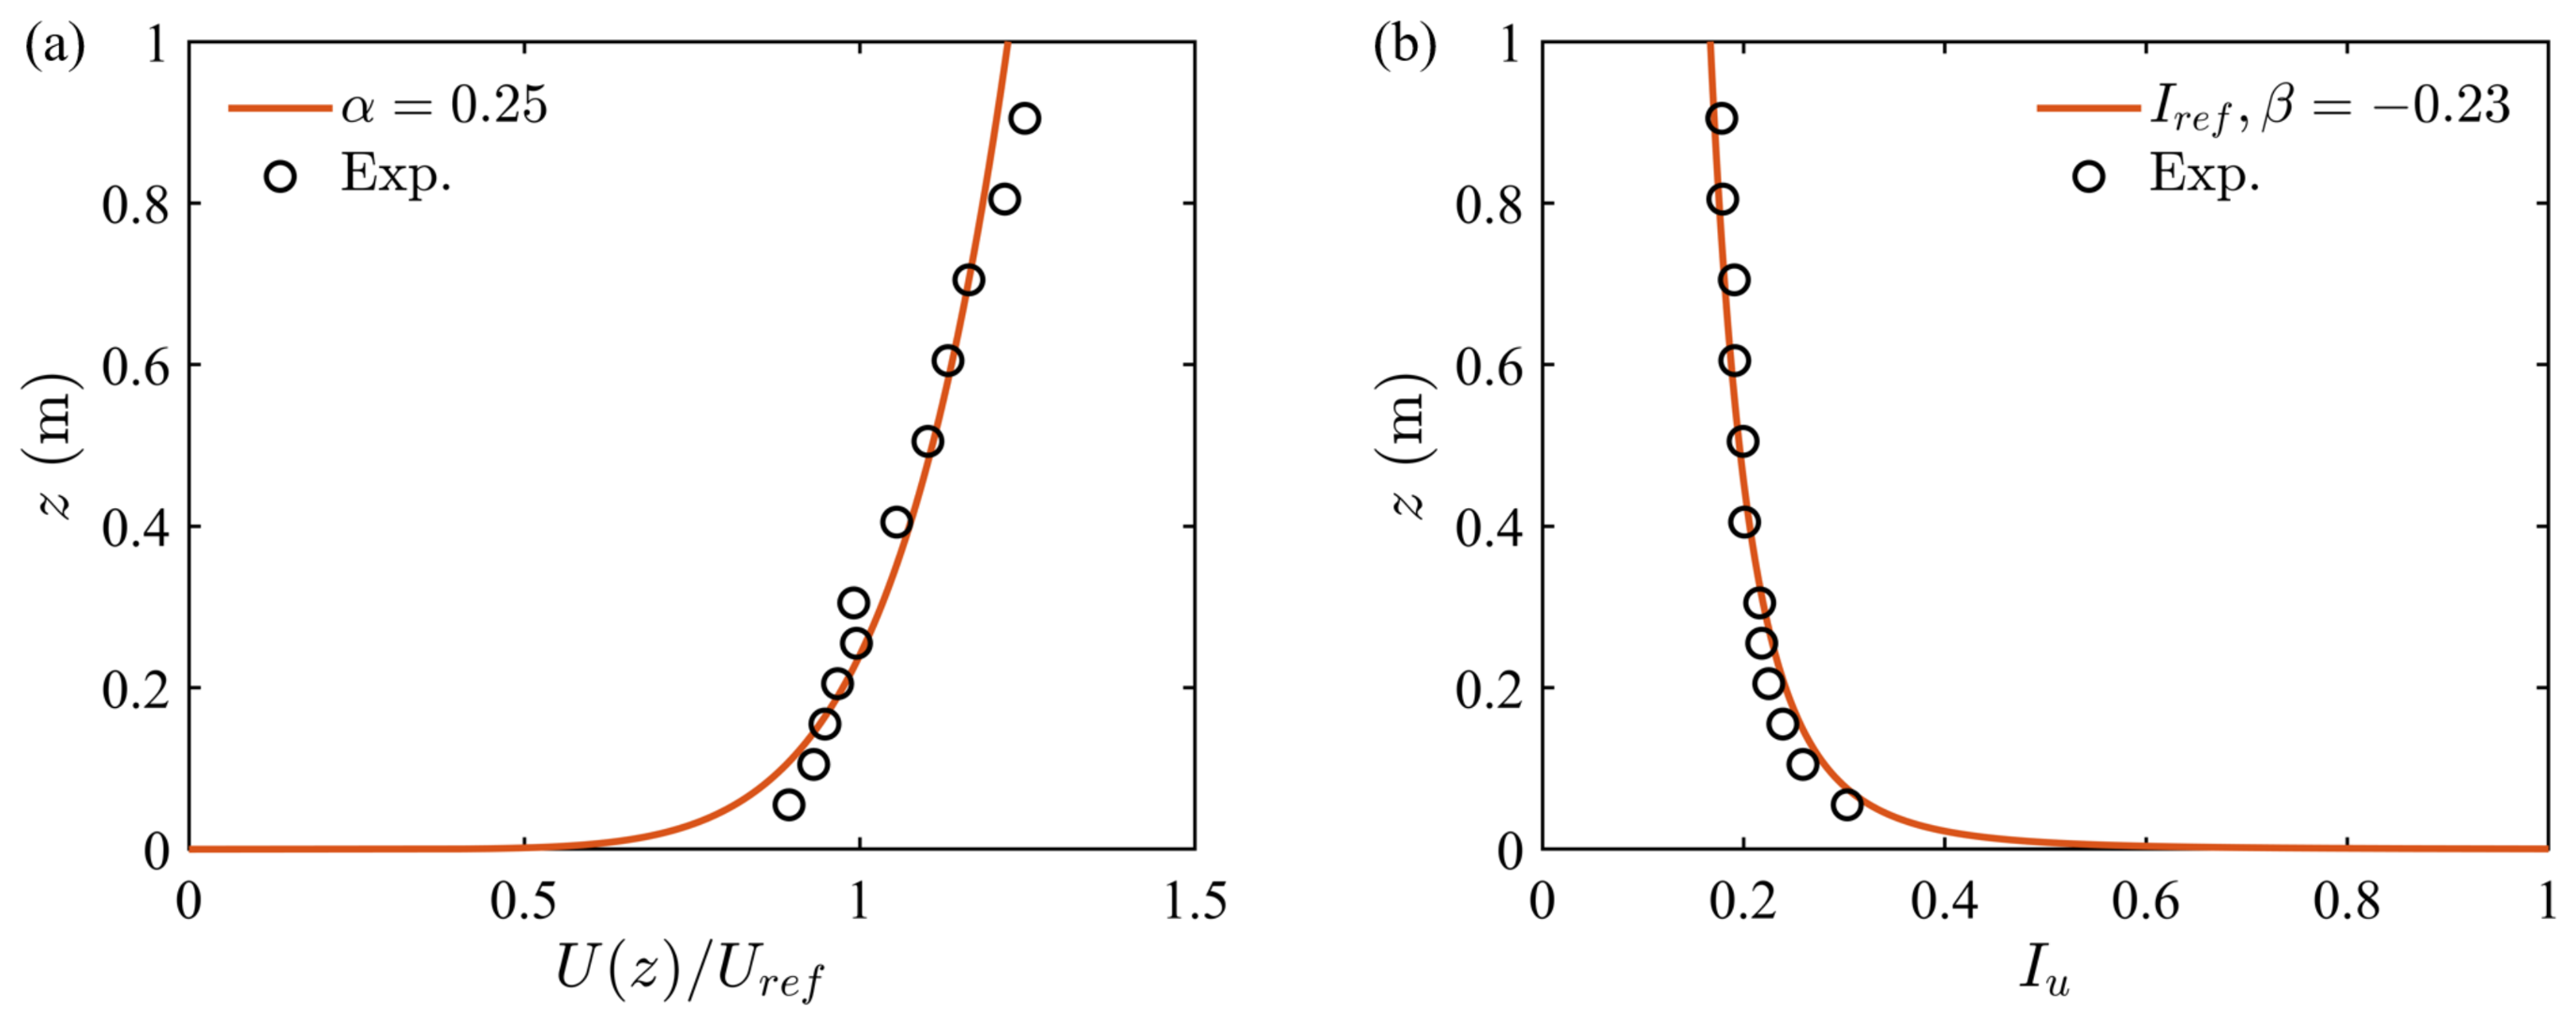
For such buildings with complex geometries and large spans, current design codes do not provide explicit methods for determining wind loads. Therefore, a scaled wind tunnel test was conducted to obtain the wind pressure distribution on the roof surface, as shown in Figure 1a. A geometric scale of 1:250 was adopted in the experiment to ensure an appropriate representation of the structural configuration within the wind tunnel constraints, and the blockage ratio of the test was approximately 3%, which is within acceptable limits for boundary layer wind tunnel experiments. The tests considered a full range of wind directions from 0° to 360° with an interval of 10° (Figure 1b), allowing for a comprehensive evaluation of directional wind effects. The wind pressure data was measured at 388 pressure taps including the upper surface and lower surface on the building roof over a 120-s period with a sampling frequency of 500 Hz for each wind direction. The inflow wind profile in the wind tunnel was carefully simulated to reproduce the near-surface wind characteristics measured during typhoon Mangkhut in Shenzhen at Shenzhen Meteorological Gradient Tower (SZMGT) (Figure 2), as reported by Li et al. [42]. It is noted that the wind profiles corresponding to the period around the peak wind speed of the typhoon are relatively consistent before and after the peak. Considering that the structural damage risk is most critical when the wind speed reaches its maximum, the wind profile at the time of peak wind speed was selected as the target inflow profile for the wind tunnel simulation. In addition, the corresponding turbulence intensity profile during this period was also adopted to ensure a realistic representation of the typhoon boundary layer characteristics. The target wind profile was used to calibrate the boundary layer flow in the wind tunnel. A comparison between the simulated wind tunnel profile and the target field measurements is presented in Figure 3, demonstrating good agreement and ensuring the reliability of the experimental results.

2.2. Site-Specific Typhoon Hazards

In this study, a stochastic typhoon track model originally proposed by Vickery and Twisdale [40] is adopted to simulate the processes of typhoon landfall, translation, and inland decay within the region of interest. The simulated typhoon paths are idealized as linear trajectories intersecting a circular domain centered on the target site. For the case of Shenzhen, a circular region with a radius of 250 km is defined to represent the spatial extent of historical typhoon influence. Each typhoon event is characterized by a set of governing parameters, including the central pressure deficit, forward translation speed, movement direction, radius to maximum wind, and the closest distance between the track and the site center. Except for the radius to maximum wind, the probabilistic descriptions of these parameters are established based on statistical analyses of historical typhoon records within the defined region. The radius to maximum wind is instead expressed as a function of the central pressure deficit. For Shenzhen, both the distribution types and corresponding statistical parameters are obtained from the work of Guo et al. [43]. A Monte Carlo simulation framework is employed to generate synthetic typhoon tracks according to the prescribed probability distributions. The corresponding landfall positions along the coastline are determined based on the simulated trajectories. After landfall, typhoons gradually weaken as they propagate inland. This attenuation process is described using a filling model, in which the temporal evolution of the central pressure deficit follows an exponential decay formulation proposed by Vickery and Twisdale [44]. The associated decay parameters for Shenzhen are calibrated using the results reported by Guo et al. [43]. Compared with full-track approaches that require extensive basin-wide datasets, the present method relies only on statistical information derived from typhoons affecting a predefined surrounding region. This enables efficient generation of synthetic typhoons impacting the site, making it particularly suitable for large-scale Monte Carlo simulations in probabilistic resilience analyses.
To simulate the associated wind field, the analytical model developed by Meng et al. [45,46] is adopted to represent the temporal evolution of wind speed and direction at the site. Based on the typhoon parameters obtained from the track model—such as central pressure deficit, radius to maximum wind, translation speed, and movement direction—the maximum wind speed and the corresponding radial and tangential velocity components can be analytically determined by solving the governing momentum equations. These velocity components are further combined with a boundary layer model that accounts for terrain effects, allowing the vertical wind profile at different elevations to be obtained. As the typhoon progresses along its trajectory, the relative position between the storm center and the site continuously changes, while the storm intensity gradually decreases after landfall. Consequently, both wind speed and wind direction at a given height exhibit significant temporal variability. Further details of the wind field modeling approach can be found in Meng et al. [45,46].

2.3. Physical Building Damage

The present study focuses on roof cladding damage and roof-supporting structure damage induced by excessive wind pressure, defined as conditions under which the applied wind load exceeds the cladding and supporting structure resistance. A probabilistic damage assessment framework is employed to establish the load-resistance relationships governing cladding and supporting structure failure. The analysis explicitly accounts for the progressive nature of cladding and supporting structure damage under spatiotemporally varying wind fields, as well as the stochastic characteristics and dynamic evolution of wind pressures acting on the roof surface. The methodology adopted for evaluating building roof damage is described in detail in this section.

2.3.1. Wind Loads

The fluctuating wind pressure acting on the cladding at time t is expressed as
P t = 1 2 ρ V H t 2 [ C p u t C p l ( t ) ]
where P ( t ) denotes the instantaneous net wind pressure on the roof surface, ρ is the air density, and V H ( t ) represents the hourly mean wind speed at the building height H , obtained from the typhoon track and wind field models described in Section 2.2. C p u ( t ) and C p l ( t ) are the wind pressure coefficients on the upper and lower surfaces of the roof, respectively, derived from wind tunnel experiments. Several assumptions are involved in Equation (1). First, although the typhoon wind field is nonstationary over the entire event, it is assumed to be locally stationary within each hourly interval. Thus, the time-varying mean wind speed V H ( t ) accounts for the nonstationary evolution of the typhoon, while the wind tunnel pressure coefficient time histories describe the short-term turbulent pressure fluctuations. Second, the air density is taken as a constant, ρ = 1.225 kg/m3, and its variation with temperature, humidity, and atmospheric pressure is not explicitly considered. Because P t is linearly proportional to ρ , density variation would mainly introduce a proportional scaling of the estimated wind pressure.
The wind tunnel tests were performed to evaluate the wind effects on a representative large-span stadium subjected to Super typhoon Mangkhut, which made landfall in Shenzhen and resulted in substantial economic losses. Detailed information on the experimental setup is provided in Section 2.1. Since the duration of a typhoon event is significantly longer than that achievable in full-scale wind tunnel simulations, an approximate non-Gaussian stochastic simulation model [26] is employed to generate wind pressure time histories of arbitrary duration for a given wind direction at the pressure tap locations. Furthermore, a non-stationary (i.e., non-straight wind) pressure model [27] is incorporated into the stochastic framework to account for the continuously varying wind direction during a typhoon event, thereby enabling a more realistic representation of the evolving wind pressures on both the upper and lower roof surfaces.

2.3.2. Damage Assessment

Roof cladding damage is primarily governed by excessive suction induced by wind loading [22]. A cladding unit is considered to have failed at time t when the corresponding limit state function G satisfies
G = R f P ( t )
where R f denotes the cladding resistance, as defined in Section 2.1, and P ( t ) is the wind pressure acting on the cladding unit at time t, as given by Equation (1). By performing a probabilistic evaluation of the limit state for each cladding unit at every time step throughout the typhoon event, the spatial distribution and temporal evolution of cladding damage over the entire roof envelope can be systematically determined. It should be emphasized that P ( t ) varies continuously with time, reflecting the inherently stochastic nature of wind speed and direction at the building site, which are governed by the typhoon’s movement and decay processes described in Section 2.3.1. In addition, since the investigated stadium is an open-type large-span structure, the local failure of roof-cover components is not expected to induce a significant abrupt increase in internal pressure [14,47,48]. This differs from initially enclosed buildings, where envelope failure may cause rapid internal-pressure amplification. In this study, both upper- and lower-surface pressure coefficients were obtained from the wind tunnel tests, and the net pressure acting on the roof-cover components was directly adopted in the damage assessment. Therefore, the internal-pressure effect is represented through the measured net pressure, while the additional pressure redistribution associated with progressive roof-cover damage is regarded as a secondary effect and is not explicitly modeled.
The failure assessment of the roof-supporting structure follows a similar procedure. The main difference is that the load effect acting on the roof-supporting structure is represented by an equivalent static wind load that incorporates the contribution of roof vibration, rather than the direct cladding pressure given in Equation (1). The structural resistance has already been defined in Section 2.1. Accordingly, the failure of the roof-supporting structure is determined by comparing the vibration-inclusive equivalent static wind load with the corresponding structural resistance at each time step throughout the typhoon event. It should be emphasized that, in the present study, failure of the roof-supporting structure generally refers to the failure of local supporting structural components rather than collapse of the entire roof structural system.

2.4. Functionality, Recovery and Resilience Models

2.4.1. Functionality Model

In this study, the exterior walls of the stadium are composed of reinforced concrete and are therefore expected to have a very low probability of failure under typhoon-induced wind loading. Consequently, wall damage is excluded from the present functionality assessment. The functional loss of the large-span stadium is evaluated by considering only two key components: the roof cover system and the roof-supporting structure. The overall functionality of the stadium is assumed to be governed by the functional states of these two components. Accordingly, the building functionality at time t is expressed as
F B ( t ) = j = 1 N w j f j t
where N denotes the number of considered components, f j t represents the functionality of the j-th component, and w j is the weight factor of the j-th component and w j = 1 . The weighting factors are introduced to account for the relative importance of different components to the operational performance of the stadium. In this study, only two components are considered, namely, the roof cover and the roof-supporting structure. Based on engineering judgment, the weighting factors for the roof cover and the roof-supporting structure are taken as 0.3 and 0.7, respectively, indicating the greater importance of the load-bearing roof system to the post-typhoon operability of the stadium.
The damage states of the large-span stadium are defined with reference to Hazus, developed by the Federal Emergency Management Agency (FEMA) [49] and further refined through engineering judgment (Table 1). The corresponding functionality ratings of the stadium are summarized in Table 2. The functionality ratings listed in this table are used to define representative damage states for practical classification and interpretation, rather than to impose an abrupt step-wise degradation rule. In the numerical implementation, the building functionality is updated at each time step according to the actual progressive damage of roof-cover components and roof-supporting members. For each component, the functionality indicator f j t ranges from 0–1.0, where f j t = 0 represents complete loss of functionality and f j t = 1.0 represents full functionality. The component functionality is expressed as
f j t = f [ R C R t ,   R S R ( t ) ]
where R C R t and R S R ( t ) represent the damage ratios of the roof cover and the roof-supporting structure at time t, respectively, as determined from the damage assessment described in Section 2.3.2. The functionality assessment of the stadium starts at t = t 0 and continues until t = T e j , where t 0 denotes the end of the typhoon event, i.e., the time at which the building reaches its maximum damage state and post-event repair activities can commence, and T e j represents the time required to complete the repair or replacement of the damaged components. At t = t 0 , both R C R t and R S R t attain their maximum values, corresponding to the minimum component functionality. As the recovery process proceeds, the damage ratios R C R t and R S R t gradually decrease, leading to a progressive increase in f j ( t ) and hence in the overall stadium functionality F B ( t ) .
When the roof-supporting structure and the roof cover are damaged simultaneously, a sequential repair strategy is adopted. Specifically, the roof-supporting structure is restored first, and only after its repair is completed can the roof cover repair or replacement be carried out. This treatment reflects actual engineering practice, as restoration of the roof cover depends on the prior recovery of the supporting structural system.

2.4.2. Recovery Model

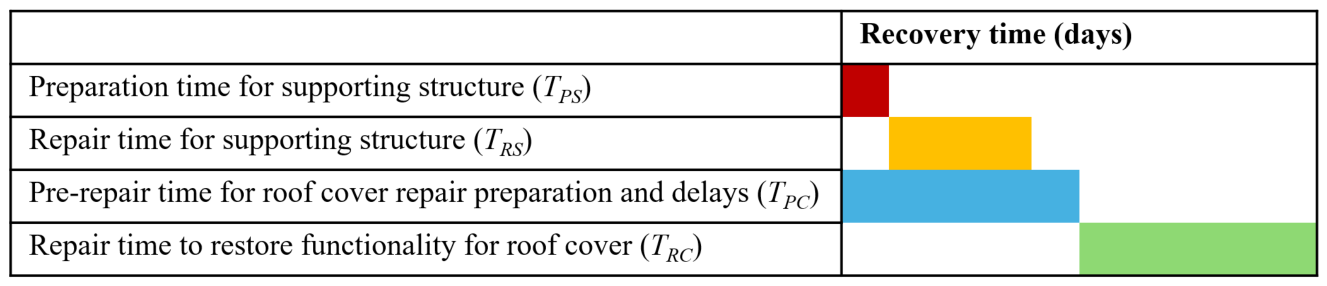
This study assumes that the building-level recovery process commences immediately after the typhoon event, at t = t 0 , as illustrated in Figure 4. The recovery framework comprises the restoration of both the roof-supporting structure and the roof cover, together with the associated preparation periods and possible delays prior to the onset of physical repair work. At the building level, the recovery strategy is governed by both structural criticality and construction sequence constraints. As shown in the recovery Gantt chart in Figure 4, planning and preparation for repairing the roof-supporting structure are initiated immediately after the typhoon and are assigned the highest priority, with the objective of restoring building functionality as early as possible. The pre-repair time for the roof-supporting structure, T P S , includes inspection and damage assessment, repair planning, resource allocation, labor mobilization, and other necessary preparatory activities. The corresponding repair time, T R S , denotes the duration required to repair the damaged roof-supporting structure and recover the associated portion of building-level functionality. Since the roof-supporting structure is fundamental to structural safety and the continued operation of the stadium, its repair is treated as urgent and therefore prioritized in the allocation of available resources.
For the damaged roof cover, the pre-repair time, T P C , includes both preparation activities for roof-cover repair and any delay arising from limited resource availability or lower repair priority. Although T P C also starts immediately after the typhoon event, its temporal composition may differ from that of T P S . Since roof-cover repair is contingent upon the restoration of the roof-supporting structure, additional delays may arise either before the preparation activities can be initiated or after they have been completed but prior to the commencement of the actual repair work. The repair time for the roof cover, denoted as T R C , refers to the time required to repair all damaged roof-cover units and the associated local components, thereby restoring the building to its original functional state. This duration depends not only on the extent of roof-cover damage, but also on the completion of supporting-structure repairs and the adopted repair sequence.
Accordingly, the recovery sequence shown in Figure 4 reflects two practical and highly likely post-disaster constraints: (i) repairs to the roof-supporting structure and the roof cover can only begin after their respective preparation stages have been completed; and (ii) roof-cover repair cannot start until the repair of the supporting structure has been completed. Owing to these sequential dependencies, T P C may also include the waiting time between the completion of roof-cover preparation and the completion of roof-supporting-structure repair, when the former finishes earlier than the latter. Therefore, by definition, T P C is not less than T P S + T R S . This treatment enables the proposed recovery model to explicitly account for priority-based resource allocation, construction interdependence, and realistic post-typhoon repair sequencing at the building level.

2.4.3. Resilience Assessment

The typhoon resilience index of the building is defined as
R T = 1 T t o t t 0 t 0 + T t o t a l F B ( t ) d t
where R T denotes the building-level resilience index, and F B ( t ) is the time-dependent building functionality, as determined from the functionality and recovery models described in Section 2.4.1 and Section 2.4.2. Here, T t o t = T P + T R represents the total recovery duration introduced in Section 2.4.2, where total preparation time T P = m a x { T P C ,   T R S + T P S } and total repair time T R = m a x { T R S ,   T R C } . Physically, R T corresponds to the integral of the recovery curve over the post-typhoon recovery period, from t = t 0 to t = t 0 + T t o t , when the building has been fully restored to its pre-event state. Therefore, a larger value of R T indicates a smaller functional loss and/or a faster recovery process, and hence a stronger resilience capacity against typhoon-induced damage.

2.5. Simulation Procedures

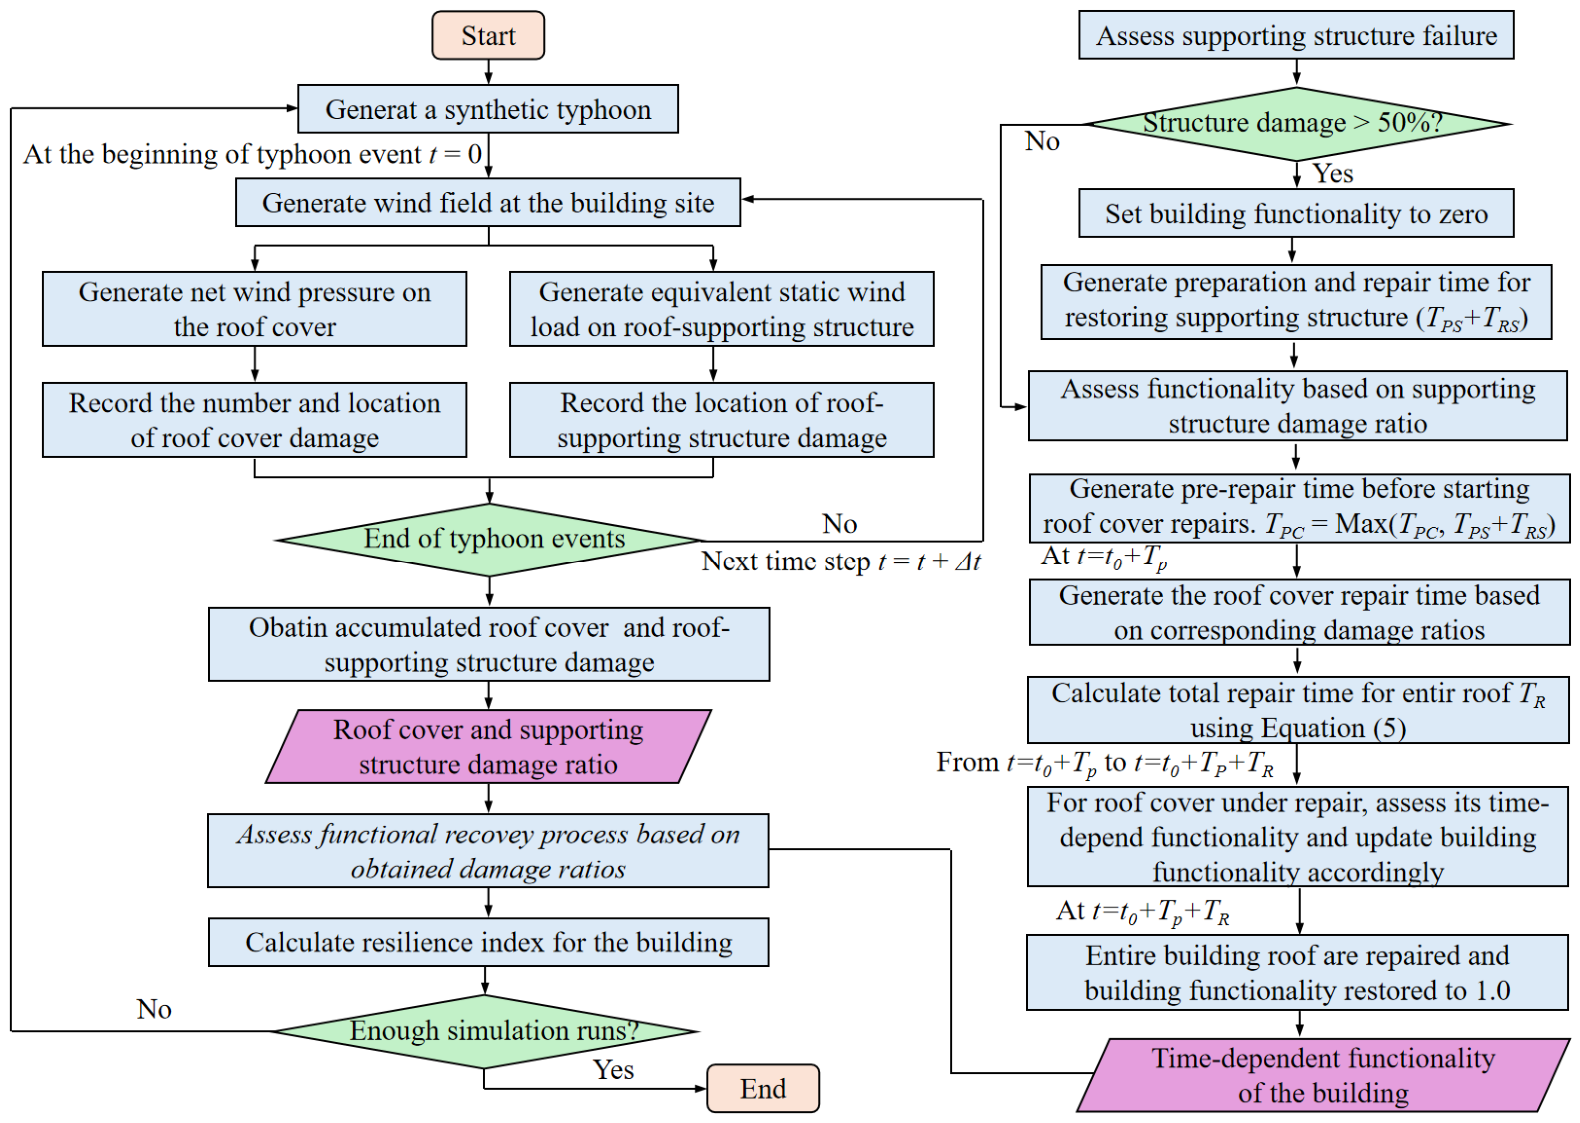
A Monte Carlo simulation framework is developed to couple the modelling of typhoon hazard, structural damage, functionality degradation, and post-event recovery, thereby facilitating a probabilistic resilience assessment. The overall procedure for simulating building damage and subsequent functional recovery is presented in Figure 5. In each realization, the time-varying wind field during the typhoon event, the associated roof wind pressures, and the resulting roof damage are simulated step by step over the entire hazard duration. After the typhoon event, the building-level functionality recovery is further simulated as a time-dependent process until the large-span roof building is fully restored.
Based on the simulated functionality history in each realization, the resilience index defined in Equation (5) is evaluated. Statistical information and probabilistic characteristics of damage, functionality, and resilience are then obtained by aggregating the results from all realizations. In this way, the proposed framework explicitly accounts for the stochastic nature of typhoon loading, damage accumulation, and recovery progression, allowing a more comprehensive evaluation of the resilience performance of large-span roof buildings.

3. Results and Discussion

3.1. Case Study on the Prototype Large-Span Roof Building

The proposed methodology for assessing building damage, functionality loss, recovery, and resilience is demonstrated using the prototype large-span roof building. The building characteristics, as well as the wind-pressure resistance of the roof-supporting structure and roof cover units, are introduced in Section 2.1. The wind effects acting on the roof are evaluated through a combination of wind tunnel testing and finite element analysis of the roof steel structure.
The numerical values and statistical information of the parameters used for typhoon track simulation, wind field modelling, wind load estimation, and damage assessment of both roof cover and roof-supporting structure are detailed in Section 2.2 and Section 2.3. These sections also provide the relevant rationale and literature basis. For the functionality and recovery models presented in Section 2.4, the parameter values are specified based on engineering judgement and literature-informed assumptions. Their numerical values, statistical descriptions, governing expressions, and the associated assumptions are summarized in Table 3.
It should be noted that the preparation and repair times involved in the post-typhoon recovery process of large-span roof systems are difficult to determine accurately due to the lack of sufficient field-based recovery records. Therefore, following previous studies on typhoon resilience assessment, lognormal distributions are adopted in this study to characterize the uncertainty in preparation time and structural repair time. The influence of this uncertainty on the recovery process is further discussed in Section 3.2.3. In addition, the repair time of an individual roof-cover unit is estimated with reference to the cladding repair time for low-rise buildings reported in FEMA [49], and a corresponding sensitivity analysis of this parameter is provided in Section 3.3.
These settings define a representative demonstration case for applying the proposed framework and are not intended to represent the only possible parameterization in practice. Nevertheless, the adopted assumptions provide a transparent basis for quantifying the effects of damage, functionality loss, and recovery uncertainty on typhoon-induced resilience assessment.

3.2. Results

For the prototype large-span roof building in Shenzhen, China, 30,000 Monte Carlo simulation runs were carried out to probabilistically evaluate the entire typhoon-induced damage-and-recovery process. Each simulation explicitly considered the synthetic typhoon wind field, roof pressure evolution, equivalent wind loads on roof-cover units, and damage to both the roof cover and roof-supporting structure. The resulting time-dependent functionality degradation and recovery of the two systems were then evaluated.

3.2.1. Synthetic Typhoons

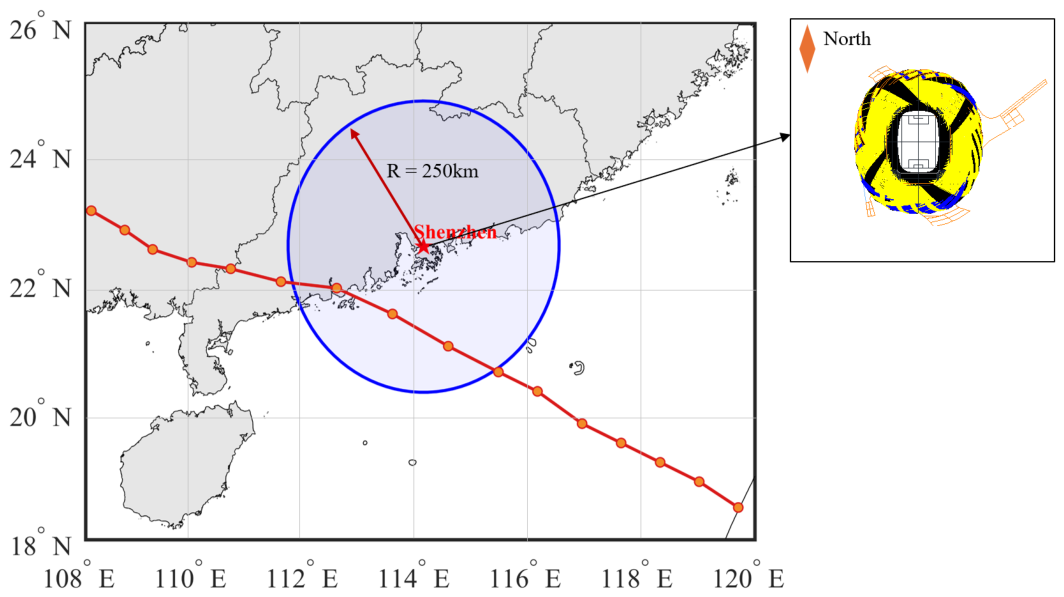
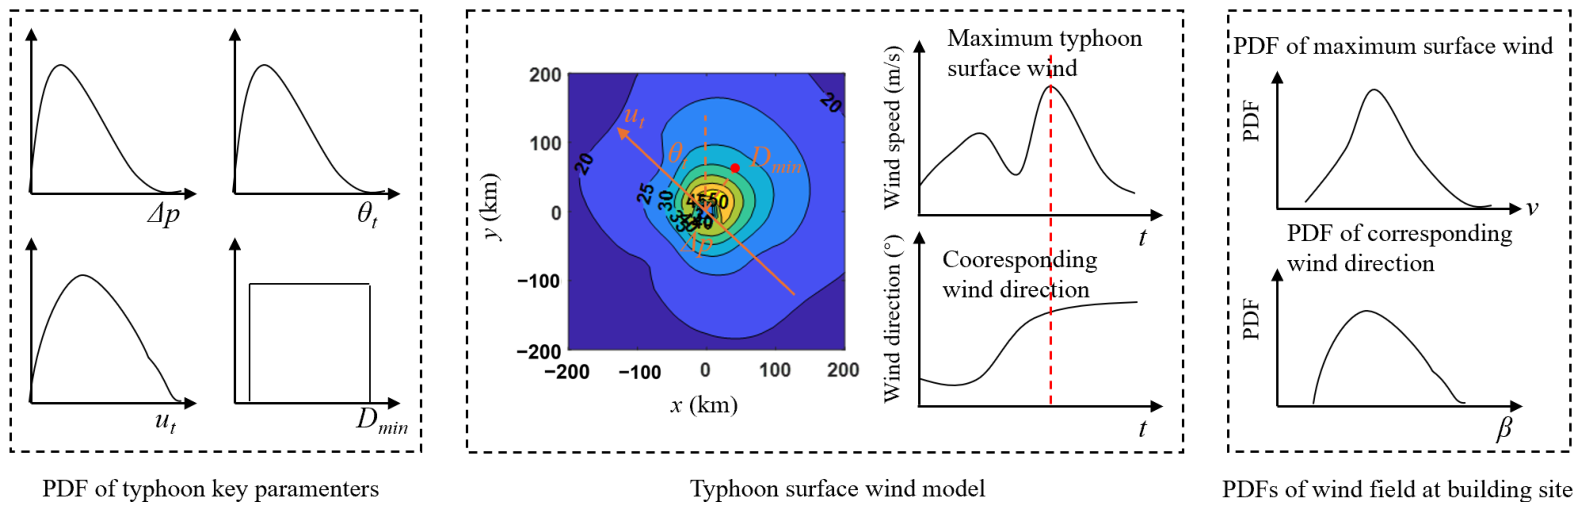
Typhoon tracks are simulated based on the parameterized probabilistic model introduced in Section 2.2, in conjunction with the annual occurrence rate of typhoons affecting the Shenzhen area [43]. Figure 6 presents an example of a simulated typhoon track from a single realization and the circular subregion centered on the target site in Shenzhen. The historical best-track data of typhoon Mangkhut [52] are used to drive the wind field simulation. Typhoon hazard is evaluated using a simulation-based wind hazard assessment approach, which propagates the uncertainty in key typhoon parameters through the typhoon surface wind model to quantify the resulting uncertainty in wind speed. In this study, the surface wind refers to the 10-min mean wind speed at a height of 10 m. Because the analysis is conducted for a single site, the local-track method is adopted, and its main procedure is shown in Figure 7. The key typhoon parameters include the translational speed u t , heading angle θ t , minimum distance from the typhoon center and the site D m i n , and center pressure difference Δ p . The quantity D m i n is defined as positive when the site lies to the right of the typhoon moving direction, while θ t is measured clockwise from north to the typhoon heading. For specified values of D m i n and θ t , the local typhoon track is represented as a straight line. As the typhoon center moves along this track at speed u t , the time-varying surface wind field can be determined according to the method described in Section 2.2.
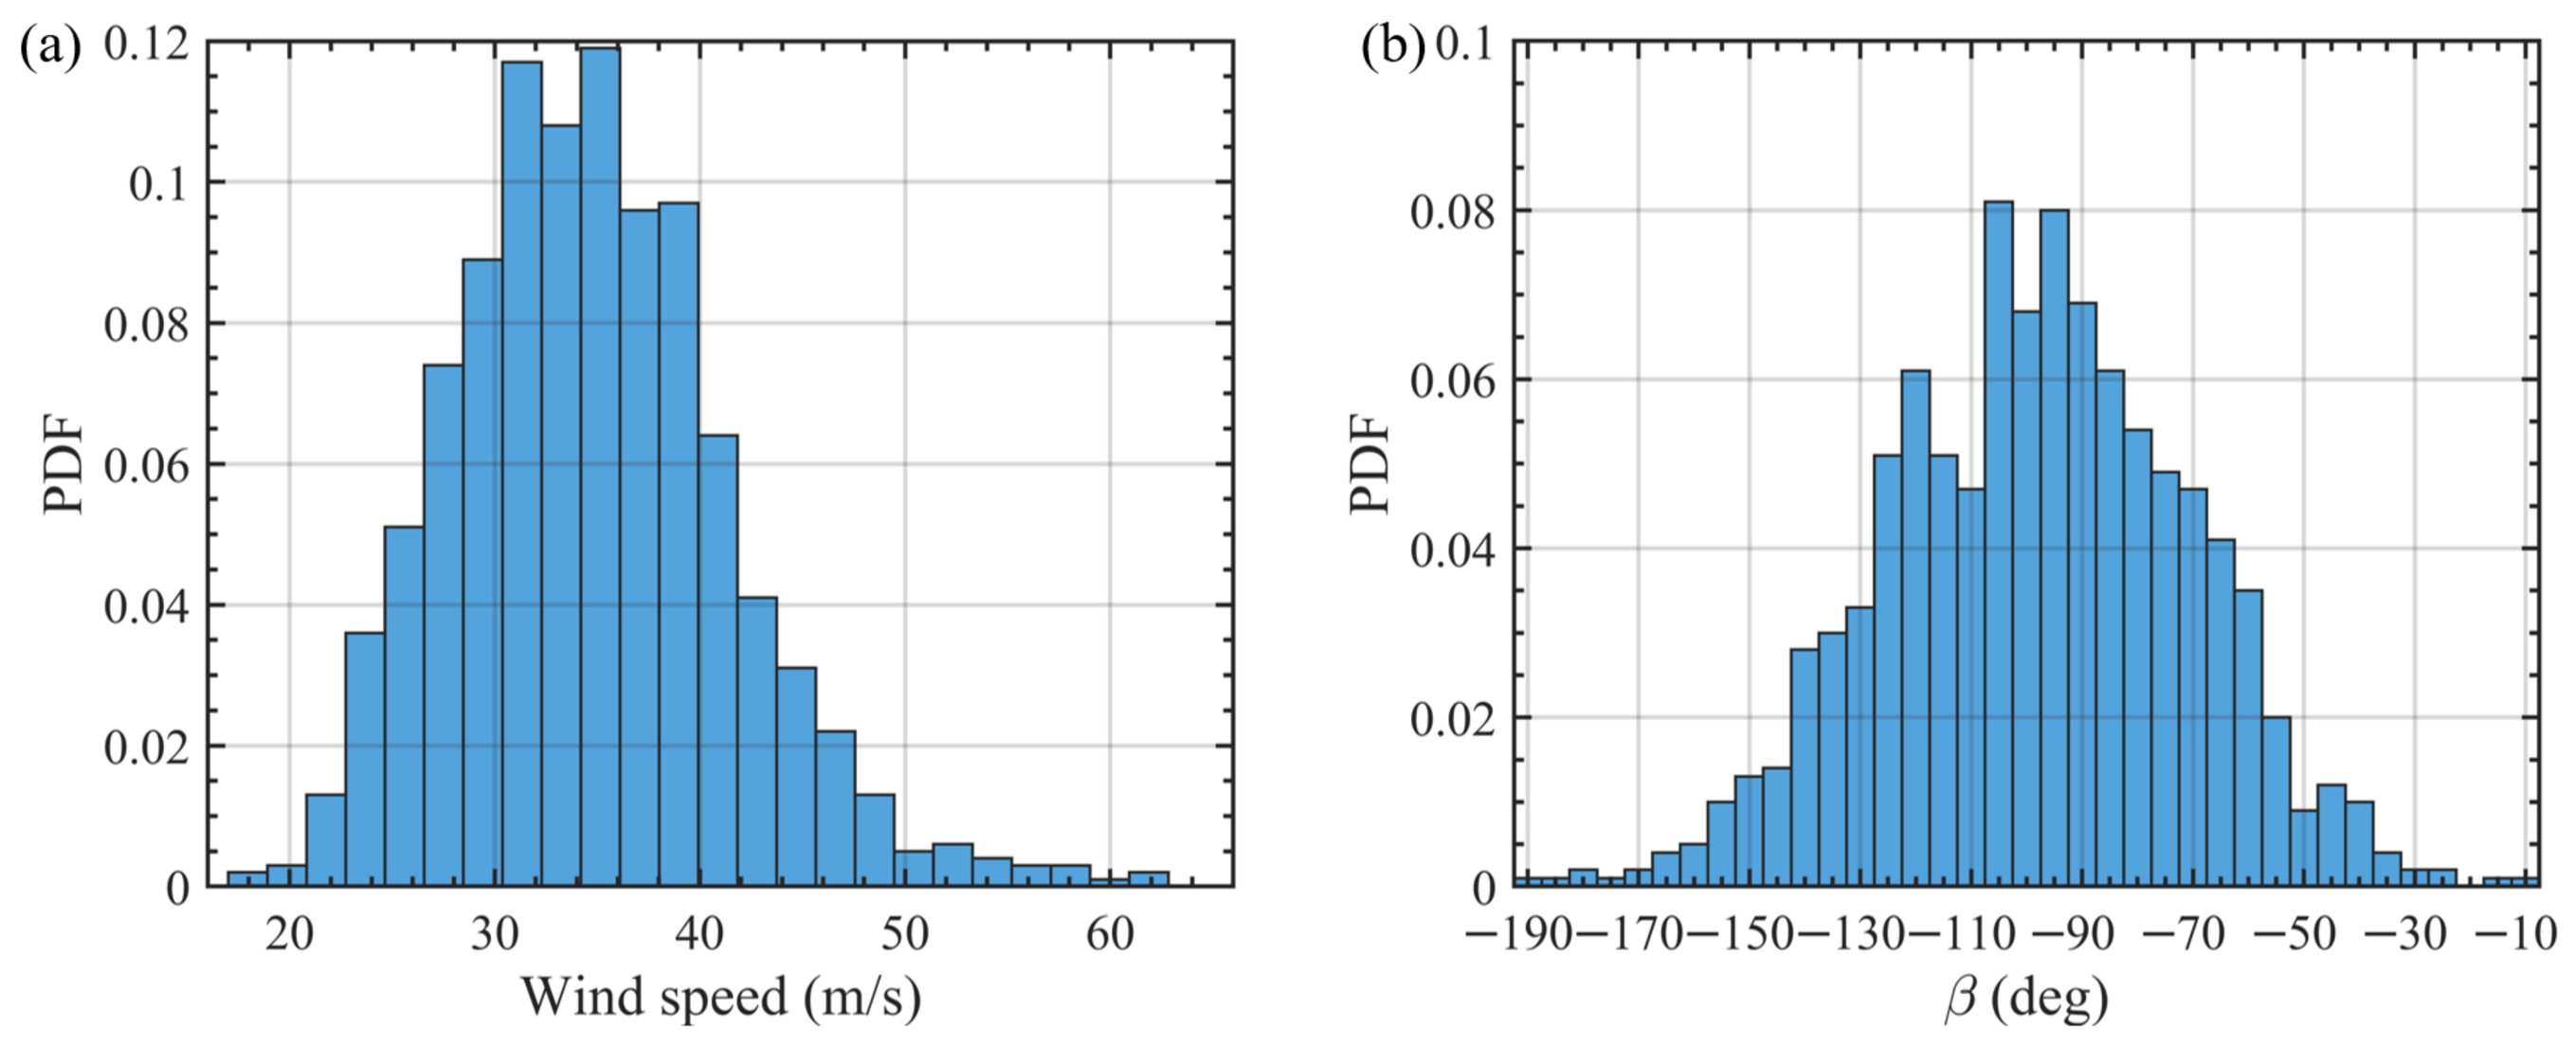
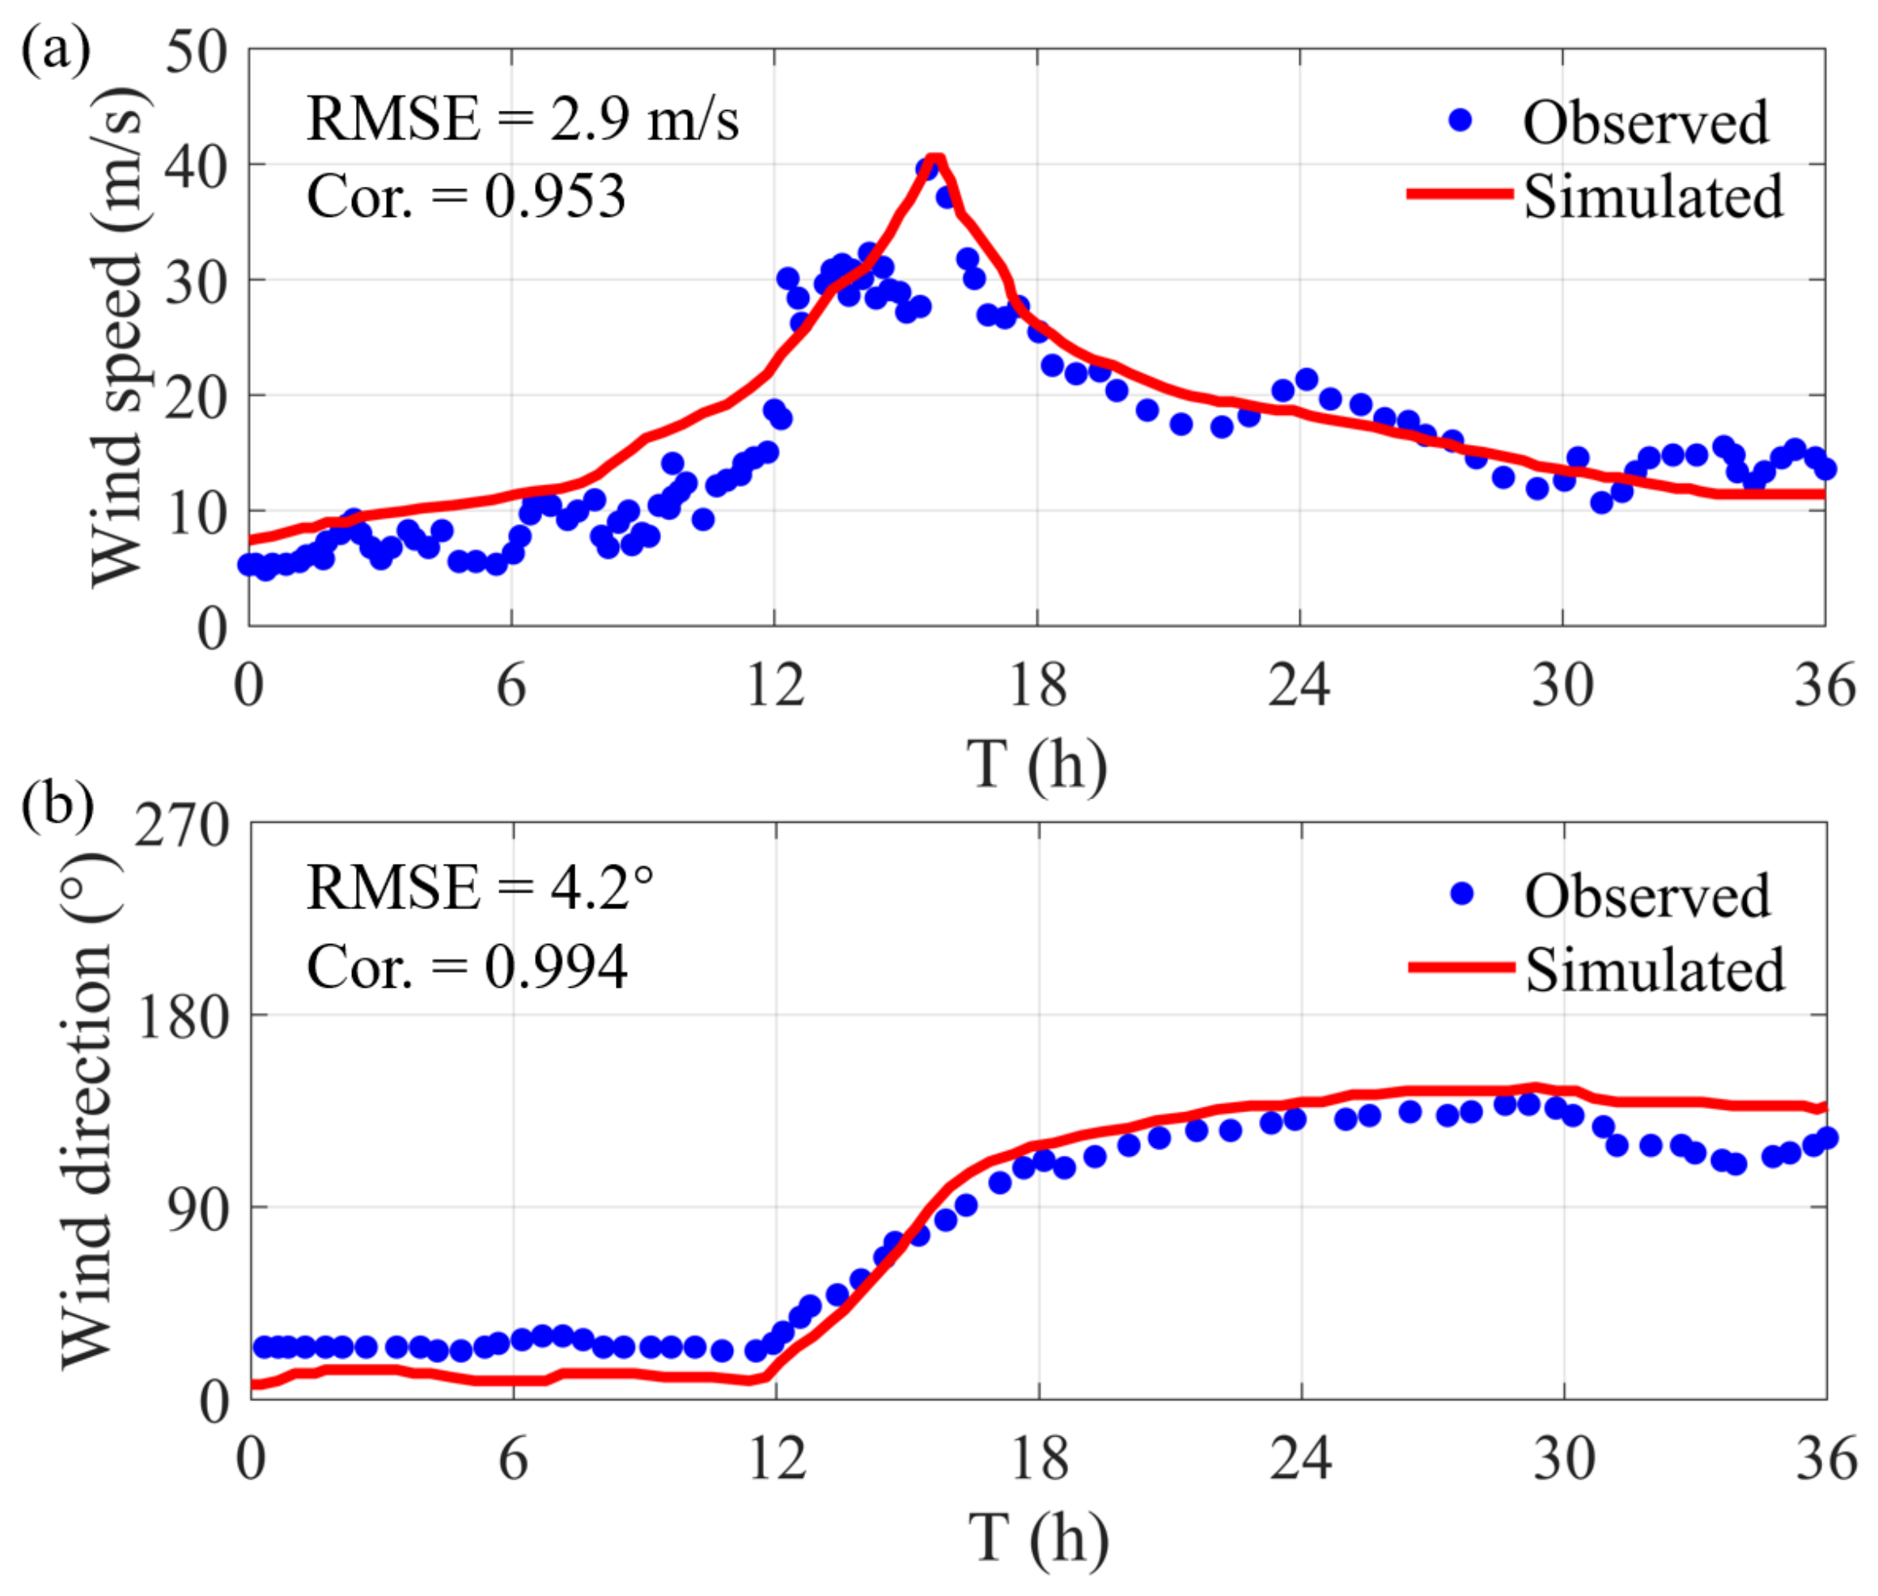
Based on the typhoon hazard modelling procedure and the probability density functions of the key typhoon parameters for Shenzhen reported by Guo et al. [43], Monte Carlo simulations were performed to generate 5000 typhoon samples. For each sample, the maximum wind speed and the corresponding wind direction at the building site were extracted. Figure 8 presents the probability density distributions of the simulated wind speed and wind direction. The simulated wind direction exhibits a clockwise shift from the northwestern sector to the southern sector. To validate the simulated wind field, the predicted wind speed and wind direction are compared with the corresponding field measurements reported by Li et al. [42], collected from 23:00 on 15 September to 11:00 on 17 September 2018, as shown in Figure 9. The simulated time histories of the 10-min mean wind speed and wind direction agree reasonably well with the observations. The root mean square error (RMSE) values for simulated wind speed and wind direction are 2.9 m/s and 4.2°, respectively, with corresponding correlation coefficients of 0.953 and 0.994. It should be noted that validation based on multiple typhoon events would further strengthen the robustness of the wind-field simulation model; however, reliable typhoon wind measurements in the Shenzhen region are currently limited. The adopted model has also been validated in our previous work using field data from Typhoon Hagupit in 2008 [53]. Therefore, the simulated wind field is considered to provide a reasonable representation of the actual typhoon wind conditions at the building site.

3.2.2. Cladding Damage

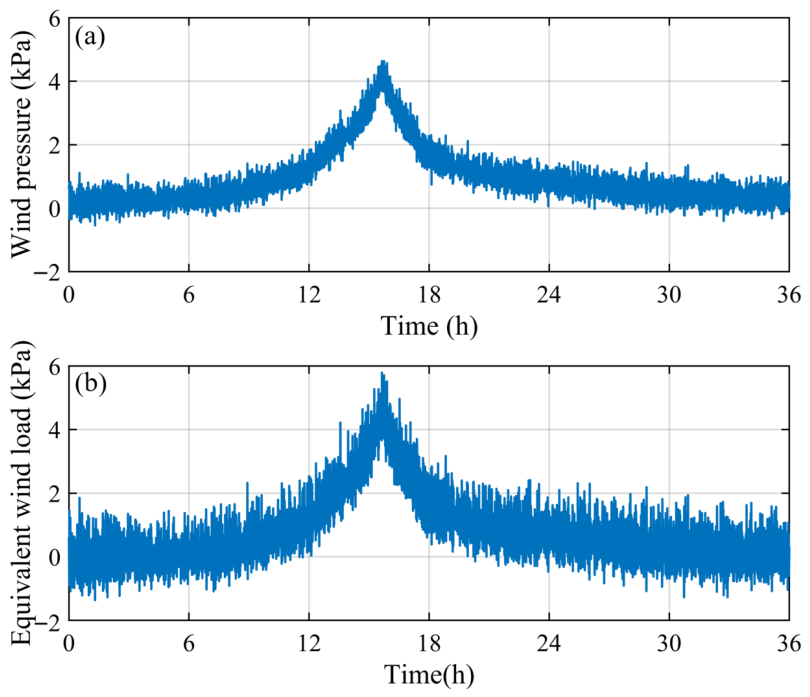
The net pressure time histories acting on each roof unit, defined as the combined effect of the pressures on the upper and lower roof surfaces, can be generated using the method described in Section 2.3. Based on these simulated net pressure histories, the corresponding wind-induced loading acting on each roof cover unit can be quantified over the entire typhoon event. Furthermore, equivalent static wind loads for individual roof units can be derived by additionally accounting for the amplified loading effects associated with wind-induced vibration of the roof-supporting structure. These equivalent loads account for both the local pressure differences across the roof unit and the additional demand transferred from the dynamic response of the supporting structural system under typhoon excitation. As such, they provide a more representative measure of the actual load effects experienced by the supporting members of roof units. The resulting equivalent static wind loads serve as a key basis for assessing whether the roof-supporting structure reaches its damage limit state. Figure 10 presents the time histories of net pressure and equivalent static wind load on a roof unit in a typhoon sample.
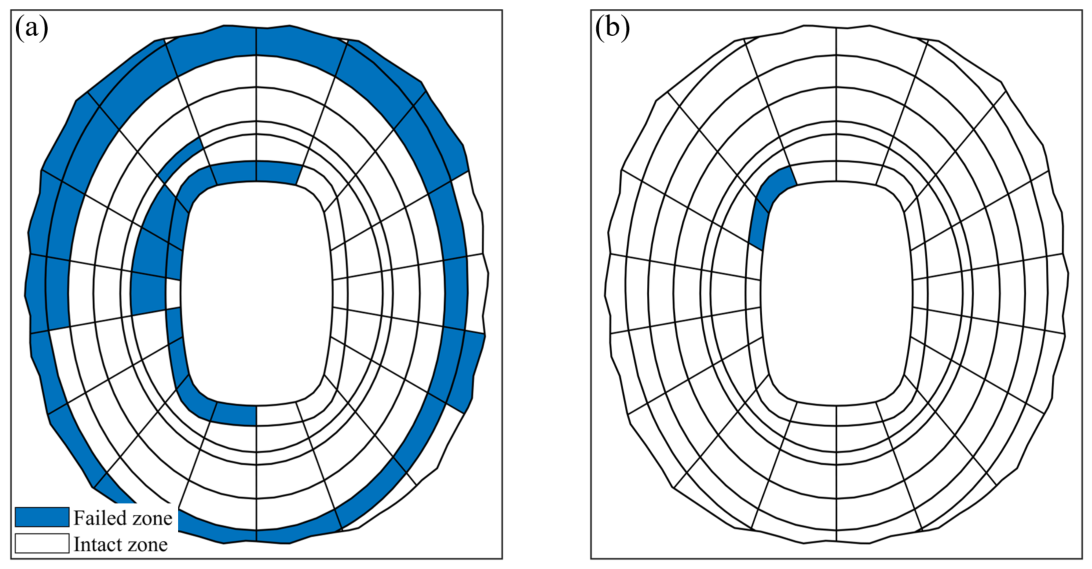
In each simulation run, damage to all roof cover units over the building envelope is assessed at every time step by comparing the simulated wind loads with the corresponding cladding resistance, following the procedure described in Section 2.3.2. Figure 11a presents the resulting spatial distribution of roof cover damage over the building envelope for a representative simulation. Meanwhile, finite element (FE) analyses are performed in each simulation run to identify failure in the roof-supporting structure and to determine the corresponding distribution of structural failure regions. Based on the FE results, the locations and extent of failure in the roof-supporting system can be quantified. Figure 11b shows the distribution of failed regions in the roof-supporting structure obtained from a single simulation run. For the roof cover, failures are mainly observed along the windward leading-edge regions on both the outer and inner sides of the roof. These failures are primarily caused by the strong suction generated by flow separation and are therefore dominated by extreme wind-pressure effects. By contrast, damage to the roof-supporting structure is mainly concentrated on the inner side of the roof, where strong fluctuating pressures coincide with relatively large structural vibration responses. This combined effect amplifies the equivalent wind loads acting on the roof-supporting system, thereby increasing the likelihood of structural damage in this region.
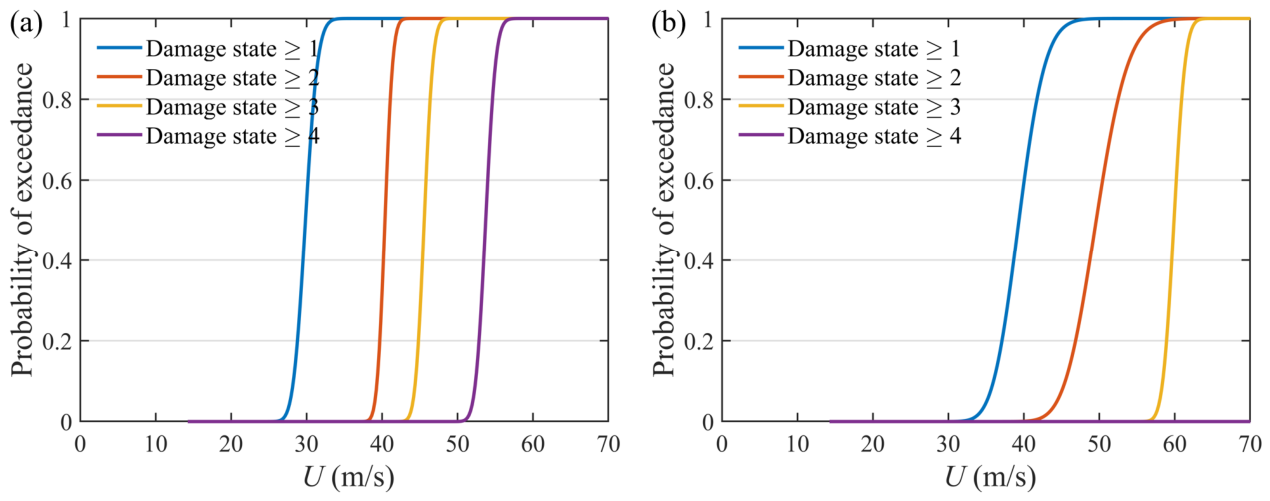
Figure 12 shows the fragility curves of both the roof cover and the roof-supporting structure, from which it can be observed that the probability of exceedance increases monotonically with wind speed U at 10-m height, indicating that the probability of exceeding each damage state rises significantly as the typhoon intensity increases. All curves exhibit a steep sigmoidal shape, suggesting that the exceedance probability transitions rapidly from nearly zero to nearly one within a relatively narrow wind speed range. This reflects the existence of clear wind-speed thresholds for the initiation and development of structural damage. For the roof cover, the fragility curves shift progressively toward higher wind speeds from Damage State ≥ 1 to Damage State ≥ 4. The exceedance probability of Damage State ≥ 1 increases sharply at around 30 m/s, indicating that the roof cover is highly sensitive to wind loading and is likely to be the first damaged component. More severe damage states occur only at higher wind speeds, reflecting a clear progressive damage process as typhoon intensity increases. For the roof-supporting structure, the fragility curves are generally shifted to the right relative to those of the roof cover, indicating that higher wind speeds are required to reach the same damage exceedance probability. The wider transition intervals for lower and intermediate damage states suggest a more gradual damage evolution, reflecting the structural redundancy and load-carrying capacity of the supporting system. The absence of a distinct curve for Damage State ≥ 4 further indicates that severe failure of the roof-supporting structure is unlikely under the considered hazard scenario and may occur only under more extreme wind conditions.
To further quantify the fragility characteristics shown in Figure 12, the fitted lognormal parameters of each fragility curve are summarized in Table 4. The median wind speed U 50 , k represents the wind speed at which the exceedance probability of Damage State ≥ k reaches 50%, while β k describes the dispersion of the fragility curve in logarithmic wind-speed space. the larger U 50 , k values of the roof-supporting structure reflect the higher load-carrying capacity and redundancy of the primary structural system. The smaller β k values for several roof-cover damage states also indicate a sharper damage transition, implying that once the critical wind-speed range is reached, the probability of damage may increase rapidly.
Overall, the results clearly show that the roof cover is substantially more vulnerable than the roof-supporting structure. This finding is consistent with the typical failure sequence observed in large-span roof structures under strong winds, where non-structural envelope components are damaged prior to major structural members. It also highlights that, in typhoon risk assessment and resilience analysis, particular attention should be paid to the vulnerability of roof cover components and their contribution to the degradation of overall building functionality.
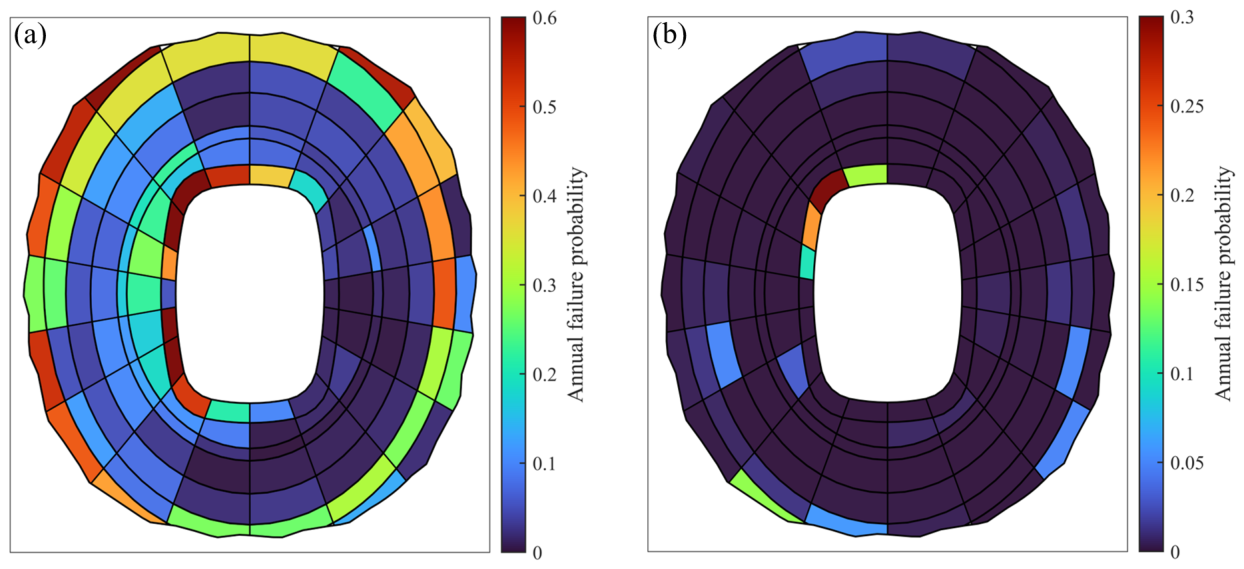
The annual failure probability of each roof cover unit and the roof-supporting structure over the entire building roof can be obtained by integrating the results from all simulation runs, as presented in Figure 13. It should be noted that the annual occurrence rate of typhoons in Shenzhen is derived using a negative binomial distribution proposed by Guo et al. [43], based on the typhoon database provided by CMA [52].
As shown in Figure 13, roof cover damage is generally more likely to occur along the roof edges, particularly around the inner edge region of the cantilevered grandstand roof. The high-risk regions are mainly concentrated on the western side of the roof. The high-risk zones are predominantly located on the western side of the roof. This spatial pattern is closely related to the prevailing southeasterly winds at the building site. Under this wind direction, flow separation and vortex formation near the windward and side-edge regions can induce strong suction and pronounced pressure fluctuations. These effects increase the likelihood of local cladding failure, particularly in edge and corner regions where the roof cover is more directly exposed to extreme aerodynamic actions.
The roof-supporting structure shows a substantially lower annual failure probability than the roof cover, reflecting the higher resistance and redundancy of the primary structural system. However, its vulnerable zones are also concentrated near the inner edge of the cantilevered roof. This pattern results from the coupled effect of aerodynamic loading and structural dynamic response. In these regions, strong fluctuating pressures coincide with relatively large structural flexibility, which amplifies the equivalent wind loads transmitted to the supporting system. Therefore, although the supporting structure is globally more robust, local dynamic amplification can still lead to elevated failure probabilities in these critical regions.

3.2.3. Functionality, Recovery and Resilience

Following the typhoon events at t = t 0 , the post-event building functionality is assessed based on the damage states of the roof cover and the roof-supporting structure. The functionality and recovery models, together with the simulation procedures described in Section 2.4 and Section 2.5, are then used to characterize the recovery trajectories of the roof cover, roof-supporting structure, and overall building. This allows the post-event functionality loss, recovery process, and resilience performance to be assessed under different damage scenarios.
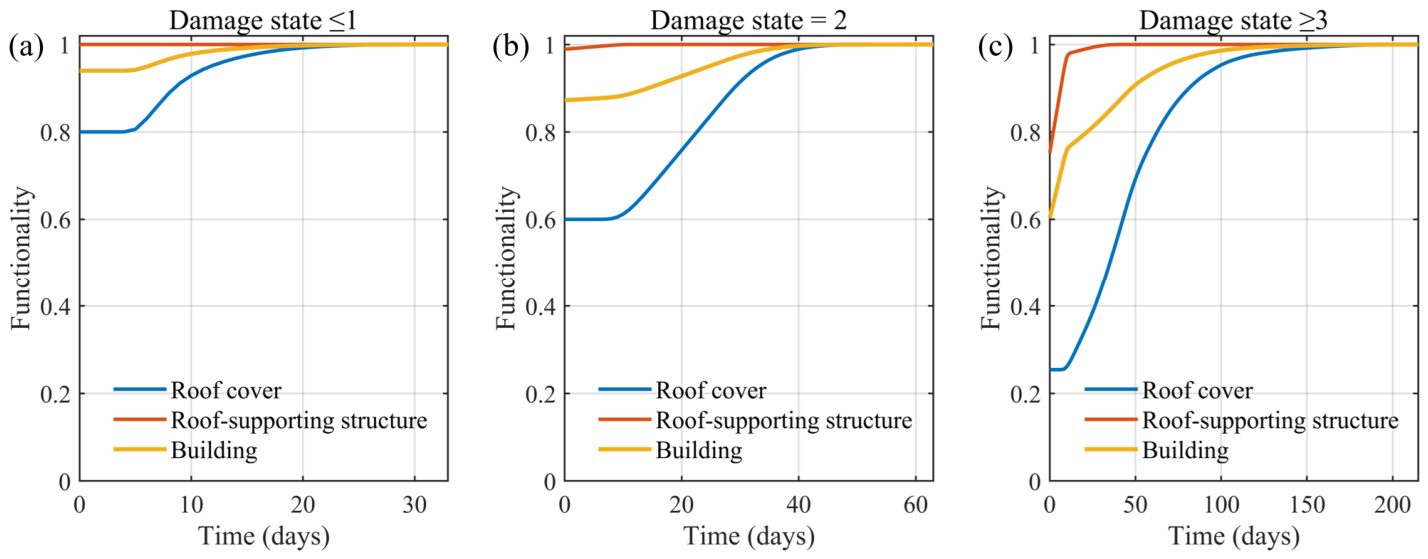
Figure 14 presents the mean functional recovery curves of the roof cover, roof-supporting structure, and the overall building under different damage states. Overall, the recovery duration increases markedly with increasing damage severity, while the initial post-event functionality decreases correspondingly. For the cases with slight damage (damage state ≤ 1), the functionality of the roof-supporting structure remains close to 1.0 and that of the overall building stays above 0.9, indicating that only limited functional disruption is induced and that full recovery can be achieved within a short period. In this case, the roof cover recovers to its pre-event functional state in approximately 20 days. For the moderate-damage cases (damage state = 2), the initial functionality of the roof cover decreases more noticeably, and the recovery process becomes more prolonged, which in turn leads to a moderate reduction in the overall building functionality during the early post-event stage. The roof-cover recovery duration extends to approximately 40 days, representing an increase of about 100% relative to the slight-damage cases. In contrast, for the severe-damage cases (damage state ≥ 3), the roof cover exhibits a substantial initial functional loss and requires a much longer repair period of roughly 150–160 days. This corresponds to an increase of approximately 400% relative to the moderate-damage cases and about 800% relative to the slight-damage cases. As a result, the recovery of overall building functionality is significantly delayed. The time required to approach full functionality increases from about 15 days in slight-damage cases to around 40 days in moderate-damage cases, and exceeds 100 days in severe-damage cases. By comparison, the roof-supporting structure generally shows a smaller functional degradation and a faster restoration process than the roof cover. Even in the severe-damage cases, its functionality rises rapidly to near 1.0 within roughly 25–30 days. This indicates that, within the present recovery framework, the roof-cover damage and its associated repair time dominate the overall recovery trajectory of the building.
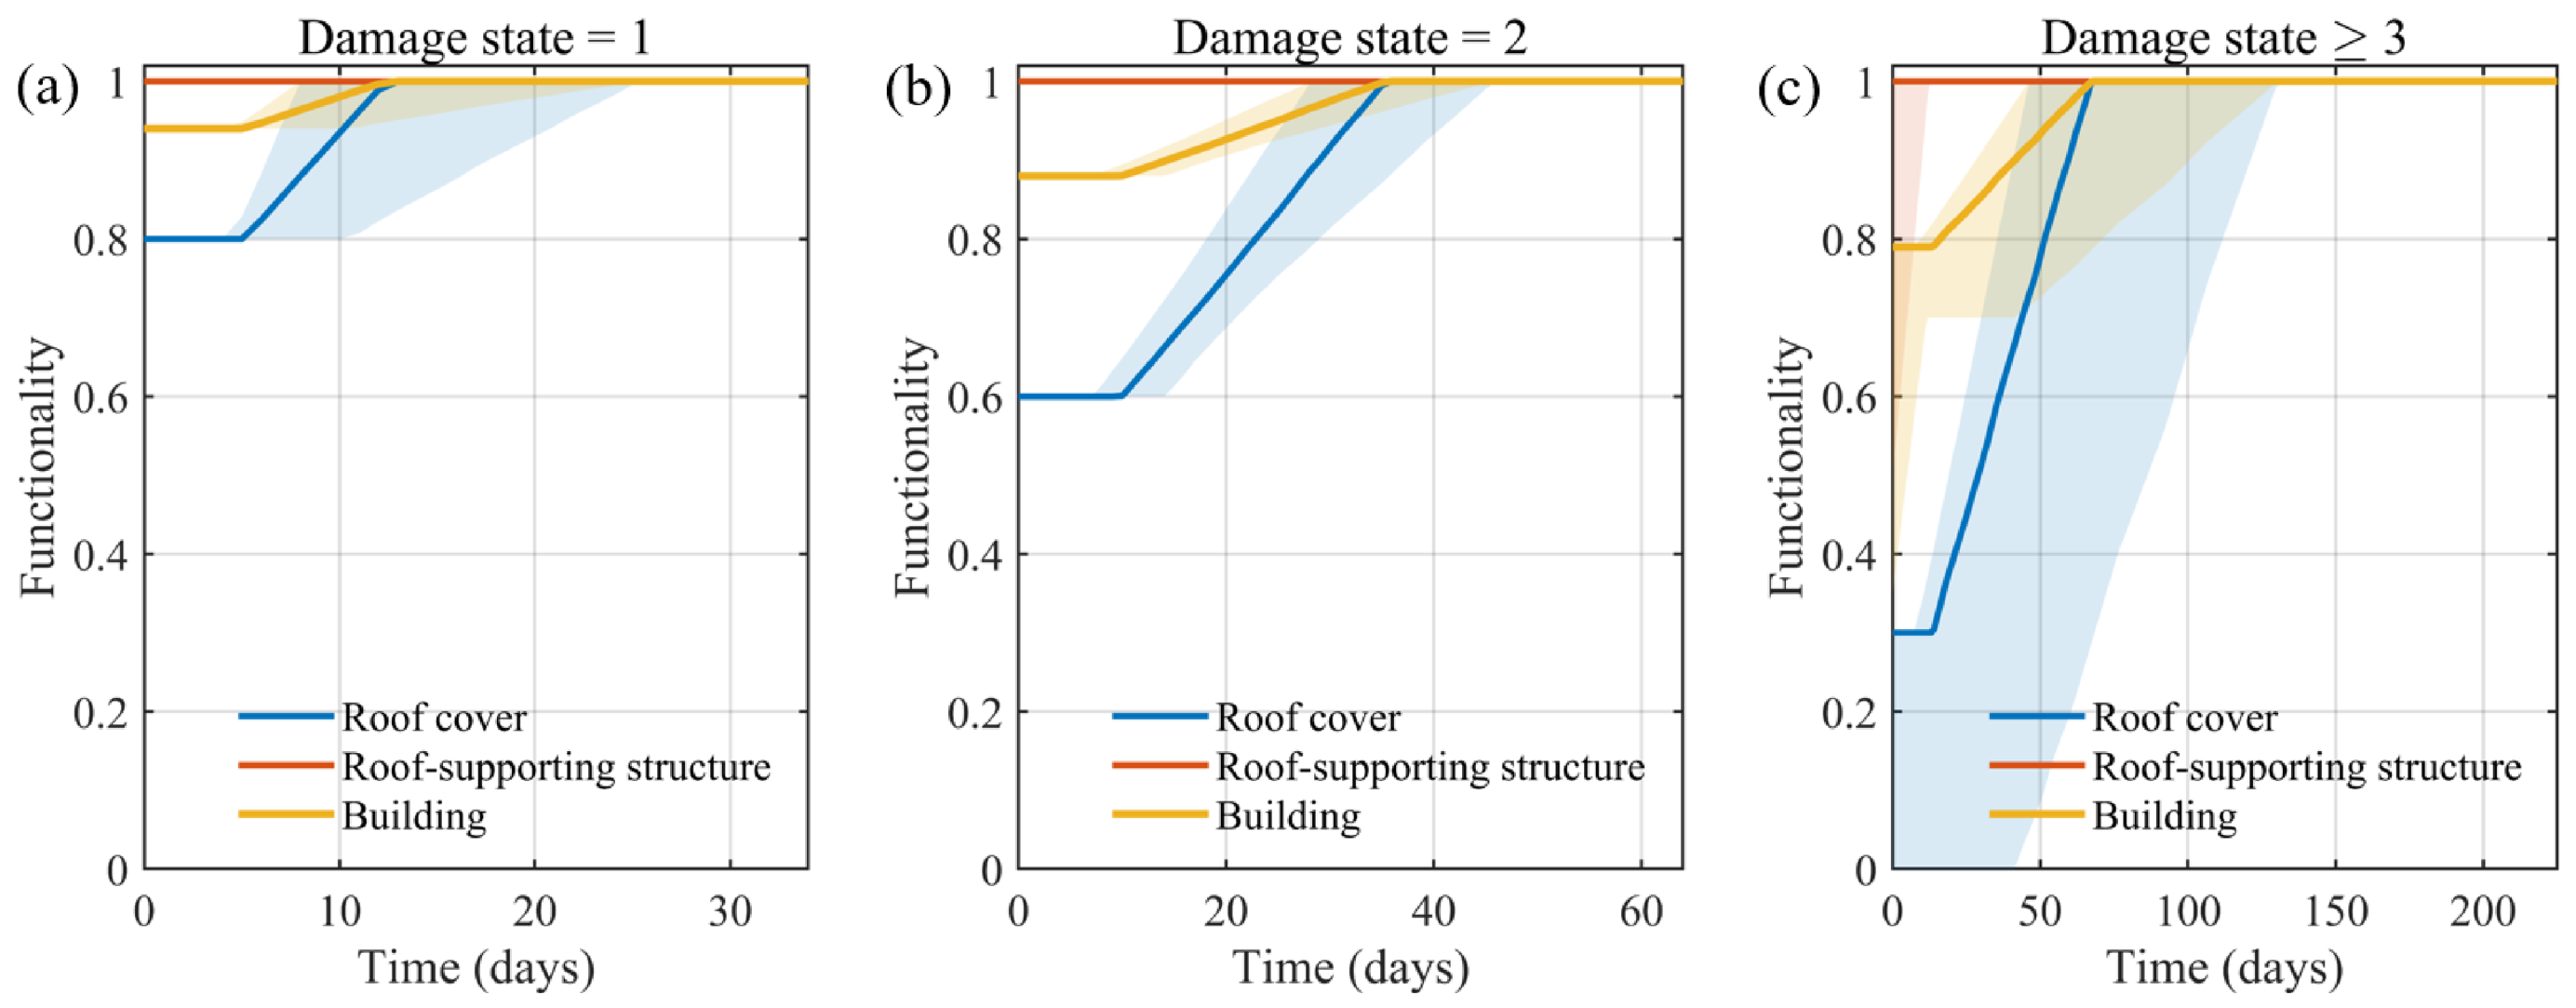
To quantify the uncertainty induced by stochastic repair times, Figure 15 presents the recovery curves at the 5th, 50th, and 95th percentile levels. The shaded bands indicate the range between the 5th and 95th percentiles, while the solid lines represent the median recovery trajectories. The results show that the uncertainty in the recovery trajectory increases with damage severity. For damage state 1, the percentile bands are relatively narrow, suggesting a stable recovery process. In contrast, for damage state ≥ 3, the percentile bands become much wider, indicating that severe damage results in greater uncertainty in both recovery duration and functionality restoration. This is primarily caused by the larger COVs assigned to more severe damage states, which increase the variability of repair-time samples. Therefore, repair-time uncertainty can substantially affect the recovery process and the resulting resilience estimates under severe damage conditions. In addition, the mean recovery curves shown in Figure 14 are generally consistent with the median recovery trajectories in Figure 15, suggesting that the adopted recovery model can capture the central tendency of the recovery process. However, the repair-time parameters used in this study are not calibrated against empirical post-disaster repair data, which is a limitation of the present model. Future studies should incorporate field-based repair records to further calibrate the repair-time distributions and reduce the uncertainty in resilience assessment.
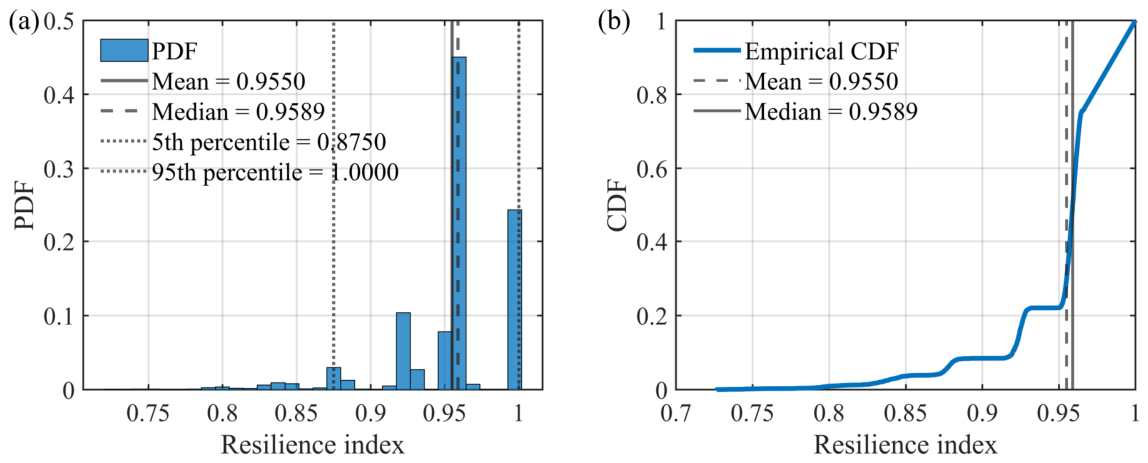
Figure 16 shows the probability density function (PDF) and cumulative distribution function (CDF) of the building resilience index. The resilience values are highly concentrated in the upper range, indicating that the building generally maintains a high level of functionality throughout the recovery process. The mean and median resilience indices are 0.9550 and 0.9589, respectively, suggesting a relatively concentrated distribution with limited skewness. In addition, the 5th percentile is 0.8750, which indicates that even under relatively unfavorable scenarios, the building still retains a considerable degree of resilience. The 95th percentile reaches 1.0, implying that a large proportion of the simulated cases experience only minor functional loss and rapid recovery. Overall, these results demonstrate that the building exhibits strong post-typhoon resilience, while only a small fraction of samples show relatively reduced resilience due to more severe damage and prolonged recovery duration.
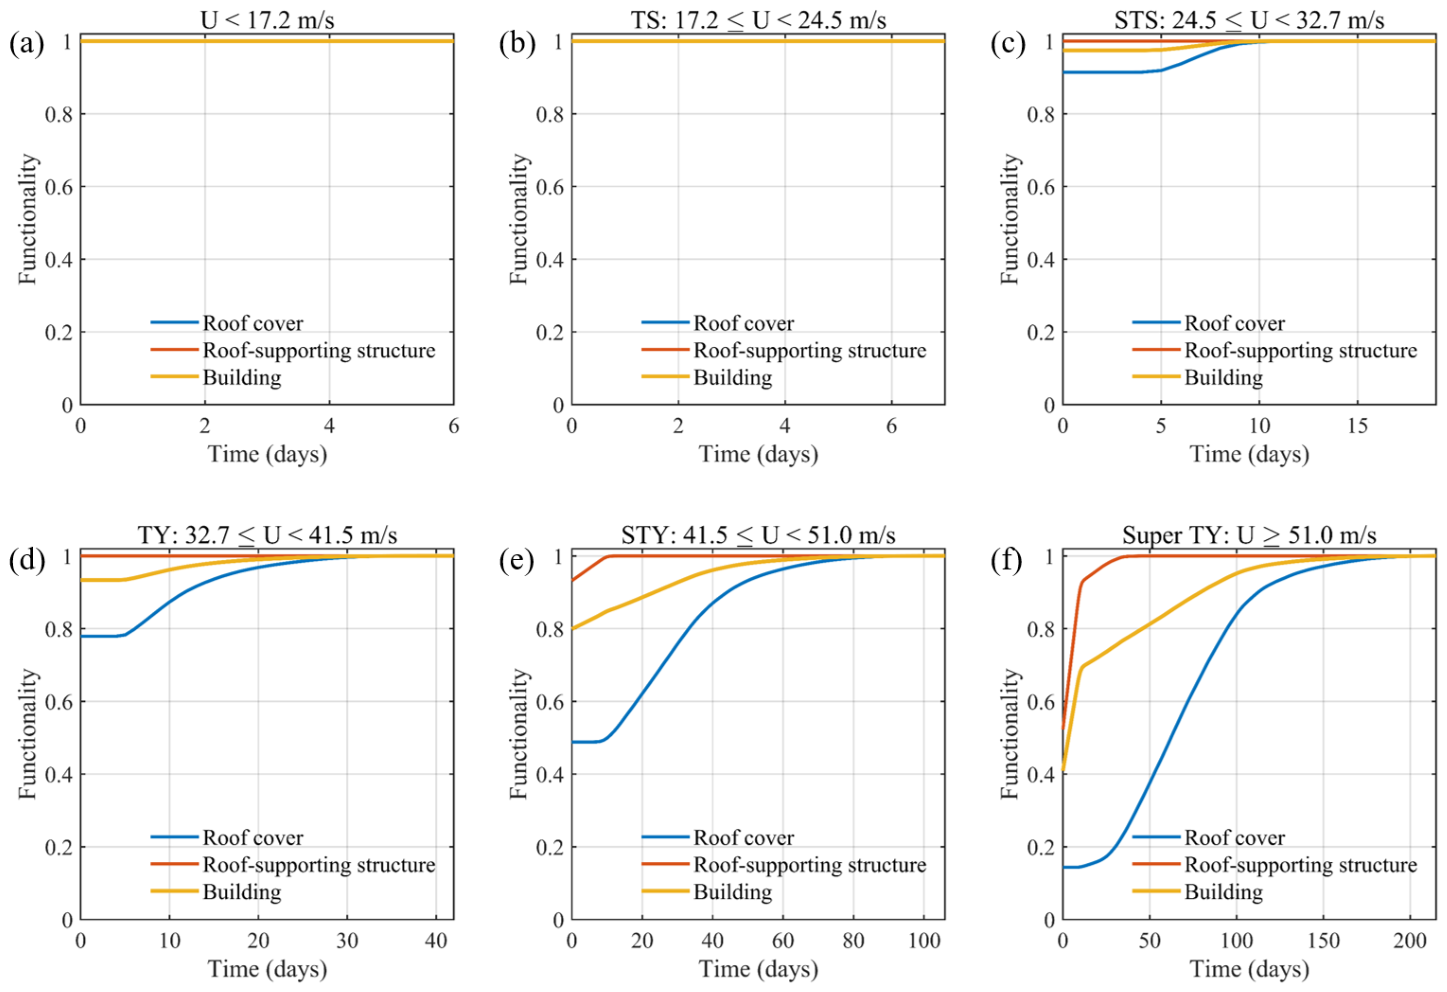
According to the Chinese code GB/T 19201-2006 [54], typhoon hazards can be classified into six categories based on near-surface wind speed, as presented in Table 5. Figure 17 presents the mean functional recovery curves of the roof cover, roof-supporting structure, and the overall building under different typhoon categories. Overall, the initial functionality decreases and the recovery duration increases markedly with increasing typhoon intensity.
For the lower-intensity groups (U < 17.2 m/s and TS), the three functionality curves remain close to 1.0 throughout the recovery period, indicating negligible damage and nearly no recovery demand. For the STS group, only slight roof-cover damage is observed, with the roof-cover functionality decreasing to about 0.9. The overall building functionality remains above approximately 0.97 and recovers within about 10 days. When the typhoon intensity reaches the TY level, the initial functionality of the roof cover decreases to about 0.78, while the overall building functionality drops to around 0.93. The recovery duration also increases to approximately 20–30 days. More pronounced functionality loss is observed in the STY group, where the initial functionality of the roof cover and overall building decreases to about 0.50 and 0.80, respectively, and the recovery duration extends to around 70–80 days. The most severe case occurs under Super TY conditions. In this case, the roof-cover functionality drops to about 0.15, and the overall building functionality decreases to roughly 0.40 immediately after the event. Although the roof-supporting structure recovers relatively rapidly, the roof cover requires about 160–180 days to recover, resulting in a much slower restoration of the overall building functionality.
These results indicate that the recovery process is increasingly governed by the roof cover as typhoon intensity increases. This is mainly because the roof cover has a lower wind-resistance threshold and is directly exposed to extreme local suction, pressure fluctuations, and edge-vortex effects. Once roof-cover damage becomes spatially extensive, recovery is no longer controlled only by the repair time of individual components. It is also affected by damage inspection, temporary protection, replacement material availability, and the accessibility of distributed damaged areas. Therefore, high-intensity typhoons can produce a disproportionate increase in recovery duration, even when severe damage to the main supporting structure is limited.
From an engineering perspective, these findings suggest that improving the wind resistance and repairability of roof-cover systems is critical for enhancing post-typhoon resilience. Particular attention should be paid to edge and corner regions, where local suction and cladding failure are more likely to initiate. Measures such as strengthened connections, increased local design wind-resistance capacity, modular replacement of roof-cover units, and pre-positioned repair materials could effectively reduce functionality loss and shorten recovery time. In addition, post-event inspection and emergency repair plans should prioritize roof-cover damage, especially under STY and Super TY scenarios, because this subsystem becomes the main bottleneck controlling overall building recovery.
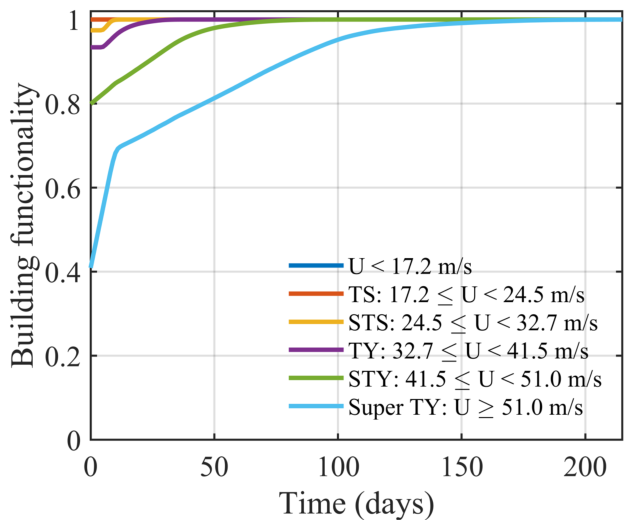
Figure 18 compares the mean building functionality recovery curves under different typhoon categories. It can be found that the building functionality remains close to 1.0 throughout the entire period for the lower-intensity groups, whereas clear divergence appears once the wind intensity reaches the TY level and above. In particular, the Super TY case shows the lowest initial functionality and the longest recovery duration, requiring approximately 160–180 days to approach full recovery. By contrast, the recovery duration is about 70–80 days for the STY group and only around 20–30 days for the TY group. Therefore, compared with the TY case, the recovery time is increased by roughly 2–3 times for STY and by about 5–6 times for Super TY. This confirms that the post-event recovery performance of the building deteriorates rapidly under high-intensity typhoon scenarios.
This rapid increase is mainly attributed to the nonlinear escalation of damage with typhoon intensity. Under stronger wind actions, the roof cover experiences more extensive cladding failure, while the roof-supporting structure may also suffer localized damage due to the combined effects of fluctuating wind pressures and dynamic amplification. As a result, the initial post-event functionality is substantially reduced. In addition, severe damage usually requires longer inspection, planning, material preparation, and repair periods, which further delay the recovery process. These results indicate that the post-event recovery performance of the building deteriorates rapidly under high-intensity typhoon scenarios, especially when damage extends from non-structural roof components to the supporting structural system.

3.3. Discussion

Based on the preceding analysis, the proposed resilience assessment framework can reasonably capture the post-typhoon recovery capacity of large-span buildings by linking typhoon-induced damage, functionality loss, and subsequent recovery processes. Nevertheless, its direct application in engineering practice still requires careful determination of several key parameters, such as functionality weights, preparation time, repair time, and recovery-related parameters, as summarized in Table 6. These parameters may not only affect the shape of the recovery curve but also influence the calculated resilience index. Owing to the limited availability of field observations and statistical data on post-typhoon damage and recovery of large-span buildings, the recommended values adopted in this study are mainly determined based on existing literature, code provisions, and preliminary engineering statistics. To further examine the influence of parameter uncertainty on the assessment results, this section conducts a sensitivity analysis of the key parameters and discusses the limitations of the proposed framework in terms of parameter selection, model assumptions, and engineering applicability. This discussion is expected to provide useful guidance for future model calibration and practical implementation.
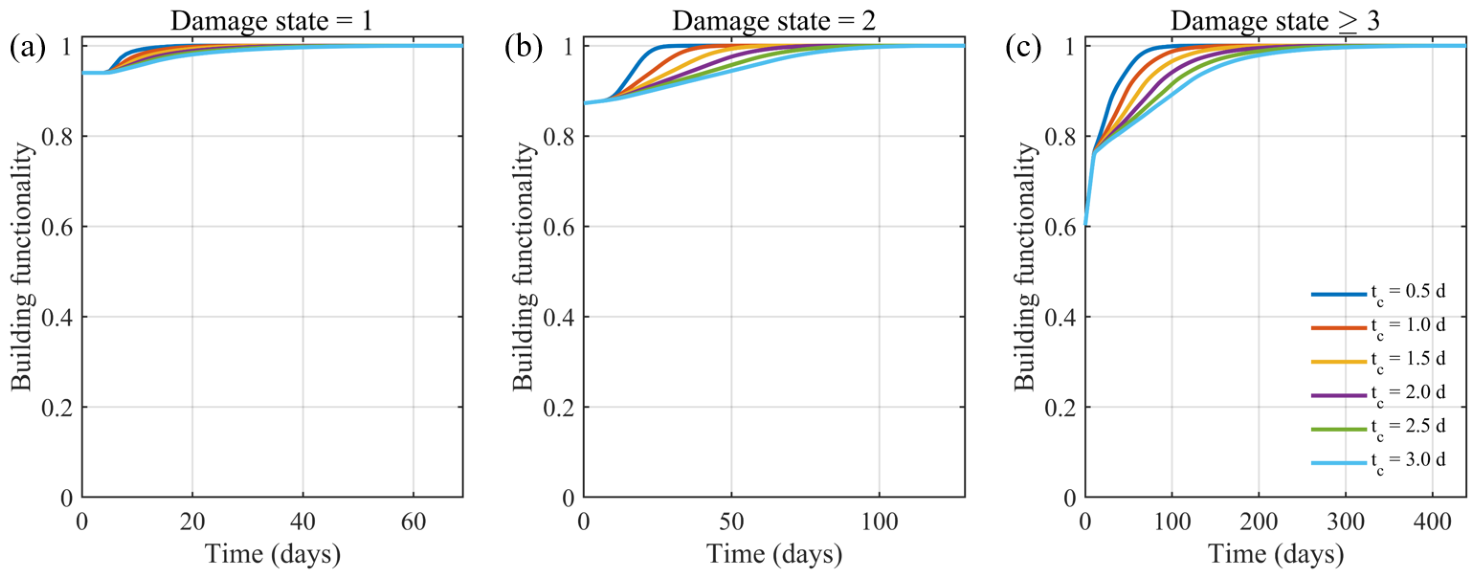
A sensitivity analysis of the repair time required for an individual roof-cover unit, t c , is conducted to evaluate its influence on the building resilience index and the post-disaster recovery process. As summarized in Table 7, the effect of t c on the overall resilience index is relatively limited, with the maximum difference among the tested cases being approximately 1.5%. Nevertheless, Figure 19 indicates that variations in t c can noticeably affect the recovery efficiency of the roof-cover system and, consequently, the evolution of overall building functionality. Specifically, a smaller t c accelerates the restoration of roof-cover units, leading to a steeper recovery curve and a shorter recovery duration. When the roof damage level is relatively low, only a small number of roof-cover units require repair, and the influence of t c on the recovery trajectory is therefore marginal. However, as the damage level increases, the recovery process becomes more sensitive to t c , because the accumulated repair demand of damaged roof-cover units becomes more significant.
Therefore, although the influence of t c on the final resilience index is not dominant in the present cases, its accurate determination remains important for describing the time-dependent recovery process, especially under moderate-to-severe roof damage scenarios. In this study, t c = 1 day is adopted based on available engineering experience and reference values reported for other building types [28], providing a reasonable first-order estimate for the repair efficiency of individual roof-cover units. Nevertheless, this parameter is still subject to uncertainty, since the actual repair time may vary with roof-cover material, damage severity, accessibility, labor availability, weather conditions, and post-disaster resource allocation. Future work should therefore incorporate more field survey data, engineering repair records, and building-specific maintenance information to further calibrate t c and improve the reliability of resilience assessment for practical engineering applications.
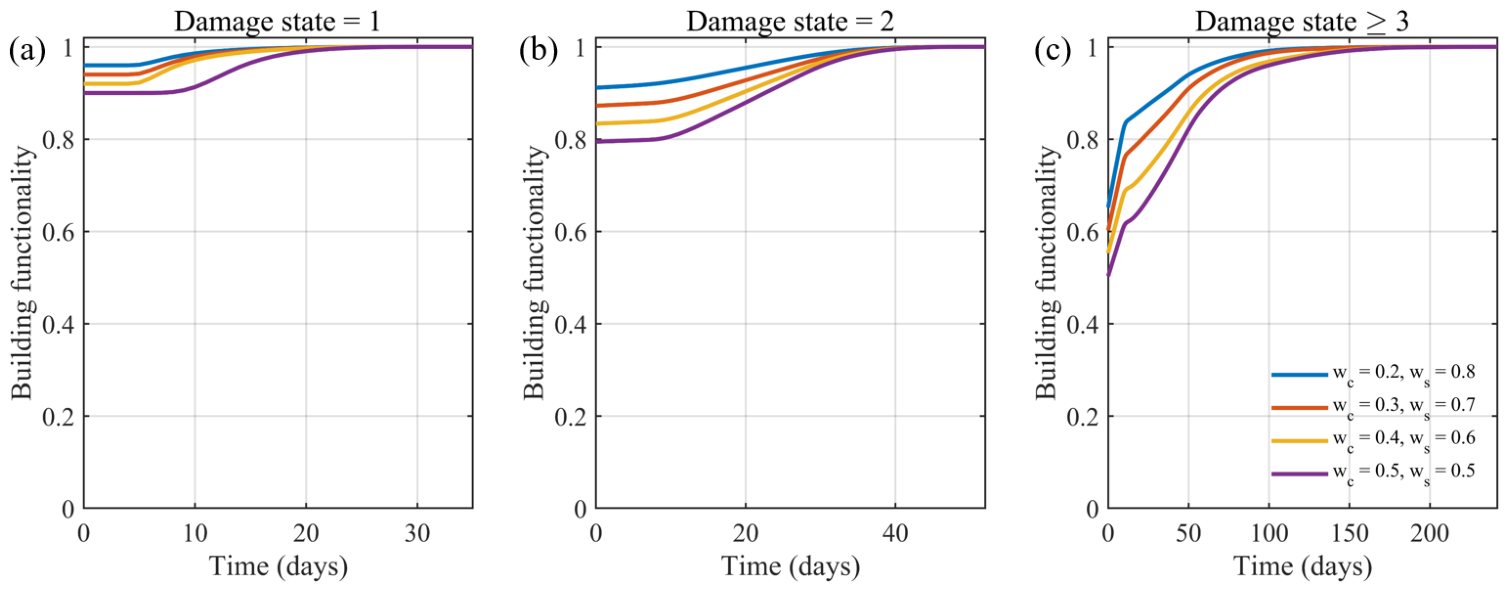
A sensitivity analysis is further conducted to examine the influence of the weighting assumptions assigned to the roof-cover system and the roof-supporting structure. As shown in Table 8, the weighting factors have a limited effect on the mean and median values of the resilience index, but a more pronounced influence on the 5th percentile value, indicating that the lower-tail resilience performance is more sensitive to the assumed functionality contribution of different components. When the weights of the roof cover and roof-supporting structure become closer, the resilience index exhibits a more dispersed distribution, because the variability associated with roof-cover damage and repair contributes more significantly to the overall functionality loss and recovery. The recovery curves in Figure 20 further show that changing the weighting factors does not substantially alter the total recovery duration, which is mainly controlled by the completion of component repair. Instead, the weighting assumptions primarily affect the recovery rate of building functionality at different stages.
In this study, weights of 0.3 and 0.7 are assigned to the roof-cover system and the roof-supporting structure, respectively. This combination is considered reasonable because the supporting structure plays a dominant role in maintaining global safety, load transfer, and overall serviceability, while the roof-cover system mainly affects enclosure integrity and local functionality. Thus, the adopted weighting scheme reflects the relative functional importance of these two subsystems, while still explicitly accounting for the effect of roof-cover damage on post-typhoon recovery. Nevertheless, further calibration based on expert judgment, post-disaster surveys, and building-specific functional requirements is still needed in future applications.

4. Conclusions

This paper presented a resilience assessment framework for a large-span stadium subjected to typhoon-induced wind hazards. Probabilistic parametric models were employed to simulate synthetic typhoon tracks and the corresponding spatiotemporal wind field at the building site. Progressive damage to the roof cover was assessed probabilistically by considering fluctuating external pressures as well as internal pressure variations induced by damage evolution, while the damage to the roof-supporting structure was evaluated based on equivalent wind loading and structural resistance. On this basis, a functionality assessment approach was developed by incorporating both roof-cover damage and functional loss of the roof-supporting structure at the building level. A time-dependent recovery model was further established for the roof cover, roof-supporting structure, and the overall building, explicitly accounting for pre-repair preparation, repair duration, and repair sequencing, thereby enabling resilience quantification for the entire typhoon-induced damage-and-recovery process. The main conclusions can be summarized as follows:
(1)
The roof cover is much more vulnerable than the roof-supporting structure under typhoon wind hazards and therefore governs the overall damage evolution of the building. The fragility results show that slight roof-cover damage begins to increase rapidly at around 30 m/s, whereas the fragility curves of the roof-supporting structure are consistently shifted to higher wind-speed ranges. The annual failure probability distributions also indicate that the most vulnerable regions of both systems are concentrated near the inner edge of the cantilevered roof, but the annual failure probability of the roof-supporting structure is substantially lower than that of the roof cover.
(2)
Building recovery is highly sensitive to damage severity, and the roof-cover repair process is the dominant factor controlling post-event functionality restoration. For slight-damage cases, the roof cover recovers within about 20 days, while the corresponding recovery duration increases to about 40 days for moderate damage and to roughly 150–160 days for severe damage, representing increases of about 100% and 800%, respectively, relative to the slight-damage cases. By contrast, even under severe-damage scenarios, the roof-supporting structure generally recovers to near-full functionality within about 25–30 days, confirming that delayed building recovery is primarily caused by roof-cover damage rather than by the recovery of the main supporting system.
(3)
The building exhibits generally high resilience under the considered typhoon scenarios, although a small proportion of severe-damage cases still lead to noticeable resilience reduction. The resilience index is strongly concentrated in the high-value range, with a mean of 0.9550, a median of 0.9589, a 5th percentile of 0.8750, and a 95th percentile of 1.0. These results indicate that the building can maintain a relatively high average functionality throughout the recovery process in most simulated cases, while the lower tail of the distribution corresponds mainly to cases with severe roof-cover damage and prolonged repair duration.
(4)
Typhoon intensity has a strongly nonlinear effect on post-event functionality loss and recovery time, especially once the wind intensity reaches the typhoon level and above. For the STS category, the overall building functionality remains above about 0.97 and full recovery is achieved within about 10 days; in the TY category, the initial building functionality decreases to around 0.93 and the recovery duration extends to about 20–30 days; in the STY category, the initial functionality drops further to about 0.80 and the recovery duration increases to approximately 70–80 days. Under Super TY conditions, the initial building functionality decreases sharply to about 0.40 and the recovery period reaches about 160–180 days, which is roughly 2–3 times that of the STY case and about 5–6 times that of the TY case.
It should also be noted that the functionality recovery trajectories and resilience indices were not validated against empirical post-typhoon recovery data, because such data are currently unavailable for the investigated large-span stadium. Therefore, the recovery and resilience results should be interpreted as scenario-based estimates under the proposed modelling assumptions. Future work will incorporate observed post-disaster repair and recovery records when available to further validate and refine the proposed framework. The wind-field model in this study was validated using only one historical typhoon event due to the limited availability of complete observation data. Although the validation results provide preliminary support for the reliability of the adopted modeling approach, further verification based on additional historical typhoon records is still necessary. Future studies will incorporate more typhoon events with different tracks, intensities, landing locations, and wind-field characteristics to strengthen the hazard-model validation and improve the robustness of the proposed resilience assessment framework for engineering applications.

Author Contributions

Conceptualization, L.W. and J.L.; methodology, Y.Y., J.Z. and Y.L.; software, Y.L.; validation, S.L. and Z.Z.; formal analysis, L.W. and J.L.; investigation, L.W. and J.L.; resources, Y.Y.; data curation, L.W. and J.L.; writing—original draft preparation, L.W. and J.L.; writing—review and editing, Y.Y. and J.Z.; visualization, S.L. and Z.Z.; supervision, L.W. and J.L.; project administration, L.W. and J.L.; funding acquisition, L.W. and J.L. All authors have read and agreed to the published version of the manuscript.

Funding

This research was funded by the Shenzhen Sustainable Development Science and Technology Project, grant number KCXFZ20211020165543004, and Guangdong Special Support Plan, grant number 2023TQ07G906.

Data Availability Statement

The original contributions presented in the study are included in the article, further inquiries can be directed to the corresponding author.

Conflicts of Interest

The authors declare no conflicts of interest.

References

  1. Guo, Y.; Hou, Y.; Liu, Z.; Du, M. Risk prediction of coastal hazards induced by typhoon: A case study in the coastal region of shenzhen, China. Remote Sens. 2020, 12, 1731. [Google Scholar] [CrossRef]
  2. Chou, J.; Dong, W.; Tu, G.; Xu, Y. Spatiotemporal distribution of landing tropical cyclones and disaster impact analysis in coastal China during 1990–2016. Phys. Chem. Earth Parts A/B/C 2020, 115, 102830. [Google Scholar] [CrossRef]
  3. Choy, C.W.; Wu, M.; Lee, T. Assessment of the damages and direct economic loss in Hong Kong due to Super Typhoon Mangkhut in 2018. Trop. Cyclone Res. Rev. 2020, 9, 193–205. [Google Scholar] [CrossRef]
  4. Yang, Q.S.; Gao, R.; Bai, F.; Li, T. Yukio Tamura Damage to buildings and structures due to recent devastating wind hazards in East Asia. Nat. Hazards 2018, 92, 1321–1353. [Google Scholar] [CrossRef]
  5. Tamura, Y.; Yang, Q.S.; Wang, Y. Design of temporary, conditional, general and highly influential buildings for tropical cyclones and severe local storms. Adv. Struct. Eng. 2022, 25, 3215–3234. [Google Scholar] [CrossRef]
  6. Kossin, J.P.; Knapp, K.R.; Olander, T.L.; Velden, C.S. Global increase in major tropical cyclone exceedance probability over the past four decades. Proc. Natl. Acad. Sci. USA 2020, 117, 11975–11980. [Google Scholar] [CrossRef]
  7. Wang, P.; Wang, C.; Gou, Y.; Wu, L.; Cao, J.; Zhao, H. Future changes and uncertainty in tropical cyclone genesis over the western North Pacific: Insights from the dynamic genesis potential index using CMIP6 models. Clim. Dyn. 2025, 63, 99. [Google Scholar] [CrossRef]
  8. Murakami, H.; Wang, B. Patterns and frequency of projected future tropical cyclone genesis are governed by dynamic effects. Commun. Earth Environ. 2022, 3, 77. [Google Scholar] [CrossRef]
  9. Li, Q.S.; Li, X.; He, Y.C.; Yi, J. Observation of wind fields over different terrains and wind effects on a super-tall building during a severe typhoon and verification of wind tunnel predictions. J. Wind Eng. Ind. Aerodyn. 2017, 162, 73–84. [Google Scholar] [CrossRef]
  10. Li, D.; Lu, L.Y.; Huang, H.W.; Qiu, Y.; Deng, X.W.; Liu, C.J. Investigation on typhoon-induced aero-elastic response of membrane structures by wind tunnel test and numerical simulation. J. Build. Eng. 2024, 98, 110996. [Google Scholar] [CrossRef]
  11. He, J.Y.; Li, Q.S.; Chan, P.W.; Li, L.; Lu, C.; Zhang, L.; Yang, H.L. Characteristics and vertical profiles of mean wind and turbulence for typhoon, monsoon, and thunderstorm winds. J. Struct. Eng. 2021, 2021, 147. [Google Scholar] [CrossRef]
  12. Ke, S.T.; Zhu, R.K. Typhoon-induced wind pressure characteristics on large terminal roof based on mesoscale and microscale coupling. J. Aerosp. Eng. 2019, 32, 04019093. [Google Scholar] [CrossRef]
  13. Li, Q.S.; Li, J.C.; Hu, S.Y. Monitoring of near-surface winds and wind pressures on an instrumented low-rise building during super typhoon Rammasun. J. Struct. Eng. 2018, 145, 04018255. [Google Scholar] [CrossRef]
  14. Yuan, Y.; Dai, Y.; Jiang, S.; Liu, T. Experimental and theoretical study on the internal pressure induced by the transient local failure of low-rise building roofs. Adv. Struct. Eng. 2021, 24, 3222–3237. [Google Scholar] [CrossRef]
  15. Lu, C.L.; Li, Q.S.; Huang, S.H.; Chen, F.B.; Fu, X.Y. Large eddy simulation of wind effects on a long-span complex roof structure. J. Wind Eng. Ind. Aerodyn. 2012, 100, 1–18. [Google Scholar] [CrossRef]
  16. Fang, Y.F.; Yin, Y.; Chen, W.J.; Gao, C.J.; Hu, J.H.; Zhao, B.; Zhang, D.X. Dynamic response analysis of large-span air-supported membrane structure under typhoon loads. Structures 2025, 77, 109060. [Google Scholar] [CrossRef]
  17. Xuan, Y.; Xie, Z.; Zhang, L.; Li, Q.S. Estimation method of wind-induced fatigue of metal roof claddings under typhoon: Numerical analysis and experimental comparison. Appl. Sci. 2022, 12, 6785. [Google Scholar] [CrossRef]
  18. Li, Z.; Fu, J.Y.; He, Y.C.; Liu, Z.; Wu, J.R.; Rao, R.; Ng, C.T. Structural responses of a supertall building subjected to a severe typhoon at landfall. Appl. Sci. 2020, 10, 2965. [Google Scholar] [CrossRef]
  19. Pita, G.L.; Pinelli, J.P.; Gurley, K.; Weekes, J.; Cocke, S.; Hamid, S. Hurricane vulnerability model for mid/high-rise residential buildings. Wind Struct. 2016, 23, 449–464. [Google Scholar] [CrossRef]
  20. Wei, Z.; Pinelli, J.P.; Gurley, K. Component-based hurricane vulnerability model for mid/high-rise commercial residential buildings. Int. J. Disaster Risk Reduct. 2024, 100, 104222. [Google Scholar] [CrossRef]
  21. Wei, Z.; Pinelli, J.P.; Gurley, K.; Hamid, S.; Flannery, G. Component-based estimation of recovery time and time-related expenses after hurricane events. Front. Built Environ. 2024, 9, 1295619. [Google Scholar] [CrossRef]
  22. Wu, T.; Sun, Y.; Quan, X.; Yu, Z. Performance-based wind engineering for roof cladding based on vulnerability analysis of roof plate unit. J. Build. Eng. 2024, 95, 109958. [Google Scholar] [CrossRef]
  23. Phan, C.H.; Won, B.; Lee, S.; Kwon, S.D. Extreme wind-induced roof cladding failure: A fragility analysis for nuclear power plant structures. Nucl. Eng. Technol. 2026, 58, 103928. [Google Scholar] [CrossRef]
  24. Zhao, R.; Wu, L.; Zhao, H.; Wang, Y.; He, Y. Study on the reliability of wind-uplifted resistance of different types of standing seam metal roof systems. Buildings 2025, 15, 3957. [Google Scholar] [CrossRef]
  25. Cui, W.; Caracoglia, L. Performance-based wind engineering of tall buildings examining life-cycle downtime and multisource wind damage. J. Struct. Eng. 2020, 146, 04019179. [Google Scholar] [CrossRef]
  26. Ouyang, Z.; Spence, S.M. A performance-based wind engineering framework for envelope systems of engineered buildings subject to directional wind and rain hazards. J. Struct. Eng. 2020, 146, 04020049. [Google Scholar] [CrossRef]
  27. Ouyang, Z.; Spence, S.M. A performance-based wind engineering framework for engineered building systems subject to hurricanes. Front. Built Environ. 2021, 7, 720764. [Google Scholar] [CrossRef]
  28. Qin, H.; Niu, X.L.; Zhai, C.H. Resilience assessment for urban high-rise buildings subjected to typhoon-induced wind and rain hazards. J. Build. Eng. 2026, 118, 114800. [Google Scholar] [CrossRef]
  29. Tokgoz, B.E.; Gheorghe, A.V. Resilience Quantification and Its Application to a Residential Building Subject to Hurricane Winds. Int. J. Disaster Risk Sci. 2013, 4, 105–114. [Google Scholar] [CrossRef]
  30. Pantua, C.A.J.; Calautit, J.K.; Wu, Y. Sustainability and structural resilience of building integrated photovoltaics subjected to typhoon strength winds. Appl. Energy 2021, 301, 117437. [Google Scholar] [CrossRef]
  31. Qiu, T.; Chen, X.; Chen, K.; Su, D.; Shen, J.; Wang, L.; Zheng, Z. Multi-hazard resilience assessment framework for prefabricated underground stations with a large-span roof structure. Tunn. Undergr. Space Technol. 2022, 130, 104750. [Google Scholar] [CrossRef]
  32. Adhikari, P.; Abdelhafez, M.A.; Dong, Y.; Guo, Y.; Mahmoud, H.N.; Ellingwood, B.R. Achieving residential coastal communities resilient to tropical cyclones and climate change. Front. Built Environ. 2021, 6, 576403. [Google Scholar] [CrossRef]
  33. Fusco, G.; Zhu, J. Resilience assessment of residential buildings under hurricane wind loading through customized interactive structural analysis. In Proceedings of the Computing in Civil Engineering 2021; ASCE: Reston, VA, USA, 2024; pp. 1179–1187. [Google Scholar] [CrossRef]
  34. Li, C.-N.; Hsieh, Y.-K.; Lo, C.-W. Transit-oriented development urban spatial forms and typhoon resilience in taipei: A dynamic analytic network process evaluation. Atmosphere 2025, 16, 1178. [Google Scholar] [CrossRef]
  35. Song, J.; Huang, B.; Li, R. Assessing local resilience to typhoon disasters: A case study in Nansha, Guangzhou. PLoS ONE 2018, 13, e0190701. [Google Scholar] [CrossRef] [PubMed]
  36. Taki, A.; Doan, V.H.X. A New Framework for Sustainable Resilient Houses on the Coastal Areas of Khanh Hoa, Vietnam. Sustainability 2022, 14, 7630. [Google Scholar] [CrossRef]
  37. Wang, T.Y.; Lin, C.Y. Resilience assessment of interdependent urban infrastructure systems under intensifying typhoon scenarios: Comparing recovery strategies for coupled networks. Int. J. Disaster Risk Reduct. 2026, 135, 106050. [Google Scholar] [CrossRef]
  38. Wang, W.; Shi, L.; Qiu, Z. Multi-Indicator Fused Resilience Assessment of Power Grids Considering Wind-Photovoltaic Output Uncertainty during Typhoon Disasters. Electronics 2024, 13, 745. [Google Scholar] [CrossRef]
  39. Huang, B.; Ou, Z.; Zhao, G.; Wang, J.; Liu, L.; Lv, S.; Huang, B.; Liu, X. A Systematic Analysis of Influencing Factors on Wind Resilience in a Coastal Historical District of China. Appl. Sci. 2025, 15, 8116. [Google Scholar] [CrossRef]
  40. Ding, Y.; Lin, L.; Xie, G.; Wang, X.; Zhao, P. A Field-Based Measurement and Analysis of Wind-Generated Vibration Responses in a Super-Tall Building During Typhoon “Rumbia”. Buildings 2025, 15, 1448. [Google Scholar] [CrossRef]
  41. GB/T 50009-2012; Load Code for the Design of Building Structures. Ministry of Housing and Urban–Rural Development of the People’s Republic of China: Beijing, China; China Architecture & Building Press: Beijing, China, 2012. (In Chinese)
  42. Li, Q.S.; He, J.Y.; Zhou, K.; Li, X.; Chan, P.W.; Li, L. City-Scale Typhoon Hazard Analysis and Field Monitoring of Wind Effects on Skyscrapers during Super Typhoon Mangkhut. J. Struct. Eng. 2022, 148, 0402208. [Google Scholar] [CrossRef]
  43. Guo, Y.; Hou, Y.; Qi, P. Analysis of typhoon wind hazard in Shenzhen City by Monte-Carlo simulation. J. Oceanol. Limnol. 2019, 37, 1994–2013. [Google Scholar] [CrossRef]
  44. Vickery, P.J.; Twisdale, L.A. Prediction of hurricane wind speeds in the United States. J. Struct. Eng. 1995, 121, 1691–1699. [Google Scholar] [CrossRef]
  45. Meng, Y.; Matsui, M.; Hibi, K. An analytical model for simulation of the wind field in a typhoon boundary layer. J. Wind Eng. Ind. Aerodyn. 1995, 56, 291–310. [Google Scholar] [CrossRef]
  46. Meng, Y.; Matsui, M.; Hibi, K. A numerical study of the wind field in a typhoon boundary layer. J. Wind Eng. Ind. Aerodyn. 1997, 67, 437–448. [Google Scholar] [CrossRef]
  47. Dai, Y.M.; Yuan, Y.J.; Tao, L.; Chen, Y.F. Experimental investigation on the effects of inter-layer gaps on wind loads of cantilevered stadium roofs. Adv. Struct. Eng. 2020, 23, 764–778. [Google Scholar] [CrossRef]
  48. Dai, Y.M.; Yuan, Y.J.; Song, S.J.; Li, Y. Steady-state and transient wind characteristics of low-rise building roofs with openings in vulnerable areas. Adv. Struct. Eng. 2020, 23, 2343–2357. [Google Scholar] [CrossRef]
  49. US Department of Homeland Security, Federal Emergency Management Agency. Hazus 7.0 Hurricane Model Technical Manual; Federal Emergency Management Agency: Washington, DC, USA, 2025. Available online: https://www.fema.gov/sites/default/files/documents/fema_rsl_hazus-7-hutm_06272025_0.pdf (accessed on 31 January 2026).
  50. Terzic, V.; Villanueva, P.K.; Saldana, D.; Yoo, D.Y. Framework for modelling post-earthquake functional recovery of buildings. Eng. Struct. 2021, 246, 113074. [Google Scholar] [CrossRef]
  51. Abdelhady, A.U.; Spence, S.M.; McCormick, J. A framework for the probabilistic quantification of the resilience of communities to hurricane winds. J. Wind Eng. Ind. Aerodyn. 2020, 206, 104376. [Google Scholar] [CrossRef]
  52. STI/CMA. The CMA Tropical Cyclone Database, Shanghai Typhoon Institute of China Meteorological Administration; STI/CMA: Shanghai, China, 2025. [Google Scholar]
  53. Yuan, Y.J.; Dong, Y.; Zhang, J.X.; Yan, B.W. Probabilistic vulnerability assessment of floating offshore wind turbines under typhoon hazards considering long-term corrosion–fatigue degradation. Eng. Struct. 2026, 357, 122577. [Google Scholar] [CrossRef]
  54. GB/T 19201–2006; Grade of Tropical Cyclone. Standards Press of China: Beijing, China; General Administration of Quality Supervision: Beijing, China; Inspection and Quarantine of the People’s Republic of China: Beijing, China; Standardization Administration of the People’s Republic of China: Beijing, China, 2006. (In Chinese)
Figure 1. Wind tunnel test of the target large-span stadium: (a) Experimental setup; (b) Definition of wind direction; (c) Roof measurement point layout and zoning.
Buildings 16 01914 g001
Figure 2. Vertical profiles of (a) 10-min mean wind speed and (b) longitudinal turbulence intensity at SZMGT before, during, and after the maximum wind speed.
Buildings 16 01914 g002
Figure 3. Vertical profiles of (a) mean wind speed and (b) longitudinal turbulence intensity produced in the wind tunnel tests.
Buildings 16 01914 g003
Figure 4. Roof-level recovery process Gantt chart.
Buildings 16 01914 g004
Figure 5. Simulation procedures for assessing building roof damage and functional recovery.
Buildings 16 01914 g005
Figure 6. A sample synthetic typhoon track from the simulation runs.
Buildings 16 01914 g006
Figure 7. Procedure of typhoon hazard modelling.
Buildings 16 01914 g007
Figure 8. Probability density distributions of (a) the maximum wind speed at 10 m height and (b) wind direction at the building site considering the uncertainty in key parameters.
Buildings 16 01914 g008
Figure 9. Comparison of simulated and observed (a) 10-min mean wind speed and (b) wind direction at 350 m height of the Shenzhen Meteorological Gradient Tower during typhoon Mangkhut.
Buildings 16 01914 g009
Figure 10. Time histories of (a) wind pressure and (b) equivalent wind load on a roof unit.
Buildings 16 01914 g010
Figure 11. Roof cover damage and supporting structure damage in a single simulation: (a) distribution of roof cover unit damage; (b) distribution of roof-supporting structure damage.
Buildings 16 01914 g011
Figure 12. Fragility curve of roof cover and roof-supporting structure considering the effects of the corresponding damage states: (a) roof cover; (b) roof-supporting structure.
Buildings 16 01914 g012
Figure 13. Annual failure probability of the building roof of the large-span stadium: (a) roof cover; (b) roof-supporting structure.
Buildings 16 01914 g013
Figure 14. Mean functional recovery curves of the roof cover, roof-supporting structure, and the overall building under different damage states: (a) Damage state ≤ 1; (b) Damage state = 2; (c) Damage state ≥ 3.
Buildings 16 01914 g014
Figure 15. Functional recovery curves of the roof cover, roof-supporting structure, and the overall building at 5%, 50%, and 95% percentile levels: (a) Damage state = 1; (b) Damage state = 2; (c) Damage state = 3.
Buildings 16 01914 g015
Figure 16. (a) Probability density function and (b) cumulative distribution function of the building resilience index.
Buildings 16 01914 g016
Figure 17. Mean functional recovery curves of the roof cover, roof-supporting structure, and the overall building under different typhoon categories: (a) U < 17.2 m/s; (b) TS; (c) STS; (d) TY; (e) STY; (f) Super TY.
Buildings 16 01914 g017
Figure 18. Comparison of mean building functionality recovery curves under different typhoon categories.
Buildings 16 01914 g018
Figure 19. Mean functional recovery curves of the overall building under different damage states considering the effects of tc: (a) Damage state = 1; (b) Damage state = 2; (c) Damage state = 3.
Buildings 16 01914 g019
Figure 20. Mean functional recovery curves of the overall building under different damage states considering the effects of weighting factors: (a) Damage state = 1; (b) Damage state = 2; (c) Damage state = 3.
Buildings 16 01914 g020
Table 1. Damage states for the large-span stadium.
Damage StateQualitative Damage DescriptionRoof Cover Failure RatioRoof Structure Failure Ratio
0No damage or very minor damage≤2%No
1Minor damage>2% and <15%No
2Moderate damage15% and ≤50%Local damage > 3% and <10%
3Severe damage>50%Local damage > 10% and <50%
4DestructionTypically > 50%Full damage
Table 2. Functionality ratings related to roof damage ratio.
Functionality RatingFunctional StateRoof Damage RatioDescription
1.0Fully
functional
Cover failure 0–2% and no roof structure failureInsignificant roof cover damage, with negligible impact on stadium operation. The stadium remains fully functional and can continue to host normal activities.
0.8Largely
functional
Cover failure 2–15% and no roof structure failureMinor roof cover damage, with no damage to the main roof structure. Localized leakage may occur above parts of the spectator stands, and long-term seepage may cause corrosion of the steel roof-supporting members. Only a very limited portion of the seating area becomes unusable. Overall, the stadium’s function is only slightly affected.
0.6Partially functionalCover failure 15–50% or local roof structure failure 3–10%Moderate roof cover damage, with slight local bending and deformation of the roof-supporting members. A large portion of the spectator area may suffer from rainwater intrusion, substantially reducing the number of usable seats. The stadium remains usable only at a reduced capacity, and its functionality is moderately affected.
0.3Minimal functionalityCover failure >50% or local roof structure failure 10–50%Extensive roof cover damage, with significant local bending and deformation of the roof-supporting members. Many areas of the spectator stands are damaged, and only a small number of spectators can be safely accommodated. The stadium is barely operational and has essentially lost most of its intended functionality.
0Not
functional
Cover failure largely >50% or roof structure failure fully damagedThe roof cover is almost completely destroyed, and the roof structure experiences severe damage or collapse. The interior of the stadium is left in a state of devastation, and the stadium completely loses its functionality.
Table 3. Parameters of the functionality and recovery models used in the demonstration.
ParameterNumerical Value, Probability Distribution, and EquationDescription
Preparation and repair time for roof-supporting structure T P S + T R S DRS: damage ratio of the roof-supporting structure.
Zero if DRS < 3%, otherwise, follows a lognormal distribution with
Mean = 10 (days), COV = 0.1, 3% ≤ DRS < 10%;
Mean = 30 (days), COV = 0.2, 10% ≤ DRS < 50%;
Mean = 90 (days), COV = 0.3. DRS ≥ 50%.
Assigned a lognormal distribution with mean and COV as a function of roof-supporting structure damage ratio based on reasonable engineering assumptions.
Pre-pair time for all roof cover unitsZero if no building damage, otherwise, follows a lognormal distribution with
Mean = 5 (days), COV = 0.1, 0.9 < FB ≤ 1.0;
Mean = 10 (days), COV = 0.2, 0.7 < FB ≤ 0.9;
Mean = 15 (days), COV = 0.3, 0.5 < FB ≤ 0.7;
Mean = 30 (days), COV = 0.3, 0.3 < FB ≤ 0.5;
Mean = 60 (days), COV = 0.4, FB ≤ 0.3;
Assigned a lognormal distribution with mean and COV as a function of building functionality based on inference from Qin et al. [28], Terzic et al. [50] and engineering judgement.
The repair time for roof cover damageTRC = DRC × N × tC.
DRC: damage ratio of roof cover;
tC: Repair time of single roof cover unit, which is assumed to be 1 day;
N: The total number of the roof cover units, N = 122.
tC inferred from general statistics of post-recovery of building roof in Shenzhen and references like FEMA [49], Abdelhady et al. [51] and Wei et al. [20].
Roof repair sequenceThe repair of the roof cover can only begin after the roof-supporting structure has been fully restored.Different scenarios for roof repair sequence to reflect available resource limits.
Table 4. Lognormal fragility parameters for the roof cover and roof-supporting structure.
Damage StateRoof CoverRoof-Supporting Structure
U 50 , k (m/s) β k U 50 , k (m/s) β k
129.80.04339.30.070
240.40.02049.60.067
345.90.02059.90.0198
453.70.019--
Table 5. Typhoon classification based on near-surface wind speed.
ClassificationTropical Storm (TS)Severe Tropical Storm (STS)Typhoon (TY)Severe Typhoon (STY)Super Typhoon (Super TY)
Wind speed range (m/s)17.2 ≤ U < 24.524.5 ≤ U < 32.732.7 ≤ U < 41.541.5 ≤ U < 51.0U ≥ 51.0
Table 6. Important parameter assumptions in this framework.
ParametersDescriptionValues
t c Repair time of single roof cover unit1 days
w c and w s Weighting factors w c = 0.3 and w s = 0.7
T P C Preparation time for all roof cover unitsLognormal distribution
T P S + T R S Preparation and repair time for roof-supporting structureLognormal distribution
Table 7. Statistics of building resilience index under different tc.
tc (Days)Resilience Index
Mean ValueMedian Value5th Percentile95th PercentileMaximum Error
0.50.94990.95480.86091−1.5%
1.00.95500.95890.874510
1.50.95760.96130.88031+0.6%
2.00.95920.96290.88361+1.0%
2.50.96040.96390.88561+1.3%
3.00.96120.96470.88711+1.4%
Table 8. Statistics of building resilience index under different weighting factors.
Weighting FactorResilience Index
MeanMedian5th Percentile95th PercentileMaximum Error
wc = 0.2, ws = 0.80.95960.96260.88591+1.1%
wc = 0.3, ws = 0.70.95500.95890.874510
wc = 0.4, ws = 0.60.93980.94520.821715.7%
wc = 0.5, ws = 0.50.92110.92420.7775111.4%
Disclaimer/Publisher’s Note: The statements, opinions and data contained in all publications are solely those of the individual author(s) and contributor(s) and not of MDPI and/or the editor(s). MDPI and/or the editor(s) disclaim responsibility for any injury to people or property resulting from any ideas, methods, instructions or products referred to in the content.