Article

Integrating Drilling Parameters and Face Images for Tunnel Rock Mass Classification Using a Hybrid Random Forest and MambaVision Model

1
Shaanxi Expressway Engineering Consulting Co., Ltd., Xi’an 710068, China
2
Ocean College, Zhejiang University, Zhoushan 316021, China
3
College of Urban Development and Modern Transportation, Xi’an University of Architecture and Technology, Xi’an 710055, China
*
Author to whom correspondence should be addressed.
Buildings 2026, 16(10), 1916; https://doi.org/10.3390/buildings16101916
Submission received: 12 March 2026 / Revised: 19 April 2026 / Accepted: 26 April 2026 / Published: 12 May 2026
(This article belongs to the Section Construction Management, and Computers & Digitization)

Abstract

Tunnel construction requires accurate and timely classification of surrounding rock masses to ensure safety and guide excavation. This research addresses the limitations of conventional methods and unimodal intelligent approaches by proposing a novel hybrid deep model, Random-Mamba, that integrates drilling parameters and digital images for enhanced classification performance. A dataset of 3361 synchronized samples was constructed, containing six drilling parameters, digital face images, and expert-classified rock mass grades. The model employs a dual-branch architecture: a Random Forest processes the drilling parameters, and a MambaVision network extracts visual features, with a multilayer perceptron performing the fusion. The proposed model achieved an overall accuracy of 92.12% and a macro-F1 score of 91.66%, outperforming the most comparable hybrid model by 2.61% in accuracy. It demonstrated particularly high precision in identifying Class III rock with an F1-score of 93.2%. Ablation and comparative experiments confirmed its superiority over both single-modality models, such as SVM and ResNet, and other hybrid architectures, like Random-Swin. SHAP-based sensitivity analysis further revealed that feed speed was the most influential drilling parameter for classification. The effective fusion of complementary mechanical and visual data provides a robust and practical solution for real-time rock mass assessment in tunneling engineering.

1. Introduction

1.1. Background

The rapid development of Chinese infrastructure construction has led to an unprecedented scale of tunnel engineering projects. According to the National Railway Administration of China, over 18,000 km of railway tunnels and 20,000 km of highway tunnels have been constructed in the past decade, with annual growth rates exceeding 8% [1]. This massive tunnel construction boom presents significant challenges in geological risk management and construction safety assurance. The accurate classification of surrounding rock masses has emerged as a critical factor influencing tunnel design optimization, construction process adjustment, quality control, schedule management, and most importantly, safety assurance [2,3]. As tunnel projects increasingly extend into complex geological environments in western China, the demand for rapid, reliable, and real-time rock mass classification has become more urgent than ever.
Traditional surrounding rock classification methods primarily rely on laboratory tests of rock samples and field geological surveys, which are inherently time-consuming, labor-intensive, and often behind construction progress [4]. The Rock Mass Rating (RMR) [5,6] system and Q-system [7,8], developed in the 1970s, have been widely adopted in tunnel engineering but require extensive geological data collection and expert judgment. Similarly, the Chinese national standard, the basic quality index of rock mass (BQ) method, emphasizes the importance of rock strength and integrity in classification, but faces practical limitations in real-time application during tunnel construction [9]. Palmstrom and Stille highlighted that the subjective nature of some evaluation parameters introduces inconsistency, and the discrete classification results fail to capture gradual transitions in rock mass quality [10]. These limitations motivate the exploration of automated, data-driven approaches that can provide timely and objective assessments during tunnel excavation.

1.2. Related Work

1.2.1. Overview Review

The advancement of artificial intelligence technologies has opened new avenues for intelligent surrounding rock classification [11,12]. Over the past decade, researchers have increasingly explored machine learning and deep learning approaches using various data sources. To comprehensively understand the research landscape and identify existing gaps, Table 1 summarizes representative studies from recent years, detailing the researchers, year, input data types, algorithms employed, and reported accuracy.
The systematic review presented in Table 1 reveals that while significant progress has been made in intelligent rock mass classification, two critical gaps remain unaddressed. The first gap pertains to the limitations of single-modality approaches, and the second gap concerns the architectural choices for visual feature extraction in tunnel engineering applications.

1.2.2. Single-Modality Approaches for Rock Classification

A substantial body of research has focused on developing intelligent classification methods using single data sources. Drilling parameter-based methods, as summarized in Table 1, have achieved impressive accuracies ranging from 87.9% to 96.33% using various machine learning algorithms. Yang et al. [13] employed Random Forest with thrust force per cutter, penetration rate, and advance rate as inputs, achieving 87.9% accuracy. Nie et al. [14] utilized Coati-XGBoost with eight drilling parameters, including cutterhead torque and specific energy, reaching 91.5% accuracy. Sebbeh Newton et al. [15] applied Extremely Randomized Trees to bore energy, cutterhead torque, and rate of penetration, attaining 91.0% accuracy. Liu et al. [16] achieved 93.0% accuracy using Random Forest with propulsion speed, impact pressure, and rotary pressure. Most notably, Zhang et al. [18] achieved 96.33% accuracy using Deep Forest with ten detailed tunneling parameters.
These approaches benefit from real-time data acquisition during tunnel excavation, enabling continuous classification updates. However, drilling parameters offer only localized, point-wise assessments that can be influenced by operational factors or temporary equipment conditions. Tan Daiming et al. [29] emphasized that current rock mass classification methods predominantly rely on single-source indicators and heavily depend on the experience of construction personnel, making it difficult to quantitatively characterize the structural features of surrounding rock under complex geological conditions. The drilling parameters capture mechanical responses at the drill bit but fundamentally fail to characterize large-scale geological structures such as joint patterns, bedding planes, and fault zones that are equally critical for accurate rock mass assessment.
Image-based methods, as shown in Table 1, achieve accuracy between 83.2% and 93.9% using various deep learning architectures. Xiao et al. [19] employed ShuffleNet V2 with tunnel face images, achieving 85.0% accuracy. Shi et al. [20] utilized DCNN and reached 93.6% accuracy. Kim et al. [21] applied EfficientNet-B4 to achieve 83.2% accuracy. Zhang et al. [22] used ResNet-101 for 91.3% accuracy. Liang et al. [23] developed SAFN, a CNN-Attention hybrid architecture, attaining 92.5% accuracy. Chen et al. [24] achieved the highest among image-based methods at 93.9% using Inception-ResNet-V2. These approaches capture holistic geological features, including joint patterns, weathering conditions, and rock fabric textures. Yet image analysis alone is susceptible to lighting variations, occlusions, and scale ambiguities, and cannot directly quantify mechanical properties such as rock strength or drillability.
The inherent limitations of single-modality approaches have motivated preliminary fusion attempts. Shao et al. [27] combined longitudinal deformation curves with images using a SE-CNN-LSTM-Attention hybrid architecture, achieving 91.2% accuracy. This inherent complementarity between mechanical and visual information strongly suggests that fusing these two modalities could yield superior classification performance, yet existing fusion attempts remain limited in their ability to capture deep cross-modal interactions.

1.2.3. Various Artificial Intelligent Algorithm for Construction Data

As summarized in Table 1, various machine learning algorithms have been explored for processing drilling parameters in mining. Algorithms applied to drilling parameter analysis include Coati-XGBoost [14,17], Extremely Randomized Trees [15], Deep Forest [18], and Random Forest [13], and achieved accuracy of 91.5%, 91.0%, 96.33%, and 93.0%, respectively. Among the above algorithms, the Random Forest algorithm [30] offers inherent advantages for structured tabular data: it handles mixed feature types naturally, prevents overfitting through ensemble averaging, and provides feature importance rankings that reveal each parameter’s contribution to classification decisions. These characteristics make Random Forest particularly suitable for capturing complex non-linear relationships among thrust force, penetration rate, torque, and pressure variables essential for accurate rock mass characterization.
In the domain of tunnel face image processing, the evolution of deep learning architecture has progressively enhanced classification capabilities. As shown in Table 1, researchers have explored various architectures with accuracies ranging from 83.2% to 93.9%. While CNN has demonstrated effectiveness, its local receptive fields limit the capture of large-scale geological structures spanning significant portions of the tunnel face, such as persistent joints and fault zones [31]. Transformer-based architectures address this limitation through self-attention, enabling global context, but their quadratic computational complexity becomes prohibitive for high-resolution tunnel face images [32]. MambaVision [33] combines CNN computational efficiency with Transformer global modeling capability, providing an optimal balance for analyzing both fine-scale textural details and large-scale structural patterns in tunnel face images.
Regarding multi-source data fusion strategies, existing studies have demonstrated various approaches and effectiveness levels [34]. As shown in Table 1, Tom F. Hansen et al. [28] fused MWD images with MWD data using ResNet-50 combined with an ensemble of KNN, Extra Trees, and Catboost, achieving 86.0% accuracy by a decision-level fusion. However, existing fusion strategies predominantly employ early feature concatenation or late decision fusion, which may not fully capture the deep interactive relationships between different modalities. Feature-level fusion allows each branch to develop specialized representations for its respective data modality before strategic integration, enabling the model to learn synergistic relationships between mechanical responses and visual patterns.

1.3. Objective

This research addresses the need for efficient surrounding rock classification in tunnel engineering by developing a hybrid intelligent model that integrates drilling parameters and digital images. This study established a dataset of 3361 samples integrating drilling parameters and tunnel face images for tunnel surrounding rock classification. A dual-branch hybrid model was developed, which processed drilling parameters through Random Forest and extracted image features via MambaVision, followed by feature fusion for final classification. The proposed model was systematically compared with conventional and single-modality intelligent methods. Experimental results and discussions demonstrated superior performance, providing a new methodological framework for intelligent surrounding rock classification in tunnel engineering.

2. Dataset Acquisition and Preprocessing

2.1. Project Background and Data Collection

This study utilizes data from the Dabashan Tunnel construction within the Chinese Shaanxi Province Anlan Expressway project. Located in the geologically complex Qinba Mountain region, the tunnel traverses varied metamorphic formations, including phyllite, slate, and quartzite, interspersed with carbonate rocks. The area’s significant tectonic activity has resulted in well-developed joint systems and fault zones, creating ideal conditions for studying diverse rock mass behaviors.
Drilling parameters were collected using a TBM integrated monitoring system operating at 10 Hz sampling frequency. Six key parameters were recorded: feed speed, propulsion pressure, impact pressure, rotation pressure, water pressure, and water flow. These parameters collectively characterize rock-drill interaction mechanics, with harder formations typically exhibiting lower feed speeds and higher pressure requirements.
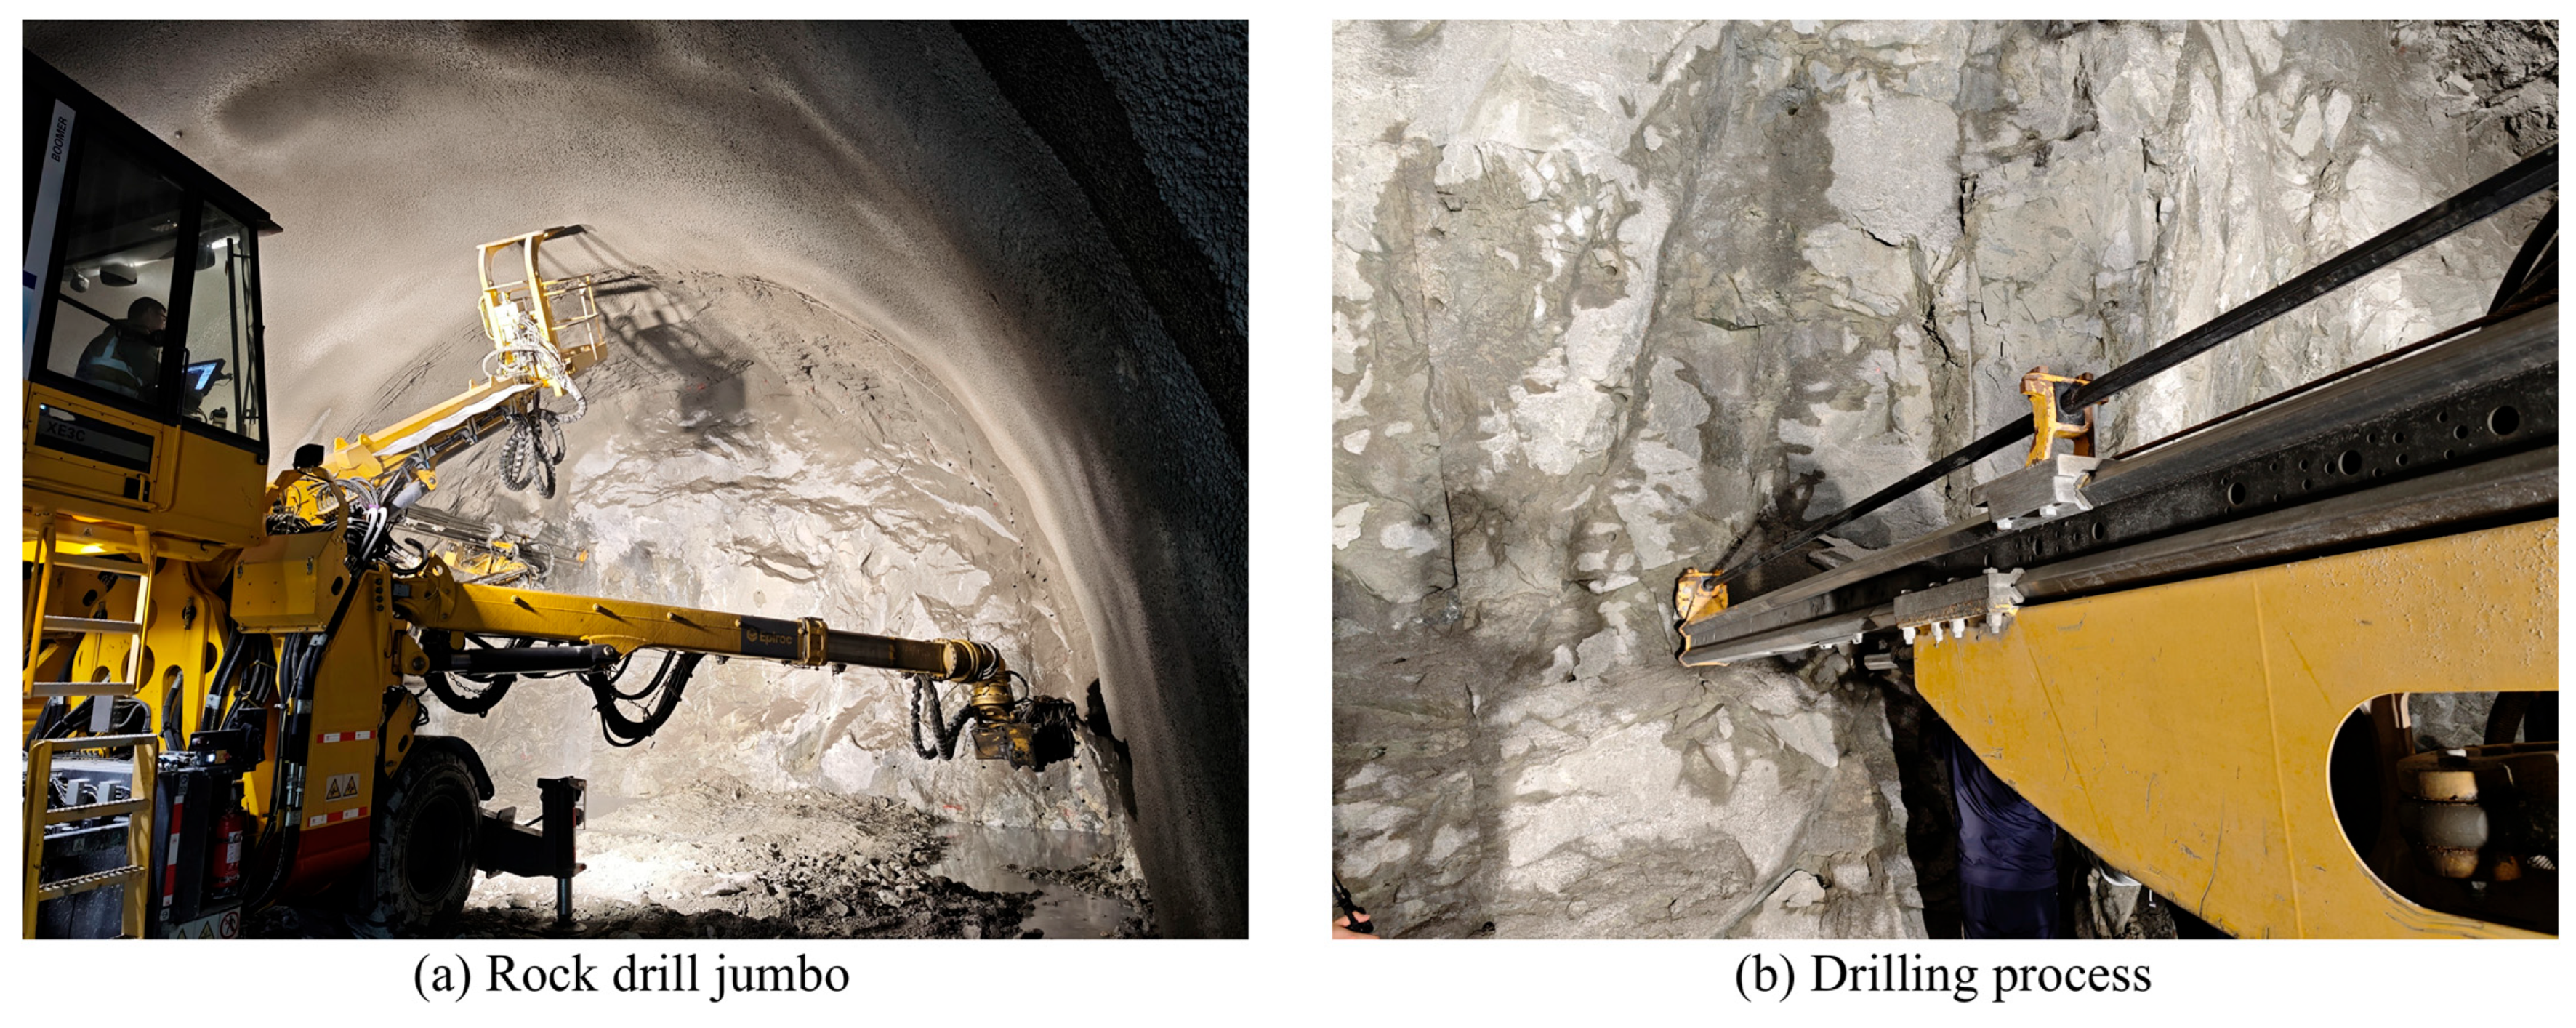
Tunnel face imaging employed a Canon EOS 5D Mark IV DSLR camera with a 30.4 MP resolution, which was fixed at 5 m from the face, 1.5 m high with a 15° downward angle. Image capture was synchronized with drilling data acquisition through an automated trigger system activated upon each 1 m advance completion, ensuring precise temporal alignment between visual documentation and mechanical response data, as shown in Figure 1.
To align multi-source data streams, the average values of drilling parameters within a two-second time window immediately preceding each image capture trigger were selected as the corresponding drilling parameter values in the dataset. The two-second window was chosen because it corresponds to approximately 50 mm of TBM advance, which is the average distance over which the geological conditions at the tunnel face remain relatively stable. These average values capture the central tendency during the excavation process of each rock segment. Ground truth rock grades followed the Chinese BQ method, combining laboratory core testing with field geological mapping. Three experienced geologists independently evaluated each 1 m segment, assessing uniaxial compressive strength, rock mass integrity, groundwater conditions, and structural characteristics to establish consensus-based reference classifications. The data in this research are described in Table 2.
The physical and mechanical properties of different-grade rocks are shown in Table 3. Grade II rocks have high strength, with a UCS of 60–80 MPa, and very low porosity. Grade III rocks show moderate properties, while Grades IV and V are characterized by low strength, high porosity, and closely spaced joints. These properties directly influence both drilling parameters and visual appearance, providing the physical basis for multi-modal classification.

2.2. Dataset Description

The comprehensive dataset comprises 3361 synchronized records of drilling parameters, tunnel face images, and expert-classified rock masses. Table 4 presents a detailed statistical analysis of drilling parameters across the four rock grades.
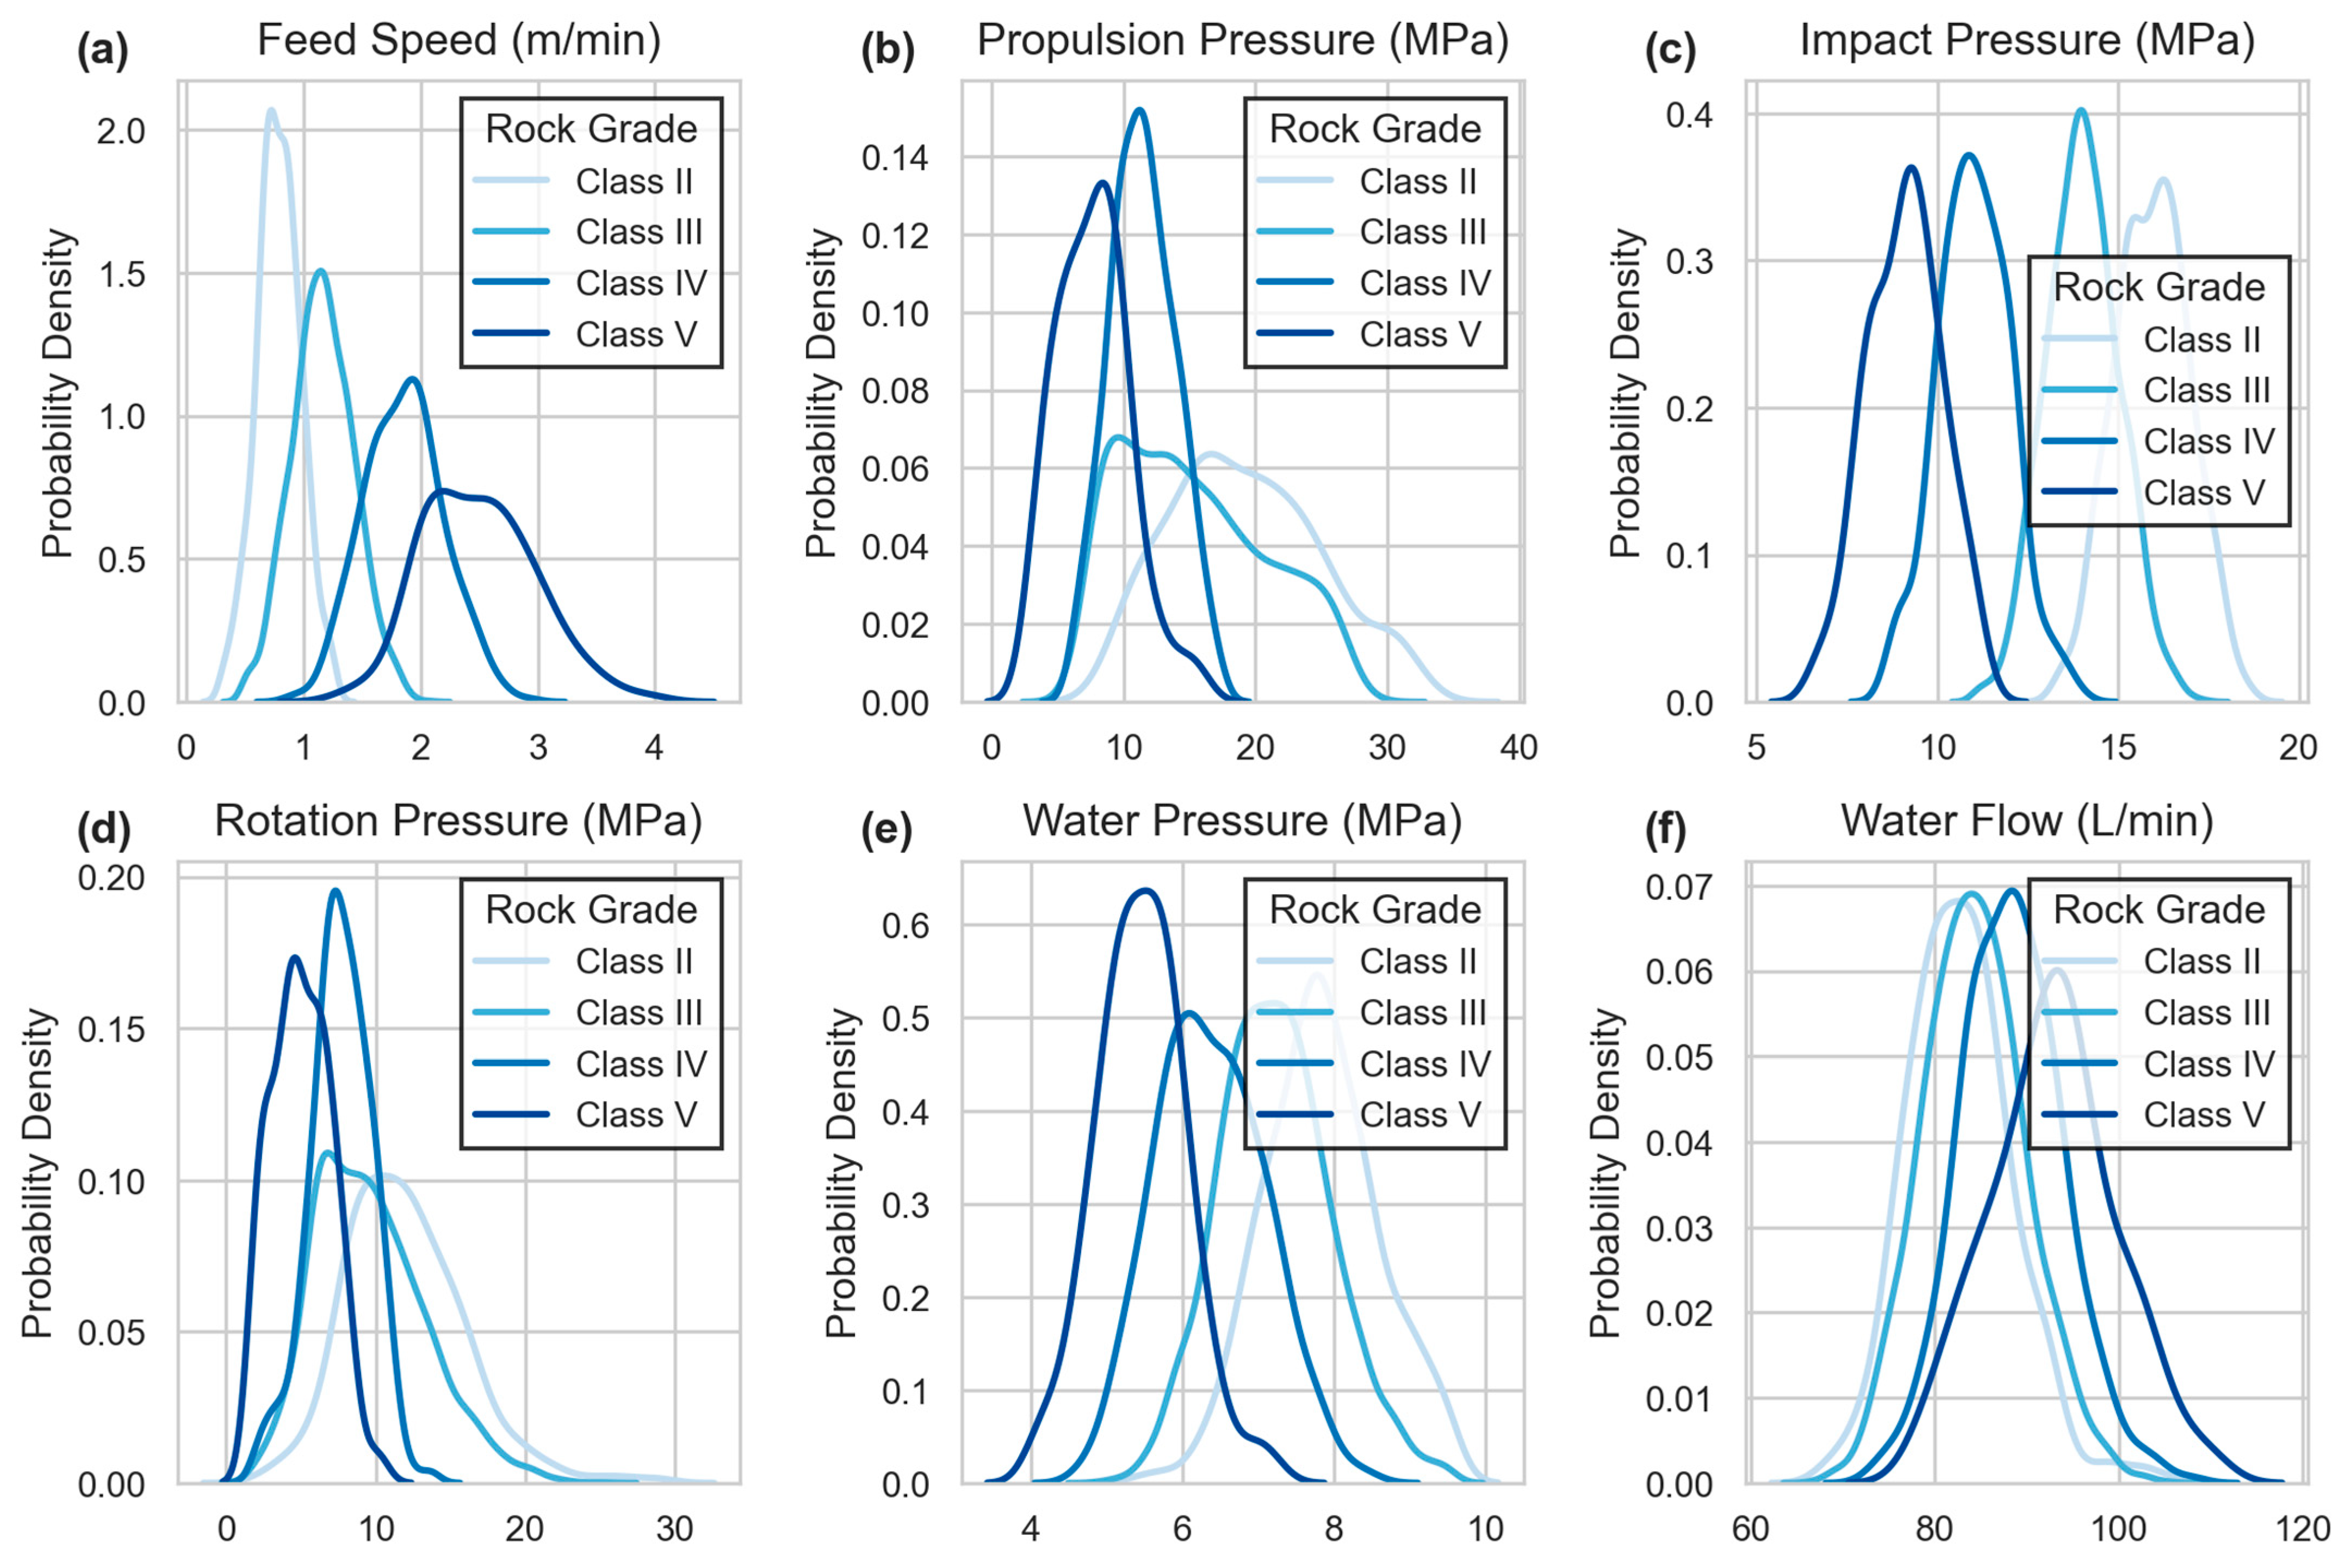
As shown in Table 4, feed speed demonstrates the most pronounced classification sensitivity, with mean values increasing steadily from 0.79 m/min in Grade II to 2.50 m/min in Grade V. The standard deviation also rises from 0.19 m/min to 0.48 m/min across the same grades, while the operational range widens from 0.31–1.27 m/min to 1.35–3.96 m/min. This progression reflects the fundamental relationship between rock strength and penetration rate, though the substantial range overlaps between adjacent grades highlight the inherent challenges in classification.
Propulsion pressure exhibits a clear inverse relationship with rock quality, decreasing from a mean of 19.28 MPa and a standard deviation of 5.69 MPa in Grade II, to 7.74 MPa with a standard deviation of 2.77 MPa in Grade V. The operational range correspondingly shifts from 8.21–33.33 MPa down to 2.88–16.09 MPa. The notably higher standard deviations observed in harder rock grades indicate greater variability in thrust requirements, possibly due to heterogeneous rock fabric or intermittent hard inclusions. Rotation pressure follows a similar decreasing pattern, dropping from a mean of 12.00 MPa in Grade II to 5.03 MPa in Grade V, with standard deviations of 4.00 MPa and 1.94 MPa, respectively. The consistent ratio of approximately 0.65 to 0.70 between propulsion and rotation pressures across all grades suggests a fundamental mechanical relationship in the drilling process.
Impact pressure maintains relatively stable operational ranges across different rock grades, varying from 15.94 MPa in Grade II, to 11.04–17.40 MPa in Grade III, 8.54–14.00 MPa in Grade IV, and 6.57–11.29 MPa in Grade V. The minimal standard deviations observed confirm nature as a controlled operational parameter rather than a highly responsive indicator.
Water parameters show the least classification sensitivity. Water pressure operates within a narrow range of 4.10 to 9.50 MPa across all rock grades, while water flow maintains consistent levels between 67.07 and 110.00 L/min. This stability confirms their primary roles as controlled operational parameters for cooling and debris removal, rather than serving as diagnostic indicators for rock classification.
Figure 2 provides a visual representation of parameter distributions through density curves. Each subplot is labeled (a) to (f), corresponding to the six drilling parameters. The legends, such as Class II and Class V, represent the surrounding rock mass grades used in the study.
The feed speed distributions show progressive right-shifting from Grade II to V, with increasing distribution widths indicating greater operational variability in softer formations. Propulsion pressure displays characteristic right-skewness across all grades, particularly pronounced in Grade II and III rocks, reflecting the occurrence of intermittent high-resistance zones. Impact pressure distributions exhibit remarkably consistent shapes with minimal skewness, emphasizing their controlled nature. The significant distribution overlaps observed across all parameters, especially between adjacent rock grades, underscore the challenges of establishing discrete classification boundaries.
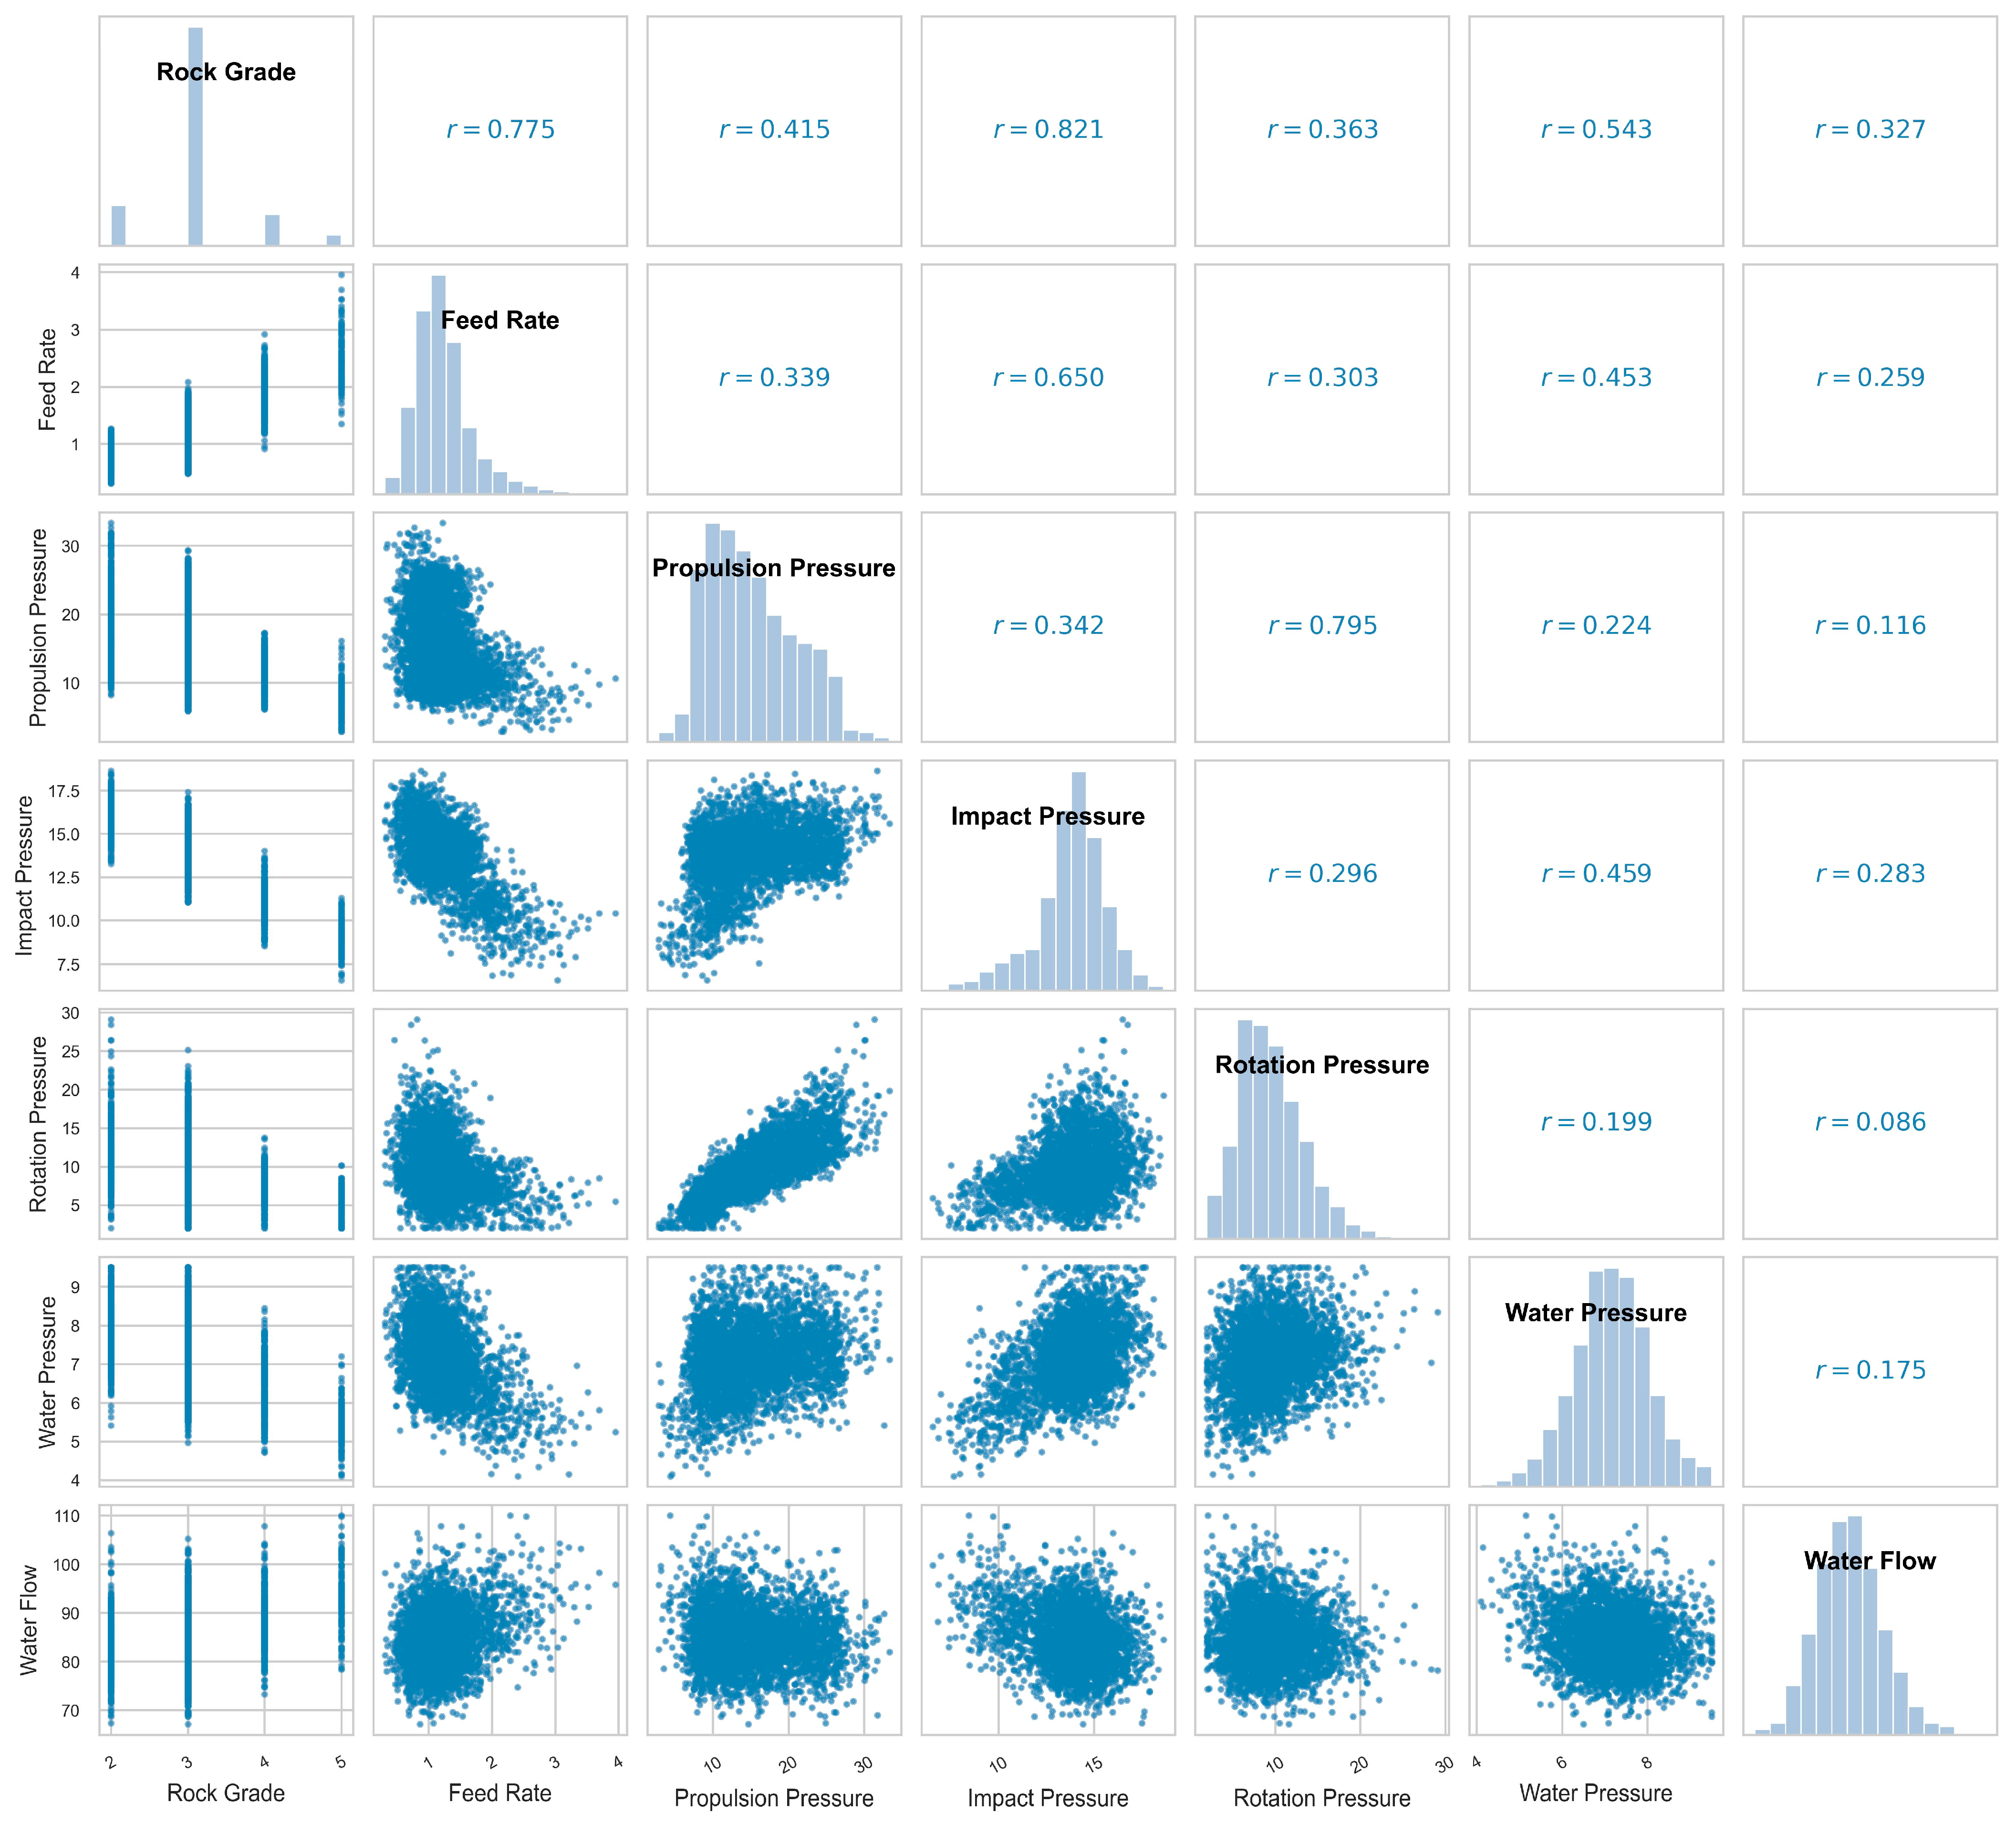
Figure 3 presents a comprehensive correlation matrix organized as a 7 × 7 grid of subplots, systematically illustrating the relationships among all variables in the dataset. The lower triangle shows bivariate scatter plots, the upper triangle displays the absolute value of Pearson’s correlation coefficient, and the diagonal shows univariate histograms. Axis labels are provided on the leftmost column and bottom row for clarity.
For instance, the scatter plot located in the fifth row and third column illustrates the relationship between propulsion pressure and rotation pressure. Conversely, the upper-right triangle presents numerical correlation coefficients in the corresponding positions, where the value of 0.795 appearing in the third row and fifth column represents the correlation coefficient between propulsion pressure and rotation pressure. This structured visualization enables simultaneous examination of variable distributions, bivariate relationships, and quantitative correlation measures.
The inter-parameter correlation analysis reveals significant relationships among certain drilling parameters. Propulsion pressure and rotation pressure demonstrate the strongest correlation with a coefficient of 0.795, indicating a tightly coupled mechanical relationship in the drilling system. Similarly, feed speed exhibits strong negative correlations with impact pressure at −0.650, consistent with the expected inverse relationship. In contrast, water-related parameters show notably weaker correlations with other mechanical parameters, with water flow correlating at only 0.116 with propulsion pressure and 0.086 with rotation pressure. This pattern reinforces the fundamental distinction between controlled operational parameters and responsive mechanical parameters in the drilling process.
The correlation coefficients between drilling parameters and rock grade vary considerably across different parameters. Impact pressure demonstrates the strongest correlation with rock grade at 0.821, followed by feed speed at 0.775, water pressure at 0.543, propulsion pressure at 0.415, rotation pressure at 0.363, and water flow, showing the weakest correlation at 0.327. While impact pressure and feed speed show reasonably strong correlations with rock grade, the moderate values for other parameters, particularly the critical pressure indicators, prove insufficient for reliable classification.
The substantial overlaps visible in the scatter plots, combined with correlation coefficients consistently below 0.85 for all parameters, clearly demonstrate that drilling parameters alone cannot provide accurate rock classification. This fundamental limitation necessitates the integration of complementary data sources, particularly visual information from tunnel face images, to achieve satisfactory classification performance.

2.3. Image Augmentation

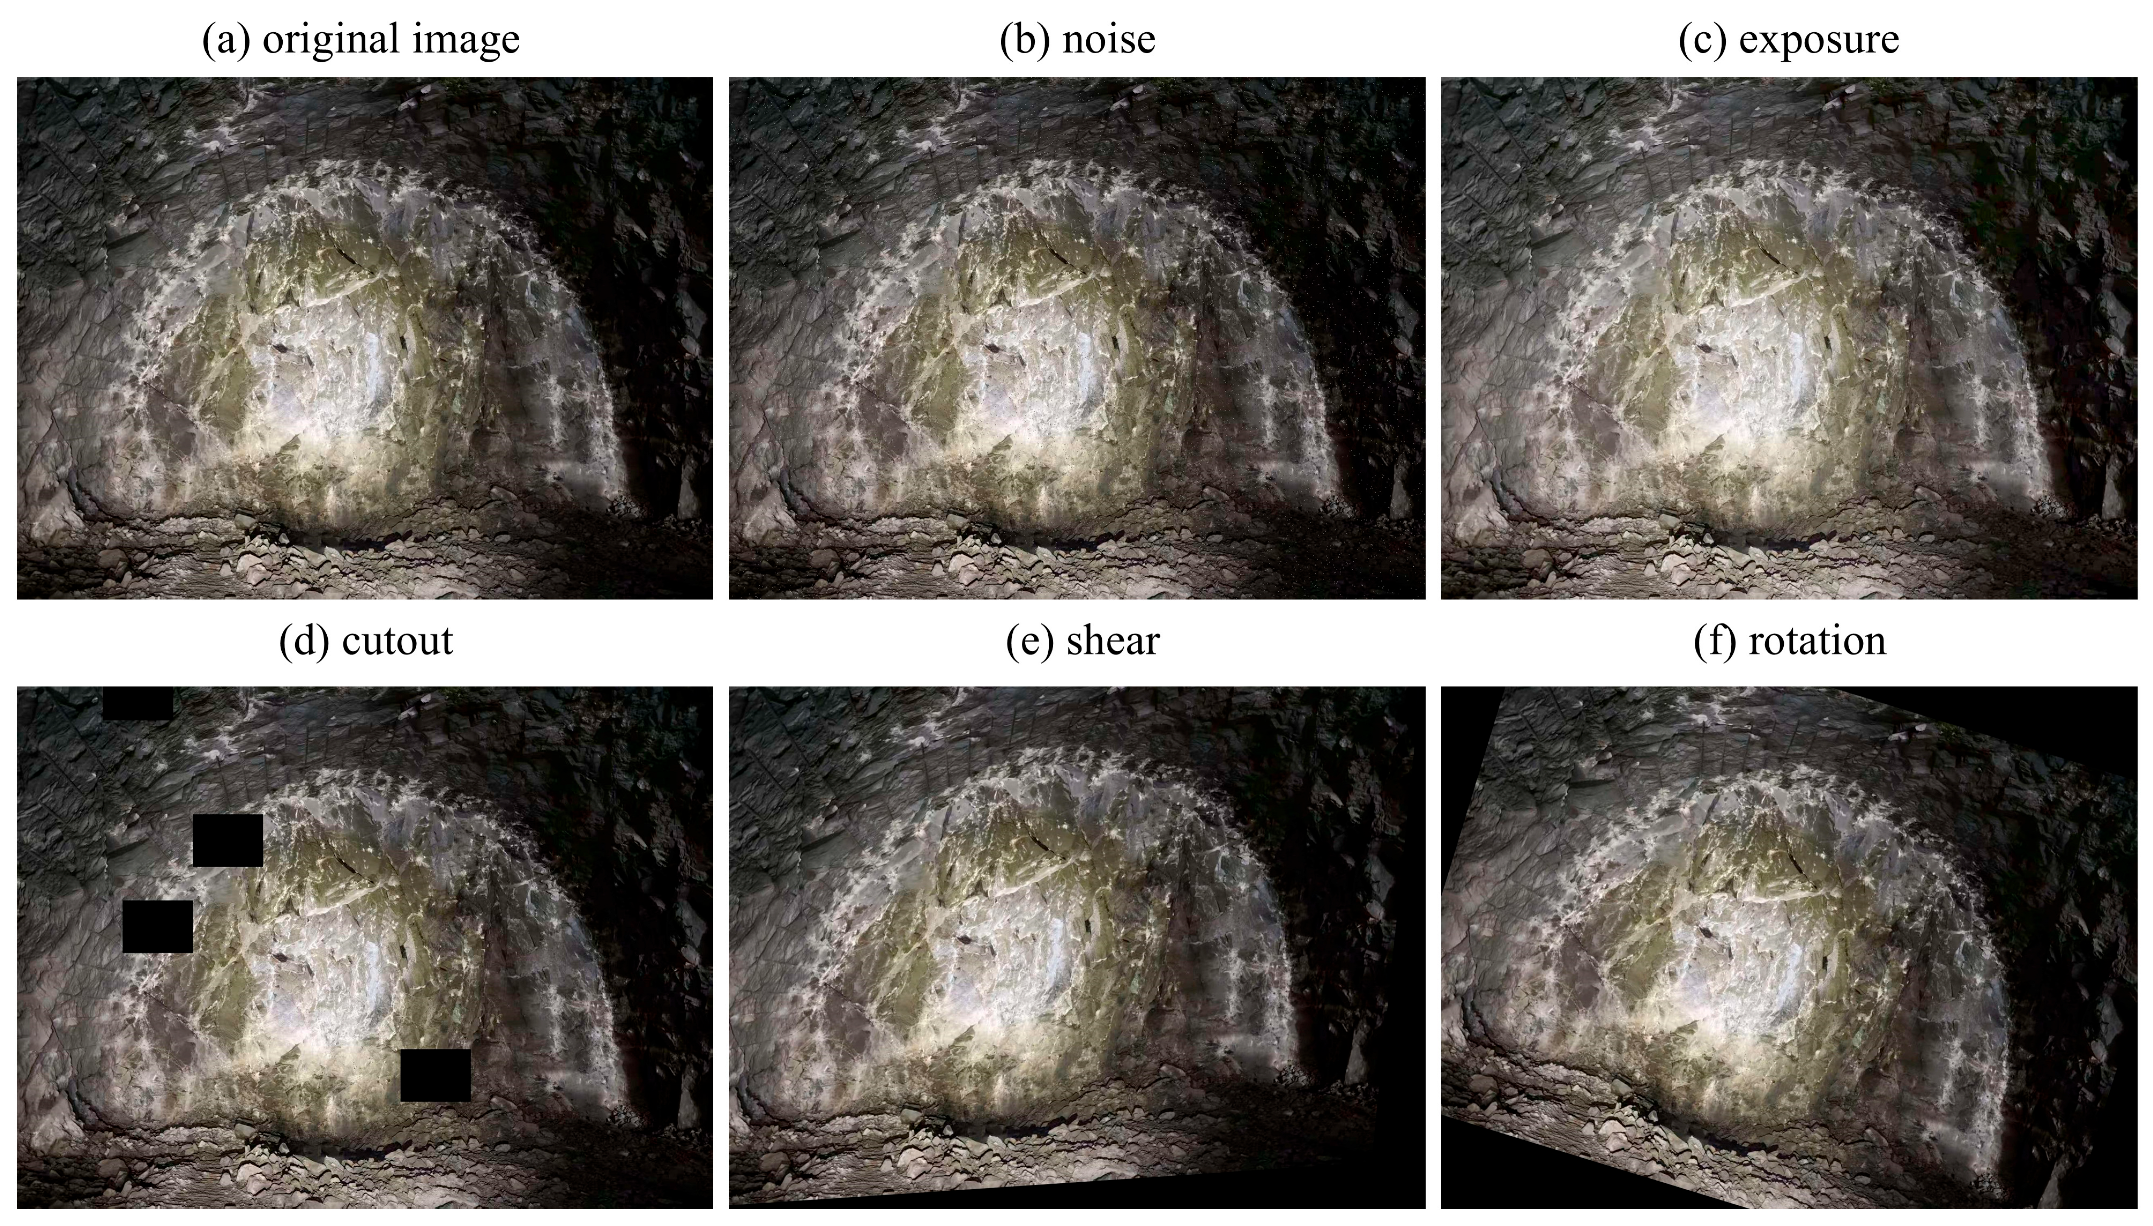
To enhance dataset diversity and model robustness, comprehensive image augmentation was applied, including random rotation, shearing, exposure, Gaussian noise addition, and cutout. The effectiveness of these techniques is demonstrated in Figure 4, showing augmented images that preserve essential geological features while introducing realistic variations.

3. Methodology and Experiment Setup

3.1. Random-Mamba Model

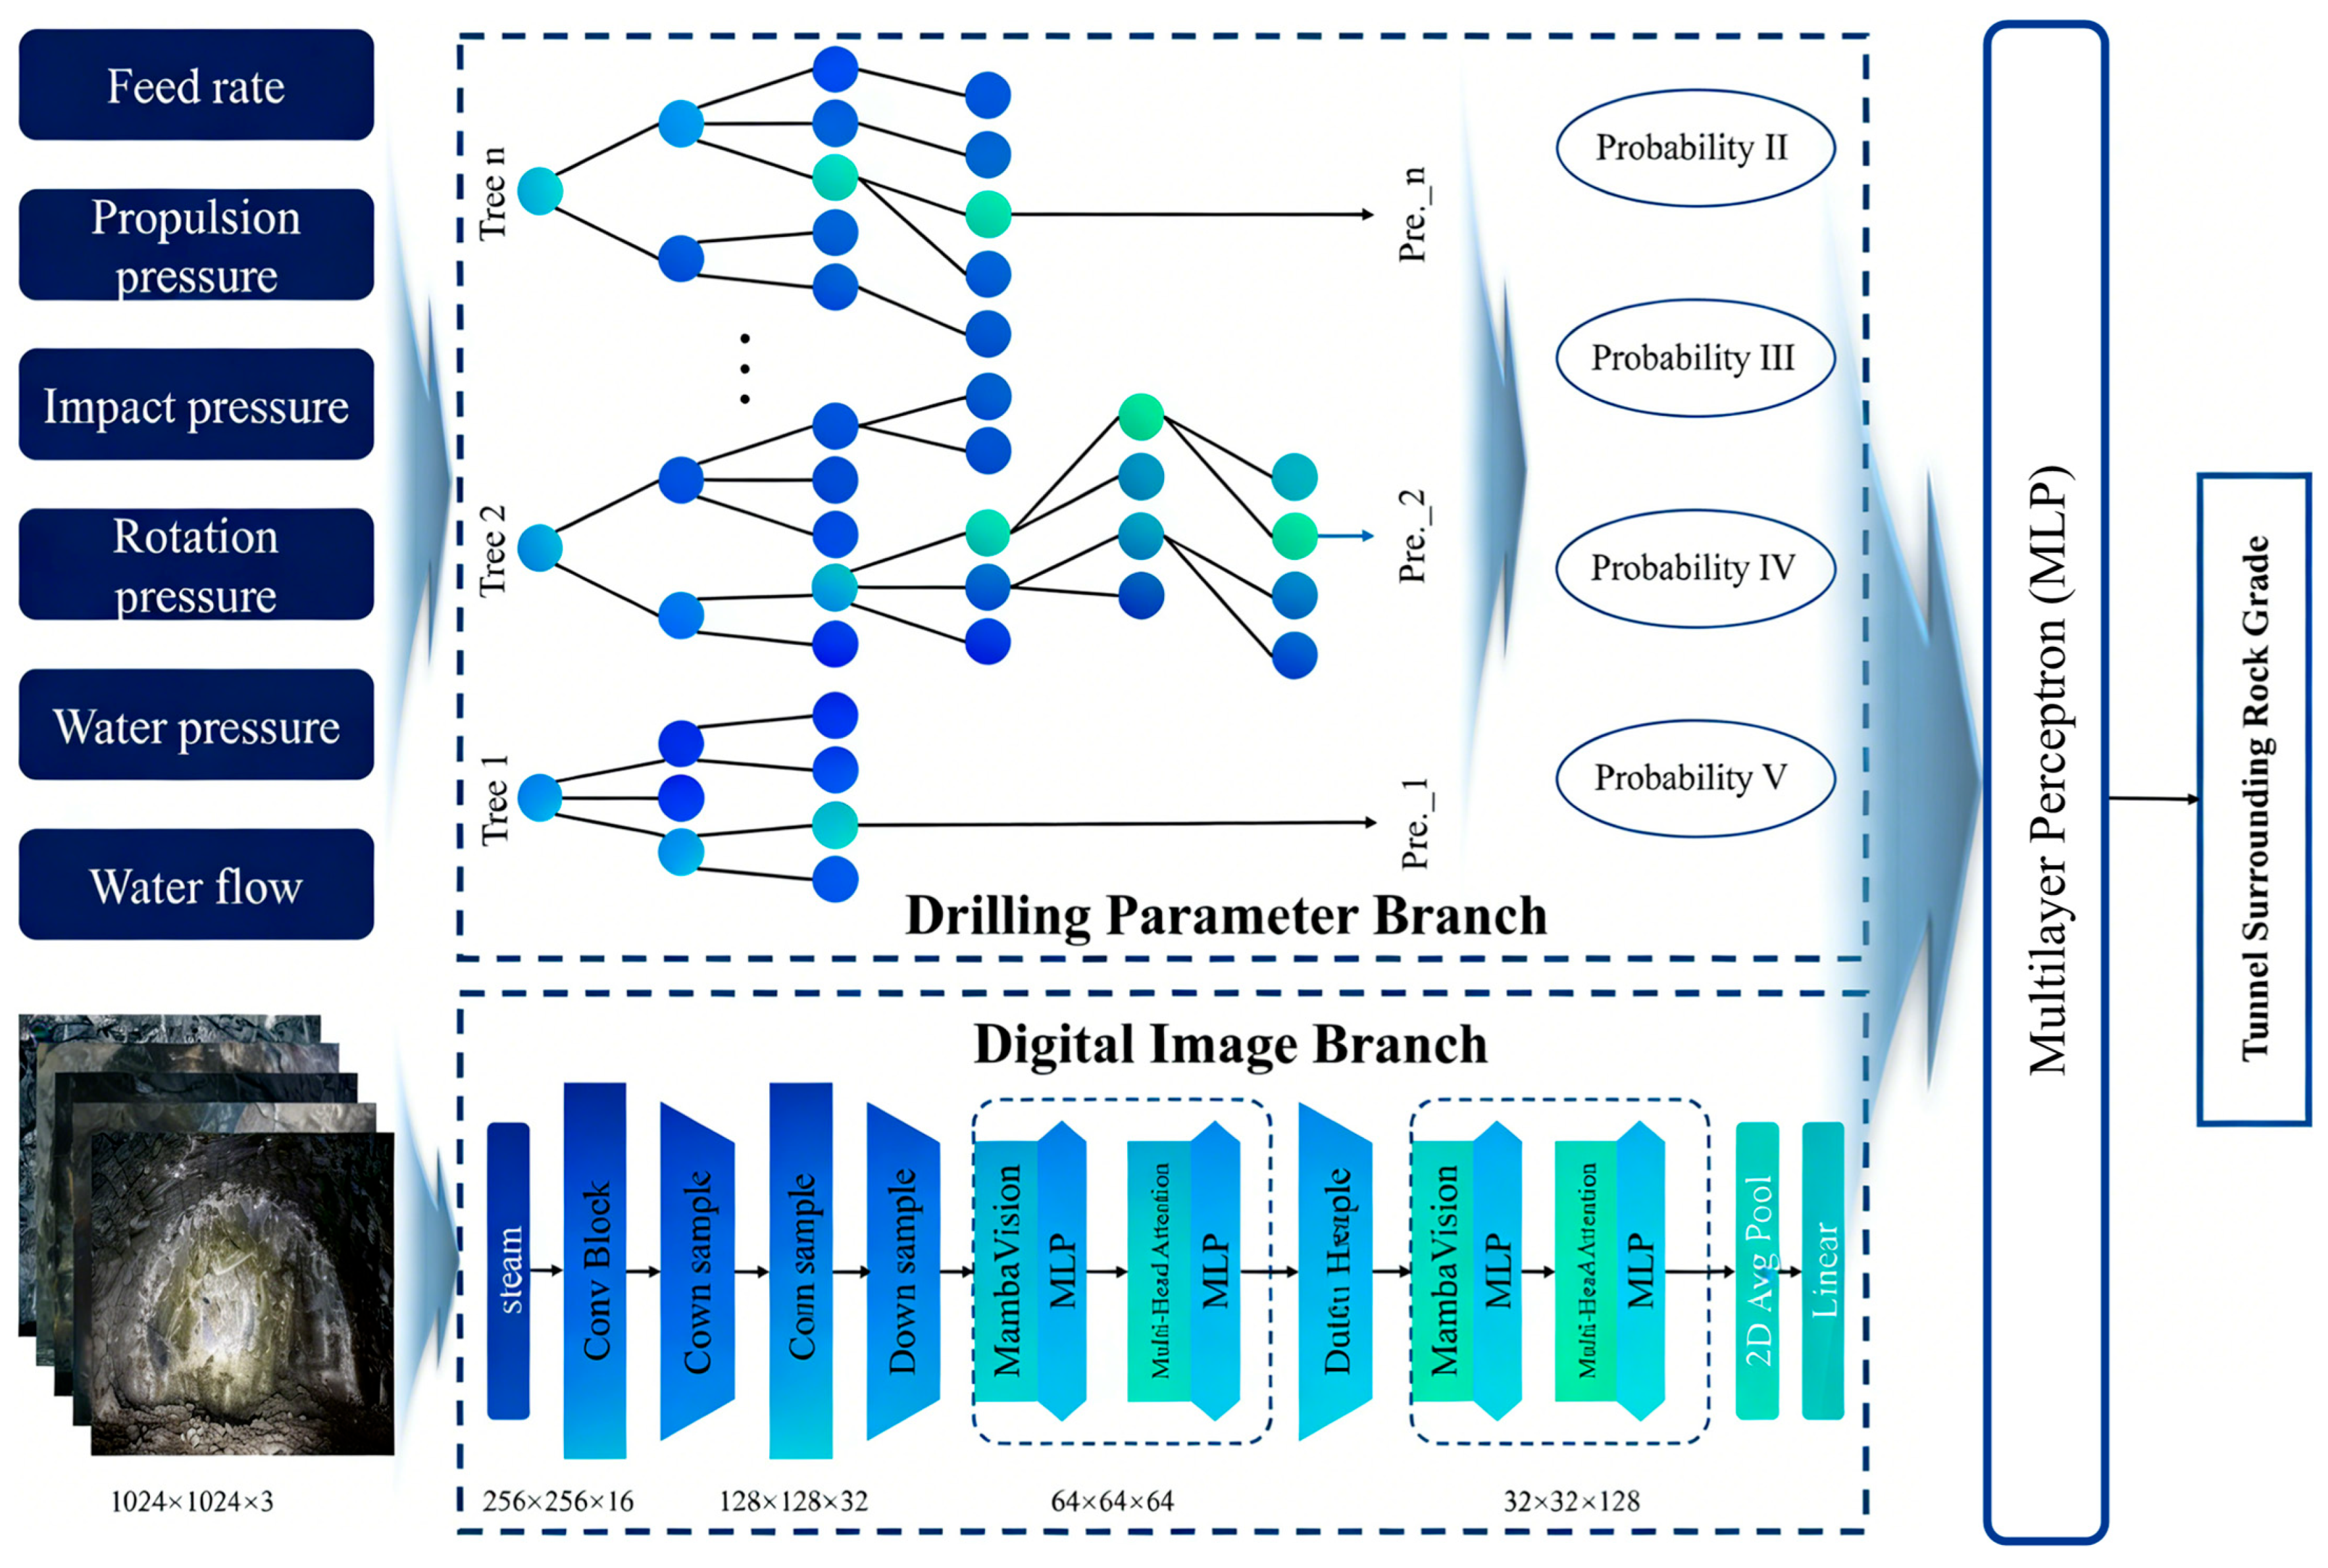
This paper proposes Random-Mamba, a novel hybrid model for surrounding rock classification that integrates both drilling parameters and digital images through the dual-branch architecture, as illustrated in Figure 5.
The upper branch, designated as the Drilling Parameter Branch, processes the six-dimensional vector of drilling parameters. It employs a Random Forest classifier to directly output a four-dimensional probability vector, where each element represents the predicted probability for one of the four rock grades (II, III, IV, and V).
The lower branch, termed the Digital Image Branch, is designed to extract rich visual features from tunnel face images. It utilizes a MambaVision backbone to transform the input image into a compact 16-dimensional feature vector, capturing essential geological characteristics.
Finally, the four-dimensional probability vector from the upper branch and the 16-dimensional feature vector from the lower branch are concatenated, forming a 20-dimensional fused feature vector. This combined representation is fed into a Multi-Layer Perceptron (MLP) for the final rock grade prediction. This architecture effectively leverages the complementary strengths of structured numerical data and unstructured visual information.
The hyperparameters for each branch were independently optimized through pre-study on their respective single-modality classification tasks, as shown in Table 5. The Random Forest configuration achieved the highest accuracy (78.5%) when using only drilling parameters, while the MambaVision-Tiny model attained 84.2% accuracy on tunnel face image classification alone. These optimal settings were then directly transferred to the dual-branch fusion framework without further modification. The MLP fusion module was trained end-to-end with the combined features, using early stopping to prevent overfitting.

3.2. Drilling Parameter Branch: Random Forest Model

The Random Forest algorithm was selected for the drilling parameter branch due to its renowned robustness against overfitting, its ability to model complex non-linear relationships, and its inherent feature importance assessment capability. It operates by constructing a multitude of decision trees during training and outputting the mode of the grades for classification. The hyperparameters of this branch are shown in Table 5.

3.3. Digital Image Branch: MambaVision Model

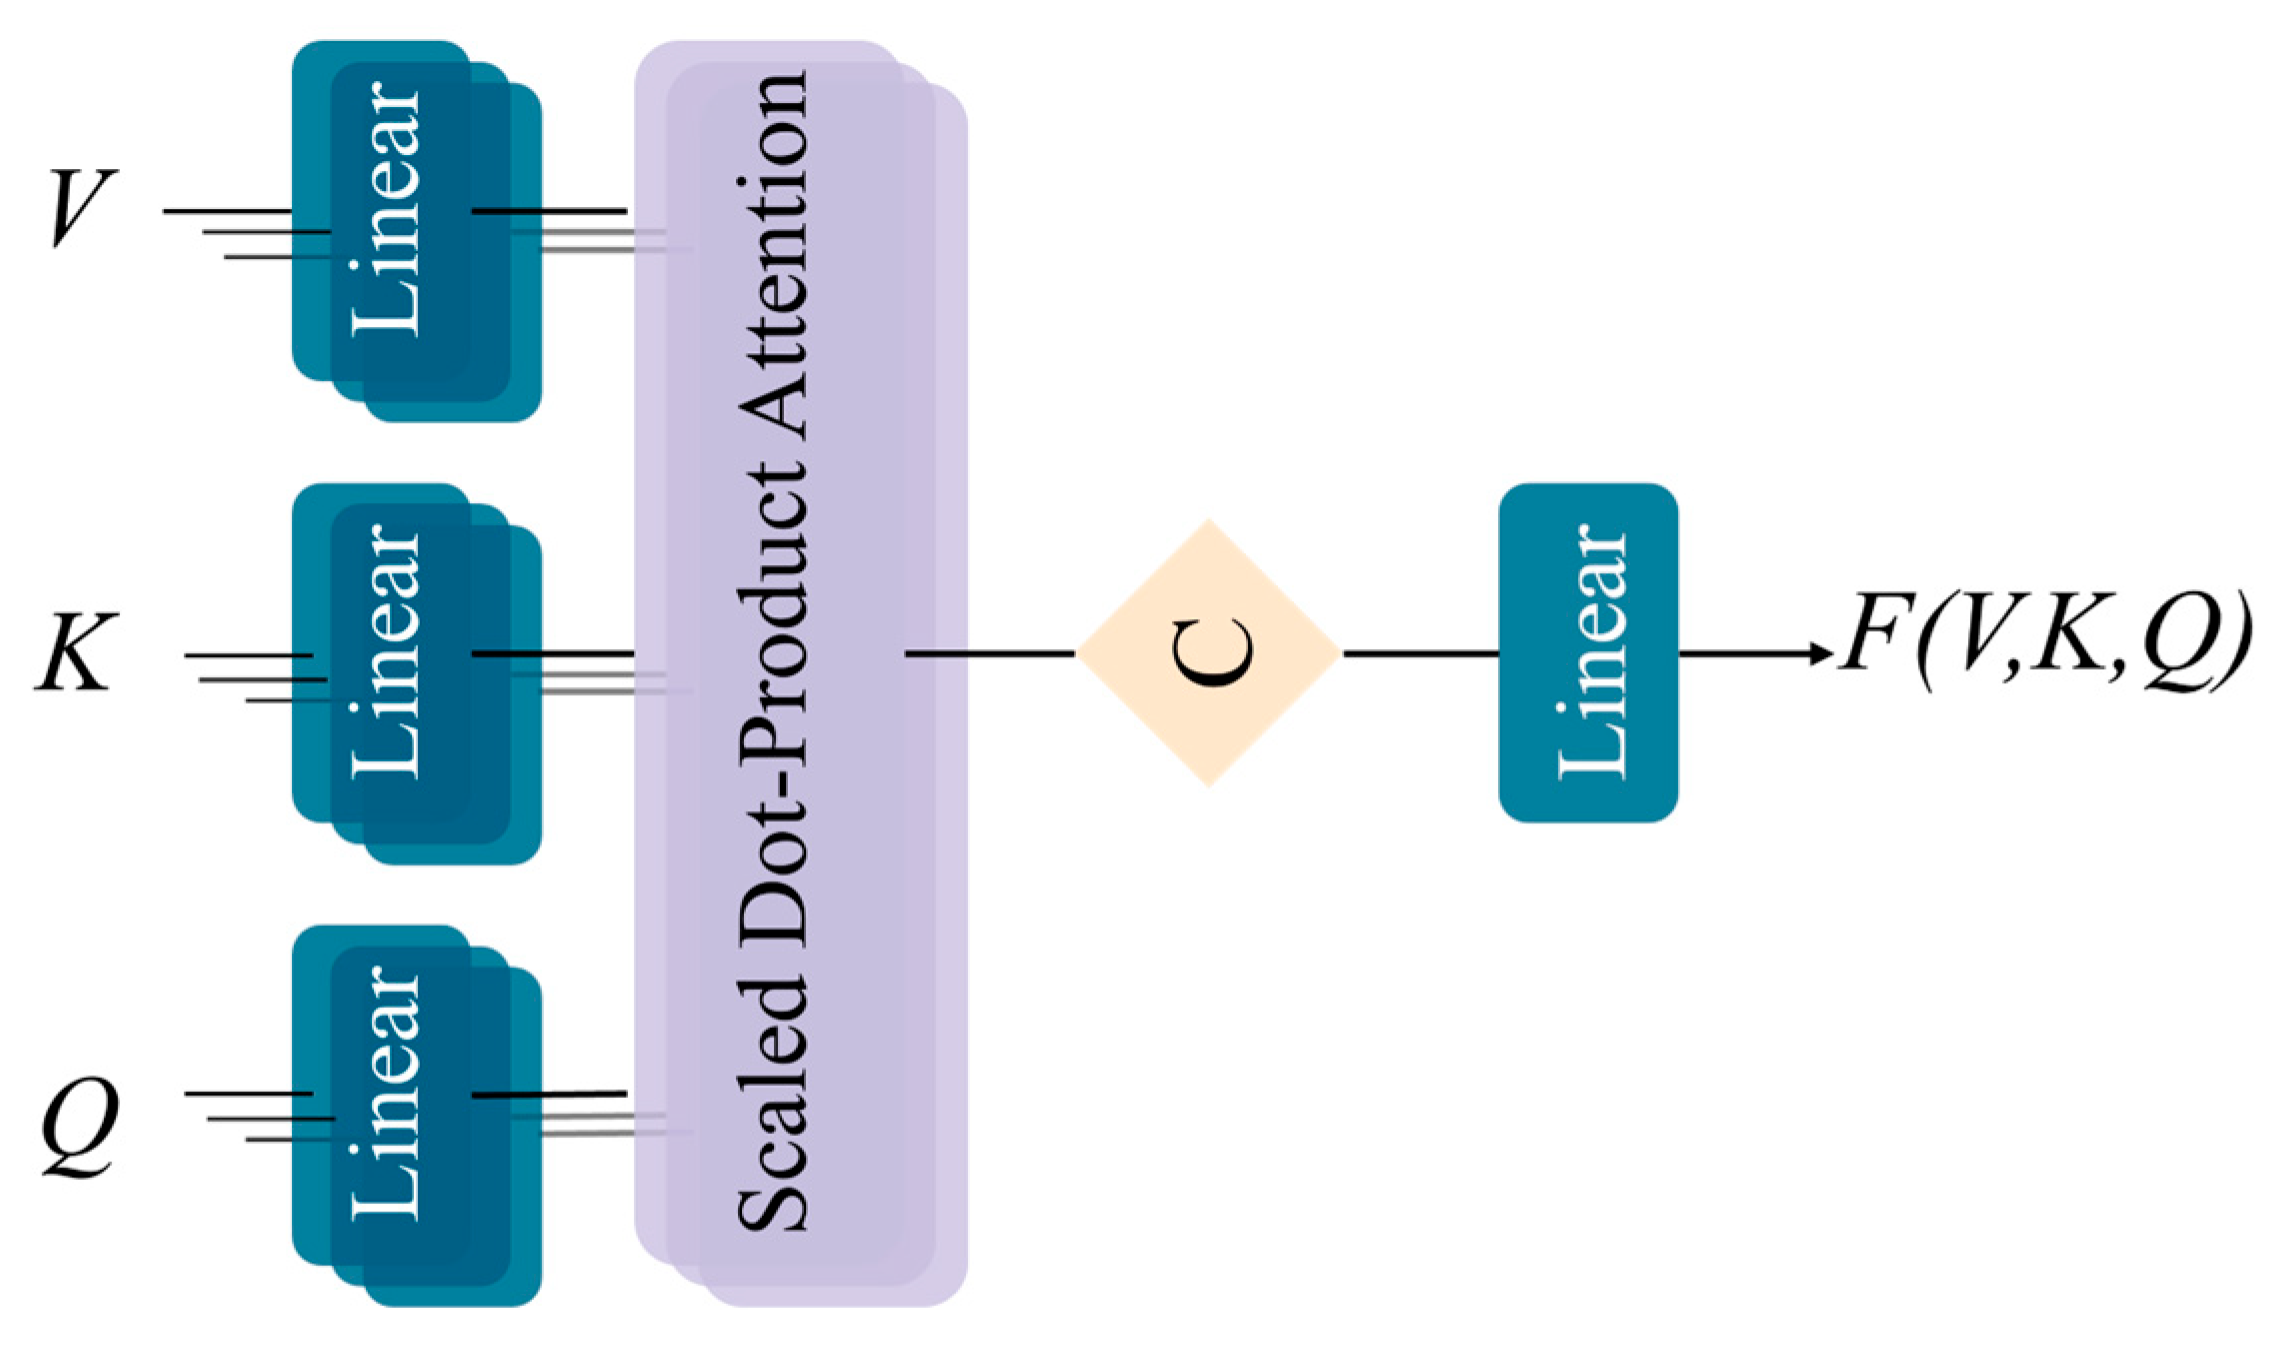
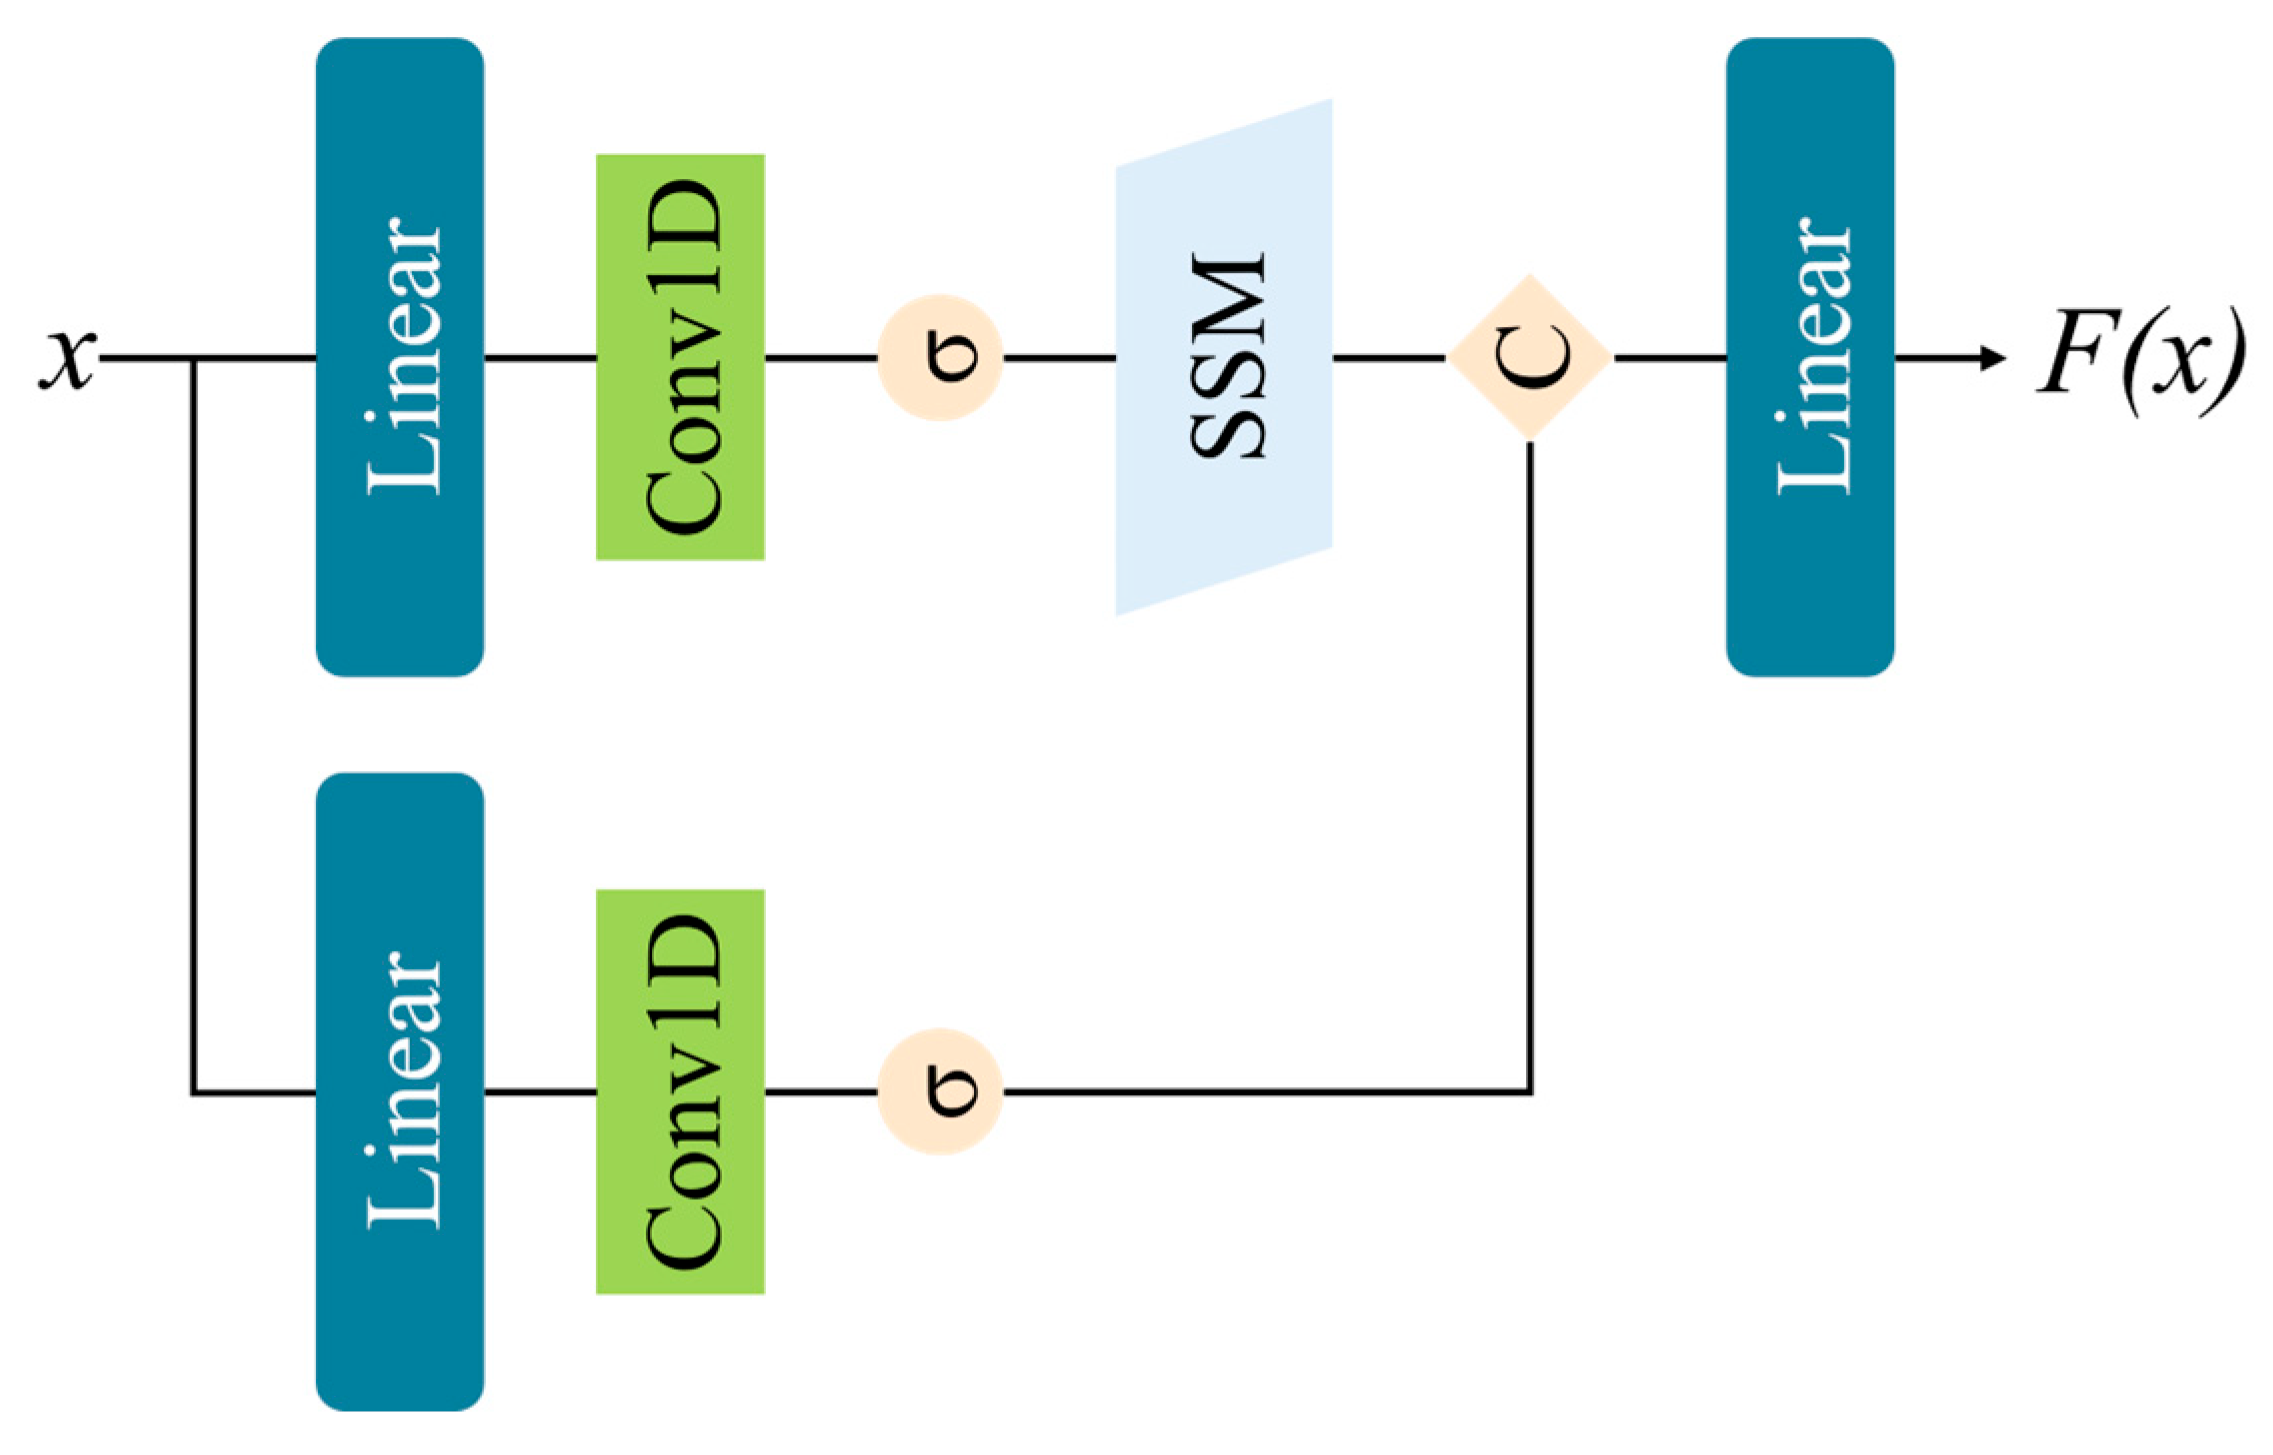
The Digital Image Branch employs MambaVision, a state-space model architecture that has demonstrated remarkable performance in visual tasks. Its primary advantage lies in its linear computational complexity with respect to sequence length, enabling efficient processing of high-resolution images while maintaining a global receptive field, a critical feature for analyzing the large-scale geological structures present in tunnel faces. As detailed in Figure 6, the core MambaVision block utilizes a structured state space sequence model for data-dependent global visual context modeling, shown in Equations (1)–(3). Furthermore, Figure 7 illustrates the Multi-Head Self-Attention module, which is strategically integrated in early stages to complement the Mamba blocks by capturing fine-grained local feature dependencies shown in Equations (4) and (5).
y 1 = S c a n ( σ ( C o n v ( L i n e a r ( C , C 2 ) ( x ) ) ) )
y 2 = σ ( C o n v ( L i n e a r ( C , C 2 ) ( x ) ) )
F ( x ) = L i n e a r ( C 2 , C ) ( C o n c a t ( y 1 , y 2 ) )
where x is the input, C is the channel number, F(x) is the output of the MambaVision block, scan, σ, conv, Linear, and Concatenation were operators.
A t t e n t i o n ( Q , K , V ) = S o f t m a x ( Q K T d h ) V
F ( Q , K , V ) = L i n e a r ( C , 2 C ) ( C o n c a t ( A t t . 1 , , A t t . n ) )
where Q, K, V were the input matrices, C is the channel number, F(Q,K,V) is the output of the Multi-Head Attention block, Softmax, Linear, and Concatenation were operators.
To adapt the original MambaVision model for the Random-Mamba model, the final classification head was modified. Instead of projecting features directly to grade logits, the network now outputs a 16-dimensional feature vector. This vector serves as a compact visual descriptor for the subsequent fusion layer. The hyperparameters of this branch are shown in Table 5.

3.4. Output Fusion Strategy

The fusion of information from the two branches is achieved through a relatively simple yet effective MLP. This concatenation, followed by an MLP, is a standard practice in multi-modal learning. It allows the network to learn a joint representation where cross-modal correlations can be captured by the non-linear layers, even if the original feature spaces are not semantically aligned [35,36]. The MLP acts as a universal approximator that can map the concatenated vector to the final classification space.
This MLP takes the concatenated 20-dimensional vector as input. Its architecture consists of two fully connected layers. The hyperparameters of MLP are shown in Table 4. This design allows the network to learn a non-linear mapping that optimally combines the probabilistic judgment from the drilling data with the rich feature representation from the visual data, thereby making a more informed and robust final classification.

3.5. Comparative Models and Evaluation Metrics

3.5.1. Comparative Models

To rigorously validate the effectiveness of the proposed Random-Mamba model, its performance is compared against several baseline and alternative hybrid models. The baseline models include: (1) SVM: A Support Vector Machine using only drilling parameters. (2) XGBoost: a XGBoost using only drilling parameters. (3) RF: A Random Forest using only drilling parameters. (4) ResNet: A ResNet-50 model using only images. (5) ConvNeXt: a ConvNeXt-Tiny model using only images. (6) ViT: a ViT-B/16 model using only images. (7) SwinT: A Swin Transformer using only images. (8) MambaVision: MambaVision using only images.
Furthermore, to isolate the contribution of the specific branch components, each parameter branch (SVM, XGBoost, Random Forest), all five image backbones (ResNet, ConvNeXt, ViT, Swin, MambaVision) were combined, resulting in 15 hybrid models plus 5 single-modality image models and 3 single-modality parameter models, a total of 23 models. All hybrid models employ the same feature-level fusion strategy, concatenation followed by MLP, for fair comparison.

3.5.2. Evaluation Metrics

The models are evaluated using standard metrics for multi-grade classification. For a comprehensive assessment, Accuracy shown in (6), Precision shown in (7), Recall shown in (8), and F1-score shown in (9) were reported. The metrics are calculated as follows, where TP, FP, TN, and FN denote True Positives, False Positives, True Negatives, and False Negatives for each grade, and N is the total number of samples:
A c c u r a c y = T P + T N N
P r e c i s i o n = T P ( T P + F P )
R e c a l l = T P ( T P + F N )
F 1 - s c o r e = 2 × P r e c i s i o n × R e c a l l P r e c i s i o n + R e c a l l
The macro-average is computed for Precision, Recall, and F1-score to ensure equal weight for all grades.
Additionally, a confusion matrix is provided to offer detailed insight into the classification performance across all individual rock grades.

3.6. Experiment Setup

The dataset comprising 3361 synchronized samples was randomly divided into the training set, validation set, and test set following a ratio of 7:2:1. The random split was chosen to ensure that all rock grades are represented in each subset, which is critical for evaluating model performance on rare classes. To mitigate potential spatial correlation, the data were shuffled before splitting, and a fixed random seed was used for reproducibility. For all random processes, including dataset division, the random seed was fixed.
All experiments were conducted on a server equipped with an NVIDIA RTX 4090 GPU (NVIDIA Corporation, Santa Clara, CA, USA) and an Intel Core i9–13900K CPU (Intel Corporation, Santa Clara, CA, USA). The models were implemented using PyTorch 2.0. A consistent batch size of 32 was used for training. The AdamW optimizer was employed with an initial learning rate of 3 × 10⁻⁴, betas of (0.9, 0.999), and a weight decay of 0.01. A cosine annealing learning rate scheduler was used to decay the learning rate to 1 × 10⁻⁶ over the training epochs.
For the Digital Image Branch, the MambaVision-Tiny variant was adopted. The input tunnel face images were resized and center-cropped to a resolution of 512 × 512 pixels. The model was initialized with weights pretrained on the ImageNet-1K dataset. The model was trained for a maximum of 1000 epochs with an early stopping mechanism monitoring the validation loss with a patience of 20 epochs. The training typically converged within 200–400 epochs.

4. Results and Discussion

4.1. Model Training and Validation Results

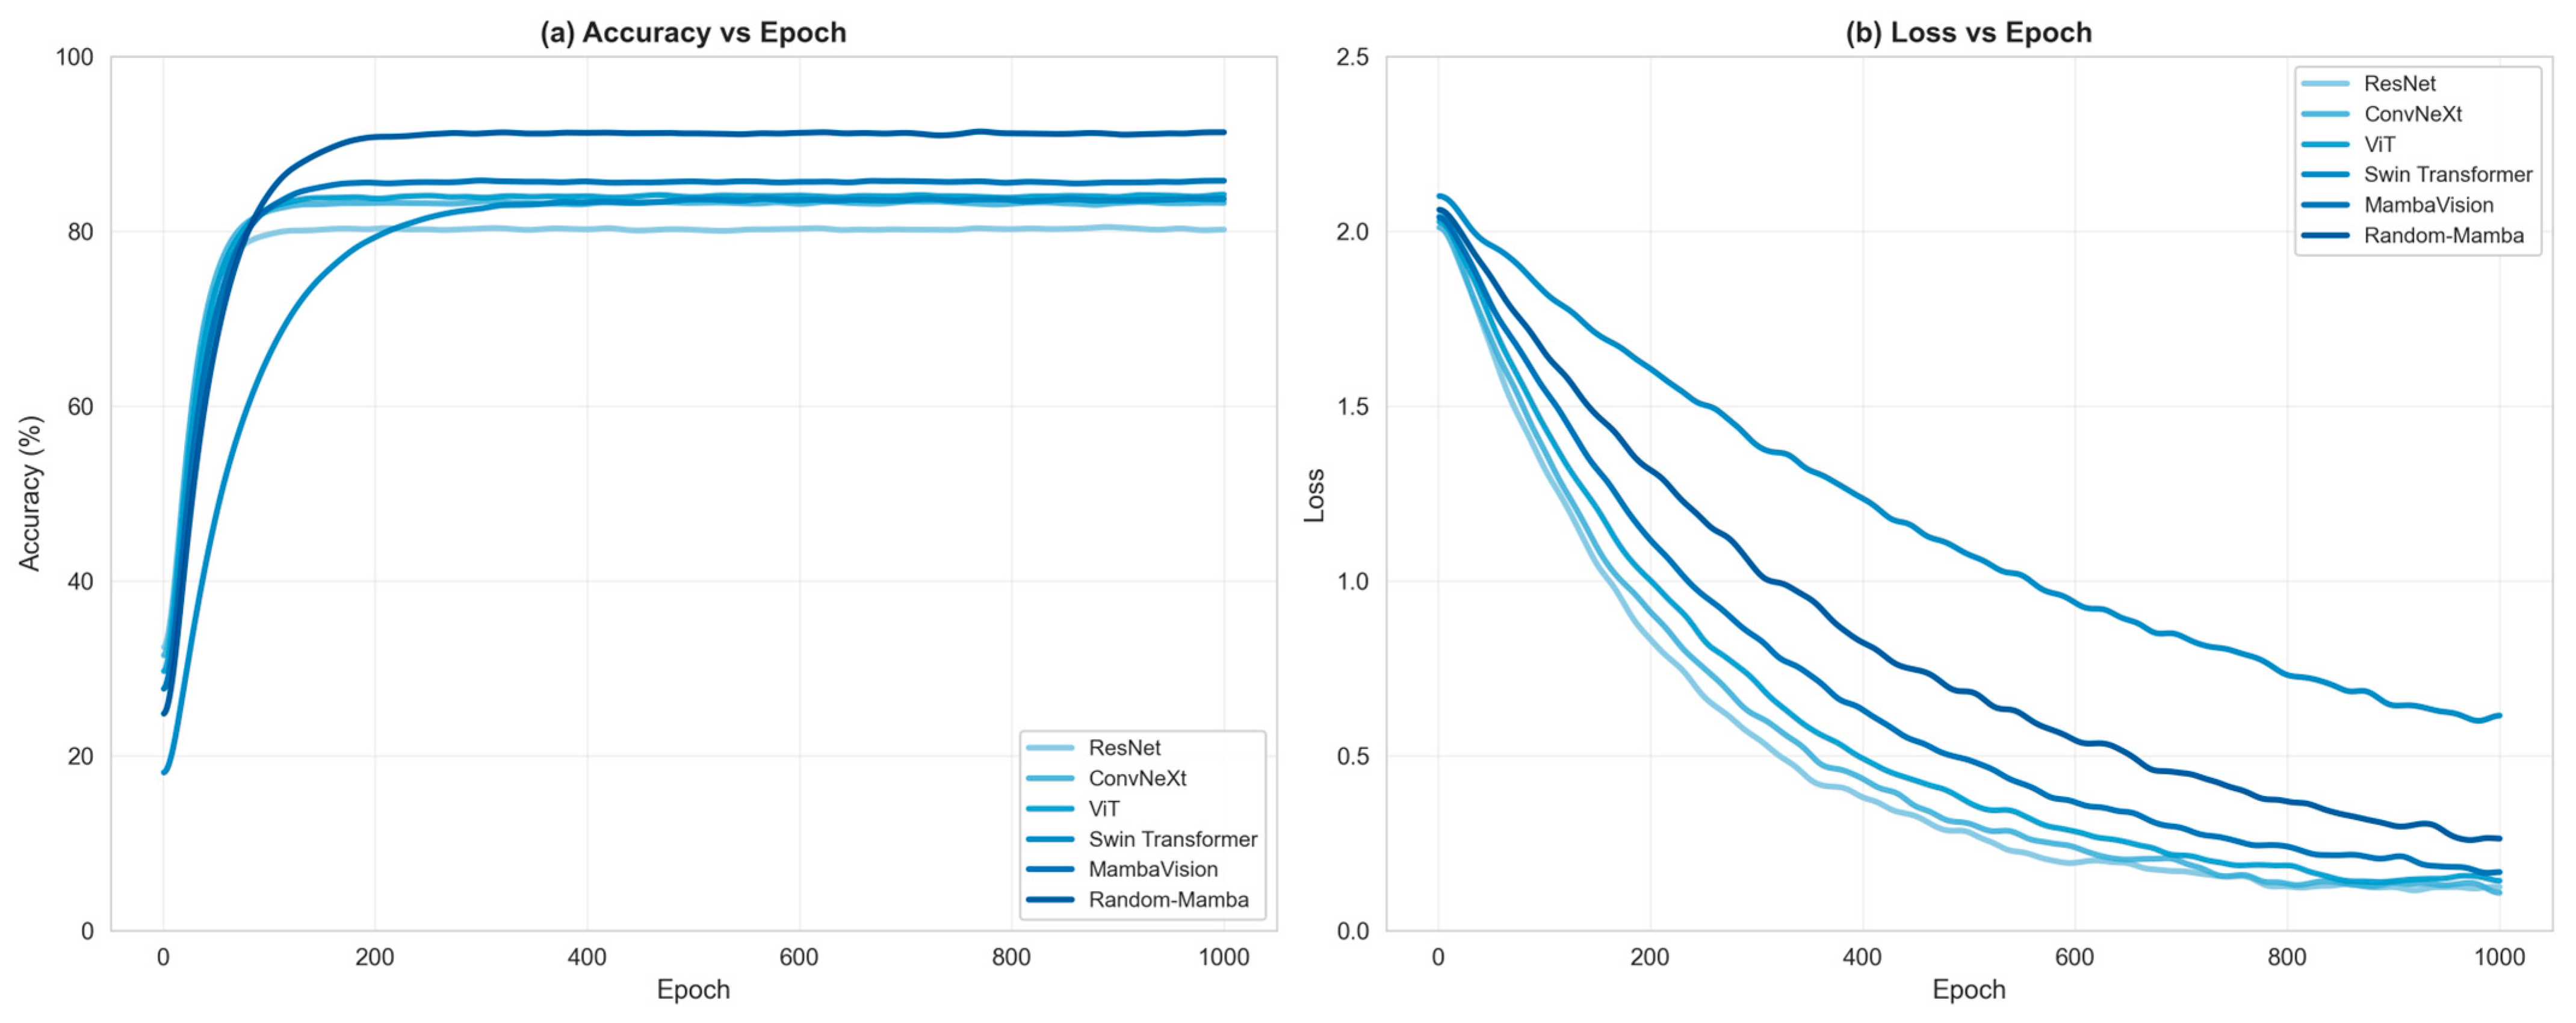
We have selected six representative models to show the training process results, as illustrated in Figure 8, which presents both accuracy and loss trajectories across training epochs. All models were trained with a maximum of 1000 epochs, though convergence patterns varied significantly across architectures. The proposed Random-Mamba model demonstrated an efficient convergence, reaching near-optimal performance by epoch 400 with a final training accuracy of 95.84% and validation accuracy of 91.21%. Transformer-based models, including Swin Transformer and ViT, exhibited slower convergence but ultimately achieved competitive performance. CNN-based models such as ResNet and ConvNeXt showed the fastest initial convergence but plateaued at lower performance levels compared to transformer-based and Mamba-based architectures.
Table 6 presents the 5-fold cross-validation results. The proposed Random-Mamba model consistently achieved the highest performance across all folds, with a mean accuracy (MA) of 91.21% and macro-F1 score of 90.82%. Among image-only models, MambaVision, with a mean accuracy of 85.62%, outperforms Swin Transformer at 84.93%, ViT at 84.04%, ConvNeXt at 83.21%, and ResNet at 81.52%, which confirms the advantage of MambaVision as the image backbone. Random Forest, with a mean accuracy of 79.51%, slightly outperformed XGBoost and SVM in parameter-only mode. All hybrid models surpassed their single-modality counterparts, with Random-Swin reaching 88.83% and SVM-ResNet with 85.11%.

4.2. Model Comparison

4.2.1. Quantitative Comparison

The performance of all twenty-three models on the independent test set is summarized in Table 7. The proposed Random-Mamba model achieves the highest overall accuracy of 92.12%, with macro precision, recall, and F1 scores of 91.82%, 91.57%, and 91.66%, respectively. This represents a significant improvement of 2.6 percentage points over the next best hybrid model, Random-ViT, with an accuracy of 89.51%. Among image-only models, MambaVision outperforms ResNet, ConvNeXt, ViT, and Swin Transformer with accuracy of 81.49%, 83.20%, 84.03% and 84.91%, respectively. For parameter-only models, Random Forest slightly edges out XGBoost and SVM. Notably, when integrated into hybrid models, Random Forest-based hybrids consistently outperform their XGBoost and SVM counterparts, indicating that Random Forest’s feature representations are more complementary to visual features extracted by MambaVision.

4.2.2. Confusion Matrix Analysis

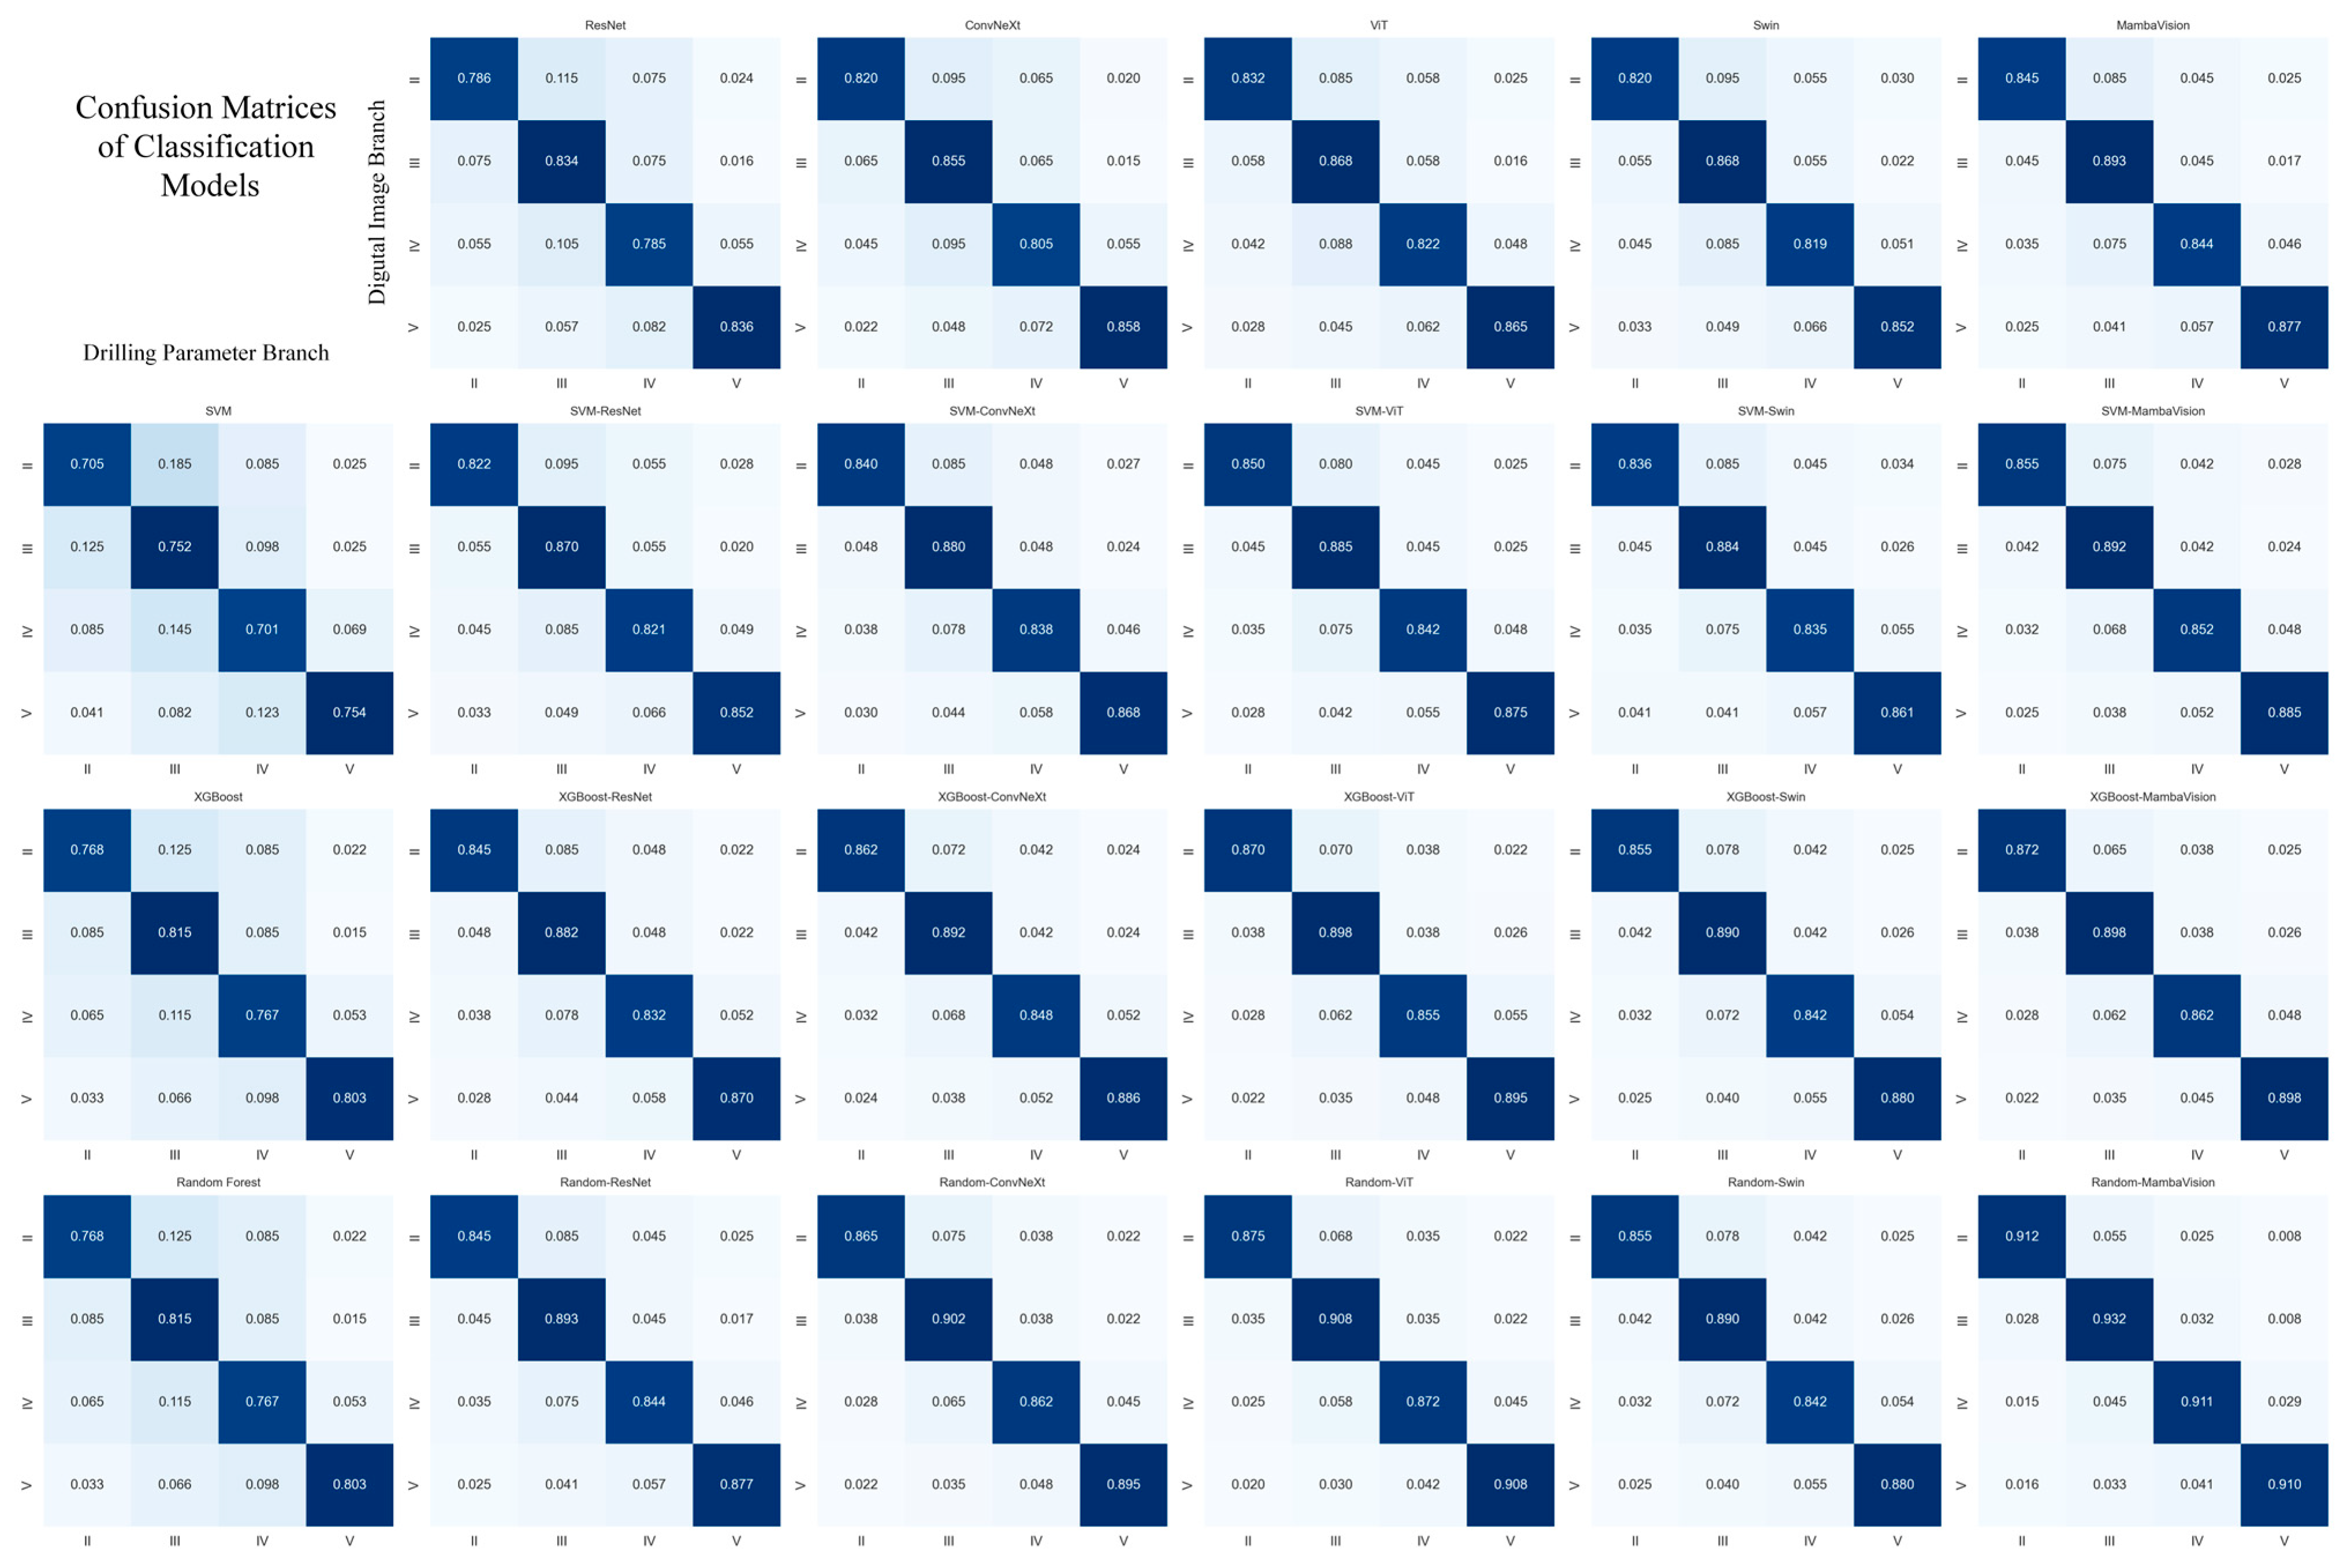
The confusion matrices for all twenty-three models are arranged in a 4 × 6 grid in Figure 9. The layout groups models by their parameter branch: the first row contains the image-only models, including ResNet, ConvNeXt, ViT, Swin Transformer, and MambaVision; the second row contains SVM-based hybrids; the third row contains XGBoost-based hybrids; and the fourth row contains Random Forest-based hybrids. Within each row, the columns progress from parameter-only to hybrids with increasingly powerful image backbones.
Random-Mamba exhibits the strongest diagonal dominance, with true positive rates of 91.2% for Grade II, 93.2% for Grade III, 91.1% for Grade IV, and 91.0% for Grade V. Parameter-only models, SVM, XGBoost, and Random Forest, show substantial confusion, especially between Grades III and IV. Image-only models perform better but still exhibit noticeable errors. The hybrid models progressively reduce these errors, with XGBoost-Mamba and Random-Swin improving clearly, yet still trailing the full Random-Mamba.
Misclassifications are primarily confined to adjacent grades, especially Grade III and IV. This is primarily because the mechanical and visual characteristics of Grade III and Grade IV rocks often overlap: both can exhibit moderate strength and joint development, making boundary determination challenging even for human experts. The proposed Random-Mamba reduces such adjacent-class errors by 40–50% compared to single-modality models, like Random Forest. Errors between non-adjacent classes, like Grade II and V, are extremely rare, smaller than 0.5%, indicating that the model rarely confuses fundamentally different rock masses.

4.3. Ablation Study

To further validate the design choices of the Random-Mamba model, an ablation study was conducted focusing on three aspects: (1) the contribution of each modality, (2) the choice of algorithms within each branch, (3) the fusion strategy, and (4) the transfer learning. In addition, we conducted an ablation where the parameter branch was trained without class_weight = ‘balanced’ to investigate the impact of class imbalance. The results are summarized in Table 8, which also reports model size and inference time per sample. All reported metrics are averages of five independent runs with different random seeds. The small standard deviations, typically ≤1.0%, indicate that the observed differences are statistically reliable.
From Table 8, several key observations about the model architecture can be drawn. First, all dual-branch configurations substantially outperform their single-modality counterparts, confirming the synergistic value of fusing drilling parameters and images. Second, among image backbones, MambaVision consistently yields the best performance when paired with any parameter branch, and this advantage is magnified in the full Random-Mamba model. Third, Random Forest proves to be the optimal choice for the parameter branch: despite having only marginally higher single-modality accuracy than XGBoost, its fusion with MambaVision achieves a 4.0 percentage point improvement compared with XGBoost-Mamba, from 88.1% to 92.1%, indicating that Random Forest’s feature representations are more complementary to visual features. Fourth, although the attention-based fusion method achieved a slight improvement of 0.3% in accuracy, it increased the inference time by 42%, from 6.9 ms to 9.8 ms, and also led to an increase in the number of parameters. Based on this, we still retain the MLP as the fusion method.
What is more, the effect of pretraining weight was further quantified. As shown in Table 8, training MambaVision from scratch reduces the validation accuracy by 3.3 percentage points, and the full Random-Mamba model loses 1.8 percentage points without pretrained weights. This confirms that transfer learning provides a meaningful but not indispensable boost; the architectural advantages of MambaVision remain effective even without pretraining.
Applying class balancing improves the F1-score for Grade V by approximately 10% for Random Forest alone. In the full Random-Mamba model, the balanced RF contributes to a Grade V F1 of 91.0%.
Finally, the inference time of Random-Mamba is well within real-time requirements, while its parameter count remains moderate. The TBM monitoring system samples drilling parameters at 10 Hz. The proposed Random-Mamba model has an average inference time of 6.9 ms per sample, which is well below the 100 ms data acquisition interval, leaving sufficient margin for data transmission and other processing tasks. During one meter of tunnel advance, the model can process more than 500 samples, enabling continuous real-time classification. Therefore, the model meets the real-time requirements of on-site tunnel construction.
All of the above results collectively validate the architectural choices and confirm the practical viability of the proposed method.

4.4. Sensitivity Analysis

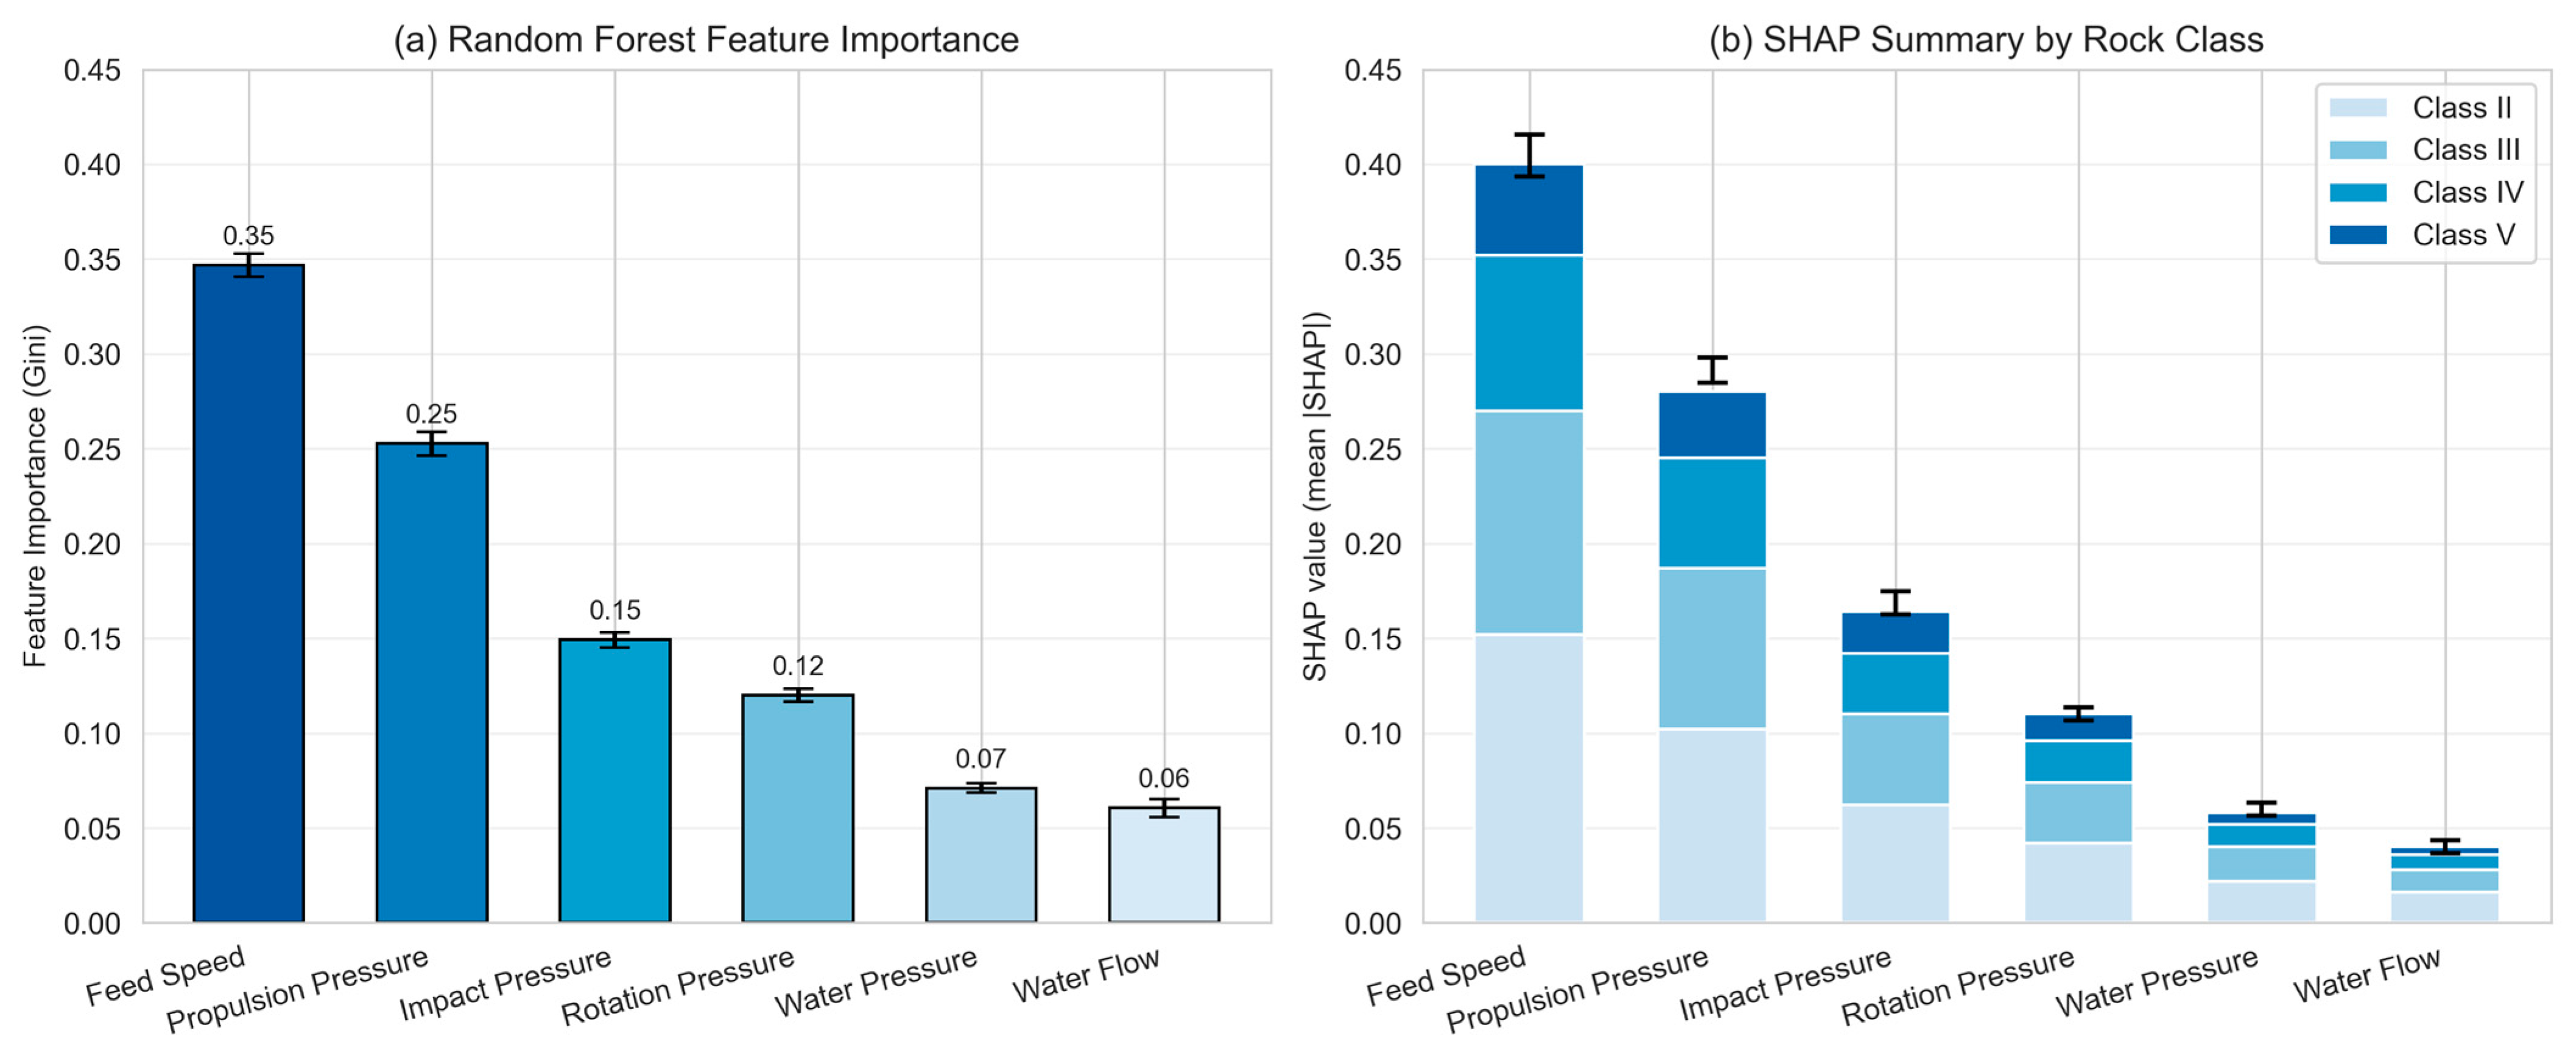
To interpret the contribution of each drilling parameter, we employed two complementary methods: Random Forest’s built-in Gini importance and SHapley Additive exPlanations (SHAP) values, which provide a unified measure of feature importance based on game theory. Both methods were evaluated over five repeated experiments, and the results are presented in Figure 10.
Figure 10a shows the Random Forest importance scores, where feed speed ranks highest at 0.35 ± 0.01, followed by propulsion pressure at 0.25 ± 0.01 and impact pressure at 0.15 ± 0.01. Rotation pressure, water pressure, and water flow have lower scores, 0.12, 0.08, and 0.05, respectively.
Figure 10b presents the SHAP summary, where the total height of each bar represents the mean absolute SHAP value, and the colors indicate the contribution to each rock class. The ordering of features by SHAP is identical: feed speed with a value of 0.41, propulsion pressure at 0.29, impact pressure at 0.17, rotation pressure at 0.11, water pressure at 0.06, and water flow at 0.04. The absolute values differ between the two methods, which is expected because they quantify importance on different scales. However, the consistent ranking across methods confirms the robustness of the analysis.
The SHAP decomposition further reveals that for hard rock classes, such as II and III, feed speed and propulsion pressure dominate the contribution, while for soft classes, IV and V, water-related parameters play a slightly larger role, albeit still minor. These findings align with rock mechanics principles: feed speed directly reflects penetration resistance, and propulsion pressure indicates thrust requirement. The results provide actionable guidance for parameter prioritization in practical drilling optimization and real-time monitoring systems.

4.5. Discussion

4.5.1. Discussion About the Results

The observed performance of the proposed Random-Mamba model is attributed to two principal factors. First, the model architecture integrates two complementary data types. Drilling parameters provide continuous, quantitative measurements of the mechanical interaction at the rock-drill interface. Parameters such as feed speed and propulsion pressure are directly related to the in situ strength and drillability of the rock. In contrast, digital images of the tunnel face capture qualitative information on geological structure, including joint patterns and weathering conditions, which are often not fully reflected in point-wise mechanical data. The fusion of these modalities allows the model to leverage both local mechanical responses and global structural context. Analysis of misclassified cases in comparative models suggests that this fusion is particularly effective in reducing ambiguity between adjacent rock classes, where single modality features frequently overlap.
Quantitative comparison with recent literature shows that Random-Mamba achieves a 92.12% accuracy, which is substantially higher than that of Dong et al. [26] early-fusion hybrid model with an accuracy of 83.0%. While direct comparisons are complicated by different datasets and test protocols, the consistent margin over the reproduced baseline hybrids confirms that the proposed architecture offers a state-of-the-art balance between accuracy and efficiency.
The choice of MambaVision as the image processing backbone was based on its architectural characteristics relative to the task requirements. Tunnel face image analysis necessitates the modeling of long-range spatial dependencies to identify extended geological features. While CNNs are computationally efficient, their local receptive fields can limit the capture of such large-scale patterns. Transformer models can capture global context but exhibit quadratic computational complexity with respect to image resolution. The state space model architecture of MambaVision offers linear scaling complexity while maintaining a global receptive field. This balance enables the processing of high-resolution site images within practical computational constraints, facilitating the extraction of features relevant to both detailed texture and macroscopic structure.
From an application perspective, the model utilizes six drilling parameters that are standard outputs of contemporary tunnel boring machine monitoring systems. This design choice ensures compatibility with existing site equipment, indicating a pathway for integration into real-time data workflows. The method provides an automated, data-driven supplement to conventional classification protocols, which often depend on intermittent laboratory testing or expert field assessment. The primary application value lies in its potential to offer a more consistent and immediate interpretation of rock mass conditions during excavation, which could inform decisions related to support selection and excavation parameters. Future implementation would require validation across a wider range of geological settings and machine types to further assess generalizability.

4.5.2. Limitations

Despite the promising results, this study has several limitations. First, the dataset originates from a single tunnel project. Generalization to other geological settings, such as soft ground, karst, and fault zones, remains to be validated. Second, the dataset is imbalanced, and although class weighting was applied, the performance on Grade V could still be improved with synthetic data generation. Third, the model was designed for TBM-driven tunnels; adaptation to other methods would require additional validation.

5. Conclusions and Future Work

This research has established and validated an integrated framework for intelligent surrounding rock classification. A synchronized multi-source dataset was constructed, comprising 3361 data groups that include six drilling parameters, tunnel face images, and expert-classified rock mass grades from the Dabashan Tunnel project. Analysis of this dataset informed the design of the Random-Mamba model, a novel dual-branch hybrid architecture that fuses a Random Forest for drilling parameter analysis with a MambaVision network for image feature extraction. Experimental results confirm the framework’s effectiveness in improving classification performance compared to conventional and single-modality methods.
The principal contributions of this study are: (1) a hybrid Random-Mamba architecture that achieves 92.12% accuracy, outperforming 22 baselines; (2) empirical evidence that MambaVision is better suited than CNN-based and ViT-based models for tunnel face analysis, and that Random Forest provides the most complementary feature representations.
The main contributions and findings of this study are as follows:
  • The proposed dual-branch Random-Mamba model proves highly effective for surrounding rock classification. Ablation studies demonstrate that dual-branch architecture significantly outperforms all single-modality baselines, confirming the synergistic value of fusing mechanical and visual information. Furthermore, the feature-level fusion strategy employing an MLP yields superior results compared to early concatenation or late fusion approaches, achieving an overall accuracy of 92.1% and a macro-F1 score of 91.6%.
  • The selection of Random Forest for the drilling parameter branch and MambaVision for the image branch is well-justified. Comparative experiments among twenty-three models reveal that Random Forest-based hybrids consistently outperform XGBoost-based counterparts, despite their similar single-modality performance, indicating that Random Forest’s feature representations are more complementary to visual features. MambaVision, with its linear computational complexity and global receptive field, achieves the highest accuracy with 85.6% among image-only models while maintaining competitive inference speed with 6.5 ms/sample. The complete Random-Mamba model balances accuracy with 92.1% and efficiency on speed and size, 6.9 ms/sample and 26.9 M parameters, confirming its practical viability.
  • SHAP-based sensitivity analysis identifies the relative importance of drilling parameters. Based on the Random Forest branch, the rank of six parameters from most to least influential follows as: feed speed, propulsion pressure, impact pressure, rotation pressure, water pressure, and water flow. This hierarchy aligns with rock mechanics principles and provides actionable guidance for parameter prioritization in real-world applications.
These findings collectively demonstrate that the proposed Random-Mamba model offers a robust, accurate, and real-time capable solution for intelligent surrounding rock classification, with strong potential for deployment in active tunnel construction environments. Future work will address dataset imbalance, extend applicability to diverse geological scenarios, and explore integration with digital-twin platforms for enhanced construction management.

Author Contributions

Conceptualization, P.Y. and L.L.; methodology, L.L.; software, L.L.; validation, Q.Z. and B.Z.; formal analysis, P.Y.; investigation, P.Y., D.Z. and Q.Z.; resources, B.Z.; data curation, B.Z.; writing—original draft preparation, P.Y. and Q.Z.; writing—review and editing, D.Z. and L.L.; visualization, D.Z. and Q.Z.; supervision, L.L.; project administration, B.Z.; funding acquisition, P.Y. All authors have read and agreed to the published version of the manuscript.

Funding

This research received no external funding.

Data Availability Statement

Some or all data, models, or code that support the findings of this study are available from the corresponding author upon reasonable request.

Acknowledgments

Thank you to the relevant constructors of the Dabashan tunnel and friends who have provided support for this study. Thank you for the reviewer’s comments, which have enabled us to improve the quality of this study.

Conflicts of Interest

Authors Peng Yang, Qiang Zhao, and Bentie Zhang were employed by the company Shaanxi Expressway Engineering Consulting Co., Ltd. The remaining authors declare that the research was conducted in the absence of any commercial or financial relationships that could be construed as a potential conflict of interest.

Abbreviations

The following abbreviations are used in this manuscript:
RMRRock mass rating
RQDRock quality designation
SVMSupport vector machines
CNNConvolutional neural network
ViTVision transformer
MLPMulti-Layer Perceptron
TPTrue positive
FPFalse positive
FNFalse negative
MAmean accuracy
SHAPSHapley Additive exPlanations

References

  1. Ministry of Transport of the P.R.C. Bulletin on the Development of Chinese Transportation Industry in 2024 Released. Tunn. Constr. (Chin. Engl.) 2025, 45, 1101. [Google Scholar]
  2. Bo, Y.; Liu, Q.; Huang, X.; Pan, Y. Real-Time Hard-Rock Tunnel Prediction Model for Rock Mass Classification Using CatBoost Integrated with Sequential Model-Based Optimization. Tunn. Undergr. Space Technol. 2022, 124, 104448. [Google Scholar] [CrossRef]
  3. Adhikari, S.; Panthi, K.; Basnet, C. Subjectivity Associated to the Use of Rock Mass Classification in Stability Analysis of Caverns. Sci. Rep. 2025, 15, 26256. [Google Scholar] [CrossRef]
  4. Russo, A.; Hormazabal, E. Correlations Between Various Rock Mass Classification Systems, Including Laubscher (MRMR), Bieniawski (RMR), Barton (Q) and Hoek and Marinos (GSI) Systems; LopezAcosta, N., MartinezHernandez, E., EspinosaSantiago, A., MendozaPromotor, J., Lopez, A., Eds.; IOS Press: Amsterdam, The Netherlands, 2019; pp. 2806–2815. [Google Scholar]
  5. Chen, J.; Li, X.; Zhu, H.; Rubin, Y. Geostatistical Method for Inferring RMR Ahead of Tunnel Face Excavation Using Dynamically Exposed Geological Information. Eng. Geol. 2017, 228, 214–223. [Google Scholar] [CrossRef]
  6. Mert, E.; Yilmaz, S.; Inal, M. An Assessment of Total RMR Classification System Using Unified Simulation Model Based on Artificial Neural Networks. Neural Comput. Appl. 2011, 20, 603–610. [Google Scholar] [CrossRef]
  7. Chiu, C.; Liu, C. Development of a Computer Program from Photogrammetry for Assisting Q-System Rating. Int. J. Rock Mech. Min. Sci. 2023, 170, 105499. [Google Scholar] [CrossRef]
  8. Hajiazizi, M.; Khatami, R. Seismic Analysis of the Rock Mass Classification in the Q-System. Int. J. Rock Mech. Min. Sci. 2013, 62, 123–130. [Google Scholar] [CrossRef]
  9. GB/T 50218-2014; Standard for Engineering Classification of Rock Masses. Beijing COC Tech Co., Ltd.: Beijing, China, 2014.
  10. Palmstrom, A.; Stille, H. Ground Behaviour and Rock Engineering Tools for Underground Excavations. Tunn. Undergr. Space Technol. 2007, 22, 363–376. [Google Scholar] [CrossRef]
  11. Ahmad, M.; Hu, J.; Hadzima-Nyarko, M.; Ahmad, F.; Tang, X.; Rahman, Z.; Nawaz, A.; Abrar, M. Rockburst Hazard Prediction in Underground Projects Using Two Intelligent Classification Techniques: A Comparative Study. Symmetry 2021, 13, 632. [Google Scholar] [CrossRef]
  12. Ayawah, P.; Sebbeh-Newton, S.; Azure, J.; Kaba, A.; Anani, A.; Bansah, S.; Zabidi, H. A Review and Case Study of Artificial Intelligence and Machine Learning Methods Used for Ground Condition Prediction Ahead of Tunnel Boring Machines. Tunn. Undergr. Space Technol. 2022, 125, 104497. [Google Scholar] [CrossRef]
  13. Yang, B.; Armaghani, D.J.; Fattahi, H.; Afrazi, M.; Koopialipoor, M.; Asteris, P.G.; Khandelwal, M. Optimized Random Forest Models for Rock Mass Classification in Tunnel Construction. Geosciences 2025, 15, 47. [Google Scholar] [CrossRef]
  14. Nie, Y.; Zhang, Q.; Hou, L.; Du, L.; Zhao, X.; Xue, Y.; Lin, Z.; Cao, X.; Wang, Z. TBM Rock Mass Classification Using XGBoost and Interpretable Machine Learning. Adv. Eng. Inform. 2025, 66, 103459. [Google Scholar] [CrossRef]
  15. Sebbeh-Newton, S.; Seidu, J.; Ankah, M.L.Y.; Ewusi-Wilson, R.; Zabidi, H.; Amakye, L. Real-Time Classification of Ground Conditions Ahead of a TBM Using Supervised Machine Learning Algorithms. Model. Earth Syst. Environ. 2024, 10, 6173–6186. [Google Scholar] [CrossRef]
  16. Liu, Q.; Yan, J.; Li, H.; Zhang, P.; Liu, Y.; Liu, L.; Ye, S.; Liu, H. Intelligent Identification of Surrounding Rock Grades Based on a Self-Developed Rock Drilling Test System. Buildings 2024, 14, 2176. [Google Scholar] [CrossRef]
  17. Yang, B.; Liu, Y.; Liu, Z.; Zhu, Q.; Li, D. Classification of Rock Mass Quality in Underground Rock Engineering with Incomplete Data Using XGBoost Model and Zebra Optimization Algorithm. Appl. Sci. 2024, 14, 7074. [Google Scholar] [CrossRef]
  18. Zhang, J.; Shi, K.; Majiti, H.; Shan, H.; Fu, T.; Shi, R.; Lu, Z. Study on the Classification and Identification Methods of Surrounding Rock Excavatability Based on the Rock-Breaking Performance of Tunnel Boring Machines. Appl. Sci. 2023, 13, 7060. [Google Scholar] [CrossRef]
  19. Xiao, Y.; Yuan, H.; Shi, Q.; Qiu, Z.; Tang, L.; Yu, Y.; Li, Y.; Pan, Y.; Xiao, Q. Real-Time Grading Method of Tunnel Surrounding Rock Based on Image Recognition. Front. Artif. Intell. 2026, 9, 1766828. [Google Scholar] [CrossRef]
  20. Shi, M.; Chen, Y.; Gao, T.; Wang, Y. Accurate and Reliable Vision-Based Tunnel Face Rock Mass Classification by Explainable Deep Learning. Tunn. Undergr. Space Technol. 2026, 168, 107233. [Google Scholar] [CrossRef]
  21. Kim, Y.; Yun, T.S. Enhanced Rock Mass Rating Prediction from Tunnel Face Imagery: A Decision-Supportive Ensemble Deep Learning Approach. Eng. Geol. 2024, 339, 107625. [Google Scholar] [CrossRef]
  22. Zhang, W.; Zhang, W.; Zhang, G.; Huang, J.; Li, M.; Wang, X.; Ye, F.; Guan, X. Hard-Rock Tunnel Lithology Identification Using Multi-Scale Dilated Convolutional Attention Network Based on Tunnel Face Images. Front. Struct. Civ. Eng. 2024, 17, 1796–1812. [Google Scholar] [CrossRef]
  23. Chen, L.; Liu, Z.; Su, H.; Lin, F.; Mao, W. Automated Rock Mass Condition Assessment during TBM Tunnel Excavation Using Deep Learning. Sci. Rep. 2022, 12, 1722. [Google Scholar] [CrossRef] [PubMed]
  24. Chen, J.; Yang, T.; Zhang, D.; Huang, H.; Tian, Y. Deep Learning Based Classification of Rock Structure of Tunnel Face. Geosci. Front. 2021, 12, 395–404. [Google Scholar] [CrossRef]
  25. Zhang, S.; Chen, Z.; Ling, T.; Huang, N.; Zhang, L. A Dynamic Classification Method for Surrounding Rock Based on the Fusion of Tunnel Face Images and Ground Penetrating Radar Advanced Geological Forecast Images. Meas. Sci. Technol. 2025, 36, 106104. [Google Scholar] [CrossRef]
  26. Dong, Z.; Yu, H.; Tian, G.; Li, X.; Cao, R.; Zhang, Y. Data Visualization Strategy for Predicting Rock Mass Classification with TBM Key Rock-Fragmentation Parameters. Transp. Geotech. 2025, 51, 101489. [Google Scholar] [CrossRef]
  27. Shao, S.; Song, R.; Wu, Y.; Zhang, Z.; Fu, H.; Peng, Y.; Li, Z.; Liu, Y. Research on Intelligent Predictions of Surrounding Rock Ahead of the Tunnel Face Based on Neural Network and Longitudinal Deformation Curve. Appl. Sci. 2025, 15, 8771. [Google Scholar] [CrossRef]
  28. Hansen, T.F.; Erharter, G.H.; Liu, Z.; Torresen, J. A Comparative Study on Machine Learning Approaches for Rock Mass Classification Using Drilling Data. Appl. Comput. Geosci. 2024, 24, 100199. [Google Scholar] [CrossRef]
  29. Tan, F.; You, M.; Zuo, C.; Jiao, Y.; Tian, H. Simulation of Rock-Breaking Process by Drilling Machine and Dynamic Classification of Surrounding Rocks. Rock Mech. Rock Eng. 2022, 55, 423–437. [Google Scholar] [CrossRef]
  30. Breiman, L. Random Forests. Mach. Learn. 2001, 45, 5–32. [Google Scholar] [CrossRef]
  31. LeCun, Y.; Bengio, Y.; Hinton, G. Deep Learning. Nature 2015, 521, 436–444. [Google Scholar] [CrossRef]
  32. Vaswani, A.; Shazeer, N.; Parmar, N.; Uszkoreit, J.; Jones, L.; Gomez, A.N.; Kaiser, L.; Polosukhin, I. Attention Is All You Need. In Advances in Neural Information Processing Systems 30 (NIPS 2017); NIPS: San Diego, CA, USA, 2017; Volume 30. [Google Scholar]
  33. Hatamizadeh, A.; Kautz, J. MambaVision: A Hybrid Mamba-Transformer Vision Backbone. In 2025 IEEE/CVF Conference on Computer Vision and Pattern Recognition (CVPR); IEEE: New York, NY, USA, 2025; pp. 25261–25270. [Google Scholar]
  34. Awoyera, P.O.; Simwanda, L.; Vasic, M.V.; Mydin, M.A.O.; Imoh, U.U.; Fadugba, O.G.; Asiz, A.; Rad, M.M. Hybrid Generative-Ensemble Approach for Predicting Recycled Aggregate Concrete Strength Properties. Sci. Rep. 2026. [Google Scholar] [CrossRef]
  35. Yuan, C.; Kong, Q.; Chen, W.; Fan, G.; Hao, H. Multimodal Feature Fusion for Detecting Debonding in FRP-Reinforced Concrete Interfaces Using Dual-Branch CNN. Struct. Health Monit.-Int. J. 2025, 25, 2039–2054. [Google Scholar] [CrossRef]
  36. Ren, Z.; Liu, S.; Wang, L.; Guo, Z. Conv-SdMLPMixer: A Hybrid Medical Image Classification Network Based on Multi-Branch CNN and Multi-Scale Multi-Dimensional MLP. Inf. Fusion 2025, 118, 102937. [Google Scholar] [CrossRef]
Figure 1. The process of obtaining parameters while drilling.
Buildings 16 01916 g001
Figure 2. Density curve of six drilling parameters under different surrounding rock grades.
Buildings 16 01916 g002
Figure 3. Scatter plot and correlation coefficient between drilling parameters and surrounding rock grades.
Buildings 16 01916 g003
Figure 4. Image augmentation results. The sub-figure (a) is the original image, and (bf) are the augmented images by adding noise, advising exposure, adding a cutout, shearing, and rotating, respectively.
Buildings 16 01916 g004
Figure 5. Architecture of Random-Mamba Model.
Buildings 16 01916 g005
Figure 6. Architecture of MambaVision Block.
Buildings 16 01916 g006
Figure 7. Architecture of Multi-Head Attention Block.
Buildings 16 01916 g007
Figure 8. Training Curves of Random-Mamba and Comparative Models.
Buildings 16 01916 g008
Figure 9. Confusion Matrices of Random-Mamba and Comparative Models.
Buildings 16 01916 g009
Figure 10. Feature Importance Rank.
Buildings 16 01916 g010
Table 1. Summary of Representative Studies on Tunnel Surrounding Rock Classification.
Method TypesYearResearchersInput DataAlgorithmAccuracy (%)
Drilling Parameter-Based Methods2025Bo Yang et al. [13]thrust force per cutter, revolutions per minute, penetration rate, advance rate, and penetration per revolutionRandom Forest87.9
2025Nie Yaoqi et al. [14]cutterhead rotation speed, advance speed, cutterhead torque, total thrust force, cutterhead penetration, advance feed rate, cutterhead set rotation speed, hydraulic pump pressure, and the author-designed parameter specific energyCoati-XGBoost91.5
2024Sylvanus Sebbeh-Newton et al. [15]boring energy, cutterhead torque, cutterhead thrust force, revolution per minute, rate of penetration, stroke speed, gripper cylinder pressure, pitching, and motor current ampsExtremely Randomized Trees91.0
2024Quanwei Liu et al. [16]Propulsion speed, Impact pressure, Propulsion pressure, and Rotary pressureRandom Forest93.0
2024Yang, B et al. [17]uniaxial compressive strength, rock mass integrity coefficient, rock quality designation, and groundwater conditionXGBoost92.3
2023Jianming Zhang et al. [18]total thrust, top shield cylinder rod chamber pressure, top shield cylinder rod less chamber pressure, gripping force, gripper pump pressure, cutterhead torque, cutterhead rotational speed, penetration, advance rate, and propulsion pump pressureDeep Forest96.33
Image-Based Methods2026Yihuan Xiao et al. [19]Tunnel face imagesShuffleNet V285.0
2026Mengnan Shi et al. [20]Tunnel face imagesDCNN93.6
2024Yejin Kim et al. [21]Tunnel face imagesEfficientNet-B483.2
2024Wenjun Zhang et al. [22]Tunnel face imagesResNet-10191.3
2022Chen Liang et al. [23]Tunnel face imagesSAFN, a CNN-Attention hybrid architecture92.5
2021Jiayao Chen et al. [24]Tunnel face imagesInception-ResNet-V293.9
Multi-Source Fusion Methods2025Sheng Zhang et al. [25]Image and GPR dataMobileNetV385.7
2025Zhikai Dong et al. [26]tunneling parameters and their Assembled Image FusionResNet83.0
2025Shao Shuai et al. [27]Longitudinal Deformation Curve and its imageSE-CNN-LSTM-Attention Hybrid Architecture91.2
2024Tom F. Hansen et al. [28]MWD image and MWD dataResnet-50 and an ensemble machine learning model consisting of KNN, Extra Trees, and Catboost by a Voting Classifier86.0
Table 2. Data Description of this research.
DataVariableVariable MeaningObtain Method
Input Datafeed speedPenetration rate of the drill bit during excavation, reflecting rock drillabilityReal-time monitoring system of the tunnel boring machine (sampling frequency: 10 Hz)
propulsion pressureThe thrust force required to advance the drill bit, indicating rock resistance
impact pressurePercussive energy is transmitted for rock fragmentation
rotation pressureTorque resistance encountered during the drilling operation
water pressurePressure of water injected for cooling and debris removal
water flowFlow rate of water for cooling and flushing purposes
tunnel face imagesRGB image capturing geological features of the excavation face, including joint patterns, weathering conditions, and rock textureDigital camera mounted 5 m from the tunnel face, synchronized with drilling data acquisition
Output Datarock gradeSurrounding rock grade (II, III, IV, V) determined according to the Chinese BQ standardExpert evaluation by three experienced geologists
Table 3. Physical and Mechanical Properties of Rock Masses by Grade.
Rock GradeUniaxial Compressive Strength (MPa)Density (g/cm3)Porosity (%)RQD (%)
II60–802.65–2.751–380–95
III30–602.55–2.653–850–80
IV15–302.45–2.558–1525–50
V<152.30–2.45>15<25
Table 4. Statistical Analysis of Drilling Parameters.
Rock GradeStatisticFeed Speed
(m/min)
Propulsion Pressure
(MPa)
Impact Pressure
(MPa)
Rotation Pressure
(MPa)
Water Pressure
(MPa)
Water Flow
(L/min)
Record Count
IIAvg. (Std.)0.79 (0.19)19.28 (5.69)15.94 (1.02)12.00 (4.00)7.84 (0.76)82.78 (5.79)449
(13.36%)
[Min., Max.][0.31, 1.27][8.21, 33.33][13.26, 18.63][2.00, 29.09][5.42, 9.50][67.32, 106.37]
IIIAvg. (Std.)1.16 (0.26)15.39 (5.55)14.02 (1.01)9.62 (3.69)7.23 (0.74)84.33 (5.67)2438
(72.54%)
[Min., Max.][0.48, 2.08][5.87, 29.31][11.04, 17.40][2.00, 25.12][4.96, 9.50][67.07, 105.23]
IVAvg. (Std.)1.86 (0.34)11.46 (2.43)11.02 (1.00)7.66 (2.03)6.38 (0.71)88.39 (5.55)352
(10.47%)
[Min., Max.][0.91, 2.92][6.10, 17.27][8.54, 14.00][2.00, 13.75][4.71, 8.45][73.25, 107.78]
VAvg. (Std.)2.50 (0.48)7.74 (2.77)9.09 (1.02)5.03 (1.94)5.47 (0.59)92.84 (6.78)122
(3.63%)
[Min., Max.][1.35, 3.96][2.88, 16.09][6.57, 11.29][2.00, 10.15][4.10, 7.20][78.39, 110.00]
All GradesAvg. (Std.)1.24 (0.45)15.22 (5.77)13.78 (1.81)9.57 (3.8)7.16 (0.88)84.86 (6.09)3361
(100%)
[Min., Max.][0.31, 3.96][2.88, 33.33][1.81, 18.63][2.00, 29.09][4.10, 9.50][67.07, 110.00]
Table 5. Hyperparameter Configuration of the Proposed Random-Mamba Model.
ComponentParameterValue
Random Forest BranchNumber of trees150
Maximum tree depth20
Minimum samples per split5
Split criterionGini impurity
MambaVision BranchInput image size (pixel × pixel × channel)512 × 512 × 3
Patch size (pixel × pixel)16 × 16
Number of transformer blocks12
Number of attention heads8
Hidden dimension384
Pre-trainingImageNet-1K
MLP Fusion ModuleInput dimension20 (4 from RF + 16 from MambaVision)
Hidden layer 116 neurons, ReLU activation
Hidden layer 28 neurons, ReLU activation
Output layer4 neurons, Softmax activation
Dropout rate0.3 (after each hidden layer)
Table 6. 5-Fold Cross-Validation Results on Validation Set.
Mean Acc ± Std (%)
[Mean F1 ± Std (%)]
Parameter Branch
Only ImageSVMXGBoostRandom Forest
Image BranchOnly Parameter/73.82 ± 0.73
[72.11 ± 0.69]
79.03 ± 0.52
[77.54 ± 0.48]
79.51 ± 0.48
[78.02 ± 0.44]
ResNet81.52 ± 0.61
[80.03 ± 0.52]
85.11 ± 0.51
83.82 ± 0.47]
86.02 ± 0.50
[84.73 ± 0.46]
87.44 ± 0.49
[85.94 ± 0.45]
ConvNeXt83.21 ± 0.54
[81.93 ± 0.49]
86.52 ± 0.49
[85.23 ± 0.45]
87.63 ± 0.47
[86.31 ± 0.43]
88.93 ± 0.44
[87.62 ± 0.40]
ViT84.04 ± 0.59
[82.74 ± 0.55]
87.13 ± 0.53
[85.81 ± 0.49]
88.21 ± 0.51
[86.92 ± 0.47]
89.52 ± 0.47
[88.23 ± 0.43]
Swin Transformer84.93 ± 0.47
[83.42 ± 0.43]
86.51 ± 0.48
[85.22 ± 0.44]
87.54 ± 0.48
[86.23 ± 0.44]
88.83 ± 0.45
[87.41 ± 0.41]
MambaVision85.62 ± 0.45
[84.21 ± 0.41]
87.24 ± 0.46
[85.84 ± 0.42]
88.13 ± 0.45
[86.72 ± 0.41]
91.21 ± 0.58
[90.82 ± 0.53]
Table 7. Performance Comparison on Test Set (Mean ± Std).
ModelAccuracy (%)Macro Precision (%)Macro Recall (%)Macro F1 (%)
SVM73.80 ± 0.7572.09 ± 0.7171.83 ± 0.6971.96 ± 0.70
XGBoost79.02 ± 0.5477.73 ± 0.5077.34 ± 0.4877.53 ± 0.49
Random Forest79.53 ± 0.5078.21 ± 0.4677.82 ± 0.4478.01 ± 0.45
ResNet81.49 ± 0.6380.21 ± 0.5479.81 ± 0.5280.01 ± 0.53
ConvNext83.20 ± 0.5681.90 ± 0.5181.51 ± 0.4981.70 ± 0.50
ViT84.03 ± 0.6182.73 ± 0.5782.32 ± 0.5582.52 ± 0.56
Swin Transformer84.91 ± 0.4983.61 ± 0.4583.22 ± 0.4383.41 ± 0.44
MambaVision85.60 ± 0.4784.41 ± 0.4384.02 ± 0.4184.21 ± 0.42
SVM-ResNet85.12 ± 0.5383.82 ± 0.4983.43 ± 0.4783.62 ± 0.48
SVM-ConvNext86.51 ± 0.5185.21 ± 0.4784.82 ± 0.4585.01 ± 0.46
SVM-ViT87.11 ± 0.5585.82 ± 0.5185.41 ± 0.4985.61 ± 0.50
SVM-Swin86.50 ± 0.5085.20 ± 0.4684.81 ± 0.4485.00 ± 0.45
SVM-Mamba87.22 ± 0.4885.83 ± 0.4485.42 ± 0.4285.62 ± 0.43
XGBoost-ResNet86.01 ± 0.5284.71 ± 0.4884.32 ± 0.4684.51 ± 0.47
SVM-ConvNext87.62 ± 0.4986.32 ± 0.4585.92 ± 0.4386.12 ± 0.44
SVM-ViT88.20 ± 0.5386.91 ± 0.4986.51 ± 0.4786.71 ± 0.48
XGBoost-Swin87.53 ± 0.5086.22 ± 0.4685.82 ± 0.4486.02 ± 0.45
XGBoost-Mamba88.11 ± 0.4786.72 ± 0.4386.31 ± 0.4186.51 ± 0.42
Random-ResNet87.43 ± 0.5186.11 ± 0.4785.72 ± 0.4585.91 ± 0.46
SVM-ConvNext88.92 ± 0.4687.63 ± 0.4287.23 ± 0.4087.43 ± 0.41
SVM-ViT89.51 ± 0.4988.21 ± 0.4587.82 ± 0.4388.01 ± 0.44
Random-Swin88.82 ± 0.4787.41 ± 0.4387.01 ± 0.4187.21 ± 0.42
Random-Mamba92.12 ± 0.6191.82 ± 0.5791.51 ± 0.5591.66 ± 0.56
Table 8. Ablation Study Results.
ConfigurationAccuracy (%)Macro-F1
(%)
Class V F1
(%)
Parameters (M)Inference Time (ms)
Single-modality, without class_weight
SVM (w/o balance)71.21 ± 0.8269.52 ± 0.7458.31 ± 1.210.0020.1
XGBoost (w/o balance)76.83 ± 0.6175.13 ± 0.5864.23 ± 1.040.50.3
Random Forest (w/o balance)77.32 ± 0.5575.62 ± 0.5265.13 ± 0.940.80.4
Single-modality, with class_weight
SVM (balanced)73.82 ± 0.7371.91 ± 0.6968.52 ± 1.120.0020.1
XGBoost (balanced)79.03 ± 0.5277.54 ± 0.4874.21 ± 0.840.50.3
Random Forest (balanced)79.51 ± 0.4878.02 ± 0.4475.33 ± 0.820.80.4
Image-only
ResNet81.52 ± 0.6180.03 ± 0.5279.21 ± 0.9125.65.2
ConvNeXt83.21 ± 0.5481.93 ± 0.4981.12 ± 0.8427.86.1
ViT84.04 ± 0.5982.74 ± 0.5582.02 ± 0.8886.49.3
Swin Transformer84.93 ± 0.4783.42 ± 0.4383.23 ± 0.7328.38.7
MambaVision85.62 ± 0.4584.21 ± 0.4184.11 ± 0.7126.16.5
Dual-Branch with different image backbones (fixed Random Forest)
Random-ResNet87.44 ± 0.4985.94 ± 0.4585.53 ± 0.7226.45.6
Random-ConvNeXt88.93 ± 0.4487.62 ± 0.4087.23 ± 0.6328.66.5
Random-Vit89.52 ± 0.4788.23 ± 0.4387.82 ± 0.6887.29.7
Random-Swin88.83 ± 0.4587.41 ± 0.4187.12 ± 0.6429.19.1
Random-Mamba, proposed92.12 ± 0.6191.66 ± 0.5691.02 ± 0.6226.96.9
Dual-Branch with different parameter branches (fixed MambaVision)
SVM-Mamba (balanced)87.22 ± 0.4885.83 ± 0.4485.42 ± 0.6826.16.6
XGBoost-Mamba (balanced)88.11 ± 0.4786.72 ± 0.4386.33 ± 0.6526.66.8
Random-Mamba, proposed92.12 ± 0.6191.66 ± 0.5691.02 ± 0.6226.96.9
Without transfer learning weight
MambaVision (no pretrained)82.33 ± 0.6880.91 ± 0.6280.02 ± 0.8526.16.5
Random-Mamba (no pretrained)90.31 ± 0.7289.82 ± 0.6889.02 ± 0.7426.96.9
Fusion strategy variants (RF + MambaVision)
Early concatenation (no MLP, direct Softmax)89.53 ± 0.5888.72 ± 0.5388.23 ± 0.7926.16.4
Late fusion (average of probabilities)88.91 ± 0.5988.21 ± 0.5487.82 ± 0.8126.16.3
Attention-based fusion92.42 ± 0.6291.92 ± 0.5791.32 ± 0.6428.59.8
MLP fusion (proposed)92.12 ± 0.6191.66 ± 0.5691.02 ± 0.6226.96.9
Disclaimer/Publisher’s Note: The statements, opinions and data contained in all publications are solely those of the individual author(s) and contributor(s) and not of MDPI and/or the editor(s). MDPI and/or the editor(s) disclaim responsibility for any injury to people or property resulting from any ideas, methods, instructions or products referred to in the content.