1. Introduction
Green prefabricated composite wall systems consist of panelized members prefabricated with small-section reinforced concrete grids and infilled with ecological blocks and fine-aggregate concrete [
1]. These systems represent a novel prefabricated structural form that integrates thermal insulation and load-bearing functions. Owing to favorable seismic performance, good thermal insulation, and rapid construction, such systems have been widely applied in low- and multi-story rural buildings. Despite these advantages, several technical issues still need to be resolved, among which joint connection technology remains a key concern in prefabricated structures. Reliable reinforcement connection, rational joint design, and effective joint detailing are essential to ensure the structural integrity of prefabricated buildings and to satisfy the requirement that prefabricated structures achieve performance comparable to that of cast-in-place structures. At present, it remains difficult for both low- to mid-rise and high-rise prefabricated buildings to achieve cast-in-place-equivalent performance solely by adopting reinforcement details similar to those used in cast-in-place construction. In particular, the connection of vertical reinforcement in boundary elements is associated with construction difficulty and high cost, which makes the development of efficient connection technology increasingly urgent.
Researchers in China and elsewhere have carried out preliminary studies on connection technologies for boundary regions of prefabricated members. From the perspective of on-site construction, conventional joint or node connection methods can generally be classified as wet connections and dry connections [
2]. When the joints or nodes of prefabricated members require on-site formwork erection and concrete casting, the method is defined as a wet connection. By contrast, dry connections do not require on-site casting or grouting.
Typical wet connections include cast-in-place strip connections, post-cast integral connections, grouted sleeve connections, and grout-anchored lap splices. Qian Jiaru and co-workers [
3] designed five reinforced concrete shear walls and investigated their mechanical behavior through pseudo-static tests. The results showed that prefabricated shear walls exhibited deficiencies such as relatively poor energy dissipation capacity and rapid post-peak load degradation. By modifying the arrangement of grouted sleeves and applying unbonded treatment to the connected reinforcement after satisfying the strength requirement, Soudki K. A. et al. [
4] found that the unbonded treatment significantly improved the deformation capacity of the wall. The deformation and energy dissipation capacities were enhanced because of the arrangement of unbonded prestressed tendons, although the strength and stiffness of the wall decreased to some extent. Studies on grouted sleeve connections have shown that their mechanical performance is affected by the connector configuration, grouting quality, and anchorage-related parameters. Alias et al. [
5] reported that transverse spiral reinforcement improved the tensile performance of grouted sleeve connectors. Xiao et al. [
6] further showed that sleeve grouting defects may adversely affect the seismic behavior of precast concrete shear walls, especially when the spliced bars are subjected to tension. Zhao et al. [
7] also indicated that the reliability of grouted sleeve connections is closely related to parameters such as rebar diameter, anchorage length, and grouting material strength.
Typical dry connections include bolted connections, prestressed connections, and welded connections. Can Bora et al. [
8] proposed a connection method in which steel plates were embedded in the wall and the wall panels on both sides were connected by bolts. Experimental studies were carried out to evaluate the influence of the combined action of bolts and steel plates on the seismic performance of the wall, and a mechanical model for the bolted steel-plate wall connection was established. Pan et al. [
9] experimentally investigated the seismic behavior of precast concrete shear walls with bolted-plate connections and showed that the mechanical connection details significantly influenced wall strength, deformation capacity, and failure characteristics. Hutchinson et al. [
10] achieved wall-joint connection through post-tensioning and, based on the test results, clarified the failure mechanism and force-transfer mechanism of prefabricated wall joints. Smith B. J. et al. [
11] reported that shear walls integrating two material systems can not only make full use of the energy dissipation capacity of mild steel, but also mobilize the self-centering capability provided by post-tensioned tendons. However, the incorporation of mild steel may lead to relatively large lateral displacements and thus to faster degradation of wall stiffness and strength. Wang Yueda [
12] adopted welding to connect wall horizontal joints and investigated the effects of the diameter and arrangement of continuous connecting reinforcement on wall performance. The test results showed that the prefabricated wall exhibited higher stiffness, ductility, strength, and energy dissipation capacity than the cast-in-place wall. As the diameter of the continuous reinforcement increased, both the cracking load and the load-carrying capacity increased, whereas the energy dissipation capacity and ductility decreased.
Another type of wall-panel connection involves horizontal joints. Liu Peng [
13] investigated the shear capacity of horizontal joints in monolithic precast shear walls and proposed a shear-capacity formula by extending shear-friction theory. Zhong et al. [
14] proposed a bolt-connected horizontal joint for precast RC wall panel structures and evaluated its seismic behavior through experimental and numerical analyses. Wu et al. [
15] numerically investigated a new type of steel shear-connection horizontal joint in prefabricated shear wall structures, and Cheng et al. [
16] studied the shear performance of an innovative keyway joint for prefabricated concrete wall panels. These studies indicate that horizontal-joint detailing plays an important role in shear transfer, deformation behavior, and structural integrity of prefabricated wall systems.
Compared with conventional wet connections, such as grouted sleeve connections and grout-anchored lap splices, the proposed integrated rebar box connection is intended to reduce on-site wet construction and simplify horizontal joint detailing. In addition, the quality of grouted connections depends strongly on the grouting process, and the internal connection condition is difficult to directly inspect after construction. Compared with typical dry connections, such as bolted, welded, or prestressed connections, the proposed connection integrates the connecting rebars and steel box components into the prefabricated wall panels in advance, thereby forming a relatively direct embedded force-transfer path between the upper and lower wall panels. Moreover, some bolted dry connections may require exposed steel components or external connecting plates, which may increase the demand for corrosion protection, fire protection, and architectural finishing. Therefore, the proposed connection differs from existing wet and dry connection systems in terms of reduced on-site wet work, embedded force transfer, inspectability during assembly, and reduced exposure of connecting components.
To address this issue, this study proposes an integrated rebar box connection and investigates its applicability in fully prefabricated composite walls. To investigate the preliminary behavior of this connection detail, two half-scale wall specimens incorporating the same integrated rebar box connection were tested under different loading protocols, namely low-cycle reversed loading and monotonic loading. The tests were used to preliminarily assess the failure mode, load-carrying capacity, deformation capacity, and stiffness degradation characteristics of walls using this connection. On this basis, a finite element model was established and compared with the measured responses to capture the main global behavior of the specimens. Parametric numerical analyses were then conducted to examine the effects of selected parameters, including integrated rebar diameter, axial compression ratio, longitudinal reinforcement ratio in rib columns, and concrete grid strength, on the shear behavior of the wall. The present work provides a preliminary basis for further study of this type of connection in low- and multi-story prefabricated composite walls. Because only two half-scale specimens were tested, the results are mainly used to clarify the basic force-transfer behavior of the proposed connection rather than to draw generalized design conclusions.
2. Experimental Plan
To preliminarily evaluate the applicability of the integrated rebar box connection in the horizontal joints of fully prefabricated composite walls, two specimens were designed and fabricated in this study, both with integrated rebars of 2Ø20 HRB400. Here, Ø denotes the nominal bar diameter in mm. One specimen was subjected to low-cycle reversed cyclic loading, whereas the other was subjected to monotonic loading. By comparing the responses of the two specimens with the same connection detail under different loading protocols, the preliminary feasibility of the proposed connection was assessed, while the influence of loading protocol on wall behavior was also examined. The results also provide a basis for subsequent finite element modeling and parametric analysis.
2.1. Experimental Design
A total of two specimens were tested. The prototype wall was taken from a representative prefabricated residential building with a story height of 3 m, and all specimens were fabricated at a scale of 1/2. Detailed information on the specimens is provided in
Table 1. Each specimen consisted of three parts: the foundation beam, the prefabricated wall, and the loading beam. The specimens were designed in accordance with the Technical Specification for Assembled Composite Wall Structures (DBJ61/T94-2015) [
17], and the detailed dimensions and reinforcement arrangements are presented in
Table 2 and
Table 3, respectively. In the reinforcement notation used in the tables, @ denotes the stirrup spacing.
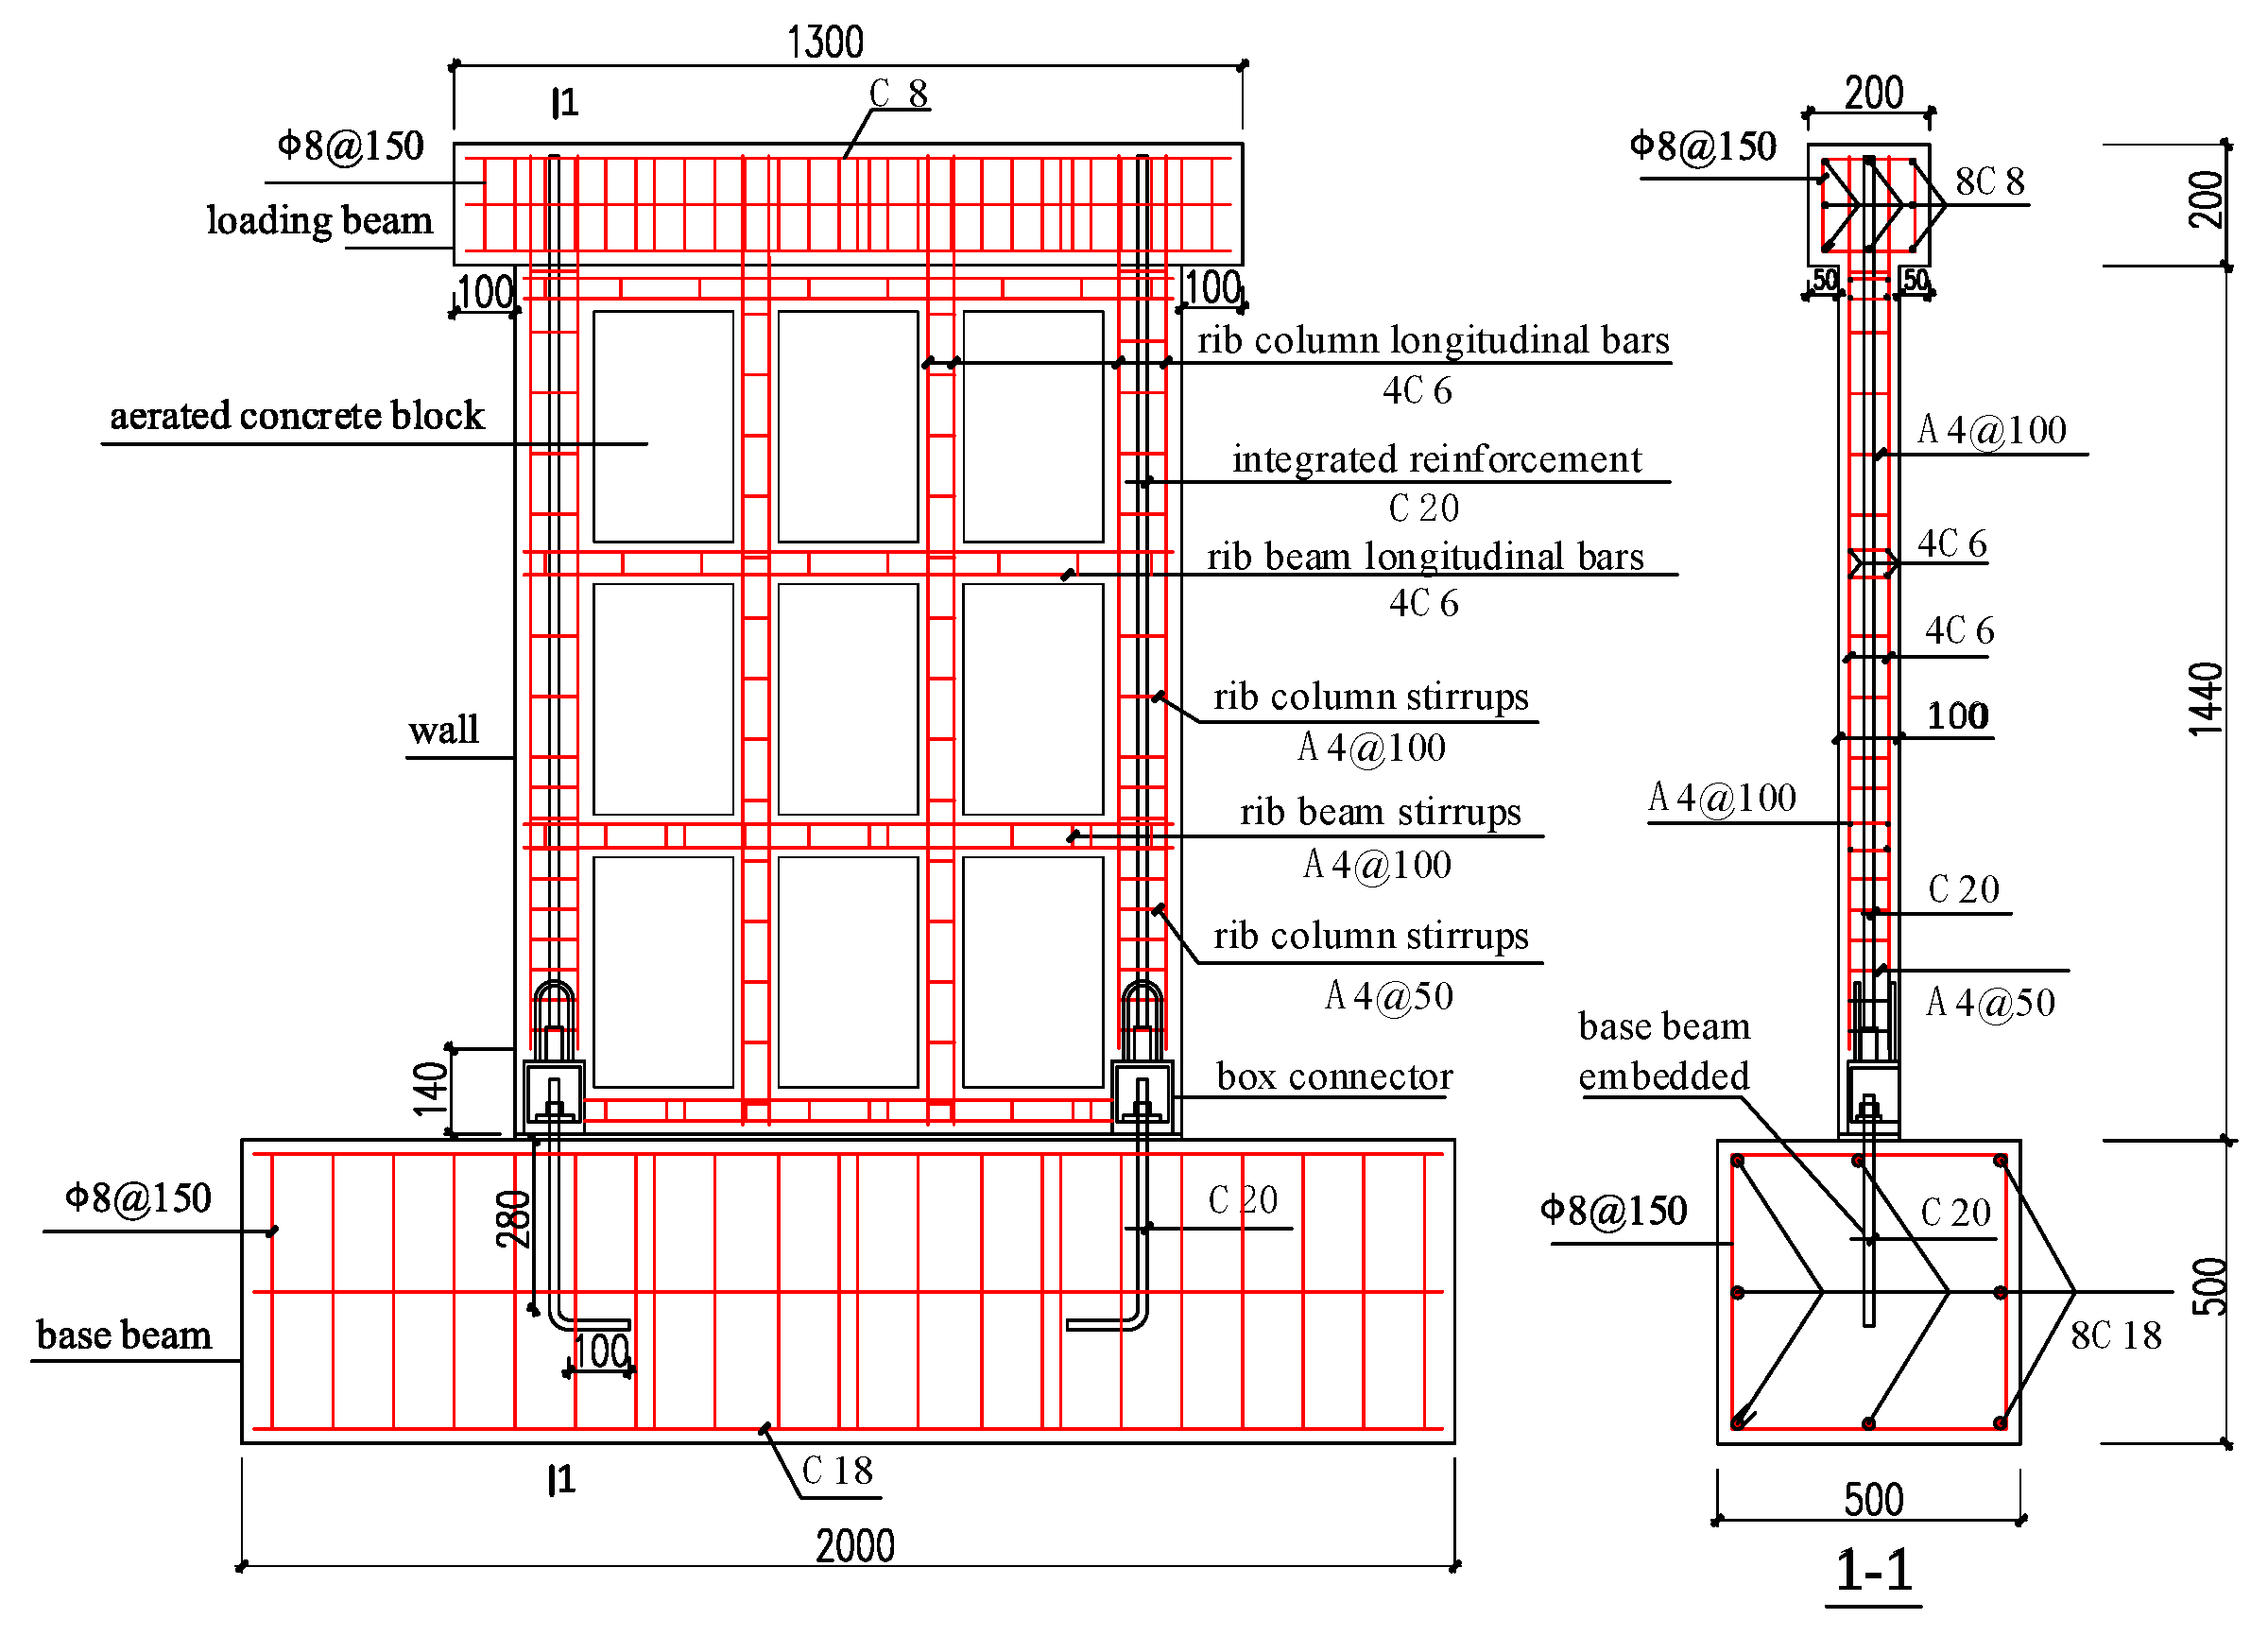
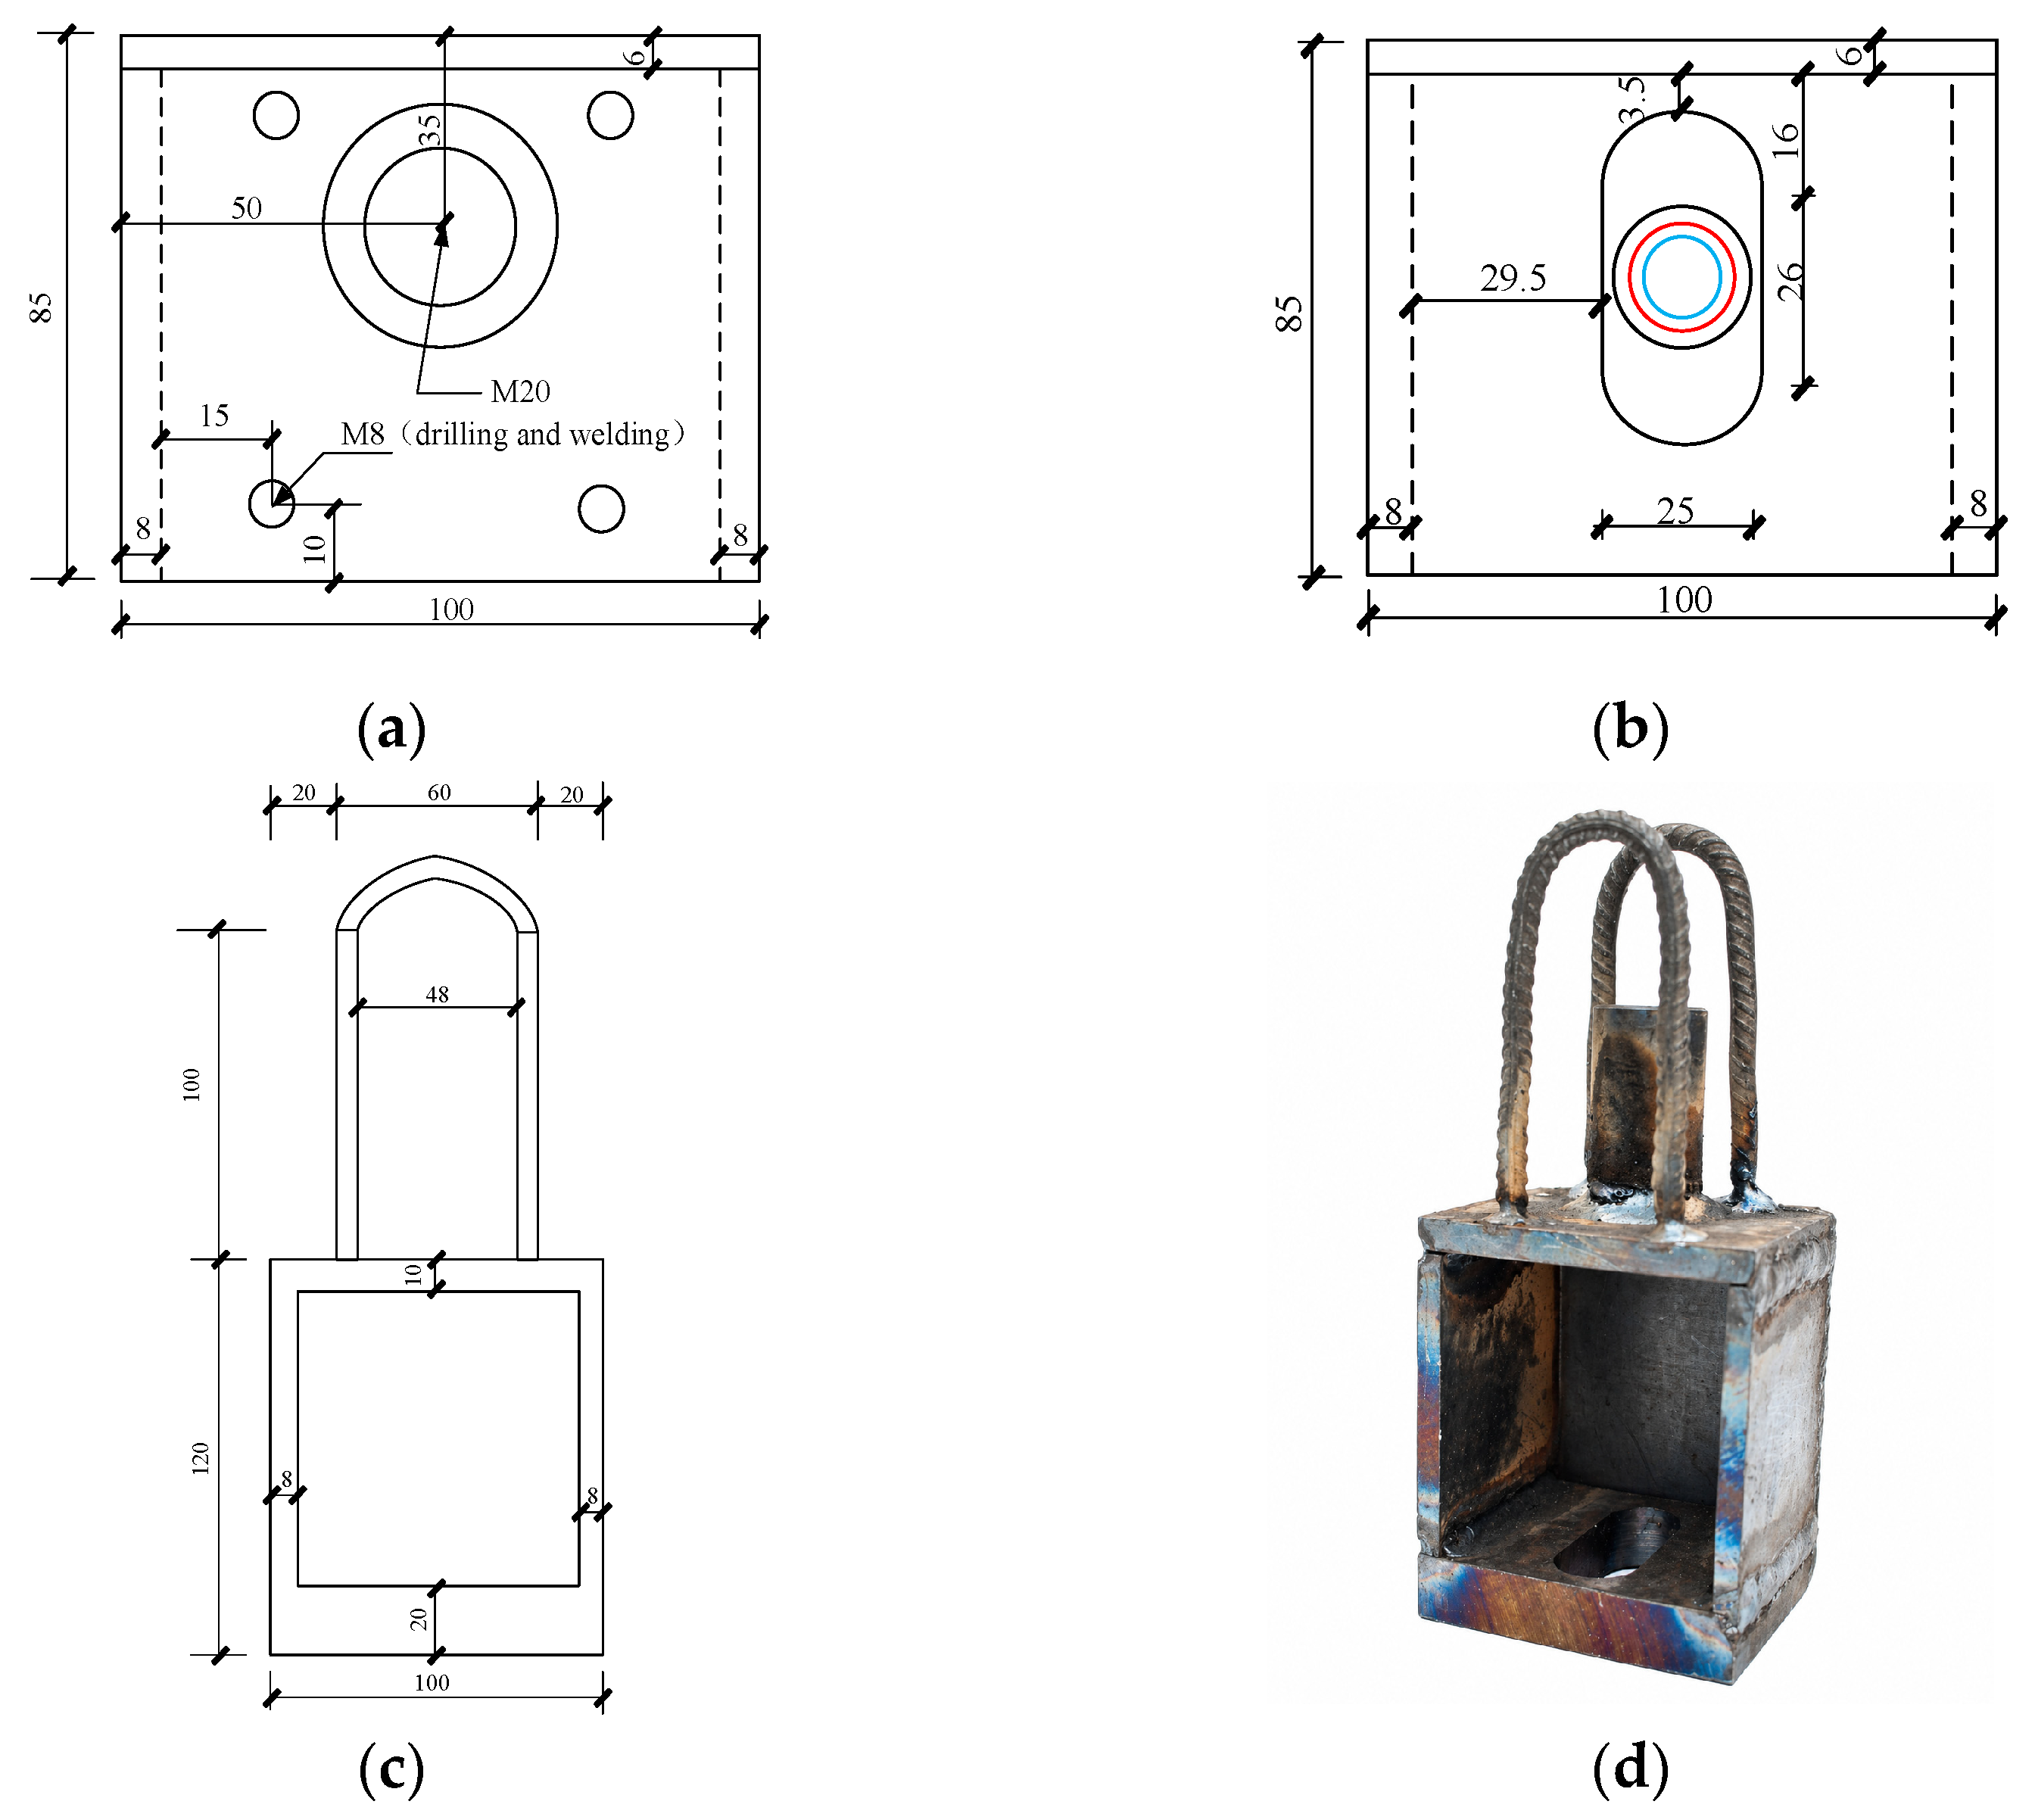
In this study, both prefabricated composite wall specimens were designed in accordance with the relevant code provisions. The two specimens had identical material strength, dimensions, and reinforcement arrangements. The detailed reinforcement and connection configurations are shown in
Figure 1 and
Figure 2. In
Figure 1, the plain round-bar symbol denotes HPB300 reinforcement, the ribbed-bar symbol denotes HRB400 reinforcement, the following number denotes the nominal bar diameter in mm, and @ denotes the stirrup spacing.
2.2. Material Properties
The mechanical properties of the constituent materials provide a critical basis for both the experimental investigation and the finite element analysis. The materials used in this study comprised four categories: (1) concrete; (2) reinforcing steel; (3) autoclaved aerated concrete (AAC) blocks used as infill; and (4) steel plates used for the box connectors. The mechanical properties of all materials used in the composite wall specimens were tested in accordance with the relevant code requirements.
(1) Properties of concrete and AAC blocks
C30 concrete was used for the specimens. The concrete was cast in three batches, and three standard cubic specimens were prepared from each batch for compressive strength testing. All specimens were cured under the same conditions as the full-scale specimens. The compressive strength tests were conducted in accordance with the Standard for Test Method of Mechanical Properties on Ordinary Concrete (GB/T 50081-2002) [
18]. The measured properties of concrete are presented in
Table 4.
Two sets of AAC block specimens were prepared, with each set consisting of three cubes with dimensions of 100 mm. The mechanical properties were determined in accordance with the Test Methods of Autoclaved Aerated Concrete (GB/T 11969-2008) [
19]. The measured properties of the AAC blocks are presented in
Table 5.
(2) Mechanical properties of steel reinforcement
The specimens incorporated five types of reinforcing bars of HPB300 and HRB400 grades. Three samples were prepared for each type, giving a total of fifteen samples. The mechanical properties were determined in accordance with Metallic Materials—Tensile Testing—Part 1: Method of Test at Room Temperature (GB/T 228.1-2010) [
20]. The measured mechanical properties of the reinforcing bars are presented in
Table 6.
The box-type steel plate connectors were fabricated from Q235B steel plates. The measured mechanical properties of the steel plates are presented in
Table 7.
2.3. Test Setup and Loading System
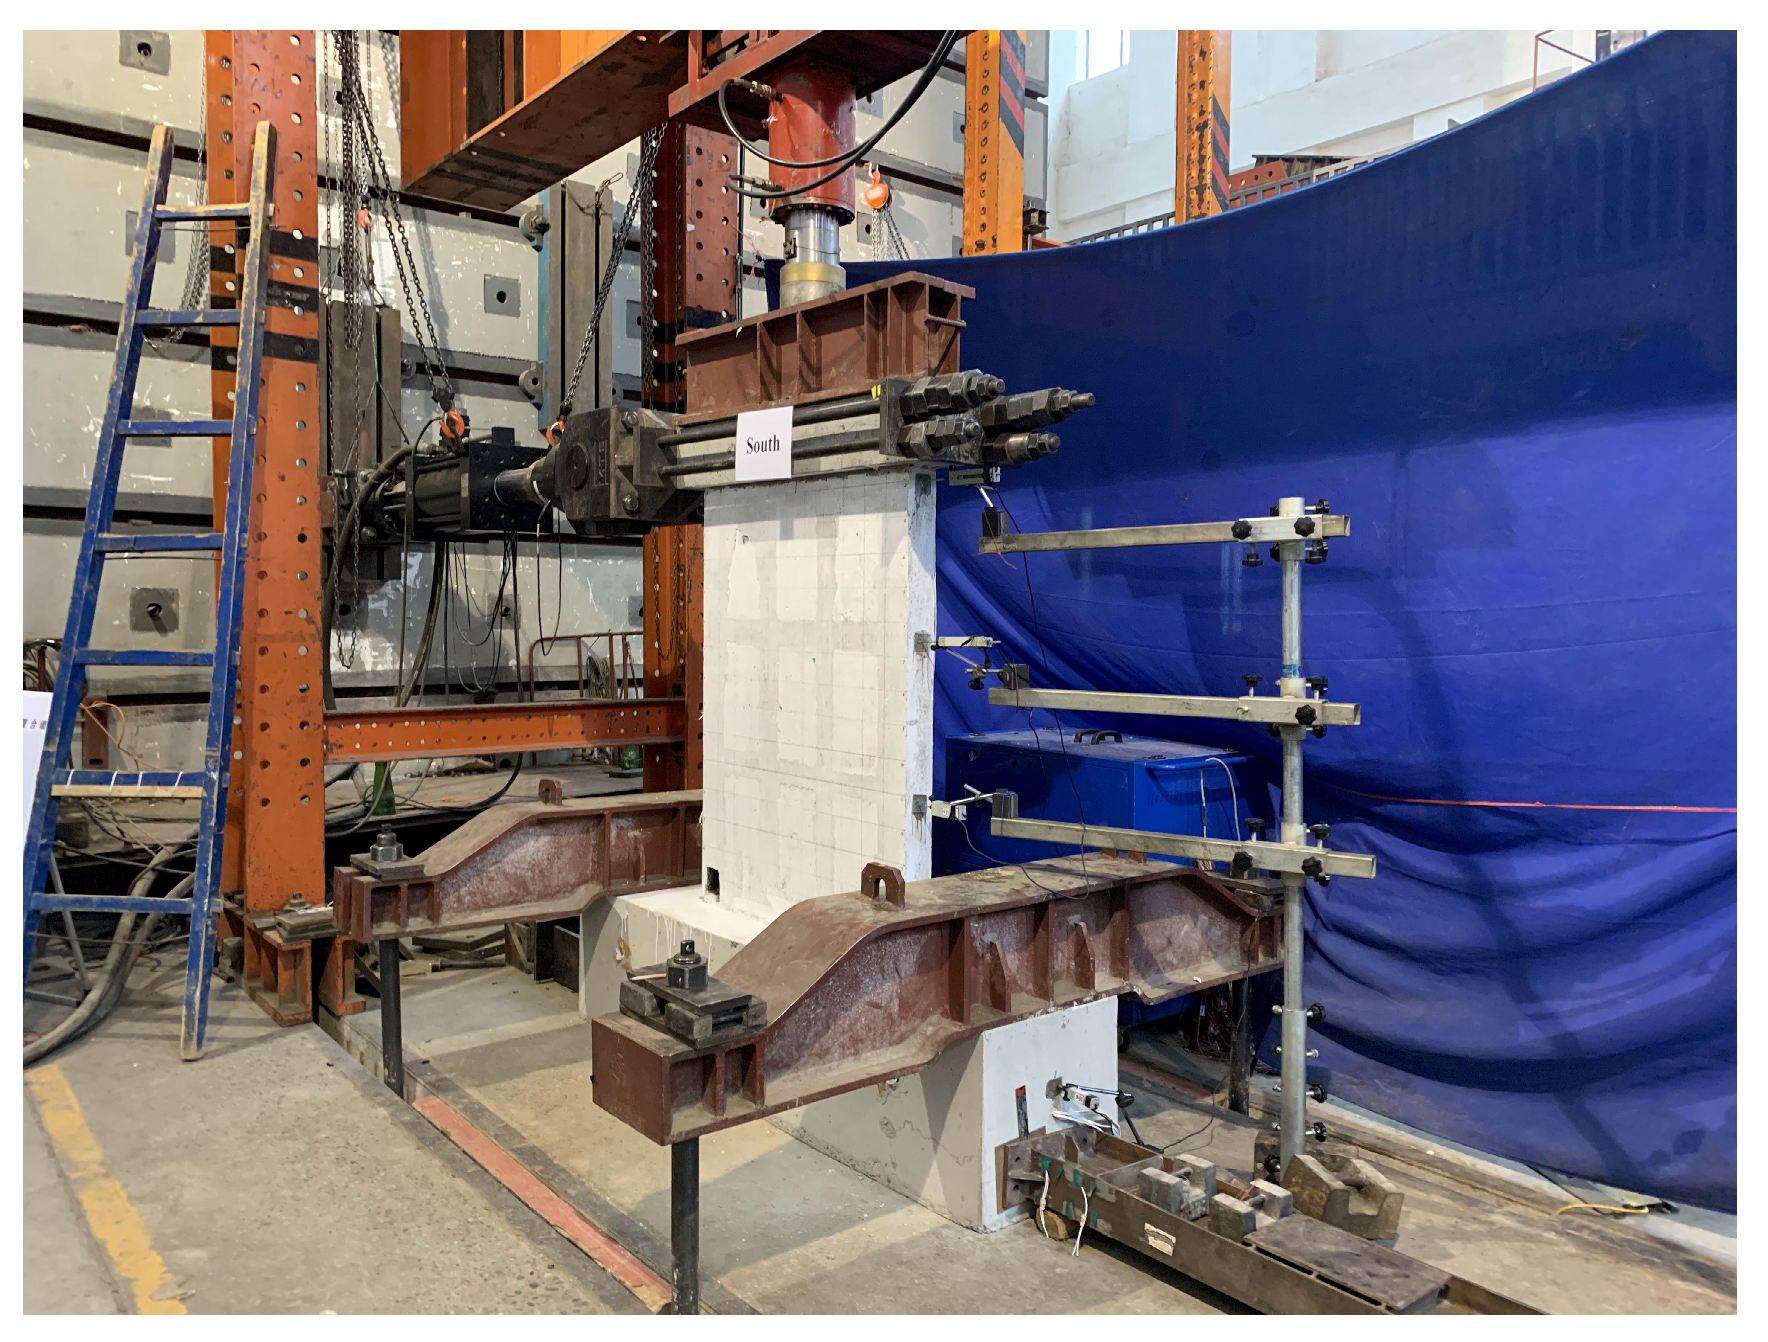
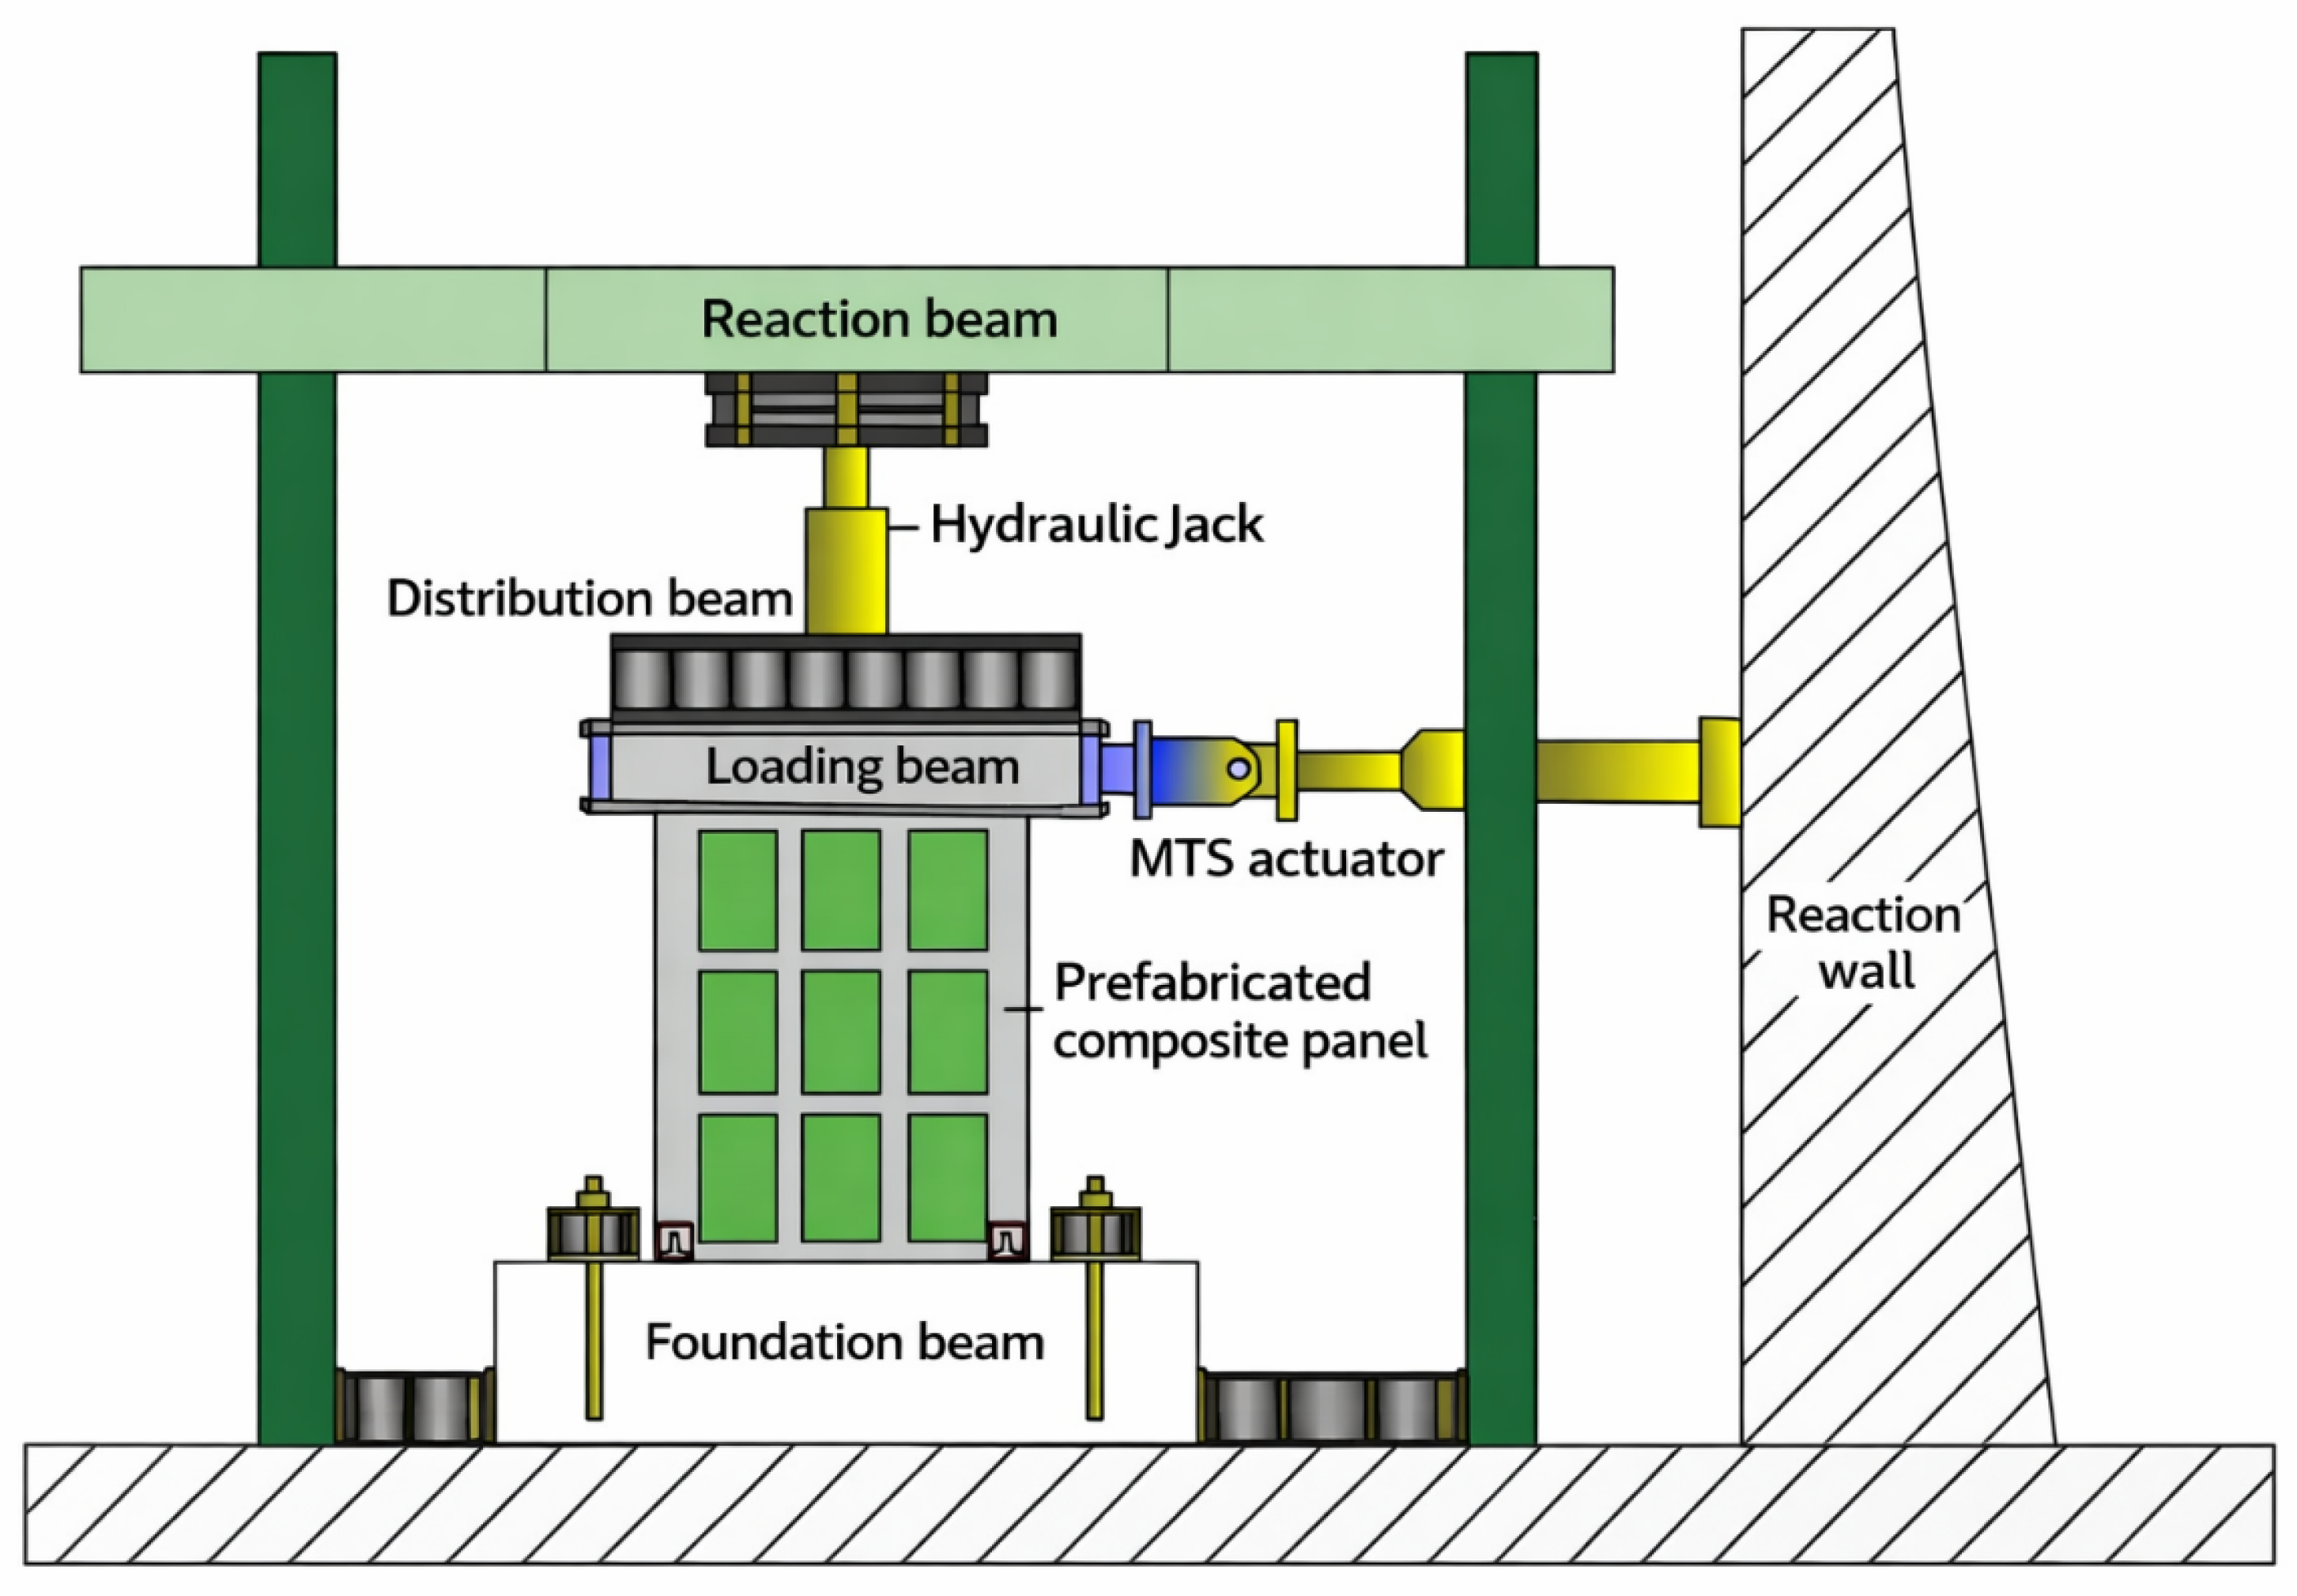
The prefabricated composite wall specimens with integrated steel box connectors were tested under constant vertical axial compression combined with either cyclic lateral loading or monotonic unidirectional loading. The test setup comprised the following components:
Vertical loading system: The vertical load was applied through a hydraulic jack, a spreader beam, and a reaction frame. The axial compression was transferred from the jack to the spreader beam, and fine sand was uniformly distributed between the spreader beam and the loading beam to ensure uniform load distribution over the top surface of the specimen.
Lateral loading system: The lateral load was applied by a 100-ton servo-controlled hydraulic actuator (MTS) together with clamping plates and high-strength threaded rods. The lateral force generated by the MTS actuator was transmitted to the loading beam of the specimen through the clamping plates and rods. Before formal testing, a small preloading process was applied to ensure proper contact among the actuator, clamping plates, rods, and specimen, and the lateral displacement response was measured using displacement transducers.
Base restraint system: The foundation beam was anchored to the strong floor by means of pressure beams and rigid hold-down bolts. In addition, horizontal jacks were installed to restrain specimen rotation and sliding, thereby ensuring a fixed-base condition.
2.4. Instrumentation and Test Protocol
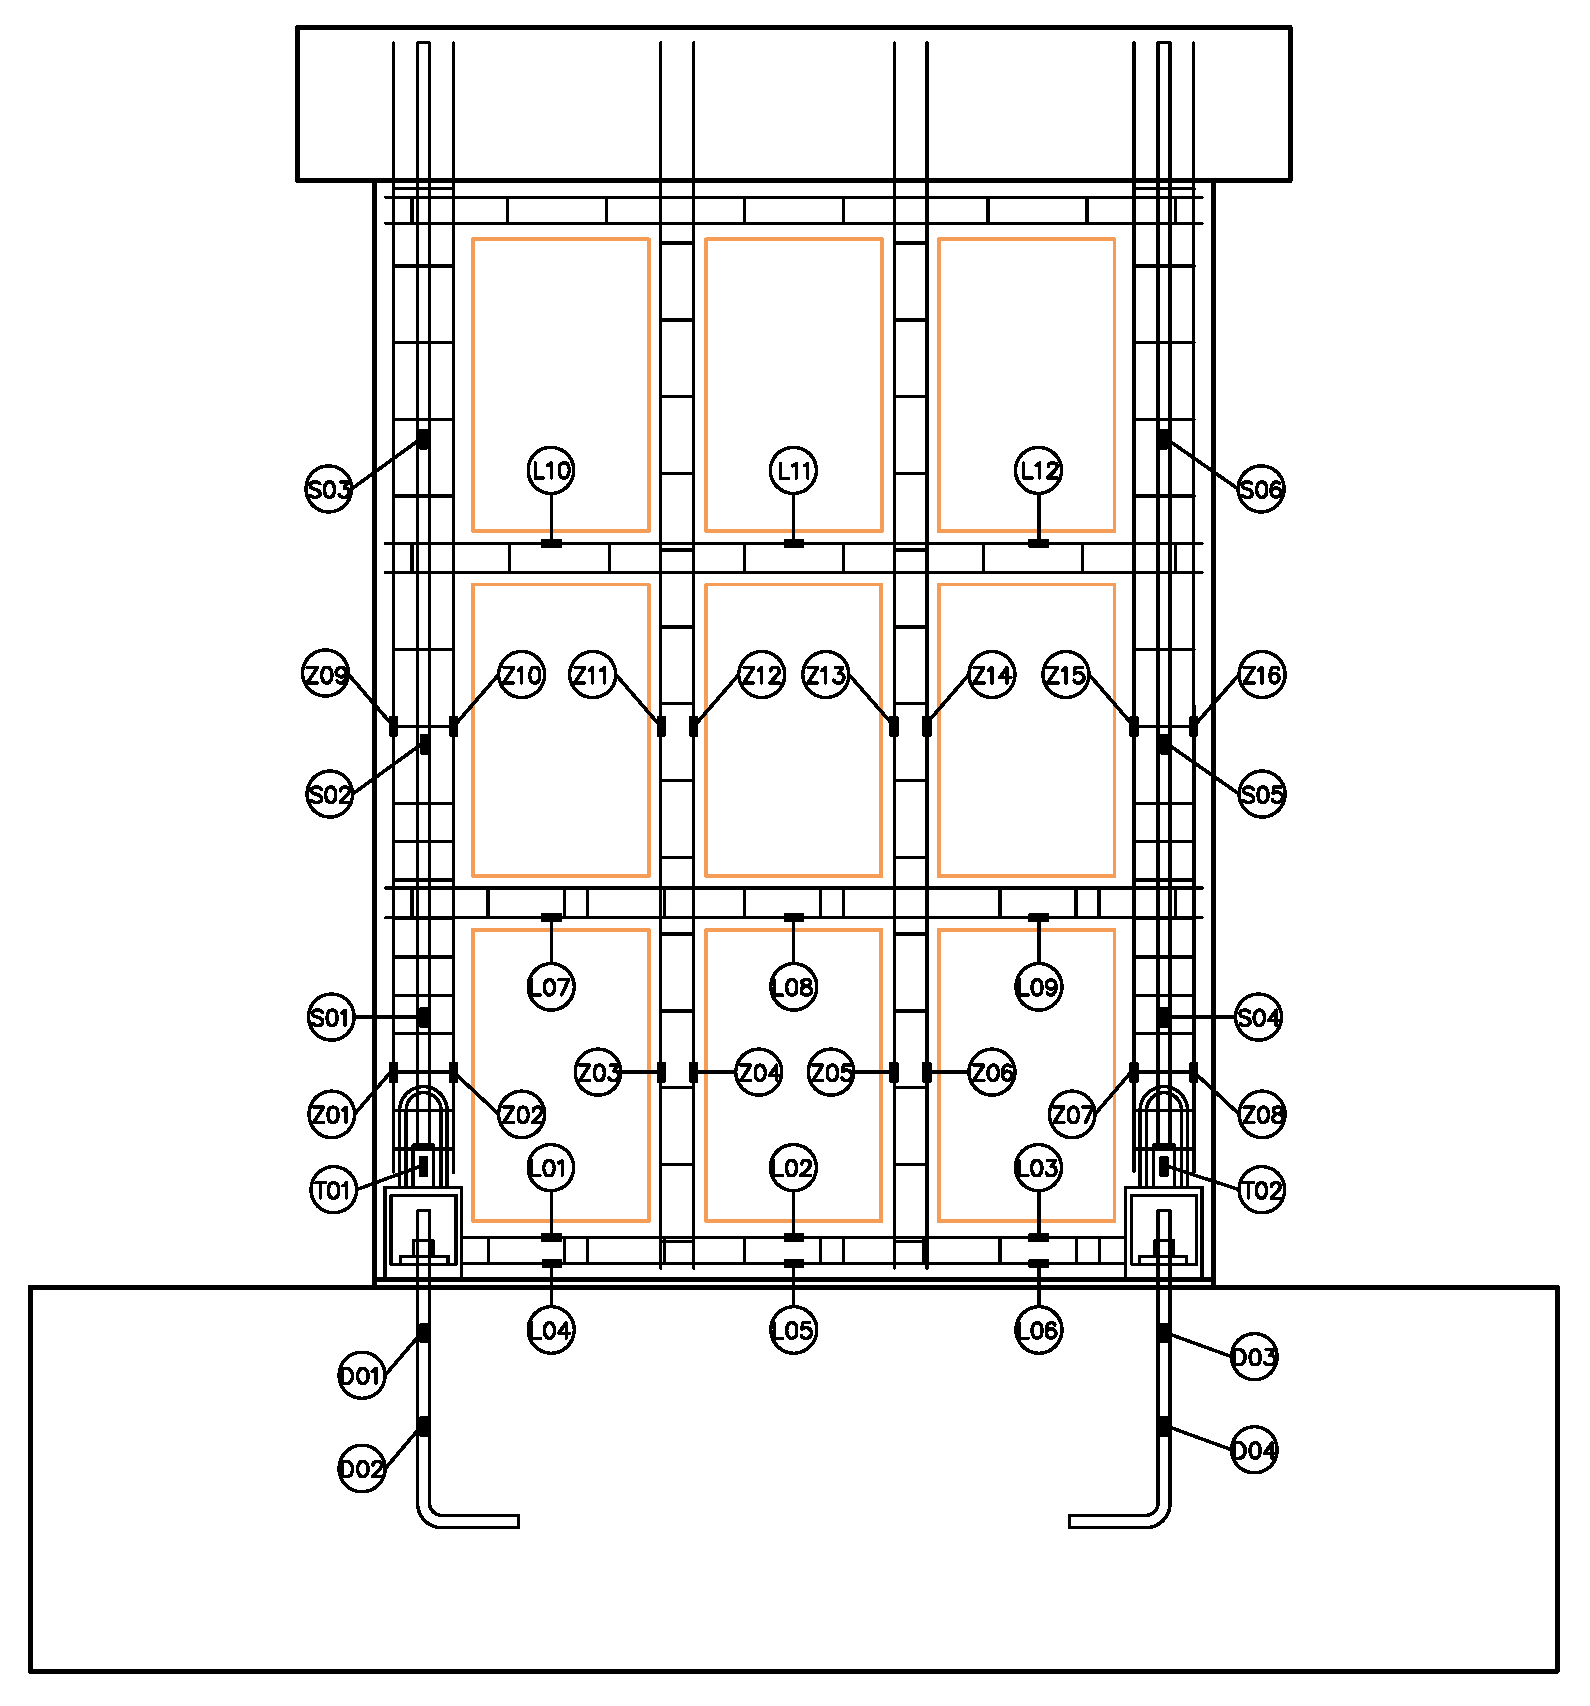
To comprehensively evaluate the shear behavior of prefabricated composite walls with integrated steel box connectors, strain gauges and displacement transducers were used to monitor damage development at the horizontal joints and within the wall panels during loading. The main measurements included the following:
(1) Crack documentation: During loading, crack development on the wall surface was inspected at each loading step. Crack patterns were marked with a permanent marker and labeled according to the corresponding load level. Particular attention was paid to crack orientation, crack width development, and crack intersections.
(2) Strain monitoring of reinforcing bars and box connectors: Electrical resistance strain gauges were embedded during specimen fabrication. Before the strain gauges were installed, the surfaces of the reinforcing bars were locally polished, cleaned, and degreased to improve gauge bonding. After bonding, the strain gauges were coated with epoxy resin for protection before concrete casting. Before formal testing, the continuity and survivability of all measurement points were checked. During loading, monitoring focused on the integrated rebars, the longitudinal reinforcement in the boundary elements, and the longitudinal bars in the ribs and columns.
(3) Displacement measurements: Displacements of the loading beam, foundation beam, and wall top, as well as lateral displacements at the elevations of the rib beams, were recorded during loading. Considering that cracking and local spalling of AAC blocks and concrete may affect local strain readings, the global deformation of the specimens was mainly evaluated using displacement transducers, while strain gauges were used to monitor the local strain development of reinforcement and connector regions.
(4) Damage phenomena and failure characteristics: Observations during loading included spalling and detachment of AAC blocks, spalling of the concrete cover over the box connectors, crushing of the bedding mortar at the joints, deformation of the steel box connectors, and buckling of reinforcing bars.
(5) Loading application and data acquisition: A 100-ton MTS actuator was used to apply both monotonic and cyclic lateral loading to the composite wall specimens. The lateral load was recorded by the load cell of the MTS actuator, the displacement responses were measured using displacement transducers, and the reinforcement strains were recorded using a multi-channel static strain acquisition system.
2.5. Strain Gauge Arrangement
Strain gauges were attached to the longitudinal bars in the ribs and columns, to the integrated rebars, and to selected locations on the concrete wall surface to determine the corresponding deformation and the onset of yielding. Uniaxial strain gauges with a gauge length of 2 × 3 mm
2 were used. The strain measurement layouts for specimens IPC1 and IPCm are shown in
Figure 5. Temperature-induced drift was reduced by zero balancing the strain channels before loading and using temperature-compensated strain measurement during the test.
2.6. Displacement Transducer Arrangement
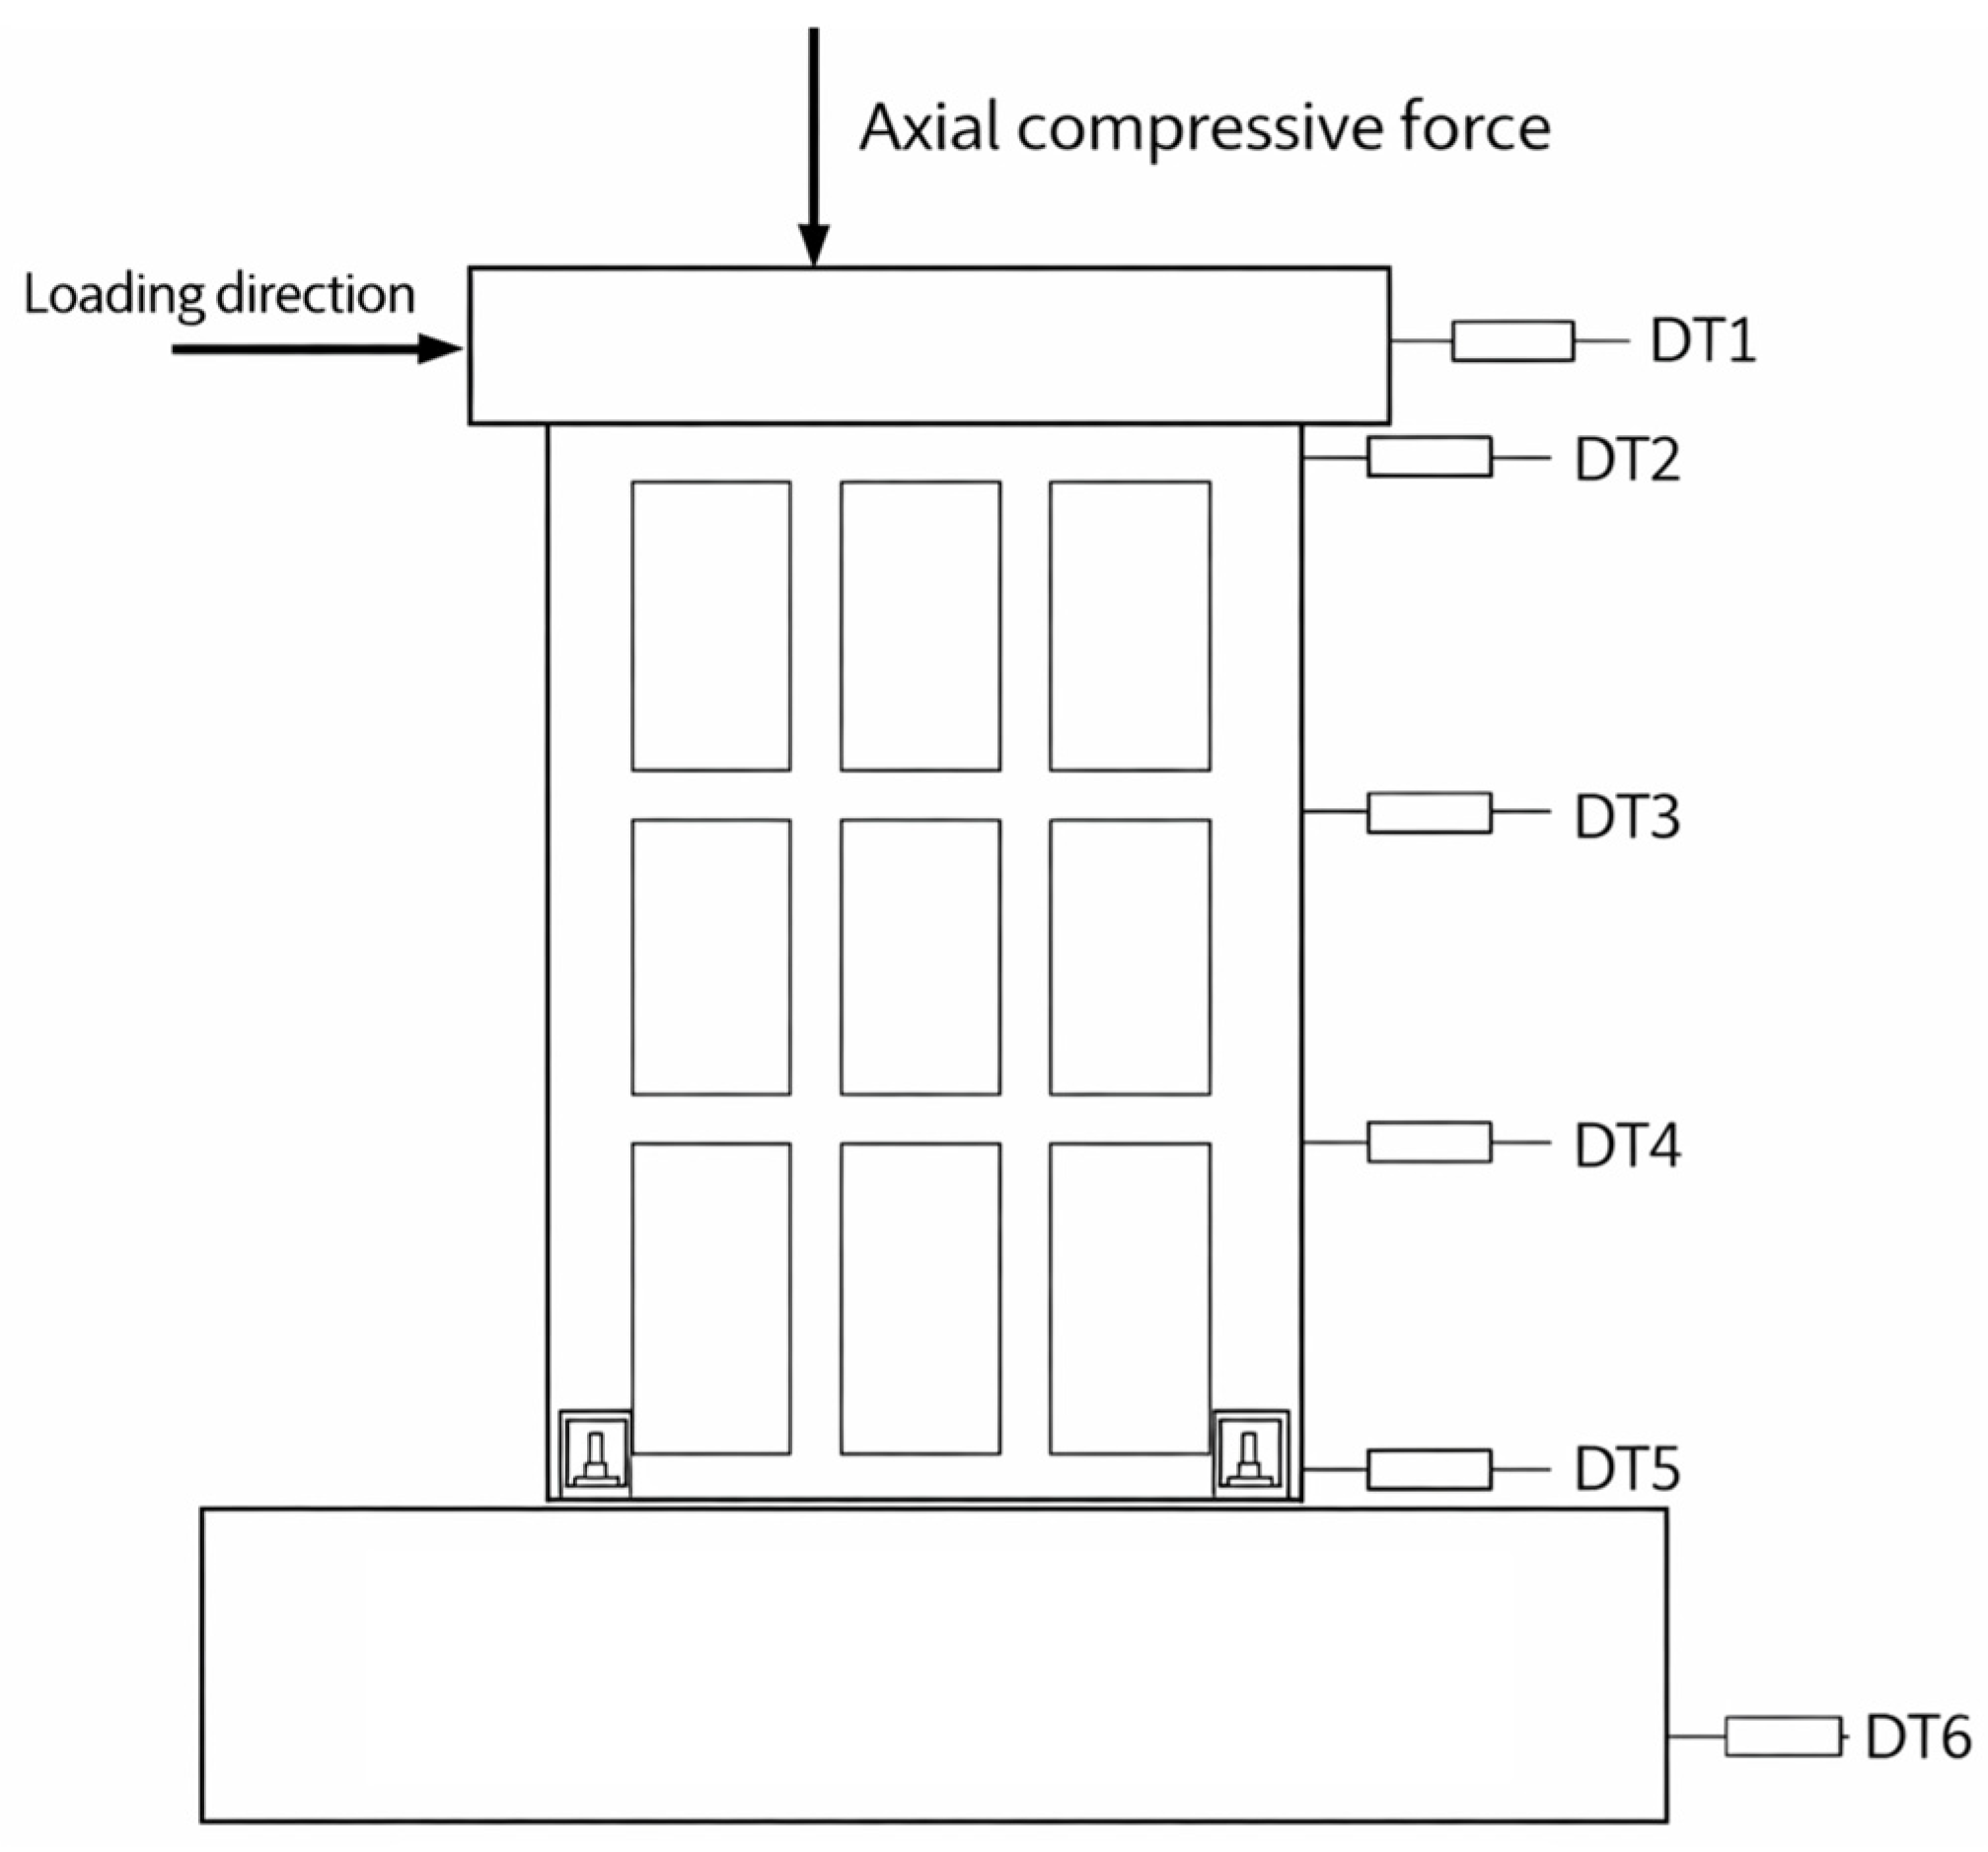
A total of six displacement transducers were used in this test.
DT-1 was a cable-extension transducer with a measuring range of 50–1000 mm. DT-2 and DT-3 were linear variable differential transformers (LVDTs) with a measuring range of ±50 mm. DT-4 and DT-5 were LVDTs with a measuring range of ±25 mm. DT-6 was an LVDT with a measuring range of ±10 mm. The detailed instrumentation layout is shown in
Figure 6.
2.7. Loading Protocol
Under constant vertical axial compression, lateral loading was applied in two patterns: monotonic unidirectional loading and quasi-static reversed cyclic loading.
(1) Loading Procedure
(a) Vertical axial compression: The axial load ratio was selected to simulate the compression carried by the first-story wall in an existing prefabricated composite wall building. An axial load ratio of 0.2 was adopted in this study, corresponding to a vertical load of 240 kN applied to the specimen. (b) Lateral loading: After the vertical load was applied, lateral load was imposed incrementally on the loading beam through the actuator. To eliminate gaps between the actuator, the specimen, and the clamping plates and to ensure stable load transfer, a preloading procedure was carried out. The preloading consisted of two repeated cycles of 10 kN lateral load in each direction.
(2) Loading History
In accordance with the Specification for Seismic Test of Buildings [
21], a combined force-control and displacement-control loading history was adopted, with yielding of the specimen taken as the transition point. The loading sequence was as follows:
Force-controlled stage: Initial loading started at 10 kN and increased in increments of 10 kN. Each load level was applied for one fully reversed cycle until the cracking load was observed. After crack initiation, loading continued in 10 kN increments, and yielding was identified from the variation in longitudinal reinforcement strain.
Displacement-controlled stage: After yielding, the control mode was switched to displacement control. The test was terminated when the load-carrying capacity decreased to 85% of the peak load. For unidirectional loading, displacement control was used throughout. The loading was applied in a quasi-static stepwise manner. After each target load or displacement level was reached, the level was maintained briefly until the specimen response became stable, during which data were recorded and cracks were observed. The detailed loading history is summarized in
Table 8.
3. Experimental Phenomena and Analysis
The loading direction was defined as follows: the direction applying thrust to the specimen from west to east was taken as positive, whereas the direction applying tension from east to west was taken as negative.
3.1. Specimen IPC1
Preloading stage: No cracks were observed in the wall, and the specimen remained in the elastic range.
Force-controlled loading stage: When the load was below 30 kN, no cracks appeared in the rib beams or rib columns, and only a few microcracks were observed in the AAC blocks. At a lateral load of 30 kN, distinct cracks initiated at the corners of the blocks and at the interfaces between the blocks and the rib beams or rib columns. An inflection point appeared in the skeleton curve and was identified as the cracking load. As the load increased to 50 kN, small diagonal cracks successively developed in the upper and middle blocks, and the existing cracks gradually widened. At 70 kN, cracks in the middle rib beam partially penetrated the section, and vertical cracks appeared at the locations of the steel box connectors. The block cracks formed an X-shaped diagonal pattern, indicating a shear-dominated failure mode. At a load of 80 kN, the yield point was identified from the load–displacement curve, corresponding to a yield displacement Δy of 4.6 mm. The test then entered the displacement-controlled stage.
Displacement-controlled loading stage: Cracks continued to propagate and widen with increasing displacement. At a displacement of 2.0Δy (9.2 mm), surface spalling occurred in the middle AAC blocks, and cracks at the bottom of the central rib column penetrated the section. Diagonal cracks in the blocks on the east and west sides of the upper wall extended to the upper rib beam, accompanied by concrete spalling at the west corner. The peak load was reached at this stage. At a displacement of 5.0Δy (23.0 mm), the concrete cover over the box connectors in the boundary rib columns on both sides was crushed and detached, and the bedding mortar was crushed. The hysteretic loops exhibited pinching, and the lateral resistance fell below 85% of the peak load, indicating specimen failure.
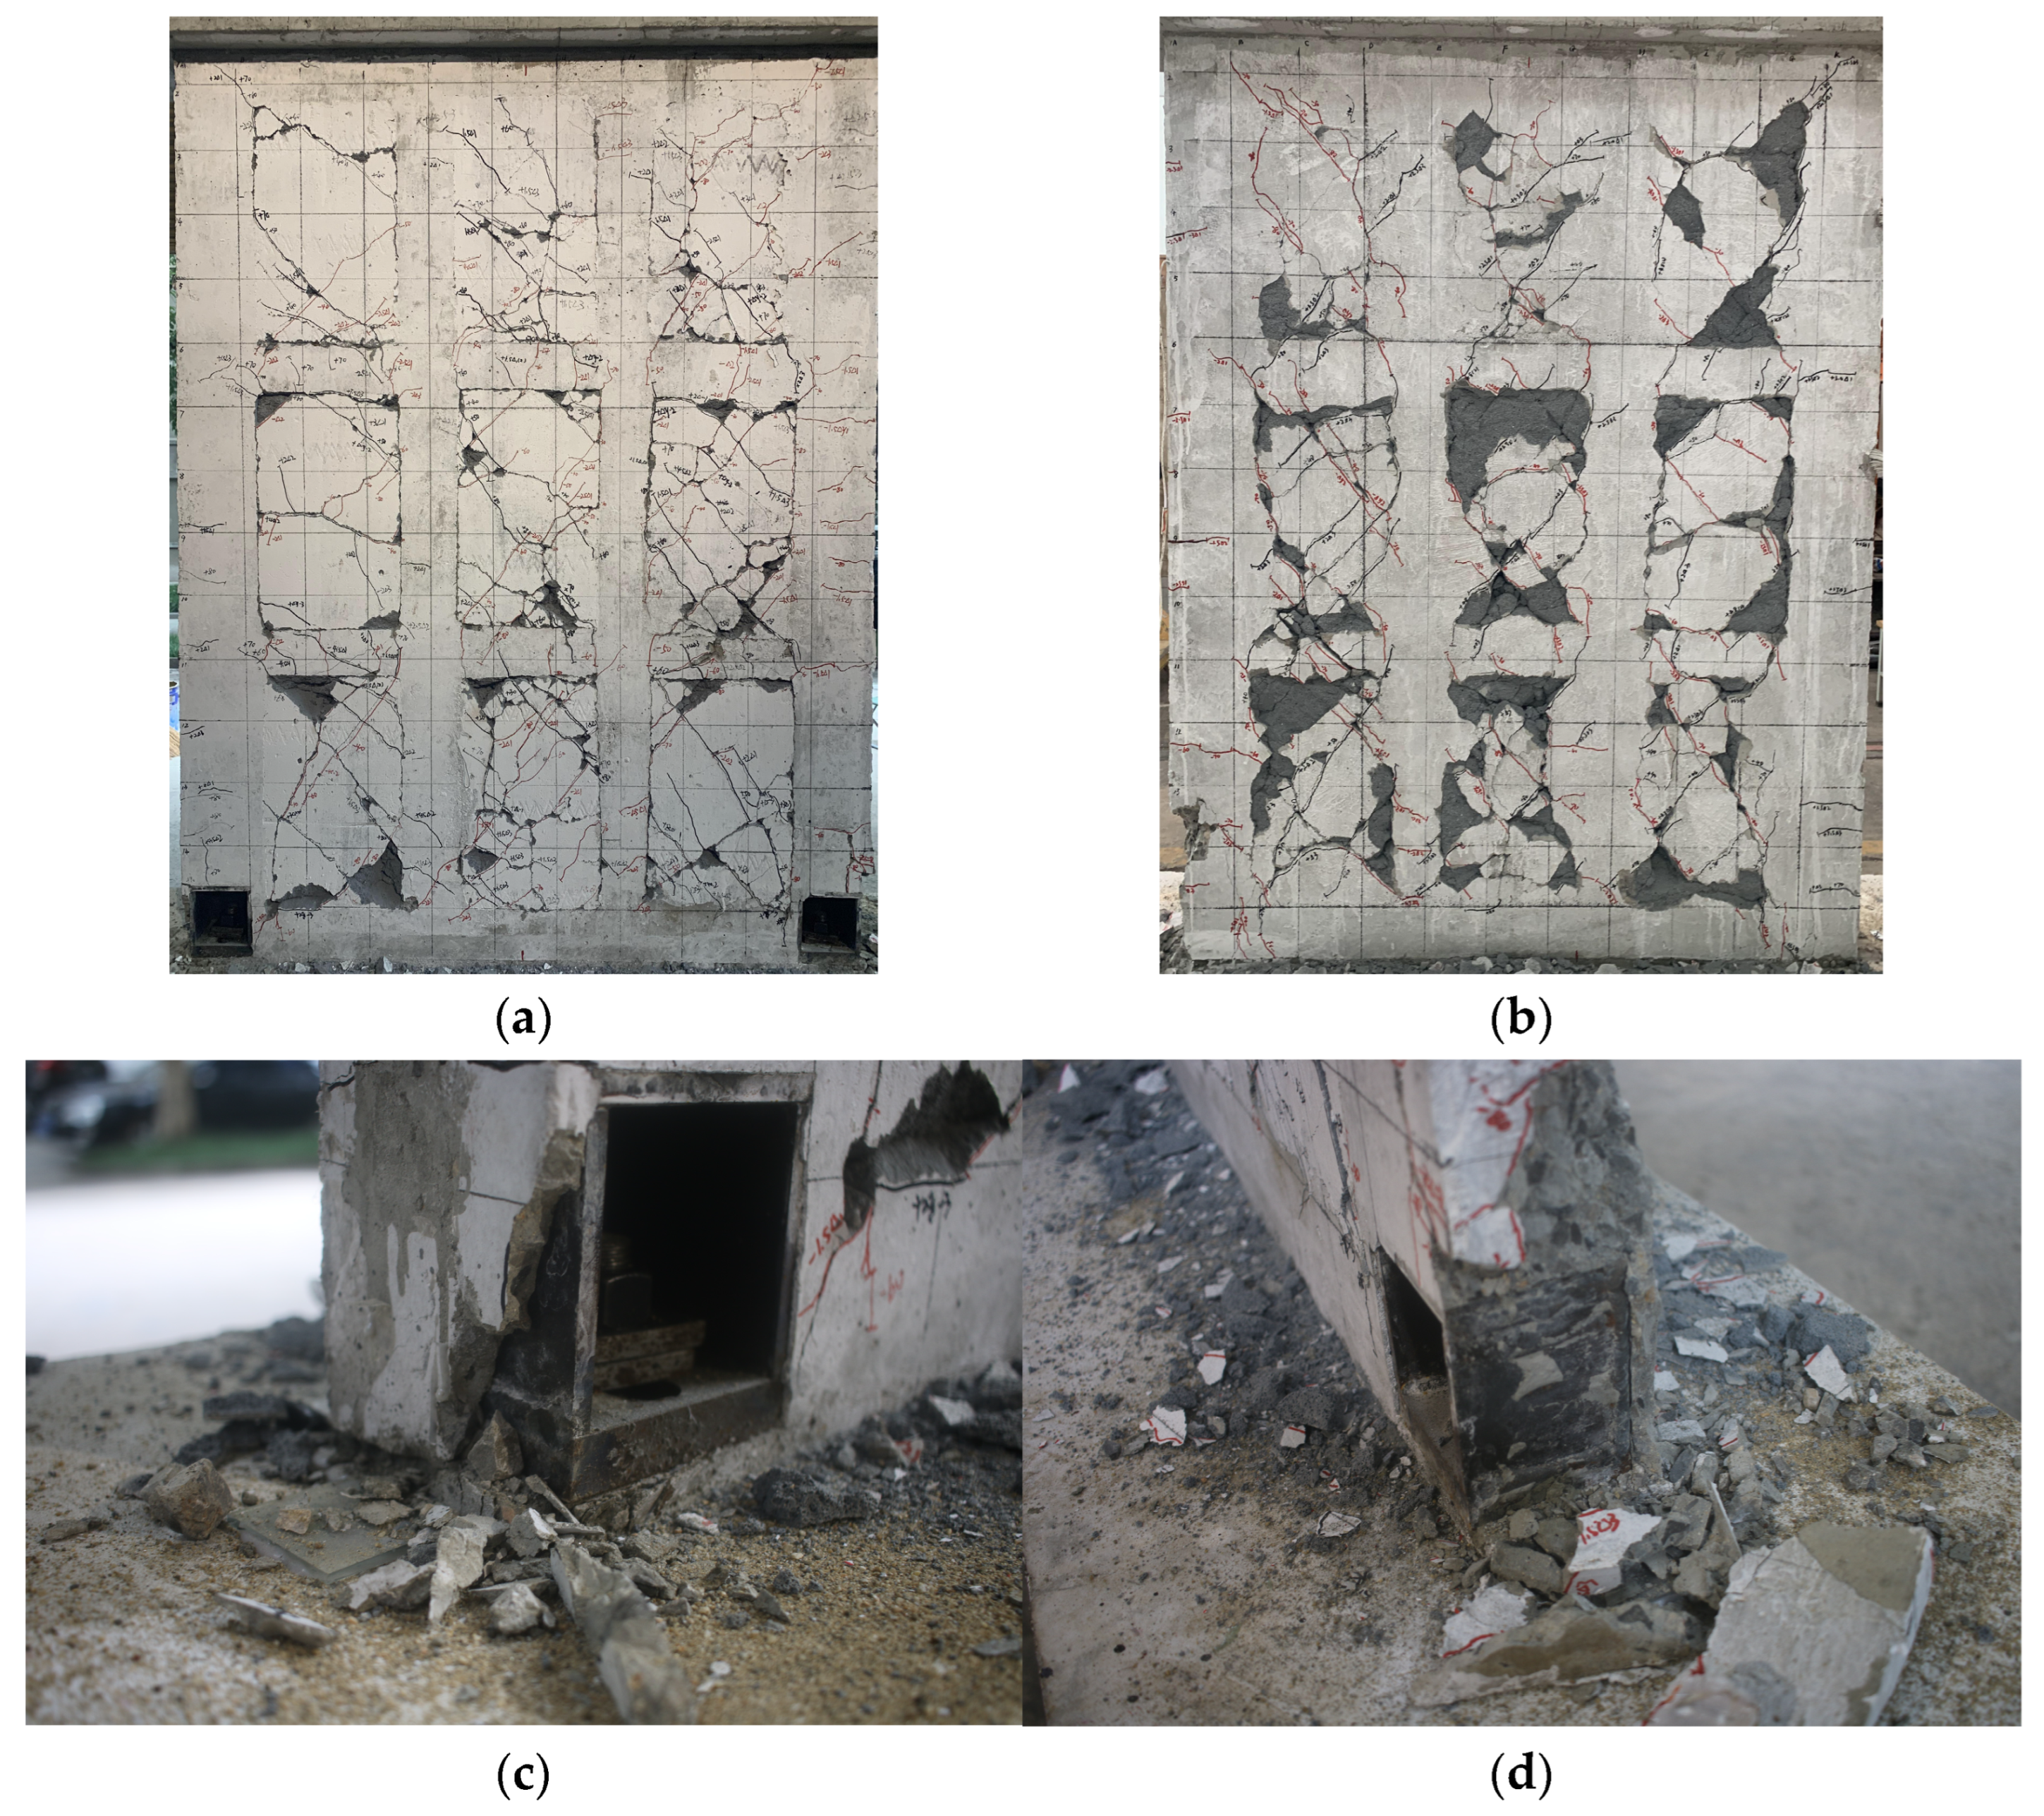
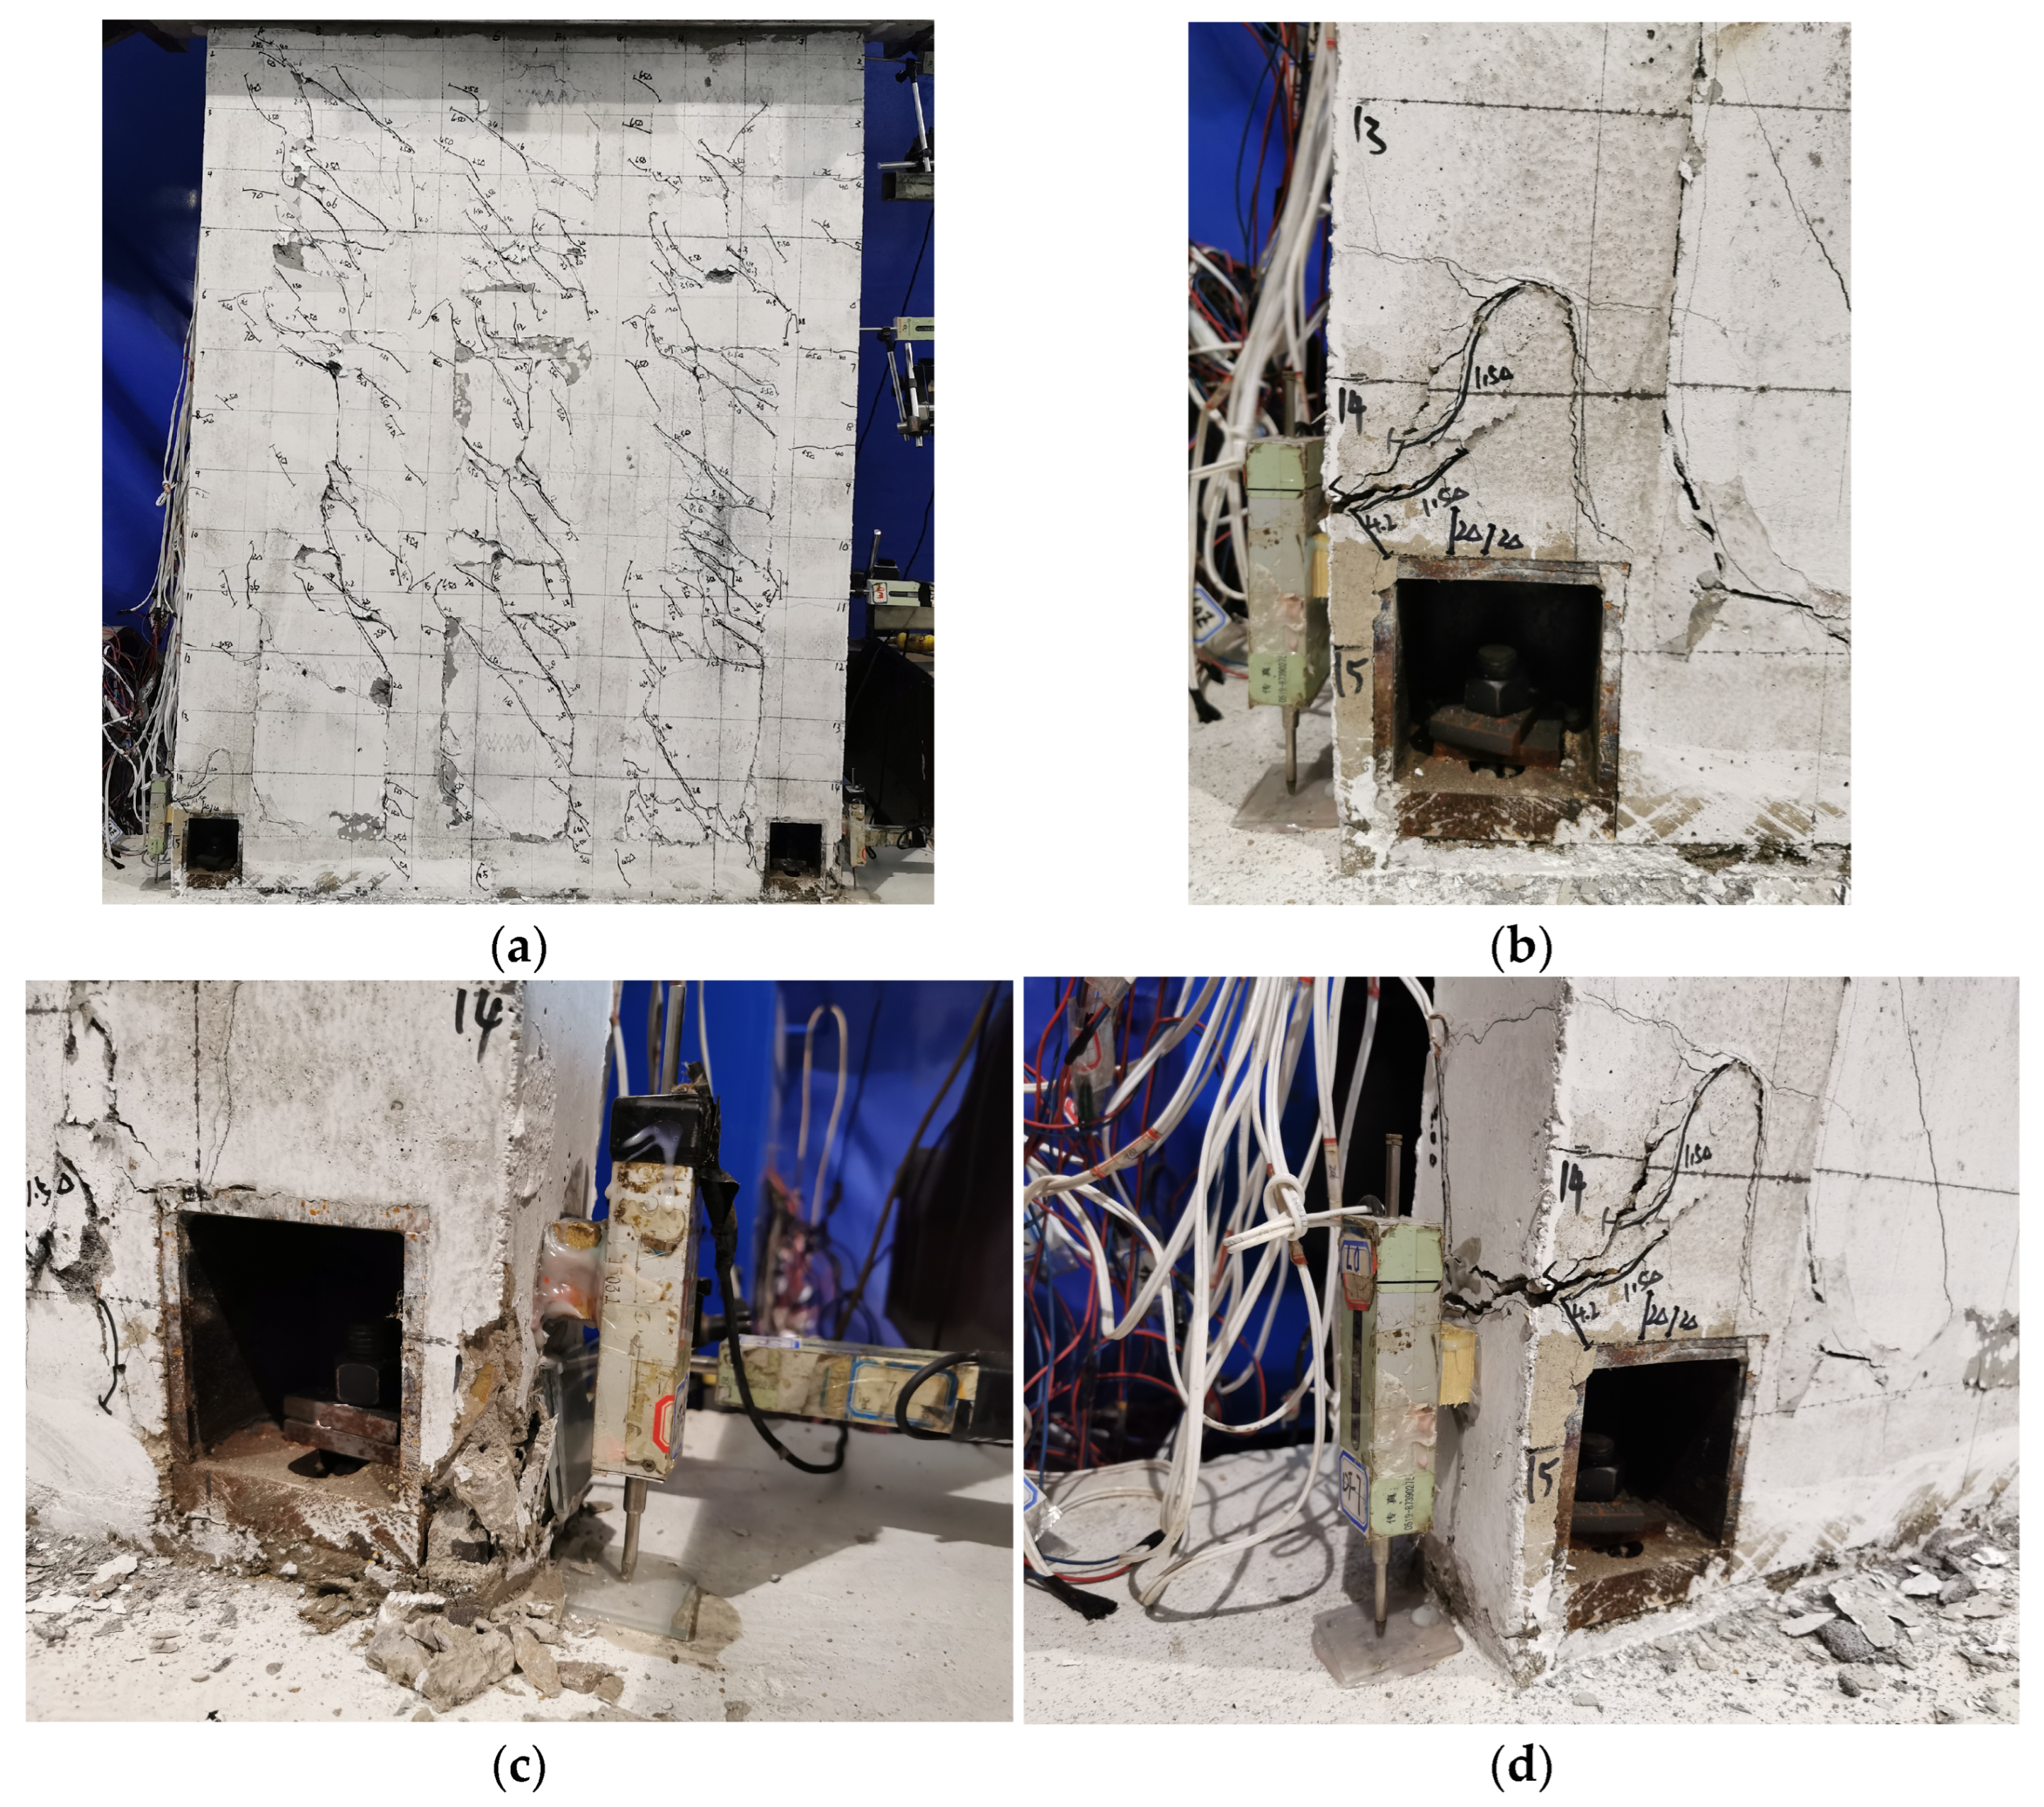
Failure characteristics: Cracks were fully developed and densely distributed over the wall surface. The AAC blocks were severely cracked, and the diagonal cracks formed an X-shaped pattern. Surface spalling of the blocks occurred during the later loading stages. Beyond the ultimate load, the longitudinal bars in the rib columns and rib beams yielded, and the concrete cover at the box connector locations spalled. The final failure mode is shown in
Figure 7.
3.2. Specimen IPCm
Preloading stage: No cracks were observed in the wall, and the specimen remained in the elastic range.
Loading stage: With increasing displacement, cracks initiated at the interfaces between the AAC blocks and concrete, and diagonal cracks appeared in the middle blocks. At a displacement of 14.4 mm, horizontal cracks developed in the west boundary rib column, and block cracks extended to the middle rib column, while most cracks in the middle rib beam had fully penetrated. The peak load was reached at this stage. At a displacement of 60.4 mm, the concrete at the east column base was crushed and spalled, accompanied by internal thudding sounds. The load-carrying capacity then decreased to less than 85% of the peak load, indicating specimen failure and termination of the test.
Failure characteristics: The specimen experienced three stages, namely, the elastic stage, the elastoplastic stage, and the failure stage. During loading, damage progressed sequentially from the blocks to the rib beams and then to the rib columns, indicating a shear-dominated failure mode. At final failure, no obvious fracture or pull-out failure was observed in the box connectors or in the horizontal joint core, although local connector deformation was noted and damage was mainly concentrated in the wall panel. This observation suggests that the integrated rebar box connection was able to maintain force transfer between the upper and lower wall panels under the present test conditions. The final failure mode is shown in
Figure 8.
3.3. Load–Displacement Curves
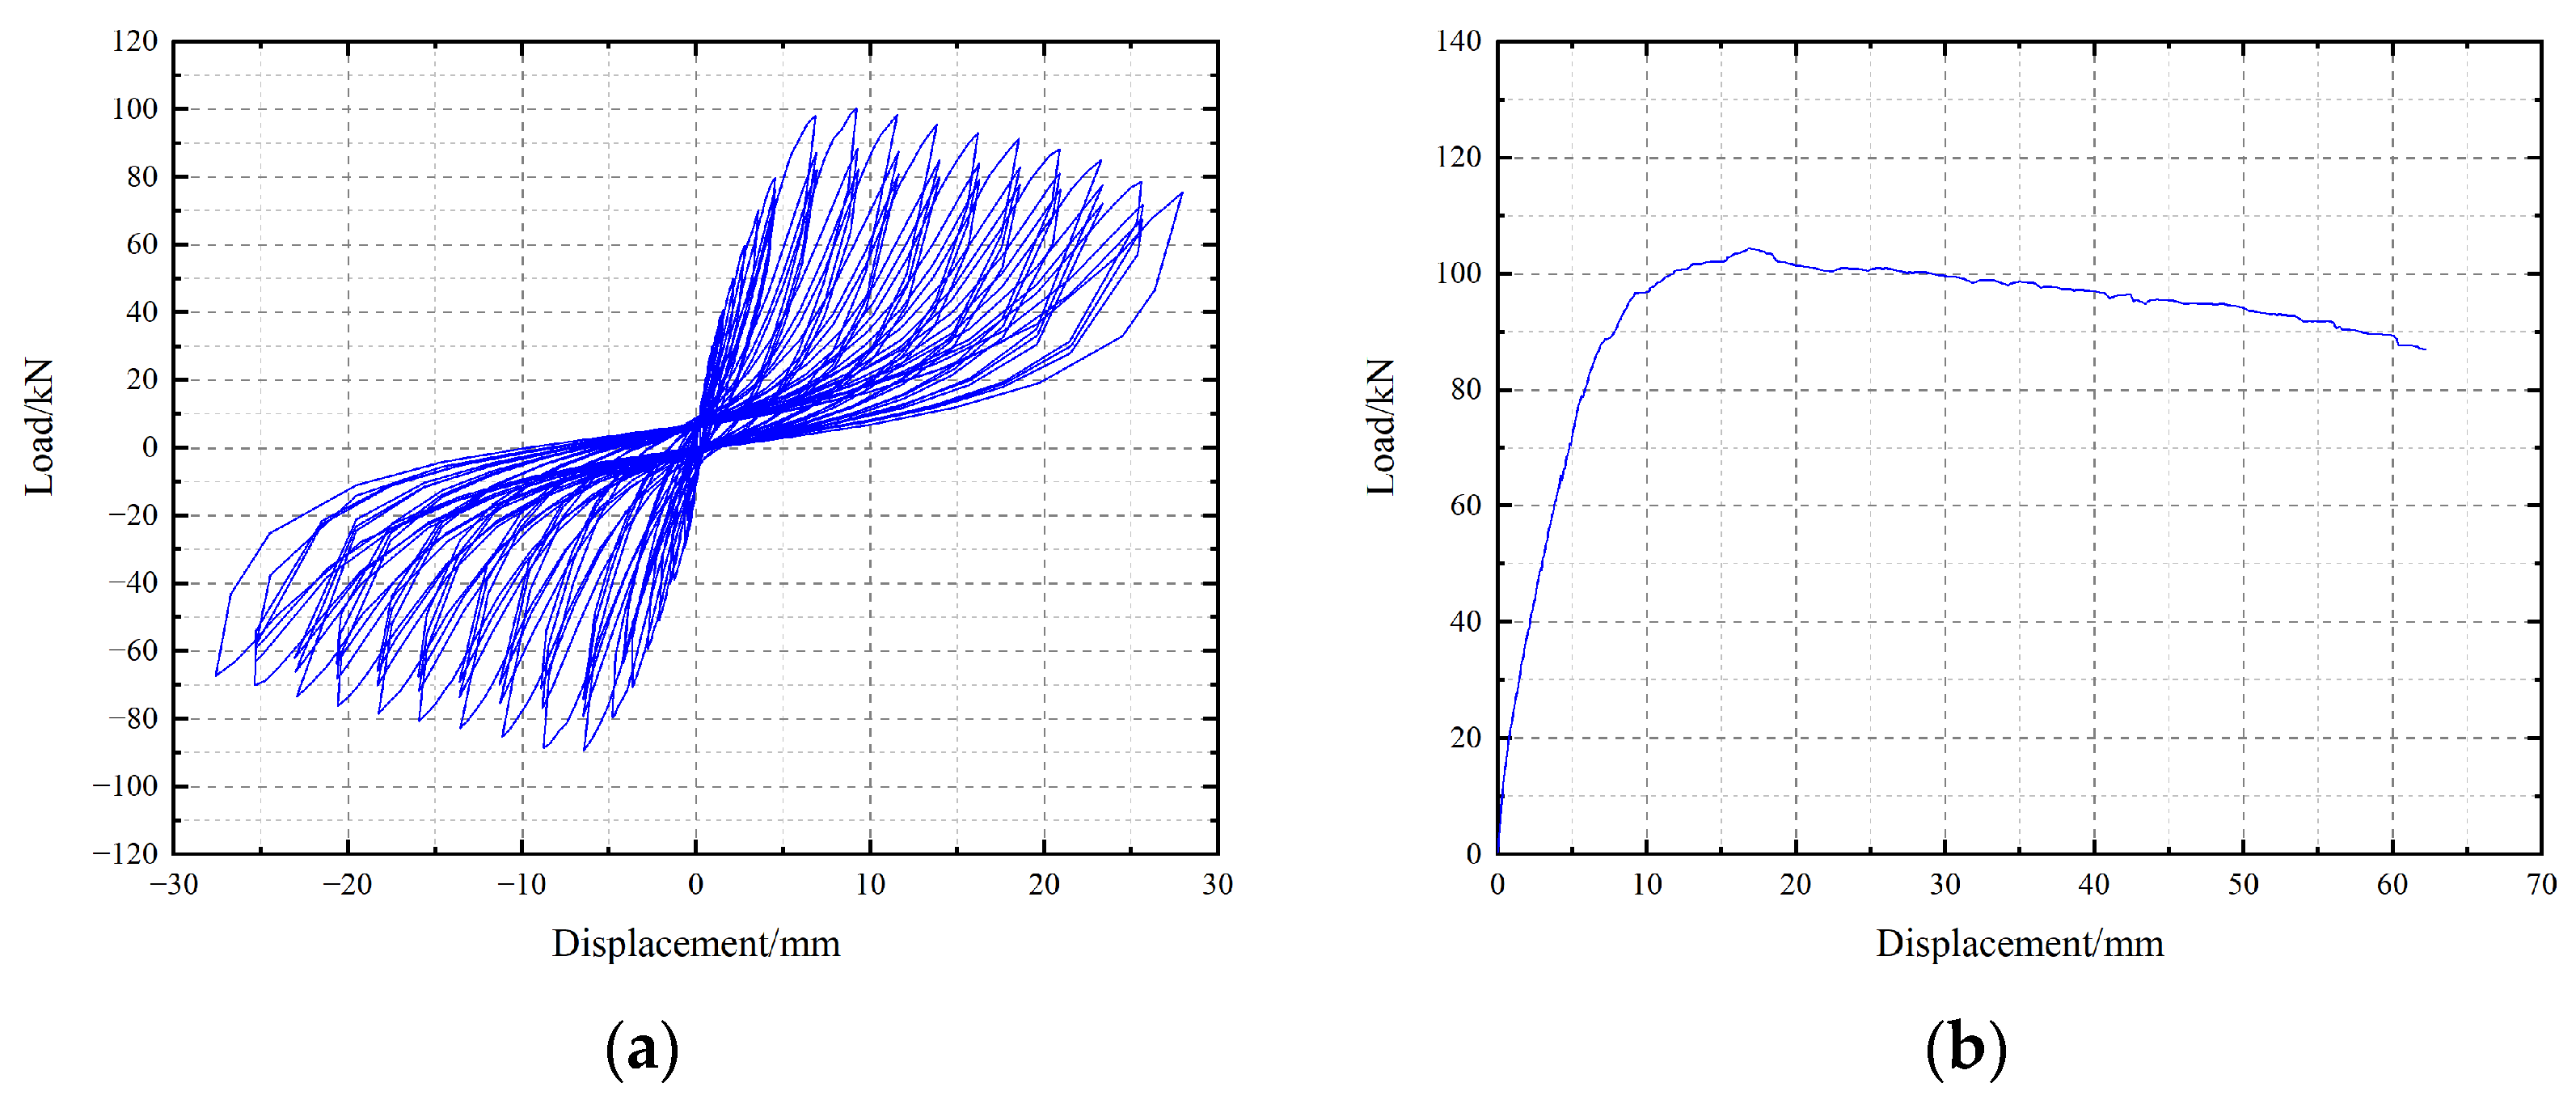
The load–displacement curves of the specimens are presented in
Figure 9.
Comparison of the load–displacement curves in
Figure 9 leads to the following observations:
(1) Analysis of specimen IPC1: Before cracking, both the load and displacement were small, and the hysteretic loops were essentially linear, indicating elastic behavior with negligible residual deformation after unloading. From crack initiation to yielding, the specimen entered the elastoplastic stage, and the hysteretic loops became spindle-shaped. The slope of the hysteretic curves gradually decreased, and the residual deformation after unloading to zero load increased progressively. After yielding, as the displacement amplitude increased, the slope of the hysteretic curves continued to decrease, indicating stiffness degradation, and the hysteretic loops evolved into reverse S-shaped forms with pronounced pinching. Beyond the peak load, the unloading stiffness decreased further and the residual deformation increased, with the hysteretic loops showing significant pinching. Throughout the loading process, relative slip between the concrete frame and the AAC blocks was evident, which was reflected in the pinching of the hysteretic curves. The wall underwent shear deformation and ultimately failed in a shear-dominated mode.
(2) Analysis of specimen IPCm: Under monotonic loading, the specimen remained in the elastic range before cracking, and the load–displacement curve was nearly linear. Between crack initiation and yielding, crack propagation in the wall panel reduced the stiffness, which was reflected in a decrease in the slope of the curve. After yielding, the specimen entered the strain-hardening stage, and the stiffness degraded rapidly. Beyond the peak load, as the lateral displacement increased, the shear resistance contributions of the blocks, rib beams, and rib columns diminished successively, whereas the stress in the shear reinforcement increased progressively. The specimen ultimately failed because of concrete crushing in the compression zone at the column base.
3.4. Skeleton Curves
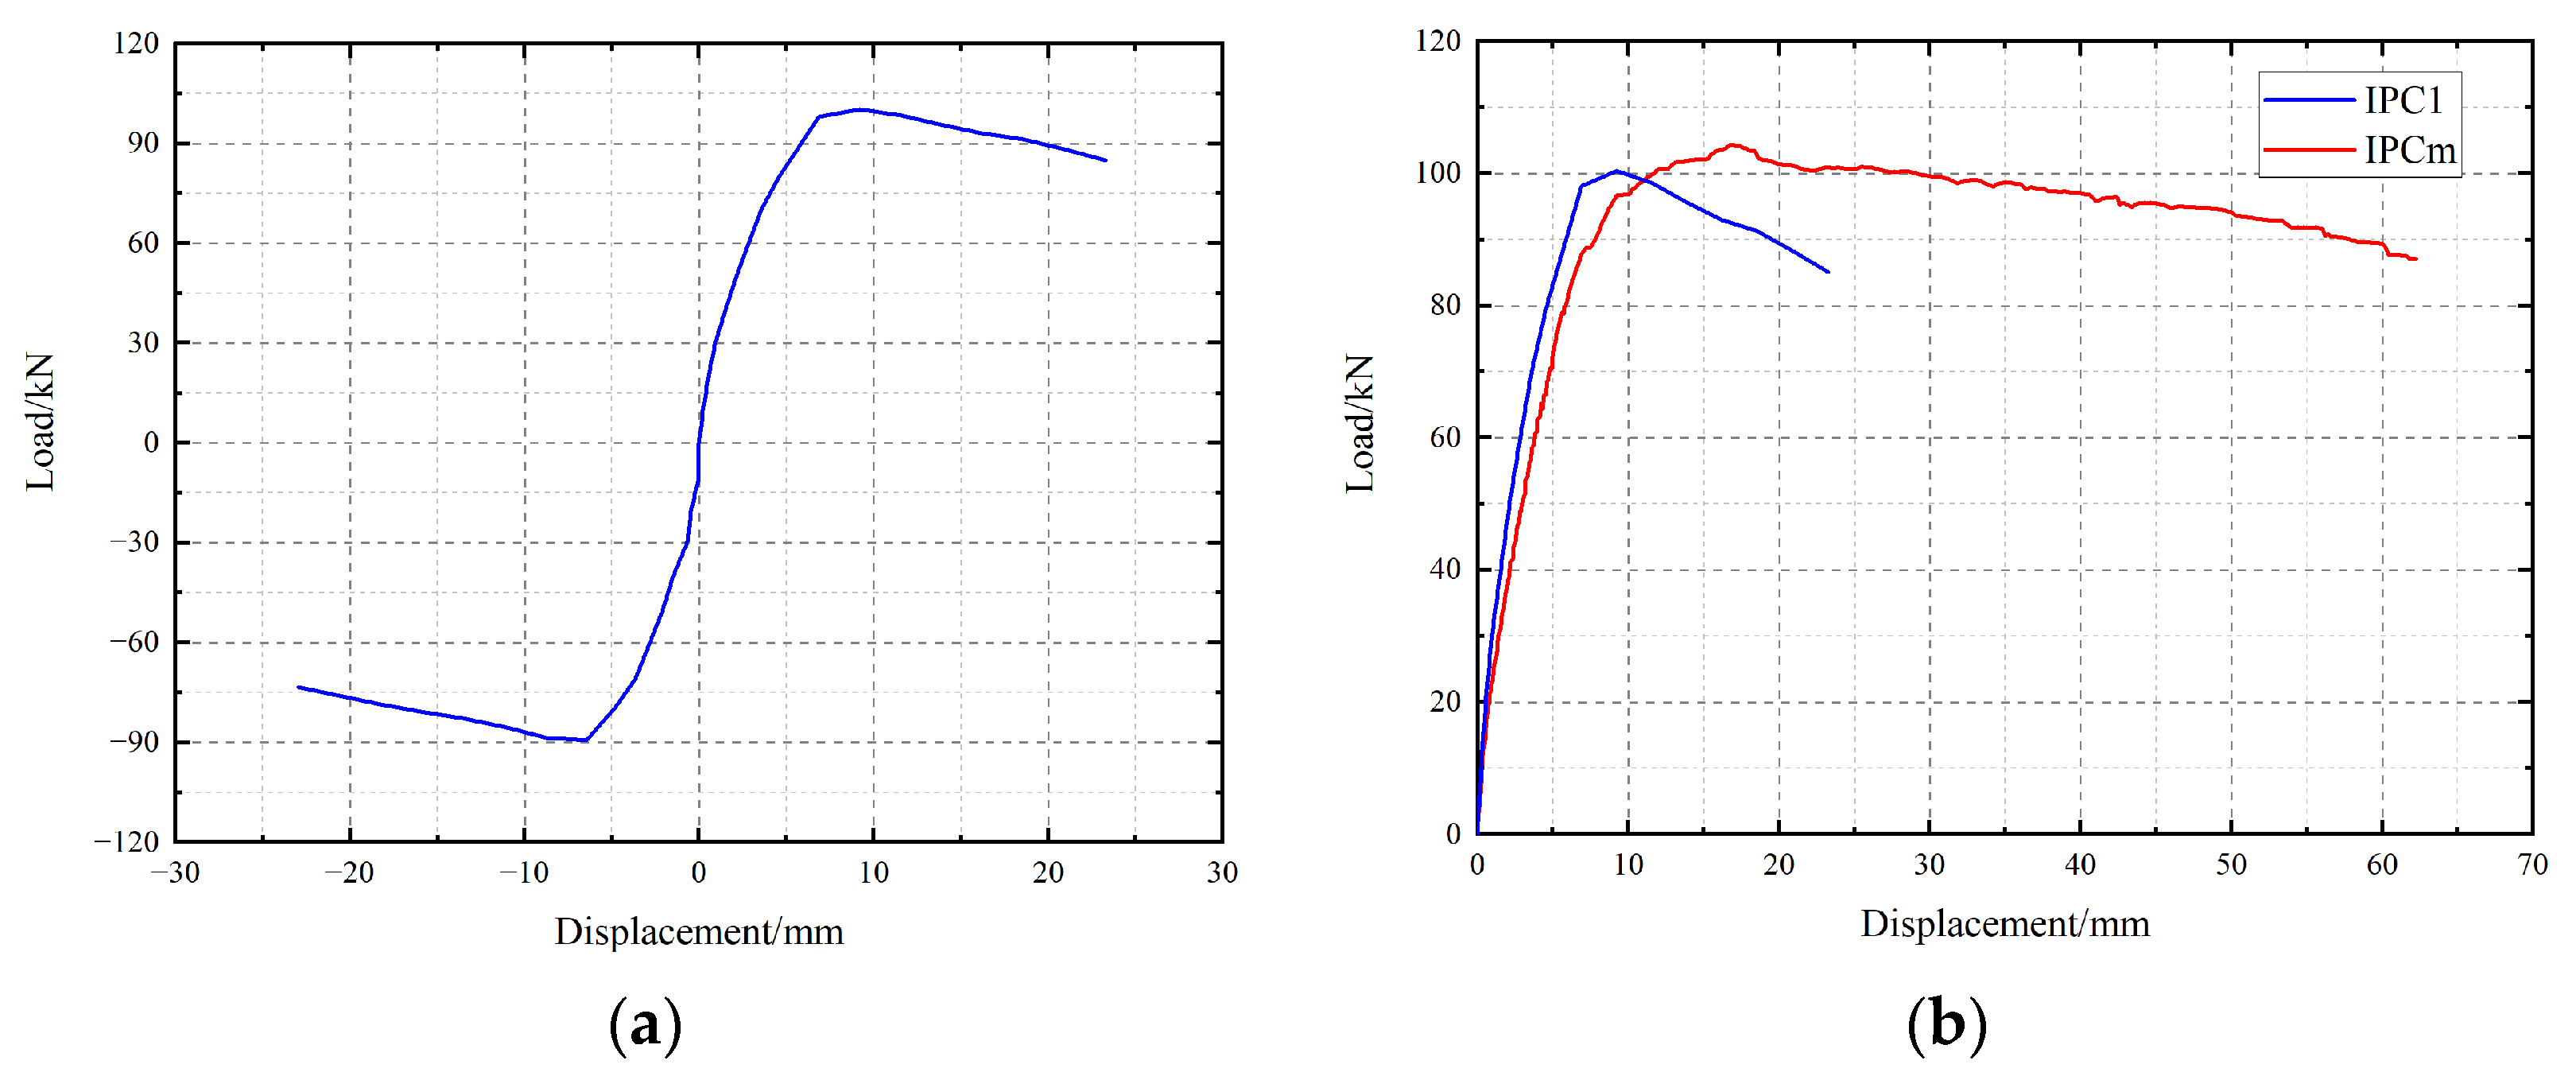
The skeleton curves of the fully prefabricated composite wall specimens with integrated rebar box connections are presented in
Figure 10.
(1) Analysis of specimen IPC1: The skeleton curve exhibits an S-shaped profile, reflecting the three stages experienced by the specimen, namely the elastic stage, the yielding stage, and the failure stage. Before yielding, the specimen remained in the elastic stage, with limited deformation and little stiffness degradation. After the yield point was reached, the increase in the skeleton curve slowed, the rate of strength increase decreased, plastic deformation accumulated progressively, and stiffness degradation accelerated. Beyond the ultimate load, the load-carrying capacity decreased gradually, while the specimen retained a certain residual strength and eventually failed in a ductile manner.
(2) Comparison between IPC1 and IPCm: The two specimens exhibited similar failure modes. Compared with cyclic loading, monotonic loading resulted in a slightly higher peak load, a more gradual post-peak strength degradation, and larger deformation capacity under monotonic loading. This difference can be attributed to fatigue damage caused by reversed cyclic loading in the wall panel. In terms of initial stiffness, specimen IPCm under monotonic loading showed slightly higher stiffness than specimen IPC1 under cyclic loading, which may be related to fabrication variability between the specimens.
3.5. Load-Carrying Capacity and Deformation Capacity Analysis
The characteristic points, inter-story drift ratios, and ductility coefficients of all specimens are summarized in
Table 9.
(1) Specimens IPC1 and IPCm had identical integrated rebar configurations and wall dimensions. Specimen IPCm was subjected to monotonic unidirectional loading. Compared with IPC1, the two specimens had the same cracking load of 30 kN. However, the yield load, peak load, and ultimate load of IPCm were 4.7%, 10.0%, and 10.7% higher, respectively. Except for the cracking load, all characteristic load-carrying capacities under monotonic loading exceeded those under cyclic loading.
(2) For the cyclic specimen IPC1, the measured ductility coefficient exceeded the reference value of 3.0 specified in GB 50011-2010 [
22], indicating satisfactory deformation capacity under reversed cyclic loading. Its ultimate drift ratio also exceeded the elastoplastic drift limit of 1/120, suggesting that the specimen retained considerable deformation capacity before failure. For the monotonic specimen IPCm, the corresponding displacement-based indices are reported only as supplementary indicators of deformation capacity under monotonic loading and should not be directly interpreted as independent seismic qualification.
(3) Compared with IPC1, specimen IPCm exhibited larger yield, peak, and ultimate displacements, and a higher displacement ductility coefficient. These differences mainly reflect the influence of the loading protocol and the cumulative damage introduced by reversed cyclic loading, rather than an inherent superiority of monotonic loading for seismic assessment.
3.6. Stiffness Degradation Analysis
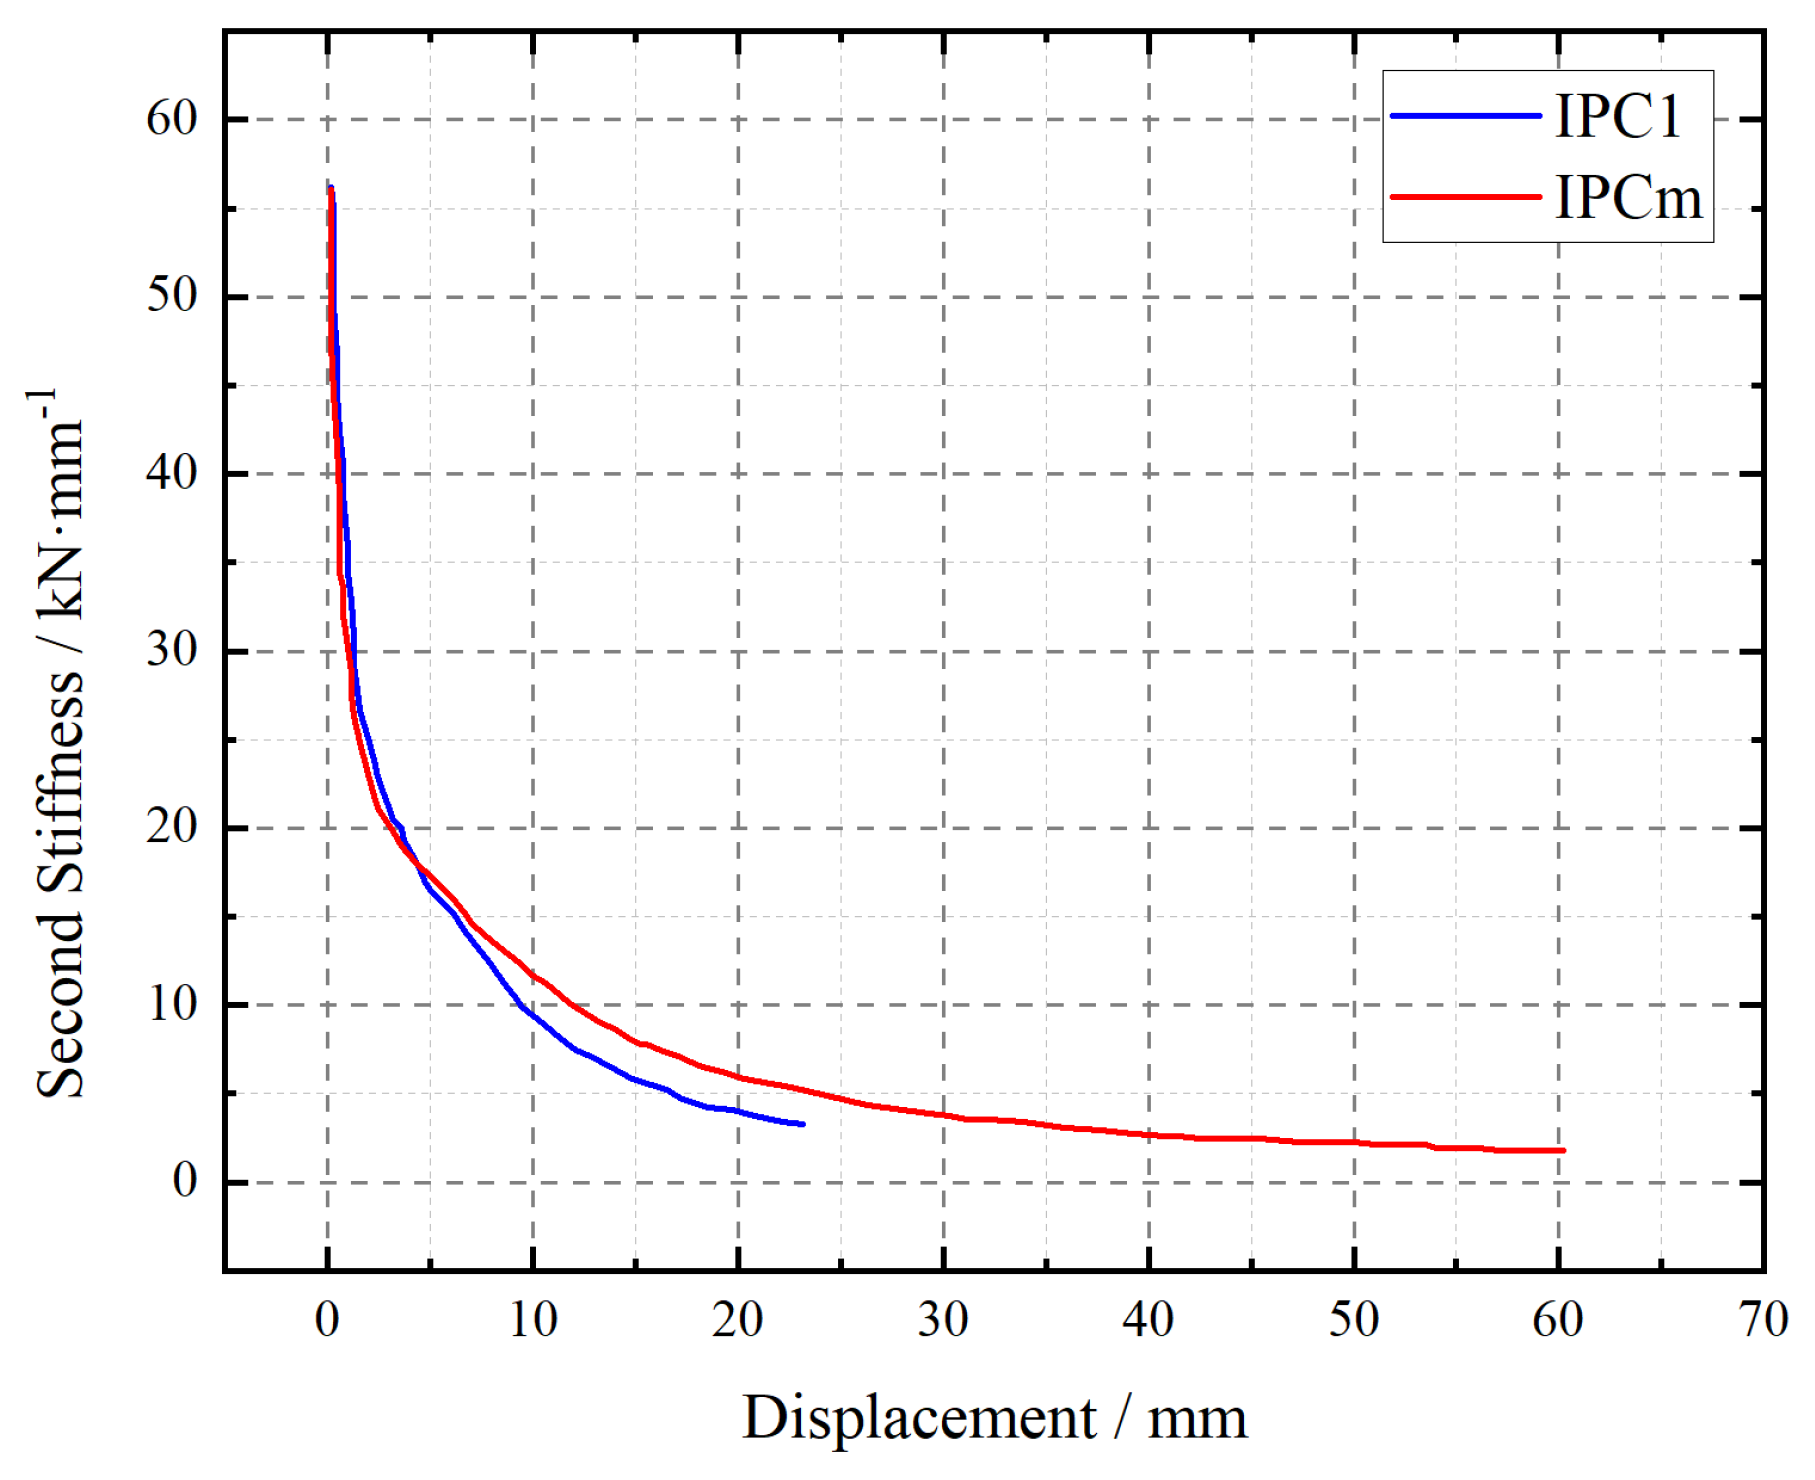
To compare the stiffness evolution of the two specimens under different loading protocols, the secant stiffness at the characteristic points was adopted. For the cyclic specimen IPC1, the stiffness values were determined from the skeleton curve; for the monotonic specimen IPCm, the stiffness values were determined from the monotonic load–displacement curve. In both cases, the secant stiffness was calculated as
, where
and
are the load and the corresponding displacement at the cracking, yielding, peak, and ultimate points, respectively. The characteristic points and secant stiffness values are presented in
Table 10, and the stiffness degradation trends are shown in
Figure 11.
(1) Both specimens showed a generally similar trend of stiffness degradation. Before cracking, the stiffness decreased rapidly. From cracking to yielding, the degradation rate became slower. After yielding, the stiffness continued to decrease with the accumulation of damage and plastic deformation until failure.
(2) Comparison between IPC1 and IPCm indicates that the initial secant stiffnesses of the two specimens were close. After yielding, the response of the two specimens gradually diverged. The monotonically loaded specimen exhibited larger deformation capacity and a more gradual post-peak response under monotonic loading, whereas the cyclically loaded specimen showed more pronounced damage accumulation. This difference is likely associated with the cumulative effects of reversed cyclic loading and with local interface slip inferred from the pinched hysteretic response.
4. Finite Element Modeling and Comparison with Test Results
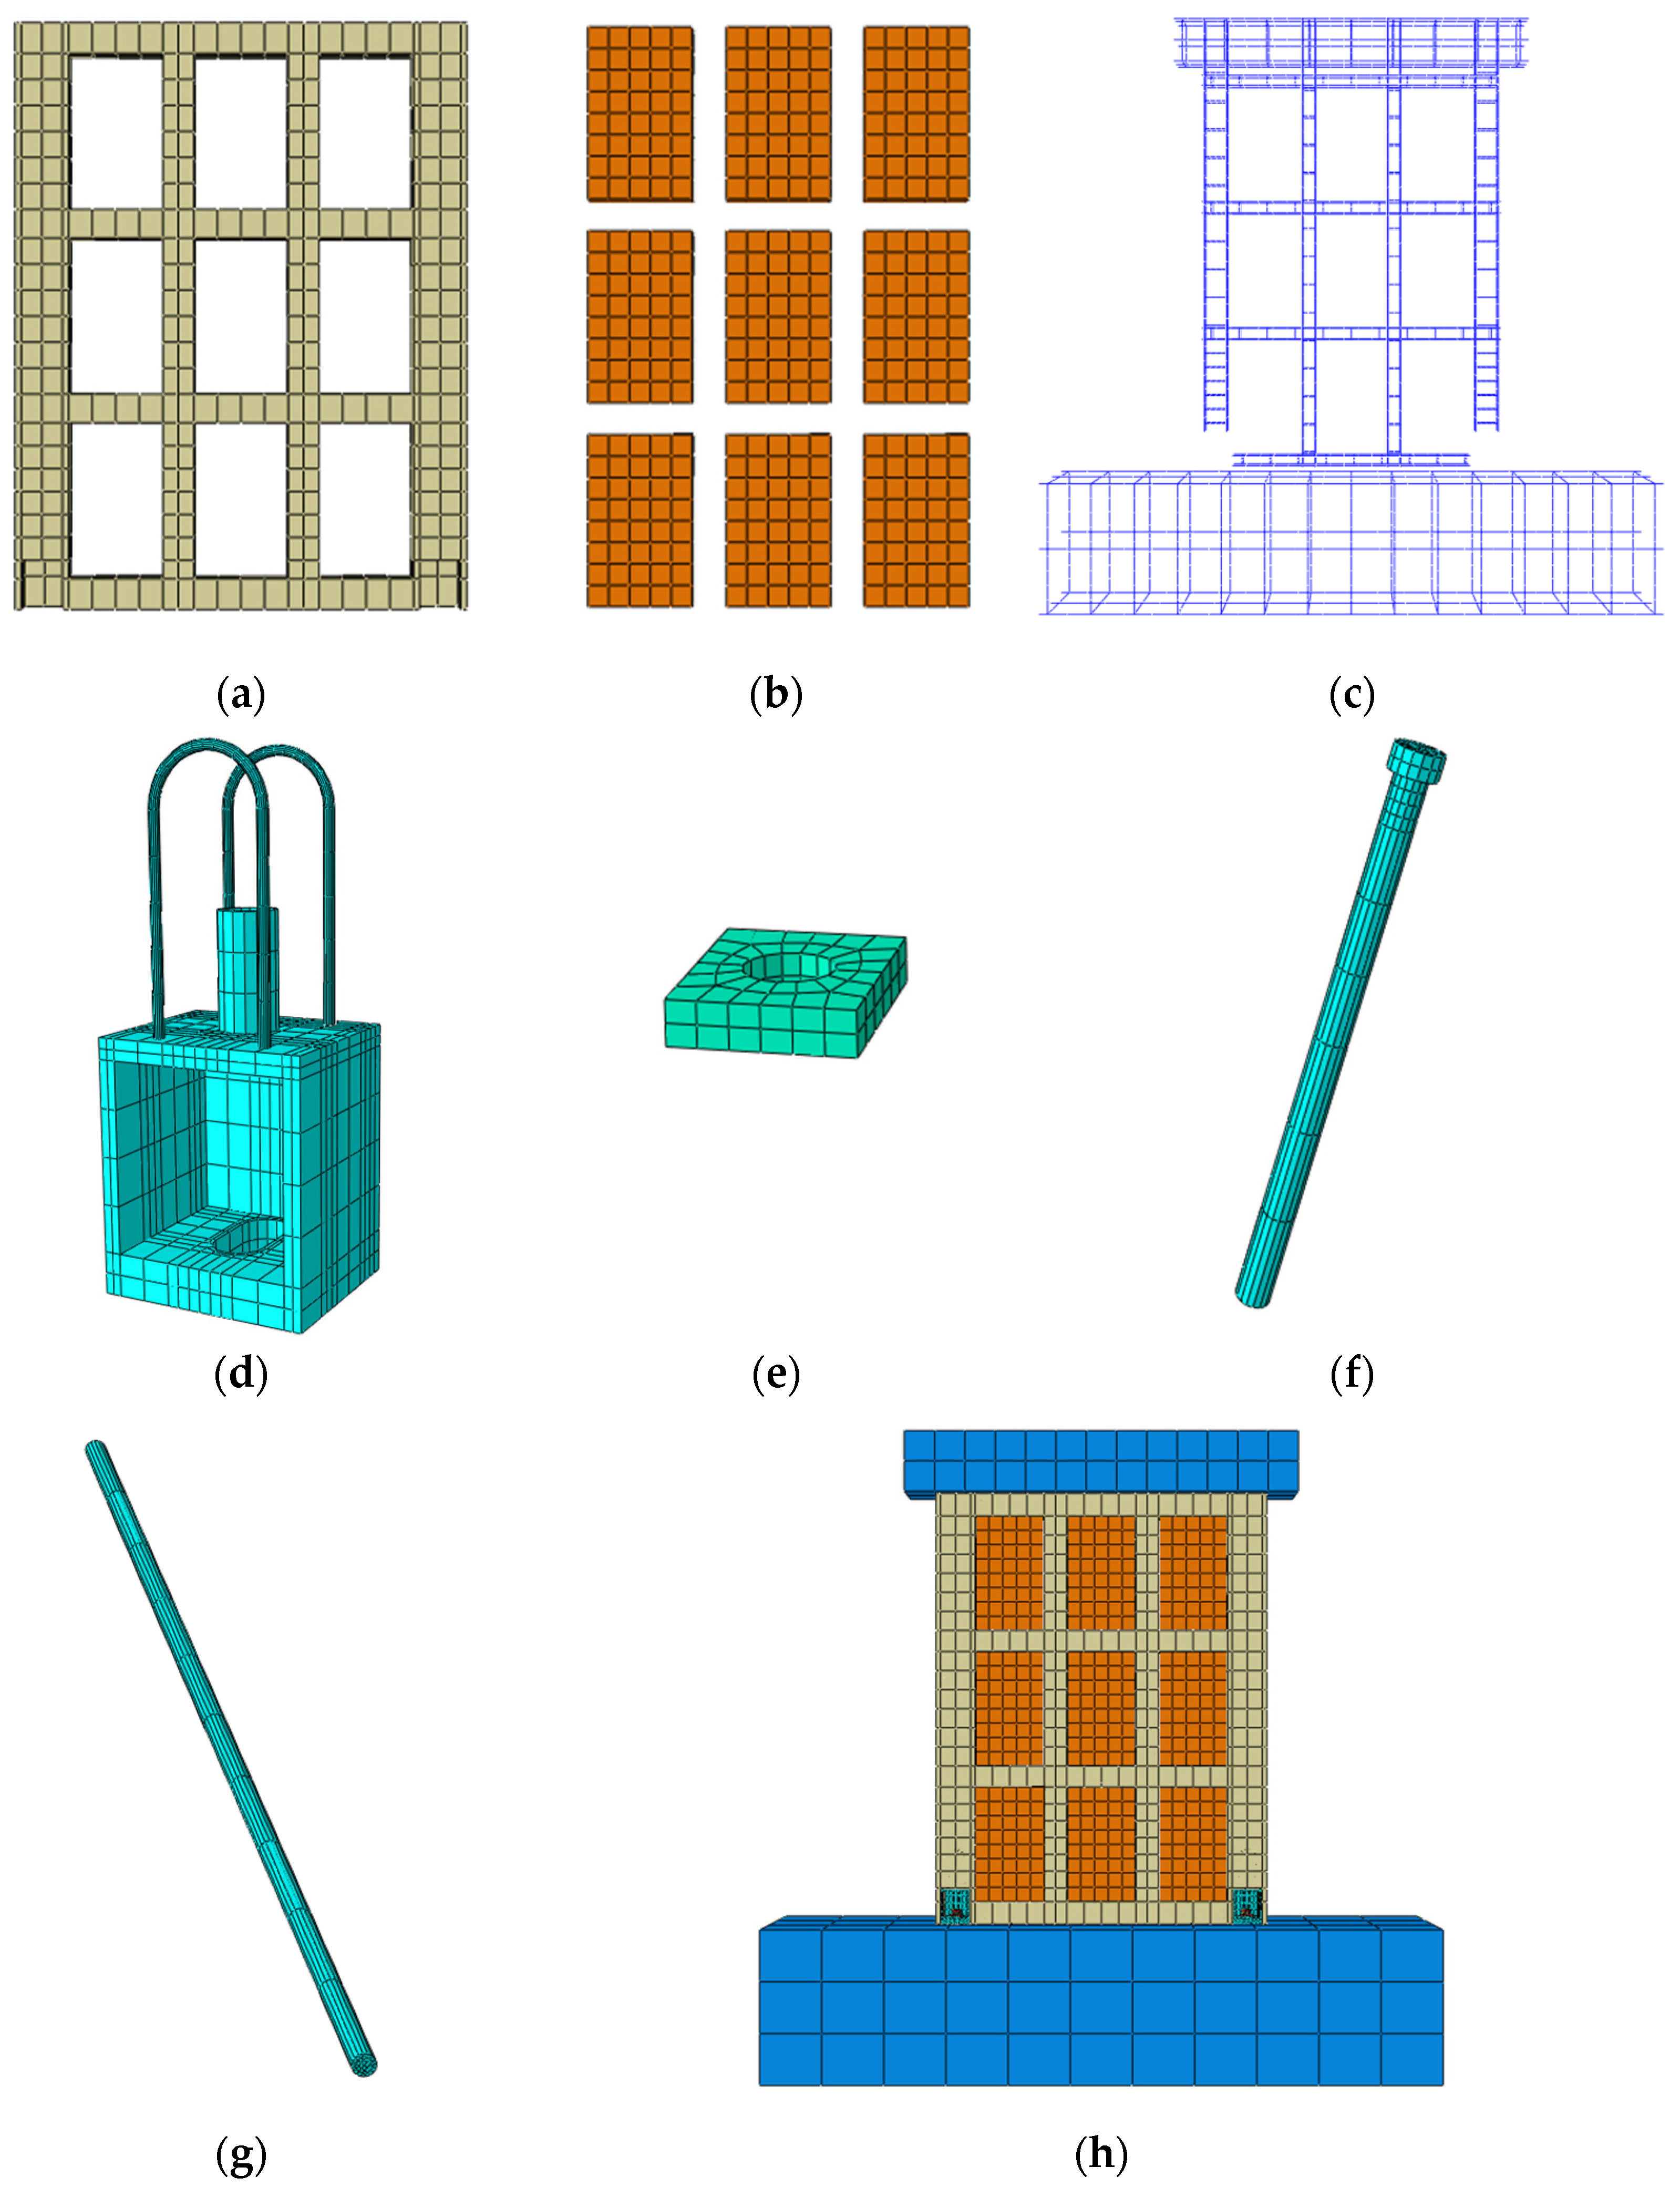
Finite element models of specimens IPC1 and IPCm were established and analyzed using ABAQUS. Two element types were primarily used in this study: solid elements and truss elements. The precast concrete composite walls, concrete frames, infill blocks, foundation beams, and loading beams were modeled using C3D8R elements, namely, 8-node brick elements with reduced integration. The reinforcement cages within the composite walls were modeled using T3D2 elements, namely, 2-node linear three-dimensional truss elements. Because the integrated rebars play a governing role in resisting shear in both the wall panels and the horizontal joints, they were also modeled using C3D8R elements. The box connectors and connecting steel plates were likewise modeled using C3D8R elements.
A relatively fine mesh was adopted in the key regions, including the integrated rebars, box connectors, and infill blocks. By contrast, coarser meshes were used for non-critical components such as the loading beams and foundation beams to improve computational efficiency.
4.1. Material Constitutive Models
A constitutive relationship describes the stress–strain behavior of a material in the elastoplastic stage. Because reinforced concrete exhibits material nonlinearity, constitutive models that closely represent the experimental materials were defined in this study to ensure the accuracy of the simulation results. The constitutive models were selected according to the material characteristics of each component, relevant design codes, and previous modeling practice for prefabricated composite walls, while the main mechanical parameters were determined from the measured material properties. The specific constitutive models are described below:
(1) Concrete constitutive model
The concrete constitutive model was established based on the formulations provided in the Code for Design of Concrete Structures (GB 50010-2010) [
23]. The concrete constitutive equations with damage factors are expressed as follows:
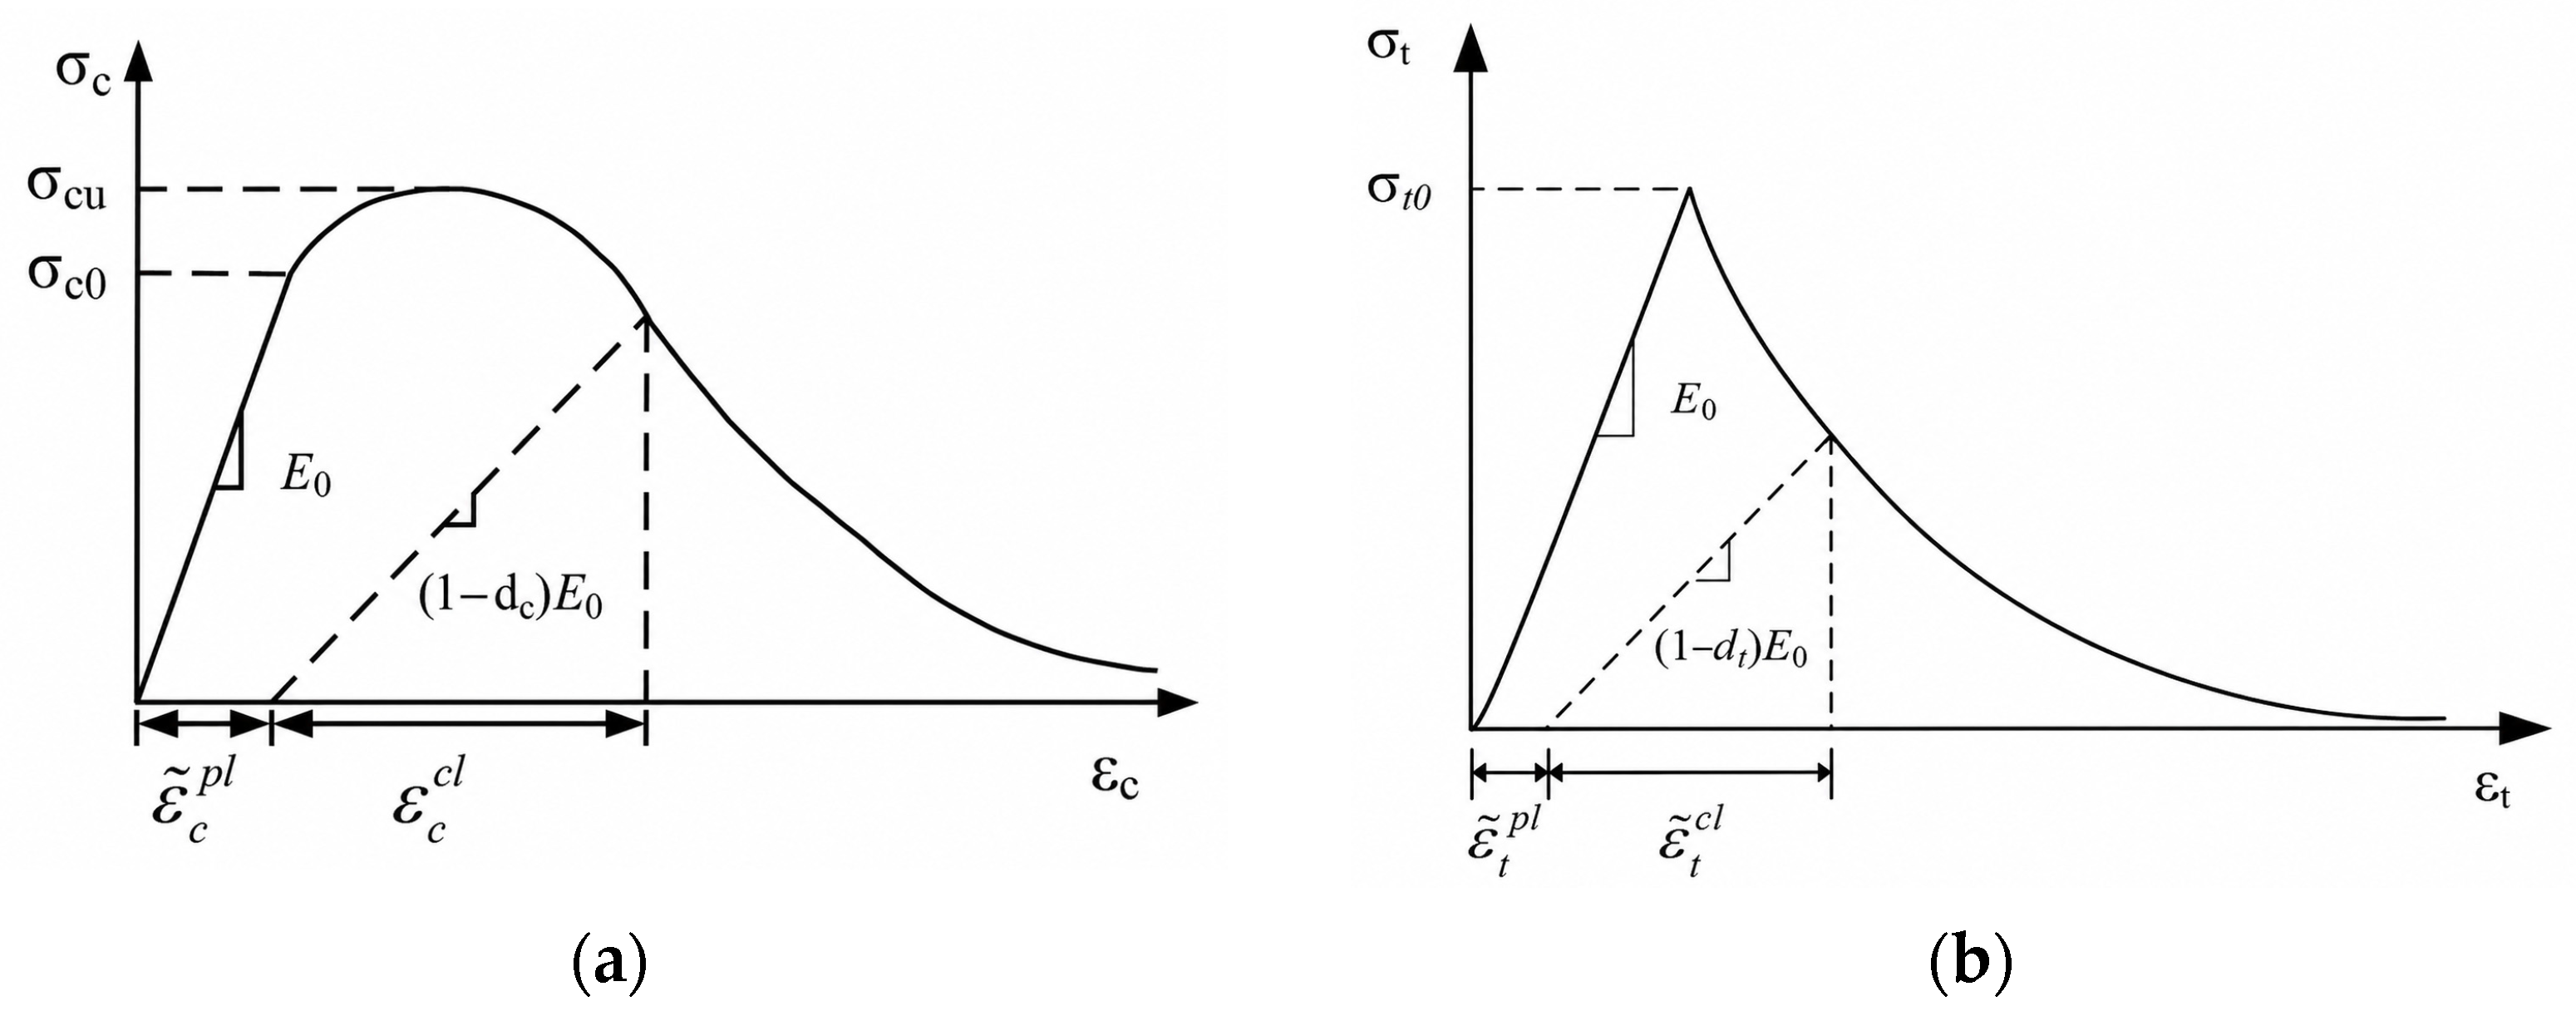
The constitutive relationship of concrete is shown in
Figure 12a,b. The concrete plasticity parameters are summarized in
Table 11.
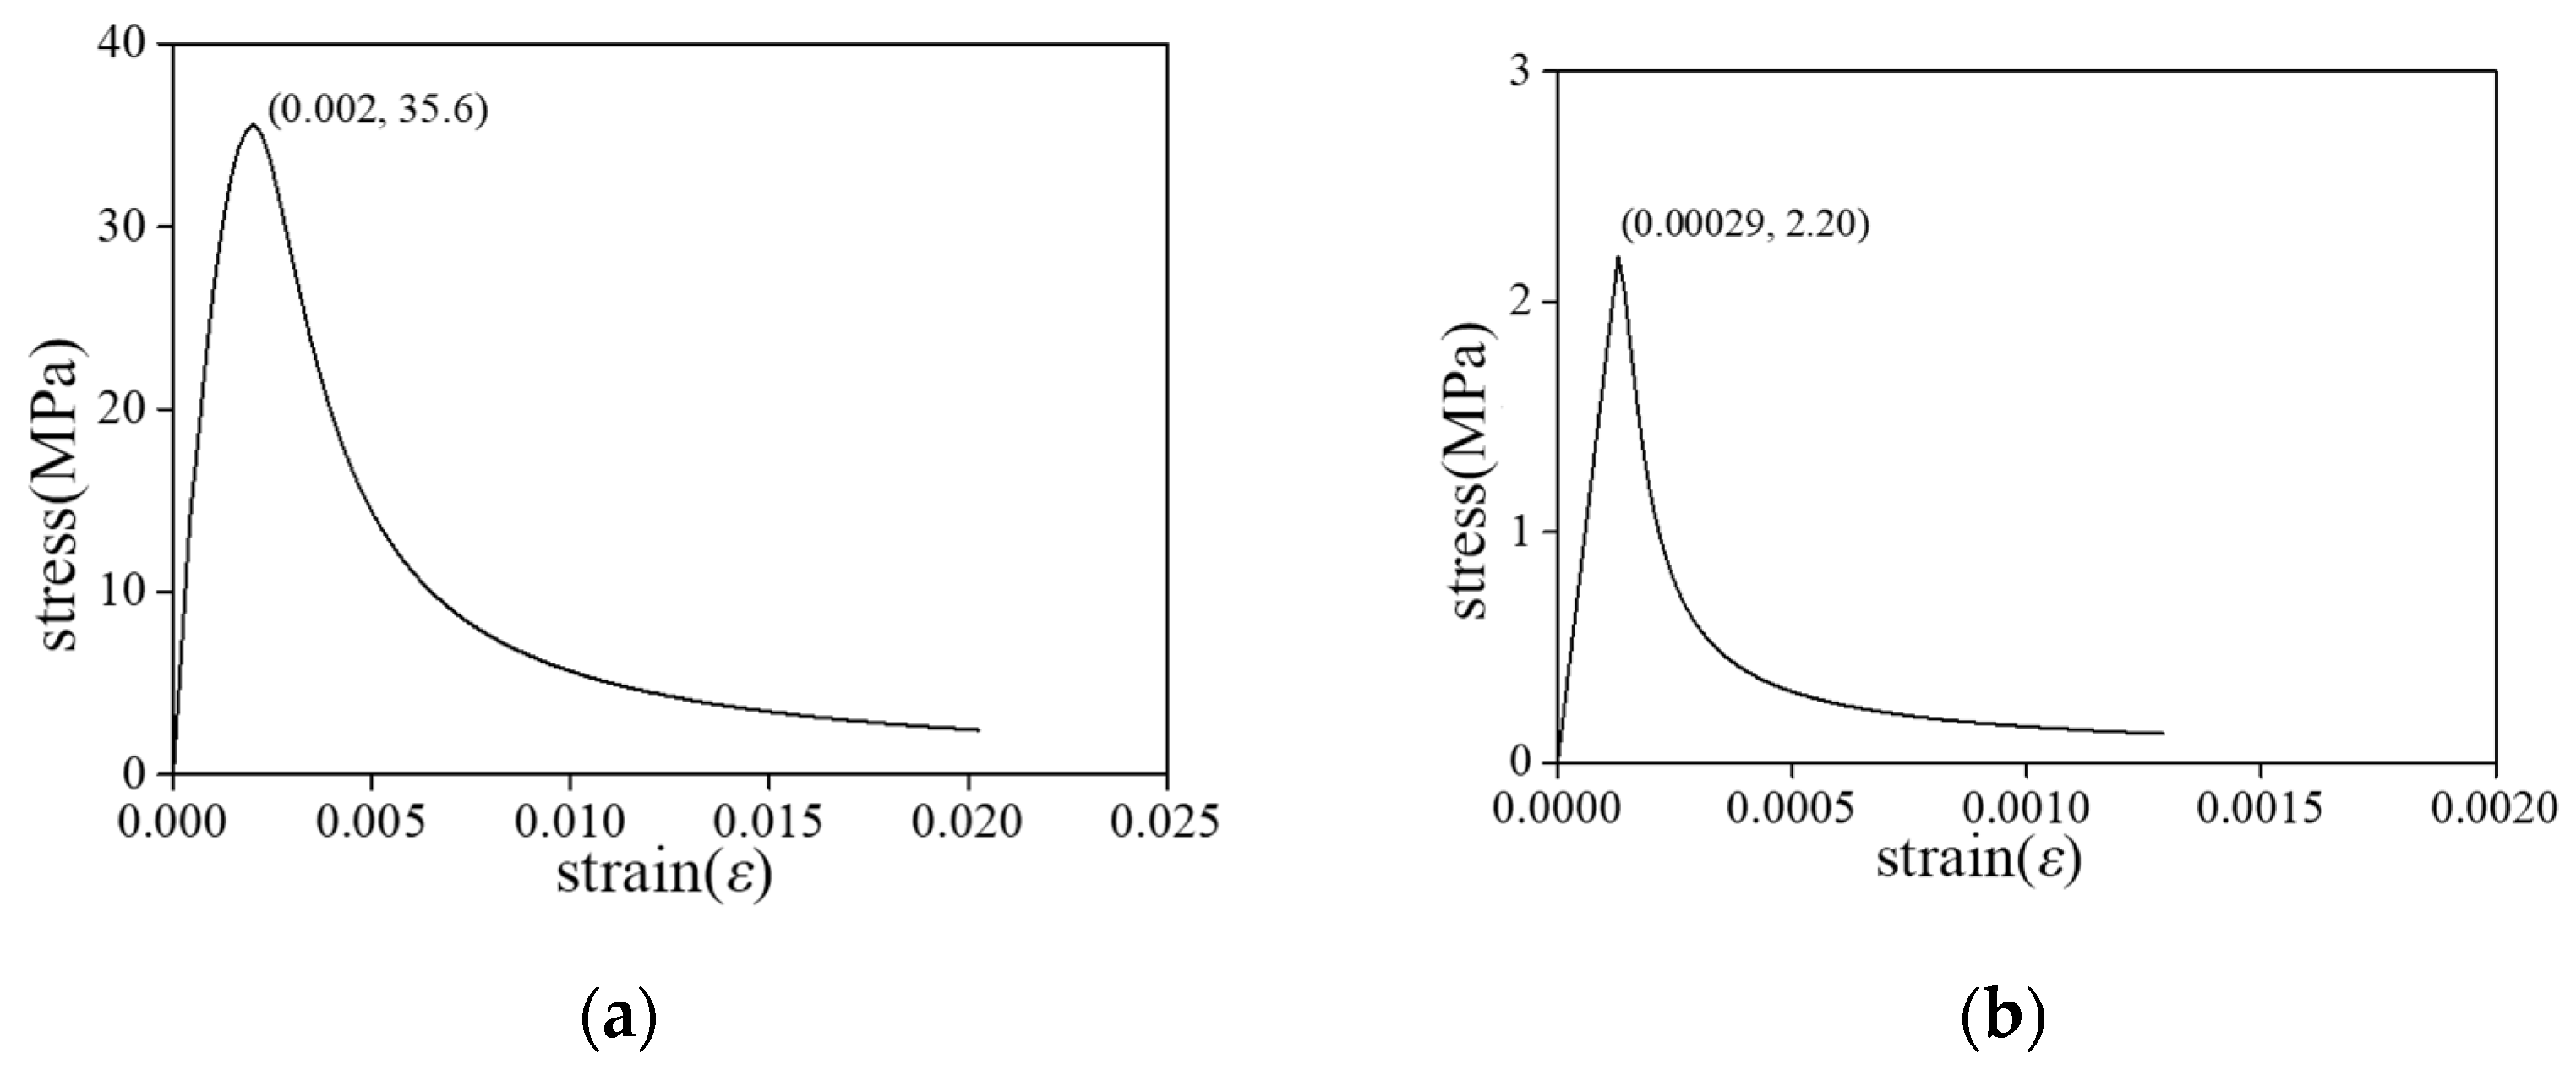
The constitutive relationships and the uniaxial tensile and compressive stress–strain curves for C30 concrete are shown in
Figure 13a,b.
(2) Constitutive model of steel
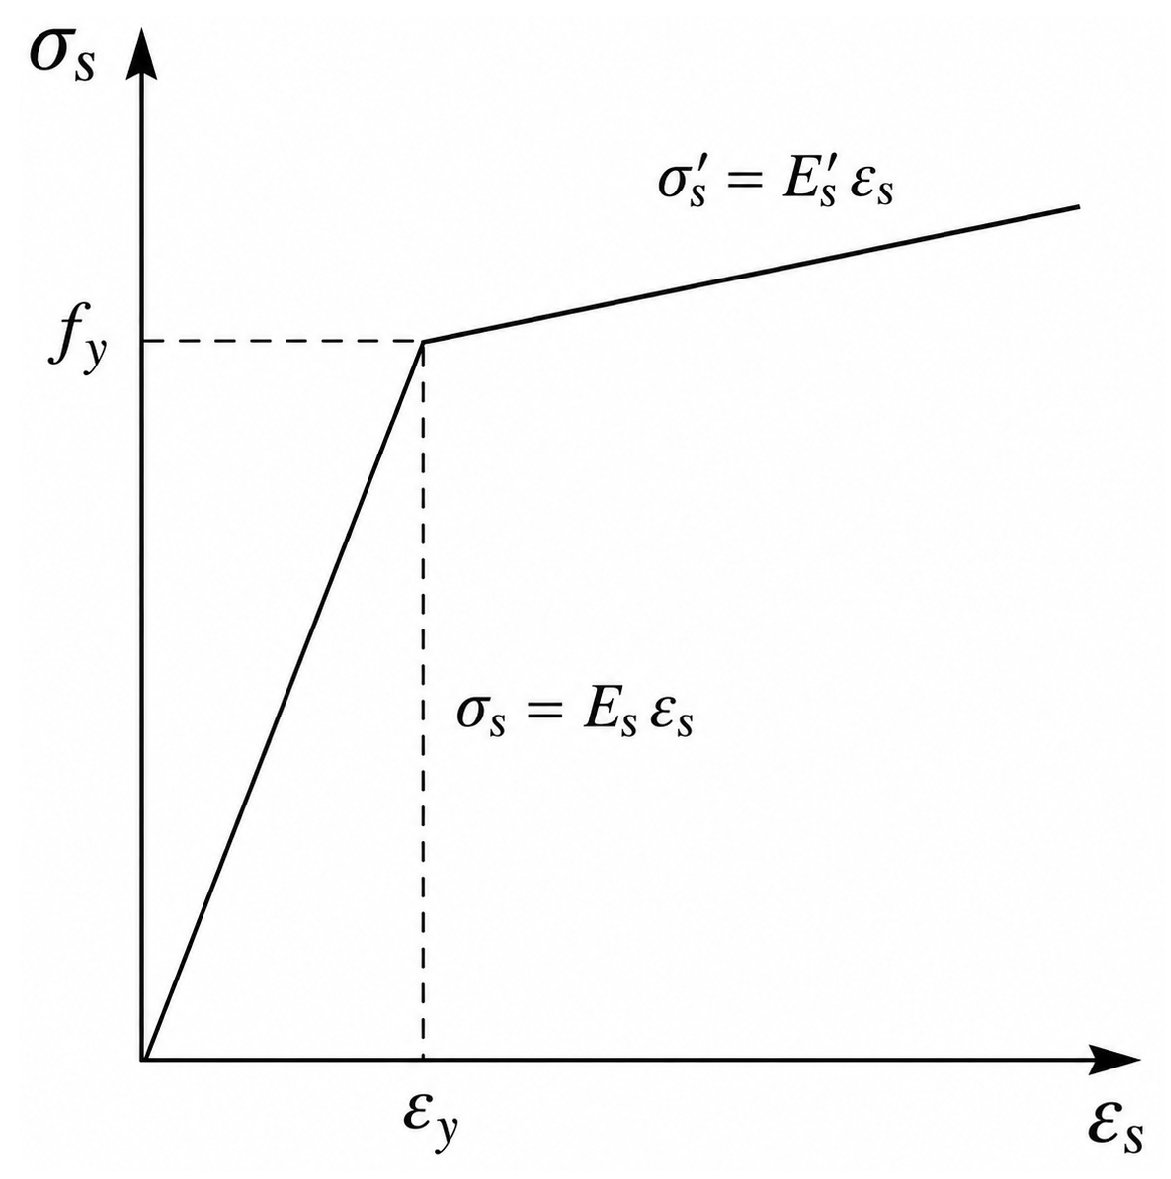
The steel materials used in the fully prefabricated composite wall with box connections included reinforcement cages, integrated rebars, box connectors, connecting steel plates, and embedded steel components. In this study, an elastic-hardening model was adopted to simulate the constitutive relationship of steel (
Figure 14), and the hardening stiffness was taken as approximately E/100. The yield strength and ultimate strength of each steel component were determined from the material tests.
(3) Constitutive model of masonry blocks
The concrete grid of the composite wall was infilled with lightweight aerated concrete blocks, which significantly influence the seismic performance of the wall. Therefore, the stress–strain relationship established by the research group in previous work [
24] was adopted for the constitutive model of the masonry blocks:
a. Compressive constitutive model:
b. Tensile constitutive model:
4.2. Finite Element Modeling
In the interaction settings, the reinforcement cages were embedded in the surrounding concrete grid using the embedded-region constraint. Tie constraints were adopted for the interfaces where relative slip was not considered, such as the interfaces between the AAC blocks and concrete grid and between the box connectors and surrounding concrete. The wall–foundation interface and the contact among the integrated rebars, box connectors, and steel plates were modeled using surface-to-surface contact. The foundation beam was fixed to represent the fixed-base condition, and the axial compression and lateral loading were applied through a reference point coupled to the loading beam.
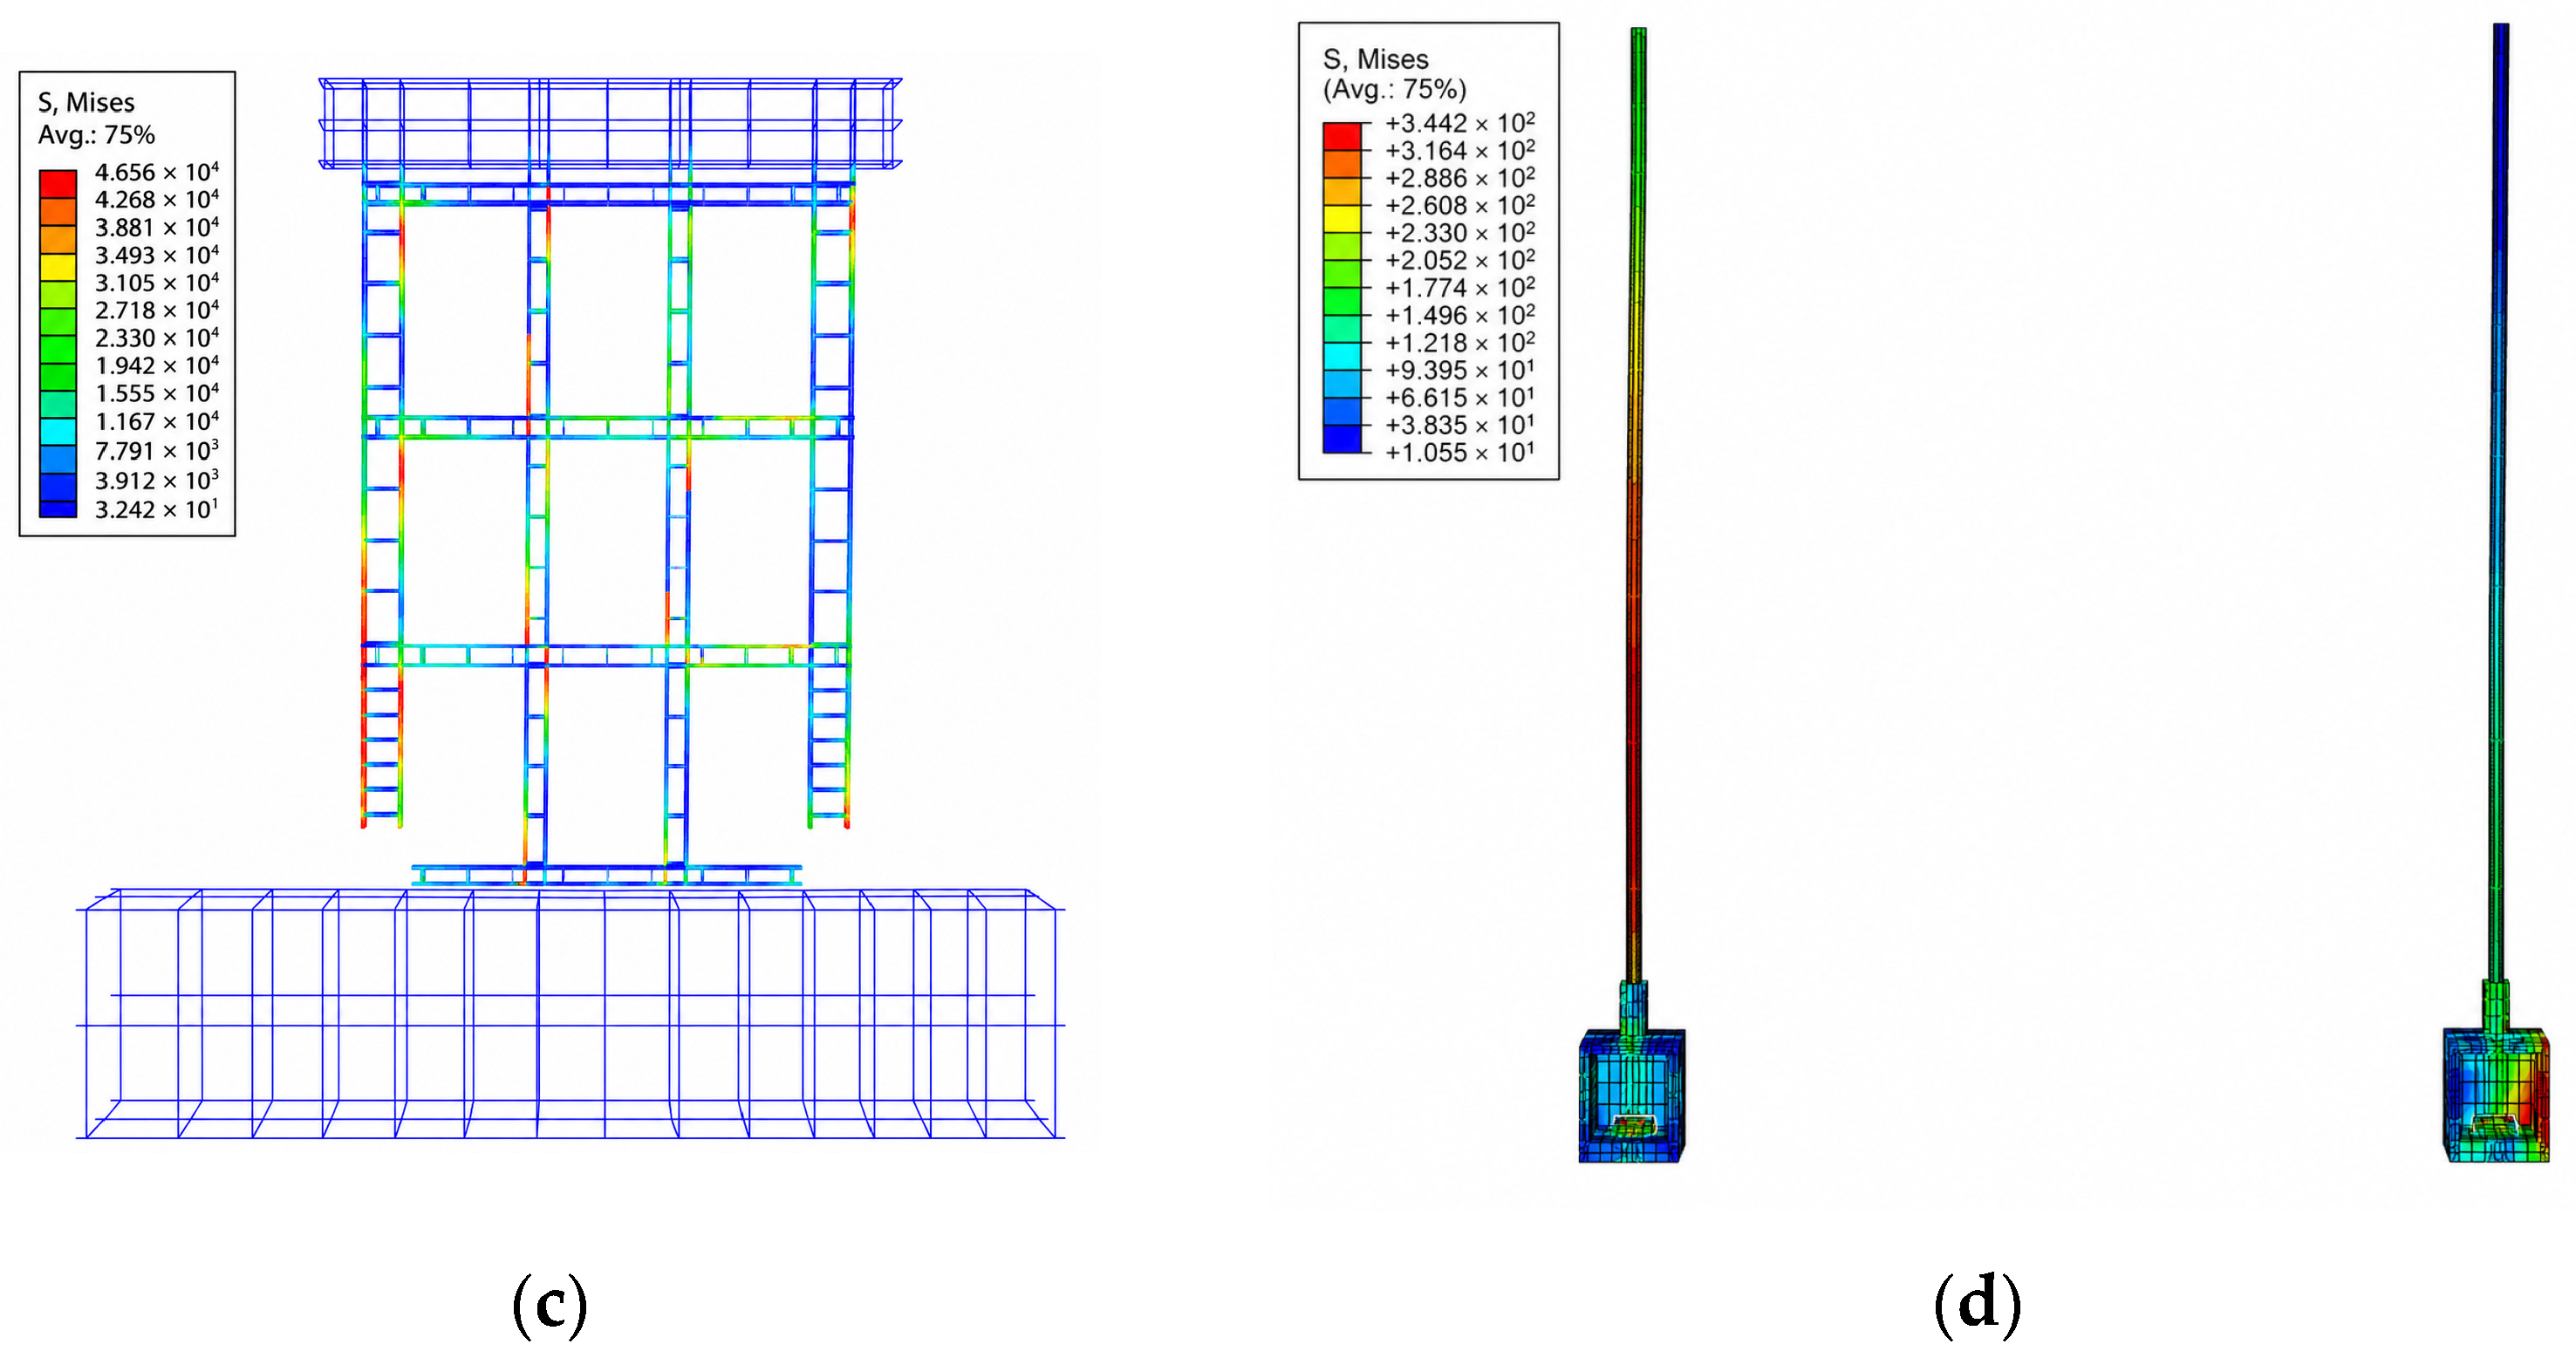
Based on the procedure described above, a numerical model of the fully prefabricated composite wall with integrated rebar box connectors was established. Taking specimen IPC1 as an example, the finite element model is shown in
Figure 15.
4.3. Comparison of Load–Displacement Curves
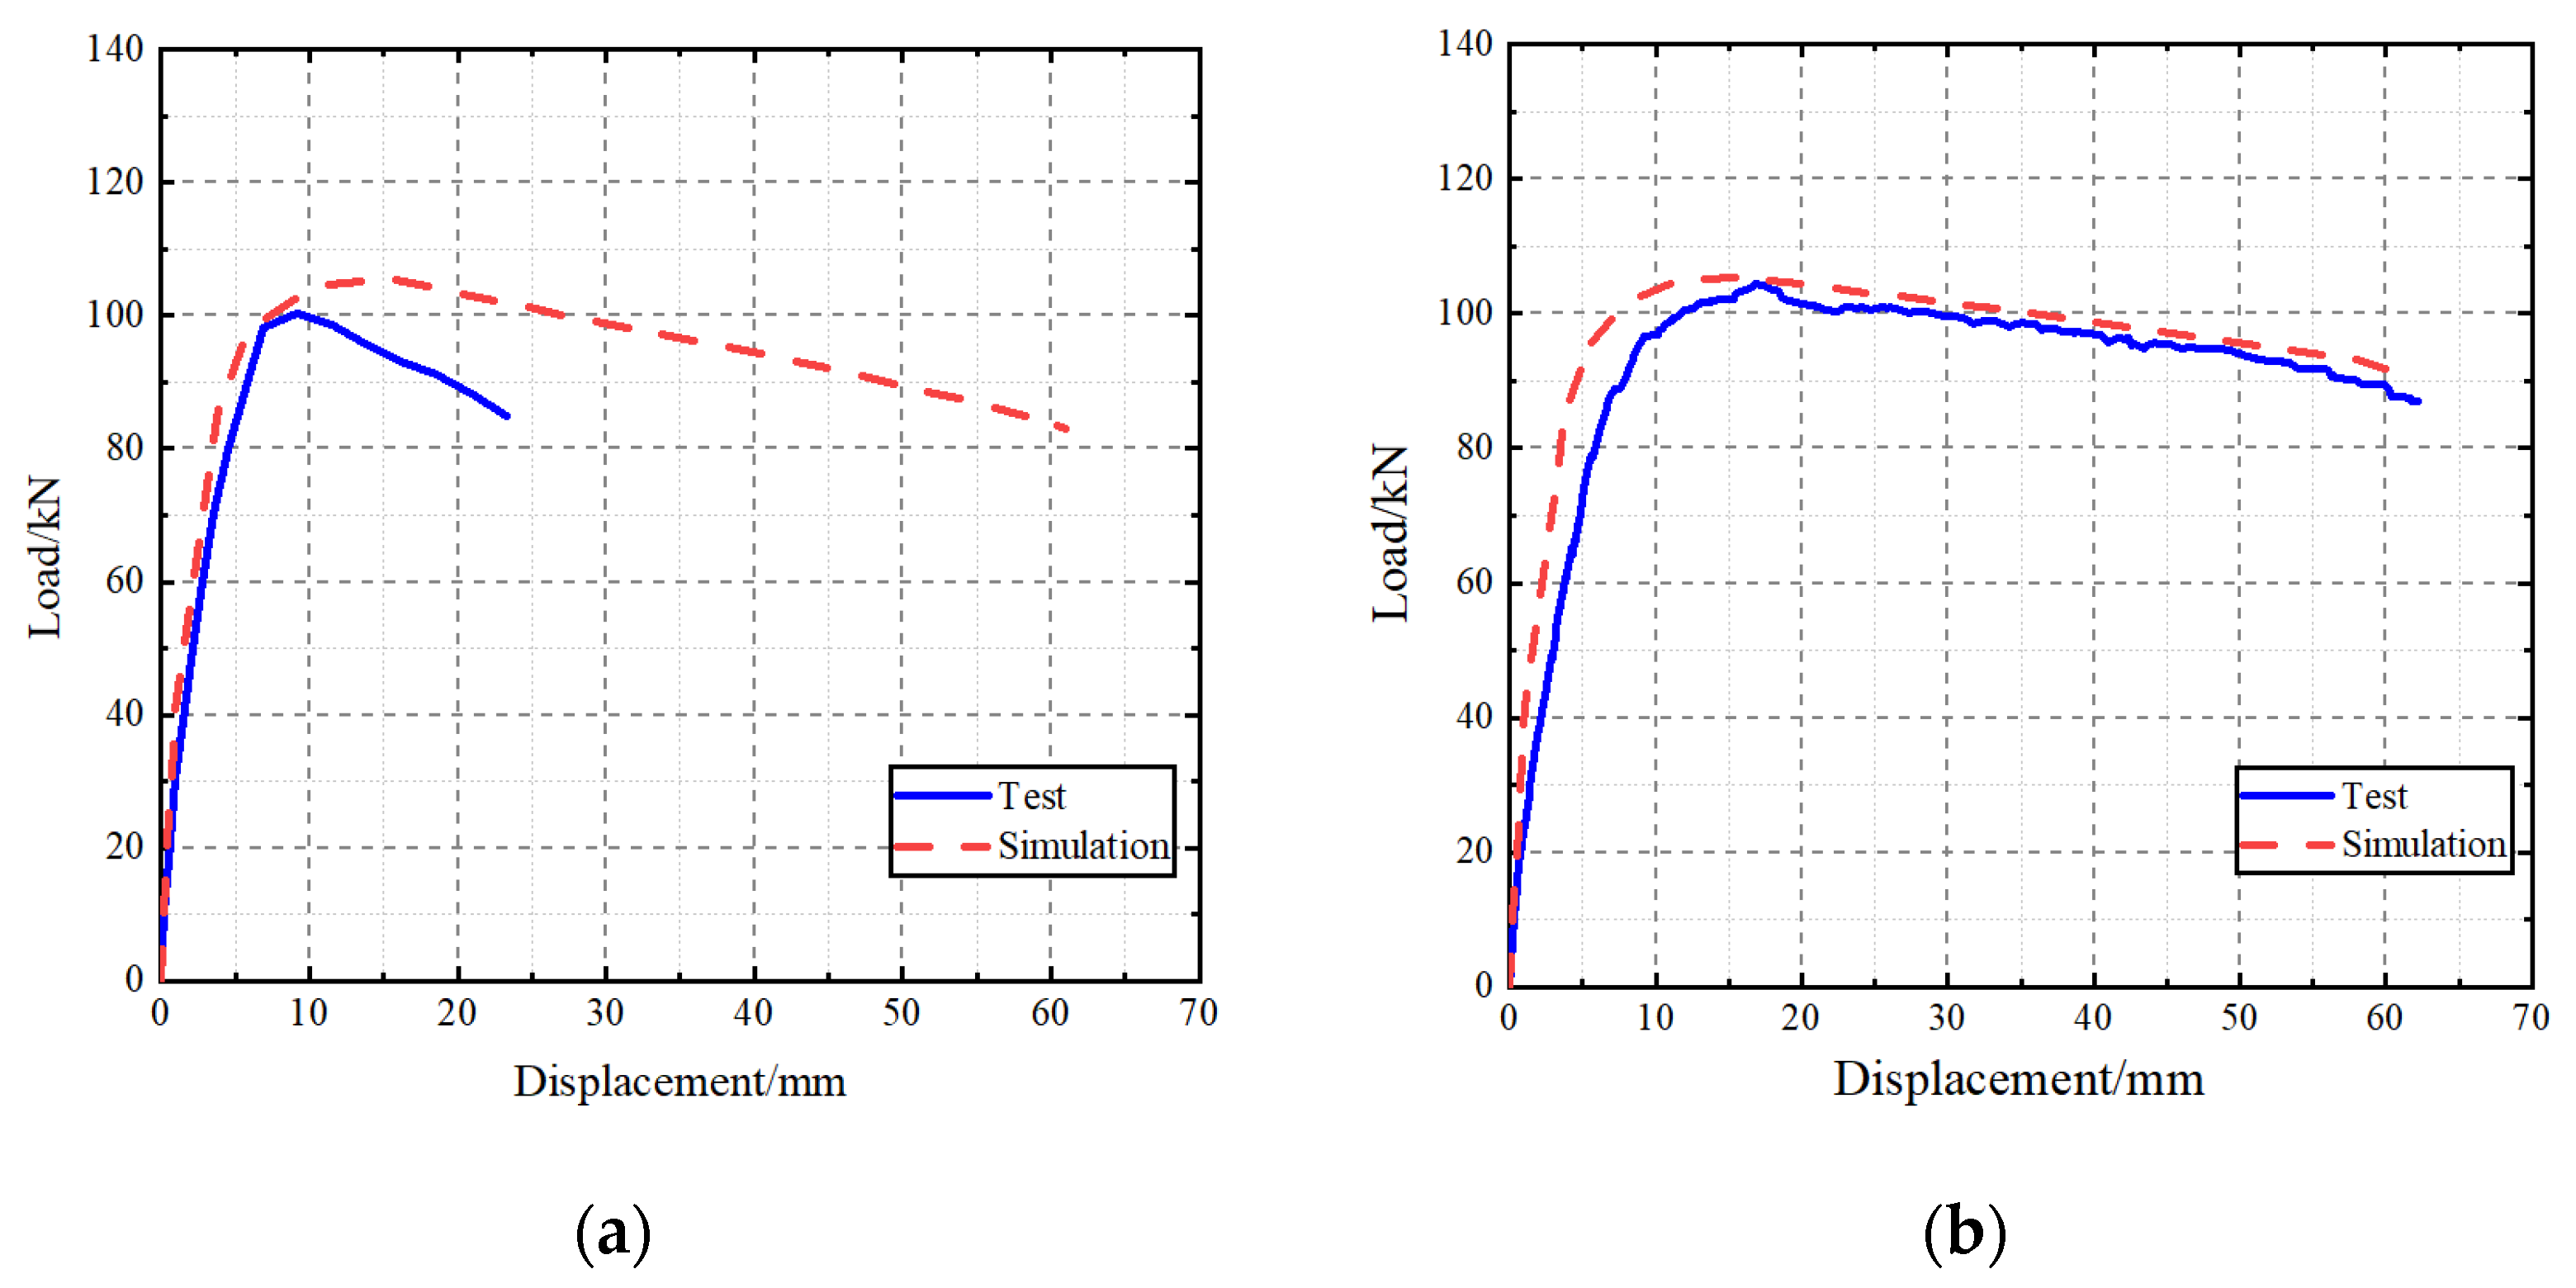
Nonlinear analyses were carried out on specimens IPC1 and IPCm using the established numerical models. The simulated load–displacement curves were then compared with the experimental results for validation. Comparisons between the experimental and numerical load–displacement curves for each specimen are presented in
Figure 16. The comparison of peak loads between the tests and the simulations is summarized in
Table 12.
(1) Overall comparison
In general, the monotonic numerical simulation results were compared with the positive envelope curves of the cyclically loaded specimens from the tests. The load–displacement curves from the two approaches exhibited similar trends and comparable peak loads. The finite element simulation curves were also compared with those of the monotonically loaded specimen and showed good agreement. The curves can be divided into the elastic stage, the elastoplastic stage, and the failure stage, indicating that the established numerical model of the fully prefabricated composite wall with integrated rebar box connectors can reasonably capture the load–displacement response and failure process of the wall.
(2) Stiffness and damage evolution
At the initial loading stage, the numerical simulation exhibited slightly higher stiffness than the test. As loading continued, the wall stiffness gradually decreased with crack development. After the peak load, the descending branch of the simulated curve was more gradual than that observed in the test. This difference can be attributed to the more severe damage accumulation in the concrete under low-cycle reversed loading during the test, whereas accurate representation of cumulative concrete damage remains challenging in finite element analysis. In addition, bond slip between the longitudinal reinforcement and the concrete was not considered in the simulation, which also contributed to the discrepancy. Moreover, the concrete was modeled as a homogeneous material, whereas the actual concrete was heterogeneous.
(3) Simplification effects
Some deviations between the numerical and experimental results are attributable to the complex interaction among the various components of the prefabricated composite wall. Reasonable simplifications were introduced in the simulation for the interaction and contact behavior among the concrete grid, the masonry blocks, and the joints. The loading system was also idealized in the numerical model through the boundary and loading conditions applied to the foundation beam and loading beam, which may partly explain the difference in stiffness between the test and simulation. In addition, the possible interface slip between the AAC blocks and the concrete grid was simplified by tie constraints, which may also contribute to the discrepancy in stiffness and pinching behavior between the test and simulation.
4.4. Failure Stress Contours of Specimen Models
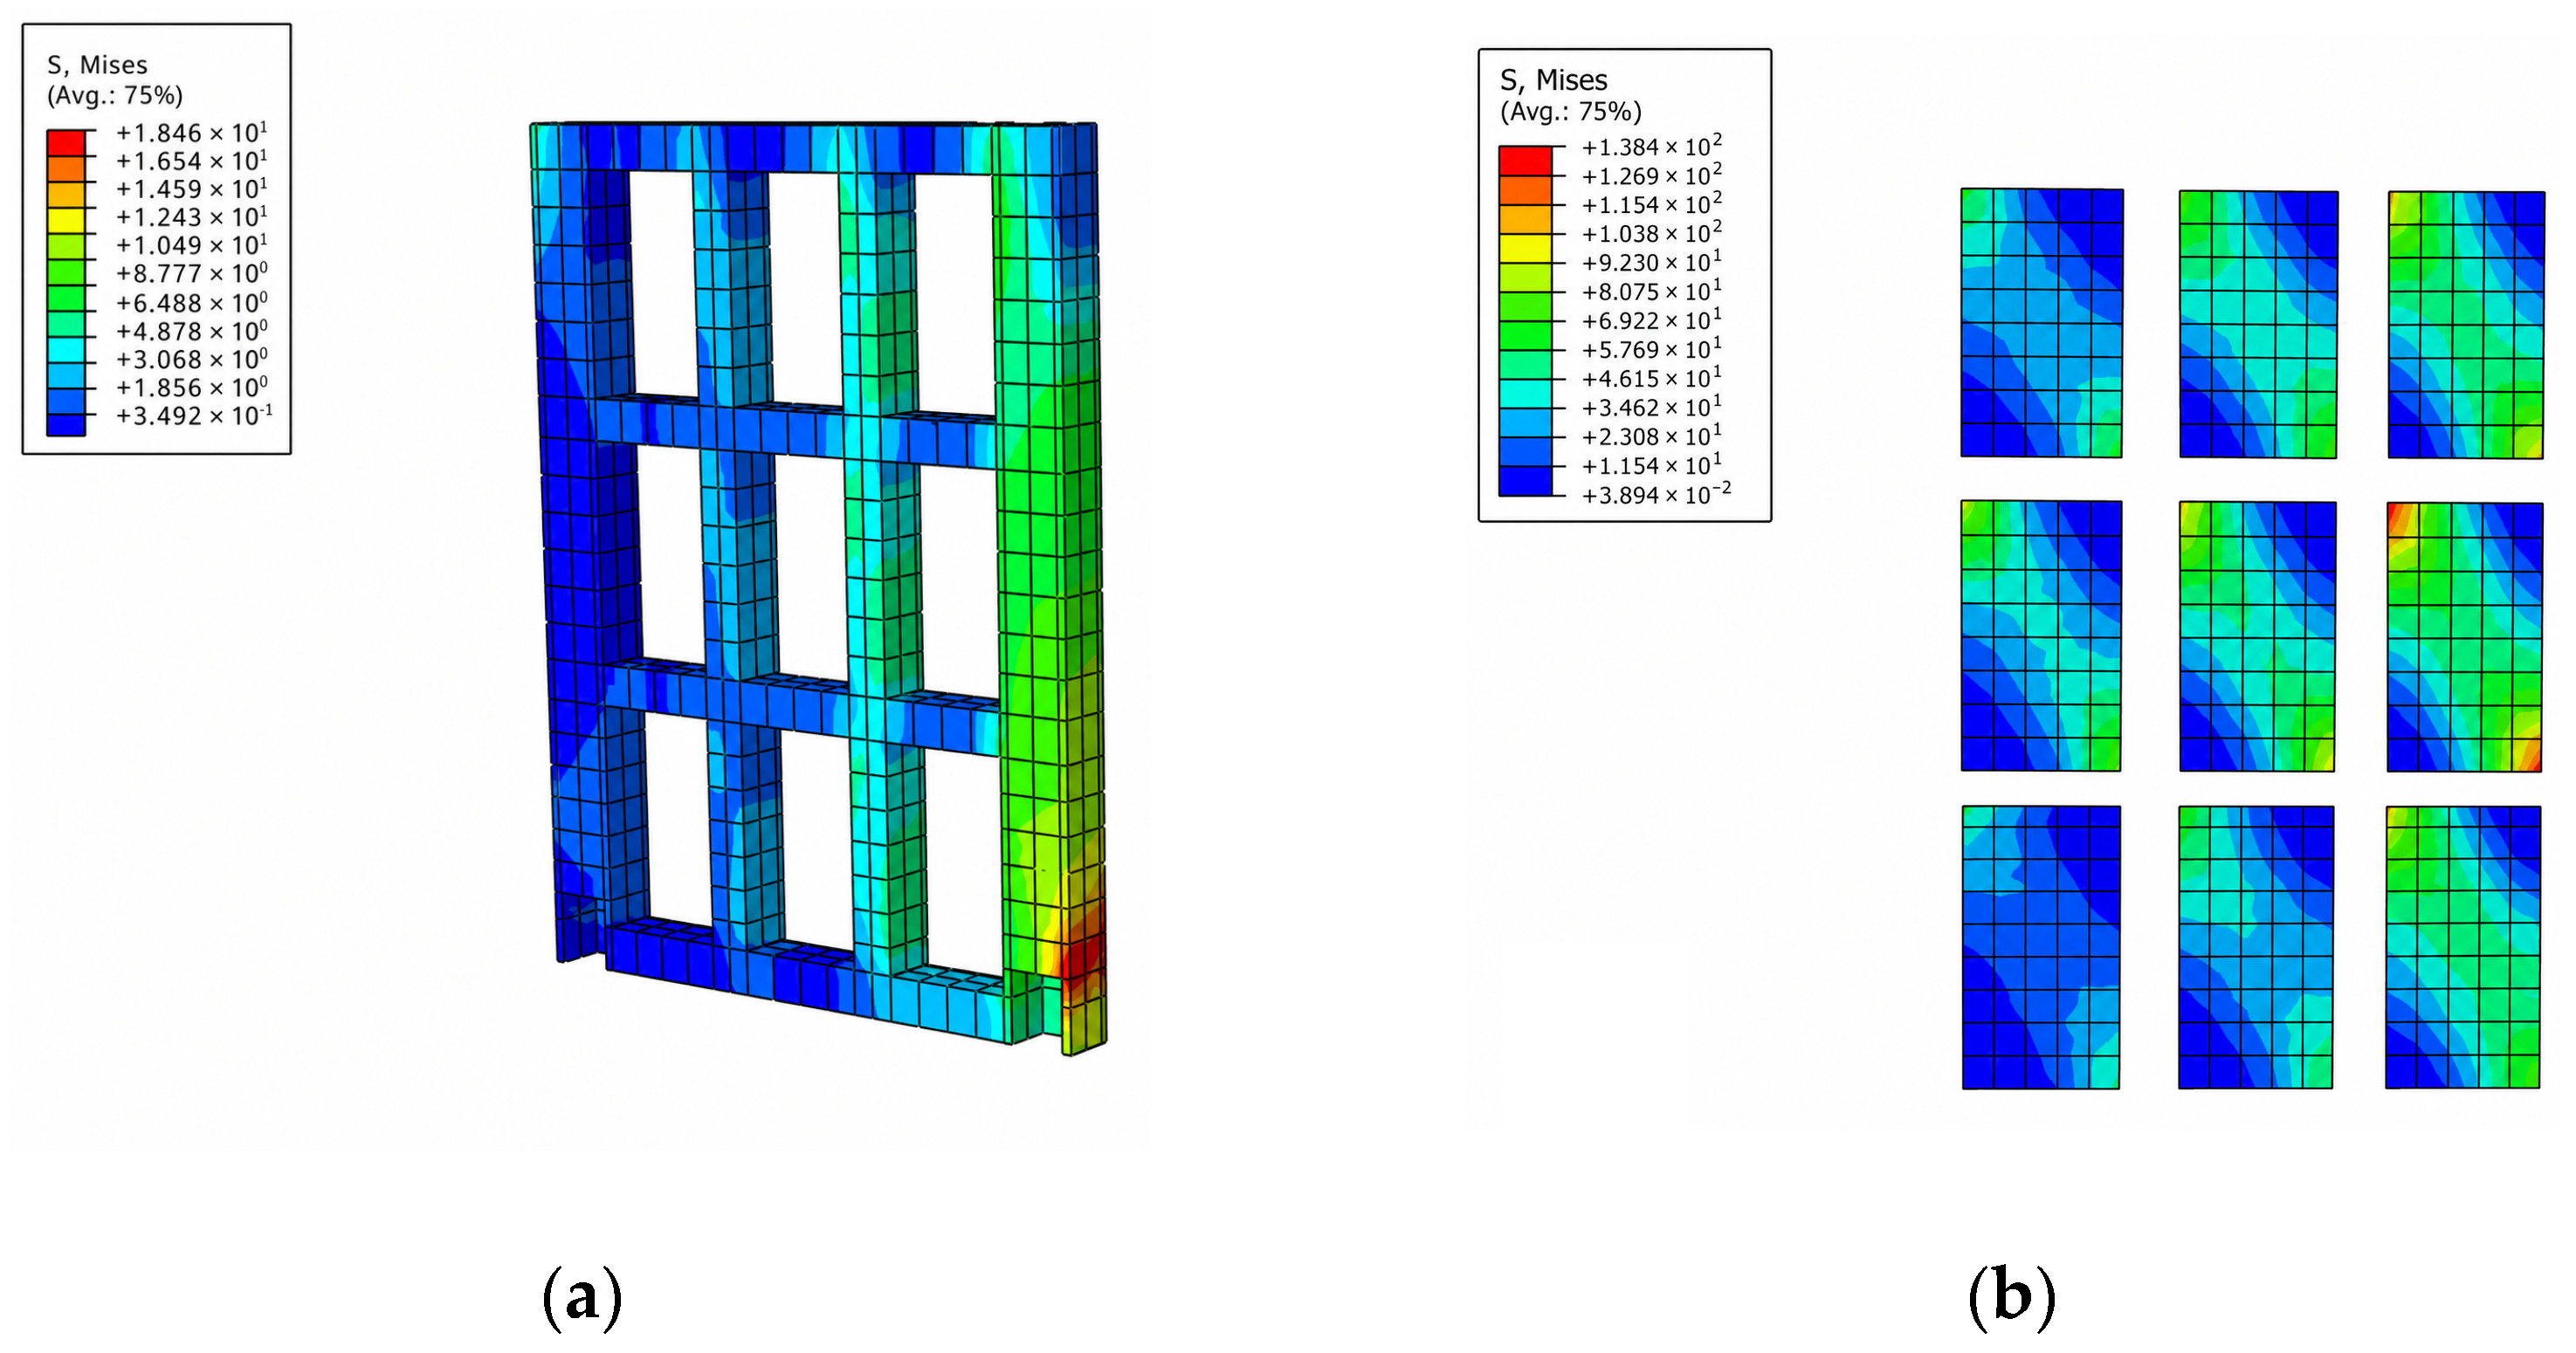
Based on the numerical simulation results, the stress and plastic strain distributions of the models were examined. The von Mises stress contours reflect the internal force-transfer characteristics of the wall, while the plastic strain distribution reflects the damage-prone regions and crack-development tendency. Comparison with the test observations showed good agreement. Plastic strain in the blocks was mainly distributed along the diagonal directions. Plastic strain in the rib beams was concentrated at the ends. Severe damage occurred in the corner regions of the rib columns in the compression zone. Plastic strain in the box connectors was concentrated in the side plates. Strain in the integrated rebars was concentrated at the junctions with the box connectors, indicating an important contribution of the integrated rebars to the load-carrying capacity of the wall. The overall failure mode exhibited clear shear-type characteristics, which agreed well with the test observations. The stress contours also provide additional evidence for the force-transfer behavior of the joint region. As shown in
Figure 17, relatively high von Mises stresses developed in the integrated rebars and in the box connector region, especially near the junctions between the integrated rebars and the box connectors. This stress concentration indicates that the integrated rebars and steel box connectors participated in transferring forces between the upper and lower wall panels. Meanwhile, the high-stress regions in the box connectors were local and did not develop into fracture, pull-out failure, or loss of load-transfer capacity in the tests. The main damage observed in the tests was concentrated in the wall panel rather than being governed by failure of the horizontal joint connectors. Therefore, the assessment that the connection satisfied the basic force-transfer requirement was based on combined evidence from test observations, local connector deformation, and numerical stress distributions, rather than solely on the absence of fracture or pull-out failure.
The ABAQUS numerical model established for the fully prefabricated composite wall with integrated rebar box connectors can reasonably capture the main mechanical response and internal force distribution of the wall during loading, and is therefore suitable for preliminary parametric analysis of the factors affecting the load-carrying capacity of this type of wall.
6. Conclusions
This study presents low-cycle reversed loading tests and monotonic loading tests on two specimens of fully prefabricated composite walls with integrated rebar box connectors, together with ABAQUS finite element analyses of the influence of key parameters. Based on the experimental and numerical results, the following conclusions can be drawn:
(1) Both specimens exhibited shear failure characterized by the sequential development of block cracking, rib-beam damage, and rib-column deterioration. Within the scope of the present test program, no fracture, pull-out failure, or loss of load-transfer capacity was observed in the horizontal joint box connectors. Although local cover spalling and mortar crushing occurred near the joint region, the connection did not govern the final failure. Together with the observed local deformation of the box connector and the numerical stress concentration in the joint region, this result indicates that the proposed connection can satisfy the basic force-transfer requirements between the upper and lower wall panels and exhibits the mechanical feature of a strong joint and a comparatively weaker wall panel.
(2) Under the present test conditions, the monotonically loaded specimen exhibited higher yield load, peak load, peak displacement, and ultimate displacement than the cyclically loaded specimen, whereas the initial stiffness of the two specimens was similar. This difference is mainly associated with the cumulative damage caused by reversed cyclic loading.
(3) The finite element load–displacement curves generally agree with the experimental envelope curves and can reasonably reflect the load-carrying capacity level, damage location, and overall force development process of the wall. It should be noted that simplifications were introduced in the numerical model with respect to boundary conditions, contact relationships, and cumulative damage. As a result, some discrepancies remain between the numerical and experimental results in terms of the initial stiffness and post-peak response.
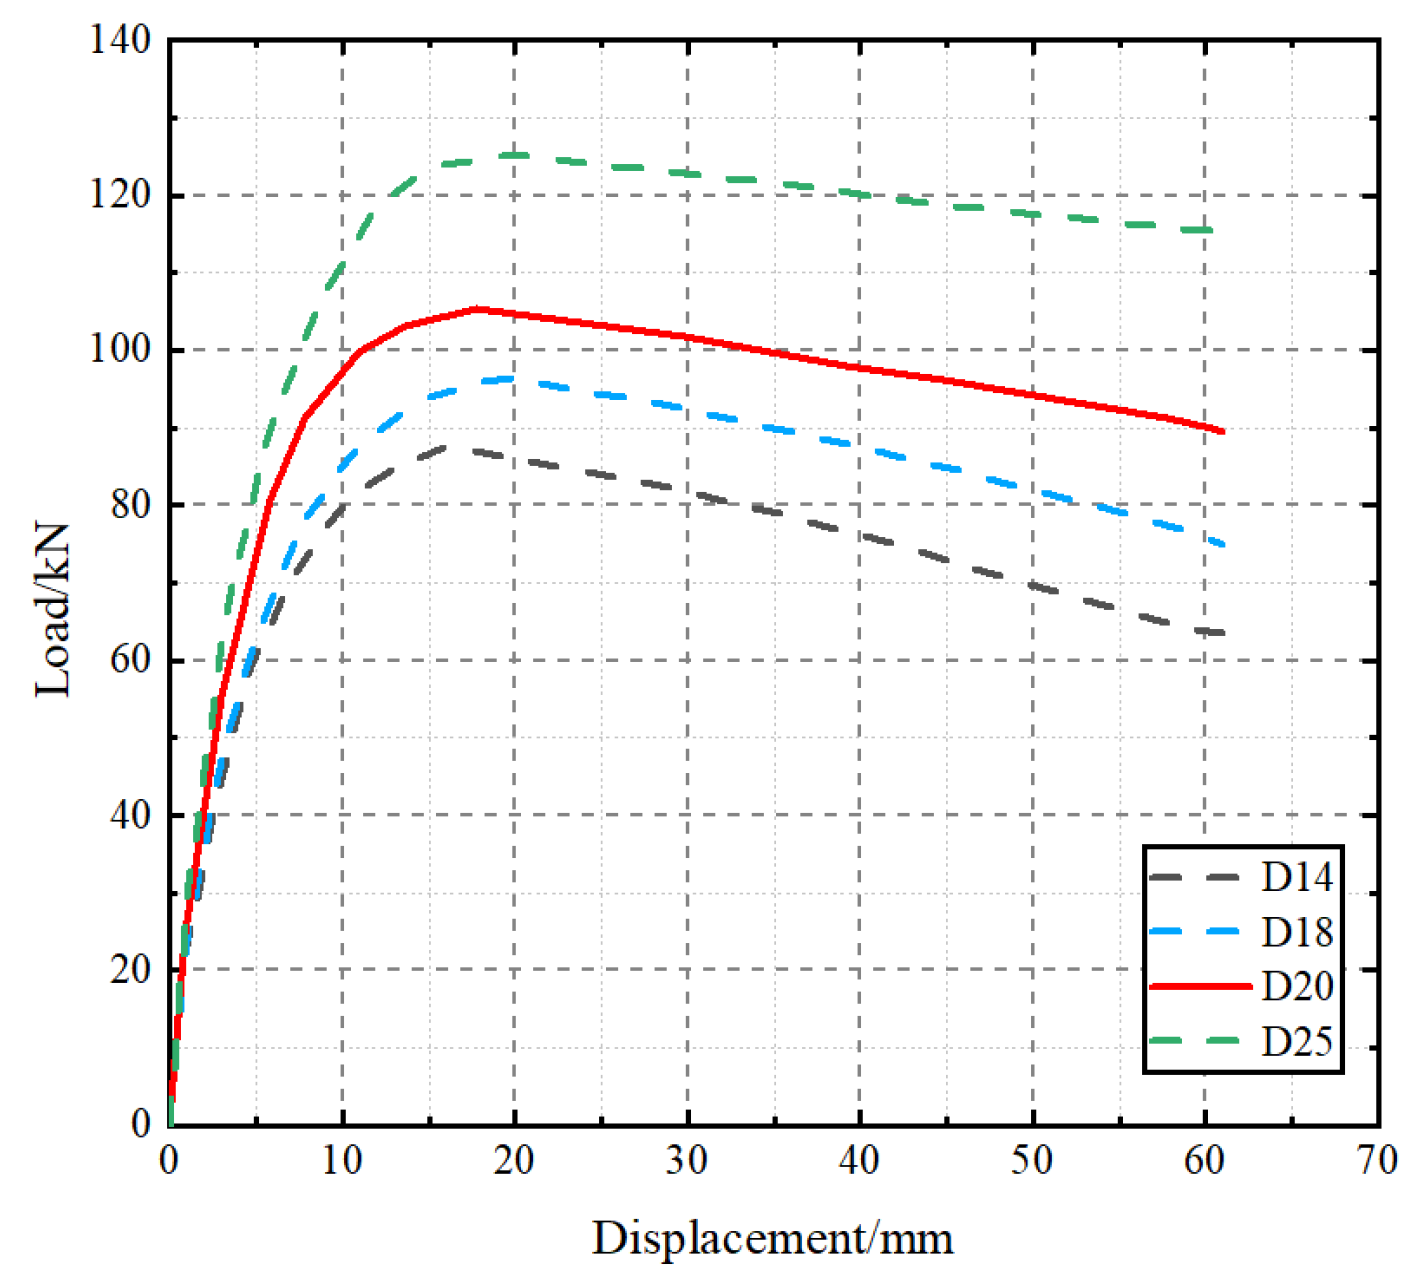
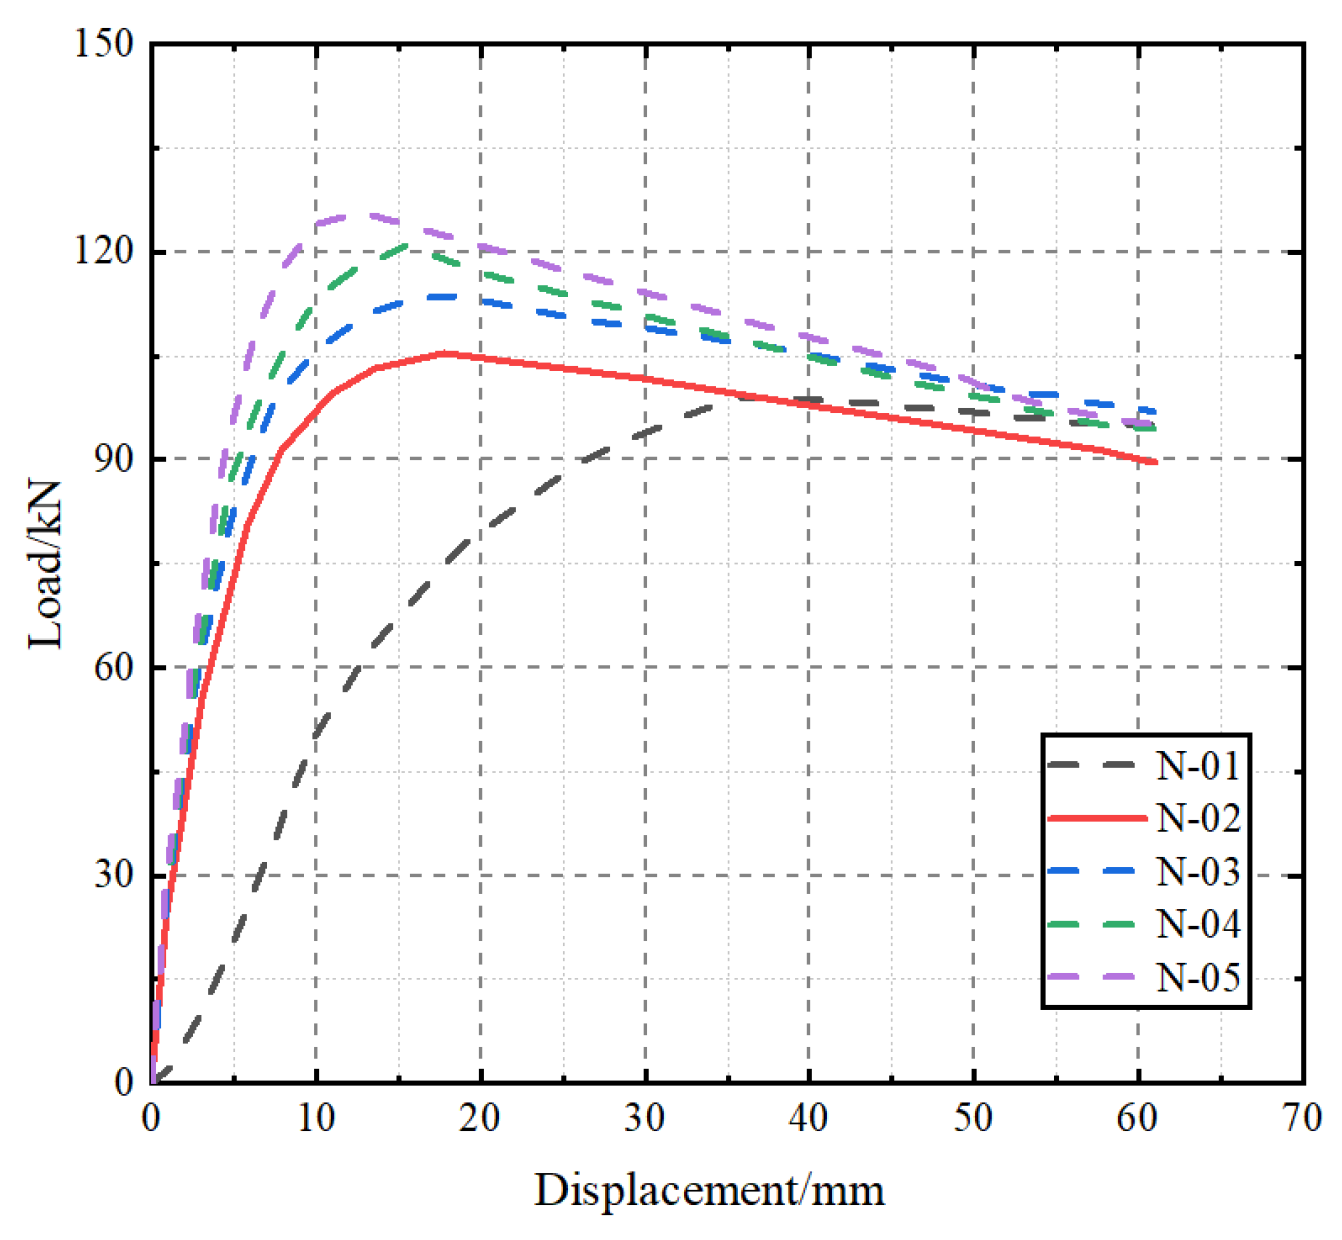
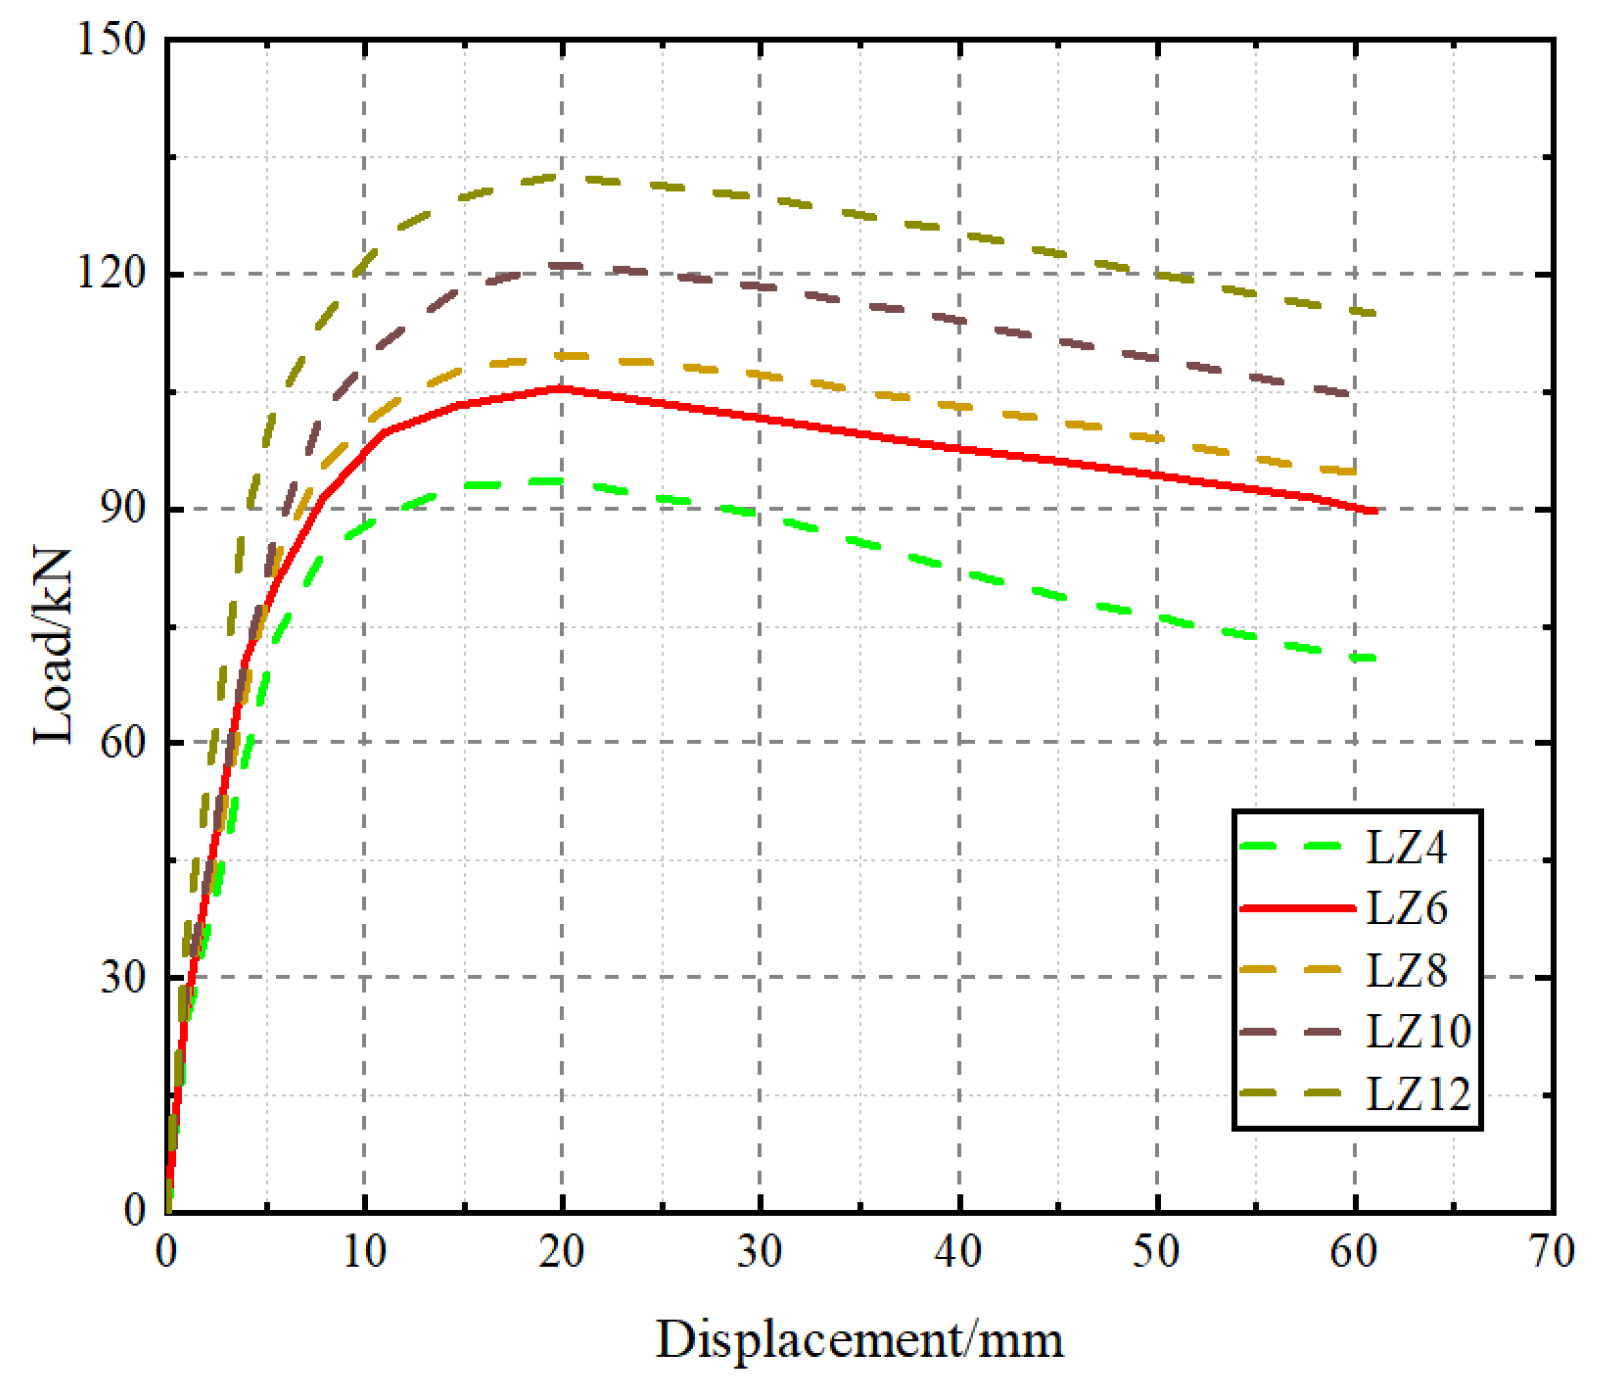
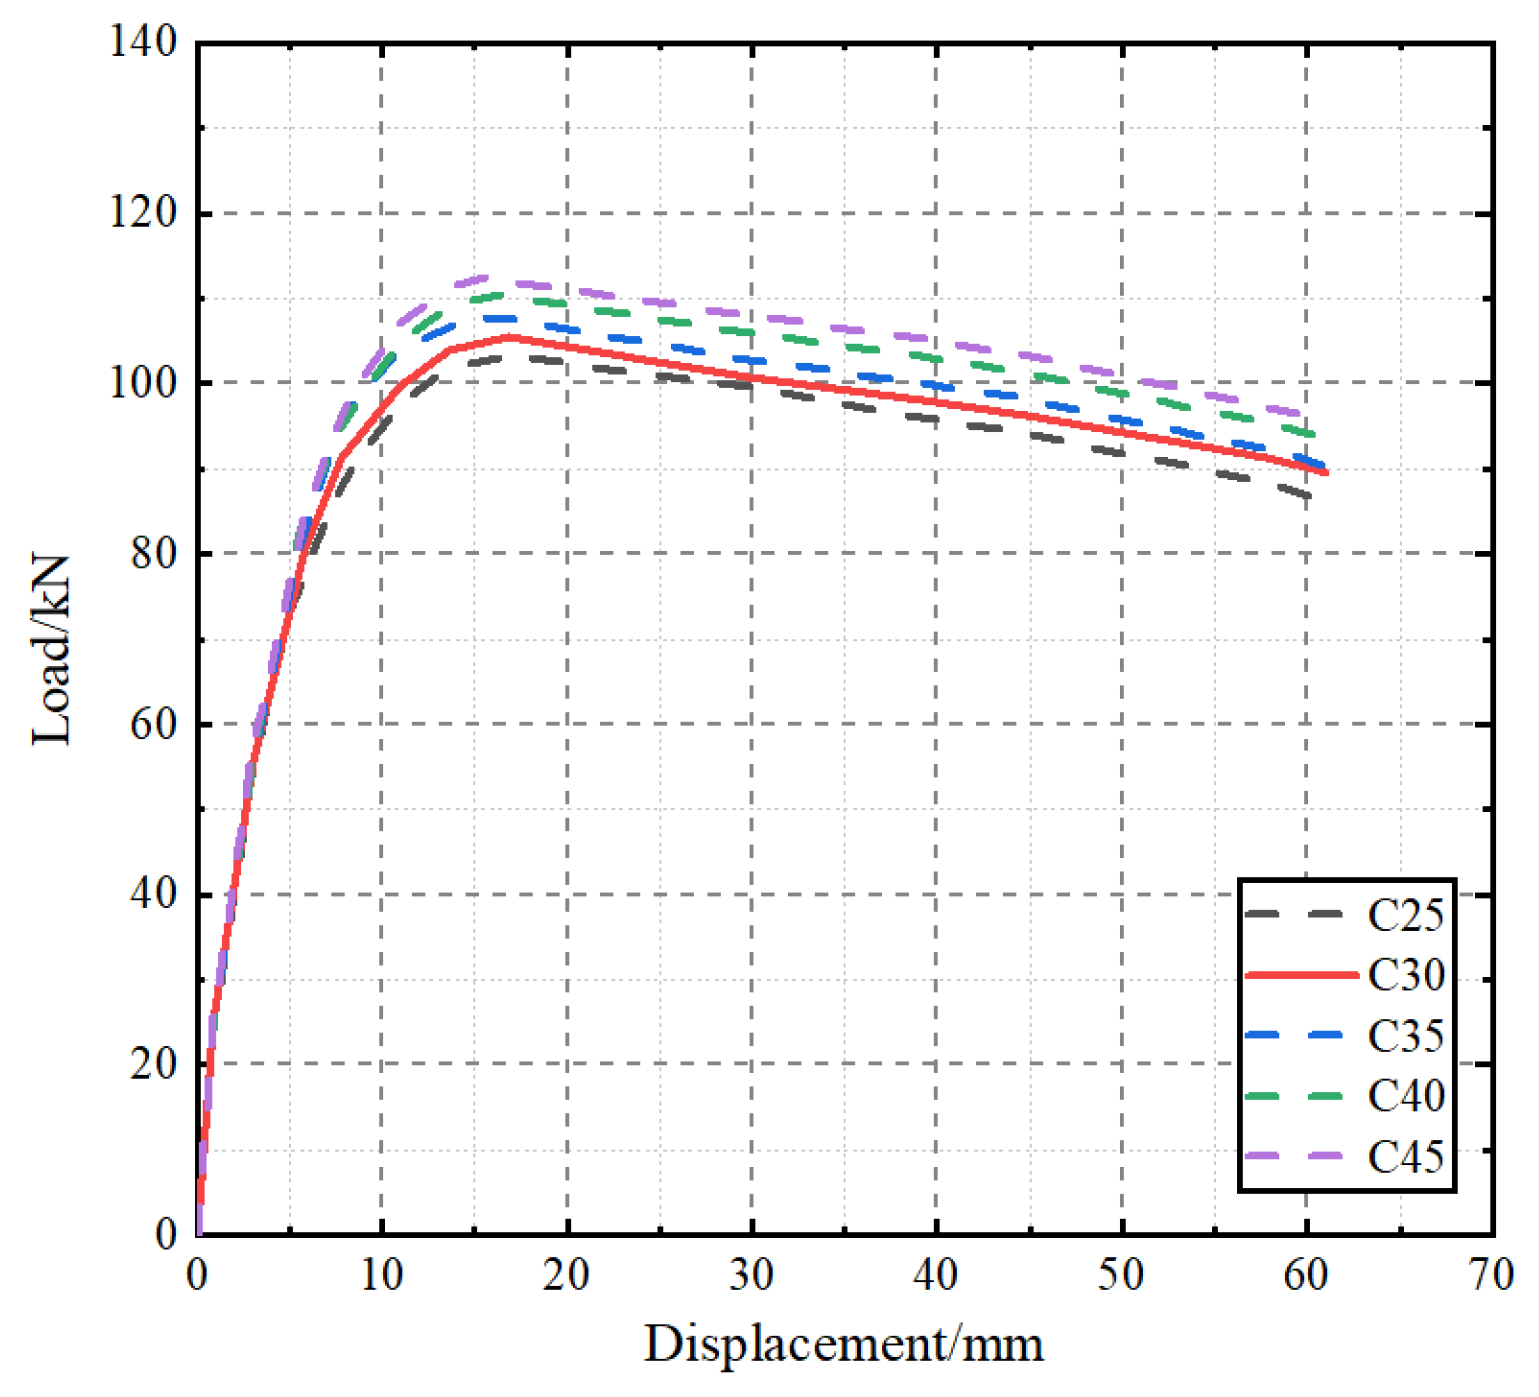
(4) The parametric analyses indicate that increasing the integrated rebar diameter, the longitudinal reinforcement ratio in the rib columns, the concrete grid strength, and the axial compression ratio can all improve the peak load of the wall. Among these parameters, the integrated rebar diameter and the rib-column reinforcement ratio have more pronounced effects. By contrast, increasing the concrete grid strength provides only limited improvement in load-carrying capacity. In addition, although increasing the axial compression ratio can raise the peak load, it also steepens the post-peak descending branch and reduces ductility. Therefore, engineering design should balance load-carrying capacity and deformation capacity.
(5) The integrated rebar box connector can presently be regarded as a promising horizontal-joint solution for fully prefabricated composite walls based on the experimental and numerical evidence obtained in this study. Further studies involving additional specimens and comparative connection details are still needed to clarify its seismic advantages, applicable scope, and design method.