Article

Hydro-Adaptive Housing for Flood-Resilient Planning: Elevated, Amphibious and Floating Solutions


Faculty of Architecture, Gdańsk University of Technology, 11/12 Gabriela Narutowicza Street, 80-233 Gdansk, Poland
*
Author to whom correspondence should be addressed.
Buildings 2026, 16(10), 1880; https://doi.org/10.3390/buildings16101880
Submission received: 24 March 2026 / Revised: 29 April 2026 / Accepted: 5 May 2026 / Published: 9 May 2026
(This article belongs to the Special Issue Advances in Landscape Management and Urban Planning)

Abstract

Climate-driven intensification of pluvial and fluvial flooding increasingly challenges lowland cities in Central Europe, while conventional protection and land-use controls offer limited flexibility under growing hydrological variability. A planning-oriented framework is developed and tested to integrate hydro-adaptive housing into climate-resilient urban development using three typologies: elevated foundations, amphibious dwellings and modular floating platforms. The framework links hazard profiles and site-enabling conditions to typology selection and considers supporting blue–green measures within the broader adaptation context. It is applied to three flood-prone settings in northern Poland representing a coastal delta, a river confluence and a lower-river terrace. The methodology combines GIS-based hazard mapping; one-dimensional unsteady-flow HEC-RAS simulations for 50-, 100- and 500-year design events; and parametric structural modelling in Rhino–Grasshopper. Performance is assessed using maximum inundation depth, surface-water retention time, and a probabilistic building damage index. Amphibious dwellings reduce modelled 100-year flood damage by 62% relative to slab-on-grade construction, while modular floating platforms maintain habitability under water-level rises exceeding 5.0 m. In addition, bioretention and blue–green corridors reduce retention time by 18–31%. The results provide a planning-oriented decision logic for expanding adaptive housing options in flood-prone lowland settings under increasing hydrological variability.

1. Introduction

Flood risk has become a significant constraint on development in Central European lowlands, where flood events can cause direct damage to buildings and infrastructure and generate longer-term recovery challenges for municipalities and communities [1,2,3]. Furthermore, the disruption to mobility networks, local economies and public services can transform single events into longer-term complications, especially in dense urban fabrics and low-gradient terrains where drainage and redundancy are limited [4]. Future risk is expected to remain high or intensify in many settings as hydrological variability rises, extreme precipitation intensifies, and urbanisation continues within hazard-exposed zones [1,5]. At the same time, recent analyses of flood records in Poland indicate that observed trends are spatially differentiated rather than uniformly monotonic, which reinforces the need for planning approaches capable of accommodating variable flood conditions in lowland settings [6].
Across northern Polish lowlands, flood processes may arise from different combinations of fluvial; pluvial; and, in Baltic-connected settings, coastal drivers. In coastal–deltaic and Baltic-connected river corridors, fluvial inundation may coincide with intense rainfall–runoff, while backwater effects and storm surges can further elevate flood levels [2]. These interactions reduce the reliability of single-hazard assumptions and challenge strategies that focus primarily on the prevention of water ingress. Conventional protection measures and land-use controls remain essential; however, they offer limited flexibility under increasingly variable flood conditions and can be constrained by space, cost, and environmental trade-offs [3]. Consequently, adaptation requires solutions capable of maintaining acceptable performance across a wider range of water levels and flood conditions than static defences alone can accommodate.
From an implementation perspective, contemporary flood adaptation increasingly combines conventional engineered flood-protection measures, blue–green measures, and risk-informed planning instruments. The first category includes levees, embankments, pumping systems, and drainage upgrades; the second includes bioretention, retention corridors, floodways, permeable surfaces, and water plazas; and the third includes hazard zoning, land-use restrictions, and development controls [7]. Recent evaluations of flood risk management planning in Poland indicate that implementation remains dominated by conventional infrastructure, while the integration of nature-based solutions is comparatively slow and uneven [3]. At the same time, the evidence base on nature-based and natural flood management approaches continues to expand. Reported outcomes include peak-flow reductions and broader co-benefits when measures are implemented at sufficient scale and in suitable catchment settings [8,9,10]. However, assessments also emphasise strong context dependence, time-lag effects, and limited effectiveness during extreme events, particularly where interventions are fragmented or constrained by urban form [9,10]. Decision-support and optimisation frameworks for urban nature-based solutions are advancing, although methodological and governance barriers, including data requirements, maintenance responsibilities, and uncertainty handling, still limit systematic uptake at city scale. This gap between strategic aspirations and operational maturity underscores the necessity for complementary adaptation strategies that can remain functional where complete prevention of inundation is not feasible.
Recent studies and emerging planning practice increasingly discuss hydro-adaptive housing as an adaptation option in flood-prone urban and waterfront settings, particularly through elevated, amphibious, floating, and stilted residential forms [11,12,13,14]. Rather than relying exclusively on territorial protection, these approaches enable buildings to accommodate temporary inundation or adjust to changing water levels through elevation, amphibious foundations, and floating or stilted configurations [15,16,17]. Built precedents and pilot applications in the Netherlands, Sweden, Canada, and parts of Asia indicate technical feasibility and resilience potential, including reduced damage and continued habitability during high-water events, although the evidence remains case-based and context-dependent [18,19,20]. Recent European research has also explored the potential of water-adapted dwellings to support energy autonomy and low-carbon operation [21]. At the same time, studies on urban blue-space design in the Baltic Sea Region point to broader synergies between flood adaptation, waterfront redevelopment, and climate-responsive urban districts [16,22]. Together, these developments suggest that hydro-adaptive housing can extend the repertoire of adaptation options in selected flood-prone settings. At a broader urban scale, recent work on floating-city concepts further reflects growing interest in water-based development models as possible responses to sea-level rise, land scarcity, and climate-related coastal pressures, although these concepts remain exploratory and require further feasibility assessment [23]. However, comparative quantitative evaluation and implementation-oriented appraisal of such typologies in Central European planning contexts remain limited, while current uptake in Europe is still fragmented and strongly conditioned by regulatory, institutional, financial, and technical constraints [13,14,24].
Furthermore, there are several knowledge gaps that continue to constrain the transferability of hydro-adaptive housing to Central European lowland contexts. First, comparative quantitative assessments of typology performance across distinct hazard regimes remain limited outside a relatively small number of case-based applications, which restricts reliable planning-oriented comparison among elevated, amphibious, and floating solutions [11,18,25]. Second, operational and appraisal-related aspects, including access, utilities, safety systems, maintenance, and affordability, are reported inconsistently across the literature, which complicates cross-typology evaluation and weakens planning-stage decision support [26,27]. Third, governance and regulatory conditions remain a major constraint in settings where floodplain development is tightly controlled, technical frameworks for amphibious or floating structures remain fragmented or incomplete, and adaptation measures are not yet consistently mainstreamed into existing planning instruments and policy pathways [28,29,30].
As a result, hydro-adaptive housing is frequently discussed as a promising adaptation option. However, planning practice still lacks transparent decision logic that links local hazard profiles and site-enabling conditions to the screening of appropriate typologies within existing planning frameworks [31]. Addressing this gap requires planning-oriented evaluations across different scales, from building-level feasibility to neighbourhood-scale recovery and surface-water dynamics. In particular, hazard profiles derived from hydraulic modelling and hazard mapping should be related to site-enabling conditions that determine typology feasibility and operational safety. In addition, complementary blue–green infrastructure measures that may reduce retention time and support broader urban water management objectives should be considered. This perspective is particularly relevant in resource-constrained municipalities in smaller river basins, where adaptation measures must remain operationally feasible, implementable, and compatible with existing spatial-planning instruments [3,30,32].
The present study addresses this gap by developing and testing a planning-oriented comparative framework for the assessment of hydro-adaptive housing in climate-responsive urban landscapes. The framework focuses on three typologies: elevated foundations, amphibious dwellings, and modular floating platforms. Additional reference configurations are treated only as contextual background and are not part of the core comparative assessment. It examines how typology suitability varies in relation to hazard profiles and site-enabling conditions. This approach is evaluated in three distinct flood-prone settings in northern Poland: a coastal delta, a river confluence zone, and a lower-river terrace. The methodology combines GIS-based hazard mapping with one-dimensional (1D) unsteady-flow hydraulic modelling for 50-, 100- and 500-year design events and parametric structural modelling to evaluate typology feasibility and performance at the building scale. Complementary blue–green infrastructure measures are considered as supporting interventions within the broader adaptation context rather than as a separate co-design framework.
In response to the identified gaps, the study addresses three questions: (1) how hazard profiles vary across the three study settings; (2) under which hazard and site-enabling conditions elevated, amphibious, and floating housing typologies are most suitable; and (3) whether and to what extent complementary blue–green infrastructure measures affect retention time and related resilience indicators. To address these questions, the article develops and applies a planning-oriented comparative framework that combines hazard mapping, hydraulic modelling, and typology-based assessment. The contribution of the study lies not in proposing a new regulatory framework, but in providing a planning-oriented decision logic for linking hazard conditions and site feasibility to the screening of adaptive housing typologies within existing planning and risk-management contexts. The framework is intended to support the screening of hydro-adaptive housing options in flood-prone lowland settings and to clarify how hazard conditions, site feasibility, and supporting blue–green measures may be considered together in adaptation-oriented spatial planning.

2. Materials and Methods

2.1. Study Areas and Data Sources

Three flood-prone urban settings in the Lower Vistula River corridor (northern Poland) were selected to represent contrasting hydro-morphological and planning conditions relevant to hydro-adaptive housing deployment:
(1) A coastal delta/brownfield context (Gdansk—Polski Hak);
(2) A peri-urban inner-meander and confluence context (Torun—Kaszczorek; Vistula and Drweca confluence);
(3) A lower-river terrace context with documented deep inundation during historical flood events (Tczew, Nadwiślańskie terraces).
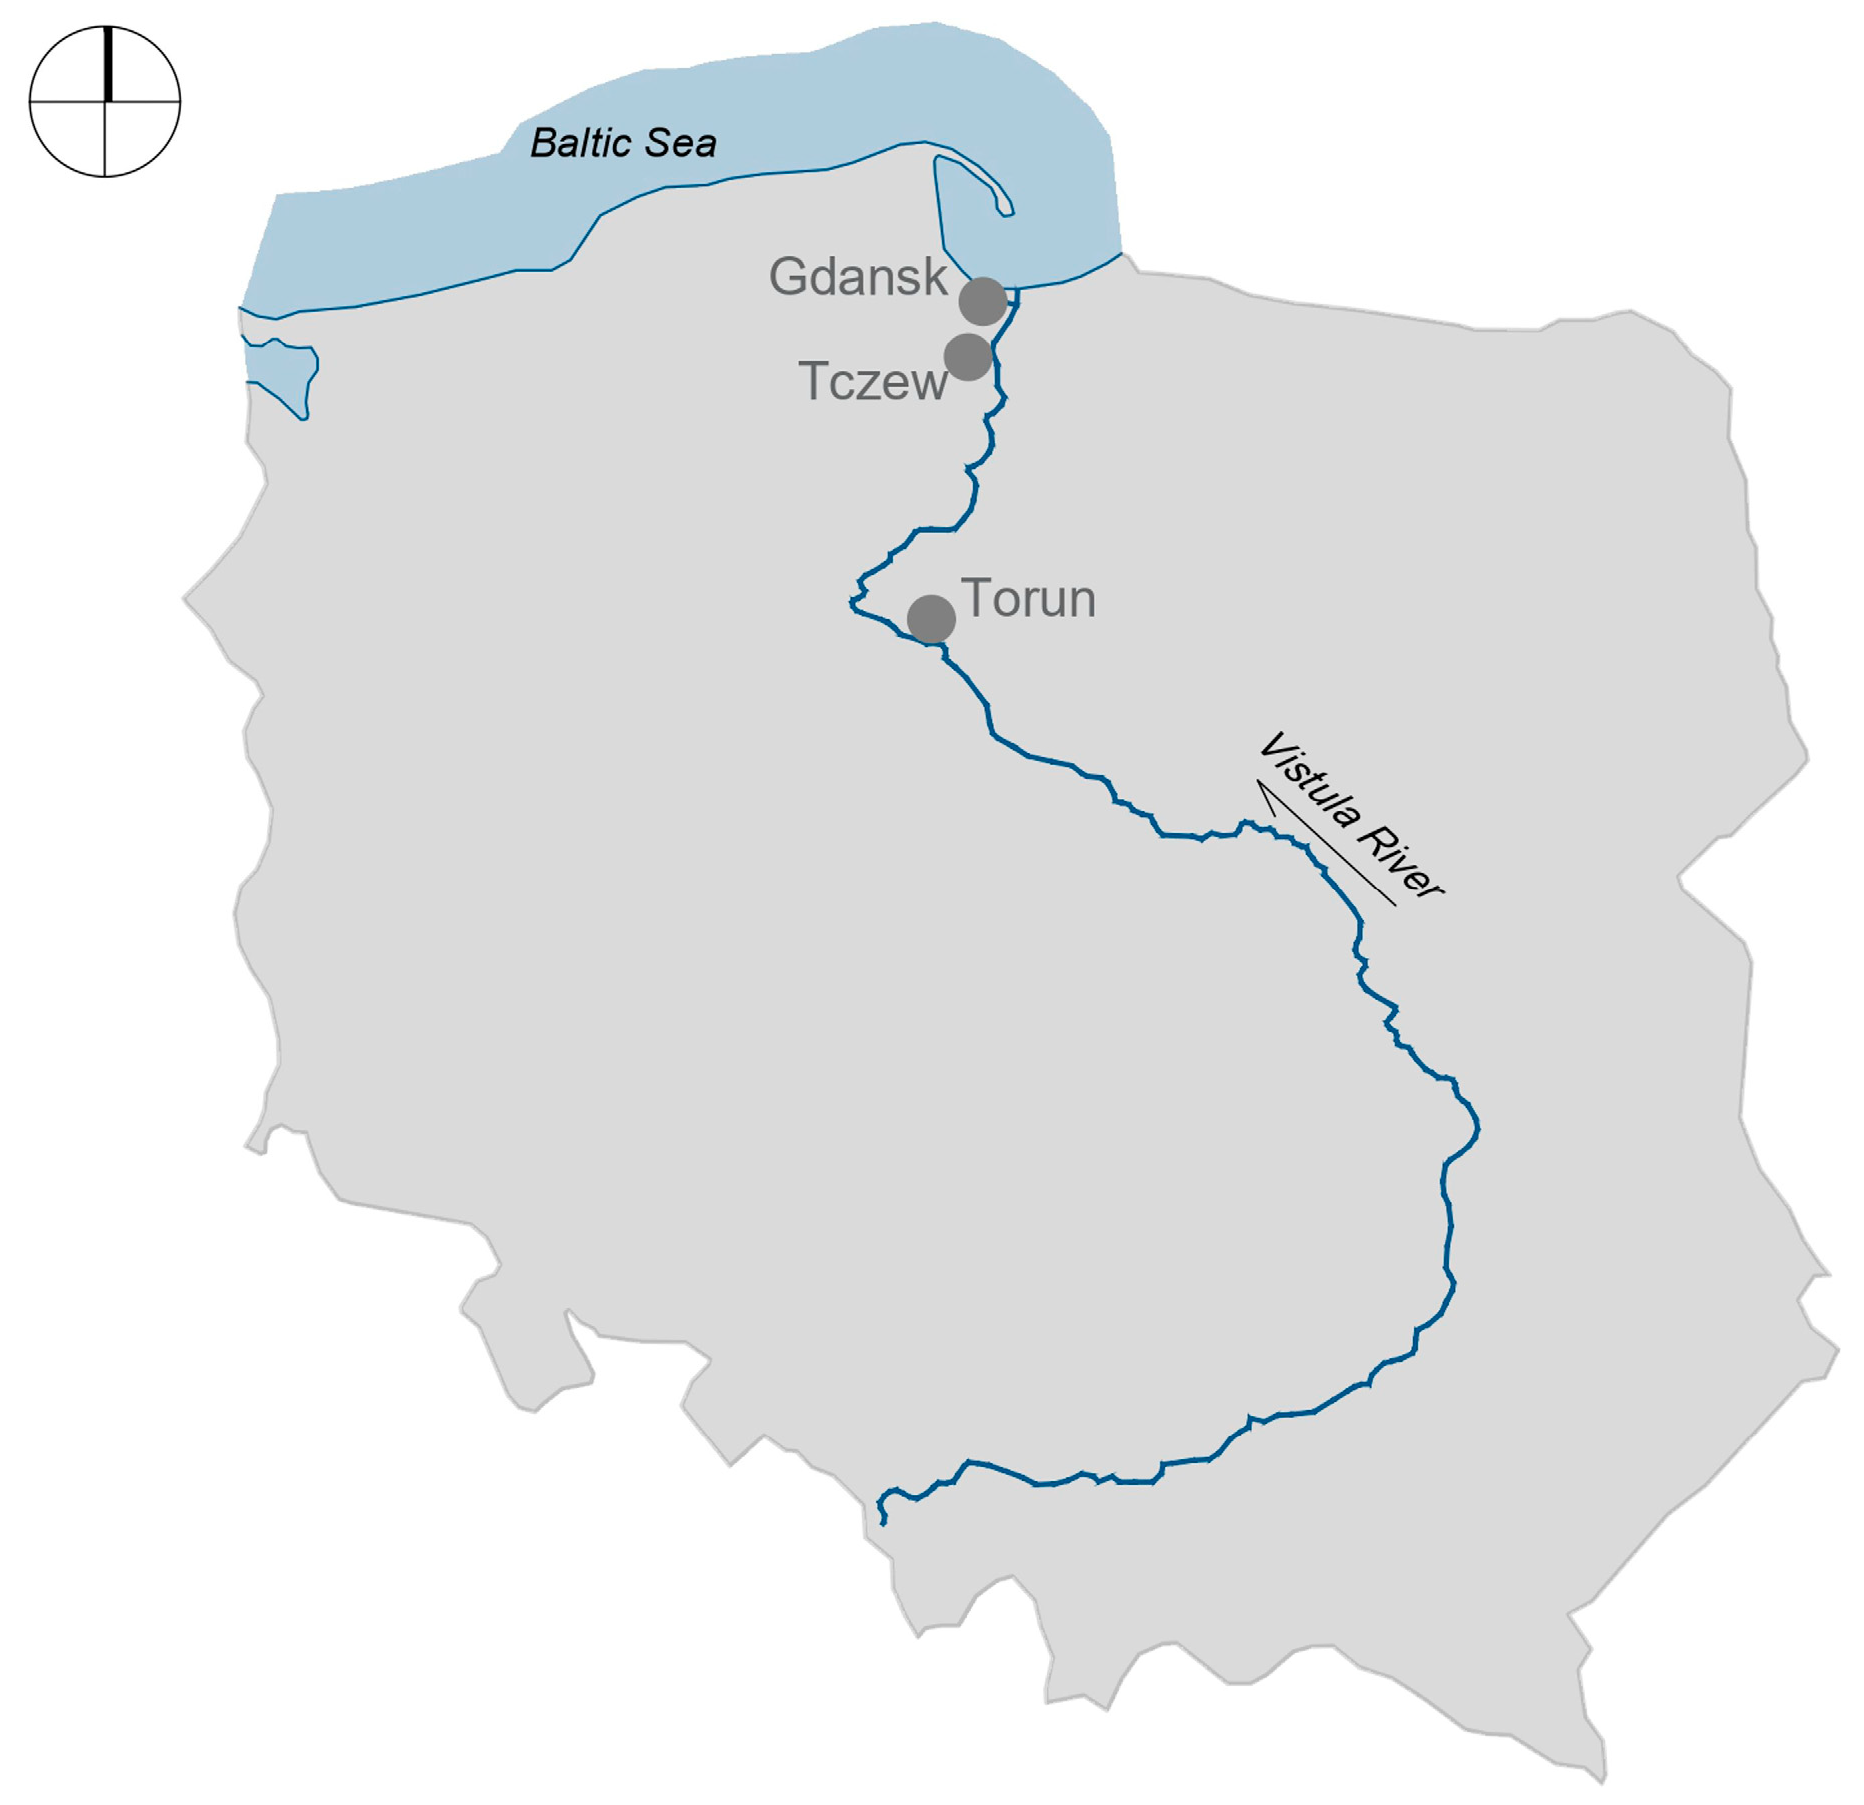
To ensure cross-site comparability, the case studies were delineated using the same selection criteria and harmonised datasets, while spanning a range of watershed scales, urbanisation pressures and hydromodification levels. Selection criteria included recurrent flood exposure, the availability of consistent LiDAR and hydrometric inputs, and planning relevance for housing deployment. In addition, the analysed reaches were delineated consistently across sites to capture valley geometry, floodplain connectivity, and key hydraulic controls that condition urban exposure. The topography for site delineation and hydraulic geometry was derived from airborne LiDAR (0.5 m vertical resolution) datasets available through national geodetic resources [33] and complemented with historical flood archives and hydrometric records from the Polish Institute of Meteorology and Water Management—National Research Institute (IMGW-PIB) [34]. Figure 1 illustrates the geographic location of the case-study areas within the Lower Vistula River corridor.
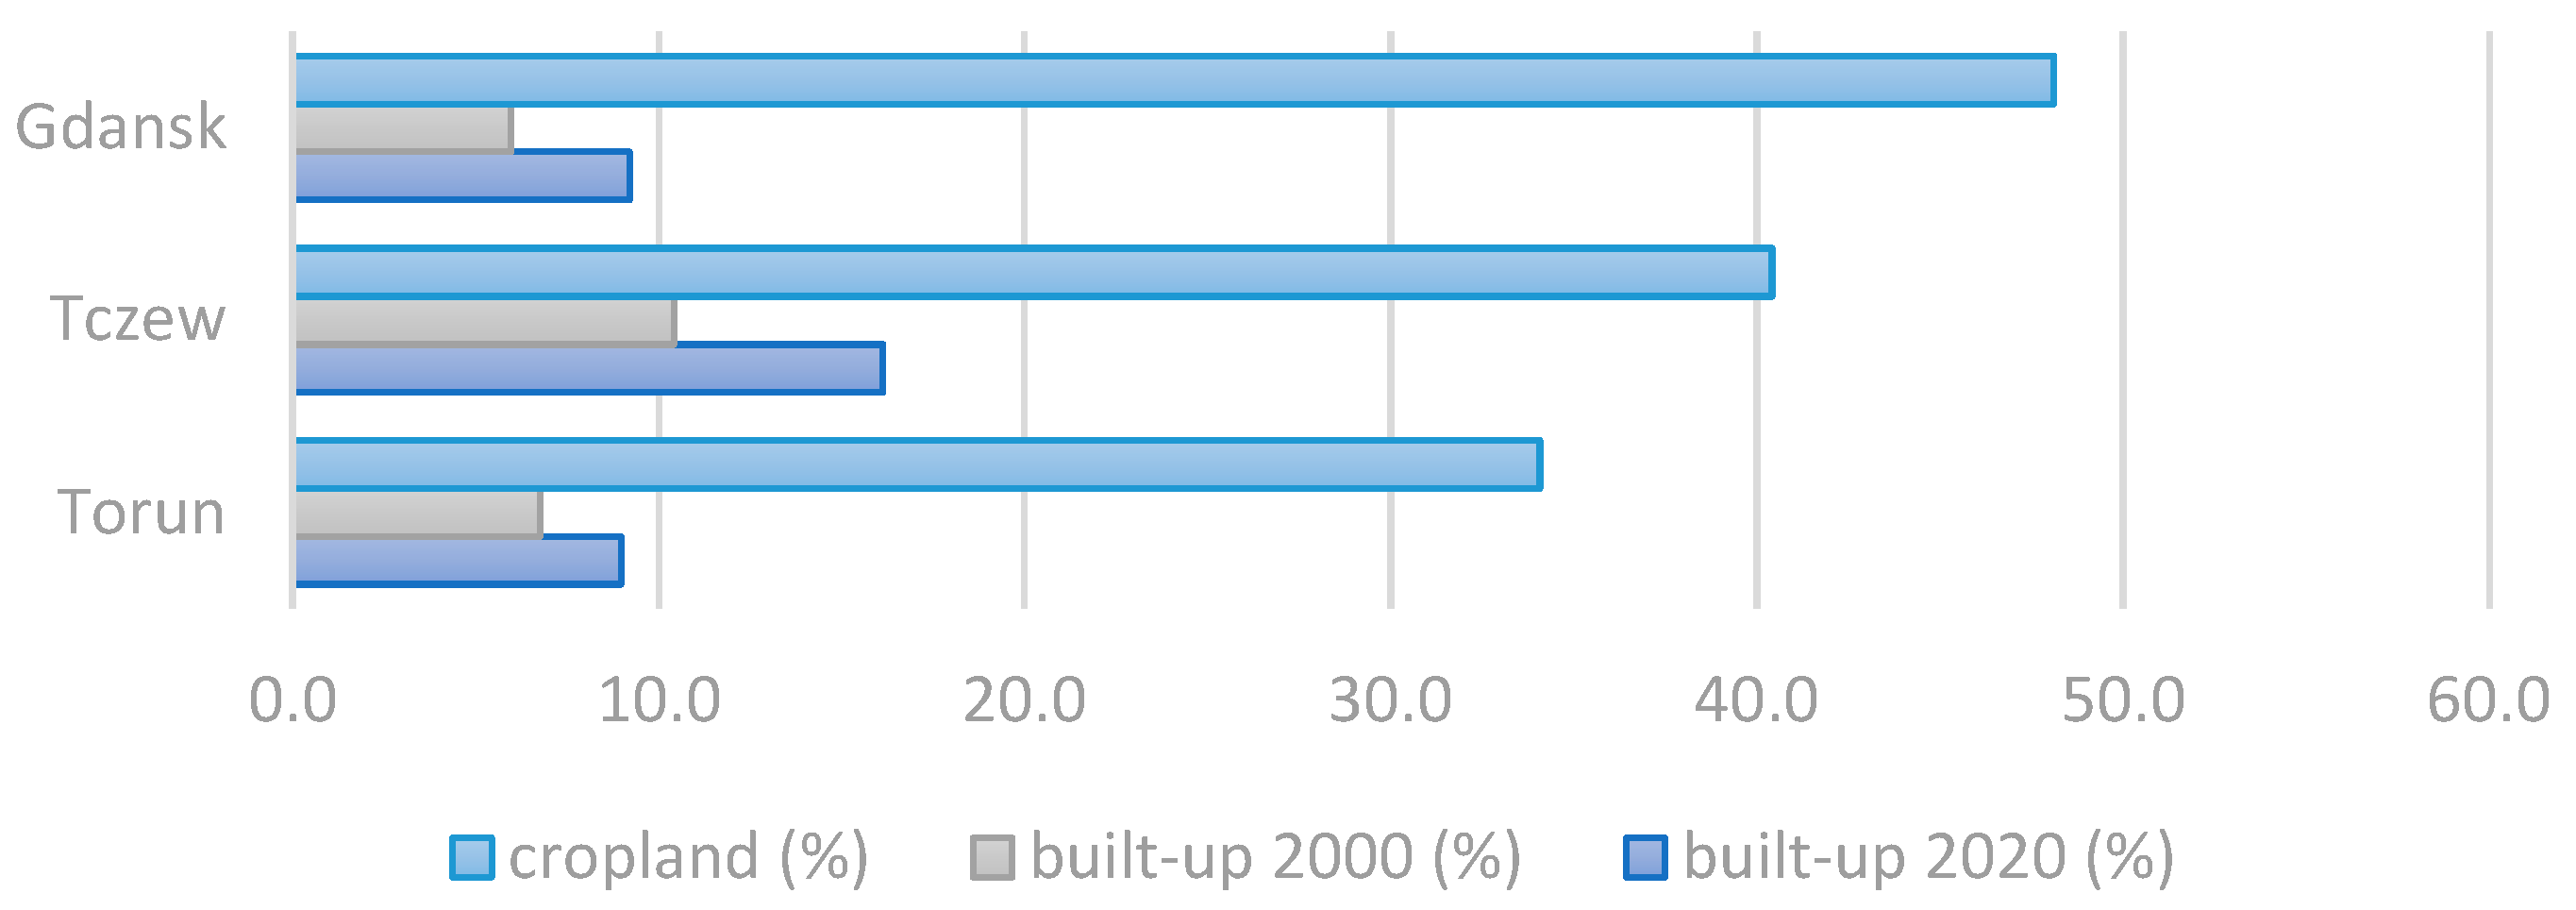
To contextualise basin-scale drivers and exposure pressures under pluvio-fluvial flood conditions, watershed-level baseline characteristics were compiled using the Global Watersheds reporting framework [35]. The dataset integrated satellite-derived land-cover information (GLAD, 2000–2020), population estimates (GlobPop 2020), climate and water-flux layers (WorldClim/GLEAM) [36], terrestrial water-storage anomalies from GRACE [37], and dam inventories from Global Dam Watch, as available through reporting [35]. These variables were used to support site selection and to characterise the broader hydro-environmental conditions within which the local hydraulic simulations were interpreted.
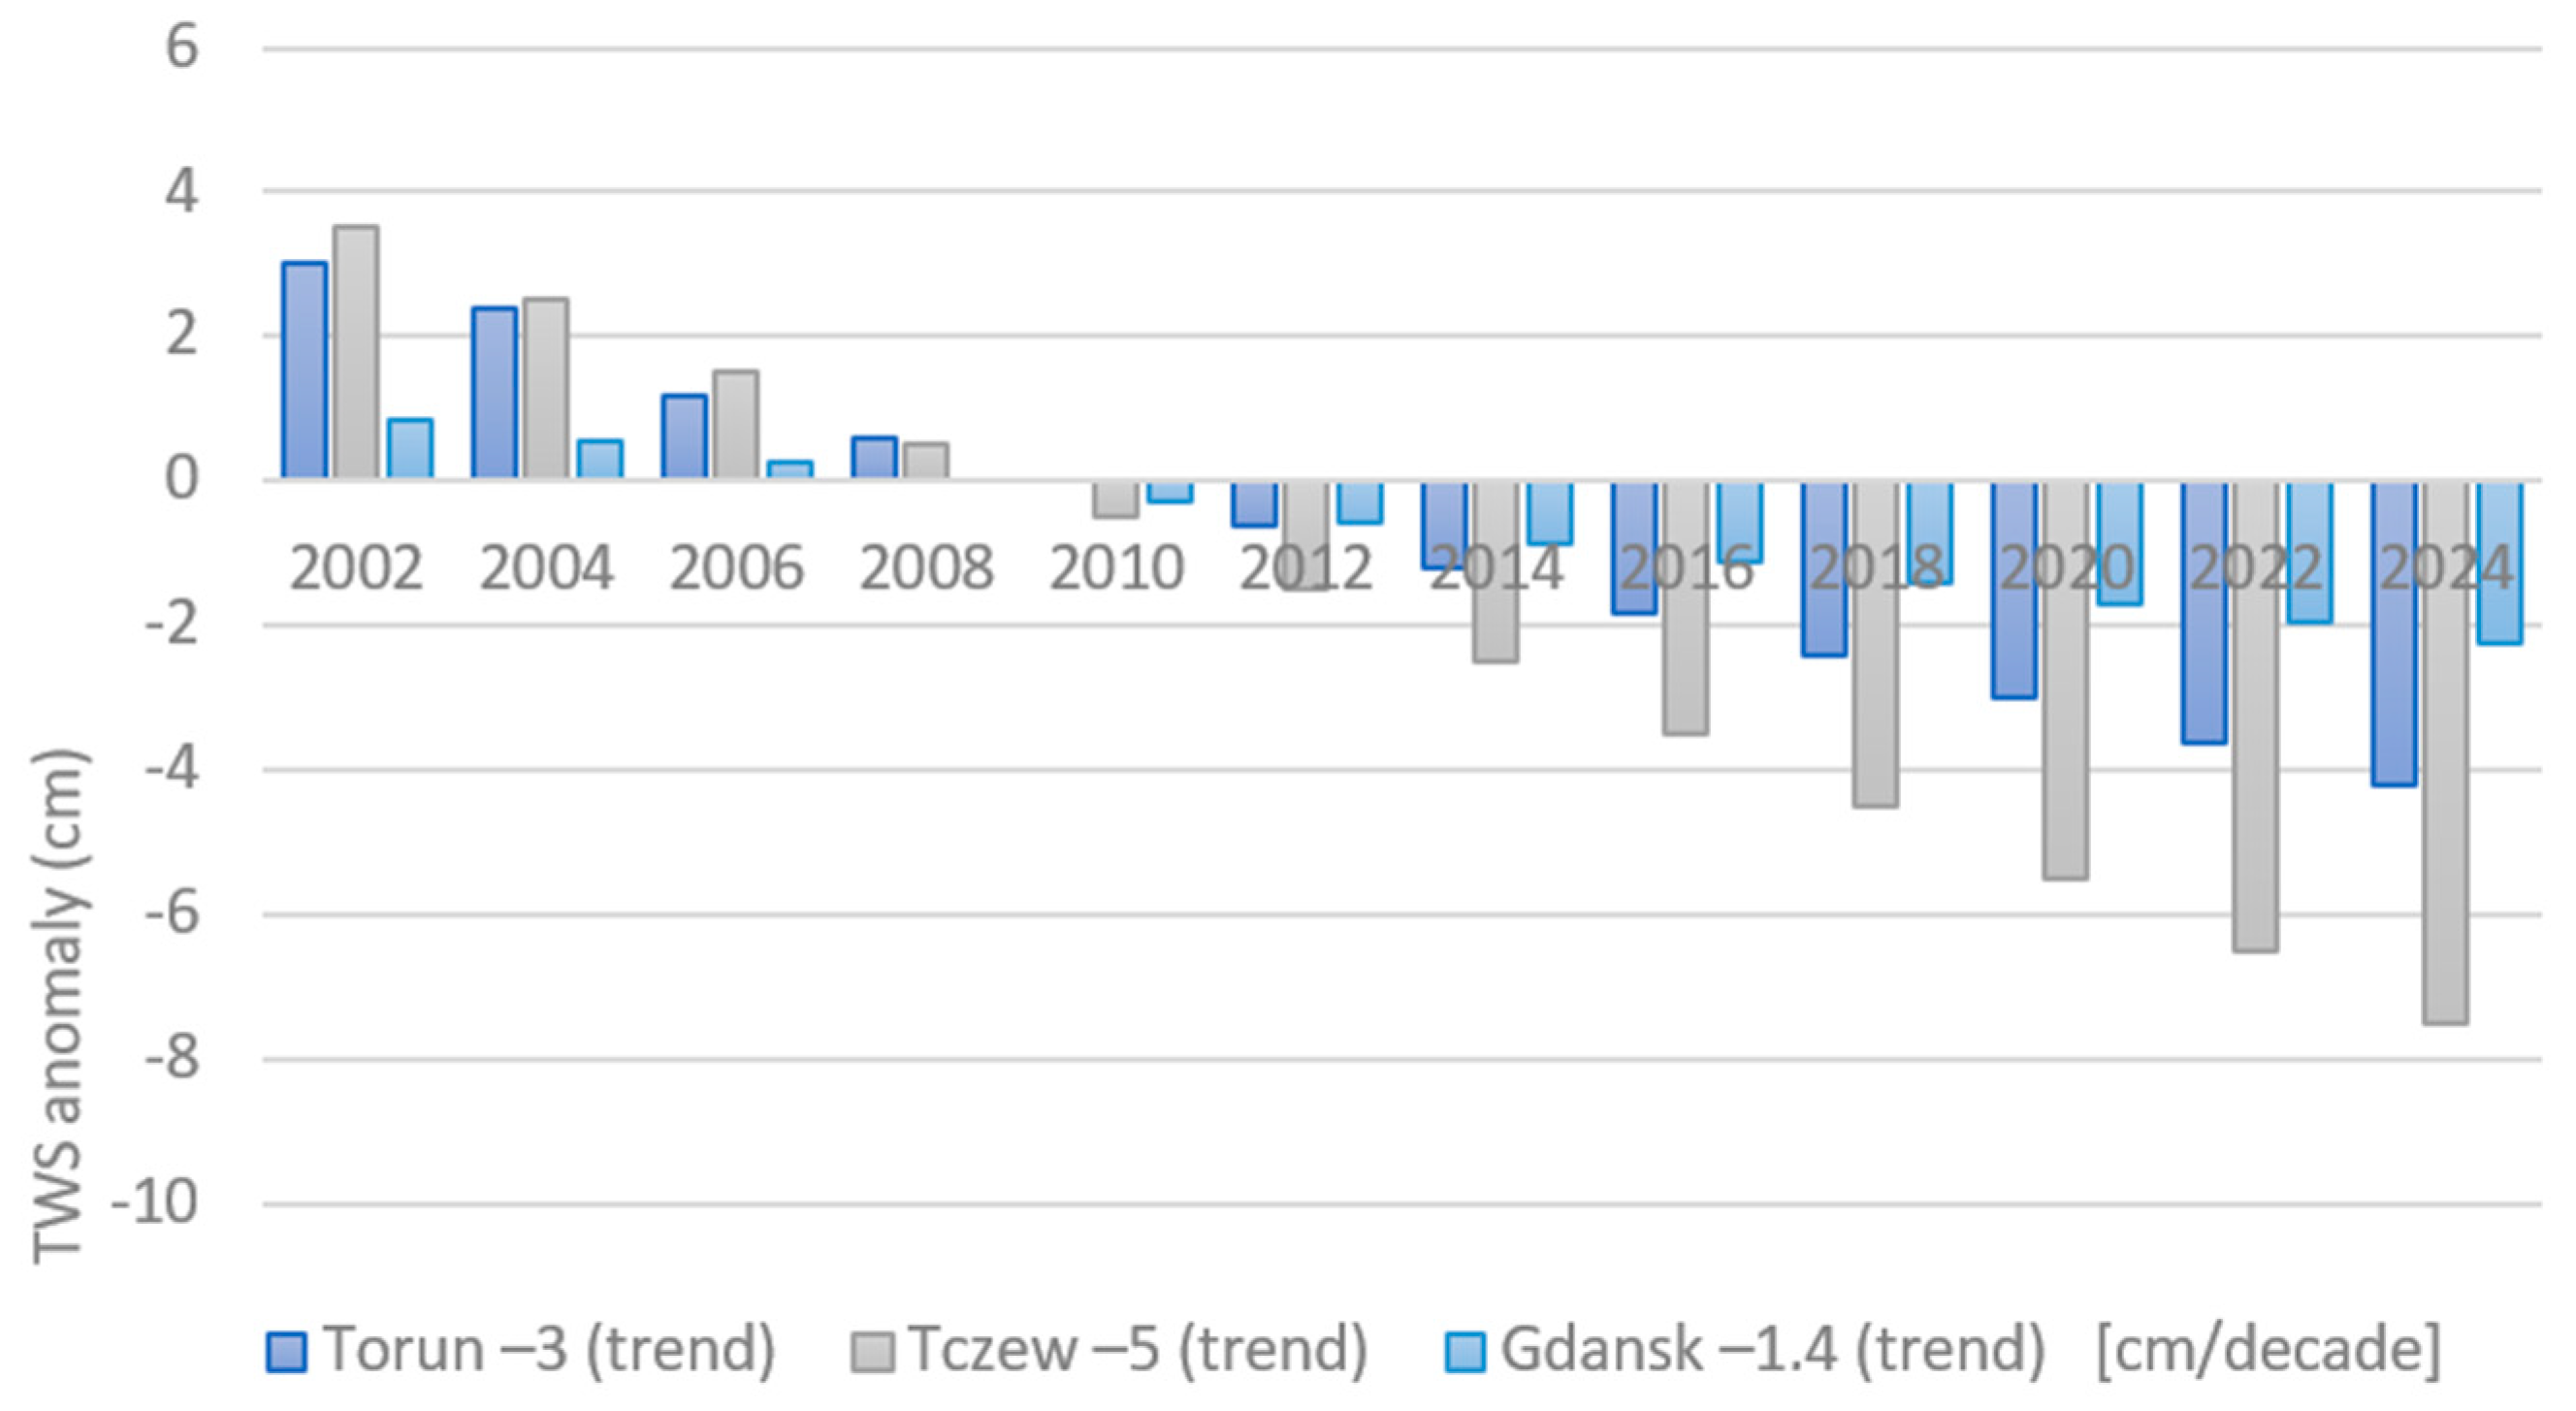
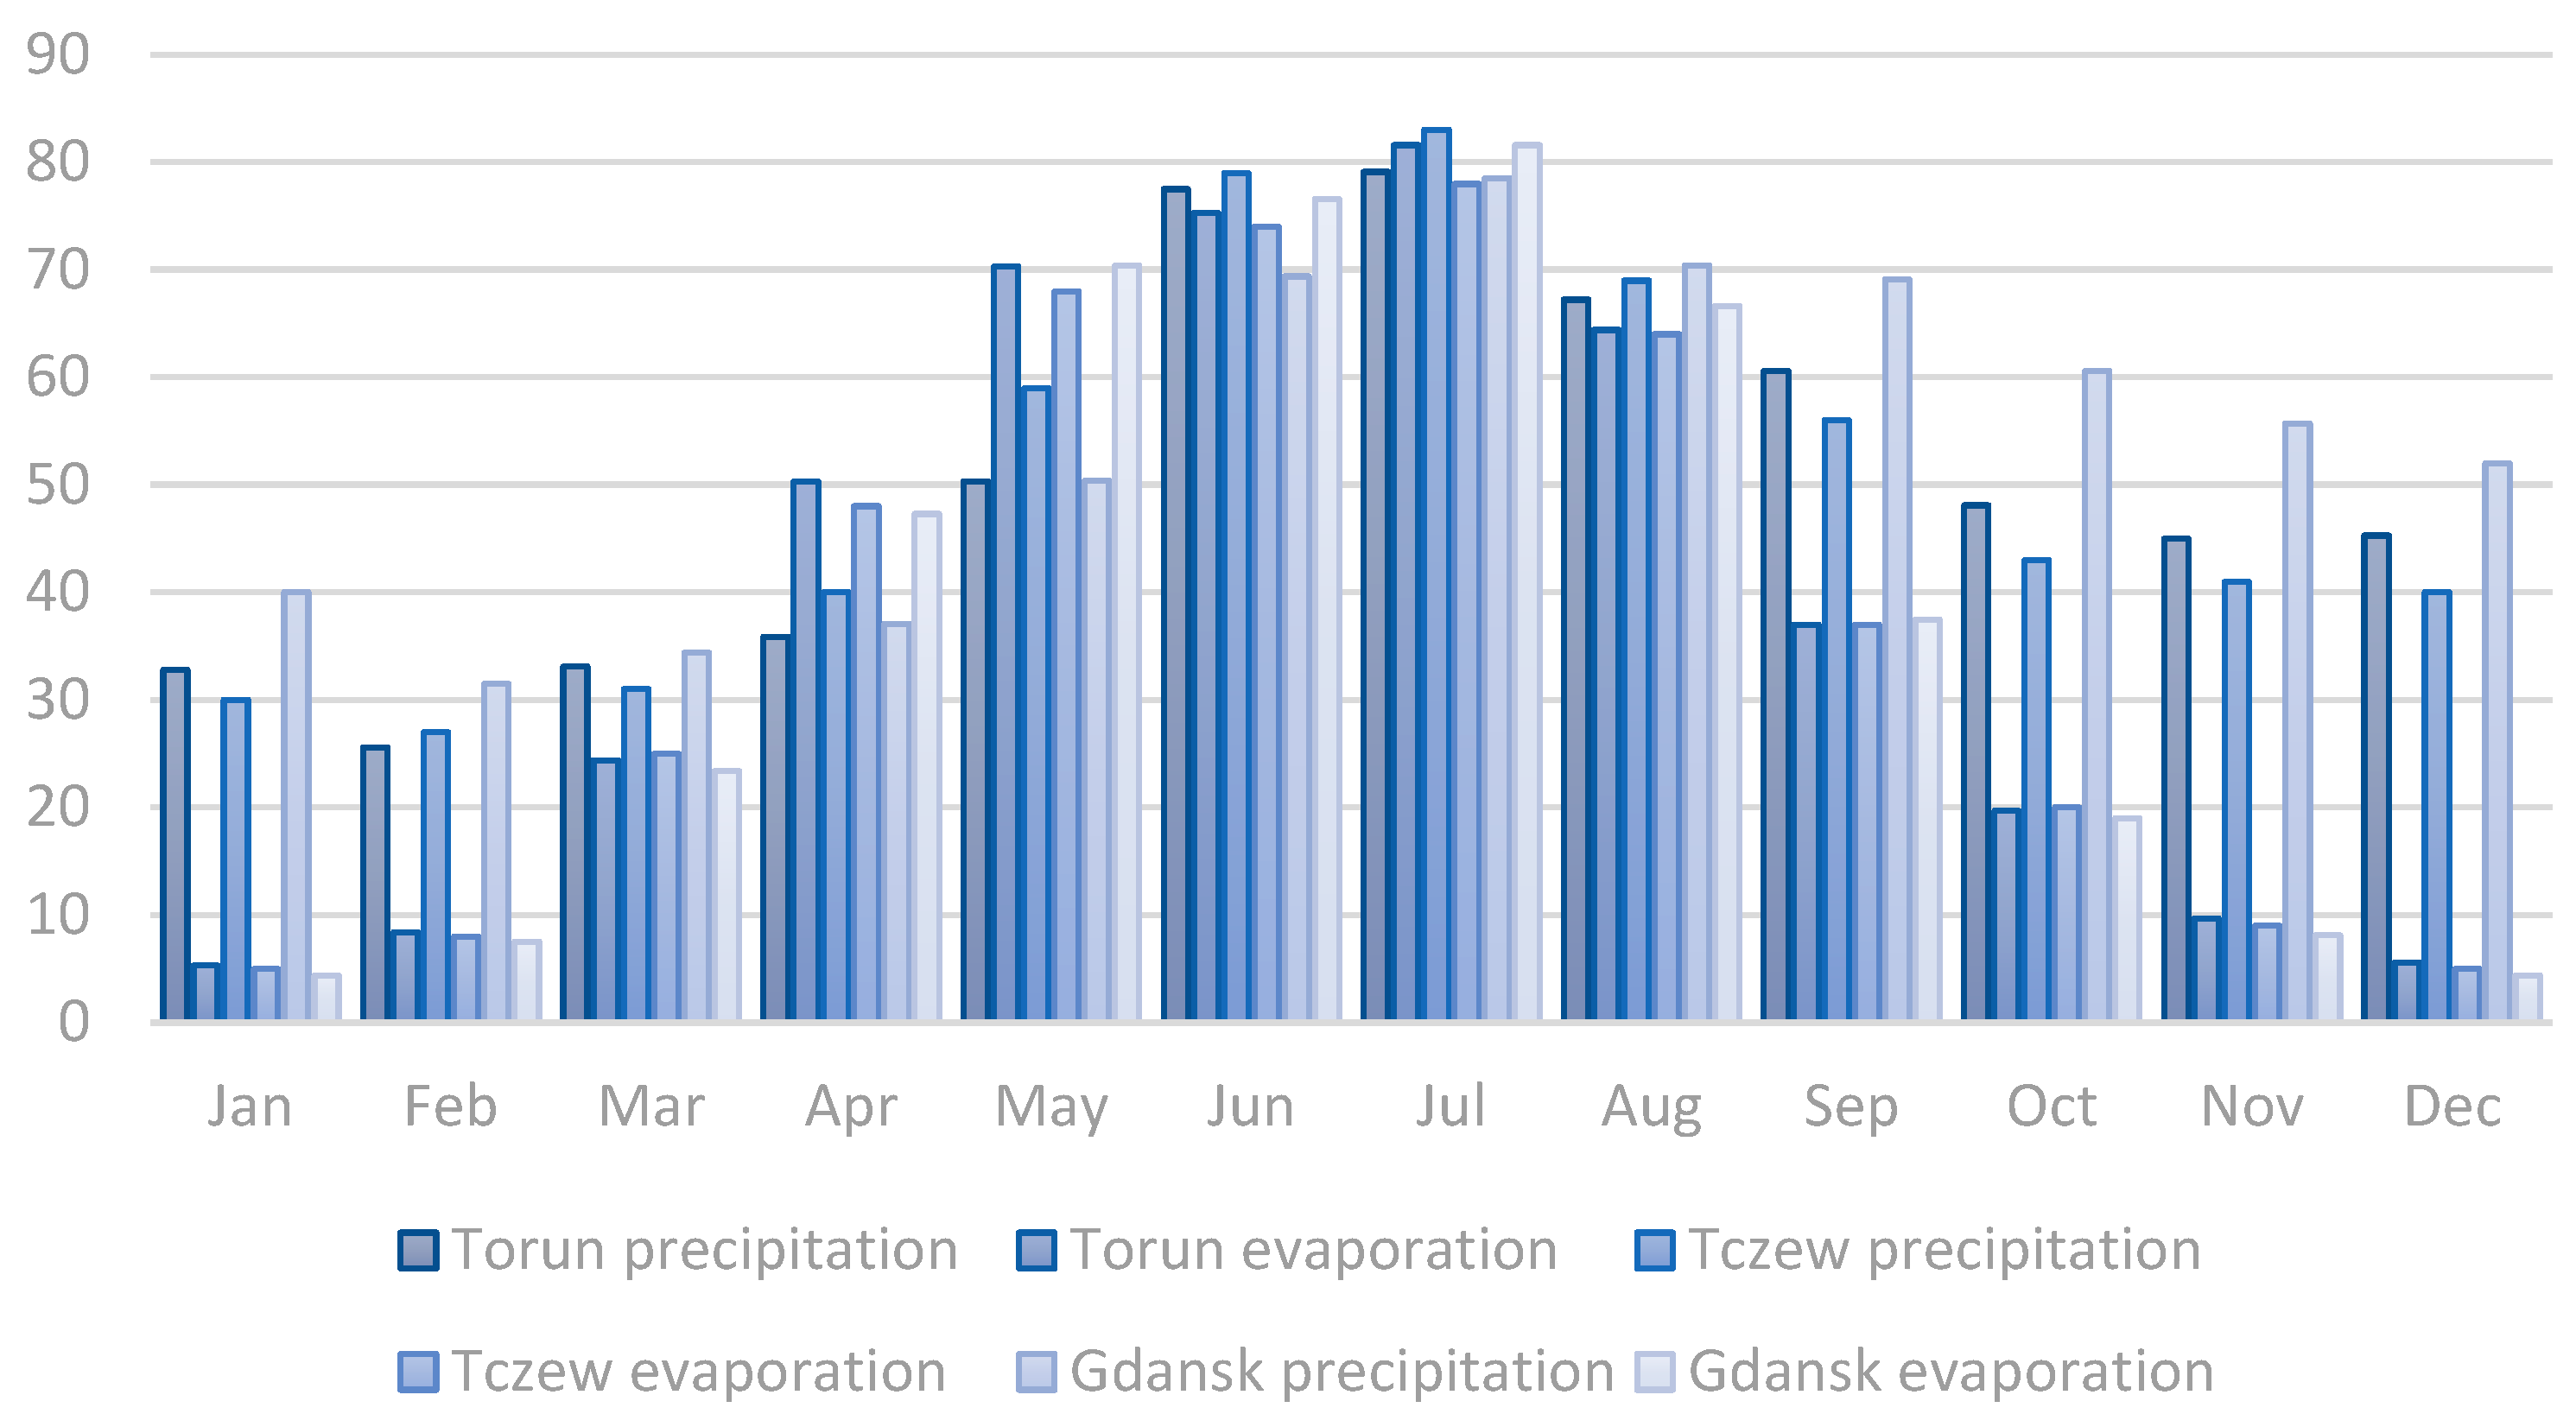
Key watershed indicators are presented in Figure 2, Figure 3 and Figure 4, including land-cover change, terrestrial water-storage trends, and monthly precipitation–evapotranspiration climatology. Together, these datasets provided basin-scale context for assessing urbanisation pressure, long-term water-storage dynamics, and pluvio-fluvial seasonality across the study areas.
Table 1 summarises the watershed-level baseline descriptors used for inter-site comparison, including population density within the drainage area (population/km2), cropland share normalised to drainage area, built-up change between 2000 and 2020, mean annual precipitation (mm/year), and GRACE trend estimates expressed as centimetres of equivalent water height per decade [37]. Land-cover and population indicators informed the comparative characterisation of urbanisation pressure across catchments, whereas climatological and terrestrial water-storage data were used primarily to contextualise basin-scale hydrological conditions rather than as direct hydraulic input parameters.

2.2. Research Design and Workflow

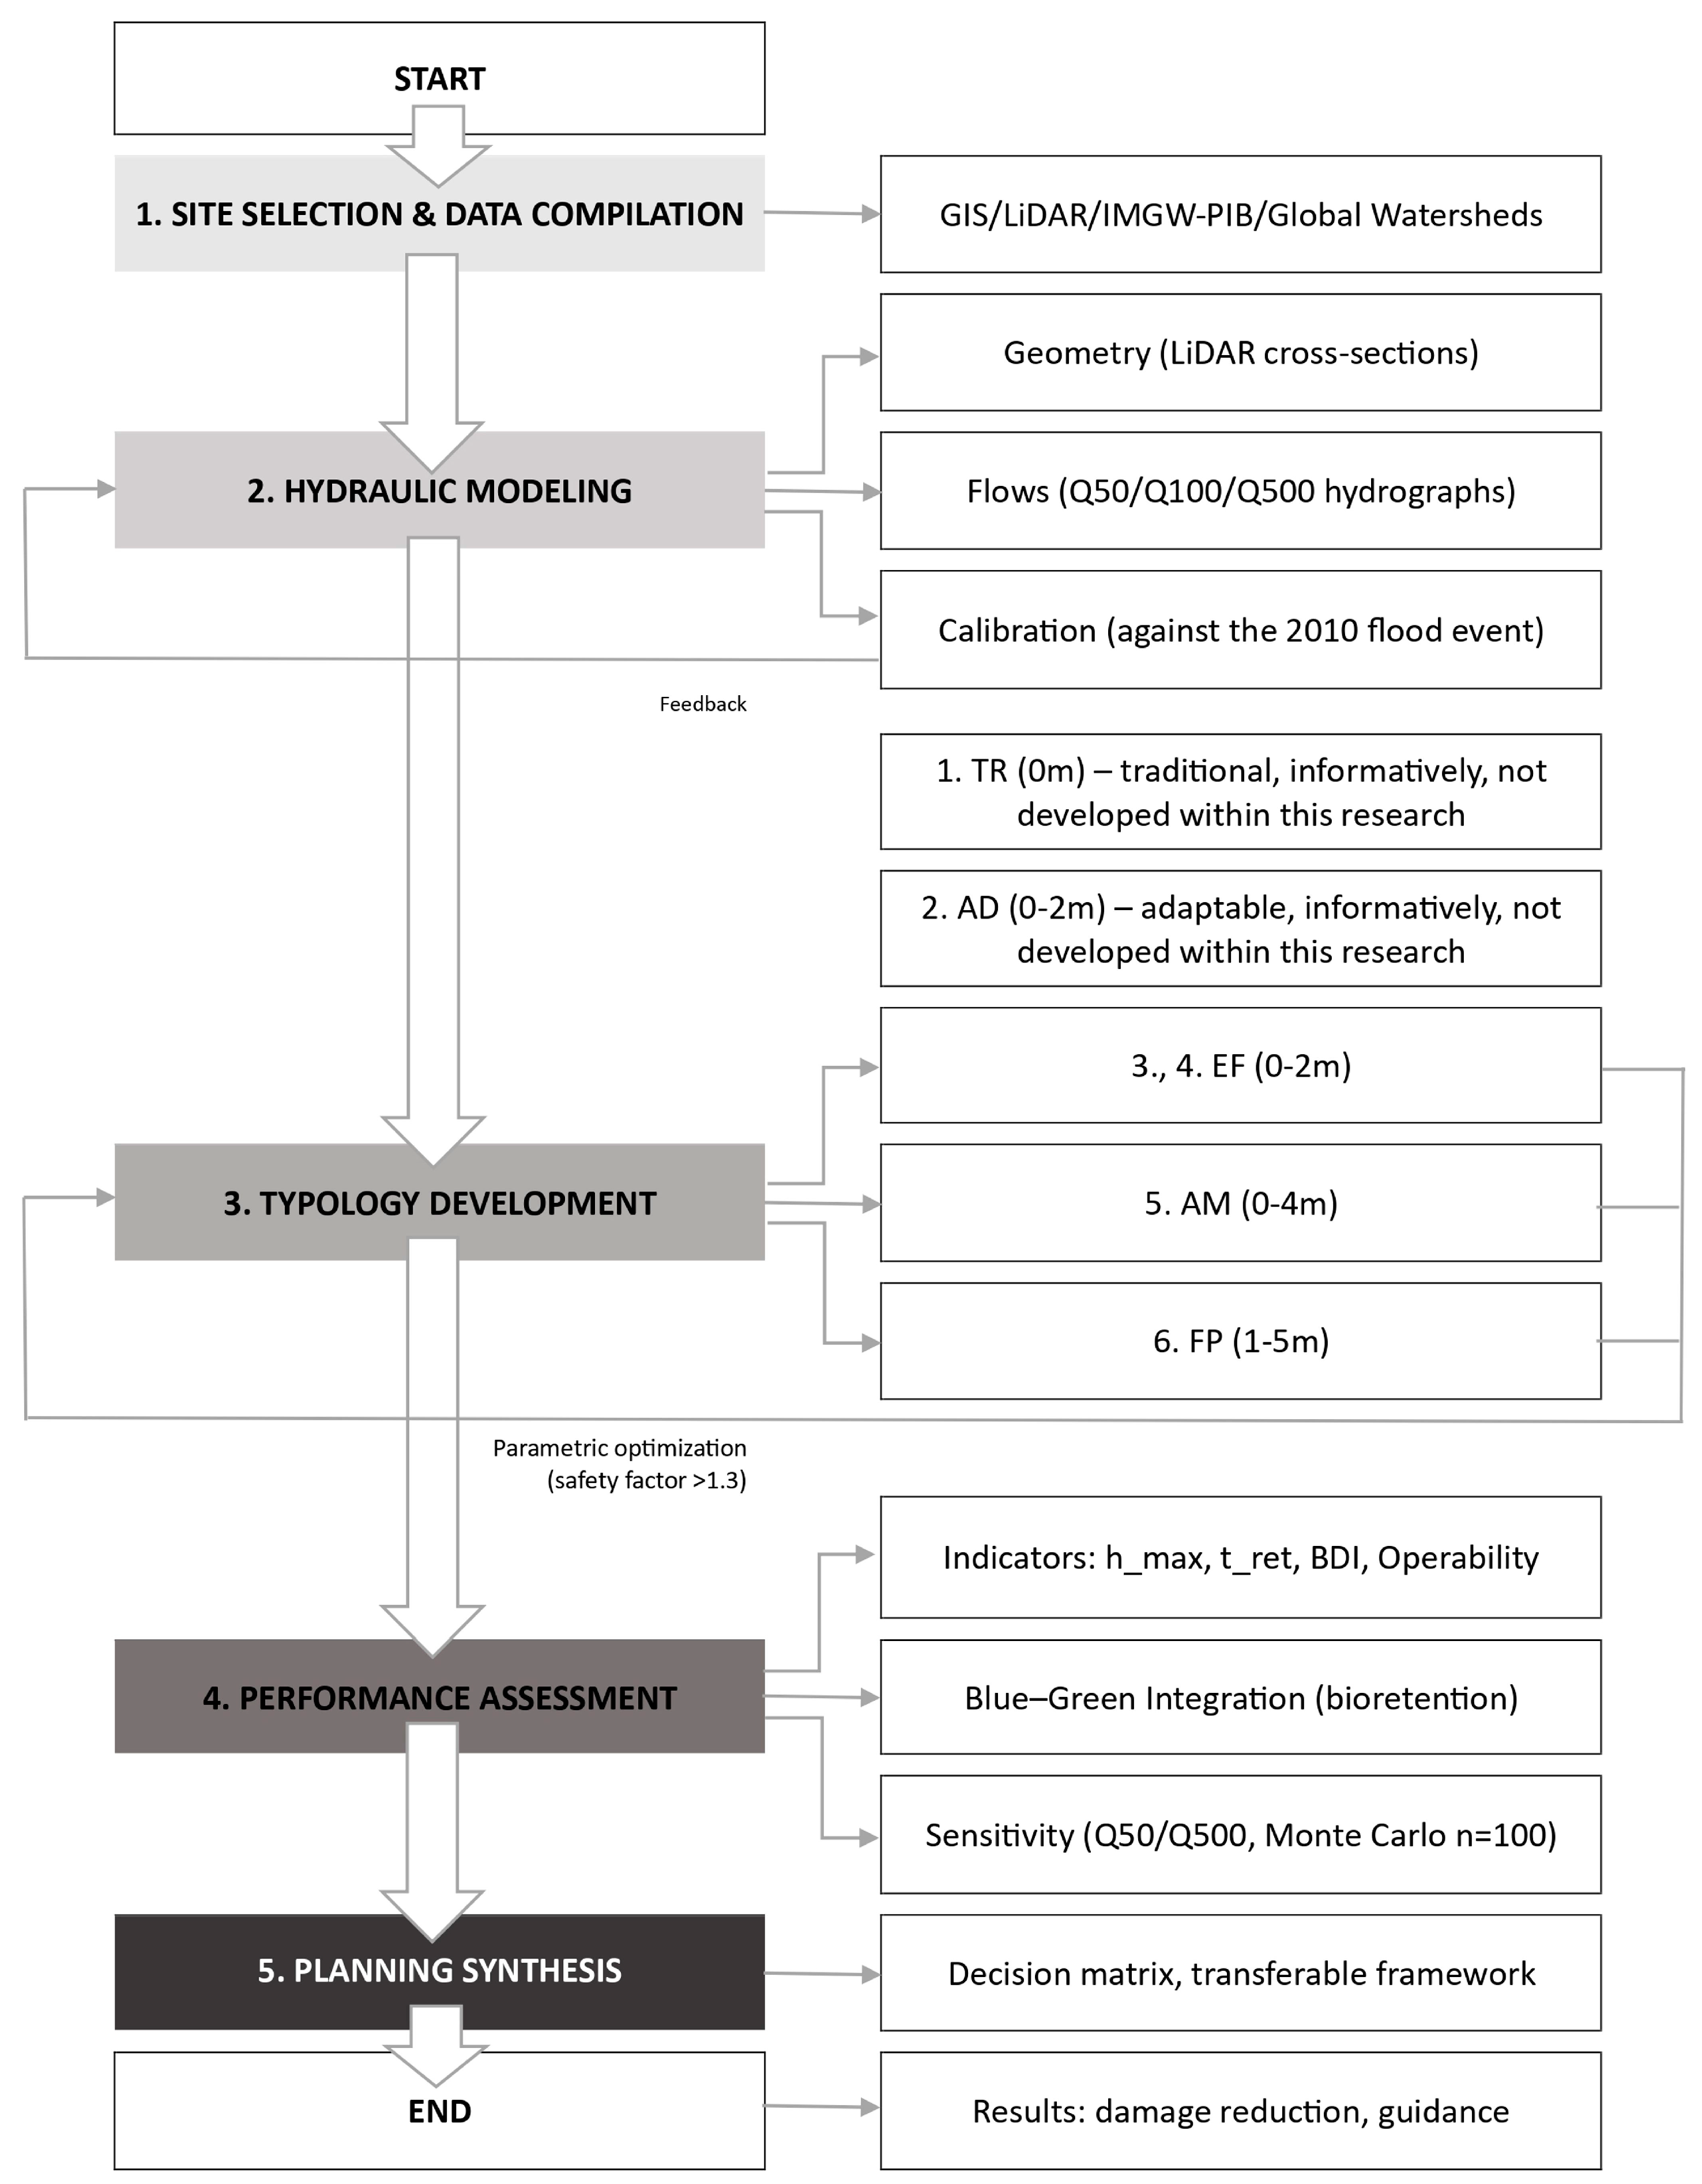
A multi-stage research design was implemented to translate flood hazard characterisation into planning-relevant guidance for hydro-adaptive housing. The methodological framework integrates four core components: (1) hazard and site data compilation, (2) one-dimensional unsteady-flow hydraulic modelling (HEC-RAS, v6.0; U.S. Army Corps of Engineers, Hydrologic Engineering Center, Davis, CA, USA) [38], (3) research-by-design development of hydro-adaptive housing typologies [39], and (4) performance-based comparison using cross-disciplinary indicators, followed by synthesis into planning implications (Scheme 1).
The workflow follows a sequential logic site selection and data compilation → hydraulic modelling → typology development → performance assessment → planning synthesis, while incorporating an explicit feedback loop between modelling and design stages to ensure hydraulic plausibility and model calibration. Hydraulic model calibration was verified against a reference flood event (2010), with calibration performance reported as the root mean square error (RMSE) [40], as detailed in Section 2.3.2.
Performance assessment combined hydraulically derived and planning-relevant indicators: maximum inundation depth (h_max), surface-water retention time (t_ret), a probabilistic building damage index (BDI), and operability-related criteria. Blue–green integration was evaluated via bioretention sensitivity, and sensitivity was examined under contrasting design events (Q50/Q500) with Monte Carlo sampling [41] of roughness ranges (n = 100), enabling stability assessment across hydrological conditions (Scheme 1). The final stage synthesised the results into a transferable decision matrix and implementation-oriented planning guidance.

2.3. Hydrodynamic Modelling

Flood dynamics were simulated using a one-dimensional unsteady-flow hydraulic model implemented in the Hydrologic Engineering Center’s River Analysis System (HEC-RAS, v6.0; hereafter referred to as HEC-RAS) [38]. For each case-study reach, a geometric model was built from airborne LiDAR-derived terrain data and site-specific cross-sections extracted along the main channel and, where applicable, across the adjacent floodplain [33]. Cross-section spacing and extent were selected to capture changes in valley geometry, floodplain connectivity, and hydraulic controls (e.g., constrictions, embankments, and terrace edges), while maintaining consistency across the three sites. Site-specific reach geometry was represented using cross-sections extracted along the main channel and, where applicable, across the adjacent floodplain. For Gdansk, 28 cross-sections were applied at a mean spacing of 75 m (local range: 25–150 m); for Torun, 35 cross-sections were applied at a mean spacing of 50 m (30–120 m); and for Tczew, 42 cross-sections were applied at a mean spacing of 60 m (20–200 m). This spacing was selected to capture major changes in valley geometry, terrace edges, embankments, and floodplain connectivity. Given the known sensitivity of HEC-RAS flood simulations to DEM resolution, the use of 0.5 m LiDAR data was intended to preserve local topographic controls relevant to floodplain conveyance, embankment representation, and inundation routing, while limiting generalisation errors associated with coarser terrain models [42].
Unsteady simulations were driven by design hydrographs representing 50-, 100-, and 500-year return periods (Q50/Q100/Q500). Frequency analysis was performed using IMGW-PIB records [34], following standard hydrological frequency analysis procedures commonly applied in Polish practice [43], from Gdansk (GDASTATION = 114100050, period: 1967–2024, 57 years), Torun (TORSTATION = 114120030, 1951–2024, 73 years), Tczew (TCZSTATION = 114110010, 1956–2024, 68 years), applying a Gumbel Type I distribution to annual maxima. Results: Gdansk Q50 = 1250, Q100 = 1650, Q500 = 2450 m3/s; Torun Q50 = 950, Q100 = 1250, Q500 = 1850 m3/s; Tczew Q50 = 1450, Q100 = 1900, Q500 = 2800 m3/s. The resulting hydrographs were imposed as upstream boundary conditions. Downstream boundary conditions were defined separately for each site, as detailed in Section 2.3.1.
Channel and floodplain roughness were parameterised using Manning’s n, assigned based on land-cover classes and adjusted within plausible ranges during calibration. Where local guidelines and reference values were available, they were used to constrain roughness selection. Hydraulic structures and anthropogenic modifications affecting conveyance (e.g., embankments and floodplain discontinuities) were represented in the geometry to the extent supported by available topographic and archival evidence.
Model performance was evaluated through calibration against the May–June 2010 flood event using RMSE-based comparison between simulated and observed water levels (see Section 2.3.2 for details). Following calibration, the model was run for Q50/Q100/Q500 events to produce spatially explicit water-surface elevations and inundation depth rasters. These outputs provided hazard inputs for subsequent typology assessment, including maximum inundation depth (h_max) and temporal descriptors used to derive surface-water retention time (t_ret) at the neighbourhood scale. A drained condition was defined as a water depth below 0.10 m across the plot (threshold per FEMA P-312 guidelines for evacuation and urban operability assessment; sensitivity tested at 0.05–0.15 m showed <5% variation in t_ret).

2.3.1. Roughness Parameterisation and Boundary Conditions

Manning’s roughness coefficients (n) were assigned to represent the spatial heterogeneity of hydraulic resistance in the main channel and floodplain, following the Polish hydraulic standard Instrukcja określania szorstkości koryt rzecznych i terenów zalewowych [44]. Higher n values indicate greater frictional resistance and typically yield higher simulated water levels and larger inundation extents for a given discharge. Roughness zones were delineated based on land cover and surface type (built-up/engineered, agricultural, grassed/vegetated, and riparian surfaces) to ensure consistent parameterisation across the three case-study settings. Channel roughness (n) was set within the range 0.025–0.040, while floodplain roughness was in the range 0.035–0.100, reflecting differences in vegetation density and urban surface complexity.
Boundary conditions were specified in a site-specific manner to reflect contrasting downstream controls. For Gdansk (deltaic–backwater setting), downstream water levels were defined by Baltic Sea mean level combined with a synthetic storm-surge stage curve derived through extreme value analysis to represent coastal backwater influence during high-water conditions. For the Gdansk deltaic–backwater setting, downstream water levels were defined by Baltic Sea stages derived from extreme value analysis of observations at the Władysławowo tide gauge (IMGW-PIB, 1977–2024). The resulting synthetic storm-surge stage curve was used as the downstream boundary condition for the 50-, 100-, and 500-year events, with design stages of 1.25 m, 1.65 m, and 2.30 m a.s.l., respectively. For Torun (Vistula–Drweca confluence) and Tczew (lower-river terrace setting), boundary conditions were defined using IMGW-PIB hydrometric monitoring data from the relevant gauging stations, consistent with national guidance for design-event hydrology. Upstream inflows were imposed as the design hydrographs (Q50/Q100/Q500), while downstream conditions were specified as stage–discharge relationships or observed stage time series, depending on data availability and reach characteristics.

2.3.2. Calibration and Model Outputs

Calibration was performed using observed water levels from the May–June 2010 flood event. Model parameters (primarily spatially varying Manning’s roughness) were adjusted within guideline-consistent ranges to reproduce observed stages and the longitudinal water-surface profile. Key parameter ranges, boundary conditions, and the calibration target are summarised in Table 2. Calibration performance was quantified as the RMSE between simulated and observed water levels at observation locations, achieving RMSE < 0.22 m, which was considered adequate for the scenario-based comparative assessment conducted in this study.
Following calibration, the model was run for the design events (Q50/Q100/Q500). Model outputs included spatially explicit maximum inundation depth and inundation extent rasters, velocity fields, and recession-time information, which were exported to GIS for subsequent analyses. GIS processing and hazard mapping were conducted using ArcGIS Pro 3.5 (Esri, Redlands, CA, USA). One-dimensional (1D) unsteady-flow modelling was selected as the primary approach due to the predominantly channel-controlled flood dynamics in the study reaches, where main-channel conveyance and longitudinal water-surface profiles dominate inundation extent and timing. While 2D or coupled 1D/2D models offer enhanced resolution of lateral flow redistribution and complex floodplain interactions, their substantially higher computational demands (typically 5–10× longer runtimes for equivalent mesh resolution) were deemed disproportionate for the planning-oriented comparative assessment across three sites and multiple return periods. The 1D approach provided adequate accuracy for typology suitability evaluation (calibrated RMSE = 0.22 m) and is consistent with Polish hydraulic practice for riverine flood mapping. These outputs served as hazard inputs for the building-scale performance assessment (e.g., depth-dependent damage metrics) and neighbourhood-scale diagnostics (e.g., surface-water retention and recession characteristics), ensuring consistent propagation of hydraulic results into the planning-oriented evaluation.

2.4. Development of Hydro-Adaptive Housing Typologies

Hydro-adaptive housing typologies were developed using a research-by-design approach supported by interdisciplinary workshops involving architecture and civil engineering. Three representative typologies were operationalised to cover an increasing spectrum of water-compatibility and buoyancy: elevated foundations (EF), amphibious dwellings (AM), and modular floating platforms (FP). The typologies were defined as transferable design logics rather than site-specific architectural projects, enabling consistent performance comparison across the three case-study settings. Within this framework, elevated–stilt and elevated–terp configurations were treated as subtypes of the EF category. Additional reference configurations are included in the Supplementary Materials for contextual illustration only and are not part of the core comparative assessment.
Typology selection and initial parameter bounds were informed by the contrasting watershed and planning conditions observed in the study areas (Table 3). The EF and AM solutions were prioritised where temporary inundation and shallow to moderate water-level fluctuations were expected and where continuity of land-based access and utilities remained feasible. FP solutions were considered for settings characterised by stronger backwater influence and larger water-level variability, provided that mooring, access, and service connections could be ensured under design events.
Parametric models were developed in Rhinoceros 7 (Robert McNeel & Associates, Seattle, WA, USA) [47] and Grasshopper 1.8 (Robert McNeel & Associates, Seattle, WA, USA) [48], with structural checks performed using Karamba3D 2.3.1 (Clemens Preisinger, Vienna, Austria, in cooperation with Bollinger und Grohmann ZT GmbH) [49]. For each typology, key geometric and buoyancy-related parameters (e.g., pontoon/float-box dimensions, displacement volume, draft, freeboard, and mooring constraints) were defined as variable inputs. Hydrostatic feasibility was evaluated under incremental water-level scenarios consistent with the hydraulic boundary conditions used in the flood simulations. The design criteria included (i) hydrostatic balance (displacement ≥ total load), (ii) an uplift safety factor > 1.3 under design conditions, and (iii) minimum freeboard to maintain operability during flooding. Hydrostatic feasibility was assessed by comparing the buoyant force at the design water level against the sum of permanent and imposed service loads for each typology. A minimum hydrostatic safety factor of 1.3 was adopted across typologies (uplift resistance ≥ 1.3 × total dead + live load under design water levels), as per Eurocode 7 and Dutch amphibious guidelines [46]. Load assumptions: dead load: 2.5 kN/m2 (structure + finishes), live load: 1.5 kN/m2 (occupancy + storage); full breakdown in Supplementary Materials (Table S1). Outputs from the parametric scripts included displacement, centre of mass, and mooring force estimates under increasing water levels, enabling coupling between hydraulic forcing and typology performance.
To standardise scenario testing, each typology was associated with a functional water-level range used in subsequent analyses (Table 4): EF (0–2 m), AM (0–4 m), and FP (1–5 m). These ranges were used to interpret suitability thresholds and to support the planning-oriented decision logic presented in the synthesis.

2.5. Performance Assessment and Indicators

Comparative effectiveness of the hydro-adaptive housing typologies was evaluated using four indicators capturing both hydraulic exposure and functional resilience. Unless stated otherwise, indicators were computed for the 100-year design event (Q100) as the reference scenario, with sensitivity checks conducted for Q50 and Q500.
  • Maximum façade inundation depth (h_max, m).
For each building/plot, h_max was defined as the maximum simulated water depth at the building perimeter during a given design event. Values were extracted from the HEC-RAS-derived maximum water-surface elevation/inundation depth rasters at the footprint/perimeter zone and reported as peak depth (m).
2.
Surface-water retention time (t_ret, h).
t_ret was defined as the duration between the time of peak inundation and the time when the plot returned to a “drained” condition (i.e., water depth below a predefined threshold), operationalised as water depth falling below 0.10 m. This threshold was adopted to represent residual surface water no longer significantly constraining plot-scale access and operability.
3.
Building Damage Index (BDI, 0–1).
BDI was calculated as a probabilistic, asset-weighted damage metric adapted from depth–damage/flood-loss estimation logic (FEMA/HAZUS-type approach). BDI was computed as a normalised weighted aggregate of depth-dependent component damage ratios. For each building component, a depth-related damage ratio was assigned and multiplied by its weighting coefficient; the weighted values were then summed and normalised to a 0–1 scale, where 0 indicates negligible damage and 1 indicates total loss. The component set, weighting scheme, and full curve library are provided in the Supplementary Materials, which provide the full methodological details (Tables S1–S4 and Figure S1). While derived from the FEMA/HAZUS methodology calibrated for U.S. residential structures, the functions were adapted for a Central European typology through adjustment of foundation/structure weighting to reflect typical Polish masonry construction and slab-on-grade prevalence. Sensitivity to curve localisation was tested with ±20% content value scaling, yielding a BDI uncertainty < 12% for design events [50]. To improve European contextual relevance, the adapted FEMA/HAZUS-type logic was interpreted with reference to the JRC global flood depth–damage database, including the country-specific damage context for Poland [51]. BDI was adapted from FEMA/HAZUS-MH v4.2 (USA), calibrated for Polish residential contexts (brick/concrete, 2–3 stories). Depth–damage curves: foundations (0–100% for 0–1.5 m), load-bearing walls (20–80% for 0.5–3.0 m), and finishes (50–95% for 1.0–2.0 m). Component weights: structure: 60%, finishes: 25%, systems: 15%. Normalisation: relative loss [%] vs. replacement value (1800 PLN/m2). The adopted BDI parameterisation is summarised in Table 5. Additional details are provided in Supplementary Table S2.
4.
Operability (binary, 1/0).
Operability was coded as a binary indicator denoting whether a dwelling remained habitable/functional throughout the flood-event duration (1 = operable; 0 = disrupted). The classification accounted for threshold exceedance relevant to access and basic services (e.g., sustained inundation at entries, utility points, or circulation constraints), as specified in the typology ruleset.

2.6. Blue–Green Infrastructure Integration

Blue–green infrastructure (BGI) measures were incorporated as supporting scenario-based interventions to assess whether plot- and neighbourhood-scale retention elements modify inundation recession behaviour and related performance indicators under the same hydraulic forcing.
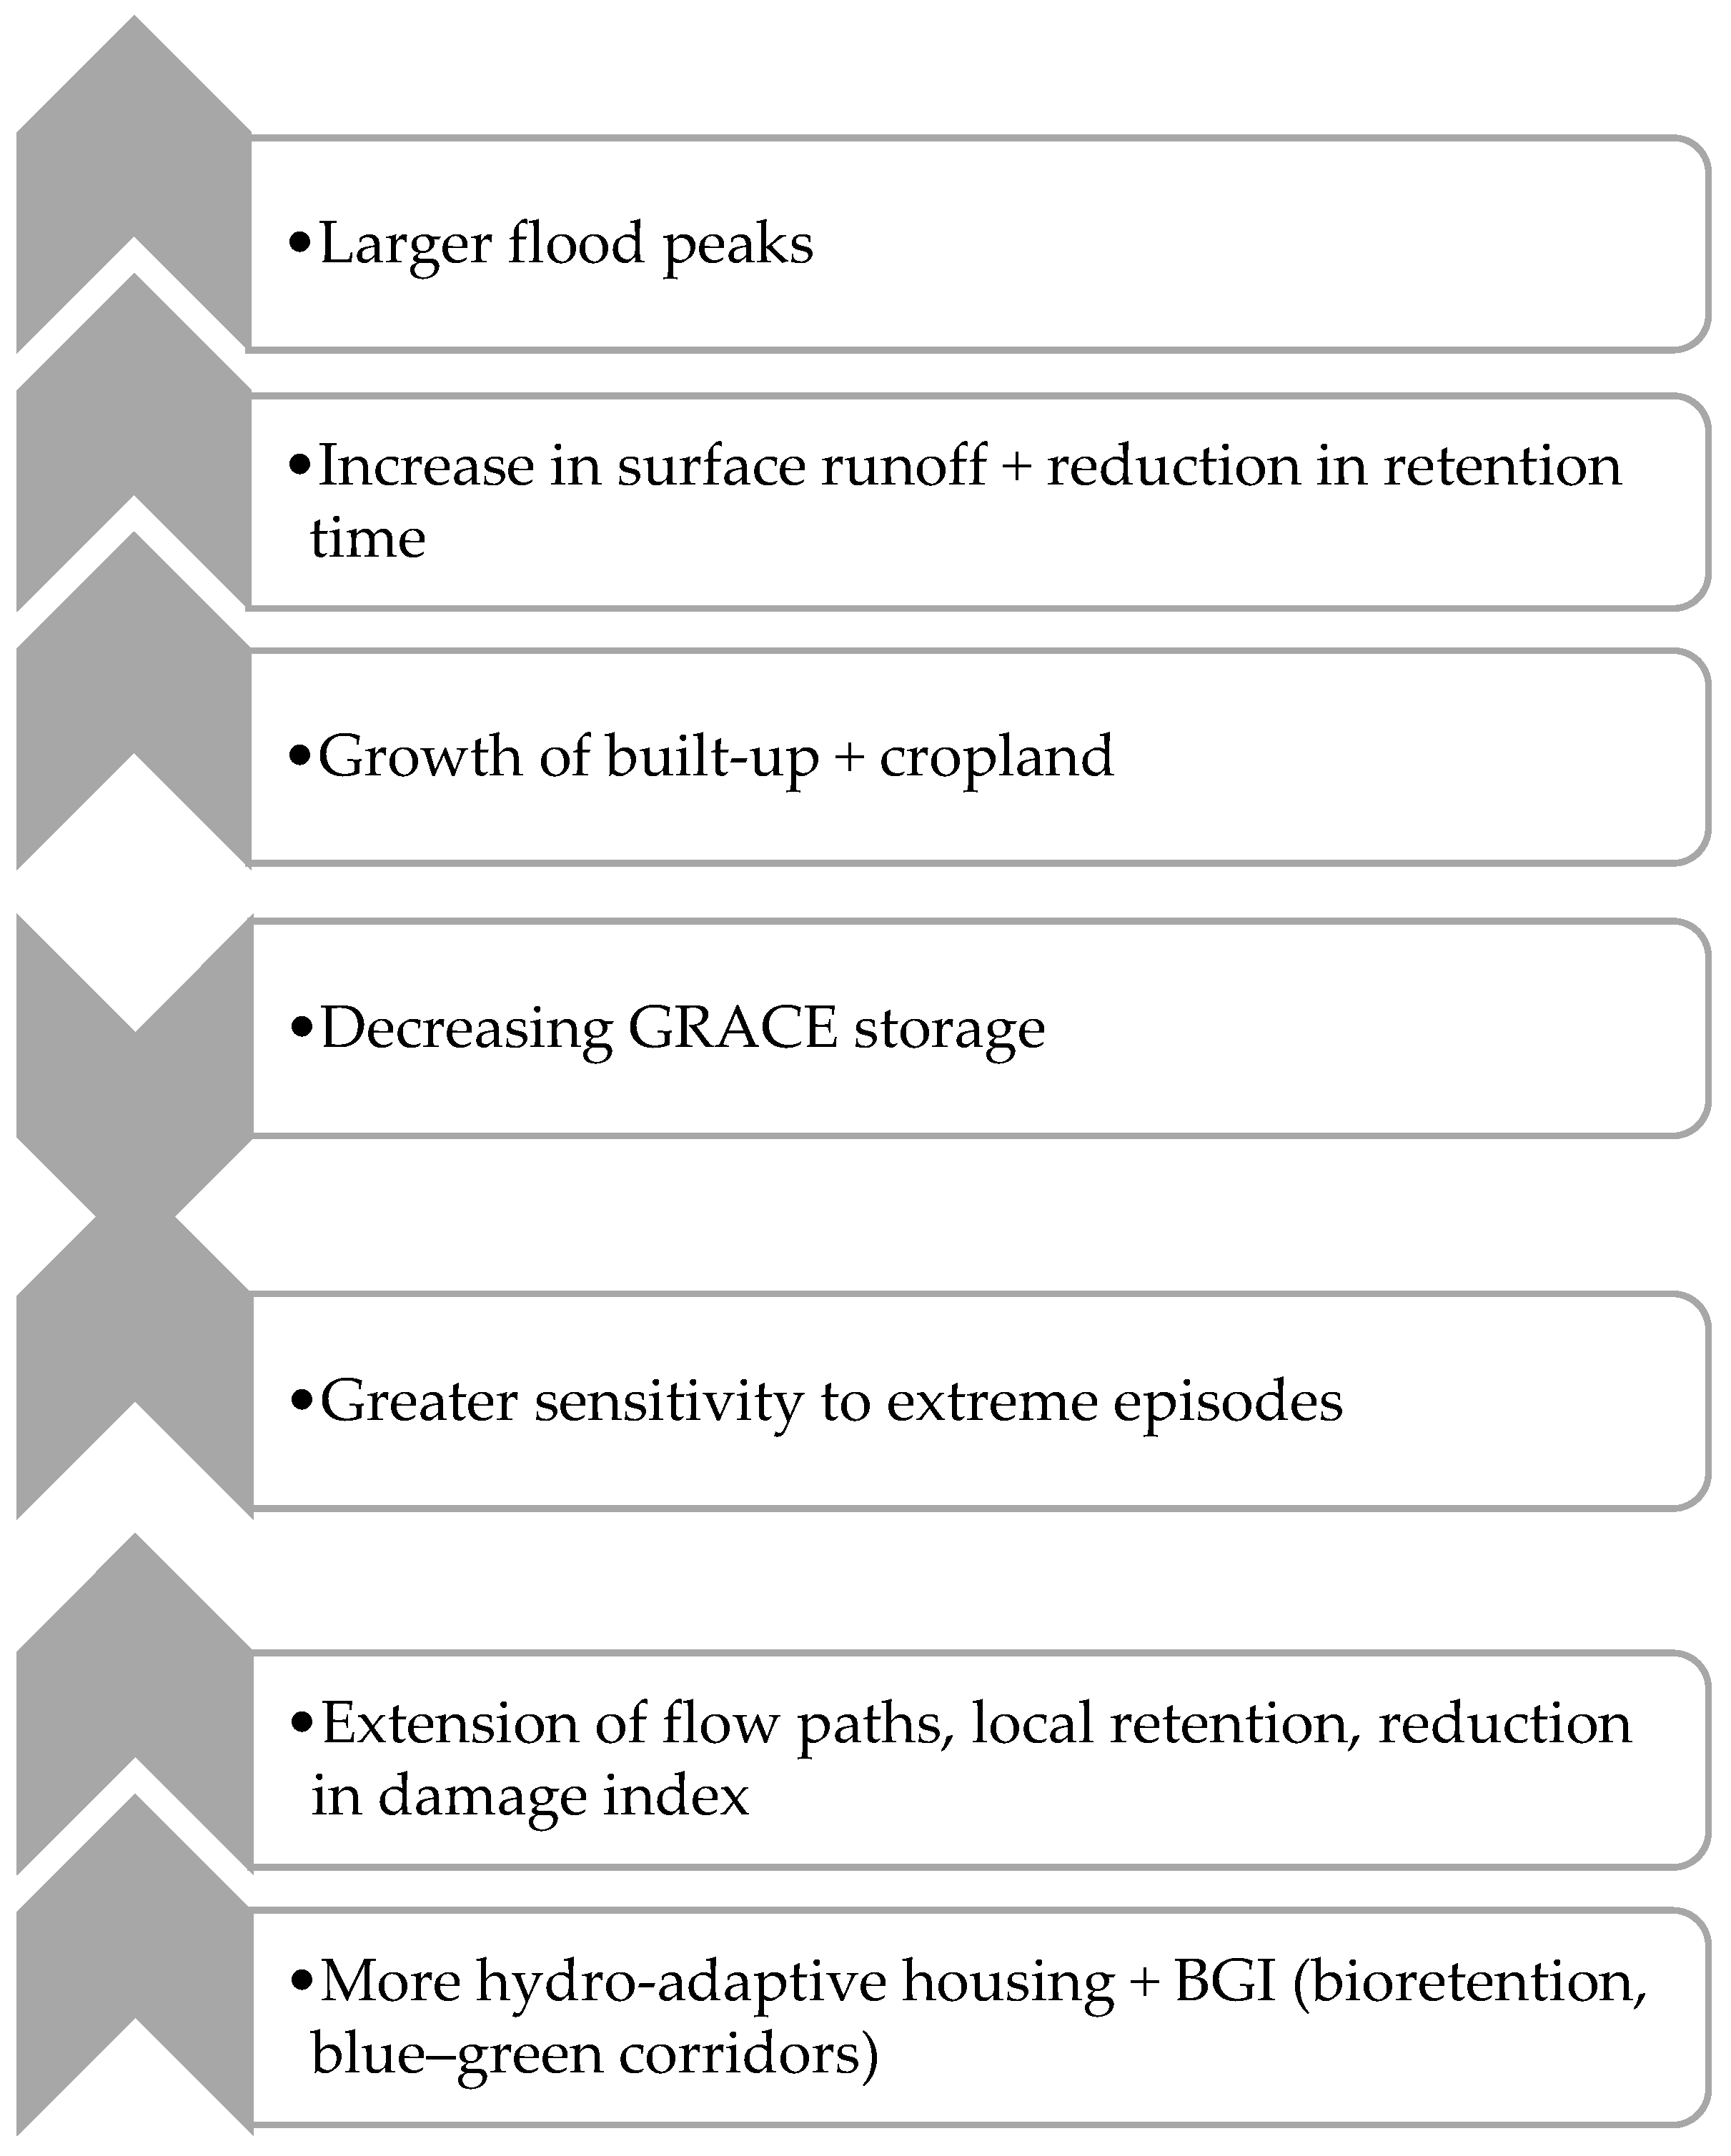
Two BGI components were considered: (i) on-plot bioretention (infiltration/temporary storage at parcel level) and (ii) neighbourhood-scale blue–green corridors supporting extended flow paths and distributed surface retention. BGI was implemented as a set of parameterised scenarios coupled to the hydraulic–typology workflow (Figure 5). For each site and design event, baseline simulations (no BGI) were compared against BGI scenarios, and the effect was quantified using changes in surface-water retention time (t_ret) and downstream indicators derived from the hazard layers (including BDI and operability where applicable). Sensitivity testing was performed under contrasting magnitudes (Q50/Q500), using Monte Carlo sampling (n = 100) to represent uncertainty in key hydraulic parameters (primarily roughness ranges) and to evaluate the stability of BGI effects across plausible conditions.
Figure 5 provides a conceptual representation of the hypothesised pathway linking catchment/land-cover pressures and flood response, and the role of combined hydro-adaptive housing and BGI measures in modifying local retention and exposure conditions.

2.7. Scenario Structure and Sensitivity Analysis

Scenario testing followed a factorial structure combining three design-event magnitudes (Q50, Q100, and Q500), three hydro-adaptive typologies (EF, AM, and FP), and three case-study settings (Gdansk, Torun, and Tczew). The Q100 event served as the reference baseline for cross-typology comparison, while Q50 and Q500 were used to examine the consistency of typology performance under lower and extreme forcing and to test sensitivity to exceedance of functional water-level ranges and operability constraints (Table 4). Sensitivity analysis accounted for hydraulic parameter uncertainty via Monte Carlo sampling (n = 100 realisations per site–event–typology combination). Manning’s n values were perturbed uniformly within ±10% for channels (calibrated baseline: 0.025–0.040 → perturbation range: 0.0225–0.044) and ±15% for floodplains (baseline: 0.035–0.100 → 0.0298–0.115), reflecting typical observational uncertainty in land-cover-based parameterisation (e.g., vegetation density and surface roughness variability). For each realisation, full unsteady-flow simulations were re-run, with outputs (h_max and t_ret) propagated to performance indicators (BDI and operability). Results were summarised as medians ± IQRs, confirming typology ranking stability (e.g., AM > EF across 92% of Gdansk Q100 samples).

2.8. Data, Code, and Materials Availability

Hydrological inputs were derived from monitoring records of the Polish Institute of Meteorology and Water Management—National Research Institute (IMGW-PIB) and processed using nationally adopted hydrological procedures described in Section 2.3. Topographic inputs (terrain models and geometric representations of the study reaches) were derived from airborne LiDAR (ALS) elevation data, while historical flood documentation was used to support the selection and interpretation of the reference event applied for model calibration. Baseline watershed descriptors were compiled from Global Watersheds reporting products, as summarised in the baseline dataset document.

3. Results

This section reports the hydrodynamic simulation outputs and the performance of the three hydro-adaptive housing typologies across the study sites under the Q50, Q100, and Q500 design events. The results are organised in four sections. Firstly, the hydrological characteristics of the test areas under 50-, 100-, and 500-year return periods are considered. Secondly, a comparative evaluation of elevated foundations, amphibious dwellings, and modular floating platforms is presented. Thirdly, the implications of integrating such housing with neighbourhood-scale water management are explored. Finally, sensitivity and uncertainty are assessed to support interpretation of performance differences across sites and event magnitudes.

3.1. Hydrodynamic Simulation Findings

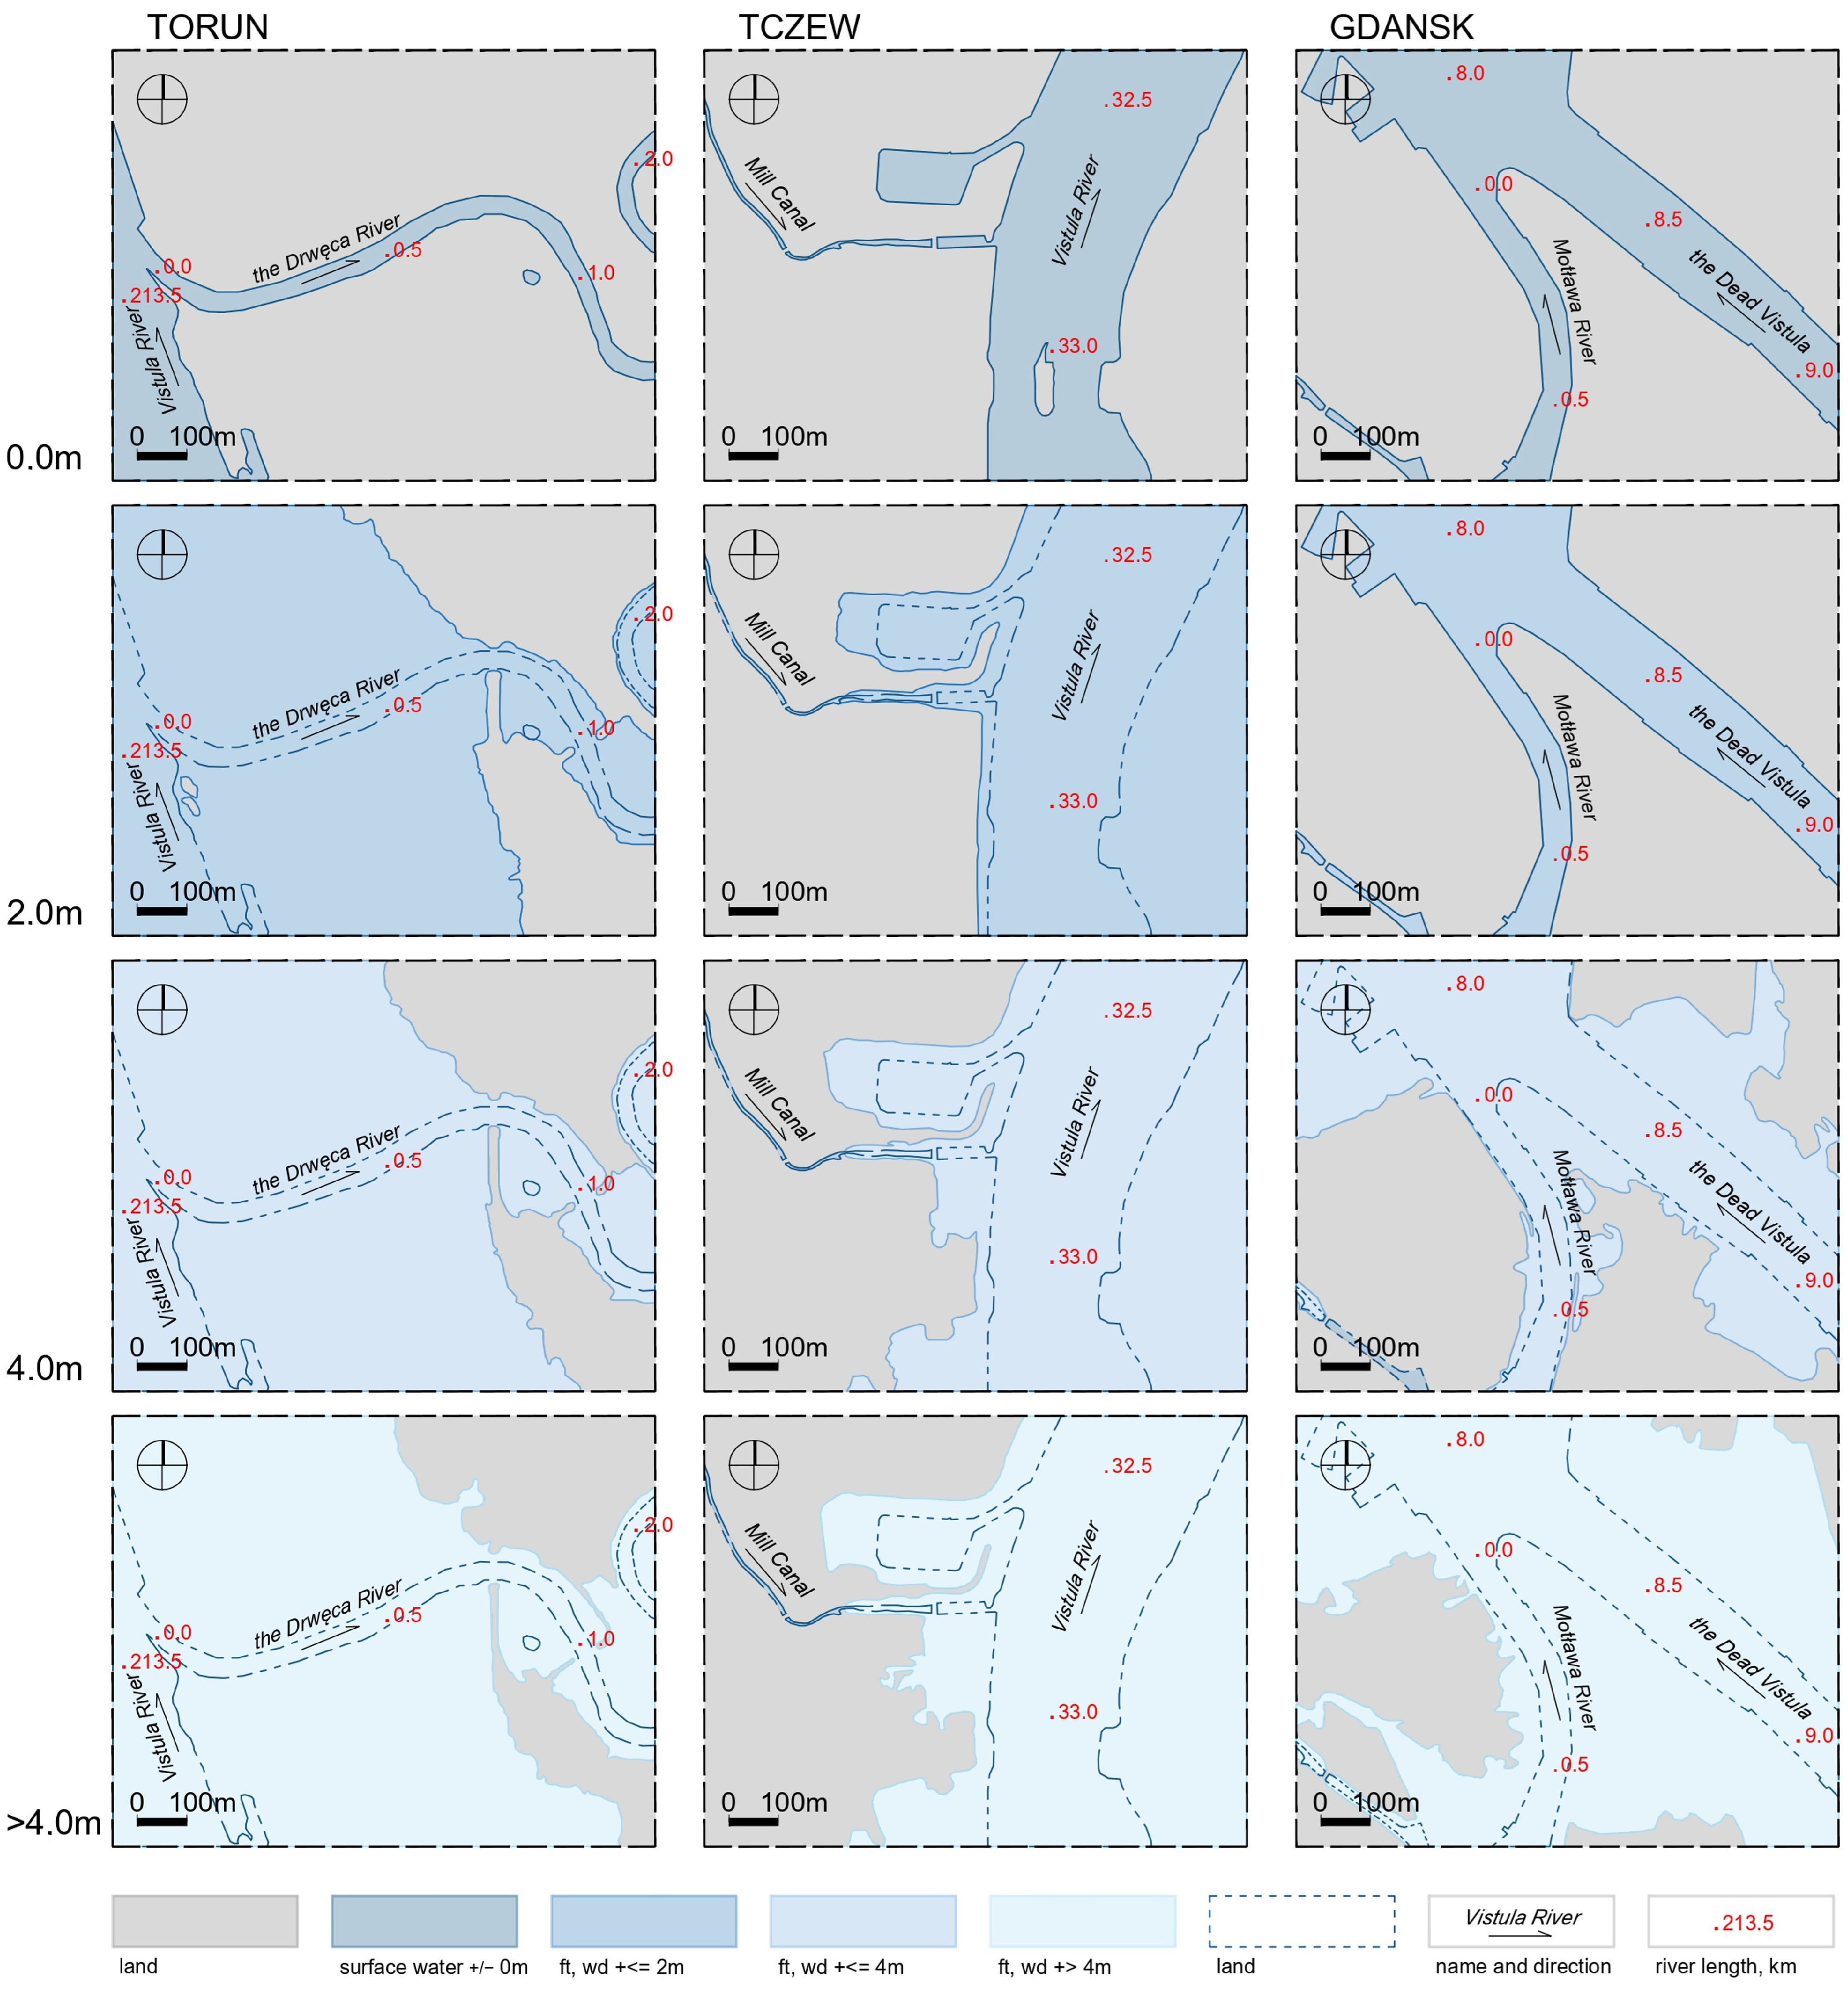
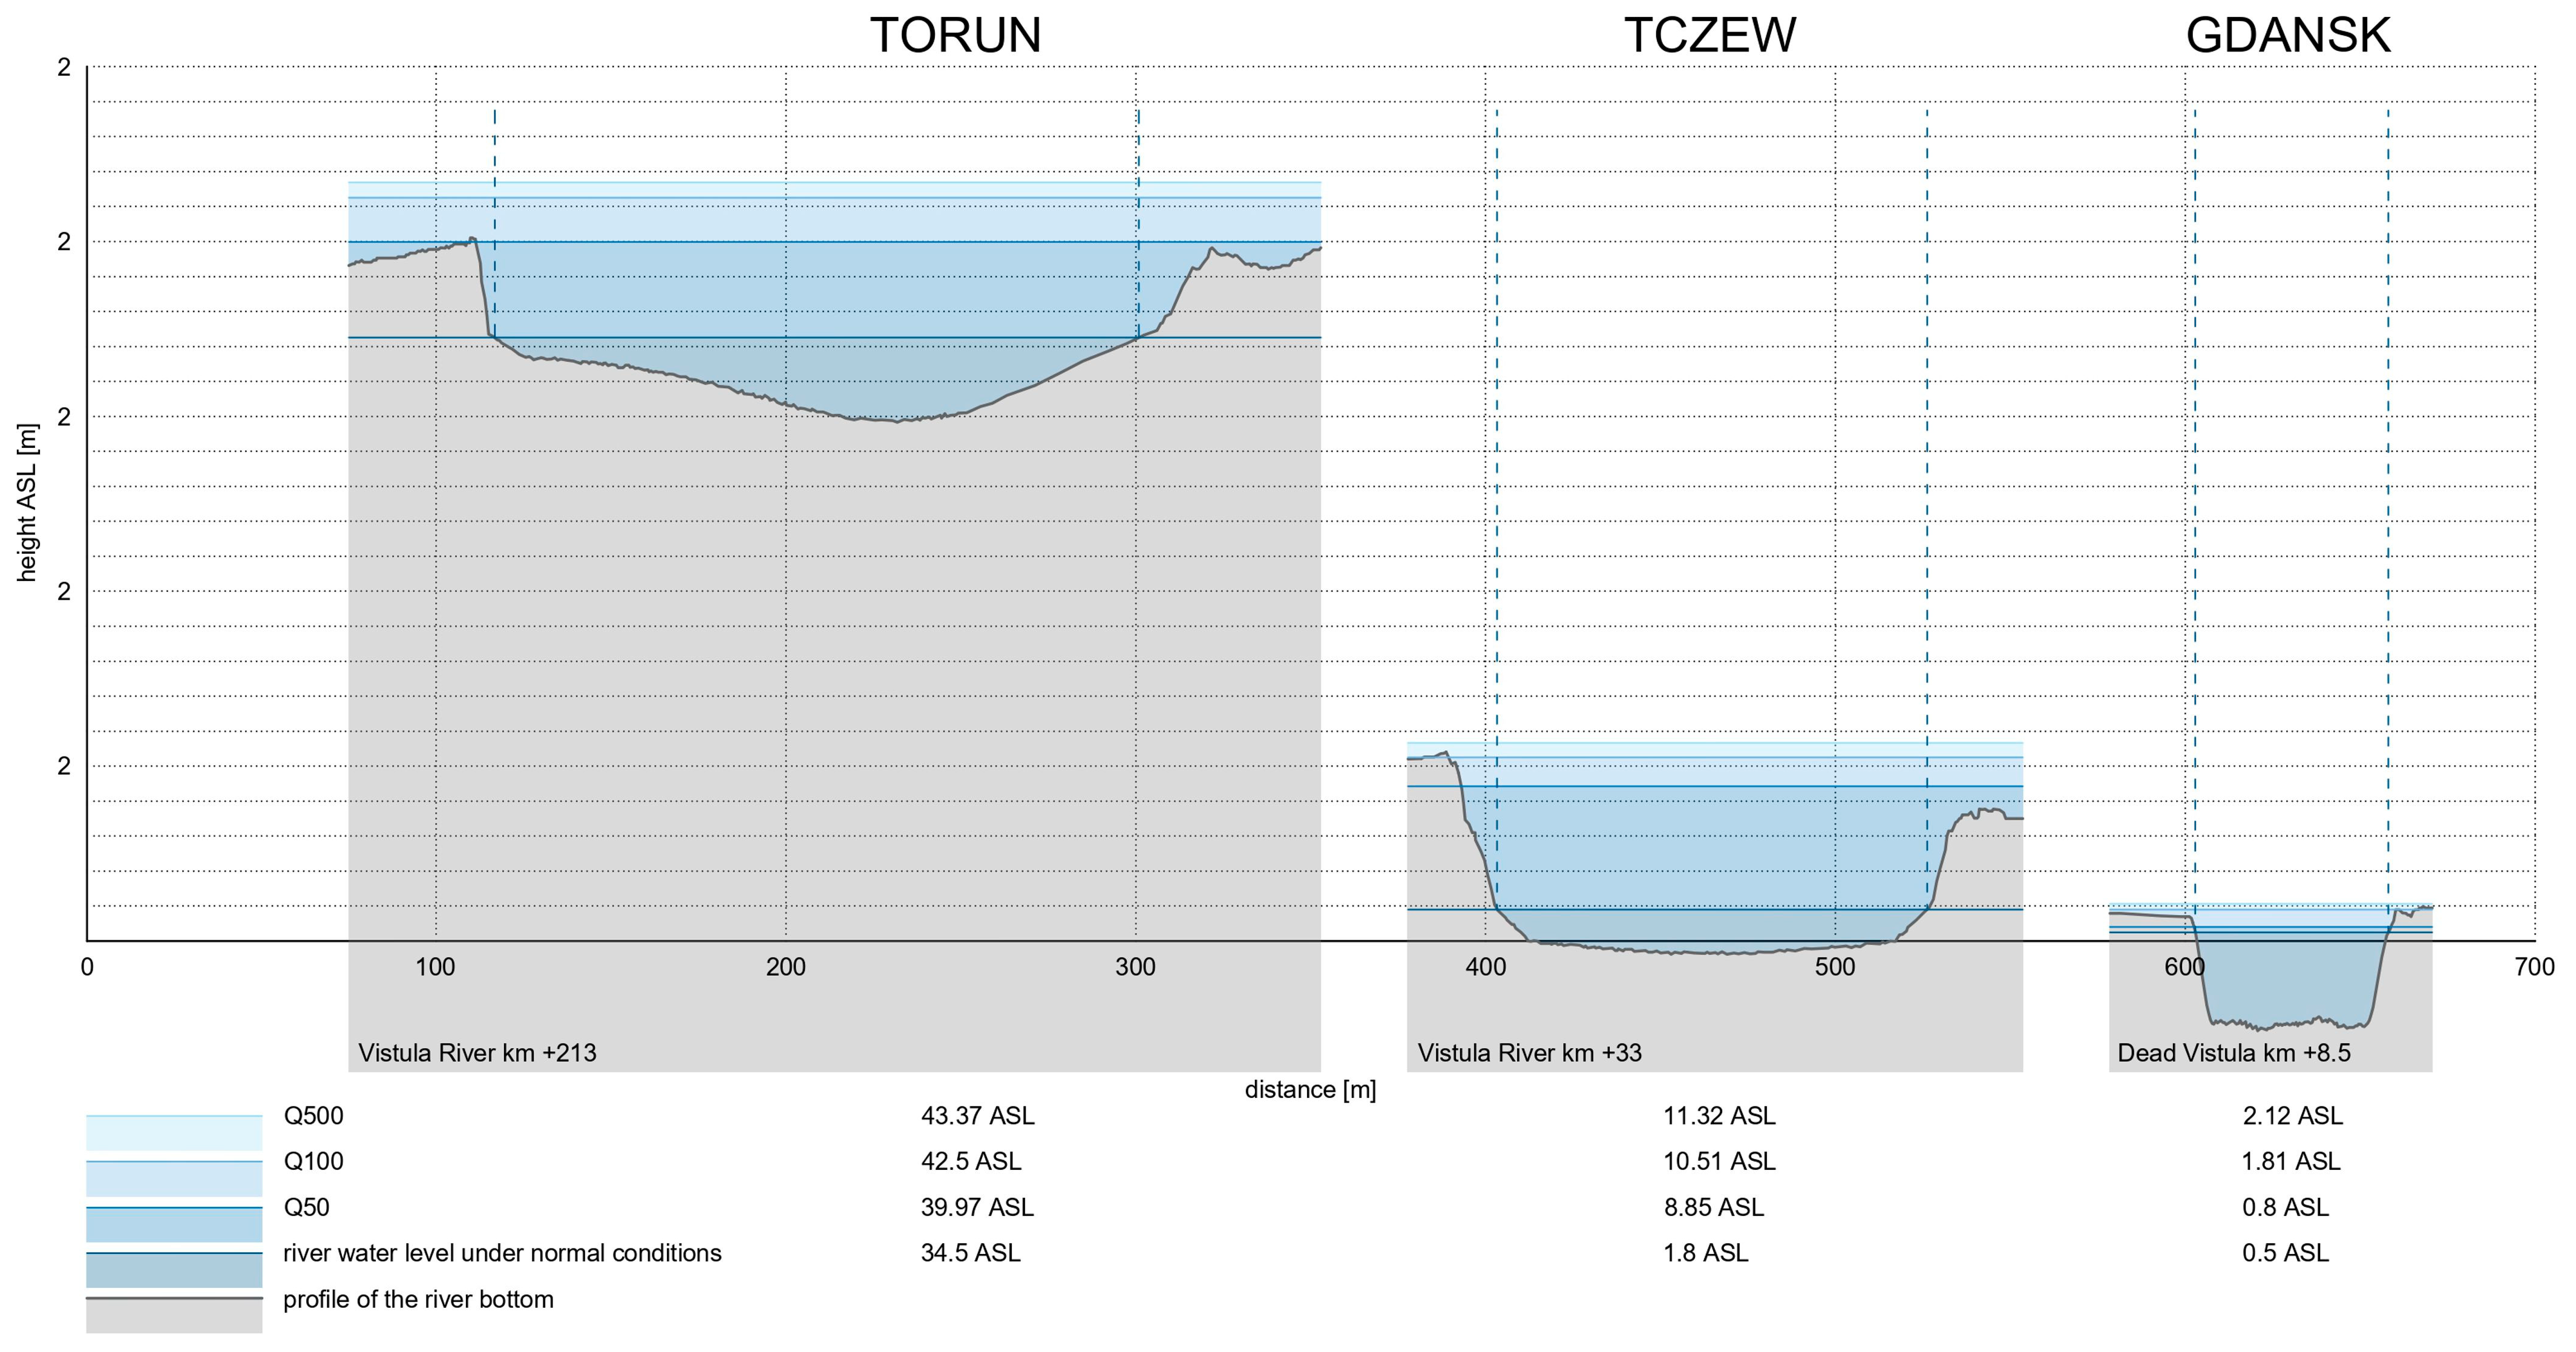
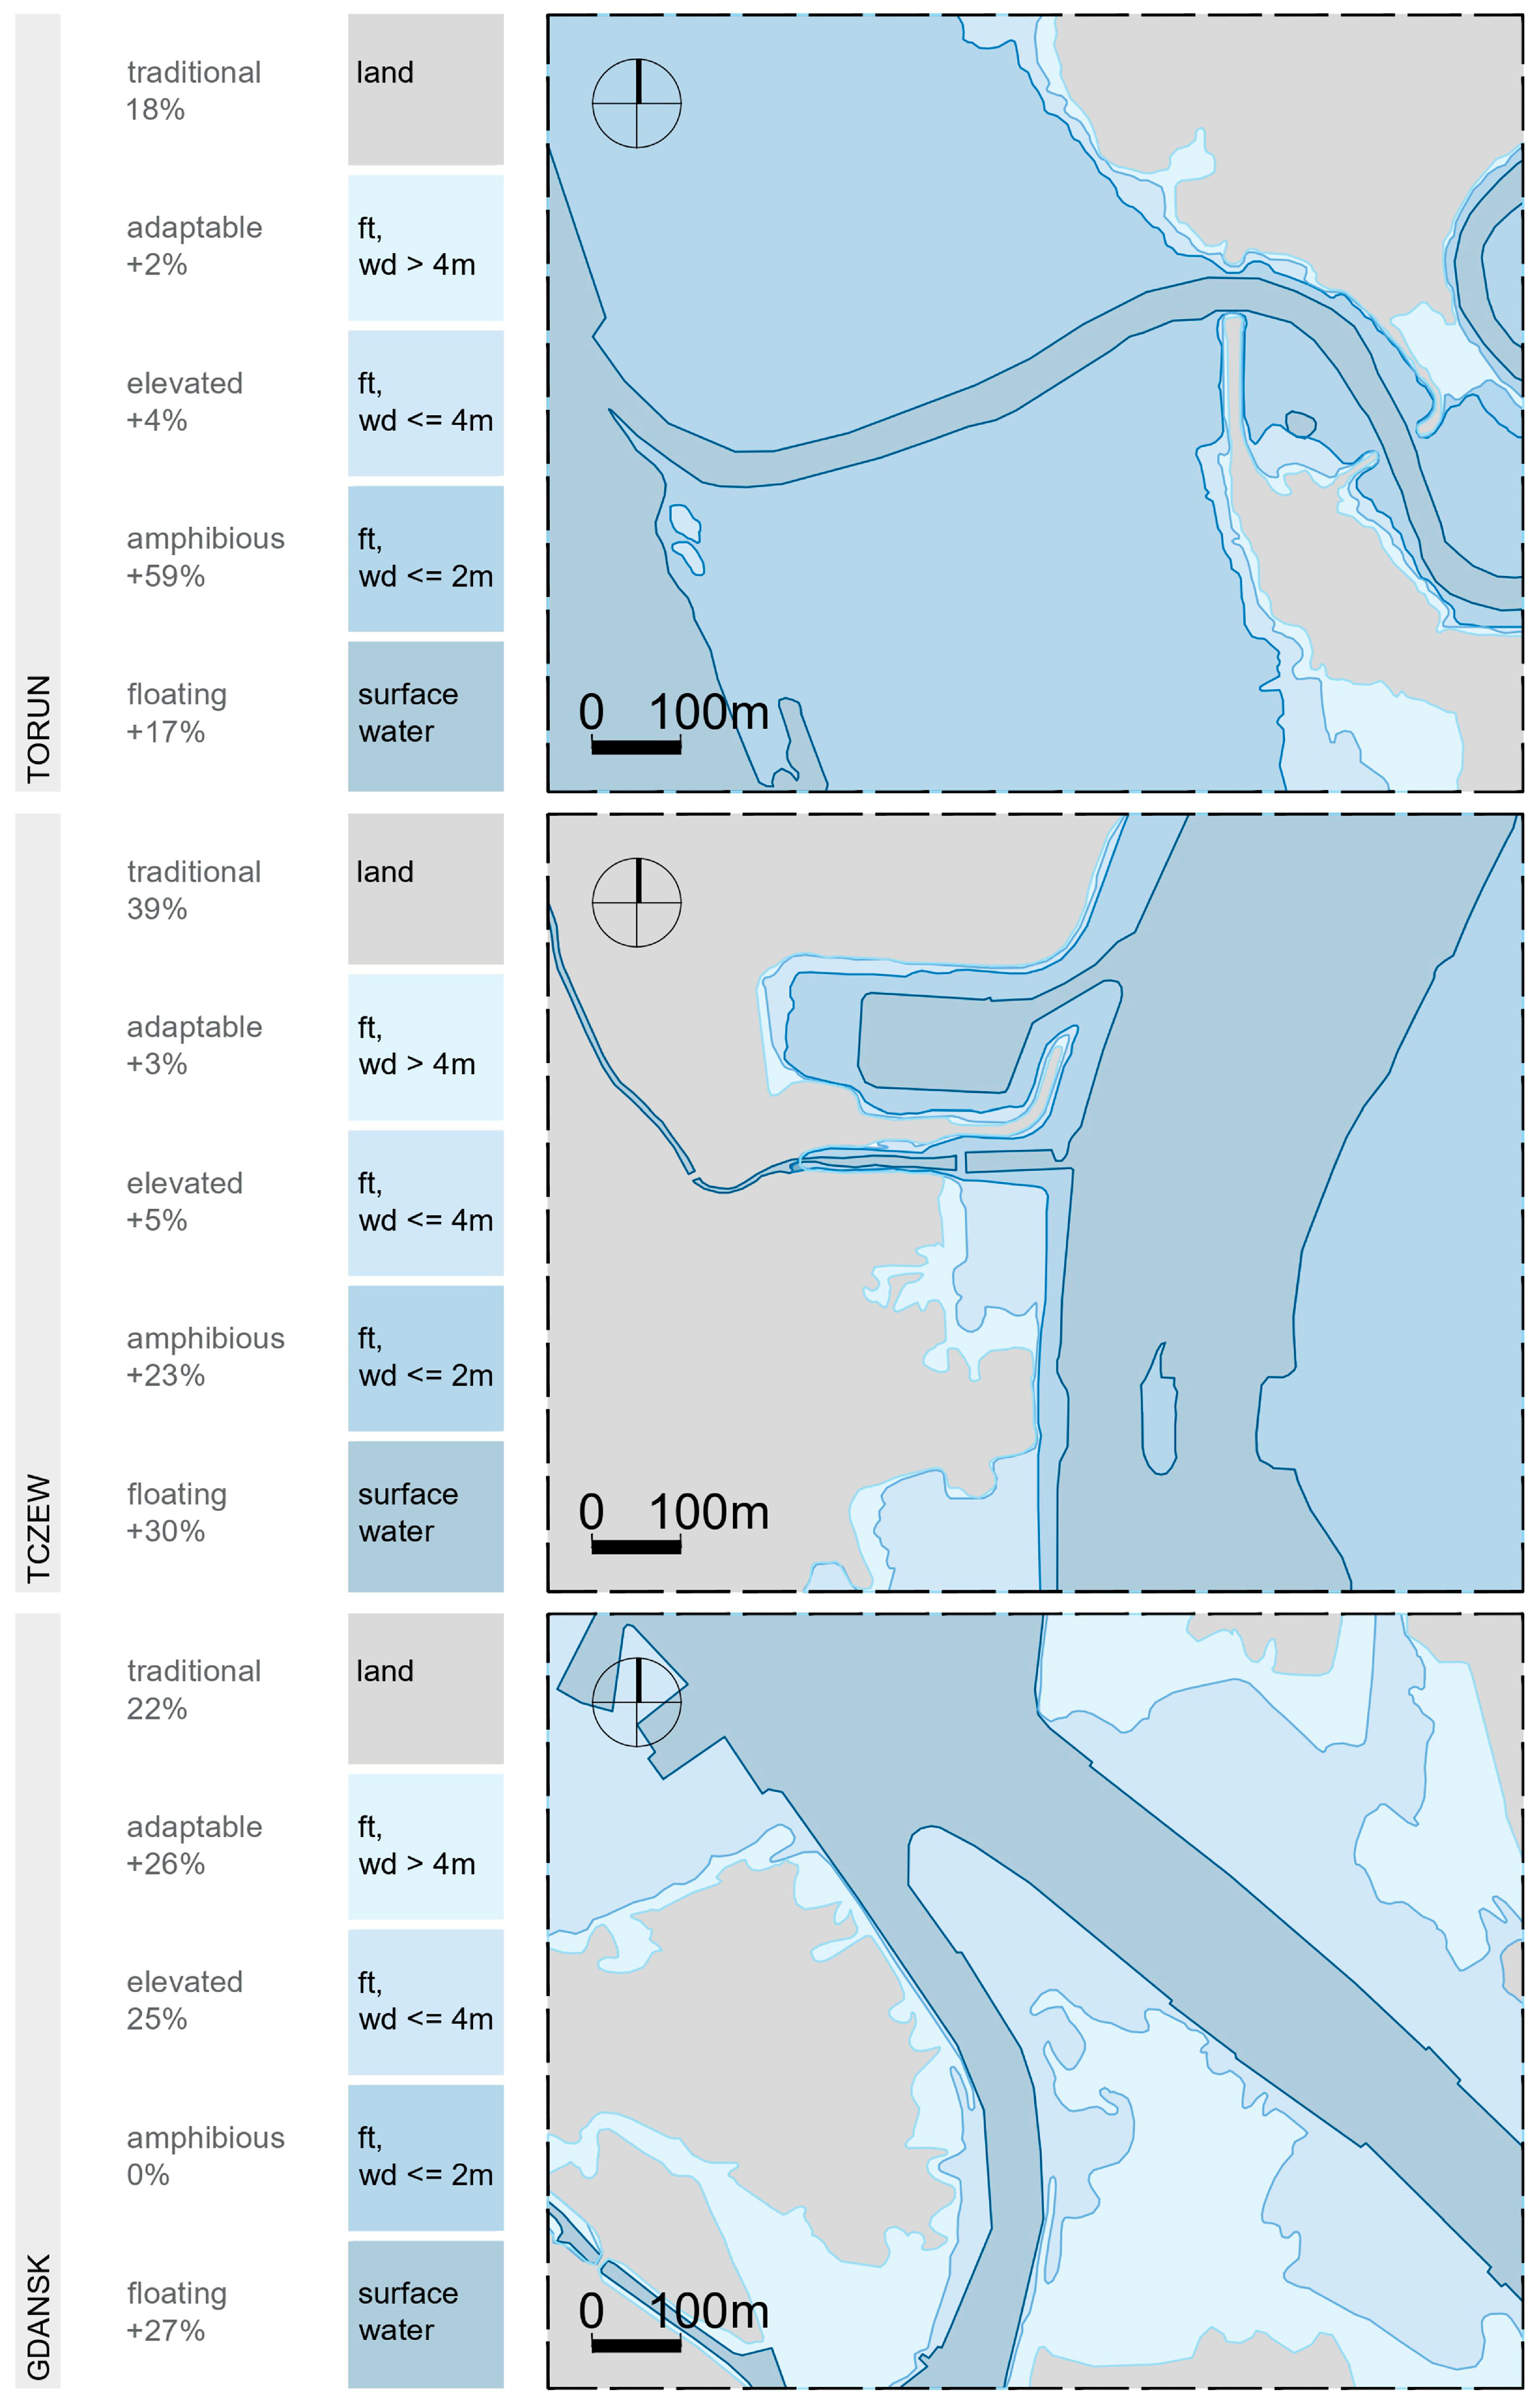
Hydrodynamic simulations revealed substantial variability in flood behaviour across the three study sites (Table 4). Maximum inundation depths ranged from 1.8 to 4.8 m, retention times from 36 to 96 h, and affected areas from 8 to 32%. As demonstrated in Figure 6, which illustrates the inundation extent for Torun, Tczew, and Gdansk under incremental flood scenarios, there is a clear progression in exposure as water levels rise from 2.0 m to above 5.0 m in comparison to natural conditions. Figure 7 further contextualises these differences by showing hydrographic cross-sections of the Vistula River at the three sites, highlighting channel morphology and characteristic water levels under Q50, Q100, and Q500 design conditions. Figure 6 shows simulated inundation extents for Torun (Kaszczorek; Vistula–Drweca confluence), Tczew (Nadwiślańskie terraces), and Gdansk (Polski Hak) under incremental water-level rise scenarios of 0 m (Q100 baseline), +2 m, +4 m, and +5 m. The scenarios highlight distinct exposure gradients across sites and provide the hydraulic context for the typology comparison in Section 3.2 (EF: 0–2 m; AM: 0–4 m; FP: 1–5 m).
Figure 7 presents representative hydrographic cross-sections through the three case-study sites—Torun (Kaszczorek), Tczew (Nadwiślańskie terraces), and Gdansk (Polski Hak)—illustrating riverbed morphology (grey) alongside water-surface profiles for normal flow (black line), Q50 (dark blue), Q100 (blue), and Q500 (light blue) design discharges. The cross-sections reveal characteristic hydraulic geometries: Torun’s wide, shallow confluence channel prone to lateral spilling; Tczew’s incised terrace with rapid depth increase under high flows; and Gdansk’s deltaic–backwater profile showing gradual floodplain expansion under elevated downstream stages. Such cross-sectional variability underpins site-specific hazard profiles and supports interpretation of typology suitability thresholds (EF/AM/FP; Table 3).
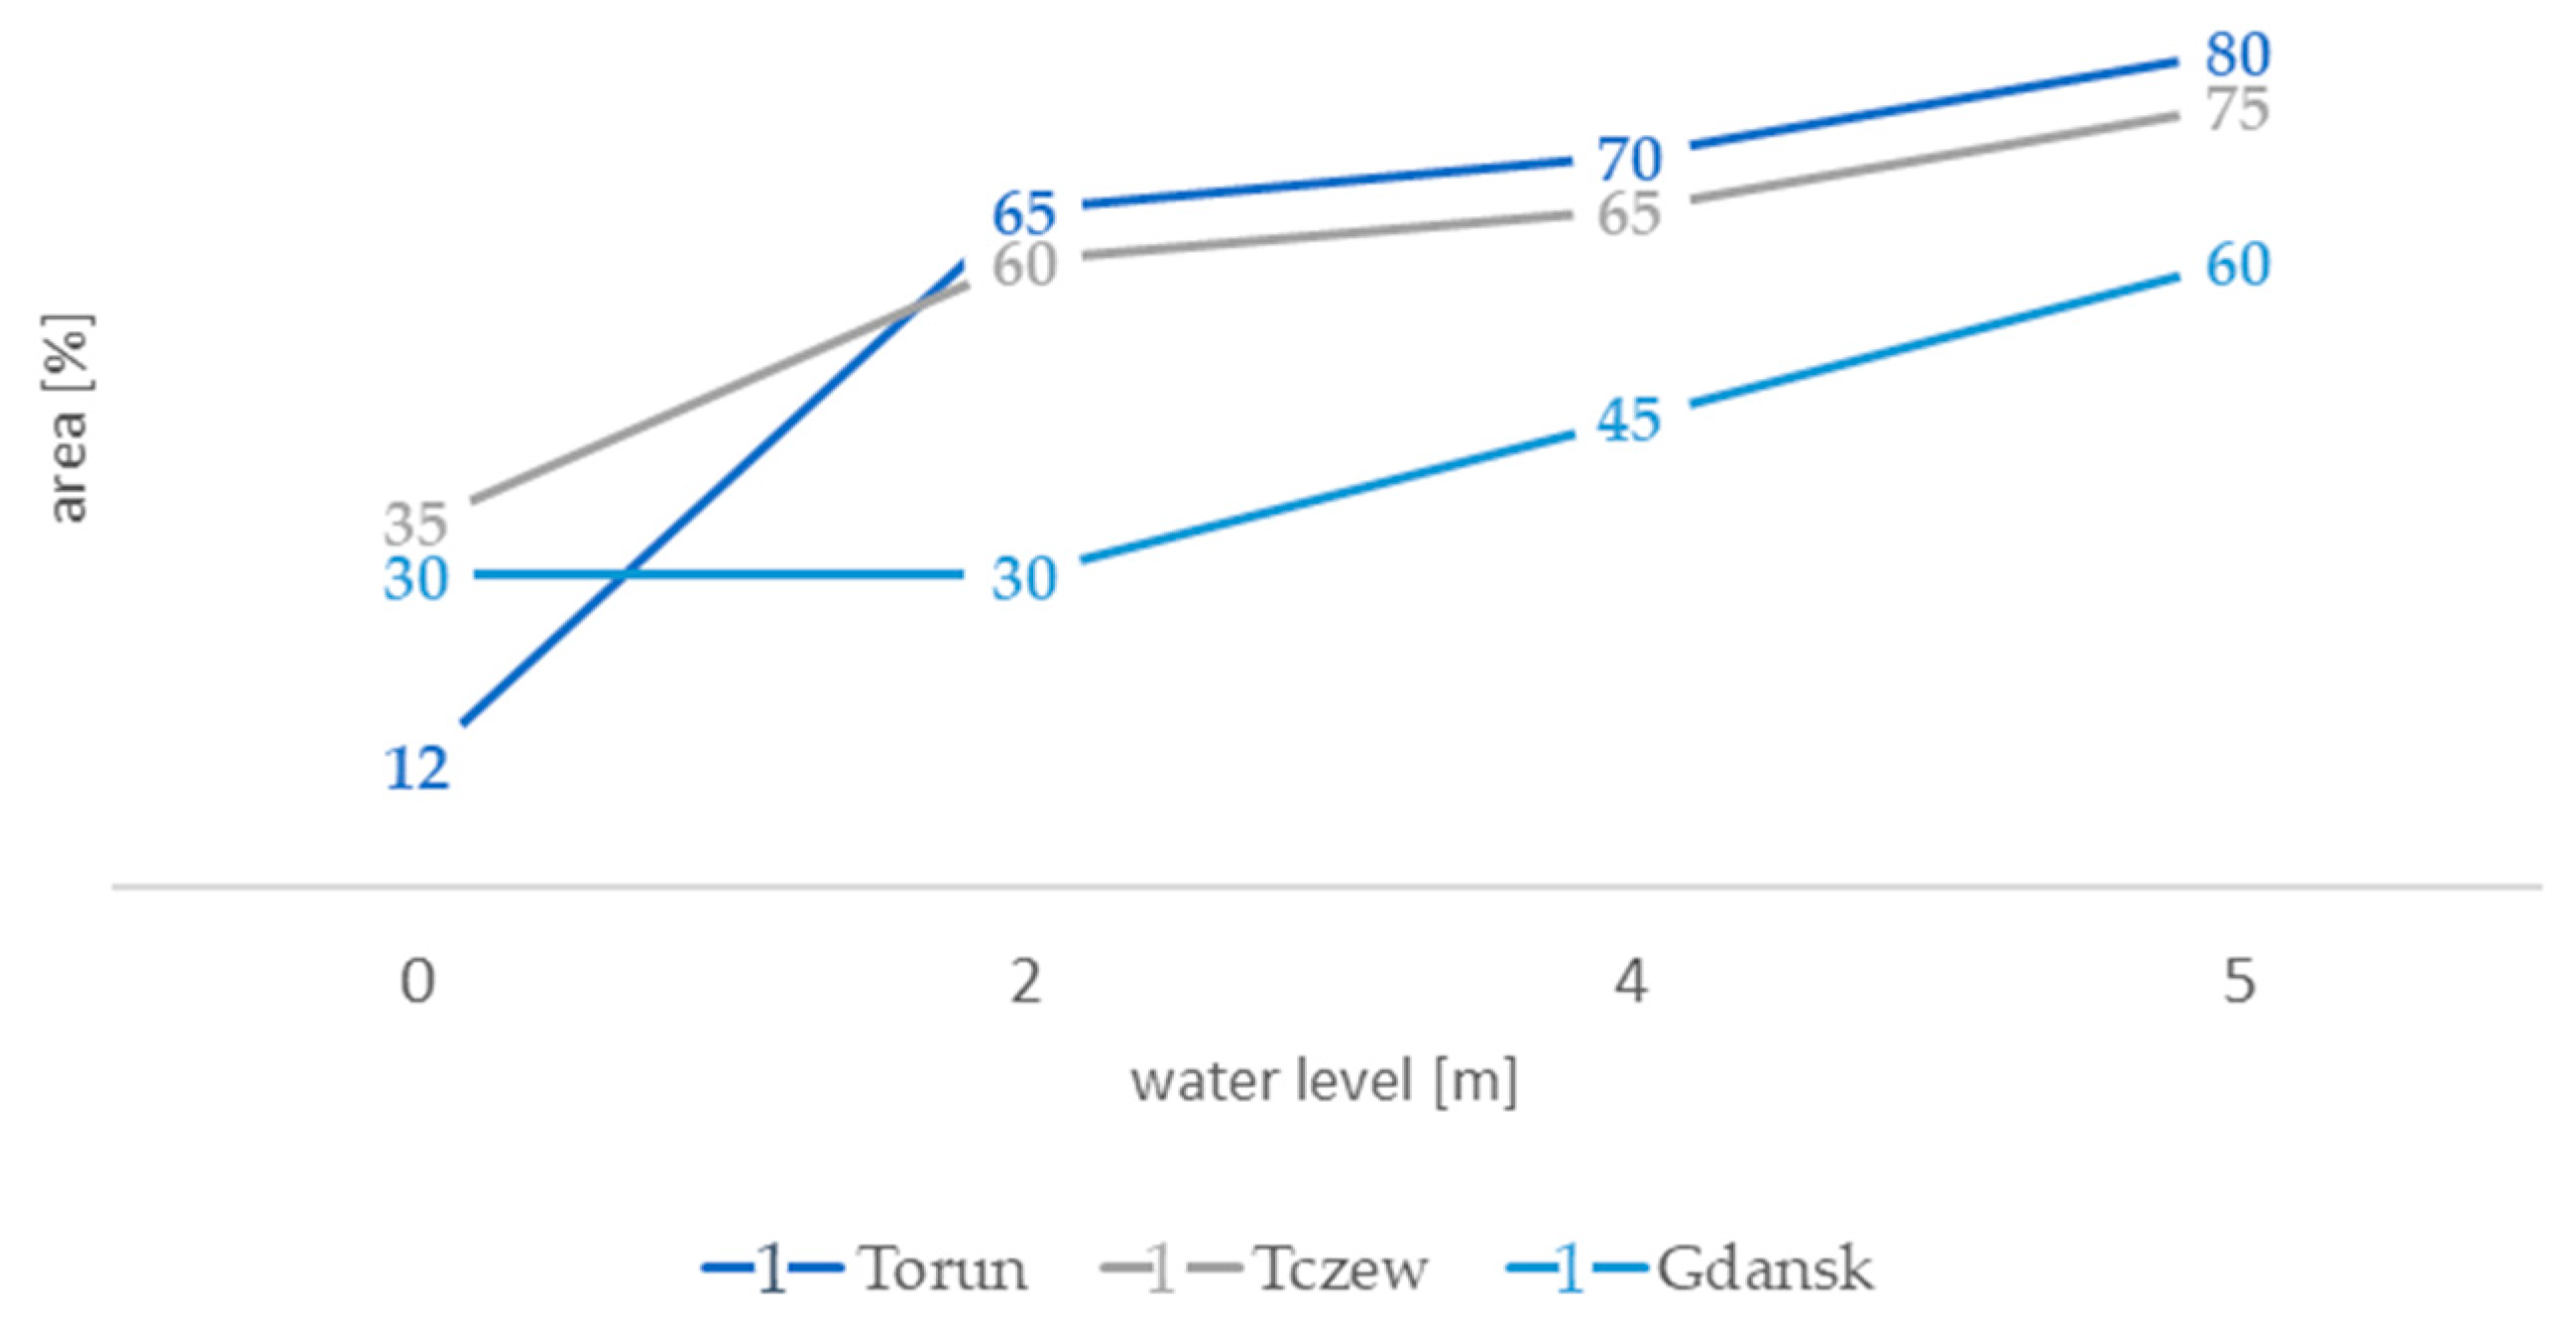
While Figure 6 illustrates the spatial extent of inundation, Figure 8 quantifies the proportion of land area affected at each site. The results reveal that flood exposure in Torun increases most sharply between 0 and 2 m, whereas Gdansk shows a more gradual rise and Tczew follows an intermediate pattern. Figure 8 quantifies the non-linear sensitivity of flood exposure across the three case-study sites, plotting the percentage of inundated area within predefined site boundaries as water levels rise incrementally from the Q100 baseline (0 m) to +5 m. The trends highlight Gdansk’s rapid deltaic expansion (12% to ~75%), Tczew’s pronounced terrace saturation (>65% at +2 m), and Torun’s moderated confluence response (~35–60%). These exposure gradients provide a quantitative basis for comparing typology performance across sites in Section 3.2.
In Gdansk (Polski Hak), maximum inundation depths during the 100-year event exceeded 3.0 m. The combination of riverine inflows with storm-surge backwater effects generated compound flooding, which not only increased peak water levels but also prolonged flood recession, with standing water persisting for several days in the lowest-lying areas. In Torun (Kaszczorek), modelled flood depths were lower, in the range of 2.0–2.5 m, but hydraulic dynamics differed markedly. The constricted inner meander bend of the Vistula created zones of accelerated flow, resulting in higher modelled velocities and implying increased local erosion potential and erosion of embankments. These conditions imply that, despite moderate depths, structural vulnerability could be amplified by high flow velocities.
Tczew, situated on Nadwiślańskie terraces downstream of the delta headwaters, displayed the most severe flood hazard. Under 500-year design conditions, maximum inundation depths reached 4.8 m. Temporal recession curves showed that drainage from the terraces could require more than 96 h, reflecting the combination of low-gradient topography and limited natural drainage capacity. Extended stagnation periods at this site highlight the risk of prolonged infrastructure disruption, waterlogging of soils, and increased damage to buildings due to persistent saturation. Key hydrodynamic outputs are summarised in Table 6.
The results show marked between-site differences in maximum inundation depth, affected land area, and retention time across the design events. In Gdansk, compound surge–river interactions produce deep inundation, with simulated depths exceeding 4.0 m under the Q500 scenario. Tczew exhibits the most severe conditions, with retention times exceeding 96 h and some of the highest simulated peak water levels across the study. In contrast, Torun is characterised by lower inundation depths but higher modelled flow velocities, resulting in shorter, although still disruptive, retention times.
Overall, the simulations indicate marked contrasts between the study areas: compound flood interactions in Gdansk; velocity-driven hazards in Torun; and deep, long-lasting inundation in Tczew.

3.2. Performance of Hydro-Adaptive Housing Typologies

Evaluation of the three hydro-adaptive housing typologies demonstrated distinct performance characteristics. Elevated foundations (EF) proved effective in reducing damage for shallow to moderate flooding (≤2.0 m), lowering the BDI by 35–40% compared to slab-on-grade housing. Their protective capacity, however, diminished rapidly under higher flood scenarios once freeboard thresholds were exceeded.
Amphibious dwellings (AM) offered greater adaptability, achieving reductions in BDI of up to 62% under 100-year events in Torun. Their guided elevating frames enabled habitability to be maintained up to approximately 4.0 m of flood depth, extending the functional range beyond EF in this study. Modular floating platforms (FP) displayed the highest level of resilience, remaining operable under water-level rises exceeding 5.0 m and consistently reaching near-zero BDI values across all scenarios.
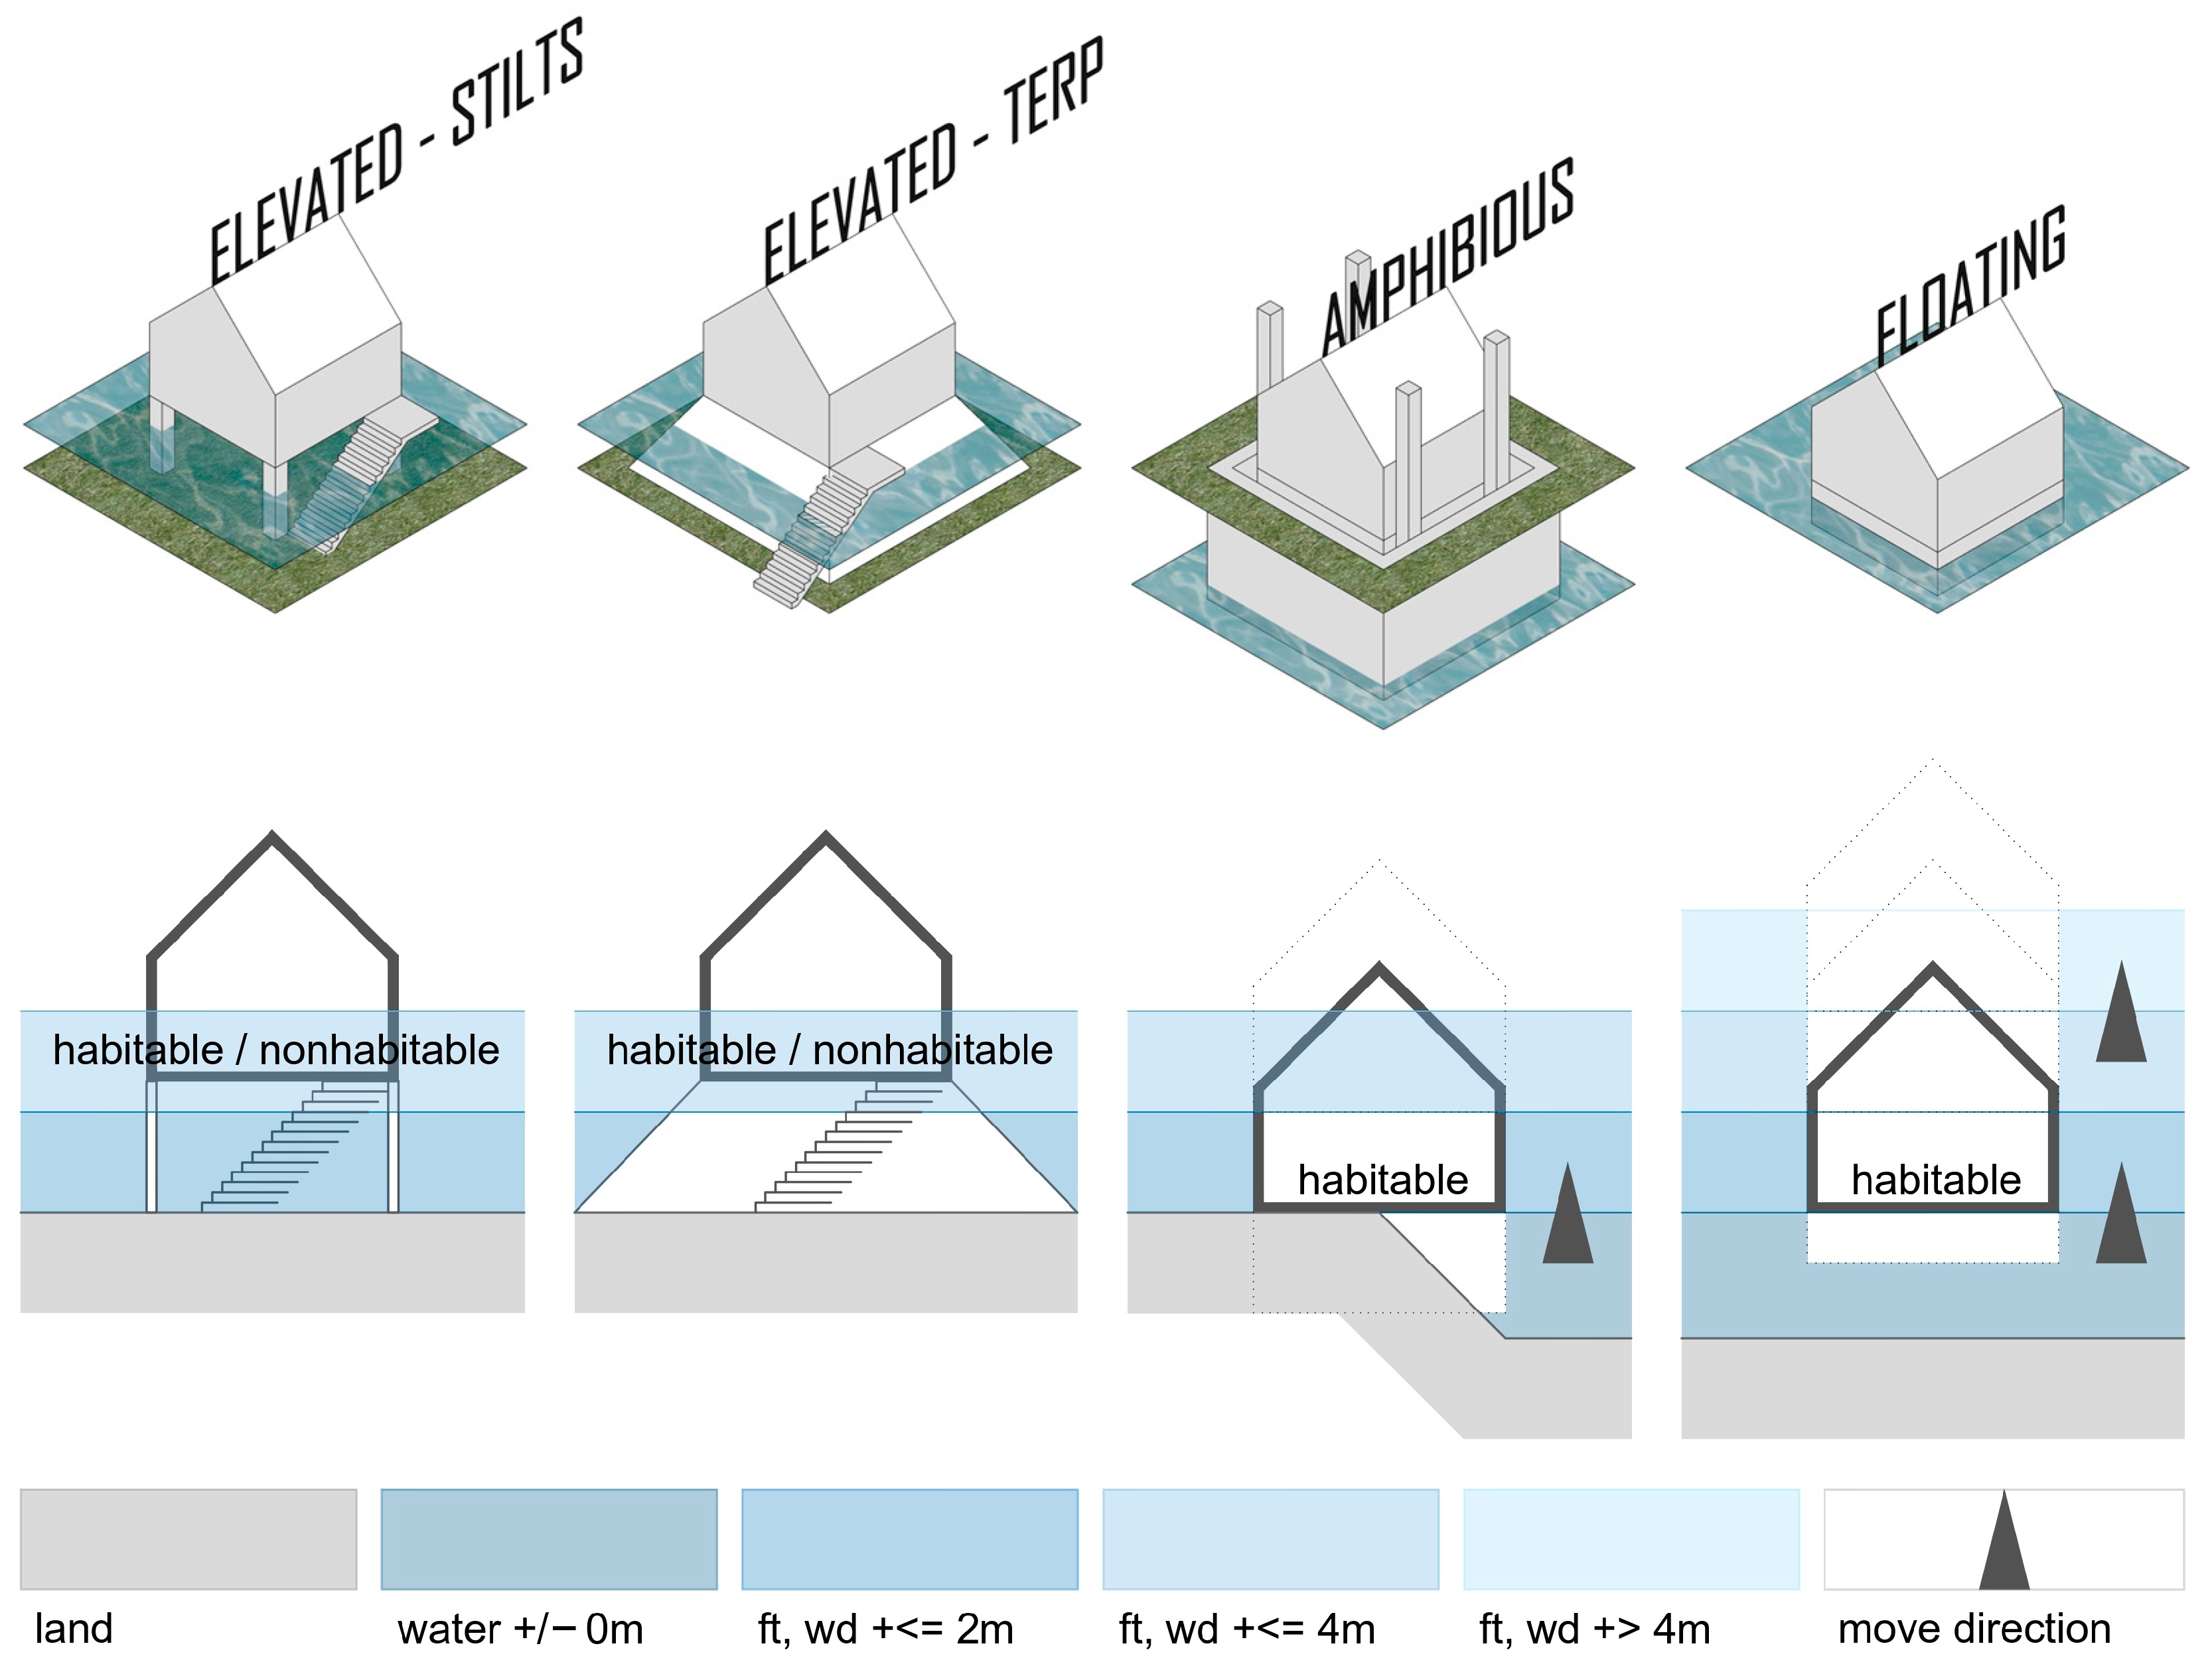
Figure 9 illustrates the operating logic of the three assessed hydro-adaptive housing typologies under dry and flooded conditions, supporting the interpretation of operability outcomes reported in Table 7 and Table 8.
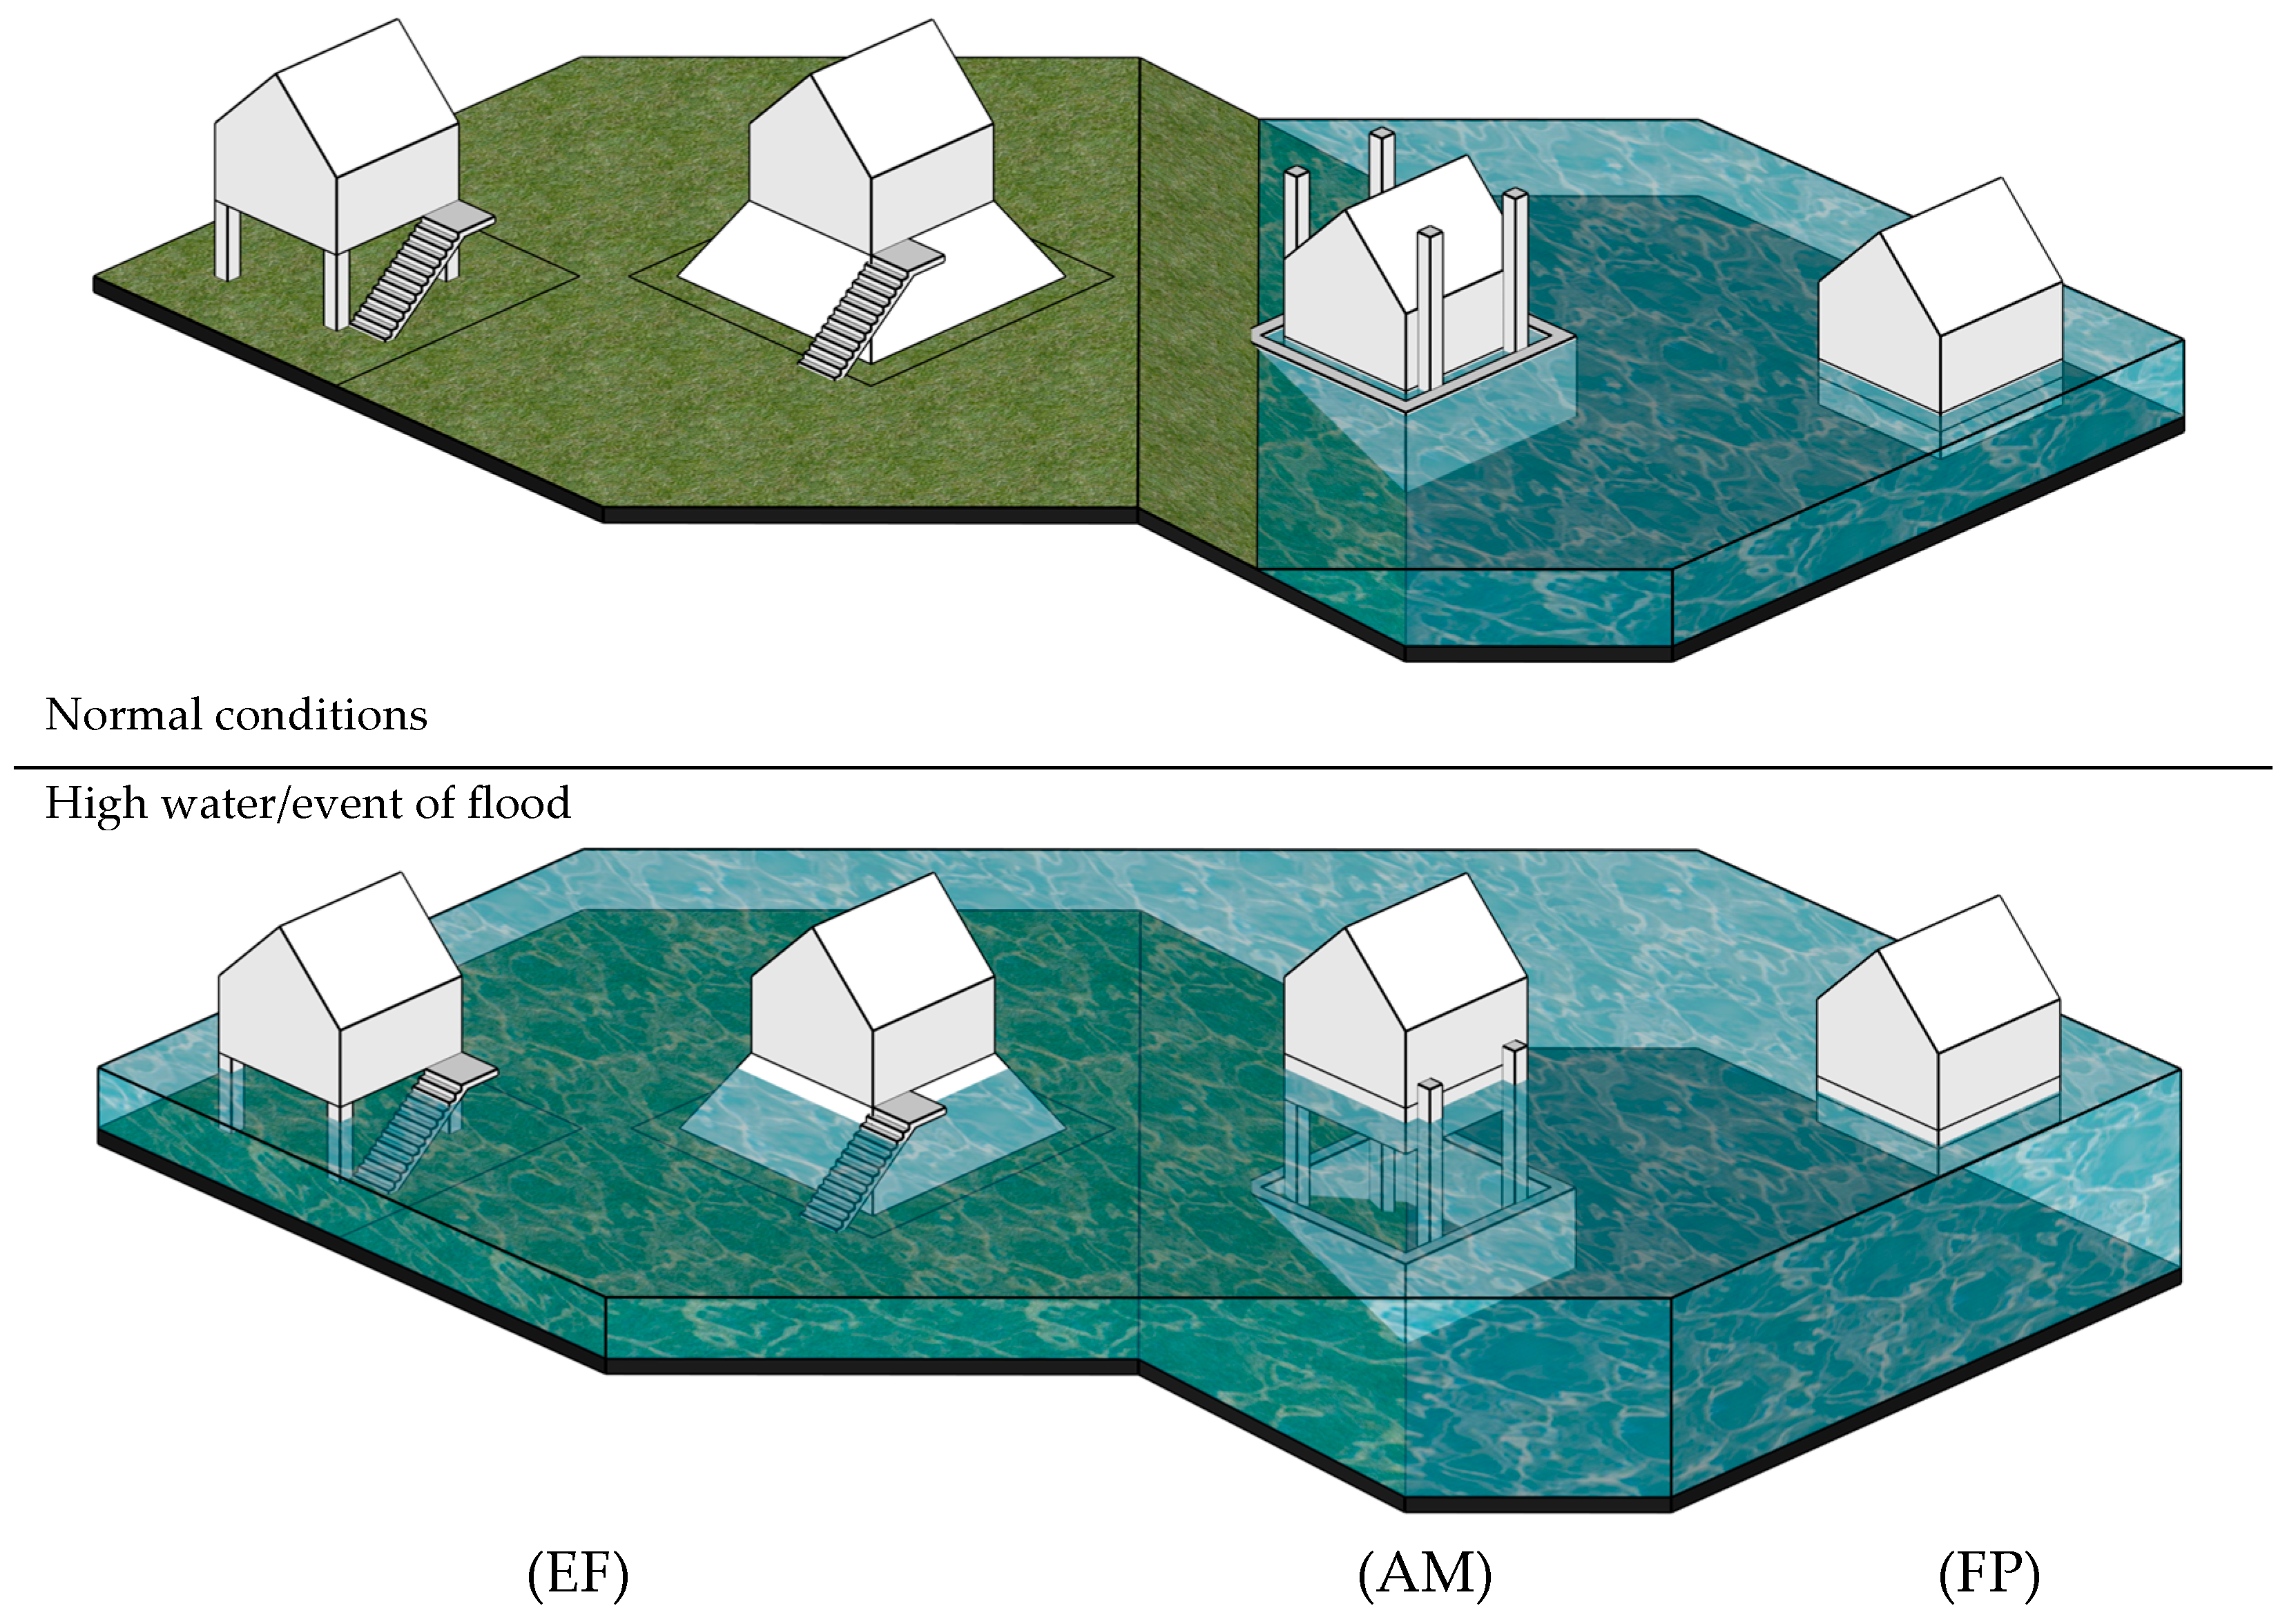
Figure 10 illustrates the operating logic of the three assessed hydro-adaptive typologies under normal and flood conditions, with elevated foundations (EF) shown as two representative raised configurations.
Operability scores corroborated the cross-typology differences. Under the Q100 event, EF configurations exceeded their functional limits in the deepest-exposed settings (Gdansk and Tczew), whereas AM remained habitable under intermediate conditions and FP maintained operability across all modelled events (Q50/Q100/Q500). The same ranking was observed under the sensitivity checks: Q50 conditions were generally within EF and AM operating ranges, while Q500 conditions exceeded EF limits and, in selected locations, also approached or exceeded the AM range, leaving FP as the only configuration maintaining full operability.
A detailed synthesis of performance metrics for the assessed hydro-adaptive typologies under the Q100 design event is summarised in Table 7. Overall, EF reduced damage relative to slab-on-grade construction, AM provided substantially greater damage reduction while preserving habitability over a wider depth range, and FP achieved the highest operability with near-zero damage across the tested configurations. Relative cost differences are also reported in Table 7 and are discussed in Section 4.
Table 8 summarises the performance–cost trade-off across the three hydro-adaptive typologies, including effective water-depth ranges, relative damage reduction, operability thresholds, and key implementation constraints.
Operability scores confirm typology hierarchy across return periods (Table 9), with FP maintaining full functionality across all tested events and AM offering consistent performance up to the Q100 scenario.
Together, these results indicate a consistent performance hierarchy across the tested scenarios: FP achieves the highest operability with near-zero damage across the assessed configurations, AM provides substantial damage reduction while maintaining operability over an intermediate depth range, and EF remains suitable for shallow to moderate exposure where flood depths stay within its functional limits.
The observed operability hierarchy under the Q500 scenario is broadly consistent with published evidence indicating that amphibious systems may retain partial habitability under extreme flood conditions, while elevated solutions are more sensitive to freeboard exceedance and floating systems generally provide the highest continuity of use under deeper inundation [53,54,55].

3.3. Typology Deployment and Site Suitability

The results demonstrate that the deployment of hydro-adaptive housing cannot be treated as typology-neutral but must be matched to site-specific hydraulic exposure, water-depth regime, and enabling spatial conditions. Building on the performance hierarchy established in Table 7 and Table 8, the suitability analysis shows a clear differentiation between elevated foundations (EF), amphibious dwellings (AM), and floating platforms (FP) across the three case-study settings. While FP provided the highest technical overall performance, AM emerged as the most spatially versatile solution across mixed land–water conditions, whereas EF remained suitable primarily in shallow to moderate exposure zones where design water levels remained within its functional range.
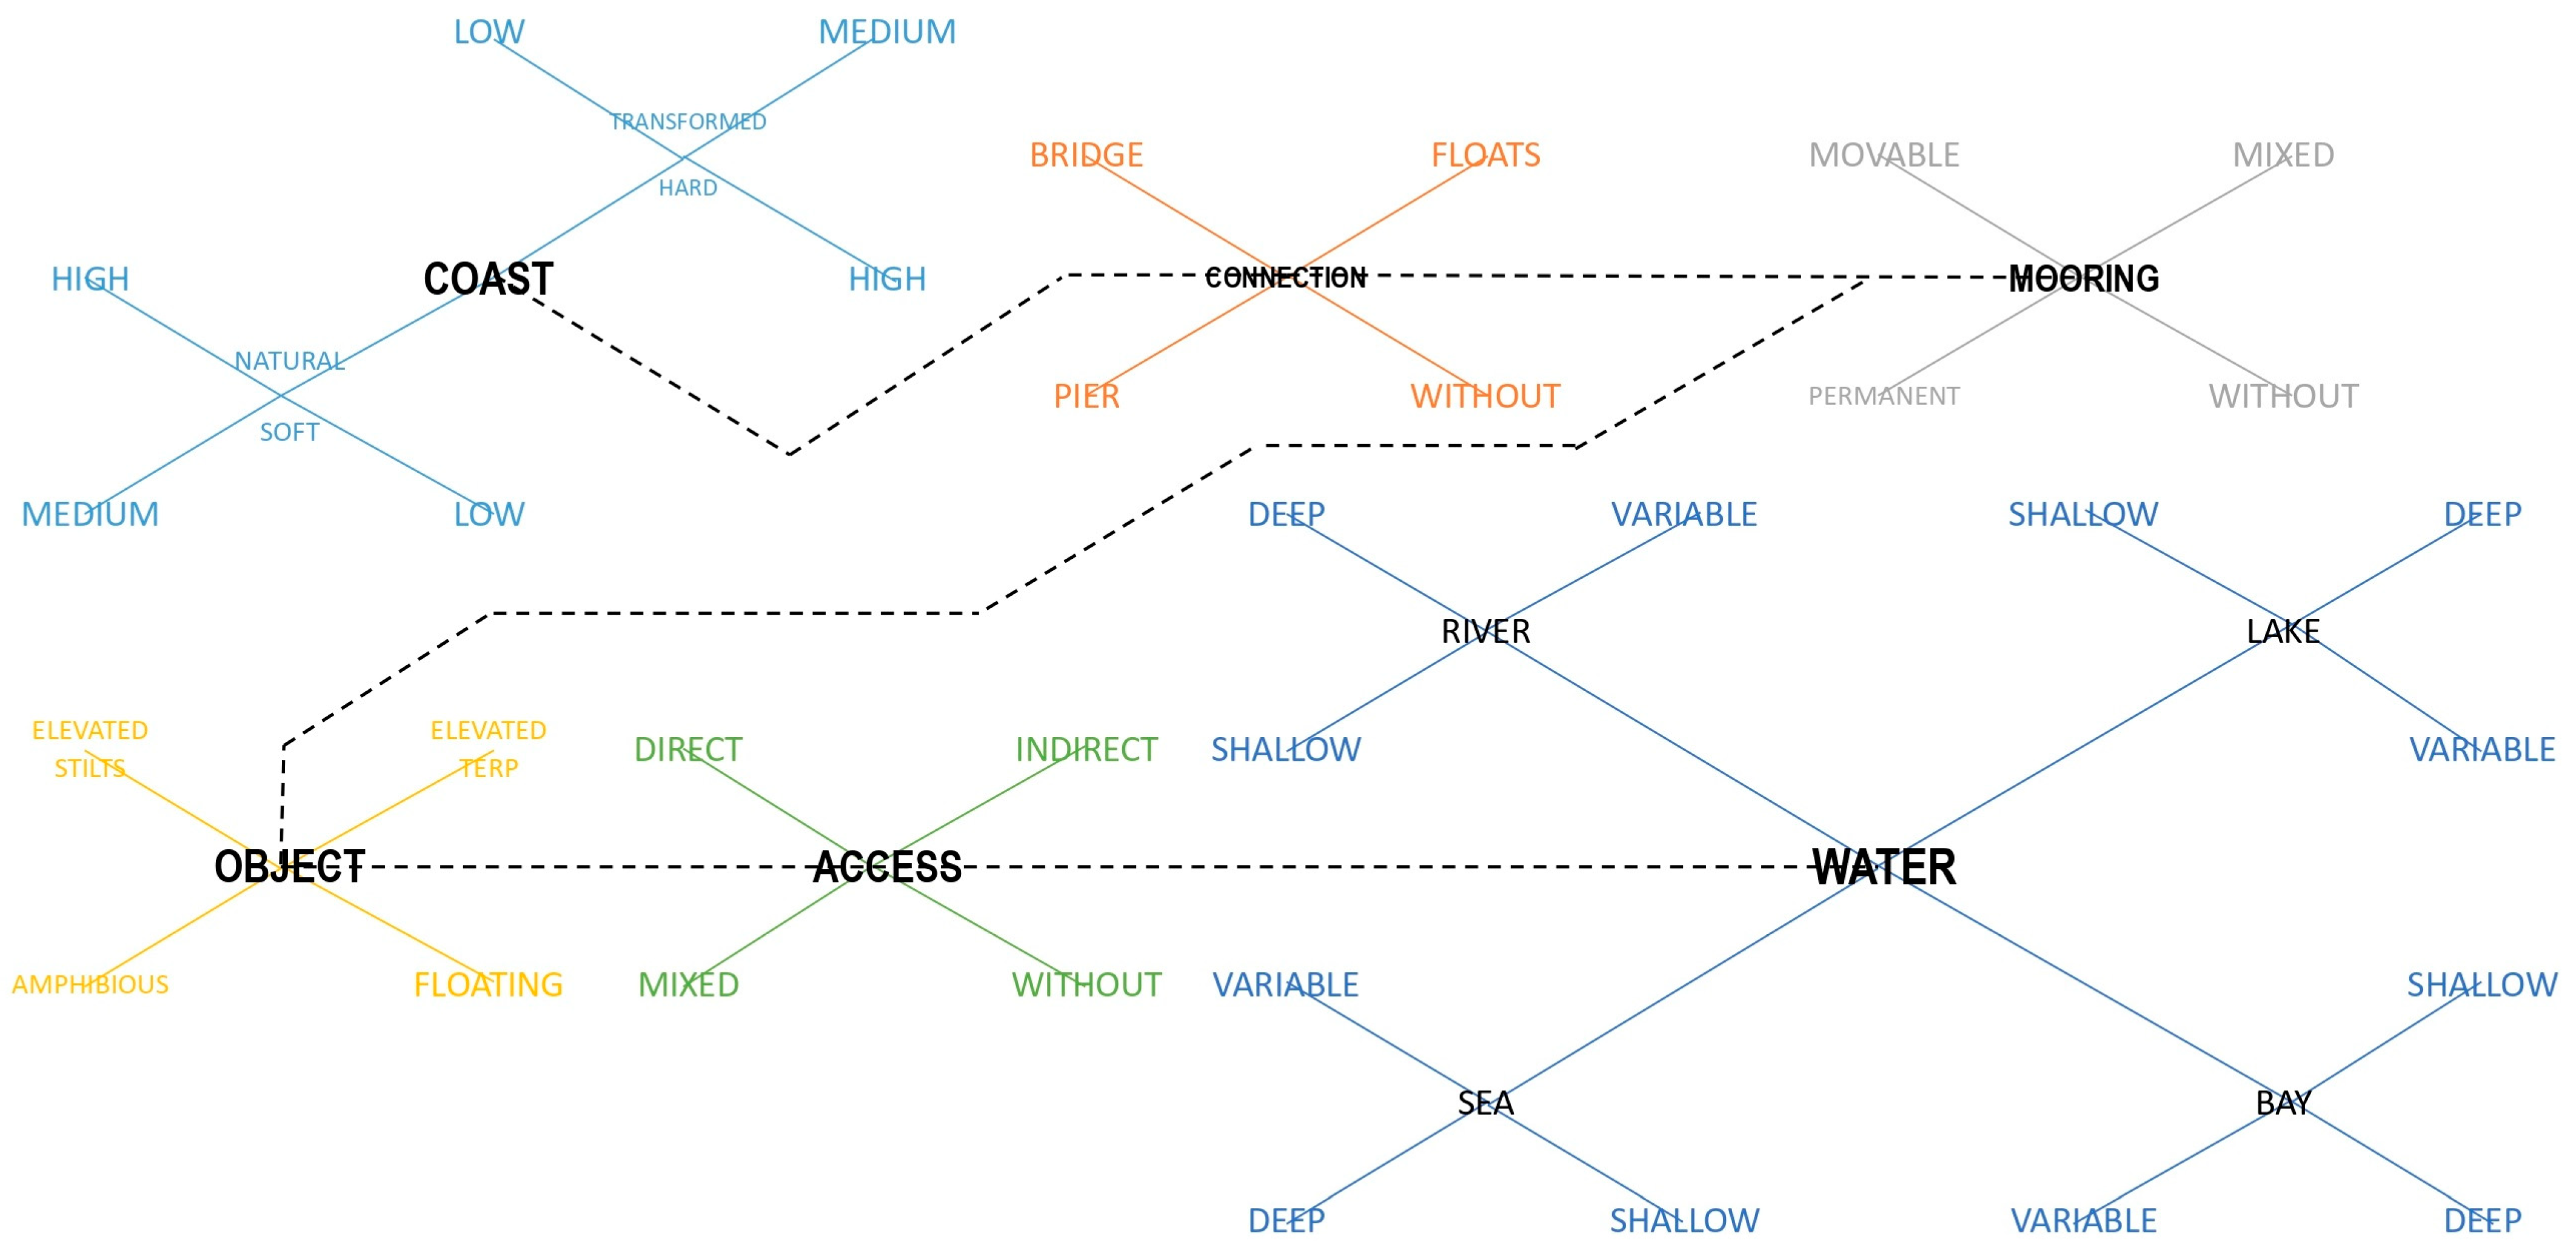
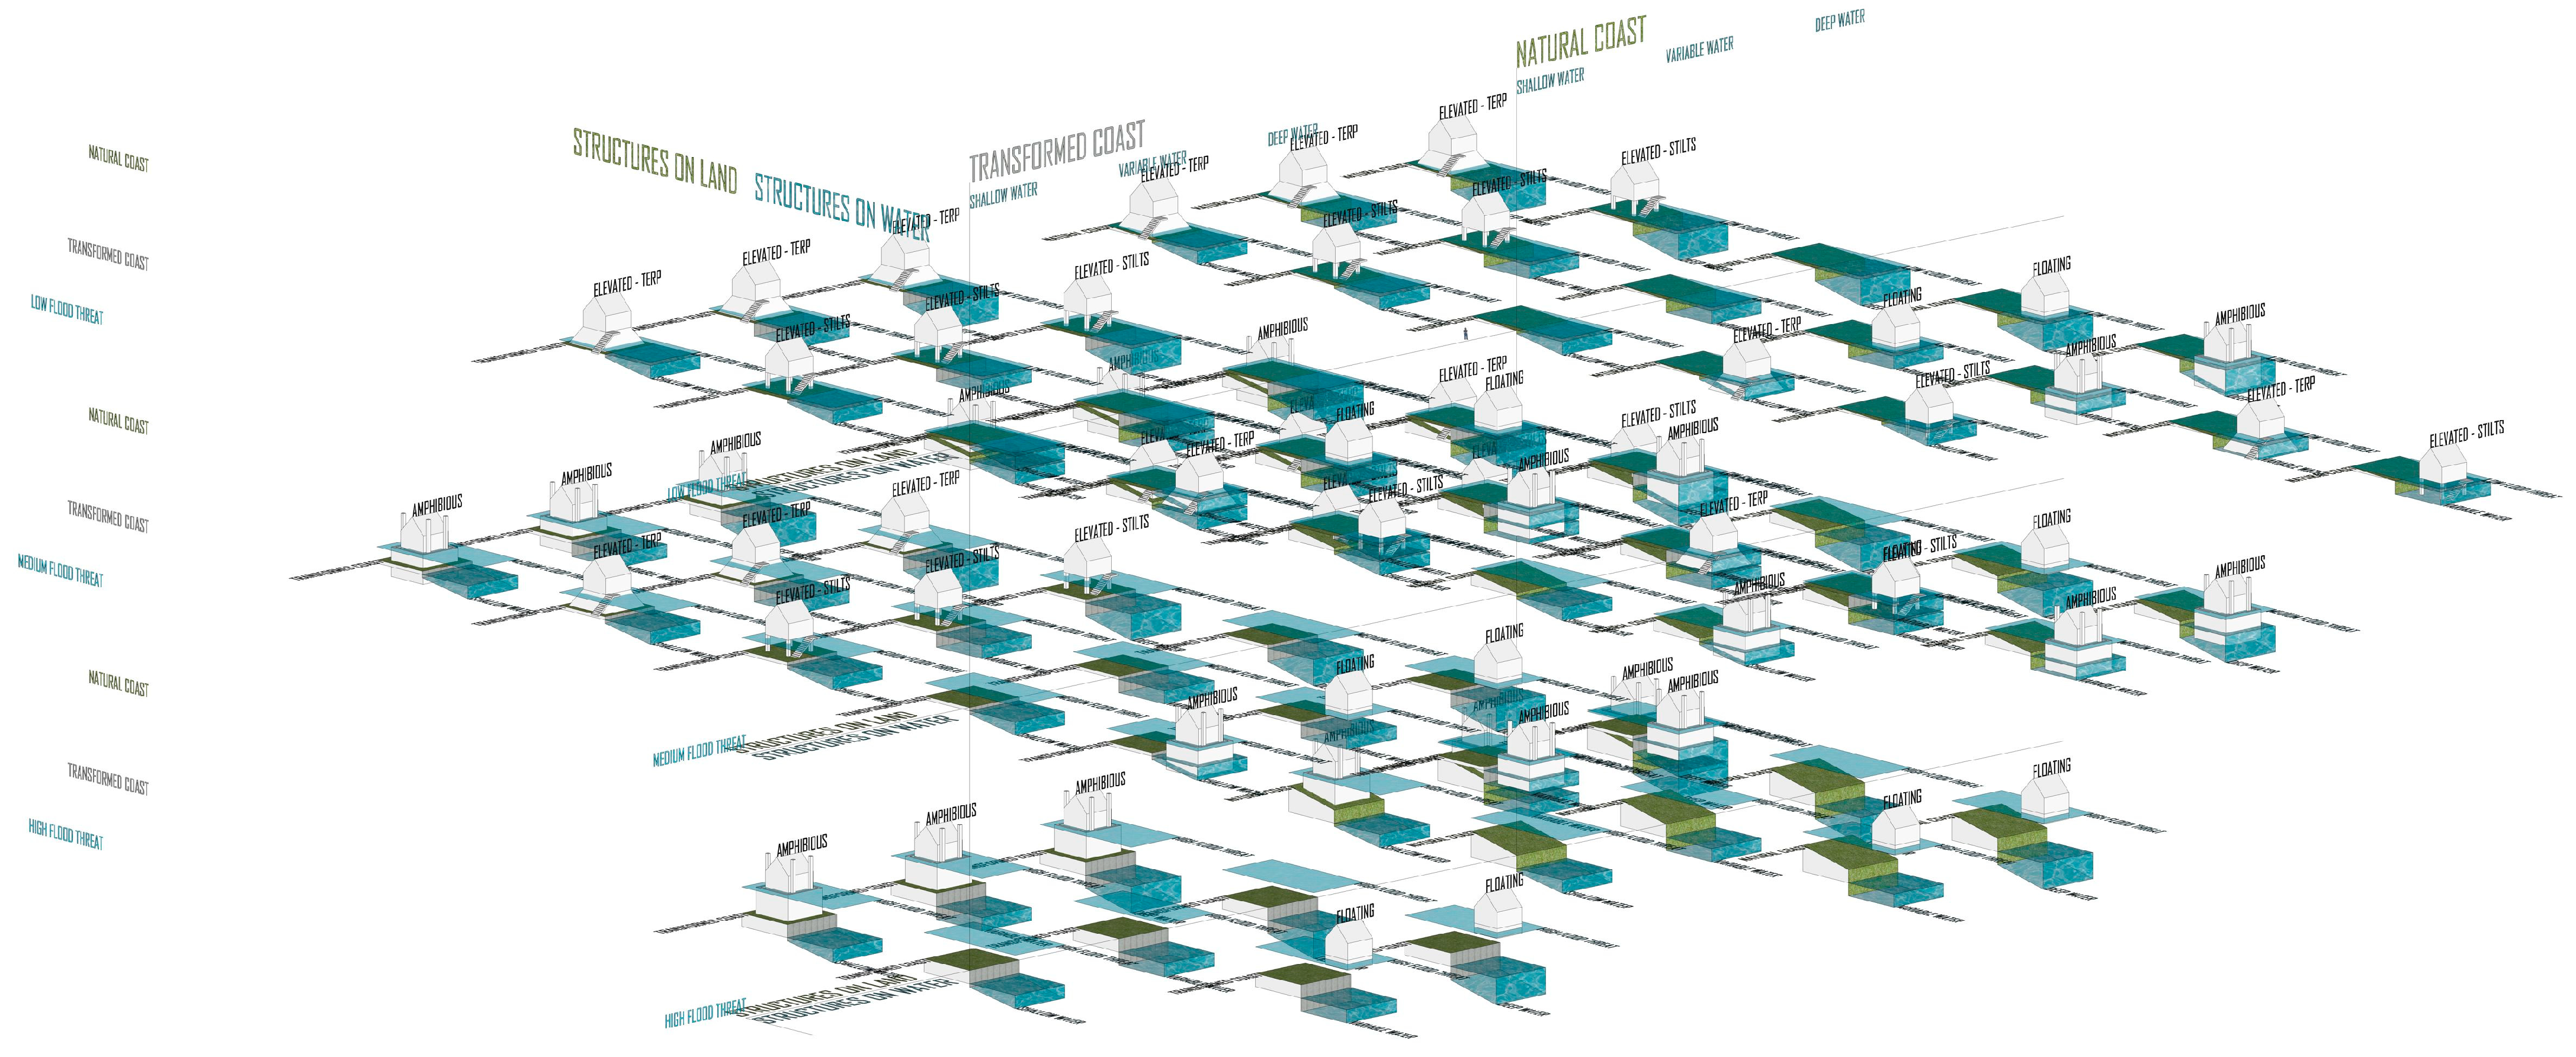
This differentiation is synthesised in Scheme 2 as a planning-oriented deployment logic linking EF, AM, and FP to contrasting land–water settings and flood-exposure conditions. The corresponding site-suitability distribution across land- and water-based siting conditions is summarised in Table 10.
Scheme 2 synthesises this suitability differentiation as a conceptual decision-support framework linking typology selection to flood-threat level, water-depth regime, and land–water setting. The framework indicates that EF is most appropriate in land-based locations with a limited inundation depth and relatively stable access conditions. AM becomes preferable where periodic flooding is more frequent or prolonged, but where structures can still maintain guided vertical movement and service continuity. FP is the most suitable solution in locations exposed to deep, variable, or persistent inundation, particularly where permanent or semi-permanent water conditions require mooring-based stability and water-oriented access systems. Rather than identifying a universally optimal typology, the framework defines a site-dependent decision logic in which suitability shifts along the gradient from dry land to permanently water-affected terrain.
The cross-site comparison further confirms that suitability is strongly conditioned by local flood morphology. In Torun, where inundation remained comparatively shallow and was shaped by confluence-related retention dynamics, AM offered the most balanced typological response, combining substantial damage reduction with operational continuity under intermediate flood depths. In Tczew, where flood conditions were more severe and hydraulically persistent, EF lost effectiveness once freeboard limits were exceeded, whereas AM remained suitable across a wider range of plots, particularly in zones of recurrent but not permanent inundation. In Gdansk, the most variable and water-oriented setting among the three cases, FP showed the highest suitability because deep and spatially unstable backwater conditions reduced the feasibility of elevation-based strategies and favoured floating systems capable of maintaining operability under larger water-level fluctuations.
The analysis also indicates that amphibious housing is the most flexible typology in spatial deployment terms. Across the site-based suitability frameworks, AM occupied the broadest range of feasible positions between dry land and transitional flood-prone zones, consistent with its strong Q100 performance and the observed reduction in building damage relative to slab-on-grade construction. By contrast, FP was highly effective but spatially more selective, as its applicability depended on water-based siting conditions and supporting access and mooring infrastructure. EF remained the least adaptable of the three hydro-adaptive typologies under higher design depths, although it retained value as a lower-complexity option in zones of shallow inundation. Taken together, these findings indicate that AM represents the most transferable compromise between resilience performance and implementation feasibility, whereas FP should be prioritised where hazard intensity and water permanence exceed the practical limits of elevation-based approaches.
Figure 11 provides a conceptual visualisation of this interpretation by illustrating how the assessed typologies relate to contrasting combinations of flood threat, water-depth regime, and land–water setting. The figure indicates that suitability is not determined by a single factor, but by the combined effect of hydraulic exposure, land–water transition conditions, and technical enabling requirements. In this sense, typology selection should be guided not only by maximum flood depth, but also by the broader configuration of access, infrastructure continuity, and the land–water interface.
A comparative overview of flood-threat and water-depth suitability across the three case-study locations illustrates how the relative suitability of the assessed hydro-adaptive typologies shifts along the gradient from land-based to surface-water conditions (Figure 12).
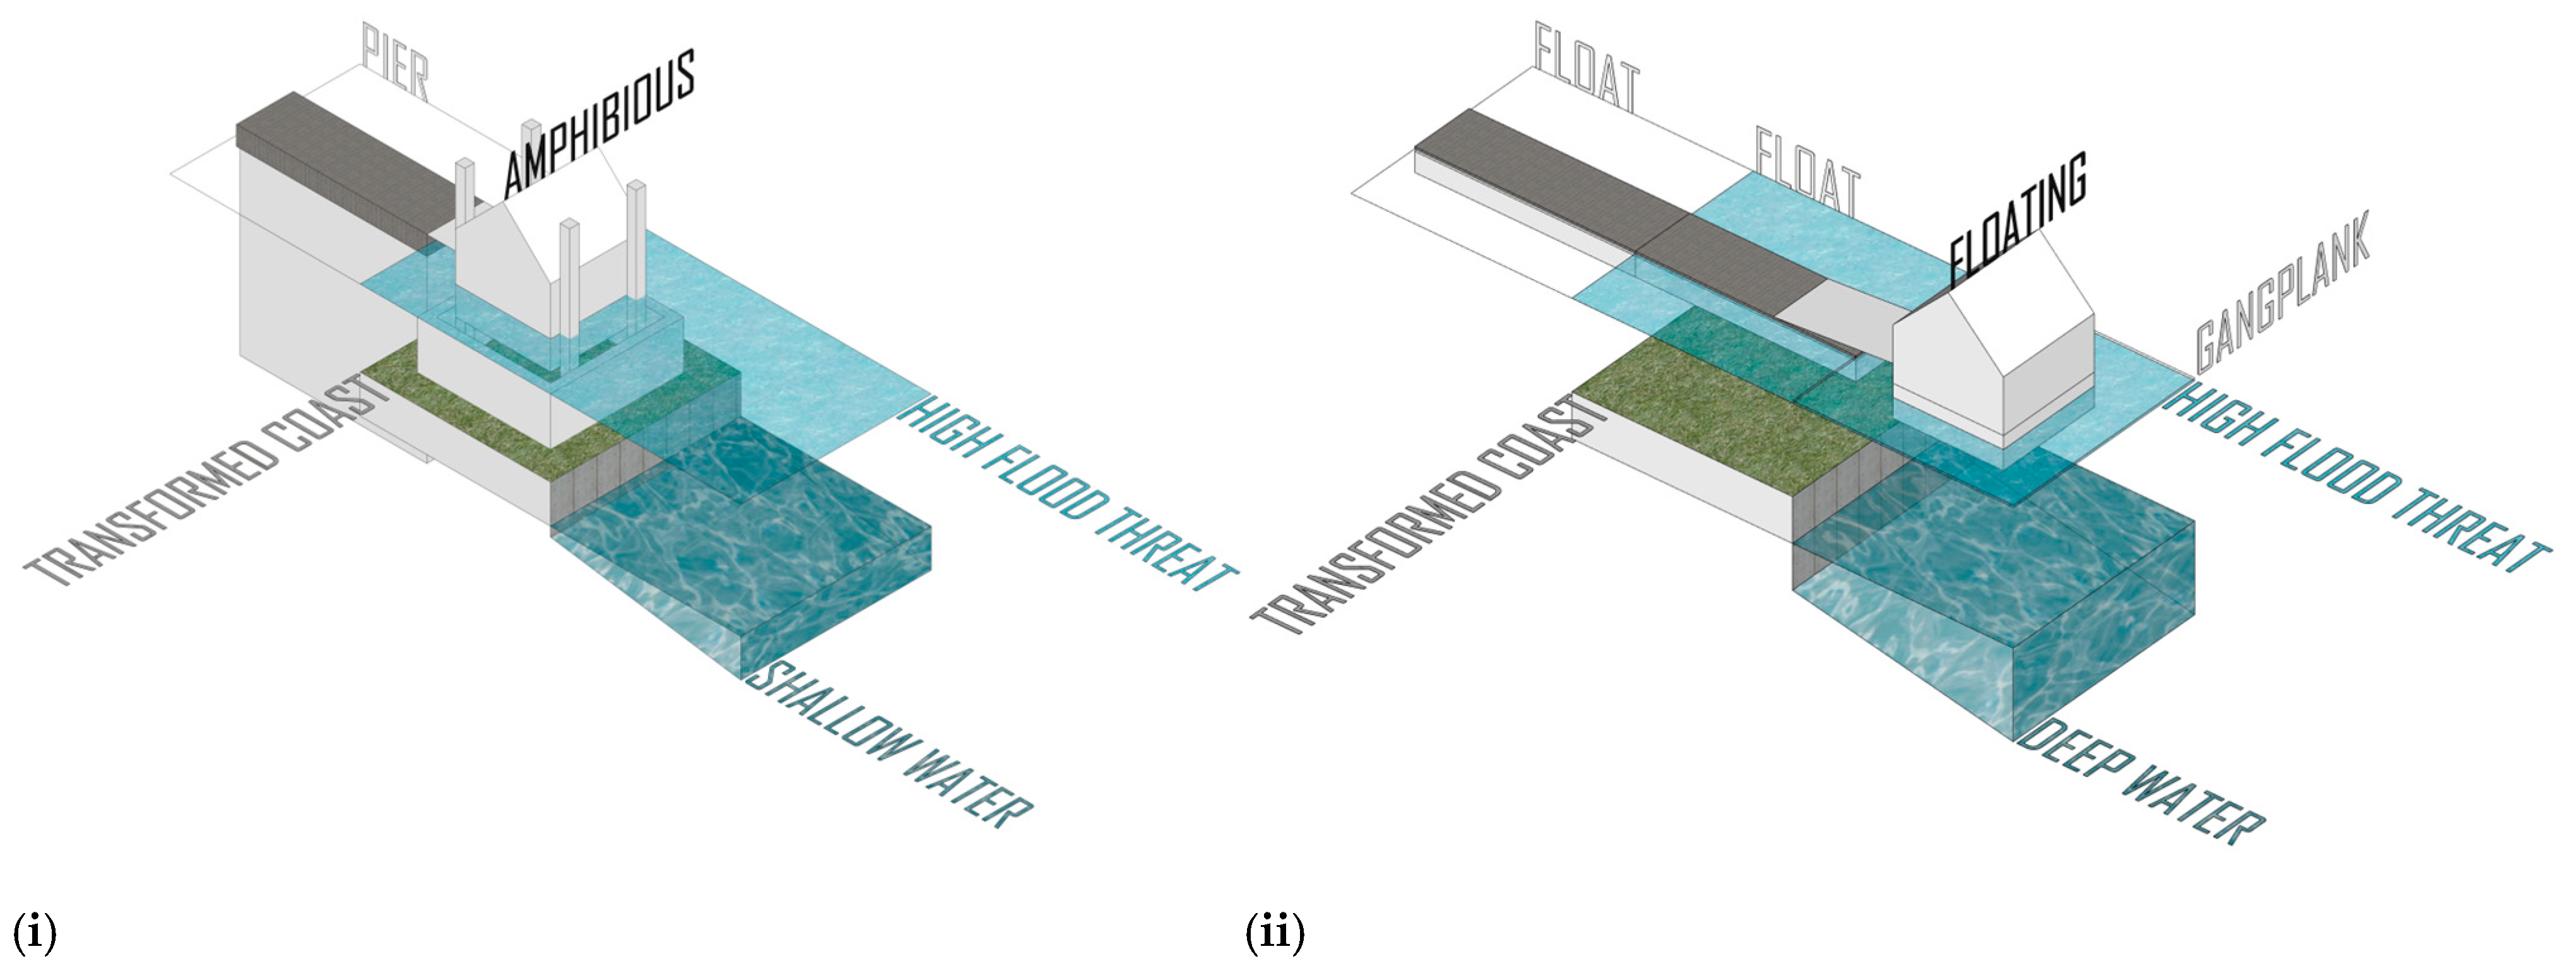
Figure 13 illustrates two example deployment scenarios, showing how the suitability framework can be translated into specific hydraulic and spatial applications.
The scenario-based deployment matrix presented in Table 11 translates these findings into site-specific application zones. It shows that the assessed hydro-adaptive typologies (EF, AM, and FP) differ in their suitability across contrasting flood-exposure and land–water conditions. In land-dominated settings, EF and AM provide the main feasible options, while in water-oriented or permanently inundated zones FP is the only consistently suitable solution.
Taken together, these results define a comparative deployment logic in which hydro-adaptive housing comprises a differentiated set of responses matched to distinct hydraulic and spatial conditions.

3.4. Neighbourhood-Scale Recovery Effects

At the neighbourhood scale, the integration of hydro-adaptive housing with nature-based solutions (NBSs) yielded significant co-benefits. Simulations incorporating on-plot bioretention and blue–green corridors reduced surface-water retention time (t_ret) by 18–31%, with the strongest effects observed in Torun, where limited natural drainage capacity made the system particularly sensitive to retention improvements. In Gdansk, the reductions were more moderate, reflecting the buffering role of existing canalised flows, while in Tczew drainage time decreased by up to 24 h but remained above 72 h under extreme scenarios.
Beyond reducing the overall duration of water stagnation, the introduction of NBSs also altered the spatial distribution of floodwaters by decreasing the occurrence of isolated surface-water pockets. This effect was reflected in a 12–15% reduction in inundated public space, including streets and courtyards, thereby accelerating the functional recovery of neighbourhood infrastructure. Synergies were most pronounced where amphibious and floating typologies were deployed, as these remained operable during inundation, while blue–green retention measures accelerated recovery in surrounding spaces. This combination also points to broader design opportunities in flood-prone neighbourhoods, where blue–green corridors and retention areas can function simultaneously as hydraulic buffers and everyday public amenities.
The magnitude of neighbourhood-scale recovery benefits varied across the three study sites. In Gdansk, NBSs reduced stagnation times only marginally, as existing canals already provided partial drainage pathways. By contrast, Torun exhibited the strongest improvements, with drainage accelerated by more than 24 h in selected scenarios. In Tczew, reductions in t_ret were measurable but insufficient to lower total inundation time below 72 h during extreme events, highlighting the persistent constraint imposed by low-gradient topography.
Taken together, the results indicate that supporting BGI measures reduced surface-water retention time by 18–31% and modified local inundation patterns relative to the baseline configuration, with the strongest effects observed in Torun and more limited improvements in Gdansk and Tczew. These findings suggest a potential contribution of BGI to neighbourhood-scale resilience. However, they should be interpreted as the outcome of a scenario- and sensitivity-based assessment rather than as a standalone co-design framework for matching specific BGI configurations to particular housing typologies.

4. Discussion

The results demonstrate that hydro-adaptive housing can significantly mitigate the impact of floods in Central European lowland cities. However, its effectiveness is influenced by the interplay between flood regime, site conditions, and typology-specific operating thresholds. Across the three case studies, elevated foundations (EF) proved effective primarily under shallow to moderate inundation, maintaining protective capacity up to approximately 2.0 m of water depth and reducing the BDI by 35–40%. In contrast, the performance of amphibious dwellings (AM) and floating platforms (FP) was found to be notably superior in terms of resilience when subjected to more severe design events. Specifically, AM exhibited high operability under Q100 conditions, while FP demonstrated functionality across the entire range of tested return periods. This pattern is consistent with a recent review in the literature indicating that amphibious structures are particularly suitable in settings exposed to substantial but manageable flood-level fluctuations [19]. Taken together, these findings do not support a single universal hierarchy of “best” solutions; instead, they indicate that hydro-adaptive housing should be approached as a context-sensitive portfolio of measures, whose suitability depends on local hydro-morphological conditions, water-level dynamics, access requirements, and infrastructural constraints [25,26,56].
This interpretation is consistent with broader international research demonstrating that flood-adaptive housing is most effective when calibrated to site-specific hazard conditions rather than applied as a generic design model [2]. In the Lower Vistula context, this argument is further reinforced by studies highlighting the geomorphological complexity of the floodplain, including the role of crevasse channels, floodplain dynamics, and locally differentiated flood pathways in shaping flood hazard and management responses [57,58]. A recent review in the literature further suggests that amphibious systems are particularly well suited to settings characterised by substantial, yet spatially and mechanically manageable, water-level fluctuations, whereas elevated or buoyant foundation-based solutions (applied for heritage objects) may offer more feasible intermediate responses in moderate-risk environments [59]. Against this background, the present study contributes not only additional comparative evidence, but also a clearer planning-oriented rationale for typology selection. The comparison of EF, AM, and FP across the Lower Vistula corridor shows that the critical issue is not resistance to inundation alone, but the extent to which each typology corresponds to the underlying flood regime, including flood depth, duration, recession dynamics, and the enabling conditions required to maintain habitability, access, and service continuity.
The findings also suggest that hydro-adaptive housing may generate benefits beyond the scale of individual buildings, particularly when integrated with broader blue–green infrastructure strategies [22]. The observed reductions in surface-water retention time and improvements in accessibility recovery indicate that such typologies may contribute to neighbourhood-scale resilience [60] rather than merely reducing direct structural damage. This interpretation is consistent with recent studies showing that nature-based and blue–green interventions can reduce runoff, shorten flood duration, and improve urban flood-system performance under both design and failure conditions [61]. The observed reduction in surface-water retention time (18–31%) is broadly consistent with published evidence indicating that bioretention and distributed blue–green interventions can produce measurable, though strongly site-dependent, improvements in local drainage and flood-mitigation performance. In this sense, the effect identified here appears meaningful in relation to the wider range of hydrological benefits reported for urban nature-based stormwater measures [32].
A particularly important finding of the study is that amphibious dwellings emerge as the most balanced option across the analysed Central European conditions. Although floating platforms (FP) achieved the highest level of technical resilience, their dependence on mooring systems, floating infrastructure, and more complex service integration implies substantially higher implementation thresholds, particularly due to affordability constraints [27]. Elevated foundations (EF), by contrast, remain comparatively accessible as retrofit or low-complexity adaptation measures, but their protective capacity declines rapidly once the design freeboard is exceeded. Amphibious dwellings (AM) offer a more advantageous middle ground: they extend the functional flood range well beyond that of EF while avoiding some of the infrastructural and governance burdens associated with permanent floating solutions [54,62]. This makes amphibious housing particularly relevant in riverine and backwater-influenced settings characterised by episodic but significant inundation, where permanent floating urbanism may be difficult to justify economically or institutionally. In this sense, the findings suggest that amphibious housing may represent the most realistic compromise between resilience performance and implementation feasibility in many small- and medium-sized flood-prone urban areas of Central Europe. The operability results under Q500 further reinforce this hierarchy. The low EF operability rate and the partial reduction in AM operability are consistent with published evidence on amphibious system limits, whereas FP remains the only typology that maintains full operability in the tested Q500 scenarios, subject to standard buoyancy, anchorage, stability, and freeboard requirements [63,64].
Furthermore, the case studies reinforce the importance of situating housing adaptation within wider floodplain and watershed dynamics [65]. Earlier work on the Lower Vistula has emphasised the compound and geomorphologically conditioned nature of flood hazards in the corridor, including the role of floodplain morphology, crevasse channels, and local backwater effects [57]. At the global scale, major coastal cities are expected to face increasing flood losses under continued urbanisation and climate change [66], while recent research on major delta cities further shows that compound flood risk is amplified by the interaction of climatic drivers and land subsidence [67]. The present results align with this understanding by showing that typology performance varies not only with nominal return period, but also with the specific spatial logic of inundation at each site. In other words, the same architectural strategy cannot be assumed to perform equally across a coastal–delta setting, a river confluence, and a lower-river terrace, particularly where compound flood drivers and spatially differentiated flood pathways shape local hazard patterns [68,69]. This is precisely why the decision framework developed in the study is significant: it moves beyond generic advocacy for hydro-adaptive housing and instead links hazard profile, enabling conditions, and typology suitability in a more operational manner.
Earlier work on the Lower Vistula has emphasised the compound and geomorphologically conditioned nature of flood hazards in the corridor, including the role of floodplain morphology, crevasse channels, and local backwater effects [31]. At the global scale, major coastal cities are expected to face increasing flood losses under continued urbanisation and climate change [1], while recent research on major delta cities further shows that compound flood risk is amplified by the interaction of climatic drivers and land subsidence [39].
The findings also indicate that hydro-adaptive housing may generate benefits beyond the individual building scale. The simulations showed reductions in surface-water retention time of 18–31% and measurable improvements in neighbourhood accessibility recovery, including 12–15% less inundated public space in selected scenarios [60]. This range appears broadly consistent with reported performance levels for plot- and neighbourhood-scale bioretention and distributed blue–green measures [32,70], suggesting that the effect identified here is operationally relevant and within the range documented in previous studies. These effects suggest that hydro-adaptive typologies, when combined with blue–green infrastructure (BGI), may support broader recovery processes at the district scale rather than merely reducing direct damage to housing units [71,72], particularly through walkable public spaces [60]. This distinction matters because it shifts the role of hydro-adaptive housing from a purely building-level protective measure to a component of wider district-scale resilience planning [73,74,75]. In much of the literature, hydro-adaptive housing is discussed primarily as a building-level response; by contrast, the present results indicate that its planning value increases when it is embedded within a wider system of retention, drainage, and public-space adaptation [76,77], consistent with transition models for Baltic urban blue spaces [22].
This interpretation is consistent with recent work on nature-based and blue–green approaches to urban flood mitigation. Studies on distributed rainwater harvesting, multifunctional drainage landscapes, and neighbourhood-scale BGI have shown that ecological and spatial interventions can reduce runoff volumes, shorten flood durations, and improve resilience under both design and failure conditions. The findings from Gdansk and the Lower Vistula case studies complement this line of research by suggesting that hydro-adaptive housing can be assessed alongside supporting BGI measures within a layered adaptation strategy. However, the present study does not establish a standalone co-design framework or a decision rule for matching specific BGI configurations to particular housing typologies. From this perspective, adaptive dwellings should not be treated as substitutes for BGI or conventional flood defences, but as components of a layered adaptation strategy [78] in which architectural, ecological, and infrastructural measures reinforce one another [7]. This perspective is particularly relevant in flood-prone urban districts where land scarcity, redevelopment pressure, and climate uncertainty make single-function defence solutions increasingly inadequate [22], reinforcing the need to combine resilience-oriented and liveability-oriented urban strategies and to integrate public-space and river-corridor adaptation measures [79,80]. While the present analysis focused on on-plot bioretention and blue–green corridors, hydrological performance varies substantially across BGI types [32]. Permeable pavements excel at peak-flow attenuation and rapid infiltration but provide limited volume retention compared to rain gardens [70]. Green roofs offer modest peak mitigation suitable for frequent small events but become saturated during extremes, limiting their effectiveness in mitigating floods [81]. Future work should integrate these complementary responses within the typology framework to optimise district-scale resilience [32].
At the same time, the results should be interpreted in light of several methodological limitations. The analysis relies on 1D hydraulic modelling and simplified parametric typology descriptions, which support comparative planning assessment but cannot reproduce the full complexity of local flow processes, construction detailing or operational behaviour. Consequently, the reported performance ranges and decision matrices should be viewed as indicative planning guidance that requires site-specific engineering validation and local calibration before practical application. Future research should therefore combine hydraulic and architectural modelling with pilot implementations, post-occupancy evidence, and more explicit socio-economic evaluation. Future research may also explore the integration of AI- and machine learning-based tools to support multi-objective optimisation [82], as well as surrogate flood modelling and uncertainty analysis within hydro-adaptive housing design and evaluation workflows [83,84,85]. Such extensions would be especially valuable in assessing whether the apparent cost–performance advantage of amphibious systems remains robust once maintenance, insurance, governance, and user acceptance are taken into account [11,16].
From an implementation perspective, the wider uptake of hydro-adaptive housing remains conditioned by regulatory, economic, and institutional constraints that lie beyond the direct outputs of the present modelling workflow [16,30]. In Poland, development in flood-prone areas is generally subject to restrictive planning controls, while dedicated legal, technical, and approval pathways for amphibious and floating dwellings remain limited. These conditions may constrain experimentation and reduce the feasibility of pilot implementation, even in locations where conventional flood-defence strategies provide only partial protection [86].
These constraints also differ across typologies. Elevated foundation systems appear more feasible in lower-complexity retrofit settings [16], whereas amphibious dwellings require more advanced engineering and coordination but may offer a more balanced compromise between adaptability and implementation effort. Floating platforms provide the highest technical tolerance of large water-level fluctuations, yet their broader application depends on more demanding infrastructure, access, servicing, and governance arrangements [18]. These issues should not be interpreted as direct empirical outputs of the present study but as contextual conditions affecting the practical transferability of the reported findings. In this sense, wider implementation will depend not only on hazard suitability, but also on planning adaptation, institutional support, and demonstration projects capable of testing economic and social feasibility [30].
Finally, governance and regulation emerge as decisive conditions for real-world implementation. Even where amphibious and floating solutions perform strongly in hydraulic and parametric simulations, their broader uptake depends on legal definitions, zoning practice, insurance arrangements, infrastructure provision, and public legitimacy [28,29]. European case studies, including those from the Netherlands, demonstrate that hydro-adaptive housing becomes viable only when technical innovation is accompanied by institutional adaptation [17,29]. The Polish context remains more restrictive, particularly in relation to development in flood-prone areas and the absence of clearly established standards for amphibious or floating dwellings [20]. Under such conditions, hydro-adaptive housing is unlikely to move beyond pilot or demonstration status unless spatial planning frameworks, approval pathways, and risk-governance instruments are updated accordingly [24].
From a planning perspective, the main implication is not that hydro-adaptive housing should replace conventional flood protection, but that it can expand the adaptation repertoire [78] available to municipalities facing increasing hydrological uncertainty [87]. Its greatest value lies in contexts where the rigid separation of land and water is becoming progressively less tenable, yet where urban continuity, housing provision, and redevelopment pressures still require inhabitable solutions. In such settings, hydro-adaptive housing may serve as a strategic complement to flood defences, blue–green infrastructure, and spatial planning controls, particularly through remodelling land–water connections [73], helping to shift flood-prone urbanism from a paradigm of resistance alone towards one of controlled accommodation and recovery [58]. The principal contribution of the study lies precisely here: not merely in comparing three housing typologies, but in establishing a planning-oriented decision logic linking flood regime, site enabling conditions, and blue–green co-design [78] to typology suitability in Central European lowland environments, particularly climate-sensitive waterfronts [58].
The economic feasibility of hydro-adaptive housing varies substantially across typologies, with indicative cost factors ranging from 1.3× (EF) to 2.5× (FP) that of conventional construction [Table 7]. While initial investment premiums for AM and FP remain challenging for individual developers (10–30% higher than land-based housing) [18], life-cycle savings from avoided flood damage (62–90% BDI reduction) and reduced recovery costs may offset upfront costs over 20–30 years, particularly in recurrently flooded settings [88]. Social acceptance is likely higher for EF due to familiarity with elevated structures, whereas AM and FP may face perceptual barriers related to the safety and permanence of water interfaces [13]. Pilot projects and community engagement are therefore essential to build legitimacy, especially in Poland, where floodplain development carries strong cultural associations with risk [3]. Policy support remains the primary barrier: current Polish regulations restrict floodplain construction and lack standards for amphibious/floating structures [3,46,89], necessitating updates to spatial planning frameworks, insurance models, and technical guidelines [44]. Demonstration initiatives, similar to Dutch Room for the River, could catalyse institutional adaptation by proving economic viability and public benefits [49,86]. Overall, these limitations confirm that the framework is best used as a planning-support tool for preliminary typology screening and blue–green co-design, rather than as a replacement for detailed site-specific engineering design and empirical testing.

5. Conclusions

This study demonstrated that hydro-adaptive housing can make a meaningful contribution to urban flood mitigation in Central European lowland cities. By comparing elevated foundations (EF), amphibious dwellings (AM), and floating platforms (FP) across contrasting hydro-morphological settings in Torun, Tczew, and Gdansk, it showed that architectural adaptability can complement conventional flood-defence strategies in a context-sensitive manner. Among the analysed typologies, amphibious and floating solutions offered the highest levels of protection under more severe flood conditions, whereas elevated foundations remained more suitable for shallow to moderate inundation.
The findings further show that the value of hydro-adaptive housing extends beyond the individual buildings. When integrated with blue–green infrastructure and nature-based measures, these typologies can contribute to improved drainage performance, faster accessibility recovery, and broader neighbourhood-scale resilience. Hydro-adaptive housing should therefore be understood not as an isolated technical innovation, but as part of a wider multi-layered adaptation strategy combining architectural, ecological, and spatial planning measures.
At the same time, the wider application of hydro-adaptive housing in Poland remains constrained by restrictive planning regulations, unresolved questions concerning life-cycle cost and avoided-damage performance, and the need for greater institutional and social acceptance. Further empirical and site-specific validation remains necessary before broader implementation.
This study is subject to several limitations that bound the validity and transferability of its findings. First, the flood hazard characterisation relies on one-dimensional unsteady HEC-RAS simulations, which represent longitudinal water-surface profiles and channel-controlled inundation but do not capture the full range of lateral flow redistribution and small-scale floodplain dynamics that two-dimensional or coupled 1D–2D models could resolve. Second, the hydro-adaptive housing typologies are operationalised through simplified parameterisation of structural geometry, loads and hydrostatic performance rather than detailed site-specific engineering designs, so the quantitative thresholds reported here should be interpreted as indicative planning values rather than as construction-ready specifications. Third, the assessment is calibrated to three case-study settings in the Lower Vistula corridor, and the resulting decision logic and suitability ranges are therefore transferable only to hydrologically and morphologically comparable lowland contexts; applying the framework elsewhere requires local hydraulic calibration, regulatory review and adaptation to site-specific planning constraints. Taken together, these limitations mean that the framework is intended primarily as a screening and planning-support tool rather than as a substitute for detailed project-level hydraulic and structural design.
Overall, the main contribution of the study lies in providing a planning-oriented decision framework, validated on three flood-prone sites in northern Poland, for matching hydro-adaptive housing typologies to flood regime, site conditions, and enabling factors in similar Central European lowland settings, pending local calibration and validation against independent cases. In this sense, hydro-adaptive housing should be understood not only as a technical response to flood risk, but also as a strategic instrument of climate-resilient urban development in settings where the rigid separation of land and water is becoming increasingly difficult to sustain.

Supplementary Materials

The following supporting information can be downloaded at https://www.mdpi.com/article/10.3390/buildings16101880/s1. Table S1: Load assumptions used in hydrostatic safety checks; Table S2: Depth–damage curves used for Building Damage Index (BDI) calculation; Table S3: Manning’s roughness ranges and perturbation envelopes used in the hydraulic sensitivity analysis; Table S4: Design dis-charges derived from annual maximum discharge series obtained from IMGW-PIB; Table S5: Contextual comparison of housing typologies under the Q100 design event, including additional reference configurations; Table S6: Contextual comparison of operability by typology and return period (% operable units under design events), including additional reference configurations; Table S7: Contextual comparison of additional reference configurations across land- and water-based siting conditions, provided as supplementary background to the assessed hydro-adaptive typologies (EF, AM, FP); Table S8: Scenario-based comparison of site suitability across gradients of flood threat, water depth, and land–water setting, including additional reference configurations; Figure S1: Component-specific depth–damage curves used in the Building Damage Index (BDI) calculation; Figure S2: Schematic comparison of representative housing typologies under dry and high-water conditions, ranging from conventional slab-on-grade (traditional, adaptable) to hydro-adaptive solutions (3D visualisation and cross sections); Figure S3: Comparative housing typologies under normal conditions (top row) and during a flood event (bottom row): (i) traditional slab-on-grade, (ii) adaptable foundation, (iii) elevated on stilts, (iv) elevated on a terp (raised mound), (v) amphibious dwelling (guided vertical lift), and (vi) floating platform (pontoon with mooring).

Author Contributions

Conceptualisation, J.G., I.M.B. and L.N.; methodology, J.G., I.M.B. and L.N.; software, J.G. and I.M.B.; validation, J.G. and I.M.B.; formal analysis, J.G. and I.M.B.; investigation, J.G. and I.M.B.; resources, J.G. and I.M.B.; data curation, J.G., I.M.B. and L.N.; writing—original draft preparation, J.G., I.M.B. and L.N.; writing—review and editing, J.G., I.M.B. and L.N.; visualisation, J.G.; supervision, L.N.; project administration, J.G. and I.M.B.; funding acquisition, not applicable. All authors have read and agreed to the published version of the manuscript.

Funding

This research received no external funding.

Data Availability Statement

Every dataset generated or employed throughout the present work can be found in the published paper. Supplementary information will be provided by the corresponding author when reasonably requested.

Conflicts of Interest

The authors declare no conflicts of interest.

References

  1. Kundzewicz, Z.W.; Kanae, S.; Seneviratne, S.I.; Handmer, J.; Nicholls, N.; Peduzzi, P.; Mechler, R.; Bouwer, L.M.; Arnell, N.; Mach, K.; et al. Flood risk and climate change: Global and regional perspectives. Hydrol. Sci. J. 2014, 59, 1–28. [Google Scholar] [CrossRef]
  2. Kundzewicz, Z.W.; Su, B.; Wang, Y.; Wang, G.; Wang, G.; Huang, J.; Jiang, T. Flood risk in a range of spatial perspectives—From global to local scales. Nat. Hazards Earth Syst. Sci. 2019, 19, 1319–1328. [Google Scholar] [CrossRef]
  3. Kundzewicz, Z.W.; Januchta-Szostak, A.; Nachlik, E.; Pińskwar, I.; Zaleski, J. Challenges for flood risk reduction in Poland’s changing climate. Water 2023, 15, 2912. [Google Scholar] [CrossRef]
  4. Koks, E.; Rozenberg, J.; Zorn, C.; Tariverdi, M.; Vousdoukas, M.; Fraser, S.; Hall, J.; Hallegatte, S. A global multi-hazard risk analysis of road and railway infrastructure assets. Nat. Commun. 2019, 10, 2677. [Google Scholar] [CrossRef]
  5. IPCC. Climate Change 2021: The Physical Science Basis. Contribution of Working Group I to the Sixth Assessment Report of the Intergovernmental Panel on Climate Change; Cambridge University Press: Cambridge, UK, 2023. [Google Scholar] [CrossRef]
  6. Venegas-Cordero, N.; Kundzewicz, Z.W.; Jamro, S.; Piniewski, M. Detection of trends in observed river floods in Poland. J. Hydrol. Reg. Stud. 2022, 41, 101098. [Google Scholar] [CrossRef]
  7. Ambily, P.; Chithra, N.; Mohammed, F. A framework for urban pluvial flood resilient spatial planning through blue-green infrastructure. Int. J. Disaster Risk Reduct. 2024, 103, 104342. [Google Scholar] [CrossRef]
  8. Zhu, Q.; Klaar, M.; Willis, T.; Holden, J. A quantitative review of natural flood management research: Patterns, challenges and future directions. Wiley Interdiscip. Rev. Water 2025, 12, e1765. [Google Scholar] [CrossRef]
  9. Hill, B.; Liang, Q.; Bosher, L.; Chen, H.; Nicholson, A. A systematic review of natural flood management modelling: Approaches, limitations, and potential solutions. J. Flood Risk Manag. 2023, 16, e12899. [Google Scholar] [CrossRef]
  10. Dadson, S.J.; Hall, J.W.; Murgatroyd, A.; Acreman, M.; Bates, P.; Beven, K.; Heathwaite, L.; Holden, J.; Holman, I.; Lane, S.; et al. A restatement of the natural science evidence concerning catchment-based ‘natural’ flood management in the UK. Proc. R. Soc. A 2017, 473, 20160706. [Google Scholar] [CrossRef]
  11. Huebner, S. Floating and stilted structures as strategies in coastal climate adaptation: Local monsoon adaptation practices and implications for flood risk management. Clim. Risk Manag. 2025, 49, 100719. [Google Scholar] [CrossRef]
  12. Huebner, S. Coastal urban climate adaptation and the advance onto aquatic surfaces using floating solutions: Historical challenges and potential future benefits of floating homes and similar structures. Ocean Coast. Manag. 2025, 261, 107433. [Google Scholar] [CrossRef]
  13. Kalfouni, B.; Rubczak, A.; Wiszniewska, O.; Warżała, P.; Lasota, F.; Kamrowska-Załuska, D. Regional lessons to support local guidelines: Adaptive housing solutions from the Baltic Sea Region for climate-sensitive waterfronts in Gdańsk. Sustainability 2025, 17, 11082. [Google Scholar] [CrossRef]
  14. Pasquier, U.; Nicholls, R.J.; Le Cozannet, G.; Sayers, P.B.; Völz, V.; Hinkel, J.; Toimil, A.; Wolff, C. Structural accommodation as a coastal adaptation response to sea-level rise: Lessons from Europe. Earth’s Future 2026, 14, e2025EF006797. [Google Scholar] [CrossRef]
  15. Ameh, H.E.; Badarnah, L.; Lamond, J. Amphibious architecture: A biomimetic design approach to flood resilience. Sustainability 2024, 16, 1069. [Google Scholar] [CrossRef]
  16. Pasquier, U.; Nicholls, R.J.; Le Cozannet, G.; Sayers, P.B. A comparative assessment of accommodation strategies based on elevated buildings for coastal adaptation. Clim. Risk Manag. 2024, 46, 100655. [Google Scholar] [CrossRef]
  17. Piątek, Ł.; Dal Cin, F.; Gireesh, N. Amphibious buildings as a response to increased flood risk: European case study. In Proceedings of the 3rd World Conference on Floating Solutions (WCFS 2023); Lecture Notes in Civil Engineering; Springer: Singapore, 2024; pp. 613–626. [Google Scholar] [CrossRef]
  18. European Environment Agency. Floating and Amphibious Housing. European Climate Adaptation Platform (Climate-ADAPT), 2023. Available online: https://climate-adapt.eea.europa.eu/en/metadata/adaptation-options/floating-and-amphibious-housing (accessed on 8 December 2025).
  19. Devikrishna, S.; Sharma, K.B. Review of amphibious structures as a flood resilience strategy around the world. Recent Trends Civ. Eng. Technol. 2025, 15, 11–27. Available online: https://journals.stmjournals.com/rtcet/article=2025/view=197130 (accessed on 8 December 2025).
  20. Bradecki, T.; Konsek, P. Examples and concepts of floating architecture in the face of climate change: The example of Szczecin. IOP Conf. Ser. Mater. Sci. Eng. 2020, 960, 032062. [Google Scholar] [CrossRef]
  21. Gorzka, J.; Karczewski, A.; Litwin, W.; Matej-Łukowicz, K.; Nawrot, N.; Nyka, L.; Piątek, Ł. Zero-emissions, off-grid, autonomous houseboat—A case study of selected locations in Europe. Pol. Marit. Res. 2024, 31, 42–60. [Google Scholar] [CrossRef]
  22. Burda, I.; Nyka, L. Innovative urban blue space design in a changing climate: Transition models in the Baltic Sea Region. Water 2023, 15, 2826. [Google Scholar] [CrossRef]
  23. Ruzzo, C.; Cacurri, M.; Arena, F. Rethinking and comprehensive planning of the floating city concept. Commun. Earth Environ. 2026, 7, 196. [Google Scholar] [CrossRef]
  24. Storbjörk, S.; Hjerpe, M. Stuck in experimentation: Exploring practical experiences and challenges of using floating housing to climate-proof waterfront urban development in Sweden. J. Hous. Built Environ. 2022, 37, 2263–2287. [Google Scholar] [CrossRef]
  25. Piątek, Ł.; Wojnowska-Heciak, M. Multicase study comparison of different types of flood-resilient buildings (elevated, amphibious, and floating) at the Vistula River in Warsaw, Poland. Sustainability 2020, 12, 9725. [Google Scholar] [CrossRef]
  26. Attems, M.; Thaler, T.; Genovese, E.; Fuchs, S. Implementation of property-level flood risk adaptation (PLFRA) measures: Choices and decisions. WIREs Water 2020, 7, e1404. [Google Scholar] [CrossRef]
  27. Hudson, P. The affordability of flood risk property-level adaptation measures. Risk Anal. 2020, 40, 1151–1167. [Google Scholar] [CrossRef]
  28. Storbjörk, S.; Hjerpe, M. Climate-proofing coastal cities: What is needed to go from envisioning to enacting multifunctional solutions for waterfront climate adaptation? Ocean Coast. Manag. 2021, 210, 105732. [Google Scholar] [CrossRef]
  29. Lin, F.-Y.; Spijkers, O.; van der Plank, P. Legal framework for sustainable floating city development: A case study of The Netherlands. In WCFS 2020; Lecture Notes in Civil Engineering; Springer: Singapore, 2022; pp. 343–357. [Google Scholar] [CrossRef]
  30. Runhaar, H.; Wilk, B.; Persson, Å.; Uittenbroek, C.; Wamsler, C. Mainstreaming climate adaptation: Taking stock about ‘what works’ from empirical research worldwide. Reg. Environ. Change 2018, 18, 1201–1210. [Google Scholar] [CrossRef]
  31. Birchall, S.; MacDonald, S.; Slater, T. Anticipatory planning: Finding balance in climate change adaptation governance. Urban Clim. 2021, 37, 100859. [Google Scholar] [CrossRef]
  32. Griffiths, J.; Borne, K.; Semadeni-Davies, A.; Tanner, C. Selection, planning, and modelling of nature-based solutions for flood mitigation. Water 2024, 16, 2802. [Google Scholar] [CrossRef]
  33. Head Office of Geodesy and Cartography. Numeryczny Model Terenu (NMT). 2025. Available online: https://www.geoportal.gov.pl/pl/dane/numeryczny-model-terenu-nmt/ (accessed on 8 December 2025).
  34. IMGW-PIB. Dane Publiczne IMGW-PIB (Hydrologia i Meteorologia). 2025. Available online: https://danepubliczne.imgw.pl/ (accessed on 8 December 2025).
  35. MG Hydro. Global Watersheds. 2025. Available online: https://mghydro.com/watersheds/ (accessed on 8 December 2025).
  36. Potapov, P.; Hansen, M.; Pickens, A.; Hernandez-Serna, A.; Tyukavina, A.; Turubanova, S.; Zalles, V.; Li, X.; Khan, A.; Stolle, F.; et al. The global 2000–2020 land cover and land use change dataset derived from the Landsat archive: First results. Front. Remote Sens. 2022, 3, 856903. [Google Scholar] [CrossRef]
  37. NASA Jet Propulsion Laboratory. JPL GRACE and GRACE-FO Mascon Ocean, Ice, and Hydrology Equivalent Water Height JPL Release 06.3 Version 04. 2025. Available online: https://podaac.jpl.nasa.gov/dataset/TELLUS_GRAC-GRFO_MASCON_GRID_RL06.3_V4 (accessed on 8 December 2025).
  38. U.S. Army Corps of Engineers. HEC-RAS River Analysis System: User’s Manual, Version 6.0, CPD-68; USACE-HEC: Davis, CA, USA, 2021; Available online: https://www.hec.usace.army.mil/software/hec-ras/documentation/HEC-RAS_6.0_Users_Manual.pdf (accessed on 8 December 2025).
  39. Fraser, M. Design Research in Architecture: An Overview; Routledge: London, UK, 2013. [Google Scholar] [CrossRef]
  40. Willmott, C.J. Some comments on the evaluation of model performance. Bull. Am. Meteorol. Soc. 1982, 63, 1309–1313. [Google Scholar] [CrossRef]
  41. Horritt, M.S. A methodology for the validation of uncertain flood inundation models. J. Hydrol. 2006, 326, 153–165. [Google Scholar] [CrossRef]
  42. Alexopoulos, M.; Dimitriadis, P.; Iliopoulou, T.; Bezak, N.; Kobold, M.; Koutsoyiannis, D. Effects of digital elevation model resolution on rain-on-grid simulations: A case study in a Slovenian watershed. Hydrol. Sci. J. 2024, 69, 1468–1485. [Google Scholar] [CrossRef]
  43. Ozga-Zielińska, M.; Brzeziński, J. Hydrologia Stosowana; Wydawnictwo Naukowe PWN: Warszawa, Poland, 1997. [Google Scholar]
  44. Instytut Meteorologii i Gospodarki Wodnej. Instrukcja Określania Szorstkości Koryt Rzecznych i Terenów Zalewowych (Instrukcja F); IMGW: Warszawa, Poland, 1979. [Google Scholar]
  45. EN 1997-1:2004; Eurocode 7: Geotechnical Design—Part 1: General Rules. CEN: Brussels, Belgium, 2004.
  46. Rijkswaterstaat. Waterway Guidelines 2020; Centre for Water, Transport and Environment (WVL), Directorate-General for Public Works and Water Management: Rijswijk, The Netherlands, 2020; Available online: https://open.rijkswaterstaat.nl/@165725/waterway-guidelines-2020/ (accessed on 8 December 2025).
  47. Robert McNeel & Associates. Rhino 7. 2024. Available online: https://www.rhino3d.com/7/ (accessed on 8 December 2025).
  48. Robert McNeel & Associates. Grasshopper 1.8. 2024. Available online: https://www.rhino3d.com/features/#grasshopper/ (accessed on 8 December 2025).
  49. Preisinger, C. Linking structure and parametric geometry. Archit. Des. 2013, 83, 110–113. [Google Scholar] [CrossRef]
  50. Scawthorn, C.; Flores, P.; Blais, N.; Seligson, H.; Tate, E.; Chang, S.; Mifflin, E.; Thomas, W.; Murphy, J.; Jones, C.; et al. HAZUS-MH flood loss estimation methodology. II. Damage and loss assessment. Nat. Hazards Rev. 2006, 7, 72–81. [Google Scholar] [CrossRef]
  51. Huizinga, J.; de Moel, H.; Szewczyk, W. Global Flood Depth-Damage Functions: Methodology and the Database with Guidelines; Publications Office of the European Union: Luxembourg, 2017. [Google Scholar] [CrossRef]
  52. Państwowe Gospodarstwo Wodne Wody Polskie. Mapy Zagrożenia Powodziowego—Hydroportal—ISOK. Available online: https://wody.isok.gov.pl/imap_kzgw/?moduleId=gpMZP (accessed on 29 April 2026).
  53. Negussey, E.D. Amphibious Foundation for Flood Hazard Mitigation. Ph.D. Dissertation, Department Civil Environmental Engineering, Syracuse University, Syracuse, NY, USA, 2026. Available online: https://surface.syr.edu/etd/2240/ (accessed on 8 December 2025).
  54. Varkey, M.; Philbin, M. Flood risk mitigation through self-floating amphibious houses: Modelling, analysis, and design. Mater. Today Proc. 2022, 65, 442–447. [Google Scholar] [CrossRef]
  55. Meacham, B.J. Using risk as a basis for establishing tolerable performance: An approach for building regulation. In Special Workshop Risk Acceptance and Risk Communication; Stanford University: Palo Alto, CA, USA, 2007; Available online: https://www.ripid.ethz.ch/Paper/Meacham_paper.pdf (accessed on 8 December 2025).
  56. Azhar, M.; Kane, B.; Vahedifard, F.; AghaKouchak, A. Comprehensive portfolio of adaptation measures to safeguard against evolving flood risks in a changing climate. Commun. Earth Environ. 2025, 6, 824. [Google Scholar] [CrossRef]
  57. Wierzbicki, G.; Ostrowski, P.; Falkowski, T. Applying floodplain geomorphology to flood management (the Lower Vistula River upstream from Plock, Poland). Open Geosci. 2020, 12, 1003–1016. [Google Scholar] [CrossRef]
  58. Gorzka, J.; Nyka, L. A laboratory for adaptation of urban areas to climate change: Flooding resilience and climate-sensitive waterfronts. World Trans. Eng. Technol. Educ. 2024, 22, 261–266. [Google Scholar] [CrossRef]
  59. Adeola, O.K.; Peters, O.R. Assessment of sustainable flood resilient housing: A review. Int. J. Res. Sci. Innov. 2025, 12, 481–494. [Google Scholar] [CrossRef]
  60. Gorzka, J.; Burda, I.; Nyka, L. Walkability and flood resilience: Public space design in climate-sensitive urban environments. Urban Plan. 2025, 10, 9561. [Google Scholar] [CrossRef]
  61. Mugume, S.; Kibibi, H.; Sørensen, J.; Butler, D. Can blue-green infrastructure enhance resilience in urban drainage systems during failure conditions? Water Sci. Technol. 2024, 89, 915–944. [Google Scholar] [CrossRef]
  62. Tiwari, A.; Biswas, R.; Prajapati, V.K.; Chaudhary, U.; Verma, A.; Haider, A. Designing and estimating an amphibious house using lightweight materials to mitigate the devastating effects of floods. Mater. Today Proc. 2023; in press. [CrossRef]
  63. English, E.; Klink, N.; Turner, S. Thriving with water: Developments in amphibious architecture in North America. E3S Web Conf. 2016, 7, 13009. [Google Scholar] [CrossRef]
  64. Danish Maritime Authority. Technical Regulation on the Stability, Buoyancy, etc. of Houseboats and Floating Structures; Danish Maritime Authority: Copenhagen, Denmark, 2007; Available online: https://www.dma.dk/Media/637720424603885615/Technical%20regulation%20on%20the%20stability%20buoyancy%2C%20etc%20of%20houseboats%20and%20floating%20structures.pdf (accessed on 8 December 2025).
  65. Guan, X.; Vorogushyn, S.; Apel, H.; Merz, B. Assessing compound pluvial–fluvial flooding: Research status and ways forward. Water Secur. 2023, 19, 100136. [Google Scholar] [CrossRef]
  66. Hallegatte, S.; Green, C.; Nicholls, R.J.; Corfee-Morlot, J. Future flood losses in major coastal cities. Nat. Clim. Change 2013, 3, 802–806. [Google Scholar] [CrossRef]
  67. Zhang, M.; Nicholls, R.J.; Wen, J.; AghaKouchak, A.; Bouma, T.J.; Darby, S.E.; Du, S.; Dai, Z. Growing compound-flood risk, driven by both climate change and land subsidence, challenges flood risk reduction in major delta cities. One Earth 2025, 8, 101489. [Google Scholar] [CrossRef]
  68. Green, J.M.; Haigh, I.D.; Quinn, N.; Neal, J.C.; Wahl, T.; Wood, M.; Eilander, D.; de Ruiter, M.J.; Ward, P.J.; Camus, P. A comprehensive review of compound flooding literature with a focus on coastal and estuarine regions. Nat. Hazards Earth Syst. Sci. 2025, 25, 747–816. [Google Scholar] [CrossRef]
  69. Skrede, T.; Tørudstad, V.; Pons, V.; Alfredsen, K.; Muthanna, T. From flood paths to floodways, an efficient method to map, identify and evaluate suitable floodways: A case study from Trondheim, Norway. J. Environ. Manag. 2023, 346, 118672. [Google Scholar] [CrossRef]
  70. Valencia-Félix, S.; Anco-Valdivia, J.; Vigil, A.E.; Valdivia, A.H.; Sanchez-Carigga, C. Review of green water systems for urban flood resilience: Literature and codes. Water 2024, 16, 2908. [Google Scholar] [CrossRef]
  71. Ambily, P.; Chithra, N.; Firoz, M.; Viswanath, S. Ecological Flood Resilience Index (EFRI) to assess the urban pluvial flood resilience of blue–green infrastructure: A case from a southwestern coastal city of India. Int. J. Disaster Risk Reduct. 2024, 113, 104867. [Google Scholar] [CrossRef]
  72. Liu, Y.; Zhang, X.; Liu, J.; Wang, Y.; Jia, H.; Tao, S. A flood resilience assessment method of green–grey–blue coupled urban drainage system considering backwater effects. Ecol. Indic. 2025, 170, 113032. [Google Scholar] [CrossRef]
  73. Burda, I.; Nyka, L. Providing public space continuities in post-industrial areas through remodelling land/water connections. IOP Conf. Ser. Mater. Sci. Eng. 2017, 245, 082037. [Google Scholar] [CrossRef]
  74. Wang, M.; Zhao, J.; Xiong, Z.; Zhang, M.; Wang, L.; Tan, S. Strategic deployment of nature-based solutions for urban flood management in high-density urban landscapes. Ecol. Indic. 2025, 176, 113681. [Google Scholar] [CrossRef]
  75. Zhou, H.; Zhao, X.; Zheng, J.; Wu, R.; Yang, Y. Dual-use stormwater detention spaces for pluvial flood-resilient urban renewal: Prototyping, predictive control, and contribution measurement. Sustain. Cities Soc. 2025, 130, 106641. [Google Scholar] [CrossRef]
  76. Dal Cin, F.; Hooimeijer, F.; Silva, M.M. Planning the urban waterfront transformation, from infrastructures to public space design in a sea-level rise scenario: The European Union Prize for Contemporary Architecture case. Water 2021, 13, 218. [Google Scholar] [CrossRef]
  77. Zhou, H.; Zhao, X.; Wu, R. Alleviating urban pluvial floods via dual-use water plazas orchestrated by predictive algorithms. J. Hydrol. 2024, 640, 131695. [Google Scholar] [CrossRef]
  78. Nyka, L.; Burda, I. Scenario-planning solutions for waterfront flood-prone areas. Global J. Eng. Educ. 2020, 22, 149–154. Available online: https://mostwiedzy.pl/pl/publication/download/1/scenario-planning-solutions-for-waterfront-flood-prone-areas_51674.pdf (accessed on 8 December 2025).
  79. Sepe, M. Combining urban strategies for resilience and liveability: Three emblematic case studies. J. Urban Regen. Renew. 2025, 19, 100–118. Available online: https://ideas.repec.org/a/aza/jurr00/y2025v19i1p100-118.html (accessed on 8 December 2025). [CrossRef]
  80. Di Giacomo, T. Spaces and initiatives along the River Aniene. In Waterfront Dialectics: Rome and Its Region Facing Climate Change Impacts; TAB Edizioni: Rome, Italy, 2023; pp. 225–236. [Google Scholar] [CrossRef]
  81. Reinstaller, S.; König, A.; Muschalla, D. Using high-resolution flood hazard and urban heat island maps for high-priority BGI placement at the city scale. Hydrology 2025, 12, 125. [Google Scholar] [CrossRef]
  82. Bista, A.; Paus, K.; Seifert-Dähnn, I. Multi-objective optimization of nature-based solutions in urban stormwater management: A scoping review. Environ. Model. Softw. 2025, 194, 106659. [Google Scholar] [CrossRef]
  83. Aderyani, F.; Jafarzadegan, K.; Moradkhani, H. A surrogate machine learning modeling approach for enhancing the efficiency of urban flood modeling at metropolitan scales. Sustain. Cities Soc. 2025, 123, 106277. [Google Scholar] [CrossRef]
  84. Dang, T.; Tran, B.; Le, Q.; Dang, T.; Tanim, A.; Pham, Q.; Bui, V.; Mai, S.; Thanh, P.; Anh, D. Application of machine learning-based surrogate models for urban flood depth modeling in Ho Chi Minh City, Vietnam. Appl. Soft Comput. 2024, 150, 111031. [Google Scholar] [CrossRef]
  85. Idowu, J.; Alfahid, A. Open problems in uncertainty quantification for flood modelling: A systematic review. Environ. Model. Softw. 2026, 196, 106799. [Google Scholar] [CrossRef]
  86. Delta Programme Commissioner. Room for the River Programme: Maasbommel Amphibious Housing. Climate-ADAPT Case Study, 2025. Available online: https://climate-adapt.eea.europa.eu/en/metadata/case-studies/amphibious-housing-in-maasbommel-the-netherlands (accessed on 8 December 2025).
  87. Peck, A.J.; Adams, S.L.; Armstrong, A.; Bartlett, A.K.; Bortman, M.L.; Branco, A.B.; Brown, M.L.; Donohue, J.L.; Kodis, M.; McCann, M.J. A new framework for flood adaptation: Introducing the Flood Adaptation Hierarchy. Ecol. Soc. 2022, 27, 5. [Google Scholar] [CrossRef]
  88. Calcagni, L.; Ruggiero, A.; Battisti, A. Resilient waterfront futures: Mapping vulnerabilities and designing floating urban models for flood adaptation on the Tiber Delta. Land 2025, 14, 87. [Google Scholar] [CrossRef]
  89. Ministerstwo Infrastruktury. Ustawa Prawo Wodne—Zmiany w Przepisach Dotyczących Terenów Zalewowych. 2025. Available online: https://wodnesprawy.pl/en/government-adopts-amendment-to-the-flood-law/ (accessed on 8 December 2025).
Figure 1. Schematic location of the three case-study areas along the Lower Vistula River corridor (Vistula), Poland.
Buildings 16 01880 g001
Figure 2. Land-cover change in the study watersheds between 2000 and 2020, showing the relative shares of cropland and built-up area normalised to drainage area. The figure provides comparative context for long-term urbanisation pressure across the analysed catchments. Source: Global Watersheds reporting framework based on GLAD data.
Buildings 16 01880 g002
Figure 3. GRACE terrestrial water-storage (TWS) trends in the study watersheds for 2002–2025, expressed as equivalent water-height change. Negative values indicate long-term depletion of terrestrial water storage. Source: Global Watersheds reporting framework based on GRACE data.
Buildings 16 01880 g003
Figure 4. Mean monthly precipitation and evapotranspiration climatology for the study watersheds, derived from WorldClim/GLEAM datasets within the Global Watersheds reporting workflow. The figure provides basin-scale climatic context for interpreting pluvio-fluvial flood conditions across the analysed sites.
Buildings 16 01880 g004
Scheme 1. Multi-stage methodology workflow for hydro-adaptive housing assessment. The framework integrates site data compilation (GIS/LiDAR/IMGW-PIB/Global Watersheds); 1D unsteady HEC-RAS hydraulic modelling (geometry, Q50/Q100/Q500 hydrographs, calibration to the 2010 flood event); research-by-design typology development (EF/AM/FP) with parametric feasibility checks (safety factor > 1.3); performance assessment (h_max, t_ret, BDI, operability), including blue–green sensitivity (bioretention) and uncertainty testing (Q50/Q500; Monte Carlo n = 100); and planning synthesis (decision matrix and transferable guidance).
Buildings 16 01880 sch001
Figure 5. Conceptual pathway diagram linking watershed pressures and flood-response mechanisms with the supporting role of blue–green infrastructure and hydro-adaptive housing within the modelling workflow.
Buildings 16 01880 g005
Figure 6. Simulated flood inundation extents for Torun (Kaszczorek), Tczew (Nadwiślańskie terraces), and Gdansk (Polski Hak) under baseline (0 m), +2 m, +4 m, and +5 m water-level-rise scenarios (relative to Q100), based on HEC-RAS 6.0 models and LiDAR data (0.5 m vertical resolution); source: own study, based on cartographic reference layers from ISOK Hydroportal [52].
Buildings 16 01880 g006
Figure 7. Hydrographic cross-sections of the river in Torun (Kaszczorek), Tczew (Nadwiślańskie terraces), and Gdansk (Polski Hak) showing riverbed profiles (grey) and water-surface elevations for normal-flow conditions (black), Q50 (blue), Q100 (dark blue), and Q500 (light blue); source: own study, based on online GRACE dataset [37].
Buildings 16 01880 g007
Figure 8. Percentage of inundated area (%) within study site boundaries for Torun (navy blue), Tczew (gray), and Gdansk (light blue) under incremental water level rises of 0 m (Q100 baseline), +2 m, +4 m, and +5 m relative to baseline, derived from HEC-RAS 6.0 maximum extent outputs; source: own study, with site-context information derived from Global Watersheds [35].
Buildings 16 01880 g008
Figure 9. Schematic illustration of the three assessed hydro-adaptive typologies under dry and high-water conditions (3D visualisation and cross-sections): elevated foundations (EF; including elevated-on-stilts and elevated-on-terp configurations), amphibious dwellings (AM; guided vertical lift), and floating platforms (FP; pontoon with mooring). Functional water-level ranges used in scenario testing were: EF: 0–2 m, AM: 0–4 m, FP: 1–5 m (Table 4). Note: For contextual background, a broader version of this comparison is provided in Supplementary Figure S2; it is not included in the core comparative assessment.
Buildings 16 01880 g009
Figure 10. Schematic illustration of the three assessed hydro-adaptive typologies under normal conditions (top row) and during a flood event (bottom row): elevated foundations (EF), amphibious dwellings (AM), and floating platforms (FP). Within the EF category, two representative raised configurations are shown: on stilts and on a terp. Source: own study. Note: For contextual background, a broader version of this comparison is provided in Supplementary Figure S3; it is not included in the core comparative assessment.
Buildings 16 01880 g010
Scheme 2. Conceptual decision-support framework linking the assessed hydro-adaptive typologies (EF, AM, and FP) to land–water settings, flood-threat levels, water-depth regimes, and access/mooring conditions across the gradient from land-based to water-based environments. The scheme synthesises the site-dependent suitability logic derived from the comparative assessment and indicates how typology preference shifts under contrasting hydraulic and spatial conditions. Source: own study.
Buildings 16 01880 sch002
Figure 11. Conceptual site–hazard–typology visualisation supporting interpretation of the assessed hydro-adaptive typologies (EF, AM, and FP) across gradients of flood threat, water-depth regime, and land–water setting in the three case-study sites (Torun, Tczew, and Gdansk). Blue volumes indicate high-suitability conditions identified through HEC-RAS-based hazard mapping and parametric evaluation; labels within the diagram are illustrative and do not denote additional independently assessed typologies. Source: own study.
Buildings 16 01880 g011
Figure 12. Comparative site overview of flood-threat and water-depth suitability across the three case-study locations (Torun, Tczew, and Gdansk), indicating the relative suitability of the assessed hydro-adaptive typologies across land, transitional, and surface-water conditions; source: own study.
Buildings 16 01880 g012
Figure 13. Example deployment scenarios illustrating the practical application of the suitability framework: (i) an amphibious structure in a transformed coastal setting with a high flood threat and shallow water and (ii) a floating structure in a transformed coastal setting with a high flood threat and deep water. Source: own study.
Buildings 16 01880 g013
Table 1. Baseline watershed characteristics for the case-study areas.
Case-Study AreaPopulation
Density in Drainage Area (Persons/km2)
Cropland
(2020, %)
Built-Up Change (2000–2020, %)Mean Annual Precipitation (mm/Year)GRACE Trend (cm/Decade)
Gdansk (delta)2254054652−1.4
Tczew (lower Vistula)1213433600−5.0
Torun (Vistula—Drweca
confluence)
794854601−3.0
Sources: Global Watersheds reporting products (2025–2026), including GLAD land cover (2000–2020), GlobPop (2020), WorldClim/GLEAM climate and water-flux layers, GRACE (Gravity Recovery and Climate Experiment) terrestrial water-storage anomalies, and Global Dam Watch. Cropland share normalised to drainage area. Built-up change reported as percentage change over 2000–2020.
Table 2. Key HEC-RAS parameter settings and calibration target.
ParameterValue/RangeBasis/Source
Manning’s n (channel)0.025–0.040Instrukcja F [44]
Manning’s n (floodplain)0.035–0.100Instrukcja F [44]
Calibration eventMay–June 2010 flood eventObserved water levels (IMGW-PIB)
Calibration metric/performanceRMSE < 0.22 mRMSE between simulated and observed water levels at observation locations
Computational time step1–5 s (stability-tested; see note)HEC-RAS unsteady-flow stability testing
Downstream boundary condition (Gdansk)Baltic Sea stage (mean level) + storm-surge stage curveExtreme value analysis; Baltic Sea downstream stage boundary
Downstream boundary condition (Torun, Tczew)Gauge-based stage–discharge (rating curve) or observed stage time seriesIMGW-PIB gauging data
Monte Carlo roughness perturbationn = 100 samples; channel ± 10%, floodplain ± 15% around calibrated nUniform distribution within ranges
Hydrostatic safety factor (typologies)1.3 (dead 2.5 kN/m2, live 1.5 kN/m2)EN 1997-1:2004 [45];
Dutch amphibious guidelines [46];
Supplementary Materials (Table S1)
Note: The computation time step was selected through numerical stability testing and adjusted where necessary to avoid oscillations in simulated stages during high-flow routing.
Table 3. Conceptual linkage between watershed context and hydro-adaptive housing typology selection used to guide typology development across the three case-study settings. Rationale: realistic values for 1D HEC-RAS in Polish lowland valleys.
CaseWatershed ContextHydro-Adaptive Housing TypologyNumber of Cross-SectionsMean Spacing (m)Local Range (m)Record PeriodQ50 (m3/s)Q100 (m3/s)Q500 (m3/s)
TorunConfluence dynamics/
rapid urban growth
Amphibious dwellings (floodplain belts)355030–1201951–202495012501850
TczewLarge, regulated basin/
prolonged inundation potential
Elevated foundations (flood zones); floating platforms (quays)426020–2001956–2024145019002800
GdanskSmall coastal catchment/
backwater influence
Modular floating plat-forms; amphibious dwellings287525–1501967–2024125016502450
Table 4. Functional water-level ranges used for typology scenario testing.
CodeTypologyCore MechanismFunctional Water-Level Range
EFElevated foundationsRaised structure on a terp or stilts (static elevation above flood levels)0–2 m
AMAmphibious dwellingsVertical guidance frame allowing controlled lifting during flooding0–4 m
FPFloating platformsPontoon-based platform with mooring for horizontal stability1–5 m
Note: Functional water-level ranges indicate the water-level variation (relative to local ground level) for which each typology was parameterised and scenario-tested in the hydraulic–design coupling; thresholds reflect typical operational limits under the design events. For EF, the range denotes design inundation levels accommodated by static elevation rather than a moving mechanism.
Table 5. BDI parameters.
ComponentWeight (%)Critical Depth (m)Damage Curve (%)
Foundations200–1.50–100
Load-bearing walls400.5–3.020–80
Finishes251.0–2.050–95
Systems150.3–1.530–90
Table 6. Hydrodynamic simulation outputs by site and return period.
SiteReturn PeriodMax Depth (m)Affected Area (%)Retention Time (h)
Torun50-year1.88.236
100-year2.414.158
500-year3.121.884
Tczew50-year2.515.872
100-year3.823.496+
500-year4.832.196+
Gdansk50-year2.112.548
100-year3.218.772
500-year4.125.396
Table 7. Performance comparison of housing typologies under the Q100 design event.
TypologyBuilding Damage IndexOperability ScoreMaximum Functional Water Depth (m)Cost Factor
Elevated Foundations0.41 ± 0.090.652.01.3
Amphibious Dwellings0.26 ± 0.070.854.01.8
Floating Platforms0.05 ± 0.021.005.0+2.5
Note: Cost estimates were derived from Gorzka et al. [21] and adapted to the present typology comparison. For contextual background, a broader comparison including additional reference configurations is provided in Supplementary Table S5; it is not included in the core comparative assessment.
Table 8. Comparative performance of hydro-adaptive housing typologies under the Q100 design event.
TypologyEffective Flood Depth RangeBDI Reduction vs. Slab-on-GradeOperability ThresholdKey Limitations
Elevated foundation (EF)0–2 m35–40%Not operable beyond ~2 m (site-dependent: ~2.0–2.5 m)Rapid loss of effectiveness once freeboard exceeded
Amphibious dwelling (AM)0–4 mUp to 62%Operable up to ~4.0 mRequires guided frame; higher engineering demand
Floating platform (FP)1–5+ m~90–100% (BDI ≈ 0 in tested casesFully operable across all tested scenariosHigh initial investment; infrastructure/mooring requirements
Source: own study.
Table 9. Operability of the assessed hydro-adaptive typologies by return period (% operable units under design events).
TypologyQ50 (%)Q100 (%)Q500 (%)
EF1006510
AM1008540
FP100100100
Note: Values were estimated from the functional ranges defined in Section 2.4 and the inundation exceedance across the study sites reported in Section 3.1. EF was considered non-operable above ~2 m and AM above ~4 m, whereas FP remained operable across the tested scenarios. For example, Q50 rarely exceeded 2 m in Torun and Gdansk, whereas Q500 frequently exceeded 4 m in Tczew. For contextual background, a broader comparison including additional reference configurations is provided in Supplementary Table S6; it is not part of the core comparative assessment.
Table 10. Site-suitability distribution of the assessed hydro-adaptive typologies across land- and water-based siting conditions in flood-threatened areas. Within the EF category, two representative raised subtypes are distinguished (stilts and terp); source: own study.
Flood-Threatened Areas
Elevated–Stilts (EF)Elevated–Terp (EF)Amphibious (AM)Floating (FP)
Structures on landBuildings 16 01880 i001Buildings 16 01880 i002Buildings 16 01880 i003
1212120
Structures on waterBuildings 16 01880 i004Buildings 16 01880 i005Buildings 16 01880 i006Buildings 16 01880 i007
451012
Total number of possible occurrences16172212
Note: Elevated–stilt and elevated–terp configurations are treated here as representative EF-related variants; amphibious corresponds to AM, and floating corresponds to FP. For contextual background, a broader comparison is provided in Supplementary Table S7; it is not included in the core comparative assessment.
Table 11. Scenario-based suitability of the assessed hydro-adaptive typologies and related structural variants across gradients of flood threat, water depth, and land–water setting. Within the EF category, elevated–stilt and elevated–terp configurations are distinguished as representative raised subtypes.
Scenarios:
Coast, Flood Threat, Water Depth
Flood-Threatened Areas
Structures on LandStructures on Water
EFAMEFAMFP
Elevated–StiltsElevated–TerpAmphibiousElevated–StiltsElevated–TerpAmphibiousFloating
Transformed coast, low flood threat, shallow water1101100
Transformed coast, low flood threat, variable water1101111
Transformed coast, low flood threat, deep water1100011
Natural coast, low flood threat,
shallow water
1101100
Natural coast, low flood threat, variable water1101111
Natural coast, low flood threat, deep water1100011
Transformed coast, medium flood threat, shallow water1110110
Transformed coast, medium flood threat, variable water1110011
Transformed coast, medium flood threat, deep water1110011
Natural coast, medium flood threat, shallow water1110010
Natural coast, medium flood threat, variable water1110011
Natural coast, medium flood threat, deep water1110011
Transformed coast, high flood threat, shallow water0010000
Transformed coast, high flood threat, variable water0010001
Transformed coast, high flood threat, deep water0010001
Natural coast, high flood threat
shallow water
0010000
Natural coast, high flood threat, variable water0010001
Natural coast, high flood threat, deep water0010001
Note: Elevated–stilt and elevated–terp configurations are treated here as representative EF-related variants; amphibious corresponds to AM; floating corresponds to FP; 1 = feasible, 0 = not feasible. For contextual background, a broader comparison is provided in Supplementary Table S8; it is not included in the core comparative assessment.
Disclaimer/Publisher’s Note: The statements, opinions and data contained in all publications are solely those of the individual author(s) and contributor(s) and not of MDPI and/or the editor(s). MDPI and/or the editor(s) disclaim responsibility for any injury to people or property resulting from any ideas, methods, instructions or products referred to in the content.