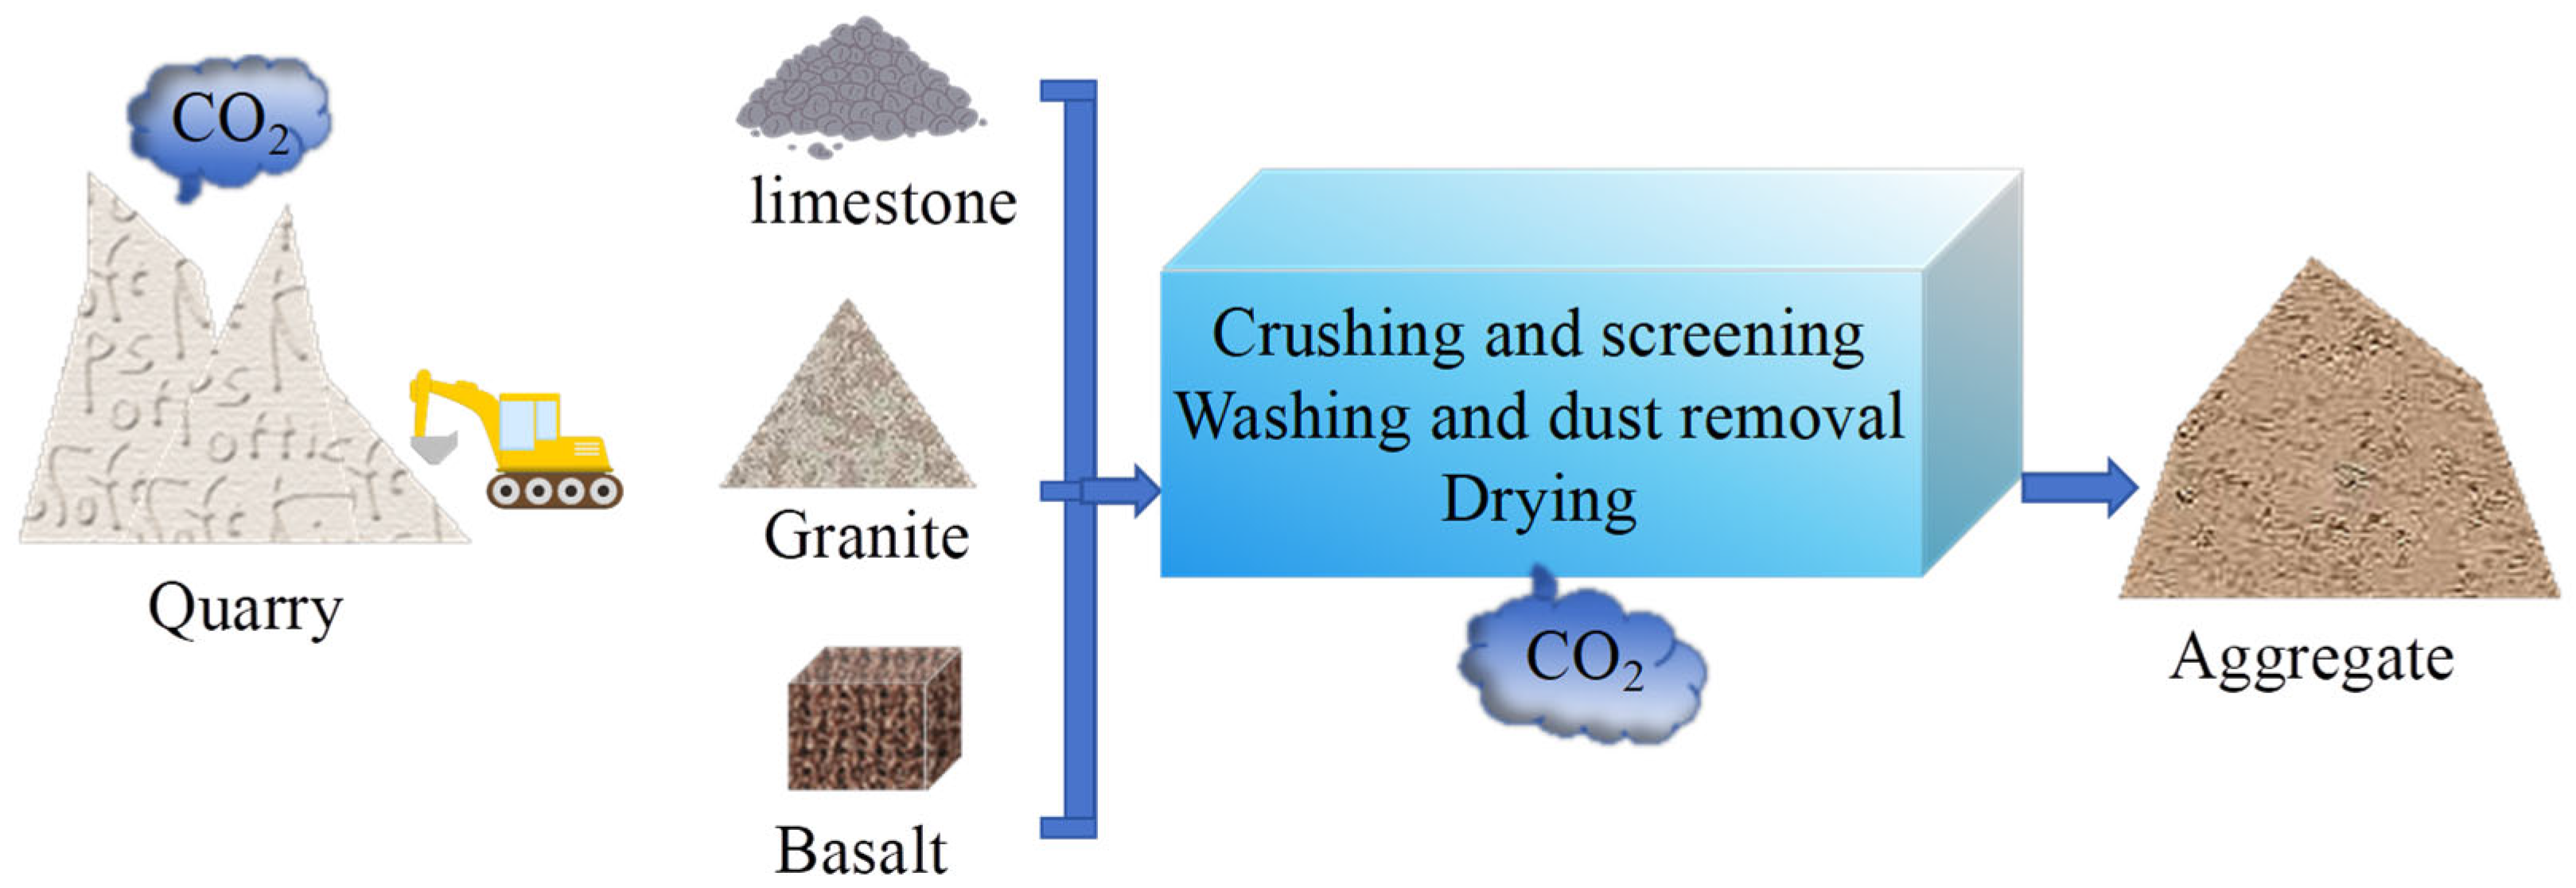
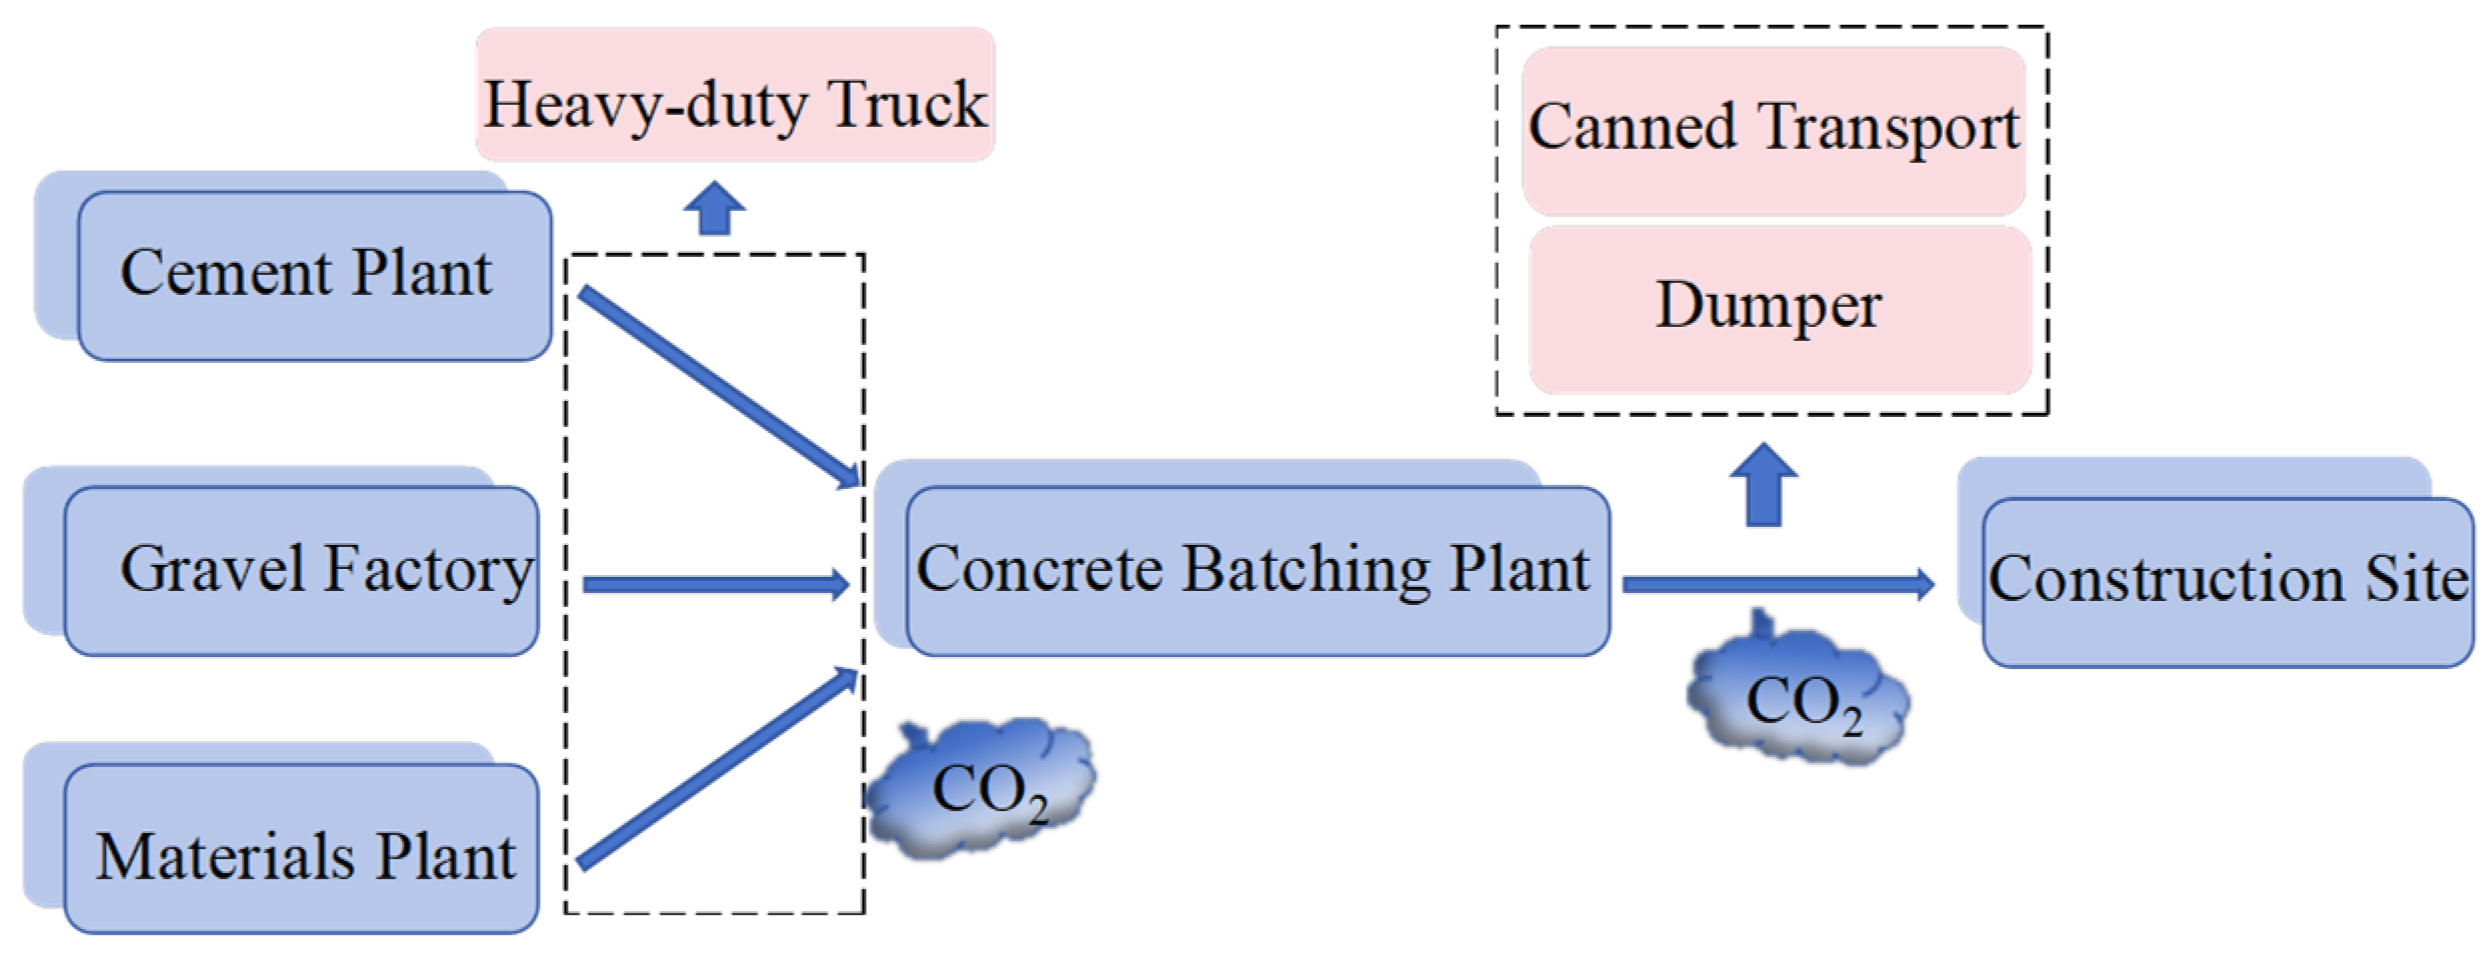
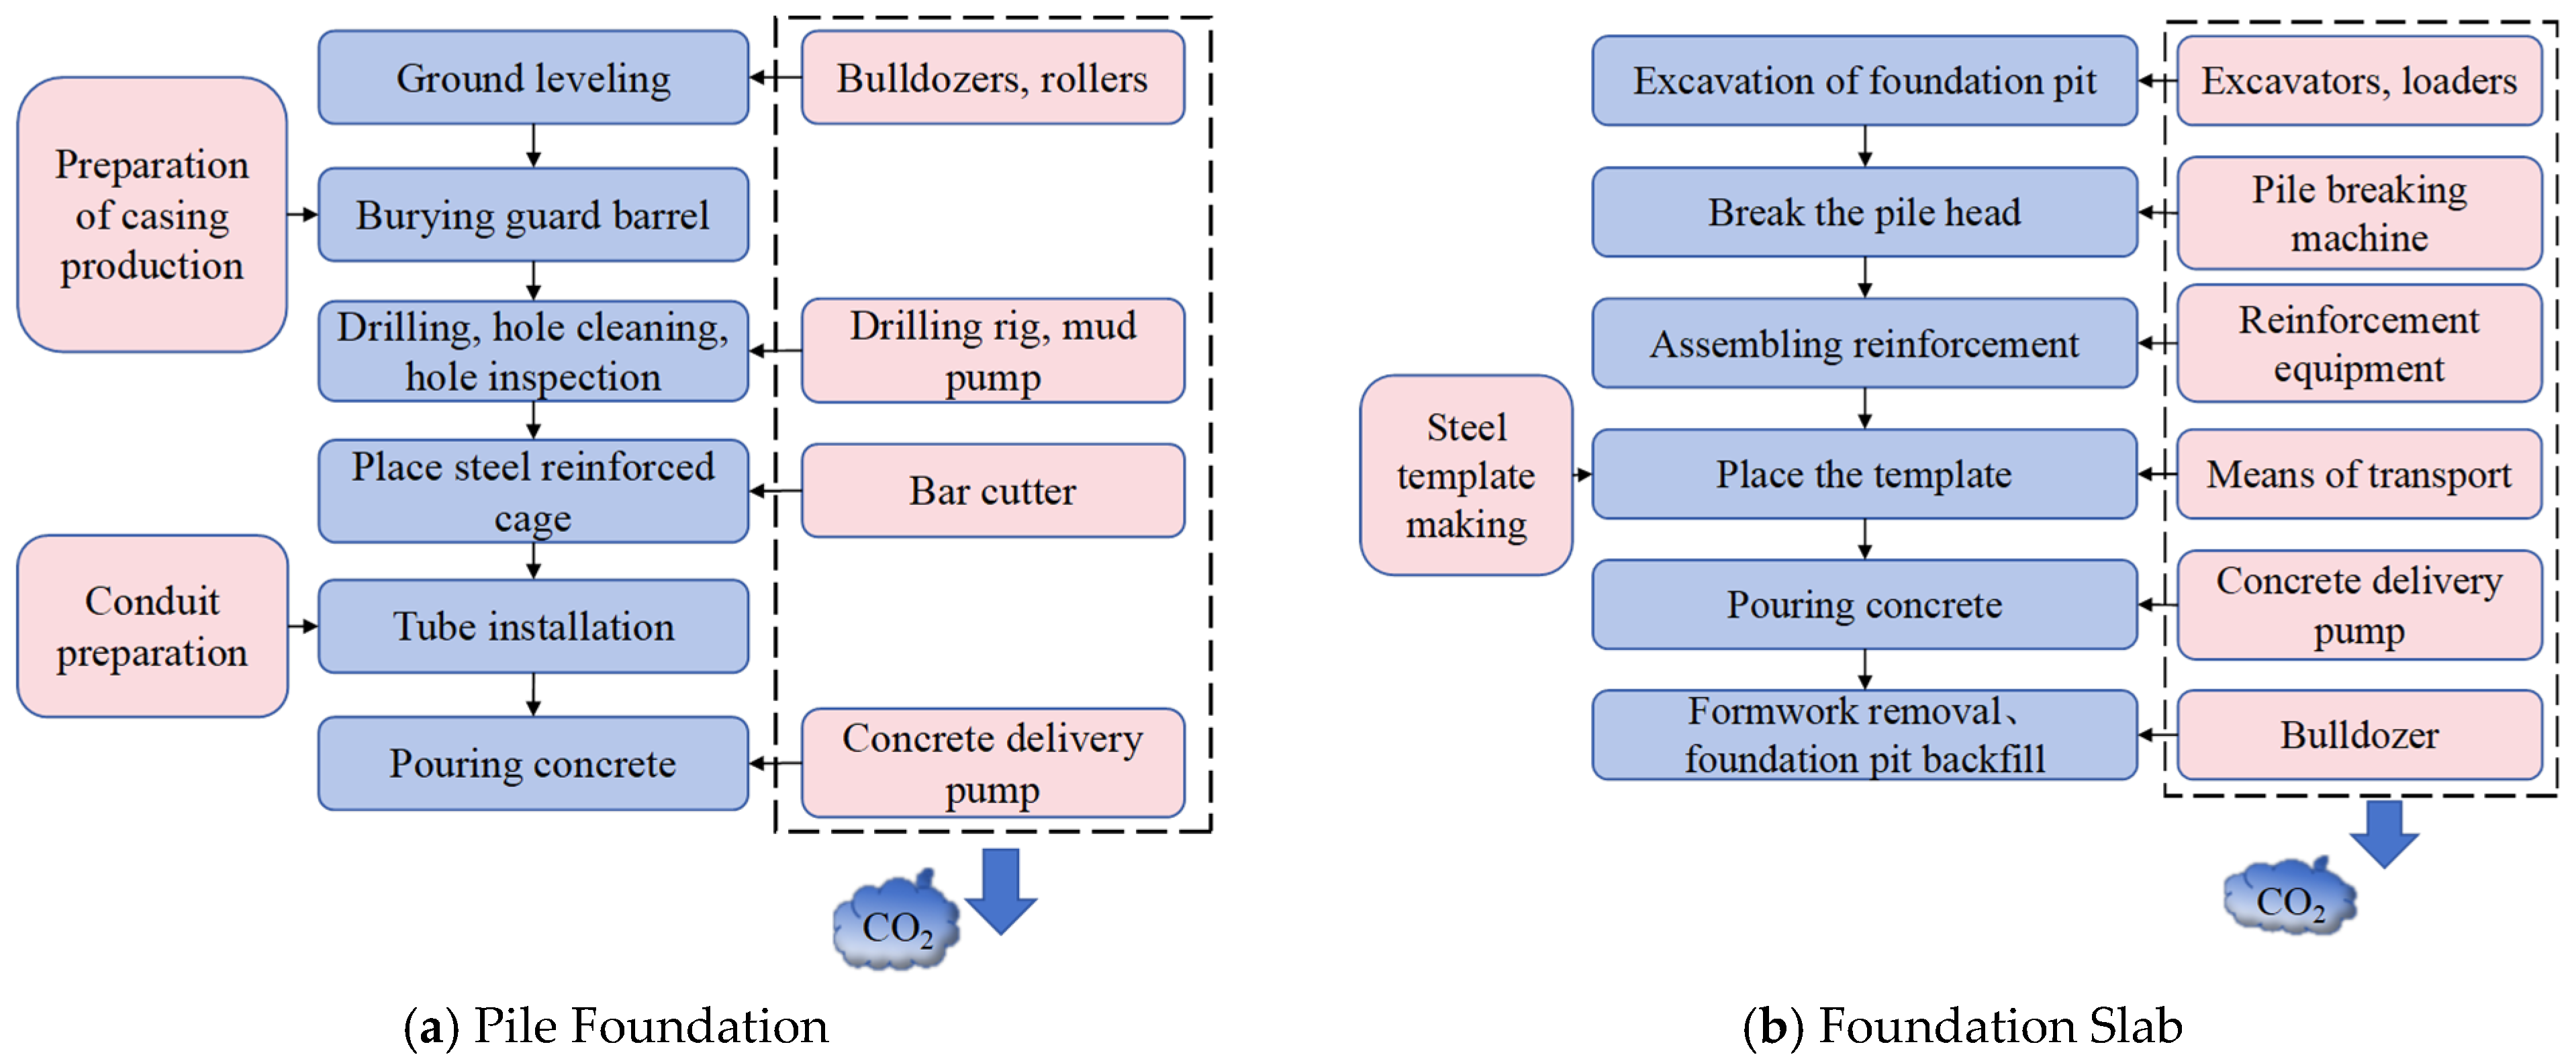
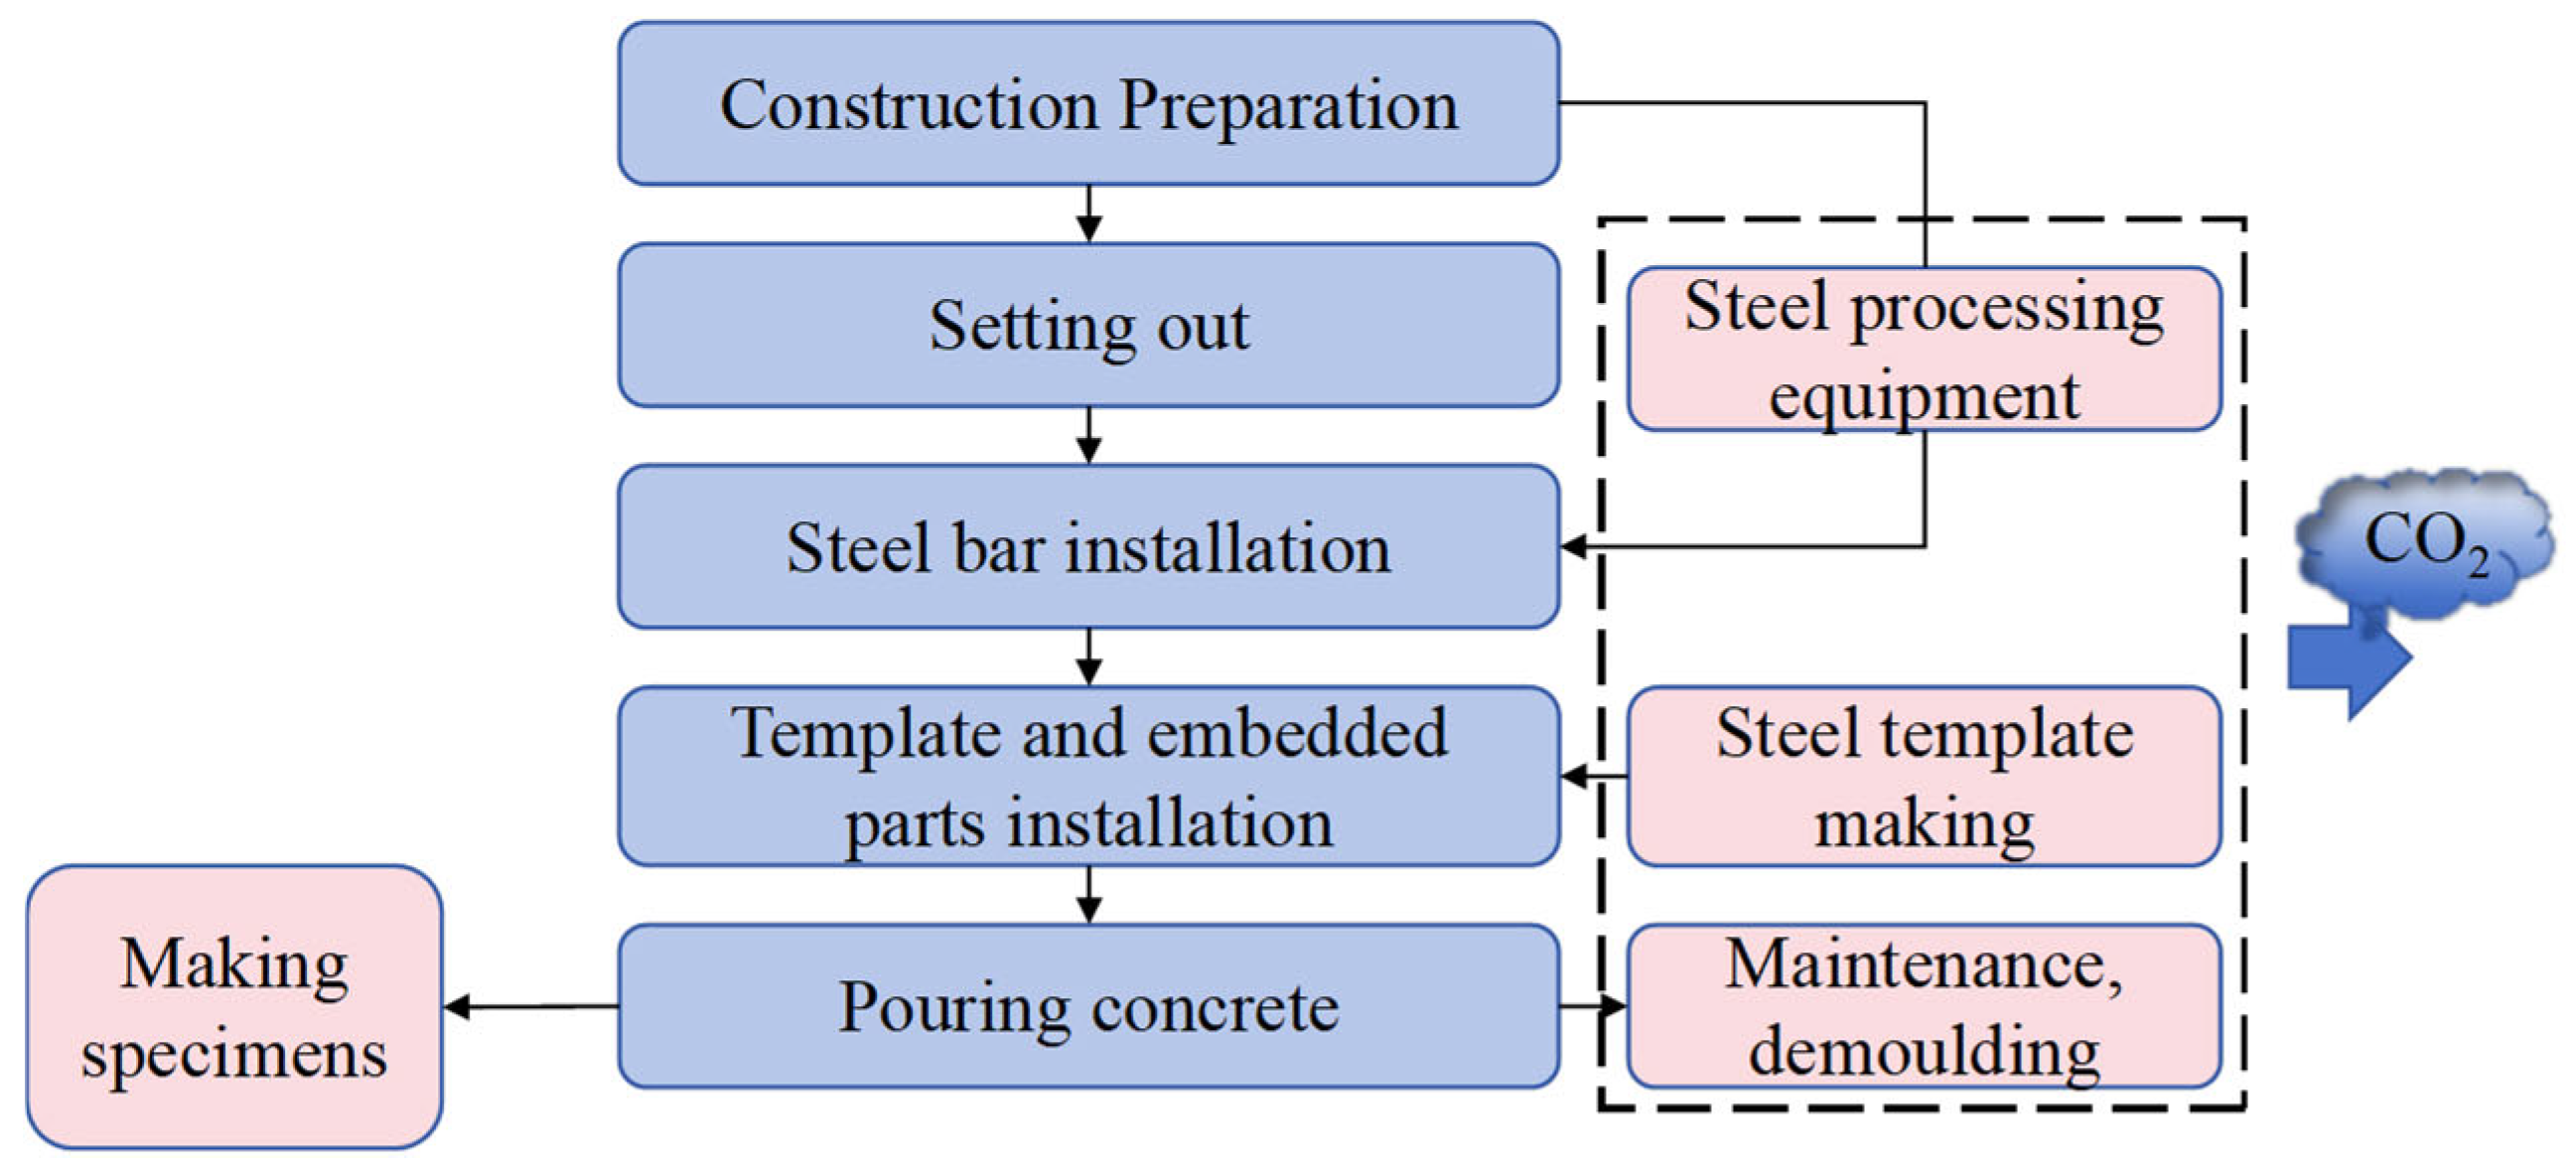
4.3.1. Carbon Emission Analysis of Building Materials Production
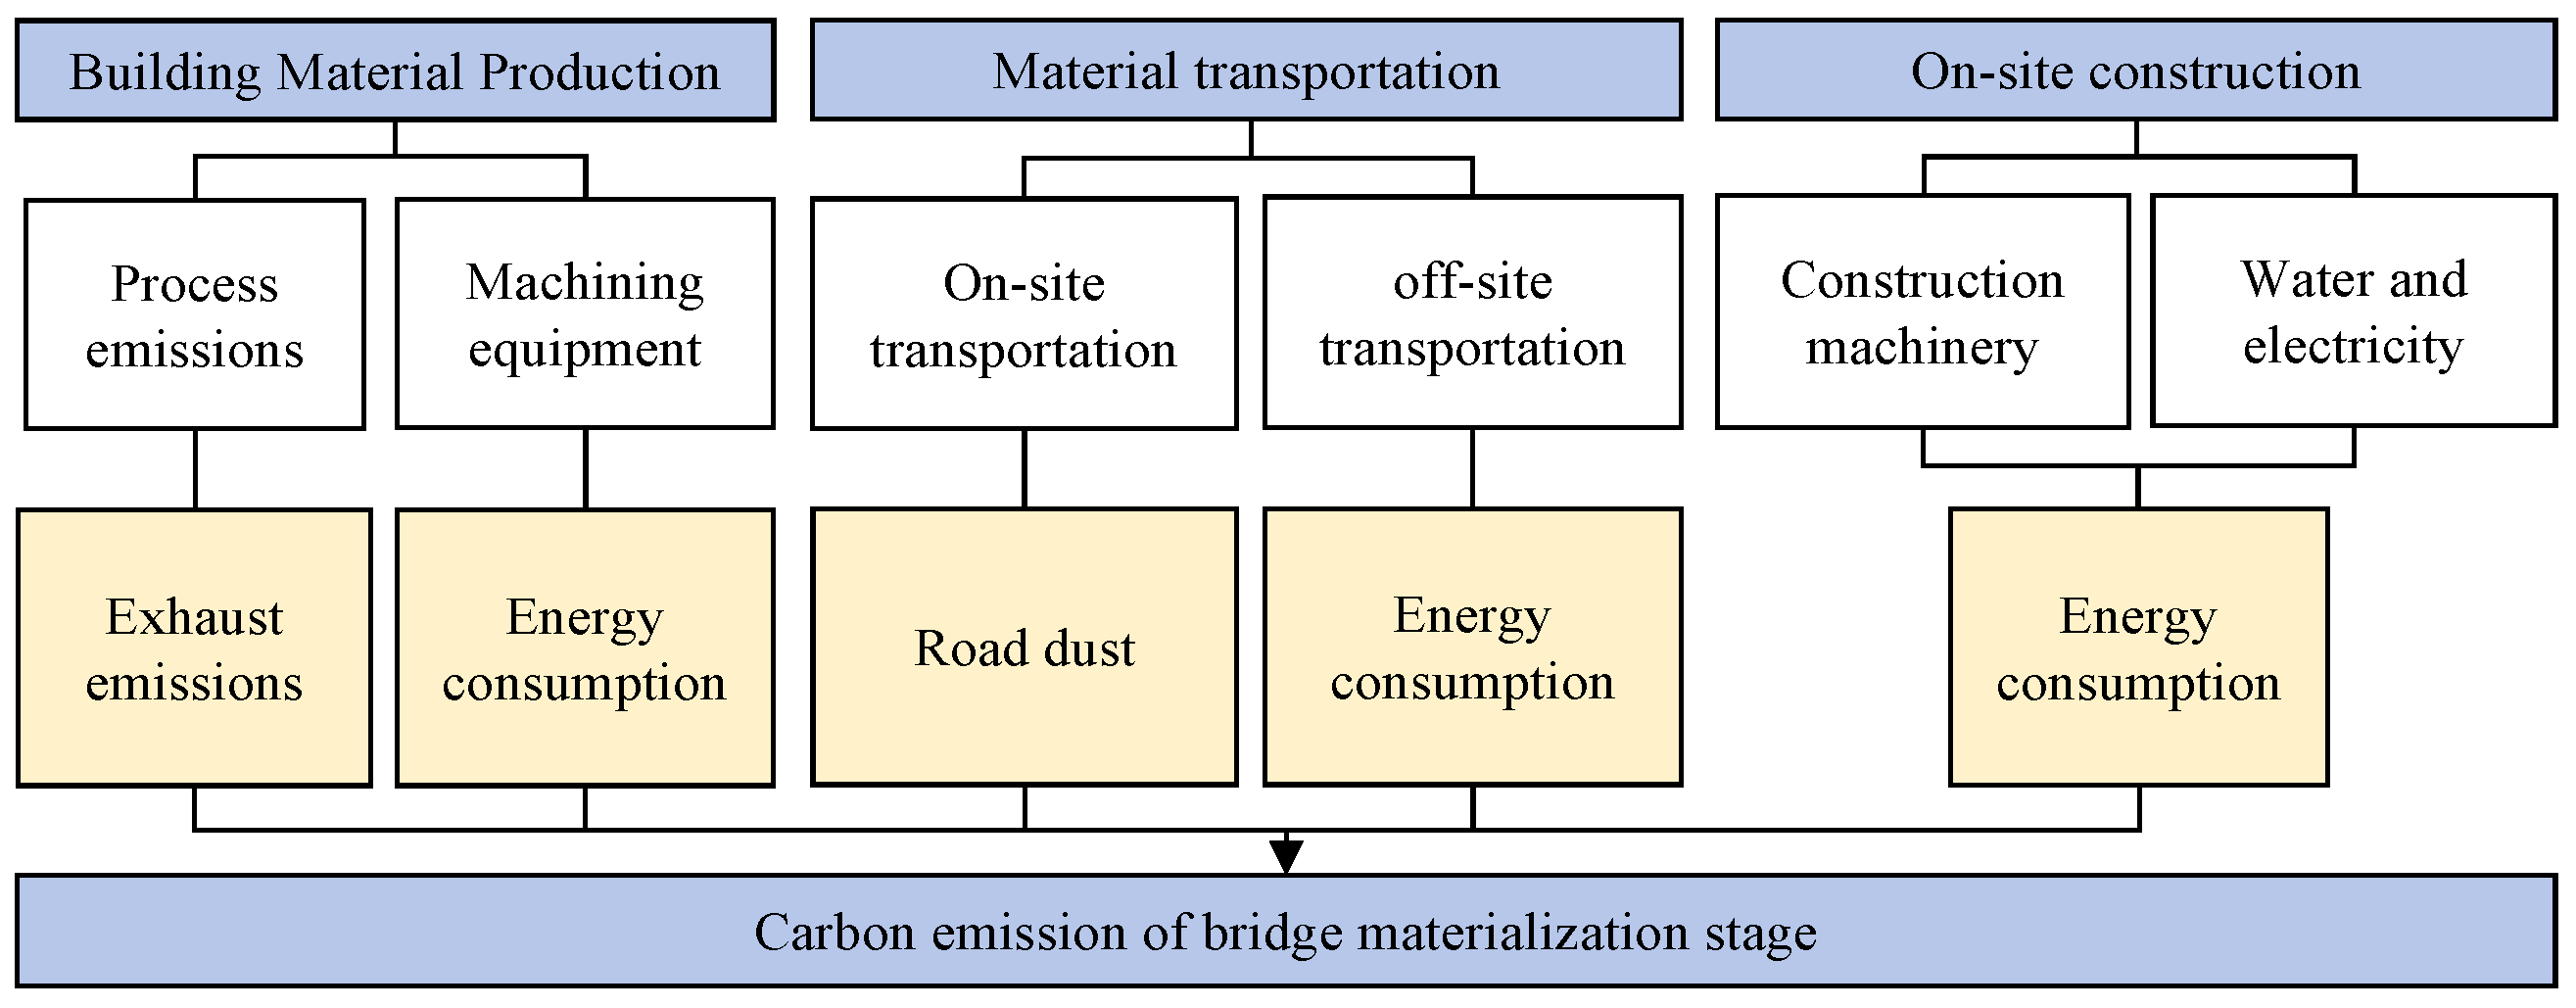
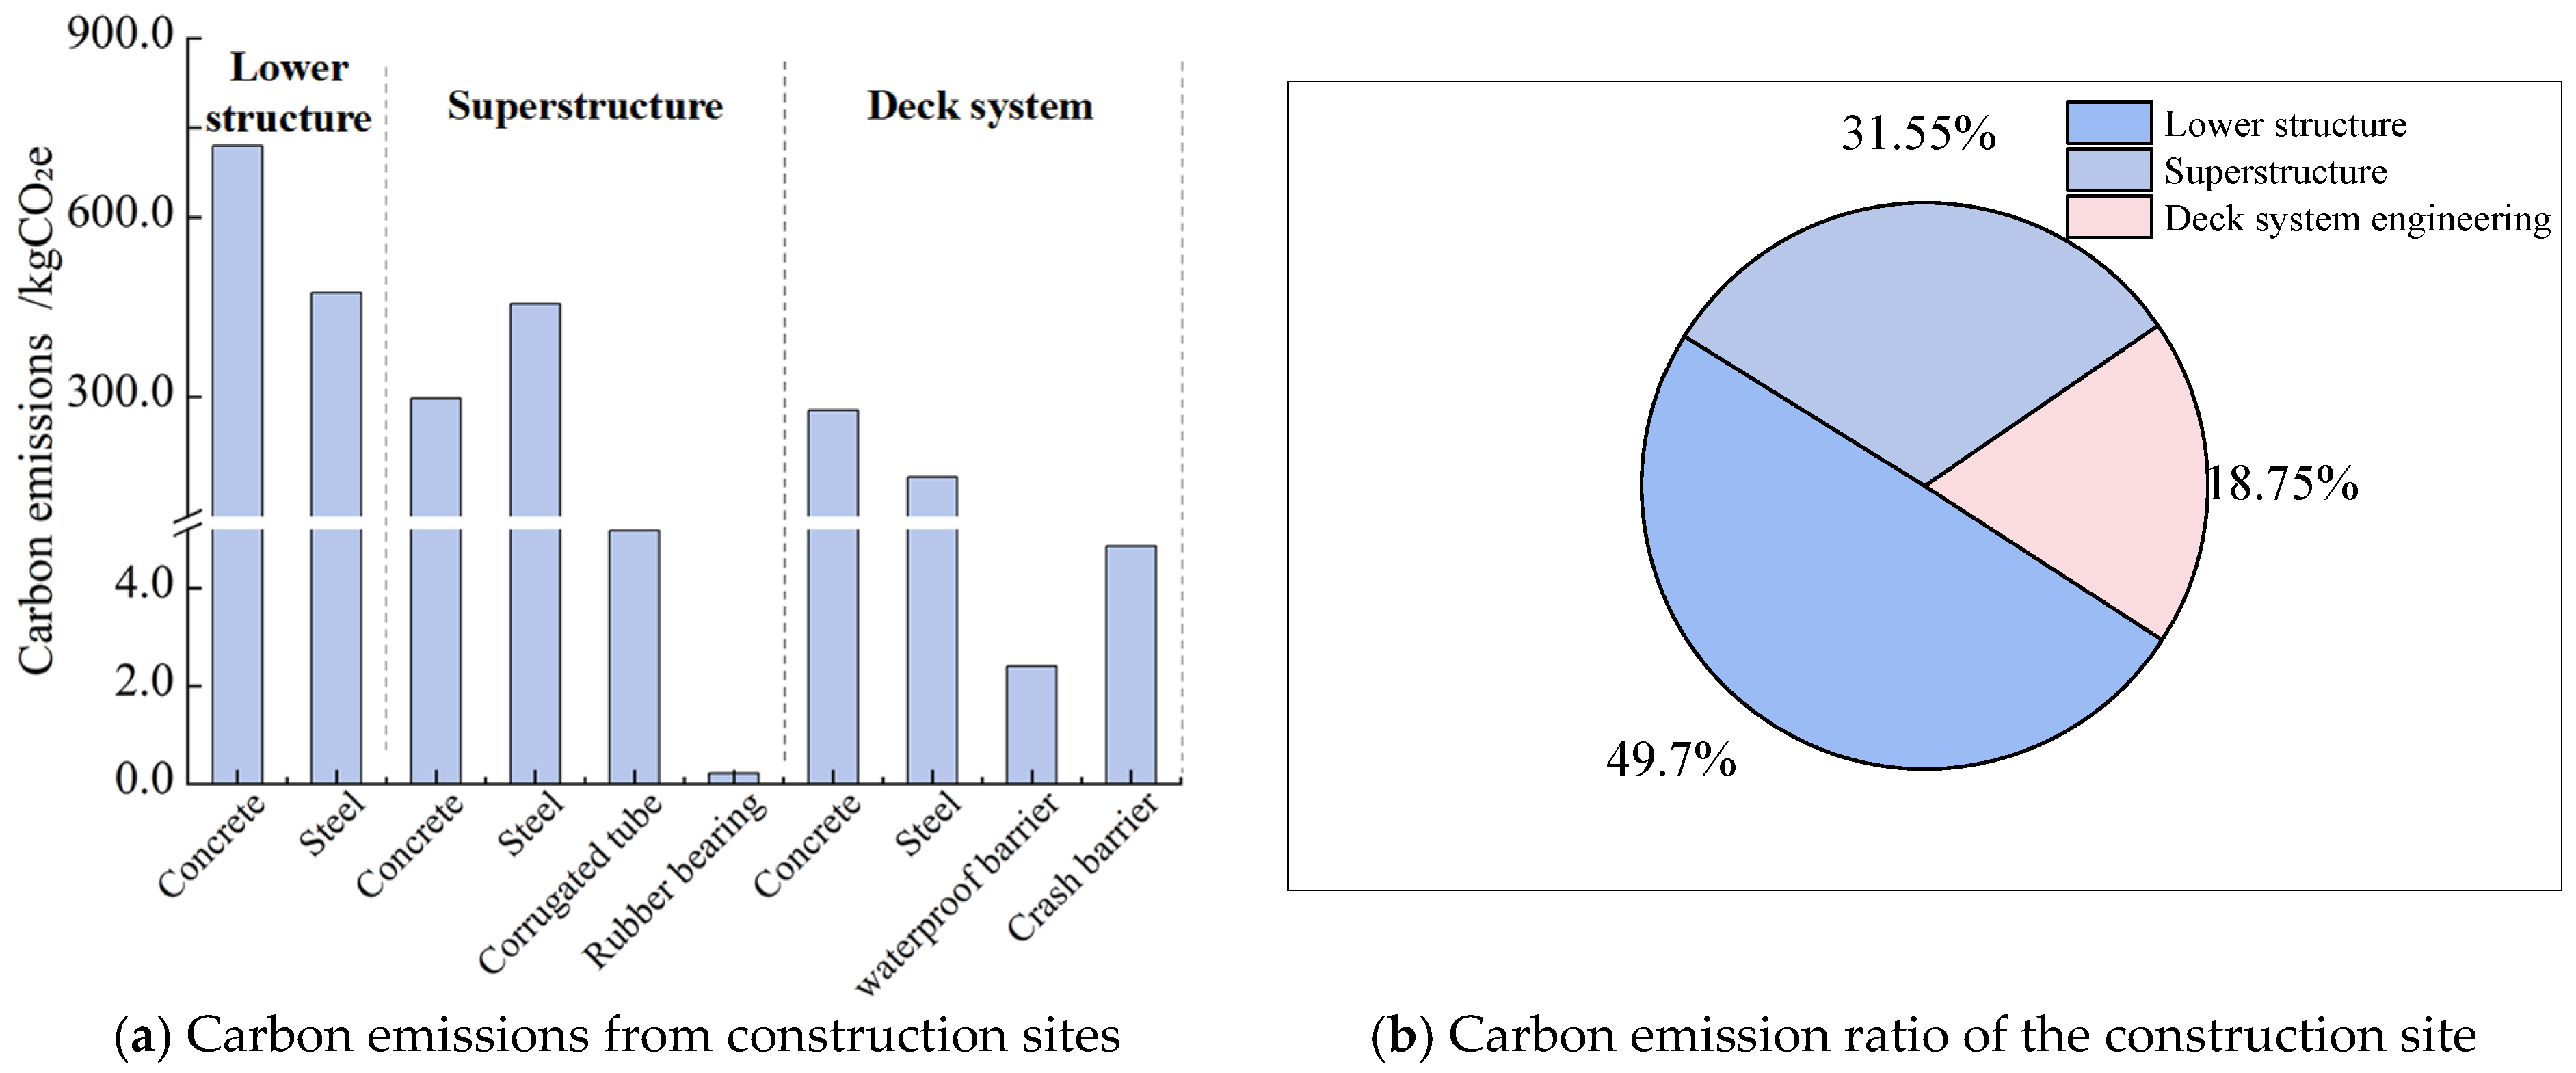
The carbon emissions in the production and use of concrete and steel are not only affected by the dosage, but also closely related to the carbon strength of the material and the structural design parameters. Based on the above quantitative results, the carbon emissions and proportions of each part of the construction are shown in
Figure 11a and
Figure 11b, respectively. Furthermore, to analyze the carbon emission intensity of different materials in various components, the unit carbon emission factor of each material was calculated by dividing the total carbon emissions of each material by its consumption quantity, with the results presented in
Table 10.
From the perspective of components, the substructure and superstructure are the fundamental sources of carbon emissions. Together, they account for 81.25% of the total emissions, among which the substructure accounts for 49.7% and the superstructure accounts for 31.55%. This distribution characteristic stems from the differences in mechanical functions and structural scales between the two components. The substructure, including pile foundations, bearing platforms, and piers, undertakes the core function of transferring the entire bridge load to the foundation. It requires mass concrete and dense reinforcement, resulting in a large base consumption of building materials. The superstructure is dominated by box girders. Although its concrete consumption only accounts for 12.3% of that of the substructure, C50 high-strength concrete is adopted to meet the flexural and shear resistance requirements under large spans. Its carbon emission factor is remarkably higher than that of C30 concrete commonly used in the substructure, leading to prominent carbon emissions. Meanwhile, the superstructure features large spans and numerous components, resulting in a considerable cumulative consumption of steel and concrete as well. In contrast, the deck system and auxiliary structures (waterproof layers, anti-collision guardrails, etc.) have relatively low absolute carbon emissions, but exhibit high carbon emission intensity per unit engineering quantity. For instance, modified asphalt waterproofing layers, due to their high energy consumption during production and large carbon emission factors, still generate considerable emissions even with a limited engineering quantity.
From the material characteristics shown in
Table 10, the carbon emission contribution rate of steel is significantly higher than its mass proportion, revealing the decisive effect of material carbon intensity on the emission structure. In the substructure, steel accounts for only 3% of the total mass of this component but contributes 39.7% of its carbon emissions; in the superstructure, steel accounts for 7% of the total mass, with a carbon emission contribution rate as high as 60.25%. The contrast between “low mass proportion yet high carbon emission contribution” stems from the fact that the unit carbon emission factor of steel is much higher than that of concrete. Although concrete accounts for the majority of total emissions due to its massive consumption, its unit carbon intensity is relatively stable. Owing to its high carbon intensity, steel has become a key breakthrough for optimizing reinforcement ratios and promoting high-strength steel.
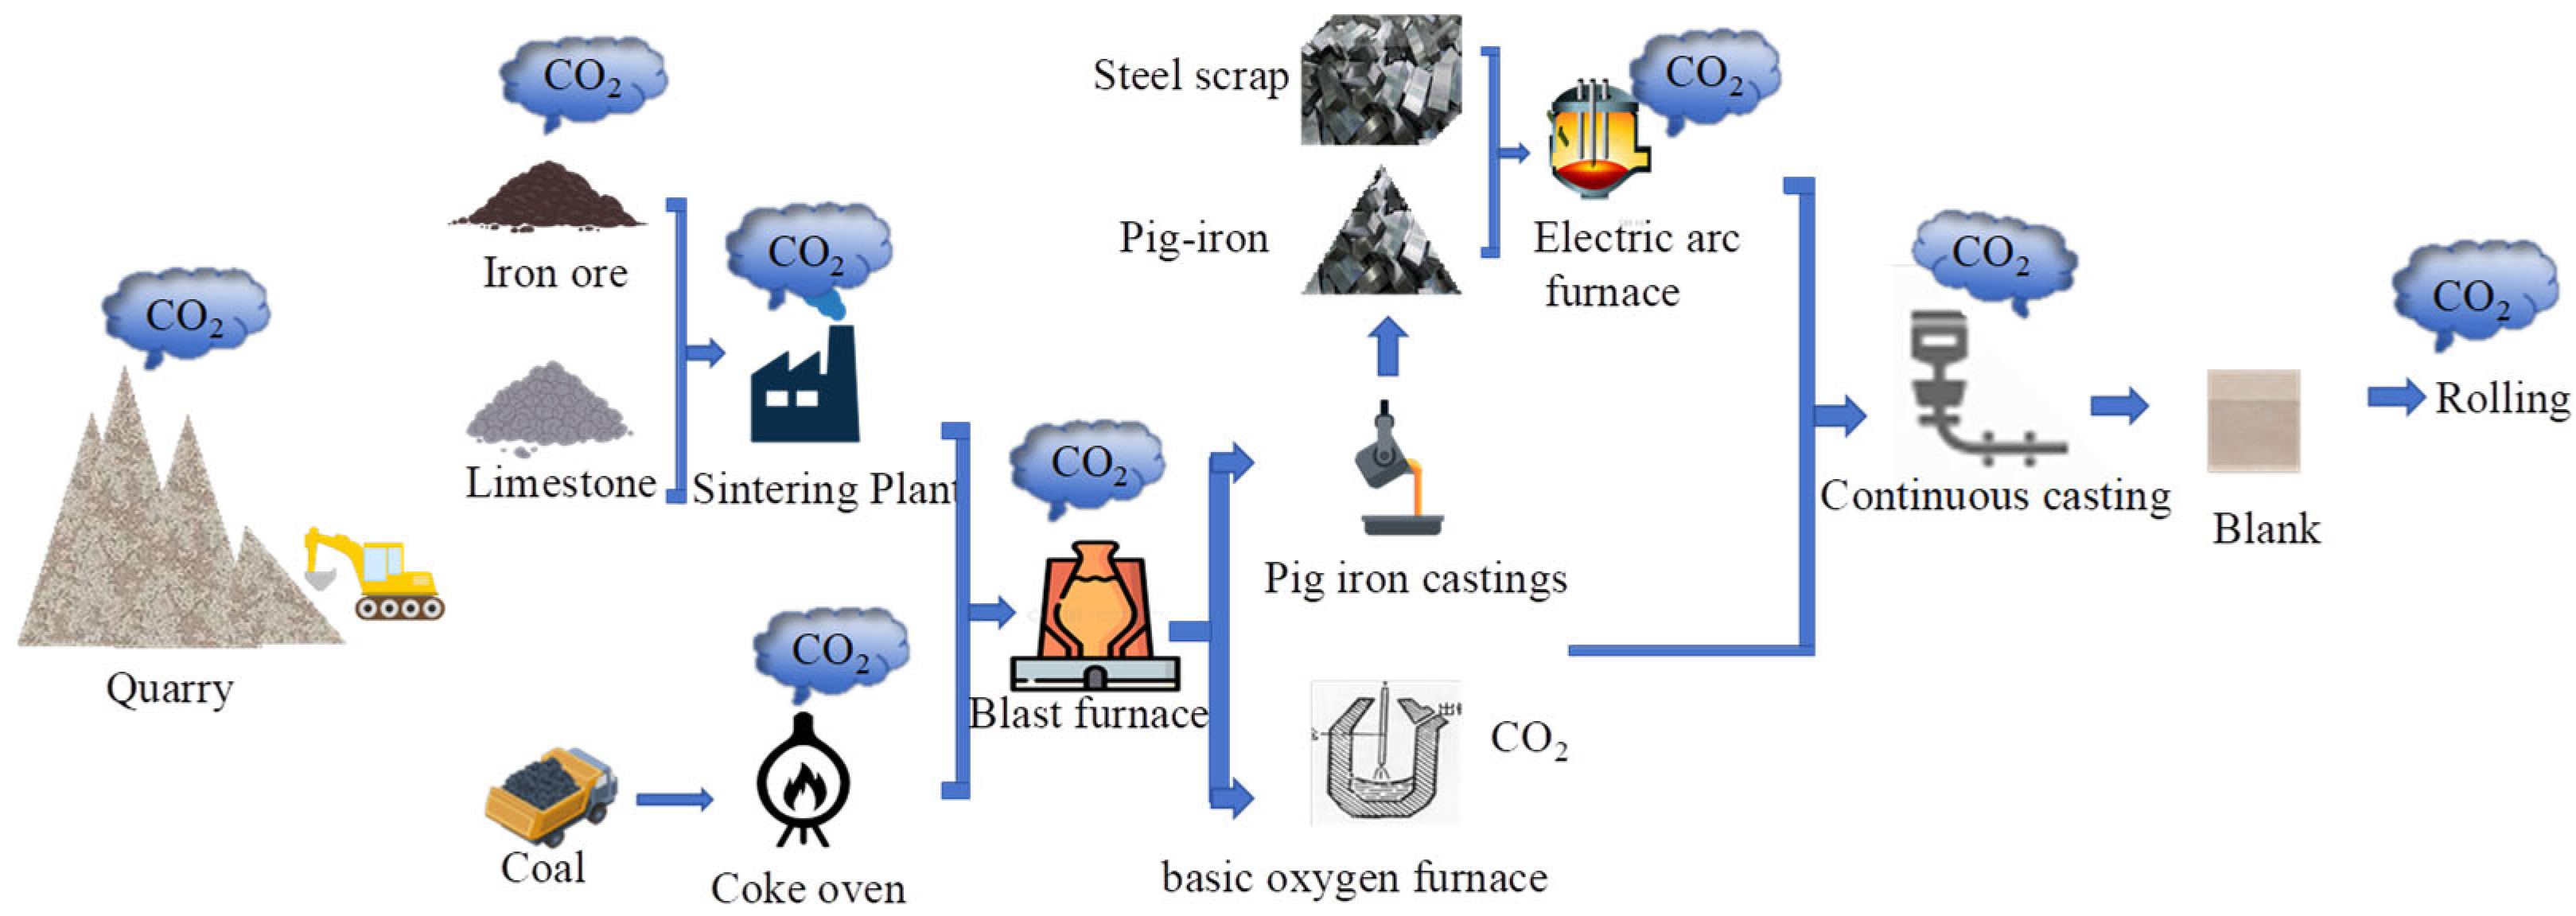
The high carbon intensity of steel further indicates that increasing the application ratio of recycled materials in the iron and steel industry is of great significance for carbon emission reduction in bridge engineering. The carbon emission factor of steel is closely related to its production process route. The blast furnace-converter process mainly takes iron ore as raw material and presents high carbon emission intensity, while the electric furnace process uses scrap steel as the main raw material and can significantly reduce carbon emissions per unit product. The currently adopted steel carbon emission factor is the industrial average value, which incorporates the existing average scrap steel ratio. Increasing the proportion of electric furnace steel and the input amount of scrap steel in the building material production stage can effectively lower the unit carbon emission factor of steel products, thereby cutting the total carbon emissions during the bridge materialization stage. Further research can establish scenarios with different scrap steel ratios to quantify the emission reduction potential brought by the application of recycled materials to bridge carbon emissions.
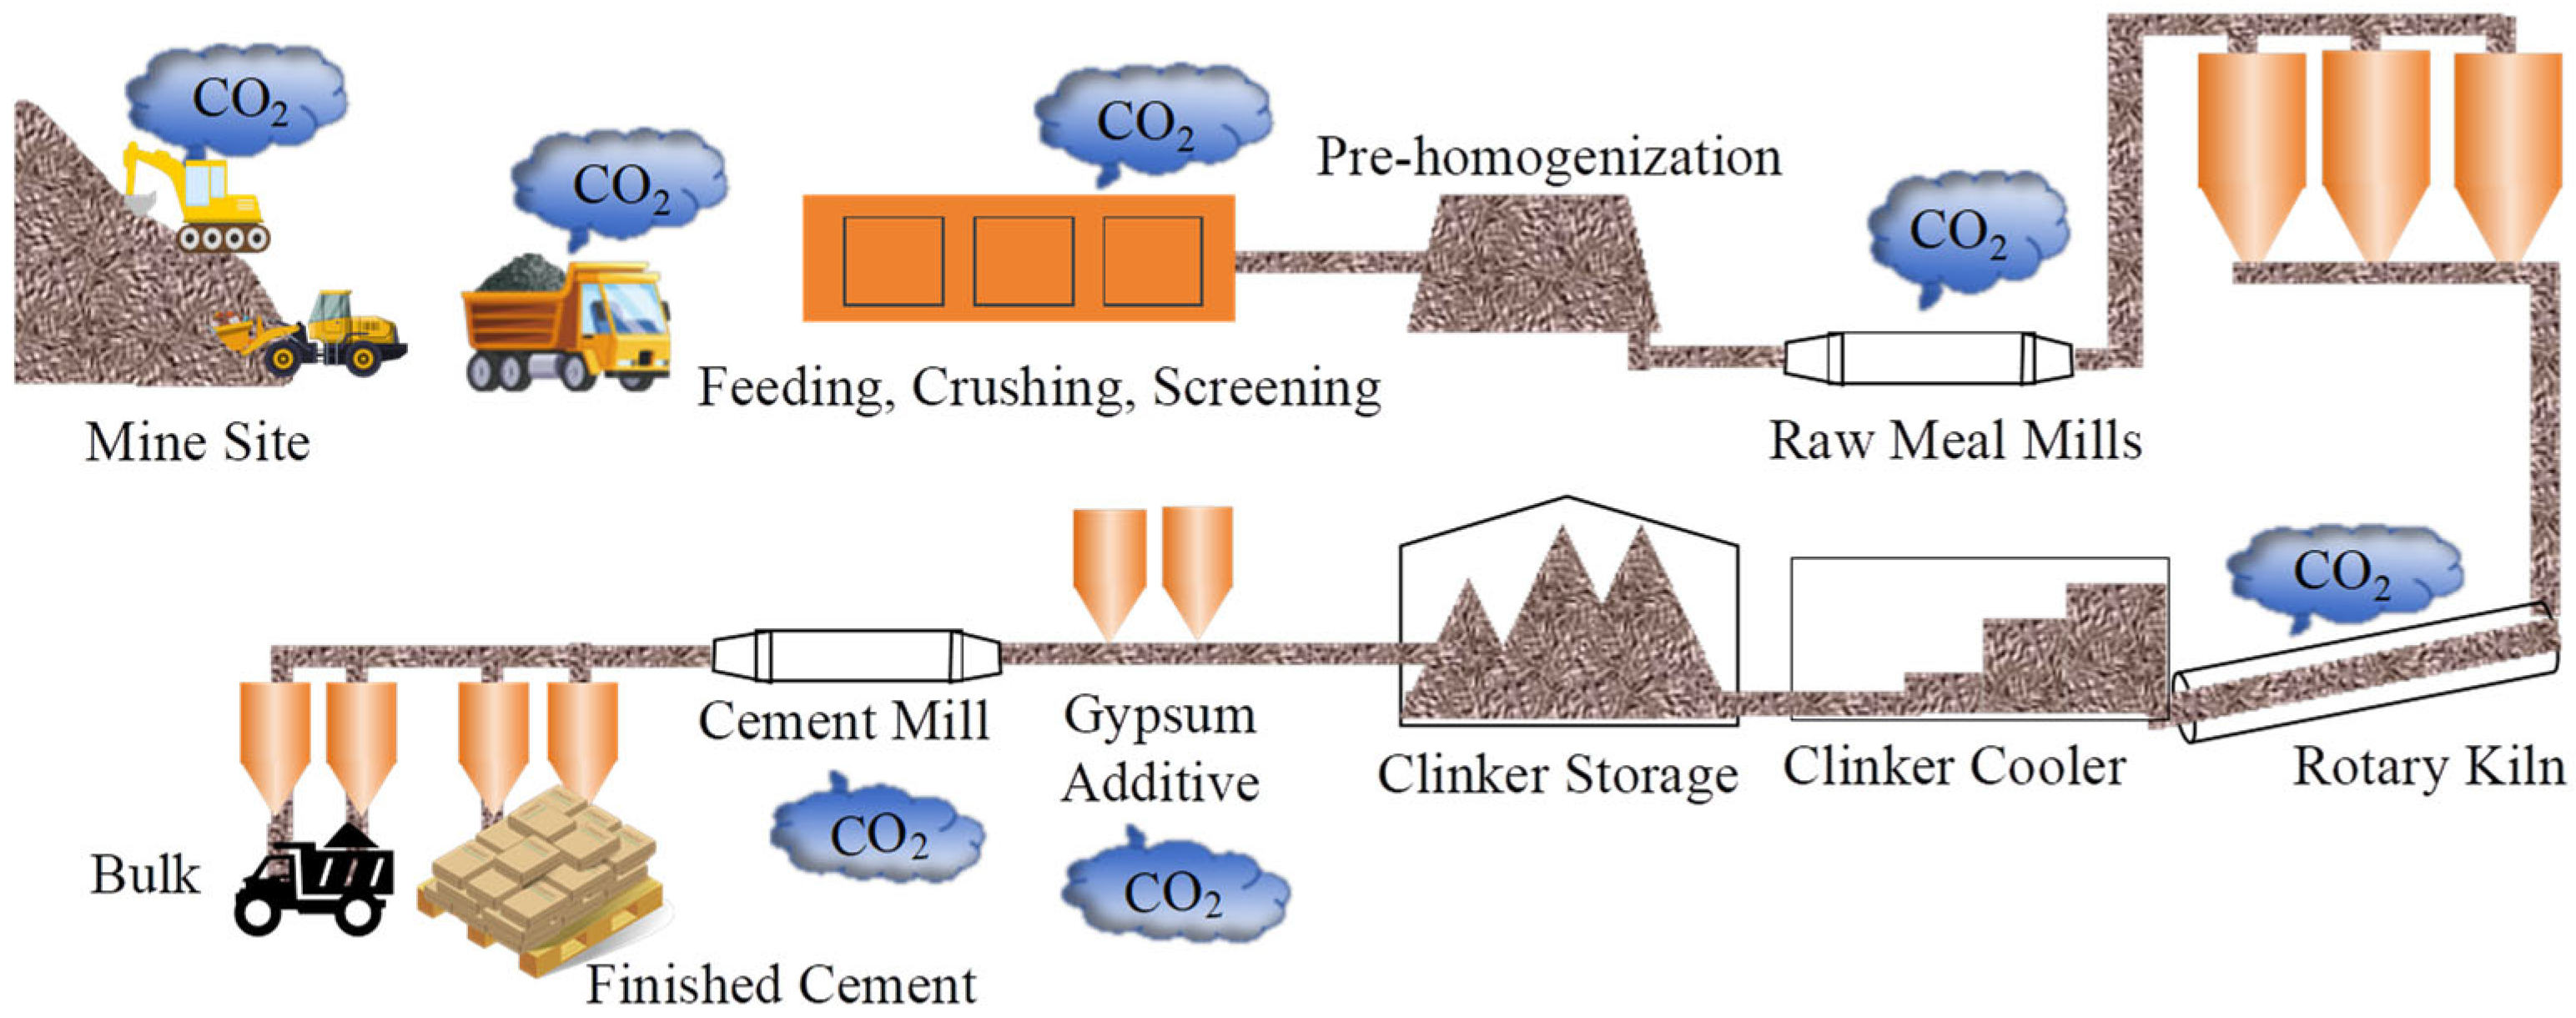
In summary, the superstructure and substructure are the fundamental components for carbon emission control, and the high carbon intensity of steel is the core factor affecting carbon emission efficiency. Accordingly, this study proposes focusing emission reduction efforts on the following three aspects: first, optimizing the concrete mix proportion of the substructure to reduce cement consumption or adopt low-carbon alternative materials on the premise of meeting bearing capacity requirements; second, optimizing the reinforcement design of the superstructure and promoting the application of high-strength steel bars to reduce the total steel consumption; third, conducting material substitution and process optimization for key technologies of the deck system with high carbon intensity but low engineering quantity. Fourth, select low-carbon cement types. Cement products of different types have distinct carbon emission factors due to differences in clinker content and admixture dosage. On the premise of meeting structural performance requirements, priority should be given to composite cement with high admixture content, which can further reduce carbon emissions under the same material consumption. Through the above measures, a significant reduction in carbon emissions can be achieved without compromising structural safety and service functions.
4.3.2. Carbon Emissions Analysis of Building Materials Transportation
From
Table 8, the total carbon emissions in the transportation stage of building materials are 305,213.68 kgCO
2e. Based on this, the carbon emissions per ton of transportation materials under different transportation modes are calculated, as shown in
Table 11.
In terms of total transportation volume, 46-ton heavy-duty diesel trucks are the primary source of carbon emissions during the transportation stage. The carbon emissions of such vehicles amount to 292,212.27 kg CO2e, accounting for 95.7% of total transportation emissions. The fundamental reason is that 46-ton trucks undertake the vast majority of building material transportation for this project, with a total transport volume of 42,721.09 t, representing 98.2% of the total. In comparison, the combined transport volume of 30-ton and 18-ton trucks accounts for less than 2%, while light- and medium-duty trucks make up less than 0.1% of the total transport volume.
From the perspective of unit emission intensity, vehicle tonnage and carbon emission efficiency show a significant negative correlation, revealing the energy efficiency advantages of large-tonnage transportation. The carbon emission per unit weight of 46-ton trucks is 6.84 kg CO2e/t, which is 26.9% lower than that of 30-ton trucks (9.36 kg CO2e/t) and 55.8% lower than that of 18-ton trucks (15.48 kg CO2e/t). Although the transportation volume of 8-ton medium-sized and 2-ton light trucks accounts for less than 0.1% of total freight volume, the carbon emissions intensity per unit of freight transported is as high as 21.48 kgCO2e/t and 34.33 kgCO2e/t, which are 3.1 times and 5.0 times that of 46-ton vehicles, respectively. The fundamental reason for this difference is as follows: per unit transport distance, vehicle energy consumption mainly depends on fixed losses such as engine idling and mechanical wear. The greater the load capacity, the more these fixed losses are diluted, resulting in lower carbon emission intensity per unit transport volume. Therefore, large-tonnage vehicles exhibit significant energy efficiency advantages under full-load conditions.
Accordingly, this study proposes optimizing the transportation process from the following three aspects: first, prioritize the use of large-tonnage trucks of 46 tons and above for the transportation of bulk building materials to fully leverage their energy efficiency advantages; second, integrate scattered transportation demands and reduce the frequency of using light and medium-duty trucks; third, under the same tonnage conditions, give preference to building material suppliers with shorter transportation distances to further reduce carbon emissions in the transportation stage. Through the above measures, the carbon emission reduction efficiency of the transportation process can be significantly improved on the premise of ensuring construction progress.
4.3.3. Carbon Emission Analysis of On-Site Construction Machinery
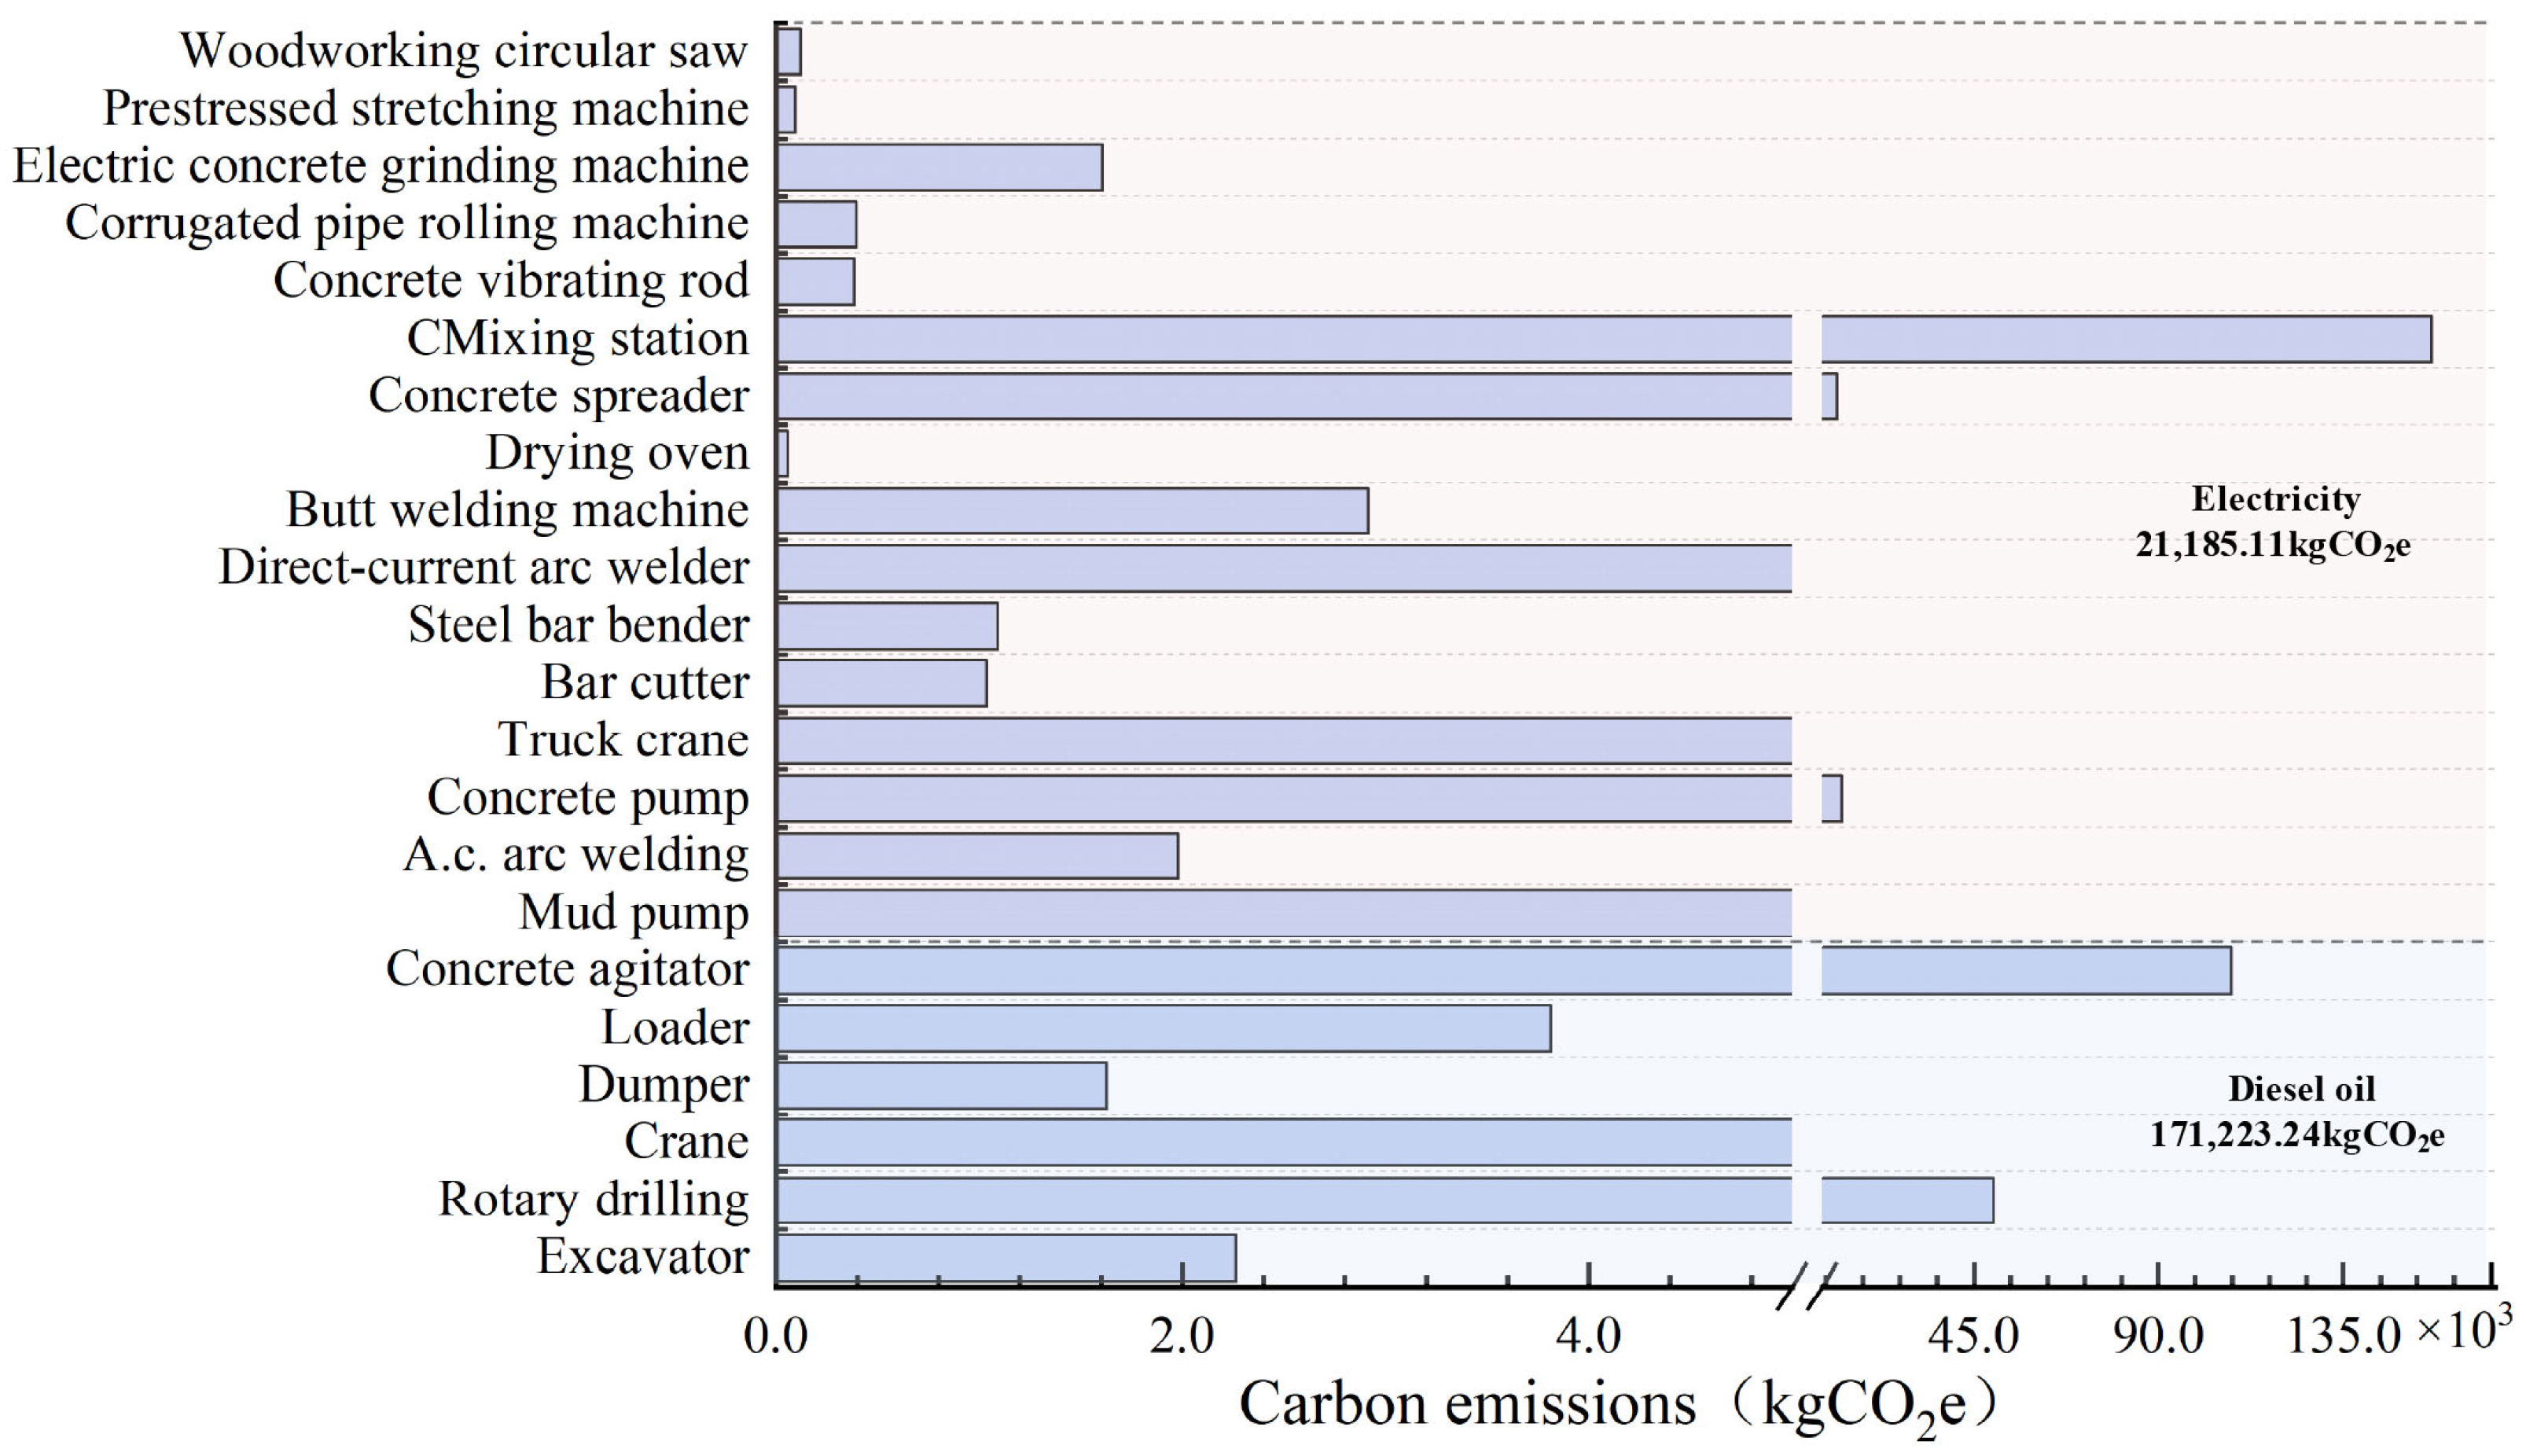
According to
Table 9, the carbon emissions generated by different mechanical equipment are compared and analyzed. The comparison between mechanical energy consumption types and carbon emissions is shown in
Figure 12.
In terms of emissions, cement concrete mixing stations and concrete mixing trucks are the primary sources of carbon emissions during the construction stage. As shown in
Figure 12, the HZS-180 mixing station emits 156,442.21 kg CO
2e, and mixer trucks emit 107,836.71 kg CO
2e, which together account for 68.9% of total emissions in the construction stage. The fundamental reason is that concrete production and transportation constitute the core processes of bridge construction, running through the entire pouring process of all concrete structures, including pile foundations, bearing platforms, piers, and main girders, with operating hours far exceeding those of other equipment. Meanwhile, mixing stations are driven by electric motors, and mixer trucks rely on diesel engines; both are energy-intensive facilities with high energy consumption intensity per unit time.
In terms of equipment classification patterns, carbon emissions exhibit a distinct three-level differentiation characteristic. As shown in the figure, Class A high-carbon equipment (mixing station and mixer trucks) accounts for less than 10% of the total quantity but contributes over 70% of emissions. Mixing stations operate continuously to meet concrete production demands, while mixer trucks frequently travel between mixing stations and construction sites during peak pouring periods, resulting in long operating hours and high energy consumption. Class B medium-carbon equipment (rotary drilling rigs, concrete pump trucks, etc.) is characterized by intermittent operation. Although its working hours are concentrated, it does not run continuously, resulting in a moderate total emission volume. Class C low-carbon equipment (vibrators, cutters, electric welding machines, etc.) is abundant in quantity but serves as auxiliary equipment. Such equipment features low unit power, short single-operation duration, and mostly intermittent use, thus generating low emissions per machine. Therefore, the functional attributes of equipment determine its operating hours and energy consumption pattern, which in turn define its position in the carbon emission structure.
In summary, this study proposes a hierarchical emission reduction strategy. For Class A high-carbon equipment, priority should be given to promoting clean energy substitution (e.g., electric mixer trucks and electrically powered mixing stations) and establishing an IoT energy consumption monitoring system for precise management and control. For Class B medium-carbon equipment, operation scheduling should be optimized to avoid idling and repeated startup and shutdown, thereby improving single-operation efficiency. For Class C low-carbon equipment, efforts should focus on routine maintenance and management to ensure efficient operation. Through such classified measures, precise control and effective reduction of carbon emissions can be achieved without affecting construction progress.
4.3.4. Comprehensive Analysis of Carbon Emissions in the Materialization Phase
Integrating carbon emission models across all stages, the carbon emissions during the materialization phase of bridge engineering: Ere = E
ys + E
sc + E
SG = 3,092,237.79 (kgCO
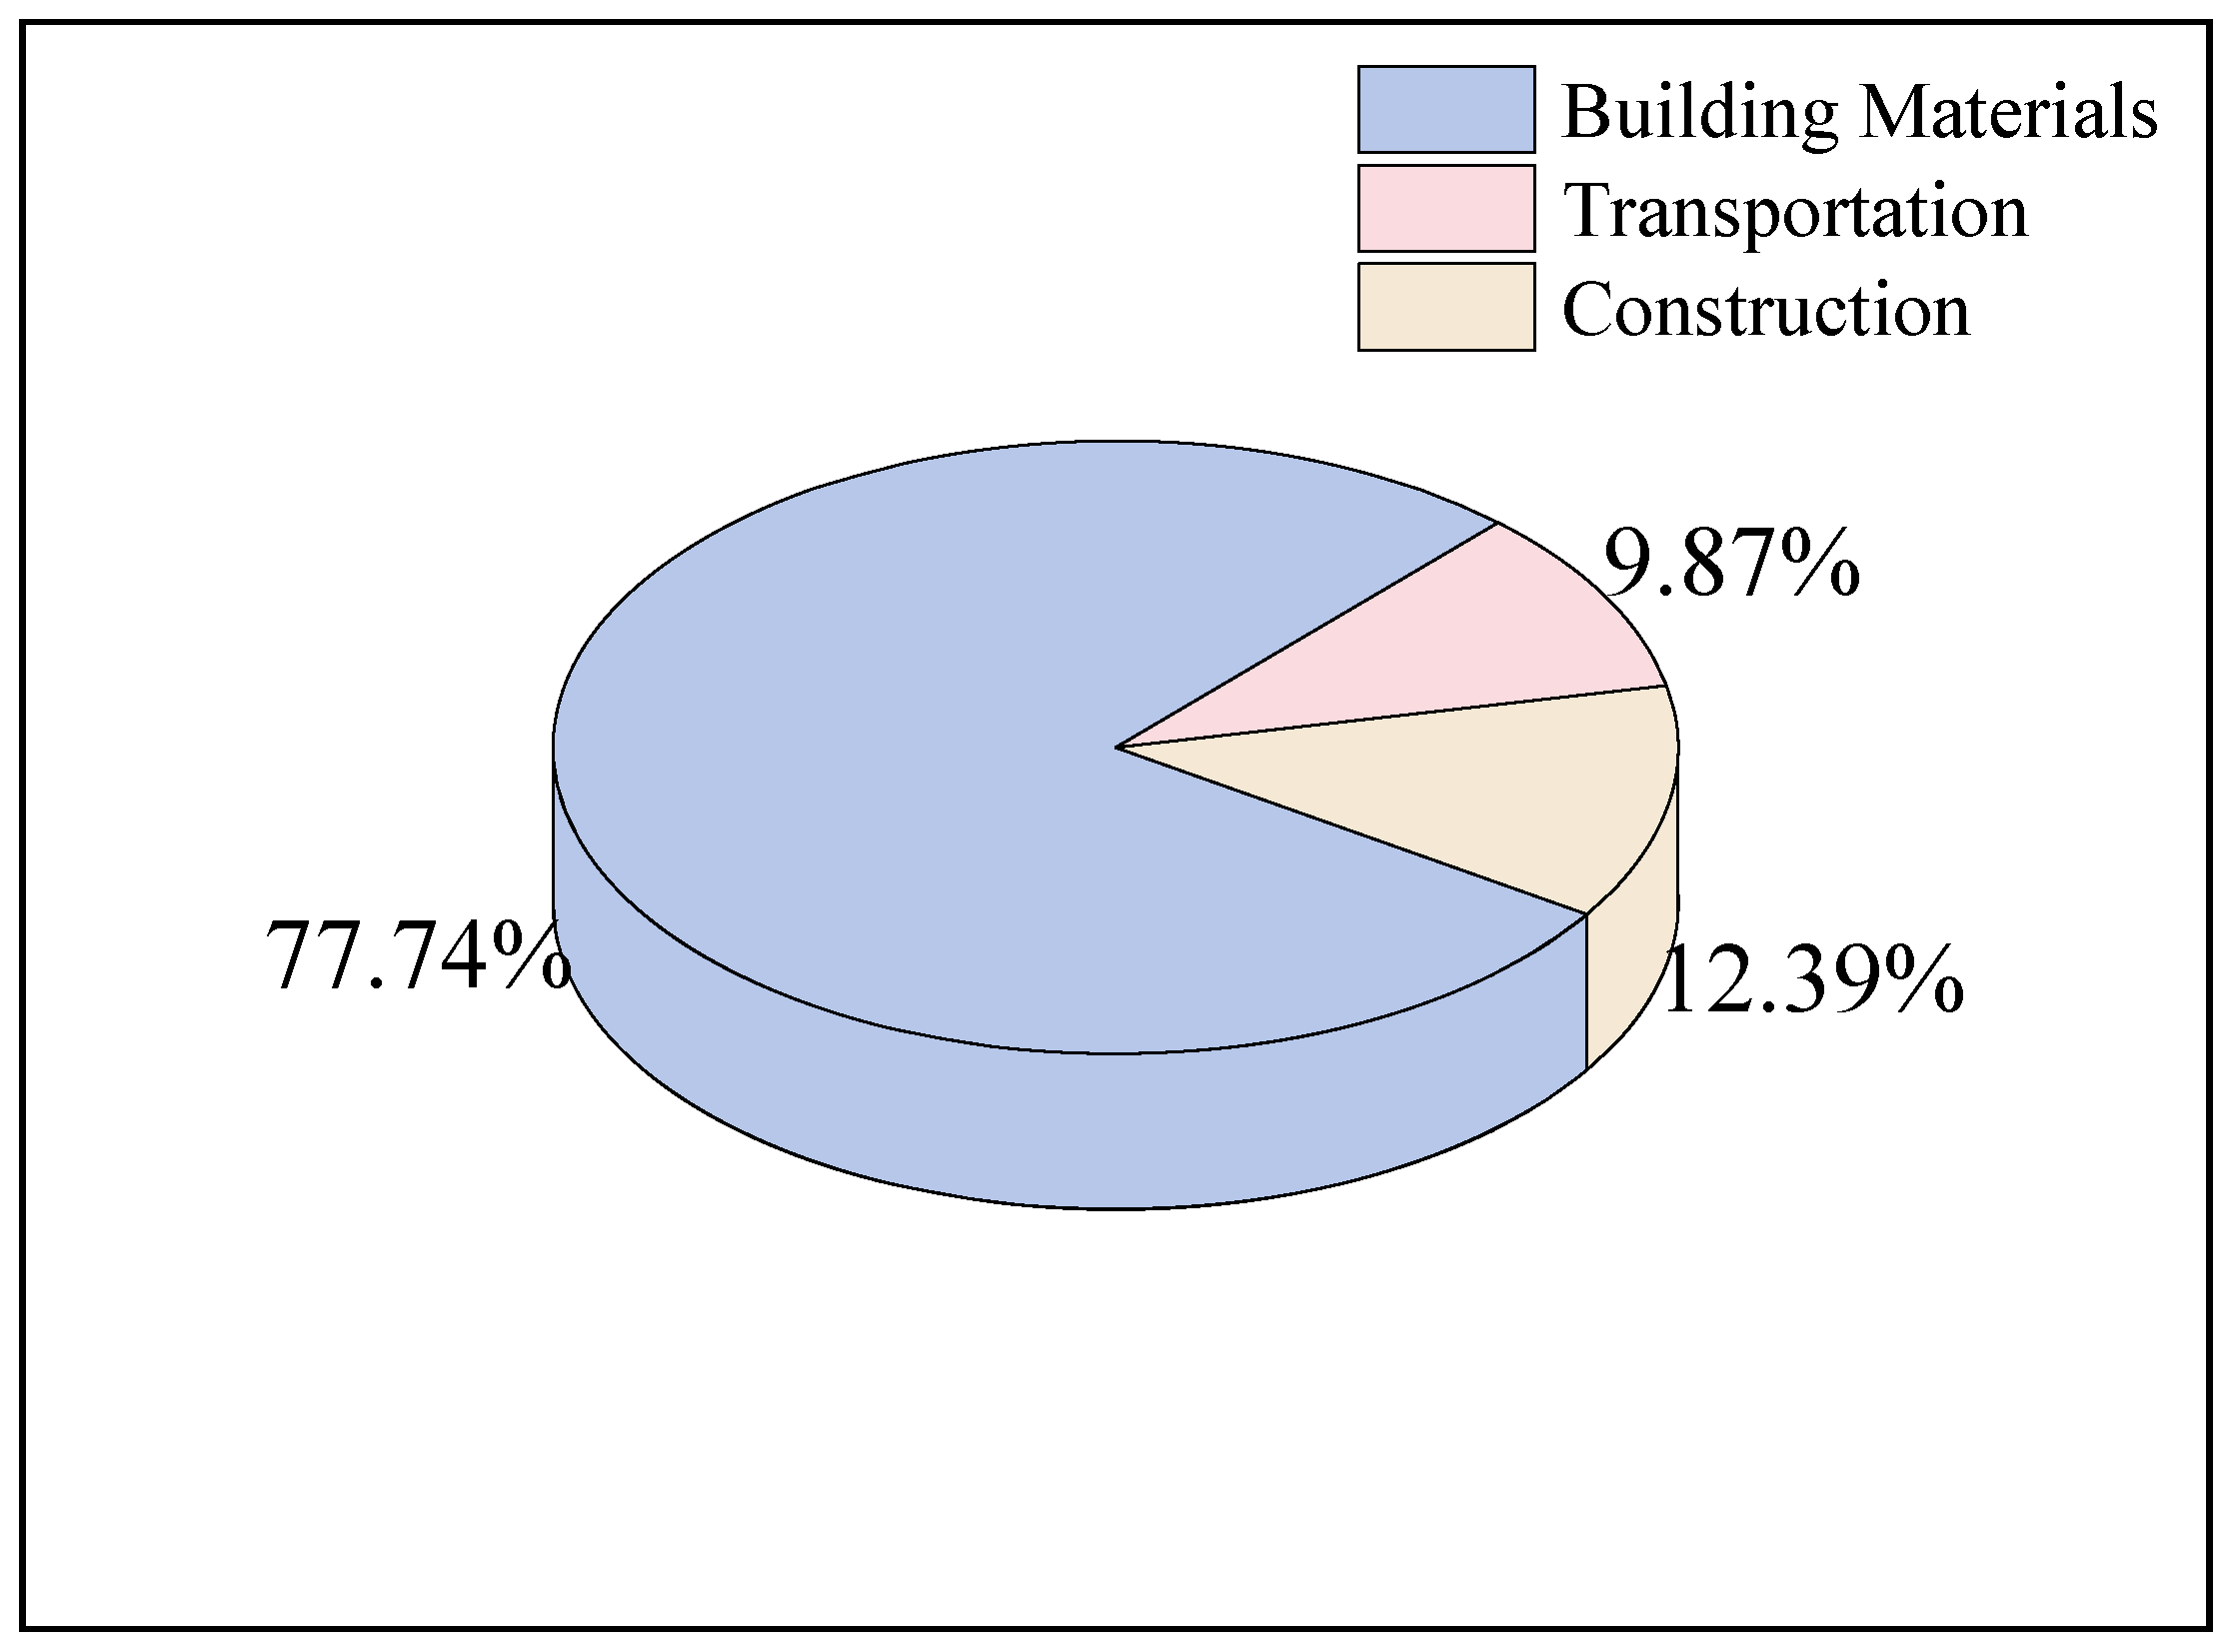
2e). The proportion of carbon emissions in each link is shown in
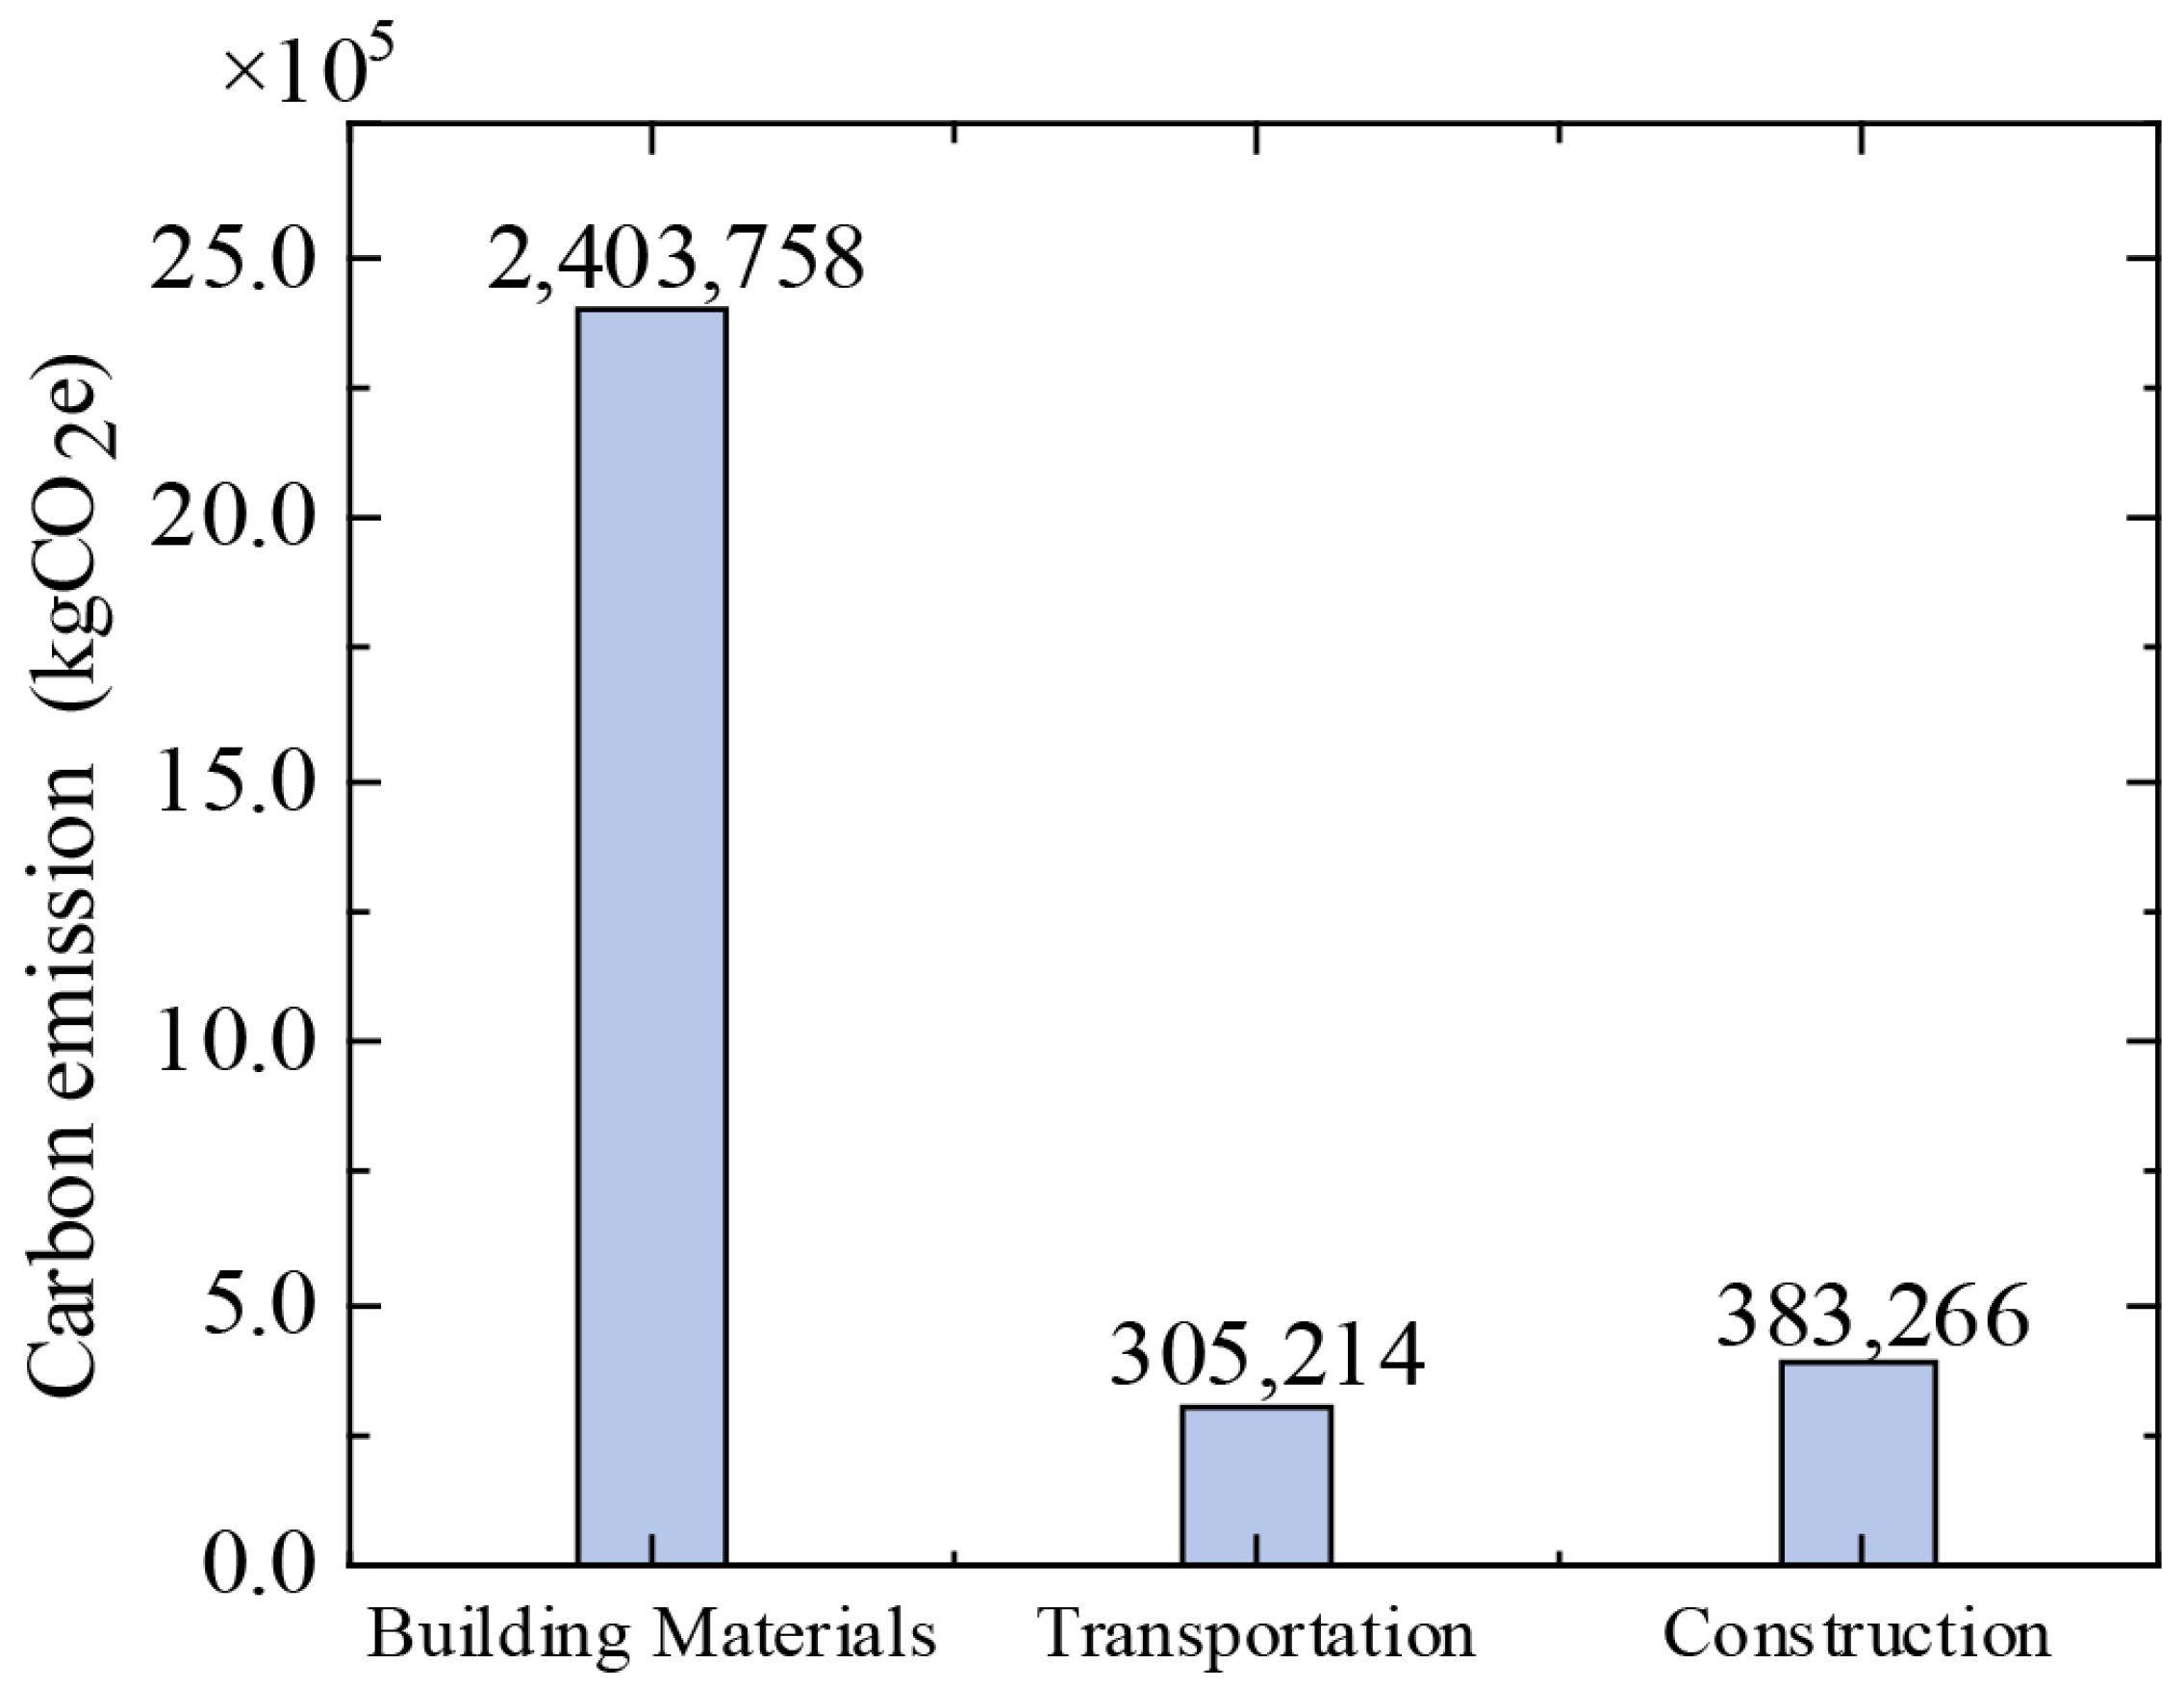
Figure 13, and the carbon emissions in each link of the materialization stage are shown in
Figure 14.
The above figure shows that the carbon emissions in the production of building materials are the highest, reaching 2,403,758.59 kgCO2e, accounting for 77.74% of the total, which is mainly due to the energy-intensive production process of cement and steel. The carbon emissions in the construction process were 383,265.51 kgCO2e, accounting for 12.39%, of which the rotary drilling rig and mixing station are the main emission sources. The carbon emissions in the transportation link were 305,213.68 kgCO2e, accounting for 9.87%, of which 46 tons of heavy trucks accounted for 96.5%. This is mainly because the material consumption in the building material production stage indirectly determines the emission scale of transportation and construction. That is, the greater the material consumption, the denser the transportation demand, and the more significant the construction energy consumption. During construction, the continuous operation of rotary drilling rigs in bored pile construction and the continuous running of mixing plants in concrete production both represent an emission pattern characterized by core processes, continuous operation, and high energy intensity. In the transportation stage, large-tonnage vehicles undertake the vast majority of building material transportation. Their absolute dominant position determines the emission distribution of this stage.
In summary, as an upstream source with high-carbon production processes, the building material production stage constitutes the fundamental source of carbon emissions during the materialization phase. The emission characteristics of each stage follow a causal chain: material consumption drives transportation and construction, and emissions are gradually transmitted through transportation and construction activities.
Based on the above, this study proposes a hierarchical optimization strategy. The first level focuses on the building material production stage. By promoting high-strength materials (high-strength steel bars, high-performance concrete), the goal of “reducing consumption and carbon emissions” is achieved, so as to cut material usage and the downstream emissions it causes at the source. The second level targets the construction stage. For Class A high-carbon equipment such as rotary drilling rigs and mixing plants, the proportion of electric equipment will be increased to 40% to reduce dependence on fossil energy. The third level concentrates on the transportation stage. Large-tonnage vehicles of 46 tons and above are preferentially adopted, taking advantage of their high energy efficiency and low unit emission intensity. Through the progressive hierarchy of “source reduction, process efficiency improvement, and end-of-pipe optimization”, the above strategies can systematically reduce carbon emissions in the materialization phase.
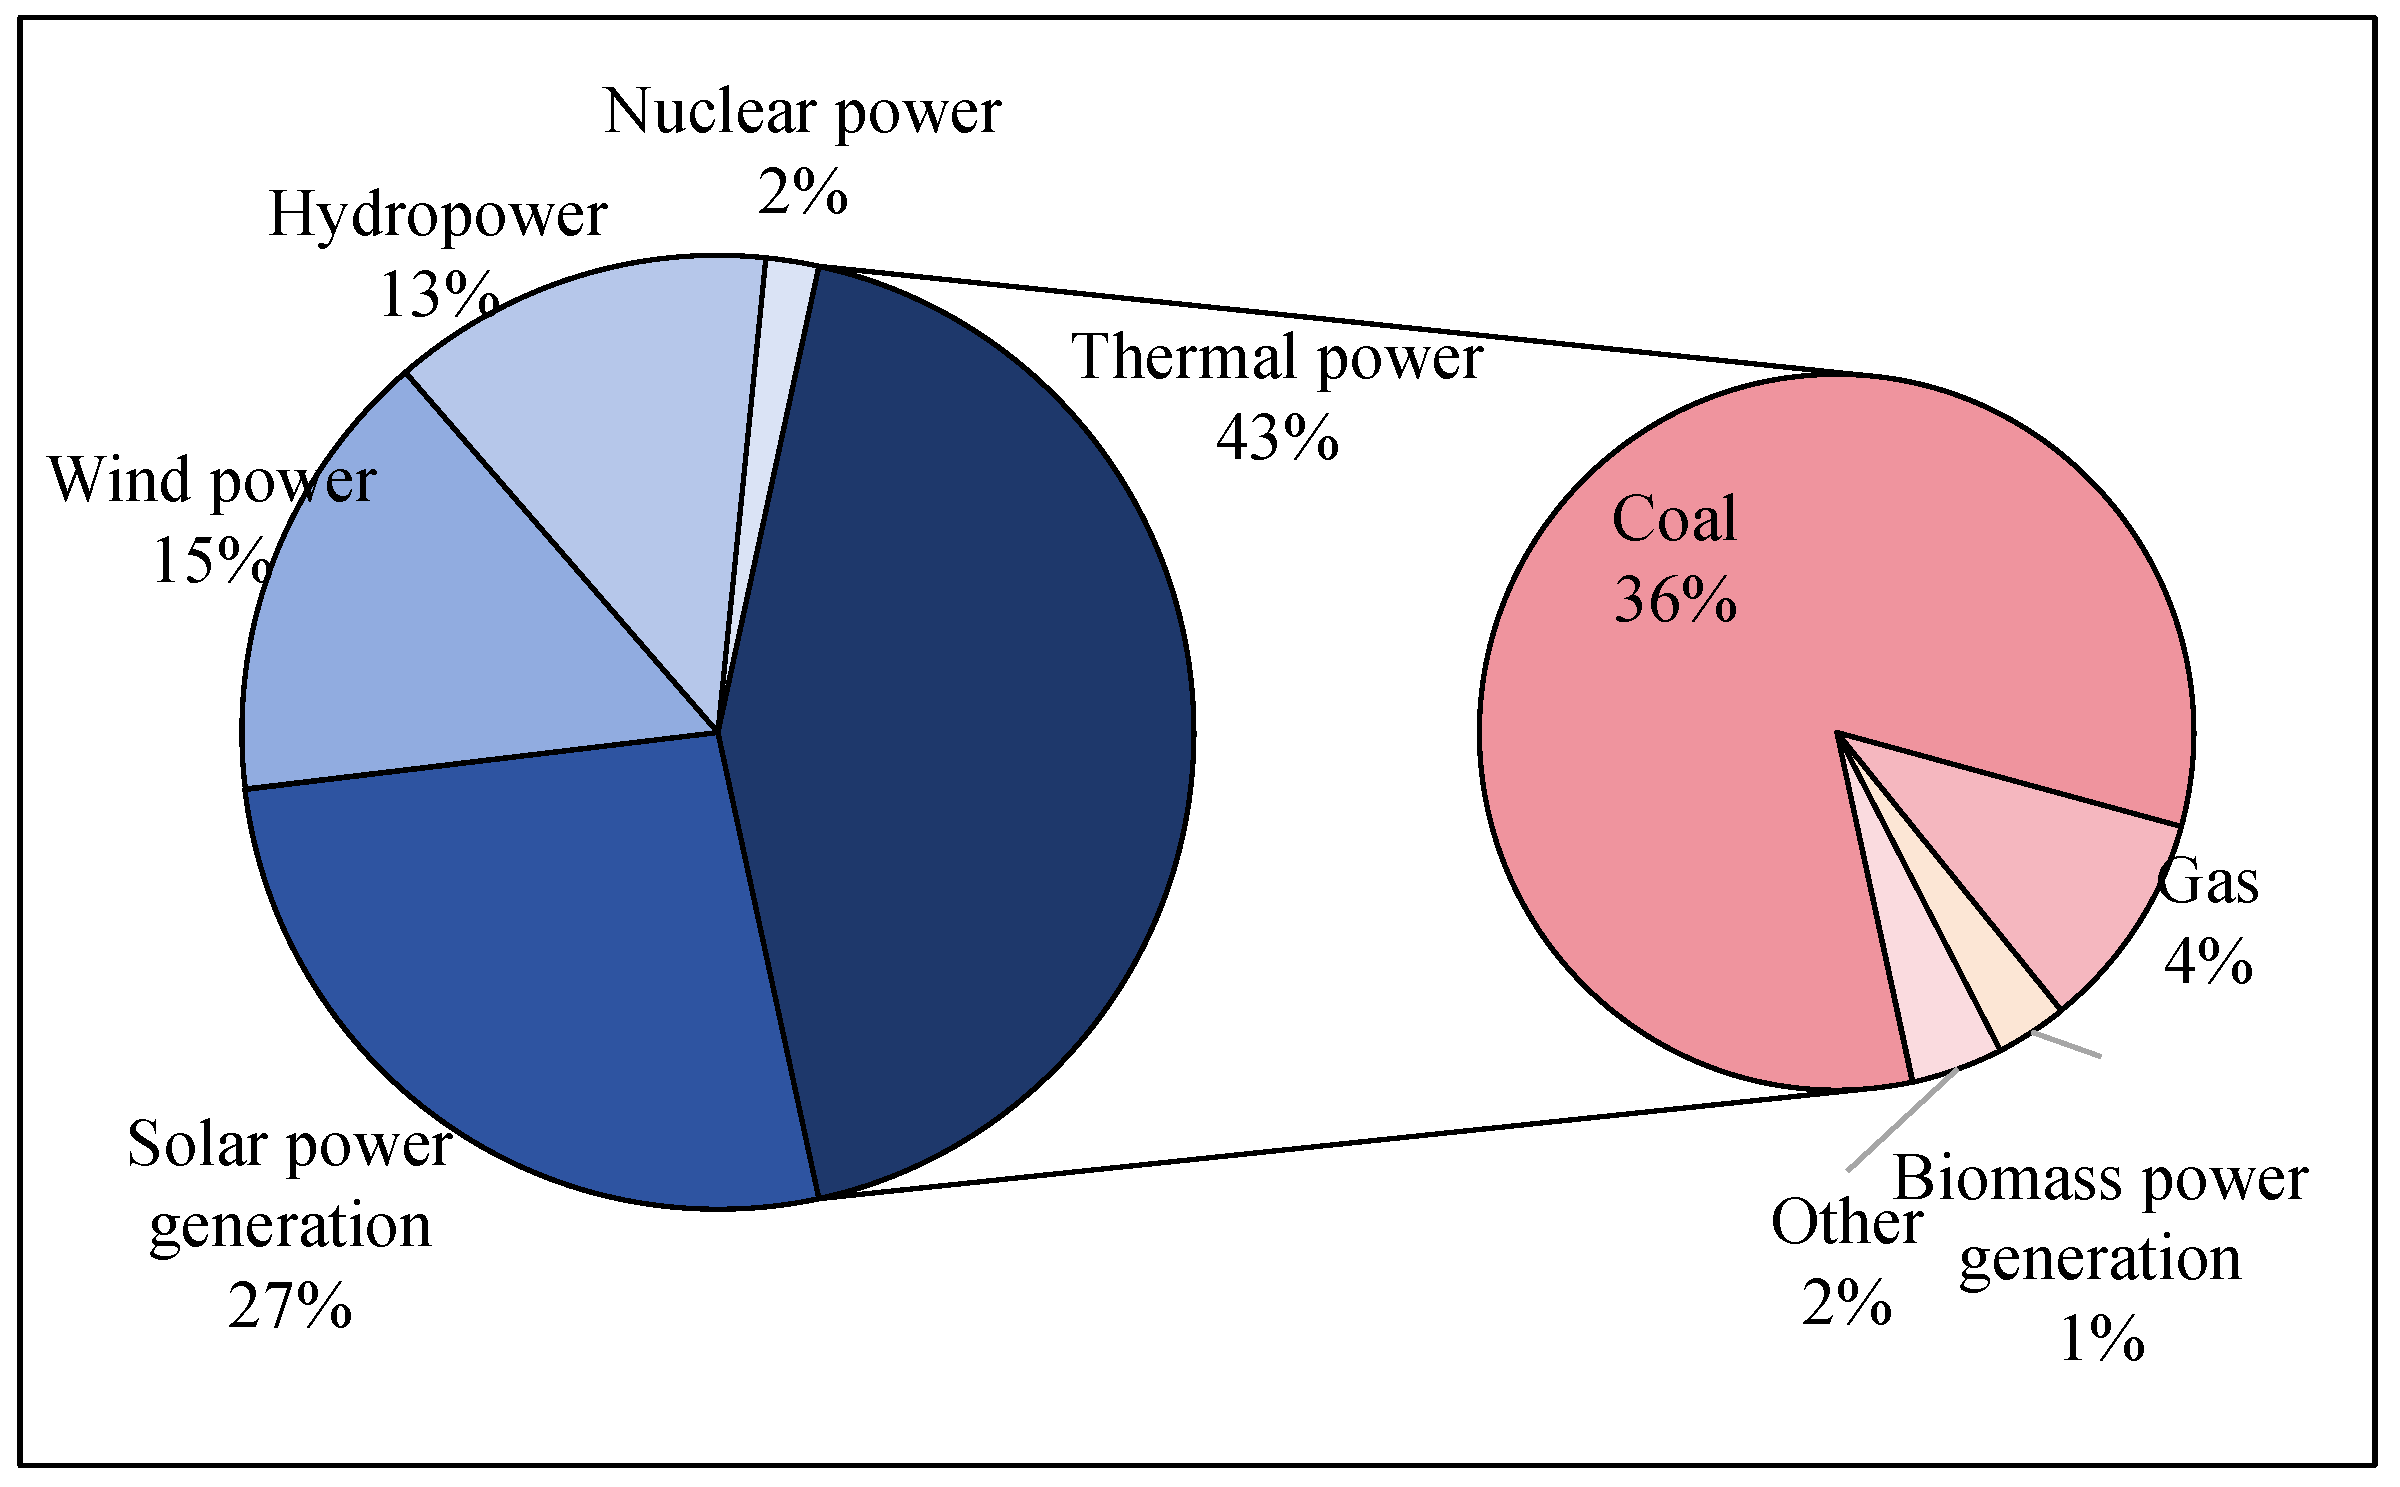
The construction stage of bridge engineering has large power consumption, concentrated equipment, and a long running time, which is an important source of indirect carbon emissions in the life cycle of the project. This phase involves continuous operation of high-energy-consumption equipment such as concrete batching plants, which feature independent electricity metering and clearly defined system boundaries, presenting significant potential for emissions reduction. This study adopts the single-factor controlled scenario analysis method to verify the influence of regional differences on carbon emission accounting results. Specifically, the bill of quantities and construction machinery configuration of the case bridge are set as invariant control variables. Only the carbon emission factor of electric power is replaced from the baseline value of the North China Power Grid (0.8843 kgCO
2/kWh) with the corresponding values of the Northeast, East China, Northwest, Central China, Southern China power grids, and the national average level. With all other conditions kept completely consistent, the total indirect carbon emissions from electric power consumption during the construction stage are recalculated, so as to accurately characterize the net impact of regional differences. Calculation results are presented in
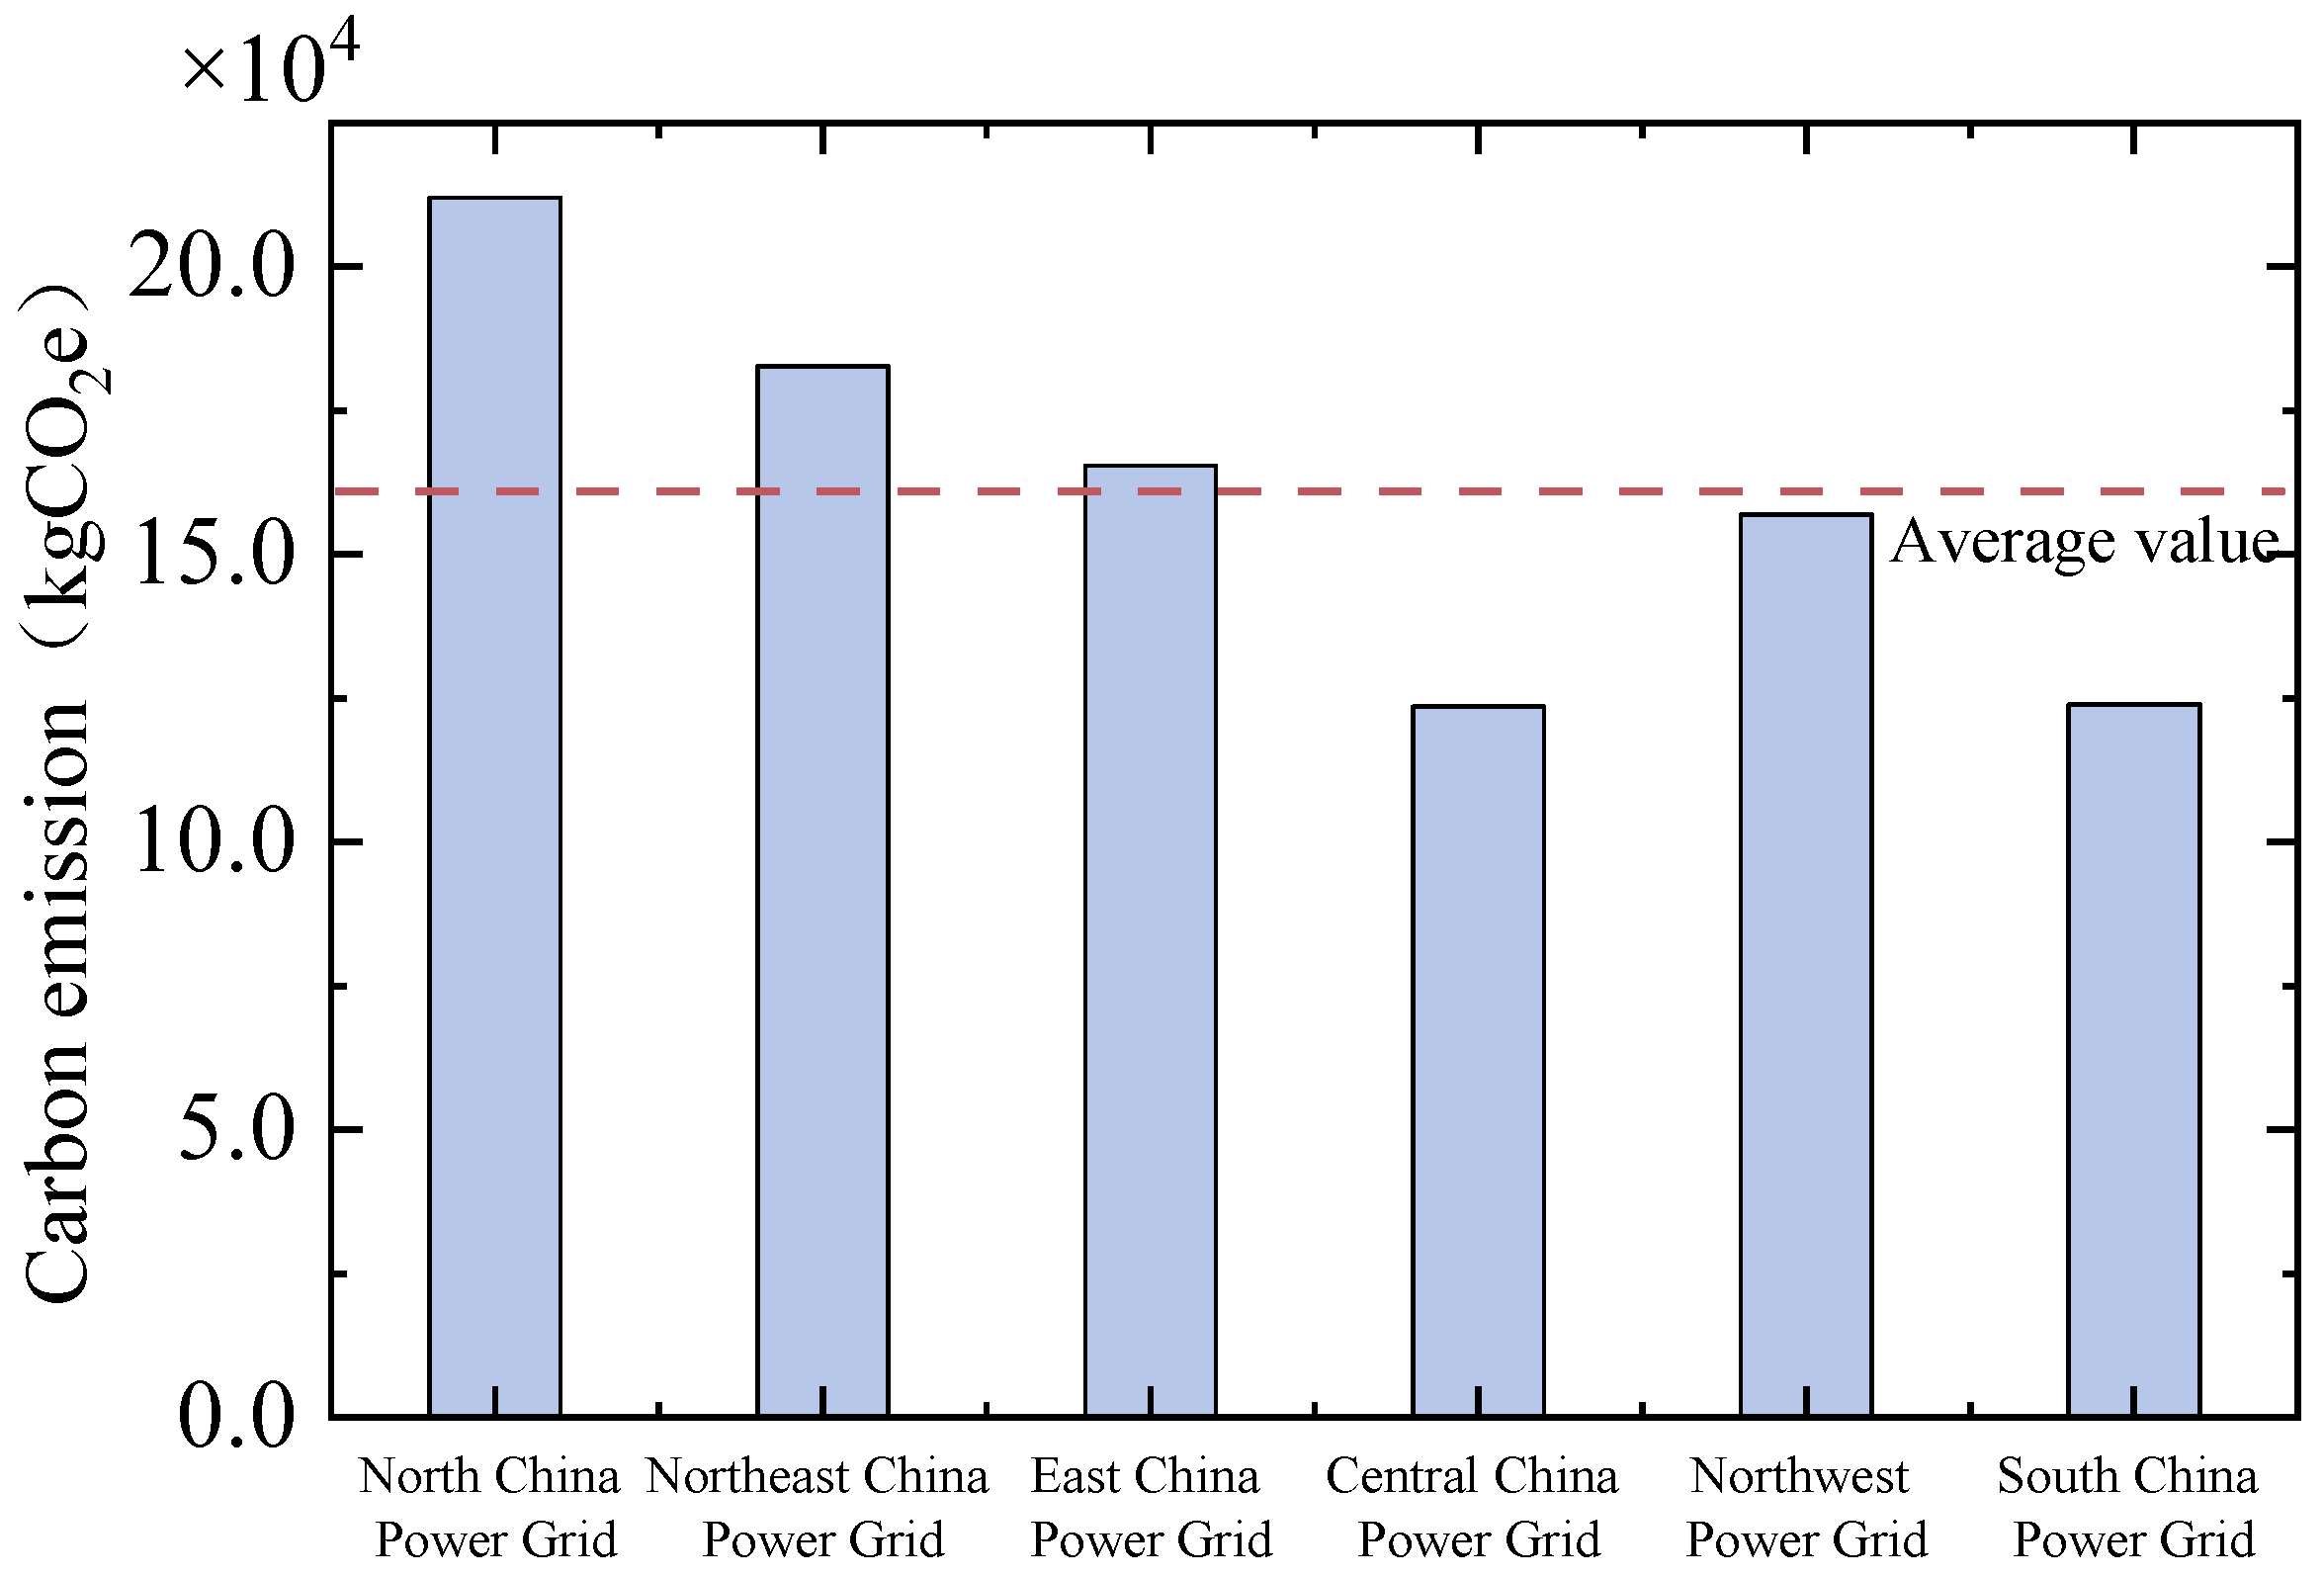
Table 12, regional carbon emission comparisons are shown in
Figure 15, and power generation composition is illustrated in
Figure 16.
As shown in the table and the figure, the total carbon emissions of North China Power Grid are the highest, which is 212,043.91 kgCO2, which is 31.90% higher than the national average, mainly due to the coal-dependent power structure. The total carbon emission of the Central China Power Grid is the lowest (123,615.85 kgCO2), which is 23.11% lower than the average, and the proportion of clean energy, such as hydropower, is high. The maximum value (North China) is 1.71 times the minimum value (Central China), highlighting the significant impact of grid structure on carbon emissions. This disparity fully reflects the decisive influence of the grid’s energy mix on carbon emissions.
Correlation analysis between carbon emission factors and total amount: carbon emission factors and total amount rank exactly the same (North China > Northeast China > East China > Northwest China > South China > Central China), indicating that factors dominate the difference in total amount. Based on the electricity consumption of this project, a reduction of 0.1 kgCO2/kWh in the carbon emission factor results in a decrease of approximately 24,000 kgCO2 in total carbon emissions. The difference in the carbon emission factor of the regional power grid directly leads to the fluctuation of the total carbon emission of the bridge construction machinery up to 55.01%.
When examining such differences against the total carbon emissions, regional fluctuations in power carbon emission factors can cause a fluctuation of 1.7% to 2.8% in the overall emissions of the entire materialization stage. Although this proportion appears relatively small, it produces a prominent cumulative effect in the large-scale construction of infrastructure clusters. Combined with the multi-factor sensitivity analysis results presented, the standardized regression coefficient of the regional power grid factor is 0.099, ranking 7th among the eight core parameters and categorized as a low-sensitivity parameter. This conclusion does not mean that regional differences are insignificant; instead, it reveals the hierarchical structure of carbon emission driving factors. High-sensitivity parameters such as material consumption and transportation distance dominate the major proportion of carbon emissions, while the regional power grid structure exerts a further moderating effect on this basis. Therefore, for specific engineering projects located in high-carbon power grid regions such as North China, the procurement of green electricity and the local utilization of renewable energy should still be regarded as important supplementary carbon reduction measures. Meanwhile, when formulating industrial carbon emission accounting standards, it is necessary to explicitly require the adoption of regional power carbon emission factors rather than national average values, so as to avoid systematic underestimation for regions with high-carbon power grids. At the project level, carbon reduction strategies should be implemented in a hierarchical manner. Priority shall be given to material optimization and supply chain management, followed by the localized promotion of construction electrification and clean energy substitution.
- b.
Multi-factor sensitivity analysis
Based on the above carbon emission accounting results, this study identifies the key factors with the highest contribution to carbon emissions in each link as the object of sensitivity analysis. In the four links, eight core parameters are selected, including cement dosage, steel dosage, replacement rate of high-strength steel, aggregate transportation distance, proportion of electric equipment, energy efficiency of mixing station, proportion of large tonnage vehicles, and regional power grid factor. According to the research of Zhang [
15], the influence mechanism of each numerical fluctuation on the total carbon emission of the materialization stage of the bridge is systematically analyzed. The detailed data are shown in
Table 13.
Due to the interaction among multiple parameters, this study employed MATLAB Version R2024a [
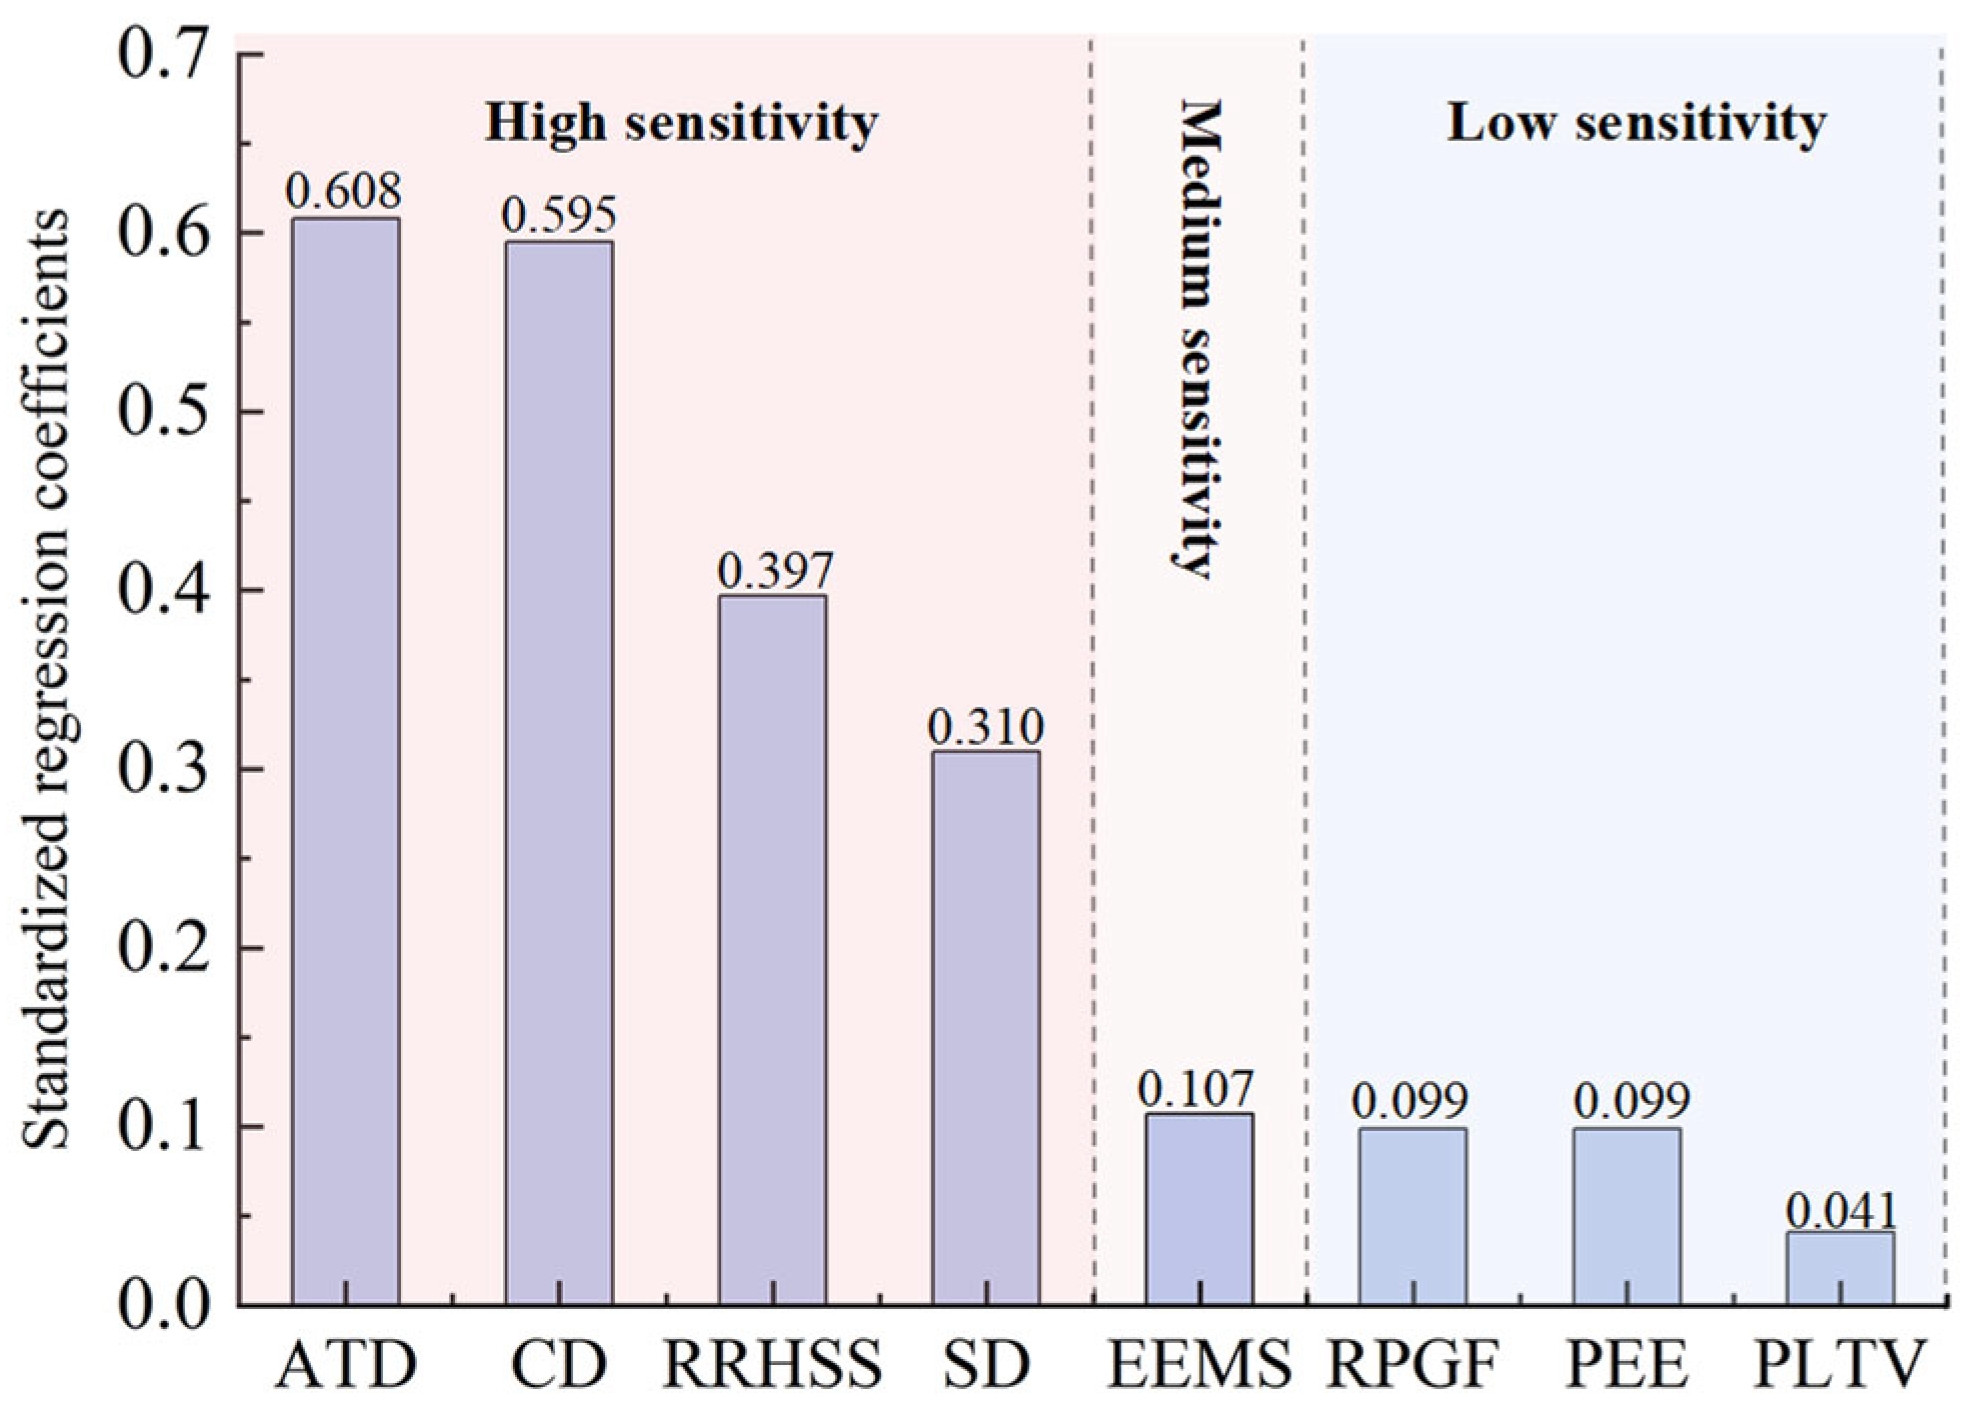
41] to run Monte Carlo simulations to generate parameter distributions. By calculating the total carbon emissions for each sample, sensitivity analysis was ultimately conducted using standardized regression coefficients. The order of parameter sensitivity is shown in
Figure 17, and the probability of total carbon emissions is shown in
Figure 18.
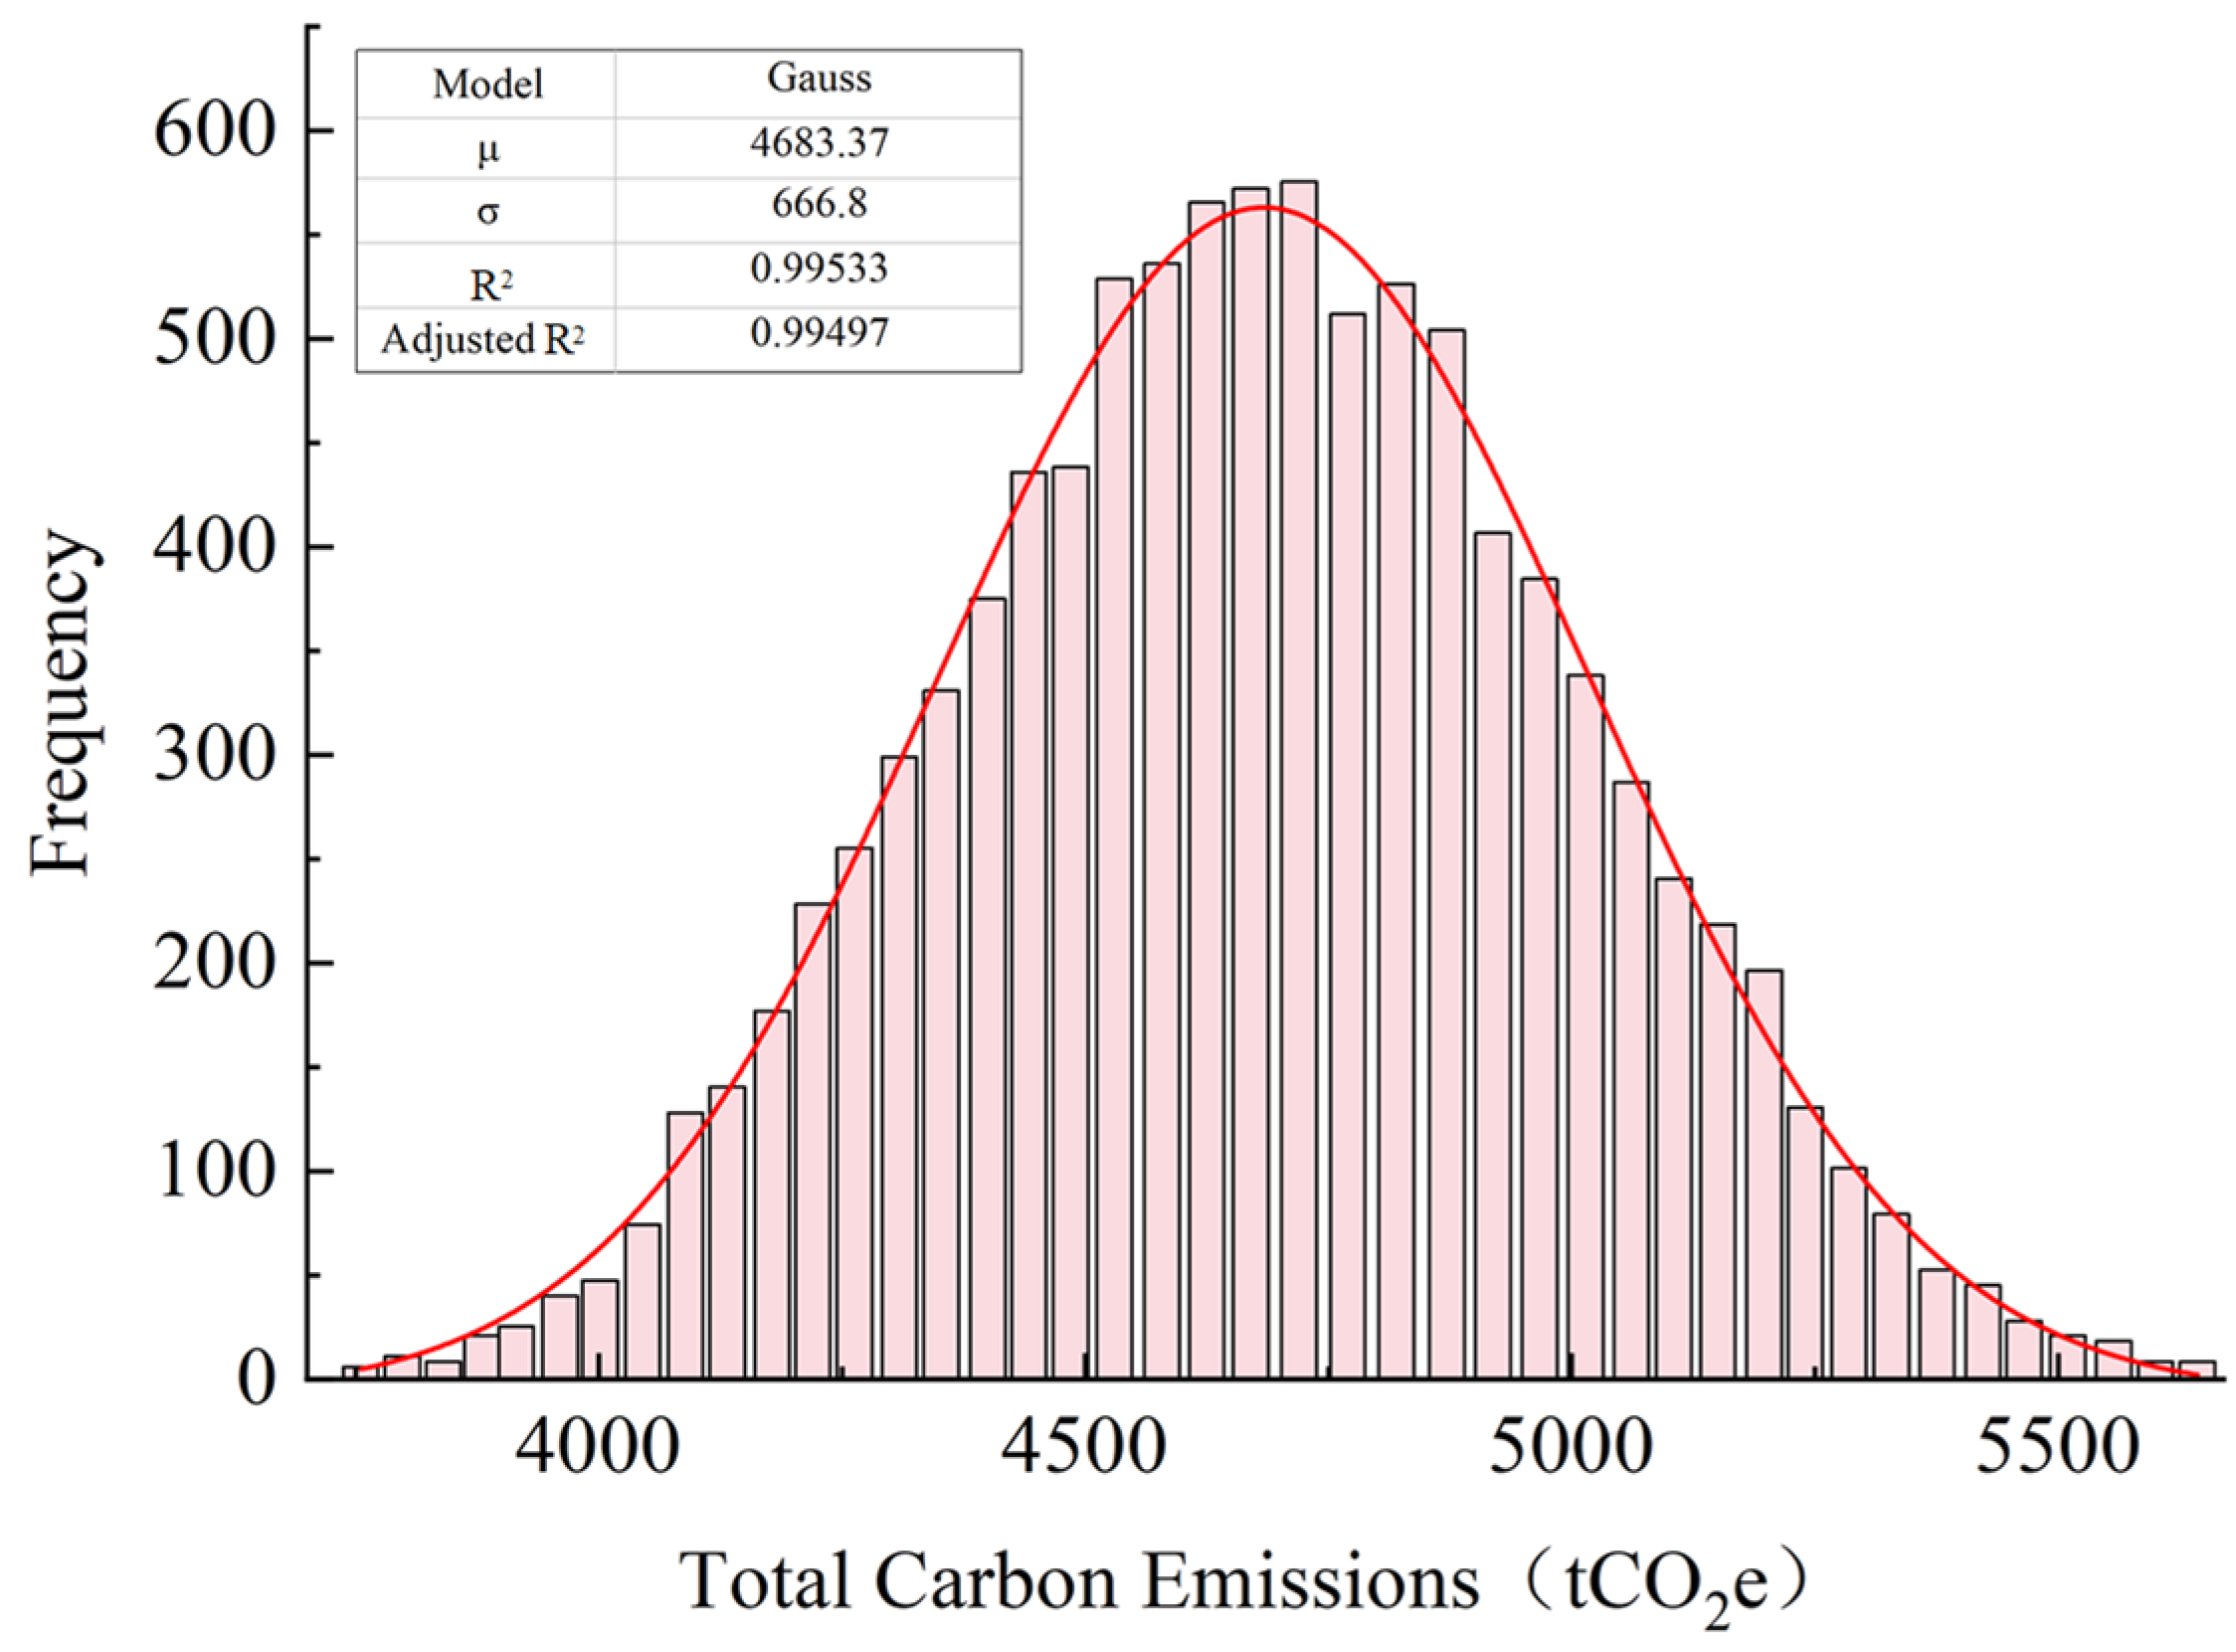
Based on 10,000 Monte Carlo simulations, the average carbon emissions were calculated at 4,582,968 kgCO
2e, which is 3.7% lower than the baseline calculation value (4,761,156 kgCO
2e). From
Figure 17, the driving effects of each influencing factor on carbon emissions during the materialization phase of bridges exhibit significant gradient differences. Aggregate transport distance (0.608) and cement consumption (0.595) serve as highly sensitive parameters that decisively influence total carbon emissions. Fluctuations in these parameters will directly lead to significant changes in carbon emissions. The high-strength steel substitution rate (0.397) and steel consumption (0.310) are both classified as highly sensitive parameters, indicating that material selection and consumption control are critical factors in carbon emission reduction. In contrast, the energy efficiency (0.107) and grid emission factor (0.099) of the mixing station in the construction stage are less sensitive, reflecting the limited carbon emission elasticity of energy consumption in the construction stage.
Figure 18 shows that the 95% confidence interval is [4,248,513, 4,926,404] kgCO
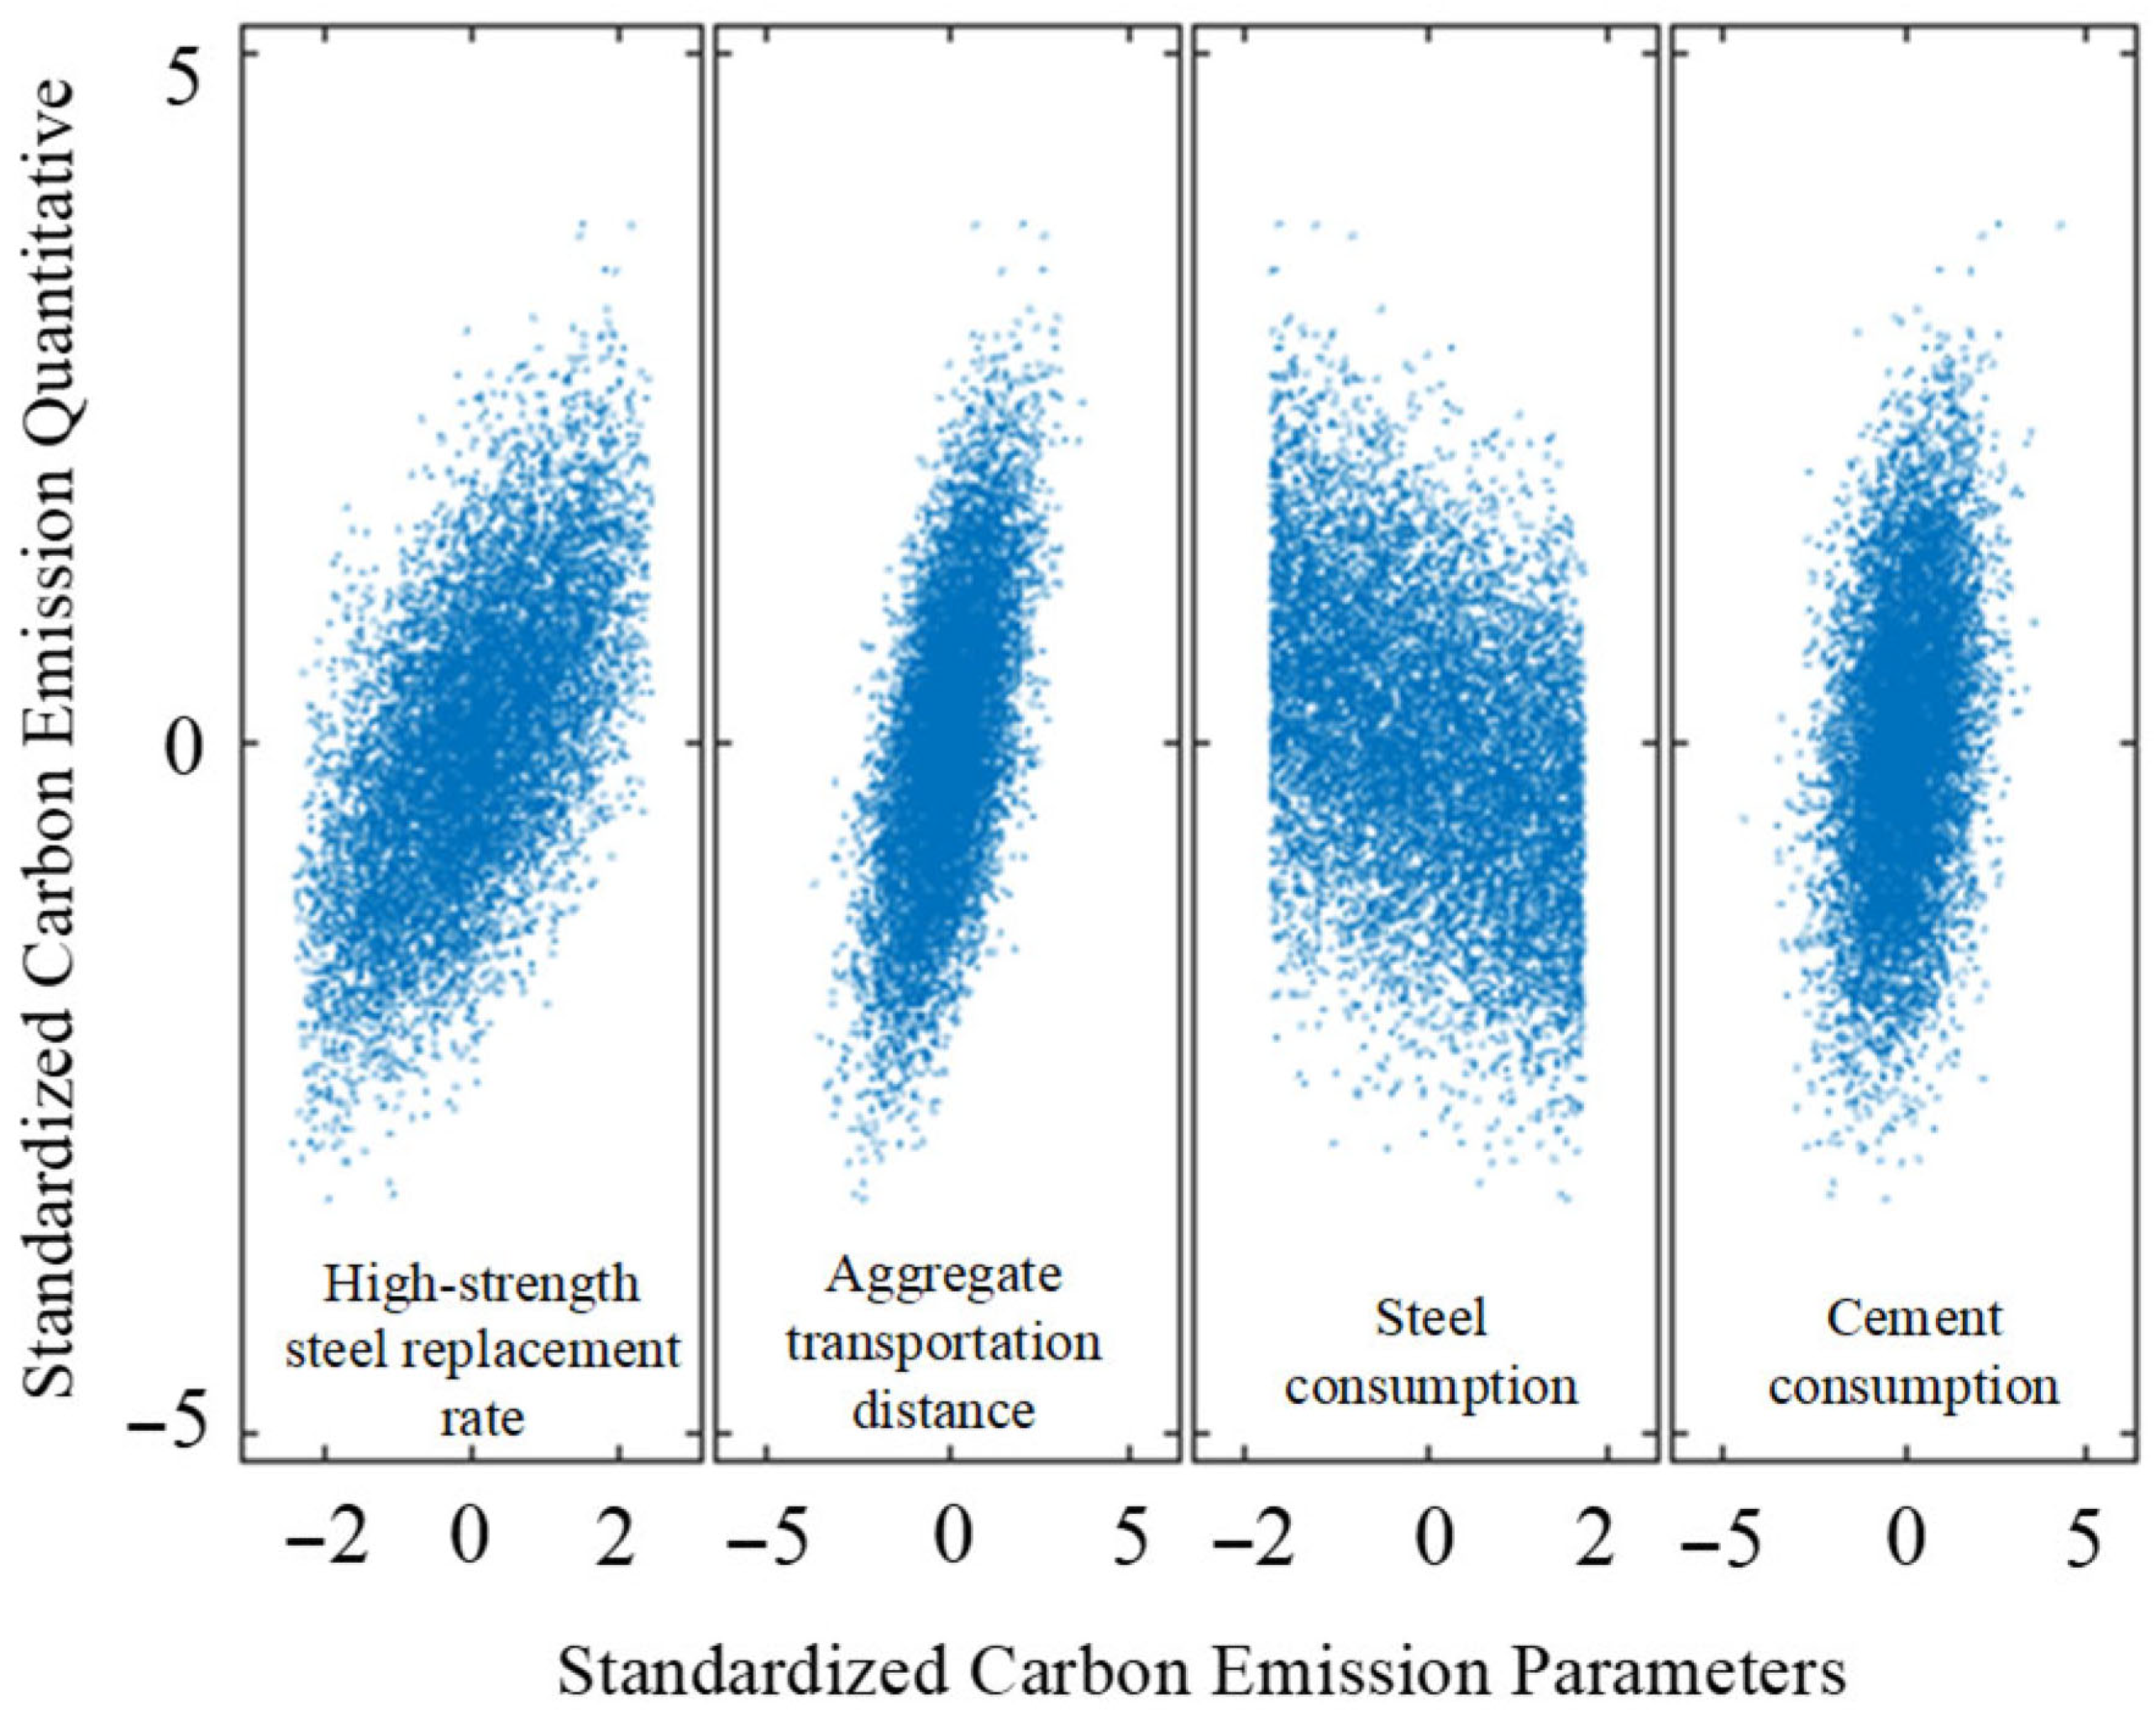
2e, with a relative range of ±7.4%. The coefficient of variation is 3.8%, indicating that the total carbon emissions estimate possesses high precision, and parameter uncertainty has a limited impact on the overall results. The four most sensitive parameters were selected for carbon emission correlation analysis, as shown in
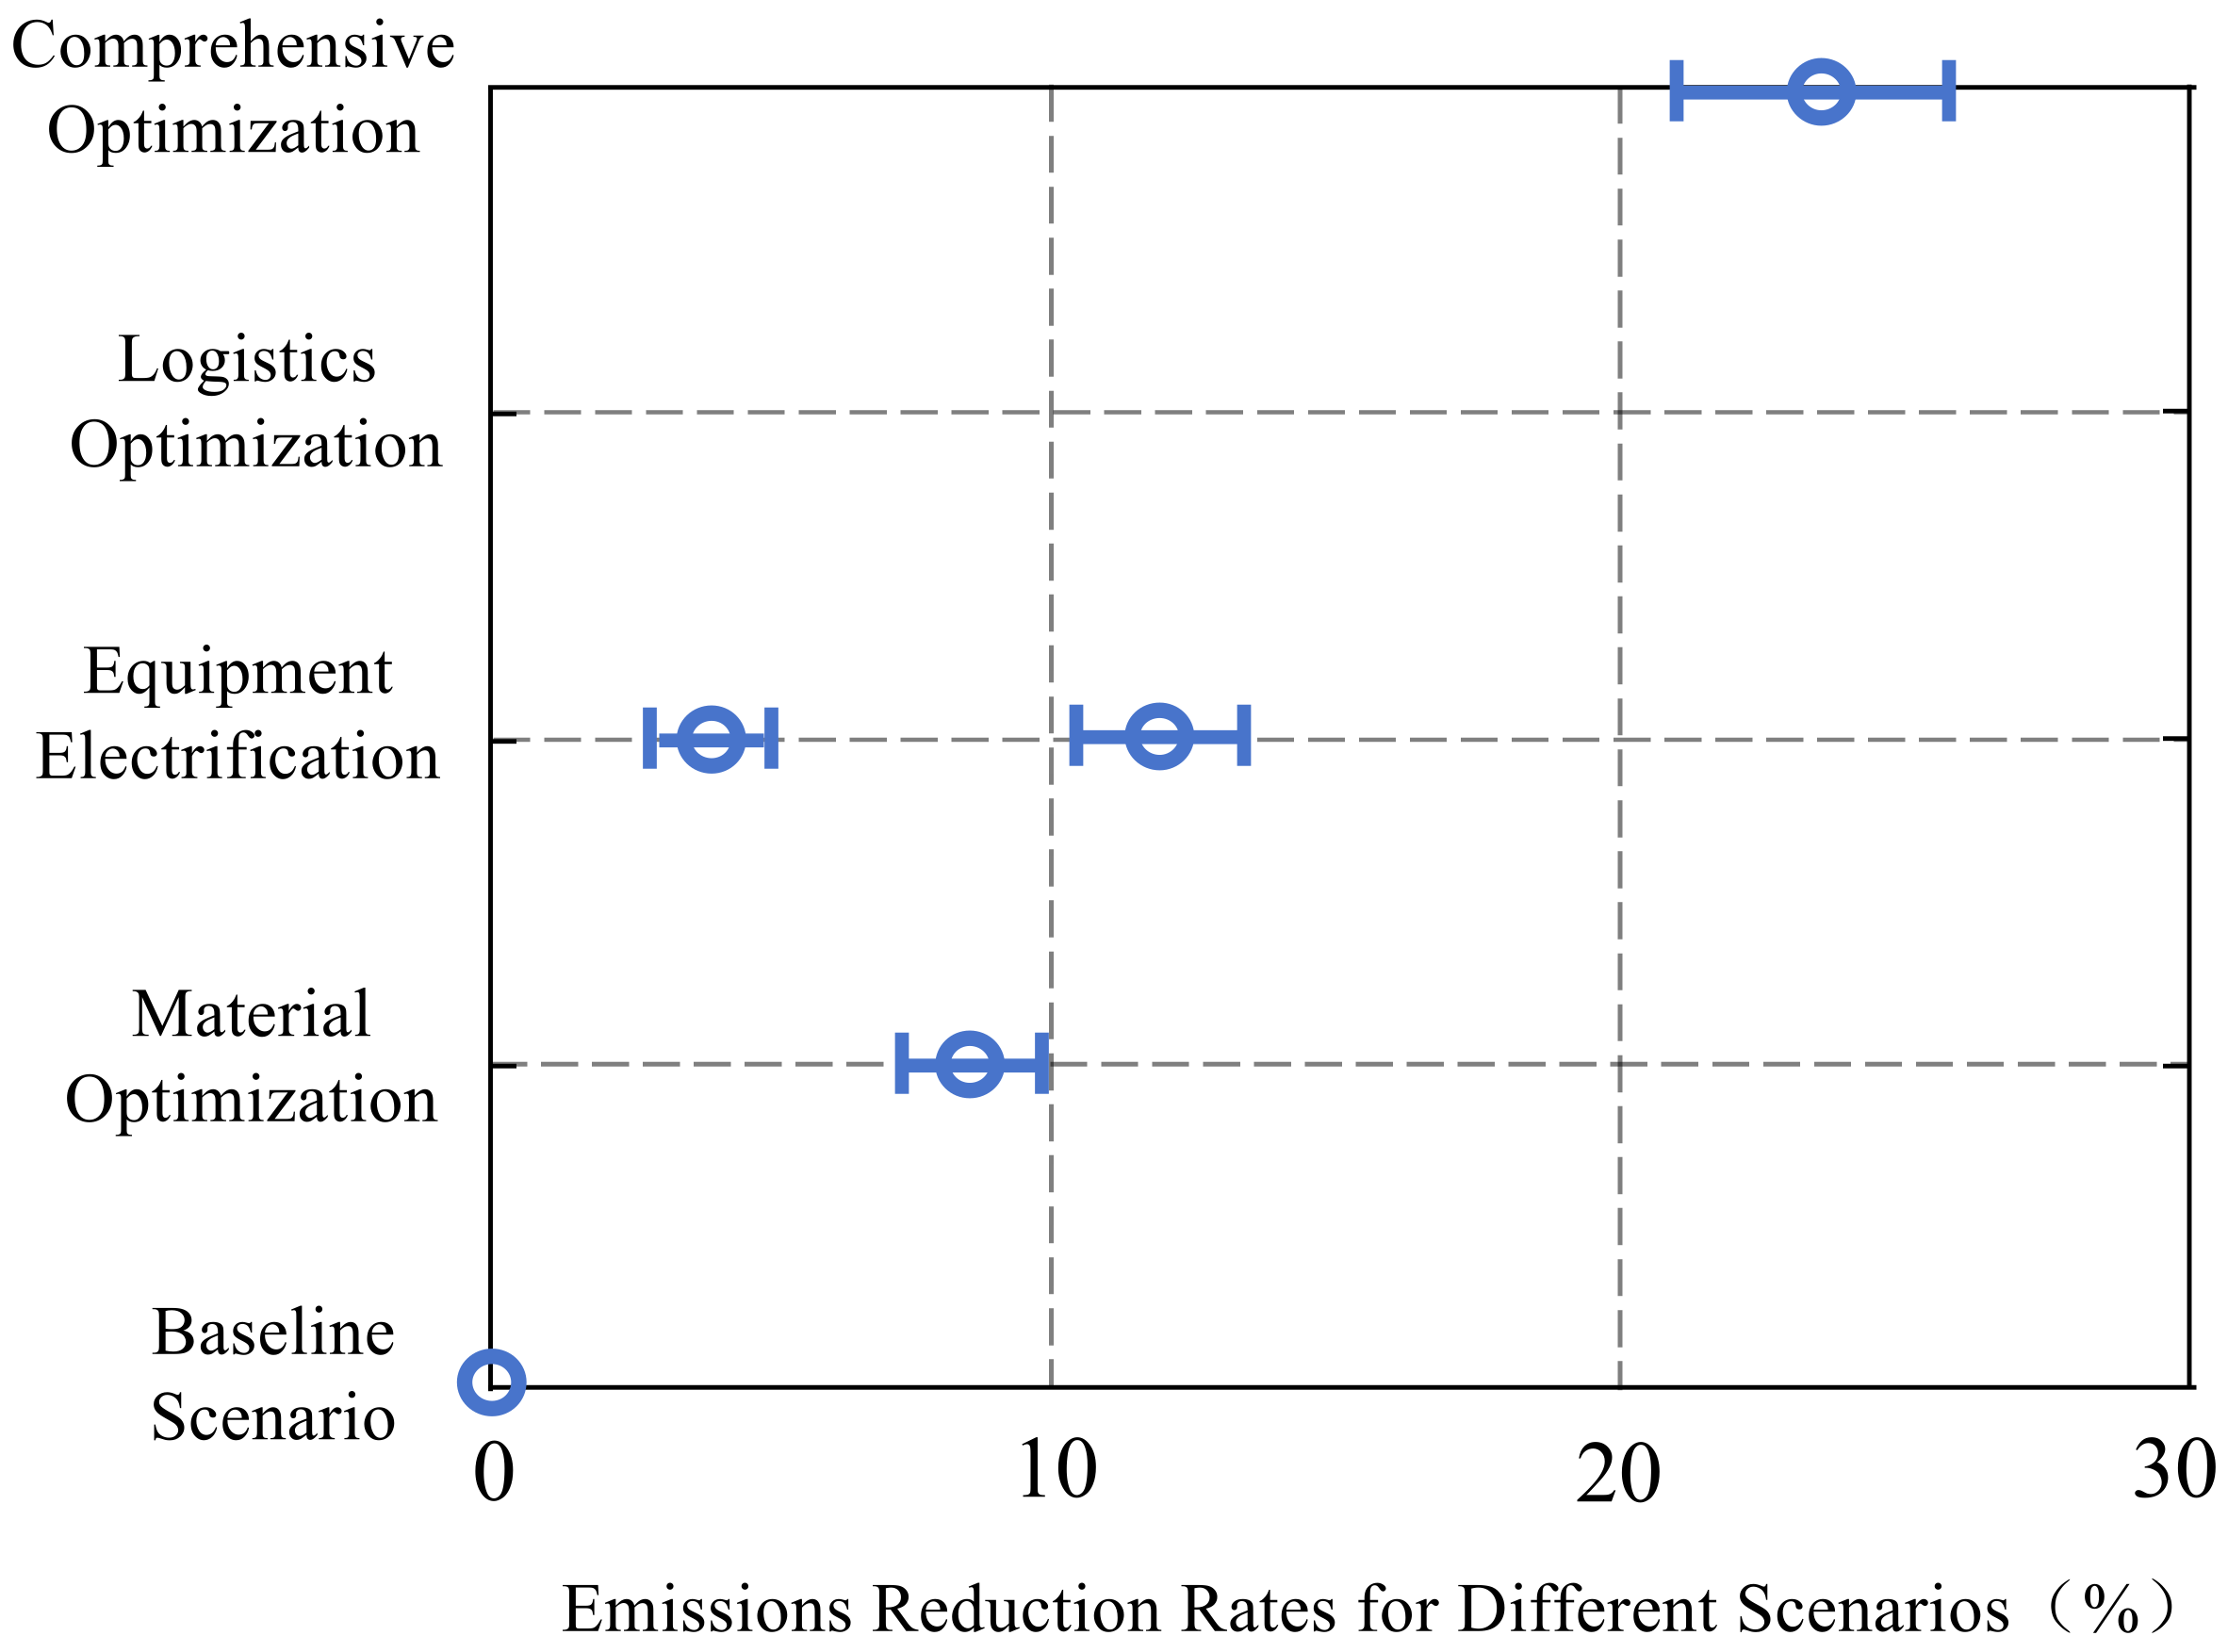
Figure 19. The emission reduction effects at each stage are illustrated in
Figure 20.
As shown in
Figure 19, the scatter points of aggregate transportation distance and cement consumption are closely distributed along the fitting line with a relatively large slope. This indicates that these two parameters exert decisive impacts on the total carbon emissions and should be prioritized in the formulation of carbon emission reduction strategies. The aggregate transportation phase exhibits the strongest correlation with carbon emissions, accounting for 62% of raw material extraction emissions. For every 10% increase in transportation distance, total carbon emissions rise by approximately 6.1%. Cement production accounts for over 60% of emissions in the building materials manufacturing sector, with fluctuations in its consumption directly impacting total emissions. Compared to steel, cement has fewer alternative materials and technological pathways, leading to concentrated sensitivity. Continuous improvements in steel production processes have reduced emissions intensity per unit, while the recyclability of steel partially offsets the sensitivity of emissions from initial production. Observing
Figure 20, a single logistics, material, and equipment electrification strategy can achieve emission reduction rates of 3.7%, 7%, and 13%, respectively, while the comprehensive optimization strategy can produce a synergistic emission reduction effect of 24%, which is far from the simple superposition of a single strategy. This shows that carbon emission reduction needs to adopt systematic solutions of logistics, materials, and energy, and maximize the benefits of low-carbon construction through targeted management involving multiple measures.
- c.
Emission reduction control strategy
In order to achieve the goal of low-carbon sustainable development of bridge engineering, this study proposes a systematic emission reduction control strategy for the high-carbon emission characteristics of each link in the materialization stage.
Firstly, case studies in the raw material extraction phase reveal that diesel machinery accounts for only 25% of the equipment fleet yet contributes 95% of carbon emissions. This highlights the contradiction within mining machinery: a low proportion but high emissions from diesel equipment. This study proposes supporting measures such as advancing the electrification of high-energy-consumption equipment, developing dual-mode hybrid transition systems, and constructing mining micro-grids (integrating photovoltaic, energy storage, and fast charging) to resolve the conflict between process and energy cleanliness, thereby providing a quantifiable pathway for the low-carbon transformation of raw material extraction machinery.
Secondly, aiming at the carbon emission problem of building materials transportation, this study proposes to establish an 80 km radius regional building materials supply network, preferentially select aggregate suppliers with a distance of ≤50 km from the construction site, and control the average transportation distance within 30 km. Implementation of transport equipment upgrades, the full use of 46 tons of heavy-duty electric trucks, and equipped with an intelligent loading system to ensure that the loading rate is ≥95%. These measures can reduce transportation losses, reduce procurement costs, and achieve win-win environmental and economic benefits.
Finally, to effectively reduce carbon emissions from construction machinery in bridge engineering, this study implements tailored strategies based on equipment carbon intensity: high-carbon equipment (concrete batching plants, transport trucks) undergoes mandatory electrification retrofits, incorporating an electric mixing station and battery-charged transport vehicle; medium-carbon equipment (rotary drilling rigs, etc.) employs BIM-based intelligent scheduling to minimize idle energy consumption; low-carbon equipment utilizes shared leasing to enhance utilization rates.