Article

Forecasting the Production of Construction Waste and Evaluating the Economic Value of Resource Utilization


1
School of Material Science and Engineering, Beijing University of Technology, Beijing 100021, China
2
MCC Communication Construction Group Co., Ltd., Beijing 100081, China
*
Author to whom correspondence should be addressed.
Buildings 2026, 16(1), 13; https://doi.org/10.3390/buildings16010013
Submission received: 22 November 2025 / Revised: 7 December 2025 / Accepted: 16 December 2025 / Published: 19 December 2025
(This article belongs to the Section Building Materials, and Repair & Renovation)

Abstract

With the rapid development of the global urbanization process, the resource utilization of construction waste has become one of the core issues of the development of a circular economy and has been widely concerned by the international community. However, China’s resource utilization efficiency in this field is still in the development stage, and cthere is still a gap with developed countries. It is urgent to systematically solve scientific problems such as low resource utilization efficiency, prominent technical bottlenecks, and imperfect whole process management mechanisms, so as to realize the coordinated high-quality development of the economy, society, and the environment. In order to scientifically predict the generation trend of construction waste and assess the resource potential, this study takes Beijing as the research object. Based on the historical data samples of construction waste in Beijing from 2001 to 2024, the analysis framework of “output estimation—trend prediction—value evaluation” is constructed. The ARIMA model is selected as the core tool of prediction, because it can match the phased change characteristics of construction waste output with the development of the city in time series data processing. Combined with the cost–benefit analysis method, it makes a quantitative analysis of the future production scale of construction waste and the economic benefits of resource utilization in Beijing. The research results show that from 2025 to 2034, the production of construction waste in Beijing will show a trend of first decreasing and then increasing, and it will reach 13.599 million tons by 2034. The resource utilization of construction waste in the next 10 years is expected to bring about USD 2.998 billion of economic benefits. This prediction result may be related to the policy guidance of Beijing’s urban renewal, changes in construction activities, and industrial technology upgrading. Accordingly, this study puts forward countermeasures and suggestions to help the development of industrialization, providing theoretical support and practical references for the sustainable development of the resource utilization of construction waste.

1. Introduction

In the wave of accelerating global urbanization, the construction industry, as a pillar industry of the national economy, has provided a solid material foundation for urban development, but at the same time, accompanied by the production of a large amount of construction waste, has become a prominent problem restricting the sustainable development of urban ecology. According to the statistical data of the National Research Report on the release of information on the prevention and control of environmental pollution by solid waste, 315 cities in China generated 9.32 billion tons of solid waste in 2023, including 2.41 billion tons of construction waste, accounting for 25.86% of the total [1]. The disorderly stacking and extensive disposal of construction waste not only takes up a lot of land resources but also contains harmful substances that can penetrate the soil and pollute groundwater, posing a double threat to the ecological environment and human health.
At present, the resource utilization of construction waste has become one of the core issues in the development of a global circular economy, and this field has received extensive attention from many scholars. Many scholars have conducted cutting-edge research on the performance optimization of recycled building materials and material science. Driven by global technological and production process innovation, the performance of recycled building materials can be significantly improved through technological and process improvements, thus, meeting basic engineering needs. For example, the research of Silva and Delvasto et al. showed that the performance of recycled building materials is comparable to or superior to conventional concrete or concrete made with virgin or natural materials [2,3]. Wang et al.’s research has shown that recycled glass powder has been successfully applied to limestone calcined clay cement (LC3) systems, improving their resistance to high-temperature degradation. Their other studies have shown that thermally activated waste eggshells are also used as an active calcium-rich component in ternary cement blends [4,5]. There are also many scholars who have conducted relevant research on the carbon emissions of construction waste and the environmental and economic benefits of the resource utilization of construction waste. Jiang et al. (2025) established a Carbon Emission Accounting Model (CEAM) to assess the carbon emission benefits of various stages of construction and demolition waste (CDW) recycling, finding that the carbon emissions from recycling metal materials are significantly lower than those from ordinary building materials [6]. Niekurzak et al. (2025) analyzed the regulatory mechanisms, ecological costs, and benefits of using urban and industrial waste as alternative fuels in the European cement industry based on research results from Polish cement plants [7]. Yu (2021) proposed a dynamic supply–demand model for construction waste recycling, which offers valuable decision-making support for both industrial chain participants and the government [8]. Many countries have also attached great importance to it and issued a series of policies and regulations to promote its development. Based on the revised Waste Directive of the European Parliament and the Council, and on the basis of the 70% target for the resource utilization of construction waste, the EU further requires member states to promote higher resource utilization targets through their own laws and policies in their new circular economy action plan [9,10]. In contrast, China’s annual production of construction waste exceeds 2 billion tons, but the utilization efficiency of construction waste resources is still at a low level, and the construction and demolition waste management system still needs to be further optimized and improved [11]. This situation has not only caused huge waste of resources and environmental pressure but also signifies a significant gap with China’s strategic goal of promoting high-quality development and building a new development pattern. Further research is urgently needed to promote its sustainable development. As one of the largest resource-consuming industries in China, the green transformation, technological innovation, and application of the construction industry are urgent. The recycling of recycled building materials has become a key step to achieving the goal of carbon emission reduction. Therefore, it is very important to predict the production of construction waste, especially in first-tier cities with rapid economic development.
Based on this, the purpose of this study is to provide scientific theoretical support and a practical path for the development of regional construction waste recycling industrialization, taking Beijing as a typical case, aiming at the problems of low efficiency, insufficient yield prediction accuracy, and a lack of value quantification in China’s construction waste recycling. In order to achieve this goal, this study systematically combed the relevant theories of construction waste management and circular economy, combined with the historical data of construction waste in Beijing from 2001 to 2024, and constructed a complete analysis framework of “output estimation—trend prediction—value evaluation”. The ARIMA model is selected as the core prediction tool in this study, because it has the dual advantages of capturing long-term trends and short-term random fluctuations in time series data processing, does not need to rely on complex multivariable assumptions, can accurately adapt to the stage change characteristics of construction waste production with urban development, and is highly consistent with the time series attributes of the 24-year continuous historical data in this study, which can effectively improve the reliability of the prediction results. This study combines the cost–benefit analysis method to quantify the economic value of resource utilization, refine the accounting indicators, and, finally, form targeted policy recommendations.
Figure 1 shows the research structure of this study.

2. Related Concepts and Theoretical Basis

2.1. Resource Utilization of Construction Waste

Construction waste is composed of solid waste generated during the construction, transformation, decoration, and demolition of buildings and their auxiliary facilities, mainly including muck, waste concrete, broken bricks, waste metal, and wood, etc. [12]. In addition, construction and demolition waste also includes ceramic materials such as tiles and fired clay bricks. Although its composition is complex, most components such as waste concrete, metal, and wood have the potential for recycling. The resource utilization of construction waste refers to the process of processing construction waste through physical, chemical, biological, and other technical means to convert it into renewable resources and put it back into production and use, mainly including the production of recycled aggregate, the manufacture of recycled building materials, metal recycling, energy recycling, and other forms. Its core goal is to achieve the reduction, recycling, and harmlessness of construction waste, reduce the dependence on original resources, and reduce environmental pressure.
In the early stages of China’s development, landfill was the main treatment method of construction waste, but with the improvement of ecological civilization construction and environmental protection awareness, the development of a multi-level utilization system of construction waste recycling was gradually promoted [13]. At present, China’s construction waste recycling strategy is divided into four levels. In the first layer, construction waste is still directly buried; in the second layer, construction waste is crushed and used for simple backfilling of the subgrade or foundation; in the third layer, construction waste is transformed into recycled aggregate after screening and processing, which is used as a substitute for natural aggregate to form recycled building materials; and the fourth layer is to use higher-standard recycled aggregate to produce high-performance recycled building materials or other building composites. The resource utilization of construction waste in China has gradually evolved from the initial simple treatment to a multi-level and efficient comprehensive utilization system. Through the multi-level resource system, the efficient utilization of construction waste has been effectively promoted.

2.2. Circular Economy Theory

The circular economy theory takes the closed-loop flow of “resources—products—wastes—renewable resources” as the core mode, relying on the three principles of “reduce, reuse, and recycle”, aiming to solve the disadvantages of the traditional linear economy of “mass production, mass consumption, and mass waste” through the efficient circulation of resources, and realize the synergy between economic development and ecological protection, which is the core theoretical support for the resource utilization of construction waste [14]. The idea of a circular economy originates from the concept of a “spaceship Economy” put forward by Kenneth E. Boulding, an American economist, in 1960. It compares the earth to a closed system and puts forward that resource recycling is the inevitable choice for sustainable development. In the 1980s, Germany and Japan took the lead in translating ideas into practice. The circular economy and waste removal act of Germany established the “extended producer responsibility system”, and the basic law for promoting the formation of a circular society of Japan established a full-chain governance system. Since the beginning of the 21st century, China has incorporated the circular economy into its national strategy. In 2009, it promulgated the Circular Economy Promotion Law of the People’s Republic of China [15]. In 2021, the “14th five-year plan” for the development of a circular economy clearly listed the recycling of construction waste as a key field, promoting the deep implementation of the theory in the construction industry.
The circular economy is closely related to the resource utilization of construction waste [16]. The “3R” principle of the circular economy constitutes a progressive governance system, which is reflected in the clear practical path of construction waste management. The principle of reduction is reflected in focusing on source control, reducing resource consumption through modular design, green construction, and the research and development of new building materials. According to the data, compared with traditional cast-in-place buildings, prefabricated buildings can shorten the construction period by 25% to 30%, save about 50% of water resources, save about 80% of wood, and reduce construction waste by more than 70% [17]. The principle of reuse is reflected in extending the resource utilization cycle, reusing turnover materials such as templates and scaffolding, and reusing old building components after repair, achieving “low-cost emission reduction”. The principle of resource utilization is reflected in the conversion of waste into renewable resources through technological means, such as the production of recycled aggregates from concrete blocks and the recycling and smelting of waste metals, which are the core links of “turning waste into treasure”.
The connotation of circular economy theory is embodied in the three concepts of system view, whole life cycle, and coordinated development, which pursue the unity of economic, social, and environment efficiency. For the resource utilization of construction waste, its value is reflected in three aspects: first, clarify the progressive path of “reduction–reuse–resource” and provide active guidance; the second is to guide the construction of the governance system of “government guidance, enterprise leadership, and public participation”; the third is to support the quantitative evaluation of value, provide a theoretical basis for the cost–benefit analysis of this study, and highlight the comprehensive value of resource utilization through the accounting of economic benefits and environmental costs.

2.3. Prediction Technology Theory

Prediction technology theory is a comprehensive theoretical system based on data law analysis and future trend deduction. The core is to quantitatively predict the future development status of the research object through historical data mining, feature extraction, and model construction, so as to provide a scientific basis for decision-making. In the production control of construction waste, this theory is the key support to realize “making decisions based on needs”. Its development can be divided into three stages: from the beginning to the middle of the 20th century, empirical judgment and simple statistical methods, such as the moving average method and exponential smoothing method, relied on the linear characteristics of data and are suitable for the prediction of short-term stationary series; with the development of econometrics in the middle and late 20th century, causality models rose, and multiple linear regression and gray prediction models became the mainstream. The prediction accuracy was improved by constructing quantitative relationships between variables, but data integrity was required; since the 21st century, with the breakthrough of big data and artificial intelligence technology, machine learning and deep learning models have been widely used. Back propagation (BP) neural network, LSTM, and other models have solved the prediction problems under complex influencing factors by virtue of their nonlinear fitting ability, forming a gradual and progressive technical system of “traditional statistics–econometrics intelligent algorithm”.
The core logic of the prediction technology theory is embodied in the closed-loop process of “data preprocessing—model adaptation—accuracy test—trend prediction”, in which the model selection needs to follow the principle of “data feature matching”: for the sequence data with obvious time dependence, the time series model is the most suitable. The ARIMA model used in this paper is such a classic method, which uses autoregression (AR) to capture the correlation of the sequence itself, moving average (MA) to eliminate random fluctuations, and difference (I) to deal with non-stationarity, and constructs the ARIMA (P, D, q) model framework, which can achieve accurate prediction without relying on external influence variables, especially for the sequence of construction waste, which is affected by multiple factors such as policies and industrial cycles, but whose historical data can be traced. The practical value of this theory is particularly prominent in the management of construction waste: on the one hand, through the mining of the laws of historical production data, we can identify the correlation characteristics between production fluctuations and the development of the construction industry and urban renewal policies; on the other hand, the future production range based on the model’s production can provide a quantitative basis for the planning of resource disposal facilities and the allocation of transportation capacity, and avoid the problem of “overcapacity” or a “disposal gap”. At the same time, the “dynamic correction” concept emphasized in the prediction technology theory requires updating the model parameters in combination with real-time data, which also provides theoretical guidance for the dynamic optimization of the subsequent production prediction results, ensuring that the prediction conclusion is highly consistent with the actual industrial development.

3. Research Status

3.1. Research Status of Foreign Construction Waste Recycling

Foreign scholars have formed a more systematic research system in the field of construction waste production prediction and resource utilization. Accurate estimation of waste production is the premise of formulating effective management strategies. Because the total amount of waste is usually difficult to obtain directly, scholars have developed a variety of prediction and quantitative methods. Colorado et al. (2021) proposed a comprehensive estimation method combining building area, material volume, and material density to quantify the amount of construction waste generated in Colombia [18]; Kabirifar et al. (2020) pointed out that the circular economy strategy, such as the “reduction, reuse, recycling” (3R) principle, has a direct impact on long-term waste generation and should be included in the prediction model as a key variable [19]. With the progress of technology, some studies began to explore the application of artificial intelligence and optimization algorithms. Abdelli et al. (2016) used GIS technology to optimize vehicle routes, significantly reducing the driving distance, collection time, fuel consumption, and pollution emissions, and improving the operational efficiency and environmental efficiency of the garbage collection system [20]; David E. Meyer et al. (2020), who analyzed the waste that may be generated by construction projects based on the U.S. environmental extended input–output model (useeio), pointed out that the output of construction waste is related to the quality of building services, and stressed that waste quantification is an important basis for economic decision-making [21]; Yu (2021) built a dynamic supply and demand model for construction waste recycling based on the industrial chain information system of recycled aggregate replacing original aggregate, providing support for all parties in the industrial chain and government decision-making [8]; in addition, Brandao et al. (2021) developed a conceptual model of a reverse supply chain related to construction demolition waste to analyze key participants, government strategies, and process paths in the process of construction waste management [22].
At the practical level of resource utilization, developed countries have established relatively perfect systematic governance models, and different regions have formed distinctive development characteristics. The European Union is a global leader in the field of construction waste resource management. Taking Germany as an example, its construction waste recycling rate has reached a high level of 97%; the core driving force is its sound legal system of circular economy, and the rigid implementation of the circular economy and waste management law provides institutional guarantee for governance. At the same time, Germany has formed a technologically mature construction waste recycling processing technology system, and it equipped with completely professional sets of machinery and equipment. The Nordic countries have made remarkable achievements in the field of the environmental efficiency assessment of construction waste. Denmark, Finland, Sweden, and other countries have established a full process closed-loop management system and generally adopted the incentive and constraint mechanism with tax regulation as the core. For example, the Finnish garbage tax law clearly stipulates that high taxes will be levied on the garbage sent to landfills or incinerated, and a tax exemption will be given to the recycled garbage to guide resource orientation through economic leverage. The research and practice in the United States focus on the actual transformation of technology and the improvement of economic benefits. The academia divides the recycling of construction waste into three levels: low-level utilization, intermediate utilization, and high-level utilization. Data show that about 70% of the construction waste generated in the United States each year is recycled and transformed through fine sorting and professional processing, and the remaining 30% is disposed of by landfill. Japan has established a very mature recycling system for construction waste, with an overall recycling rate of 96%, and the recycling rate of concrete waste is as high as 99.3%. Its core features are as follows: first, the implementation of refined classification standards and the formulation of differentiated legal regulations for different types of construction waste; second, the adherence to the principle of “source reduction and classified disposal”, and requirement new and demolition projects to complete preliminary sorting at the construction site, so as to lay the foundation for subsequent resource utilization; third, strengthen the collaborative participation of multiple social subjects, promote the wide application of recycled products through mandatory legislation and normalized publicity and education, and form a governance force.

3.2. Research Status of Domestic Construction Waste Recycling

Domestic scholars generally use the estimation method with the building area as the core parameter in the prediction of construction waste production. Yuanjian et al. (2020) used the building area estimation method to calculate the historical production of construction waste in Jinan from 2000 to 2017, and based on this, built a gray prediction model to predict the production in 2018 to 2022 [23]; Yinrong et al. (2023) used the system dynamics method to simulate and predict the generation trend of construction waste in Changsha [24]; Zhaoyu et al. (2021) [25] used the gray prediction model and BP neural network model to predict the amount of decoration waste in Wuhan. The results showed that the BP neural network had higher prediction accuracy [25]. Due to the limitations of single prediction models in terms of applicable conditions and accuracy, in recent years, scholars have increasingly adopted combined models to improve the prediction effect. Humingming et al. (2020) combined the gray prediction and exponential smoothing methods to predict the amount of construction waste in Chongqing, and realized the optimal site selection of resource-based treatment plants with the help of GIS technology [26]; Wangzhenshuang et al. (2024) found, through the Moran index and GWR model, that the regional differences in China’s construction waste recycling carbon emission reduction potential are large, and the overall pattern is “high in the east and low in the west” and “high in the south and low in the north”, with significant spatial differences and obvious spatial aggregation [27]. Yanhongyan (2025), based on the complex adaptive system theory, integrated the agent modeling (ABM) and system dynamics (SD) methods to build a hybrid simulation model for the recycling of construction waste, quantified the policy’s effect through simulation experiments, revealed the impact of corporate behavior feedback, and provided a theoretical basis and model reference for subsequent research [28]; Lv (2021) systematically sorted out the quantitative methods of construction waste, combined them with the project’s budget data, extracted the key parameters from the bill of quantities, and established the prediction model of construction waste based on the project’s budget [29]; Sunkehua et al. (2020) [30] proposed a time series prediction method based on the three-layer LSTM network. Through the dropout layer’s structure-optimization network training, the accuracy and effectiveness of the method in the prediction of construction waste output were verified with the data of Shanghai [30].
In practice, the field of construction waste recycling in China started relatively late. Compared with developed countries such as Germany, Japan, and the United States, which started systematic legislation and practice in the middle and late 20th century, China did not initially pay attention to the management of construction waste until the late 1980s. Its development process shows the gradual evolution characteristics from passive disposal to systematic governance: from the end of the 20th century to about 2010 is the initial exploration period, mainly using passive disposal methods such as open stacking and simple landfill. The concept of resource utilization is in the sporadic introduction stage and has not yet formed large-scale practice. From 2011 to 2020, China entered a period of rapid development. Driven by the national strategy of building a “waste-free city”, relevant policies, regulations, and industry standards (such as the technical standard for construction waste treatment CJJ/T134-2019 [31]) were intensively introduced. By 2020, the comprehensive utilization rate of construction waste across the country increased to about 50%, and the technical system was initially established. From 2021 to now, China has stepped into a period of high-quality development and deepening, with more emphasis on whole-chain management and control, promoting the continuous improvement of the three-level policy system of “national legislation + local regulations + industry standards”, the wide application of cutting-edge prediction models and renewable technologies, and the deep integration of resource utilization and “double carbon” goals. At present, China has made significant progress in policies and regulations, management systems, and treatment technology and processes, but actual resource management still faces many challenges and needs to be further optimized and improved [32]. The overall development still faces some core bottlenecks, such as the lack of systematic front-end classified collection, the gap in the regional distribution and capacity of middle-end processing facilities, and the need to improve the market recognition and competitiveness of back-end renewable products. Compared with developed countries, there is still a significant gap in the recycling rate of construction waste in China. With the concept of green and low-carbon recycling development becoming a global consensus, China continues to strengthen the recycling treatment of construction waste, and the relevant management system and policy system are also constantly improving.

4. Prediction of Construction Waste Production

4.1. Selection of Production Estimation Method

Scientific calculations of construction waste production are the basis for formulating efficient management strategies, which have important guiding value. To estimate the production of construction waste, it is necessary to select a scientific estimation method based on the regional characteristics of Beijing, so as to improve accuracy while reducing the consumption of human and material resources. At present, the mainstream methods for estimating the production of construction waste mainly include the field research method, material flow analysis method, system modeling method, and unit area production method.
(1)
Field investigation method
The on-site investigation method is a quantitative method that directly measures the waste piles on the construction site or carries out statistical accounting on the cleaning and transportation carriers (such as garbage trucks) [33]. The core advantage of this method lies in its intuitive principle and simple operation. It can quickly obtain basic data through direct measurement or statistical accounting. However, the limitation is that the space applicability is limited, which is not suitable for production accounting on a large-scale and large-scale construction areas, and the data accuracy is easily disturbed. The operation error of statisticians, uneven vehicle loading, and other factors may lead to the deviation of accounting results.
(2)
Material flow analysis
Material flow analysis refers to the analysis of the changes in material flow and stock within a specified time and space range of a system, which can comprehensively analyze the entire system process from material sources, flow paths, intermediate media, and, ultimately, sinks [34]. Based on the principle of material conservation, the material flow analysis method tracks the transformation path of building materials from construction to demolition. It is assumed that after the building reaches its service life, the initial total amount of building materials minus construction losses is the amount of demolition waste. This method defines the space–time boundary of the study area and regards the building system as a closed material unit, so the total input of raw materials in the whole life cycle of the building is equal to the sum of the effective utilization, construction loss, and demolition waste. This method can provide a quantitative basis for analyzing the material utilization efficiency, environmental impact, and social stock of each link, but its accounting results have significant regional specificity [35]. Due to the regional differences in construction technology and the material system, its data cannot be directly applied across regions. The formula is as follows:
W = Q − WS
WS = Q × q
W is the total amount of construction waste, Q is the total amount of raw materials in the year of construction, WS is the loss during construction (i.e., the amount of construction waste generated at the construction site), and q is the average waste rate of construction loss.
(3)
System modeling method
The system modeling method regards the generation of construction waste as a systematic process driven by multiple factors, and constructs prediction models by quantifying social economy, construction technology, and other variables [36]. This method has high accounting accuracy, but it needs to obtain a long time series and multi-dimensional supporting data. The technical difficulty of model construction and parameter calibration is high, and it is suitable for medium- and long-term macro prediction.
(4)
Yield per unit area method
The waste production per unit area method is one of the most widely used methods in the field of construction waste production accounting at present. The total production can be obtained by calculating the product of the construction area and the corresponding waste production rate in the construction, demolition, and decoration stages by classification, and adding them, which can realize the refined calculation in stages and types [37]. The formula is as follows:
W = WS + WC + WZ
Wi = Si × qi, i = S, C, Z
In Equations (3) and (4), W is the total amount of construction waste, WS is the amount of construction waste generated at the construction site, WC is the total amount of demolition waste, and WZ is the total amount of decoration waste; Si is the building area corresponding to various wastes, SS is the area of newly built buildings, SC is the area of demolition, and SZ is the area of decoration; and qi is the production rate of various building wastes, which should be determined according to the actual situation.
Comprehensive comparison shows that the accuracy of the field survey method is limited, the cost of the material flow analysis method is high, and the system modeling method has strict requirements for data integrity. The yield per unit area method covers the main production links of construction waste in the whole life cycle. While ensuring operability, it can calibrate the yield rate through historical data to improve accuracy, which is suitable for the estimation of urban production. Therefore, the yield per unit area method is selected in this study to estimate the yield of construction waste.

4.2. Selection of Production Forecasting Methods

The prediction of construction waste production is the basis for the planning and management of resource treatment facilities. At present, the mainstream prediction methods include the BP neural network prediction model, multiple regression analysis model, system dynamics prediction model, gray prediction model, and ARIMA time series model. Various models are based on different theoretical foundations, showing significant differences in prediction accuracy, data requirements and operation difficulty.
(1)
Back Propagation neural network prediction model
The BP neural network is a multi-layer feedforward neural network based on the error back-propagation algorithm, which is composed of an input layer, hidden layer, and production layer. In the process of the model’s operation, the input variables are transferred to the hidden layer, layer by layer along the positive path through the input layer, and then transferred to the production layer after being processed by the activation function to generate the prediction results. The system calculates the error function between the predicted value and the actual target value, reverses the error signal along the original path, adjusts the error to the preset minimum value, and finally completes the model’s training and prediction. Akanbi et al. (2020) [38] collected the data of 2280 building demolition projects in the UK. Based on the deep learning neural network model, they predicted the total amount of building demolition waste and the amount of waste with different treatment methods. The prediction accuracy of the overall model reached 97% [38]. The model has strong nonlinear fitting ability, but as a complex artificial neural network model, its training, optimization, and testing processes require high computing power, a large amount of sample training, and have high operation complexity.
(2)
Multiple regression analysis model
Multiple regression analysis is a parametric prediction method based on statistical theory. It quantifies the influence weight of each factor on the production of construction waste by establishing the linear relationship equation between dependent variables and multiple independent variables. The specific form is as follows:
y = β0 + β1x1 + β2x2 + + βnxn
where y is the total amount of construction waste; xn is the influencing factor; and βn is the regression coefficient. This method needs to verify the reliability of the model through significance tests (such as p-value, R2), but it requires a large amount of data and avoids multicollinearity between variables. Kern et al. (2015) used multiple linear regression analysis to analyze the amount of residential construction waste, but the construction of the prediction model of waste production at the construction site using multiple linear regression analysis made it difficult to reflect the nonlinear mapping relationship between the amount and influencing factors, and the results caused large errors [39].
(3)
System dynamics prediction model
System dynamics build a causal loop diagram by identifying the causal correlation and feedback path of key influencing factors in the system, further build a system flow diagram including the flow level, flow rate, and auxiliary variables, and use Vensim or Stella and other special software to build a simulation model for operation [40]. The method is good at dealing with nonlinear and time-varying systems and can simulate long-term dynamic changes under the policy intervention. However, the model’s construction needs to accurately define the boundary of the system, which requires high domain knowledge of the modeler.
(4)
Gray prediction model
The gray prediction model generates the original data series by accumulation, converts the non-stationary series into the stable series with approximate exponential growth, and then constructs the gray differential equation and whitening differential equation to reveal the internal law of the system [41]. This method has low requirements regarding the amount of data and is suitable for short-term prediction, especially for scenes with incomplete statistical data. Its accuracy grade in the prediction of construction waste is excellent, but its limitation is that it is highly dependent on the exponential growth sequence, and the long-term prediction deviation may expand.
(5)
ARIMA prediction model
The ARIMA (Autoregressive Integrated Moving Average) model is a classic model in the field of time series prediction. Its core structure is composed of an autoregressive (AR) module, a difference (I) module, and a moving average (MA) module, which are recorded as ARIMA (p, d, q), where p is the order of the autoregressive module, d is the number of differences, and q is the order of the moving average. The model uses the autocorrelation and moving average characteristics of historical data to realize trend prediction after the non-stationary time series is transformed into a stationary series by differential processing. The ARIMA model’s modeling mainly includes the following steps: ① data stationarity test, which requires the input series to meet the stationarity assumption; ② the data are smoothed, and the non-stationary series are smoothed by the difference method; ③ the model parameters were determined, and the three values of p, d, and q were determined based on the characteristics of the ACF-PACF graph of the stationary series; ④ white noise test: the white noise test is carried out on the error sequence of the model. If the residual is a non-white noise sequence, it indicates that the model does not fully extract data information, and it is necessary to readjust the p, d, and q parameters or adopt the model fusion strategy; ⑤ prediction: production the prediction results based on the optimized model parameters [42].
In general, the applicability difference in each prediction model stems from its theoretical basis and data demand. Although the BP neural network and system dynamics model perform better in prediction accuracy, they are relatively weak in practice due to the high modeling difficulty and operation threshold; multiple regression needs complete variable data support; the gray prediction model and ARIMA model, with their simple modeling process and stable prediction effect, have a wider application prospect in the prediction of construction waste production. The specific selection needs to be combined with the comprehensive judgment of data availability, prediction cycle, and system complexity.

4.3. Estimation of Construction Waste Production in Beijing

With the continuous expansion of urban infrastructure construction, the production of construction waste is constantly increasing. The relatively traditional way of handling it has led to frequent environmental problems. The measurement of construction waste production is helpful for local governments to build standardized and orderly construction waste resource recycling management systems. At present, most foreign countries adopt methods such as deep learning and neural networks to construct prediction models for the production of construction waste. Through the analysis of the historical production, type, source, and other characteristics of construction waste, combined with regression analysis, time series analysis, cluster analysis, and other methods, the production of construction waste can be predicted.
This chapter follows the research framework of “model construction—predictive analysis—benefit evaluation”. Firstly, based on data such as the construction and completed area of building projects, the production of construction waste in Beijing is estimated through estimation methods. Secondly, the ARIMA model’s method of time series analysis is introduced. Based on the estimated result, a prediction model for the production of construction waste is constructed to predict the future production of construction waste in Beijing. Finally, based on the prediction results, the cost–benefit analysis method is applied to conduct a quantitative assessment of the economic benefits of construction waste.

4.3.1. Overview of Research Object

As a super-large city, Beijing comprehensively considers typicality, policy guidance, and regional practice closed-loop maturity in construction waste management. In this paper, Beijing is selected as the empirical object to study construction waste production prediction and waste resource progress. The main reasons include the following aspects:
(1)
Beijing’s economic development has entered a new stage of being high-end and service-oriented, and the construction industry is also facing a development trend of transforming towards urban renewal and refined management.
Benefiting from the profound adjustment, transformation, and upgrading of industrial structures, Beijing, as the national capital, reflects its strong comprehensive strength and sustained development momentum.
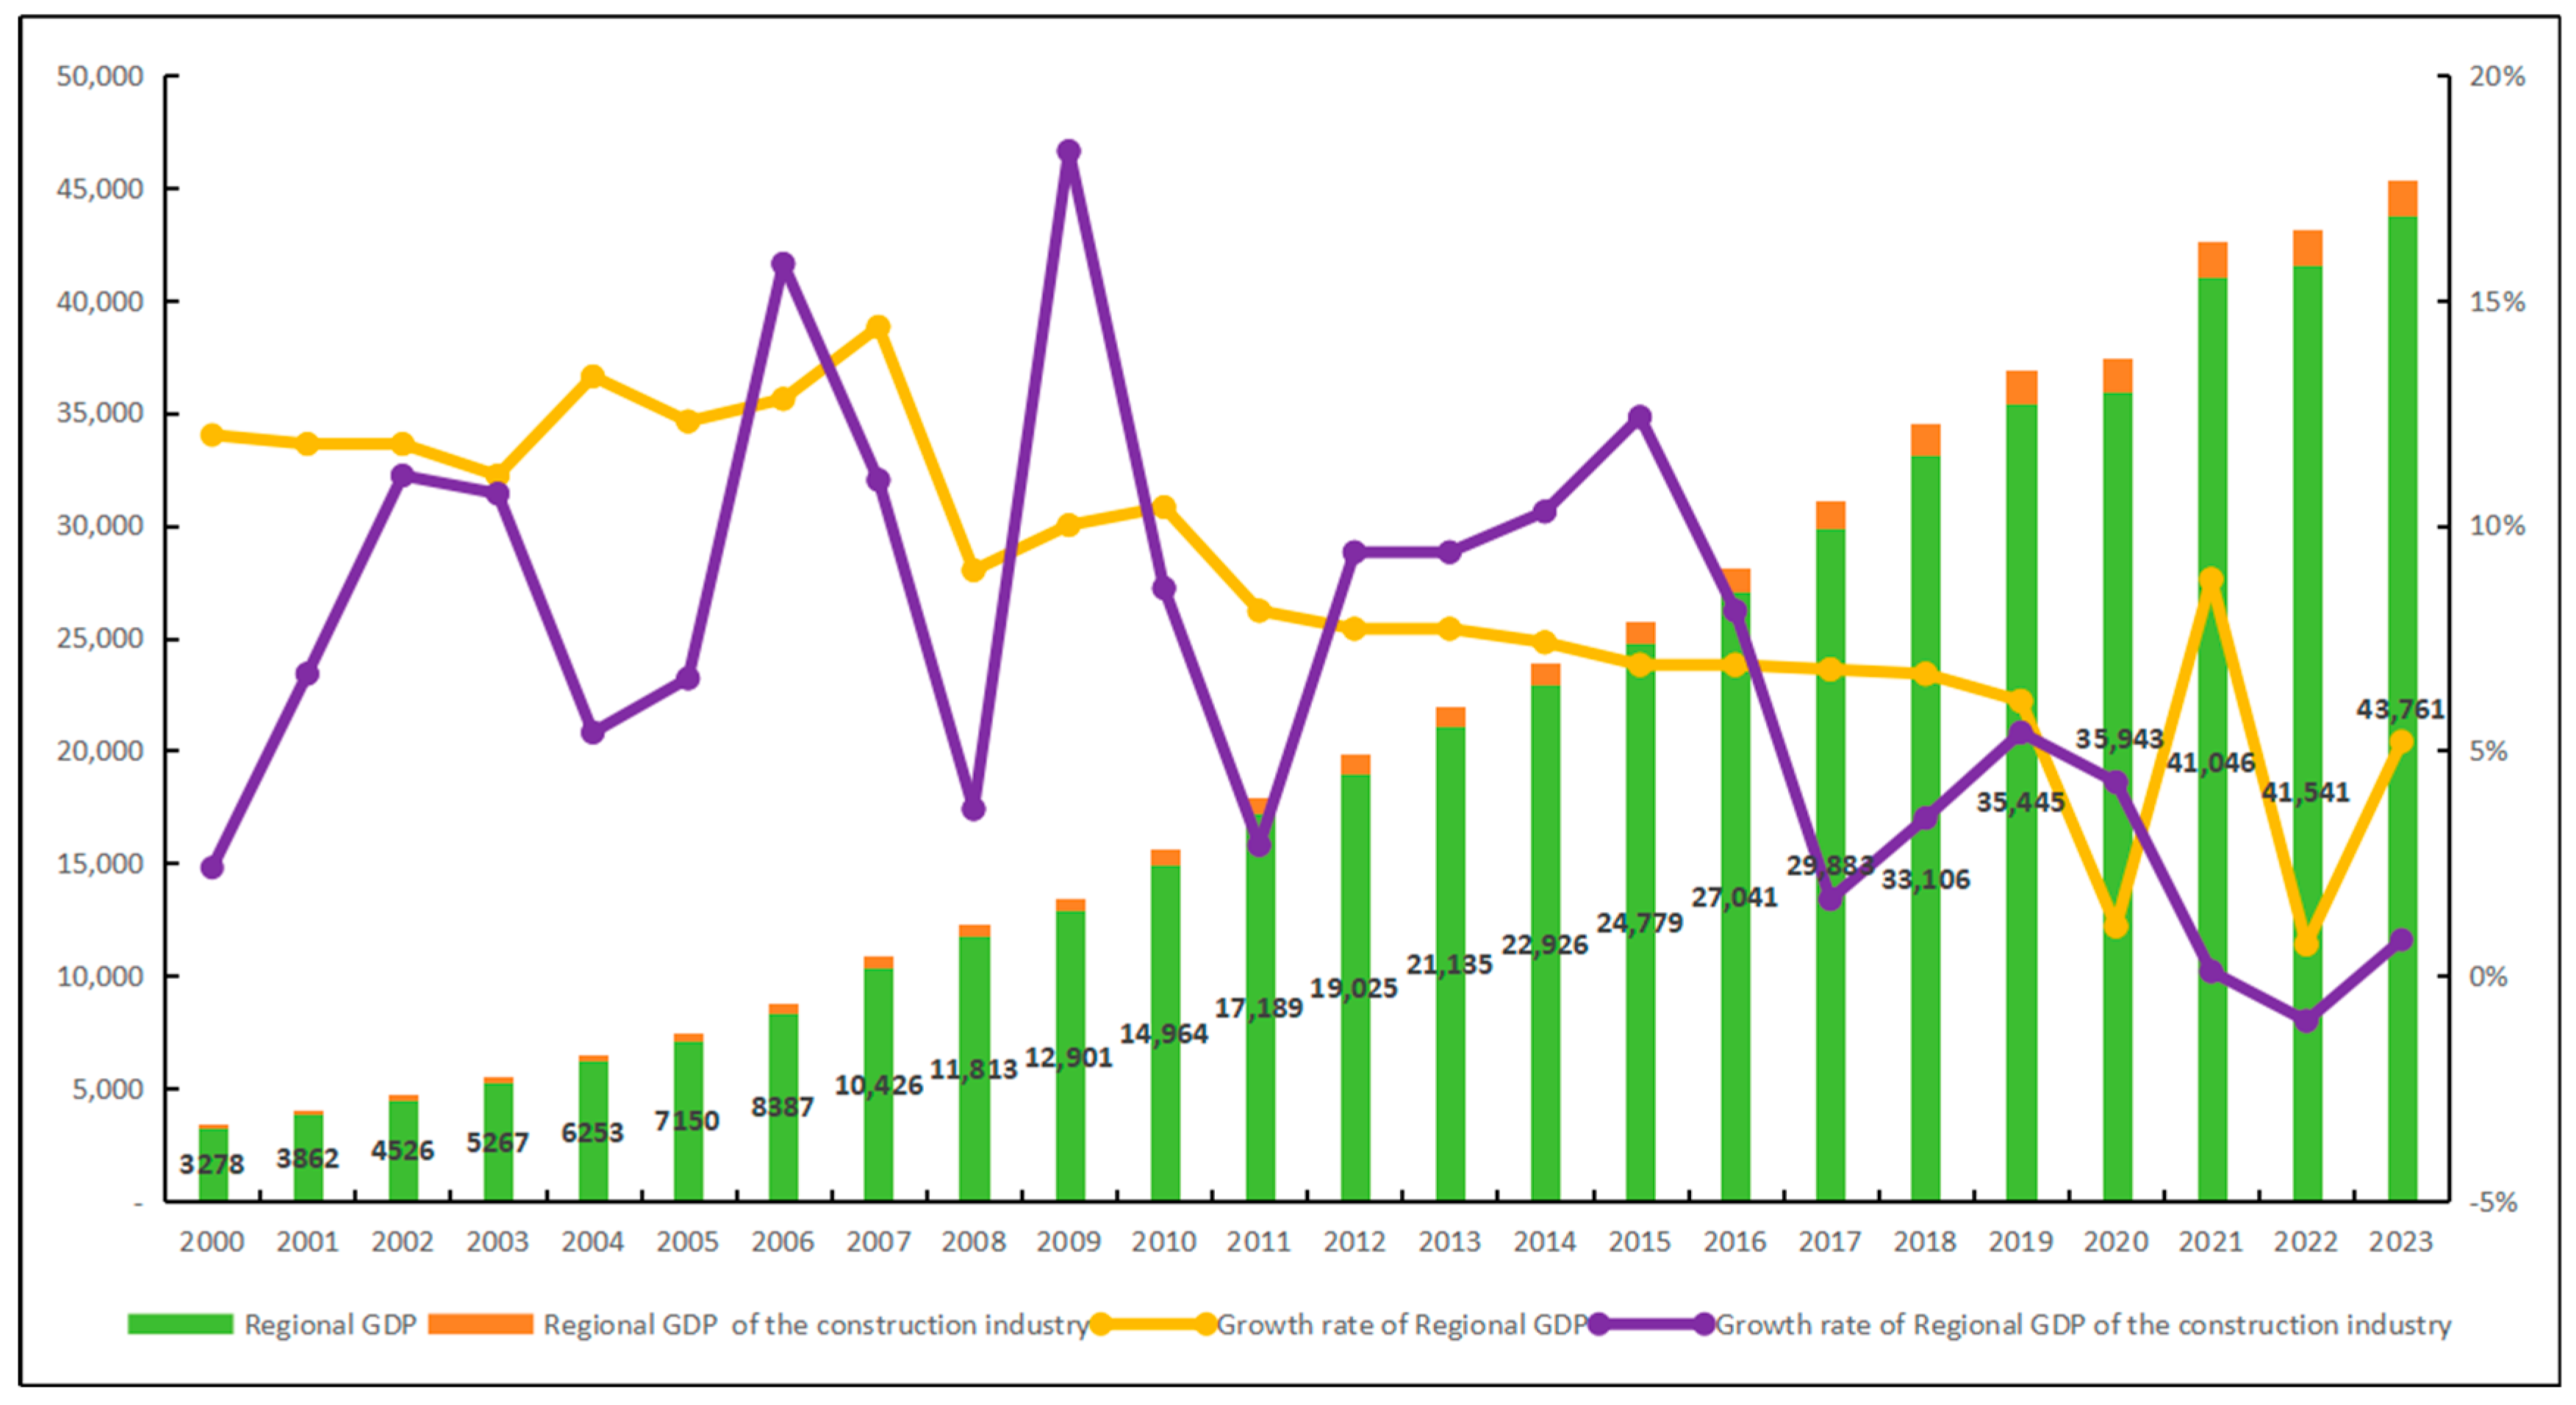
From 2000 to 2023, the regional GDP of Beijing has shown a sustained growth trend. The role and status of the construction industry as a traditional sector in economic development have changed. The construction industry in Beijing is gradually transforming towards higher quality and greater refinement to adapt to the new requirements of economic development and market demands. As can be seen from Figure 2, the regional GDP of Beijing in 2007 was CNY 1.04 trillion, the regional GDP of Beijing in 2013 was CNY 2.11 trillion, the regional GDP of Beijing in 2018 was CNY 3.31 trillion, and the regional GDP of Beijing in 2021 was CNY 4.10 trillion.
The data shows that trillions of new steps can be reached almost every five years. Meanwhile, this phenomenon has also benefited from China’s implementation of the “five-year plan”. The plan guides the government and enterprises to formulate implementation plans around the goals, making economic activities exhibit distinct five-year cycle characteristics. The driving force of economic growth has gradually shifted from traditional investment driven by large-scale infrastructure construction to scientific and technological innovation, consumption upgrading, and the service industry. It is also the main reason for the steady growth of regional GDP and the relatively slow growth of construction. In the planning document of Beijing for 2016–2035, it is pointed out that the population scale, land use scale, and development intensity of plain areas should be determined with the resource and environmental carrying capacity as the hard constraint, so as to achieve the coordination and unity of various urban development goals [43]. At the same time, Beijing also proposed to take the new version of the urban master plan as the guide, to constantly optimize and improve the capital function, and implement the strategy of double control of the population size and construction scale [44]. Therefore, as Beijing’s economic growth pays more attention to quality, the construction industry will be more deeply integrated with the development concepts of being green, low carbon, and intelligent.
(2)
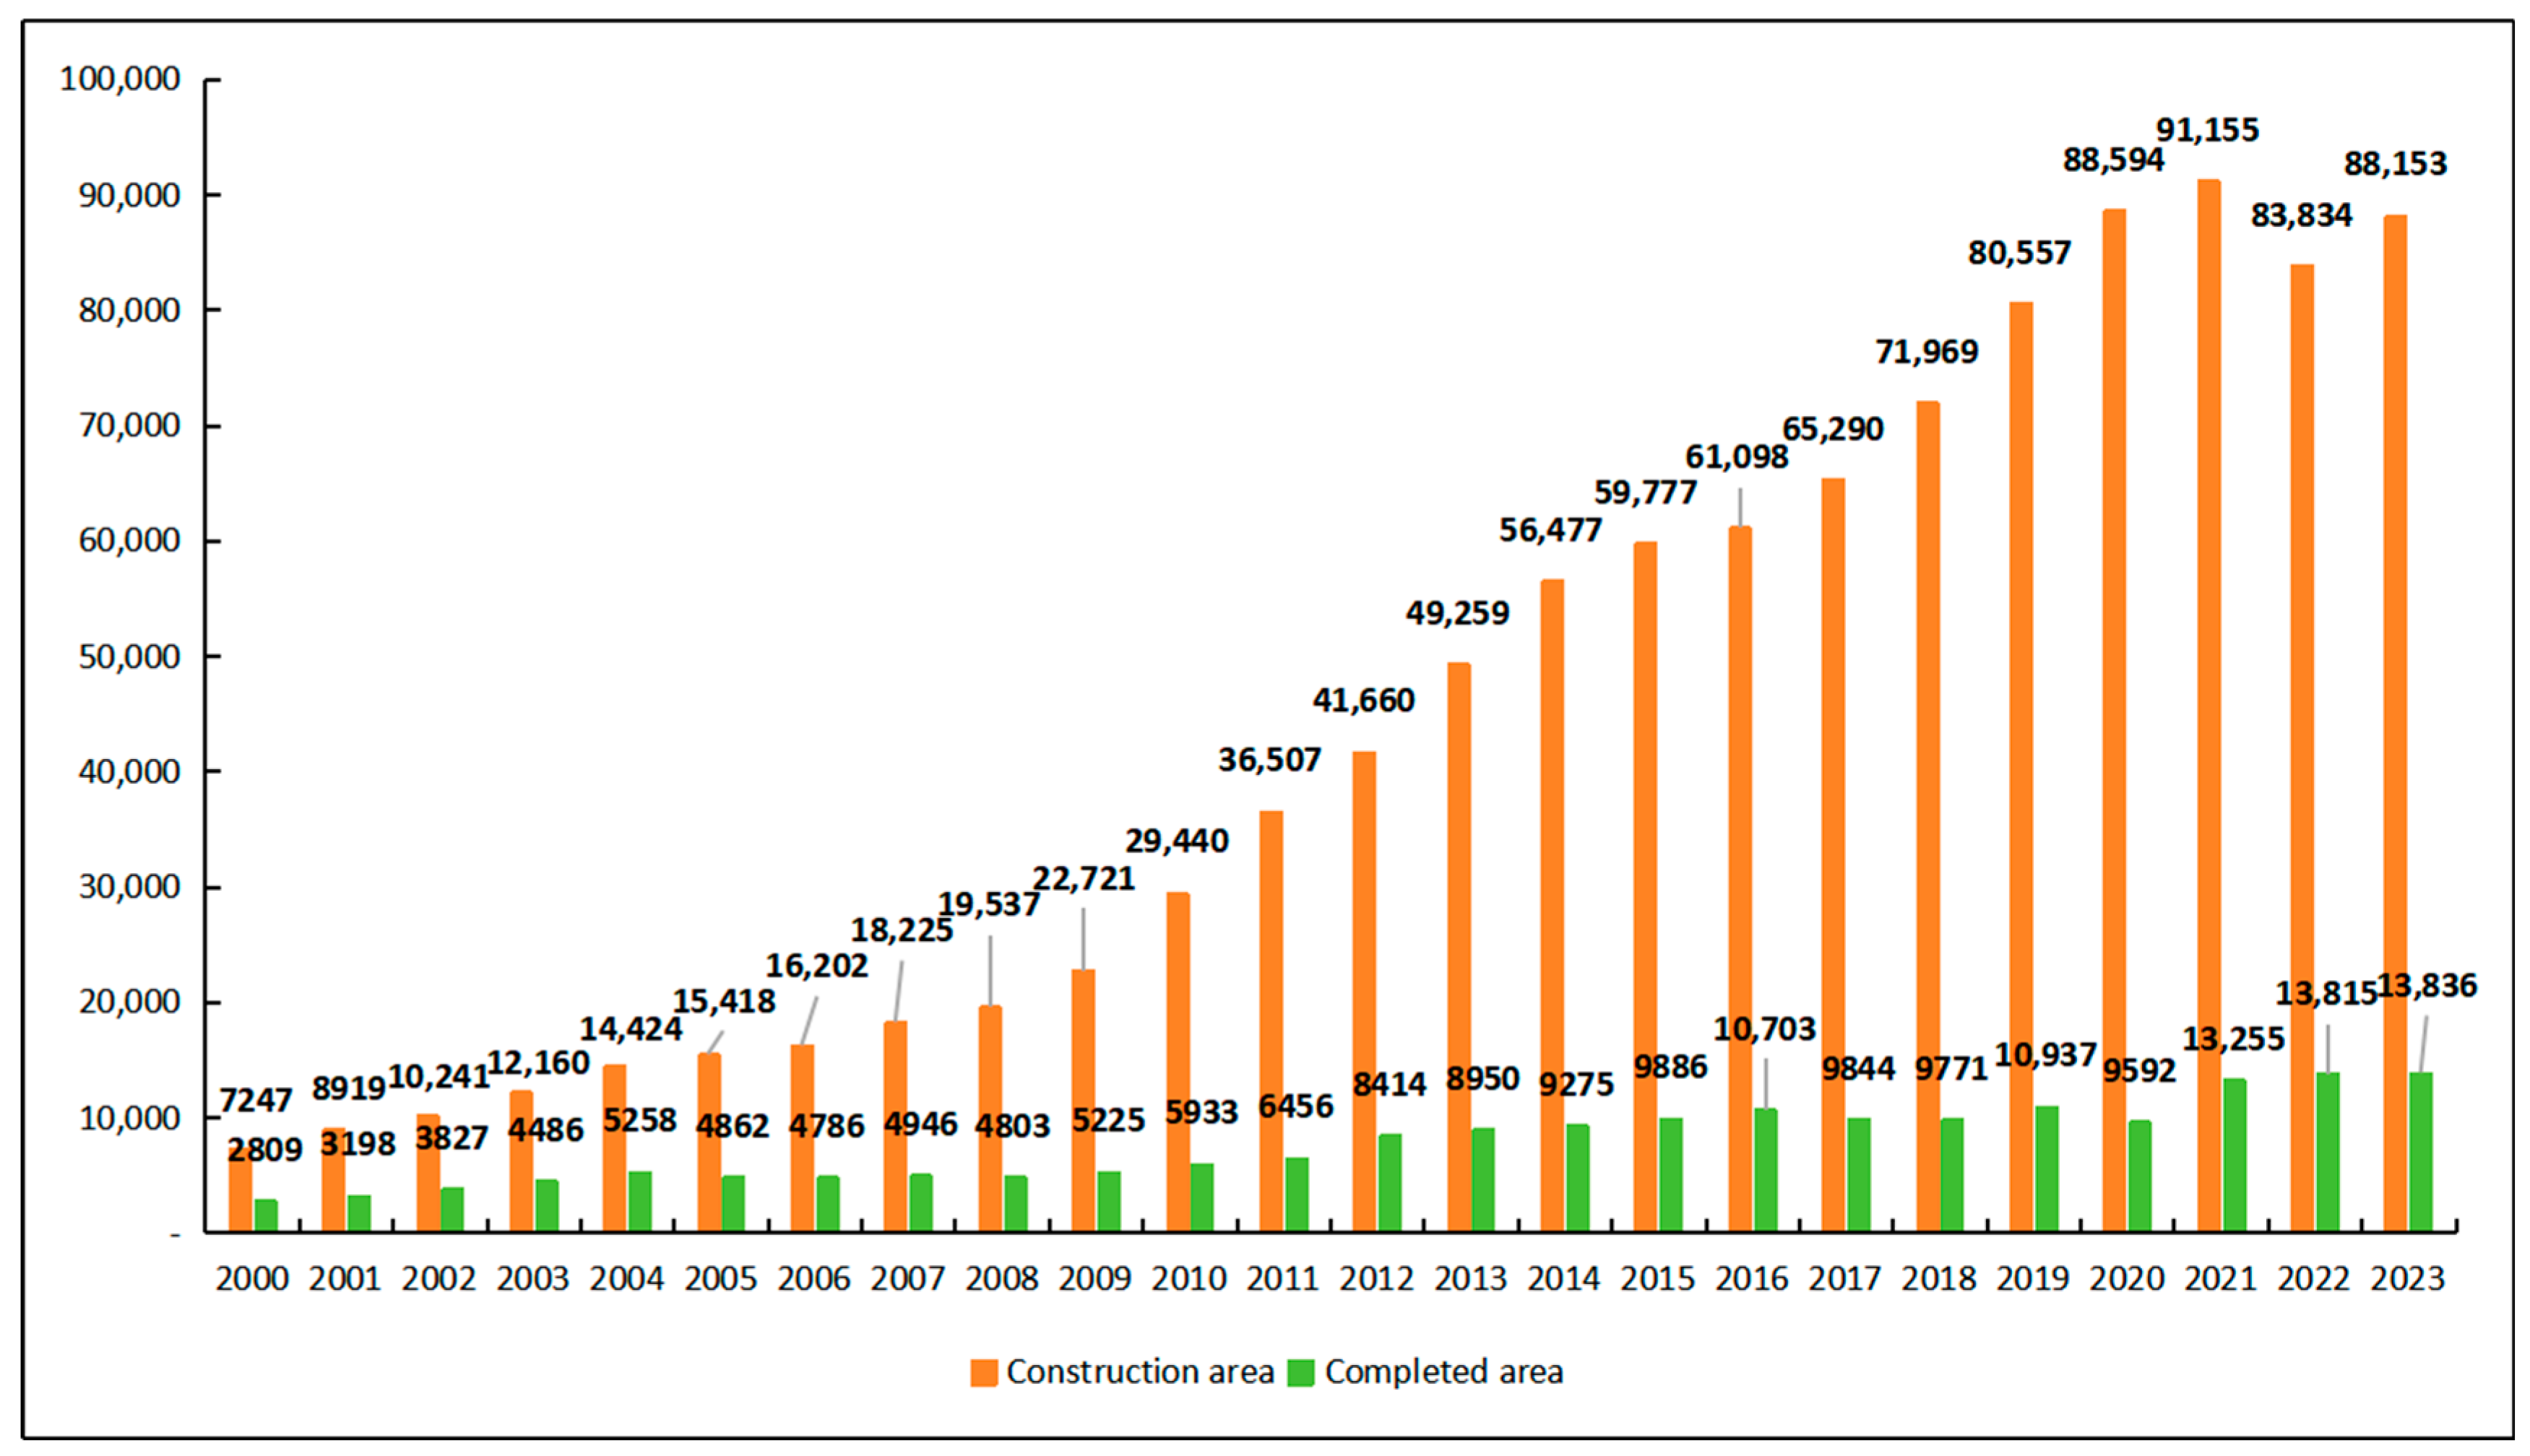
The growth rate of the construction area in Beijing’s construction industry is much higher than that of the completed area. The continuous increase in projects under construction and the increasing environmental pressure have the practical demand to promote the reduction.
As can be seen from Figure 3, the total construction area and completed area of the construction industry in Beijing show a steady upward trend. Compared with 2000, the construction area of Beijing’s construction industry in 2023 increased by 1116.41%, and the completed area increased by 392.56%. Therefore, the urbanization process in Beijing is developing rapidly, construction activities are frequent, and the situation of construction waste disposal is rather severe. The current situation where the number of completed projects is far less than that of ongoing construction poses a significant threat to the sustainable development of Beijing. Considering the pressure on environmental ecology and resource circulation, Beijing has a very urgent need for a reduction.
(3)
The production of construction waste in Beijing is much higher than the collection volume of domestic waste, and there is still a large room for improvement in resource utilization.
Since 2022, Beijing has completely abolished construction waste landfills. All waste must be treated through resource utilization, comprehensive utilization, or on-site utilization. Since 2023, the “Notice on the Prevention and Control of Environmental Pollution by Solid Waste” issued by the Beijing Municipal Bureau of Ecology and Environment has, for the first time, carried out a detailed classification and explanation of construction waste and its disposal, reflecting Beijing’s increasing emphasis on construction waste management, and more detailed data support is helpful to formulate more scientific and reasonable management strategies.

4.3.2. Data Sources

Through the systematic review of the statistical yearbook, it is found that there is a problem of incomplete data in the production of construction waste in Beijing. Beijing has not yet fully released the statistical data on the production of construction waste over the years. Therefore, based on key data such as construction and completed areas in Beijing, estimating the annual production of construction waste is an indispensable part of the resource treatment of construction waste in Beijing. In the classification system, the completed area mainly covers residential completed areas and commercial completed areas. Construction waste refers to all kinds of waste generated during the construction activities of new construction, renovation, expansion, demolition of various buildings, pipelines, traffic facilities, and house decoration. It is mainly divided into five categories: engineering muck, demolition waste, engineering mud, construction waste, and decoration waste. In the process of resource utilization of construction waste, the main disposal methods of engineering muck and engineering mud are mainly backfilling of construction land and the laying of road base, etc., without processing and reuse, which do not meet the definition of resource utilization [45]. Construction waste has received more attention in the research field of China, and the related research on the resource utilization of demolition waste and decoration waste needs to be accelerated. Therefore, the construction waste mentioned in this paper only includes demolition waste and decoration waste. According to the Beijing Statistical Yearbook and the data disclosed by the National Bureau of Statistics, Table 1 presents the historical data of the construction and completed areas in Beijing [46,47].

4.3.3. Production Estimation

In view of the lack of a unified standard, this study refers to other studies related to the prediction of construction waste production in data estimation and analysis. Based on the comprehensive consideration of the actual situation in Beijing, the output estimation method is adopted to estimate the amount of construction waste in Beijing based on the official data of construction area and completed area in each year. The construction waste estimated in this part includes demolition waste and decoration waste.
(1)
Estimation of the production of demolition waste
The formula for estimating the production of demolition waste (Wd) by using the area estimation method is as follows:
W d = q d × S d
where Wd is the production of demolition waste (t). Sd is the area of demolition waste (m2), which is usually calculated as 10% of the construction area in related studies [36], and qd is the waste generation rate of demolition waste (t/m2), which is 1.35 t/m2 by referring to the relevant literature.
(2)
Estimation of the production of decoration waste
The formula for estimating the production of decoration waste (Wr) by using the area estimation method is as follows:
W r = W r r + W r c
W r r = q r r × S r r
W r c = q r c × S r c
where Wr is the production of decoration waste (t); Wrr is the production of residential decoration waste (t); Wrc is the production of commercial decoration waste (t); Srr is the area of residential decoration waste (m2), which is 10% of the residential completed area usually calculated in related studies; qrr is the waste generation rate (t/m2) of residential decoration waste; Src is the area of commercial decoration waste (m2), which is 10% of the commercial completed area is usually calculated in related studies; and qrc is the waste generation rate (t/m2) of commercial decoration waste. As the decoration area of commercial buildings is larger and more complex than that of residential buildings, the production of construction waste per unit area of commercial buildings is usually greater than that of residential buildings. Therefore, the values of qrr and qrc are 0.1 t/m2 and 0.15 t/m2, respectively [48].
(3)
Estimation of the production of construction waste
Demolition waste and decoration waste are selected as the research objects, and the total production of construction waste is estimated as the sum of demolition waste and decoration waste (W):
W = W d + W r
According to the basic data provided, Formulas (6) to (10) were used for comprehensive calculations to derive the estimated total production of construction waste in Beijing over the years. Table 2 presents the relevant data on the production of construction waste in Beijing from 2001 to 2024.

4.4. Prediction of Construction Waste Production in Beijing

The core premise of scientific prediction of the construction waste generation scale in Beijing is to screen a scientific and applicable prediction model. The production of construction waste is affected by multi-dimensional factors such as construction scale, demolition policy, and technical level, resulting in the original data series showing significant non-stationarity and randomness. Considering the reality that the historical statistical data of construction waste production in Beijing is incomplete, the ARIMA time series prediction model is selected as the core analysis tool in this study. The following will elaborate on the construction process of the ARIMA prediction model and the prediction process of Beijing construction waste production.

4.4.1. Data Stationarity Test

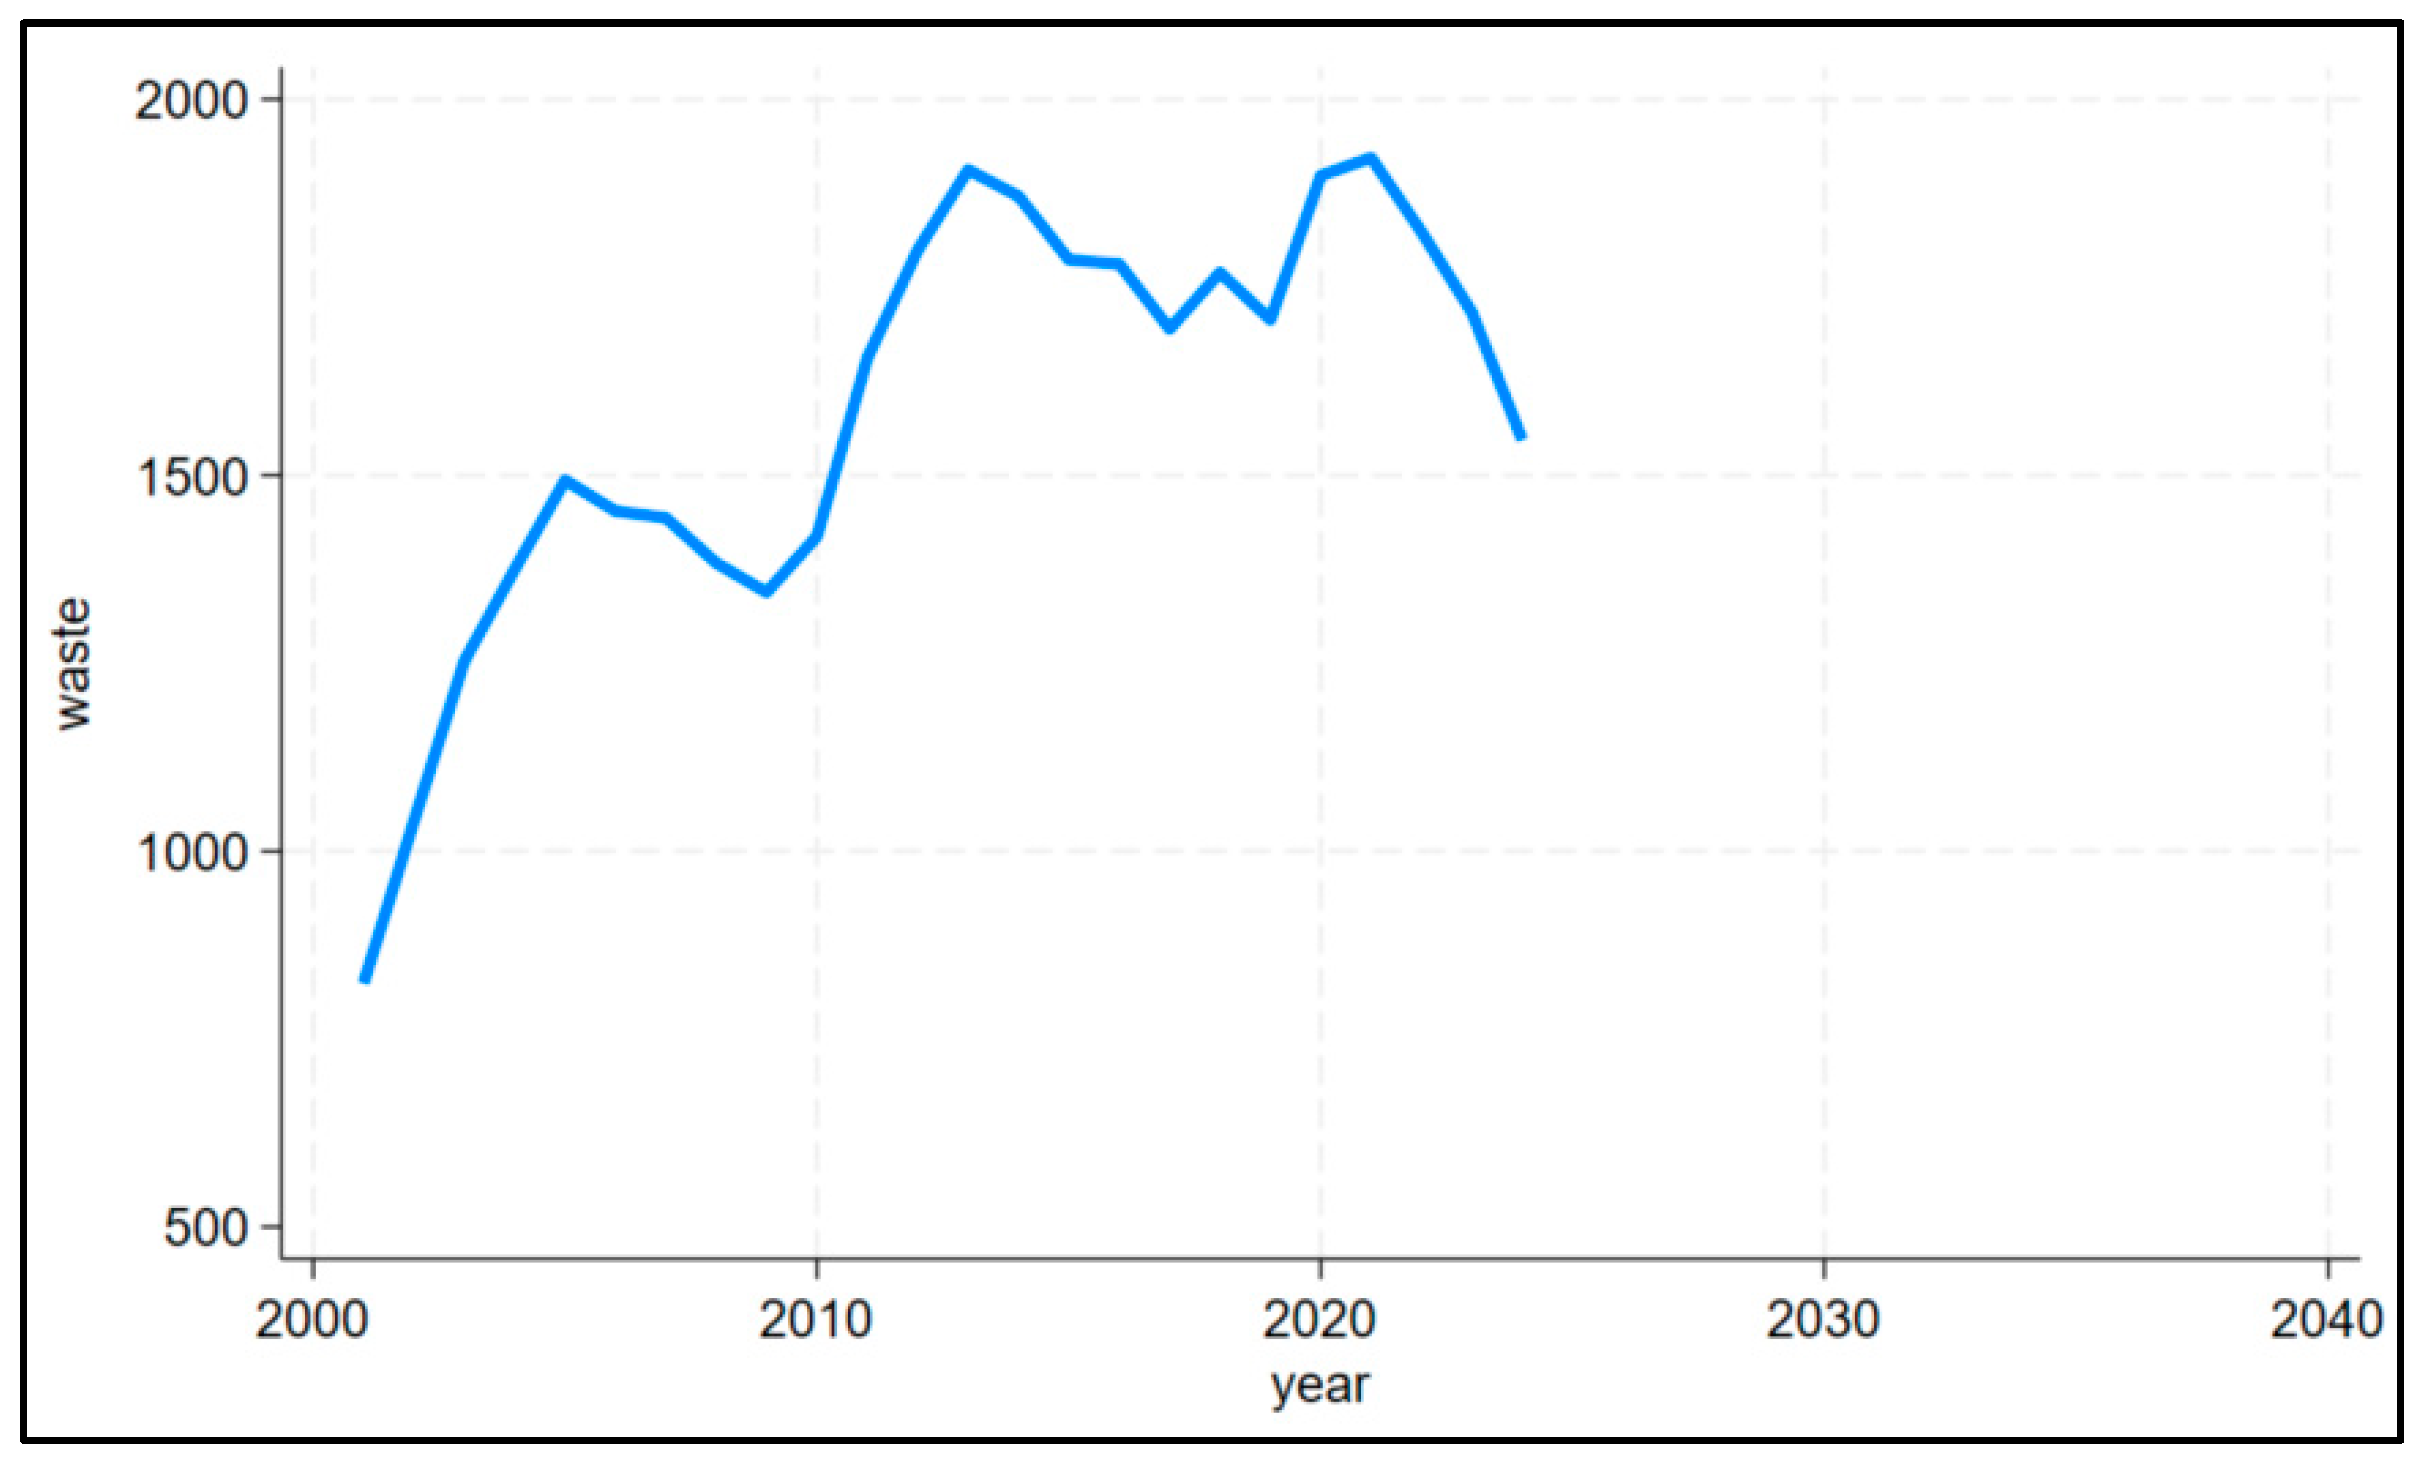
Based on the requirement of data stationarity for the ARIMA model, it is necessary to test the stationarity of basic data before constructing the model to determine whether the data meet the prerequisite conditions for the model’s application. “StataMP 18 (64-bit)” software was used to import the original series of construction waste production in Beijing from 2001 to 2024 into the ARIMA model. Figure 4 presents the line graph of the original sequence.

4.4.2. Dickey–Fuller Test for Unit Root

This study sets the production of waste as the test variable. The number of observations is from 2001 to 2024, with 23 observations in total. The number of lags is 0. The original assumption is that the sequence is non-stationary, that is, the original assumption is that the unit root H0 is “random walk without drift”. In this regard, the critical value rule and p-value rule are adopted, respectively. Among them, because our statistical test Z (T) = −3.385, its critical values at different significance levels are compared. Because it is less than the critical values at the 5% and 10% levels, the original hypothesis can be rejected at the 5% and 10% levels. In the p-value rule, the significance level is usually set as the standard of 0.05 (5%). If p < 0.05, the original hypothesis is rejected and the sequence is considered stable. Therefore, under the significance of 5%, the original hypothesis (H0) was rejected due to the p value = 0.0115 < 0.05.
In order to further determine the specific value of the difference order D, in this study, the Dickey–Fuller test for unit root was performed on the original sequence of construction waste production in Beijing from 2001 to 2024. The test results show that the p-value of this sequence is 0.0115, which is significantly lower than the significance level of 0.05. According to the decision rule of the unit root test, when the p-value is lower than the significance level, the null hypothesis can be rejected, that is, the series does not have a unit root and shows a stationarity feature. Therefore, there is no need to perform differential processing on the original sequence to achieve stabilization. By determining the differential order D as 0, the original sequence can be directly used for subsequent model parameter determination and predictive analysis.

4.4.3. Partial Autocorrelation and Autocorrelation

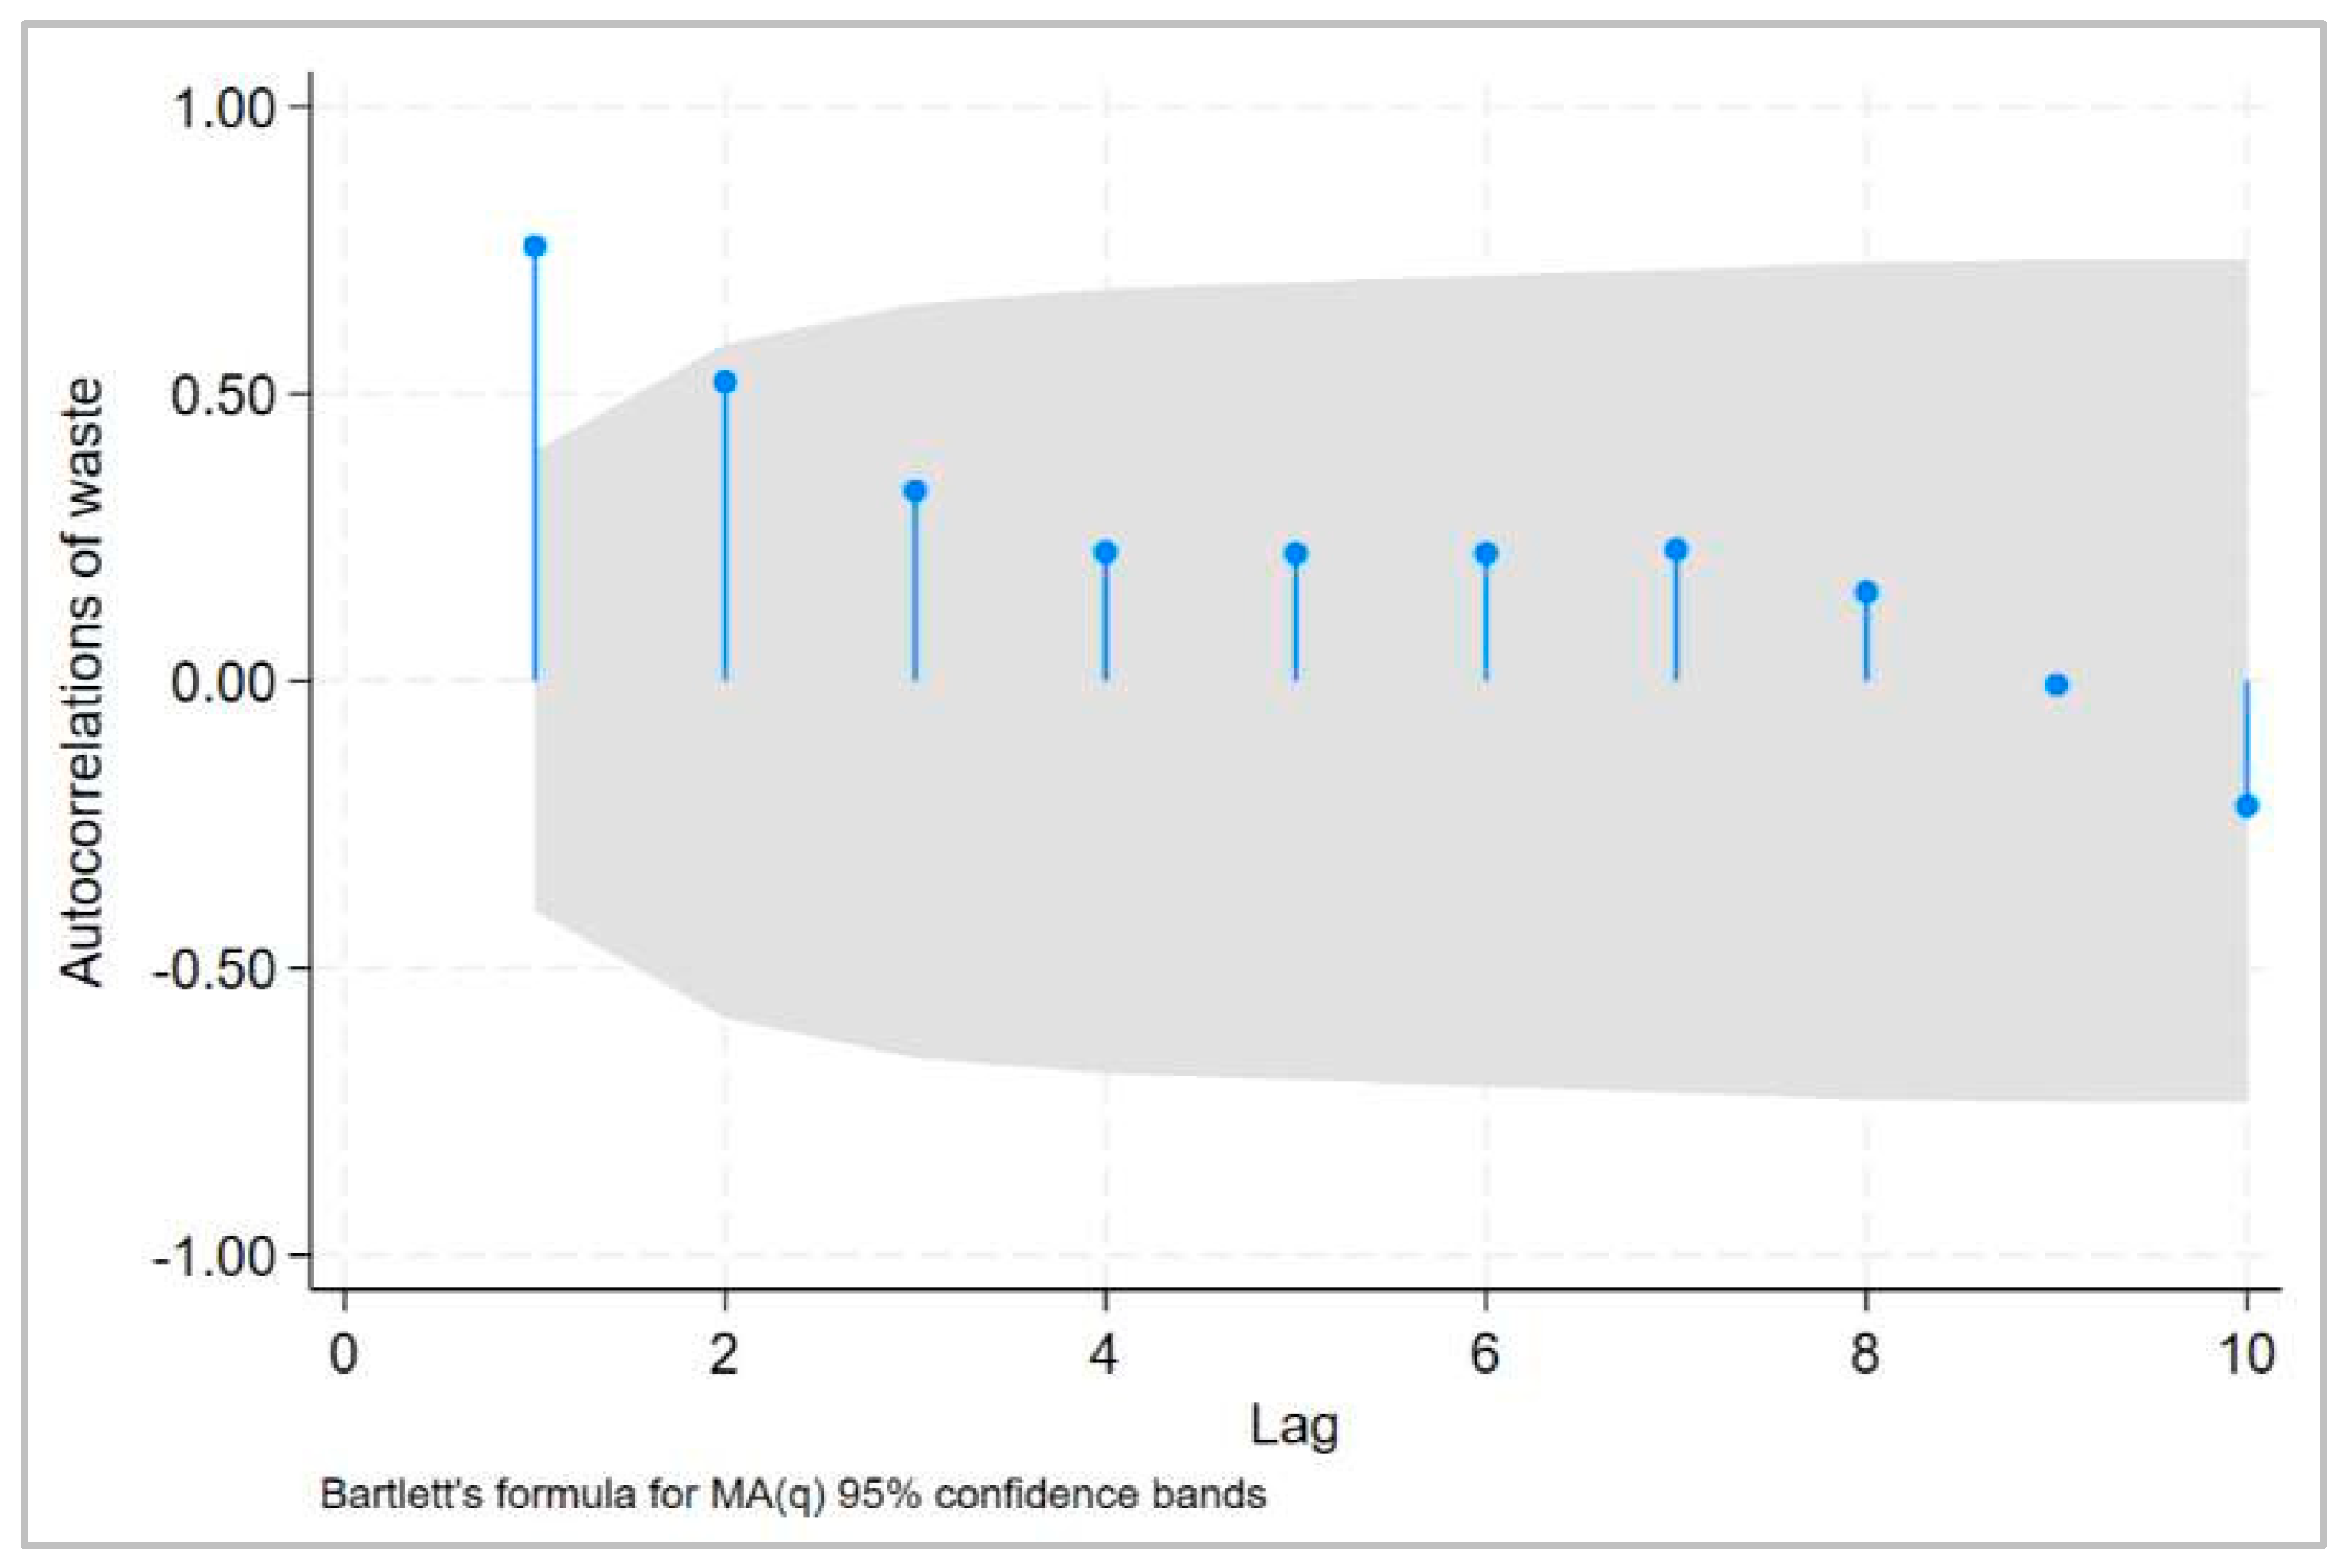
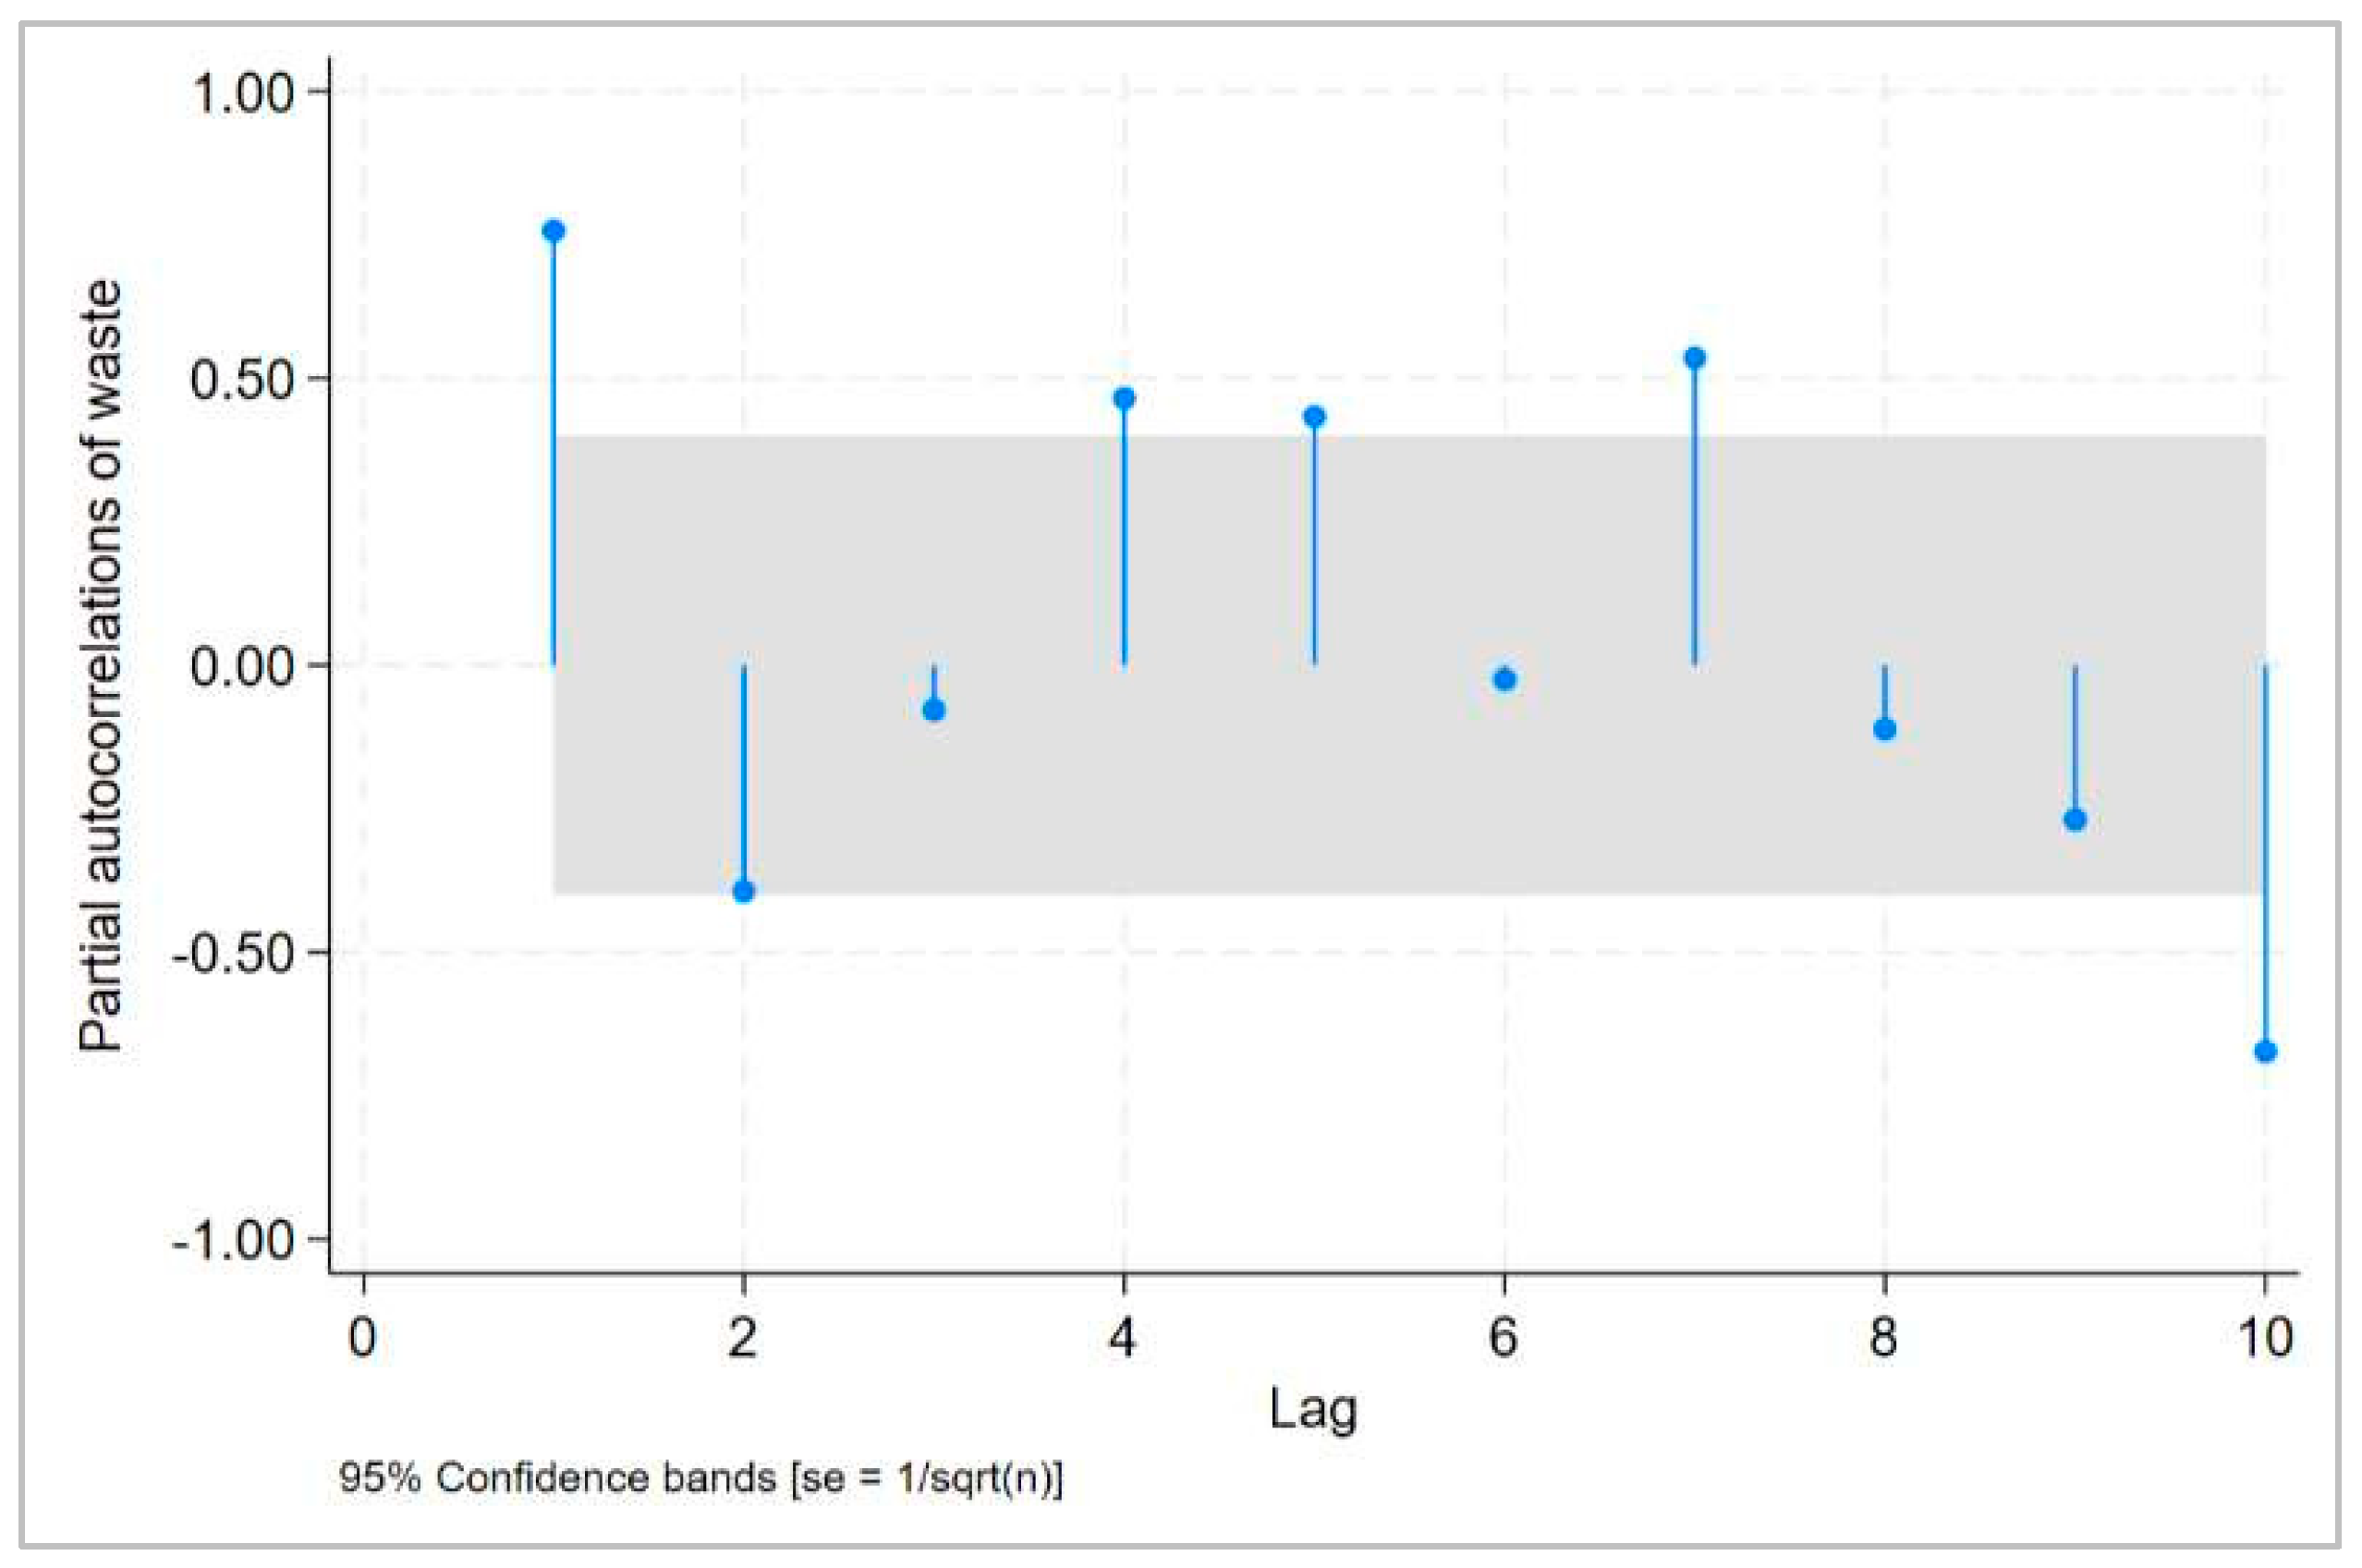
Autocorrelation and partial autocorrelation functions are important tools for identifying model orders in the time series, showing the direct correlation between models at specific lag periods. This section analyzes the autocorrelation function and the partial autocorrelation function of the original sequence. Figure 5 and Figure 6 show the partial autocorrelation function and autocorrelation function graphs of the original sequence of construction waste production in Beijing from 2001 to 2024.
Considering the characteristics of the autocorrelation function plot and the partial autocorrelation function plot, this part preliminarily determines the p-value and q-value of the ARIMA model. As can be seen from Figure 5 and Figure 6, the partial self-phase of the series is no longer significant after lag 1 (lag = 1), and the subsequent lag period basically remains within the confidence interval, so p = 2. In the autocorrelation graph, it can be determined that q = 0.

4.4.4. Akaike Information Criterion and Bayesian Information Criterion

After the initial determination of the p-value and q-value of the ARIMA model, the AIC/BIC value should be used to find the best balance between the goodness of fit and complexity of the model. They all follow the principle of the smaller the better. In order to find the optimal model, this study compared the parameter combinations of (2,0,0), (2,0,1), (1,0,1), and (3,0,0), respectively.
It can be found in Table 3, that the AIC and BIC values of the ARIMA (2, 0, 0) model are the smallest, so it is determined as the final model.

4.4.5. White Noise Verification

To verify whether the residuals of the model are white noise sequences, white noise verification is further performed in this section. The white noise test is one of the key steps to evaluate the fitting effect of the time series model. The purpose is to determine whether the residual sequence only contains random fluctuations and no other systematic information that can be captured by the model. The results show that the p-value of the residual sequence is 0.86, which is significantly greater than the significance level of 0.05. According to the decision rule of hypothesis testing, when the p-value is greater than the significance level, we cannot reject the null hypothesis that the residual sequence is a white noise sequence. This result indicates that the model has fully captured the information in the data and the residual sequence passes the white noise test.
Furthermore, from the perspective of the overall effect of model fitting, the ARIMA model shows a good fitting effect in fitting the construction waste production data of Beijing from 2001 to 2024. The model can accurately capture the trends and random fluctuations of the data, making the residual sequence exhibit random characteristics. This randomness indicates that the model has extracted all the systematic information from the data, and the remaining residuals are composed only of random errors. This not only further validates the rationality of the model but also indicates that the model has high accuracy and reliability in predicting the future production of construction waste.

4.4.6. Comparison Between RMSE and MAE

The RMSE squares the error in the calculation, which means that individual points with large prediction errors will cause amplification effects on the RMSE. The MAE is not sensitive to outliers and can reflect the “typical” error level. The RMSE and MAE were 151.92 and 96.65, respectively. The results show that the RMSE and MAE are within the acceptable range, and the surface ARIMA model results capture the internal trend of the historical data of construction waste production in Beijing.
RMSE > MAE. The results show that there is a small number of points with large prediction errors in the historical data, because these large errors are squared in the calculation of the RMSE, which magnifies the impact on the final results. However, overall control is within a relatively reasonable range. If the production forecast of 13–14 million tons is taken as the benchmark, the typical prediction error rate represented by the MAE is about 7%. When the production of construction waste is disturbed by many factors, it shows that the model has good practical value.
In addition, by calculating the coefficient of variation (CV) in the historical data from 2001 to 2024, it can be concluded that it is 18.03%, indicating that there are moderate fluctuations in the historical data of construction waste production in Beijing, indicating that the historical data itself is unstable. The prediction error rate of the model (7%) is far less than the fluctuation range of the historical data itself (18.03%). The results show that although the data itself fluctuates, the prediction error of the model is relatively small. Therefore, it is further proved that the model successfully captures the main trend, rather than blindly guessing, which once again proves that the model has practical value.

4.4.7. Model Prediction

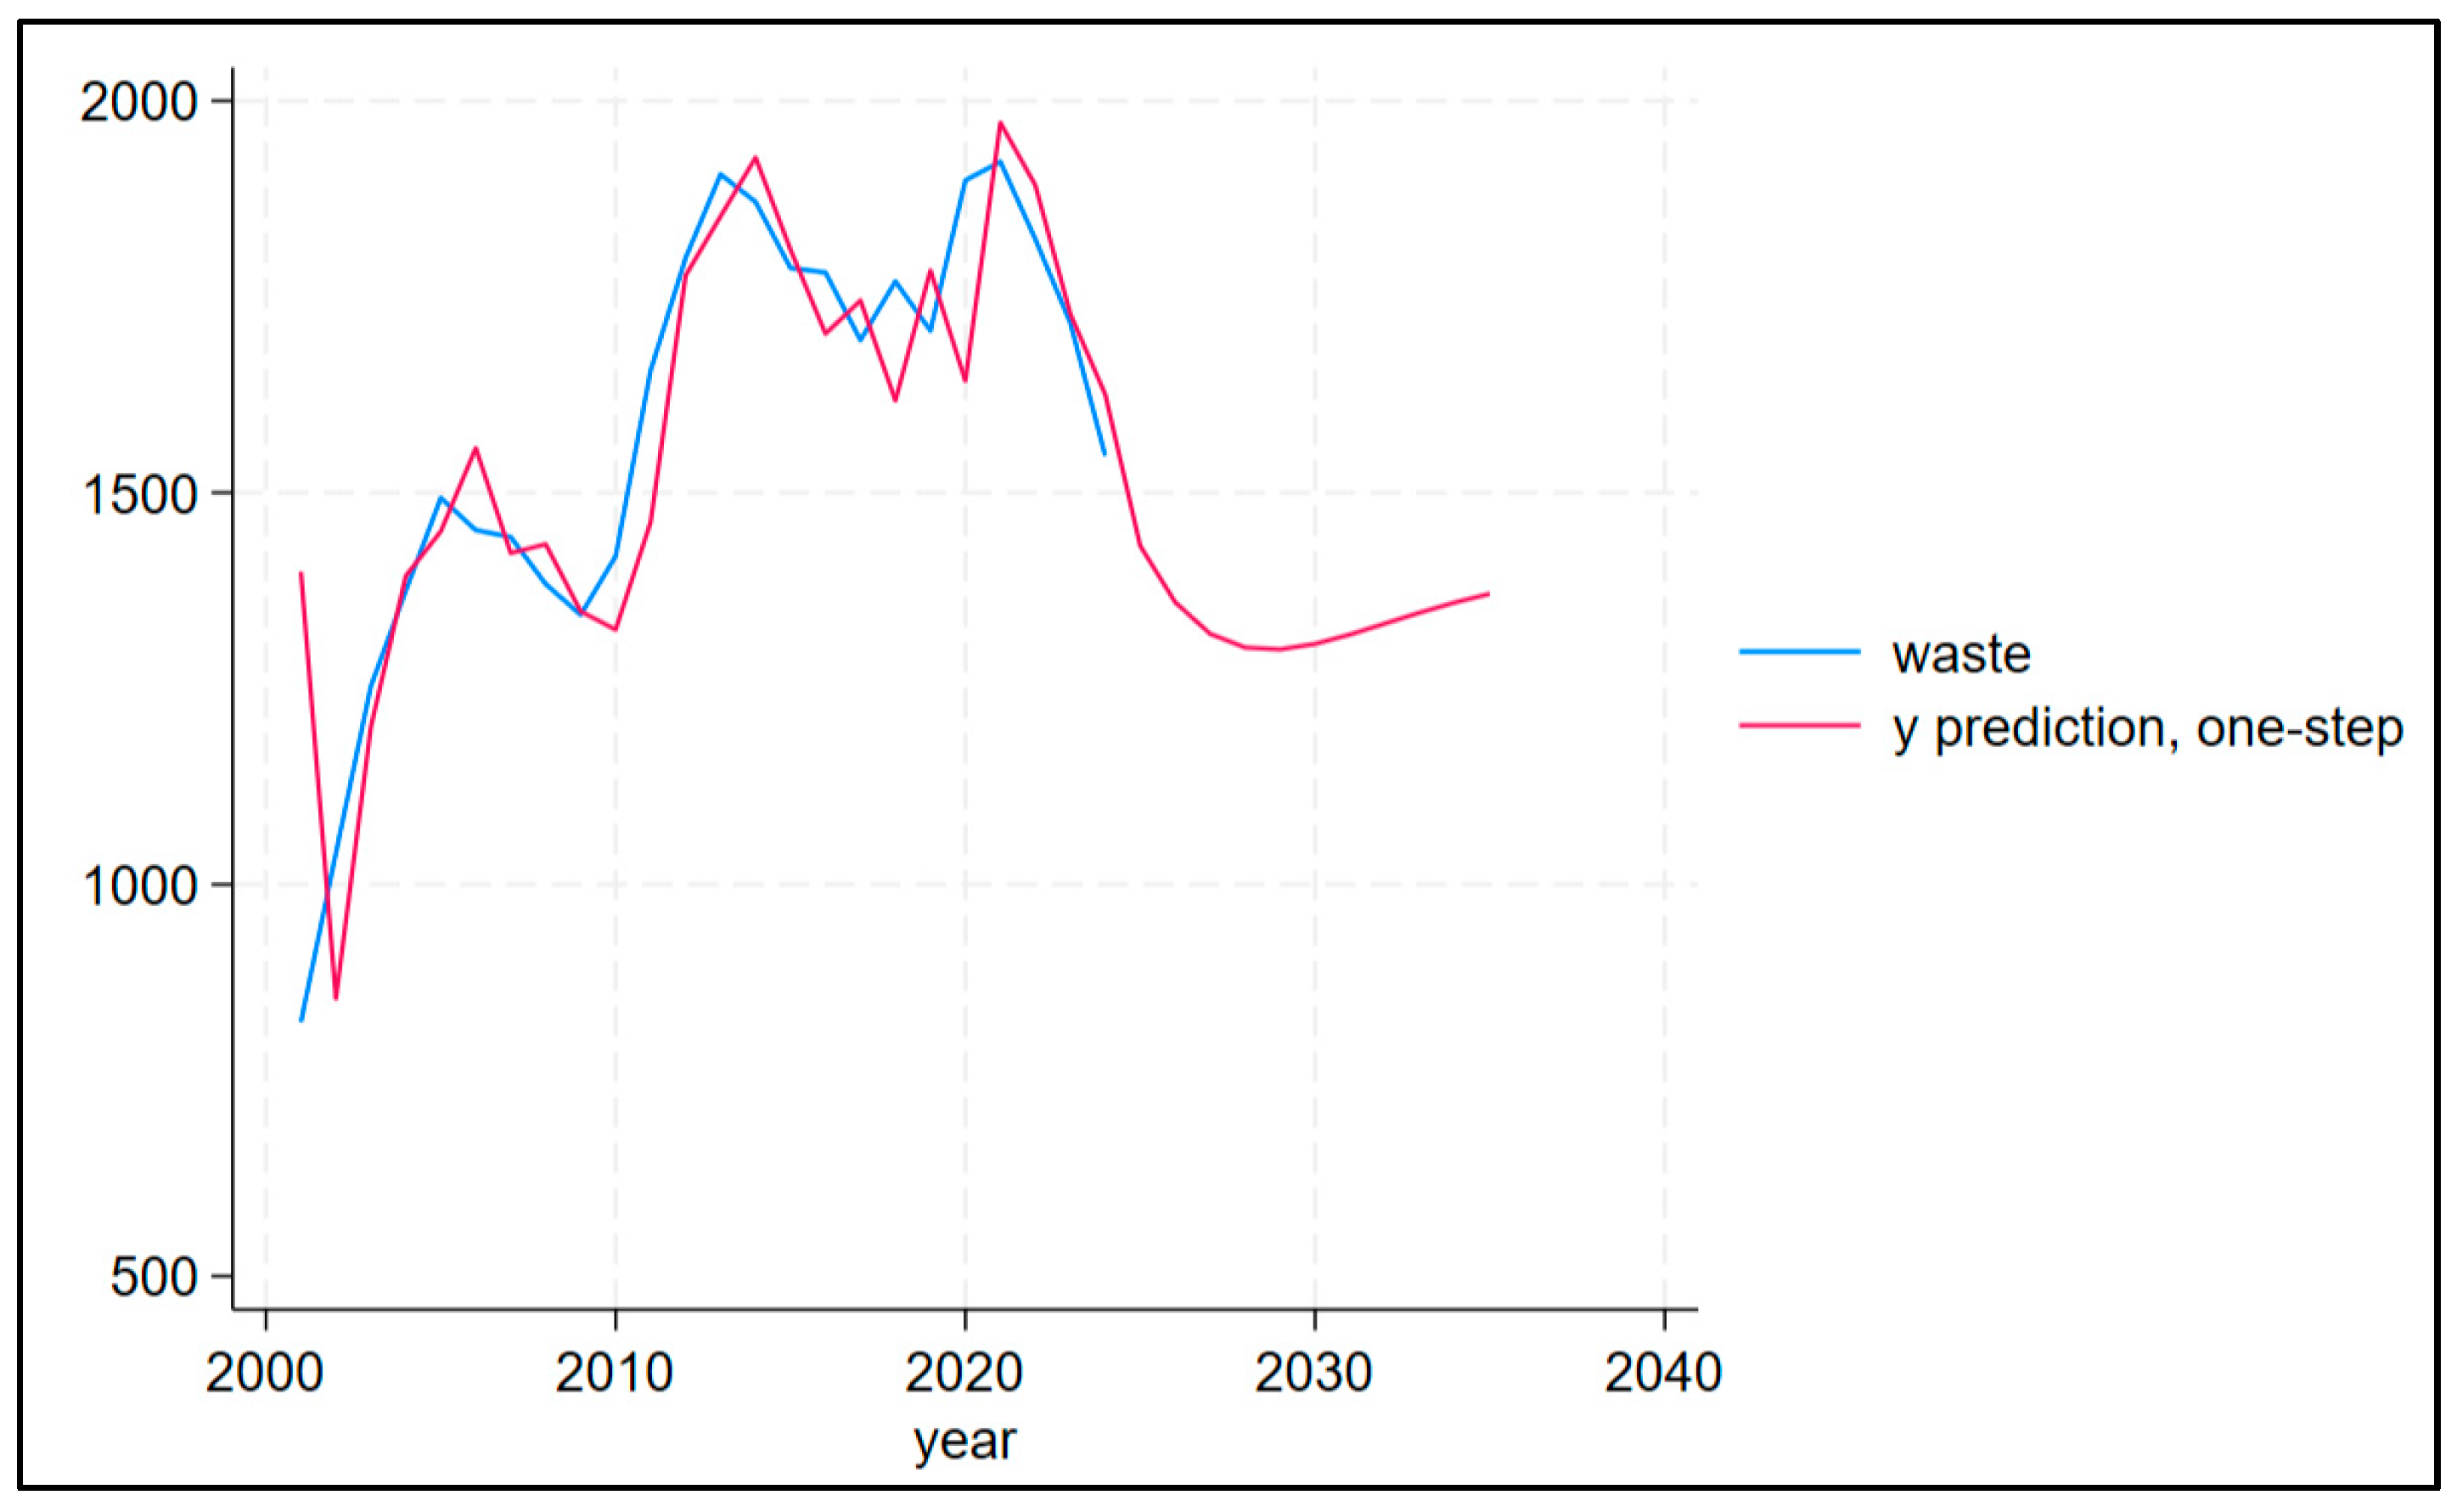
After determining the p-value, d-value, and q-value of the ARIMA model, in order to further optimize the model, the Akaike Information Criterion (AIC) is used to select the best model and the fitting accuracy of the model is balanced by minimizing the AIC value to avoid over-fitting and under-fitting problems. By adjusting the combination of parameters and comparing the AIC values of different ARIMA models, Figure 7 shows the fitting diagram of the final selected ARIMA model on the forecast value of Beijing construction waste production in the next 10 years (2025–2034).
As can be seen from Figure 7, the predicted curve fits closely with the actual observed values, and the ARIMA model has a relatively high prediction accuracy. Similarly, the ARIMA model is used to predict the demolition construction waste, which accounts for the largest proportion of construction waste. Table 4 shows the predicted values of the final selected ARIMA model for the production of construction waste in Beijing over the next 10 years (2025–2035).
As can be seen from Table 4, the production of construction waste in Beijing will show a trend of first declining and then slightly recovering from 2025 to 2034. It will reach the highest value of 14.3214 million tons in 2025, reach the lowest value of 12.9996 million tons in 2029, and rise to 13.599 million tons in 2034. The results show that the production of construction waste in Beijing will gradually and steadily decrease in the next few years but there may be an increase in the long term. This further reflects the combined effects of policy implementation, changes in construction activity, and technological advances.

5. Economic Value Assessment of Resource Utilization of Construction Waste

The economic value of the resource utilization of construction waste refers to the immediate benefits that can be monetized, measured, and directly created for social and economic activities by converting construction waste into renewable resources or products. It is mainly reflected in the economic benefits brought by the processing of waste systems into various types of recycled products (such as recycled aggregates and recycled bricks, etc.) into market circulation [49,50]. There are various methods to evaluate the economic value of the resource utilization of construction waste. The cost/benefit analysis (CBA) method examines suitable scenarios, where costs and benefits cover economic, environmental, and social perspectives [51]. This method evaluates the economic feasibility of a project by identifying and quantifying the costs and benefits of each stage of construction waste management and calculating indicators such as the net present value. The life cycle assessment method is used to evaluate the potential impact of the entire life cycle of construction waste from its generation to its final disposal on the environment. Lu et al. (2013) [52] considered the sorting, transportation, and processing costs of waste resources from the perspective of the entire life cycle, as well as the benefits of resource product sales and government subsidies. They comprehensively calculated the cost of the resource utilization process and compared it with the cost of the landfill process to determine the economic benefits or costs brought by resource utilization [52]. Externality evaluation focuses on the non-market impacts of construction waste management activities on third parties or society and attempts to monetize these impacts to more comprehensively measure their social value. For example, Li et al. (2023) used the contingent valuation method (CVM) to understand the amount that the public or contractors are willing to pay for the environmental efficiency of construction waste recycling, so as to assess its non-market value [53]. The system dynamics modeling method regards the construction waste management system as a complex whole and simulates the impact of different parameter changes on long-term economic effects and recovery rates by analyzing the feedback structural relationships between various variables within the system. Lin et al. (2021) constructed corresponding system dynamics models from the perspectives of contractors, society, and resource utilization enterprises to analyze the costs and benefits of waste disposal processes [54]. Taking into account the core evaluation requirements for economic feasibility in this study, as well as the practicality of the method and the availability of data, the cost–benefit approach was ultimately chosen as the core evaluation method. It can systematically integrate project costs and benefits, clearly present the economic net benefits of building waste resource utilization, and provide direct quantitative support for research conclusions. When conducting specific value calculations, waste is classified into two categories based on its characteristics: inert waste (such as concrete, bricks, and tiles, etc.) and non-inert waste (such as metals, wood, and plastics, etc.), and the mainstream resource utilization channels and the corresponding market values are considered, respectively. By comprehensively calculating all costs and final production benefits (including possible government subsidies for product sales revenue) during the transportation and production stages, the economic feasibility of resource utilization is visually reflected in the form of net benefits, thereby providing a quantitative basis for the formulation of relevant industrial policies and market investment decisions.

5.1. Composition of Waste

The material composition of construction waste is highly heterogeneous. Its composition is influenced by multiple factors such as regional characteristics, building structure types, construction years, and construction techniques, presenting significant spatial and type differences. Therefore, before assessing the economic value of the resource utilization of construction waste, it is necessary to first clarify its specific material composition and the proportion structure of various materials. Based on the benefit difference between natural building materials and recycled aggregate of the same quality, the economic value is calculated.
(1)
Demolition waste
Against the backdrop of the continuous advancement of urbanization, the implementation of projects such as urban renewal, shantytown renovation, and demolition of old buildings has generated a large amount of demolition waste. Although there are differences in the composition of demolition wastes influenced by building structures (such as brick–concrete structures, reinforced concrete structures, and brick–wood structures), the core material components have commonality, mainly including concrete blocks, mortar, brick blocks, ceramic tiles, metal components, wood waste, and others [55]. By sorting out the literature materials such as the “White Paper on Construction Waste Management in Beijing” and the “Technical Guidelines for the Resource Utilization of Construction Waste”, and combining the characteristics of the existing buildings in Beijing and the data of demolition projects, the proportion of each material in the demolition waste in Beijing is clearly defined, as shown in Table 5.
Based on the prediction results of the ARIMA model and the basic data in Table 5, the specific scale of various components in the demolition waste in Beijing from 2025 to 2034 can be calculated. Table 6 shows the predicted values of the scale of various components in the demolition waste in Beijing from 2025 to 2034.
Table 5 and Table 6 show that the main types of demolition waste in Beijing are inert components such as concrete blocks, brick and tile, mortar, and ceramic tile, which account for over 80% of the total demolition waste. It is estimated that more than 120 million tons will be generated in the next 10 years. The main reason is that the vast majority of the buildings demolished on a large scale in Beijing are old and dilapidated, mainly consisting of a mixed structure combining brick–concrete structures and precast concrete components. Meanwhile, concrete block and brick and tile are the mainstream structural building materials used in construction projects due to their high strength, high durability, and controllable cost. Furthermore, during the demolition stage, the physical forms of the above-mentioned materials are stable and not easily degradable, which further leads to a significant increase in their proportion in demolition waste.
(2)
Decoration waste
Decoration waste refers to the mixed solid waste generated during the decoration and renovation of buildings. Its composition is complex and has significant spatial heterogeneity, mainly consisting of concrete, bricks, wood, coatings, gypsum, glass ceramics, metals, paper, and plastics, etc. It can generally be divided into new house decoration and old house renovation decoration [56]. Moreover, the amount of waste generated from the renovation and decoration of old houses is more than three times that of the decoration of new houses [57]. The classification of construction waste is more influenced by the type of building decoration. Therefore, in the calculation process of the production of each material in decoration waste, it is chosen to classify and calculate by decoration type. The decoration of a new house specifically refers to the activity of decorating and renovating an unfinished house that has not been decorated. It does not require the demolition of the original decoration structure and only generates a small amount of waste during the new decoration construction process. The renovation of an old house refers to the transformation of houses that have already been decorated. The existing decoration layer needs to be removed first, and then the new decoration operation is implemented. The waste comes from the superposition of the demolition stage and the new decoration stage, and the composition complexity is higher. By combining the industry literature and enterprise statistical data, the material proportion structure of different types of decoration waste in Beijing is shown in Table 7 below.
Based on the prediction results of the ARIMA model and the basic data in Table 7, the specific scale of various components of the decoration waste in Beijing from 2025 to 2034 can be calculated. Table 8 shows the predicted values of the scale of various components of Beijing’s decoration waste from 2025 to 2034.
According to the results in Table 7 and Table 8, the main components of construction waste in Beijing include inert components such as brick and stone, gypsum products, and glass ceramic fragments, accounting for more than 50% of the total decoration waste. It is estimated that approximately 1.3989 million tons will be produced in the next 10 years. The main reason for this result is that the proportion of old house renovations and decoration in Beijing is relatively high. During the decoration stage, the original brick and stone structures and gypsum product decorations need to be removed, causing significant changes to the internal structure of the building. Meanwhile, brick and stone materials and gypsum products have a high market acceptance rate, stable performance, and are widely used in the decoration stage. In addition, the recycling and utilization technologies for brick, stone, and gypsum product waste are relatively limited and costly, which further leads to the proportion of inert components.

5.2. Analysis Process and Production Statistics

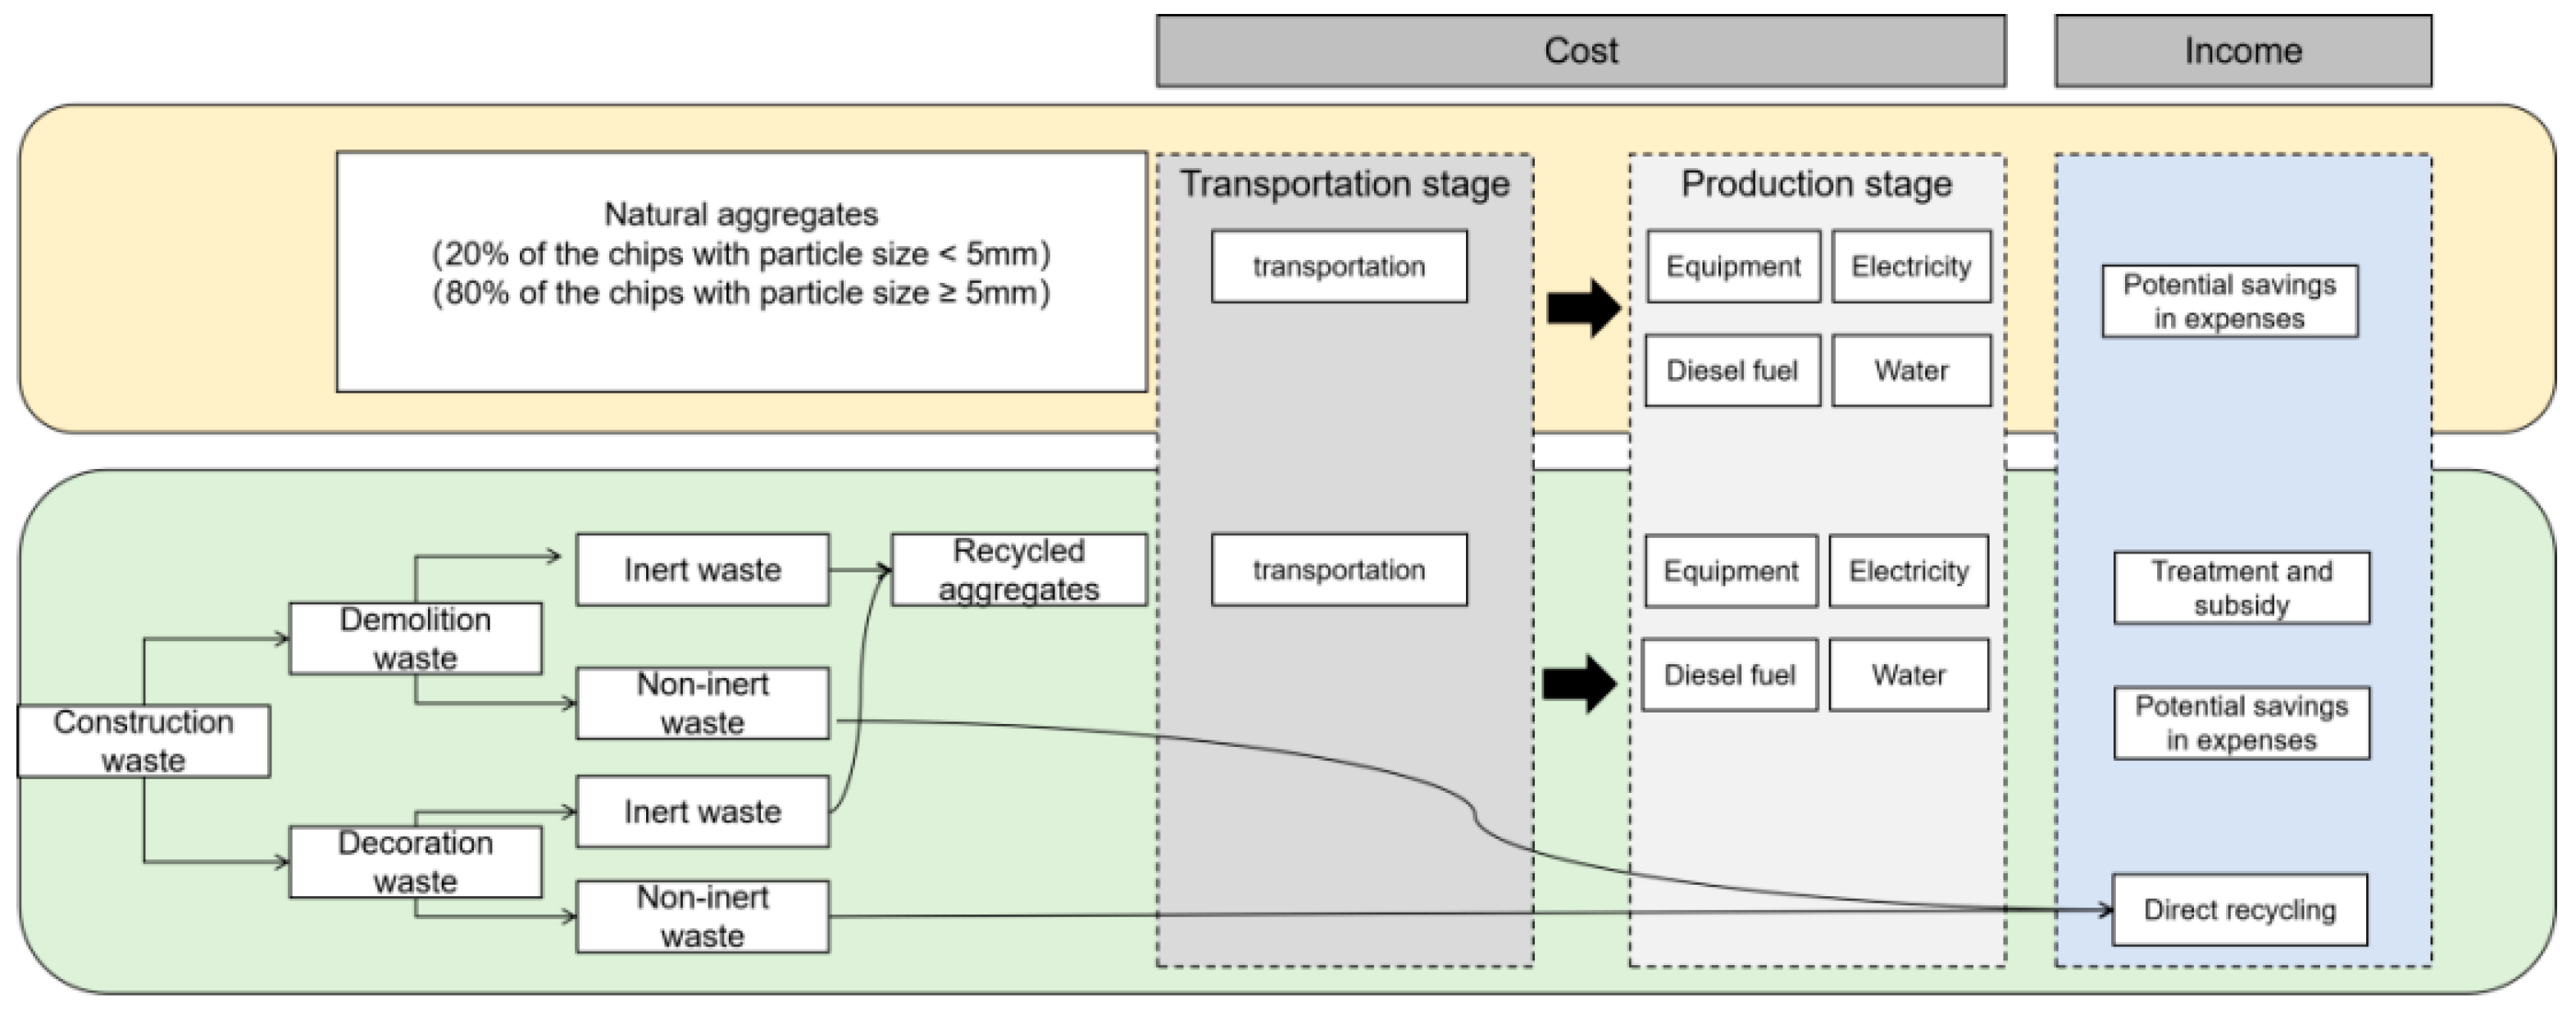
At present, the main products of the resource utilization of construction waste in China are represented by recycled aggregates and recycled concrete bricks [58]. Recycled aggregates are made by crushing inert construction waste, and their application is usually based on the technical path of replacing natural aggregates [59]. The production of recycled concrete bricks requires the construction waste to be broken into recycled aggregate and then molded according to a specific process. Based on this, the sales of recycled products of construction waste are uniformly classified as recycled aggregate for statistics in the accounting process. Figure 8 shows the flow of the analysis and calculation.
At present, the utilization rate of unsorted construction waste recycled products in China’s construction waste resource treatment plants can exceed 80%, which is similar to the proportion of inert waste in construction waste. Given the cutting-edge treatment technology, it can be inferred that inert waste such as concrete can achieve 100% resource conversion. It has been calculated that the total amount of inert waste in the decoration and demolition waste in Beijing over the next 10 years could reach 119.9101 million tons.

5.3. Cost Analysis of Natural Aggregates

5.3.1. Cost of Transportation Stage for Natural Aggregates

According to the relevant literature, natural aggregates produce about 20% of chips with a particle size of less than 5 mm in the production stage [36]. According to the national standard “Sand for Construction” (GB/T 14684-2022), the mud content of natural sand shall not exceed 5% [60]. Therefore, during the processing stage of natural aggregates, it is necessary to separate this part of the stone chips and transport them to the designated location. Suppose the one-way transportation distance to the designated location is 25 km. As a practical reference value for the control of the transportation radius, 25 km is basically enough to cover the balanced distance from the inner part of the second ring road to the outer suburbs and counties outside the Fifth Ring Road in Beijing, and this section is a free urban expressway, so it does not involve the problem of expressway costs. Construction waste is classified as non-residential domestic garbage. According to the “Notice on Adjusting the Charges for Non-residential Garbage Disposal in Beijing” issued by the Beijing Municipal Development and Reform Commission in 2013, the charging standard for non-residential domestic garbage in Beijing is CNY 6 per ton for distances within 6 km and CNY 1 per ton per kilometer for distances beyond 6 km. Therefore, it can be estimated that the average unit transportation charge standard is approximately CNY 1 per ton per kilometer.
The cost during the transportation stage of natural aggregates (CTN) is as follows:
C T N = L T N × W T S × c
where LTN is the one-way distance (km) of the transportation stage of natural aggregate; WTS is the weight (t) of stone chips during transportation over the next 10 years; and c represents the average unit transportation charge standard (CNY).
Based on the formula in this study, the calculation formula for the weight of stone chips ( W T S ) in the next 10 years is as follows: the weight of inert aggregates in construction waste in the next 10 years multiplied by 20%, and the calculation result is 23.982 million tons. Given that the average unit transportation charge standard in Beijing is CNY 1 per ton per kilometer, and the transportation distance is 25 km, the cost of the natural aggregate transportation stage can be calculated to be CNY 599 million through multiplication.

5.3.2. Cost of Production Stage for Natural Aggregates

In the process of natural aggregate production, a series of professional equipment is needed to realize the transformation from raw material mining to the finished aggregate, mainly including excavators, loaders, vibration feeders, hammer crushers, shaping crushers, sand-making machines, crawler conveyors, and vibrating screens. According to the equipment parameters of the relevant literature and the actual data of a building resource recycling plant in the Miyun District of Beijing, the information on the equipment required for the preparation of natural aggregates was obtained. Table 9 shows the information about the equipment required for the production of natural aggregates.
During the production stages of natural aggregates and recycled aggregates, the types of equipment used for the two materials are different, but the calculation standards for their usage costs remain the same. According to the “Regulations of the People’s Republic of China on the Implementation of the Enterprise Income Tax Law”, the depreciation period of construction machinery is usually determined to be 10 years. Given that the time span of this waste production forecast is 10 years, which matches the legal depreciation period of construction machinery, the purchase cost of all types of equipment is set as the total amount of their depreciation expenses. On this basis, the net residual value rates of various types of equipment are comprehensively considered. After referring to the general range, the upper limit of 5% is adopted for calculation.
The benchmark price of electricity charge does not change frequently, but the paid-in electricity price fluctuates according to the time of day. The data are based on the electricity price table of electrical commercial users purchased by the State Grid Beijing electric power company as an agent, and the daily electricity consumption data is from the two-part system of industrial and commercial electricity from November 2025. The unit price of industrial electricity during normal times (subject to the two-part tariff system) is 0.646 CNY/kw·h [61].
The unit price of industrial and commercial water in this study is 4.1 CNY/t, which is determined based on the pricing mechanism of “permitted cost and reasonable income” established in the detailed rules for the administration of urban water supply prices in Beijing [62]. At the same time, Beijing has implemented a progressive price increase system for non-residential water. When water consumption exceeds the approved quota, the excess part will be charged by one, two, or three times the basic water price, so as to promote water conservation. Therefore, the price is based on the actual water price of the resource plant and adjusted by the over-quota progressive price increase system in 2025.
The fuel charge is based on the actual price of gas stations in Beijing in 2025. However, it should be noted that regional differences, oil price adjustments, and other factors may lead to price changes. The current average retail price of diesel oil is 7.95 CNY per liter.
Therefore, the cost calculation formula for the production stage of natural aggregates (CPN) is as follows:
C P N = i = 1 n C p e i + C f + C e + C w
where C p e i is the cost of the i-th type of equipment for producing natural aggregates (CNY). Cf is the oil cost during the production stage of natural aggregates (CNY). Ce is the electricity cost for the production stage of natural aggregates (CNY). Cw is the water cost for the natural aggregate production stage (CNY).
According to the actual measurement and record data of an enterprise in the Miyun District of Beijing, the equipment for producing natural aggregates includes excavators and loaders, and the unit fuel consumption of producing natural aggregates is calculated to be 0.21 kg/t. Due to the different processing capabilities of each piece of equipment, the processing bottleneck capacity of the sand-making machine is 120 t/h. When all the equipment is started simultaneously, the processing bottleneck capacity per hour is 120 t. Without considering the load and wear of the equipment, the unit power consumption is 7.77 kW·h/t based on the upper limit of the power range of the equipment. In this study, the daily water consumption of 3 t was selected [63]. Table 10 shows the cost of the production stage of natural aggregates.
Table 10 shows that, based on the equipment cost calculated from the equipment information required for the production stage of natural aggregates, combined with the actual cost of energy consumption such as diesel fuel, water, and electricity, the total cost required for the production stage of natural aggregates in Beijing from 2025 to 2034 is CNY 847 million.

5.3.3. Total Cost of Natural Aggregates

The total cost required for natural aggregates (C) is as follows:
C   = C TN + C PN
To sum up, the total cost of natural aggregates is CNY 1.446 billion.

5.4. Cost Analysis of Recycled Aggregates

5.4.1. Cost of Transportation Stage for Recycled Aggregates

In order to avoid the interference of transportation distance on the analysis results, it is assumed that the transportation distance of this part of construction waste to the resource plant is 25 km, and all of them are located in Beijing.
The cost during the transportation stage of recycled aggregates (CTR) is as follows:
C TR = L TR × W TR × c
where LTR is the one-way distance during the transportation stage of recycled aggregates (km) and WTR is the weight of all inert waste during the transportation stages in the next 10 years (t).
According to the predicted value of inert waste weight in demolition waste in Beijing from 2025 to 2034, the cost of the transportation stage of recycled aggregates can be calculated to be CNY 2.998 billion.

5.4.2. Cost of Production Stage for Recycled Aggregates

In the production stage of recycled aggregates, the type of equipment required is different from that of natural aggregates. Table 11 shows the equipment required for the production of recycled aggregates.
The cost calculation formula for the production stage of recycled aggregates (CPR) is as follows:
C PR = i = 1 n C   pe i + C   f + C   e + C   w
C   pe i is the cost of the i-th type of equipment for producing recycled aggregates (CNY); C′f is the oil cost during the production stage of recycled aggregates (CNY); C′e is the electricity cost for the production stage of recycled aggregates (CNY); and C′w is the water cost for the recycled aggregate production stage (CNY).
The equipment required for the production of recycled aggregates is shown in Table 11. Due to the different processing capabilities of each piece of equipment, the processing bottleneck capacity of the winnowing machine and the magnetic separator is 200 t/h. When all the equipment is started simultaneously, the processing bottleneck capacity per hour is 200 t. Without considering the load and wear of the equipment, the unit power consumption is 2.51 kW·h/t, based on the upper limit of the power range of the equipment. The fuel consumption in the production process of recycled aggregate mainly comes from the solid waste transported by the loader to the production line and the finished product transported to the warehouse. According to the hourly fuel consumption and hourly production of the actual case, the average fuel consumption is 0.18 kg/t. Table 12 shows the cost of the production stage of recycled aggregates.
Table 12 shows that, based on the equipment cost calculated from the equipment information required for the production stage of recycled aggregate, combined with the actual cost of energy consumption such as diesel fuel, water, and electricity, the total cost required for the production stage of recycled aggregate in Beijing from 2025 to 2034 is CNY 411 million.

5.4.3. Total Cost of Recycled Aggregates

The total cost required for recycled aggregates (C) is as follows:
C     =   C TR + C PR
Based on the previous calculation, the total cost of the production stage of natural aggregates in Beijing from 2025 to 2034 is expected to be CNY 1.446 billion, while the total cost for the production stage of recycled aggregates is CNY 3.409 billion. As a result, the cost of the production stage of recycled aggregate is CNY 1.963 billion higher than that of natural aggregate.

5.5. Calculation of Income

5.5.1. Natural Aggregate

According to the national sand and gravel aggregate price data released by the Beijing Aggregates Association in October 2025, the prices of relevant enterprises in the Shanghai area are representative. Among them, the price of natural sand is 111 CNY/t [64]. Based on the forecasted total amount of recycled aggregate products in Beijing from 2025 to 2034, assuming that the demand for natural and recycled aggregate is consistent, the income can be calculated to be about CNY 13.310 billion.

5.5.2. Recycled Aggregates

(1)
Inert material treatment and subsidy
At present, Beijing has not clarified the specific number of subsidies. Referring to the actual construction waste resource utilization project in Sujiatuo, Haidian District, Beijing, enterprises generating the waste in this project need to pay a fee of 30 CNY/t, and the government provides a subsidy of 22.4 CNY/t [65]. Therefore, it is expected to achieve revenue of CNY 6.283 billion, which can cover the cost expenditure.
(2)
Direct recycling of non-inert materials
Non-inert materials of demolition and decoration construction waste include metal components, wood waste, paper, and paint residue, etc. According to the above description, the predicted total amount of metal components is 3.7736 million tons, that of wood waste is 2.1589 million tons, that of paint residue is 394,600 tons, that of plastic waste is 120,200 tons, and that of paper materials is 38,500 tons. In metal components, scrap iron (scrap steel) accounts for about 90%.
According to the China Waste Recycling Network and other data, the average recycling price of metal components in 2025 is about 2093 CNY/t, the average recycling price of wood waste is about 500 CNY/t, the average recycling price of plastic waste is about 3500 CNY/t, and the average recycling price of paper is about 200 CNY/t [66]. Therefore, the total direct recycling revenue of non-inert materials over the next 10 years is approximately CNY 9.406 billion.
(3)
Sales revenue
According to the data from the Beijing Aggregates Association, the price of recycled aggregates for related enterprises in the Shanghai area can reach up to 54 CNY/t [64]. Therefore, the revenue can be calculated to be CNY 6.475 billion.

5.6. Result Interpretation

Based on the calculation of resource recycling and the utilization of construction waste in Beijing from 2025 to 2034, comprehensively considering the value transformation at different stages and of different components, and combining the cost savings in construction waste treatment and the market sales revenue of aggregates, Table 13 presents the comparison of economic benefit results at different stages.
The results show that if all construction waste in Beijing is processed into recycled aggregates over the 10-year period from 2025 to 2034, it can ultimately bring about an economic value of approximately CNY 20.5 billion. In this forecast analysis, the monthly average exchange rate of CNY against the USD in November 2025 is 7.088, which is equivalent to approximately USD 2.998 billion.

5.7. Parameter Sensitivity Analysis

To explore the extent to which the variation parameters of transportation distance affect the economic benefits of recycled aggregates and natural aggregates, this study conducted a sensitivity analysis of key parameters. The study incorporated 20%, 50%, and 100% increases in transportation distance as the scenario settings for sensitivity analysis and used economic value data as the calculation results to quantitatively analyze the changes in economic benefits under different scenarios when fluctuations occurred.
The results show that in the comparative analysis of the two types of aggregates, when the interfering factor of transportation distance fluctuation is taken into account, the economic benefit advantage of recycled aggregates still exists. Even when the transportation distance reaches 100%, recycled aggregate still shows economic advantages, which further proves the robustness and superiority of recycled aggregate in terms of economic benefits. Figure 9 shows the result of sensitivity analysis of transportation distance.

6. Countermeasures and Suggestions

China’s construction waste recycling system is still in the early stage of development. At this stage, it is facing core technology bottlenecks such as insufficient performance of recycled building materials, limited engineering application scenarios, and weak market competitiveness. These technical and economic constraints make it difficult to form large-scale applications in this field, and there is a significant gap with the mature recycling system in developed countries. This study puts forward the following countermeasures and suggestions to provide a reference for promoting energy conservation, emission reduction, and the development of a circular economy.

6.1. Improve the System of Laws, Regulations, and Technical Standards and Strengthen Policy Guidance

The government should speed up the formulation and improvement of relevant laws and regulations and clarify the responsibilities and obligations of the sources of construction waste, transportation processes, treatment methods, and the application of recycled products. Fang et al. (2017) pointed out that the successful experience of developed countries showed that systematic policy support and technological innovation were the key factors promoting the recycling of construction waste [67]. The government can require the submission of waste treatment plans before the commencement of construction projects, implement refined classification and recycling, and ensure that construction waste enters the standard treatment process from the beginning. At the same time, management policies will be issued to strengthen the supervision of the recycling treatment industry, and rewards and punishments will be used to promote the transformation of treatment methods. For enterprises that actively carry out the recycling treatment of construction waste, tax incentives, financial subsidies, and other incentives can be provided to improve their enthusiasm to participate in the recycling treatment, so as to ensure the orderly competition and sustainable development of the industry. In addition, it is necessary to formulate a unified technical standard and specification system to provide a clear technical basis for the resource disposal process, the quality of recycled products, and engineering applications.

6.2. Promote the Development of Industrialization and the Construction of Market Mechanism, and Open up the Resource Chain

The key to improving the level of resource utilization is to build a sustainable business model, so that the recycled products have a stable market outlet and the processing enterprises have reasonable economic benefits. The government should encourage the integrated operation mode of construction waste collection and transportation, cultivate industrial bases and key enterprises, and give play to the scale effect and leading role. In terms of technological innovation, we need to increase support for the research and development of key technologies for resource utilization, tackle the high-value application technology of recycled aggregate, develop green building materials such as new low-carbon cementitious materials, and improve the added value and market competitiveness of products. In terms of application channel expansion, it is necessary to improve the certification system of recycled products, improve engineering application standards, and clarify the application parts, technical indicators, and quality requirements of recycled products in different types of projects, so as to provide a stable market for recycled products. At the same time, a reasonable waste treatment charging system should be established, and the construction waste producer should pay the corresponding transportation, utilization, and disposal fees to force the source’s reduction and provide financial support for industrial development.

6.3. Improve Data Collection and Management, and Build a Whole-Process Intelligent Supervision System

The establishment of a perfect data collection and management system is the basis for improving the efficiency of construction waste treatment. The construction industry should establish a perfect data collection system, covering the amount, types, components, treatment methods, and other information regarding waste. Yuvraj R. Patil et al. (2024) explored the performance, challenges, and opportunities of recycling concrete aggregates, and pointed out the shortcomings in the current quantitative management of construction and demolition (C&D) waste and sustainable policy frameworks, calling for the establishment of detailed localized databases to improve waste management [68]. Therefore, the construction industry can use the internet of things, big data analysis, and other technologies to monitor the generation and treatment of construction waste in real time, so as to realize data sharing and integration. Through data analysis, the resource treatment process was optimized to improve the resource recovery rate. To build a smart monitoring platform for the whole process, use the internet of things, Beidou satellite positioning, big data, and other technologies to build an information monitoring platform covering the whole process of construction waste from generation to transportation to disposal; realize real-time monitoring and closed-loop management of construction waste logistics and provide data support for the layout optimization of resource facilities, transportation route planning, and policy effect evaluation, so as to improve the overall governance efficiency of the industry.

7. Conclusions and Discussion

7.1. Research Conclusions

Promoting the resource utilization of construction waste has important strategic significance for China to build a circular society, promote the construction of ecological civilization, and practice the strategic goal of “double carbon”. At present, policies, regulations, and technology application research in related fields are gradually improving, which has effectively promoted the development of resource-based industries. This study systematically combs through the core concepts and development status of the recycling of construction waste. Taking Beijing as the research area, the ARIMA prediction model and yield estimation method are used to realize the scientific and quantitative prediction of the generation scale of construction waste; at the same time, the cost–benefit analysis method is used to build the economic value evaluation framework and measure the economic benefits of resource utilization.
The main conclusions are as follows:
  • The prediction model shows that the output of construction waste in Beijing will gradually decrease steadily in the next decade and may increase in the long run. The results further reflect the comprehensive impact of policy implementation, changes in construction activities, and technological progress.
  • The economic benefits of the resource utilization of construction waste are remarkable, and the medium- and long-term environmental benefits are outstanding. From 2025 to 2034, if all construction wastes in Beijing are processed into recycled aggregate, the investment will be higher than that of natural materials in the short term, but in the long run, it will bring about USD 2.998 billion of economic value.
  • Based on the prediction results and value evaluation conclusions, this paper puts forward a series of countermeasures and suggestions from the aspects of laws and regulations, technical standards, industrialization development, data management, and intelligent supervision systems, so as to improve the development level of construction waste recycling.

7.2. Conclusion Analysis and Discussion

This study predicts that the production of construction waste in Beijing from 2025 to 2034 will show a trend of “first decreasing and then slightly recovering” based on the ARIMA model, reaching about 13.6 million tons in 2034. This prediction result has both similarities and differences with multiple studies on different regions in China, reflecting the influence of multiple factors such as prediction methods, regional characteristics, and urban development stages.
The results of this study are consistent with empirical observations of the gradual decline in construction waste production in the Changping District, Beijing, in recent years [69]. This collectively reflects the direct impact of the reduction in new construction areas on the generation of construction waste in the context of Beijing’s urban construction shifting from large-scale incremental development to a focus on stock renewal. The predicted results reflect the dynamic development of the city, and the trend of “first decreasing and then stabilizing, with a slight rebound” predicted by the results of this study is a direct reflection of the transformation stage of Beijing’s urban development. The initial decline in production is closely related to Beijing’s strict control over large-scale urban development and construction, as well as the relocation of non-capital functions, reflecting a slowdown in the intensity of construction activities. A slight rebound in production at the end of the forecast period may indicate that urban development has entered a new stage dominated by “urban renewal”, characterized by a shift from large-scale new construction to the renovation, maintenance, demolition, and reconstruction of existing buildings.
However, compared with other prediction studies, there are certain differences in the prediction results of this study. The dynamic material flow analysis (DMFA) method is widely used in predicting construction waste. Dai et al. (2019) used DMFA to point out that Beijing will usher in a peak period of construction waste in 2040 [70]. Dong et al. (2025) [71] indicates that by the mid-to-late 21st century, Beijing will experience a peak in construction waste production and maintain high fluctuations. The maximum peak of construction waste is predicted to occur in 2094, with a total output of 23.964 million tons [71]. The prediction results of this study are significantly lower than the peak values of these long-term predictions, mainly due to differences in the prediction model methods and application scales. The ARIMA model used in this study is good at capturing smooth trends in the short-to-medium term based on historical data, but its ability to predict long-term structural turning points such as structural changes in building stock and the arrival of large-scale demolition activities is limited. In contrast, the dynamic material flow analysis model used in the above study can simulate the dynamic evolution of building stock flow and is better at revealing the long-term emission peaks caused by the large-scale construction of buildings that entered the demolition period decades ago.
These methodological differences explain why there are significant differences in the prediction results of construction waste production among different studies. But there have been significant innovations in prediction methods in the current research. For example, some studies have used machine learning methods such as Extreme Gradient Boosting (XGBOOST) to achieve high prediction accuracy even with limited data (test R2 value reaches 99.9). This type of data-driven approach provides a new solution for predicting construction waste in developing countries [72]. In addition, some studies have innovatively combined Agent-Based Models (ABMs) with BP neural networks to establish new evaluation models for construction waste management, which can more accurately simulate system behavior under policy intervention. This type of mixed method provides new ideas for predicting the amount of construction waste generated and its management effectiveness [73].

7.3. Research Significance

The research significance of this article can be divided into its theoretical contribution and practical significance. In terms of theory, this study enriches the research system in the field of construction waste management and constructs a complete analysis framework of “production estimation—trend prediction—value evaluation”. By combining the ARIMA prediction model with the yield per unit area method, the yield of construction waste is predicted, which improves the application depth of the time series model in the field of construction waste. At the same time, the cost–benefit analysis method is used to systematically quantify the economic value of resource utilization, refine the accounting indicators of cost and benefit, and provide a reference methodology for similar research. In addition, this study combed the relevant theories of the resource utilization of construction waste and improved the practical application system of the theory of the circular economy in the construction field. In practice, the production forecast can provide a scientific basis for the planning of construction waste disposal facilities and the allocation of transportation capacity in Beijing. The production results of 2025–2034 based on the data forecast from 2001 to 2024 can help the management department to arrange the resourceful disposal of resources in advance, optimize the disposal process, and improve the management efficiency. The economic value evaluation results can clearly show the profit potential of resource utilization, attract social capital investment, and promote the large-scale development of the industry. The policy suggestions put forward in this study can provide reference for the government departments to improve the construction waste management policy, promote the standardized development of the resource utilization industry, and help to achieve the “double carbon” goal and the construction of ecological civilization.
Meanwhile, the conclusions of this study have certain guiding significance for the future recycling and reuse of construction waste. The guiding significance runs through the entire chain of “industrial development—regulatory optimization—technology promotion”. At the level of industrial development, the focus should be on expanding the application scenarios of recycled aggregates in municipal engineering and prefabricated buildings reducing unit costs through scaling up, promoting the extension of the industrial chain, developing deep processing products of recycled aggregates, and enhancing added value. At the level of regulatory optimization, combined with the trend of “first decrease and then increase” in production, it is recommended to establish a “dynamic supervision—flexible allocation” recycling system. At the level of technology promotion, the research conclusions indirectly highlight the research and development direction of “reducing the cost of recycling”. In response to the problem that the short-term cost of recycled aggregates is higher than that of natural materials, the focus should be on promoting low-energy crushing technology and recycled material performance improvement technology, narrowing the cost gap through technological progress, and enhancing market competitiveness.

8. Study Limitations and Future Research Directions

8.1. Study Limitations

Taking Beijing as the sample, this study realized the prediction of the scale of construction waste generation and economic value evaluation through a quantitative model, which provided data support and a decision-making reference for the resource utilization of regional construction waste. However, due to the limitations of the research scope and method assumptions, there are still some limitations.
(1)
The predictive model itself has certain limitations. This study used the ARIMA model to predict the time series of construction waste production, but this model has significant limitations in application. The ARIMA model is highly sensitive to sudden changes in data related to crises. When faced with external shocks such as epidemic outbreaks, major policy adjustments, and sudden public events, the scale of construction waste generation is prone to irregular fluctuations. At this time, the model finds it difficult to accurately capture the characteristics of data changes, which can lead to significant deviations in prediction results. At the same time, the model is based on the core premise of data stationarity and relies heavily on the periodicity and trend of data sequences. It lacks the ability to actively adapt to complex exogenous shocks, which objectively limits the robustness of the prediction results.
(2)
There is uncertainty in parameter estimation. In the process of parameter estimation, in order to focus on core issues and simplify complex real-world scenarios, we have to make standardized assumptions for some parameters, which may not fully match the actual market dynamics, such as the market premium coefficient and cost-sharing ratio of recycled products. The determination of the coefficient of construction waste generation is mainly based on industry’s general standards, without fully considering the impact of specific construction techniques, material usage habits, and management-level differences in Beijing on the parameters, resulting in deviations between parameter estimation results and real market scenarios. This uncertainty will be transmitted to the final result through model calculations, reducing the accuracy of economic value assessments and output forecasting, especially in long-term applications where the cumulative effect of parameter deviations may be more pronounced.
(3)
There is a gap between the assumptions used in the model’s construction process and the actual complex system. The prediction model only takes historical production data as the core input and does not fully integrate external shock factors such as macroeconomic fluctuations, construction industry cycle changes, and environmental policy adjustments. It ignores the comprehensive impact of multi-factor interactions on the scale of construction waste generation, which may lead to long-term prediction results deviating from the actual situation. The economic value assessment model does not include implicit costs such as ecological costs and environmental externalities in the accounting system and only focuses on explicit production costs and market benefits, which makes the value assessment results unable to fully reflect the comprehensive benefits of the resource utilization of construction waste.
(4)
Regional applicability and sample scope are limited. The research sample is limited to Beijing, which, as the capital and mega-city of China, has unique characteristics in terms of the development level of its construction industry, economic structure, environmental protection policies, and resource endowment. The prediction model and value evaluation system constructed based on the Beijing samples are difficult to directly adapt to other regions, and their conclusions may not be directly applicable to other regions with different levels of economic development or different characteristics of construction industry development. The limitation of the sample size makes the constructed model lack cross-regional universality, making it difficult to support the formulation of differentiated policies at the national level.

8.2. Future Research Directions

In response to the above limitations, future research can deepen and expand in the following areas:
(1)
Optimize model architecture and parameter estimation methods to enhance prediction robustness. To improve the robustness and prediction accuracy of the model, future research can explore incorporating macroeconomic indicators, the construction industry prosperity index, policy changes, and other exogenous variables into the prediction model. For example, a combination of gray system theory and multiple regression can also be used for prediction to cope with situations where the data volume is limited and fluctuates greatly. Using BIM technology for more refined component-level waste estimations can also improve the accuracy of the input information from the data source.
(2)
Establish a comprehensive cost–benefit evaluation system. In terms of economic value assessments, future research should strive to construct a more comprehensive cost–benefit analysis framework, quantifying and accounting for implicit costs such as environmental externalities, ecological costs, carbon emission costs, and social costs. The systematic quantification of the economic, ecological, and social value of the resource utilization of construction waste can provide more comprehensive value references for decision-making.
(3)
Expand research on cross-regional comparison and differentiation models. Future research samples should expand their coverage and select regions at different stages of economic development with different characteristics of construction industry development for comparative studies. Through cross-regional data collection and analysis, key regional factors that affect the amount and resource utilization benefits of construction waste can be identified, and differentiated prediction and evaluation models can be constructed. This helps to form more targeted local management strategies and provides more comprehensive empirical support for the formulation of national-level policies.

Author Contributions

Conceptualization, X.M. and G.H.; Methodology, Y.W.; Software, Y.W.; Validation, X.M.; Investigation, Y.W. and L.W.; Resources, L.W.; Writing—Original Draft, Y.W.; Writing—Review and Editing, X.M., G.H., and L.W.; Visualization, Y.W.; Supervision, G.H.; Project Administration, X.M.; Funding Acquisition, X.M. All authors have read and agreed to the published version of the manuscript.

Funding

The research is funded by the National Key R&D Program (2022YFC3902605) and the National Natural Science Foundation of China (52300228).

Data Availability Statement

The data presented in this study are openly available in the National Bureau of Statistics at https://data.stats.gov.cn/easyquery.htm?cn=E0101 (accessed on 5 October 2025).

Conflicts of Interest

Author Liyuchen Wang was employed by the MCC Communication Construction Group Co., Ltd. The remaining authors declare that the research was conducted in the absence of any commercial or financial relationships that could be construed as potential conflicts of interest.

References

  1. Solid Waste and Chemicals Management Center; Ministry of Ecology and Environment. Research Report on the Release of National Solid Waste Pollution Prevention and Control Information, 2024. Available online: https://www.meescc.cn/zhxx/zxyw/202505/W020250530336582088864.pdf (accessed on 10 November 2025).
  2. Fernando Silva, Y.; Delvasto, S.; Valencia, W.; Araya-Letelier, G. Performance of Self-Compacting Concrete with Residue of Masonry and Recycled Aggregate under Sulfate Attack. J. Mater. Civ. Eng. 2024, 36, 113868. [Google Scholar] [CrossRef] [Scilit]
  3. Silva, Y.F.; Delvasto, S.; Izquierdo, S.; Araya-Letelier, G. Short and long-term physical and mechanical characterization of self-compacting concrete made with masonry and concrete residue. Constr. Build. Mater. 2021, 312, 125382. [Google Scholar] [CrossRef] [Scilit]
  4. Wang, Y.-S.; Wang, X.-Y. Damage evolution in limestone calcined clay cement (LC3) paste containing recycled glass powder exposed to elevated temperatures. Constr. Build. Mater. 2025, 464, 140140. [Google Scholar] [CrossRef] [Scilit]
  5. Wang, Y.-S.; Lin, R.; Kim, T.; Lim, J.-Y.; Kwon, S.-J.; Wang, X.-Y. Development and characterization of ternary blended cement incorporating slag and thermally activated waste eggshell: Hydration, microstructure, macro properties, and carbonation durability. Constr. Build. Mater. 2025, 490, 142569. [Google Scholar] [CrossRef] [Scilit]
  6. Jiang, B.; Huang, H.; Ge, F.; Huang, B.; Ullah, H. Carbon Emission Assessment During the Recycling Phase of Building Meltable Materials from Construction and Demolition Waste: A Case Study in China. Buildings 2025, 15, 456. [Google Scholar] [CrossRef] [Scilit]
  7. Niekurzak, M.; Lewicki, W.; Wróbel, J. Efficiency Assessment of the Production of Alternative Fuels of High Usable Quality within the Circular Economy: An Example from the Cement Sector. Sustainability 2024, 16, 8762. [Google Scholar] [CrossRef] [Scilit]
  8. Yu, Y.; Yazan, D.M.; Bhochhibhoya, S.; Volker, L. Towards Circular Economy through Industrial Symbiosis in the Dutch construction industry: A case of recycled concrete aggregates. J. Clean. Prod. 2021, 293, 126083. [Google Scholar] [CrossRef] [Scilit]
  9. European Union. Directive (EU) 2018/851 of the European Parliament and of the Council of 30 May 2018 Amending Directive 2008/98/EC on Waste. Available online: https://eur-lex.europa.eu/eli/dir/2018/851/oj (accessed on 10 November 2025).
  10. European Commission. The Circular Economy Action Plan. Available online: https://www.eeas.europa.eu/sites/default/files/ce_action_plan_2.0_cn_0.pdf (accessed on 10 November 2025).
  11. Aslam, M.S.; Huang, B.; Cui, L. Review of construction and demolition waste management in China and USA. J. Environ. Manag. 2020, 264, 110445. [Google Scholar] [CrossRef] [Scilit]
  12. Liu, Y.; Qin, H.; Gao, P.; Yang, Y.; Hong, L.; Zhan, B.; Yu, Q.; Guo, B. Overview of waste generation and carbon emissions in the construction industry. In Wastes to Low-Carbon Construction Materials; Woodhead Publishing: Sawston, UK, 2025; pp. 3–27. [Google Scholar] [CrossRef] [Scilit]
  13. Yu, L. Evaluation of Environmental Effects of Recycled Aggregate Asphalt (Cement) Concrete from Construction Solid Waste Based on Life Cycle Assessment. Master’s Thesis, Nanchang University, Nanchang, China, 2023. [Google Scholar]
  14. Beijing Review: Circular Economy Promotion Law of the People’s Republic of China. Available online: https://www.peoplechina.com.cn/document/txt/2008-12/04/content_168428.htm (accessed on 10 November 2025).
  15. Yan, J. On Perfecting the Legal System of Circular Economy in China; Gansu Political Science and Law Institute: Lanzhou, China, 2018. Available online: https://kns.cnki.net/kcms2/article/abstract?v=A8ynNhXZdPmBCJaFI4lLyeXZWJjykpY-ETloXbWFw9NkJ20xhpPpds8ITTs9ZOAuVjP5tZN_0_xAArSFAKSLcdnou95DjDVMLynu0zqPhZuBHwYVRPZ6ypezYfGR2MhDpIRfVU_yA7YHqMwfyE91qFTJmrfNCP6wyo49vTVHlSbpyOl224Kzp1q1SLJpj4kL&uniplatform=NZKPT&language=CHS%20%W%20CNKI (accessed on 10 November 2025).
  16. Tian, J. Comprehensive Benefit Analysis of Recycled Aggregate Produced by Construction Waste; Chongqing University: Chongqing, China, 2019. [Google Scholar] [CrossRef]
  17. Xu, L. Evaluation of Incremental Costs and Benefits of Prefabricated Buildings Under the Background of Construction Waste Minimization. Master’s Thesis, Yantai University, Yantai, China, 2025. [Google Scholar]
  18. Purchase, C.K.; Al Zulayq, D.M.; O’Brien, B.T.; Kowalewski, M.J.; Berenjian, A.; Tarighaleslami, A.H.; Seifan, M. Circular economy of construction and demolition waste: A literature review on lessons, challenges, and benefits. Materials 2022, 15, 76. [Google Scholar] [CrossRef] [Scilit]
  19. Kabirifar, K.; Mojtahedi, M.; Wang, C.; Tam, V.W.Y. Construction and demolition waste management contributing factors coupled with reduce, reuse, and recycle strategies for effective waste management: A review. J. Clean. Prod. 2020, 263, 121265. [Google Scholar] [CrossRef] [Scilit]
  20. Abdelli, I.S.; Abdelmalek, F.; Djelloul, A.; Mesghouni, K.; Addou, A. GIS-based approach for optimised collection of household waste in Mostaganem city (Western Algeria). Waste Manag Res. 2016, 34, 417–426. [Google Scholar] [CrossRef] [Scilit]
  21. Meyer, D.E.; Li, M.; Ingwersen, W.W. Analyzing economy-scale solid waste generation using the United States environmentally-extended input-output model. Resour. Conserv. Recycl. 2020, 157, 104795. [Google Scholar] [CrossRef] [Scilit]
  22. Brandão, R.; Edwards, D.J.; Hosseini, M.R.; Silva Melo, A.C.; Macêdo, A.N. Reverse supply chain conceptual model for construction and demolition waste. Waste Manag. Res. 2021, 39, 1341–1355. [Google Scholar] [CrossRef] [Scilit]
  23. Yuan, J.; Zeng, X.; Chen, M. Estimating the construction waste generation in Jinan using the grey system theory. China Environ. Sci. 2020, 40, 3894–3902. [Google Scholar]
  24. Yin, R.; Wang, Z.; Pang, Y.; Deng, X.; Deng, Q. Analysis and Prediction of Urban Construction Waste Generation Based on System Dynamics Model. Constr. Econ. 2023, 44, 394–400. [Google Scholar] [CrossRef]
  25. Zhao, Y.; Wang, Q.; Wei, J.; Zhao, L. Research on Calculating Method of the Output of Decoration Waste Based on the Prediction of the Completed Floor Space of Buildings in Wuhan. Environ. Sanit. Eng. 2021, 29, 10–15+21. [Google Scholar] [CrossRef]
  26. Hu, M.; Peng, F.; Xiang, P. Estimatinon of Construction and Demolition Waste Generation and Site Optimization of Recycling Plants: A Case Study of Chongqing Metropolis, China. Environ. Eng. 2020, 38, 122–127. [Google Scholar] [CrossRef]
  27. Wang, Z.; Wang, Y.; Qin, F.; Liu, J. Carbon Reduction Potential of Construction Waste Recycling and Spatial Temporal Heterogeneity of Influencing Factors. J. Eng. Manag. 2024, 38, 26–32. [Google Scholar] [CrossRef]
  28. Yan, H. Hybrid Simulation-Based Benefit Optimization for Construction Waste Resource Recovery Systems. Master’s Thesis, Guangdong University of Technology, Guangzhou, China, 2025. [Google Scholar]
  29. Lv, S. Research on Construction and Demolition Waste Quantification Based on Project Budget. Master’s Thesis, Beijing Jiaotong University, Beijing, China, 2021. [Google Scholar]
  30. Sun, K.; Cai, T.; Wang, W.; Wu, X.; Liu, H.; Zheng, G. LSTM-based forecasting for urban construction waste generation. J. East China Jiaotong Univ. 2020, 37, 26–33. [Google Scholar] [CrossRef]
  31. CJJ/T134-2019; The Technical Standard for Construction Waste Treatment. Ministry of Housing and Urban-Rural Development: Beijing, China, 2019.
  32. Wang, B.; Sun, J.; Wang, J.; Hou, S. Study on Policies and Countermeasures for the Disposal of Construction and Demolition Waste. Constr. Econ. 2021, 42, 8–13. [Google Scholar] [CrossRef]
  33. Hu, R. Quantification and Prediction of Construction Waste Generation of New-Constructed Residential Buildings. Master’s Thesis, Wuhan University of Technology, Wuhan, China, 2020. [Google Scholar]
  34. Wang, L.; Pan, F. Review on the Material Flow Analysis of Environmental System-Social Economic System. Ecol. Econ. 2018, 34, 3. [Google Scholar]
  35. Zhang, L.; Zhang, B.; Li, L.; Zhao, J. Review of the application of material flow analysis in solid waste management. Solid Waste management. Environ. Sustain. Dev. 2021, 46, 132–138. [Google Scholar] [CrossRef]
  36. Hu, X. Research on C&D Waste Output Prediction and Resource Utilization Value Assessment: Taking Nanchang as an Example. Master’s Thesis, East China University of Technology, Nanchang, China, 2024. [Google Scholar]
  37. Hu, Q.; Liu, R.; Su, P.; Huang, J.; Peng, Y. Construction and demolition waste generation prediction and spatiotemporal analysis: A case study in Sichuan, China. Environ. Sci. Pollut. Res. 2023, 30, 41623–41643. [Google Scholar] [CrossRef] [Scilit]
  38. Akanbi, L.A.; Oyedele, A.O.; Oyedele, L.O.; Salami, R.O. Deep learning model for Demolition Waste Prediction in a circular economy. J. Clean. Prod. 2020, 274, 122843. [Google Scholar] [CrossRef] [Scilit]
  39. Kern, A.P.; Dias, M.F.; Kulakowski, M.P.; Gomes, L.P. Waste generated in high-rise buildings construction: A quantification model based on statistical multiple regression. Waste Manag. 2015, 39, 35–44. [Google Scholar] [CrossRef] [Scilit]
  40. Liu, K. Construction and Demolition Waste Governance Comprehensive Benefit Model Simulation and Economic Incentive Policy Research. Master’s Thesis, East China University of Technology, Nanchang, China, 2023. [Google Scholar]
  41. Gao, X.; Yuan, Y.; Wang, Y.; Yang, T.; Chen, T. Prediction of Construction Waste Generation in China Based on Grey Model and Management Recommendations. Sustainability 2025, 17, 1711. [Google Scholar] [CrossRef] [Scilit]
  42. Fang, Y.; Shi, X.; Chen, Y.; He, J. Quantity Prediction of Construction and Demolition Waste Using Weighted Combined Grey Theory and Autoregressive Integrated Moving Average Model. Sustainability 2024, 16, 5255. [Google Scholar] [CrossRef] [Scilit]
  43. Beijing Municipal Commission of Planning and Natural Resources: Beijing Master Plan (2016–2035) [EB/OL]. Available online: https://www.beijing.gov.cn/gongkai/guihua/wngh/cqgh/201907/t20190701_100008.html (accessed on 10 November 2025).
  44. The People’s Government of Beijing Municipality: Beijing Communication Radio—Beijing Achieves High-Quality Leap in the Context of Volume Reduction [EB/OL]. Available online: https://fgw.beijing.gov.cn/gzdt/fgzs/mtbdx/bzwlxw/202509/t20250922_4207296.htm (accessed on 10 November 2025).
  45. Yang, K. Research on the Whole Process Treatment and Disposal of Engineering Mud and Engineering Muck. Master’s Thesis, Beijing Jiaotong University, Beijing, China, 2020. [Google Scholar]
  46. Beijing Municipal Bureau of Statistics. Survey Office of the National Bureau of Statistics in Beijing, Beijing Statistical Yearbook, 2024. Available online: https://nj.tjj.beijing.gov.cn/nj/main/2024-tjnj/zk/indexch.htm (accessed on 10 November 2025).
  47. National Bureau of Statistics. National Data. Available online: https://data.stats.gov.cn/easyquery.htm?cn=E0101 (accessed on 10 November 2025).
  48. Zheng, L. Research on the Generation Characteristics and Management Features of Construction Waste in China. Master’s Thesis, Shenzhen University, Shenzhen, China, 2019. [Google Scholar]
  49. Zhou, T. Research on the Evaluation and Optimization of Construction Waste Resource Management Based on Economic Benefits—Taking Project A as an Example. Master’s Thesis, Zhengzhou University, Zhengzhou, China, 2023. [Google Scholar]
  50. Liu, Z.; Liu, G.; Xu, J.; Zhang, J. Research on Environmental and Economic Benefits of Brick Aggregate for Road Applications in Bangladesh. J. China Foreign Highw. 2025, 1–6. Available online: https://link.cnki.net/urlid/43.1363.U.20251120.1545.008 (accessed on 25 November 2025).
  51. Sereewatthanawut, I.; Ajayi, B.O.; Emmanuel, B.M.; Bunphot, A.; Chayutthanabun, A.; Niyomukiza, J.B.; Chinda, T. Sustainable Material Recovery from Demolition Waste: Knowledge Management and Insights from a Public Sector Building Renovation. Buildings 2025, 15, 3167. [Google Scholar] [CrossRef] [Scilit]
  52. Lu, N.; Zhang, Q.; Zhang, H.; Liu, N. The Economic Benefits Research on Construction Waste Resource Recovery. Value Eng. 2013, 32, 90–92. [Google Scholar] [CrossRef]
  53. Li, S.; Yi, X.; Chen, J.; Xu, H. Evaluation of the non-market value of the construction waste recycling based on payment card ladder. J. Arid Land Resour. Environ. 2023, 37, 99–108. [Google Scholar] [CrossRef]
  54. Lin, M. Research on Economic Benefit of Recycling Construction Waste Enterprises—Based on the Analysis of Different Economic Incentive Policies. Master’s Thesis, Xi’an University of Architecture and Technology, Xi’an, China, 2021. [Google Scholar]
  55. Zhan, J. Study on the Benefits of Resource Utilization of Waste in Municipal Road Reconstruction Projects. Master’s Thesis, Guangzhou University, Guangzhou, China, 2025. [Google Scholar]
  56. Lü, S.; Jin, Y.; Liu, G.; Ren, F.; Xi, C.; Lu, T.; Zhu, J.; Zhang, C. Characteristics of Residential Decoration Waste Generation and Management Countermeasures: A Case Study on Old Palace Area in DAXING District, BEIJING. Environ. Eng. 2022, 40, 186–192. [Google Scholar] [CrossRef]
  57. Liu, H. Primary Research of House Decoration Waste Toxicity and Its Treatment. China Resour. Compr. Util. 2005, 24–27. Available online: https://kns.cnki.net/kcms2/article/abstract?v=A8ynNhXZdPmR1npFfhIciwnkb9exY3CQVXLTKJeEPd-66dDpeCqgzTIUzObZU5D1jM6AwV1IixZhblDsvzvIteItbOCmj1ieJNLh3EIl0Xcsn1G719NRvVaPr1xrPHsvR-Bg6P1AoSJHIOfpgCUkKtitfUwcAjZ4OMqcvNIkoOZsnU2rsZDKAQ==&uniplatform=NZKPT (accessed on 10 November 2025).
  58. Wang, Y.; Zheng, J.; You, F. Review on Enhancement Methods of Recycled Aggregate. Mater. Rep. 2021, 35, 5053–5061. [Google Scholar]
  59. Zhou, H.; Cui, H.; Li, Y.; Zhao, D.; Zhang, J. Present Situation and Countermeasures of Resource Utilization of Construction Waste. Constr. Sci. Technol. 2022, 81–84. [Google Scholar] [CrossRef]
  60. GB/T 14684-2022; Sand for Construction. State Administration for Market Regulation: Beijing, China, 2022.
  61. State Grid. Electricity Price List for Commercial Users of State Grid Beijing Electric Power Company. Available online: http://www.bj.sgcc.com.cn/u/cms/bj/other/202510/cd921acb575346ffbd65f8b57f2f11d9.pdf (accessed on 10 November 2025).
  62. The People’s Government of Beijing Municipality. Detailed Rules for the Implementation of Urban Water Supply Price Management in Beijing. Available online: https://www.beijing.gov.cn/zhengce/zhengcefagui/202211/t20221129_2867671.html (accessed on 10 November 2025).
  63. Zhou, M. A Cost Accounting Model and Its Application of Construction and Demolition Waste Recycling. Master’s Thesis, Chongqing University, Chongqing, China, 2018. [Google Scholar]
  64. China Aggregate Association. National Aggregate Price Release in October 2025. Available online: https://www.zgss.org.cn/gongqiuxinxi/2025/17617.html (accessed on 10 November 2025).
  65. People’s Daily. The Resource Disposal Rate of Construction Waste in Beijing Will Reach More Than 85% in 2022. Available online: http://zw.china.com.cn/2021-03/26/content_77348551.html (accessed on 10 November 2025).
  66. China Waste Recycling Network. Latest Detailed List of Various Waste Recycling Prices. Available online: https://www.zgfeipin.cn/expo_17561_1/ (accessed on 10 November 2025).
  67. Fang, S.; Zou, G.; Wang, H.; Yan, R. Investigation and inspiration on the recycling of foreign construction waste. Highw. Eng. 2017, 42, 154–167. [Google Scholar]
  68. Patil Yuvraj, R.; Dakwale Vaidehi, A.; Ralegaonkar Rahul, V. Recycling Construction and Demolition Waste in the Sector of Construction. Adv. Civ. Eng. 2024, 6234010. [Google Scholar] [CrossRef] [Scilit]
  69. The People’s Government of Beijing Municipality. Planning for Prevention and Control of Construction Waste Pollution in Changping District of Beijing (2024–2027). Available online: https://www.beijing.gov.cn/hudong/gfxwjzj/qjzjxx/202409/P020240911582986591658.pdf (accessed on 10 November 2025).
  70. Dai, T.; Li, Y. Study on Dynamic Evolution of Construction Material Stock in Beijing. Areal Res. Dev. 2019, 38, 39–44+51. Available online: https://kns.cnki.net/kcms2/article/abstract?v=A8ynNhXZdPmEdAzgBYKU0vn0MusoGB6_SfaUJ5WSqF9p0c7XRTMEAl_BqbbQDeXWMI8Hizo3H55ZgCFnzOwbZsGNLLPBmeaynuT91jWkAsnQQtqfP66PIOKYxGHwrGuejLt5QdMz4kpd0CTTH2hO2KaS2PO8y-3Vz_l-zVUSLBg7Xm7r23QuB4fhjwrUizCj&uniplatform=NZKPT (accessed on 10 November 2025).
  71. Dong, L.; Liu, J.Y.; Zhang, Z.Q.; Zhang, M. Simulation and prediction of construction and demolition waste from urban and rural housing in Beijing based on dynamic material flow analysis. China Environ. Sci. 2025, 45, 2041–2052. [Google Scholar]
  72. Maged, A.; Elshaboury, N.; Akanbi, L. Data-driven prediction of construction and demolition waste generation using limited datasets in developing countries: An optimized extreme gradient boosting approach. Environ. Dev. Sustain. 2024, 27, 26865–26889. [Google Scholar] [CrossRef] [Scilit]
  73. Wen, X. BPNN-ABM Based Simulation Research of Urban Construction Waste Recycling Soften Management. Master’s Thesis, Shenzhen University, Shenzhen, China, 2023. [Google Scholar]
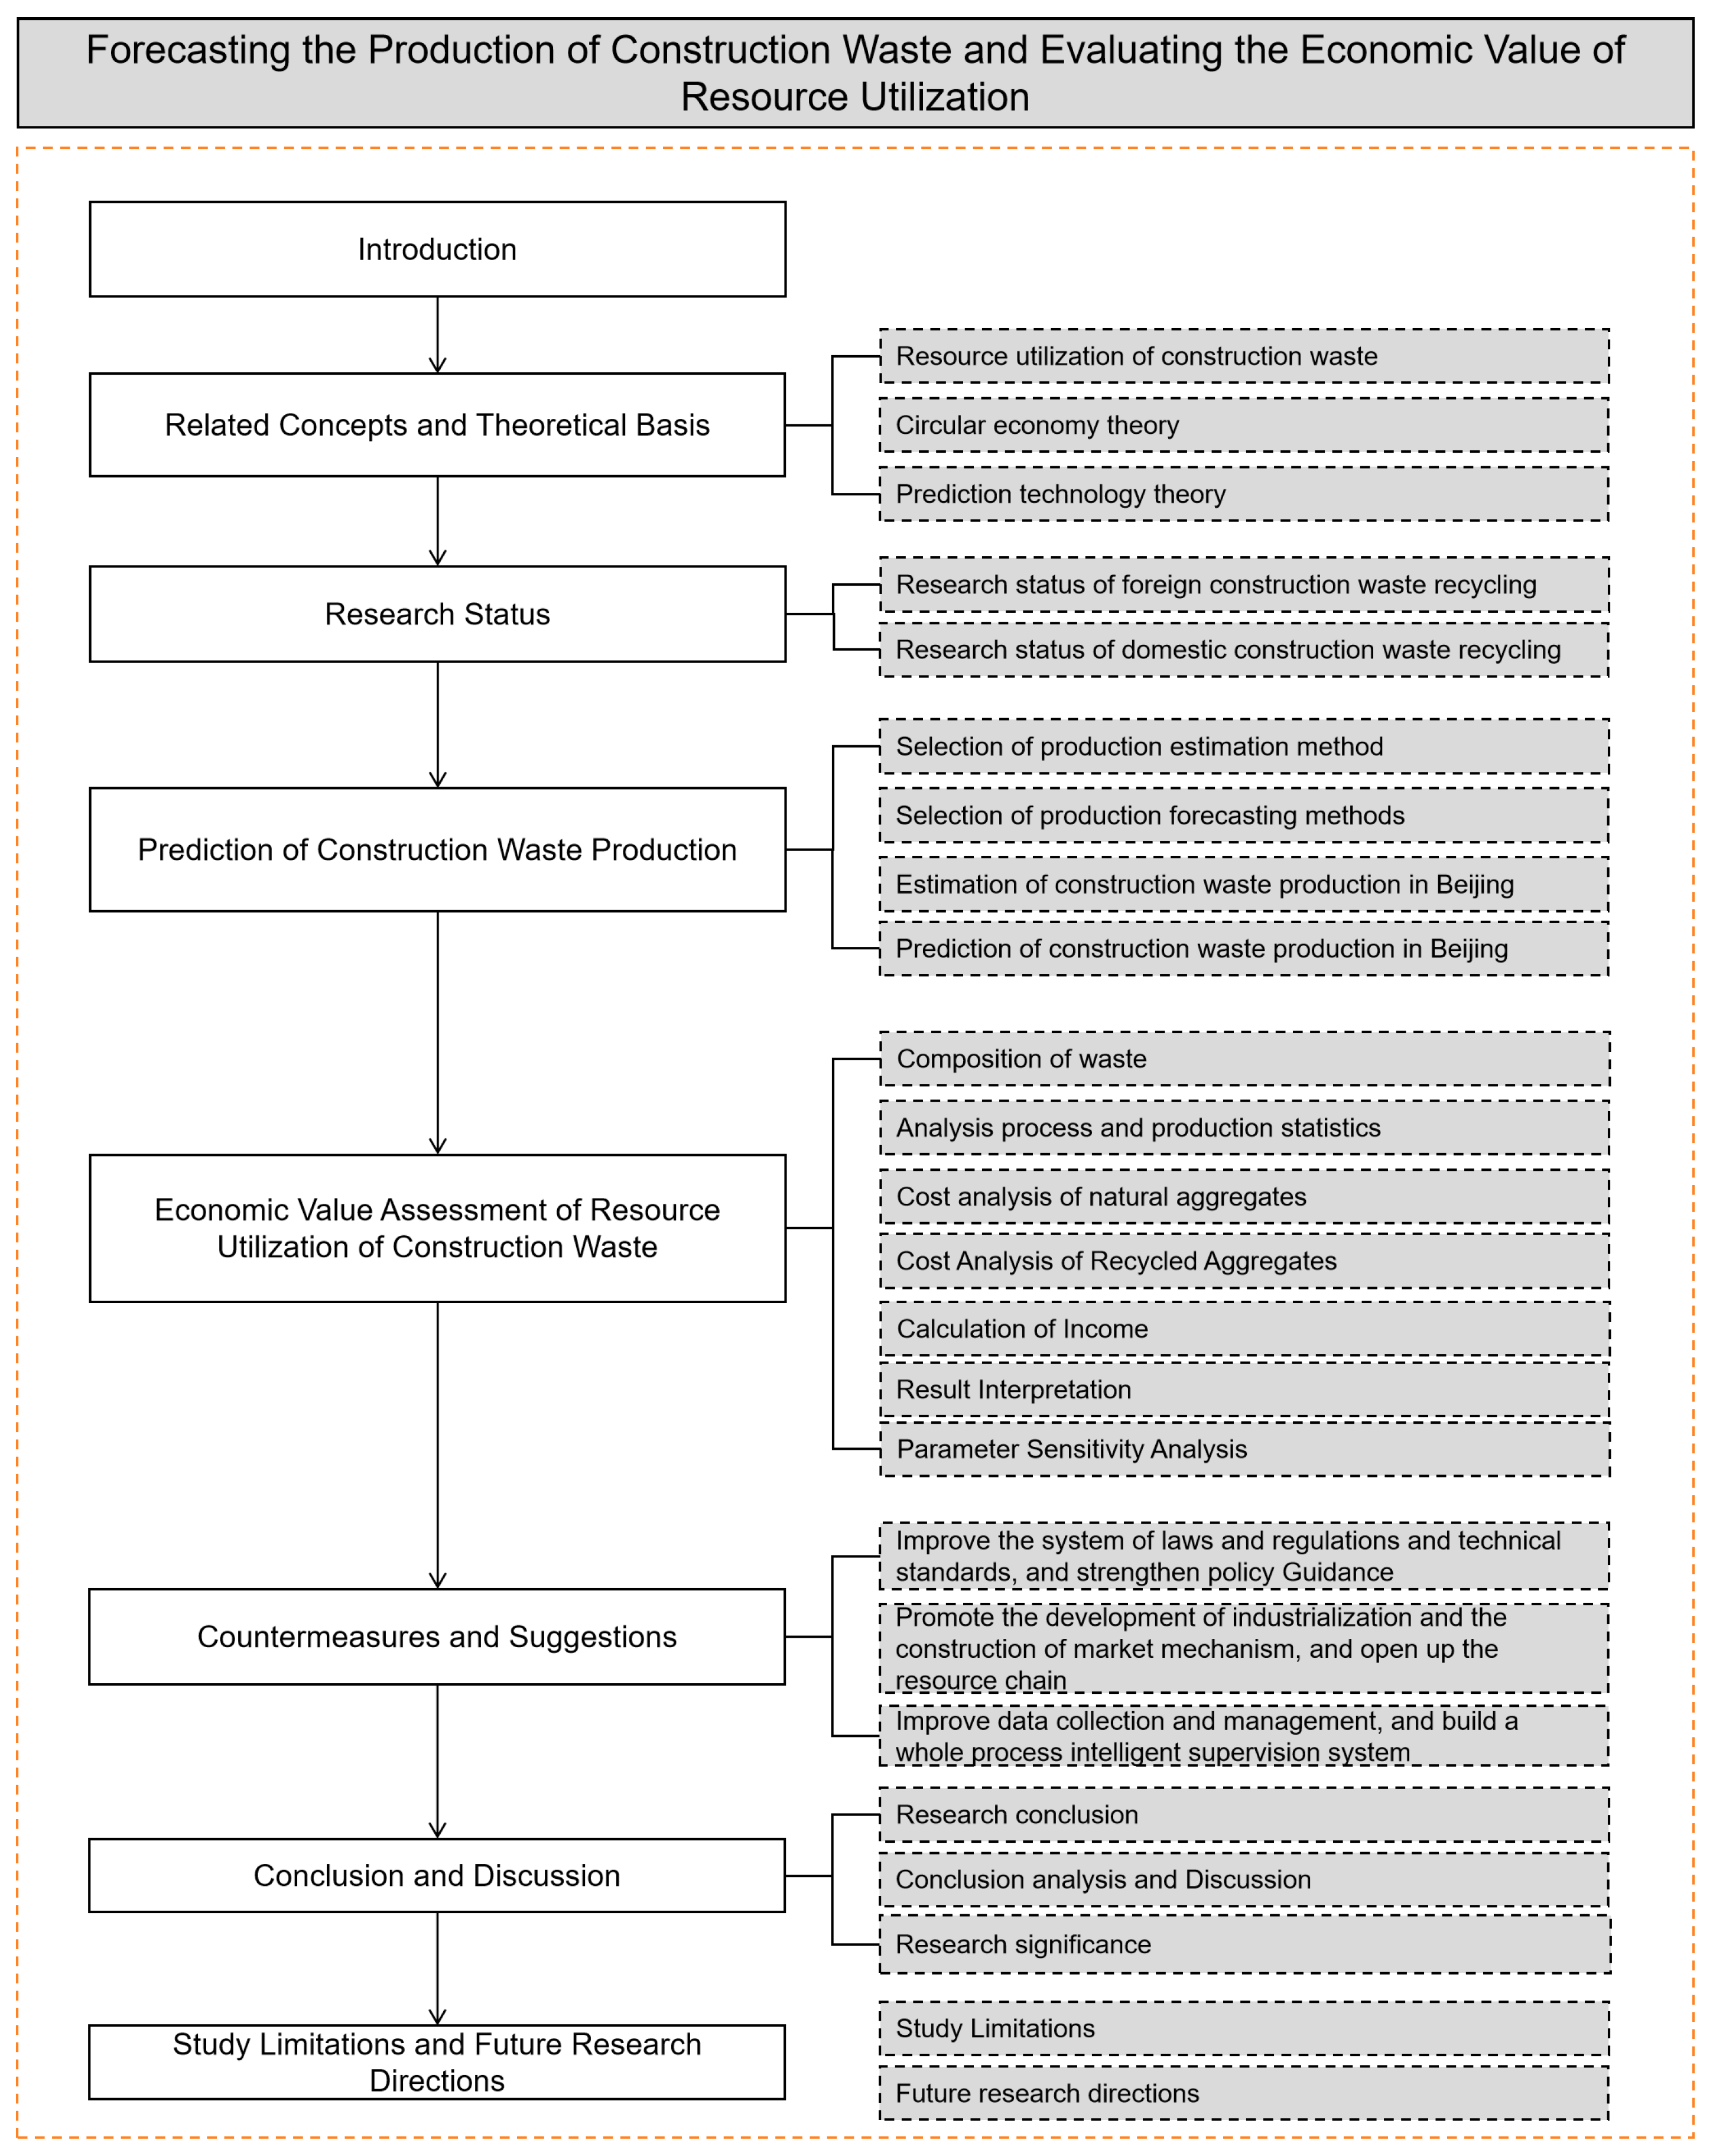
Figure 1. The research structure of the study.
Buildings 16 00013 g001
Figure 2. The GDP and change rate of Beijing and its construction industry from 2000 to 2023.
Buildings 16 00013 g002
Figure 3. Growth trend of construction area and completed area in Beijing construction industry.
Buildings 16 00013 g003
Figure 4. Original sequence line chart.
Buildings 16 00013 g004
Figure 5. Autocorrelation graph.
Buildings 16 00013 g005
Figure 6. Partial autocorrelation graph.
Buildings 16 00013 g006
Figure 7. Fitting chart of predicted value of construction waste production in Beijing from 2025 to 2034.
Buildings 16 00013 g007
Figure 8. Analysis and calculation flow chart.
Buildings 16 00013 g008
Figure 9. Sensitivity analysis of transportation distance.
Buildings 16 00013 g009
Table 1. Construction and completed areas in Beijing from 2001 to 2024 (ten thousand square meters, %).
YearConstruction AreaAnnual Growth Rate of Construction AreaCompleted AreaAnnual Growth Rate of Completed AreaResidential Completed AreaCommercial Completed Area
202411,309.53−9.75%1652.53−19.08%912.76739.77
202312,531.34−6.01%2042.255.35%1135.88906.37
202213,333.15−5.14%1938.48−2.29%1096.22842.26
202114,055.320.98%1983.8628.35%981.051002.81
202013,918.6411.22%1545.7215.07%728.48817.24
201912,514.99−3.45%1343.28−13.78%583.2760.08
201812,962.614.43%1557.96.22%731.2826.7
201712,412.74−4.34%1466.67−38.11%604.04862.63
201612,976−0.13%2369.95−9.94%1267.061102.89
201512,993.08−4.38%2631.45−13.84%1378.221253.23
201413,588.08−2.15%3054.1214.54%1804.341249.78
201313,886.875.82%2666.3511.52%1692.04974.31
201213,122.498.76%2390.866.49%1522.72868.14
201112,065.3817.13%2245.24−5.93%1316.13929.11
201010,300.865.99%2386.71−10.90%1498.48888.23
20099719.08−2.95%2678.554.71%1613.231065.32
200810,014.32−4.06%2557.99−11.54%1399.31158.69
200710,438.65−0.43%2891.65−9.46%1853.951037.7
200610,483.53−2.47%3193.89−15.30%2193.321000.57
200510,748.58.23%3770.8822.95%2841.42929.46
20049931.319.49%3066.9918.25%2343.95723.04
20039070.6620.77%2593.658.77%2080.75512.9
20027510.7525.88%2384.4439.66%1926.17458.27
20015966.67——1707.35——1393.43313.92
Table 2. Production of construction waste in Beijing from 2001 to 2024 (ten thousand tons).
YearConstruction WasteDemolition Construction WasteDecoration WasteResidential Decoration WasteCommercial Decoration Waste
20241547.01 1526.79 20.22 9.13 11.10
20231716.69 1691.73 24.95 11.36 13.60
20221823.57 1799.98 23.60 10.96 12.63
20211922.32 1897.47 24.85 9.81 15.04
20201898.56 1879.02 19.54 7.28 12.26
20191706.76 1689.52 17.23 5.83 11.40
20181769.66 1749.95 19.71 7.31 12.40
20171694.70 1675.72 18.98 6.04 12.94
20161780.97 1751.76 29.21 12.67 16.54
20151786.65 1754.07 32.58 13.78 18.80
20141871.18 1834.39 36.79 18.04 18.75
20131906.26 1874.73 31.54 16.92 14.61
20121799.79 1771.54 28.25 15.23 13.02
20111655.92 1628.83 27.10 13.16 13.94
20101418.92 1390.62 28.31 14.98 13.32
20091344.19 1312.08 32.11 16.13 15.98
20081383.31 1351.93 31.37 13.99 17.38
20071443.32 1409.22 34.11 18.54 15.57
20061452.22 1415.28 36.94 21.93 15.01
20051493.40 1451.05 42.36 28.41 13.94
20041375.01 1340.73 34.29 23.44 10.85
20031253.04 1224.54 28.50 20.81 7.69
20021040.09 1013.95 26.14 19.26 6.87
2001824.14 805.50 18.64 13.93 4.71
Table 3. AIC/BIC value combination results.
Model (p, d, q)AIC ValueBIC Value
ARIMA (2, 0, 0)299.5577304.2699
ARIMA (2, 0, 1)301.3432307.2334
ARIMA (1, 0, 1)303.1948307.907
ARIMA (3, 0, 0)301.0439306.9342
Table 4. Predicted values of construction waste production in Beijing from 2025 to 2034 (ten thousand tons).
YearTotal Construction WasteDemolition Construction WasteDecoration Construction Waste
20251432.141414.3017.84
20261360.061342.7317.33
20271319.881301.7818.10
20281302.341282.7019.64
20291299.961278.4121.55
20301306.911283.4123.50
20311318.911293.6225.29
20321332.931306.1526.78
20331347.001319.0627.94
20341359.901331.1328.77
Table 5. Demolition waste’s various material proportions in Beijing.
Type of MaterialProportion (%)Description
Concrete block46.8Inert waste, it is mainly used for the preparation of recycled aggregates.
Brick and tile32.5Inert waste, it can be processed as raw material of recycled bricks and mortars.
Mortar7.2Inert waste, it can be crushed and utilized with concrete blocks.
Metal component2.8Non-inert waste, it mainly consists of steel bars and pipes, which can be directly recycled and smelted.
Ceramic tile3.6Inert waste, it can be used for recycled aggregates or roadbed fillers.
Wood waste1.5Non-inert waste, it can be recycled for biomass energy or board processing.
Others5.6Containing plastic and glass fragments, etc., after sorting, they are classified and utilized.
Table 6. Predicted values of the scale of various components in demolition waste in Beijing from 2025 to 2034 (ten thousand tons).
YearConcrete BlockBrick and TileMortarMetal ComponentCeramic TileWood WasteOthers
2025661.89 459.65 101.83 39.60 50.91 21.21 79.20
2026628.40 436.39 96.68 37.60 48.34 20.14 75.19
2027609.23 423.08 93.73 36.45 46.86 19.53 72.90
2028600.30 416.88 92.35 35.92 46.18 19.24 71.83
2029598.30 415.48 92.05 35.80 46.02 19.18 71.59
2030600.64 417.11 92.41 35.94 46.20 19.25 71.87
2031605.41 420.43 93.14 36.22 46.57 19.40 72.44
2032611.28 424.50 94.04 36.57 47.02 19.59 73.14
2033617.32 428.69 94.97 36.93 47.49 19.79 73.87
2034622.97 432.62 95.84 37.27 47.92 19.97 74.54
Table 7. Proportions of various materials in decoration waste in Beijing (%).
Type of MaterialProportion of Initial DecorationProportion of Renovation of Existing HousesAverage ProportionDescription
Brick and stone
(concrete and brick)
42.549.546.0 Inert waste
Paint residue18.316.517.4 Non-inert waste
Gypsum product10.211.310.8 Inert waste
Wood waste8.77.68.2 Non-inert waste
Metal component3.84.24.0 Non-inert waste
Plastic waste5.64.95.3 Non-inert waste
Glass ceramic fragments6.13.74.9 Inert waste
Paper waste2.41.01.7 Non-inert waste
Other miscellaneous items2.40.91.7 ——
Table 8. Predicted values of the scale of various components of Beijing’s decoration waste from 2025 to 2034 (ten thousand tons).
YearBrick and StonePaint ResidueGypsum ProductWood WasteMetal ComponentPlastic WasteGlass ceramic FragmentsPaper WasteOther Miscellaneous Items
20258.21 3.10 1.93 1.46 0.71 0.95 0.87 0.30 0.30
20267.97 3.02 1.87 1.42 0.69 0.92 0.85 0.29 0.29
20278.33 3.15 1.95 1.48 0.72 0.96 0.89 0.31 0.31
20289.03 3.42 2.12 1.61 0.79 1.04 0.96 0.33 0.33
20299.91 3.75 2.33 1.77 0.86 1.14 1.06 0.37 0.37
203010.81 4.09 2.54 1.93 0.94 1.25 1.15 0.40 0.40
203111.63 4.40 2.73 2.07 1.01 1.34 1.24 0.43 0.43
203212.32 4.66 2.89 2.20 1.07 1.42 1.31 0.46 0.46
203312.85 4.86 3.02 2.29 1.12 1.48 1.37 0.47 0.47
203413.23 5.01 3.11 2.36 1.15 1.52 1.41 0.49 0.49
Table 9. Information on equipment required for natural aggregate production.
EquipmentQuantity
(Units)
Power
(kw)
Processing Capacity
(t/h)
Unit Price
(Ten Thousand CNY)
Type of Energy Consumption
Excavator2214——230Diesel oil
Loader292——48Diesel oil
Vibrating feeder27.4160~21024Electricity
Hammer crusher1264160~21023Electricity
Shaping crusher1220150~200134Electricity
Sand-making machine132080~12054Electricity
Crawler conveyor27.525012Electricity
Vibrating screen211150~26021Electricity
Table 10. Cost of the production stage of natural aggregates.
Type of CostCost Details
(Ten Thousand)
Description of Calculation
Cost of equipment836.95Based on the quantity of equipment used in the production stage of natural aggregates, with a depreciation period of 10 years and a legal residual value of 5%.
Diesel fuel cost23,551.75 The equipment includes excavators and loaders. The unit fuel consumption for producing natural aggregates is 0.21 kg/t. The density of diesel is 0.85 kg/L. The current national average retail price of No. 0 diesel is 7.95 CNY/L.
Electricity cost60,187.92 The bottleneck processing capacity of each device is 120 t per hour, and the unit power consumption is 7.77 kW·h/t. The unit price of industrial electricity during normal times is 0.646/kw·h.
Water cost153.63 The national legal average daily working hours are 8 h. The bottleneck processing capacity of each piece of equipment when started simultaneously is 120 tons per hour. With a water consumption of 3 tons per day, 374,700 tons of water is needed to completely treat all inert materials. The unit price of industrial water in Beijing is 4.1 CNY/t.
Total cost84,730.25
Table 11. The equipment required for the production of recycled aggregates.
EquipmentQuantity
(Units)
Power
(kw)
Processing Capacity
(t/h)
Unit Price
(Ten Thousand CNY)
Type of Energy Consumption
Loader4162——230Diesel oil
Vibrating feeder210.5180~38024Electricity
Cone crusher2220190~49068Electricity
Jaw crusher2130220~38016.8Electricity
Winnowing machine29.73~20042Electricity
Magnetic separator211120~2003Electricity
Belt conveyor420.540012Electricity
Vibrating screen41145~38021Electricity
Table 12. Cost of the production stage of recycled aggregates.
Type of CostCost Details
(Ten Thousand)
Description of Calculation
Cost of equipment1291.62Based on the quantity of equipment used in the production stage of recycled aggregates, with a depreciation period of 10 years and a legal residual value of 5%.
Diesel fuel cost20,187.22 The equipment includes loaders. The unit fuel consumption for producing natural aggregates is 0.18 kg/t. The density of diesel is 0.85 kg/L. The current national average retail price of No. 0 diesel is 7.95 CNY/L.
Electricity cost19,442.94 The bottleneck processing capacity of each device is 200 t per hour, and the unit power consumption is 2.51 kW·h/t. The unit price of industrial electricity during normal times is 0.646/kw·h
Water cost184.34The national legal average daily working hours are 8 h. The bottleneck processing capacity of each piece of equipment when started simultaneously is 200 tons per hour. With a water consumption of 6 tons per day, the unit price of industrial water in Beijing is 4.1 CNY/t.
Total cost41,106.14
Table 13. Comparison of economic benefit results at different stages (100 million CNY).
Potential Savings in ExpensesTreatment and SubsidyDirect RecyclingCostEconomic Benefit
Recycled aggregates−64.7562.8394.06−34.0958.05
Natural aggregate−133.10————−14.46−147.56
Difference68.3562.8394.06−19.36205.61
Disclaimer/Publisher’s Note: The statements, opinions and data contained in all publications are solely those of the individual author(s) and contributor(s) and not of MDPI and/or the editor(s). MDPI and/or the editor(s) disclaim responsibility for any injury to people or property resulting from any ideas, methods, instructions or products referred to in the content.