2. Materials and Methods
2.1. Study Area
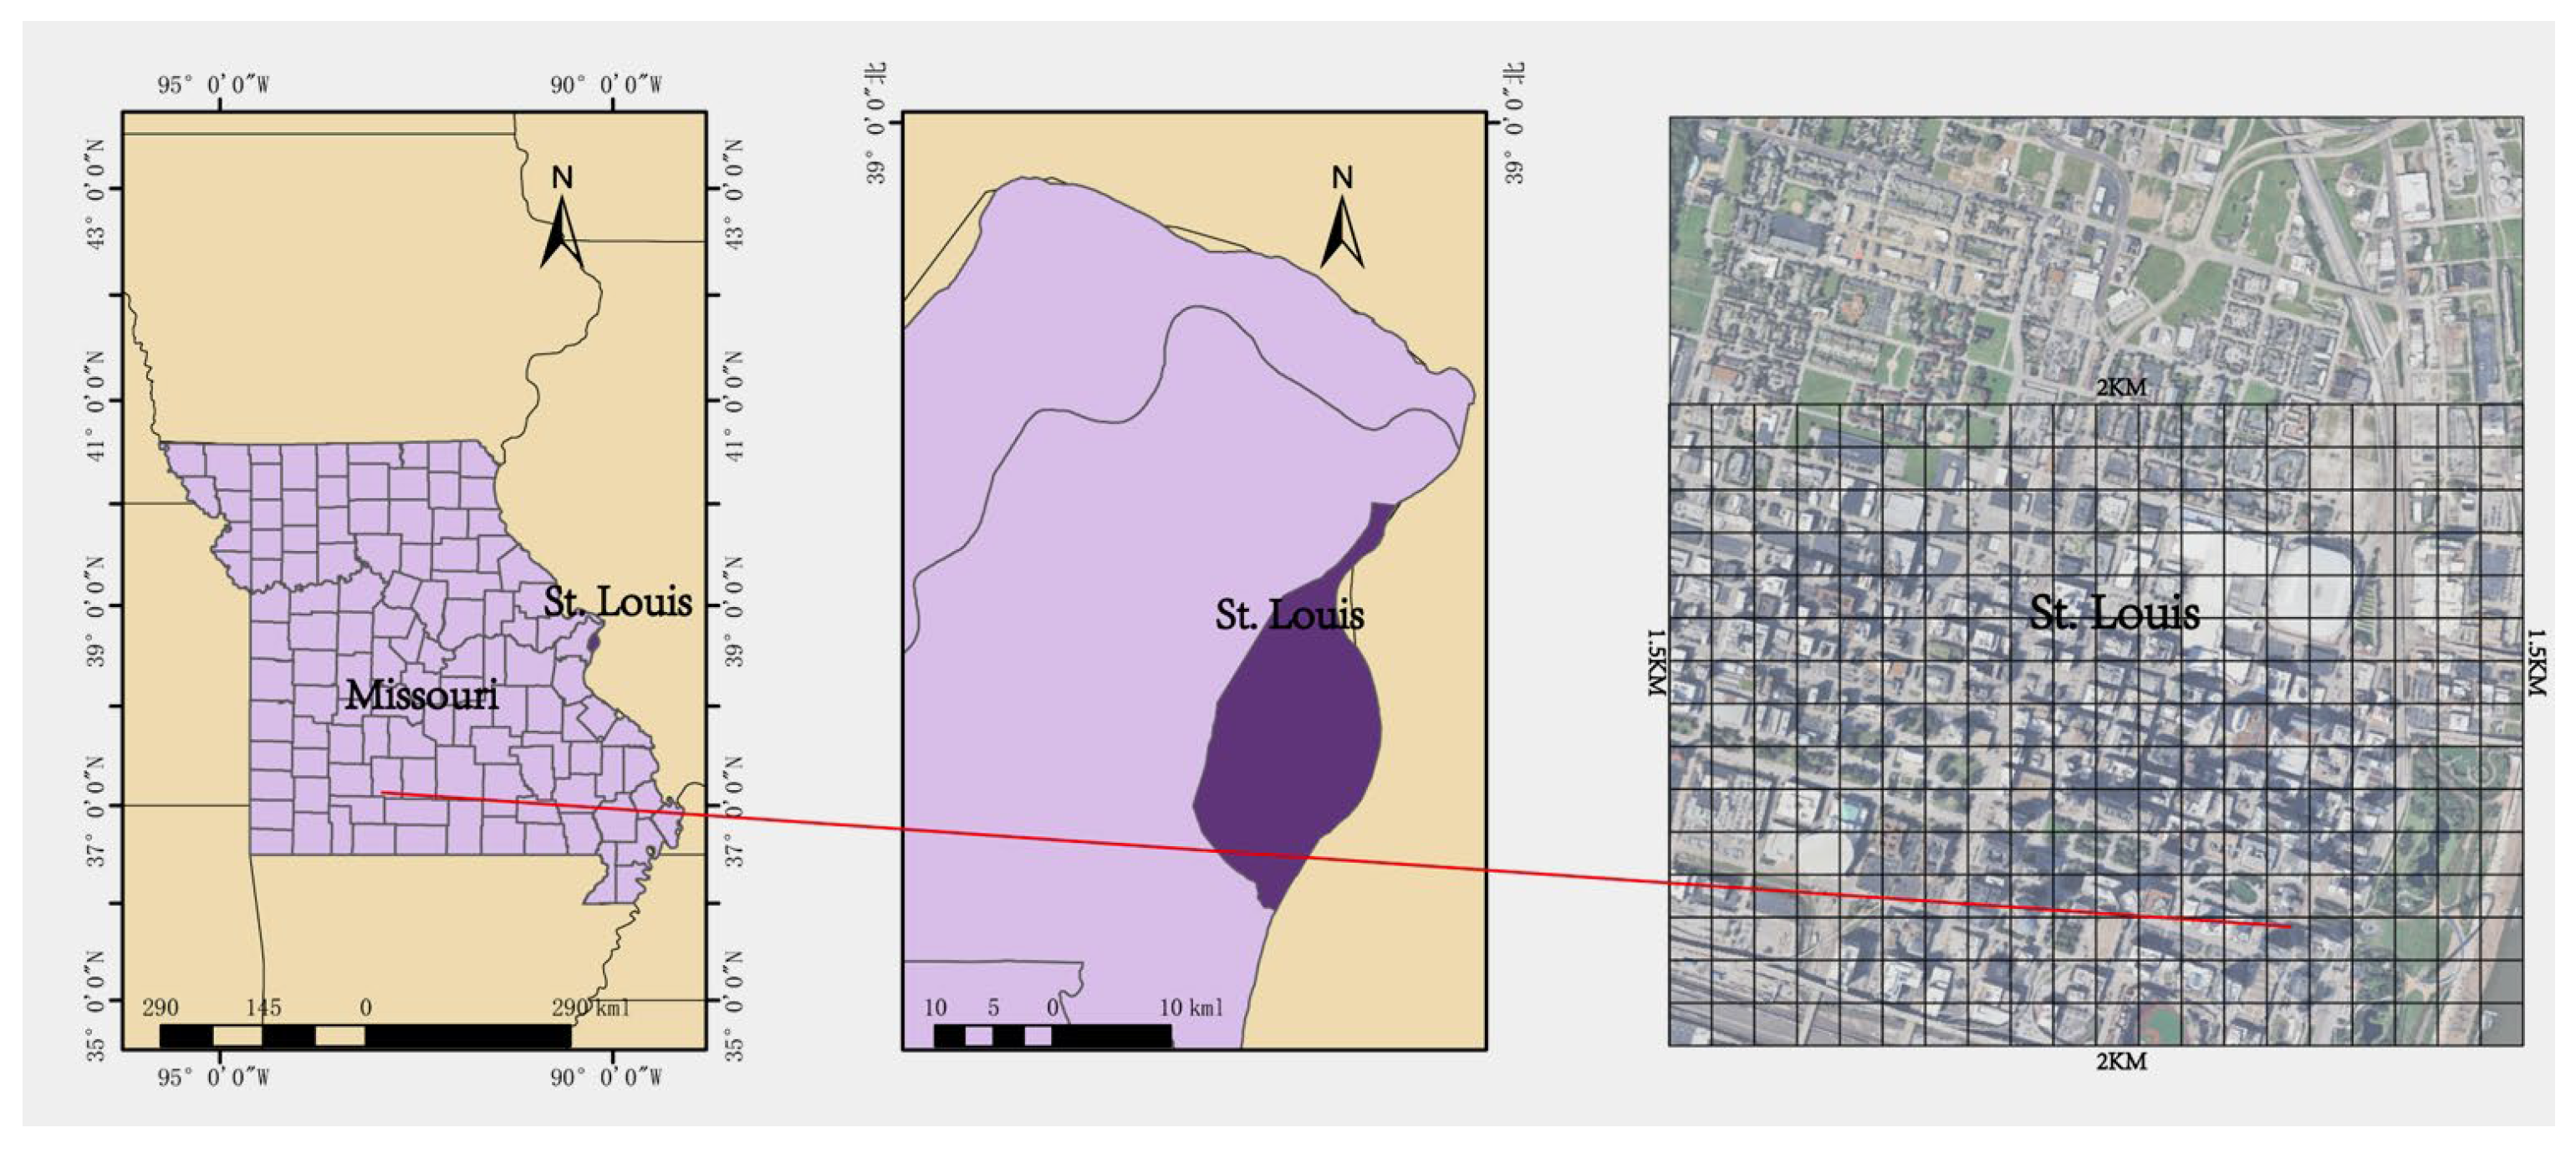
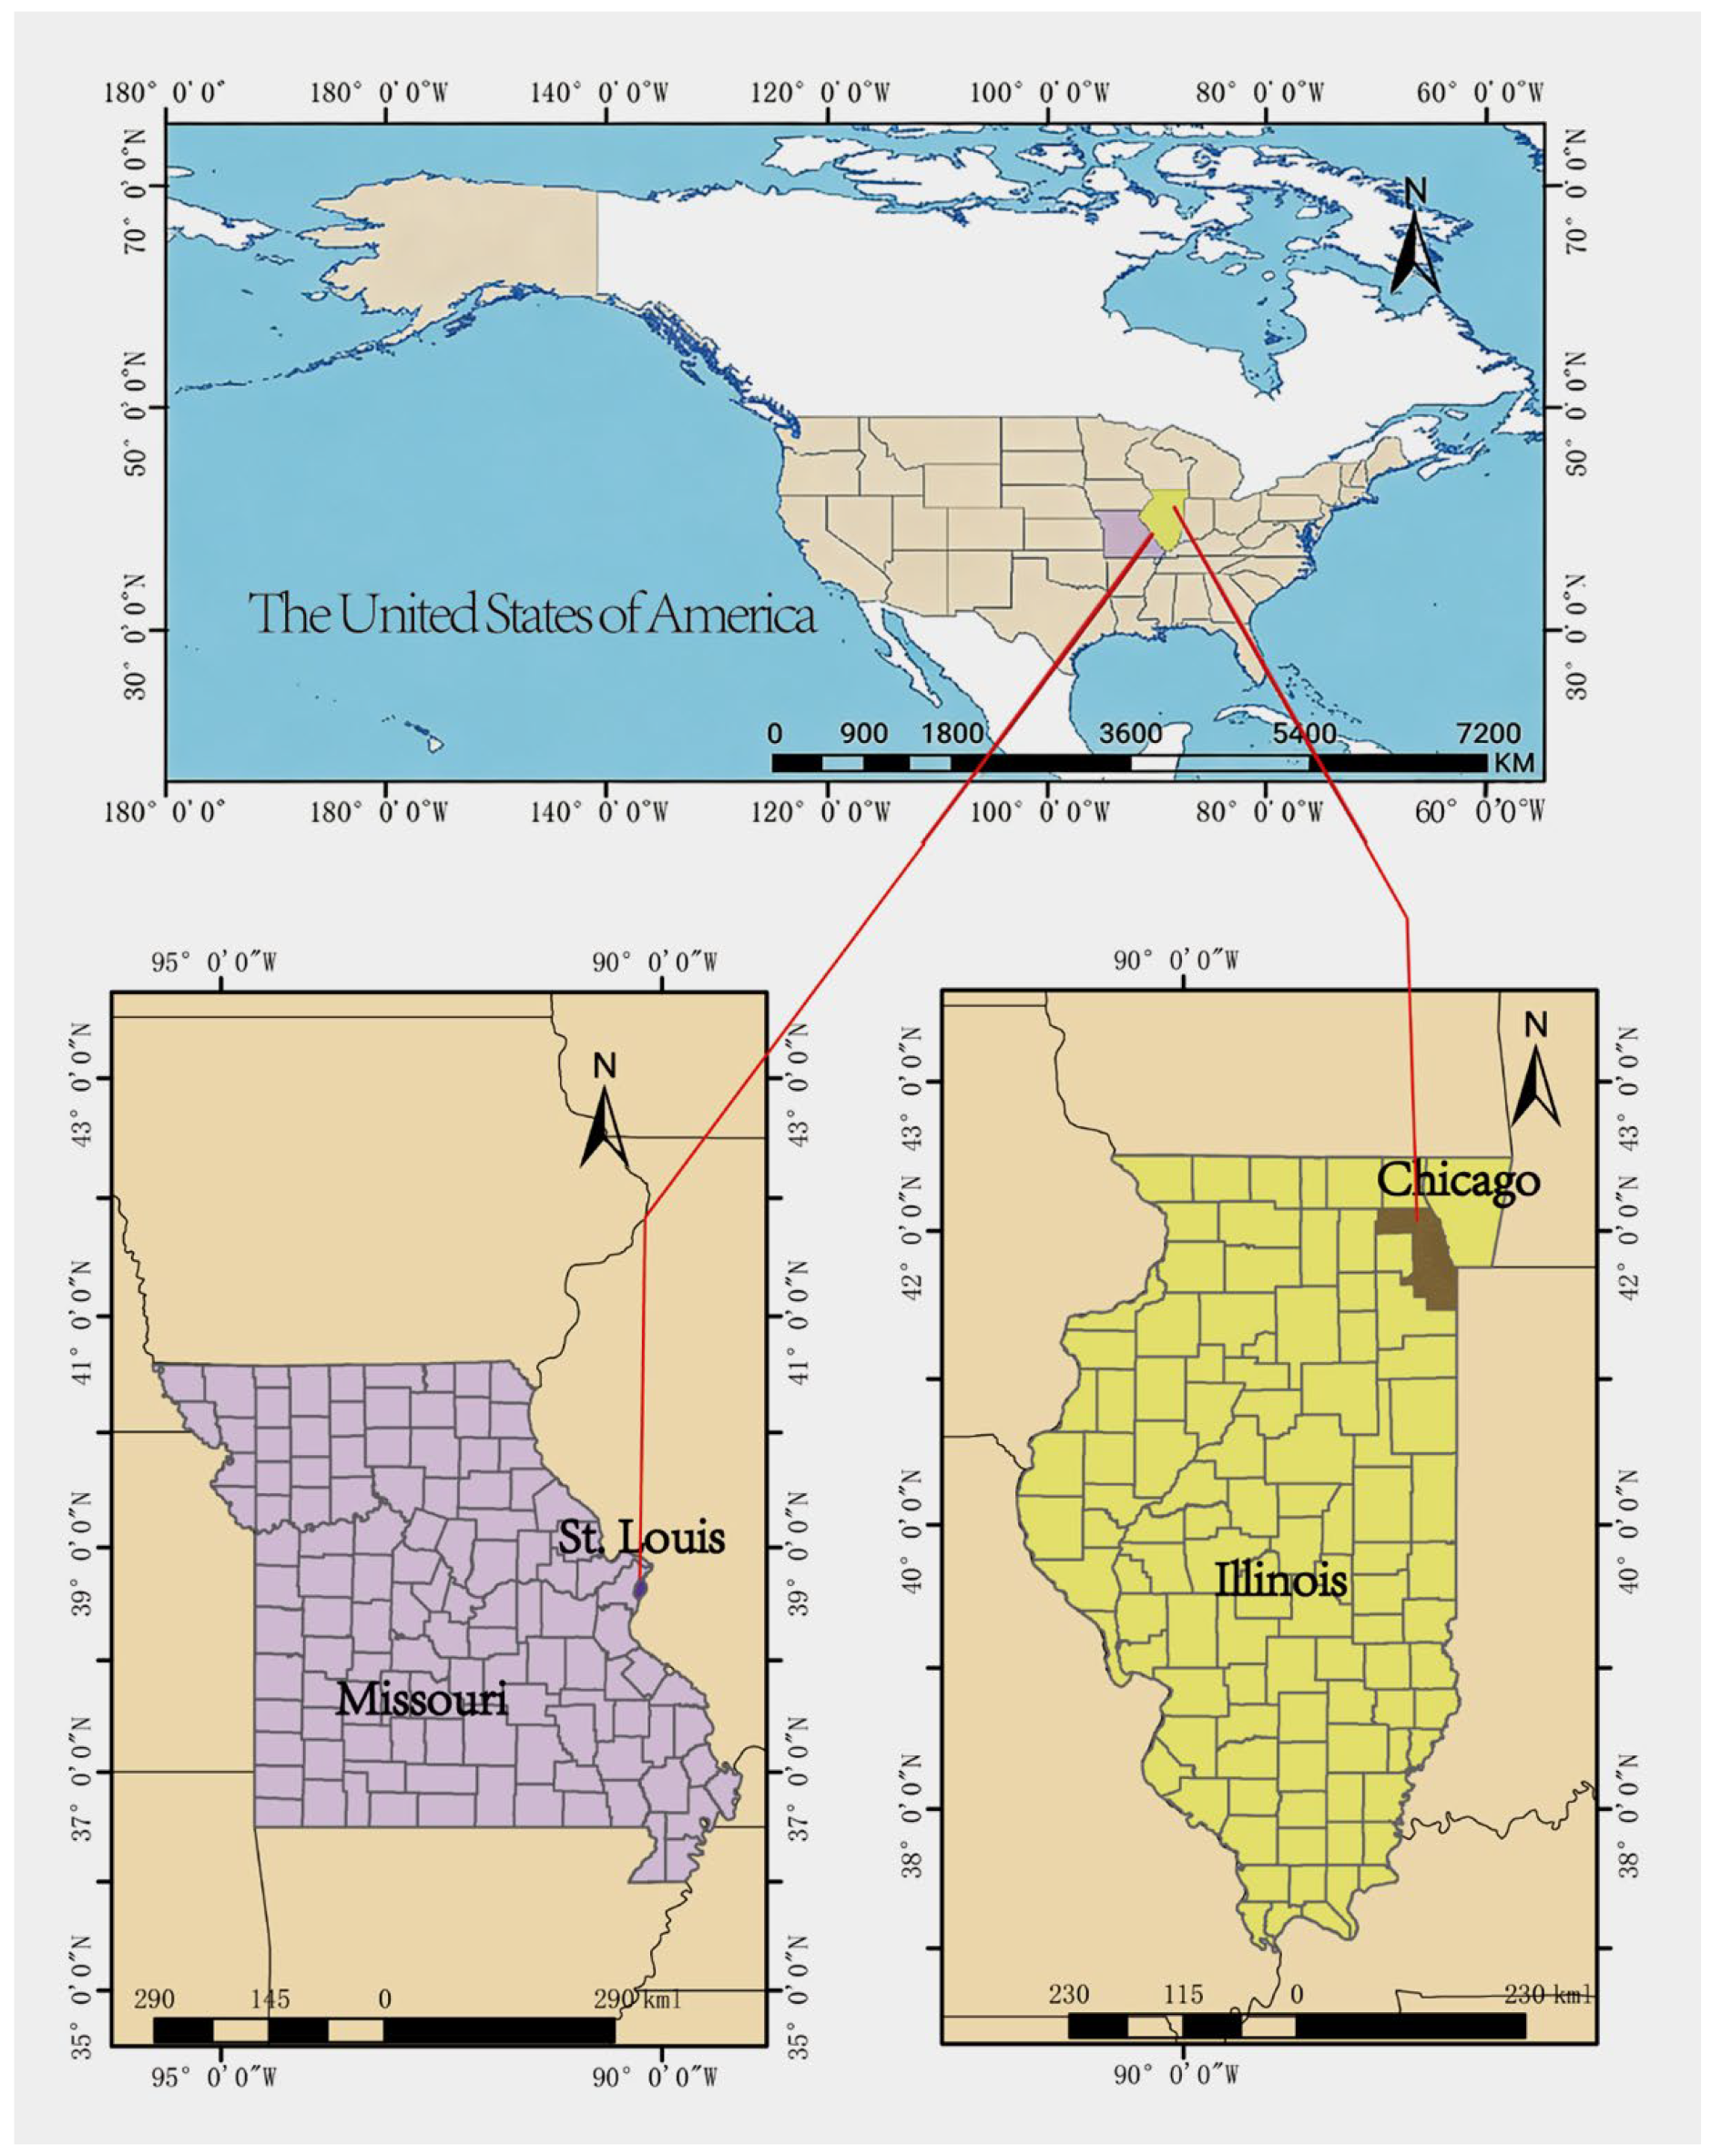
This study selected two representative cities in the U.S. Midwest—St. Louis and Chicago (
Figure 1)—to evaluate the applicability of the Frontal Area Index (FAI) method in this region and conducted on-site validation.
2.1.1. St. Louis Site
St. Louis, located in Missouri, lies near the geometric center of the United States and is known as the “Gateway to the West.” It sits at the confluence of the Mississippi and Missouri Rivers, serving as a major inland port that connects 20 states. Historically, St. Louis was the fourth-largest industrial city in the U.S. At the time of the study, its urban population was approximately 300,000, while the metropolitan area had a population of 2.85 million and a GDP of about
$240 billion, ranking 18th among U.S. metropolitan areas. The city’s terrain was relatively flat, with an elevation variation of no more than 20 m. High-rise buildings were concentrated in the downtown area, similar to cities such as Kansas City and Memphis. The selected study area, located in the city center, covered approximately 3 square kilometers (2 km wide and 1.5 km long), featuring a mix of high-rise and low-rise buildings, with low-rise structures accounting for about 7% (
Figure 2).
2.1.2. Chicago Site
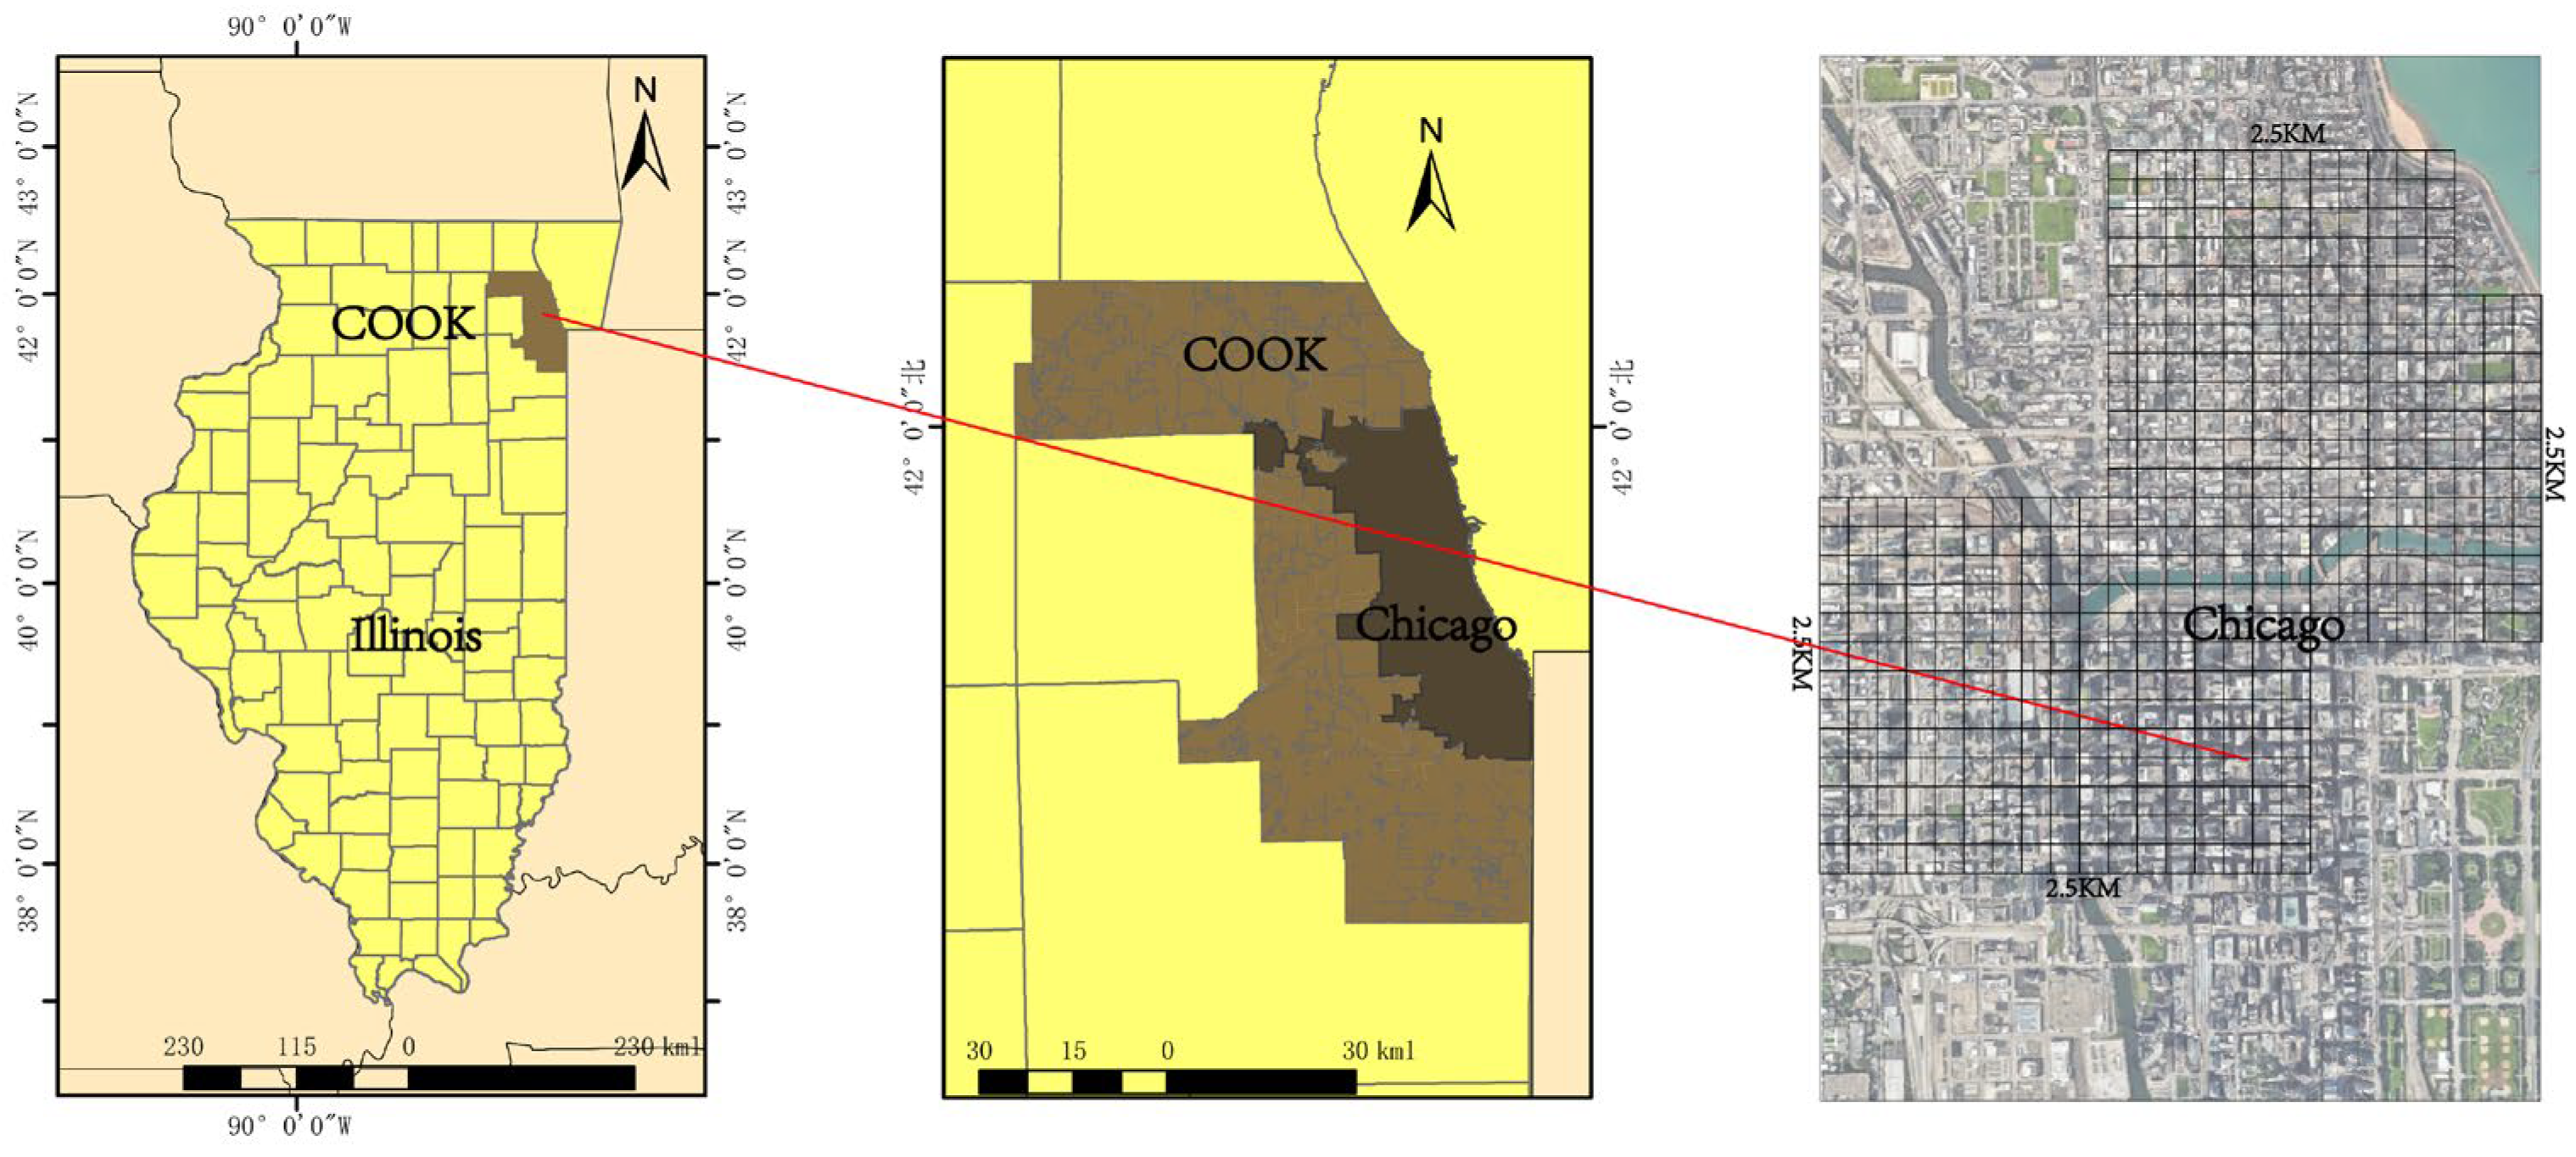
Chicago, situated in Illinois, was the third-largest city in the U.S., following New York and Los Angeles. The city had a population of approximately 2.8 million, with a GDP exceeding
$550 billion. The Chicago metropolitan area had nearly 10 million residents and a GDP of about
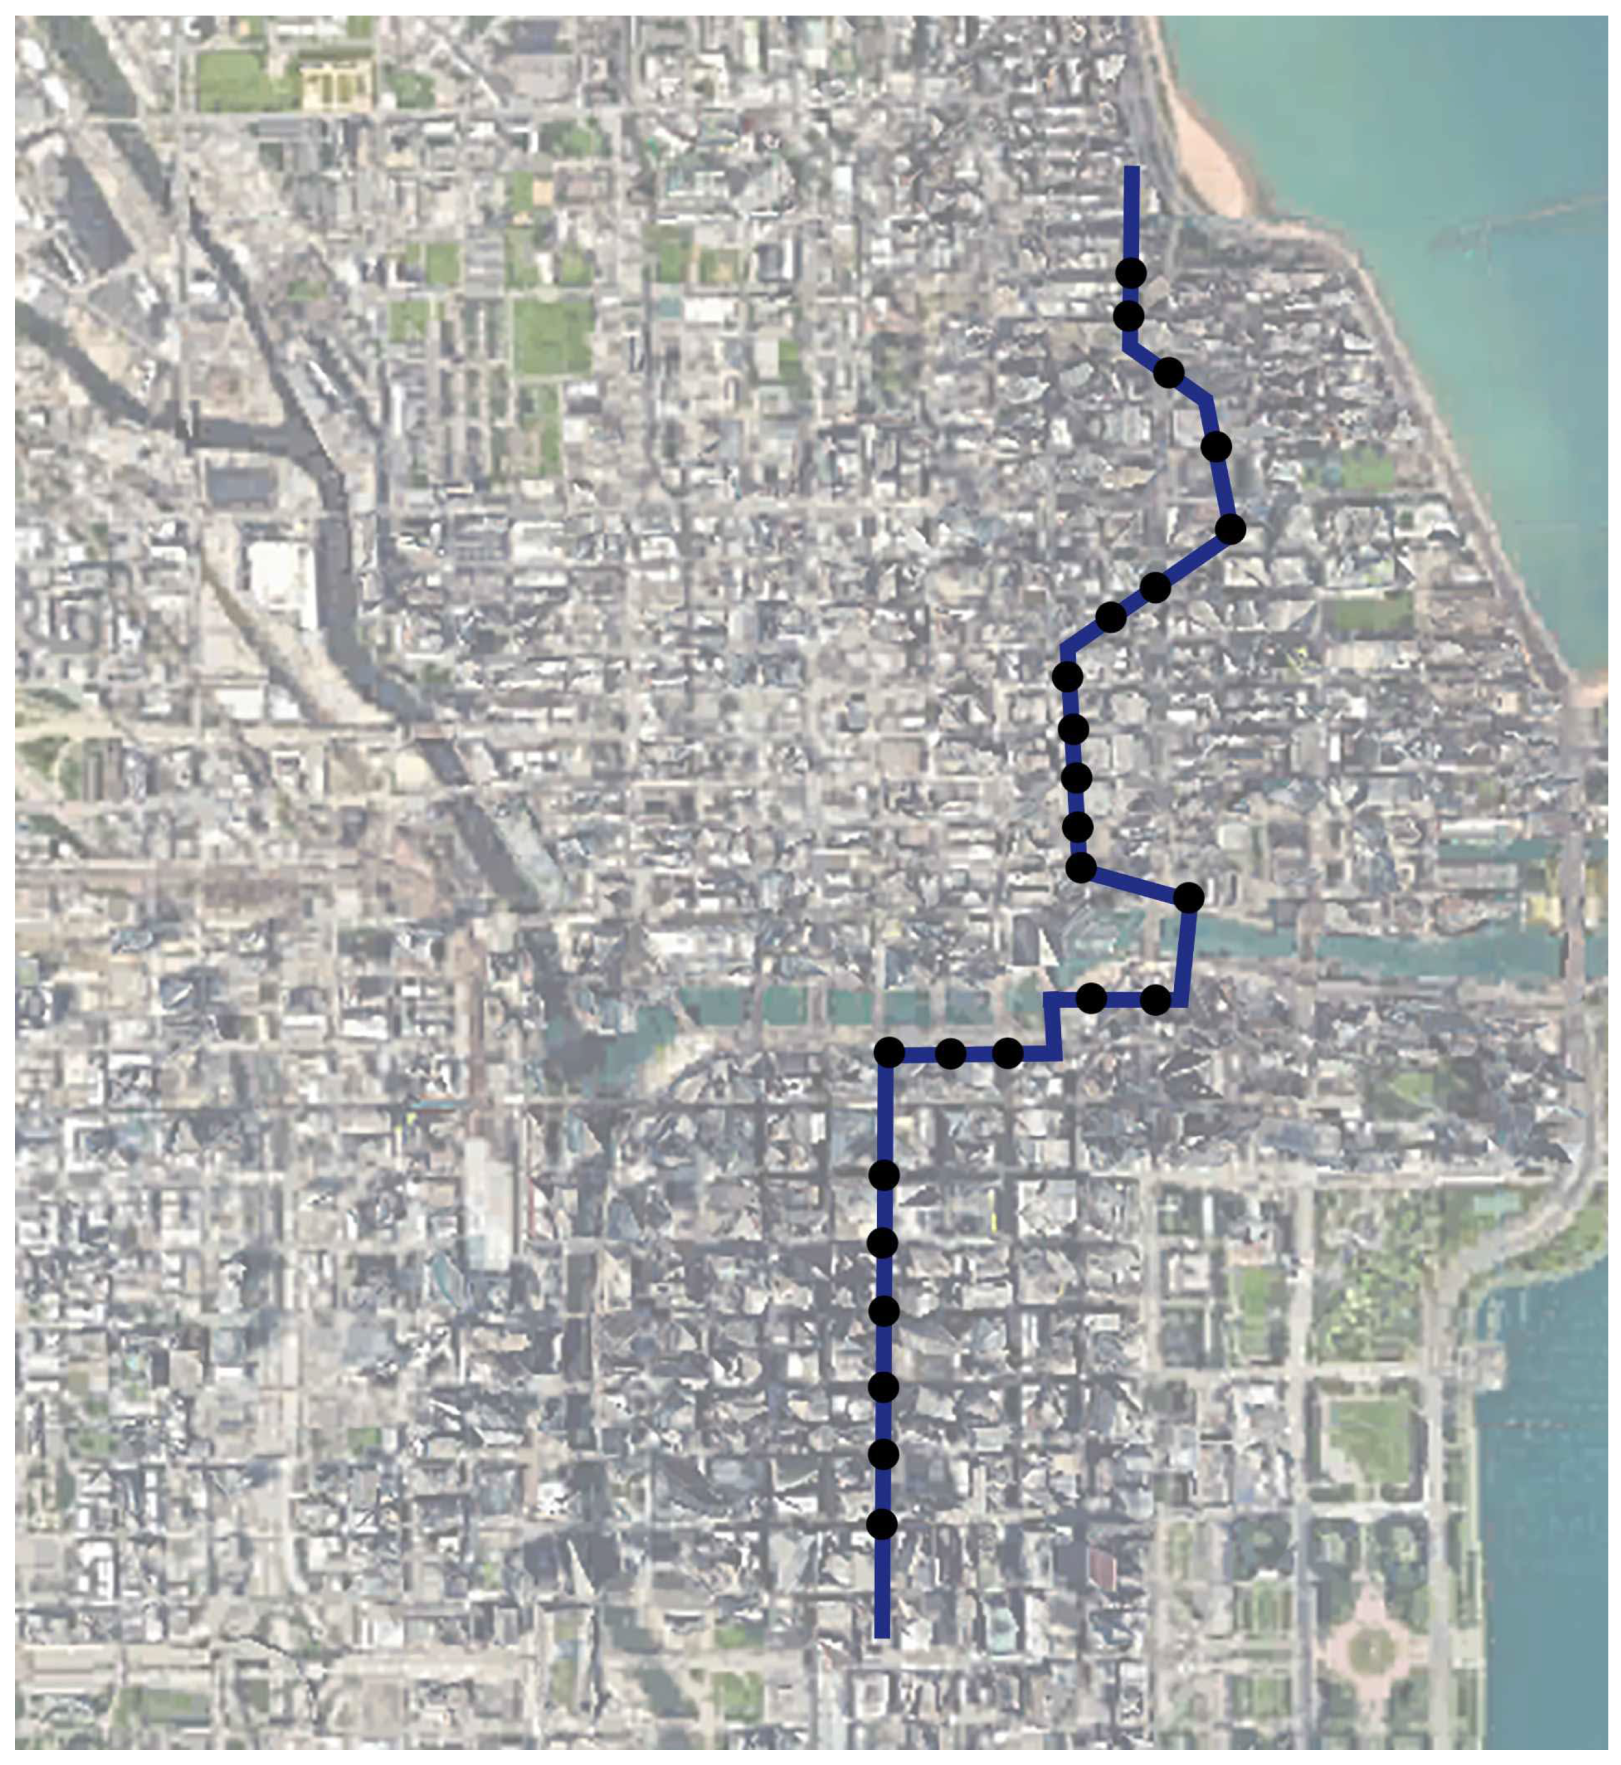
$750 billion, making it the third-largest metropolitan area in the country and the primary economic hub of the Midwest. Like St. Louis, Chicago had a relatively flat topography, with an average elevation of 176 m. The downtown area was dominated by high-rise buildings, while the outskirts featured a mix of mid-rise and low-rise structures. The study area, located in the city center, spanned 4.76 square kilometers (2.5 × 2.5 km) (
Figure 3).
The study aimed to identify ventilation corridors in these two cities and validate the accuracy of the FAI method through field measurements. The findings provided empirical support for the applicability of FAI in the U.S. Midwest and explored potential refinements to improve its accuracy. Additionally, the results served as a reference for urban planning in other Midwestern cities and regions with similar urban morphologies.
2.2. Date Source
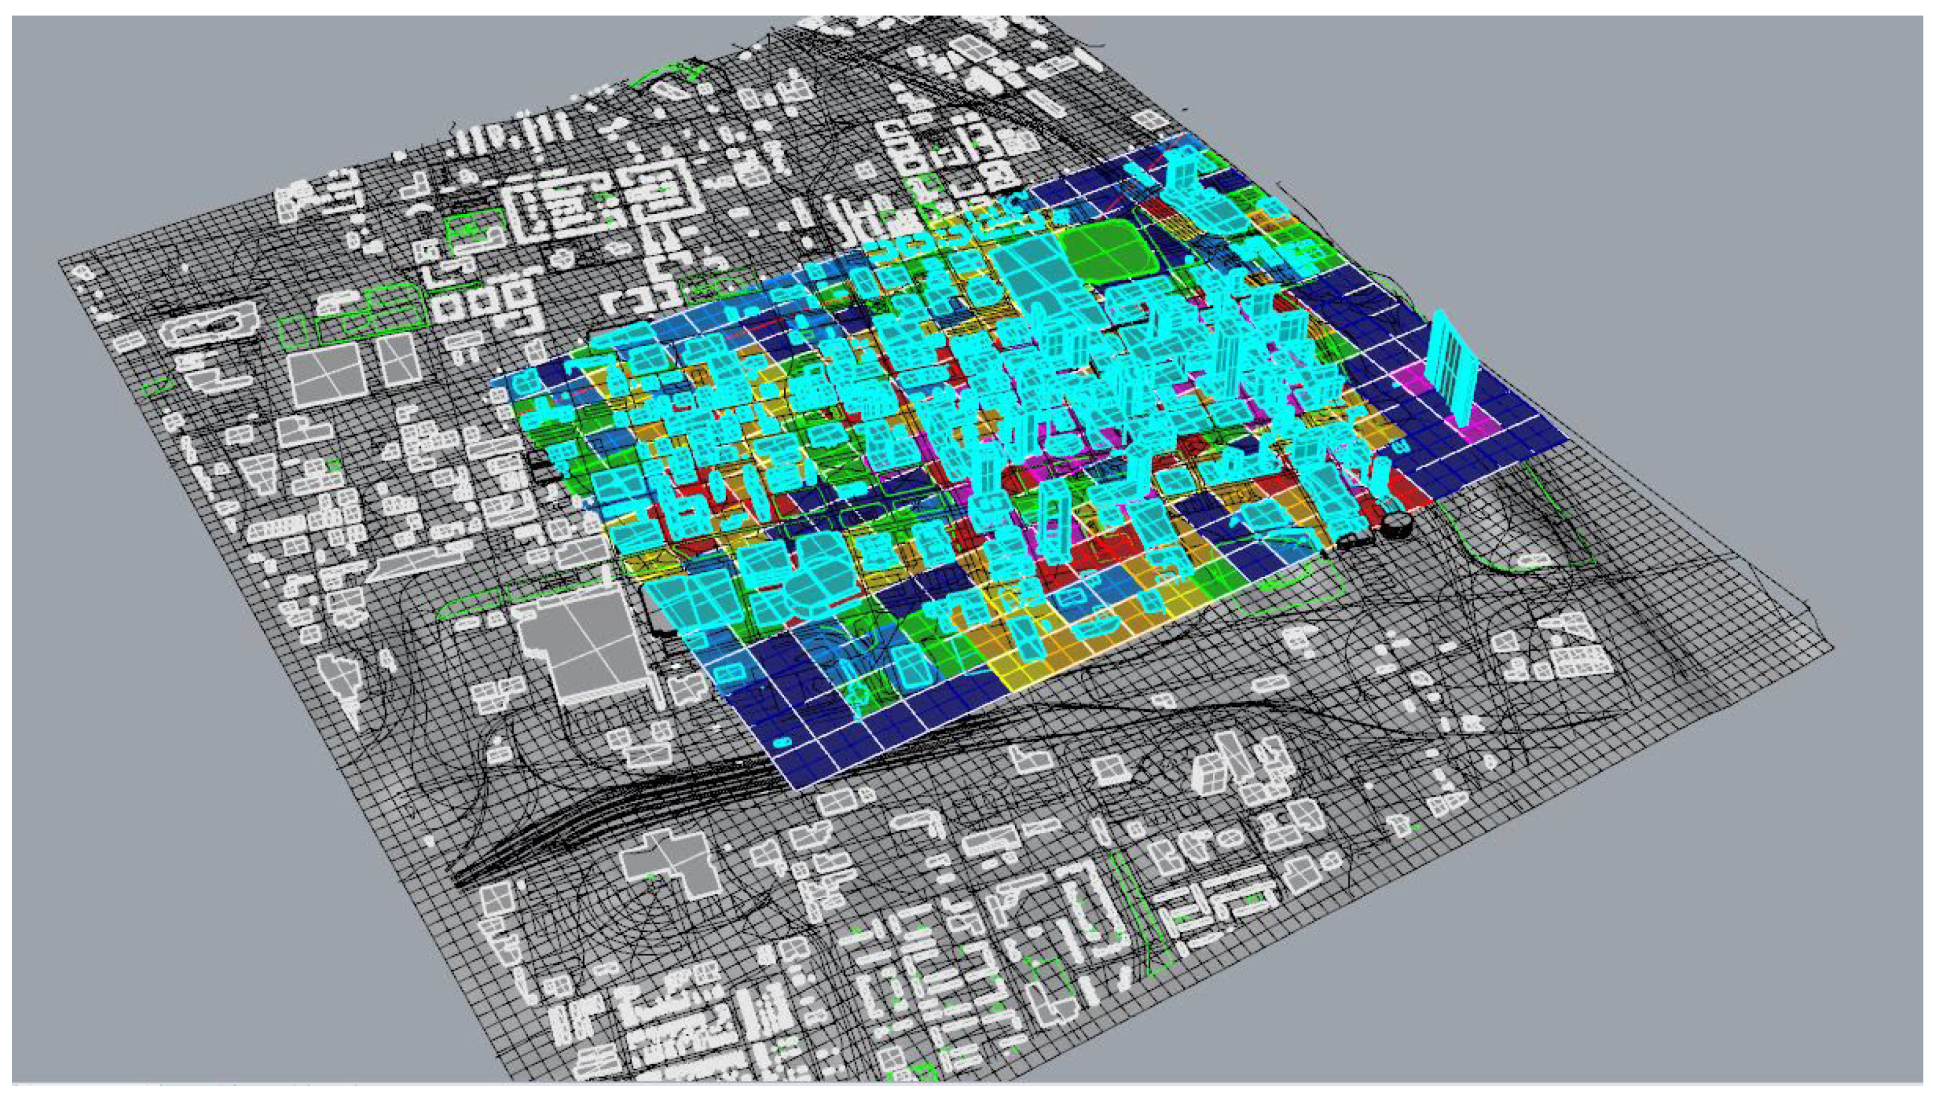
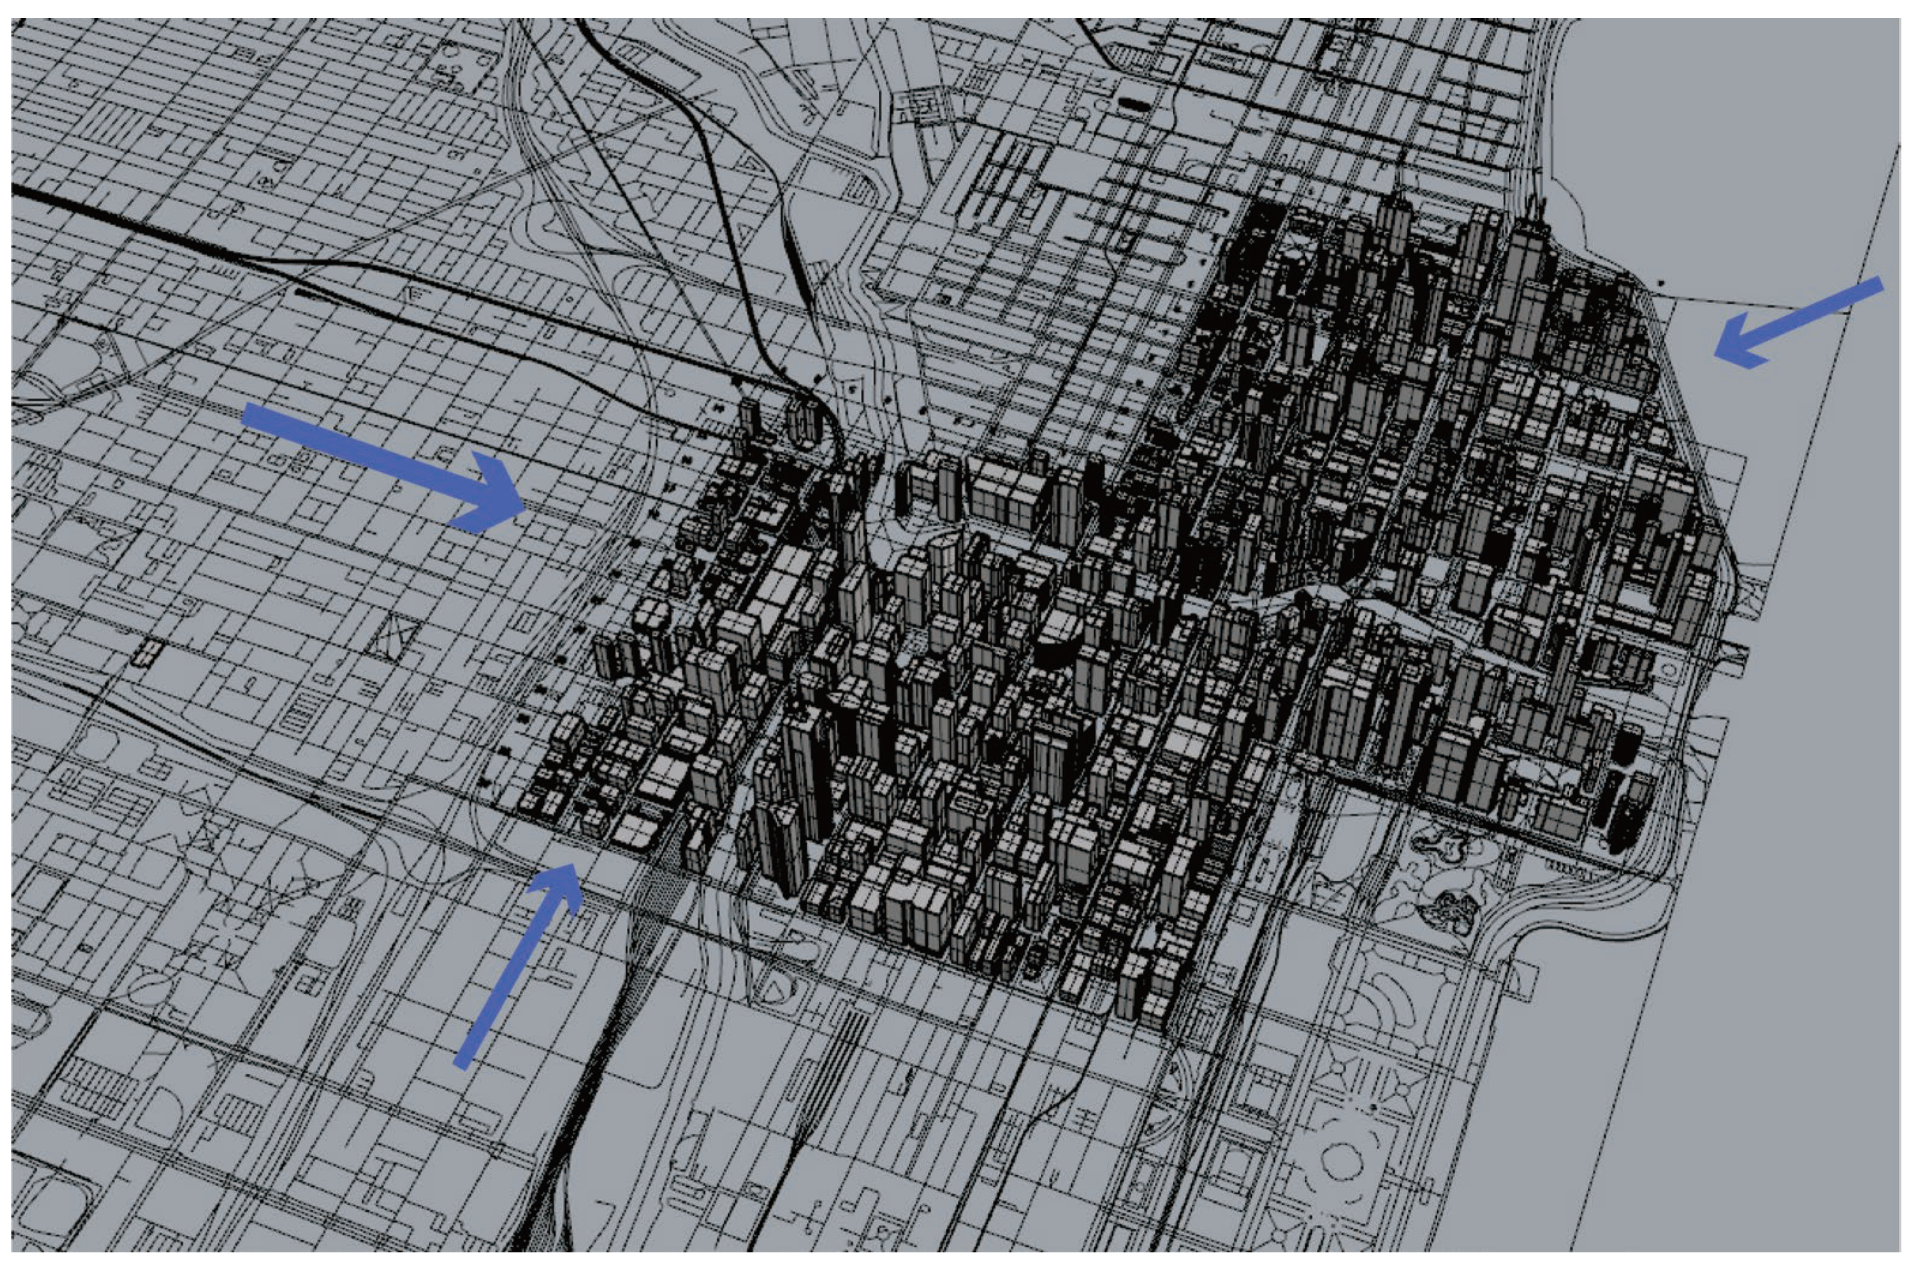
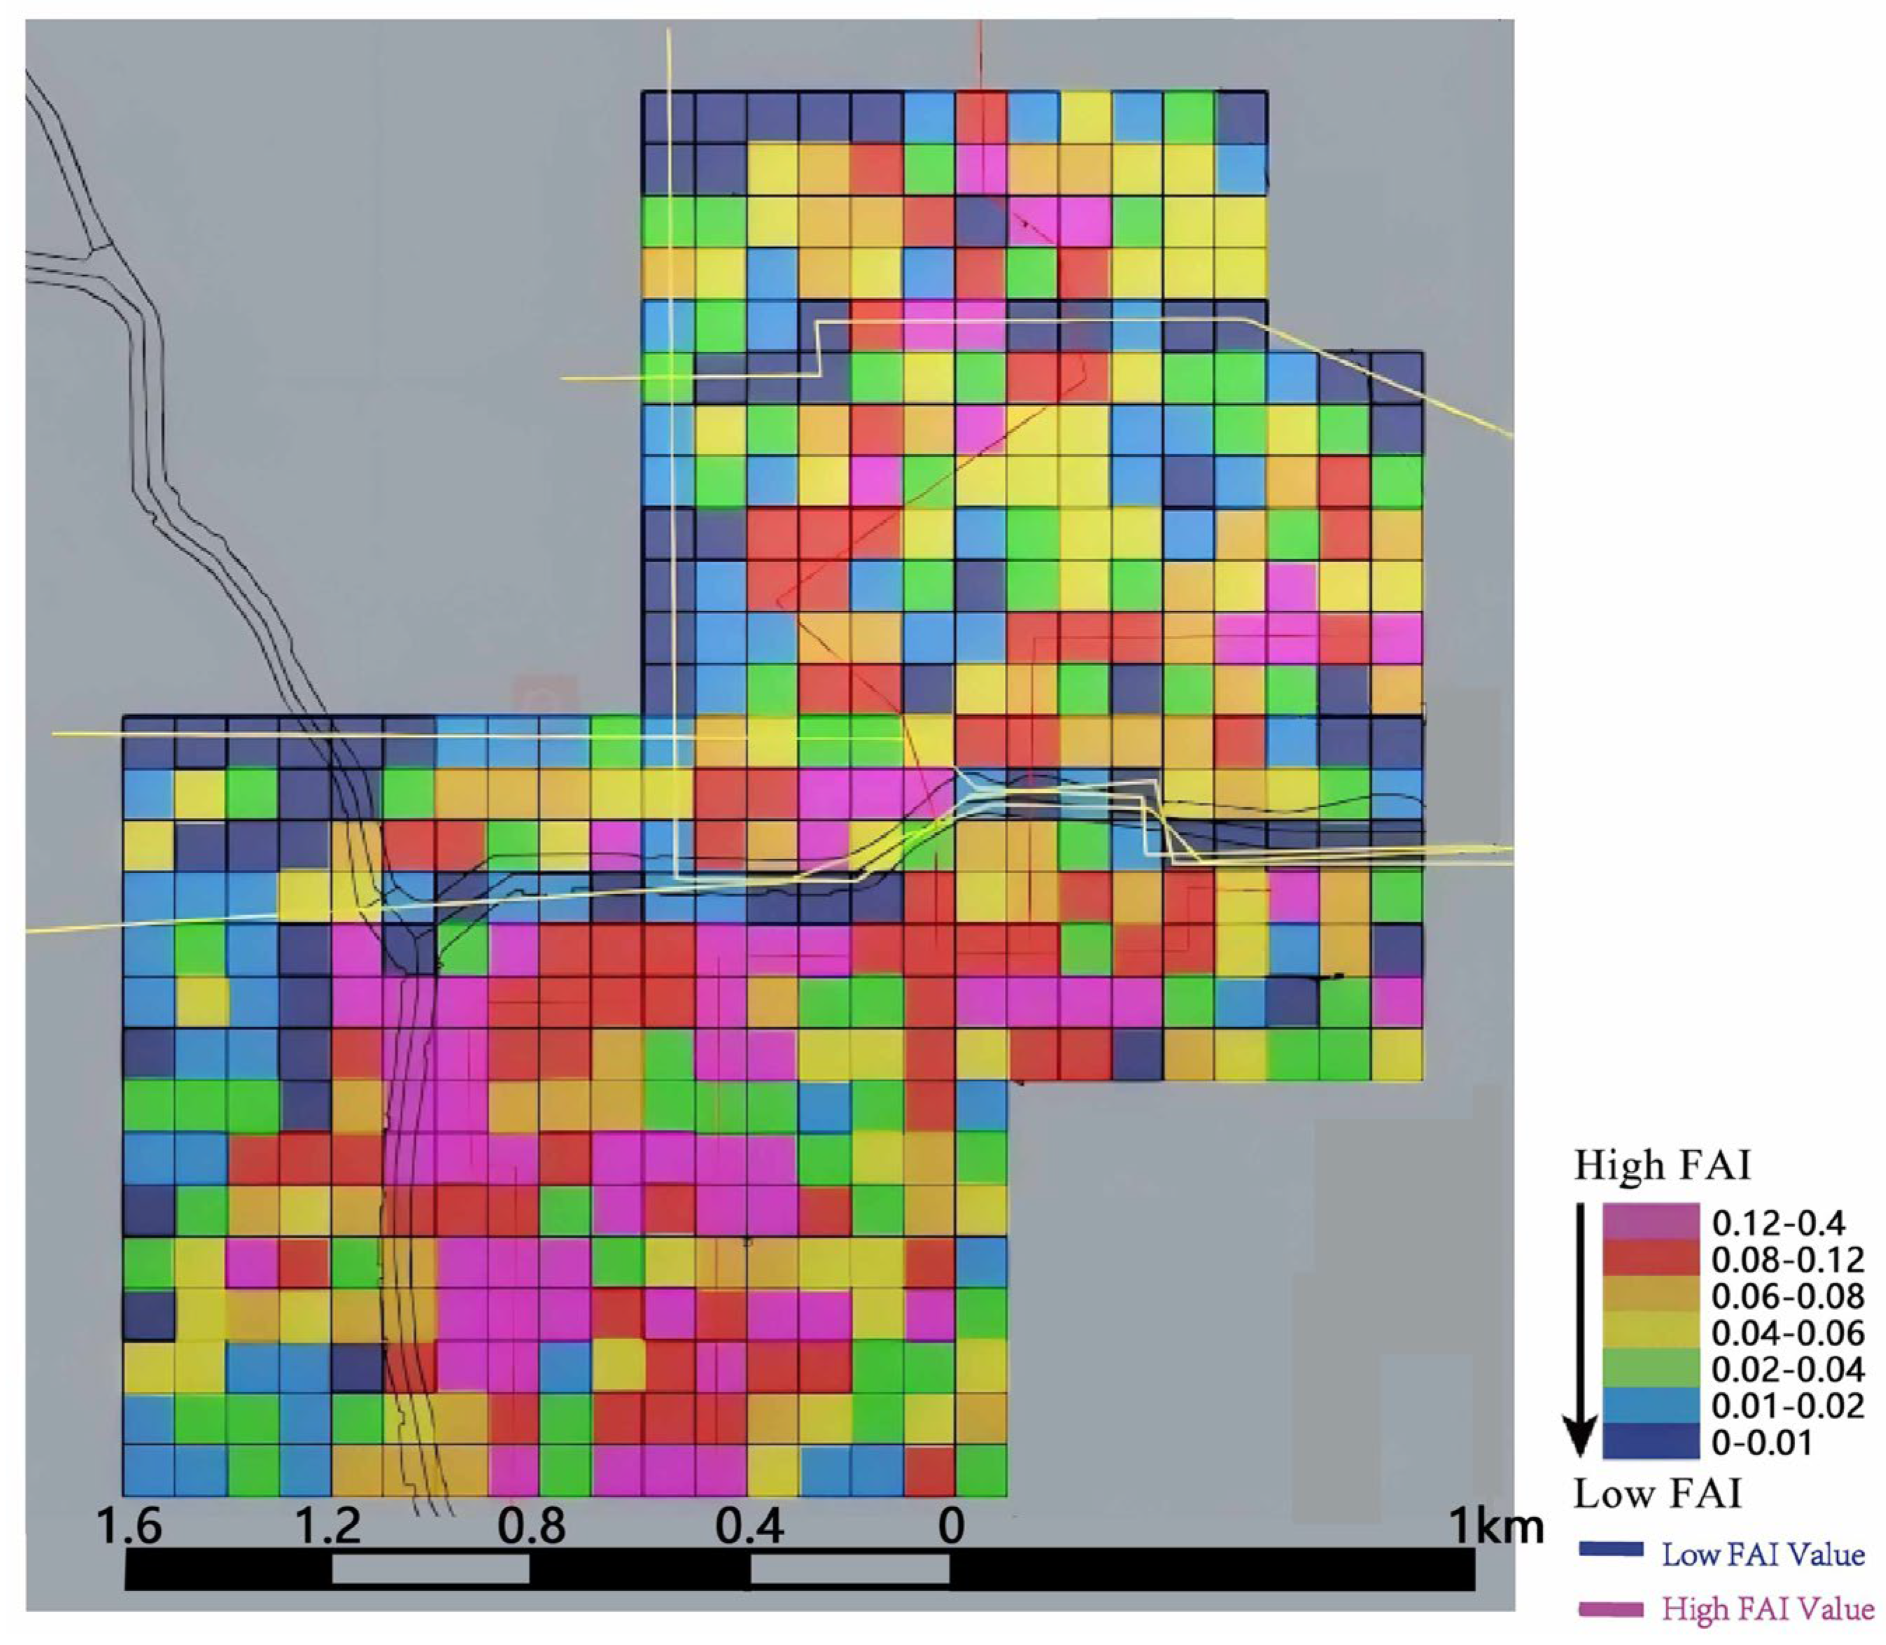
The data used in this analysis were primarily divided into two parts. The first part consisted of the 3D models of St. Louis (
Figure 4) and Chicago (
Figure 5), which were required for the FAI calculations. These models were obtained on October 9, 2019, based on geographic information system (GIS) data and paid data from OpenStreetMap. (
https://www.openstreetmap.org). Weather data for both cities were sourced from the U.S. National Renewable Energy Laboratory (NREL), specifically from the “Typical Meteorological Year version 2” datasets, which includes data from 238 locations. This dataset provided the primary wind direction data used in the FAI calculations.
The second part involved field measurements of weather data collected at the identified ventilation corridors in both cities. These measurements were used to validate the FAI results and assess the accuracy of the identified ventilation corridors.
2.3. FAI Calculation Methodology
The 3D building models obtained from OpenStreetMap were imported into Rhinoceros 6, where all geometric operations required for FAI computation were performed. Custom scripts within Rhino were used to calculate the projected frontal area for each grid cell and to generate the FAI values. This workflow ensured consistent spatial handling and reproducible geometric calculations across both study areas.
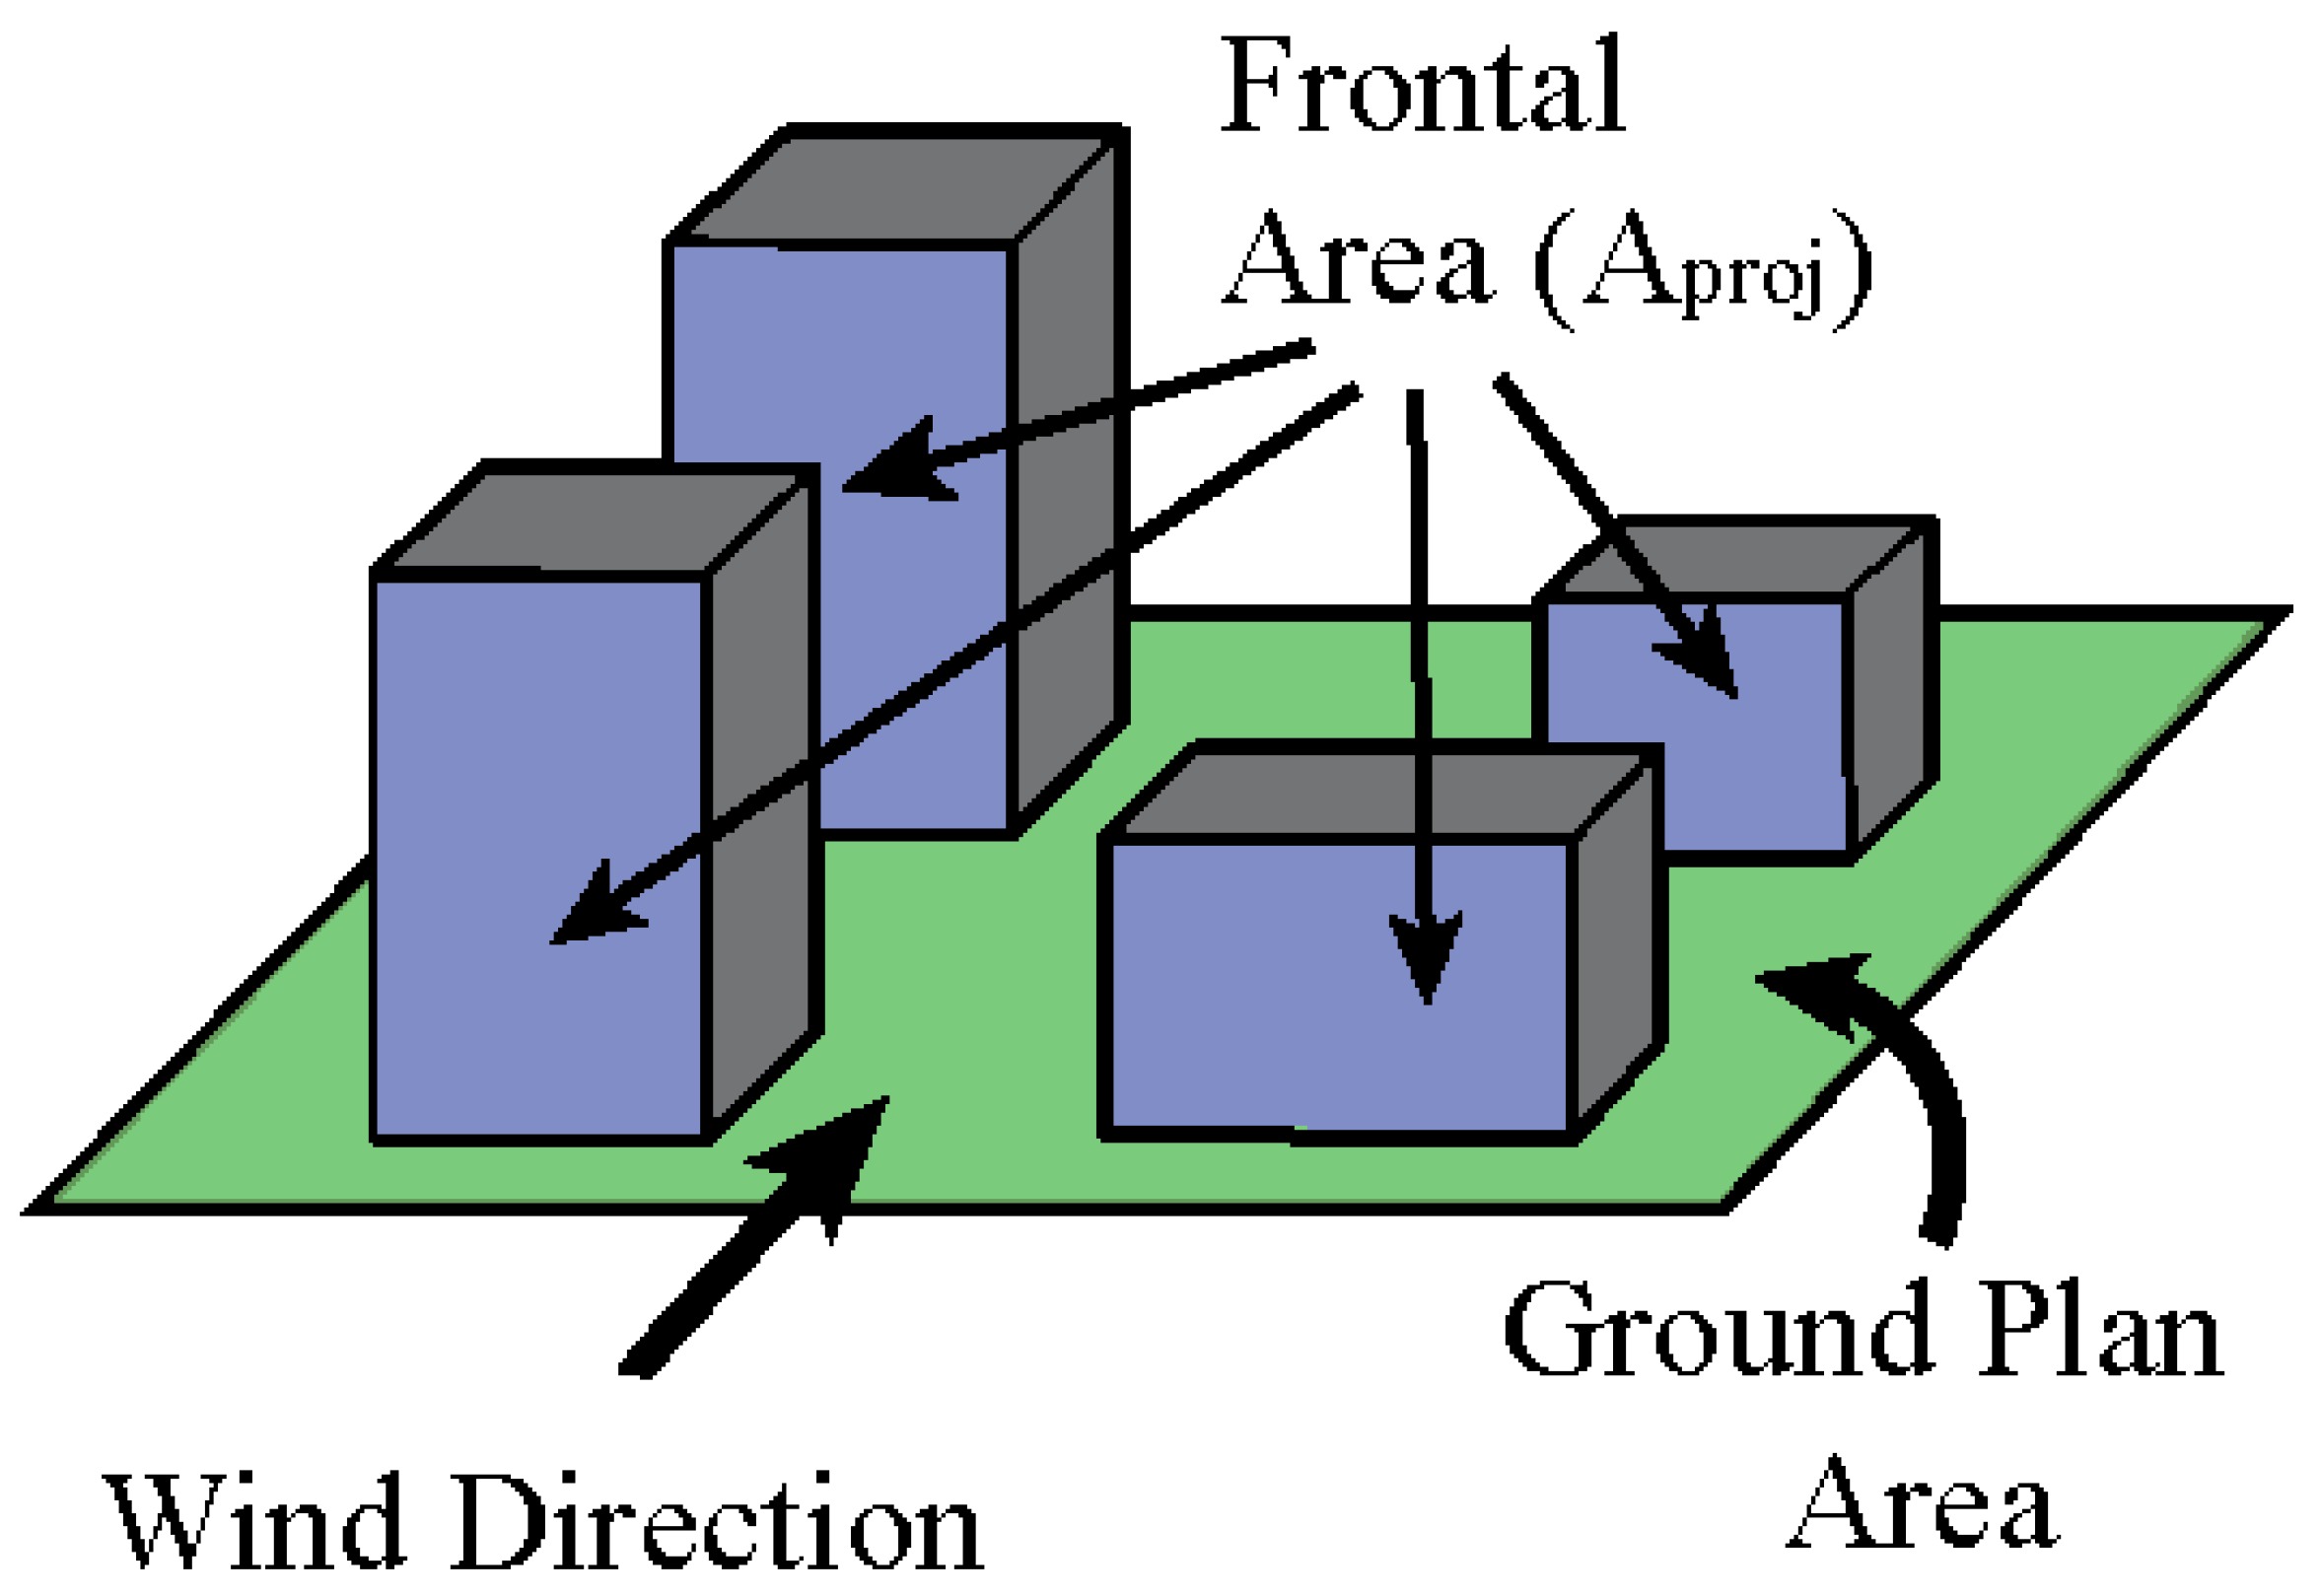
The principle of the Front Area Index calculation shows in
Figure 6. As Equation (1) shows, the Frontal Area Index (λf) is defined as the total area of building surfaces in the projected plane facing a specified wind direction divided by the plane area of the study site [
18,
23].
Figure 4 shows where θ is the wind direction.
2.4. Choosing the Cell Size
The issue of spatial resolution for air temperature estimation has been critically examined [
32]. For the grid size, the study areas were divided into uniform 100 m × 100 m cells, with each cell representing the plane area of the study site in the FAI calculation. Wong et al. (2010) [
18] selected a 100 m × 100 m grid, following Nichol et al. (2008) [
32], who criticized the use of larger grids, such as the 200 m × 200 m, due to its lower accuracy. This grid size is widely used in urban ventilation studies, balancing resolution and computational efficiency.
Previous research, including studies by Xu and Gao (2022) [
29], has emphasized that the resolution of FAI maps is critical for accurately assessing urban ventilation, as it directly affects the precision of results. For example, Frey and Parlow (2008) [
33] recommended a resolution between 75 m and 125 m in Cairo. When using satellite-derived urban morphological parameters, coarser resolutions, such as 600 m, may better predict urban morphology. However, Xu recommended a 200–300 m scale for improved prediction accuracy while preserving high resolution. These studies suggest that the optimal resolution varies based on the urban context and data sources.
Given these considerations, the 100 m × 100 m grid was chosen for this analysis to achieve a precise evaluation of urban wind corridors. However, it is important to acknowledge that the choice of grid size may still present limitations and warrants further evaluation in future studies to refine the accuracy of ventilation corridor identification.
2.5. Choosing Wind Direction
The next step was selecting the wind direction to use in the FAI calculation. Based on the prevailing wind patterns in both St. Louis and Chicago, we focused on the west wind, which is the dominant wind direction in these cities. This decision aligns with methods used in other studies [
23], where the primary wind direction was prioritized for the analysis. By selecting the appropriate wind direction, we ensured that the FAI calculation accurately reflected the influence of local winds on urban ventilation.
2.6. Mapping the Frontal Area Index
We calculated the Frontal Area Index (FAI) using a method based on established FAI calculation principles. After obtaining the FAI values, we needed to determine how to group these values for display purposes. In previous studies, FAI values were often divided into groups based on arithmetic progression, with distinct colors representing different wind speeds. However, in the case of St. Louis and Chicago, there is a significant range between the largest and smallest FAI values. If we applied the same approach used in other studies, most of the grid cells would be assigned the same color, making it difficult to distinguish between different wind speeds and resulting in an inaccurate representation of the data.
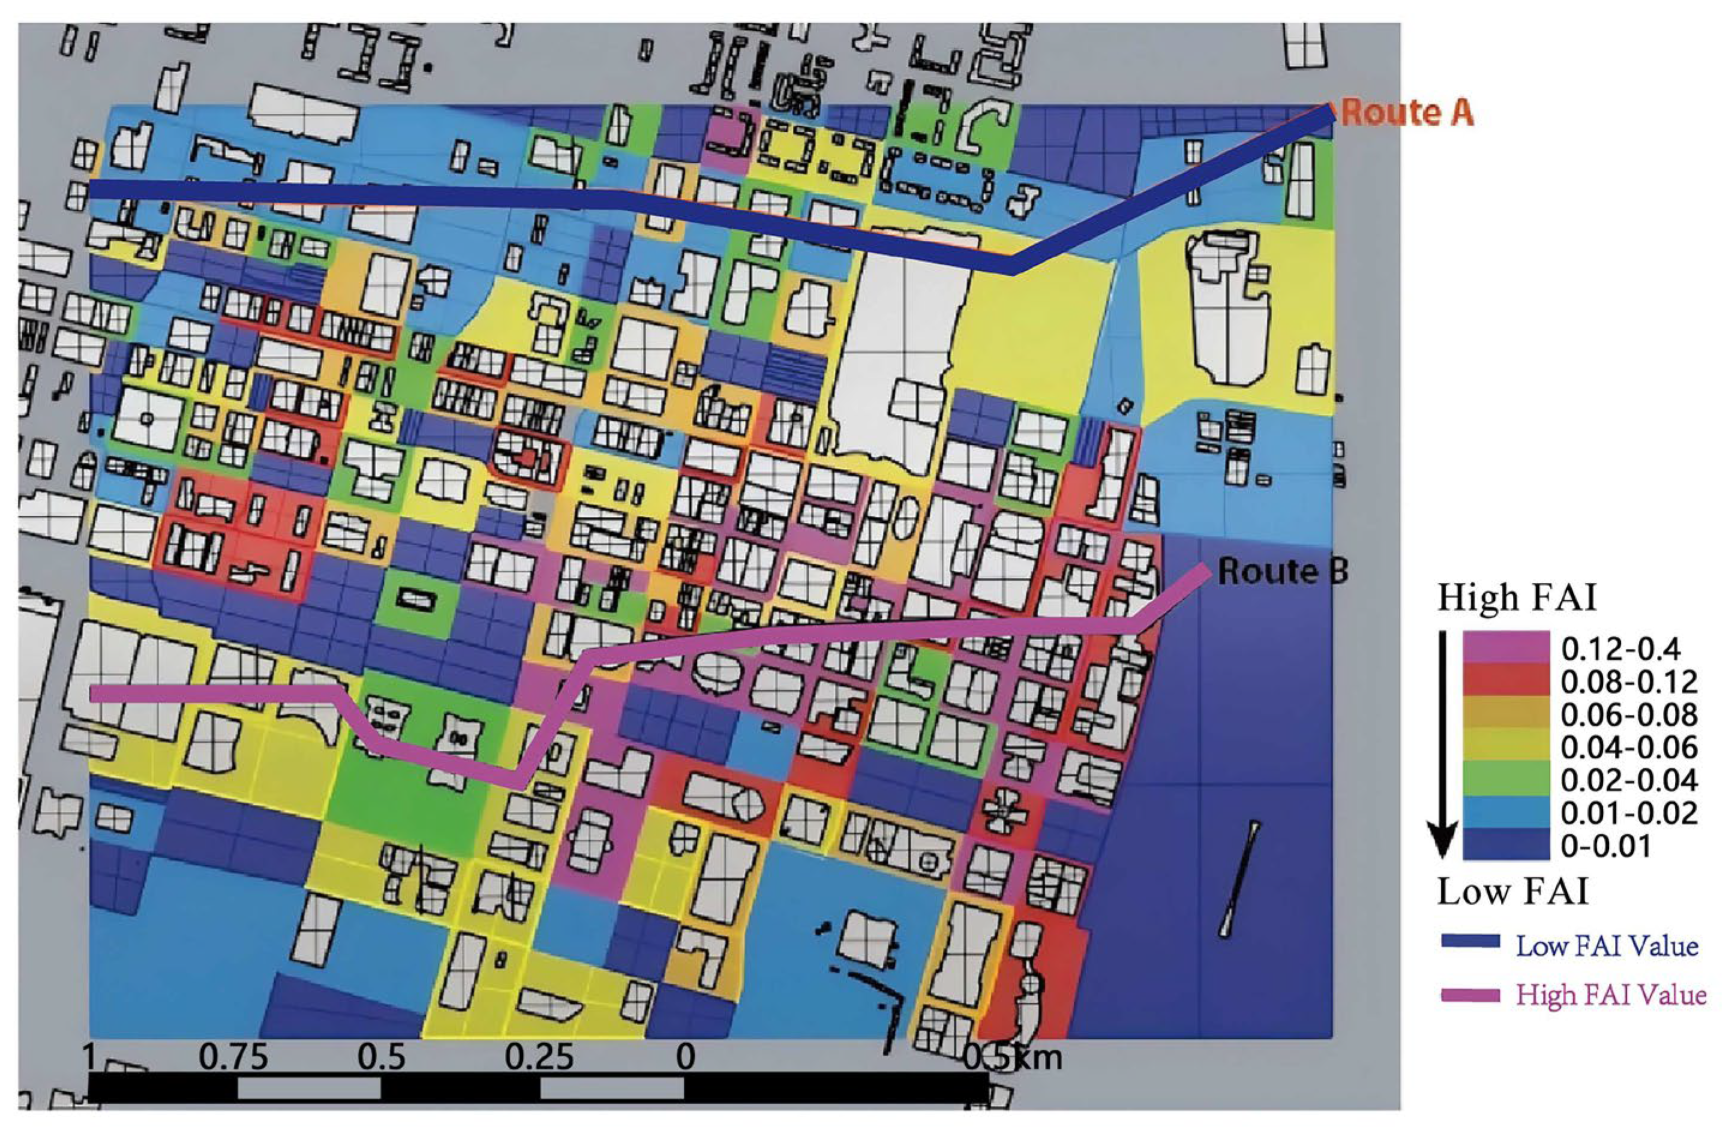
To address this, we divided the FAI values into seven groups by averaging the values within each group, ensuring an even distribution of data. This method allowed for a more meaningful separation of cells based on building heights and wind resistance, without significantly affecting the comparability of the results. The seven groups, each represented by a different color, correspond to different levels of wind resistance and facilitate a clearer interpretation of the study area’s wind corridors. The darker the color is, the faster the wind speed is; the closer the color is to red, the slower the wind speed is.
2.7. Least-Cost Path
Ventilation routes were identified exclusively through analytical interpretation of the FAI maps.
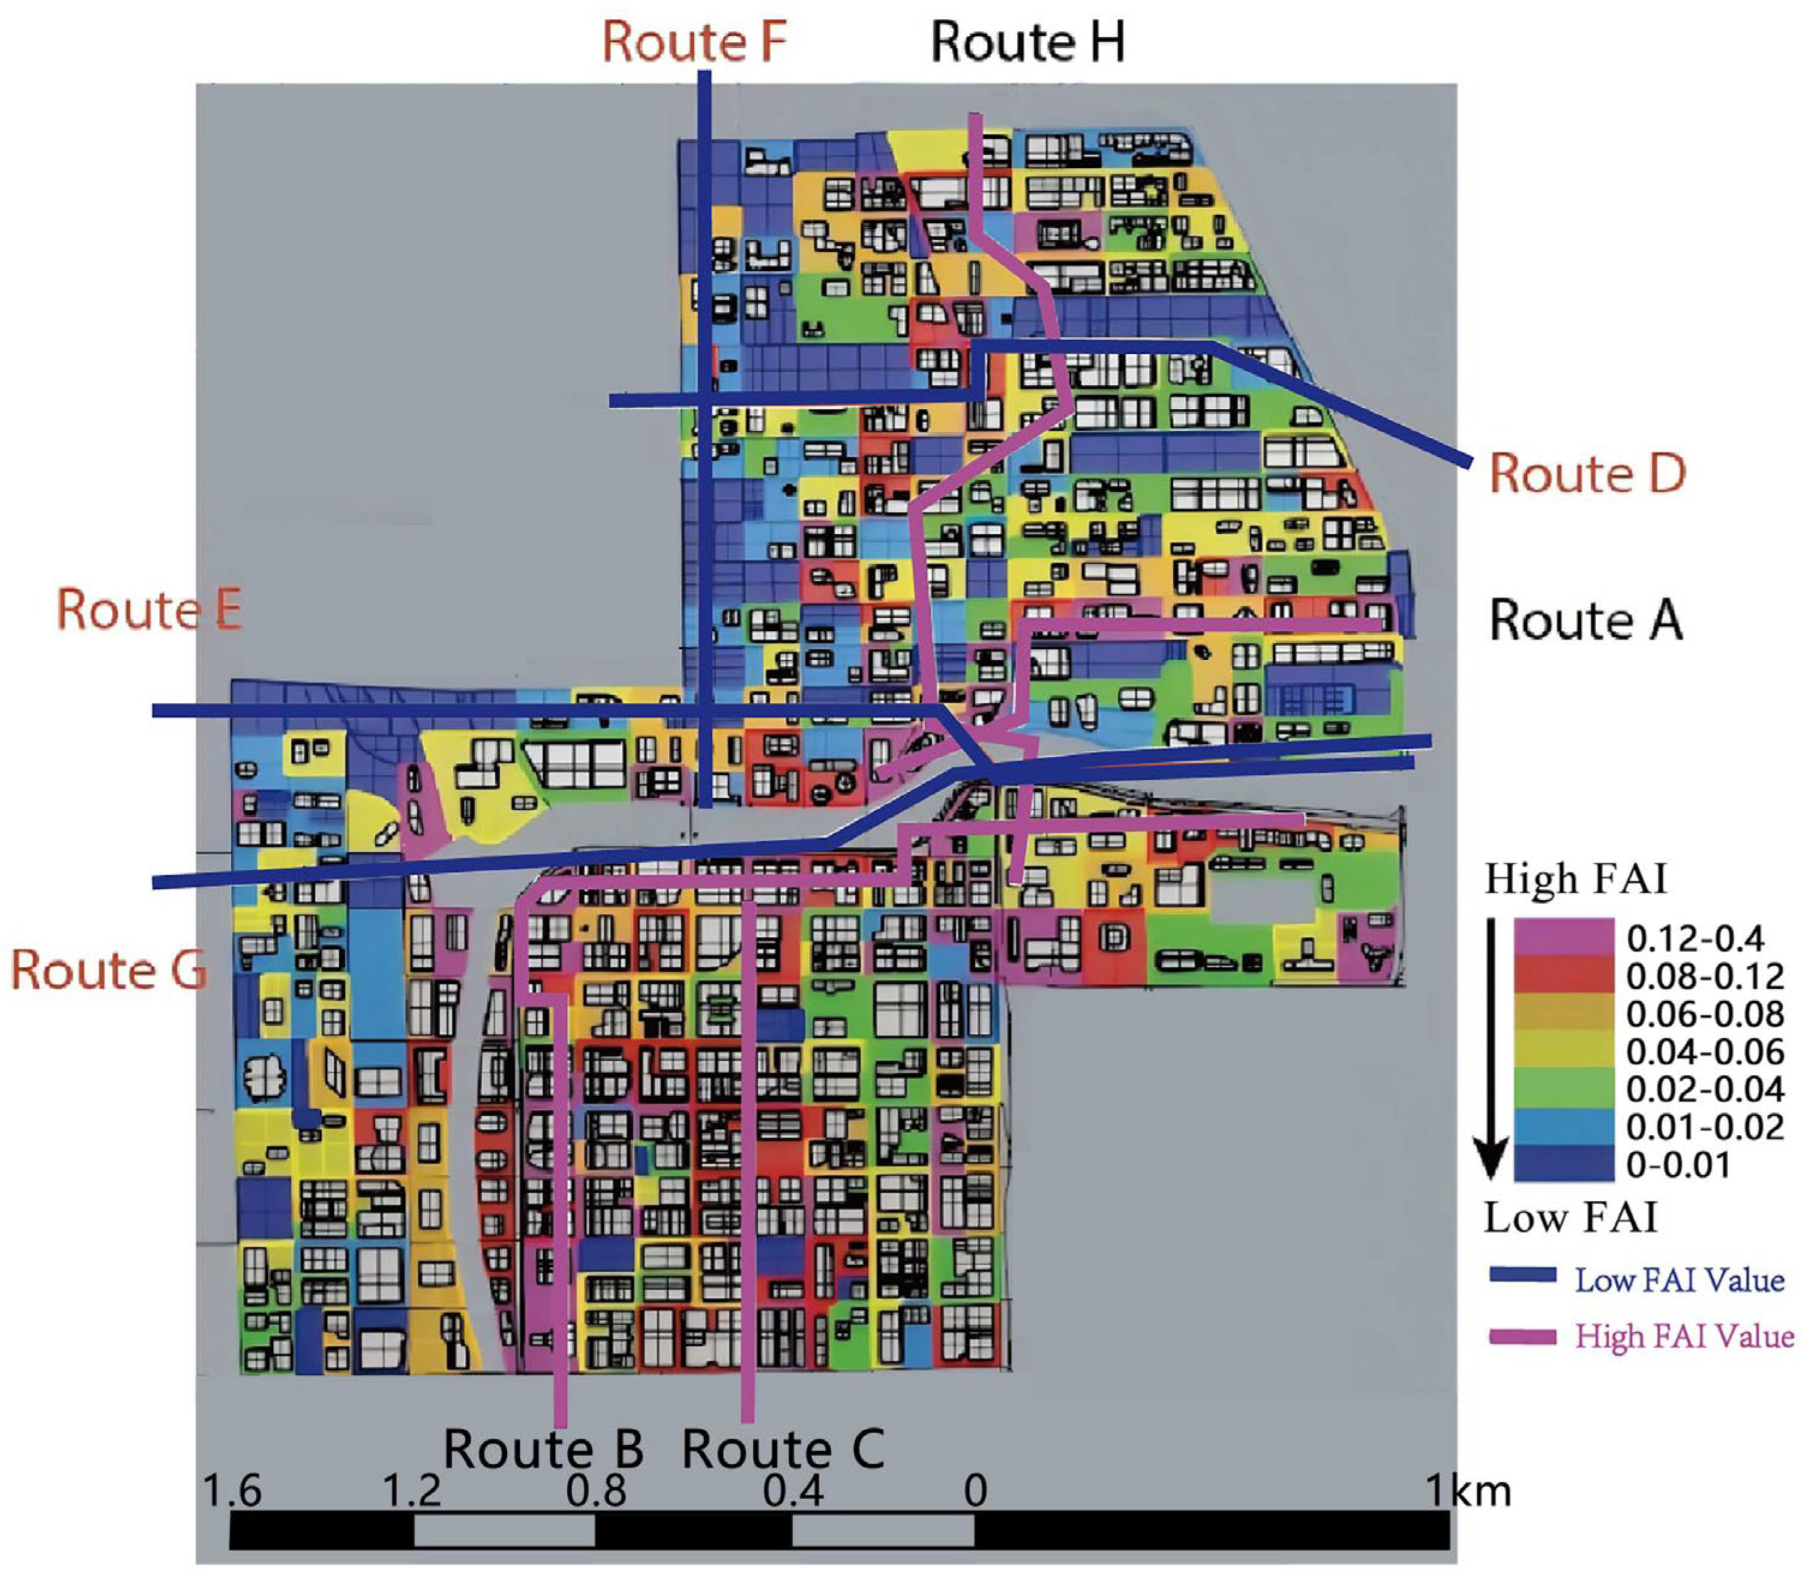
Low-FAI routes were defined as pathways formed by consecutively low frontal-area cells, representing predicted low-resistance ventilation corridors, while high-FAI routes were selected from clusters of consistently high frontal-area cells. Field measurements were conducted after this analytical selection to validate, rather than determine, these corridors.
After mapping the FAI diagram, the varying wind speeds passing through each cell in the study area became apparent. Connecting cells with low FAI values revealed the path of least cost (resistance). These least-cost paths, or urban ventilation corridors, indicate routes that pass through the center or central parts of the study area with lower FAI values. These paths represent areas of least wind resistance, contributing to optimal urban ventilation. Planning system perspectives emphasize the role of structured ventilation corridors in urban design [
34]. Conversely, paths with higher FAI values indicate areas of higher wind resistance, representing more difficult ventilation paths, where air flow is obstructed or restricted.
2.8. Validation Strategy
While most existing validation methods rely on CFD simulations, wind tunnels, and other similar approaches, these typically have limited use of on-site measurements. In contrast, this study utilized on-site measurements, providing a more direct and accurate means of validating the urban ventilation corridors identified through the FAI calculations. This approach contributed to enhancing the precision of the findings.
To validate the results, two routes were selected in St. Louis: one representing a low-resistance path and the other a high-resistance path. In Chicago, eight routes were identified, including four low-resistance paths and four high-resistance paths, to test the wind speed along different ventilation corridors. In the field, both the maximum and average wind speeds were recorded for each path. The wind speed difference between the low-resistance and high-resistance paths was then compared. The accuracy of the model was assessed by determining whether the wind speed on the low-resistance paths was higher than on the high-resistance paths, as expected.
2.9. Field Measurement Protocol
To validate the FAI-derived ventilation corridors, on-site wind measurements were conducted in St. Louis and Chicago under controlled and comparable environmental conditions. This subsection provides detailed documentation of the measurement design, instruments, temporal settings, route selection criteria, synchronization measures, and data reliability considerations.
It should be noted that the FAI method does not involve numerical wind-flow simulation at a defined height. FAI is a purely geometric indicator calculated from the projected frontal area of buildings rather than from CFD-based wind modeling. In contrast, the field validation measurements were conducted at 1.5 m above ground, representing pedestrian-level wind conditions. This distinction ensures that while FAI maps reflect surface-level roughness, the validation is performed at a consistent and human-relevant measurement height.
2.9.1. Measurement Period and Weather Conditions
Field measurements were first carried out in St. Louis on 22 October 2019, between 10:00 and 12:00, during stable weather conditions and without precipitation. Measurements were conducted at a height of 1.5 m above ground, representing pedestrian-level airflow. Local meteorological records from the same period confirm relatively steady wind direction consistent with the prevailing west wind, as indicated by the NREL TMY2 dataset.
Two days later, measurements were replicated in Chicago during the same time window and under comparable meteorological conditions in order to minimize the effects of temporal variability. Selecting dates with similar temperature, wind direction, and synoptic background ensured that differences between the two cities could be attributed primarily to urban morphology rather than weather anomalies.
2.9.2. Selection of Measurement Locations
The selection of test locations was informed by two considerations.
First, St. Louis and Chicago represent two structurally different yet climatically comparable urban environments within the U.S. Midwest. St. Louis features a moderate-density downtown with relatively wide streets, aligning with the characteristics of many Midwestern cities. Chicago, by contrast, is a dense, high-rise metropolis comparable to Hong Kong in morphology—effectively a “scaled-up version” of the dense Asian urban form where FAI has traditionally been applied. Studying both cities therefore enabled an evaluation of FAI performance at two distinct urban scales, enhancing the generalizability of findings.
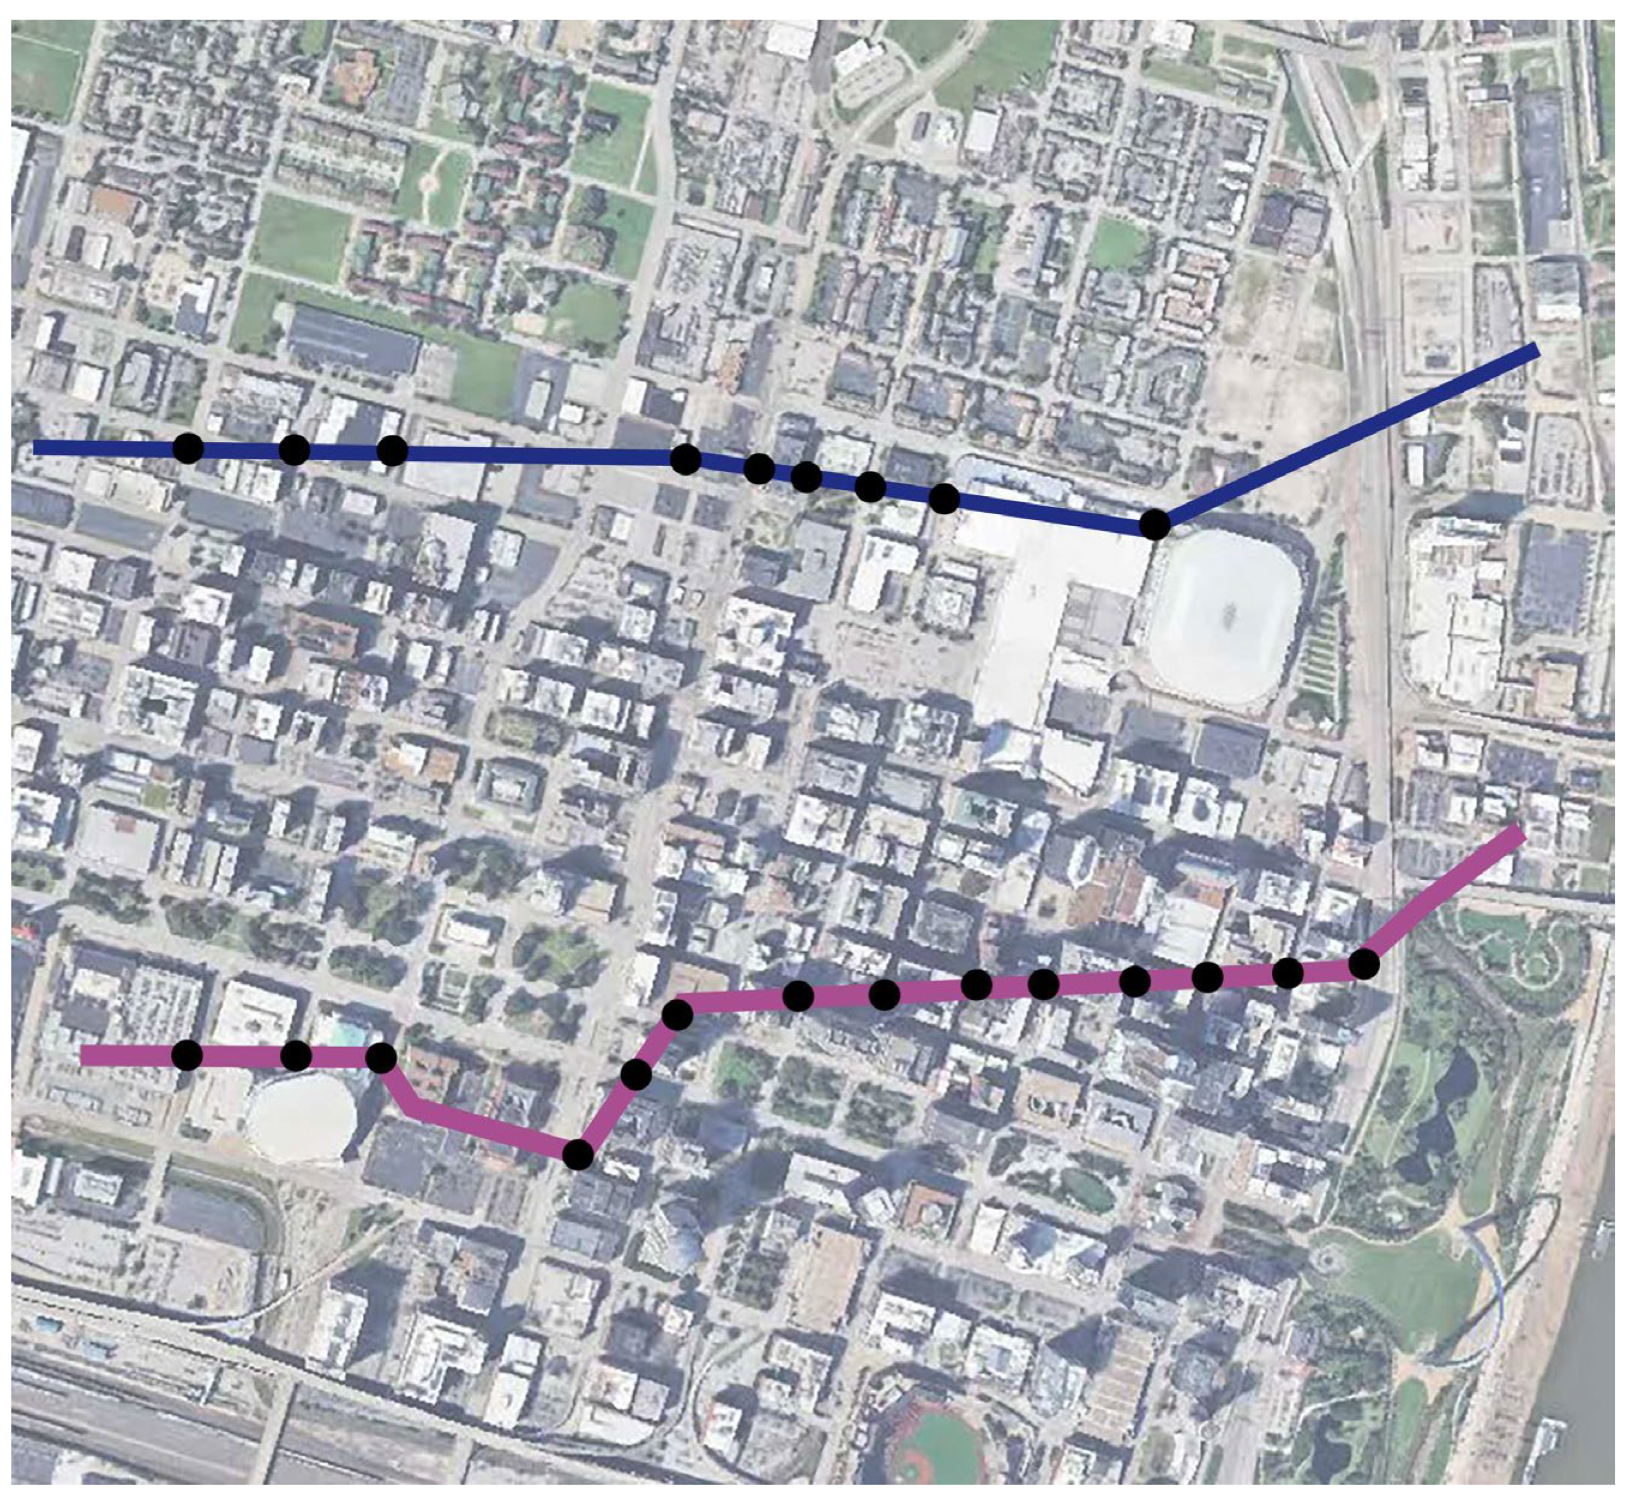
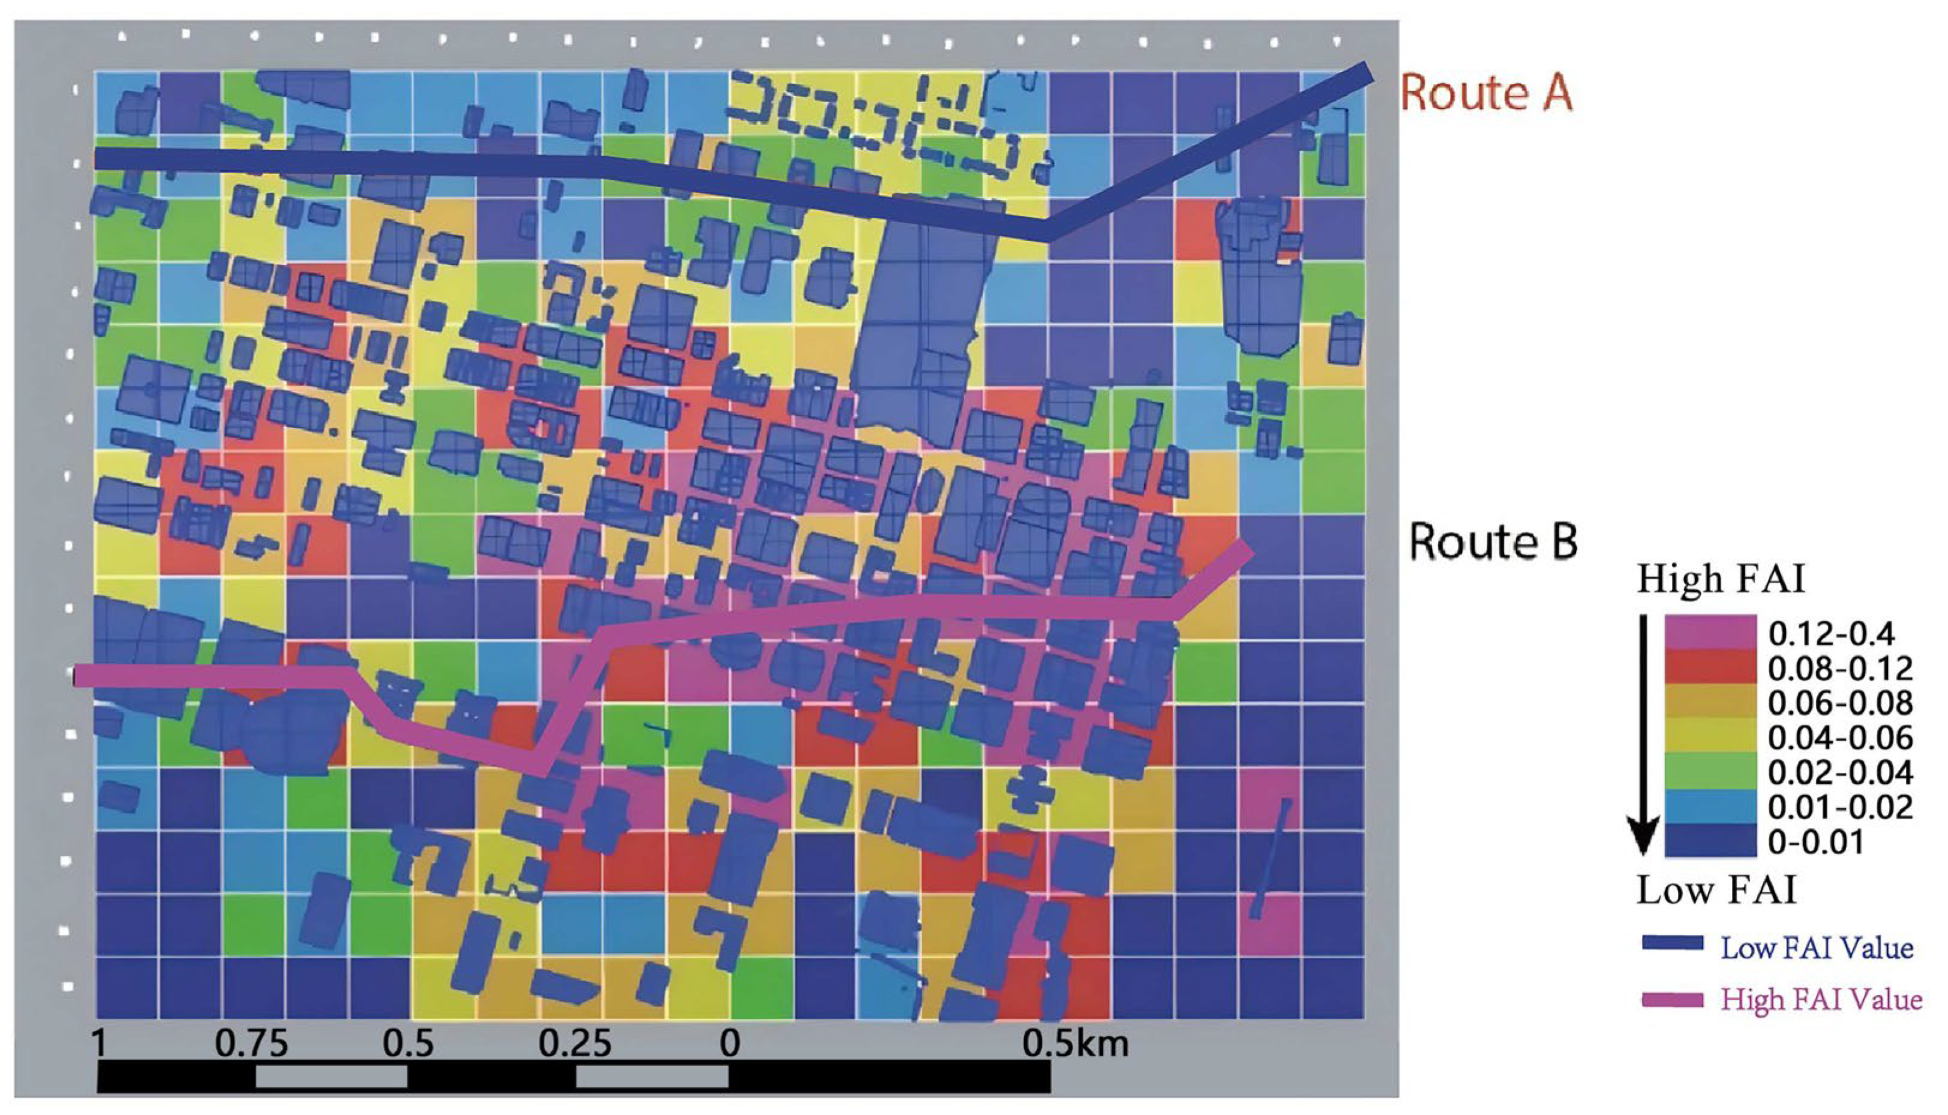
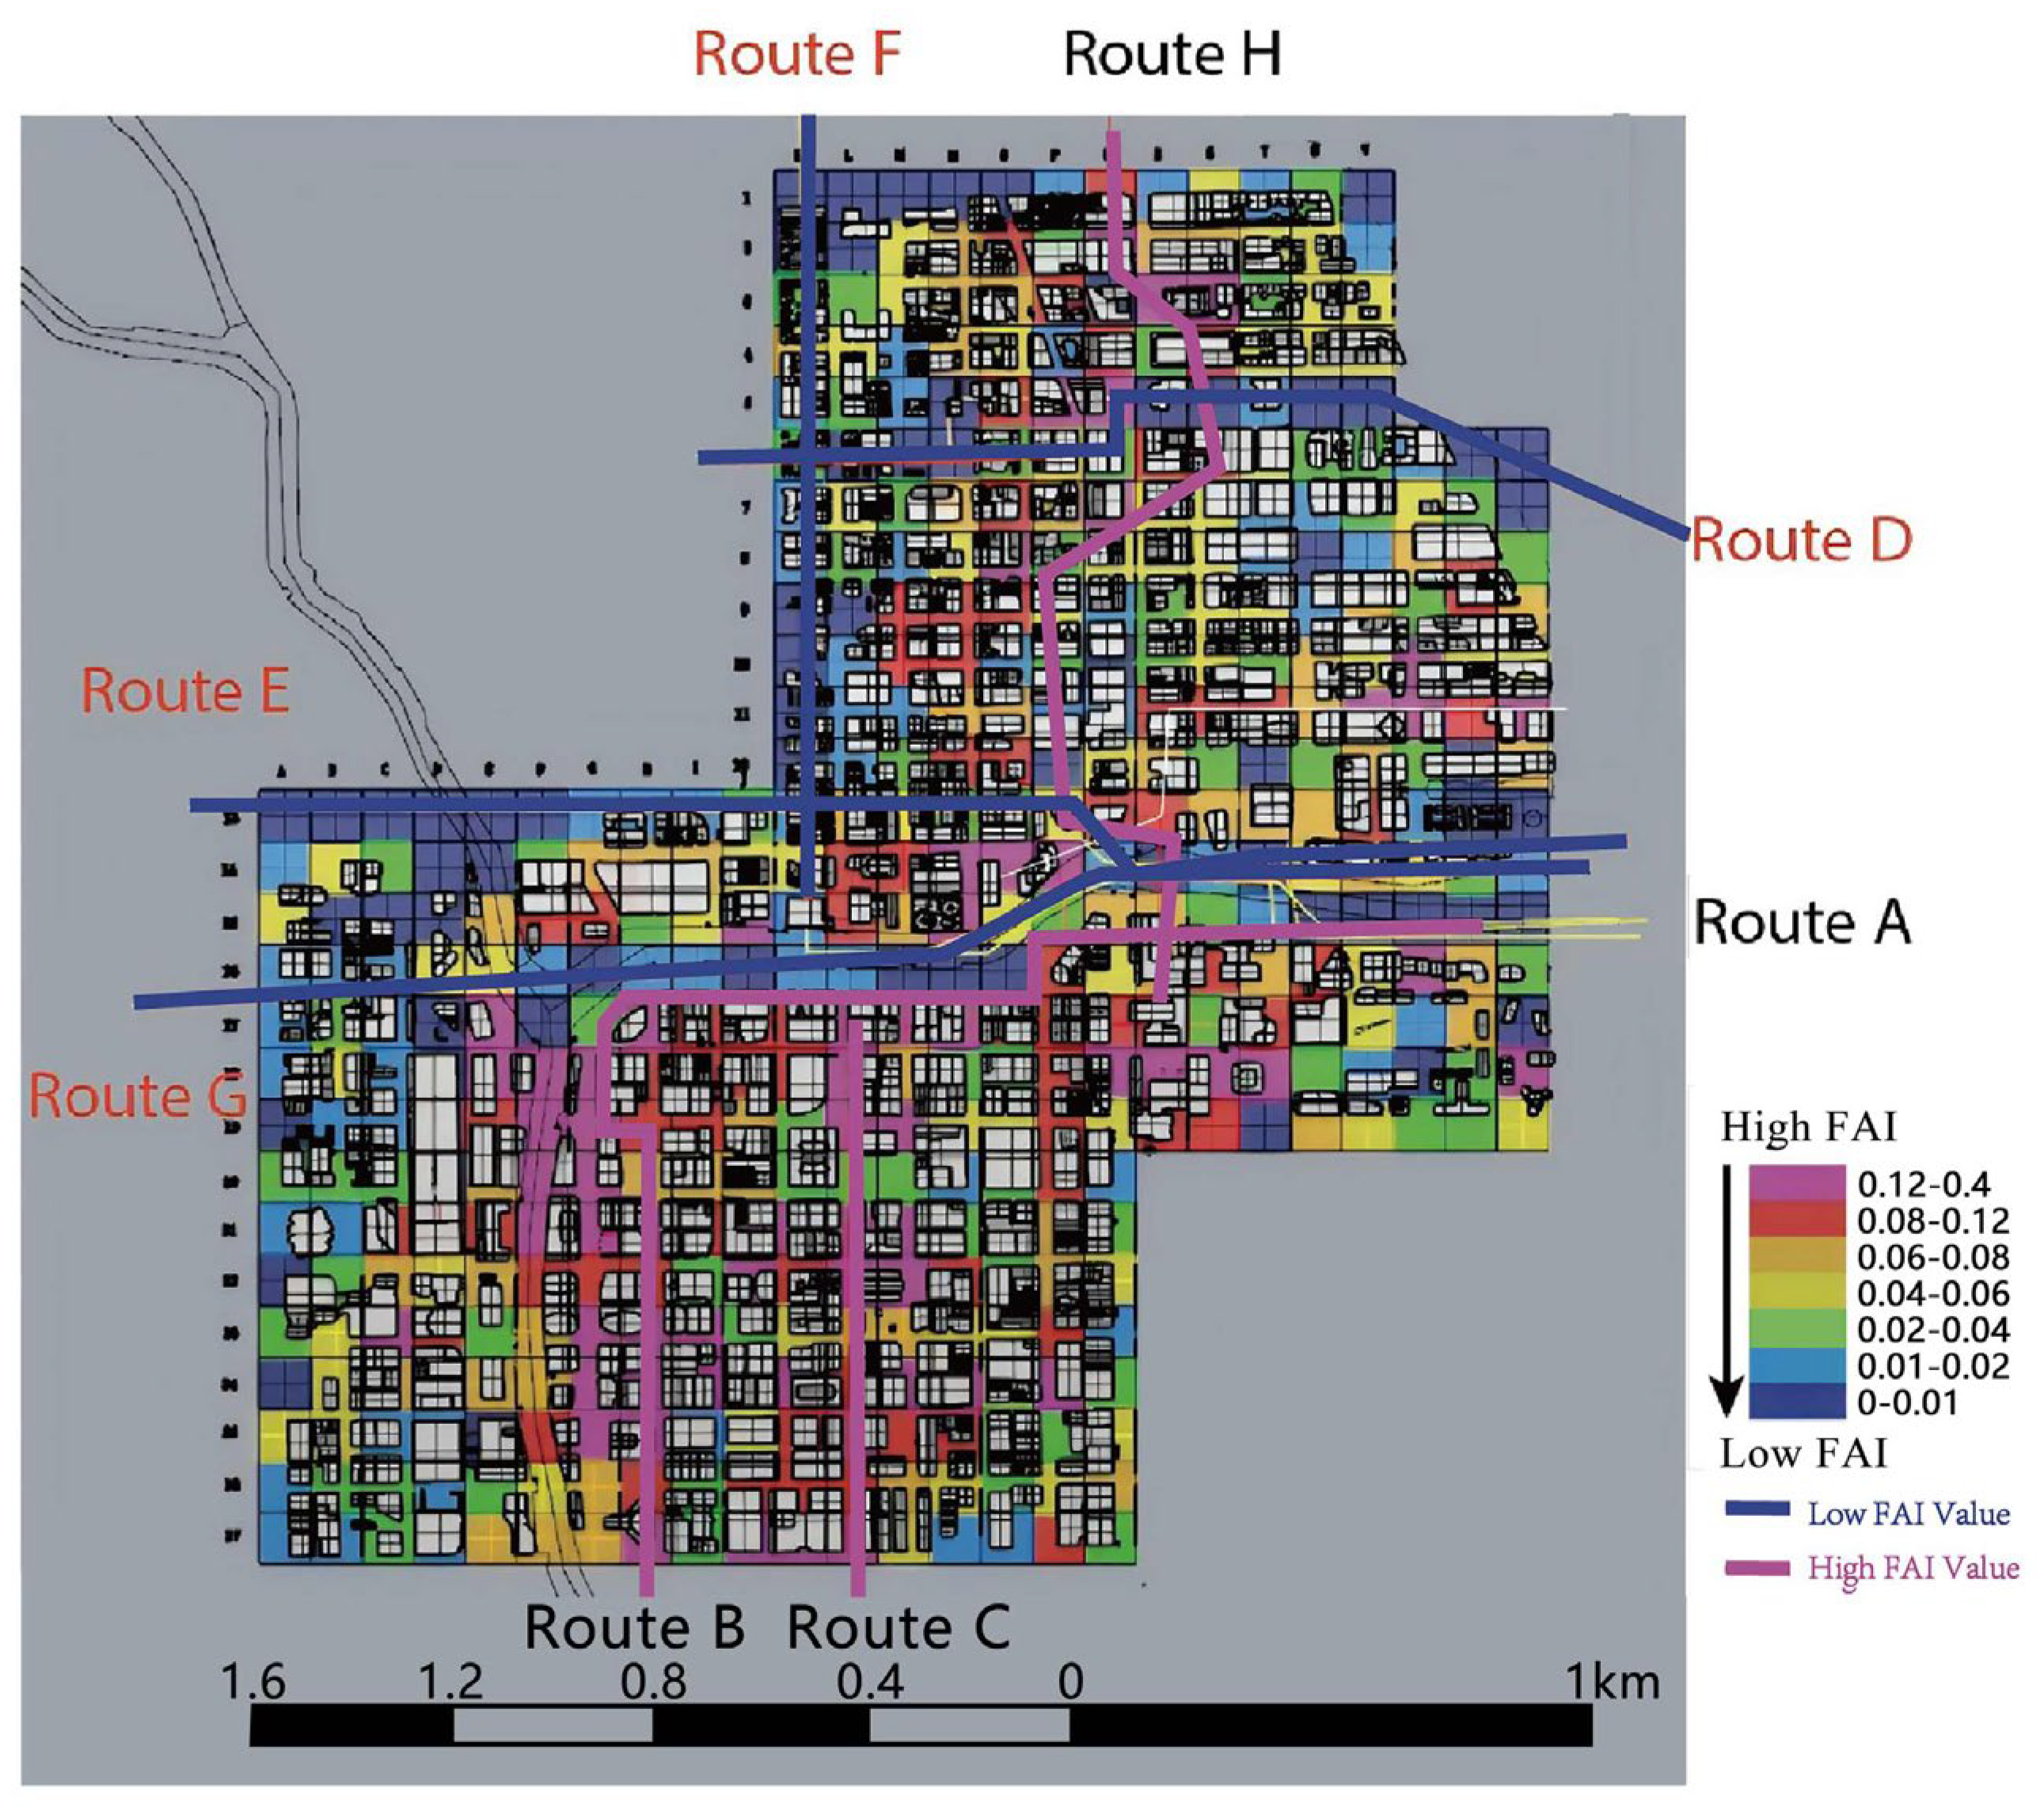
Second, within each city, measurement routes were chosen strictly based on FAI mapping results (
Figure 7 and
Figure 8). Routes with consistently low FAI values were selected as predicted “low-resistance” ventilation paths, whereas routes with high FAI values were selected as predicted “high-resistance” or obstructed paths. This ensured that the field campaign directly tested the theoretical expectations of the FAI model.
2.9.3. Measurement Method and Procedure
Measurements were performed using a mobile approach: a vehicle moved along each pre-defined route at low speed, stopping briefly at measurement points. Data were collected at intervals of no more than five minutes. This block-based sampling strategy ensured adequate spatial coverage while maintaining consistent temporal spacing between measurements.
Wind measurements were conducted using a handheld anemometer (CBMEAS WS 120; accuracy typically within ±0.1 m/s; Brand: Qingliang; Origin: Mainland China). For each stop, the reading recorded was the 1 min average wind speed, which reduces noise from momentary gusts and better represents route-level airflow characteristics. Measurements were performed during the winter season, under stable synoptic conditions and without the influence of convective weather or precipitation. When wind speed became unstable due to sudden gusts or local disturbances, measurements were temporarily paused to avoid contamination by transient fluctuations.
In both cities, testing was conducted on weekdays to minimize weekend-related traffic irregularities. Measurements were not continuous along the entire route but followed a repeated point-sampling approach that ensured comparability across routes and between the two cities.
2.9.4. Synchronization, Bias Control, and Data Reliability
To reduce potential measurement bias, the following measures were implemented (
Table 1):
Because the number of measurements along each route was limited, the Chicago dataset showed greater variability than St. Louis. This limitation is acknowledged and highlights the need for longer-duration or continuous monitoring in future studies. Nonetheless, the field measurements provided sufficient resolution to detect systematic differences between predicted and observed wind behavior, especially when interpreted jointly with the FAI maps and local morphology.
2.9.5. Rationale and Limitations
This field protocol was designed to test the applicability of the FAI method in two contrasting Midwestern urban environments while maintaining operational feasibility. The mobile point-sampling approach proved adequate for identifying route-level wind tendencies but may be insufficient for capturing fine-scale turbulence effects, particularly in dense environments such as Chicago. The observed deviations between FAI predictions and measurements in Chicago reflect both the intrinsic limitations of the FAI method in high-rise districts and the challenges posed by spatial heterogeneity, river corridors, and urban greenery.
Future work would benefit from larger sample sizes, continuous mobile transects, and integration with CFD simulations to further validate and refine FAI-based ventilation assessments.
4. Discussion
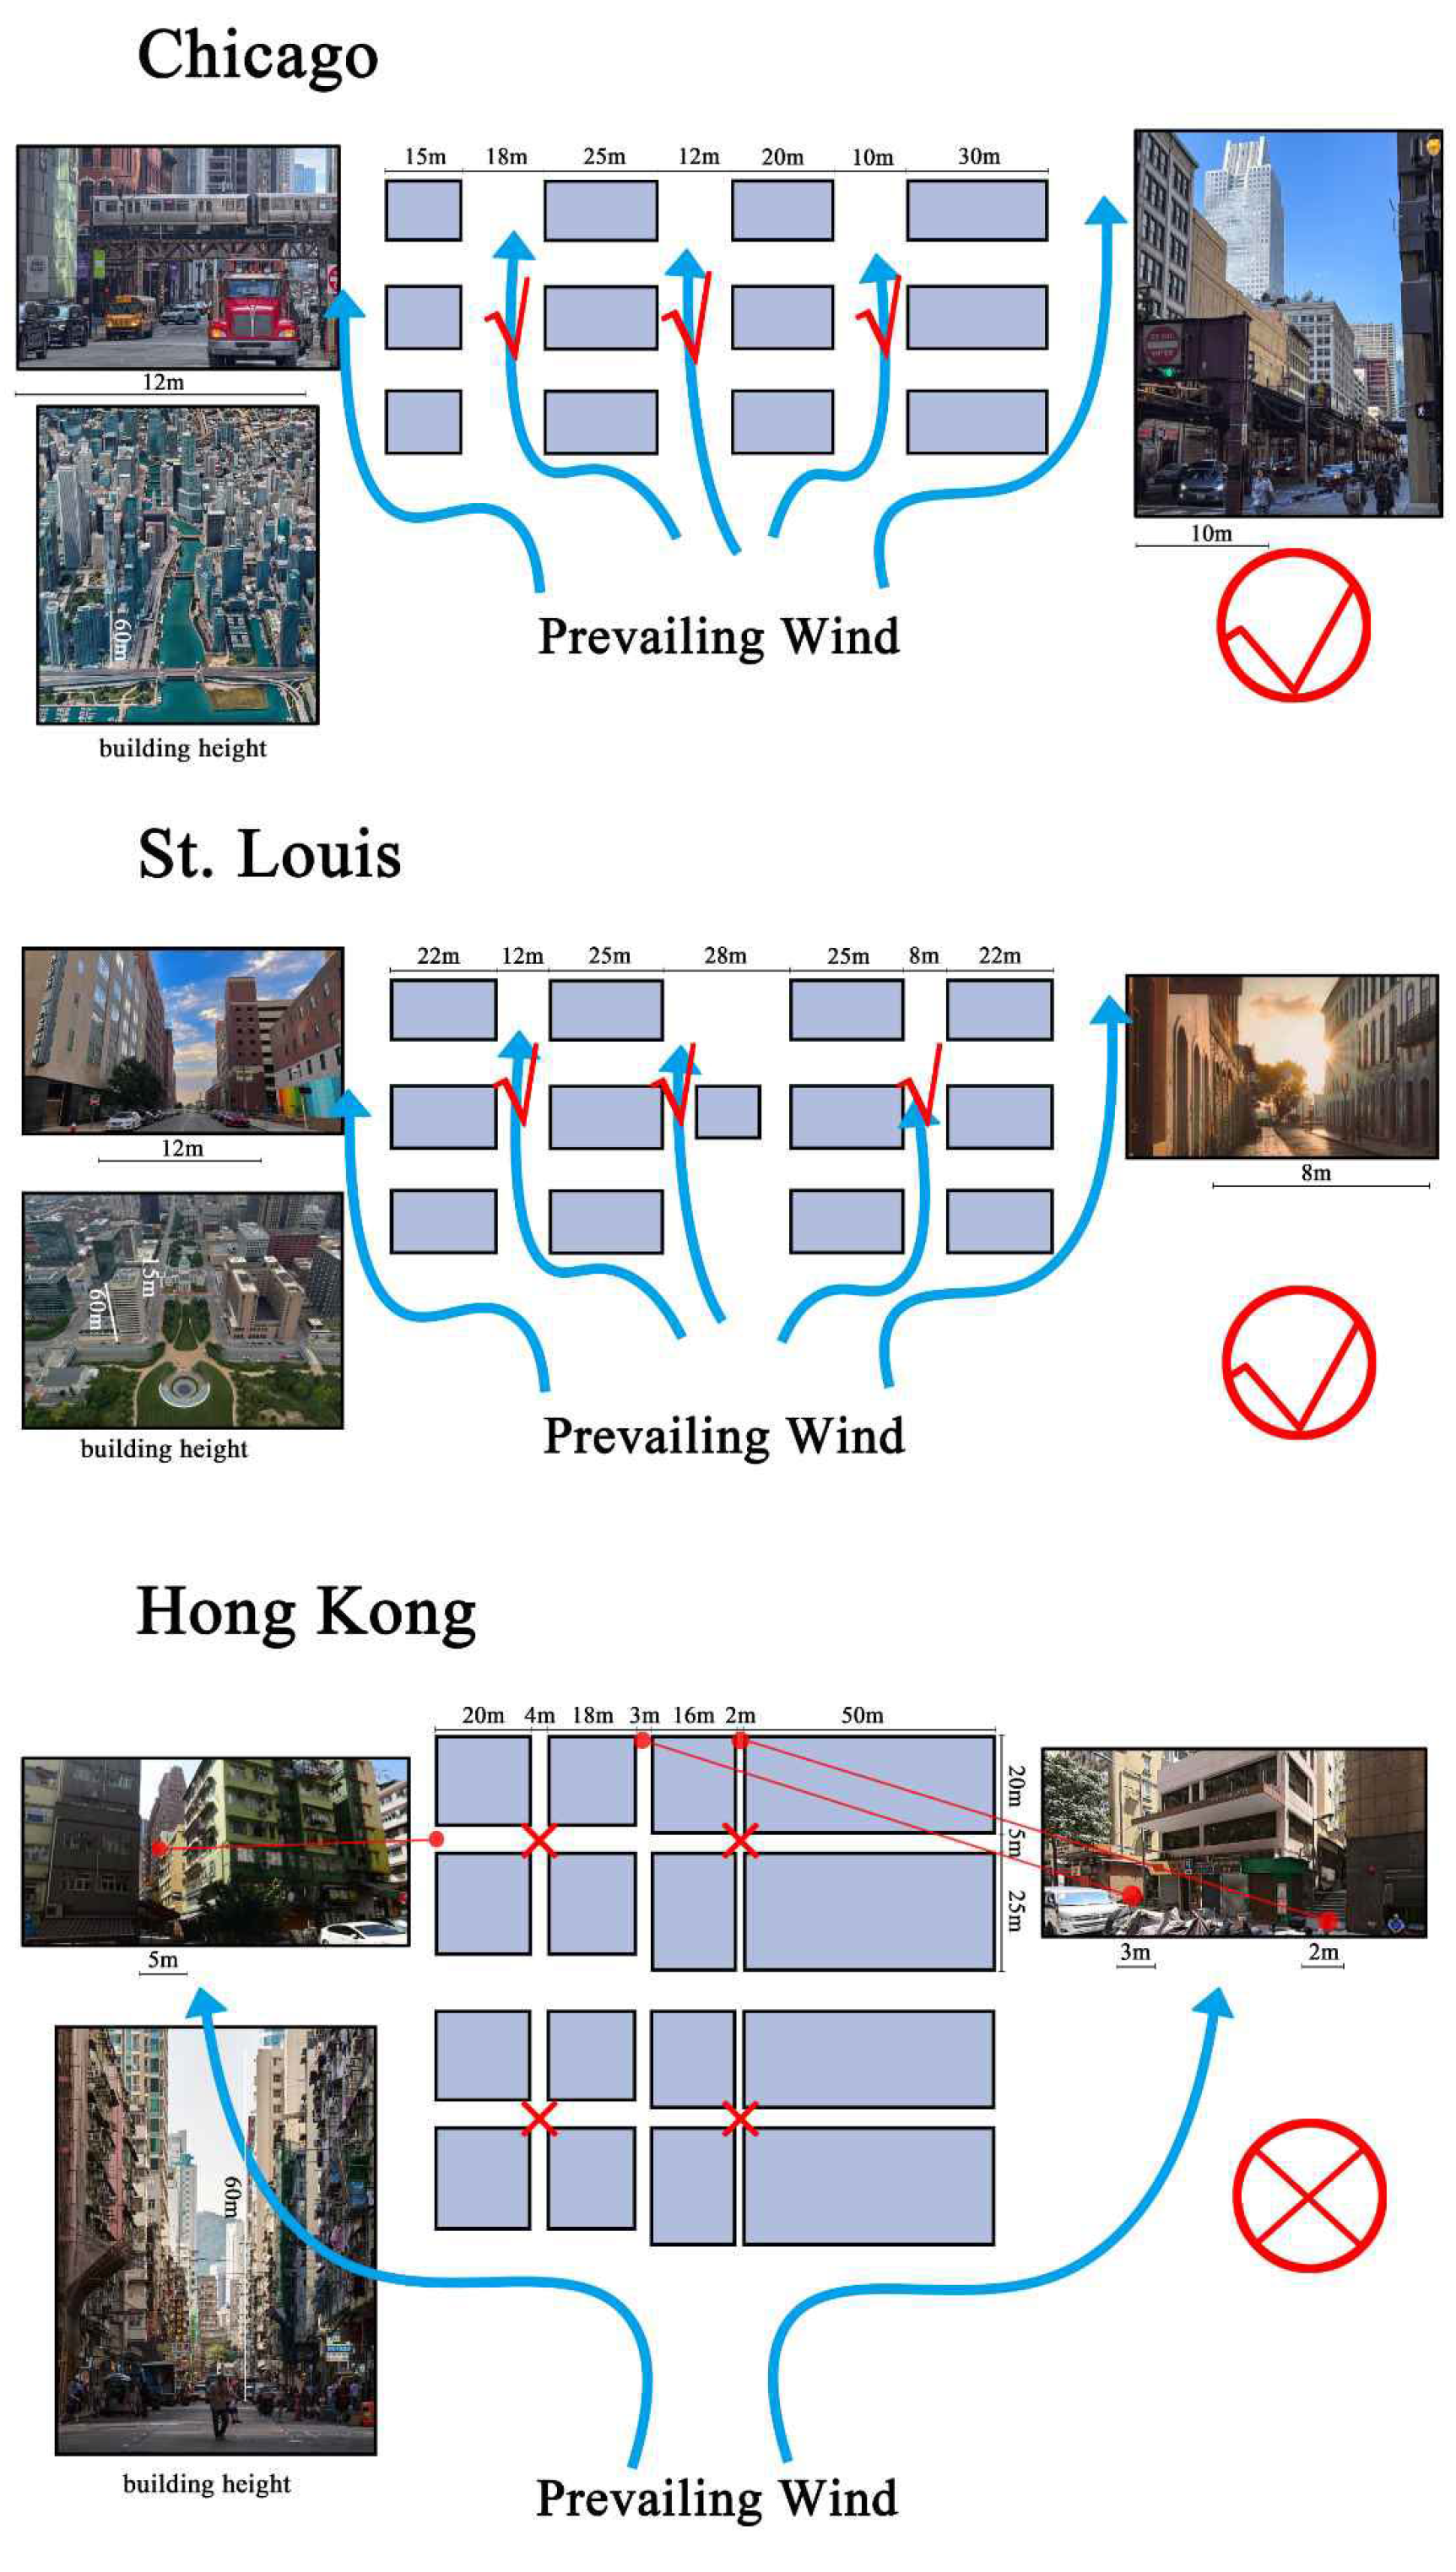
Many possible factors could contribute to the unexpected results. Firstly, when comparing the applicability of models in different cities, it becomes clear that street width plays a crucial role in influencing wind flow. For example, although cities like Hong Kong and Chicago share similar urban forms—both being compact, high-density environments with many tall buildings—the width of their streets significantly affects wind movement [
18]. On the other hand, as
Figure 12 shows, Hong Kong’s streets are narrower, restricting wind flow, whereas cities like St. Louis, with much wider streets, provide more space for the wind to pass through, which makes certain models more effective in these areas.
According to urban micro-environment and ventilation theories, the distance between streets directly impacts wind speed and flow [
35]. Wider streets allow winds to move more freely, which explains why certain models perform better in cities with this characteristic. In contrast to Hong Kong, where narrow streets hinder wind flow, St. Louis and Chicago, with its broad streets, has improved wind flow.
Secondly, the model may require further adjustments to better account for the effects of different urban forms. Cities vary significantly in their street layouts, building densities, and topographical features, all of which influence wind behavior. A model that performs well in one city may not necessarily yield accurate predictions in another if these factors are not adequately considered. In some cases, such as Hong Kong and Tokyo, only a limited number of wind paths were examined, which could affect the results [
36,
37]. A narrow selection of routes might align with the model’s predictions, but urban wind flow is highly complex and context-dependent. For instance, in the Chicago study, if only one slow wind speed route (H) and one fast wind speed route (E) had been selected, the results would have matched the model’s expectations. However, a broader sampling of routes could reveal inconsistencies that a rigid model fails to capture. To improve applicability across different urban environments, models must account for diverse urban configurations and a wider range of wind pathways.
Thirdly, the scope of the experimental model is limited. In specific cases, such as Chicago, a more focused analysis could yield different conclusions. If the study had only considered routes above the river, the results would have supported similar findings. For instance, by comparing route A with routes E and G, it becomes evident that the low wind speed of route A aligns with the hypothesis that certain ventilation paths require improvement.
One possible explanation for the Chicago results is that areas with major rivers may require a different analytical approach. In some parts of the study area, the distance between tall buildings is so small that they can be treated as a single structure. As wind moves through these buildings—similar to how it flows through a canyon—it becomes compressed, leading to an increase in speed and continuity. Additionally, the method of dividing the grid may also play a role. Instead of using a fixed 100 m by 100 m division, an alternative approach, such as dividing by plots, might be more suitable for certain urban conditions.
In addition, the choice of study area may be subject to boundary constraints. In high-rise, high-density areas that include large water bodies or parks, the division of grids may need to be reconsidered. Wind passing through these open spaces tends to follow a low-FAI fast path, meaning that a rigid grid system may not accurately capture airflow dynamics. Furthermore, the model has limited applicability in some cases, as both building height and street width significantly influence wind speed. Adjustments should be made to account for the way tall buildings obstruct wind flow and alter ventilation patterns.
The configuration of the grid itself has also been a subject of debate. In the Los Angeles study, researchers rejected the standard 100 m × 100 m grid because individual buildings were often larger than a single grid cell, causing the same structure to be split across multiple cells [
23]. Grid size plays a crucial role in accurately modeling urban wind behavior, as different scales, dimensions, and topographical features influence ventilation patterns [
29]. A coarse grid may overlook finer airflow variations, while an overly fine grid may introduce unnecessary complexity without improving accuracy. To examine whether grid configuration was a contributing factor, I adjusted the analysis by dividing and computing the St. Louis and Chicago sites based on city blocks rather than uniform grids. The results are shown in
Figure 13 and
Figure 14.
First, as
Figure 13 shows, the overall FAI distribution in St. Louis remained largely unchanged. The only noticeable difference appeared at the far-right side of route B, where an area previously marked in red shifted to blue. This adjustment had no meaningful impact on the final results, as St. Louis’s findings remained consistent with expectations drawn from the Hong Kong case.
Second,
Figure 14 shows significant changes in the FAI distribution for Chicago. The average wind speed along route F was higher than that of route C, which aligned with the results obtained using the 100 m × 100 m grid but contradicted initial expectations. Similarly, while route E was expected to have a higher average wind speed than route B, the results showed the opposite. These discrepancies suggested that switching from a uniform grid to a block-based division did not necessarily produce results that aligned with prior predictions. Further investigation was needed to better understand the relationship between the proportions of buildings and streets and their impact on wind behavior.
Improving urban ventilation modeling methods has broader implications for sustainable urbanization [
38]. If widely applicable, an improved ventilation model could indirectly contribute to urban heat island (UHI) mitigation by guiding urban design interventions. As cities adjust their layouts based on research findings, natural ventilation pathways could be optimized to enhance cooling effects. Thus, ongoing efforts to develop easy-to-use, low-cost, and widely applicable ventilation models remain crucial. While previous studies, such as [
18], have advanced the methodology, further refinement is needed to improve its ease of use and adaptability to diverse urban environments. Strengthening the applicability of urban ventilation modeling would make a significant contribution to sustainable urban planning and climate adaptation strategies.
Future research should focus on improving urban ventilation modeling methods to enhance their accuracy and applicability across different urban contexts. One key factor influencing wind speed is the interaction between street width and building density. Investigating different ratios of these variables across various urban settings could refine existing ventilation models and improve their predictive capabilities.
Previous studies, such as [
18], have made significant contributions in developing practical assessment methods for urban ventilation. While their approach has been successfully applied in some cities, further refinement is needed to accommodate variations in urban morphology and local environmental conditions. Integrating street-width-to-building-density ratios into predictive models could help tailor ventilation strategies to specific city layouts.
A logical next step would be to incorporate these findings into advanced modeling tools to develop targeted mitigation strategies for the urban heat island effect. In particular, applying such enhanced models in the Midwest could provide region-specific insights for optimizing urban airflow and improving thermal regulation. Expanding field validation efforts and testing different computational approaches will further strengthen the applicability of urban ventilation models, making them more effective tools for sustainable urban planning and climate adaptation.
5. Conclusions
The present study evaluated the applicability of the Frontal Area Index (FAI) as a preliminary tool for identifying ventilation corridors in two representative U.S. Midwest cities—St. Louis and Chicago. The findings demonstrate that FAI performs reliably in urban environments with relatively regular block structures, as shown in St. Louis, where the predicted high-FAI and low-FAI routes correspond well with measured wind speed differences. In contrast, the predictive capability of FAI declines in Chicago, where complex street canyons, mixed land–water interfaces, and heterogeneous urban textures introduce additional aerodynamic disturbances not fully captured by a purely geometry-based index. These results reinforce the notion that FAI is conditionally effective: it is well suited for cities whose urban form approximates stable roughness patterns but may encounter limitations in highly irregular settings.
Several factors help explain the reduced consistency observed in Chicago. Local environmental features—including river corridors, wide water bodies, and extensive tree belts—were found to strongly influence near-ground airflow. These elements alter pedestrian-level wind speeds in ways that are not visible in geometric projections alone, highlighting the distinction between “geometric roughness” and “aerodynamic roughness.” This discrepancy has also been noted in the recent literature, which suggests that single-parameter roughness indicators often struggle in environments with mixed surface characteristics and complex morphologies. Our findings therefore align with the broader recognition that FAI, while computationally efficient, represents only the building-derived component of aerodynamic resistance.
The interpretation of field measurements should also be considered with caution. Although both cities were measured under comparable meteorological conditions, using consistent instrumentation, height (1.5 m), and mobile measurement procedures, the number of measurements collected along each route remained limited. This constrains the statistical power of the observed differences between high-FAI and low-FAI routes, particularly in Chicago. The trends documented in this study should therefore be regarded as indicative rather than definitive. Future studies would benefit from larger sample sizes, repeated observations under varying wind directions, and formal tests of statistical significance such as t-tests or ANOVA to distinguish systematic discrepancies from random variability.
Another methodological insight emerging from this study concerns the spatial resolution of FAI calculations. Although a 100 × 100 m grid is widely recommended and commonly adopted in existing urban ventilation research, our field results suggest that this resolution may be suboptimal for cities in the U.S. Midwest, where urban fabrics are often organized around relatively small and tightly bounded blocks. In such environments, block-based divisions produce more coherent spatial patterns and exhibit stronger correspondence with field measurements. This finding underscores that grid size is not a neutral parameter but instead should be adapted to local urban morphology.
Several limitations of the study should be acknowledged. The limited measurement density reduces the robustness of statistical comparisons, and future campaigns should include more continuous temporal sampling. The measurements also reveal that surface elements such as rivers, vegetation belts, and irregular tree canopies exert significant influence on airflow, yet these factors are not incorporated into the traditional FAI framework. Finally, the reliance on a universal 100 m grid overlooks the need for morphology-sensitive spatial structuring, particularly in block-dominated cities. Future research should therefore consider integrating block-level or parcel-based divisions, expanding field campaigns to include seasonal and directional variability, and combining FAI analyses with high-resolution CFD simulations or microscale wind models for cross-validation.
Overall, this study provides an empirical assessment of the FAI method in two contrasting urban contexts and identifies both the strengths and limitations of applying a geometry-based ventilation index in real-world environments. The findings emphasize the importance of adapting FAI methodologies to local morphological conditions and incorporating additional environmental variables when venturing beyond purely geometric predictions. These insights contribute to refining the use of FAI as a practical planning tool for improving urban ventilation and mitigating heat-related risks in diverse urban settings.




 ,
,