Abstract
This paper presents an experimental and numerical investigation of the axial compression behavior of perforated cold-formed steel upright profiles commonly used in pallet racking systems. The primary objective is to examine how slenderness influences the failure modes and load-bearing capacity of these structural elements. Three column lengths, representative of typical vertical spacing in industrial rack systems, were tested under pin-ended boundary conditions. All specimens were fabricated from 2 mm thick S355 steel sheets, incorporating web perforations and a central longitudinal stiffener. Experimental results highlighted three distinct failure mechanisms dependent on slenderness: local buckling for short columns (SS-340), combined distortional–flexural buckling for medium-length columns (MS-990), and global flexural buckling for slender columns (TS-1990). Finite Element Method (FEM) models developed using ANSYS Workbench 2021 R1 software accurately replicated the observed deformation patterns, stress concentrations, and load–displacement curves, with numerical results differing by less than 5% from experimental peak loads. Analytical evaluations performed using the Effective Width Method (EWM) and Direct Strength Method (DSM), following EN 1993-1-3 and AISI S100 specifications, indicated that EWM tends to underestimate the ultimate strength by up to 15%, whereas DSM provided results within 2–7% of experimental values, especially when the entire net cross-sectional area was considered fully effective. The originality of the study is the comprehensive evaluation of full-scale, perforated, stiffened cold-formed steel uprights, supported by robust experimental validation and detailed comparative analyses between FEM, EWM, and DSM methodologies. Findings demonstrate that DSM can be reliably applied to perforated sections with moderate slenderness and adequate web stiffening, without requiring further local reduction in the net cross-sectional area.
1. Introduction
In recent decades, rapid industrialization and economic expansion have led to an increasing demand for efficient and robust steel pallet rack systems. These structures are typically constructed from cold-formed steel, which provides an optimal balance between lightweight design and high strength [1,2,3,4].
However, the presence of perforations significantly affects the stability and load-bearing capacity of uprights, necessitating a detailed analysis of axial compression behavior [5,6]. Several experimental and numerical studies have examined perforated uprights, investigating buckling resistance and failure mechanisms. Neiva et al. found that the Direct Strength Method (DSM) tends to overestimate load-carrying capacity, leading to modifications in the distortional buckling curve [7,8]. Similarly, Ren et al. explored the interaction between distortional and global buckling, concluding that perforations adversely impact structural performance [9].
Further research by Shaker et al. confirmed that DSM, in its current form, fails to accurately predict failure modes in cold-formed steel sections without modifications. To improve structural performance, Taheri et al. proposed reinforcement techniques using spacers and bolts, demonstrating enhanced load-bearing capacity and reduced distortional buckling risks [10]. Meanwhile, Bernuzzi et al. emphasized the importance of evaluating stiffness in beam-to-column joints and base connections, as these factors heavily influence overall structural stability [11].
Pham et al. (2023) extended the applicability of the Direct Strength Method (DSM) to cold-formed steel channels featuring web perforations subjected to shear forces. The study proposed improved design procedures, emphasizing accurate predictions of shear capacity affected by web openings [12]. This reference supports discussions about limitations and enhancements of DSM for perforated sections, providing context on why further investigation into alternative or complementary analytical approaches is necessary.
Martins et al. (2021) conducted extensive numerical and experimental analyses on the interaction between distortional and global buckling modes in cold-formed steel columns. Their research provided valuable insights into the strength reduction resulting from these complex interactions, emphasizing the need for advanced analytical and numerical modeling [13].
Ye et al. (2022) performed numerical studies on perforated cold-formed steel columns under axial compression, evaluating the influence of various perforation patterns on the structural stability and buckling resistance. They proposed guidelines for efficient design practices based on Finite Element Method (FEM) simulations [14].
Xiang et al. (2021) developed simplified design methods specifically for cold-formed steel columns with built-up box sections, addressing buckling behavior and strength prediction. Their findings demonstrated simplified analytical methods that align closely with FEM and experimental results [15].
Shaker et al. (2022) conducted experimental investigations on stiffened, perforated cold-formed steel sections subjected to axial compression, emphasizing the impact of triangular and circular perforations. Their study highlighted limitations of the Direct Strength Method (DSM) in accurately predicting buckling and failure modes for these profiles. They demonstrated that conventional DSM requires modification—such as those proposed by Zhao et al.—to reliably estimate the ultimate capacity of stiffened perforated uprights. This study further underscores the necessity of refined analytical methods and careful numerical modeling for perforated cold-formed steel sections [16].
Although DSM offers a simplified and efficient approach, it presents certain limitations—particularly in the case of members with perforations, where mode interaction (e.g., local–distortional) and assumptions about net section effectiveness may affect its accuracy. These aspects are further investigated in this study.
The steel uprights are designed using perforated cold-formed profiles, allowing adjustable shelf configurations [17]. The image in Figure 1 illustrates the real-life loading and bracing conditions, including high and low bay arrangements, which are critical for evaluating the axial and lateral performance of the structural members. Figure 2 represents the manufacturing and application process of perforated cold-formed steel upright profiles used in industrial pallet racks.
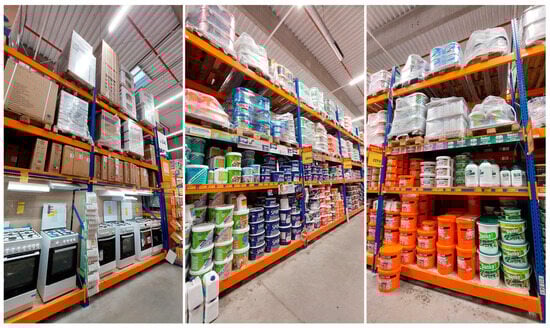
Figure 1.
Typical industrial pallet rack system used in retail or warehouse environments.
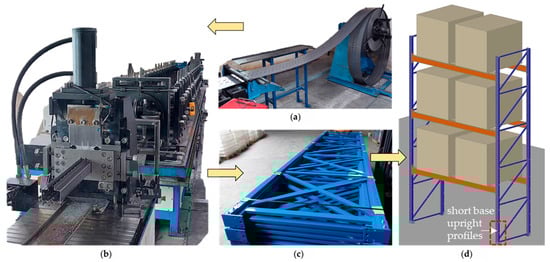
Figure 2.
Cold-forming process of steel rack components: (a) perforated steel strip; (b) cold roll forming machine; (c) vertical frame storage ready for transportation; (d) assembled interior rack.
Cold-formed steel profiles are commonly manufactured from low-carbon steel sheets, with thicknesses ranging from 0.8 mm to 4.0 mm. The most frequently used steel grades in Europe include S355MC, S420MC, S460MC, S500MC, S550MC, S600MC, S650MC, S700MC, and S900MC, with selection based on application-specific requirements [18]. Understanding material behavior and stress–strain characteristics is essential for improving finite element model (FEM) calibration and predicting failure modes in rack structures [19,20,21,22,23].
Although these contributions have improved the understanding of buckling phenomena, certain research gaps persist. Specifically, there remains limited investigation regarding the coupled buckling behavior of cold-formed perforated uprights at intermediate slenderness levels. Furthermore, detailed characterizations of realistic geometric imperfections, important for accurate finite element modeling, are rarely reported explicitly.
This paper addresses these specific gaps by presenting a comprehensive experimental, numerical, and analytical investigation into the axial compression behavior of cold-formed perforated steel upright profiles. Particular emphasis is placed on accurately capturing global–local–distortional mode interactions, especially for profiles of intermediate slenderness. Three realistic column lengths—340 mm, 990 mm, and 1990 mm—corresponding to typical bracing node spacings in pallet rack configurations are systematically studied. The chosen section dimensions (85 × 52 mm, 2 mm thick, steel grade S355) are representative of commonly utilized commercial profiles, allowing direct application of the results in practical design contexts.
A novel contribution of this research is the careful calibration of FEM, including measured geometric imperfections and realistic boundary conditions, significantly enhancing model fidelity compared to prior studies. Additionally, this study critically evaluates the applicability and limitations of simplified analytical methods, such as the Effective Width Method (EWM), particularly highlighting scenarios where DSM or enhanced analytical models may offer superior predictive capabilities.
The results presented herein provide valuable benchmark data and validated numerical models, supporting future research aimed at optimizing upright cross-sections, improving structural reliability, and assessing full-scale seismic performance of pallet rack systems.
2. Experimental Program
2.1. Materials
Materials used for storage rack systems must comply with the Romanian seismic design guide GP 128-2014 [24] specifically developed for commercial storage racks subjected to seismic actions. The materials used for storage rack systems must be suitable for cold forming, welding, and galvanizing. Their mechanical properties must comply with the requirements specified in EN 1993-1-1, EN 1993-1-3, [25,26], EN 1090-1+A1, and EN 1090-2+A1 [27,28], which regulate the execution of metal structures.
The mechanical properties considered for steel include the following:
- Yield strength: .
- Ultimate tensile strength: .
- Longitudinal modulus of elasticity: .
- Shear modulus: .
- Poisson’s ratio: . Thermal expansion coefficient: .
- Density: kg/m3.
Additionally, other steel types suitable for cold forming may be used, provided they meet the specific bending and mechanical property requirements outlined in EN 15512 [29] a standard dedicated explicitly to the design of adjustable pallet racking systems. These steels must exhibit an ultimate-to-yield strength ratio of at least 1.05.
Steels whose mechanical properties have been validated through standardized testing methods, such as those specified by EN ISO 6892-1 [30], may also be employed if they satisfy minimum performance criteria prescribed by structural design standards. In this study, mechanical properties were verified experimentally by tensile testing a sample of five specimens, ensuring the steel age did not exceed 12 months at the sampling moment, in accordance with EN 15512.
For accurate finite element model calibration, tensile tests were conducted according to EN ISO 6892-1, on steel specimens identical to those used in vertical elements of the studied metal storage racks. The tensile specimens were machined in accordance with EN ISO 6892-1, using a flat dog-bone geometry with the following dimensions: 174.1 mm total length, 50 mm gauge length, 10 mm reduced section width, and 2.0 mm thickness, identical to the wall thickness of the upright profiles. The fillet radius was 30 mm, as illustrated in Figure 3a. Figure 3b presents representative stress–strain curves from these tests, and Table 1 summarizes specimen geometry alongside mechanical properties, including yield strength, ultimate tensile strength, and modulus of elasticity, obtained from experimental results.
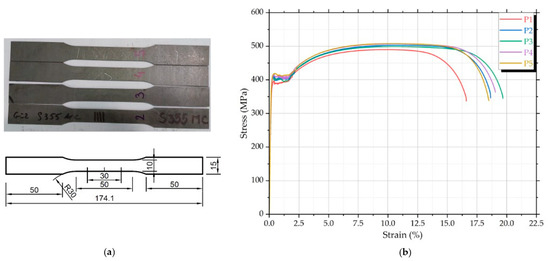
Figure 3.
Tensile specimens and stress–strain curves for S355MC steel: (a) tested samples and specimen geometry in milimeters and (b) engineering stress–strain curves from five tests (P1–P5).

Table 1.
Specimen and material properties used for axial compression testing.
Figure 3b shows the stress–strain curves from tensile tests on five steel specimens (P1–P5) used in the upright elements of the storage racks. All curves show consistent elastic behavior with a modulus of elasticity around 210 GPa, confirming material uniformity. The yield strength ranges from 420 to 440 MPa, and the ultimate tensile strength reaches 490–515 MPa, giving a strength ratio , in line with EN 15512 requirements. Most specimens show good ductility with total elongation between 15% and 20%. Specimen P1 fractured earlier, possibly due to a local imperfection. The post-yield behavior indicates stable strain hardening, suitable for structural applications and accurate FEM calibration. Table 1 summarizes specimen geometry and mechanical properties (yield strength, ultimate tensile strength, and modulus of elasticity) obtained.
2.2. Methodology
2.2.1. Test Specimens and Geometry
Figure 4 presents the detailed technical drawings of the tested specimens, including cross-sections, elevation views, and the 3D configuration. The specimens include end plates used for load application during axial compression tests. All specimens share the same cross-sectional profile of 85 mm × 52 mm, with a nominal wall thickness of 2 mm. The total lengths investigated were 340 mm, 990 mm, and 1990 mm, corresponding to realistic upright segment lengths between bracing nodes in commercial pallet racks.
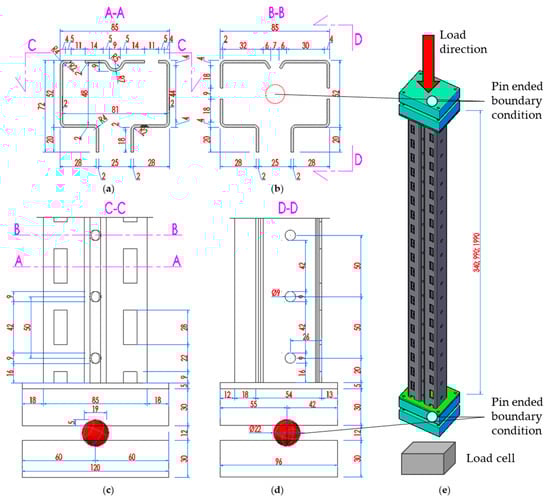
Figure 4.
Technical drawings and dimensions in millimeters of the specimens. (a) Cross-section A-A; (b) cross-section B-B; (c) front elevation segment with the end plates; (d) lateral elevation segment with the end plates; (e) 3D view of the specimen.
The three specimen lengths—340 mm (SS-340), 990 mm (MS-990), and 1990 mm (TS-1990)—were selected to represent realistic vertical spacing between bracing nodes in industrial pallet rack systems. These values also span a representative range of non-dimensional slenderness (), from stocky columns susceptible to local buckling to intermediate-length members exhibiting coupled distortional–global interaction, and slender profiles governed by global flexural buckling. The chosen lengths reflect standard commercial configurations and are consistent with typical dimensions found in European racking design practice. This selection enabled a systematic investigation of the influence of slenderness on buckling behavior and compressive resistance.
In all tests, spherical hinges were used at both ends of the specimens, positioned at the centroid of the cross-section, in accordance with the recommendations provided in Annex A.2 of the Romanian seismic design guideline GP 128-2014. This configuration ensures concentric axial loading and minimizes the influence of end restraints or unintentional moments. The offset distances of 55 mm (top) and 42 mm (bottom) account for the physical dimensions of the hinge assembly and end plates, ensuring that the applied force passes directly through the section’s centroidal axis. This setup simulates ideal pin-ended boundary conditions, enabling meaningful comparisons with analytical models and FEM simulations.
2.2.2. Test Setup and Procedure
Axial compression tests were performed on three groups of cold-formed perforated steel uprights with different lengths, representing typical vertical segments between bracing nodes in industrial pallet rack systems. All specimens were fabricated from S355 steel and had a uniform cross-section of 85 × 52 mm with a wall thickness of 2 mm. Their geometric characteristics, including cross-sectional views and end plate configuration, are detailed in Figure 4, while the visual appearance of the specimens prior to testing is presented in Figure 5.
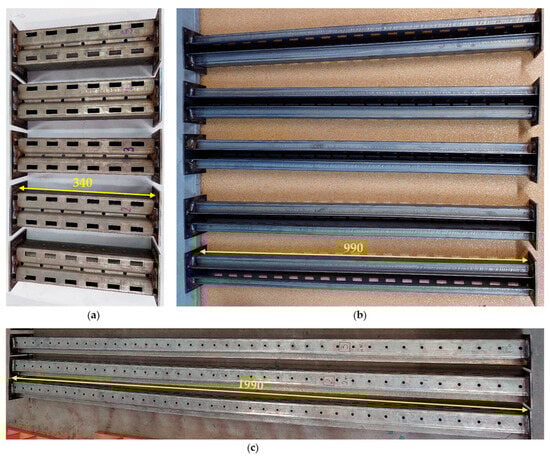
Figure 5.
Appearance of the specimens prepared for testing (units milimiters): (a) SS-340; (b) MS-990; (c) TS-1990.
- Short specimens (SS-340, length 340 mm): Five specimens were tested using a Zwick/Roell 1000SP universal testing machine with a capacity of 1000 kN. Axial force and displacement were recorded directly via the machine’s integrated sensors. The test configuration for these specimens is shown in Figure 6a,b.
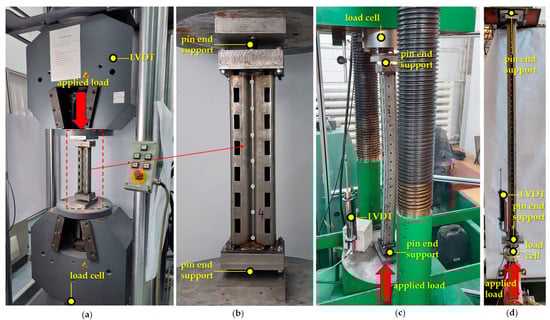 Figure 6. Experimental setup for axial compression testing of: (a) Zwick/Roell 1000SP universal testing machine for SS-340; (b) close-up view of the specimen SS-340; (c) MS-990 specimen tested in a 3000 kN universal testing machine; (d) TS-1990 specimens tested with a 300 kN hydraulic jack.
 - Medium specimens (MS-990, length 990 mm): Another set of five specimens was tested in a 3000 kN hydraulic testing machine. An external load cell and a linear displacement transducer were employed to improve measurement precision. Data were recorded and processed using an external digital acquisition system. The test setup for MS-990 specimens is depicted in Figure 6c.
- Tall specimens (TS-1990, length 1990 mm): The tallest columns illustrated in Figure 6d, were tested in a custom experimental rig using a hydraulic jack with a 300 kN capacity. An external 100 kN load cell was used for accurate force monitoring.
Although three different testing rigs were employed—each selected to match the specific load capacity and geometric constraints of the specimen series—all machines were equipped with calibrated load cells and displacement transducers, and the same loading rate and boundary conditions were applied. This ensured consistency across tests. The load–displacement responses showed no systematic deviation attributable to the testing equipment, confirming that the use of multiple rigs did not influence the results. This approach was necessary due to significant differences in specimen size and expected behavior.
For the SS-340 and MS-990 series, five identical specimens were tested to ensure statistical reliability, capture potential variability due to manufacturing imperfections, and construct average load–displacement curves with confidence. In the case of the TS-1990 specimens, three tests were performed due to practical constraints related to the size of the test rig and availability of material. Nevertheless, the results showed consistent global buckling behavior and closely matched numerical predictions, which supports the validity of the conclusions drawn for slender members. This testing strategy enabled a robust comparison across all three slenderness categories while maintaining experimental feasibility.
All tests were conducted with articulated boundary conditions at the base, as prescribed by Annex A.2 of GP 128-2014, which reflects the typical behavior of uprights in pallet racking systems. The top end of each specimen was left free to displace laterally, simulating the unbraced length between two real-world bracing nodes. Axial loads were applied concentrically through welded steel end plates to ensure uniform stress distribution and minimal eccentricity. A constant loading rate of approximately 1 kN/s was maintained throughout the tests to avoid dynamic effects and ensure repeatability. The test was terminated when a clear local or global failure was observed, or when the applied load dropped below 80% of the peak value. This criterion ensures the capture of post-peak behavior while avoiding unnecessary loading beyond structural relevance. A similar approach, based on a predefined strength loss threshold, is also reported in recent experimental studies on cold-formed steel members [31].
Displacement evolution and failure modes were visually monitored and documented throughout testing. The experimental protocol was designed to meet current industry standards for cold-formed steel members, ensuring both reproducibility and data quality. The results obtained were used to calibrate the finite element models, enabling accurate comparisons between numerical simulations and experimental outcomes.
3. Experimental Test Results
3.1. SS-340 Specimens
The axial compression tests conducted on the short specimens (SS-340) revealed consistent mechanical behavior across all five samples. The load–displacement curves, shown in Figure 7a, indicate an initial linear response followed by a gradual nonlinear hardening, reaching peak loads between 195 and 203 kN. After reaching maximum capacity, all specimens exhibited a softening response, with displacement at failure ranging from 1.9 mm to 2.2 mm.
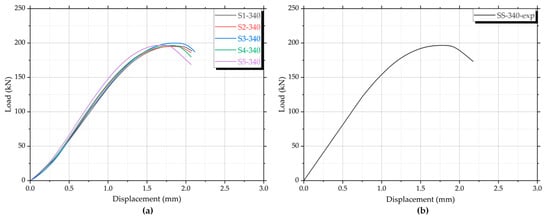
Figure 7.
Experimental load–displacement curves for the short specimens SS-340 under axial compression: (a) individual results; (b) average results.
The average load–displacement curve shown in Figure 7b reaches a peak load of 196 kN at a displacement of 1.75 mm. After the peak, the curve exhibits a moderately descending trend, which reflects the progressive development of local buckling in the web region near the perforations.
After testing, the specimens exhibited various degrees of deformation. Failure patterns are presented in Figure 8. The images show that failure was initiated by local buckling in the web zone, particularly near perforations and dimples, which act as stress concentrators. Although some global deformation was visible, the short length and high stiffness of the SS-340 specimens prevented full-column buckling. The observed failure was thus dominated by local instability phenomena, initiated around geometric discontinuities. All specimens exhibited local buckling initiated in the web zone near perforations. The deformations involved both inward flange distortion and out-of-plane bending of the web. In some cases, buckling occurred at multiple perforations simultaneously, producing compound deformation shapes.
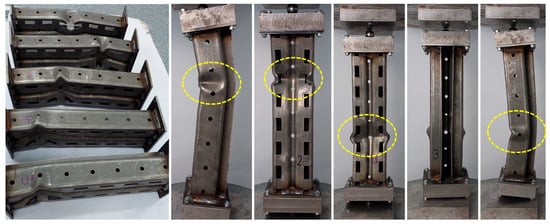
Figure 8.
Detailed views of failure patterns for SS-340 specimens following axial compression.
Plastic deformations remained confined to local zones. No material tearing or rupture was observed. The failure mode was governed by geometric instability—such as local buckling and flange distortion—rather than by ultimate material failure (e.g., tearing or rupture). Plastic yielding occurred locally, but the specimens retained integrity throughout the test.
3.2. MS-990 Specimens
The experimental load–displacement curves for the MS-990 specimens are shown in Figure 9. The individual curves in Figure 9a indicate consistent structural behavior across the five tests. All specimens follow a similar path: an initial linear elastic region, followed by a nonlinear hardening phase, reaching peak load, and ending with a post-peak softening.
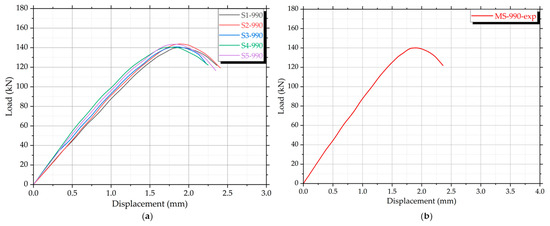
Figure 9.
Experimental load–displacement curves for the medium specimens MS-990 under axial compression: (a) individual results; (b) average results.
The maximum load values range from approximately 128 kN to 143 kN, with most specimens reaching peak strength between 1.7 mm and 2.1 mm of axial displacement. This small variation suggests a moderate sensitivity to initial geometric imperfections or local instability effects caused by the perforations.
The average response, shown in Figure 9b, confirms this trend. The maximum load reaches 140 kN, followed by a softening branch that extends until a displacement of about 2.4 mm.
The general shape of the curves reflects a deformation mechanism initiated by distortional buckling, observed as local flange and web distortions near mid-height, which then triggered a gradual global lateral deflection. This interaction reduced axial stiffness and governed the post-peak response. The deformation pattern was stable, with no abrupt load drops or material failure, and was similar for all tested specimens.
The post-test deformation patterns of MS-990 specimens are shown in Figure 10. All five columns exhibited smooth global flexural buckling, with lateral deflection occurring in a single direction and maximum curvature concentrated near the mid-span. The dashed yellow lines highlight the lateral displacement path observed during and after loading.
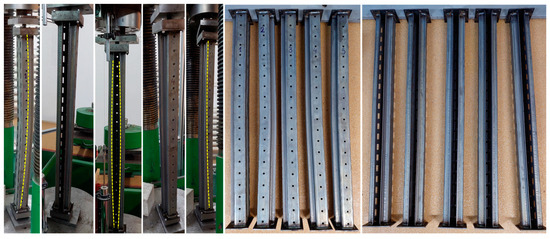
Figure 10.
Experimental results for MS-990 specimens after axial compression tests.
Some specimens present slight asymmetry in the deflected shape, suggesting the influence of geometric imperfections or eccentricities during load application. Despite the global nature of the failure, localized distortion of the cross-section can also be observed in the web regions, particularly near perforations, where the local stiffness is reduced.
In the unloaded state, viewed from both the front and rear faces, the residual deformation confirms the presence of elastic–plastic global buckling. No visible tearing or crushing was observed, indicating that material failure did not occur. Instead, the deformation was governed by geometric instability, with residual bowing retained after unloading.
This behavior aligns with the experimental curves shown earlier, where the softening branch reflects the gradual loss of axial capacity due to second-order effects from large displacements.
3.3. TS-1990 Specimens
The experimental results for the tall specimens (TS-1990) are shown in Figure 11. The individual load–displacement curves in Figure 11a indicate consistent behavior across the three tested columns. All specimens follow a similar path with an initial linear elastic region, followed by a smooth transition into a nonlinear range. The load reaches a maximum between 85 kN and 91 kN, occurring at axial displacements ranging from 3.6 mm to 4.1 mm. The average curve in Figure 11b confirms this trend, with a peak load of 89 kN reached at a displacement of 3.9 mm.
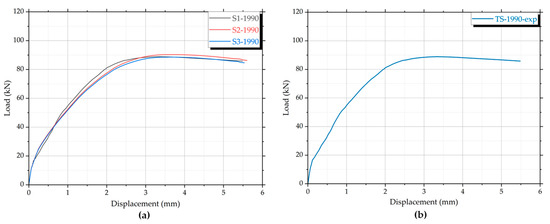
Figure 11.
Experimental load–displacement curves for the tall specimens TS-1990 under axial compression: (a) individual results; (b) average results.
Post-peak behavior shows a gradual decline in axial load, indicating a softening response associated with large lateral deflections. No sudden drop or brittle failure was observed.
The average load–displacement curve shown in Figure 11b presents three distinct linear segments, each corresponding to a different phase in the structural response of the TS-1990 specimens. The initial linear portion represents the elastic axial compression phase, characterized by uniform shortening and negligible lateral deformation. The second segment, with a noticeably reduced slope, reflects the onset of global flexural buckling, during which the columns develop increasing lateral deflection while continuing to carry axial load. The final segment, with a descending trend, corresponds to the post-peak softening phase, governed by large deflections, redistribution of stresses, and progressive loss of axial stiffness. No material rupture occurred, but the strength degradation is attributed to geometric nonlinearity and second-order effects typical of slender column behavior.
Photographic documentation of the deformed specimens is provided in Figure 12. All three specimens exhibit global flexural buckling, with pronounced lateral deflection centered at mid-height. The deformation path is smooth and continuous, with no evidence of local buckling near the perforations. The dashed yellow lines indicate the curvature profiles developed during testing.
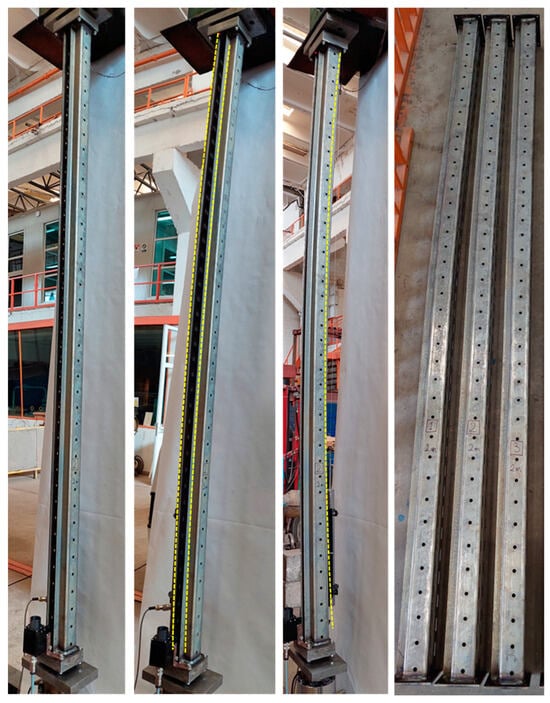
Figure 12.
Experimental results for TS-1990 specimens after axial compression tests.
Residual deformation observed after unloading confirms that the instability occurred in the plastic range. The high slenderness of the TS-1990 columns resulted in a flexural response dominated by global mode behavior, with minimal influence from local or distortional effects.
Unlike the shorter specimens, which displayed web and flange distortions around perforations, the TS-1990 profiles remained stable in the cross-sectional plane. The absence of localized deformation modes is consistent with the slenderness effect and longer effective buckling length of these specimens.
4. Numerical Analysis
4.1. Calibration of the Finite Element Model Based on Tensile Test
To accurately define the mechanical behavior of the S355MC steel used for cold-formed profiles, a finite element simulation of the uniaxial tensile test [32] was conducted using ANSYS [33]. The aim was to calibrate the material model by comparing the simulated stress–strain response with experimental results obtained from the tensile tests described in Section 2.1.
In order to address the research gaps identified in the Introduction, the numerical modeling strategy was specifically designed to capture the coupled buckling behavior observed in members with intermediate slenderness, as well as to account for realistic geometric imperfections. To this end, an eigenvalue buckling analysis was first performed to identify the critical mode shapes, and the first buckling mode was then scaled and introduced as an initial imperfection in the nonlinear analysis. This approach enables the simulation to reproduce complex instability phenomena, such as local–distortional and distortional–global mode interactions, which were especially relevant for the MS-990 specimens. The modeling assumptions and boundary conditions were chosen to mirror the test conditions as closely as possible.
The geometry of the standard tensile coupon was created in AutoCAD 2013 and imported into ANSYS as a 3D solid SAT file. The mesh consisted of SOLID186 elements, which are 20-node high-order hexahedral elements suitable for nonlinear analyses. A maximum element size of 2 mm was used, resulting in 5594 nodes and 728 solid elements, as shown in Figure 13a.
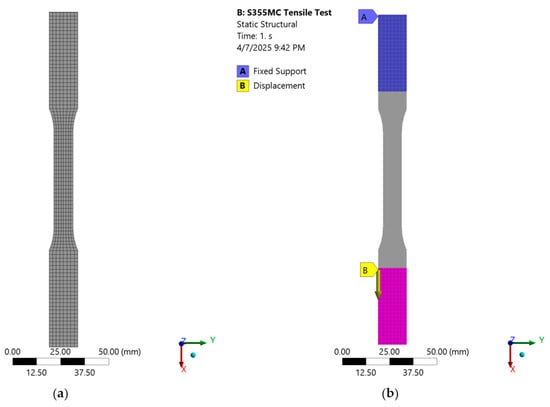
Figure 13.
Numerical setup for the tensile test simulation of S355MC steel using ANSYS: (a) finite element mesh using SOLID186; (b) boundary conditions showing fixed support at the top and imposed displacement at the bottom.
The boundary conditions included a fixed support applied to one end of the specimen, restraining all degrees of freedom. At the opposite end, a prescribed displacement of 15 mm was imposed in the axial (Y) direction to simulate the loading as Figure 13b shows. The analysis was performed under static structural conditions with large deformation enabled and automatic time stepping activated.
The material was defined as a multilinear isotropic hardening plastic model using true stress–strain data obtained from experimental conversion. The conversion from engineering to true values followed the standard relations shown below:
where
- , : engineering stress and strain;
- , : true stress and strain, used for defining the material in the numerical model;
- : elastic component of the total strain;
- : plastic strain used to define the hardening curve;
- : Young’s modulus of elasticity.
The comparison between the experimental, true, and FEM-generated stress–strain curves is shown in Figure 14. The FEM curve was obtained by applying the true stress–strain values in ANSYS and running a tensile simulation of a calibrated test specimen. The very good agreement observed confirms that the material model reproduces the mechanical behavior of the tested steel with sufficient accuracy, and it can be reliably used in the numerical modeling of the full compression tests.
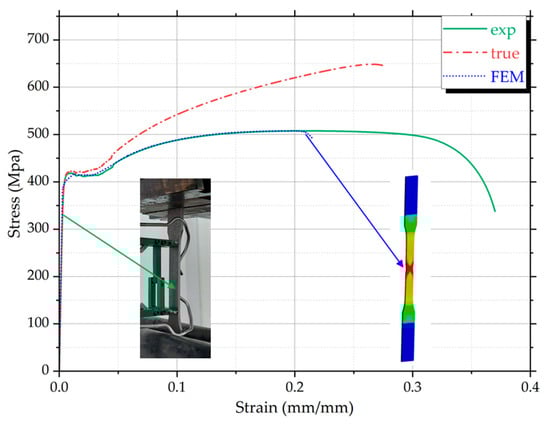
Figure 14.
Comparative stress–strain curves for the S355MC steel used in numerical analyses.
Figure 15 shows the main results from the finite element simulation of the tensile test on the S355MC steel specimen. In Figure 15a, total deformation reaches the imposed 15 mm, with uniform elongation along the gauge length, indicating correct boundary conditions and mesh quality. Figure 15b presents the equivalent plastic strain, with a maximum of 0.3838 mm/mm near the center of the reduced section, matching the expected necking zone. Figure 15c shows the von Mises stress distribution, with a peak of 677.47 MPa in the same area, confirming the model captures post-yield behavior using the applied hardening law.
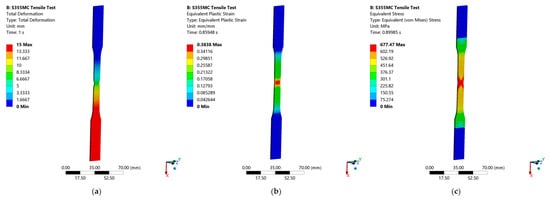
Figure 15.
Simulation results for the tensile test of the S355MC steel specimen: (a) total deformation; (b) equivalent plastic strain; (c) equivalent von Mises stress distribution.
The material model implemented in the finite element simulations used the true stress–strain curve, derived from the experimentally obtained engineering data. While the engineering yield strength was approximately 430–440 MPa, the true stress corresponding to the maximum plastic strain reached values up to 650 MPa. This value was used as the upper limit of the multilinear plasticity model to correctly capture the strain hardening behavior of the S355MC steel in the FEM analyses. This approach ensures a more realistic simulation of post-yield deformation and energy dissipation.
4.2. Numerical Modeling and Analysis of the SS-340 Specimen Under Axial Compression
The SS-340 specimen was simulated using a multi-step finite element analysis in ANSYS. The 3D solid model was created in AutoCAD and imported in (.sat) format. The finite element mesh (Figure 16) used SOLID186 elements, with 257,816 nodes and 73,656 elements, providing sufficient resolution to capture both local and global instabilities. A mesh convergence study was performed to ensure reliable prediction of local buckling behavior. The selected mesh, based on SOLID186 elements, was validated by comparing results across multiple mesh densities, with variations in peak load below 2%. Additionally, local mesh refinement was applied around perforations and web zones to accurately capture stress concentrations and deformation localization.
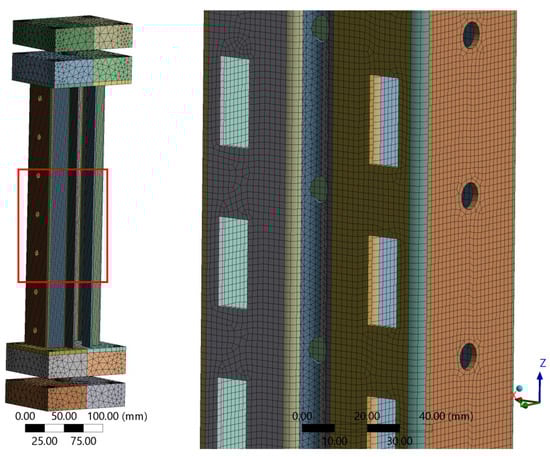
Figure 16.
Finite element mesh of the SS-340 model.
The full test setup, including end plates and spherical supports, was replicated (Figure 17). Contact behavior was defined as frictional, with a coefficient of 0.1, to simulate the pin-ended boundary conditions. The base was fixed, while a remote vertical displacement was applied at the top, allowing axial movement without lateral restraint.
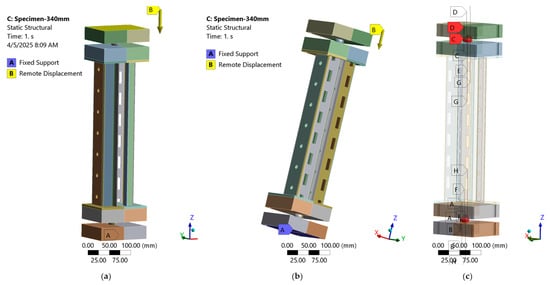
Figure 17.
Numerical modeling setup for the SS-340 specimen: (a,b) the boundary conditions; (c) the frictional contact modeling details at the pin-ended supports.
An initial eigenvalue buckling analysis identified the critical buckling shape, which was then introduced as a geometric imperfection in a subsequent nonlinear static analysis. The large deflection option was enabled to account for geometric nonlinearity.
The first buckling mode obtained from the linear eigenvalue analysis was used to introduce initial geometric imperfections in the nonlinear simulations. A scaling factor equal to 1/1000 of the column length was applied to the eigenmode shape, consistent with standard practice for cold-formed steel members and recommendations from EN 1993-1-5 [34] and related studies. This amplitude ensures the triggering of instability while maintaining physical realism.
Results from the nonlinear simulation (Figure 18a) show significant out-of-plane deflection near mid-height, consistent with flexural buckling. The corresponding eigenmode shown in Figure 18b confirms the location and shape of the instability. Total deformation reached 13 mm Figure 19a, with minor vertical shortening observed along the Z-axis, as shown in Figure 19b.
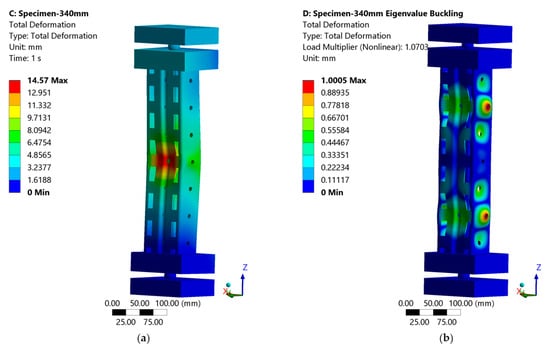
Figure 18.
Deformed shape of the SS-340 specimen: (a) nonlinear structural static analysis; (b) first buckling mode from eigenvalue analysis.
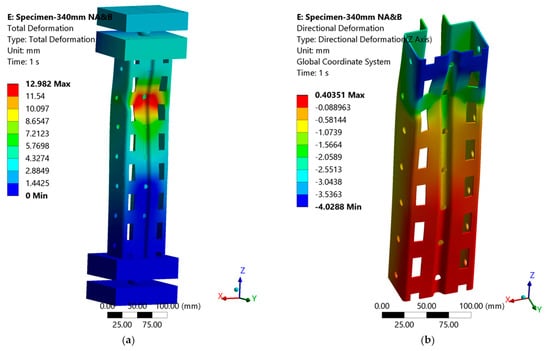
Figure 19.
Nonlinear analysis following eigenvalue analysis of the SS340 specimen: (a) total deformation; (b) directional deformation along the Z axis.
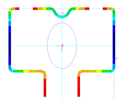
Von Mises stress results presented in Figure 20 show stress concentrations above 650 MPa near perforations at mid-height, matching the zones of observed plastic deformation in the physical tests. These stresses correspond to the experimentally observed failure features Figure 20c.
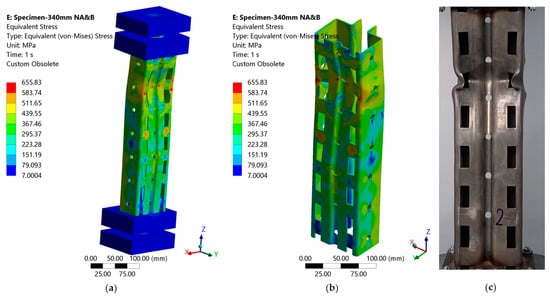
Figure 20.
Equivalent von Misses Stress distribution: (a) the complete model; (b) upright profile with hidden end plates; (c) experimentally tested specimen for visual comparison of the failure mode.
The load–displacement curve comparison in Figure 21 indicates that the simulation accurately follows the experimental trend, with a minor overestimation of initial stiffness.
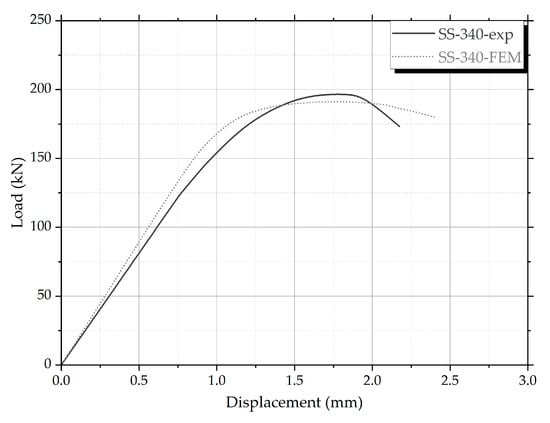
Figure 21.
Load–displacement response comparison between experimental and numerical results for the SS-340 specimen.
4.3. Numerical Modeling and Analysis of the MS-990 Specimen Under Axial Compression
The MS-990 simulation followed the same modeling strategy. The geometry was exported from AutoCAD to ANSYS, and a 3D model was meshed using 98,260 SOLID186 elements and 575,874 nodes (Figure 22). Contact between the spherical ends and plates was modeled using TARGE170 and CONTA174 elements, with a friction coefficient of 0.1.
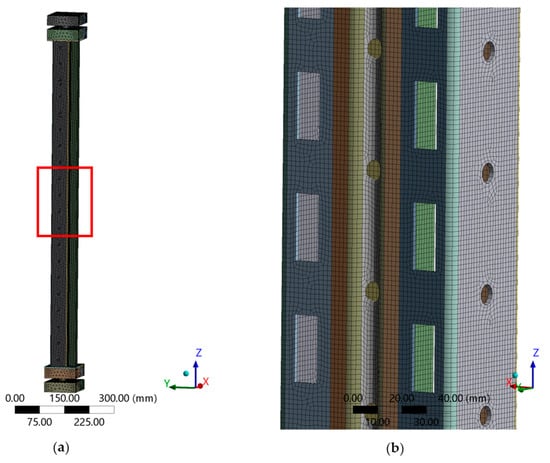
Figure 22.
Finite element mesh of the MS-990 model. (a) finite element mesh; (b) mesh detail around perforations.
The boundary conditions replicated the test setup: a fixed base and remote displacement at the top (Figure 23). A nonlinear static analysis was followed by eigenvalue buckling and then a nonlinear post-buckling analysis.
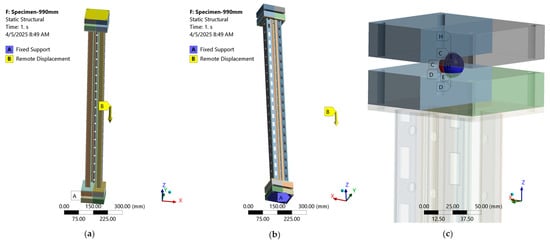
Figure 23.
Boundary conditions for the MS-990 specimen: (a) remote displacement top view, (b) fixed support bottom view and (c) pin-ended contact detail.
Figure 24 shows the deformation shape from the static and eigenvalue analyses. The final deformed shape from the post-buckling analysis (Figure 25) highlights lateral deformation at mid-height. Equivalent stress contours (Figure 26) show stress localization around perforations, similar to the failure observed experimentally (Figure 27).
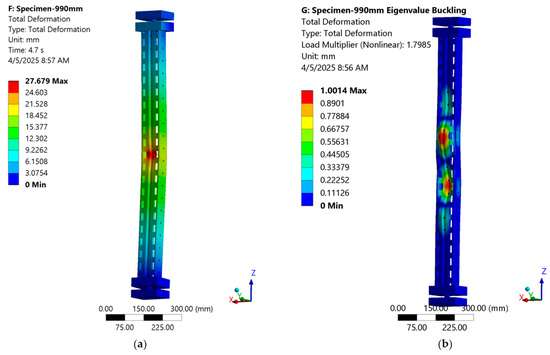
Figure 24.
MS-990 specimen deformation: (a) nonlinear static analysis; (b) first buckling mode from eigenvalue analysis.
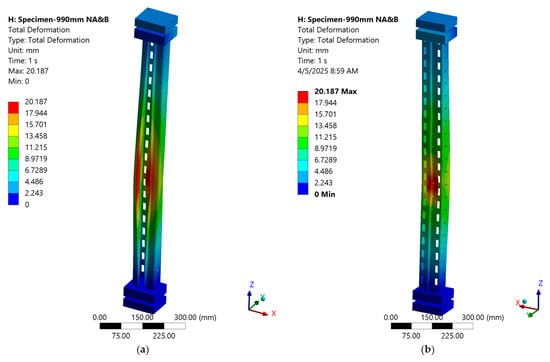
Figure 25.
Total deformation of the MS-990 specimen from nonlinear post-buckling analysis: (a) front view; (b) back view.
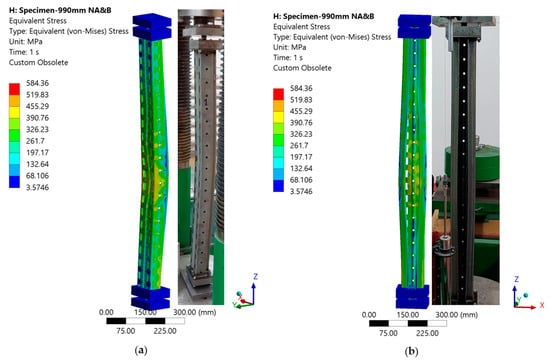
Figure 26.
Equivalent von Mises stress distribution for the MS-990 specimen and comparison with experimental failure: (a) front view; (b) back view.
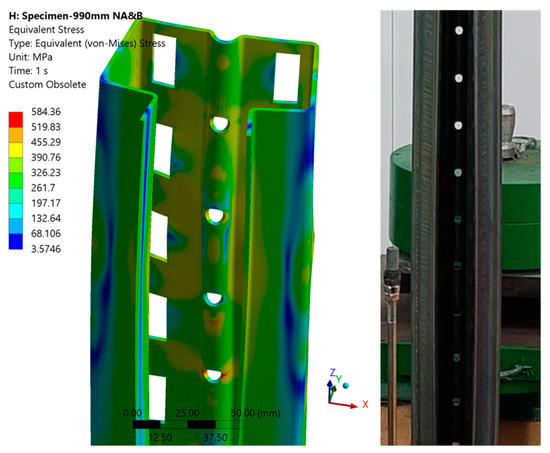
Figure 27.
Stress concentration and failure localization in the middle part of the MS-990 specimennumerical von Mises stress mapand experimental observation.
The load–displacement response in Figure 28 shows good agreement between simulation and tests, both in terms of stiffness and maximum load.
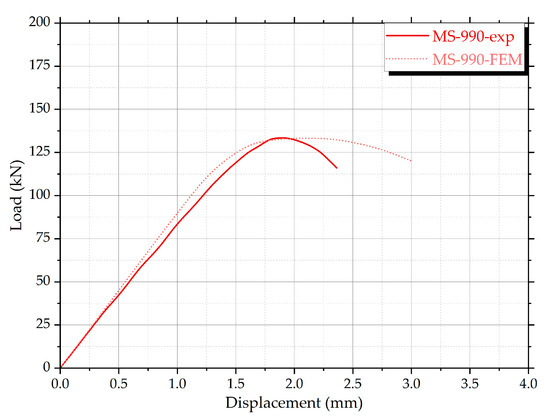
Figure 28.
Load–displacement response comparison between experimental and numerical results for the MS-990 specimen.
4.4. Numerical Modeling and Analysis of the TS-1990 Specimen Under Axial Compression
The TS-1990 model included all geometric features and test conditions, with mesh refinement near perforations (Figure 29). The mesh included 166,433 elements and 1,109,982 nodes. Boundary conditions are shown in Figure 29a, with a fixed base and imposed vertical displacement at the top.
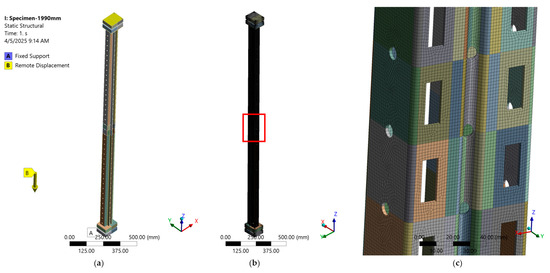
Figure 29.
Numerical model of the TS-1990 specimen: (a) boundary conditions; (b) finite element mesh; (c) mesh detail around perforations.
A nonlinear static analysis was performed first, as shown in Figure 30a, followed by eigenvalue buckling, as shown in Figure 30b, which identified a higher-order mode with local distortional features. A final nonlinear analysis incorporating imperfections, as shown in Figure 30c, produced a realistic deflection profile. Von Mises stress results (Figure 31) show peak stresses near perforations, aligning with failure zones in tested specimens.
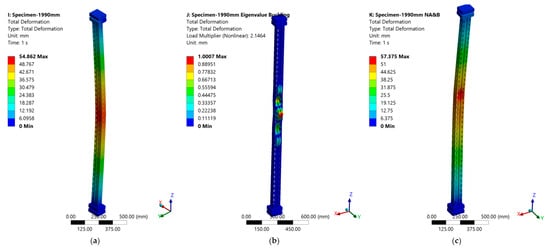
Figure 30.
TS-1990 specimen results: (a) nonlinear static analysis; (b) first buckling mode from eigenvalue analysis; (c) nonlinear analysis after eigenvalue analysis.
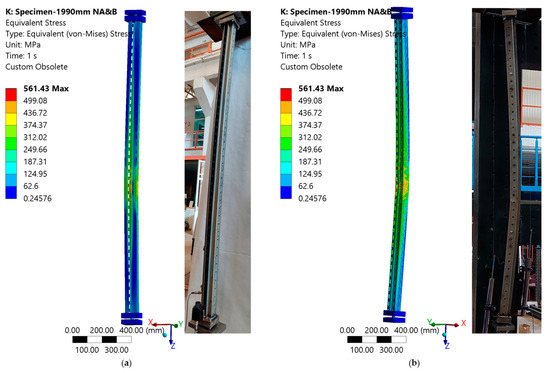
Figure 31.
Von Mises stress distribution for the TS-1990 specimen and comparison with experimental failure mechanism: (a) back view; (b) front view.
Load–displacement curves (Figure 32) show close agreement between numerical and experimental results, with minor differences in post-peak displacement. This multistep modeling approach proved effective in capturing the instability and failure behavior of cold-formed perforated profiles under axial compression.

Figure 32.
Load–displacement response comparison between experimental and numerical results for the TS-1990 specimen.
5. Design of Cold-Formed Thin-Walled Columns Under Axial Compression
This chapter presents the analytical design approach for cold-formed steel columns subjected to axial compression, based on the provisions of EN 1993-1-3 and EN 1993-1-1. The studied members are open-section perforated uprights commonly used in pallet rack systems. Their structural response is governed by the interaction of local, distortional, and global buckling modes, intensified by web perforations and thin-walled geometry.
5.1. Effective Width Method
Given this complex behavior, the Effective Width Method (EWM) is adopted as the recommended design procedure in Eurocode for cold-formed sections. This method accounts for the influence of local instabilities by reducing the effective area of individual plate elements in compression, leading to a reduced axial resistance.
Although EWM has limitations in predicting distortional or interactive buckling for perforated profiles, it remains the most widely used codified method due to its standardized framework and compatibility with current European design norms. Its stepwise application allows a conservative estimate of the column capacity, particularly when used alongside calibrated numerical and experimental validation.
For the studied upright profiles, the gross cross-sectional area is 555 mm2, while the net area, obtained by subtracting the perforated regions, is 511 mm2. In accordance with EN 1993-1-3, no further reduction to this net area was applied when calculating the effective cross-sectional area. This is justified by the fact that all plate elements (web, flanges, lips) have width-to-thickness ratios (b/t) lower than 30, which is below the limit slenderness for local buckling as defined in the Eurocode. Furthermore, the presence of a longitudinal stiffener in the web improves the local stability of the section. Therefore, the entire net area was considered fully effective in both EWM and DSM calculations.
The calculation steps followed for the current study are summarized in Table 2 and Table 3, based on EN 1993-1-3 Annex A, adapted for sections with openings.
Table 2.
Design of cold-formed thin-walled columns under axial compression using Effective Width Method (EWM).
Table 3.
Design of cold-formed thin-walled columns under axial compression using Direct Strength Method (DSM).
Note: This study was conducted between 2022 and 2023, when the applicable versions of the design standards were EN 1993-1-3:2006 [26] and AISI S100-16 [35]. Updated versions have been published since then, but were not available at the time of the analysis. The authors acknowledge these developments and will consider them in future work.
5.2. Direct Strength Method DSM
The Direct Strength Method (DSM) [34] provides a simplified yet robust approach for determining the axial compressive resistance of cold-formed steel members, especially those with complex cross-sectional geometries and perforations. Unlike the traditional Effective Width Method (EWM), which requires iterative reduction in individual flat elements based on local buckling, DSM allows the use of the entire gross or net cross-sectional area, while capturing instability effects through the calculation of non-dimensional slenderness and buckling mode-specific reduction factors.
In this study, DSM was applied in accordance with the design philosophy introduced in AISI S100 and conceptually aligned with EN 1993-1-3 provisions. The method uses elastic critical buckling loads (local, distortional, and global) to define the slenderness parameters that govern the reduction in axial capacity. These values can be obtained from analytical formulations or numerical tools such as CUFSM (Constrained and Unconstrained Finite Strip Method). Once the critical loads are known, the DSM enables a direct estimation of the nominal and design strengths without requiring an effective section reconstruction.
The applicability of DSM is particularly advantageous for perforated profiles, where the presence of holes complicates the use of EWM due to irregular plate boundaries and stress concentrations. In the tested uprights, DSM results showed very good agreement with experimental data, confirming that the interaction between buckling modes is properly captured and that the net section assumption is sufficiently conservative and realistic.
6. Results and Discussion
The comparative analysis between the experimental, numerical (FEM), and analytical (EWM; DSM) results is presented in Figure 33 and Table 4. The load–displacement curves illustrate the overall response of the three specimen groups under axial compression. Experimental results are plotted against the numerical predictions obtained through nonlinear finite element analysis.
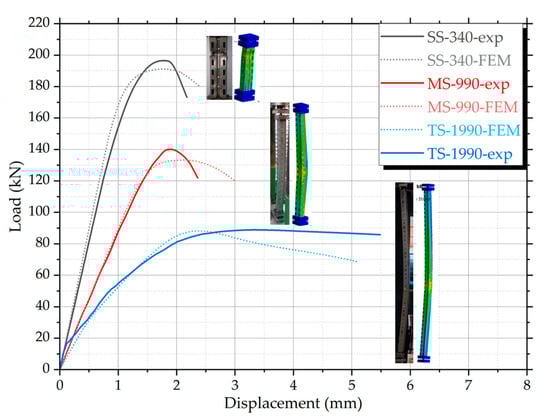
Figure 33.
Load–displacement curves for the three tested specimens (SS-340, MS-990, TS-1990): comparison between experimental results and finite element simulations (FEM).
Table 4.
Comparison between experimental, numerical (FEM), and analytical (EWM), (DSM) axial compressive resistance values for the tested specimens.
The behavior of the MS-990 series, both experimentally and numerically, confirmed the occurrence of distortional–global buckling interaction, particularly around mid-height, where localized deformation in the flanges and web transitioned into global lateral displacement. This confirms that members with intermediate slenderness are prone to coupled buckling phenomena, and justifies their inclusion as a distinct case in the study. The close agreement between test results and FEM simulations indicates that the adopted imperfection modeling strategy, based on eigenmodes, is suitable for capturing the nuanced instability mechanisms in perforated cold-formed sections.
Table 4 presents a comparative evaluation of axial compressive resistance values obtained through experimental testing, finite element modeling (FEM), and analytical methods based on the Effective Width Method (EWM) and the Direct Strength Method (DSM).
In all analyses, the net cross-sectional area was considered fully effective, without applying additional local reduction factors. This assumption is supported by several arguments. Firstly, all plate elements exhibit moderate slenderness, with width-to-thickness ratios below the critical limits established by EN 1993-1-3 for cold-formed unstiffened elements. Secondly, the presence of a longitudinal stiffener in the web significantly improves local stability, reducing the likelihood of premature buckling around perforations. Thirdly, the experimental results confirmed that no local tearing or early failure occurred in the web or flange zones near openings. All observed failures developed through geometric instability rather than material failure. These findings validate the decision to apply the full net area in both the DSM-based design calculations and the finite element modeling, and they align with the excellent agreement between test results and numerical predictions.
For the SS-340 specimen, the experimental value (196 kN) slightly exceeds the numerical (185 kN) and analytical results (165 kN), as expected for a stocky, short member. This small variation can be attributed to conservative simplifications in both analytical and numerical models that slightly underestimate peak behavior.
In the case of MS-990, the experimental result (136 kN) is marginally higher than the FEM (134 kN) and analytical estimations (141 kN). This deviation can be explained by the post-processing of the test data, where the original load–displacement curves were smoothed to remove local noise, which may have artificially elevated the recorded peak load. Nonetheless, the agreement remains within acceptable bounds, and the results confirm the mixed buckling behavior—initiated by local or distortional effects and followed by global flexure.
For the TS-1990 specimen, all values cluster between 85 and 89 kN, indicating a dominant global buckling mode with minimal influence from local or distortional instability. The consistency across all methods supports the assumption of linear behavior and confirms that the tested geometry behaves as a slender member under axial compression.
An important justification in both FEM and DSM analyses is the use of the net cross-sectional area without applying local reduction factors. Although the profiles include perforations, the web and flange panels exhibit width-to-thickness ratios not exceeding 25, which is well below the critical slenderness limit (b/t ≈ 30) specified in EN 1993-1-3 for unstiffened elements. Furthermore, the presence of a longitudinal stiffener in the web enhances the stability of the critical panels, while the perforated zones behave as short cantilever segments without influencing the global stability.
Thus, it is technically justified to consider the entire net area as fully effective, both in numerical modeling and analytical estimation. The excellent agreement with experimental results supports this assumption and confirms that no significant local buckling compromised the resistance capacity.
7. Conclusions
This study investigated the axial compression behavior of cold-formed steel upright profiles with perforated webs and longitudinal stiffeners, commonly used in industrial pallet racking systems. Based on a combined experimental, numerical, and analytical approach, the following technical conclusions can be drawn:
- Buckling modes are strongly dependent on member slenderness:
- Short specimens (SS-340) primarily exhibited local buckling near perforations.
- Medium-length specimens (MS-990) displayed distortional–global mode interaction.
- Tall specimens (TS-1990) were governed by global flexural buckling, with no significant local deformation.
- The finite element models developed in ANSYS accurately reproduced the following:
- Load–displacement behavior.
- Deformation patterns.
- Stress concentration zones near perforations, confirming the validity of the material calibration and boundary condition modeling.
- The Direct Strength Method (DSM) provided the closest agreement with experimental results, especially for the MS-990 and TS-1990 specimens. Specifically, DSM predictions for MS-990 differed by +3.7%, and for TS-1990 by –4.5%, relative to experimental peak loads. These values were identical to those obtained using EWM in this case, but this should be interpreted with caution due to the idealized assumptions used. DSM’s ability to incorporate elastic critical loads and full net section properties makes it generally more reliable than EWM in predicting buckling strength for perforated members.
- The Effective Width Method (EWM), while conservative, remains suitable for design purposes but may significantly underestimate capacity in members where distortional buckling and global modes dominate.
- Despite the presence of perforations, the net cross-sectional area could be considered fully effective in both FEM and DSM analyses for the specific profiles tested, due to the following factors:
- Moderate width-to-thickness ratios (b/t < 30).
- The stabilizing effect of the longitudinal web stiffener.
- The absence of premature local failures the experimental and numerical results.
However, this conclusion applies only to the tested cross-sections and slenderness levels. Caution is advised when extending this assumption to more slender profiles or different perforation configurations, as local effects may become more significant.
- 5.
- The combination of full-scale testing and calibrated FEM analysis offers a robust design benchmark for future parametric studies and code development related to cold-formed perforated sections.
8. Future Research
The present investigation lays the groundwork for further studies focused on optimizing the structural performance of perforated upright members in industrial pallet racks. The validated finite element model, supported by experimental results and analytical assessments, can be confidently used in a series of parametric studies aimed at enhancing the cross-sectional geometry of cold-formed steel uprights. By systematically varying geometric parameters (e.g., flange width, lip length, perforation layout), future work will identify improved design configurations that maximize axial capacity while ensuring manufacturability and cost-efficiency.
Another important direction involves the development of retrofitting techniques to strengthen existing racking systems installed over three decades ago. Many of these legacy structures were designed according to outdated standards and may not meet current performance or safety requirements under seismic or accidental loading. The failure modes observed in this study—especially distortional–global interaction—highlight potential vulnerabilities in such systems. Future work will investigate the use of stiffeners, bracing elements, or local reinforcements to increase buckling resistance and delay instability. The FEM model calibrated in this study will support quantitative evaluation of these strengthening techniques.
Research will also be extended to include additional structural components such as beam-to-upright connections and lateral bracing systems, as well as the global seismic behavior of full pallet rack assemblies. Through dynamic simulations and testing on subassemblies, performance-based design recommendations will be developed to improve the resilience and ductility of storage racks under seismic or accidental loads.
In this context, the validated FEM framework may be adapted to simulate dynamic and seismic loading, incorporating time-dependent effects, strain-rate sensitivity, and cyclic degradation. These developments represent a logical extension of the current static analysis toward more comprehensive performance evaluation under extreme loading conditions.
Author Contributions
Conceptualization, G.T. and N.T.; methodology, S.I.; software, G.T.; validation, N.T.; formal analysis, G.T.; investigation, S.I.; resources, G.T.; data curation, S.I.; writing—original draft preparation, G.T.; writing—review and editing, N.T.; visualization, S.I.; supervision, G.T.; project administration, G.T.; funding acquisition, G.T. All authors have read and agreed to the published version of the manuscript.
Funding
The experimental work was financially supported under contract TUIASI 27233/15.09.2021. The APC was funded by TUIASI.
Institutional Review Board Statement
Not applicable.
Informed Consent Statement
Not applicable.
Data Availability Statement
The data that support the findings of this study are available from the corresponding author upon request.
Acknowledgments
The author gratefully acknowledges the support and collaboration of SKAT KART SRL, Romania, for providing the materials necessary for this research.
Conflicts of Interest
The authors declare no conflicts of interest. The funders had no role in the design of the study; in the collection, analyses, or interpretation of data; in the writing of the manuscript; or in the decision to publish the results.
References
- Hancock, G.J. Cold-Formed Steel Structures. J. Constr. Steel Res. 2003, 59, 473–487. [Google Scholar] [CrossRef]
- Schafer, B.W. Cold-Formed Steel Structures around the World. Steel Constr. 2011, 4, 141–149. [Google Scholar] [CrossRef]
- Tunca, O.; Erdal, F.; Sağsöz, A.E.; Çarbaş, S. Structural Features of Cold-Formed Steel Profiles. Chall. J. Struct. Mech. 2018, 4, 77. [Google Scholar] [CrossRef]
- Hancock, G.J. Cold-Formed Steel Structures: Research Review 2013–2014. Adv. Struct. Eng. 2016, 19, 393–408. [Google Scholar] [CrossRef]
- Crisan, A.; Ungureanu, V.; Dubina, D. Behaviour of Cold-Formed Steel Perforated Sections in Compression. Part 1—Experimental Investigations. Thin-Walled Struct. 2012, 61, 86–96. [Google Scholar] [CrossRef]
- Baldassino, N.; Bernuzzi, C.; di Gioia, A.; Simoncelli, M. An Experimental Investigation on Solid and Perforated Steel Storage Racks Uprights. J. Constr. Steel Res. 2019, 155, 409–425. [Google Scholar] [CrossRef]
- Neiva, L.H.d.A.; Sarmanho, A.M.C.; Faria, V.O.; de Souza, F.T.; Starlino, J.A.B. Numerical and Experimental Analysis of Perforated Rack Members under Compression. Thin-Walled Struct. 2018, 130, 176–193. [Google Scholar] [CrossRef]
- Miyazaki, J.P.d.L.; de Carvalho, A.S.; Martins, C.H.; Rossi, A. Evaluation of the Interaction between Distortional–Global Buckling in Perforated Cold-Formed Steel Rack Sections. Structures 2023, 54, 808–824. [Google Scholar] [CrossRef]
- Ren, C.; He, Y.; Wu, Z.; He, W.; Dai, L. Experiments and Numerical Predictions of Cold-Formed Steel Members with Web Perforations under Combined Compression and Minor Axis Bending. Eng. Struct. 2022, 256, 114022. [Google Scholar] [CrossRef]
- Taheri, E.; Firouzianhaji, A.; Usefi, N.; Mehrabi, P.; Ronagh, H.; Samali, B. Investigation of a Method for Strengthening Perforated Cold-Formed Steel Profiles under Compression Loads. Appl. Sci. 2019, 9, 5085. [Google Scholar] [CrossRef]
- Bernuzzi, C.; Pellegrino, C.; Simoncelli, M. Characterization of Existing Steel Racks via Dynamic Identification. Buildings 2021, 11, 603. [Google Scholar] [CrossRef]
- Pham, D.K.; Pham, S.H.; Pham, V.B.; Pham, C.H.; Hancock, G.J. Direct Strength Design of Cold-Formed Channels with Web Openings in Shear. J. Struct. Eng. 2023, 149, 04023022. [Google Scholar] [CrossRef]
- Martins, A.D.; Camotim, D.; Dinis, P.B. On the Distortional-Global Interaction in Cold-Formed Steel Columns: Relevance, Post-Buckling Behaviour, Strength and DSM Design. J. Constr. Steel Res. 2018, 145, 449–470. [Google Scholar] [CrossRef]
- Ye, J.; Quan, G.; Yun, X.; Guo, X.; Chen, J. An Improved and Robust Finite Element Model for Simulation of Thin-Walled Steel Bolted Connections. Eng. Struct. 2022, 250, 113368. [Google Scholar] [CrossRef]
- Zhou, X.; Xiang, Y.; Shi, Y.; Xu, L.; Zou, Y. Simplified Design Method of Cold-Formed Steel Columns with Built-up Box Sections. Eng. Struct. 2021, 228, 111532. [Google Scholar] [CrossRef]
- Shaker, F.M.F.; Mamdooh, Z.; Deifalla, A.; Yehia, M.M. Experimental Investigations of the Behavior of Stiffened Perforated Cold-Formed Steel Sections Subjected to Axial Compression. Buildings 2022, 12, 812. [Google Scholar] [CrossRef]
- Dai, L.; Chen, Y.; Cheng, L.; Ren, C. Buckling Behavior and Design of Cold-Formed Thin-Walled Steel Storage Rack Upright Frames. Structures 2025, 75, 108685. [Google Scholar] [CrossRef]
- EN 10149-2:2013; Hot Rolled Flat Products Made of High Yield Strength Steels for Cold Forming Part 2: Technical Delivery Conditions for Thermomechanically Rolled Steels. BSI Standards Publication: London, UK, 2013.
- Vujanac, R.; Miloradović, N.; Vulović, S.; Pavlović, A. A Comprehensive Study into the Boltless Connections of Racking Systems. Metals 2020, 10, 276. [Google Scholar] [CrossRef]
- Andrade, T.L.; Júnior, P.A.A.M.; de Paula, W.A. Tensile Test: Comparison Experimental, Analytical and Numerical Methods. Int. J. Adv. Eng. Res. Sci. 2017, 4, 87–90. [Google Scholar] [CrossRef]
- Ungureanu, V.; Luka·ević, I.; Both, I.; Dubina, D. Numerical Investigations on Built-up Cold-formed Steel Beams for Long Spans. Ce/Pap. 2021, 4, 2277–2284. [Google Scholar] [CrossRef]
- Cabezas, E.E.; Celentano, D.J. Experimental and Numerical Analysis of the Tensile Test Uing Sheet Specimens. In Proceedings of the First South-American Congress on Computational Mechanics—MECOM, Santa Fe, Argentina, 28–31 October 2002. [Google Scholar]
- Mahmood, A.; Al-Samarai, R.A.; Fadhil, N.A. Comparative Study on Mechanical Properties of Steel by Numerical Analysis and Experimental Tests. REVISTA AUS 2019, 26, 333–340. [Google Scholar] [CrossRef]
- GP 128-2014; Guide for the Calculation and Design of Steel Rack Structures for Display and Storage in Commercial Spaces Subject to Seismic Action; More Doctors for Rural Australia Program (MDRAP). Oxford University Press: Oxford, UK, 2014. (In Romanian)
- EN 1993-1-1; Eurocode 3: Design of Steel Structures—Part. 1-1: General. Rules and Rules for Buildings. European Comittee for Standardization: Brussels, Belgium, 2005.
- EN 1993-1-3:2006; Eurocode 3: Design of Steel Structures, Part. 1.3: General. Rules, Supplementary Rules for Cold-Formed Thin Gauge Members and Sheeting. European Comittee for Standardization: Brussels, Belgium, 2006.
- EN 1090-1:2009+A1:2011; Execution of Steel Structures and Aluminium Structures—Part 1: Requirements for Conformity Assessment of Structural Components. European Standardisation Organisations: Brussels, Belgium, 2011.
- EN 1090-2:2018+A1:2024; Execution of Steel Structures and Aluminium Structures—Part 2: Technical Requirements for Steel Structures. European Standardisation Organisations: Brussels, Belgium, 2024.
- EN 15512:2020+A1:2022; Steel Static Storage Systems—Adjustable Pallet Racking Systems—Principles for Structural Design. European Standardisation Organisations: Brussels, Belgium, 2022.
- ISO 6892-1:2019; Metallic Materials—Tensile Testing—Part 1: Method of Test at Room Temperature. International Organization for Standardization. International Organization for Standardization: Geneva, Switzerland, 2019.
- Li, Z.J.; Gong, J.; Shao, Y.B.; Huang, W.F.; Zhang, X. Axial Compressive Behaviors of Multi-Cavity Concrete-Filled Double-Skin Tubular Stub Columns. J. Constr. Steel Res. 2024, 216, 108619. [Google Scholar] [CrossRef]
- Petrík, A.; Ároch, R. Usage of True Stress-Strain Curve for FE Simulation and the Influencing Parameters. IOP Conf. Ser. Mater. Sci. Eng. 2019, 566, 012025. [Google Scholar] [CrossRef]
- Ansys | Engineering Simulation Software. Available online: https://www.ansys.com/ (accessed on 19 October 2021).
- EN 1993-1-5:2006/A1:2017; Eurocode 3: Design of Steel Structures—Part. 1-5: Part 1-5: Plated structural elements. European Comittee for Standardization: Brussels, Belgium, 2017.
- AISI S100-16; North American Specification for the Design of Cold-Formed Steel Structural Members. American Iron an Steel Institute AISI: Washington, DC, USA, 2016.
Disclaimer/Publisher’s Note: The statements, opinions and data contained in all publications are solely those of the individual author(s) and contributor(s) and not of MDPI and/or the editor(s). MDPI and/or the editor(s) disclaim responsibility for any injury to people or property resulting from any ideas, methods, instructions or products referred to in the content. |
© 2025 by the authors. Licensee MDPI, Basel, Switzerland. This article is an open access article distributed under the terms and conditions of the Creative Commons Attribution (CC BY) license (https://creativecommons.org/licenses/by/4.0/).