1. Introduction
University libraries represent crucial spaces for academic research, independent learning, and intellectual collaboration. The lighting environment in these settings significantly impacts students’ cognitive performance, visual comfort, and overall health. Recent studies underscore that poor lighting design—particularly issues such as uneven illuminance, excessive glare, and inefficient use of natural light—adversely affects learning outcomes and increases energy consumption in university libraries [
1,
2]. Specifically, uneven illumination distribution has been linked to visual discomfort and reduced reading efficiency by as much as 30% [
3]. Furthermore, inadequate natural lighting contributes to increased dependency on artificial lighting, exacerbating energy inefficiency and environmental impact [
4].
Despite the acknowledged importance of optimizing library lighting, existing design practices in higher education institutions often fail to integrate key lighting variables comprehensively. Most studies have traditionally focused on singular aspects, such as enhancing energy efficiency through advanced daylighting technologies [
5] or improving human-centric lighting design to support circadian rhythms [
6]. However, a fragmented approach addressing either visual comfort or energy conservation separately fails to produce solutions that holistically enhance the library environment. As noted by recent literature, there is an increasing call for integrated multi-objective optimization methods capable of simultaneously addressing visual comfort, energy savings, and lighting uniformity [
1,
2].
To bridge this critical research gap, the present study aims to develop and validate a comprehensive multi-objective optimization framework specifically tailored to improving natural lighting in university library reading areas. The research employs the non-dominated sorting genetic algorithm-II (NSGA-II), renowned for effectively resolving complex multi-objective scenarios, thereby ensuring balanced trade-offs among competing objectives such as visual comfort, illumination uniformity, and energy consumption [
7]. The primary objectives of this study are (1) to identify and model key lighting variables—including desktop illuminance, color temperature, background reflectance, and screen luminance—that significantly influence the visual and environmental quality of library reading spaces; (2) to implement the NSGA-II optimization method to simultaneously enhance illumination uniformity, reduce energy consumption, and improve visual comfort; and (3) to validate the effectiveness of the proposed optimization model through rigorous simulation and empirical experimentation.
The value of this study lies in its novel integration of multiple critical lighting parameters within a unified optimization framework, addressing previously neglected interactions among visual comfort, energy savings, and lighting uniformity. The outcomes of this research offer significant practical insights, providing actionable guidelines for architects, designers, and facility managers to create healthier, more energy-efficient, visually comfortable learning environments in higher education libraries. Ultimately, this study contributes toward the advancement of sustainable and human-centric architectural practices in educational settings.
2. Literature Review
The optimization of natural lighting design in libraries is a hot topic in current academic research. In terms of lighting technology, Whang et al. (2020) developed an efficient lighting system that uses a special parabolic reflector to guide sunlight into the indoor space, significantly improving the indoor brightness and uniformity [
8]. Tseng et al. developed a free-form lens system to optimize the transmission and distribution of natural light and improve the indoor lighting effect [
5]. Secondly, in terms of humanized lighting design, Alkhatatbeh and Asadi pointed out that reasonable architectural design can better meet the needs of human biorhythms and effectively improve the comfort and work efficiency of residents [
6]. Golovkina and Ryazanova proposed a natural lighting design that integrates plant systems into public spaces, which can not only improve the natural lighting effect but also improve people’s psychological comfort [
9]. Although these studies are technologically advanced, they usually only focus on a single factor and lack comprehensive consideration of multiple lighting factors. Most of the existing lighting equipment research has failed to solve the comprehensive optimization problem of multiple factors at the same time, limiting its practical application effect.
In response to this situation, in recent years research on the optimization of library lighting environments has gradually focused on multi-objective optimization methods. For example, Wen et al. used genetic algorithms to explore the impact of shading strategies on daylight utilization and visual comfort in university libraries [
1]; however, this study was limited to a single building parameter and did not fully consider the interaction between multiple lighting variables (such as color temperature, desktop illumination, and screen brightness). In addition, Jia et al. proposed a new method to optimize indoor daylighting to improve lighting uniformity [
2]. Although the lighting effect was enhanced, its comprehensive impact on visual comfort and energy consumption was not systematically evaluated. At the same time, Hu conducted a parametric dynamic daylighting design study in large buildings [
4]. Although it effectively reduced lighting energy consumption, it lacked a detailed analysis of the visual comfort of specific reading areas in the library. These studies have made important progress in their respective fields, but due to the lack of comprehensive coordination of visual comfort, energy efficiency, and lighting uniformity, they are still unable to provide a complete and comprehensive solution for the lighting design of university libraries.
However, some recent studies have made more in-depth explorations in methods. For example, Brembilla et al. verified the reliability of natural lighting methods based on climate simulation by measuring long-term daylight data, demonstrating the value of combining field measurements with simulations to improve design accuracy [
10]. Brzezicki effectively improved the uniformity of daylight illumination and visual comfort in the space by studying physical components in office environments (such as light sheds and translucent ceilings) [
11]. Although these studies are not directly targeted at library spaces, their methods and results provide important references for more comprehensive natural lighting designs.
Therefore, this study aims to make up for the above research deficiencies and proposes a comprehensive multi-objective optimization framework based on the NSGA-II algorithm, taking into account multiple key lighting factors such as desktop illumination, color temperature, reflectivity, and screen brightness, and verifies its effectiveness through simulation experiments and actual measurements, aiming to simultaneously improve the visual comfort, lighting uniformity, and energy efficiency in the reading area of a university library. It is expected to provide a more scientific, comprehensive, and sustainable solution for the lighting design of the reading area of higher education libraries.
3. Theoretical Basis and Common Approaches to Library Lighting Design
Effective lighting design in university libraries significantly influences students’ reading comfort and visual performance. Natural lighting in library reading rooms primarily depends on the ratio between window area and floor area, which influences overall daylight availability. Recommended window-to-floor area ratios typically range between one-fourth to one-sixth, depending on specific design conditions, library orientation, and functional requirements [
12]. Therefore, determining an appropriate ratio requires careful consideration of individual building conditions, user demands, and spatial characteristics rather than relying on generalized standards.
In library environments, lighting adequacy must be carefully balanced to prevent excessive brightness, ensuring illumination uniformity and glare mitigation. Glare, characterized as visual discomfort or impairment caused by excessively bright sources or strong luminance contrasts, significantly impacts visual comfort and reading efficiency [
3]. Effective glare control strategies in library lighting design include directional lighting, indirect illumination, appropriate shading devices, and interior finishes with optimal reflectance properties [
13].
Various architectural typologies and spatial configurations dictate different lighting strategies. Several commonly adopted lighting design scenarios in academic libraries are well-documented:
- (1)
Unilateral side lighting: Typically applied in smaller rooms, with spans ranging from 8 to 9 m and a room height-to-depth ratio of approximately 1:2. This configuration is easy to implement but may create ventilation challenges [
12].
- (2)
Bilateral side lighting: Utilized in larger rooms with spans between 16 and 18 m, featuring windows on both walls. This arrangement usually maintains a height-to-depth ratio of around 1:4, providing improved uniformity of natural light [
12].
- (3)
Mixed lighting (skylights combined with side windows): Common in extensive single-story spaces, this design employs central skylights alongside side windows, effectively enhancing daylight distribution and reducing shadowed areas created by unilateral lighting systems [
2].
- (4)
Skylight roof lighting: Suitable for expansive single-story rooms, this approach delivers efficient and uniform daylight distribution. However, designers must address potential issues, including water leakage and thermal management [
2].
Despite these clearly defined lighting strategies, current research underscores persistent issues in university libraries, such as the inadequate utilization of natural lighting, uneven illumination, and significant glare problems. Library designs often overlook detailed lighting analyses during preliminary design phases, resulting in poorly arranged windows and inadequate considerations of spatial depth. Consequently, areas near windows may suffer overly intense lighting, while inner spaces experience insufficient illumination [
1].
Therefore, optimizing library lighting involves meticulous consideration of window placements, glazing properties, and internal reflectance characteristics. Libraries frequently employ indirect side lighting from skylights and windows oriented along the longitudinal axis, while transverse axis walls generally lack openings, reflecting traditional architectural approaches intended to minimize glare and maximize daylight penetration. Nonetheless, the effectiveness of such approaches is heavily dependent on building orientation, surrounding obstacles, and window designs, emphasizing the necessity for detailed, site-specific evaluations [
14].
Academic libraries typically evaluate lighting environments using indices such as illuminance, daylight factor, uniformity, and glare. Standards established by organizations such as the International Commission on Illumination (CIE) and national guidelines like GB50034-2013 [
15] recommend minimum daylight factors of 2%, average illuminance levels of no less than 450 lux, and a unified glare rating (UGR) below 22 for optimal visual comfort [
14]. Compliance with these standards ensures balanced lighting conditions that enhance reading efficiency and maintain student well-being.
To summarize, library lighting design necessitates precise, context-sensitive planning integrating architectural, environmental, and ergonomic considerations. Future designs should leverage comprehensive optimization frameworks, incorporating advanced multi-objective optimization techniques such as the non-dominated sorting genetic algorithm-II (NSGA-II), to simultaneously enhance visual comfort, illumination uniformity, and energy efficiency. This integrated approach significantly advances current practices by providing practical, innovative, and scientifically grounded design solutions for academic libraries.
4. Optimization Modeling and Solving for Natural Light Harvesting in Libraries
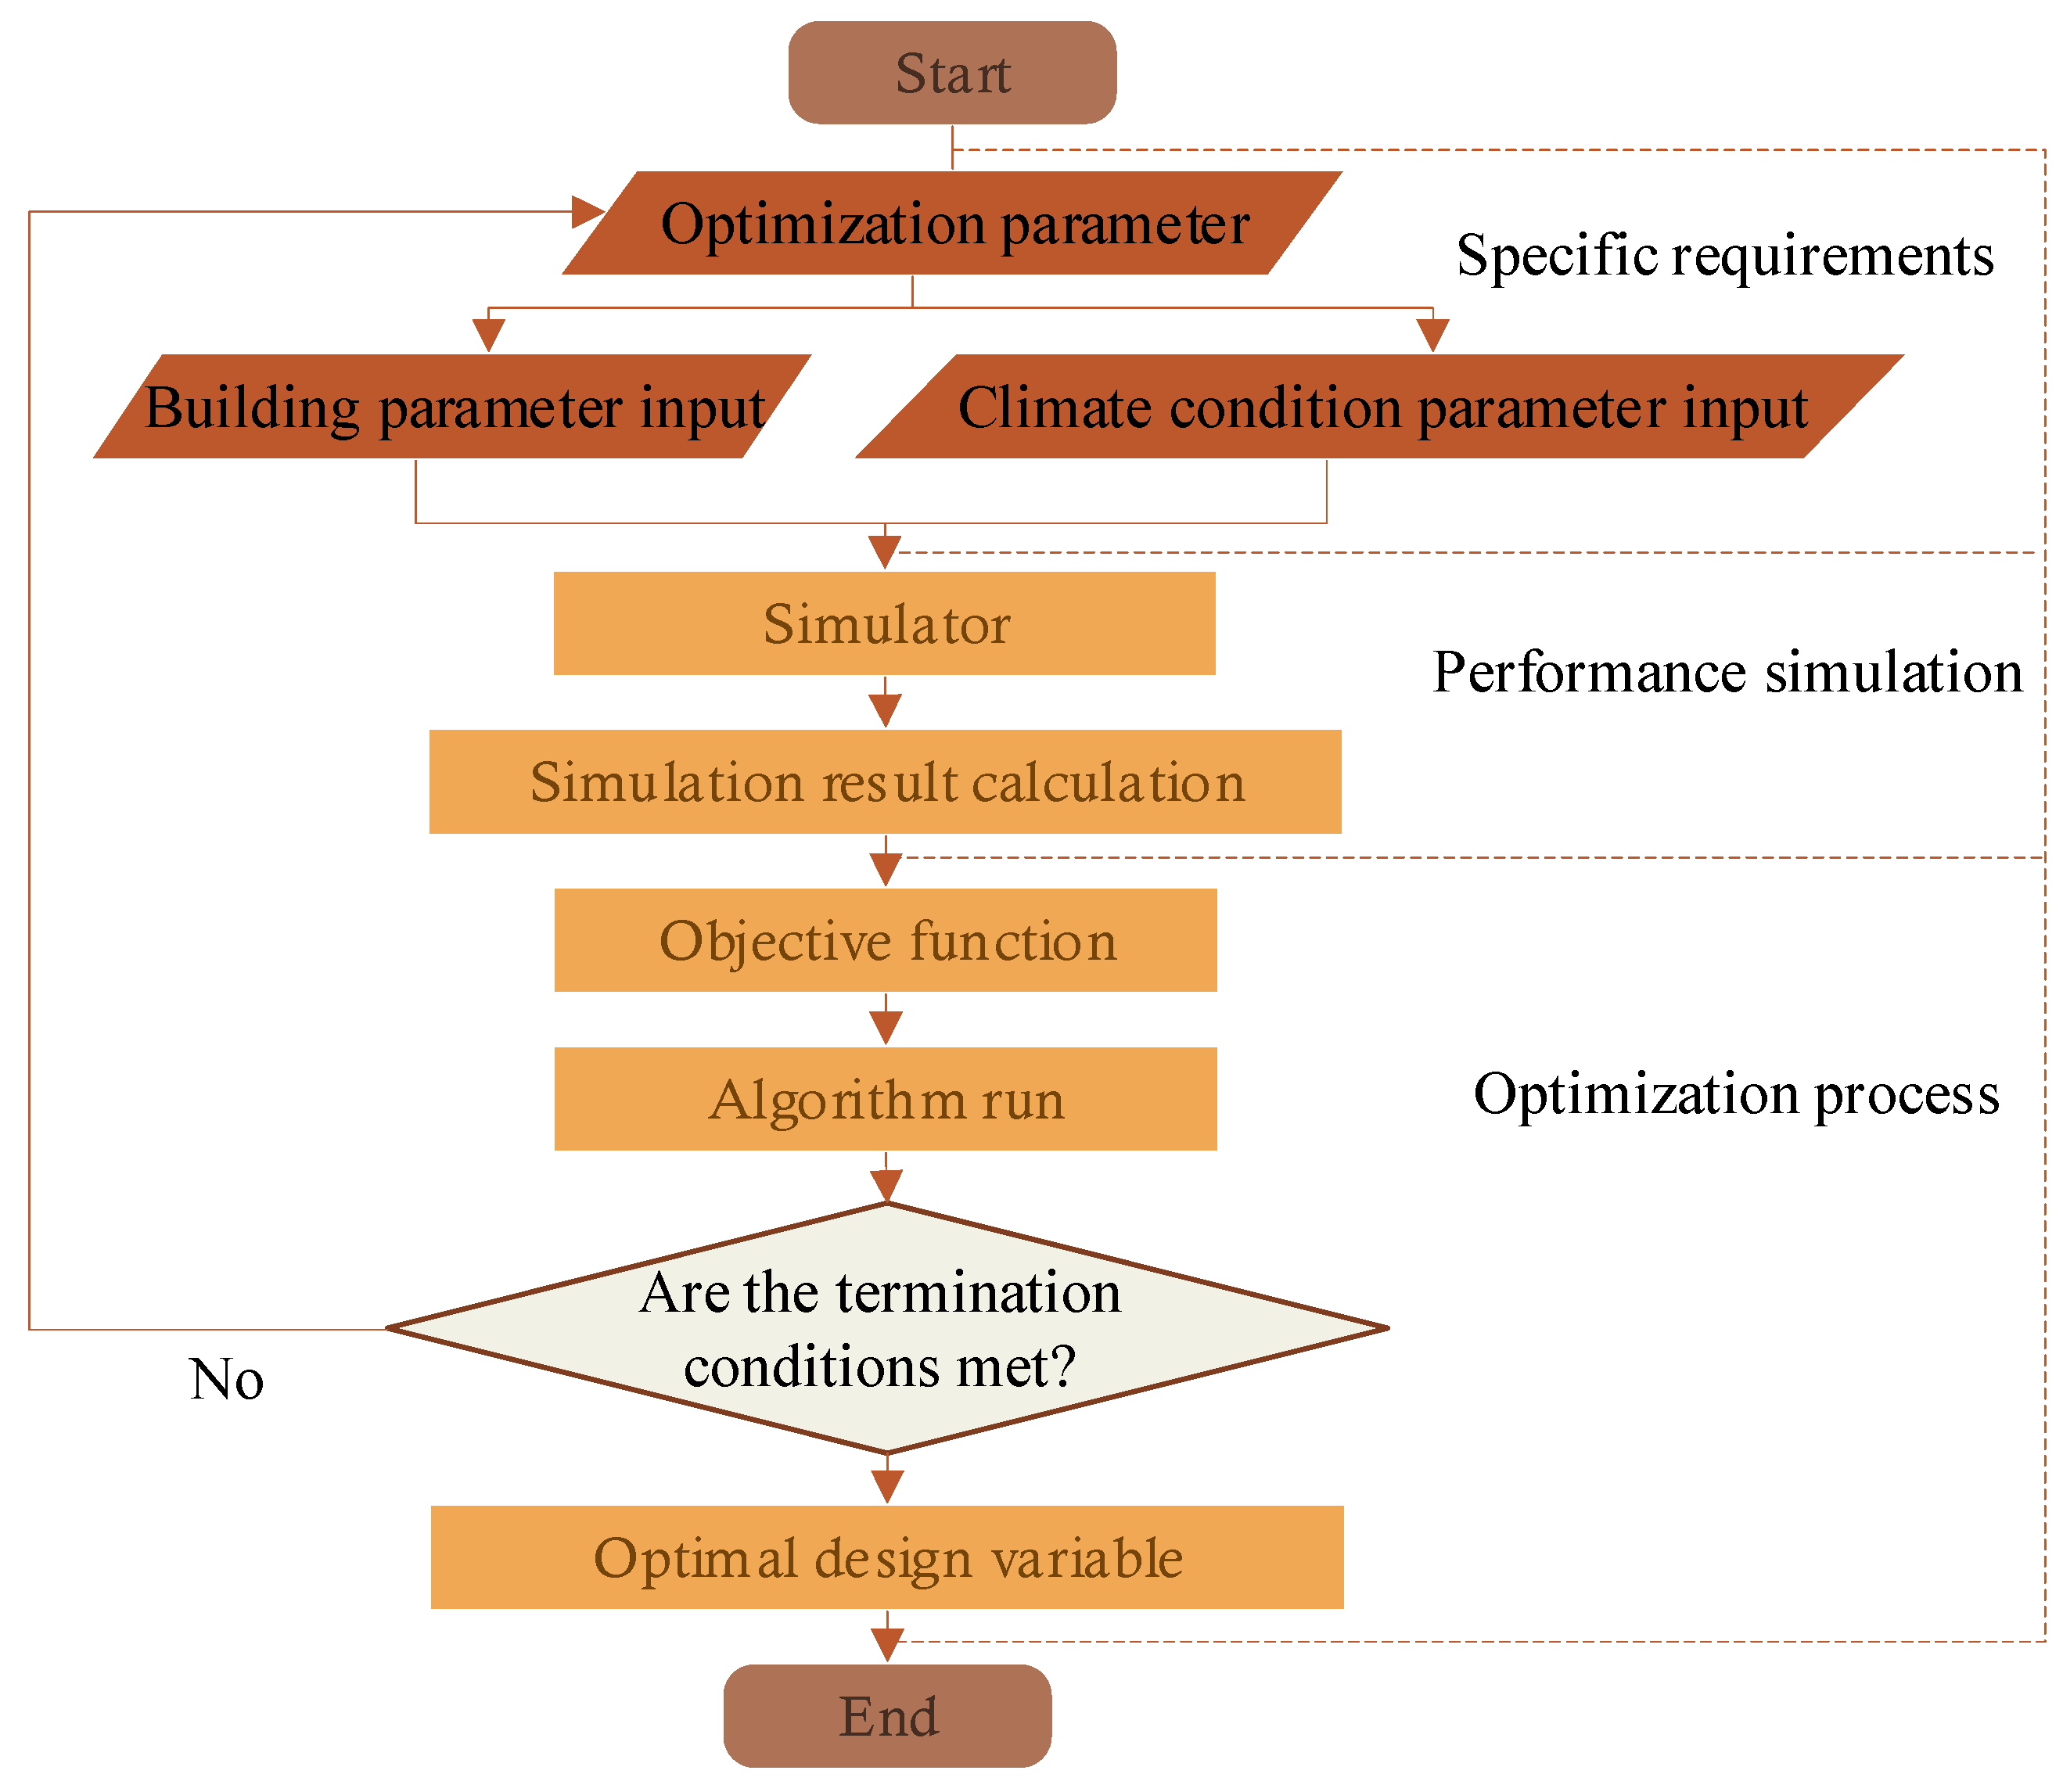
This study employs a multi-objective optimization algorithm to enhance the natural lighting environment in the reading areas of university libraries. The optimization process involves variable selection, objective function formulation, constraint definition, and solution methodology, aiming to improve lighting uniformity, energy efficiency, and visual comfort. As illustrated in
Figure 1, the proposed framework follows a structured optimization approach where multiple objectives are considered simultaneously to achieve an optimal lighting design solution.
4.1. Development of the Multi-Objective Optimization Model
4.1.1. Decision Variables
In optimizing the natural lighting environment of university libraries, the selection of decision variables directly influences the effectiveness of the model and the applicability of results. Based on existing research and on-site investigations of library lighting environments, this study identified four key decision variables, which were selected based on sensitivity analysis and expert recommendations, ensuring the most significant impact on lighting optimization while minimizing computational complexity [
16].
- (1)
Desktop illuminance (lux): Represents the lighting intensity on the reading desks. It directly affects reading comfort and visual fatigue.
- (2)
Correlated color temperature (K): The color temperature of lighting sources affects visual comfort and learning efficiency. The typical range is 3000–6000 K.
- (3)
Background reflectance: Refers to the reflective properties of walls and floors in reading areas, typically ranging from 0.1 to 0.9, affecting the uniformity of light distribution.
- (4)
Screen luminance: Brightness of electronic screens in reading areas, impacting visual comfort, typically set between 100 and 180 cd/m2.
These variables are chosen based on international standards, including recommendations from the International Commission on Illumination (CIE) and Chinese library construction standards (GB50034-2013). Reflectance values reference existing statistical studies of library interior materials [
17].
4.1.2. Formulation of Objective Functions
The optimization model includes the following three objectives: maximizing visual comfort, minimizing energy consumption, and maximizing illumination uniformity.
- (1)
To determine the weight coefficients for visual comfort parameters, this study employed the analytic hierarchy process (AHP). A total of eight professionals participated in the pairwise comparison process, including five lighting design experts (with over five years of experience in architectural daylighting design and LEED daylight credits evaluation) and three ergonomics specialists (faculty members in human factors engineering and visual ergonomics). These experts were selected based on their academic and professional backgrounds directly related to the subject matter of lighting environments in learning spaces.
Each expert was provided with a structured questionnaire developed according to the Saaty scale (1–9) and was asked to evaluate the relative importance of the following four visual comfort indicators: desktop illuminance, correlated color temperature, background reflectance, and screen luminance. The assessments were based on their knowledge of best practices in daylighting design standards (e.g., CIE 117, EN 12464-1) [
18,
19], prior project experience, and empirical evidence from peer-reviewed studies. The standardized questionnaire used for the pairwise comparison followed the classic Saaty 1–9 scale, where a score of 1 indicates equal importance, and 9 indicates extreme importance of one factor over another [
16,
20]. The questionnaire was structured into six pairwise comparisons among the four visual comfort criteria. Experts were asked to base their comparisons on international lighting guidelines, typical user comfort thresholds, and prior project-based observations. Each expert received a reference sheet summarizing empirical findings on visual comfort and ergonomic lighting levels.
A sample item in the questionnaire included “Between desktop illuminance and background reflectance, which factor contributes more to visual comfort in library reading spaces, and to what extent?”
The collected pairwise comparison matrices were synthesized using the geometric mean method to obtain a group judgment matrix. A consistency ratio (CR) was computed for each expert response, and only matrices with CR < 0.1 were included to ensure the reliability of the resulting weights. The final weight distribution was illuminance (0.40), color temperature (0.25), background reflectance (0.20), and screen luminance (0.15), which were subsequently used in the visual comfort objective function.
The objective function for visual comfort is defined as follows:
where
U(x1)represents the uniformity of illumination,
T(x2) denotes correlated color temperature,
R(x3) corresponds to background reflectance,
S(x4) signifies screen luminance,
ω1= 0.40, ω2= 0.25, ω3= 0.20, and ω4= 0.15 were determined through the analytic hierarchy process (AHP).
- (2)
Minimizing energy consumption: This goal focuses on maximizing natural light utilization to minimize artificial lighting use. Energy consumption was calculated based on lighting power density (W/m2) across different areas, aiming to reduce energy consumption to the lowest possible level.
- (3)
Maximizing lighting uniformity: Uniform lighting enhances reading comfort and learning efficiency. This study defines lighting uniformity as the ratio between minimum and average illuminance, ideally set between 0.6 and 0.75, following existing recommendations [
12].
4.1.3. Constraint Setting
Constraints: To ensure practical applicability, the following constraints were set:
Illuminance: 200 ≤ desktop illuminance ≤ 750 lux,
Color temperature: 3000 ≤ color temperature ≤ 6000 K,
Glare (unified glare rating, UGR): UGR ≤ 22,
Energy consumption: lighting power ≤ 7.6 W/m2,
Lighting uniformity: 0.6 ≤ uniformity ≤ 0.75.
4.2. Solution Approach
This study uses the non-dominated sorting genetic algorithm-II (NSGA-II) for multi-objective optimization. NSGA-II is selected because it effectively handles conflicting objectives and ensures a diverse and well-distributed set of solutions, widely applied in building lighting optimization.
The NSGA-II optimization process includes the following:
Step 1: population initialization: randomly generating initial solutions that satisfy all constraints.
Step 2: fitness evaluation: assessing each solution based on visual comfort, energy consumption, and uniformity.
Step 3: non-dominated sorting: classifying solutions into different non-dominated fronts according to Pareto optimality.
Step 4: selection, crossover, and mutation: selecting parent solutions using tournament selection; generating offspring using simulated binary crossover (SBX) and polynomial mutation.
Step 5: environmental selection: choosing solutions for the next generation based on crowding distance to maintain diversity.
Step 6: termination criteria: stopping the algorithm after a set number of iterations (e.g., 200) or when changes in the Pareto front are minimal.
4.3. Experimental Verification and Statistical Analysis
To verify the effectiveness of the optimization results, both simulated experiments and field measurements were conducted. Real-world data were collected from an existing university library to validate simulation accuracy. Statistical analyses, specifically paired
t-tests, were conducted to compare illuminance and lighting uniformity before and after optimization. Each measurement location included clear sample sizes and statistical parameters such as the mean, the standard deviation, t-values,
p-values, and 95% confidence intervals. The significance level was set at
p < 0.05, following established statistical validation practices [
7]. Additionally, Cohen’s d effect size was calculated for each measurement point, with all values exceeding 2.0, indicating large practical significance and reinforcing the robustness of the optimization outcomes [
21]. These steps ensure the reproducibility, credibility, and quantitative rigor of the experimental outcomes.
5. Library Simulation Modeling and Lighting Design Improvement
5.1. Library Simulation Modeling
In this study, Autodesk Revit was employed to construct a detailed building information model (BIM) of a university library. Revit was selected due to its robust parametric modeling capabilities [
22], enabling the precise definition of geometric and material properties essential for accurate daylighting analysis. The spatial configuration of the library, including floor heights, plan depth, window openings, and internal atriums, was modeled in detail to represent real architectural constraints and design scenarios.
Subsequently, the Revit model was exported in .fbx/.dwg format and imported into DIALux Evo13.1 (Version 5.13.1.0), a specialized lighting simulation software. DIALux was used for advanced daylight performance analysis, including evaluation of illuminance levels, glare (UGR), and lighting energy consumption [
23]. This two-step approach allowed the integration of architectural precision (via Revit) with high-resolution lighting performance analysis (via DIALux), ensuring both model fidelity and analytical rigor.
According to the library’s plan form contours, openings and depth ratios, floor height and the number of floors, and other data, as well as the location of the cut-through space and other spatial information, full consideration is given to the influence of the surrounding environment on the library’s natural lighting performance and energy consumption levels. The modeling of the library mainly includes the external shape of the library building scale, the number of floors and floor heights, and the internal spatial form, and different library forms are quickly generated by adjusting the control parameters to ensure real-time feedback of the data and the diversity of the generated form results.
5.1.1. External Form
For the construction of the geometric parametric model of the library building, the orientation is set as a design constant according to the specific base requirements. At the same time, the building scale, plan size, column spacing, floor height, number of floors, and other design parameters need to be set in line with the requirements of the library’s natural lighting performance, and then the library’s modeling logic generated to establish and the building’s external morphological model [
24,
25].
The area of the library is concentrated in 3000 m2, and a length-to-width ratio of about 1.5 is the common ratio of the building plan opening and depth, but because of the existence of the internal cutting and digging through the space the building’s profile corresponding to the corresponding area increases, and the typical value of the length ranges from 80 to 110 m, while the width of the common value of the range of 60 to 70 m. The design parameters should be set to meet the requirements of natural lighting performance of the library.
Library buildings usually use reinforced concrete structure, generally based on modulus considerations. A total of 6–9 m is used for economic column spacing and for structural considerations, 7.5–8.4 m of the frame structure belongs to the cost-effective, more scientific span range, and the corresponding 0.6–0.7 m beam height for public buildings is also acceptable. From the perspective of the library space considerations, if the span is too large it will lead to an increase in the beam height. From the perspective of library space, too large a span will lead to an increase in beam height and encroachment on the height of the vertical space of the building, which is not conducive to the generation of mobile spatial form; too small a span of columns is too tight and the spatial scale will be too tight, affecting the use of the column spacing of 7.5–8.4 m or so as it has a greater degree of flexibility, which is suitable for the more large-scale public buildings such as libraries.
According to the economic range of the plan size and column spacing of the library building, the span range of the plan length is selected to be around 10–15 spans, and the value range of the width span is 7–9 spans, and the library building with large depth is taken as the main object of study. This kind of library building has the most insufficient level of natural lighting in the internal space, so the difference between the length and the width of the typical geometric model is not as big as possible, and the spans of the length and the width are set as design constants, which can be designed and adjusted according to the specific floor area index and base form.
The number of floors of the library building is usually five, which can be adjusted according to the specific area requirements. Since 24 m is the dividing line between multi-story and high-story library buildings, it is more appropriate for the story height of five-story library buildings to be in the range of 4.2–4.8 m.
5.1.2. Parametric Modeling of Library Internal Spatial Configuration
The internal spatial configuration of the library is essential for achieving optimal natural lighting distribution and spatial efficiency [
26]. This section elaborates on the parametric modeling approach used to systematically generate the internal spatial morphology of the library.
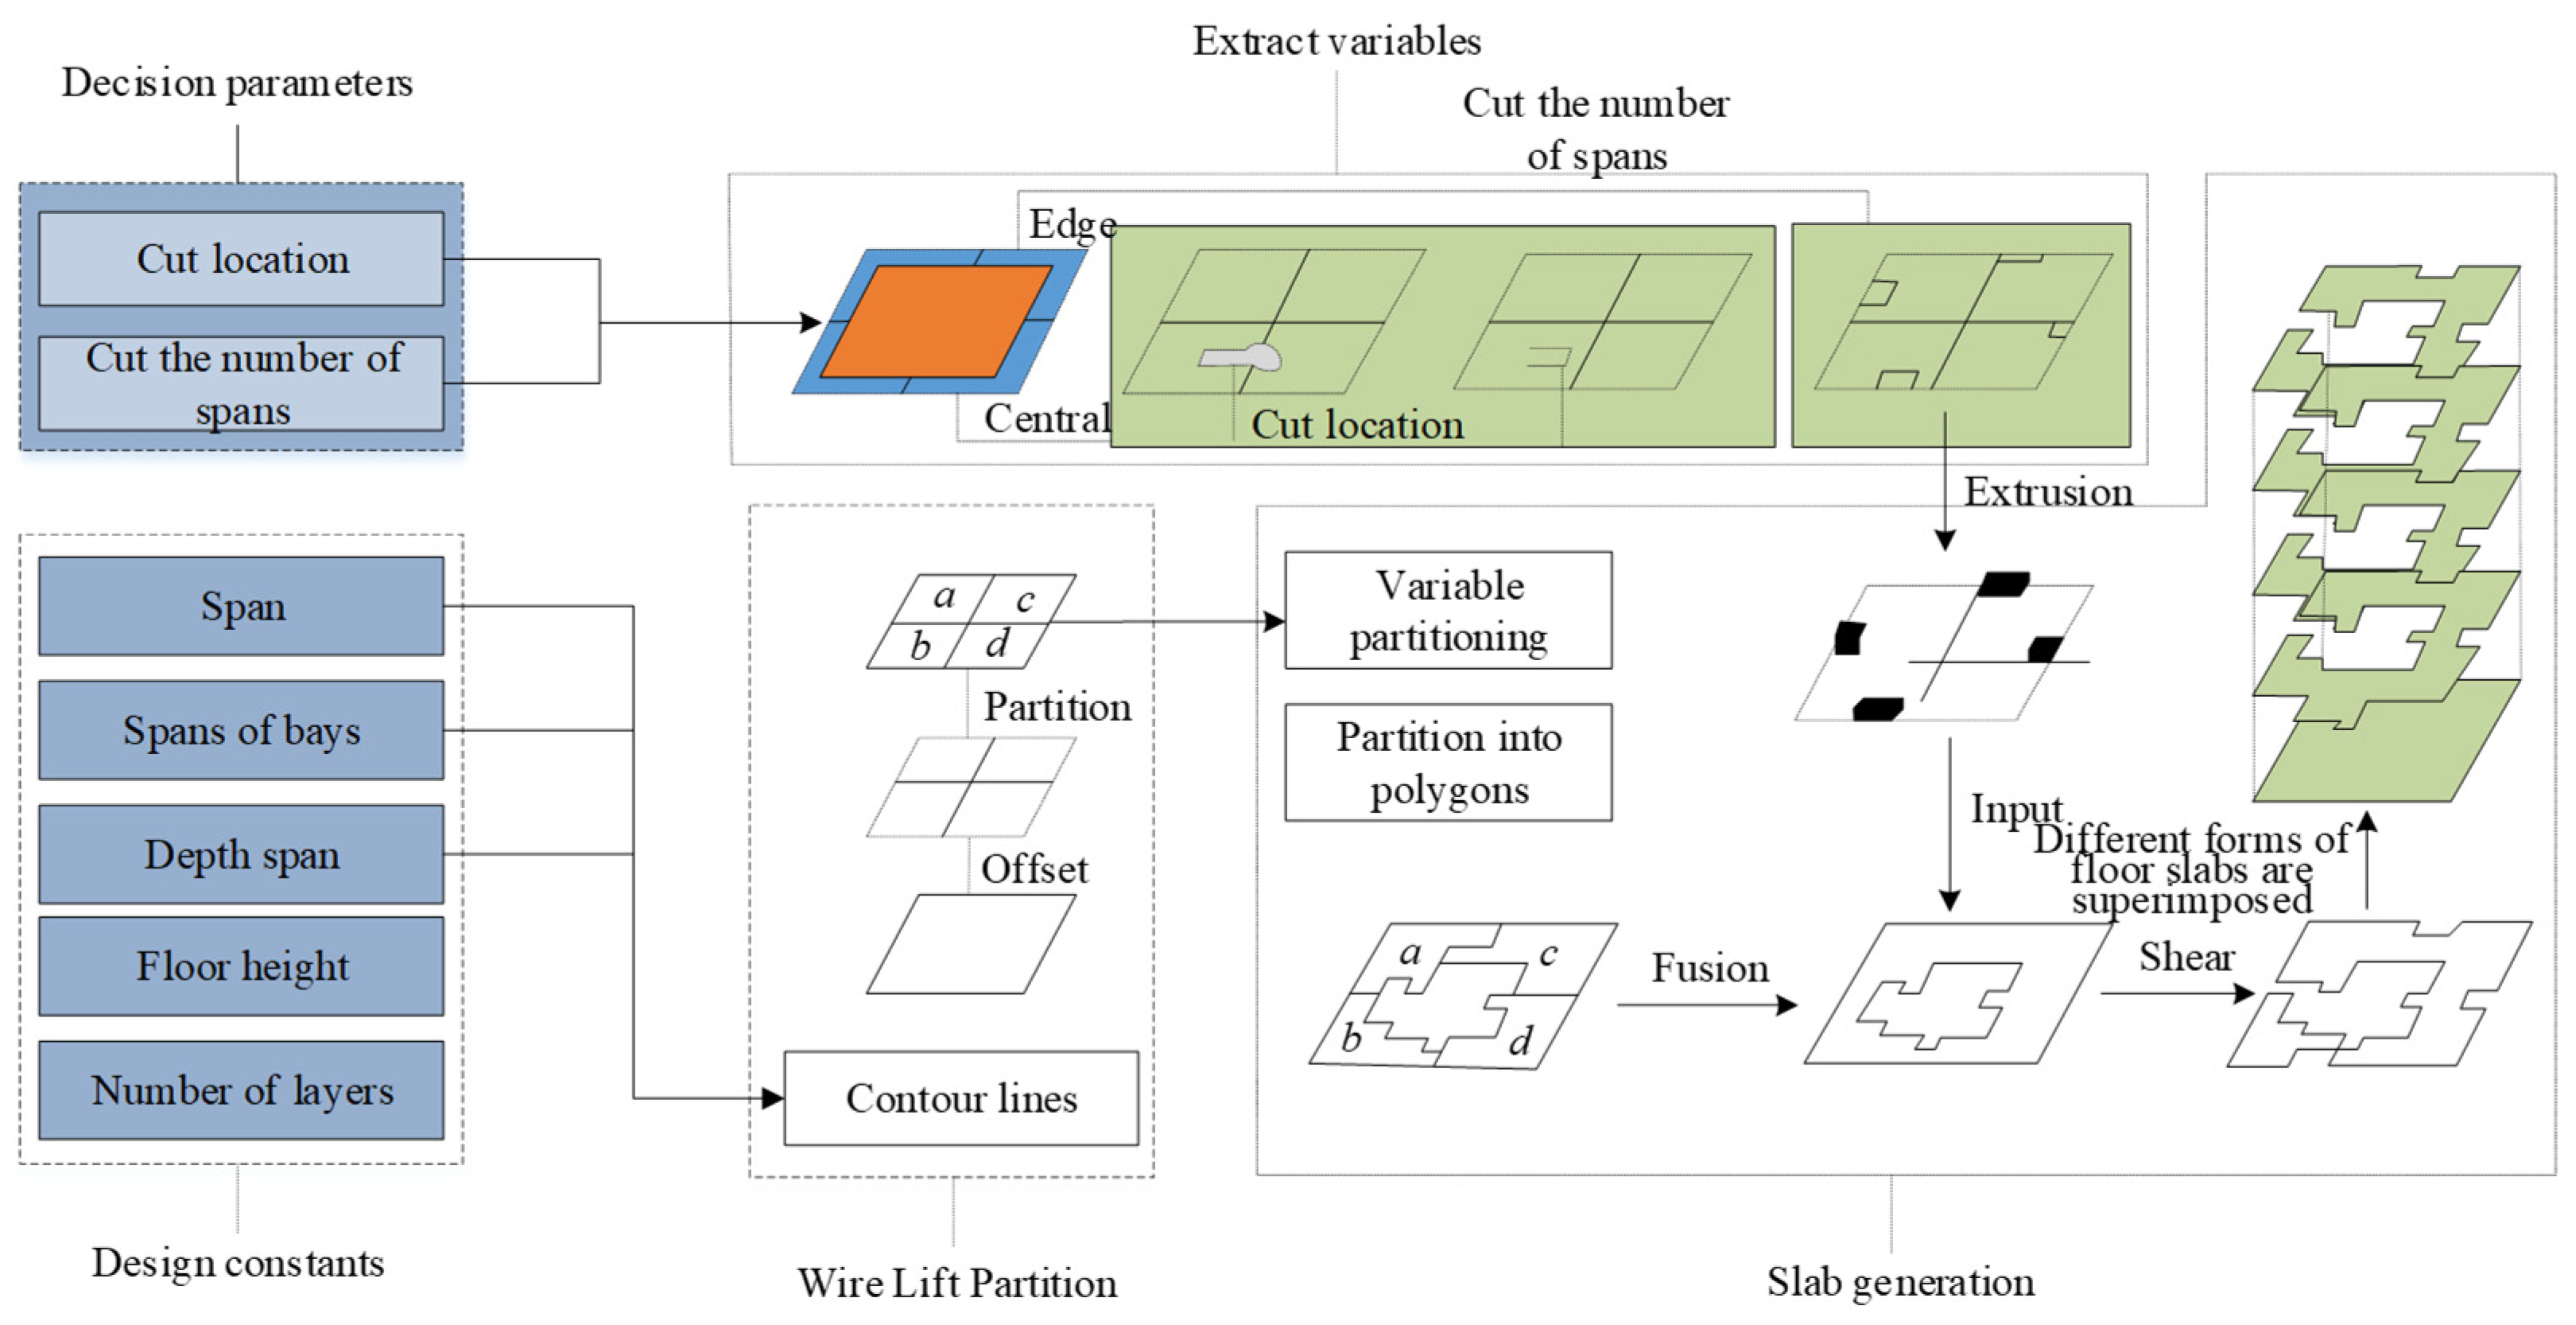
Figure 2 illustrates a schematic division of the internal floor area of the library, used as a foundation for the parametric generation of spatial forms.
In this parametric modeling process, the internal floor space is divided into four distinct regions (labeled a, b, c, and d) using the horizontal and vertical central axes intersecting at the midpoint of the library floor plan. Specifically, these four quadrants represent symmetrical partitions of the internal layout, allowing for individual and precise control over spatial alterations, such as vertical offsets and spatial cut-outs.
The peripheral spans surrounding these four central regions define the boundary areas utilized for creating atrium spaces or vertical connections between floors. Vertical cut-outs within these boundary spans are controlled through the following two key parameters:
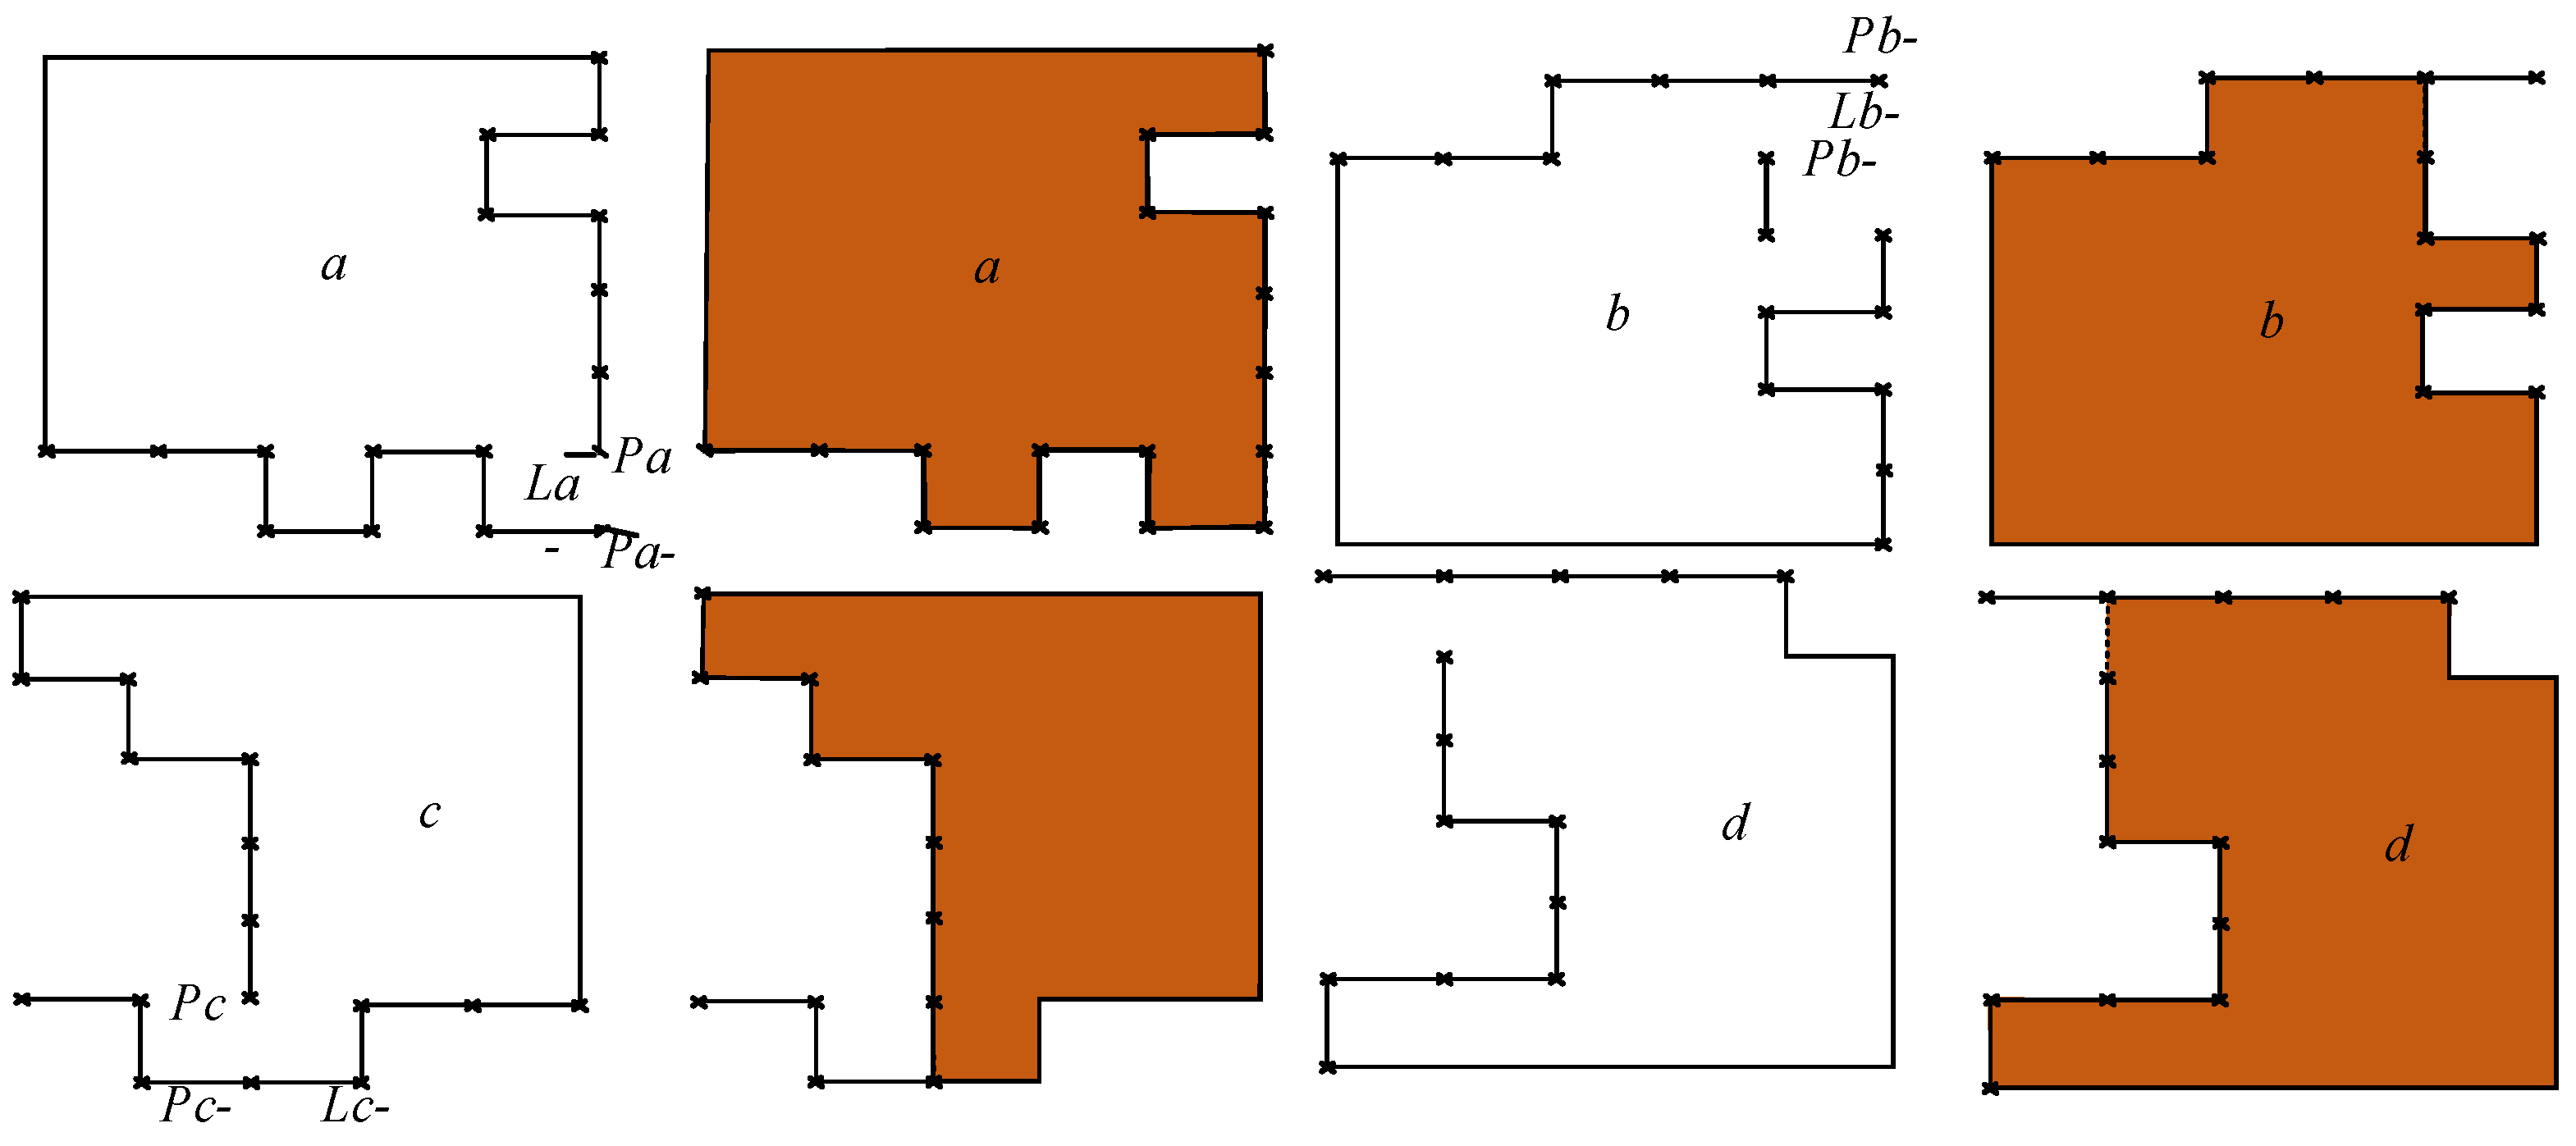
As illustrated clearly in
Figure 3, the internal parametric simulation uses precise geometric control points and reference lines to ensure spatial accuracy during dynamic form generation.
Horizontal control points are marked as Pa-i (where i = 1 to 5), with corresponding horizontal control lines labeled as La-i.
Vertical control points are labeled Pai (also i = 1 to 5), with respective vertical lines marked as Lai.
The spatial modeling logic works as follows:
When generating internal spatial voids (e.g., atriums or vertical openings), it is critical to maintain geometric consistency and ensure that each parameter adjustment logically influences space formation. Taking region a as an example:
If the vertical position (the Y-coordinate) of control point Pai is greater than either the horizontal coordinate (the X-coordinate) of the corresponding horizontal control point Pa-i, or the Y-coordinate of point Pa-i itself, then point Pai is extended horizontally to intersect line La-i. This generates a new intersection line, marked as La-i’, clearly indicating the adjusted boundary for vertical void spaces.
This parametric adjustment process is repeated sequentially from the outermost peripheral lines (La-1, La1) inward to the central lines (La-5, La5), gradually defining spatial void areas within the library layout.
After establishing these intersection lines (La-i’), the enclosed region is clearly delineated by connecting the adjusted boundary lines (La-1′ through La-5′, and similarly in vertical directions). This systematically forms the final internal spatial layer.
Similarly, this parametric logic is consistently applied to regions b, c, and d. Consequently, by iteratively adjusting these parameters, the internal morphology dynamically evolves into a coherent and functional spatial form, clearly supporting the objectives of improving natural lighting distribution, visual comfort, and spatial flexibility.
Based on the parametric modeling of the library’s spatial configuration described above, a baseline simulation environment was established to reflect the current lighting performance under existing architectural constraints. This digital model serves as the foundation for testing and applying the proposed multi-objective lighting optimization strategies. By integrating spatial geometry with lighting parameters such as window placement, reflectance, and surface materials, the model allows for detailed simulation and performance evaluation under varying daylight conditions.
5.2. Library Lighting Design Improvements
The following section presents the implementation of targeted lighting design improvements, focusing on the integration of optimization outcomes into the actual design scheme. These improvements include revised window dimensions and enhanced spatial configurations aimed at achieving better lighting uniformity, increased visual comfort, and reduced energy consumption. Empirical measurements and simulation validation are also discussed to verify the effectiveness of the optimization strategy.
5.2.1. Light Measurement
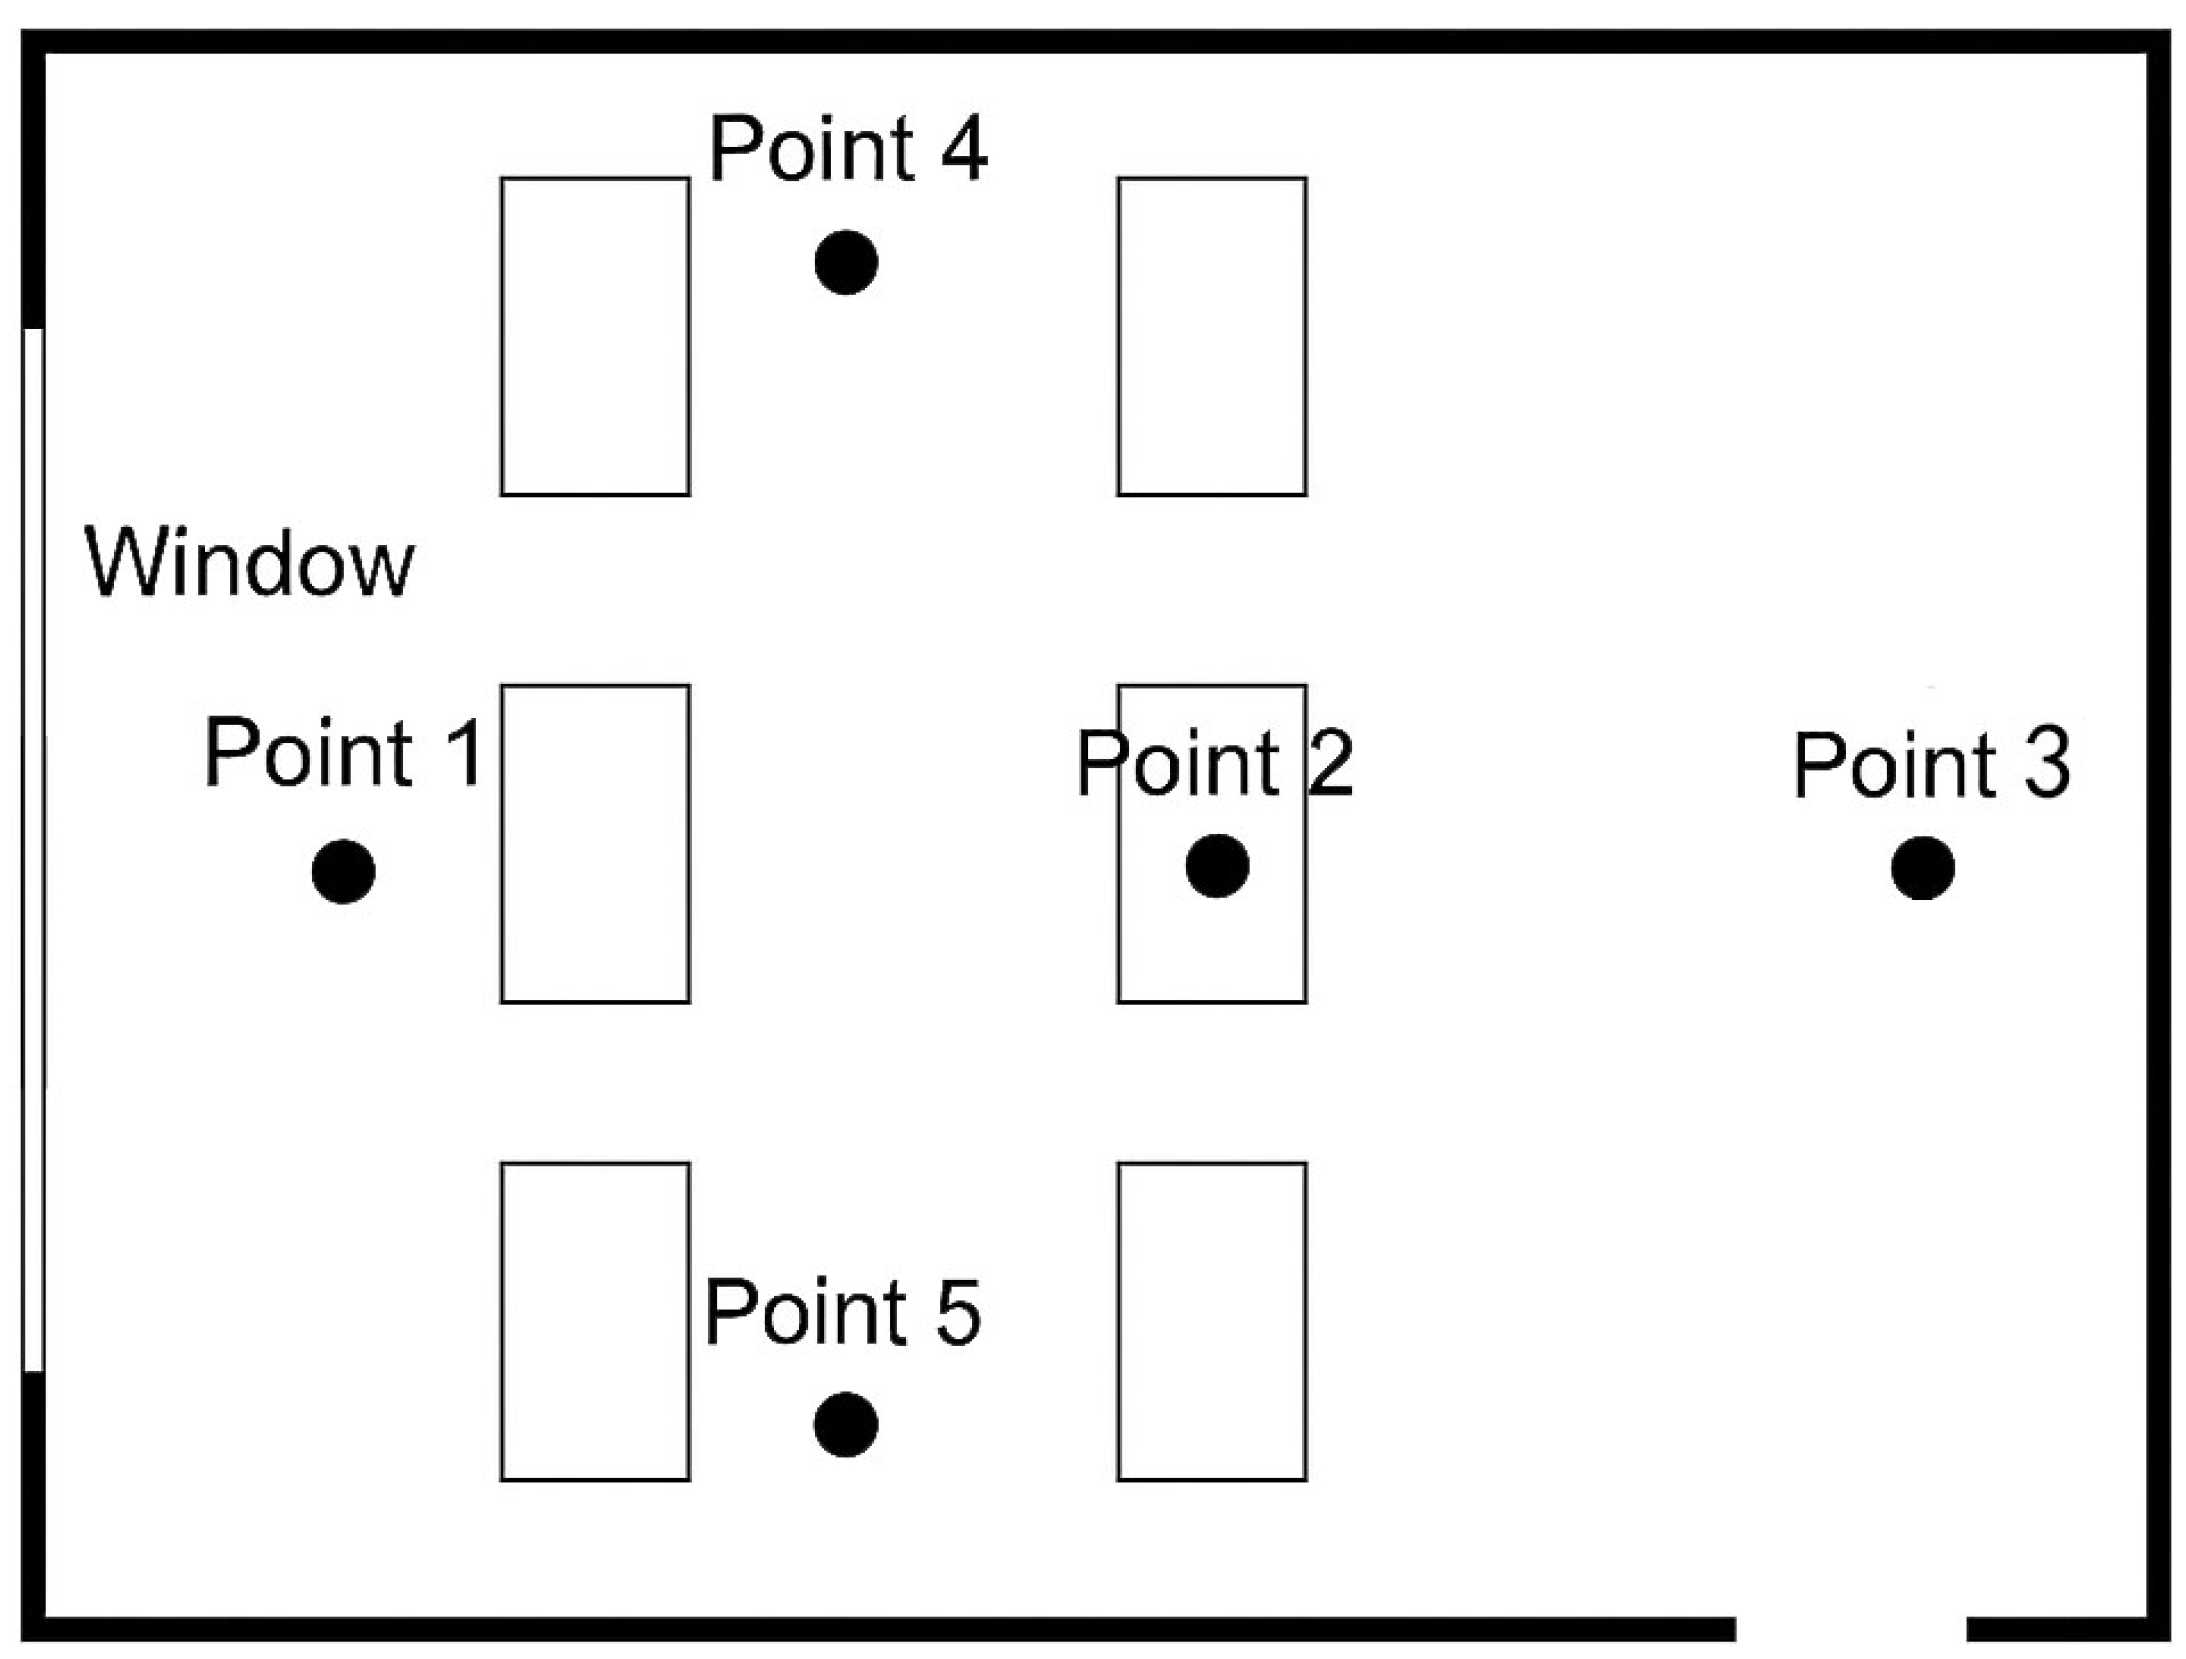
In order to accurately evaluate the current lighting conditions in the library reading area and verify the subsequent optimization effect, a field illuminance measurement experiment was carried out. The illuminance measurement was carried out in the reading area on the second floor of a university’s main library (about 800 square meters). The area adopts a typical north–south layout and combines natural lighting from double side windows and skylights, which has a certain spatial representativeness. Five representative measurement points were selected based on DIALux simulation analysis and spatial heat maps to ensure coverage of high illumination areas, medium illumination areas, and low illumination areas, while taking into account the relative distance from windows, central areas, and corners to fully reflect the differences in illumination distribution.
Measurement points positioning (
Figure 4) and rationale:
Point 1: Near a window area, representing areas exposed directly to natural light ingress.
Point 2: Central area, typically least illuminated due to the distance from natural light sources.
Point 3: Corner area opposite windows, usually the darkest.
Points 4 and 5: Intermediate positions between windows and central spaces, providing transitional illuminance data.
The measurement uses a TES-1339R digital illuminance meter (compliant with ISO 9001 standards [
27], with an accuracy of ±3%), and collects data at a standard desk height of 0.75 m to ensure accuracy and reliability. Illuminance data collection was performed at multiple time periods (9:00, 12:00, 13:00, and 17:00) that represent typical daily lighting conditions and capture illumination fluctuations caused by natural daylight variations.
The key parameters assessed included the following:
Minimum Illuminance (E_min): Identified at the darkest location (Point 3), critical for visual comfort.
Average Illuminance (E_avg): Calculated across all points to evaluate general lighting conditions.
Illuminance Uniformity (U): Defined explicitly as the ratio of the minimum illuminance (E_min) to average illuminance (E_avg), which serves as a critical indicator for assessing visual comfort and lighting consistency. Uniformity values below 0.4 indicate poor visual conditions according to relevant standards, whilst optimal uniformity is between 0.6 and 0.75.
The selection of these metrics is consistent with the stated goals of the project, namely, to improve lighting uniformity and visual comfort. They also provide a quantitative basis for evaluating the improvements brought about by the proposed optimization strategy.
Preliminary measurements revealed severe differences in illumination across reading areas, with excessive brightness near windows and insufficient illumination in peripheral corners (see the next section for specific measured values). These findings suggest the need for targeted design optimization, which will be further validated in the next section through simulation and statistical analysis.
5.2.2. Optimization Strategies for Natural Lighting Design
Based on the measured deficiencies, targeted lighting optimization strategies were formulated to enhance illumination uniformity, visual comfort, natural light utilization, and energy efficiency. Given the limitations imposed by structural and decorative constraints of existing window heights (primarily at 0.9 m and 1.2 m), optimization primarily focused on adjusting window widths to increase natural daylight penetration effectively.
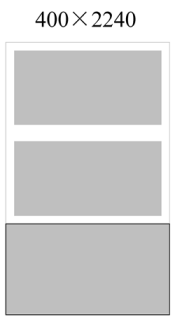
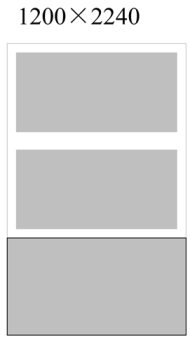
The original window configurations (
Table 1) were modified according to the optimization model recommendations as follows:
- (1)
The dimensions of Window 1 were increased from 400 mm × 2240 mm to 1200 mm × 2240 mm.
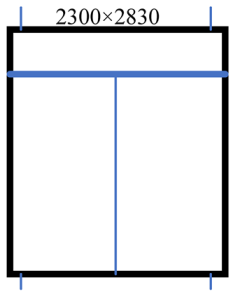
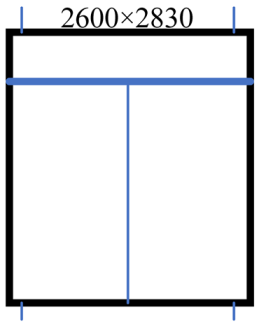
- (2)
The dimensions of Window 2 were increased from 2300 mm × 2830 mm to 2600 mm × 2830 mm.
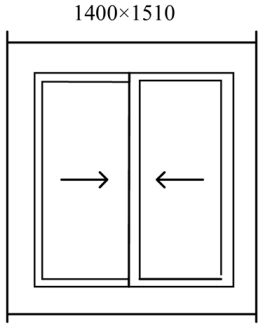
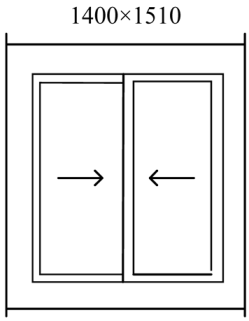
- (3)
The quantity of Window 3 was increased by an additional 10 units, maintaining the original dimensions (1400 mm × 1510 mm).
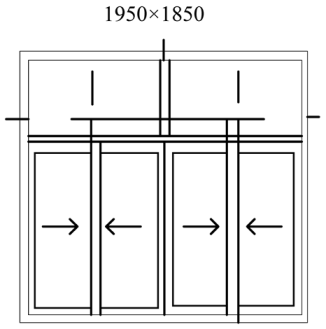
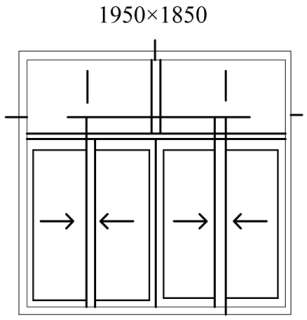
- (4)
The quantity of Window 4 was increased by an additional six units, maintaining the original dimensions (1950 mm × 1850 mm).
These adjustments resulted in an optimized total window area of approximately 174.91 m
2 (
Table 2), effectively increasing natural daylight access within the library interior.
The optimized lighting design was implemented through adjustments of window dimensions and quantities as outlined above [
28]. To assess the effectiveness of these changes, natural lighting conditions post-optimization were analyzed using DIALux Evo 13.1 (Version 5.13.1.0) lighting simulation software. Simulation results indicated substantial improvements in lighting conditions, including a significant reduction in glare near windows and enhanced lighting uniformity across the reading areas. Additionally, simulated energy consumption data suggested notable energy-saving potential due to a decreased reliance on artificial lighting.
Detailed quantitative simulation data, rigorous statistical analyses, and comprehensive evaluations of optimization effects—including illuminance uniformity, visual comfort improvements (UGR), and energy efficiency—are thoroughly presented and validated in
Section 6. These initial simulated results strongly support the idea that the optimized design solutions effectively addressed previously identified lighting issues, providing a solid foundation for further empirical validation and detailed analysis.
6. Multi-Objective Lighting Optimization Results Analysis for Library Reading Areas
6.1. Lighting Environment Optimization Effectiveness
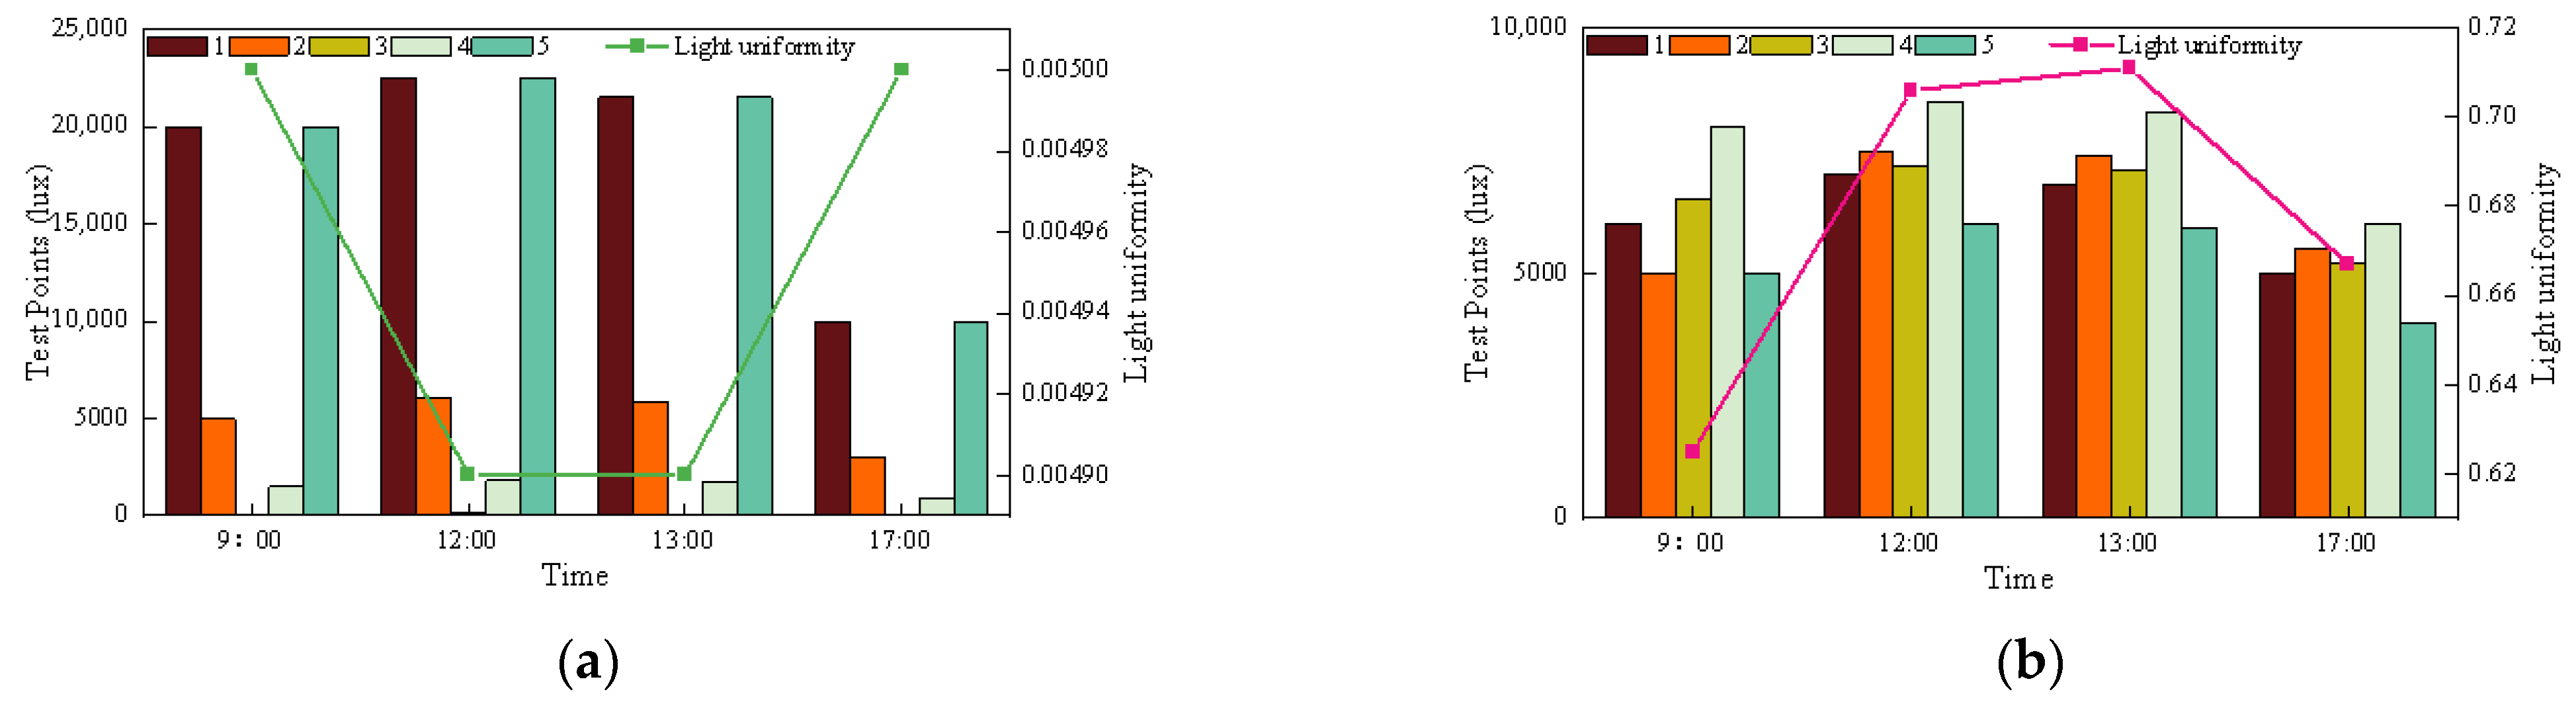
To evaluate the effectiveness of the proposed lighting optimization strategy, we used DIALux simulation results to compare the illuminance measurements before and after the optimization design was implemented. As shown in
Figure 5, the illuminance distribution before optimization varied dramatically—up to 22,500 lux near the window and as low as 110 lux in the dark corner—resulting in poor uniformity (<0.1). After optimization, the simulation results showed that the lighting was balanced at all time periods (9:00, 12:00, 13:00, and 17:00), with the illuminance values at the five test points all remaining within 2000 lux and the uniformity ranging from 0.6 to 0.75.
To verify the statistical significance of the lighting improvement, the paired
t-test was used to compare the illuminance uniformity values at the five measurement points before and after optimization. This test evaluates whether the mean difference between two related conditions is statistically significant [
7]. The mean (M) ± standard deviation (SD) of each measurement point was calculated, and a two-tailed test was used to obtain the
p-value [
21]. Statistical significance was set at a
p-value < 0.05, following standard practice for experimental validation in lighting optimization studies [
29].
Table 3 shows the illuminance values of each measurement point before and after optimization. The comparison results clearly show that the extreme over-illuminance near the window and the under-illuminance in the corner area were significantly reduced. The paired
t-test confirmed that the improvement in lighting uniformity was statistically significant (
p < 0.001).
The above table clearly shows that the illuminance gap between different spatial locations has been significantly reduced. The most extreme illuminance value, such as 22,500 lux near the window, has been successfully reduced to an appropriate level (about 310 lux), while the previously under-lit area (110 lux) has improved to about 275 lux. These results indicate that the lighting environment is more balanced and comfortable throughout the reading area. This statistically significant improvement (
p < 0.001) validates the effectiveness of the multi-objective optimization model in achieving the desired goals of lighting uniformity and visual comfort [
30].
6.2. Comfort Analysis
6.2.1. Visual Comfort Enhancement Evaluation
To evaluate the improvement of visual comfort, we used the unified glare index (UGR) as the main indicator. Referring to the GB50034-2013 standard, the optimized UGR values were always within the acceptable range (≤22), as shown in
Table 4. The results confirmed that visual discomfort was significantly reduced, especially in the high-glare area near the window. The optimized design successfully adjusted the brightness contrast, improved the students’ reading experience, enabled students to receive sufficient light while reducing visual fatigue of the eyes during reading, and improved the students’ reading comfort.
6.2.2. Thermal Comfort Enhancement Evaluation
The modified window design is used in the reading area of the university library. Five locations are selected for measurement. Locations 1–5 are, respectively, near the window area, the center of the reading area, the door, and the left and right corners. The location temperature is recorded once an hour for 24 h. The origin drawing software is used to draw the temperature changes in the five locations.
Figure 6 shows the temperature at different locations for each hour. The temperature at each location is between 21.5 and 23 °C in a day. The temperature difference is small and within 1 °C. This shows that the overall temperature distribution of the reading area is uniform after multi-objective optimization, and the natural light lighting design has achieved a good control effect on the temperature of the reading area.
6.3. Natural Light Utilization Analysis
Natural light utilization is an important indicator of library lighting design, which is mainly used to measure the degree of light utilization of library lighting design. The DIALux simulation software is installed in colleges and universities. The multi-objective optimization algorithm is the acquisition optimization model constructed in this paper. The generative adversarial network algorithm generates light conditions close to the real value through continuous adversarial training. The genetic algorithm generates the best lighting design plan after multiple iterations through selection, crossover mutation, and other operations.
Figure 7 shows the results of the natural light utilization test, and the natural light utilization rate of the multi-objective optimization algorithm can reach more than 90%. The utilization rate of the generative adversarial network is the lowest, below 70%, and the utilization rate bureau of the genetic algorithm is in the middle, around 80%, but the highest is not more than 85%. It can be found that after the design of the multi-objective optimization algorithm, the natural light of the library is softer and more uniform, and there is no problem of some areas being too bright or too dark, which is in line with the human eye’s reading needs. It reduces fatigue in the reading process, meets the actual needs and expectations of students, improves students’ experience, promotes students’ interest in reading and learning, better ensures students’ learning efficiency, and creates a comfortable and relaxing reading environment and atmosphere for students.
6.4. Energy Consumption Evaluation
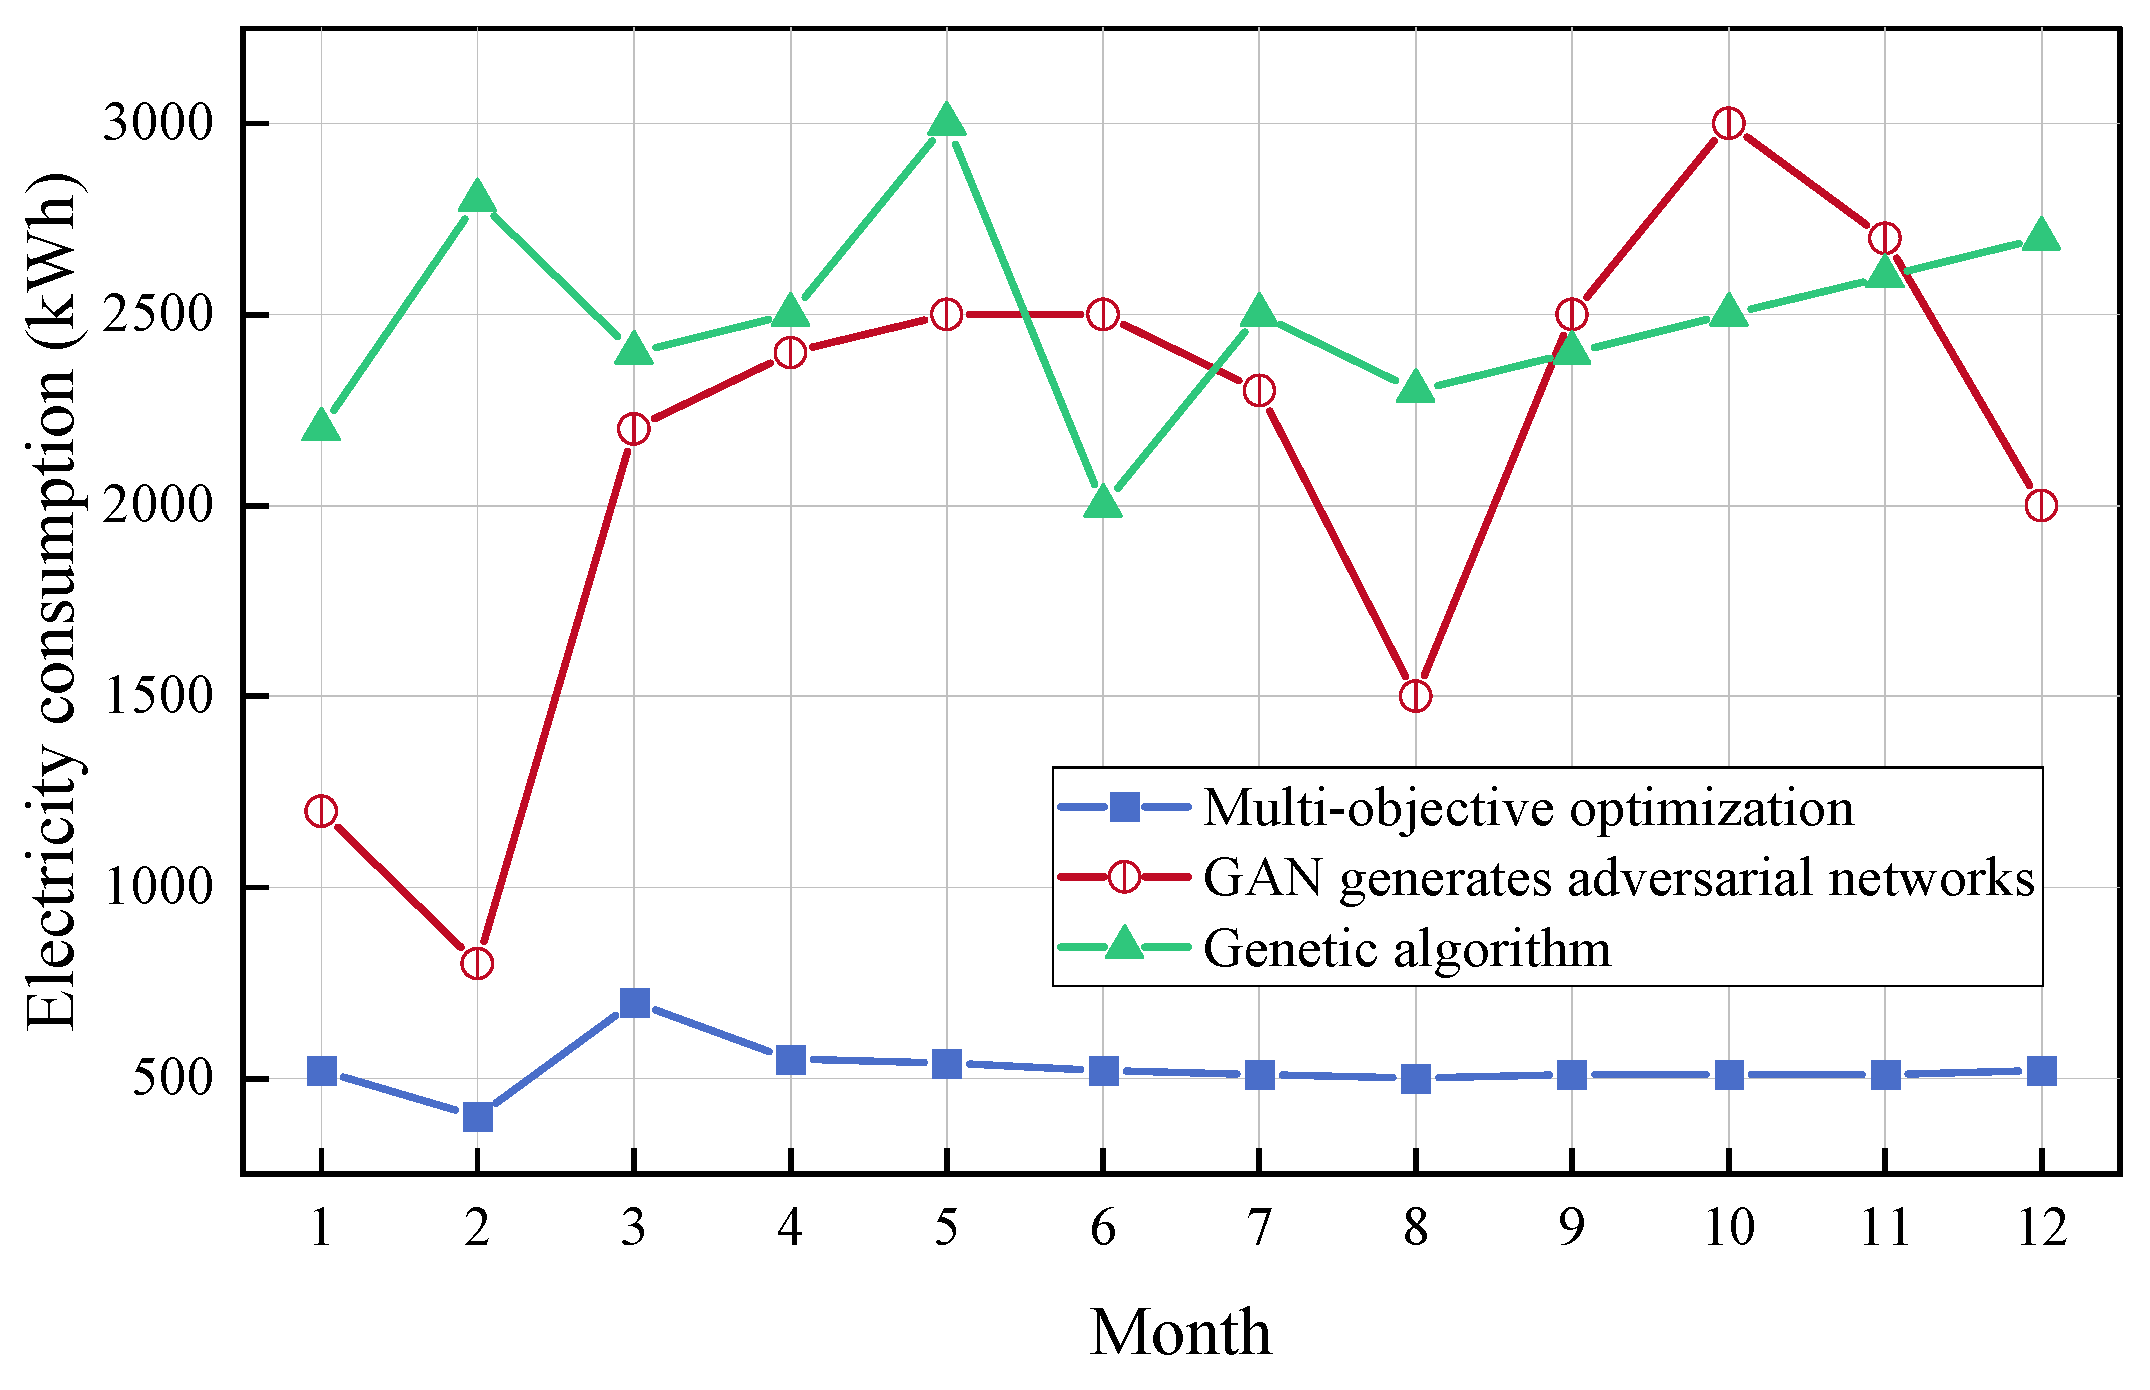
Analysis of electrical energy consumption is also an important indicator of lighting design in libraries and is used to measure the amount of electricity used for lighting in libraries. The higher the energy consumption, the less natural light there is in the library, and uneven brightness of the light leads to the need to use lighting tools to illuminate. The lower the power consumption, the more likely it is that the library’s natural light distribution is uniform, enough for students to read, and does not need additional lighting tools, light or soft, in line with the requirements of the students. Therefore, there is a need to launch the lighting design of the library power consumption analysis, and the results of the analysis of the power consumption are shown in
Figure 8.
In the DIALux simulation software, multi-objective optimization algorithm library lighting design natural light is sufficient, and it shows that the light source will be effectively distributed, reducing the use of lighting tools, Consequently, each month’s electricity energy consumption is low, generally around 500/kWh. In October, the generation of adversarial network optimization and genetic algorithm is higher than the multi-objective optimization algorithm, 2500/kWh compared to 2000/kWh, which not only ensures the needs of students at the same time but also saves energy and reduces the adverse impact on the environment. It contributes to the sustainable development of energy, reduces carbon emissions, lowers the operating costs of the library, and improves the economic efficiency of the library. And it helps the library to establish a green image, improve social recognition and honor, set an example for students in colleges and universities, and enhance students’ awareness of environmental protection.
6.5. Analysis of Electricity Energy Consumption
6.5.1. Visual Comfort
The lighting area is mainly used to evaluate the performance of the library lighting design. The larger the lighting area, the higher the lighting intensity of the library and the more uniform the light is in the library. Therefore, that readers have enough illumination when reading, ensuring that there is enough natural light inside the library and reducing readers’ visual fatigue.
After optimization, we used the simulation results to evaluate the lighting coverage area.
Table 5 shows that the lighting area of the reading room increased from 200 m
2 to 250 m
2, and the total daylight exposure area increased from 530 m
2 to 695 m
2. This increase reflects the enhancement of the coverage of natural lighting space.
6.5.2. Illumination Uniformity Distribution
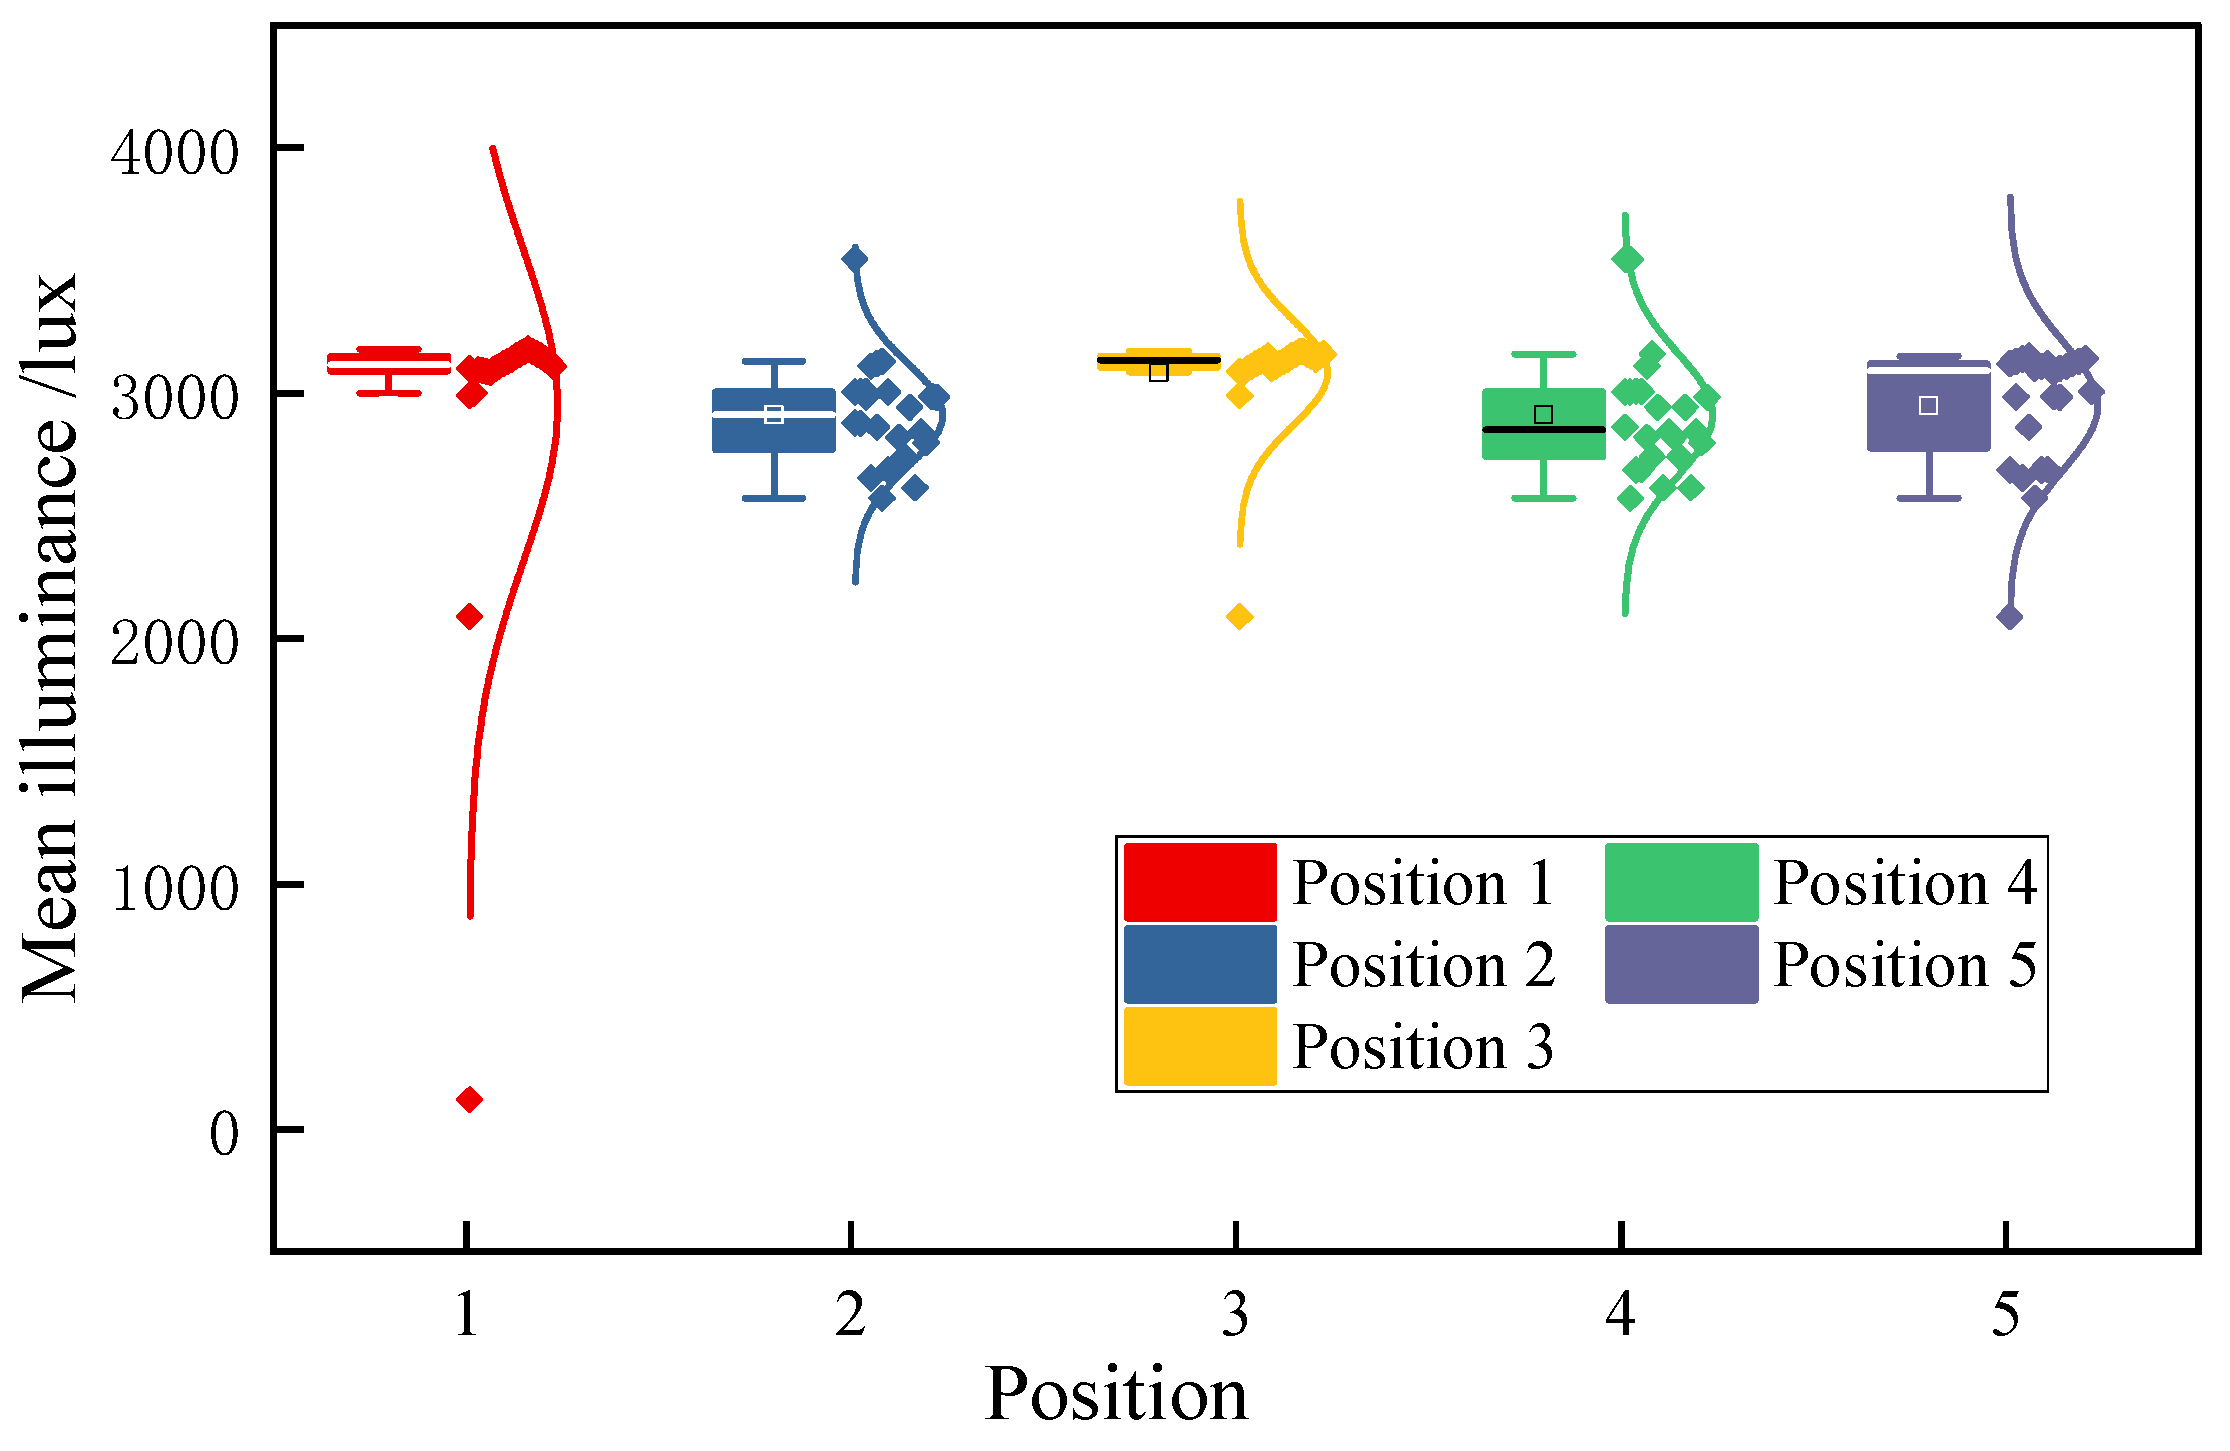
Illuminance uniformity is an important indicator for lighting design in natural light environments. The distribution of illuminance uniformity after optimization is shown in
Figure 9. Within 24 h, the average illuminance/lux of the five locations is the highest at location 1, which is 3092.84/lux, and the lowest at location 4, which is 2970.68/lux. This average illuminance is close to the expected illuminance of 3101/lux after optimization. This confirms that the algorithm can achieve spatial lighting balance and reduce lighting differences.
7. Discussion
7.1. Detailed Analysis of Experimental Data
The experimental results show that after the optimization design, the illumination uniformity of the library reading area has been improved from being extremely uneven before optimization (e.g., 22,500 lux near the window and only about 110 lux in the corner) to 200–310 lux at all measurement points, and the uniformity index has been improved from less than 0.1 to a stable range of 0.6–0.75. Through the paired t-test of five representative measurement points, the illumination improvement of each point has reached a statistically significant level (e.g., the t value of point 1 is 15.87, p < 0.001, and the 95% confidence interval is [285, 335] lux). In addition, for visual comfort, this study verified the effect of the optimization scheme in effectively reducing excessive local glare through the unified glare index (UGR), and all test areas met the requirements of UGR ≤ 22 in GB50034-2013. In terms of energy consumption, simulation results show that the optimized design significantly reduces the average monthly lighting energy consumption, which not only meets the full utilization of natural light but also reduces the reliance on artificial lighting, thus providing strong technical support for green building design.
7.2. Comparison of Experimental Results with Previous Studies
7.2.1. Improvement of Illumination Uniformity and Visual Comfort
Unlike Wen et al., who primarily applied shading strategies that alleviated local instances of excessive direct light but resulted in only limited overall uniformity improvements [
1], our approach employs the NSGA-II algorithm to perform a comprehensive multi-parameter optimization. This includes desktop illumination, color temperature, background reflectivity, and screen brightness. By combining rigorous paired
t-tests and confidence interval analyses, our study quantitatively demonstrates that the optimized design raises the uniformity index from below 0.1 to between 0.6 and 0.75. Furthermore, our visual comfort evaluation, based on the UGR metric, confirms that all measurement points meet the required standard (UGR ≤ 22), a level of detail that previous studies [
1] did not statistically validate.
7.2.2. Data Collection, Statistical Rigor, and Multi-Objective Integration
Jia et al. predominantly relied on simulated data and employed a relatively simplistic statistical analysis, lacking multi-time and multi-point on-site verification [
2]. In contrast, our research incorporates measurements taken at different times (9:00, 12:00, 13:00, and 17:00) and at multiple representative points, combined with robust statistical tools (paired
t-test, confidence intervals, and effect size calculation) to ensure the repeatability and reliability of our results. Additionally, while many earlier studies [
3] focused on single objectives such as glare reduction or uneven lighting, our research integrates energy consumption into the optimization framework. This holistic approach, guided by the NSGA-II algorithm, not only achieves superior illumination uniformity and visual comfort but also substantially reduces energy usage.
7.2.3. In-Depth Comparison with Influential Studies
To underscore the novelty and robustness of our approach, we conducted an in-depth comparison with several influential studies that have shaped the field of building daylighting and optimization. This discussion highlights the distinguishing factors of our methodology relative to these benchmark works.
Tzempelikos and Athienitis’s research focus is on the design of shading systems to reduce the cooling costs of constructions and utilize natural light at the same time [
14]. The main points of other research are the heating environment, adjustment of the sunlight, the specific exploration of the uniformity of indoor lighting, and the optionality of quantitative analysis. In the course of our research, we have added detailed lighting reference numbers, such as screen surface illuminance, background reflectance, screen brightness, and more. The use of a NSGA-II multi-purpose calculation method has been combined to provide light illumination, uniformity, and prevention of glare, and further improvements have been made to improve the effectiveness of the system.
Mardaljevic et al. have submitted some important natural light indicators, such as “Useful Sunlight Illuminance (UDI)”and “Sunlight Glare Proportion (DGP)” [
31]. Unfortunately, there are some references to the natural phosphorescence quality, but other research is not yet available. This is a small indication that the actual energy representation used in the construction is used, so this has limited effects for the actual use of the green color in the design of the construction. Our method of directing the use of natural light and energy resources is the same as that of natural light.
Compared with the method of Brembilla et al. to verify the daylight simulation results through long-term field measurements [
10], the multi-objective optimization framework adopted in this study can take into account illumination uniformity, visual comfort and energy consumption control in advance in the design stage. Brzezicki’s study emphasized improving indoor natural lighting through physical structural design [
11]. This study further combined parametric modeling with genetic algorithms to achieve overall optimization and trade-offs of multiple lighting parameters in the space, enhancing the comprehensiveness and flexibility of the design scheme.
Hosseini’s method for designing the number generation, which can be used in public construction, has the potential to change the number of leaves in order to improve the progress of the hundred leaves [
32]. Other studies mainly rely on calculation simulations, concentrate on building exterior elevation shielding planning, and study the actual land surveying information of the light illumination conversion information in the actual use environment. At the same time, we have completed the research several times, established a large number of locations, and the results have been mutually confirmed, and we have confirmed that there have been changes in the natural light conditions of the area. By using this basic number base, we can improve our performance and make it even more useful.
Lo Verso et al. explored integrative lighting strategies in classroom environments through both simulation and field measurement, focusing on improving visual comfort and supporting students’ well-being [
33]. While their work offers valuable insights into the effectiveness of dynamic lighting systems in educational settings, it primarily concentrates on classroom environments and does not explicitly address the spatial complexity and prolonged visual demands associated with library reading areas. In contrast, our study introduces a multi-objective optimization framework specifically tailored to the unique requirements of university library reading spaces—where users engage in extended reading sessions that demand high levels of illuminance uniformity and minimal glare. By integrating key comfort-related parameters such as screen luminance and background reflectivity, our model ensures a more comprehensive and user-centered solution for lighting optimization in academic libraries.
As stated above, we have been able to compare the representative research that has been carried out, and since then we have discovered that our method has progressed in many directions. In particular, it is a combination of general design, analysis, and harmonious resource management, and it is also suitable for use in long-term public education settings, and has a powerful layout. Various methods for improving the system have now been developed and the research has been completed to provide new thinking and technology paths.
8. Conclusions
In this study, a multi-objective natural lighting optimization framework based on the NSGA-II algorithm was proposed to solve the problems of uneven lighting, excessive glare, and high energy consumption in the reading area of university libraries. The framework comprehensively considers the following four key parameters, desktop illumination, correlated color temperature, background reflectivity, and screen brightness, and combines the expert scoring method (AHP) to determine their weights. A simulation model was built in the Revit and DIALux environments and finally achieved multiple goals of improving illumination uniformity and natural light utilization, while ensuring visual comfort and reducing lighting energy consumption. The research results show that after optimization, the illumination of each measuring point is between 200 and 310 lux, and the lighting uniformity is improved from less than 0.1 to 0.6 to 0.75. The UGR glare values of all test areas are controlled below 22, the natural light coverage area is increased by 25%, and the lighting energy consumption is reduced by about 20%. The statistical significance of the above improvements (p < 0.001) was verified by paired t-test and confidence interval analysis, confirming the scientificity and practicality of the proposed model.
The significance of this study lies, on the one hand, in starting from the perspective of the overall system. This breaks the limitation of previous studies that only focus on a single factor (such as energy saving or comfort). On the other hand, the integration of parametric modeling and evolutionary algorithms not only enhances the adaptability of the model, but also provides a replicable and scalable lighting optimization path for libraries and other educational building spaces.
Nevertheless, this study still has some shortcomings. Firstly, the model does not consider the physical properties of window glass, such as the transmittance and shading coefficient. Secondly, the actual limitations of a library’s existing building structure, equipment layout, etc., are not fully incorporated into the modeling process. In addition, the study did not consider the impact of different seasons and weather on natural light conditions, nor did it conduct long-term field verification in an actual library.
Based on the above shortcomings, future research can further explore the following directions: combining dynamic technologies such as real-time intelligent dimming glass and adaptive shading systems to improve the responsiveness of the model; considering the differences in building materials, climate conditions, and user behavior to establish a more complex and practical lighting optimization system; and conducting long-term monitoring and iterative optimization in actual scenarios such as university libraries to promote the deep integration of green campus and human-oriented space construction.
Author Contributions
Conceptualization, X.C.; methodology, X.C.; software, X.C.; validation, X.C. and C.-W.A.; formal analysis, X.C. and C.-W.A.; investigation, X.C.; resources, X.C. and C.-W.A.; data curation, X.C. and C.-W.A.; writing—original draft preparation, X.C.; writing—review and editing, X.C. and C.-W.A.; visualization, X.C.; supervision, C.-W.A.; project administration, X.C. and C.-W.A. All authors have read and agreed to the published version of the manuscript.
Funding
This research received no external funding.
Data Availability Statement
The data used to support the findings of this study are available from the corresponding author upon reasonable request.
Conflicts of Interest
The authors declare no conflicts of interest.
References
- Wen, S.; Hu, X.; Hua, G.; Xue, P.; Lai, D. Comparing the performance of four shading strategies based on a multi-objective genetic algorithm: A case study in a university library. J. Build. Eng. 2023, 63, 105532. [Google Scholar] [CrossRef]
- Jia, B.; Li, W.; Chen, G.; Sun, W.; Wang, B.; Xu, N. Optimized Design of Skylight Arrangement to Enhance the Uniformity of Indoor Sunlight Illumination. Sustainability 2023, 15, 11257. [Google Scholar] [CrossRef]
- Bian, Y.; Dai, Q.; Ma, Y.; Liu, L. Variable set points of glare control strategy for side-lit spaces: Daylight glare tolerance by time of day. Sol. Energy 2020, 201, 268–278. [Google Scholar] [CrossRef]
- Hu, H.; Zhang, H.; Wang, L.; Ke, Z. Evaluation and Design of Parameterized Dynamic Daylighting for Large-Space Buildings. Sustainability 2023, 15, 10773. [Google Scholar] [CrossRef]
- Tseng, W.C.; Whang, A.W.; Chen, Y.Y.; Chen, J.Z.; Yang, T.H.; Huang, T.C.; Chen, H.C. A freeform collimator lens design for the natural light illumination system. Light. Res. Technol. 2020, 52, 141–150. [Google Scholar] [CrossRef]
- Alkhatatbeh, B.J.; Asadi, S. Role of architectural design in creating circadian-effective interior settings. Energies 2021, 14, 6731. [Google Scholar] [CrossRef]
- Montgomery, D.C. Design and Analysis of Experiments, 10th ed.; John Wiley & Sons: Hoboken, NJ, USA, 2020. [Google Scholar]
- Whang, A.J.W.; Chen, Y.Y.; Yang, T.H.; Lin, Y.L.; Tseng, W.C.; Chen, H.C. High-efficiency confocal paraboloids coupler design for natural light illumination systems. Sol. Energy 2020, 195, 129–137. [Google Scholar] [CrossRef]
- Golovkina, V.B.; Ryazanova, V.R. Design concept for lighting phytosystems for public spaces. Light Eng. 2021, 29, 16–20. [Google Scholar] [CrossRef]
- Brembilla, E.; Drosou, N.C.; Mardaljevic, J. Assessing daylight performance in use: A comparison between long-term daylight measurements and simulations. Energy Build. 2022, 262, 111989. [Google Scholar] [CrossRef]
- Brzezicki, M. An Evaluation of Useful Daylight Illuminance in an Office Room with a Light Shelf and Translucent Ceiling at 51° N. Buildings 2021, 11, 494. [Google Scholar] [CrossRef]
- Dubois, M.C.; Flodberg, K. Daylight utilisation in perimeter office rooms at high latitudes: Investigation by computer simulation. Light. Res. Technol. 2013, 45, 52–75. [Google Scholar] [CrossRef]
- Deng, X.; Wang, M.; Fan, Z.; Liu, J. Dynamic daylight performance oriented design optimizations for contemporary reading room represented deep open-plan spaces. J. Build. Eng. 2022, 62, 105145. [Google Scholar] [CrossRef]
- Li, Z. Optimization of residential urban-block morphology based on its synthetic effects on indoor and outdoor natural lighting environments. Sustain. Cities Soc. 2023, 97, 104698. [Google Scholar]
- GB50034-2013; Code for Design of Building Lighting. Architecture & Building Press: Beijing, China, 2013.
- Saaty, T.L. The Analytic Hierarchy Process: Planning, Priority Setting, Resource Allocation; McGraw-Hill: New York, NY, USA, 1980. [Google Scholar]
- Tzempelikos, A.; Athienitis, A.K. The impact of shading design and control on building cooling and lighting demand. Sol. Energy 2007, 81, 369–382. [Google Scholar] [CrossRef]
- CIE 117-1995; International Commission on Illumination (CIE). Discomfort Glare in Interior Lighting. CIE: Vienna, Austria, 1995.
- EN 12464-1:2021; Light and Lighting—Lighting of Work Places—Part 1: Indoor Work Places. CEN: Brussels, Belgium, 2021.
- Forman, E.H.; Gass, S.I. The analytic hierarchy process—An exposition. Oper. Res. 2001, 49, 469–486. [Google Scholar] [CrossRef]
- Field, A. Discovering Statistics Using IBM SPSS Statistics, 5th ed.; SAGE Publications: Thousand Oaks, CA, USA, 2017. [Google Scholar]
- Eastman, C.; Teicholz, P.; Sacks, R.; Liston, K. BIM Handbook: A Guide to Building Information Modeling for Owners, Managers, Designers, Engineers and Contractors, 2nd ed.; Wiley: New York, NY, USA, 2011. [Google Scholar]
- Nabil, A.; Mardaljevic, J. Useful daylight illuminance: A new paradigm to access daylight in buildings. Light. Res. Technol. 2006, 38, 41–59. [Google Scholar] [CrossRef]
- Mamta; Kumar, V. A systematic review of library service quality studies: Models, dimensions, research populations and methods. J. Librariansh. Inf. Sci. 2023, 56, 534–546. [Google Scholar] [CrossRef]
- Haffenden, C.; Fano, E.; Malmsten, M.; Börjeson, L. Making and using AI in the library: Creating a BERT model at the national library of Sweden. Coll. Res. Libr. 2023, 84, 30–48. [Google Scholar] [CrossRef]
- Hackett, C.; Kim, J. Planning, implementing and evaluating research data services in academic libraries: A model approach. J. Doc. 2024, 80, 27–38. [Google Scholar] [CrossRef]
- ISO 9001:2015; Quality Management Systems—Requirements. International Organization for Standardization: Geneva, Switzerland, 2015.
- Ruggiero, S.; Iannantuono, M.; Fotopoulou, A.; Papadaki, D.; Assimakopoulos, M.N.; De Masi, R.F.; Vanoli, G.P.; Ferrante, A. Multi-objective optimization for cooling and interior natural lighting in buildings for sustainable renovation. Sustainability 2022, 14, 8001. [Google Scholar] [CrossRef]
- Altman, D.G. Practical Statistics for Medical Research; Chapman & Hall: London, UK, 1991. [Google Scholar]
- Rasch, D.; Pilz, J.; Verdooren, R.; Gebhardt, A. Optimal Experimental Design with R; CRC Press: Boca Raton, FL, USA, 2011. [Google Scholar]
- Mardaljevic, J.; Andersen, M.; Roy, G.G.; Christoffersen, J. Daylighting metrics: Is there a relation between useful daylight illuminance and daylight glare probability? Build. Environ. 2013, 64, 25–40. [Google Scholar] [CrossRef]
- Hosseini, S.M.; Heiranipour, M.; Wang, J.; Hinkle, L.E.; Triantafyllidis, G. Enhancing Visual Comfort and Energy Efficiency in Office Lighting Using Parametric-Generative Design Approach for Interactive Kinetic Louvers. J. Daylighting 2024, 11, 69–85. [Google Scholar] [CrossRef]
- Lo Verso, V.R.M.; Giovannini, L.; Valetti, L.; Pellegrino, A. Integrative Lighting in Classrooms: Preliminary Results from Simulations and Field Measurements. Buildings 2023, 13, 2128. [Google Scholar] [CrossRef]
| Disclaimer/Publisher’s Note: The statements, opinions and data contained in all publications are solely those of the individual author(s) and contributor(s) and not of MDPI and/or the editor(s). MDPI and/or the editor(s) disclaim responsibility for any injury to people or property resulting from any ideas, methods, instructions or products referred to in the content. |
© 2025 by the authors. Licensee MDPI, Basel, Switzerland. This article is an open access article distributed under the terms and conditions of the Creative Commons Attribution (CC BY) license (https://creativecommons.org/licenses/by/4.0/).


