
Impact of Emotional Design: Improving Sustainable Well-Being Through Bio-Based Tea Waste Materials


Abstract
1. Introduction
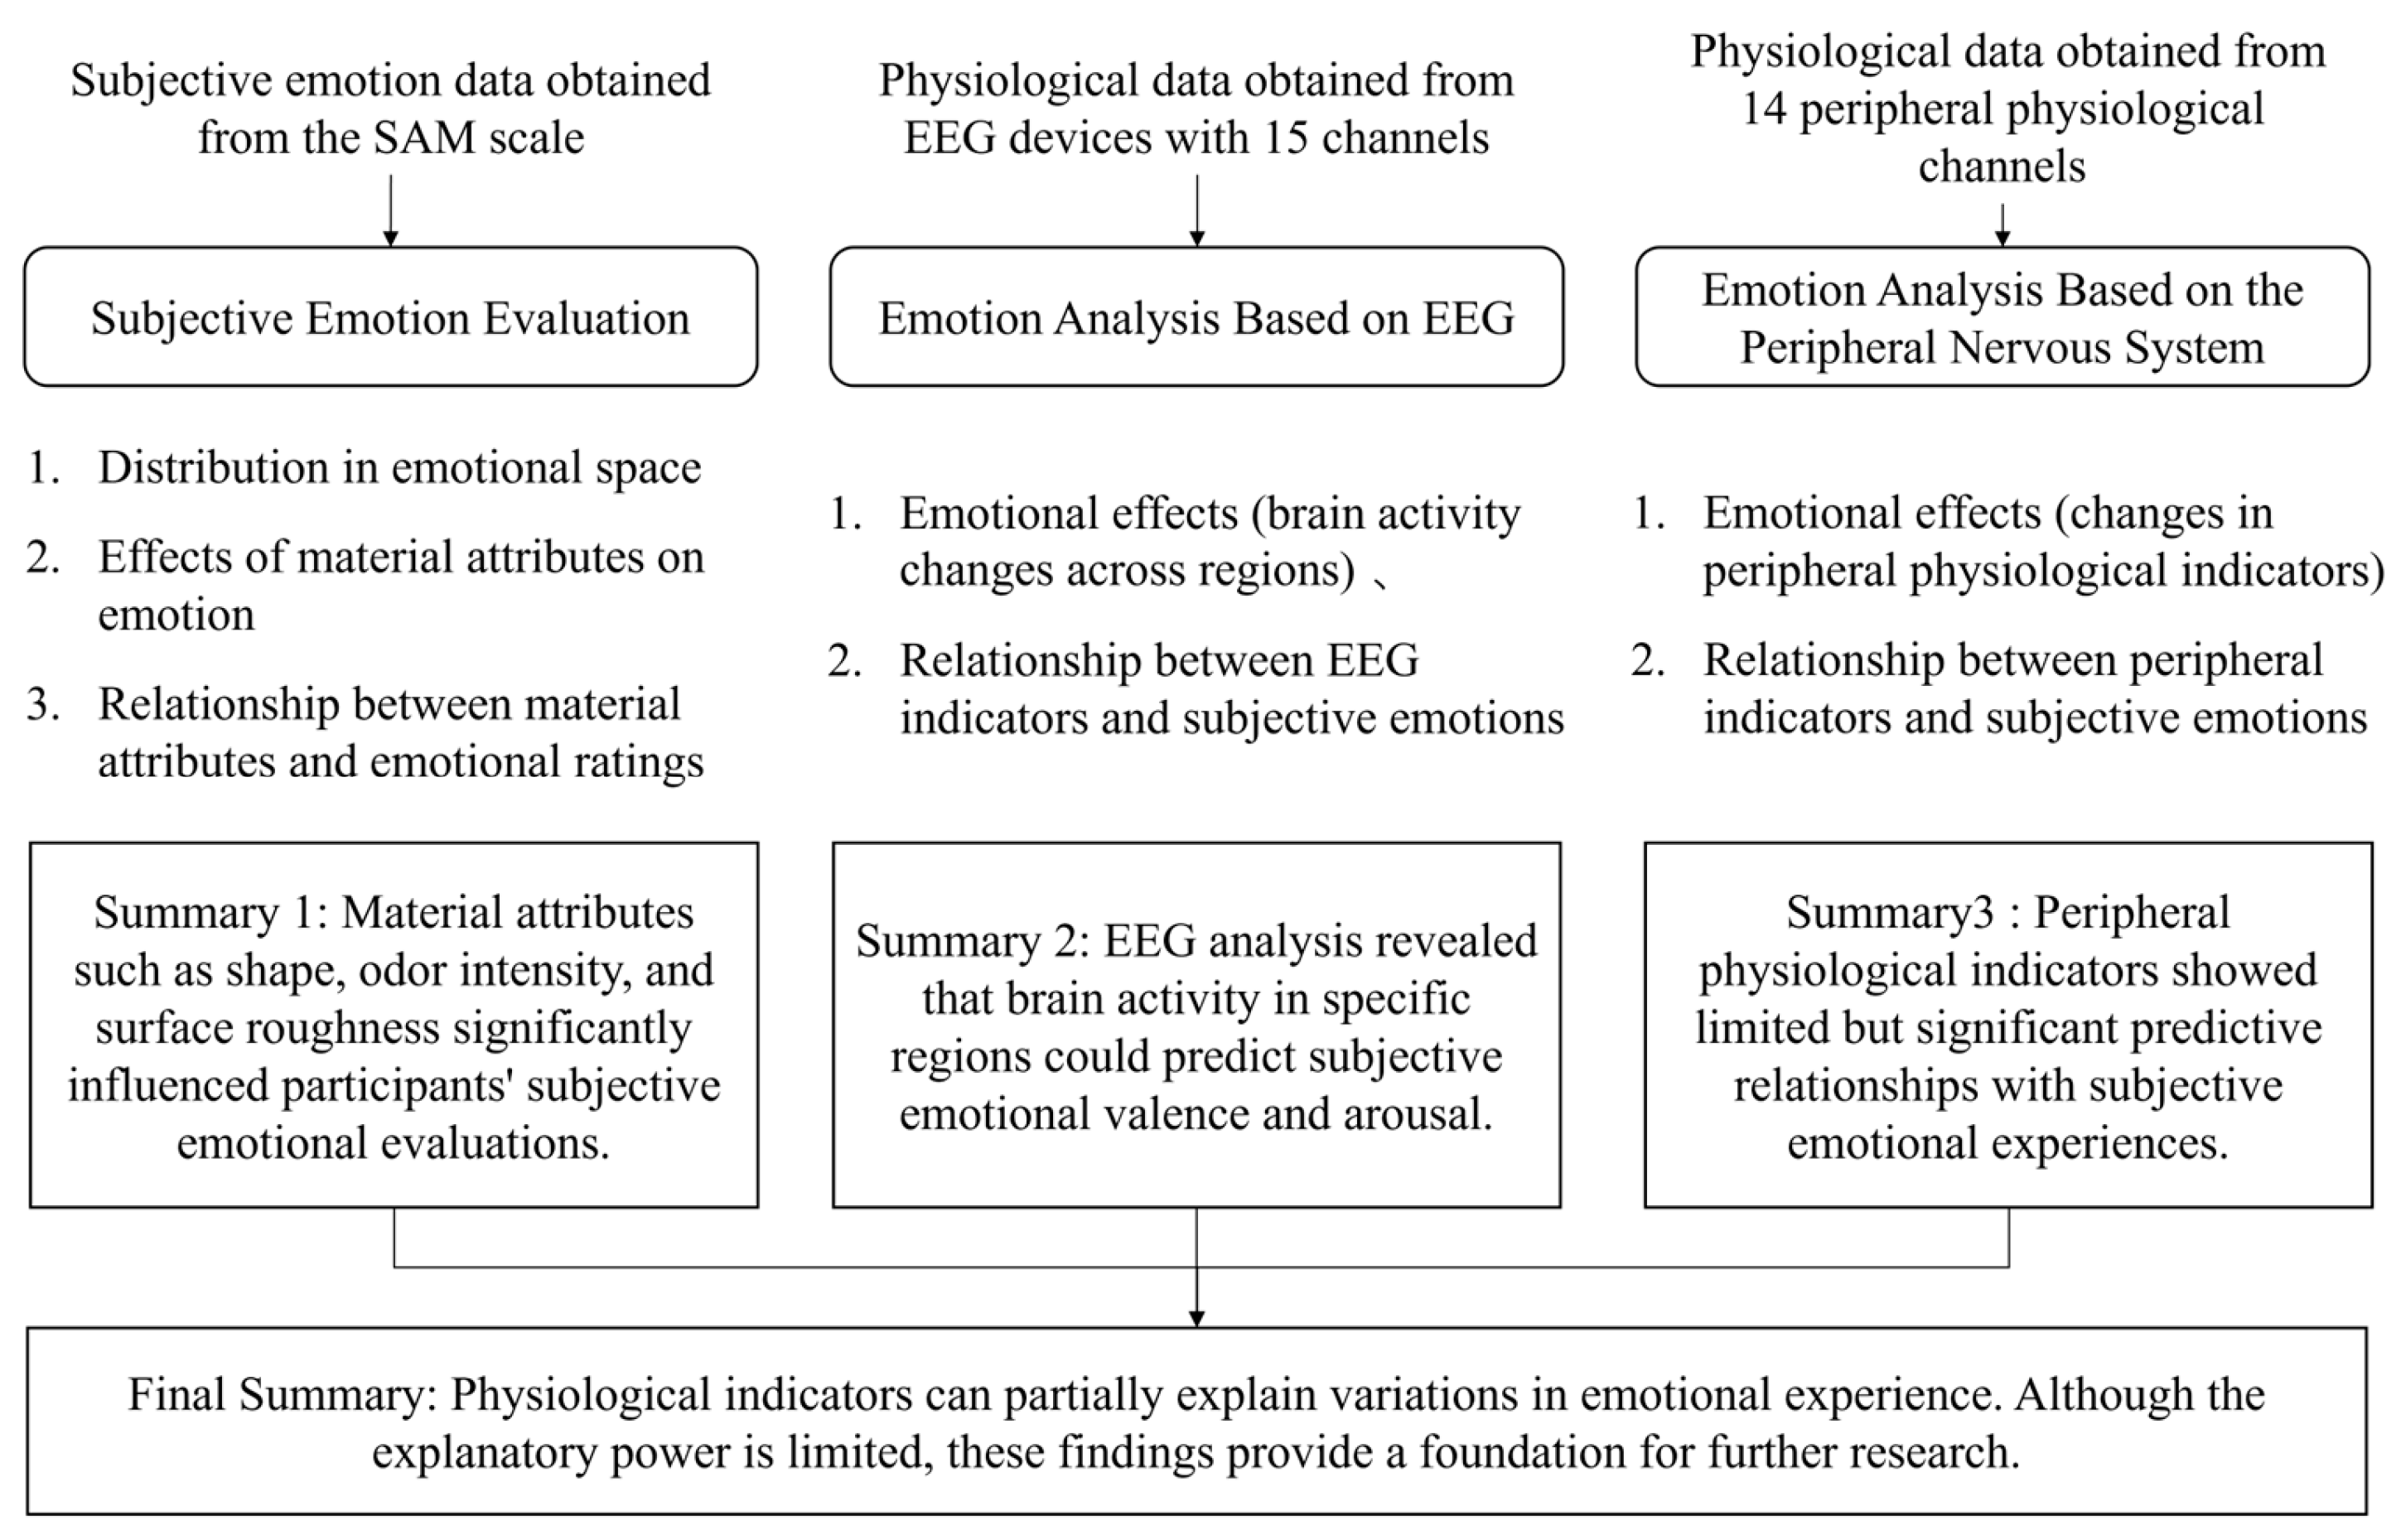
- Emotion measurement and data collection:For the subjective emotion evaluation measures, the subjects self-reported their emotional state after using biobased materials, and their emotional responses were objectively quantified in combination with physiological indicators.
- Multimodal data analysis:This analysis was conducted to reveal the characteristics of subjects’ emotional responses when using different biobased materials.
- Strategy development to enhance market acceptance:This was conducted for product design optimization and the development of product design strategies based on emotional value to enhance the market attractiveness of biobased materials and improve consumer loyalty.
2. Method
2.1. Participants
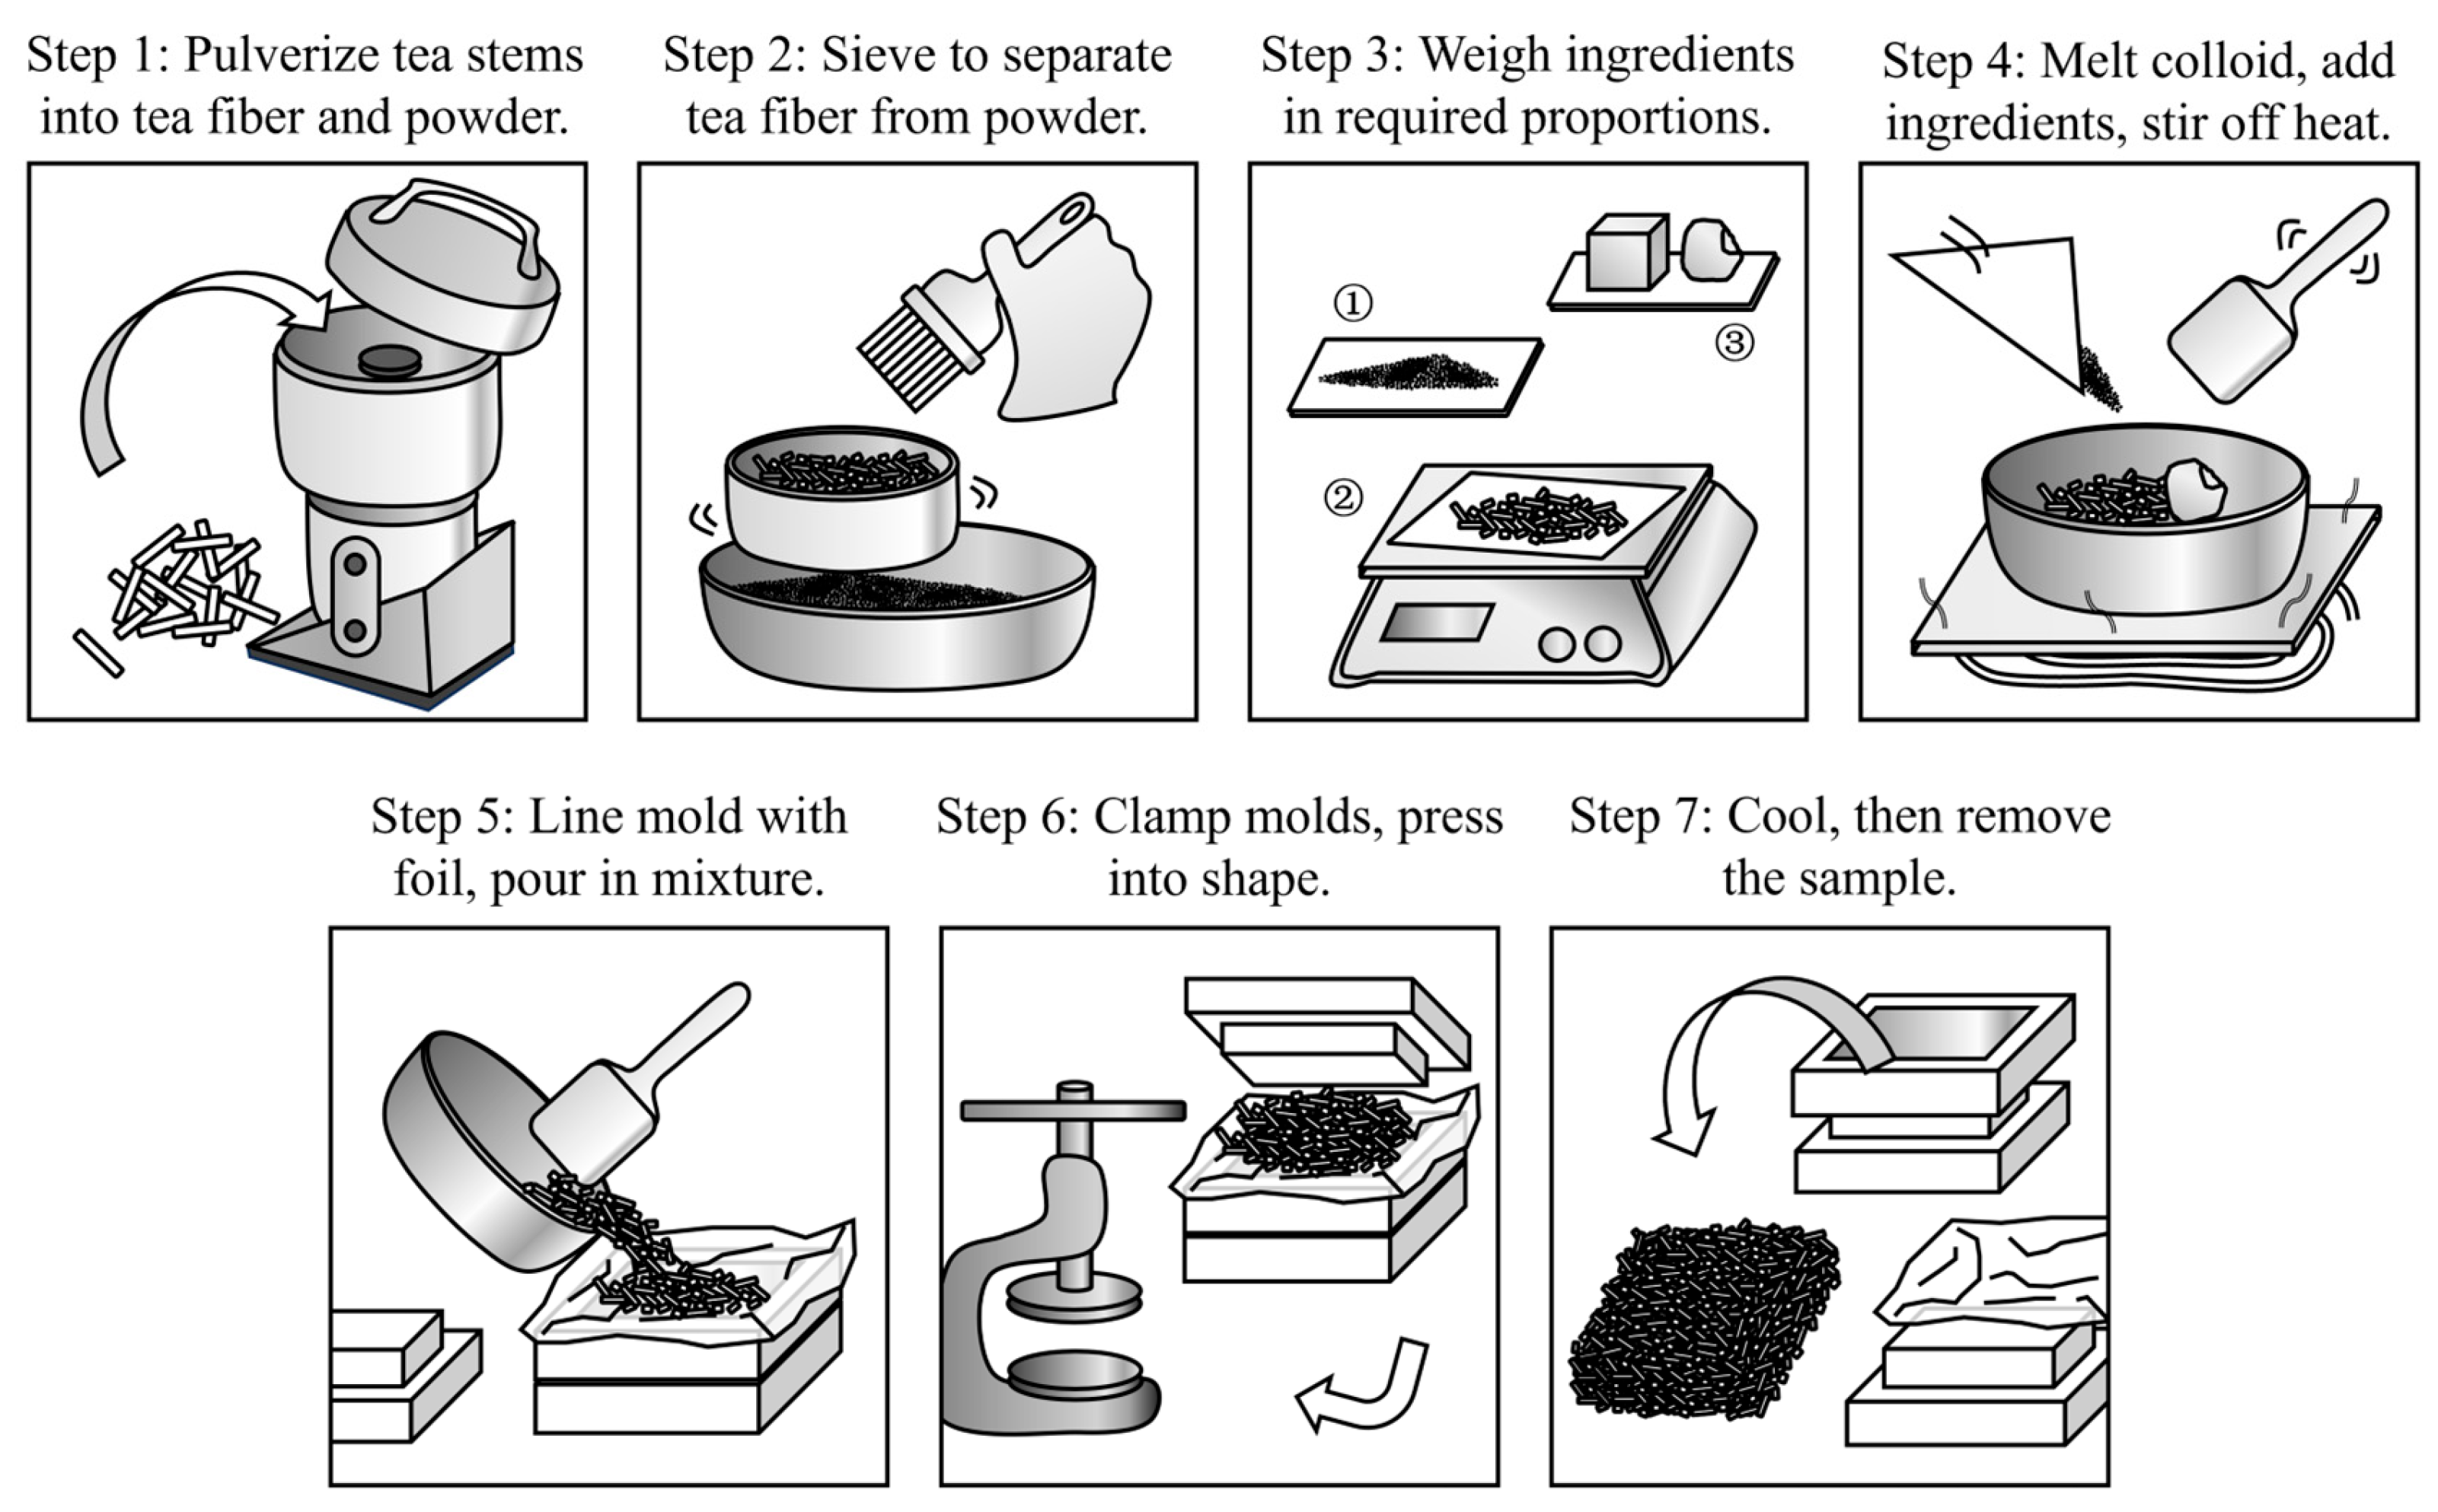
2.2. Experimental Samples
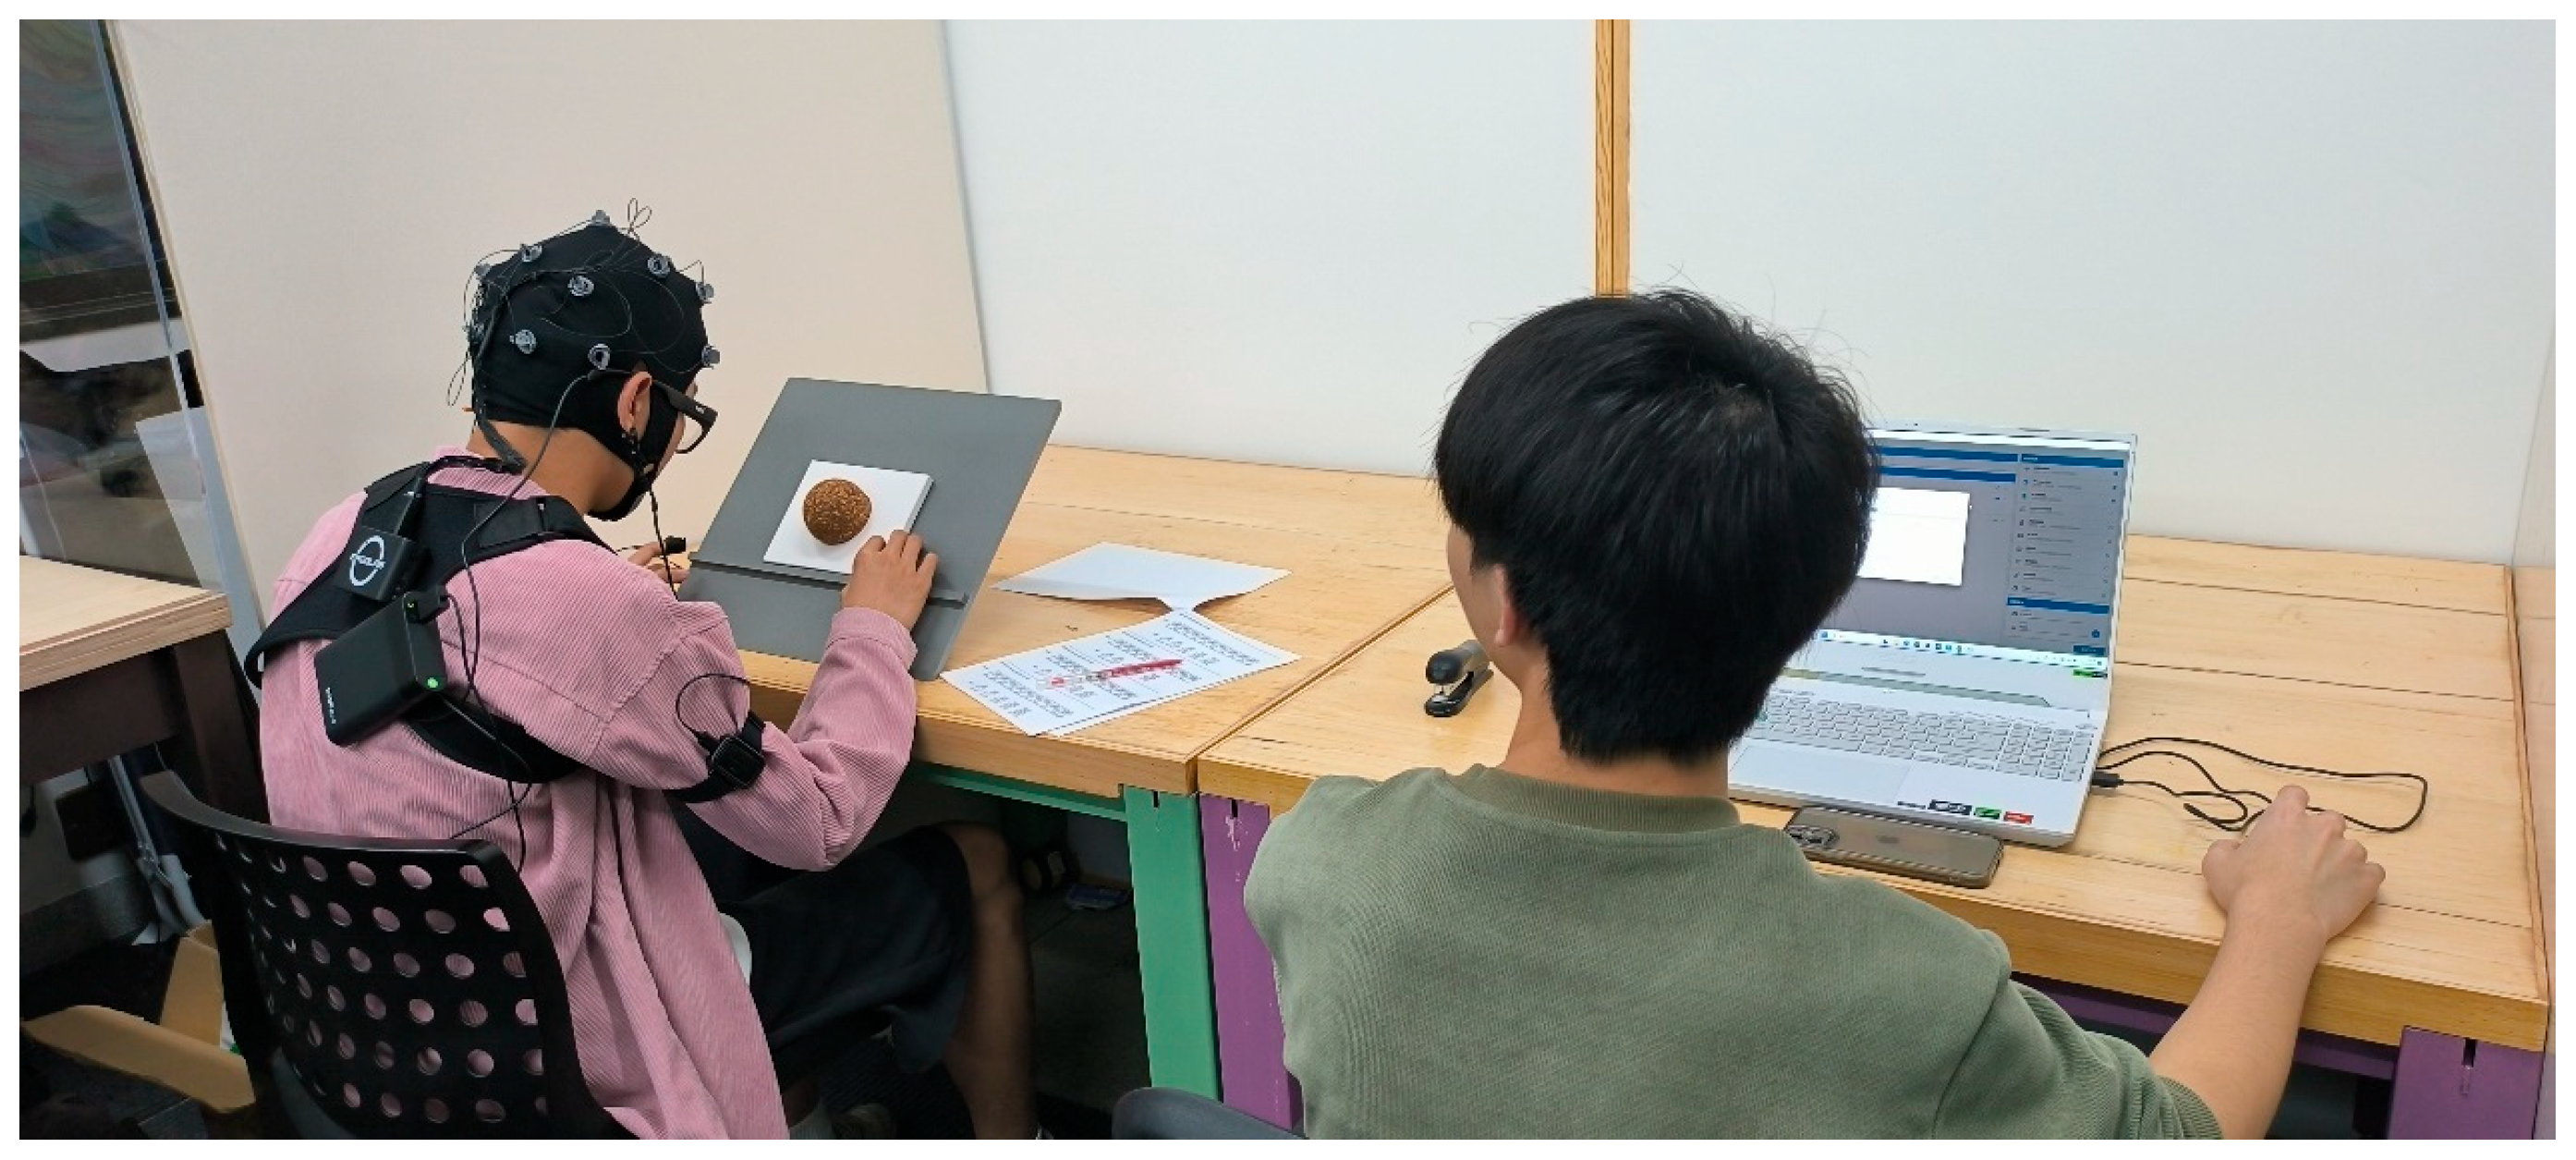
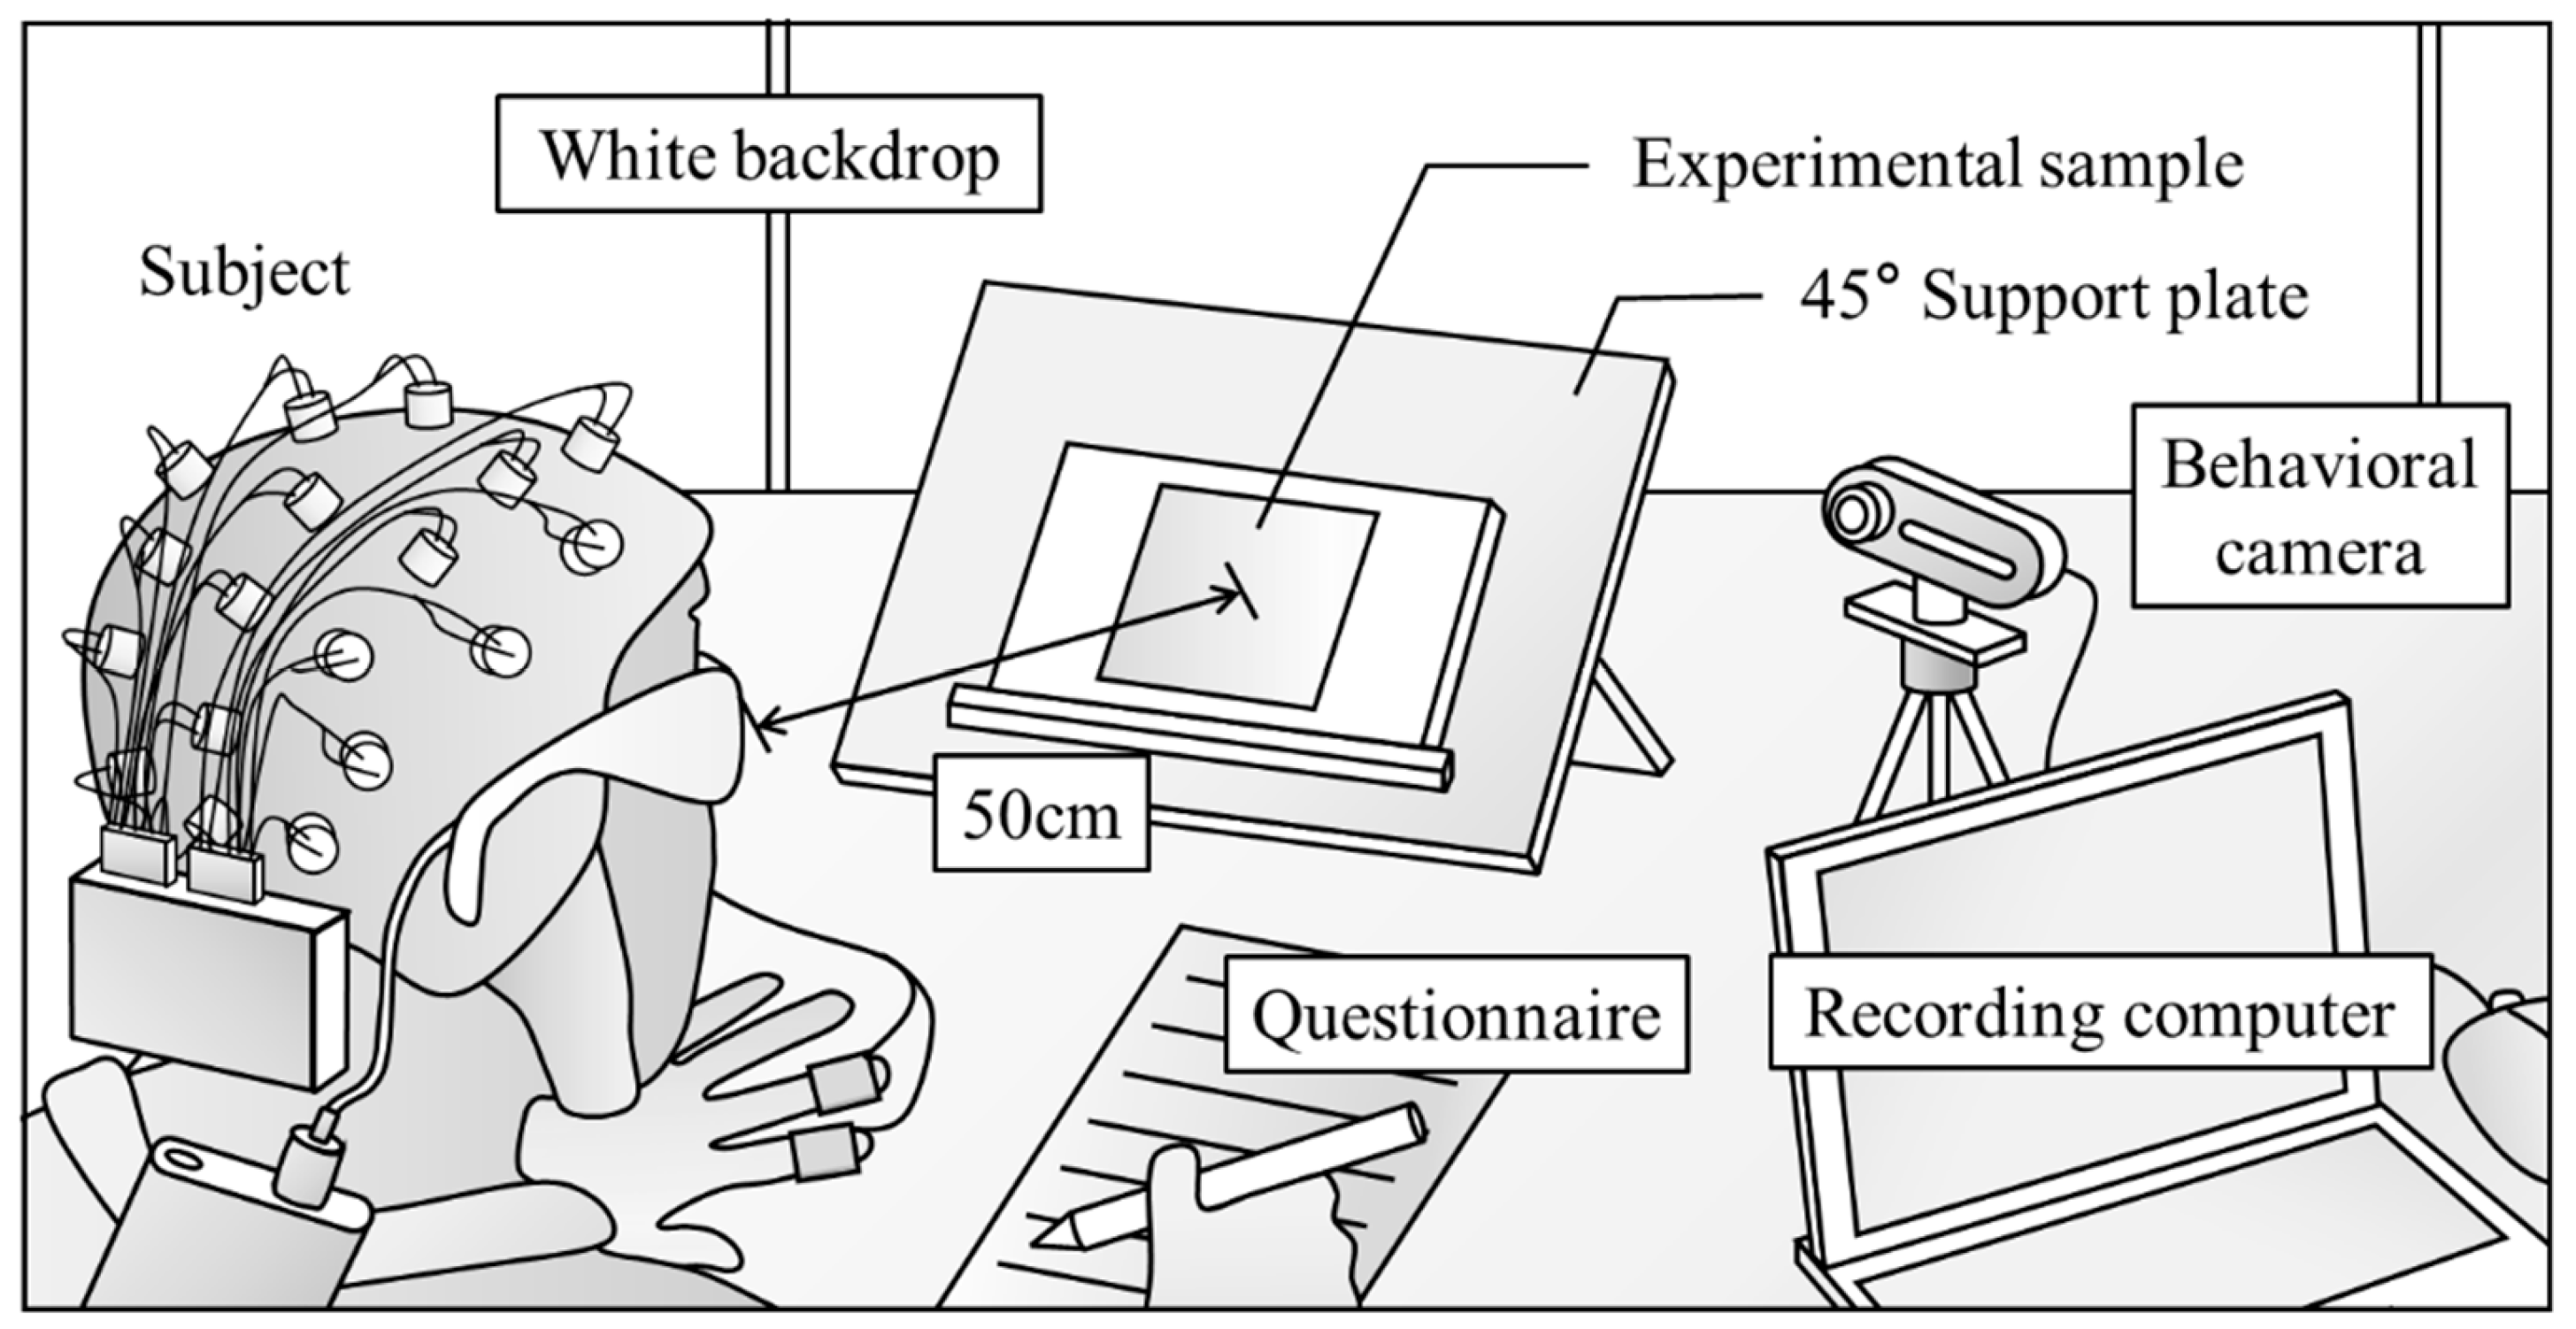
2.3. Experimental Environment
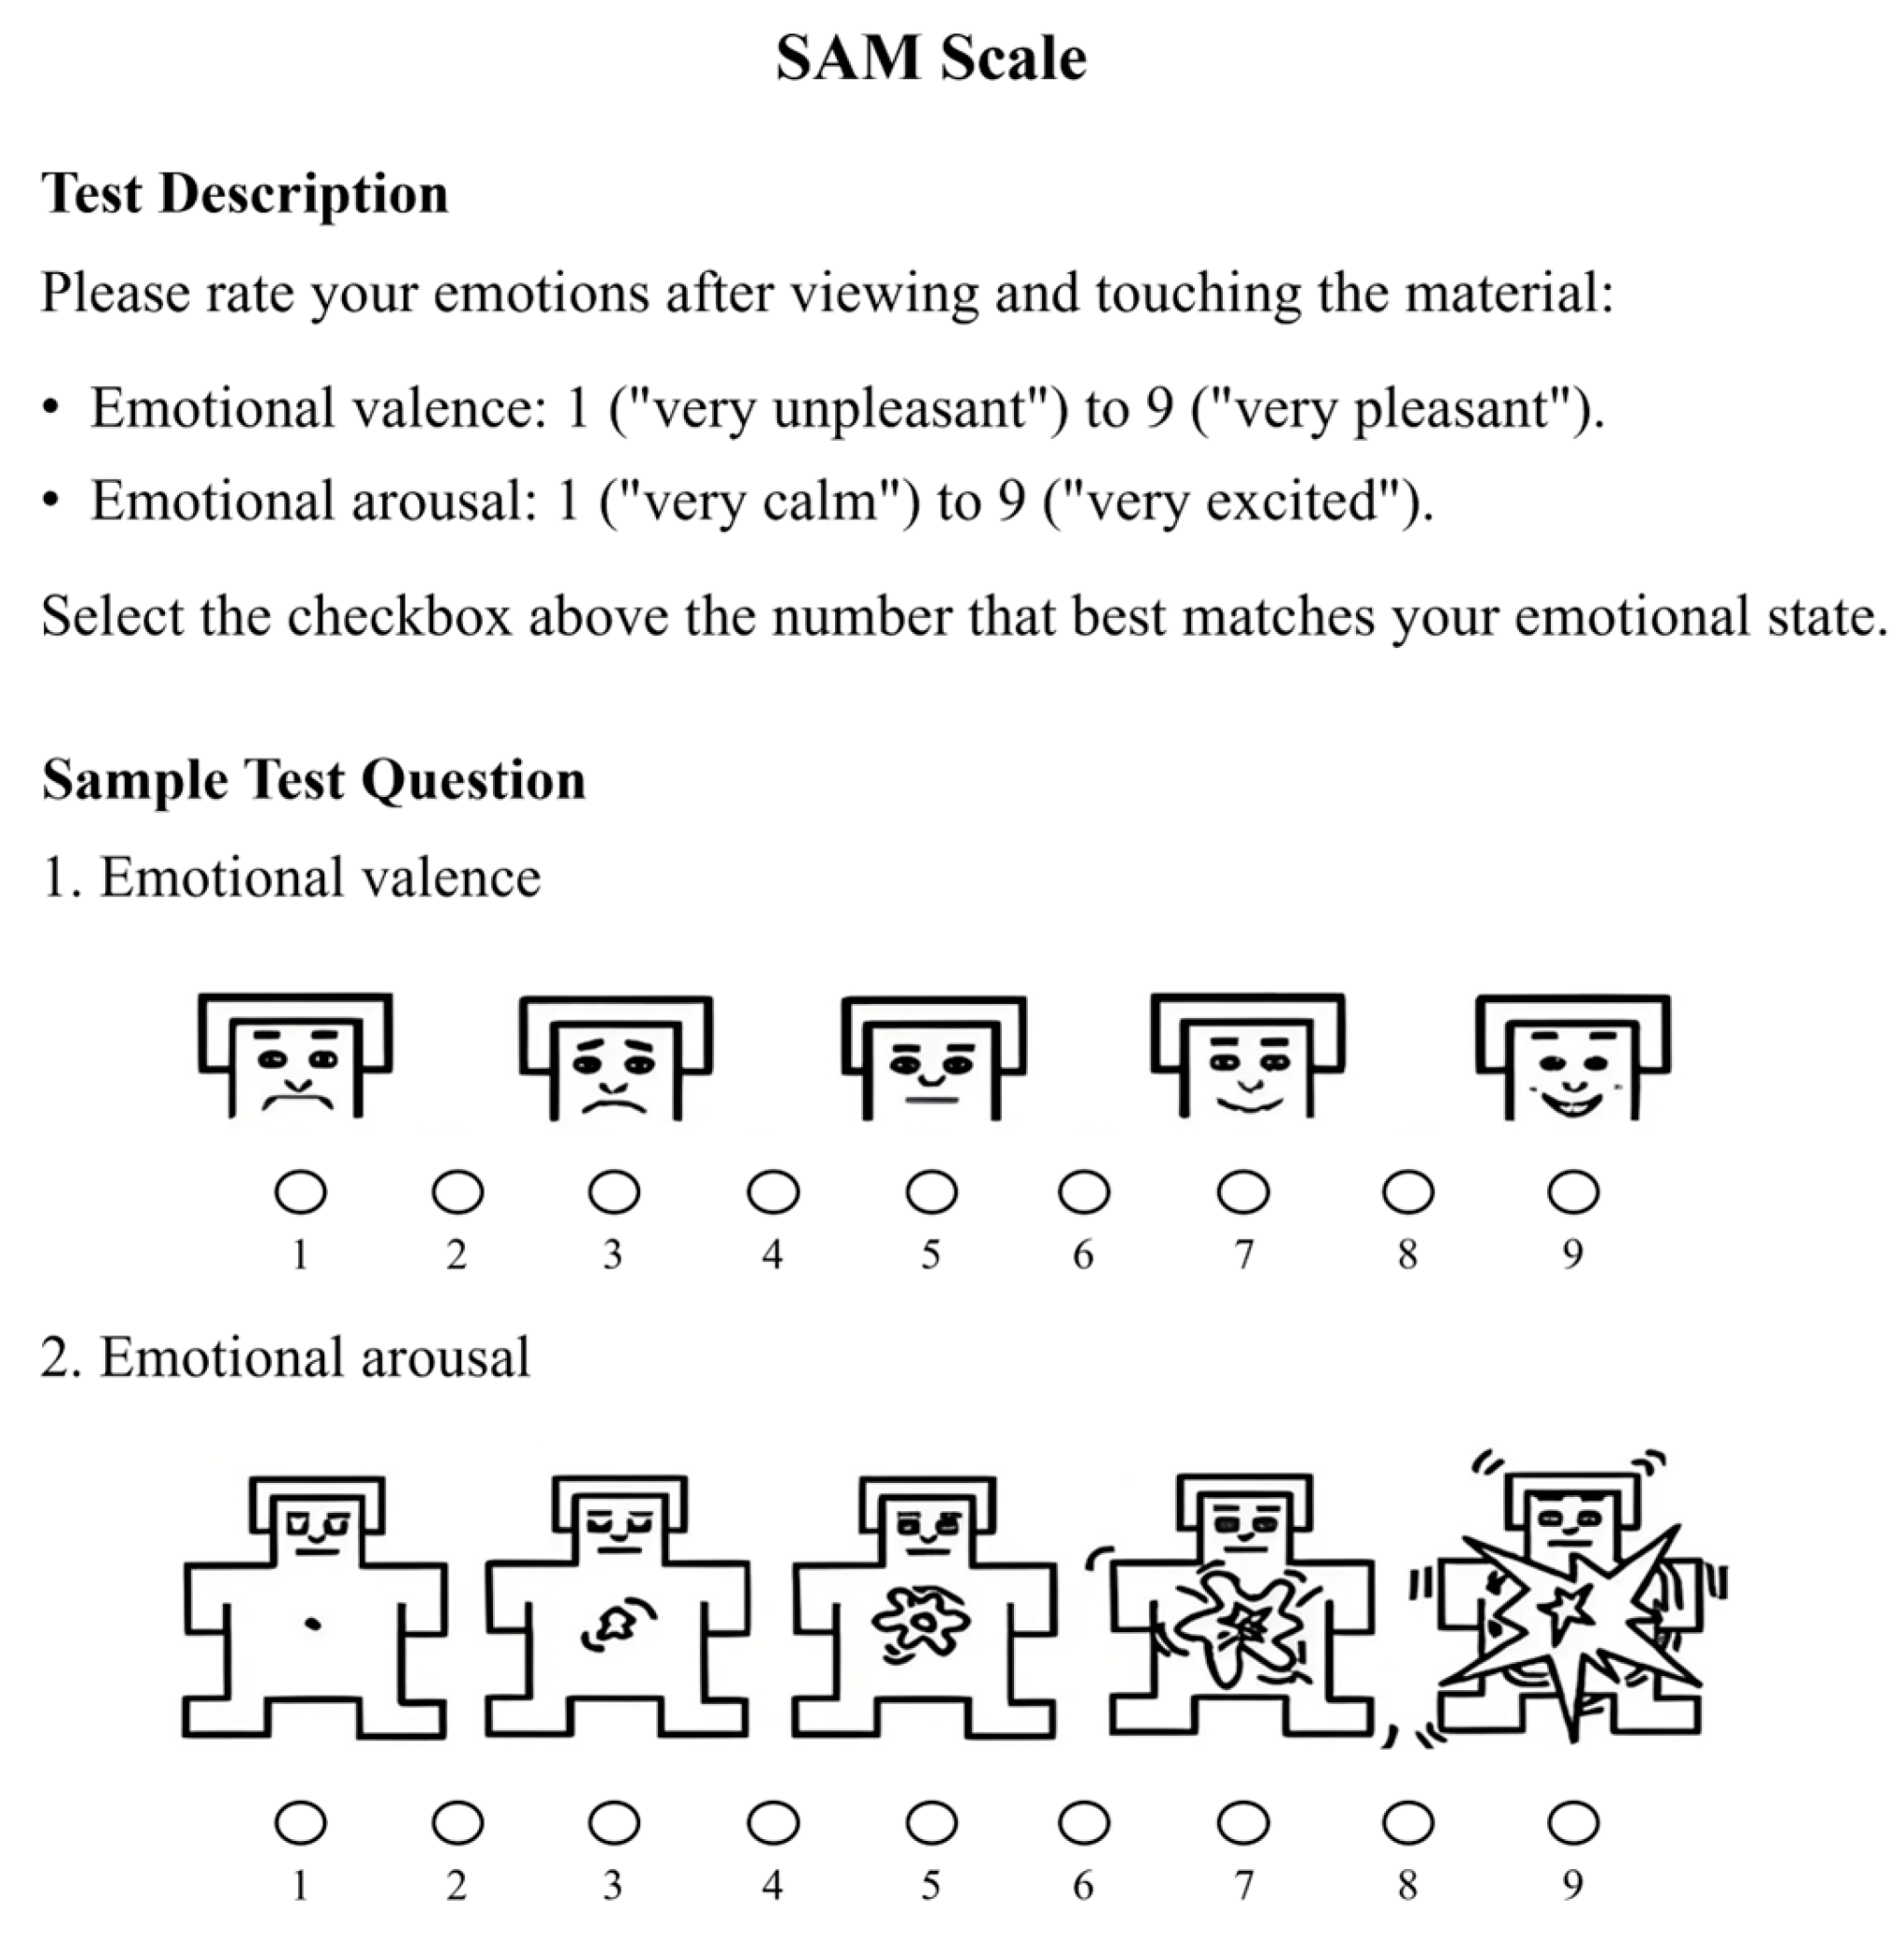
2.4. Subjective Emotional Evaluation
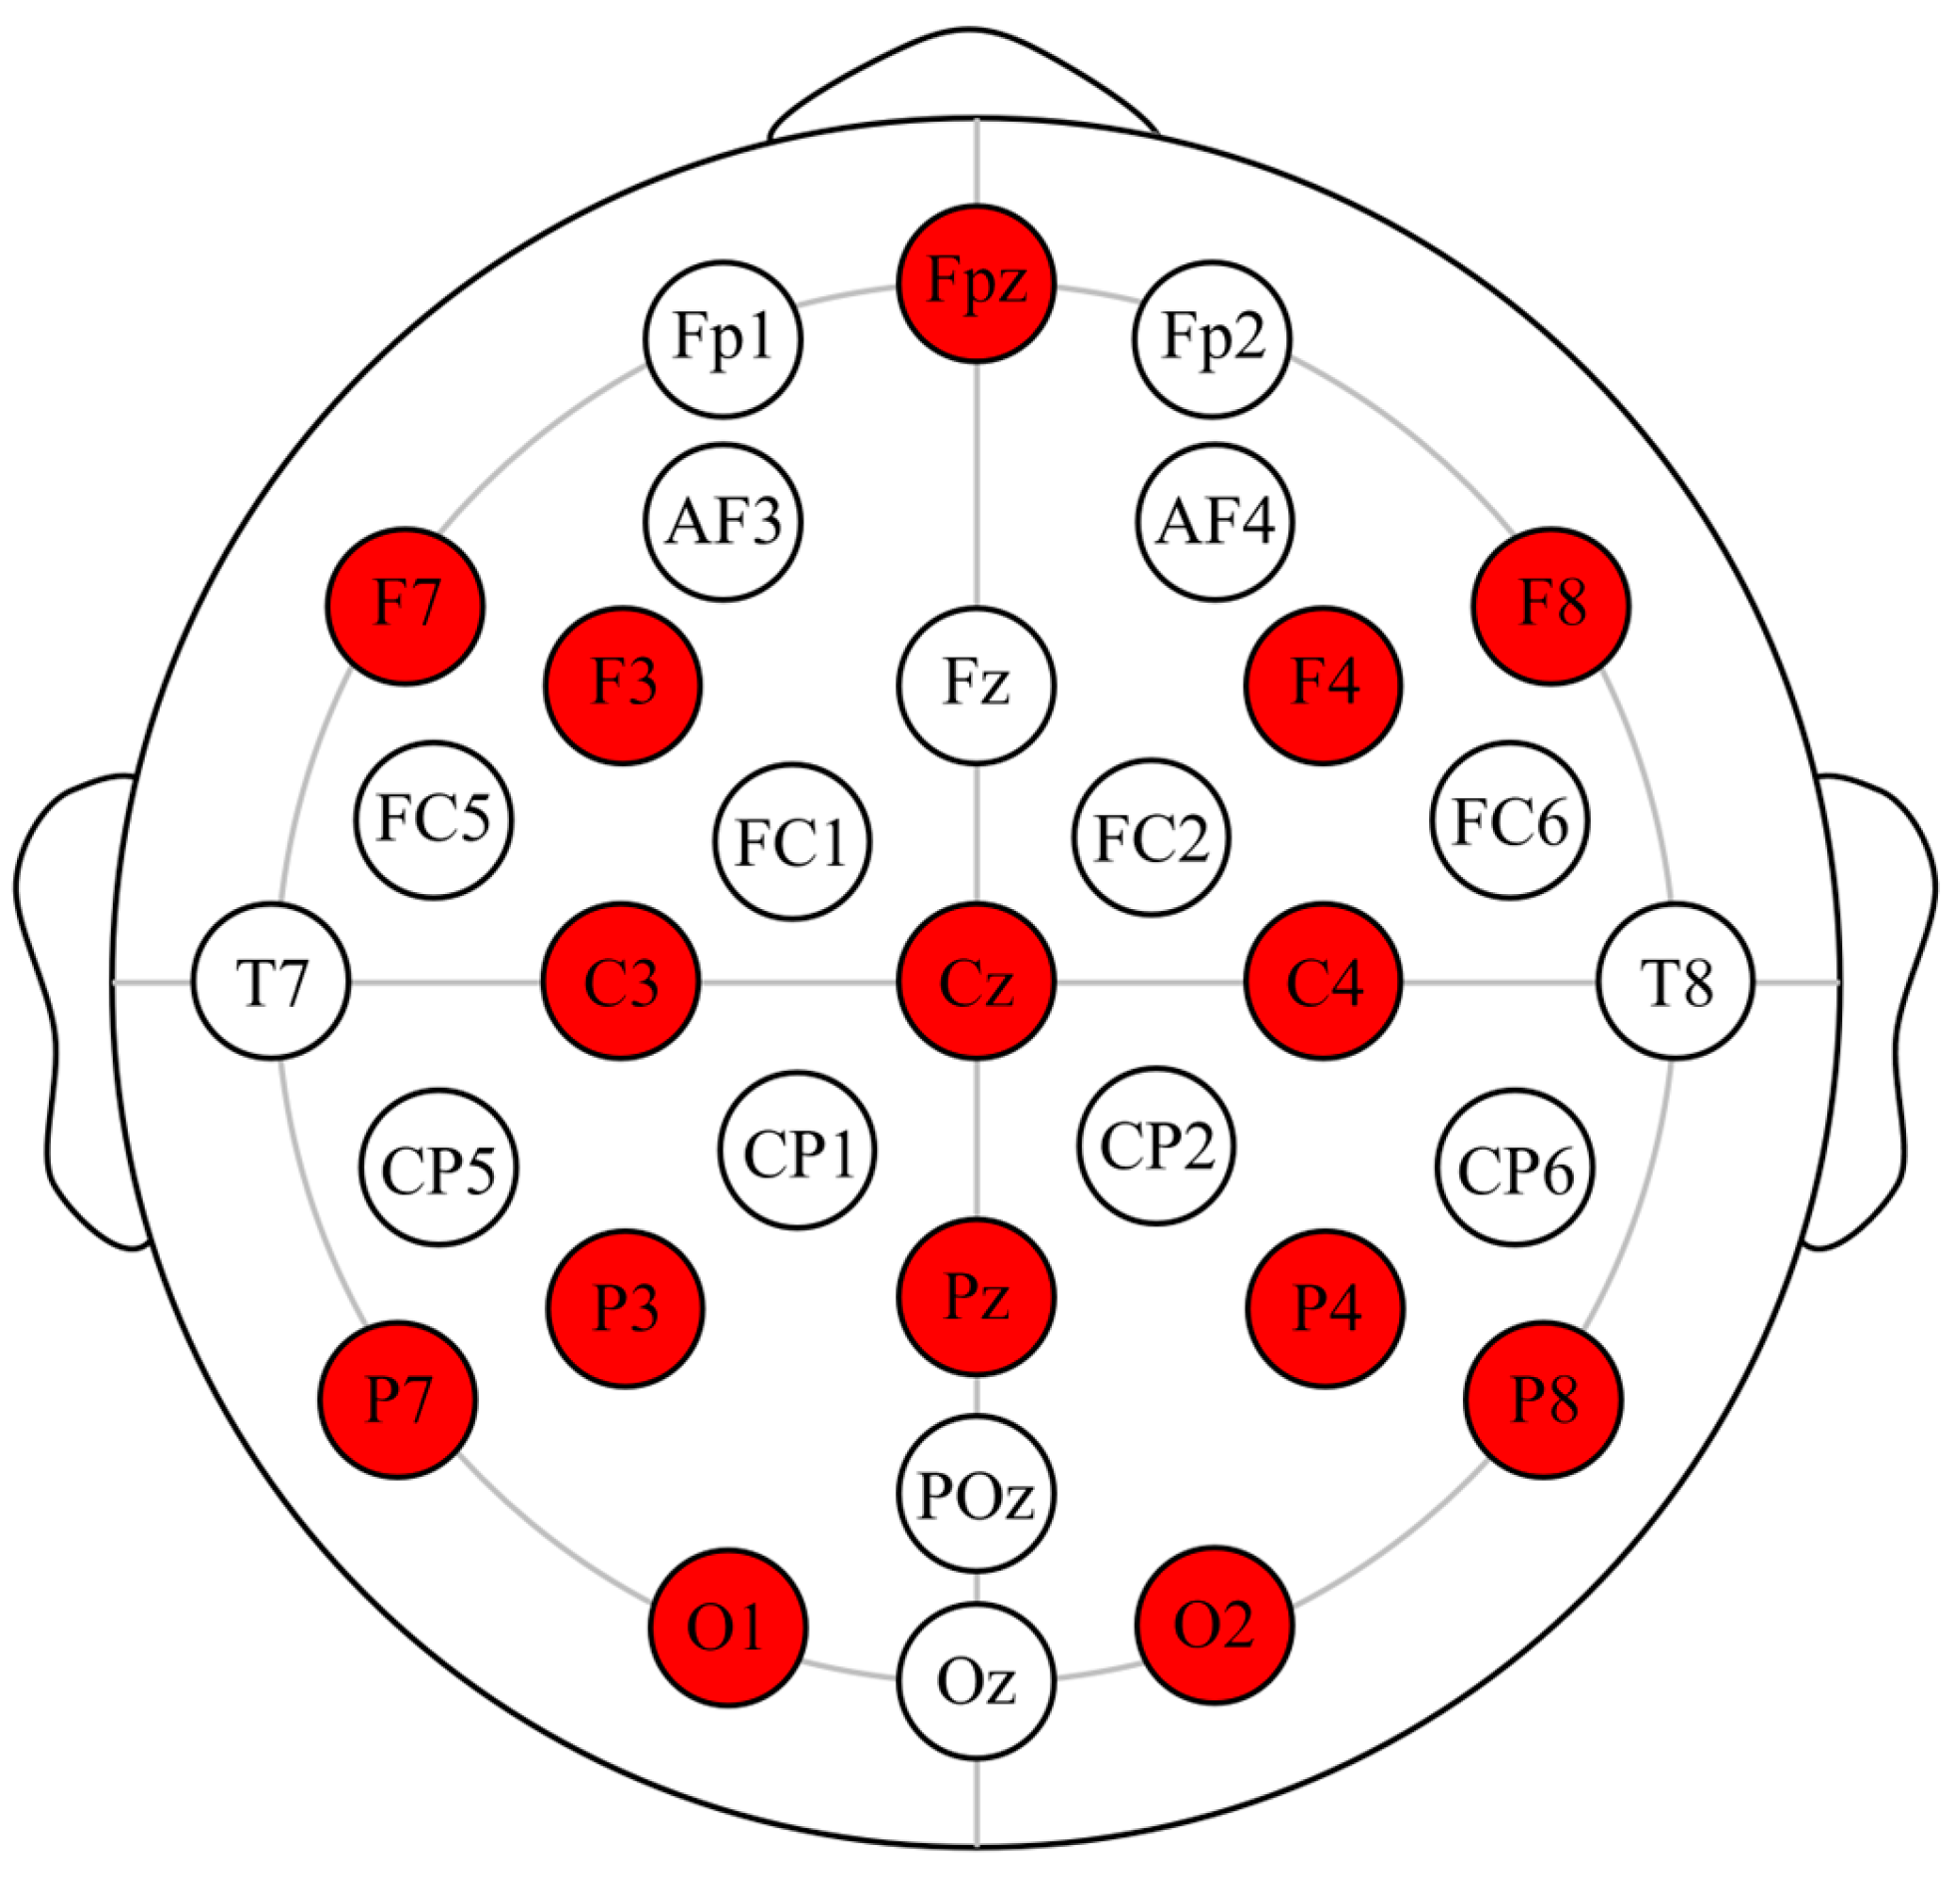
2.5. Physiological Measurement Indicators and Equipment
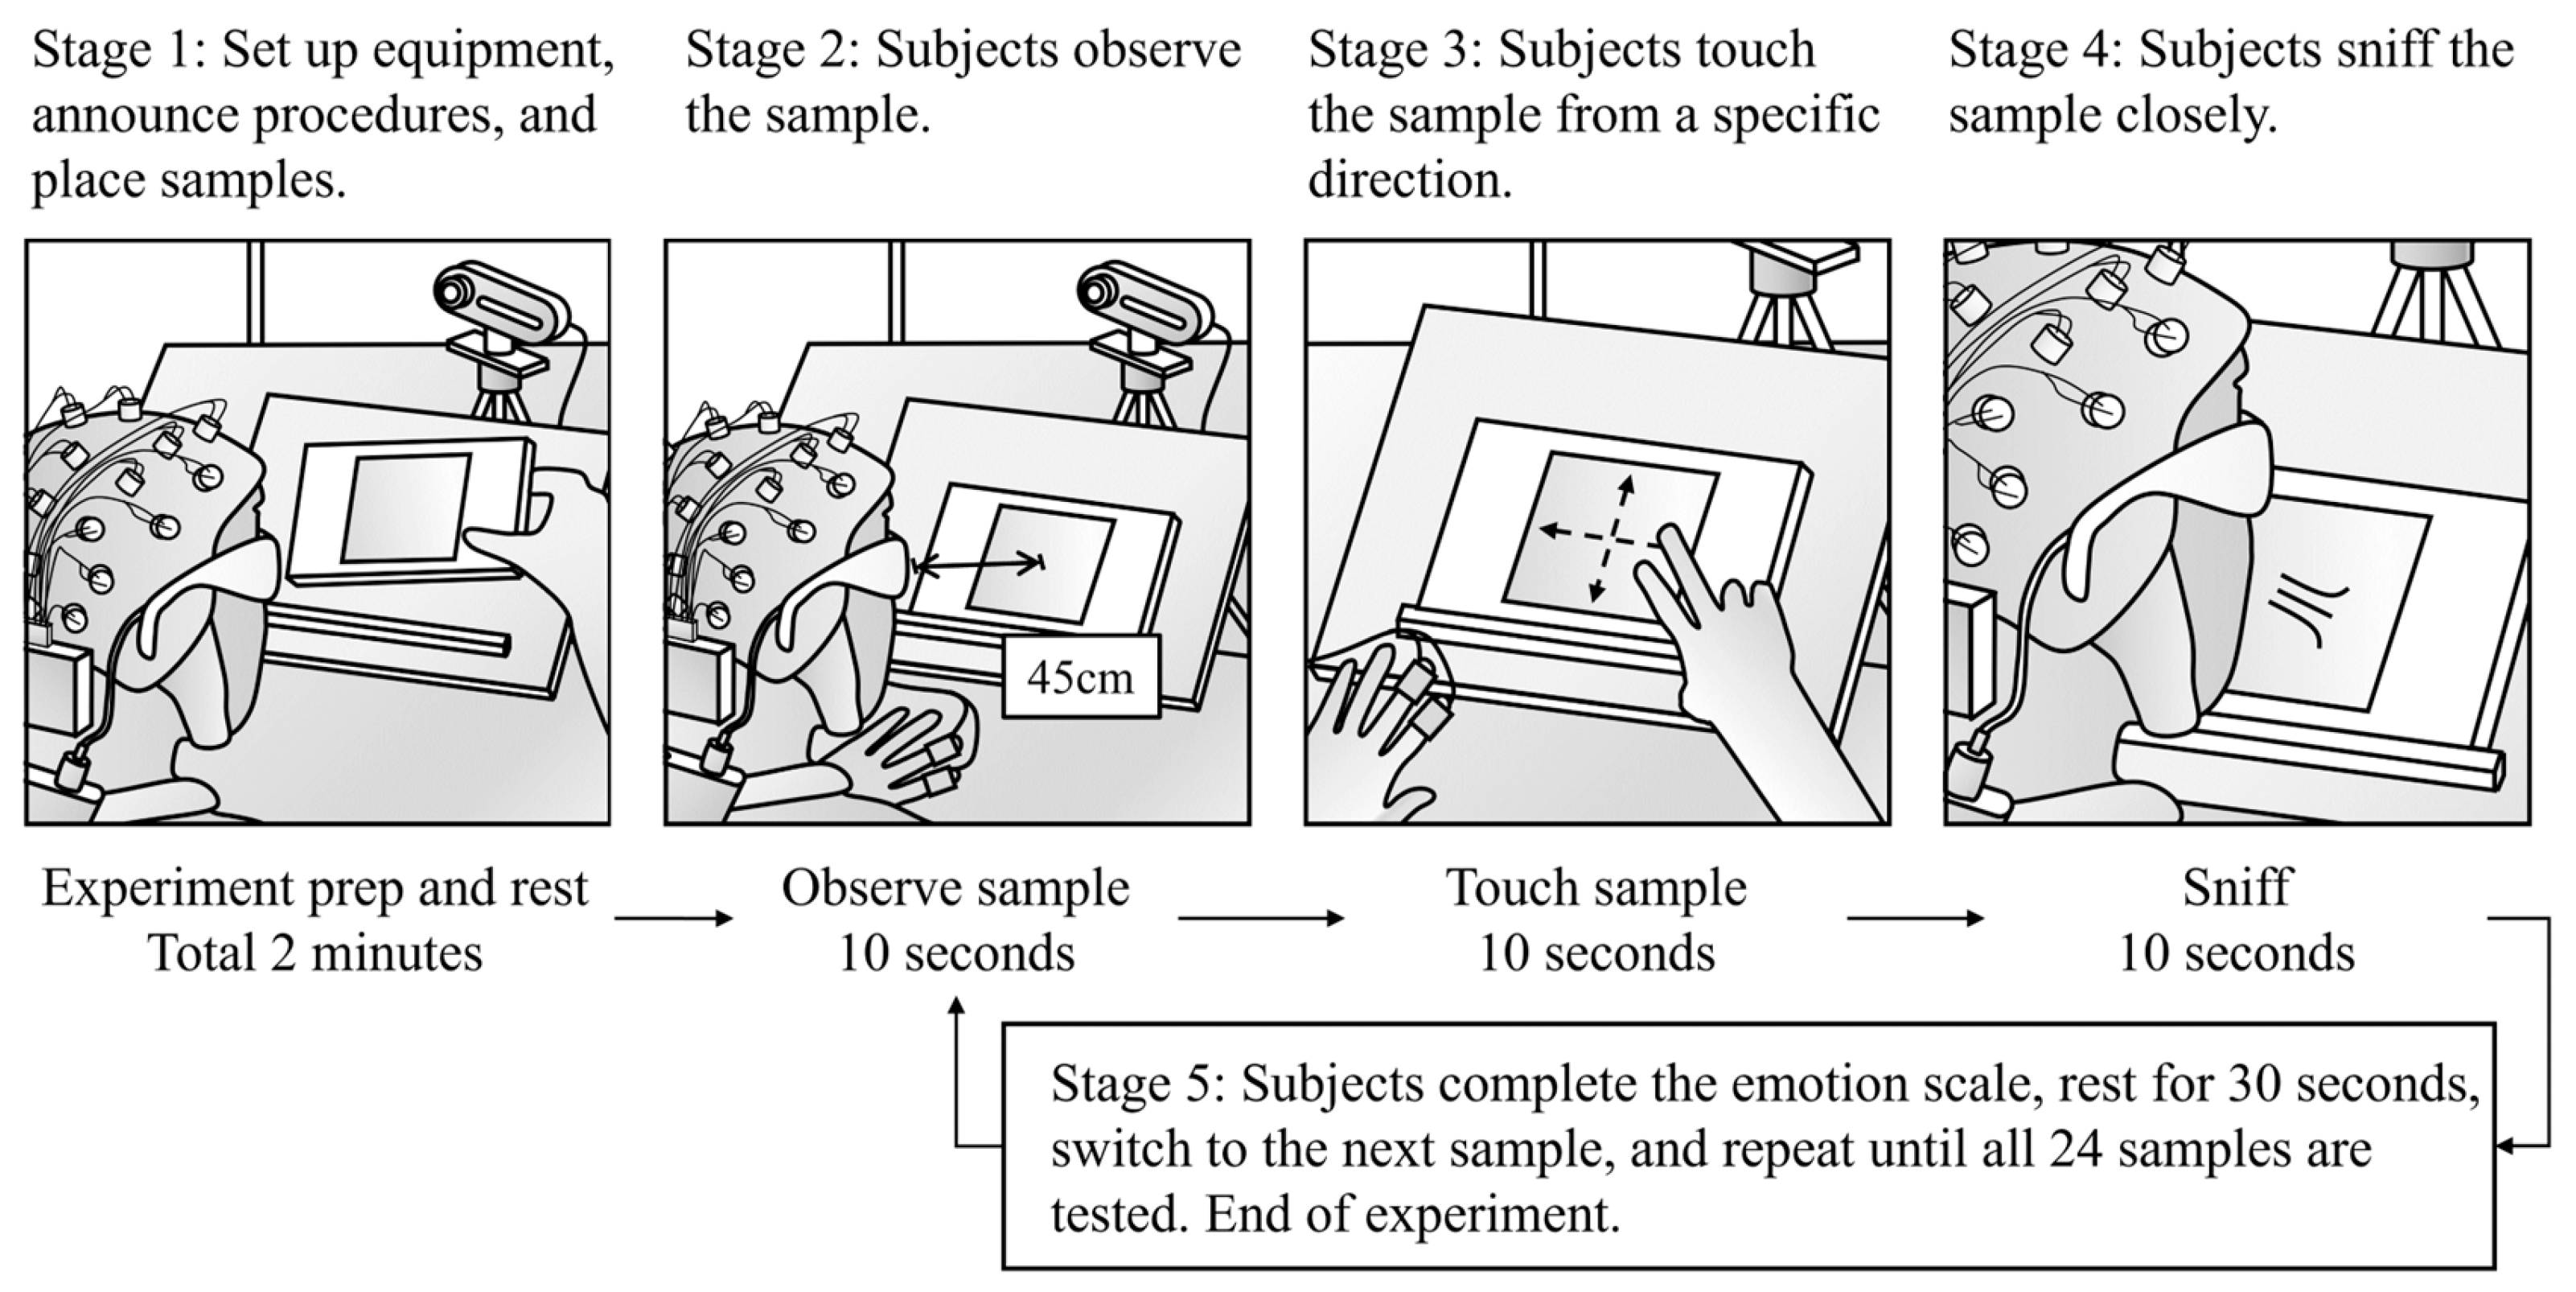
2.6. Experimental Procedure and Data Processing
3. Experimental Results
3.1. Subjective Emotion Evaluation
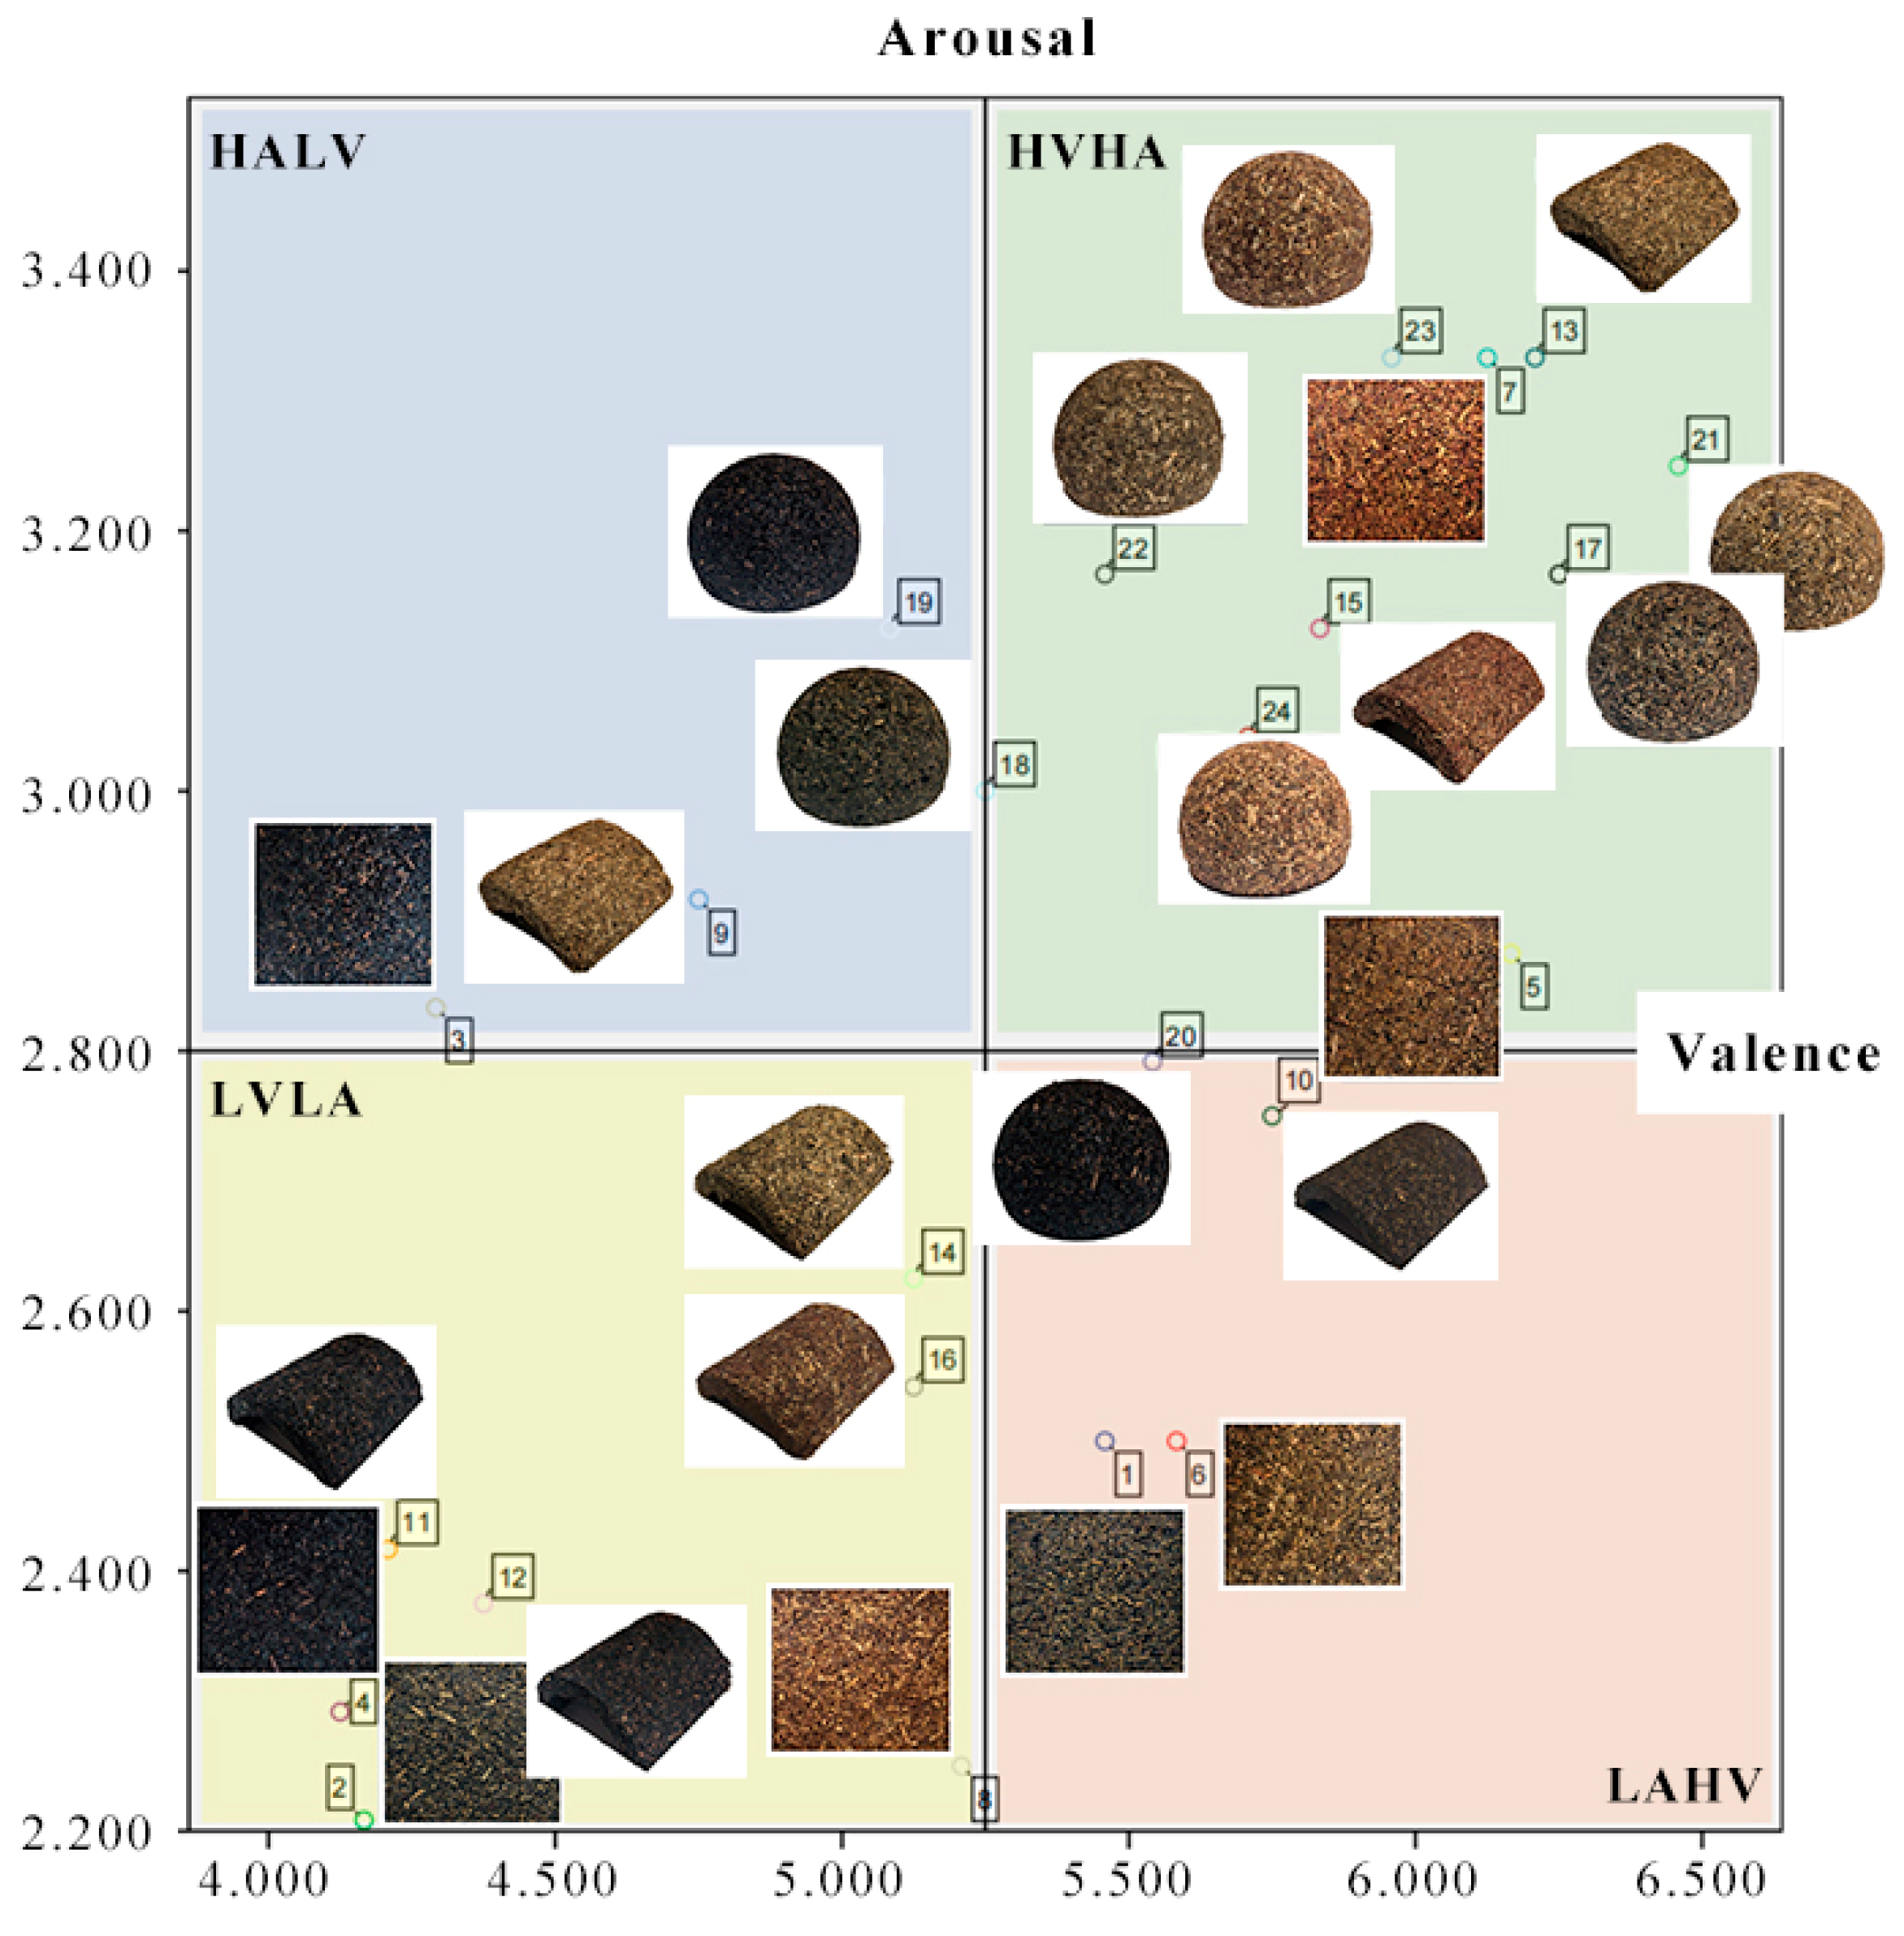
3.1.1. Subjective Emotional Space
3.1.2. Differences in Subjective Evaluation of Material Components
3.1.3. Relationship Between Material Components and Subjective Evaluation
3.2. Emotion Analysis Based on EEG
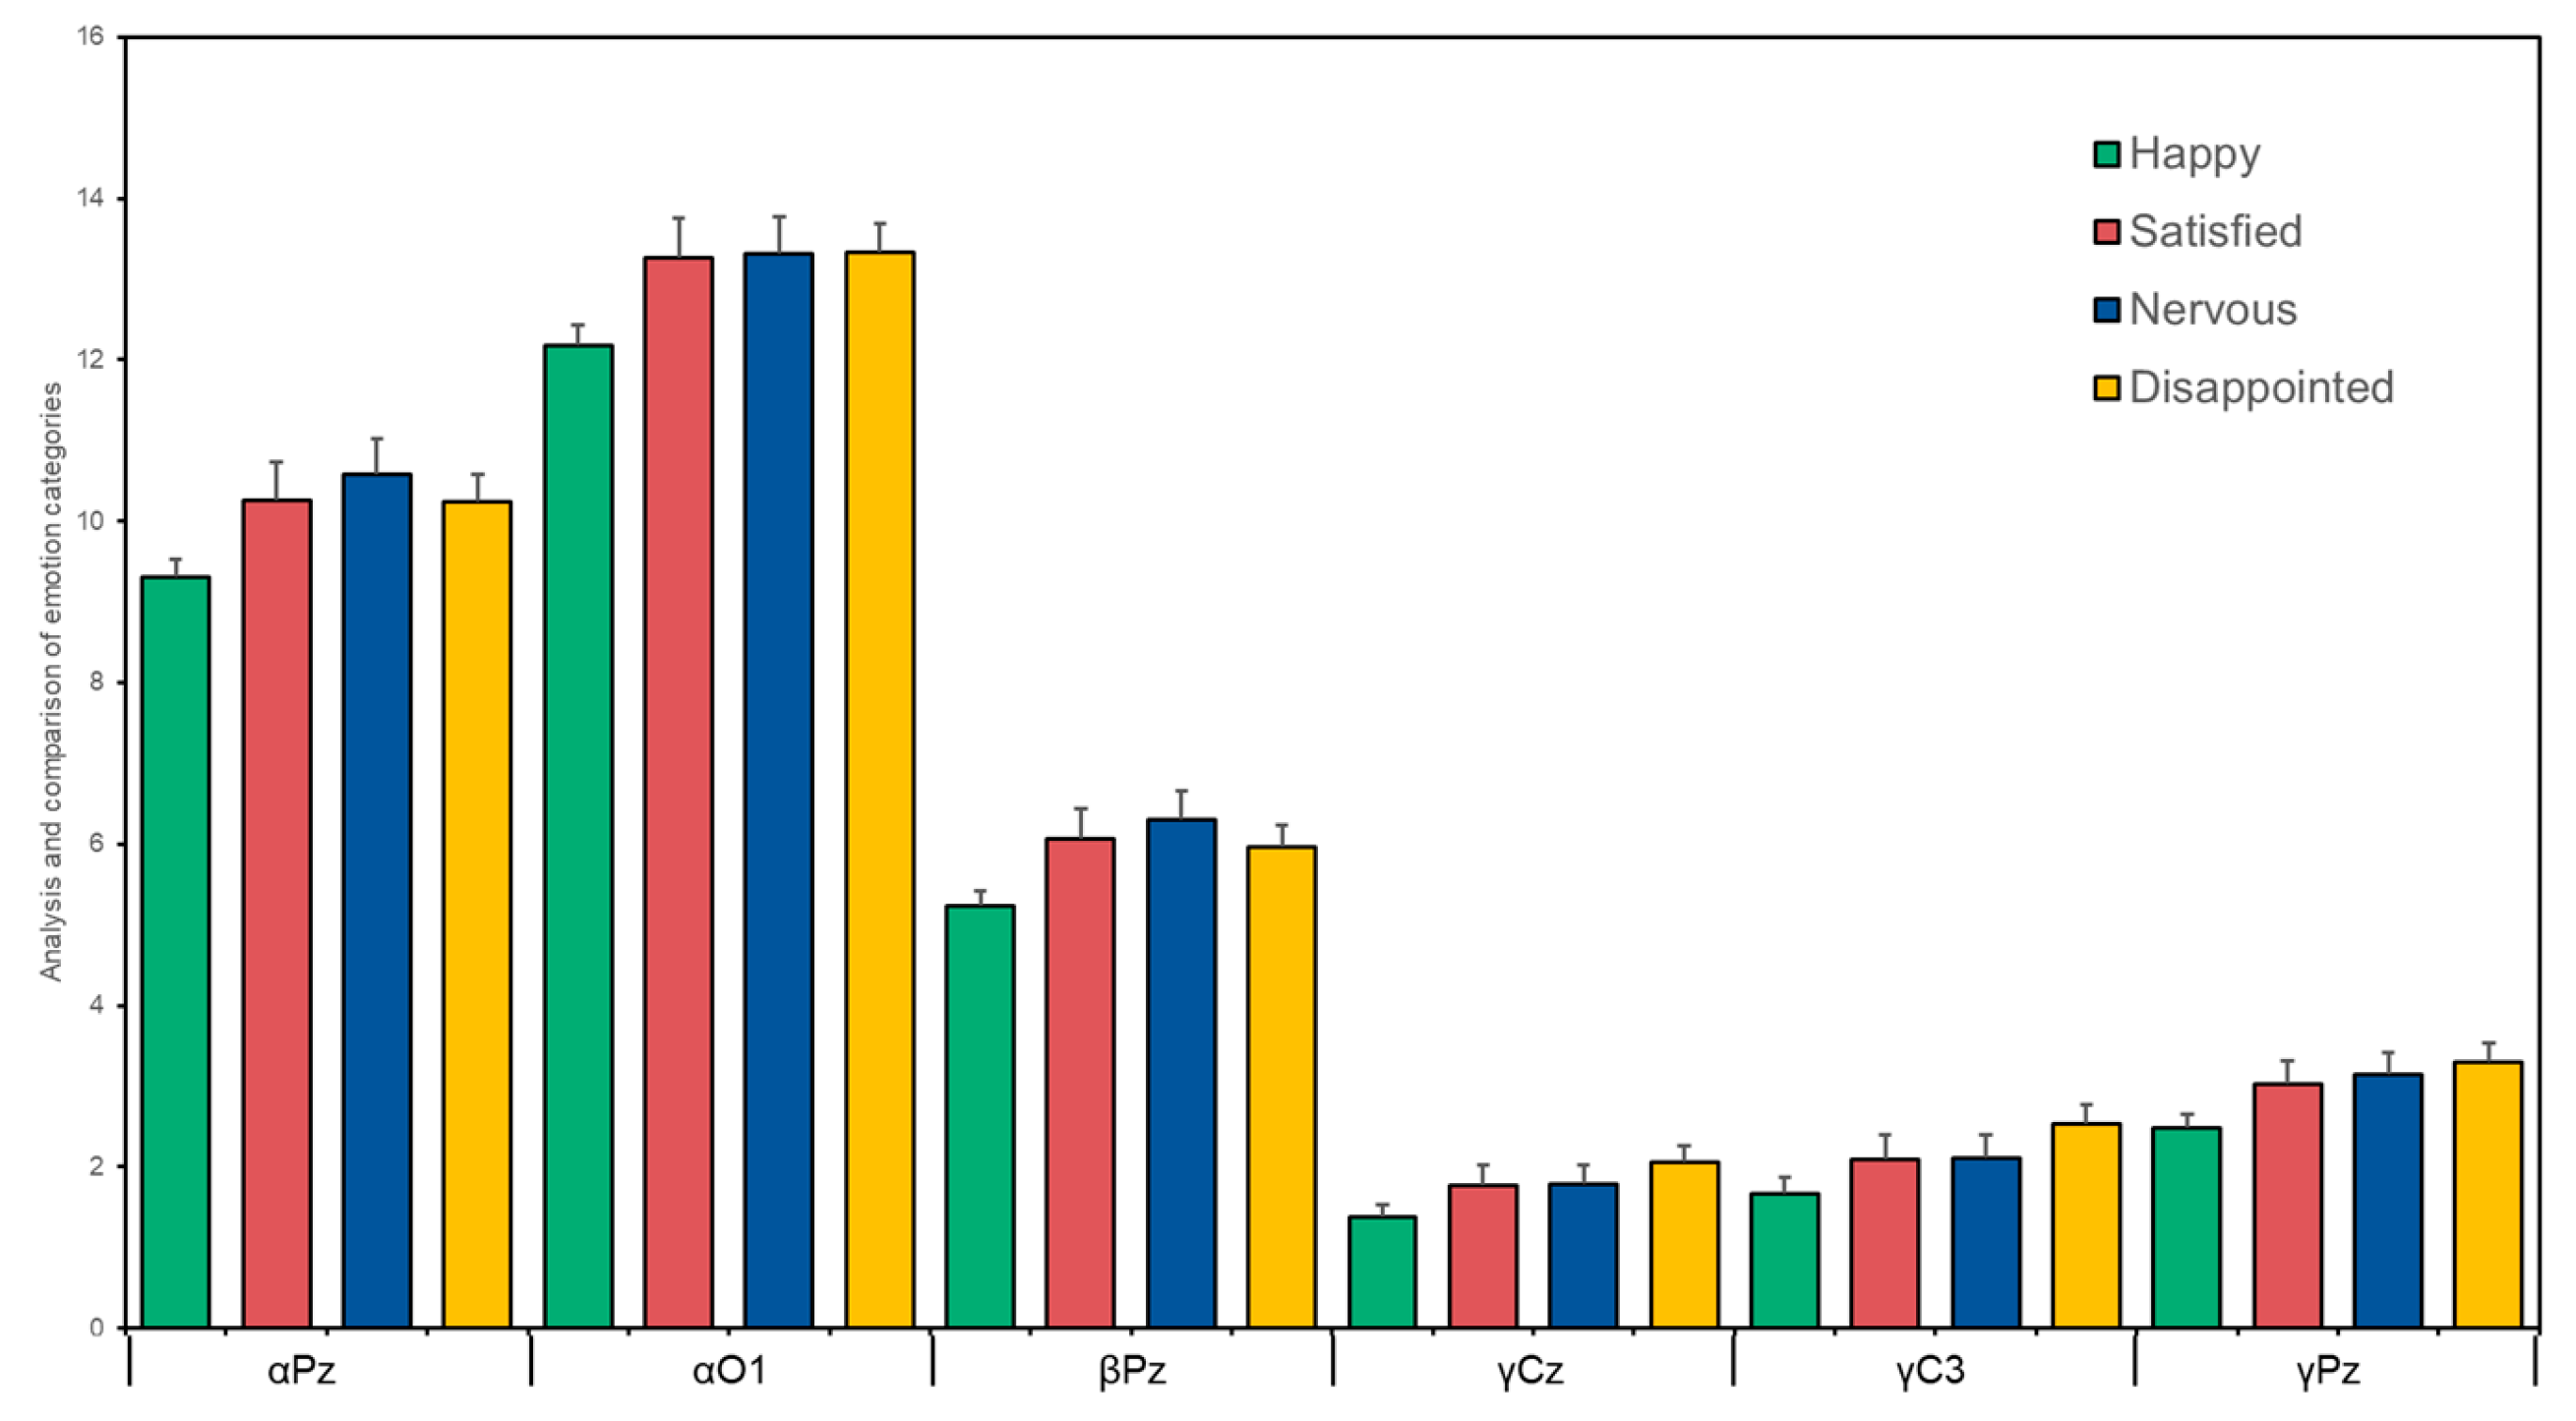
3.2.1. Emotional Effect
3.2.2. Analysis of the Relationship Between EEG and Subjective Emotions
3.3. Emotion Analysis Based on the Peripheral Nervous System
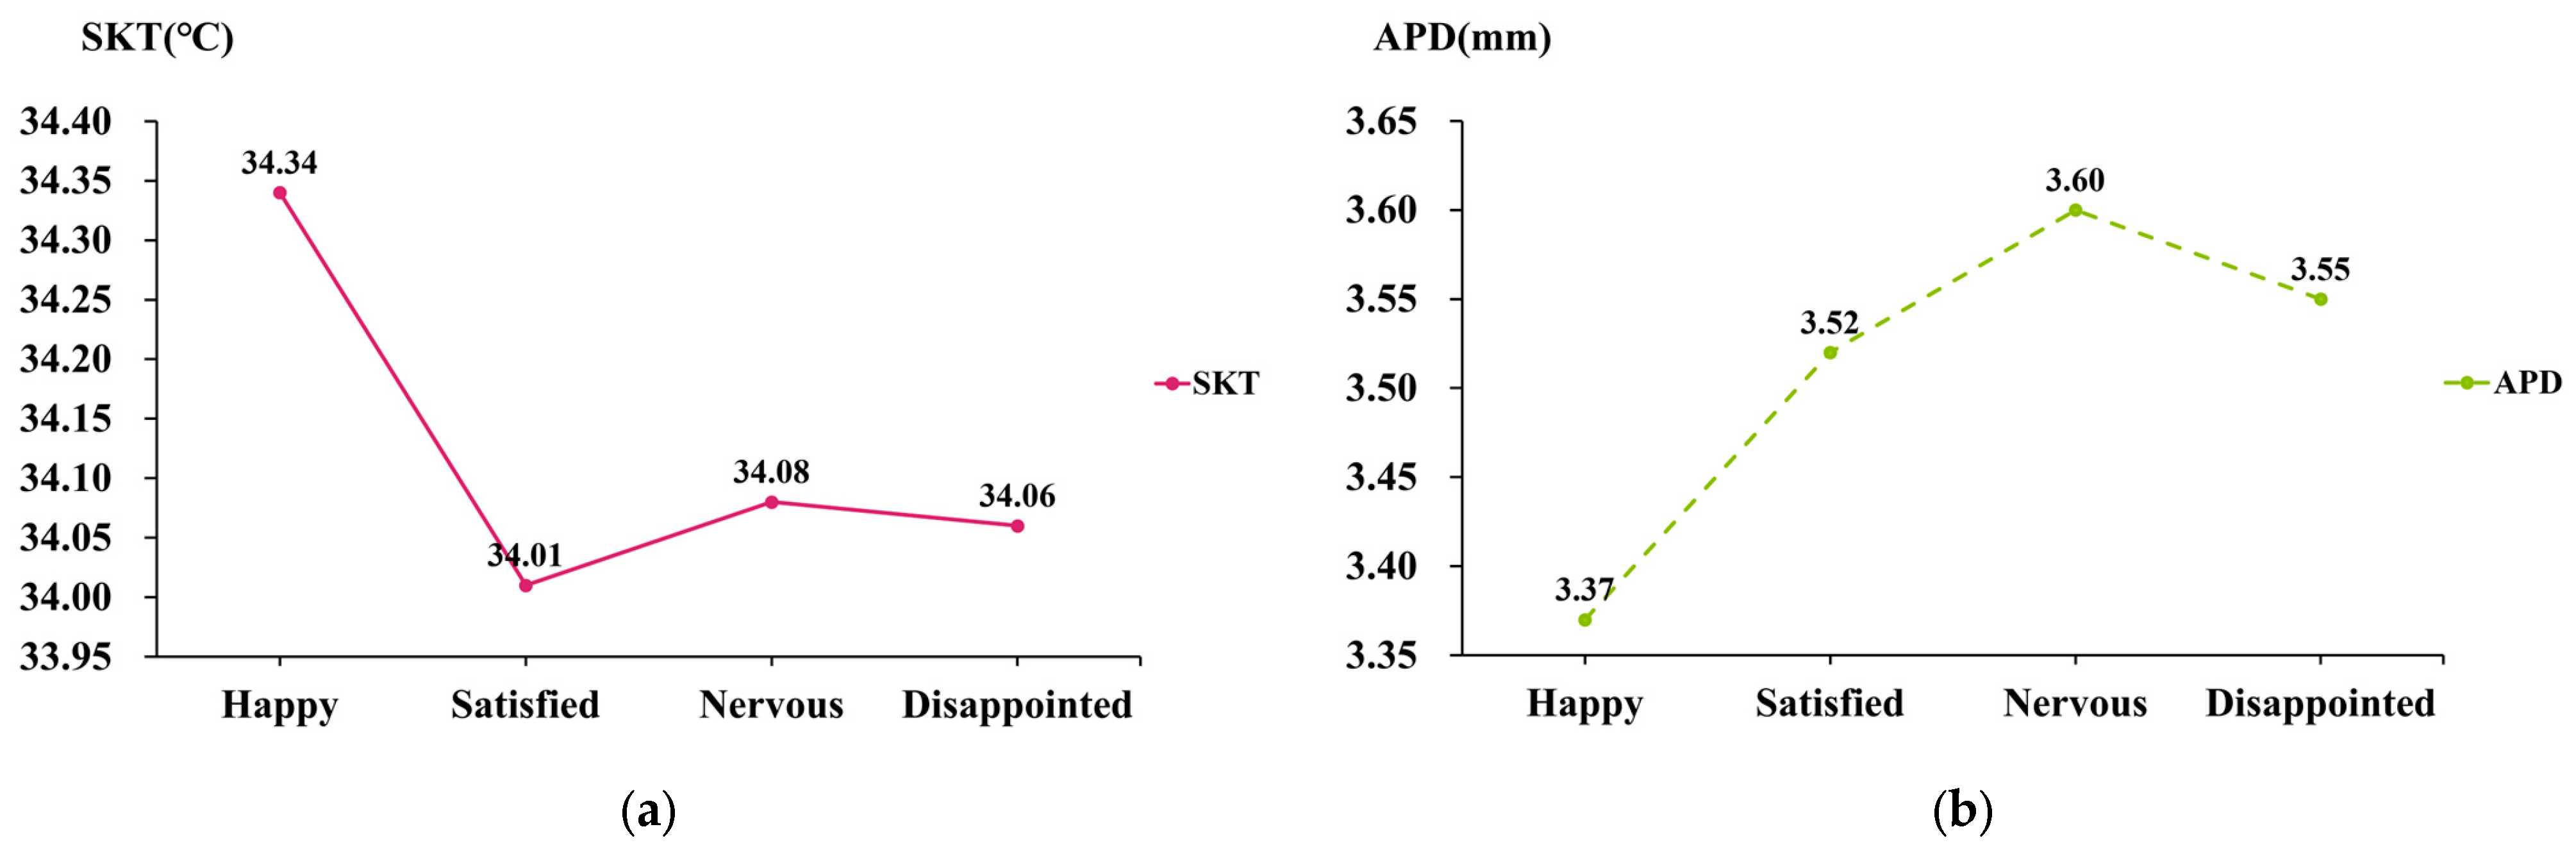
3.3.1. Emotional Effect
3.3.2. Analysis of the Relationship Between the Peripheral Nervous System and Subjective Emotions
4. Discussion
4.1. Subjective Emotion Evaluation
4.2. Emotion Analysis Based on EEG
- Valence Optimization: Enhance emotional valence by reducing γFz and γP7 power by decreasing surface glossiness to mitigate prefrontal conflict responses.
- Arousal Regulation: Balance αF4 suppression (e.g., increase color contrast to capture attention) and γF4 control (e.g., avoid overly complex textures to reduce cognitive load).
- Dynamic Feedback: During prototype testing, if γO2 power exceeds 10 μV (β = 0.455, p < 0.01), it is identified as a high arousal-high conflict state, necessitating adjustments in material CMF (color, material, finish) parameters, such as reducing red saturation.
4.3. Emotion Analysis Based on the Peripheral Nervous System
- SKT as a Measure of Pleasantness: During user testing, if contact with a material increases SKT by ≥0.3 °C, it can be determined to have high pleasantness potential (such as the natural touch of tea stem fibers).
- APD Alert Mechanism: If APD persistently exceeds 3.5 mm, it triggers design adjustments (such as reducing the proportion of black samples or optimizing surface roughness) to avoid negative associations.
4.4. Reflections on Metamodern Principles
5. Conclusions
- Morphological Features as Primary Emotional Cues: spherical designs enhance positive emotional valence by reducing the visual cognitive load (beta wave suppression up to 22%), corroborating the applicability of the affective prioritization theory in material design.
- Asymmetry in Multisensory Coupling: brightness in color drives emotional arousal by enhancing amygdala activation (gamma wave increase of 18%), while surface roughness enhances tactile emotional feedback, suggesting differential sensory impacts on emotion.
- Significant Impact of the Peripheral Nervous System on Emotions: an increase in skin temperature (SKT) by 0.8 °C during positive emotions reflects a sympathetic inhibition mechanism, whereas pupil dilation (APD increase of 15%) serves as a physiological veto signal for negative emotions.
Author Contributions
Funding
Institutional Review Board Statement
Data Availability Statement
Conflicts of Interest
Appendix
Appendix B
Appendix C

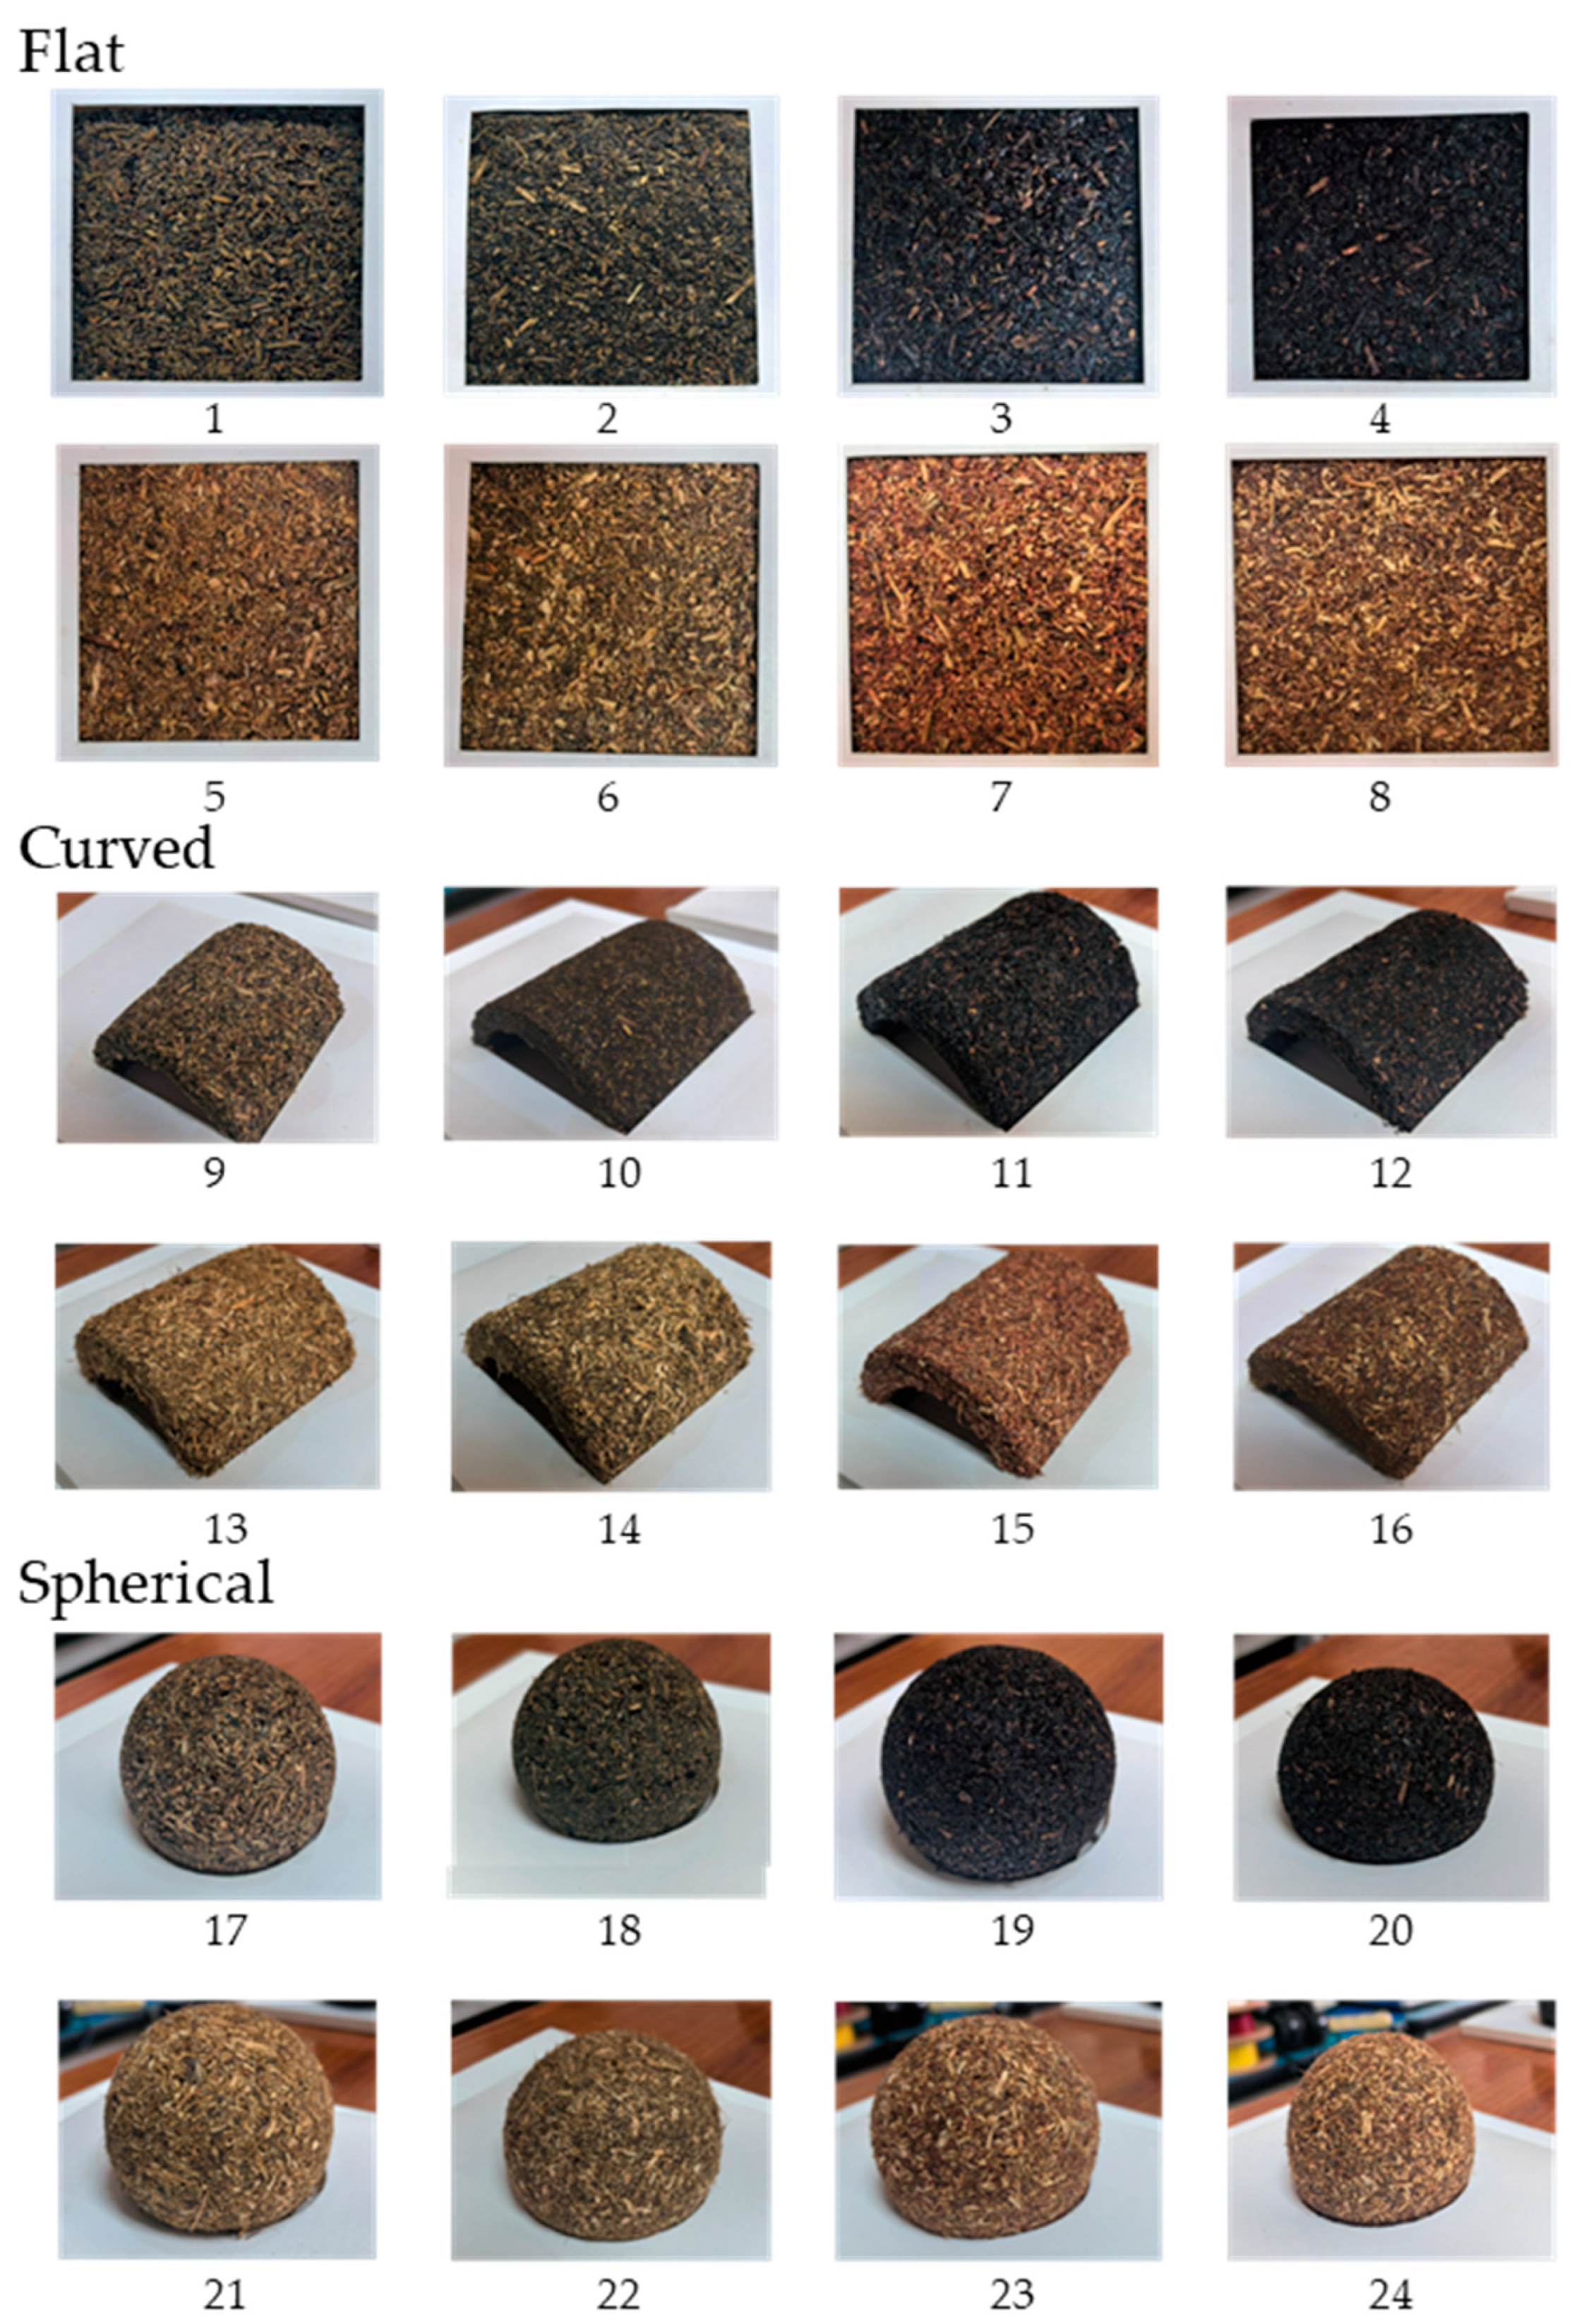
| Sample No. | Shape | Color | Intensity of Odor | Roughness |
|---|---|---|---|---|
| 1 | Flat | Green | Strong | Rough |
| 2 | Flat | Green | Strong | Smooth |
| 3 | Flat | Black | Medium | Slightly smooth |
| 4 | Flat | Black | Medium | Very smooth |
| 5 | Flat | Yellow | Light | Very rough |
| 6 | Flat | Yellow | Light | Slightly rough |
| 7 | Flat | Red | Light | Very rough |
| 8 | Flat | Red | Light | Slightly rough |
| 9 | Curved | Green | Strong | Rough |
| 10 | Curved | Green | Strong | Smooth |
| 11 | Curved | Black | Medium | Slightly smooth |
| 12 | Curved | Black | Medium | Very smooth |
| 13 | Curved | Yellow | Light | Very rough |
| 14 | Curved | Yellow | Light | Slightly rough |
| 15 | Curved | Red | Light | Very rough |
| 16 | Curved | Red | Light | Slightly rough |
| 17 | Spherical | Green | Strong | Rough |
| 18 | Spherical | Green | Strong | Smooth |
| 19 | Spherical | Black | Medium | Slightly smooth |
| 20 | Spherical | Black | Medium | Very smooth |
| 21 | Spherical | Yellow | Light | Very rough |
| 22 | Spherical | Yellow | Light | Slightly rough |
| 23 | Spherical | Red | Light | Very rough |
| 24 | Spherical | Red | Light | Slightly rough |
Appendix D
References
- Salazar Sandoval, S.; Amenábar, A.; Toledo, I.; Silva, N.; Contreras, P. Advances in the Sustainable Development of Biobased Materials Using Plant and Animal Waste as Raw Materials: A Review. Sustainability 2024, 16, 1073. [Google Scholar] [CrossRef]
- Furugori, E. Biobased Materials: Core Materials for the 21st Century, Interview with Professor Yoshiharu Kimura, Kyoto Institute of Technology. Macromolecule 2005, 54, 576–577. [Google Scholar] [CrossRef]
- Li, X.; Zhao, G. Construction of sustainable development system for furniture industry under dual-carbon strategy. Furnit. Inter. Decor. 2023, 30, 6–10. [Google Scholar] [CrossRef]
- Gao, P.; Zhang, Y.; Long, Z. Kansei Drives Sustainable Material Innovation—An Approach to Enhance the Added Value of Biobased materials. Sustainability 2024, 16, 5546. [Google Scholar] [CrossRef]
- Carus, M.; Dammer, L. The Circular Bioeconomy—Concepts, Opportunities, and Limitations. Ind. Biotechnol. 2018, 14, 83–91. [Google Scholar] [CrossRef]
- Nicolau, A.-M. Sustainable Perspectives Using Human Beings: The Sensory Properties of a Bio-Based Material Compared to a Synthetic Material—An Overall Assessment Based on an Innovative Blind Method. Sustainability 2023, 15, 9145. [Google Scholar] [CrossRef]
- Chen, S.G.; Li, Z.Z.; Ge, L.Z.; Zhang, Y.J.; Wang, C.H. Progress of Human Factors Engineering Research and Development Recommendations. China Sci. Found. 2021, 35, 203–212. [Google Scholar] [CrossRef]
- Desmet, P.; Hekkert, P. Framework of Product Experience. Int. J. Des. 2007, 1, 57–66. [Google Scholar]
- Bertheaux, C.; Zimmermann, E.; Gazel, M.; Delanoy, J.; Raimbaud, P.; Lavoué, G. Effect of Material Properties on Emotion: A Virtual Reality Study. Front. Hum. Neurosci. 2024, 17, 1301891. [Google Scholar] [CrossRef]
- D’Itria, E.; Colombi, C. Biobased Innovation as a Fashion and Textile Design Must: A European Perspective. Sustainability 2022, 14, 570. [Google Scholar] [CrossRef]
- Barrett, L.F.; Bar, M. See It with Feeling: Affective Predictions during Object Perception. Philos. Trans. R. Soc. B 2009, 364, 1325–1334. [Google Scholar] [CrossRef] [PubMed]
- MATLOVIČ, R.; MATLOVIČOVÁ, K. The Metamodern Shift in Geographical Thought: Oscillatory Ontology and Epistemology, Post-Disciplinary and Post-Paradigmatic Perspectives. Folia Geogr. 2025, 67, 22. [Google Scholar]
- Storm, J.A.J. Metamodernism: The Future of Theory; University of Chicago Press: Boston, MA, USA, 2021; ISBN 978-0-226-78679-7. [Google Scholar]
- Brosch, T.; Steg, L. Leveraging Emotion for Sustainable Action. One Earth 2021, 4, 1693–1703. [Google Scholar] [CrossRef]
- Karana, E.; Barati, B.; Rognoli, V.; Zeeuw Van Der Laan, A. Material Driven Design (MDD): A Method to Design for Material Experiences. Int. J. Des. 2015, 9, 35–54. [Google Scholar]
- Sauerwein, M.; Karana, E.; Rognoli, V. Revived Beauty: Research into Aesthetic Appreciation of Materials to Valorise Materials from Waste. Sustainability 2017, 9, 529. [Google Scholar] [CrossRef]
- Marschallek, B.E.; Löw, A.; Jacobsen, T. You Can Touch This! Brain Correlates of Aesthetic Processing of Active Fingertip Exploration of Material Surfaces. Neuropsychologia 2023, 182, 108520. [Google Scholar] [CrossRef]
- Fujisaki, W.; Tokita, M.; Kariya, K. Perception of the Material Properties of Wood Based on Vision, Audition, and Touch. Vis. Res. 2015, 109, 185–200. [Google Scholar] [CrossRef]
- Wang, L.; Qin, F. Research on aesthetic evaluation model of product CMF design. Packag. Eng. 2024, 45, 106–113. [Google Scholar] [CrossRef]
- Li, Y.; Liang, C.H.; Liu, X.L. Current status of perceptual engineering research in China and Japan and its revelation. Decor 2016, 92–95. [Google Scholar] [CrossRef]
- Suda, T. Fundamental Study on Texture Enhancement in Uncoated Plastics. Ph.D. Thesis, Chiba University, Chiba, Japan, 2015. [Google Scholar]
- Bradley, M.M.; Lang, P.J. Measuring Emotion: The Self-Assessment Manikin and the Semantic Differential. J. Behav. Ther. Exp. Psychiatry 1994, 25, 49–59. [Google Scholar] [CrossRef]
- Sorinas, J.; Ferrández, J.M.; Fernandez, E. Brain and Body Emotional Responses: Multimodal Approximation for Valence Classification. Sensors 2020, 20, 313. [Google Scholar] [CrossRef] [PubMed]
- Suhaimi, N.S.; Mountstephens, J.; Teo, J. EEG-Based Emotion Recognition: A State-of-the-Art Review of Current Trends and Opportunities. Comput. Intell. Neurosci. 2020, 2020, 8875426. [Google Scholar] [CrossRef]
- Xie, X.; Cai, J.; Fang, H.; Wang, B.; He, H.; Zhou, Y.; Xiao, Y.; Yamanaka, T.; Li, X. Affective Impressions Recognition under Different Colored Lights Based on Physiological Signals and Subjective Evaluation Method. Sensors 2023, 23, 5322. [Google Scholar] [CrossRef]
- Wang, J.; Lu, J.; Xu, Z.; Wang, X. When Lights Can Breathe: Investigating the Influences of Breathing Lights on Users’ Emotion. Int. J. Environ. Res. Public Health 2022, 19, 13205. [Google Scholar] [CrossRef]
- Gao, P.; Ogata, Y. CHAMU: An Effective Approach for Improving the Recycling of Tea Waste. IOP Conf. Ser. Mater. Sci. Eng. 2020, 711, 012024. [Google Scholar] [CrossRef]
- Gao, P.; Ogata, Y. Biodegradability of PLA and Tea Waste Composites Based on “CHAMU” and the “Tea Waste Recycling System”. IOP Conf. Ser. Mater. Sci. Eng. 2019, 563, 022034. [Google Scholar] [CrossRef]
- Gao, P. Tea Waste Sustainable Material Development and Furniture Design Applications. Furnit. Inter. Decor. 2023, 30, 50–55. [Google Scholar] [CrossRef]
- Guo, X.; Ho, C.-T.; Schwab, W.; Wan, X. Aroma Profiles of Green Tea Made with Fresh Tea Leaves Plucked in Summer. Food Chem. 2021, 363, 130328. [Google Scholar] [CrossRef]
- Du, B.; Chen, Y.; Li, Y.; Jiang, D.; Xia, Y.; Yang, G. Effects of Extruding Processing of Tieguanyin Tea Stem on Its Flavor and Aroma Components. Trans. Chin. Soc. Agric. Eng. 2010, 26, 381–384. [Google Scholar]
- Wu, W.; Jiang, X.; Zhu, Q.; Yuan, Y.; Chen, R.; Wang, W.; Liu, A.; Wu, C.; Ma, C.; Li, J. Metabonomics Analysis of the Flavor Characteristics of Wuyi Rock Tea (Rougui) with “Rock Flavor” and Microbial Contributions to the Flavor. Food Chem. 2024, 450, 139376. [Google Scholar] [CrossRef]
- Russell, J.A.; Weiss, A.; Mendelsohn, G.A. Affect Grid: A Single-Item Scale of Pleasure and Arousal. J. Personal. Soc. Psychol. 1989, 57, 493. [Google Scholar] [CrossRef]
- Chen, L.; Jiang, L.; Liu, B.; Chen, H.; Kang, G. Changes in somatosensory evoked potentials and electroencephalogram spectral characteristics after cerebral ischemia and their relation to apoptosis. China Crit. Care Emerg. Med. 2006, 268–271, 256. [Google Scholar]
- Agarwal, R.; Andujar, M.; Canavan, S. Classification of Emotions Using EEG Activity Associated with Different Areas of the Brain. Pattern Recognit. Lett. 2022, 162, 71–80. [Google Scholar] [CrossRef]
- Lin, Y.-P.; Yang, Y.-H.; Jung, T.-P. Fusion of Electroencephalographic Dynamics and Musical Contents for Estimating Emotional Responses in Music Listening. Front. Neurosci. 2014, 8, 94. [Google Scholar] [CrossRef]
- Davidson, R.J. Anterior Cerebral Asymmetry and the Nature of Emotion. Brain Cogn. 1992, 20, 125–151. [Google Scholar] [CrossRef]
- Fox, N.A. If It’s Not Left, It’s Right: Electroencephalograph Asymmetry and the Development of Emotion. Am. Psychol. 1991, 46, 863. [Google Scholar] [CrossRef]
- Al-Qazzaz, N.K.; Sabir, M.K.; Ali, S.H.B.M.; Ahmad, S.A.; Grammer, K. Electroencephalogram Profiles for Emotion Identification over the Brain Regions Using Spectral, Entropy and Temporal Biomarkers. Sensors 2019, 20, 59. [Google Scholar] [CrossRef]
- Alarcão, S.M.; Fonseca, M.J. Emotions Recognition Using EEG Signals: A Survey. IEEE Trans. Affect. Comput. 2019, 10, 374–393. [Google Scholar] [CrossRef]
- Galvão, F.; Alarcão, S.M.; Fonseca, M.J. Predicting Exact Valence and Arousal Values from EEG. Sensors 2021, 21, 3414. [Google Scholar] [CrossRef]
- Ge, Y.; Chen, Y.; Liu, Y.; Li, W.; Sun, X. Electrophysiological Measures Applied in User Experience Studies. Adv. Psychol. Sci. 2014, 22, 959. [Google Scholar] [CrossRef]
- Sánchez-Reolid, R.; López de la Rosa, F.; Sánchez-Reolid, D.; López, M.T.; Fernández-Caballero, A. Machine Learning Techniques for Arousal Classification from Electrodermal Activity: A Systematic Review. Sensors 2022, 22, 8886. [Google Scholar] [CrossRef] [PubMed]
- Harley, J.M.; Jarrell, A.; Lajoie, S.P. Emotion Regulation Tendencies, Achievement Emotions, and Physiological Arousal in a Medical Diagnostic Reasoning Simulation. Instr. Sci. 2019, 47, 151–180. [Google Scholar] [CrossRef]
- Buchanan, T.W.; Tranel, D. Central and Peripheral Nervous System Interactions: From Mind to Brain to Body. Int. J. Psychophysiol. 2009, 72, 1–4. [Google Scholar] [CrossRef]
- Hasnul, M.A.; Aziz, N.A.A.; Alelyani, S.; Mohana, M.; Aziz, A.A. Electrocardiogram-Based Emotion Recognition Systems and Their Applications in Healthcare—A Review. Sensors 2021, 21, 5015. [Google Scholar] [CrossRef]
- Lian, Z.; Guo, Y.; Cao, X.; Li, W. An Ear Wearable Device System for Facial Emotion Recognition Disorders. Front. Bioeng. Biotechnol. 2021, 9, 703048. [Google Scholar] [CrossRef]
- Wang, Y.; Lv, Z.; Zheng, Y. Automatic Emotion Perception Using Eye Movement Information for E-Healthcare Systems. Sensors 2018, 18, 2826. [Google Scholar] [CrossRef]
- McFarland, R.A. Relationship of Skin Temperature Changes to the Emotions Accompanying Music. Biofeedback Self-Regul. 1985, 10, 255–267. [Google Scholar] [CrossRef]
- Soleymani, M.; Lichtenauer, J.; Pun, T.; Pantic, M. A Multimodal Database for Affect Recognition and Implicit Tagging. IEEE Trans. Affect. Comput. 2012, 3, 42–55. [Google Scholar] [CrossRef]
- Russell, J.A. A Circumplex Model of Affect. J. Personal. Soc. Psychol. 1980, 39, 1161–1178. [Google Scholar] [CrossRef]
- Zampini, M.; Guest, S.; Spence, C. The Role of Auditory Cues in Modulating the Perception of Electric Toothbrushes. J. Dent. Res. 2003, 82, 929–932. [Google Scholar] [CrossRef]
- Iosifyan, M.; Korolkova, O. Emotions Associated with Different Textures during Touch. Conscious. Cogn. 2019, 71, 79–85. [Google Scholar] [CrossRef] [PubMed]
- Hama, H.; Mine, H.; Matsuyama, Y. Cross-Modality Validation of Affective Arousal by Texture. Jpn. Psychol. Res. 1982, 23, 196–202. [Google Scholar] [CrossRef]
- Lang, P.J.; Bradley, M.M. Emotion and the Motivational Brain. Biol. Psychol. 2010, 84, 437–450. [Google Scholar] [CrossRef]
- Jung, D.-H.; Han, K.-H. The Effect Of Shape On Emotion. Korea HCI Soc. 2007, 445–451. [Google Scholar]
- Wagemans, J.; Feldman, J.; Gepshtein, S.; Kimchi, R.; Pomerantz, J.R.; van der Helm, P.A.; van Leeuwen, C. A century of Gestalt psychology in visual perception: II. Conceptual and theoretical foundations. Psychol. Bull. 2012, 138, 1218–1252. [Google Scholar] [CrossRef]
- Wang, S.; Ding, R. A qualitative and quantitative study of color emotion using valence-arousal. Front. Comput. Sci. 2012, 6, 469–476. [Google Scholar] [CrossRef]
- Bestgen, A.-K.; Schulze, P.; Kuchinke, L. Odor Emotional Quality Predicts Odor Identification. Chem. Senses 2015, 40, 517–523. [Google Scholar] [CrossRef]
- Arzi, A.; Sobel, N. Olfactory perception as a compass for olfactory neural maps. Trends Cogn. Sci. 2011, 15, 537–545. [Google Scholar] [CrossRef]
- Kay, L.M. Circuit oscillations in odor perception and memory. Prog. Brain Res. 2014, 208, 223–251. [Google Scholar] [CrossRef]
- Johnson, K.O. The roles and functions of cutaneous mechanoreceptors. Curr. Opin. Neurobiol. 2001, 11, 455–461. [Google Scholar] [CrossRef]
- Suda, T.; Akiko, D.; Terauchi, F.; Mitsukutoku, K. Texture Expression by Composite of Silicone Resin and Filler. Des. Stud. 2015, 61, 85–92. [Google Scholar]
- Jensen, O.; Mazaheri, A. Shaping functional architecture by oscillatory alpha activity: Gating by inhibition. Front. Hum. Neurosci. 2010, 4, 186. [Google Scholar] [CrossRef] [PubMed]
- Headley, D.B.; Paré, D. In sync: Gamma oscillations and emotional memory. Front. Behav. Neurosci. 2013, 7, 170. [Google Scholar] [CrossRef]
- Helson, H.; Quantius, L. Changes in Skin Temperature Following Intense Stimulation. J. Exp. Psychol. 1934, 17, 20–35. [Google Scholar] [CrossRef]
- Kawai, S.; Takano, H.; Nakamura, K. Pupil Diameter Variation in Positive and Negative Emotions with Visual Stimulus. In Proceedings of the 2013 IEEE International Conference on Systems, Man, and Cybernetics, Manchester, UK, 13–16 October 2013; pp. 4179–4183. [Google Scholar] [CrossRef]
- Babiker, A.; Faye, I.; Malik, A. Pupillary Behavior in Positive and Negative Emotions. In Proceedings of the 2013 IEEE International Conference on Signal and Image Processing Applications, Melaka, Malaysia, 8–10 October 2013; pp. 379–383. [Google Scholar] [CrossRef]

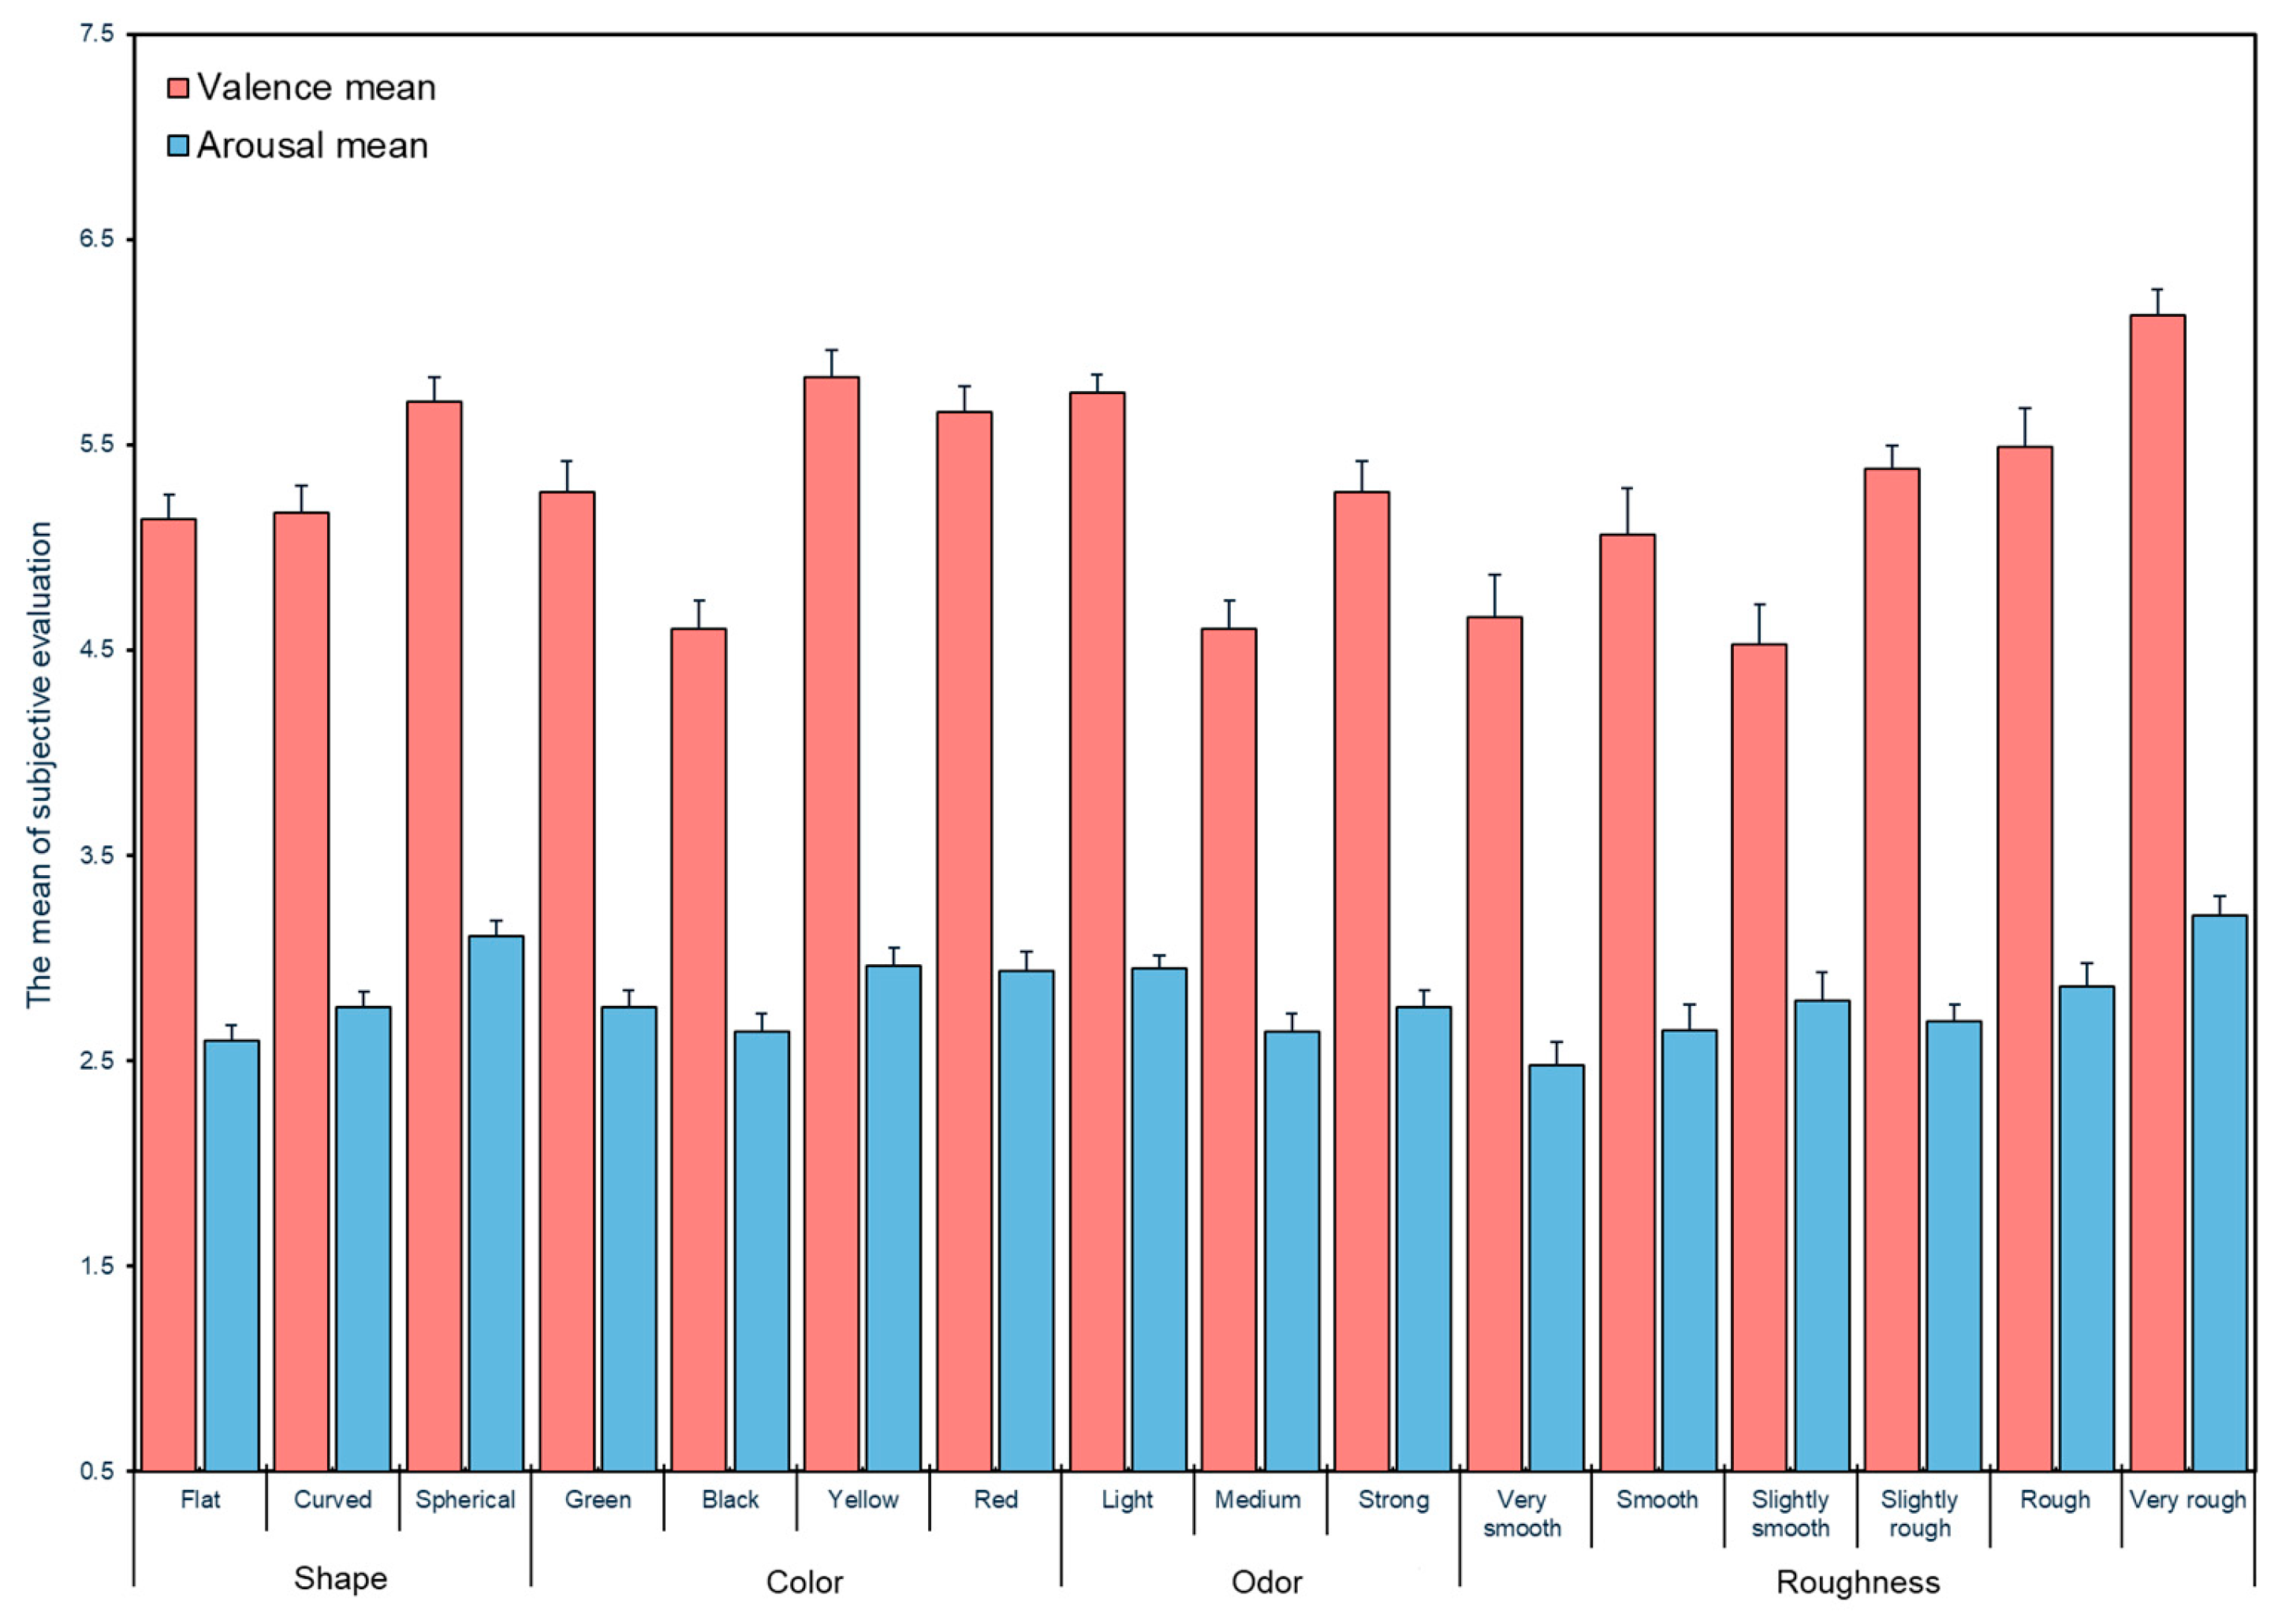
| Variable | Mean ± SD (Valence) | Valence (F/p) | Mean ± SD (Arousal) | Arousal (F/p) | η2 (Valence/Arousal) | |
|---|---|---|---|---|---|---|
| Shape category | Flat | 5.14 ± 1.60 | 7.05/0.00 ** | 2.60 ± 1.03 | 11.89/0.00 ** | 0.03/0.04 |
| Curved | 5.17 ± 1.77 | 2.76 ± 1.08 | ||||
| Spherical | 5.71 ± 1.67 | 3.11 ± 1.04 | ||||
| Color category | Green | 5.27 ± 1.77 | 15.99/0.00 ** | 2.76 ± 1.01 | 2.96/0.03 * | 0.08/0.02 |
| Black | 4.60 ± 1.70 | 2.64 ± 1.08 | ||||
| Yellow | 5.83 ± 1.53 | 2.96 ± 1.08 | ||||
| Red | 5.66 ± 1.52 | 2.94 ± 1.08 | ||||
| Intensity of odor category | Light | 5.75 ± 1.53 | 23.59/0.00 ** | 2.95 ± 1.08 | 4.44/0.01 * | 0.08/0.02 |
| Medium | 4.60 ± 1.70 | 2.64 ± 1.08 | ||||
| Strong | 5.27 ± 1.77 | 2.76 ± 1.01 | ||||
| Roughness | Very smooth | 4.66 ± 1.77 | 13.69/0.00 ** | 2.48 ± 0.96 | 6.37/0.00 ** | 0.11/0.05 |
| Smooth | 5.06 ± 1.91 | 2.65 ± 1.06 | ||||
| Slightly smooth | 4.53 ± 1.63 | 2.79 ± 1.17 | ||||
| Slightly rough | 5.38 ± 1.41 | 2.69 ± 0.97 | ||||
| Rough | 5.49 ± 1.61 | 2.86 ± 0.95 | ||||
| Very rough | 6.13 ± 1.54 | 3.21 ± 1.11 | ||||
| Predictors | Valence | Arousal |
|---|---|---|
| β (SE) | β (SE) | |
| Shape category | 0.289 ** (0.082) | 0.256 ** (0.052) |
| Roughness | 0.294 ** (0.040) | 0.131 ** (0.025) |
| Color category | – | – |
| Odor intensity | – | – |
| Constant | 3.627 (0.235) | 1.804 (0.150) |
| R2 | 0.105 | 0.081 |
| Adjusted R2 | 0.102 | 0.078 |
| F-statistic | 33.665 * | 25.352 * |
| Emotion Categories (Mean ± SD) | F | p | ||||
|---|---|---|---|---|---|---|
| Happy | Satisfied | Nervous | Disappointed | |||
| αPz | 9.31 ± 3.26 | 10.26 ± 4.57 | 10.58 ± 4.71 | 10.24 ± 4.34 | 2.999 | 0.030 * |
| αO1 | 12.17 ± 3.81 | 13.26 ± 4.85 | 13.32 ± 4.66 | 13.34 ± 4.53 | 3.279 | 0.021 * |
| βPz | 5.24 ± 2.74 | 6.07 ± 3.58 | 6.30 ± 3.60 | 5.97 ± 3.41 | 3.271 | 0.021 * |
| γCz | 1.37 ± 2.23 | 1.76 ± 2.51 | 1.78 ± 2.42 | 2.06 ± 2.54 | 2.841 | 0.037 * |
| γC3 | 1.67 ± 2.94 | 2.09 ± 3.02 | 2.10 ± 2.97 | 2.53 ± 3.10 | 2.703 | 0.045 * |
| γPz | 2.48 ± 2.36 | 3.02 ± 2.86 | 3.14 ± 2.75 | 3.30 ± 2.94 | 3.464 | 0.016 * |
| EEG Predictors | Valence | Arousal |
|---|---|---|
| β (SE) | β (SE) | |
| γFz | −0.302 ** (0.055) | – |
| γC3 | 0.185 ** (0.068) | – |
| γO2 | 0.108 * (0.053) | – |
| γP7 | −0.335 ** (0.064) | – |
| αF4 | – | −0.286 ** (0.102) |
| βF7 | – | 0.429 ** (0.120) |
| βO2 | – | −0.336 ** (0.120) |
| γF4 | – | 0.405 ** (0.099) |
| γF7 | – | −0.512 ** (0.105) |
| γO2 | – | 0.455 ** (0.111) |
| γP8 | – | −0.335 ** (0.065) |
| Model Summary | ||
| R2 | 0.133 | 0.143 |
| Adjusted R2 | 0.126 | 0.132 |
| F-statistic | F = 20.706 * | F = 12.901 * |
| Emotion Categories (Mean ± SD) | F | p | ||||
|---|---|---|---|---|---|---|
| Happy | Satisfied | Nervous | Disappointed | |||
| SKT | 34.34 ± 1.05 | 34.01 ± 1.15 | 34.08 ± 1.12 | 34.06 ± 1.11 | 3.423 | 0.017 * |
| APD | 3.37 ± 0.50 | 3.52 ± 0.49 | 3.60 ± 0.50 | 3.55 ± 0.51 | 6.446 | 0.000 ** |
| EEG Predictors | Valence | Arousal |
|---|---|---|
| β (SE) | β (SE) | |
| SCL | 0.114 * (0.046) | 0.333 ** (0.043) |
| SKT | 0.090 * (0.043) | – |
| APD | −0.133 ** (0.042) | – |
| ABR | −0.169 ** (0.045) | – |
| HR | – | 0.128 ** (0.043) |
| ABR | – | 0.199 ** (0.042) |
| Model Summary | ||
| R2 | 0.051 | 0.133 |
| Adjusted R2 | 0.044 | 0.129 |
| F-statistic | F = 7.539 ** | F = 28.973 ** |
Disclaimer/Publisher’s Note: The statements, opinions and data contained in all publications are solely those of the individual author(s) and contributor(s) and not of MDPI and/or the editor(s). MDPI and/or the editor(s) disclaim responsibility for any injury to people or property resulting from any ideas, methods, instructions or products referred to in the content. |
© 2025 by the authors. Licensee MDPI, Basel, Switzerland. This article is an open access article distributed under the terms and conditions of the Creative Commons Attribution (CC BY) license (https://creativecommons.org/licenses/by/4.0/).
Share and Cite
Lei, M.; Tan, S.; Gao, P.; Long, Z.; Sun, L.; Dong, Y. Impact of Emotional Design: Improving Sustainable Well-Being Through Bio-Based Tea Waste Materials. Buildings 2025, 15, 1559. https://doi.org/10.3390/buildings15091559
Lei M, Tan S, Gao P, Long Z, Sun L, Dong Y. Impact of Emotional Design: Improving Sustainable Well-Being Through Bio-Based Tea Waste Materials. Buildings. 2025; 15(9):1559. https://doi.org/10.3390/buildings15091559
Chicago/Turabian StyleLei, Ming, Shenghua Tan, Pin Gao, Zhiyu Long, Li Sun, and Yuekun Dong. 2025. "Impact of Emotional Design: Improving Sustainable Well-Being Through Bio-Based Tea Waste Materials" Buildings 15, no. 9: 1559. https://doi.org/10.3390/buildings15091559
APA StyleLei, M., Tan, S., Gao, P., Long, Z., Sun, L., & Dong, Y. (2025). Impact of Emotional Design: Improving Sustainable Well-Being Through Bio-Based Tea Waste Materials. Buildings, 15(9), 1559. https://doi.org/10.3390/buildings15091559