
Study on the Influence Mechanism of Machine-Learning-Based Built Environment on Urban Vitality in Macau Peninsula


Abstract
1. Introduction
2. Literature Review
2.1. Research on the Relationship Between Urban Vitality and Built Environment
2.2. Application of Nonlinear Models and Complex Systems Approache
3. Study Area and Data Sources
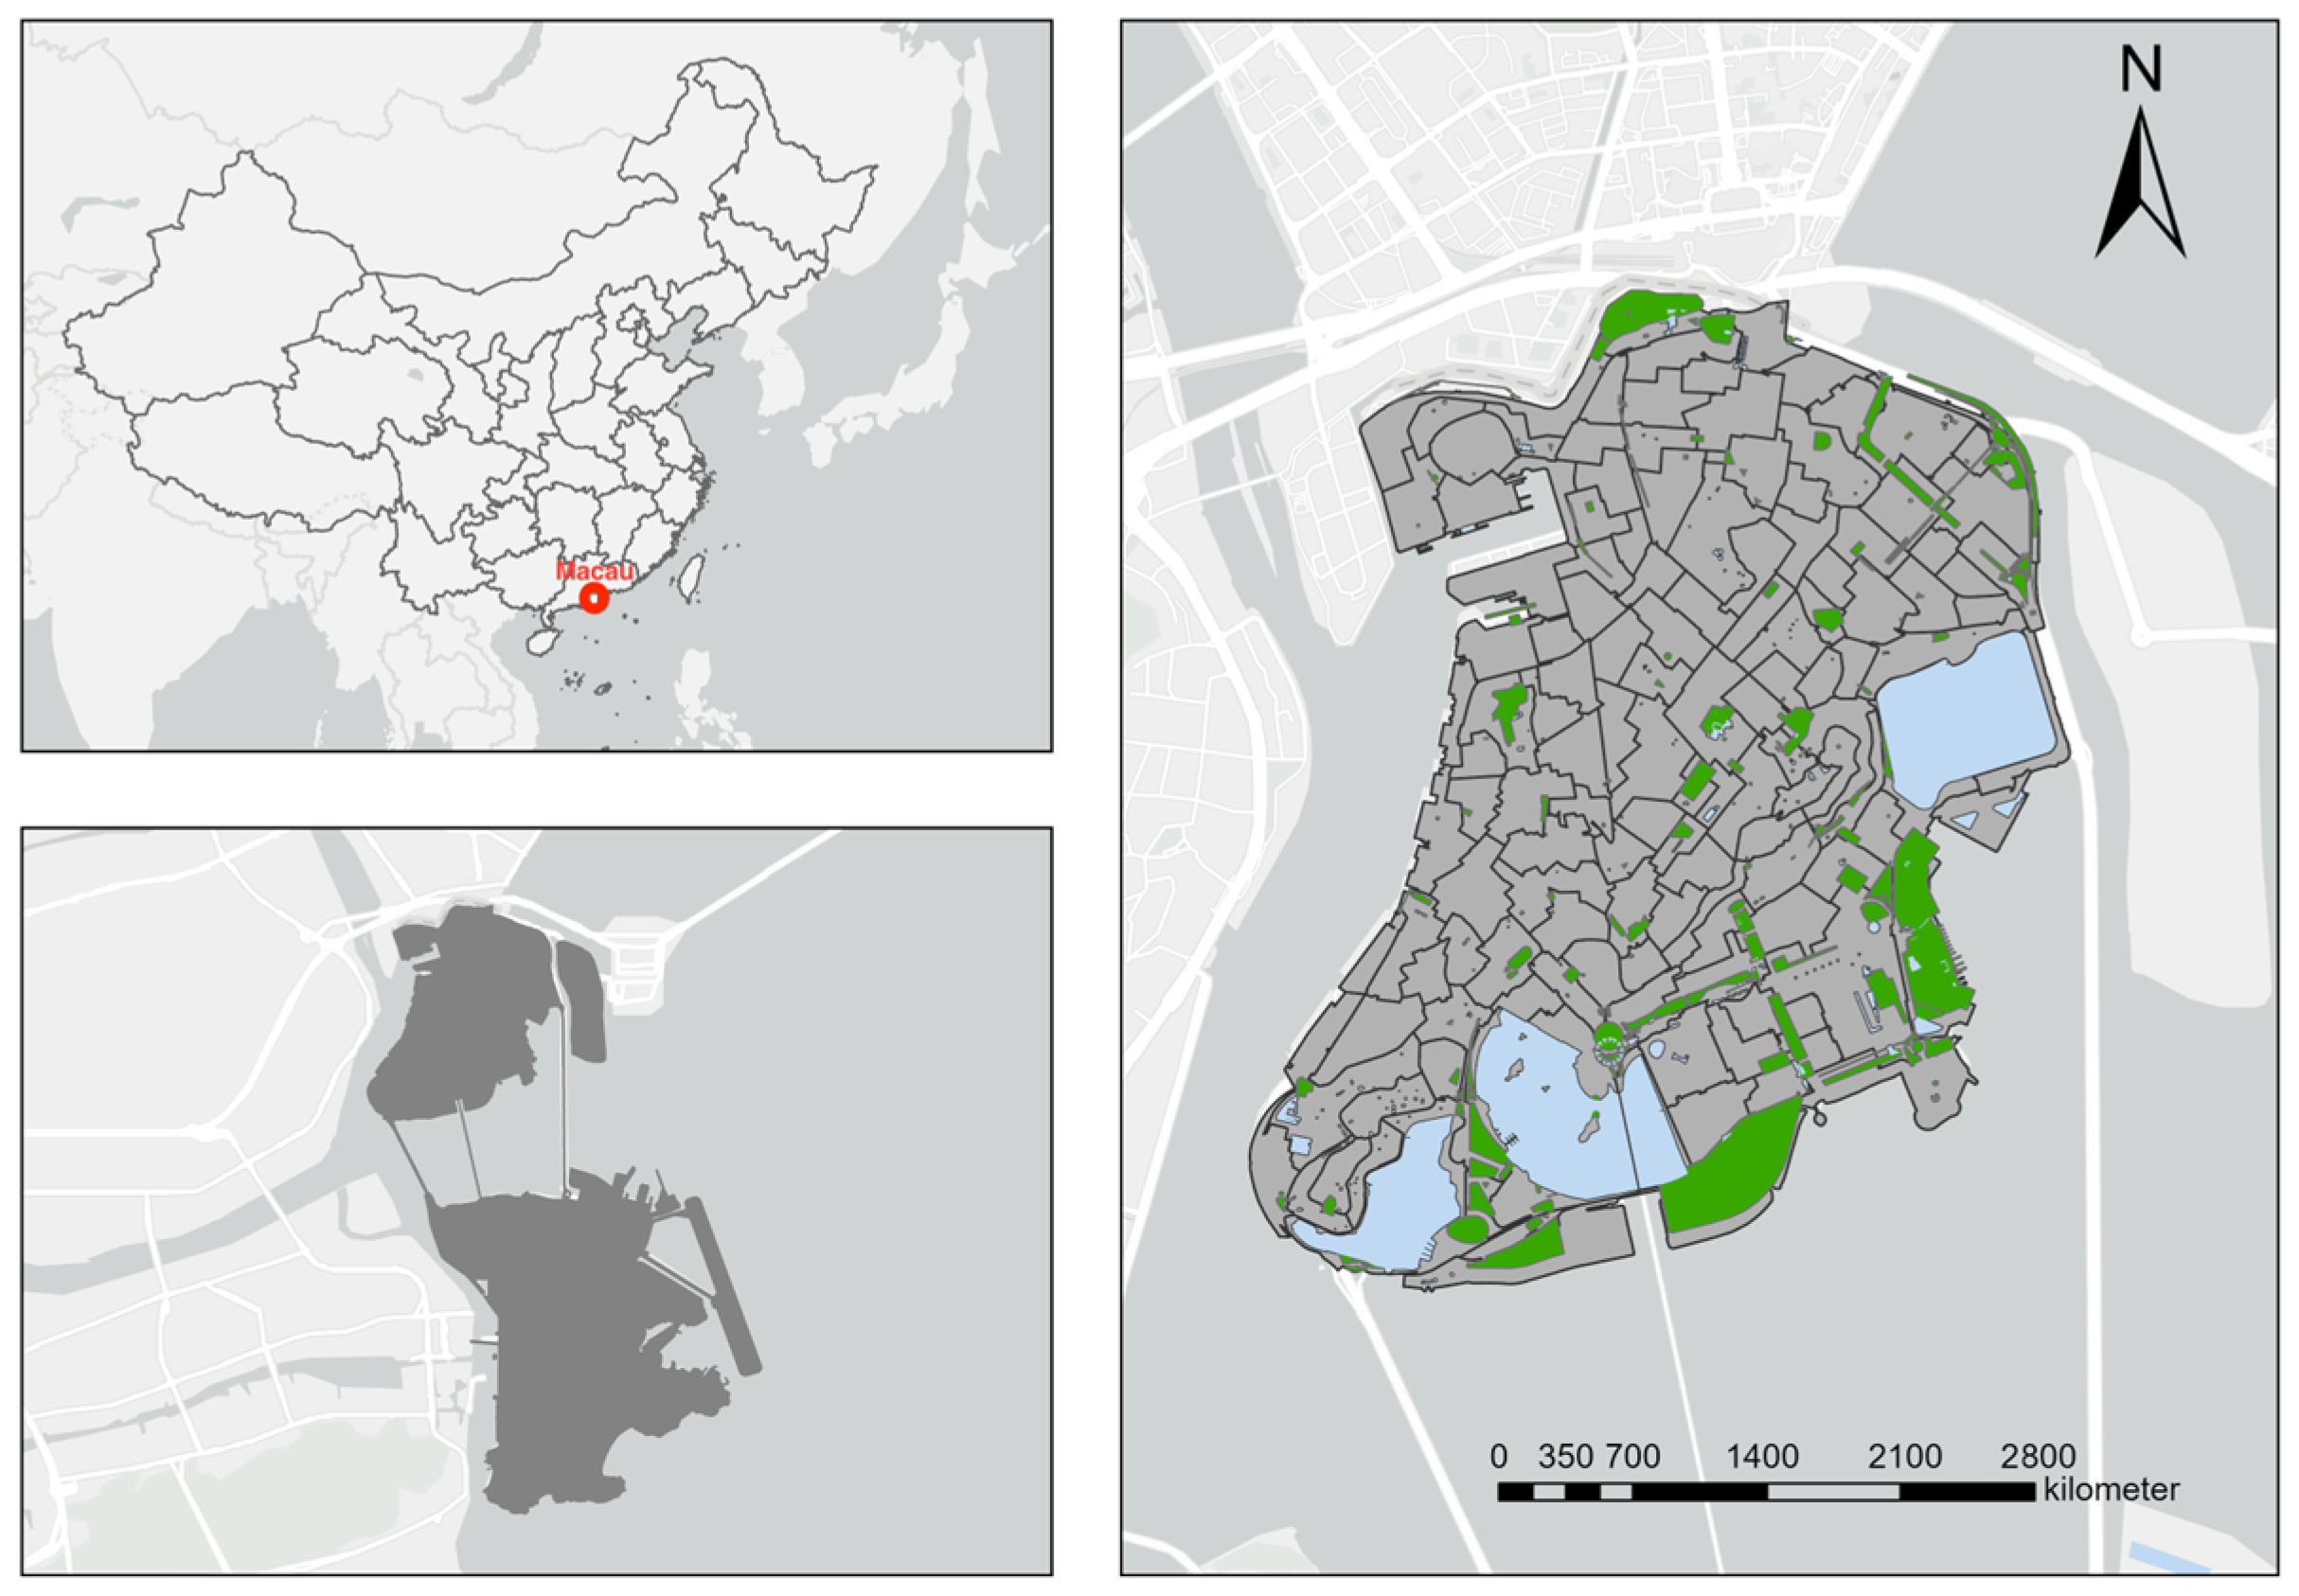
3.1. Study Area
3.2. Variables and Data
3.2.1. Vitality Measurement
3.2.2. Measurement of the Built Environment
3.3. Data Sources and Preprocessing
3.3.1. Basic Geographic Data
3.3.2. Open-Source Data
- (1)
- Baidu Heat Population Data
- (2)
- Macau Property Price Data
- (3)
- POI data
- (4)
- Weibo check-in data
- (5)
- Street View Image
4. Research Methodology
4.1. Calculation of Projection Pursuit Model Based on Real-Coded Genetic Algorithm
4.1.1. Projection Pursuit Model (PPM)
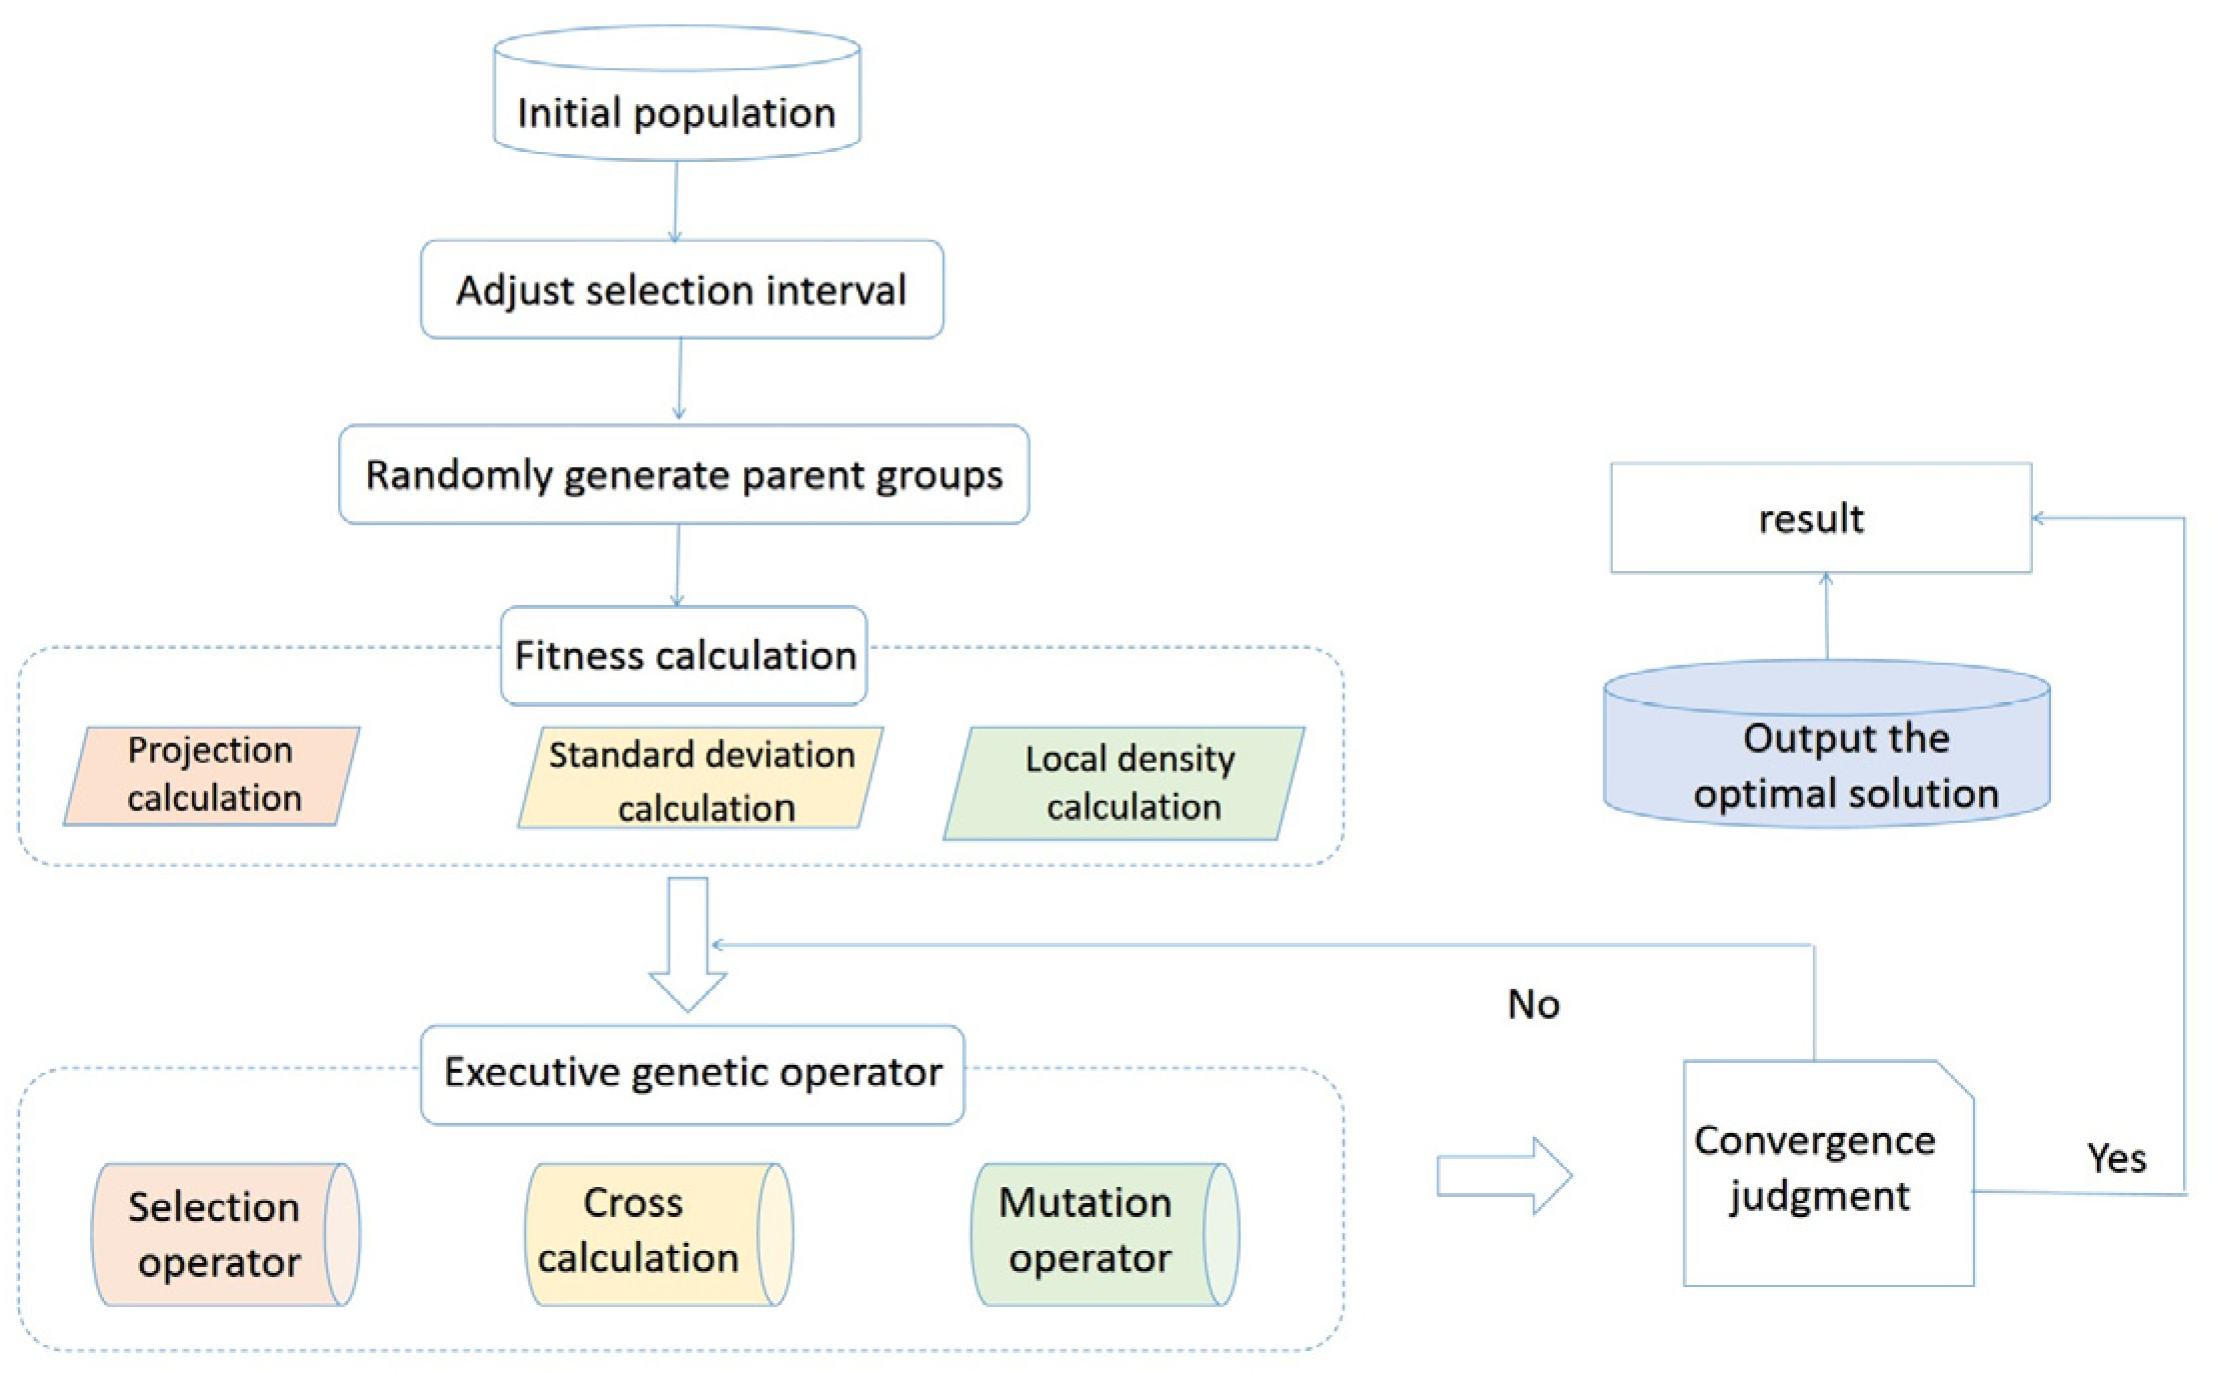
4.1.2. Accelerated Genetic Algorithm Based on Real-Coded Encoding (RAGA)
4.1.3. Projection Pursuit Model Optimized by Accelerated Genetic Algorithm with Real-Coded Encoding (RAGA-PPM)
4.2. Machine Learning Models and SHAP Interpretability Method
5. Results and Analysis
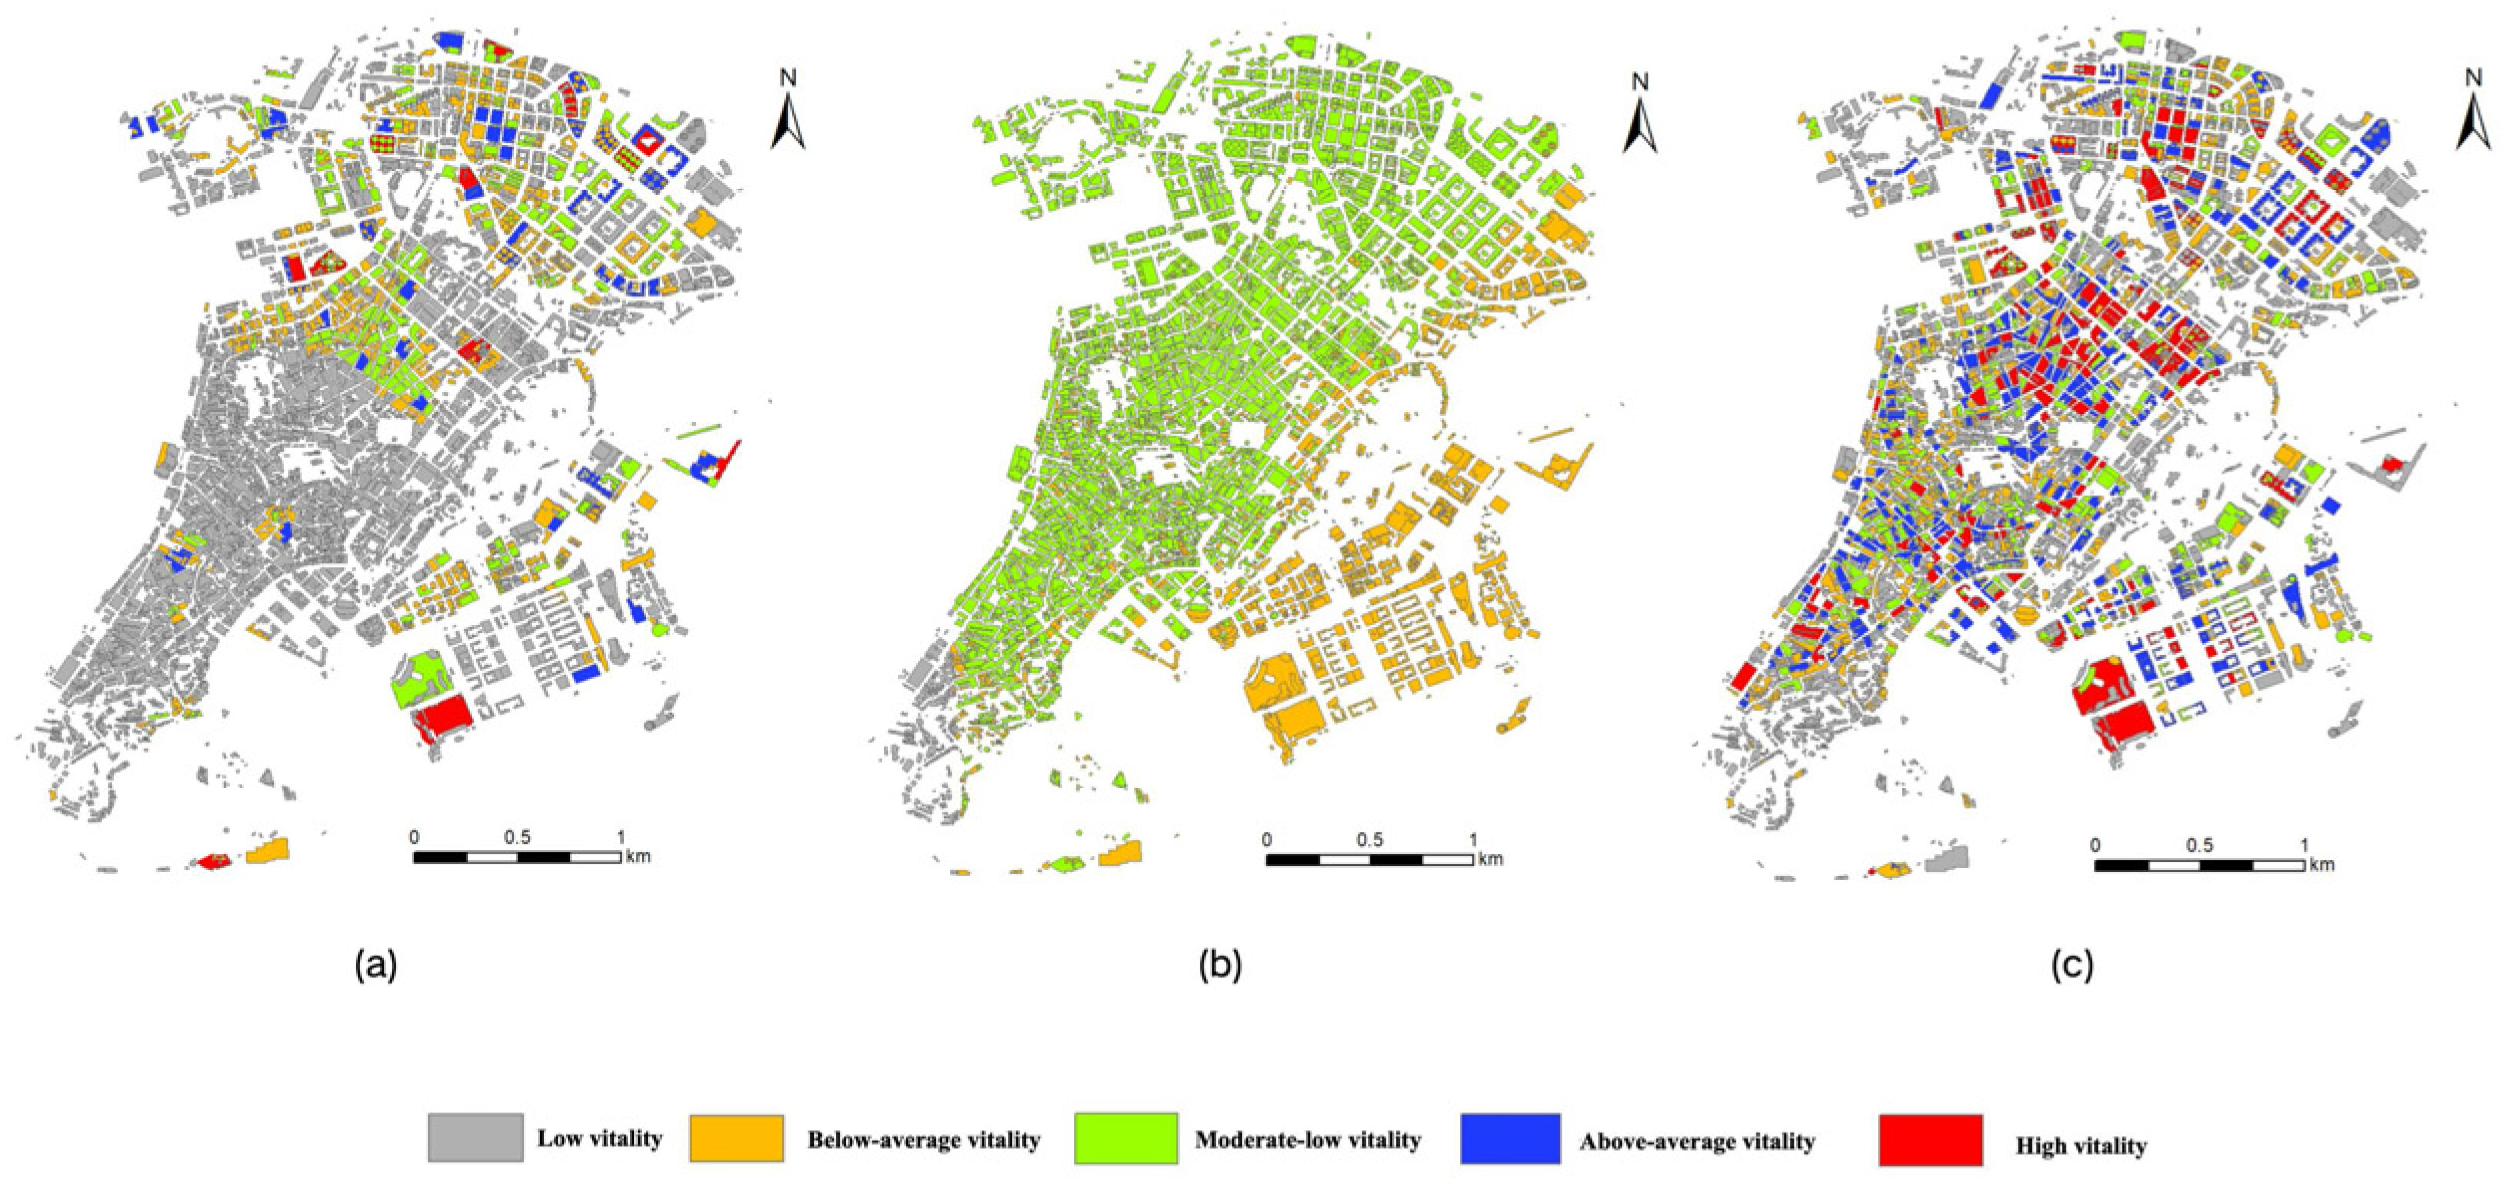
5.1. Spatial Distribution Analysis of Unidimensional Activity
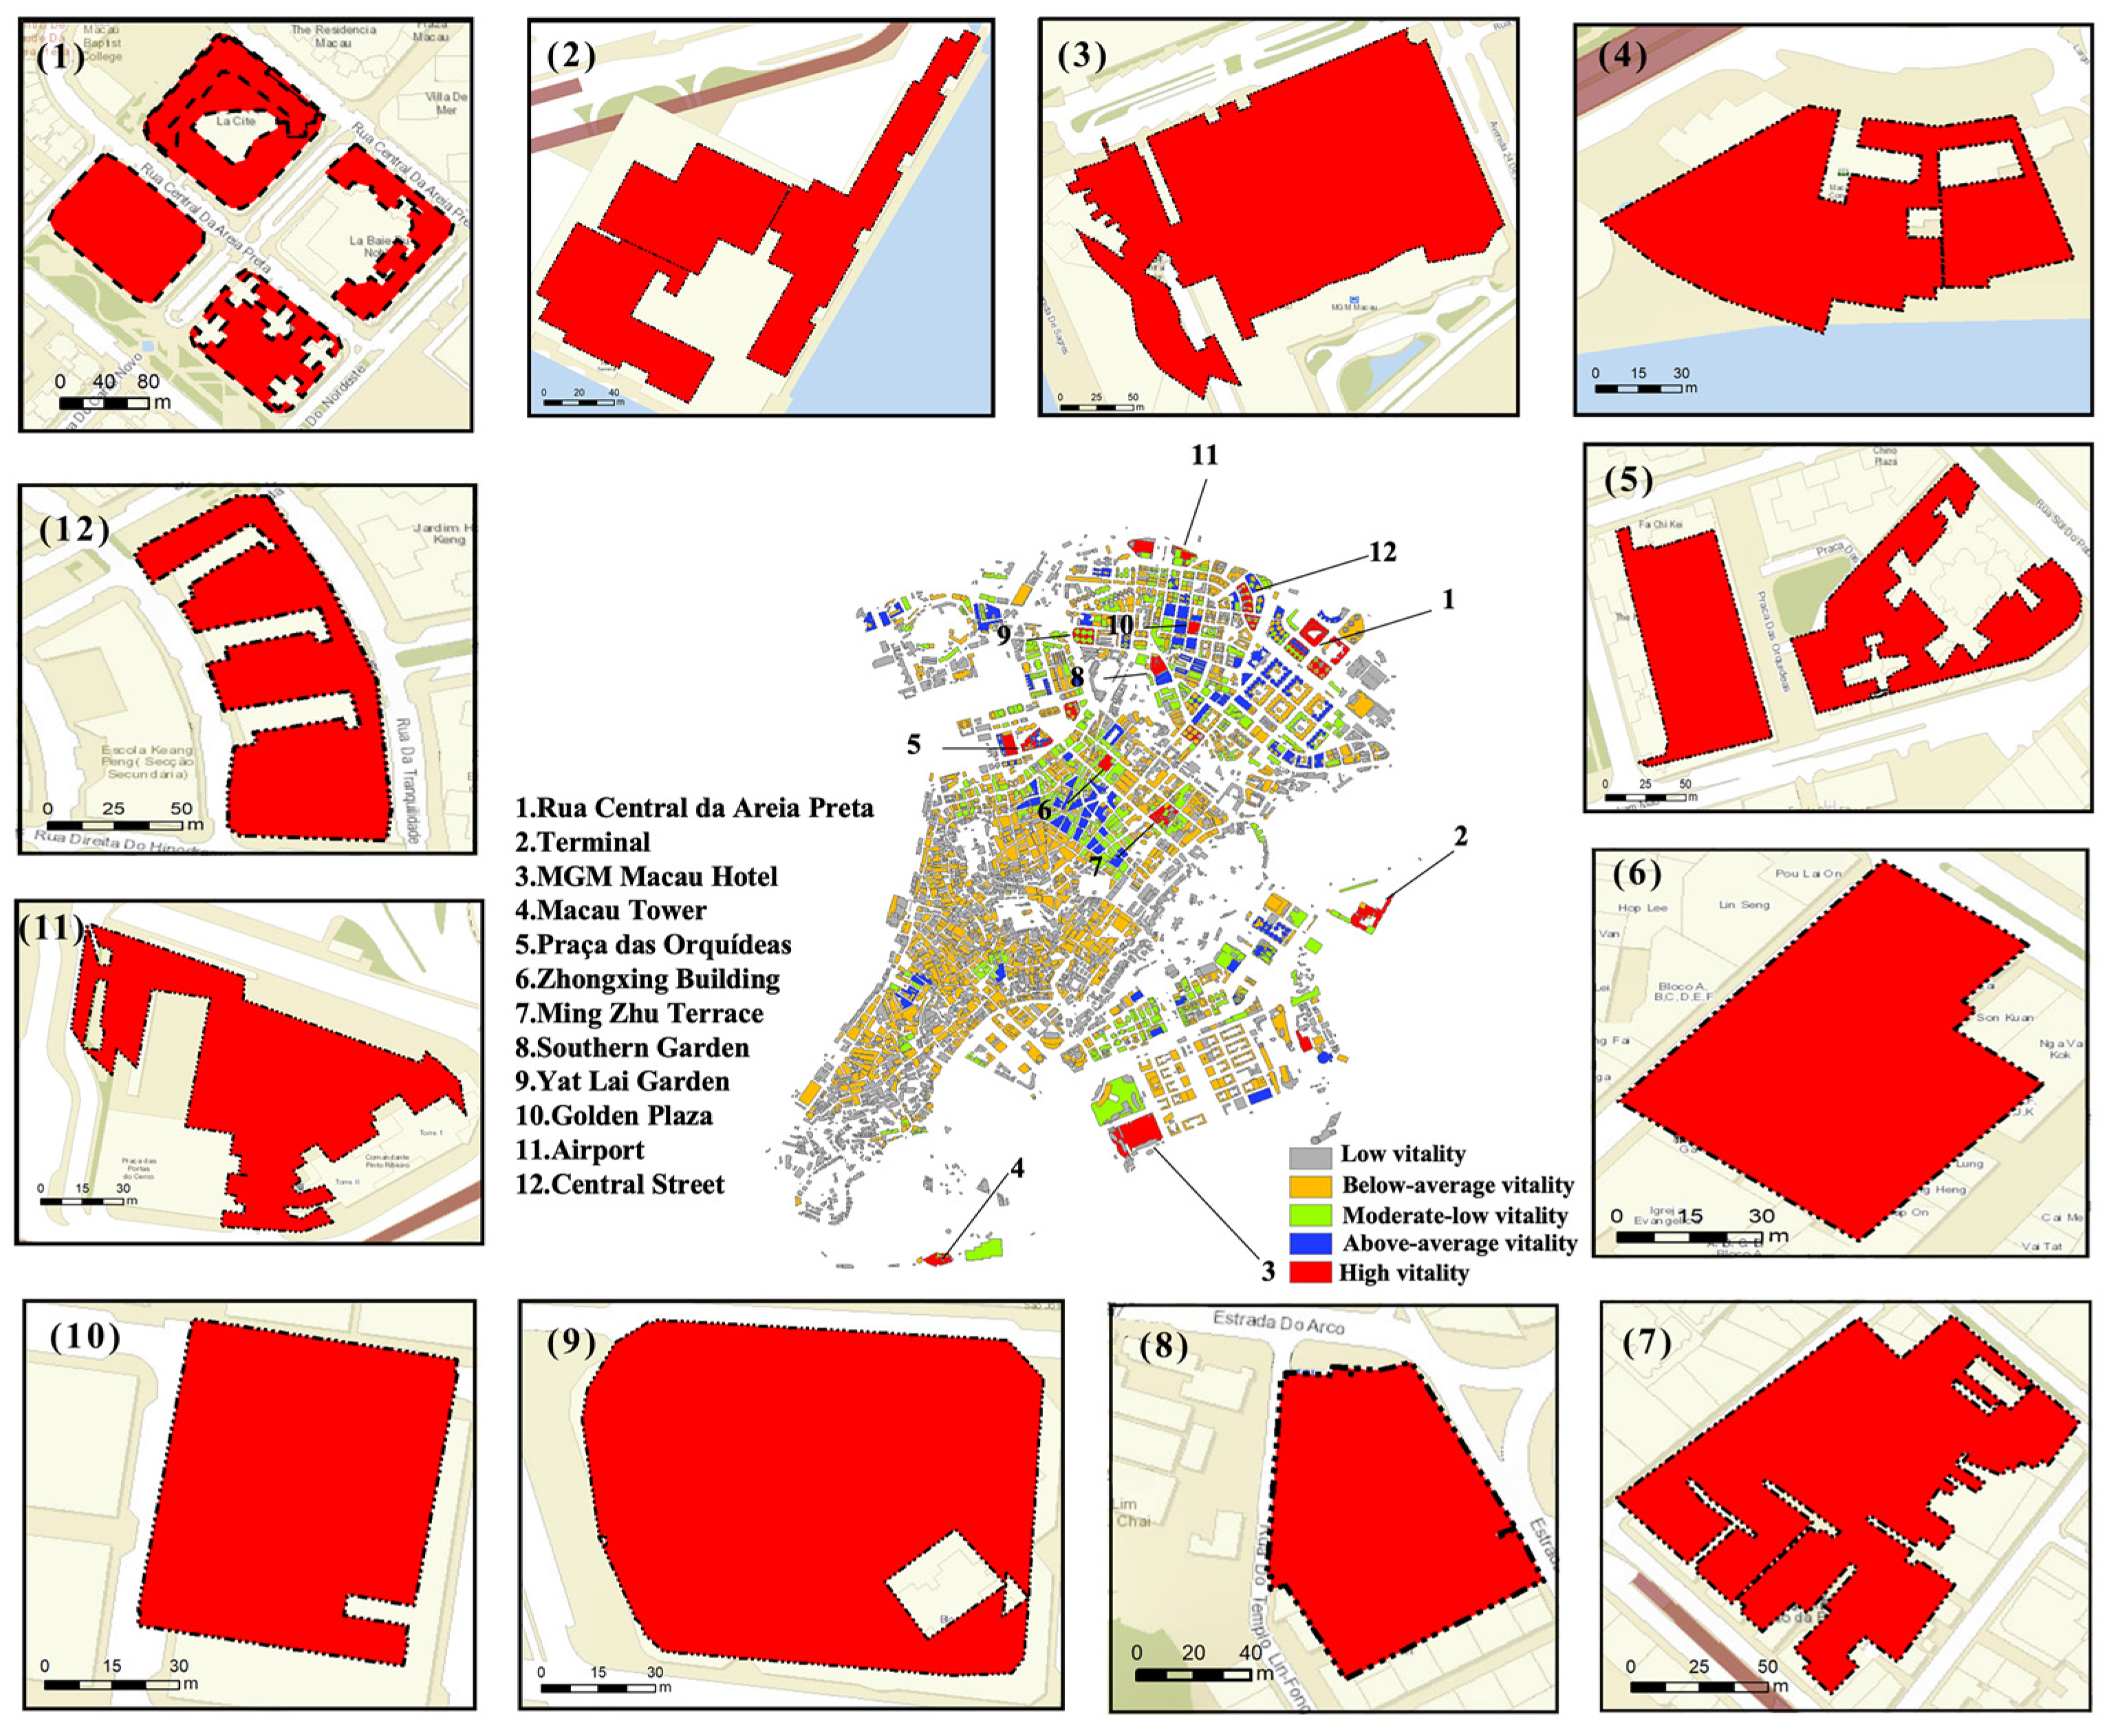
5.2. Comprehensive Vitality Space Analysis
5.3. Analysis of Spatial Differences in Vitality Using RAGA-PPM and EWM
5.4. The Impact of the Built Environment on Urban Vitality
5.4.1. Relative Importance of Built Environment Elements
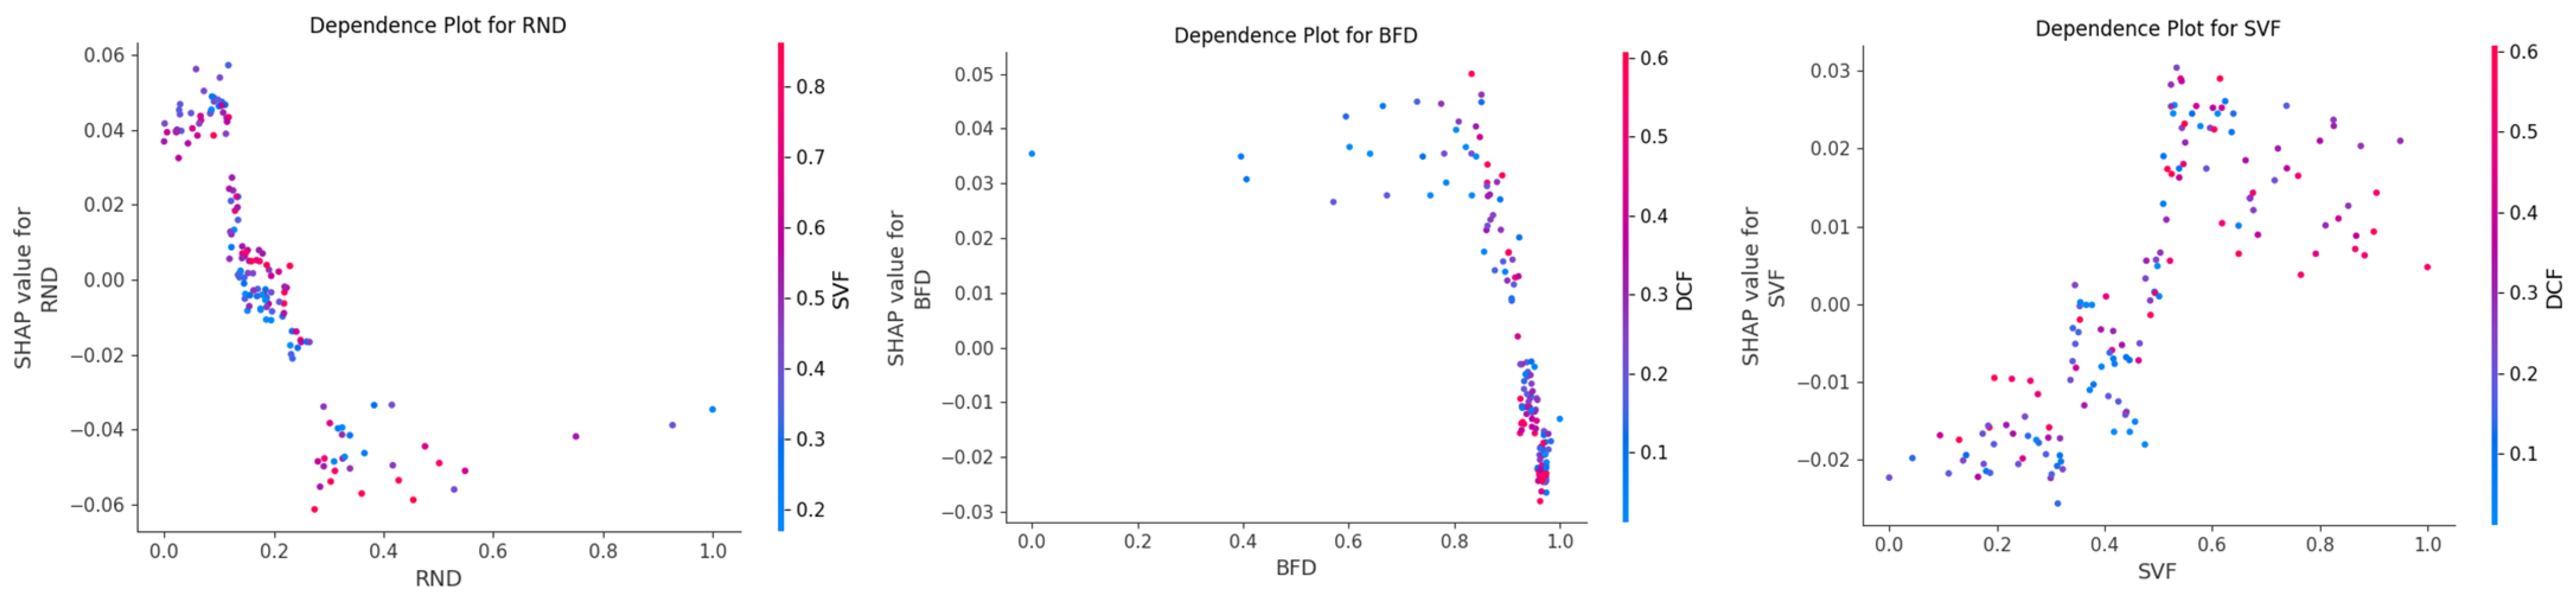
5.4.2. Nonlinear Relationship Between Built Environment Elements and Urban Vitality
6. Conclusions and Discussion
6.1. Conclusions
- (1)
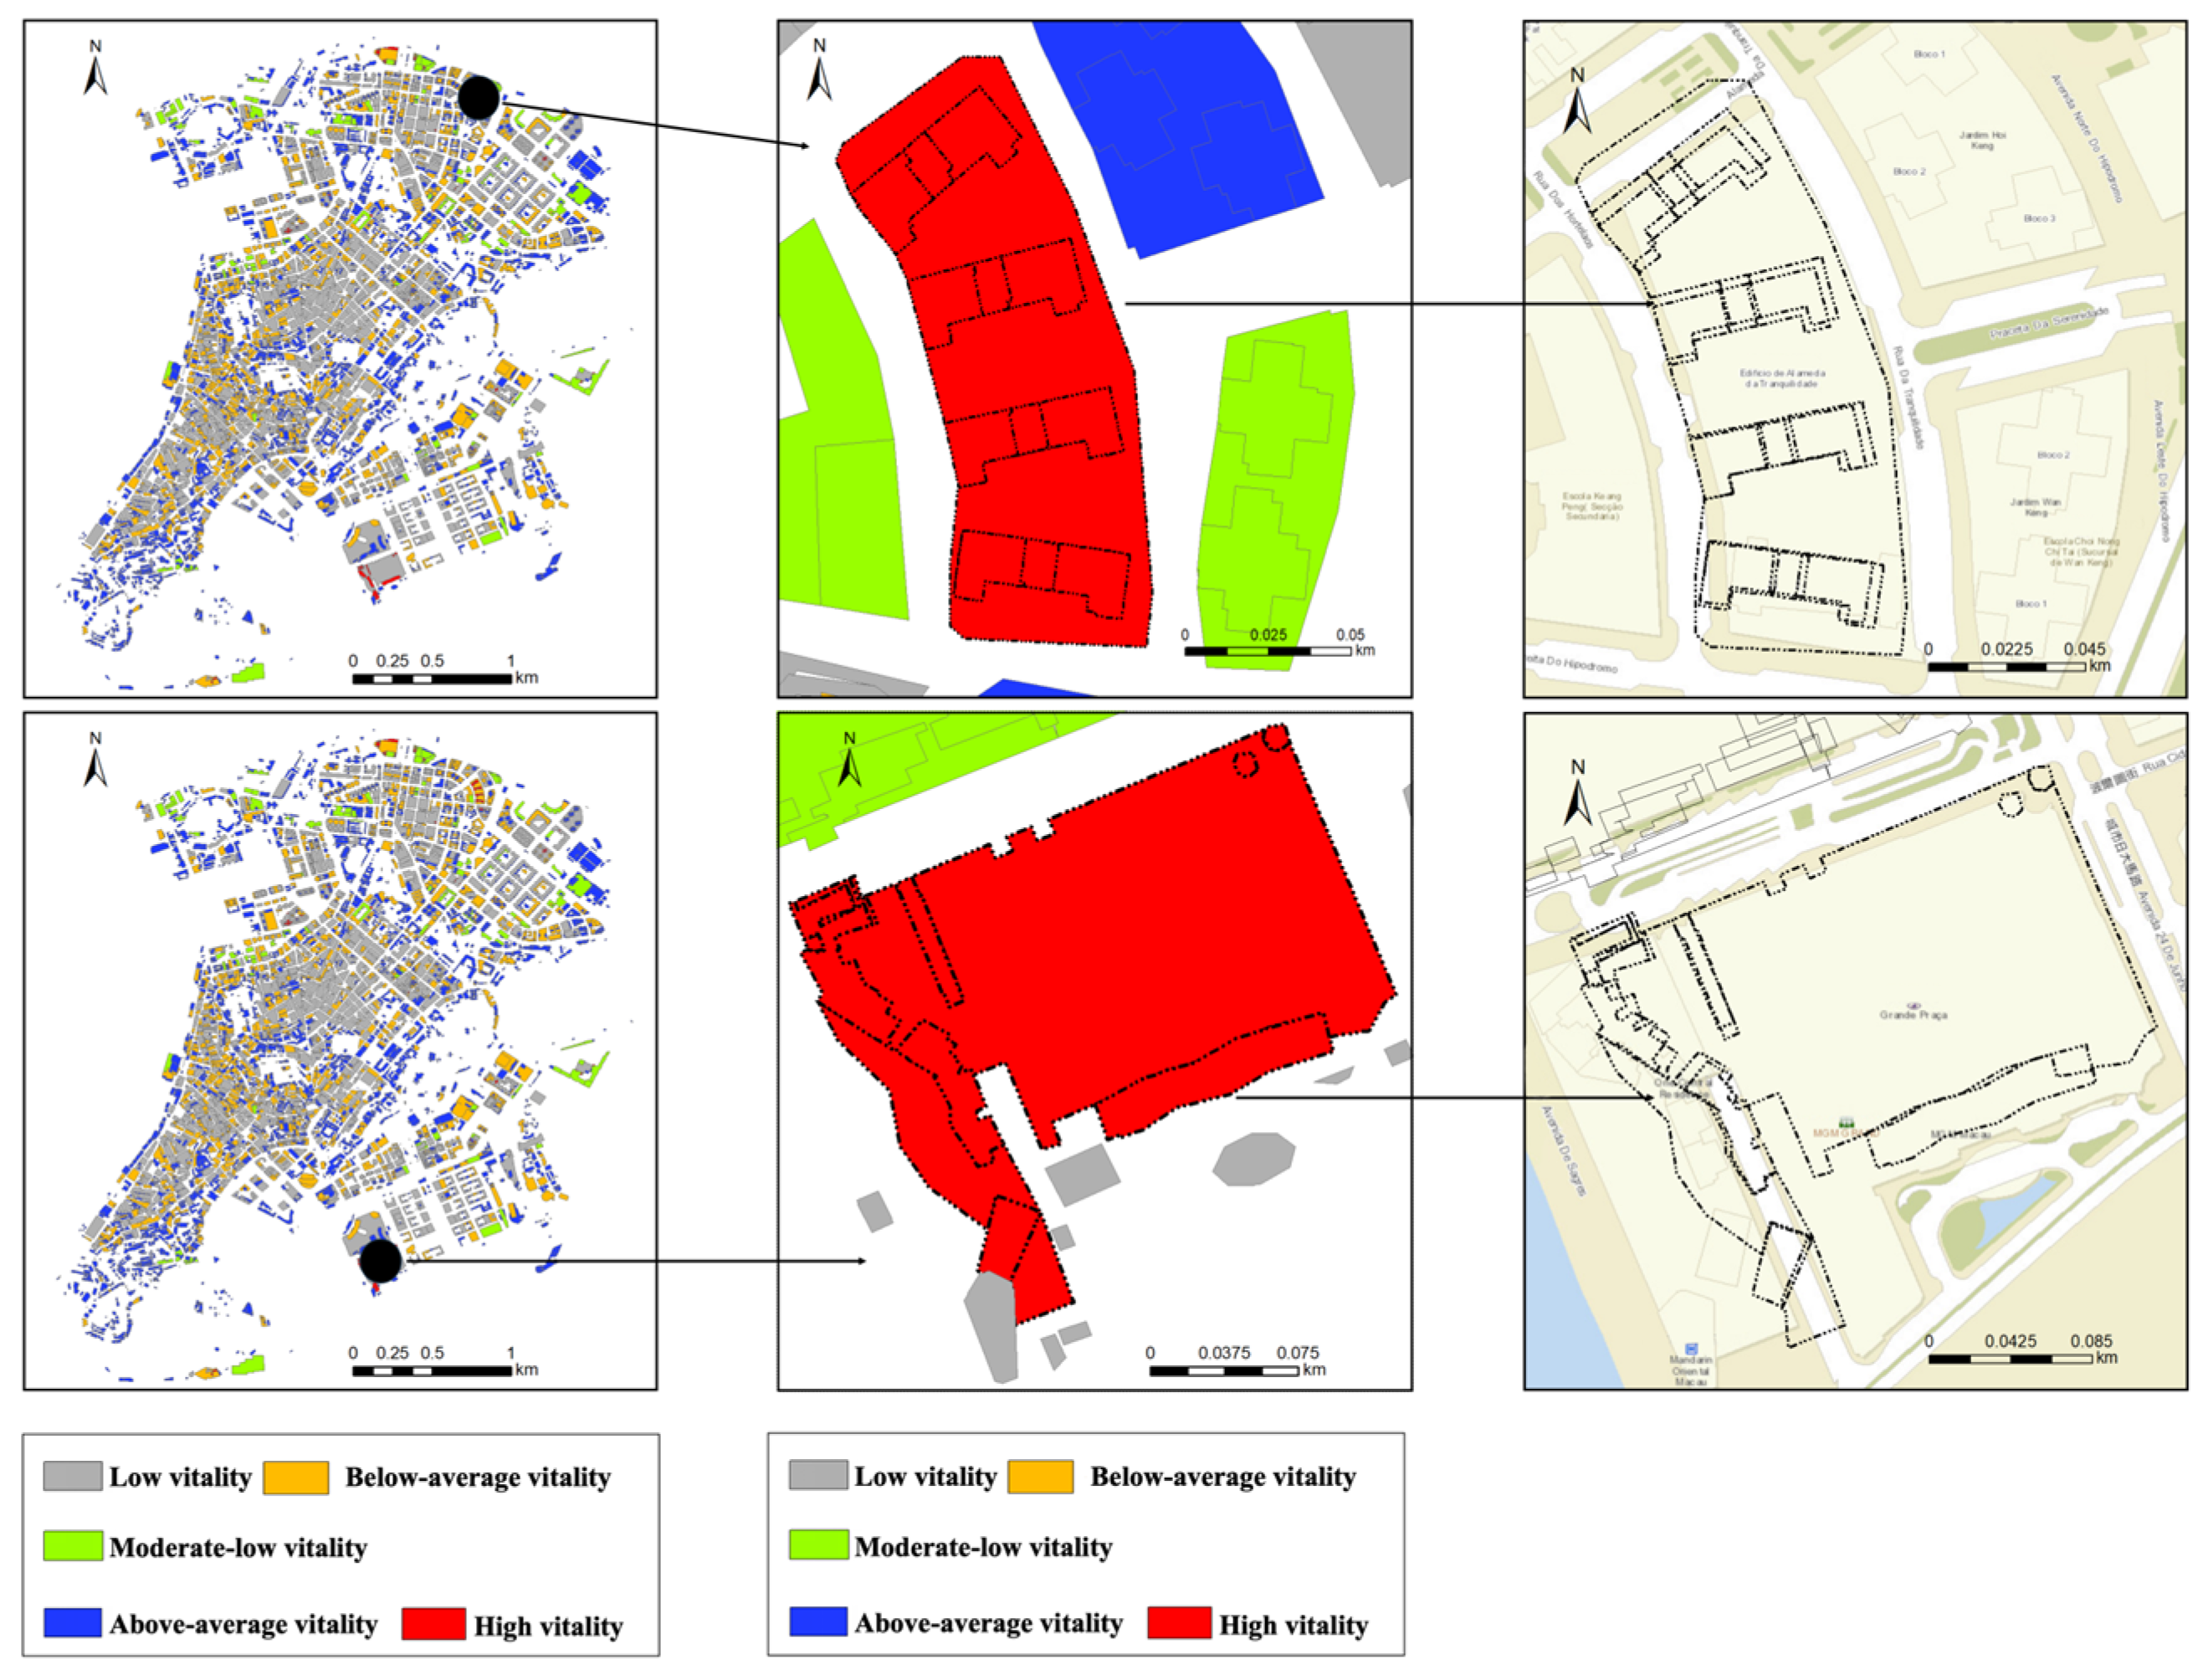
- There are certain spatial distribution differences in the urban vitality across the three dimensions—crowd activity, network interaction, and the built environment—on the Macau Peninsula. However, a common feature across all dimensions is that they exhibit high values at the center, with urban vitality values gradually decreasing toward the periphery. The vitality of crowd activities is concentrated around tourism, commerce, entertainment, and cultural functions, with a high value at the center and secondary vitality clusters in each district. The vitality of network interactions is centered around the New Port and Hac-Sa Bay, presenting a spatial pattern of “moderate vitality as the dominant feature, with scattered areas of low vitality”. The spatial distribution of built environment vitality shows clear hierarchical patterns, closely related to the regional functional layout, land use patterns, and transportation conditions, with high-vitality areas primarily concentrated around the Outer Harbor, Nanhai, Senado Square, and the area surrounding the Ruins of St. Paul’s.
- (2)
- The spatial distribution of overall vitality on the Macau Peninsula is like that of the individual dimensions. Specifically, the largest vitality center is located around the historic district, with vitality decreasing as it moves outward, and the lower vitality areas are distributed at the urban periphery. The RAGA-PPM method used in this study provided a more accurate identification of vitality areas, revealing more potential vitality centers. Each district contains a vitality center, with the historic district—comprising the Ruins of St. Paul’s, New Road, A-Ma Temple, and Senado Square—serving as the main vitality hub for the entire Macau Peninsula. The areas around New Road and Nanhai exhibited the highest vitality, while the areas around Lower Harbor and Taishan showed the lowest vitality. The spatial distribution of urban vitality on the Macau Peninsula is influenced by various factors, showing heterogeneity in distribution.
- (3)
- This study reveals that, at the neighborhood level, the six built environment factors most significantly influencing urban vitality in the Macau Peninsula are, in order of importance, street network density, spatial fractal dimension, sky openness, public facility density, functional mix, and building density. These factors were ranked based on their relative significance to urban vitality and form a key set of built environment indicators that impact the urban vitality of the Macau Peninsula.
- (4)
- The built environment on the Macau Peninsula has a nonlinear effect on urban vitality. Regarding the key factors that influence the vitality of streets and blocks, road network density, spatial fractal dimension, and sky openness had similar threshold values, with all demonstrating a positive impact on vitality when the value was below 0.2.
6.2. Discussion
Author Contributions
Funding
Data Availability Statement
Conflicts of Interest
References
- Ye, Y.; Zhuang, Y.; Zhang, L.Z. Morphological Study of Vitality Creation in Urban Design: Based on Quantitative Analysis of Urban Spatial Morphology and Resident Activity Verification. Int. J. Urban Plan. 2016, 31, 26–33. [Google Scholar]
- Ewing, R.; Cervero, R. Travel and the Built Environment: A Synthesis. Transp. Res. Rec. J. Transp. Res. Board 2001, 1780, 87–114. [Google Scholar] [CrossRef]
- Montgomery, J. Making a City: Urbanity, Vitality, and Urban Design. J. Urban Des. 1998, 3, 93–116. [Google Scholar] [CrossRef]
- Wang, Z.M.; Liu, Y.F.; Luo, X. Nonlinear Relationship Btween Urban Vitality and Built Environment Based on Multi-source Data: A Case Study of the Main Urban Area of Wuhan on Weekends. Prog. Geogr. 2023, 42, 716–729. [Google Scholar] [CrossRef]
- Wu, W.; Ma, Z.; Guo, J.; Zhao, K. Nonlinear effect of built environment on street vitality: A multi-source big data analysis based on XGBoost model. Chin. Landsc. Archit. 2022, 38, 82–87. [Google Scholar]
- Hong, Y.M.; Wang, S.Y. Big Data, Machine Learning, and Statistics: Challenges and Opportunities. J. Econom. 2021, 1, 17–35. [Google Scholar]
- Feng, Z.M.; Zheng, H.X.; Liu, B.Q. Comprehensive Evaluation of Agricultural Water Resource Utilization Efficiency Based on Genetic Projection Pursuit Model. Trans. Chin. Soc. Agric. Eng. 2005, 21, 66–70. [Google Scholar]
- Jin, J.L.; Yang, X.H.; Ding, J. An Accelerated Genetic Algorithm Based on Real Coding. J. Sichuan Univ. (Eng. Sci. Ed.) 2000, 32, 20–24. [Google Scholar]
- Long, Y.; Huang, C.C. Does Block Size Matter? The Impact of Urban Design on Economic Vitality in Chinese Cities. Environ. Plan. B Urban Anal. City Sci. 2019, 46, 406–422. [Google Scholar] [CrossRef]
- Yang, D.F.; Wang, X.M.; Han, R.N. Nonlinear Effects and Interaction of Built Environment on Street Vitality: A Case Study of Shenyang. Urban Plan. J. 2023, 05, 93–102. [Google Scholar]
- Sung, H.G.; Go, D.H.; Choi, C.G. Evidence of Jacobs’ Street Life in Great Seoul: Identifying the Association Between Physical Environment and Walking Activity on Streets. Cities 2013, 35, 164–173. [Google Scholar] [CrossRef]
- Wu, J.Y.; Ta, N.; Song, Y.; Lin, J.; Chai, Y. Urban Form Breeds Neighborhood Vibrancy: A Case Study Using a GPS-Based Activity Survey in Suburban Beijing. Cities 2018, 74, 100–108. [Google Scholar] [CrossRef]
- Delclòs-Alió, X.; Gutiérrez, A.; Miralles-Guasch, C. The Urban Vitality Conditions of Jane Jacobs in Barcelona: Residential and Smartphone-Based Tracking Measurements of the Built Environment in a Mediterranean Metropolis. Cities 2019, 86, 220–228. [Google Scholar] [CrossRef]
- Jiang, D.F. Urban Morphology and Vitality Theory; Southeast University Press: Nanjing, China, 2007. [Google Scholar]
- Tu, W.; Zhu, T.T.; Xia, J.Z.; Zhou, Y.; Lai, Y.; Jiang, J.; Li, Q. Portraying the Spatial Dynamics of Urban Vibrancy Using Multisource Urban Big Data. Comput. Environ. Urban Syst. 2020, 80, 101428. [Google Scholar] [CrossRef]
- He, Q.S.; He, W.S.; Song, Y.; Wu, J.Y.; Yin, C.H.; Mou, Y.C. The Impact of Urban Growth Patterns on Urban Vitality in Newly Built-up Areas Based on Association Rules Analysis Using Geographical Big Data. Land Use Policy 2018, 78, 726–738. [Google Scholar] [CrossRef]
- Zhang, A.Q.; Li, W.F.; Wu, J.Y.; Lin, J.; Chu, J.; Xia, C. How Can the Urban Landscape Affect Urban Vitality at the Street Block Level? A Case Study of 15 Metropolises in China. Environ. Plan. B Urban Anal. City Sci. 2021, 48, 1245–1262. [Google Scholar] [CrossRef]
- Gómez-Varo, I.; Delclòs-Alió, X.; Miralles-Guasch, C. Jane Jacobs Reloaded: A Contemporary Operationalization of Urban Vitality in a District in Barcelona. Cities 2022, 123, 103565. [Google Scholar] [CrossRef]
- Hajrasouliha, A.; Yin, L. The Impact of Street Network Connectivity on Pedestrian Volume. Urban Stud. 2015, 52, 2483–2497. [Google Scholar] [CrossRef]
- Lan, F.; Gong, X.Y.; Da, H.L.; Wen, H. How Do Population Inflow and Social Infrastructure Affect Urban Vitality? Evidence from 35 Large- and Medium-Sized Cities in China. Cities 2020, 100, 102454. [Google Scholar] [CrossRef]
- Li, X.; Li, Y.; Jia, T.; Zhou, L.; Hijazi, I.H. The Six Dimensions of Built Environment on Urban Vitality: Fusion Evidence from Multisource Data. Cities 2022, 121, 103482. [Google Scholar] [CrossRef]
- Yue, W.Z.; Chen, Y.; Thy, P.T.M.; Fan, P.; Liu, Y.; Zhang, W. Identifying Urban Vitality in Metropolitan Areas of Developing Countries from a Comparative Perspective: Ho Chi Minh City versus Shanghai. Sustain. Cities Soc. 2021, 65, 102609. [Google Scholar] [CrossRef]
- Zhang, Z.R.; Liu, J.P.; Wang, C.Y.; Zhao, Y.; Zhao, X.; Li, P.; Sha, D. A Spatial Projection Pursuit Model for Identifying Comprehensive Urban Vitality on Blocks Using Multisource Geospatial Data. Sustain. Cities Soc. 2024, 100, 104998. [Google Scholar] [CrossRef]
- Zhang, Y. Study on the vitality measurement and influence mechanism of urban blocks—A case study of Wuhan main city. Diss. Master’s Thesis, Wuhan University, Wuhan, China, 2019. [Google Scholar]
- Jacobs, J. The Death and Life of Great American Cities; Random House: New York, NY, USA, 1961. [Google Scholar]
- Ye, Y.; Van Nes, A. Quantitative Tools in Urban Morphology: Combining Space Syntax, Space Matrix, and Mixed-Use Index in a GIS Framework. Urban Morphol. 2014, 18, 97–118. [Google Scholar] [CrossRef]
- Cao, Z.M.; Zhen, F.; Li, Z.X. Study on Urban Temporal Vitality Patterns and Influencing Factors Based on Mobile Phone Signaling Data: A Case Study of the Central Urban Area of Nanjing. Hum. Geogr. 2022, 37, 109–117. [Google Scholar]
- Liu, S.J.; Zhang, L.; Long, Y. Urban Vitality Area Identification and Pattern Analysis from the Perspective of Time and Space Fusion. Sustainability 2019, 11, 4032. [Google Scholar] [CrossRef]
- Wu, G.S.; Dang, Y.T.; Zhao, K. Study on Urban Vitality Spatial Characteristics Based on Multi-dimensional Perception. J. Earth Inf. Sci. 2022, 24, 1867–1882. [Google Scholar]
- Wang, B.; Zhen, F.; Zhang, H. Study on the Temporal and Spatial Dynamics of Urban Activities Based on Check-in Data and Area Division. Geogr. Sci. 2015, 35, 151–160. [Google Scholar]
- Liu, Y.S.; Zhao, P.J.; Liang, J.S. Study on Urban Vitality Based on Location-Based Service Data: A Case Study of the Sixth Ring Area in Beijing. Reg. Res. Dev. 2018, 37, 64–69. [Google Scholar]
- Wu, Z.Q.; Ye, Z.N. Study on Urban Spatial Structure Based on Baidu Map Heat Maps: A Case Study of the Central Urban Area of Shanghai. Urban Plan. 2016, 40, 33–40. [Google Scholar]
- Jia, J.Y.; Song, J.F. Research on the Relationship Between Urban Vitality and Built Environment “3D” Characteristics: A Case Study of Wuhan. Mod. Urban Res. 2020, 35, 59–66. [Google Scholar]
- Wang, N.; Wu, J.S.; Li, S. Research on the Spatial Characteristics of Urban Vitality and the Impact Mechanisms of the Built Environment Based on Multisource Data: A Case Study of Shenzhen. Trop. Geogr. 2021, 41, 1280–1291. [Google Scholar]
- Long, Y.; Zhou, Y. Quantitative Evaluation and Influencing Factors Analysis of Street Vitality: A Case Study of Chengdu. New Archit. 2016, 52–57. [Google Scholar]
- Niu, X.Y.; Wu, G.S.; Li, M. Study on the Impact of Built Environment on Street Vitality and Its Temporal and Spatial Characteristics Based on LBS Location Data. Int. J. Urban Plan. 2019, 34, 28–37. [Google Scholar] [CrossRef]
- Zhang, L.M.; Zhang, R.X.; Yin, B. The Impact of Built Environment on Pedestrian Activities in Historical Areas. Alex. Eng. J. 2021, 60, 285–300. [Google Scholar] [CrossRef]
- Zou, S.C.; Zhang, S.Q.; Zhen, F. Study on Community Daily Activity Space Measurement and Vitality Influencing Factors Based on Residents’ Spatiotemporal Behavior: A Case Study of Shazhou and Nanyuan Streets in Nanjing. Prog. Geogr. 2021, 40, 580–596. [Google Scholar] [CrossRef]
- Luo, S.Z.; Zhen, F. Study on Urban Public Space Vitality Evaluation Method Based on Mobile Phone Data: A Case Study of Parks in Nanjing. Geogr. Res. 2019, 38, 1594–1608. [Google Scholar]
- Liu, S.; Lai, S.Q. Study on Influencing Factors of Urban Public Space Vitality Based on Multisource Data: A Case Study of the Huangpu River Waterfront Area in Shanghai. Landsc. Archit. 2021, 28, 75–81. [Google Scholar]
- Shi, Y.; Li, T.T.; Yang, J.Y. Study on Urban Waterfront Space Vitality Based on Mobile Phone Signaling Data: A Case Study of Jinji Lake in Suzhou. Landsc. Archit. 2021, 28, 31–38. [Google Scholar]
- Wang, M.W.; Jin, J.L.; Li, L. Application of Accelerated Genetic Algorithm-Based Projection Pursuit in Liquefaction Potential Evaluation of Sandy Soil. Rock Soil Mech. 2004, 23, 631–634. [Google Scholar]
- Fu, Q.; Fu, H.; Wang, L.K. Application of Accelerated Genetic Algorithm-Based Projection Pursuit Model in Water Quality Evaluation. Geogr. Sci. 2003, 23, 236–239. [Google Scholar]
- Ta, N.; Zeng, Y.T.; Zhu, Q.Y.; Wu, J.Y. Relationship Between Built Environment and Urban Vitality in Central Shanghai Based on Big Data Analysis. Geogr. Sci. 2020, 40, 60–68. [Google Scholar]
- Wang, C.G.; Wang, B.; Wang, Q.Z. Nonlinear Relationship and Threshold Effect Between Urban Vitality and Built Environment: A Case Study of Guangzhou’s Central Urban Area. Prog. Geogr. 2023, 42, 79–88. [Google Scholar] [CrossRef]
- Han, Y.; Qin, C.P.; Xiao, L.Z.; Ye, Y. The Nonlinear Relationships Between Built Environment Features and Urban Street Vitality: A Data-Driven Exploration. Environ. Plan. B Urban Anal. City Sci. 2024, 51, 195–215. [Google Scholar] [CrossRef]
- Macau Statistics and Census Service. Available online: https://www.dsec.gov.mo/zh-MO/Statistic/Database (accessed on 3 April 2024).
- Fang, L.; Huang, J.L.; Zhang, Z.Y.; Nitivattananon, V. Data-Driven Framework for Delineating Urban Population Dynamic Patterns: A Case Study on Xiamen Island, China. Sustain. Cities Soc. 2020, 62, 102365. [Google Scholar] [CrossRef]
- Huang, B.; Zhou, Y.L.; Li, Z.G.; Song, Y.; Cai, J.; Tu, W. Evaluating and Characterizing Urban Vibrancy Using Spatial Big Data: Shanghai as a Case Study. Environ. Plan. B Urban Anal. City Sci. 2020, 47, 1543–1559. [Google Scholar] [CrossRef]
- Ding, J.; Luo, L.; Shen, X.; Xu, Y. Influence of built environ-ment and user experience on the waterfront vitality of his-torical urban areas: A case study of the Qinhuai River in Nanjing, China. Front. Archit. Res. 2023, 12, 820–836. [Google Scholar] [CrossRef]
- Yu, L.; Sheng, Y.H.; Liu, X.Y. Research on urban vitality evaluation method based on RAGA-PPM model: A case study of central urban area in Nanjing. J. Geo-Inf. Sci. 2024, 26, 2567–2582. [Google Scholar]
- Cao, Q.F.; Jiang, Q.X.; Zheng, L.L. Improving the compactibility of Gardeniae Fructus extract by HPMC based on systematic optimization with QbD concept and FAHP-entropy weight method. Chin. Tradit. Herb. Drugs 2024, 55, 5448–5458. [Google Scholar]
- Liu, Y.; Wang, K.L.; Xing, X.Y. Spatial Effects in Geographic Analysis. Acta Geogr. Sin. 2023, 78, 517–531. [Google Scholar]
- Shannon, C.E. A mathematical theory of communication. Bell Syst. Tech. J. 1948, 27, 379–423. [Google Scholar] [CrossRef]
- Friedman, J.H.; Tukey, J.W. A projection pursuit algorithm for exploratory data analysis. IEEE Trans. Comput. 1974, 23, 881–890. [Google Scholar] [CrossRef]


| Variable | Detection Metric | Calculation Formula | Formula Description |
|---|---|---|---|
| Urban Vitality | Population Density | R represents the density value of a specific neighborhood unit; H denotes the kernel density value of a particular neighborhood unit; A is the area of a given neighborhood unit. | |
| Weibo Check-in Density | |||
| Spatial Configuration | Spatial Compactness | C represents the compactness of a block, which is determined by the area of the land parcel within the block unit and the lengths of the boundaries of the parcel. | |
| Fractal Dimension | D value typically ranges between 1.0 and 2.0, with a higher D value indicating greater complexity in the spatial configuration of land parcels within the region. | ||
| Functional Attribute | Functional Density | represents the total number of Points of Interest (POI) within the i-th urban block, refers to the area of the i-th category of urban blocks. | |
| Functional Mix | represents the functional mix of the block, “i” denotes the number of POIs within the i-th block unit, and “Pi” signifies the ratio of the i-th category of POIs to the total number of POIs within the block unit. | ||
| Socio-Economic Environment | Cultural Facility Density | D represents the ratio of the total number of cultural facilities, public facilities, and commercial facilities within a specific region to the total area of that region. | |
| Public Facility Density | |||
| Psychological Perception | Building Density | P represents the building density, i denotes the identification number of different buildings, refers to the base area of the building with the i-th identification number, and s stands for the usable area. | |
| Hydrophilic index | WI denotes the hydrophilicity index of spatial blocks, while K is a constant term representing the search radius value for neighborhood analysis. | ||
| Transportation Accessibility | Road Network Densit | D represents the ratio of the total number of commercial facilities and bus stops to the total area within the study region. | |
| Bus Stop Density | |||
| Street Quality | Green View Index | The visibility of vegetation as perceived by the human eye was measured to assess the level of greenery on urban streets. | |
| sky view factor | The term refers to the proportion of the sky visible within the field of view at a specific location, typically expressed as a value ranging from 0 to 1. | ||
| Enclosure | The sense of enclosure measures the extent to which an individual feels surrounded by the surrounding environment within a space. | ||
| Walkability | Refers to the level of pedestrian-friendliness of a street or urban area. |
| Data Type | Data Name | Data Source | Time | Preprocessing |
|---|---|---|---|---|
| Fundamental Geospatial Data | Macau Road Network | Tianditu (https://www.tianditu.gov.cn/ accessed on 3 April 2024) | 2024 | The data were uniformly projected onto the WGS84 coordinate system to classify road and building categories, and metrics such as road density, building area, and water system area were subsequently calculated. |
| Macau Architectural Structures | ||||
| Hydrological Data | ||||
| Open-source Web Data | Baidu Heatmap Population Data | Baidu Map Smart Eye Population Big Data Platform (https://huiyan.baidu.com/ accessed on 3 April 2024) | 2024 | The Kernel Density analysis tool within ArcGIS was employed to convert the data into a continuous raster density map. |
| Macau Housing Price Data | Estate Information Network of Macau (https://www.malimalihome.net/ accessed on 3 April 2024) | 2023 | The core fields, including unit price, total price, gross floor area, and property type, were collected to calculate key metrics such as price per square meter and average housing prices by region. | |
| Points of Interest (POI) Data | GaoDe Map | 2024 | The dataset underwent comprehensive data cleaning, including the handling of missing values and outliers. Classification and standardization processes were implemented to ensure field uniformity across all 45,708 records. | |
| Weibo Check-in Data | Sina Weibo (https://weibo.com/ accessed on 3 April 2024) | 2020 | The data cleaning process involved handling missing values and outliers, followed by categorizing the data based on check-in locations. The total number of Weibo check-ins processed was 145,370. | |
| Street View Imagery | Baidu Street View Map Open Platform (https://lbs.baidu.com/ accessed on 3 April 2024) | 2023 | Sampling points were generated at 100 m intervals based on road network data. Utilizing the Baidu API endpoint with a pitch angle of 0 degrees, images were captured at four different azimuth angles: 0°, 90°, 180°, and 270°. A total of 10,442 images were collected. |
| Dataset | MAE | RMSE | R2 |
|---|---|---|---|
| Training Set Results | 0.0256 | 0.0375 | 0.8170 |
| Test Set Results | 0.0650 | 0.0817 | 0.5548 |
Disclaimer/Publisher’s Note: The statements, opinions and data contained in all publications are solely those of the individual author(s) and contributor(s) and not of MDPI and/or the editor(s). MDPI and/or the editor(s) disclaim responsibility for any injury to people or property resulting from any ideas, methods, instructions or products referred to in the content. |
© 2025 by the authors. Licensee MDPI, Basel, Switzerland. This article is an open access article distributed under the terms and conditions of the Creative Commons Attribution (CC BY) license (https://creativecommons.org/licenses/by/4.0/).
Share and Cite
Pan, C.; Guo, J.; Li, H.; Wu, J.; Qiu, N.; Wu, S. Study on the Influence Mechanism of Machine-Learning-Based Built Environment on Urban Vitality in Macau Peninsula. Buildings 2025, 15, 1557. https://doi.org/10.3390/buildings15091557
Pan C, Guo J, Li H, Wu J, Qiu N, Wu S. Study on the Influence Mechanism of Machine-Learning-Based Built Environment on Urban Vitality in Macau Peninsula. Buildings. 2025; 15(9):1557. https://doi.org/10.3390/buildings15091557
Chicago/Turabian StylePan, Chen, Jiaming Guo, Haibo Li, Jiawei Wu, Nengjie Qiu, and Shengzhen Wu. 2025. "Study on the Influence Mechanism of Machine-Learning-Based Built Environment on Urban Vitality in Macau Peninsula" Buildings 15, no. 9: 1557. https://doi.org/10.3390/buildings15091557
APA StylePan, C., Guo, J., Li, H., Wu, J., Qiu, N., & Wu, S. (2025). Study on the Influence Mechanism of Machine-Learning-Based Built Environment on Urban Vitality in Macau Peninsula. Buildings, 15(9), 1557. https://doi.org/10.3390/buildings15091557