Article

Simulation and Analysis of the Constraint Effects of Multi-Cavity Double Steel Plate Composite Walls

1
Department of Civil Engineering, Tsinghua University, Beijing 100084, China
2
School of Civil Engineering, Chongqing University, Chongqing 400045, China
*
Author to whom correspondence should be addressed.
Buildings 2025, 15(9), 1556; https://doi.org/10.3390/buildings15091556
Submission received: 2 April 2025 / Revised: 28 April 2025 / Accepted: 2 May 2025 / Published: 5 May 2025

Abstract

Multi-cavity double steel plate–concrete composite structures are composed of two layers of steel plates, accompanied by steel flanges, diaphragms, and a core of concrete. Thanks to their exceptional mechanical attributes, these structures have gained widespread adoption in the field of wind power engineering. The outer steel plates exert a notable confinement on the concrete filling. Nonetheless, there remains a lack of a constitutive model specifically tailored for concrete under confinement within the field of multi-cavity double steel plate–concrete composite structures. To bridge this gap, our research endeavor involved the creation of approximately 2000 shell–solid finite element models, leading to the derivation of a constitutive model for compressed confined concrete within such structures through regression analysis. Initially, theoretical evaluations were conducted to pinpoint the structural parameters potentially influencing confinement behavior. Thereafter, Abaqus shell–solid finite element models were formulated, and their accuracy was corroborated through experimental validations. By systematically adjusting parameters in batch modelling, regression analysis was conducted. Consequently, a constitutive model tailored for uniaxial compression of concrete in multi-cavity double steel plate–concrete composite structures (MDSCCS) was formulated. According to the results, the strength of confined concrete in MDSCCS can be enhanced by up to 23% under typical configurations, as observed in the benchmark model MDSCCS-1. The proposed regression-based confinement model demonstrates a prediction error of less than 15% in 97.8% of the 1342 finite element models that successfully converged in batch simulations.

1. Introduction

The wind power industry has seen a trend towards larger turbines, marking a significant developmental trajectory [1,2]. Increasing the capacity of individual turbines significantly reduces the number of turbine sites, facilitating land acquisition savings and cost reduction. This necessitates the design of taller wind turbine towers to meet the demands of ultra-high hub heights, essential for harnessing wind resources to maximize power generation. Currently, the most profitable height for cylindrical towers is between 90 m and 100 m. Increased tower heights require thicker tower barrel walls, leading to poor economic efficiency. Moreover, expanding the tower base diameter poses transportation challenges. Larger turbines lead to heavier nacelles and rotors. Considering the eccentricity of the nacelle with respect to the tower barrel, tower instability and subsequent collapse under extreme loads are more likely to occur at greater heights. To address these challenges, Zhou et al. [3] proposed a novel structural design for wind turbine towers based on composite construction principles—a hybrid wind turbine tower constructed from a composite structure.
As shown in Figure 1, the novel hybrid tower framework employs a multi-cavity double steel plate–concrete composite structure [4,5,6,7] that fully leverages the material properties of steel and concrete, characterized by high sectional rigidity and excellent stability. The steel plates can replace a portion of the load-bearing reinforcement and serve as templates for concrete casting. All constituent components are manufactured in batches at a factory. This enables rapid assembly upon arrival at the site, facilitating swift construction and enhancing production efficiency [8,9,10,11]. Therefore, research on the mechanical properties of double steel plate composite walls is crucial for advancing the application of new hybrid towers [12,13,14,15,16,17].
The multi-cavity double steel plate–concrete composite structures (MDSCCS) design consists essentially of concrete, steel webs, flanges, and diaphragms, as illustrated in Figure 2. Various research endeavors have delved into the mechanical properties of these composite structures. Guo et al. [18], for instance, conducted experimental assessments on the axial compression capabilities of such a composite structure, uncovering that its load-bearing potential surpassed the combined strengths of the constituent materials. Similarly, Wang et al. [19,20,21] carried out experimental studies alongside finite element modeling to analyze the shear hysteretic behavior, highlighting the impressive ductility and robust shear capacity of the structure. These findings are corroborated by the research of Wang et al. [22] and Zhang et al. [23].
Research into the confinement effects exhibited by multi-cavity double steel plates in composite walls remains scant. Nevertheless, the confinement mechanisms shared across diverse structures offer valuable insights into those operating within MDSCCS designs. Drawing upon studies of confinement effects in reinforced and steel-reinforced concrete columns, three core methodologies are utilized:
(1)
An approach rooted in experimental foundations, augmented by semi-empirical mechanical derivations. A notable illustration is Mander’s work [24] on the confinement behavior in reinforced concrete columns. In this study, the confinement effect was compared to an equivalent stress, and a magnitude factor was derived for the compressive strength of reinforced concrete.
(2)
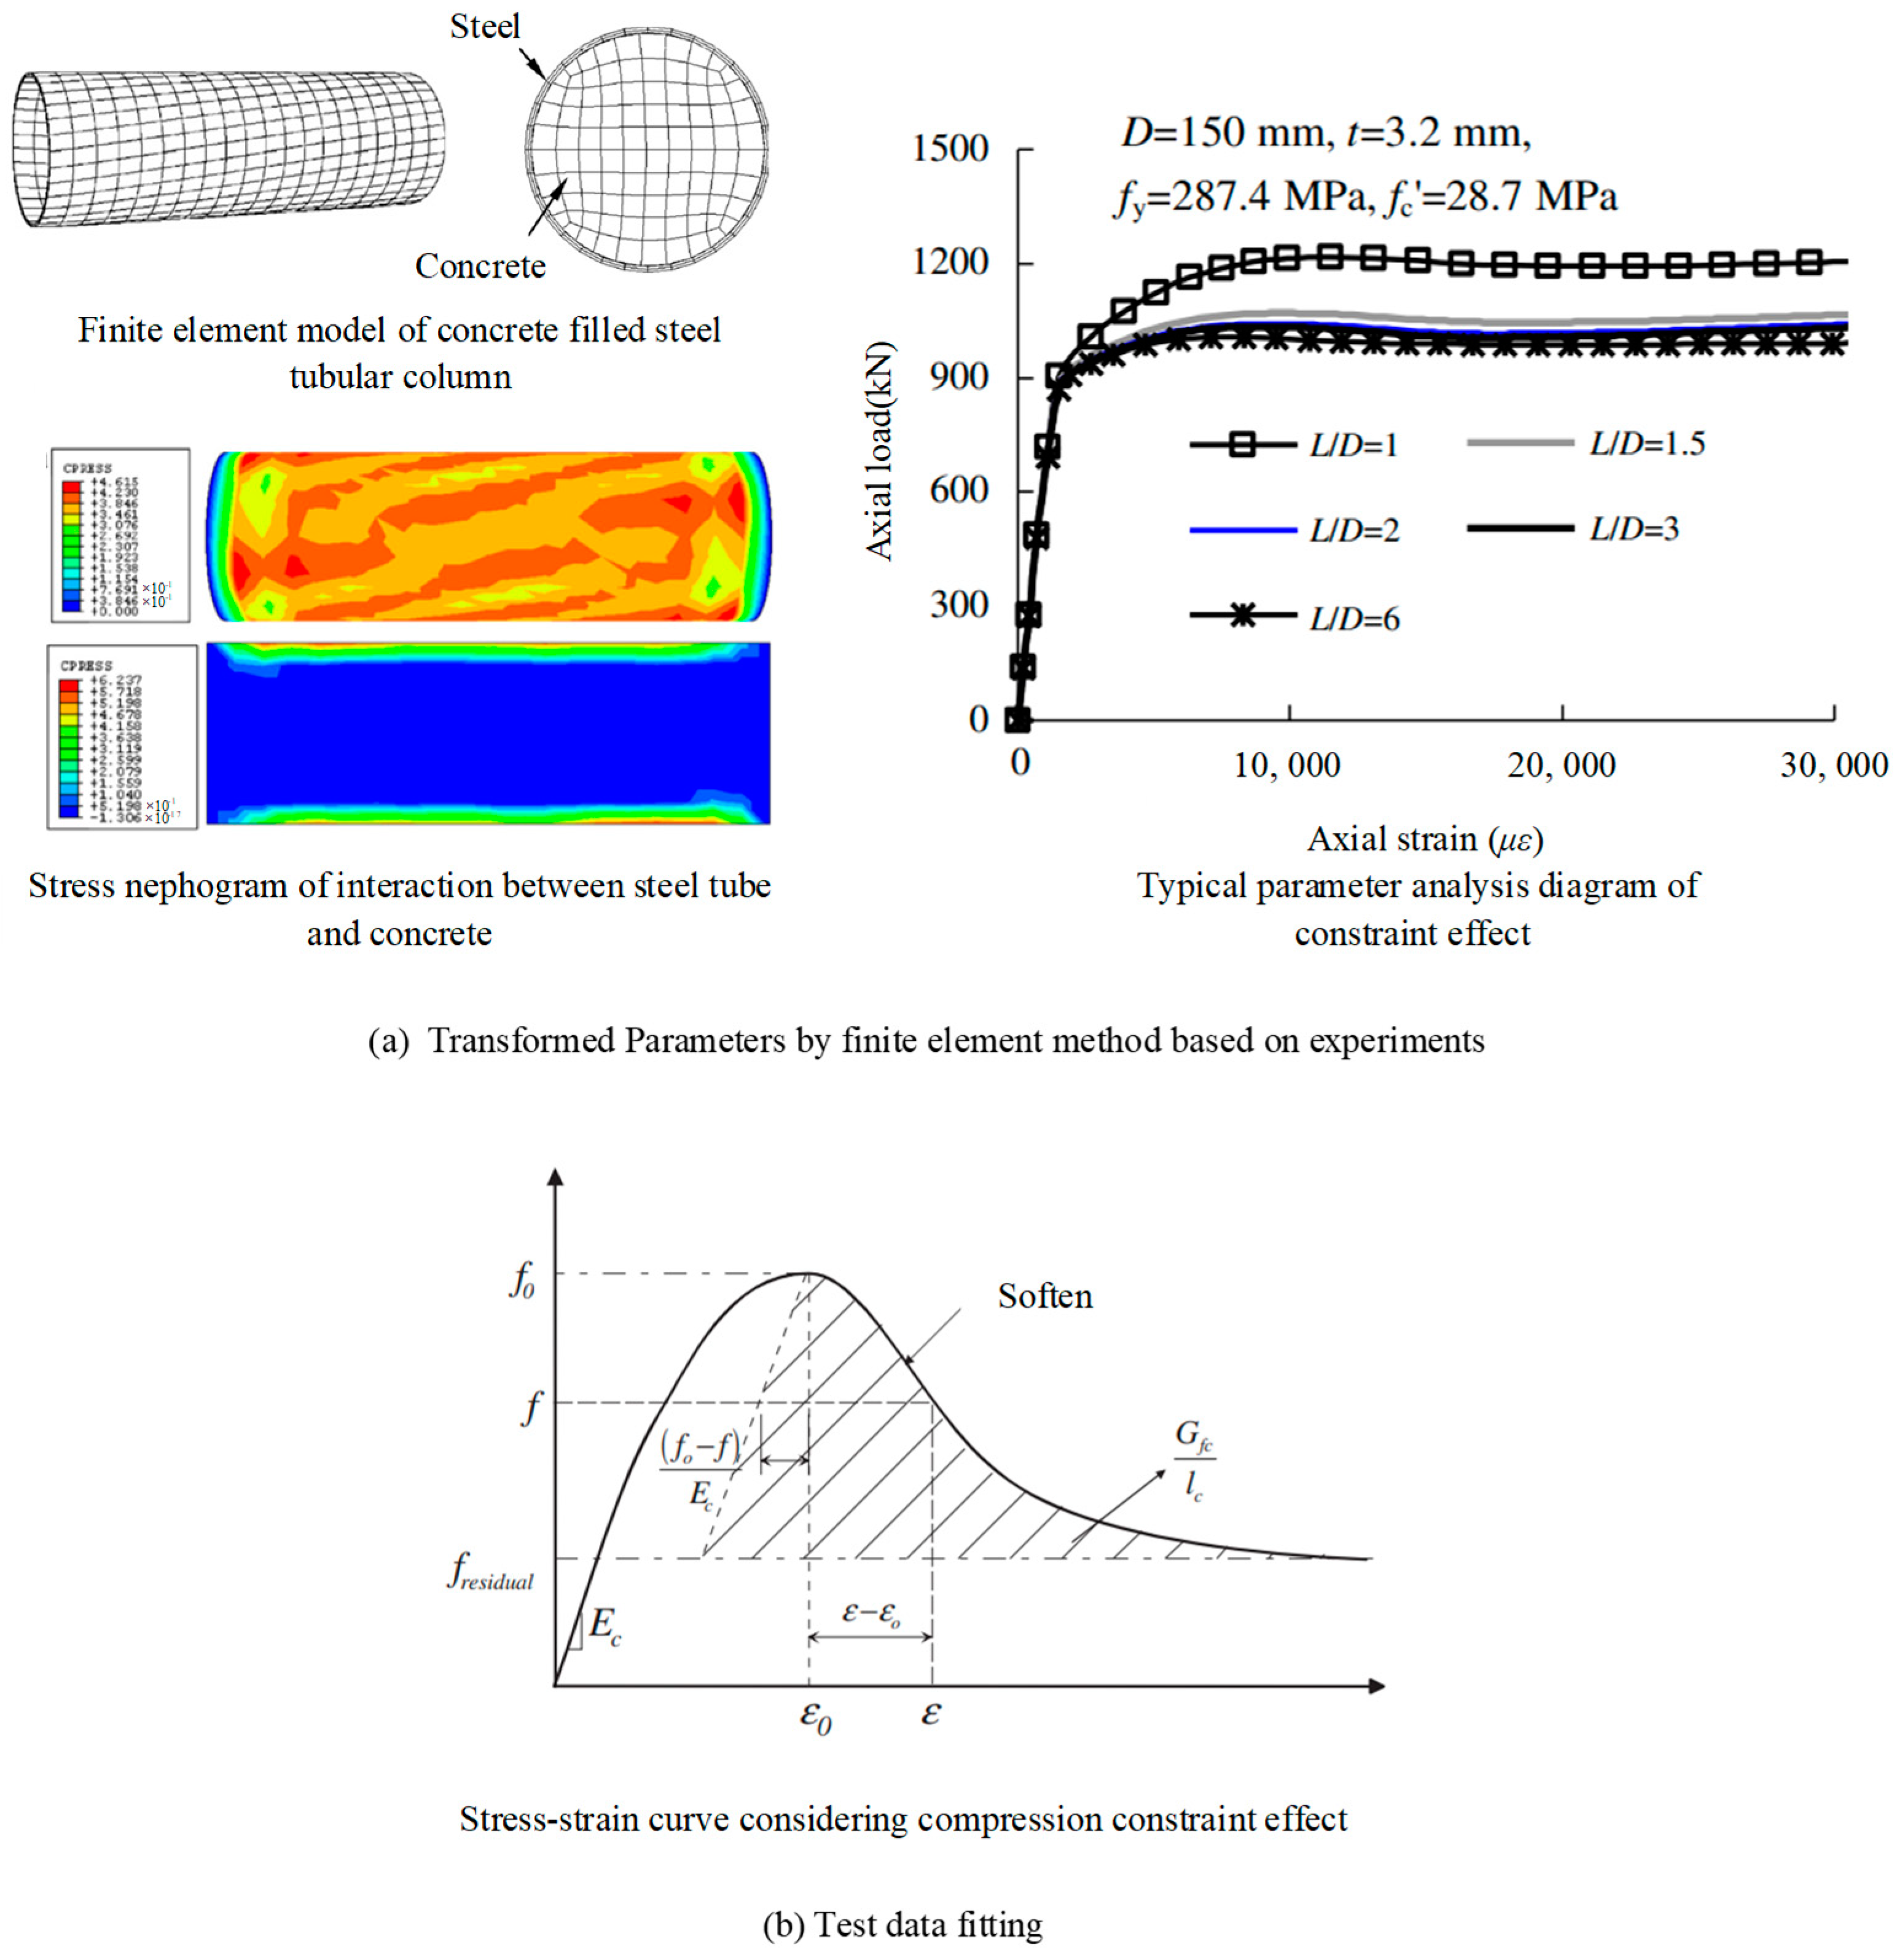
A methodology that integrates experimental results with advanced finite element modelling. A prime example is the research conducted by Han et al. and Zhong et al. [25,26] on confinement effects in steel-reinforced concrete columns, depicted in Figure 3a. Their study delves into the stress–strain relationship, emphasizing the influence of confinement effect coefficients on the overall mechanical behavior.
(3)
A purely experimental data-fitting approach. Samani’s research [27] about concrete columns stands as a typical example. Leveraging statistical and regression techniques, they formulated a strain-stress model for concrete columns based on experimental data.
Figure 3. Study on the constraint effect.
Buildings 15 01556 g003
Research on the constraint effects in MDSCCS remains scarce. The conventional strategy to account for restraint effects involves the intricate calculation of corresponding restraint stresses using sophisticated finite element models. However, this technique is computationally intensive and lacks a clear, uniaxial constitutive model for compression tailored to multi-cavity composite configurations. Consequently, an exhaustive investigation into the restraint mechanisms of these structures is urgently needed [28]. Building upon previous methodologies employed in studying restraint effects in other structural systems, our study formulated approximately 2000 detailed finite element models for comprehensive batch analysis. The core objective was to formulate a uniaxial compressive constitutive relationship specifically for MDSCCS. Initially, through theoretical scrutiny, we pinpointed 11 structural parameters that could potentially influence the restrained behavior. Following this, a shell–solid concrete damage plasticity (CDP) finite element model, grounded in Abaqus, was developed, and its precision was confirmed through experimental validation. Subsequently, a regression analysis was executed across various parameterized batch models. Ultimately, a uniaxial compressive constitutive relationship pertinent to MDSCCS was formulated.

2. Theoretical Analysis of Constraint Mechanisms in MDSCCS

An examination of constraint effects within an MDSCCS reveals that the concrete infill experiences confinement in both the width and thickness dimensions. Figure 4 illustrates the schematic representation of these constraint effects. In the thickness direction, the constraint stress generated by the infill concrete is counterbalanced by tensile forces acting on the diaphragms and flange plates in the same direction. Conversely, in the width direction, the tensile forces in the steel webs equilibrate the constraint stress. Notably, these tensile forces from diaphragms and flange plates transmit to the webs, becoming out-of-plane shear forces, which subsequently diminish the stiffness of the steel webs. Equations (1) and (2) facilitate the computation of constraint forces in both directions.
p 1 b w = 2 f p 1 t f
p 2 d = 2 f p 2 t w
In Equation (1), p1 denotes the magnitude of the thickness-direction constraint stress, bw signifies the width of a single cavity, fp1 represents the horizontal stress in the steel plate due to the constraint effect in the thickness direction, and tf stands for the thickness of the multi-cavity steel plate. Given that the flange plate and diaphragm undergo biaxial forces in opposing directions, the horizontal stress is anticipated to be lower than the yield strength. Analogously, Equation (2), derives the magnitude of the width-direction constraint stress, where p2 is the width-direction constraint stress, fp2 signifies the horizontal stress in the steel plate due to the constraint effect in the width direction, d represents the thickness of the multi-cavity composite structure, and tw denotes the thickness of the web plate. Therefore, the constraint stress is contingent upon factors such as steel thickness, strength, and the area of the concrete component. Studs were set in some multi-cavity structures; however, studs have a marginal effect on infilled concrete. This conclusion is corroborated by experimental evidence provided by Yang Y et al. [29], Shi J et al. [30], and Zhang Y et al. [31]. Hence, studs were excluded from this analysis. The primary influencers of the constraint effect in multi-cavity composite structures are the thickness and strength of the steel plate, as well as the infilled concrete. These parameters are the focus of the parametric analysis in the following parts. Furthermore, Eurocode 4 (EN 1994-1-1) [32] and the Chinese Code for Design of Composite Structures (JGJ 138-2016) [33] provide guidelines for the design of steel–concrete composite elements, but neither of them directly addresses confinement mechanisms in multi-cavity configurations. This observation underscores the novelty and potential impact of our study, which offers a more detailed model tailored to multi-cavity double steel plate composite walls.

3. Three-Dimensional Finite Element Model of MDSCCS

3.1. Model Overview

3.1.1. Constitutive Model of Material

In this research, a shell–solid finite element model grounded in the Concrete Damaged Plasticity model within the Abaqus 2024 software framework was employed. This modeling approach is commonly applied to similar structures [34]. Below is a concise overview of the FE model parameters.
For simulating concrete, the three-dimensional solid element C3D8R was utilized, adopting the CDP model with default settings as specified in [25]. Under conditions of uniform initial stiffness and peak strain, the compressive behavior was examined. By interpolating the constitutive inputs from tables, slight variations were noted among various uniaxial compression constitutive models. Subsequently, the ascending segment was modeled using an Attard curve [35]. To facilitate convergence, a linear descending part was incorporated, with the specific formulations detailed in Equations (3)–(7).
y = A x + B x 2 1 + ( A 2 ) x + ( B + 1 ) x 2
ε 0 = 4.26 f c E c f c 4
A = E c ε 0 f c
B = ( A 1 ) 2 0.55 1
E c = 4730 f c
Here, A and B represent parameters, x equals ε/ε0, and y is σ/fc. Ec denotes the Young’s modulus, while fc and ε0 signify the compressive strength and peak strain of concrete, and fc’ refers to the cylinder compressive strength. In the tensile region, a linear representation was adopted both before and after cracking, maintaining a specific residual strength to guarantee convergence. For the steel part, the S4R element was utilized, and an idealized elasto-plastic model was adopted. For connectors, the CONNECTOR element was employed, with stiffness computed using elastic methods. Explicit modeling with the shell element S4R was also applied for the diaphragm.
Key assumptions made regarding tensile behavior include: the tensile strength of concrete is approximated as 10% of its compressive strength; a constant residual tensile stress is retained to prevent early convergence failures; and tensile cracking is not considered in the regression formulation of the confined concrete model, as cracking effects in MDSCCS under axial load are marginal due to the high confinement provided by surrounding steel plates.

3.1.2. Interfacial Interactions

As for interactions, the interfaces among steel webs, diaphragms, flange plates, and embedded concrete were modelled using “hard contact”. Since the friction coefficient has a negligible impact on the mechanical response, it was set to 0.1 within this FE model. Given the complexities inherent in the model, including contacts, elastic–plastic behavior, and steel buckling, automatic stabilization was integrated into the analysis steps to assure convergence. Figure 5 illustrates a schematic of the FE model.

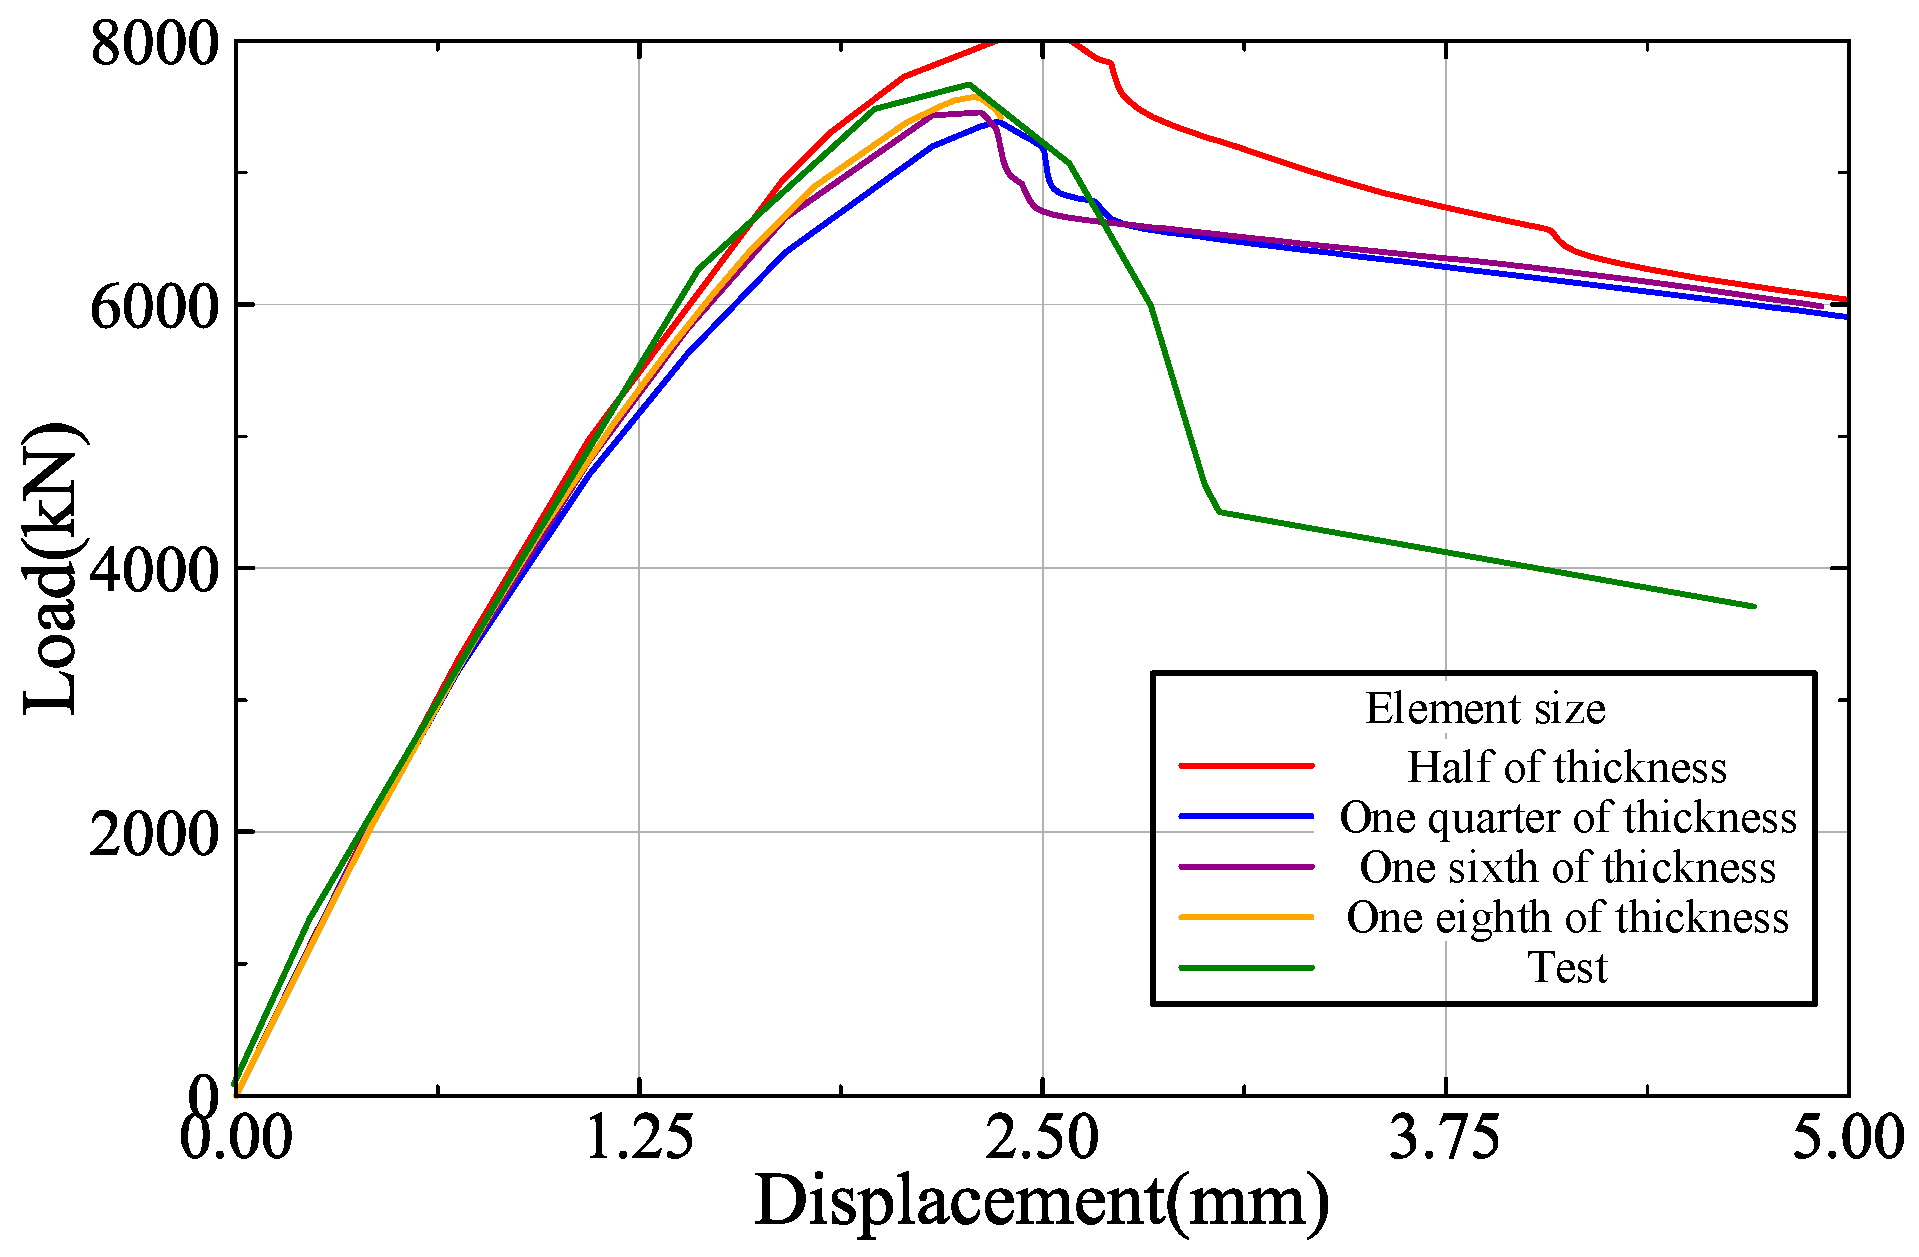
3.2. Finite Element Model Mesh Dimensional Assessment

Mesh size plays a pivotal role in shaping the computational outcomes of finite element analyses. Achieving an optimal balance between computational efficiency and precision poses a notable hurdle in these calculations. To this end, Zhao et al.’s specimen S6 [36] was chosen as the benchmark for developing finite element models featuring varying mesh resolutions, as depicted in Figure 5. Given the necessity for accurate interfacial dynamics and the simulation of steel buckling phenomena, the dimensions of steel elements were halved compared to those of concrete elements. According to the data presented in Figure 6, a concrete element size equivalent to one-quarter of the wall thickness was adopted, aligning with the findings reported by Wang et al. [19,20].

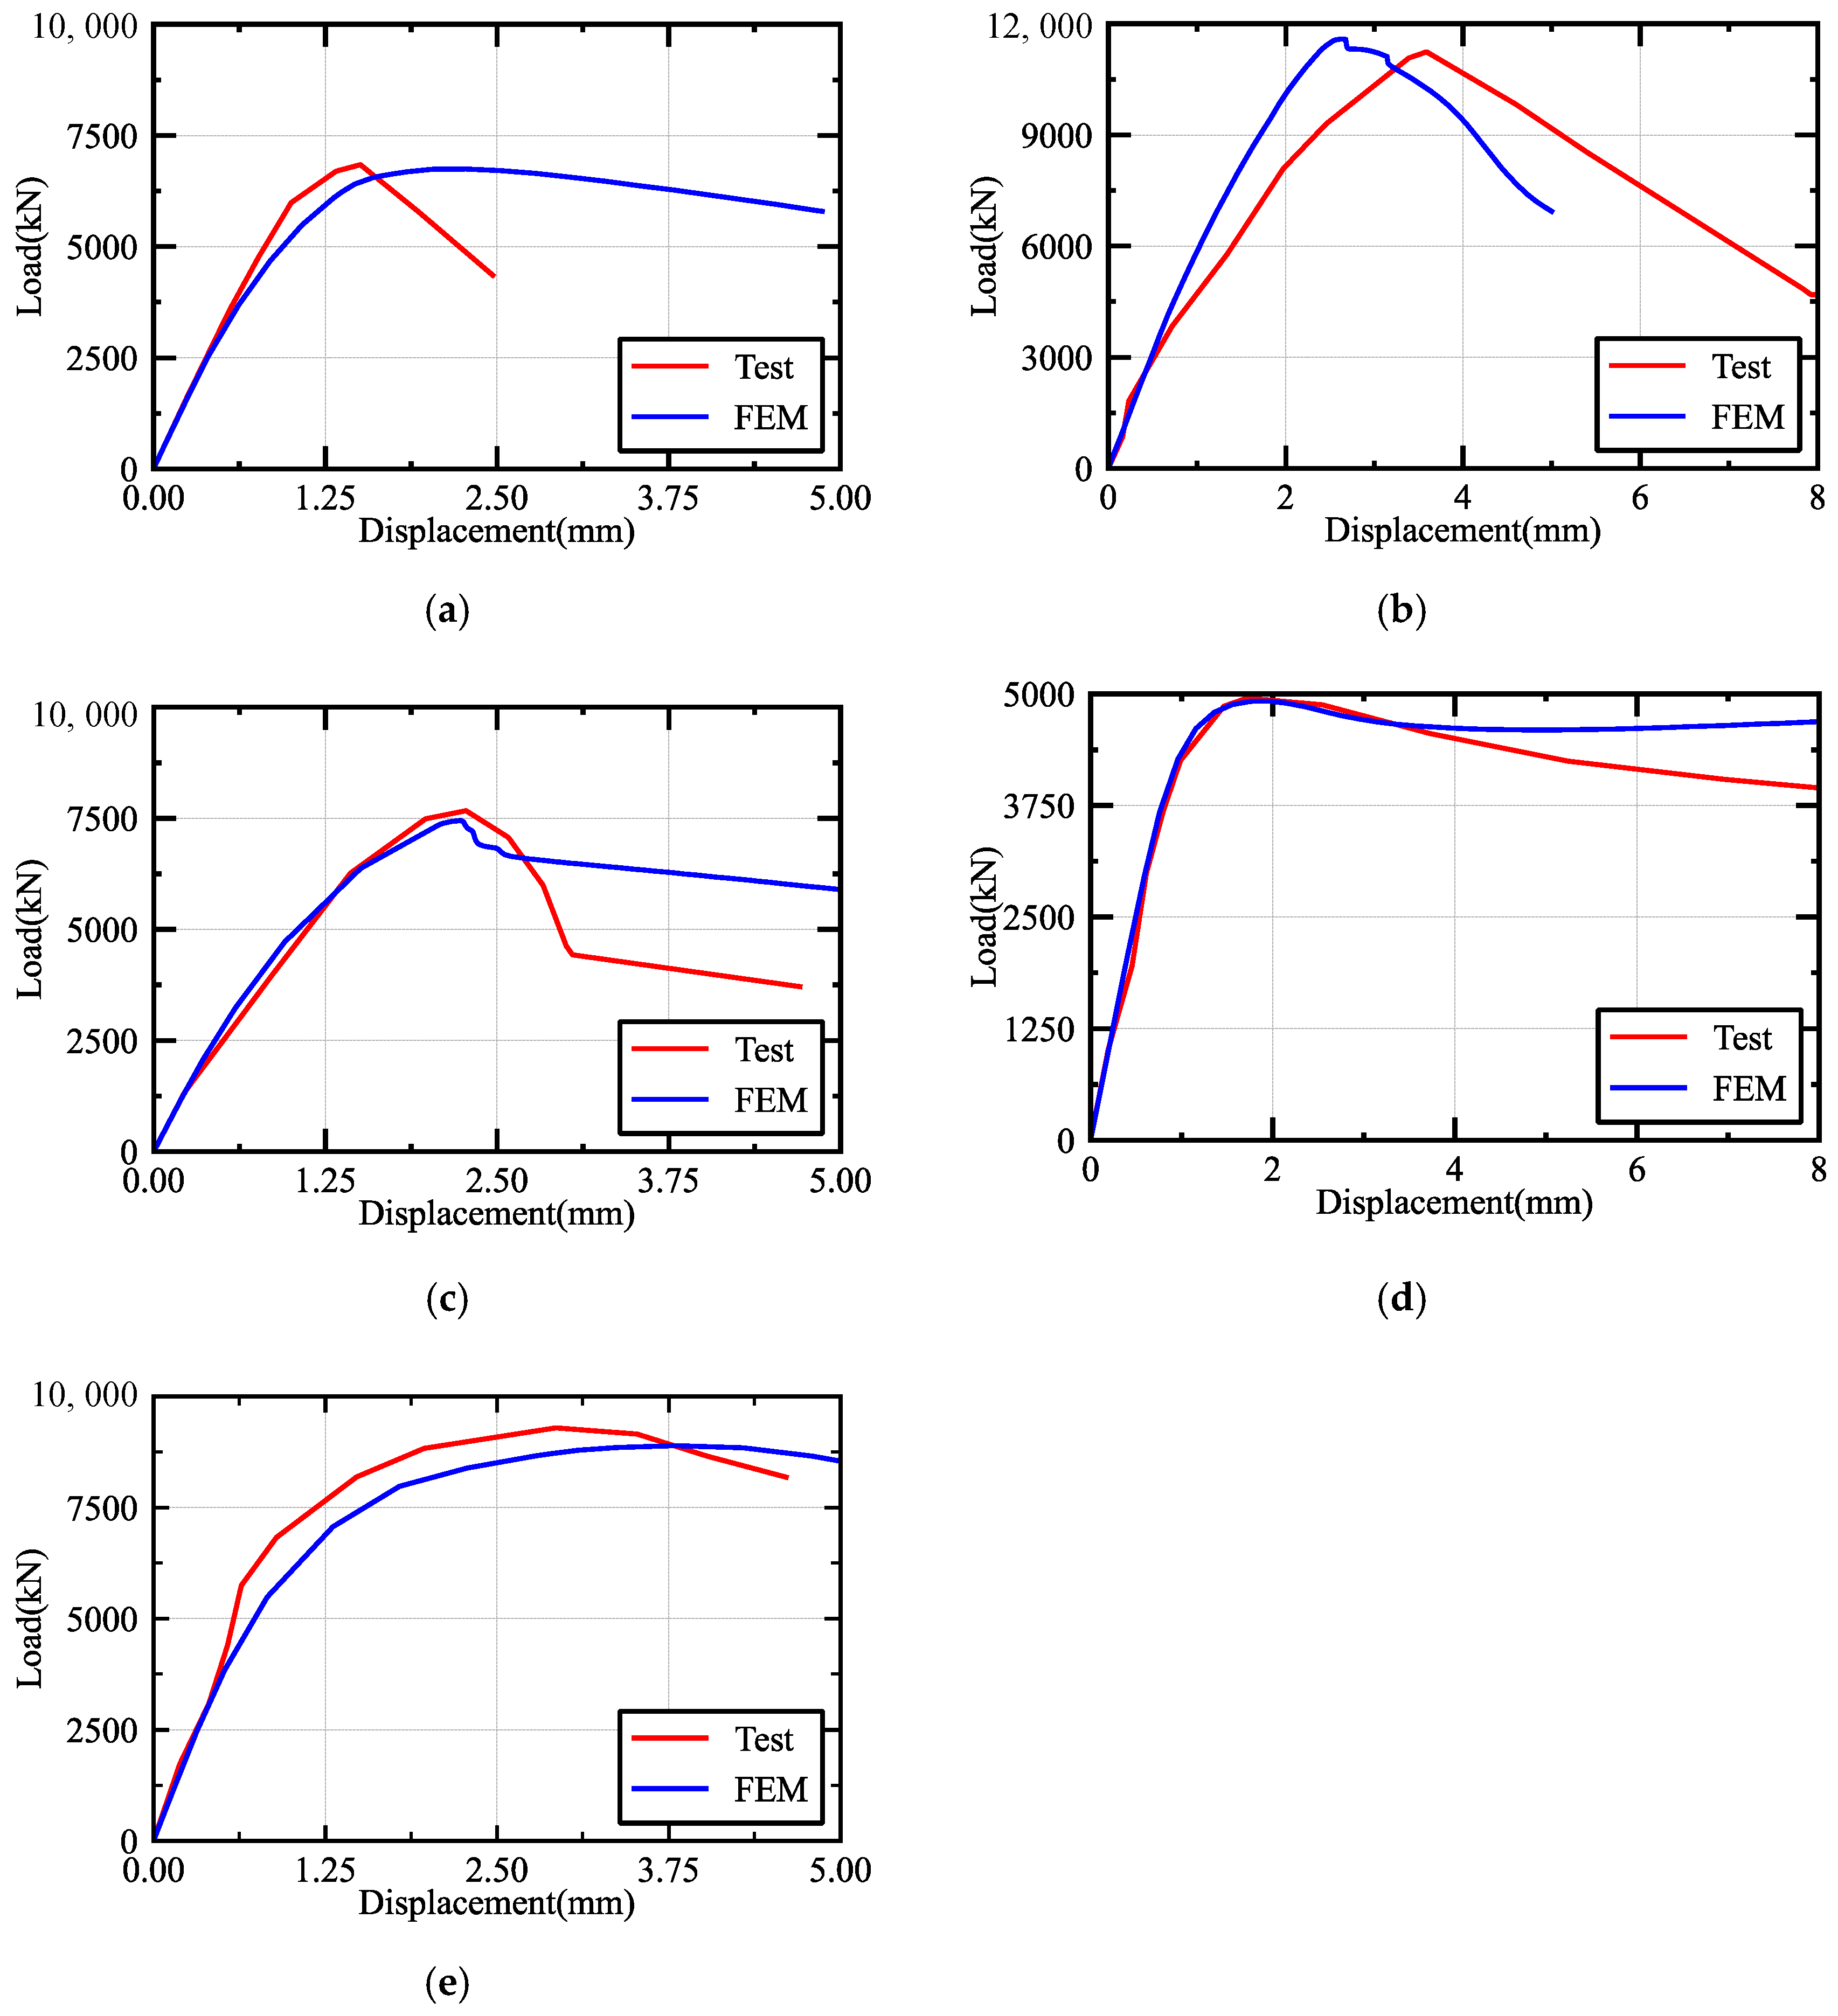
3.3. Model Validation

This paragraph introduces the validation process of the model, utilizing samples of double steel plate–concrete composite walls enduring axial compression, sourced from five earlier investigations [18,29,30,31,36]. Figure 7 illustrates a comparison between the experimental load–displacement relationship of each specimen and those anticipated by the FE analysis. Notably, specimen S6 from Zhao Y [36] featured bolt connectors, while specimen CSW-1 was MDSCCS from Guo [18]; the connectors employed in the other specimens consisted of studs. The presented model exhibited remarkable accuracy, precisely estimating crucial mechanical parameters.

4. Single-Parameter Influence Analysis of Constraint Effect of MDSCCS

This section undertakes a parametric modelling study to investigate the confining behavior of multi-cavity composite structures and consolidates the effects of various design parameters on the confinement of composite walls. The parameters under scrutiny encompass wall dimensions (thickness, depth, and height), steel plate parameters (thicknesses of different steel plates), material strength attributes (concrete and steel strengths), and cavity parameters (number of cavities), amounting to 11 factors in total. For a parametric analysis, a benchmark model is indispensable. Consequently, two benchmarks were chosen: MDSCCS-1, a five-cavity composite wall with elevated steel content, and MDSCCS-2, a four-cavity wall with reduced steel content. Specific parameter details are tabulated in Table 1. Using MDSCCS-1 and MDSCCS-2 as benchmarks, parametric assessments were executed. MDSCCS-1: approximately 8.5%, with web and flange thicknesses of 20 mm and five cavities. MDSCCS-2: approximately 4.1%, with web and flange thicknesses of 10 mm and four cavities.
Quantifying the confinement necessitates standardized metrics. This research introduces the confinement amplification factor, k, as a measure of confinement magnitude. k represents the ratio of confined concrete strength to unconfined concrete strength. During modeling, only the forces and deformations within the composite structure’s concrete segment were analyzed. In parallel, a pure concrete specimen of identical dimensions was created. Peak force and deformation from both specimens were recorded to compute peak stresses and strains. The impact of confinement was assessed by dividing the peak load of the composite specimen by its peak displacement.

4.1. Parametric Analysis of Geometric Size

This part conducted the parametric analysis about geometric sizes (including width, thickness, and height) to investigate the influence of different geometric sizes on the constraint effect. The height was from about 1500 millimeters to 7200 millimeters (with a shear–span ratio of from 0.5 to 2.5). Figure 8 shows the difference in the stress–strain curves and the constraint effect of MDSCCS. Regardless of height, both models exhibited a phenomenon in which the peak stress was larger at lower shear–span ratios. This was because the compressive strength of pure concrete differs with geometric size.

4.1.1. Height Effect

As shown in Figure 8b, for MDSCCS-1 with a higher steel ratio, the strength magnifying factor was higher when the shear–span ratio was less than 0.6. When the shear–span ratio exceeded 0.6, the strength enhancement coefficient remained at approximately 1.23, largely unchanged with height. Similarly, Figure 8d reveals that for MDSCCS-2 with a lower steel ratio, the strength enhancement coefficient remained at approximately 1.06 across different shear–span ratios. Thus, it can be preliminarily inferred that within the common dimensions encountered in engineering, the constraint effect of the multi-cavity composite structure does not significantly vary with height.

4.1.2. Width Effect

After this, a comprehensive parametric examination of the width was undertaken. In order to preserve geometric consistency, the width of an individual cavity remained fixed, whereas both the width and the quantity of cavities were scaled up proportionally when assessing the influence of width on the confinement effect. The widths under consideration ranged from 1200 mm to 6000 mm, which corresponded to a cavity number spanning from 2 to 11 for MDSCCS-1 and from 3 to 10 for MDSCCS-2, with the shear–span ratio typically falling within the bounds of 0.5 to 2. The obtained results are depicted in Figure 9. Like the effect of the height, the higher peak stresses under wider conditions were primarily attributed to the inherent properties of concrete rather than the constraint effect. For MDSCCS-1 with varying widths, the strength enhancement coefficient slightly increased with the width. By contrast, for MDSCCS-2 with different widths, the strength enhancement coefficient remained largely unchanged with varying widths. Considering that the height and width had similar effects on the constraint effect, the following sections simultaneously analyze the width and height variations in a multi-parametric analysis.

4.1.3. Thickness Effect

In the present investigation, the thickness was adjusted between 300 mm and 900 mm, representing fractions ranging from 1/10 to 3/10 of the overall width. The results are depicted in Figure 10. Specifically, for the MDSCCS-1 variant with an elevated steel proportion, a notable decline was observed in the strength amplification factor as the thickness increased from 300 mm to 600 mm. Nevertheless, beyond this 600 mm threshold, the strength amplification factor exhibited minimal variation. Notably, the 600 mm mark aligns with the scenario where the width of a solitary cavity matches the structural thickness. Consequently, maintaining a single cavity width that is at least equal to the structural thickness is crucial for preserving an adequate confinement effect.

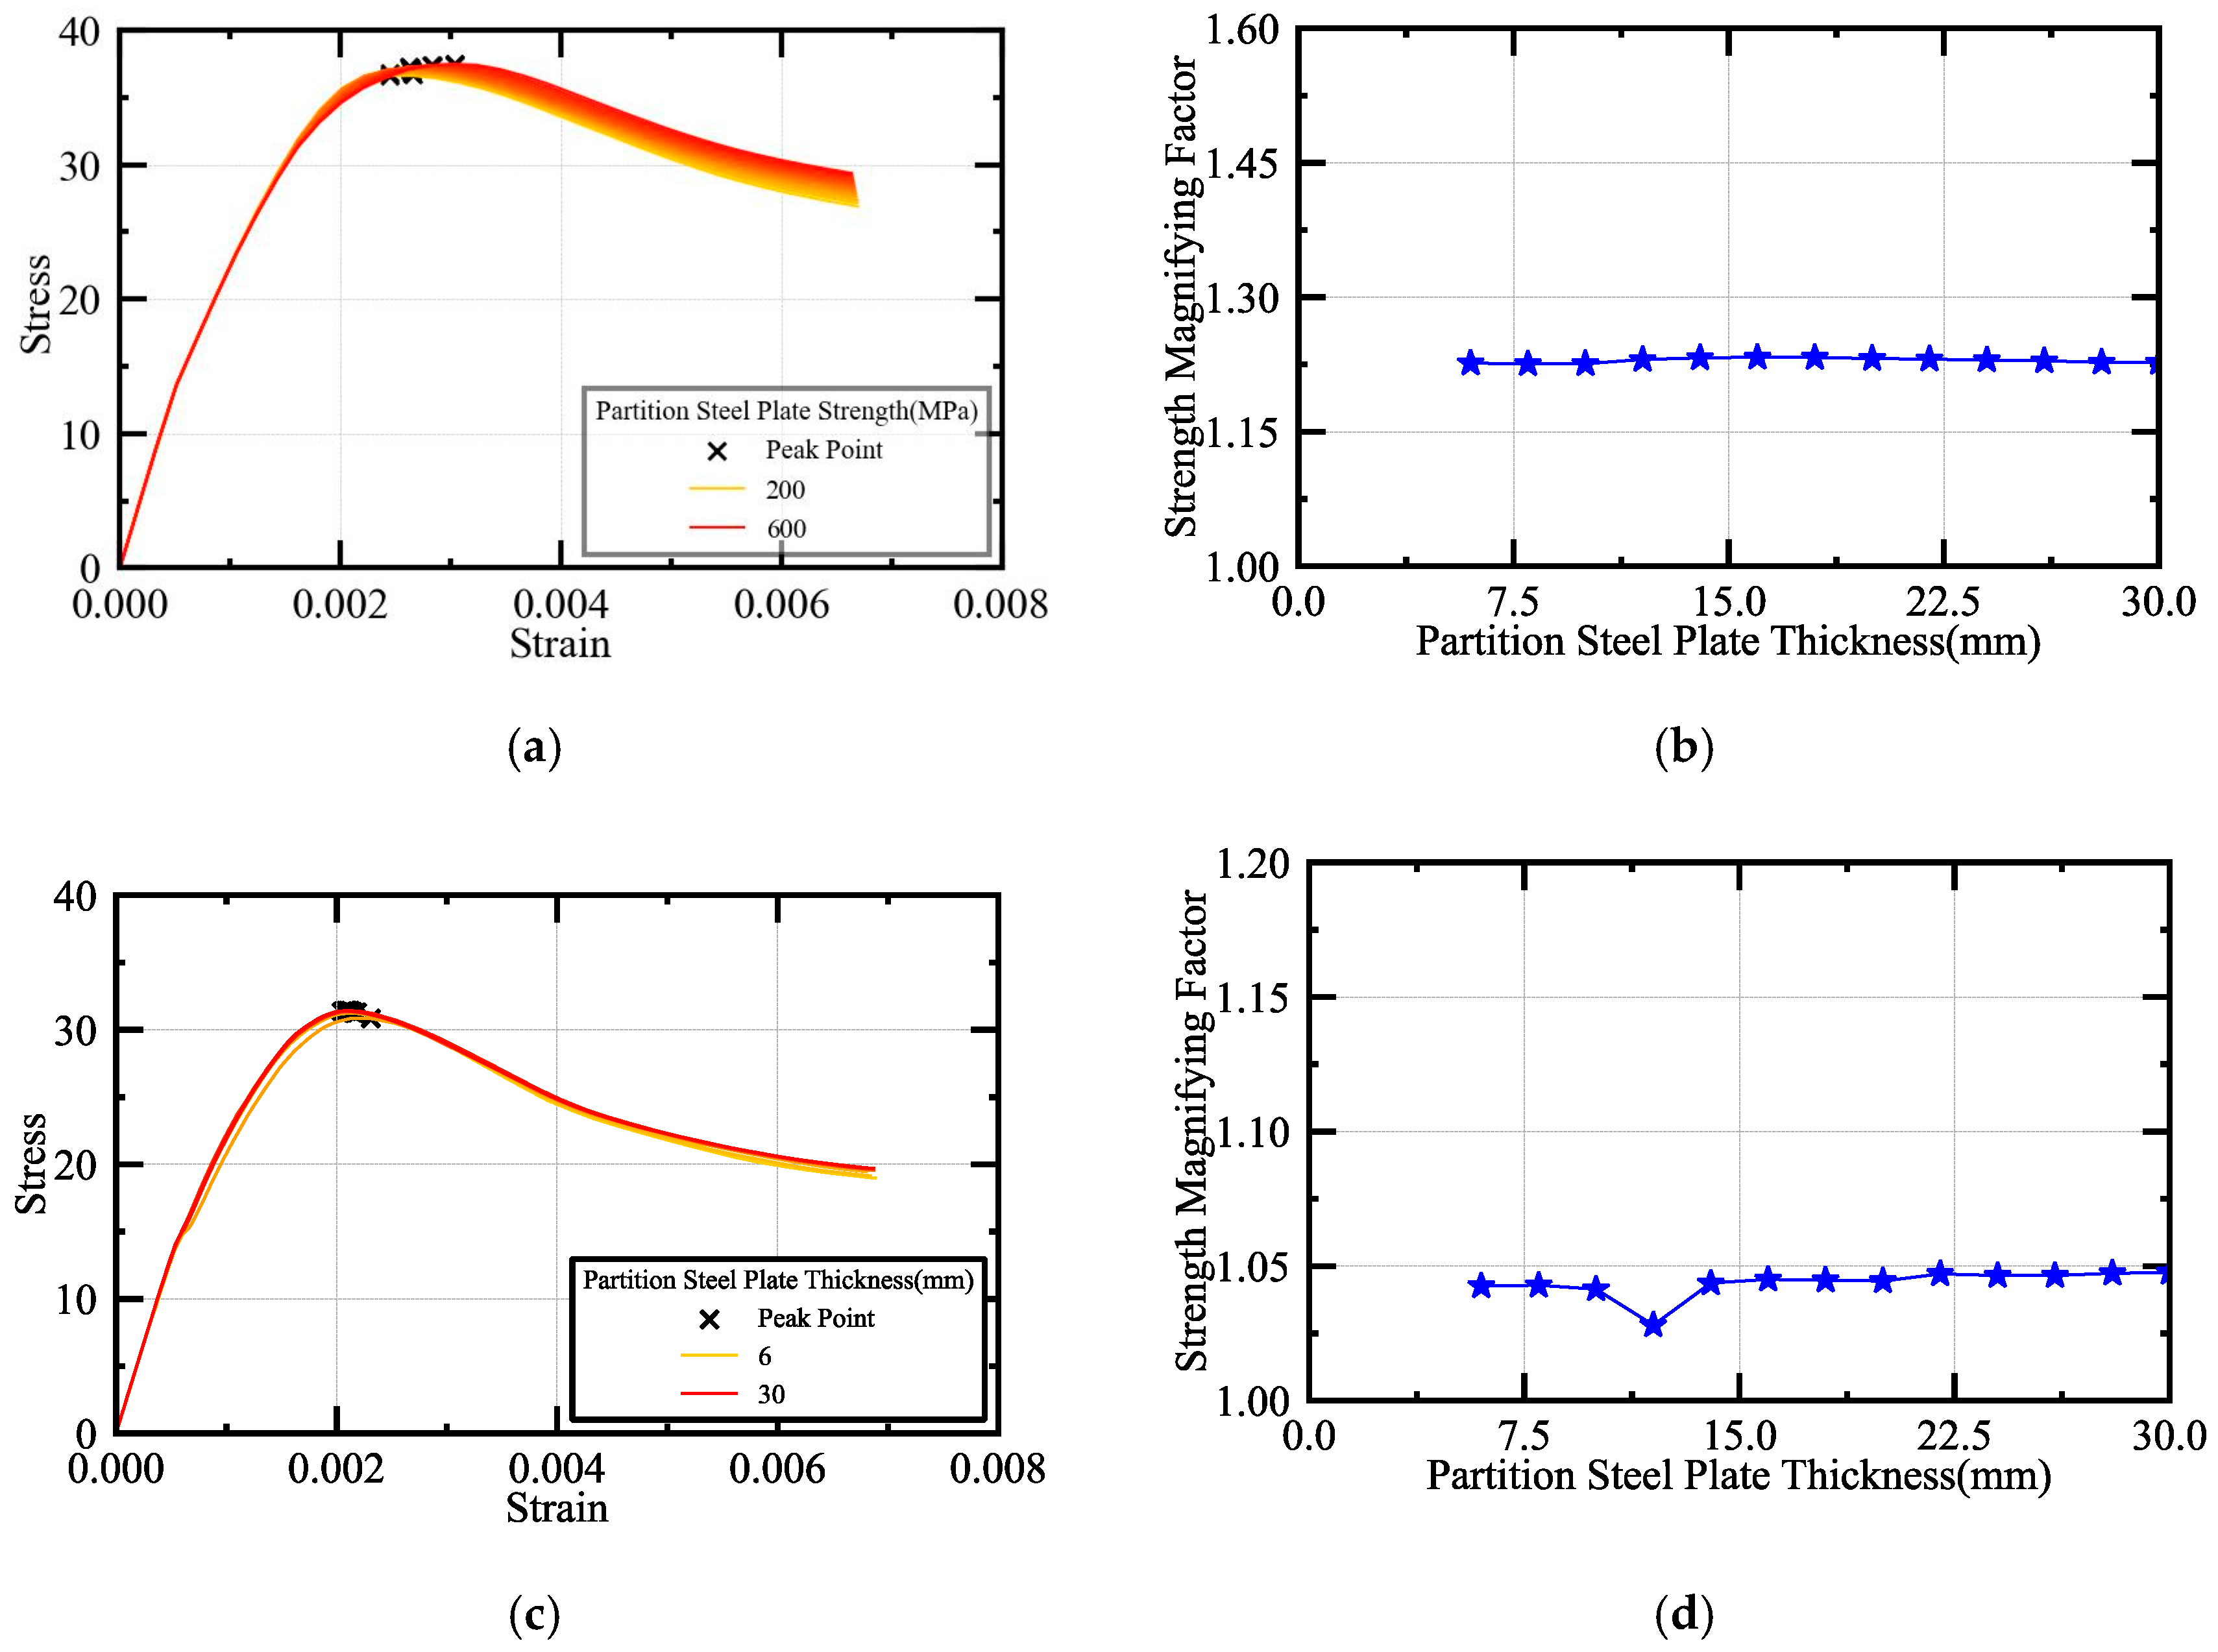
4.2. Parametric Analysis of Steel Thickness

This section undertakes a parametric examination of the thicknesses of various steel components, notably the web, flange, and diaphragm, all constructed from three diverse steel plates. Utilizing the benchmark models MDSCCS-1 and MDSCCS-2, a series of batch modeling exercises were conducted by modulating the steel thickness parameters. Our investigation began with an exploration of the impact of web thickness. Figure 11 illustrates the outcomes of this parametric analysis, where the web thickness was adjusted within a spectrum of 10 to 40 mm across both benchmark models. Notably, the web thickness exerted a substantial influence on the load-bearing capacity and ultimate strain of the multi-cavity composite walls. Thicker webs imposed stronger confinement, thereby augmenting the ultimate strain and stress of the concrete. However, these effects were contingent upon the structural dimensions. MDSCCS-1, characterized by a greater number of steel configurations, demonstrated a more marked elevation in the strength enhancement coefficient. Conversely, MDSCCS-2, possessing fewer steel configurations, experienced a modest strength enhancement coefficient of approximately 1.15, even with increased steel thickness.
Figure 12 depicts the outcomes of the parametric study focusing on flange thickness. A series of batch modelling exercises were performed, where the flange thickness in the two benchmark models was varied from 10 mm to 40 mm. Consequently, stress–strain relationships for the various models were generated. The findings revealed that while the flange thickness did exert an influence on the confinement effect, its impact was relatively lesser compared to that of the web thickness. Specifically, in the MDSCCS-1 model, the peak stress observed for a 40 mm thick flange exceeded that of a 10 mm thick flange by approximately 10%. Similarly, in the MDSCCS-2 model, the peak stress for a 40 mm thick flange was 5% greater than that of a 10 mm thick flange. However, in terms of peak strain, there was minimal variation among flanges of differing thicknesses.
Figure 13 presents the findings of the parametric study examining the impact of diaphragm thickness. A series of batch models were developed, with diaphragm thicknesses ranging from 6 mm to 30 mm in both the MDSCCS-1 and MDSCCS-2 configurations. Across both models, the effect of diaphragm thickness on the concrete infill proved to be minimal. Specifically, the strength enhancement coefficient remained relatively constant at approximately 1.23 for MDSCCS-1 and 1.05 for MDSCCS-2. Consequently, the diaphragm thickness does not play a primary role in determining the constraint effect and can be selected primarily based on constructional considerations.

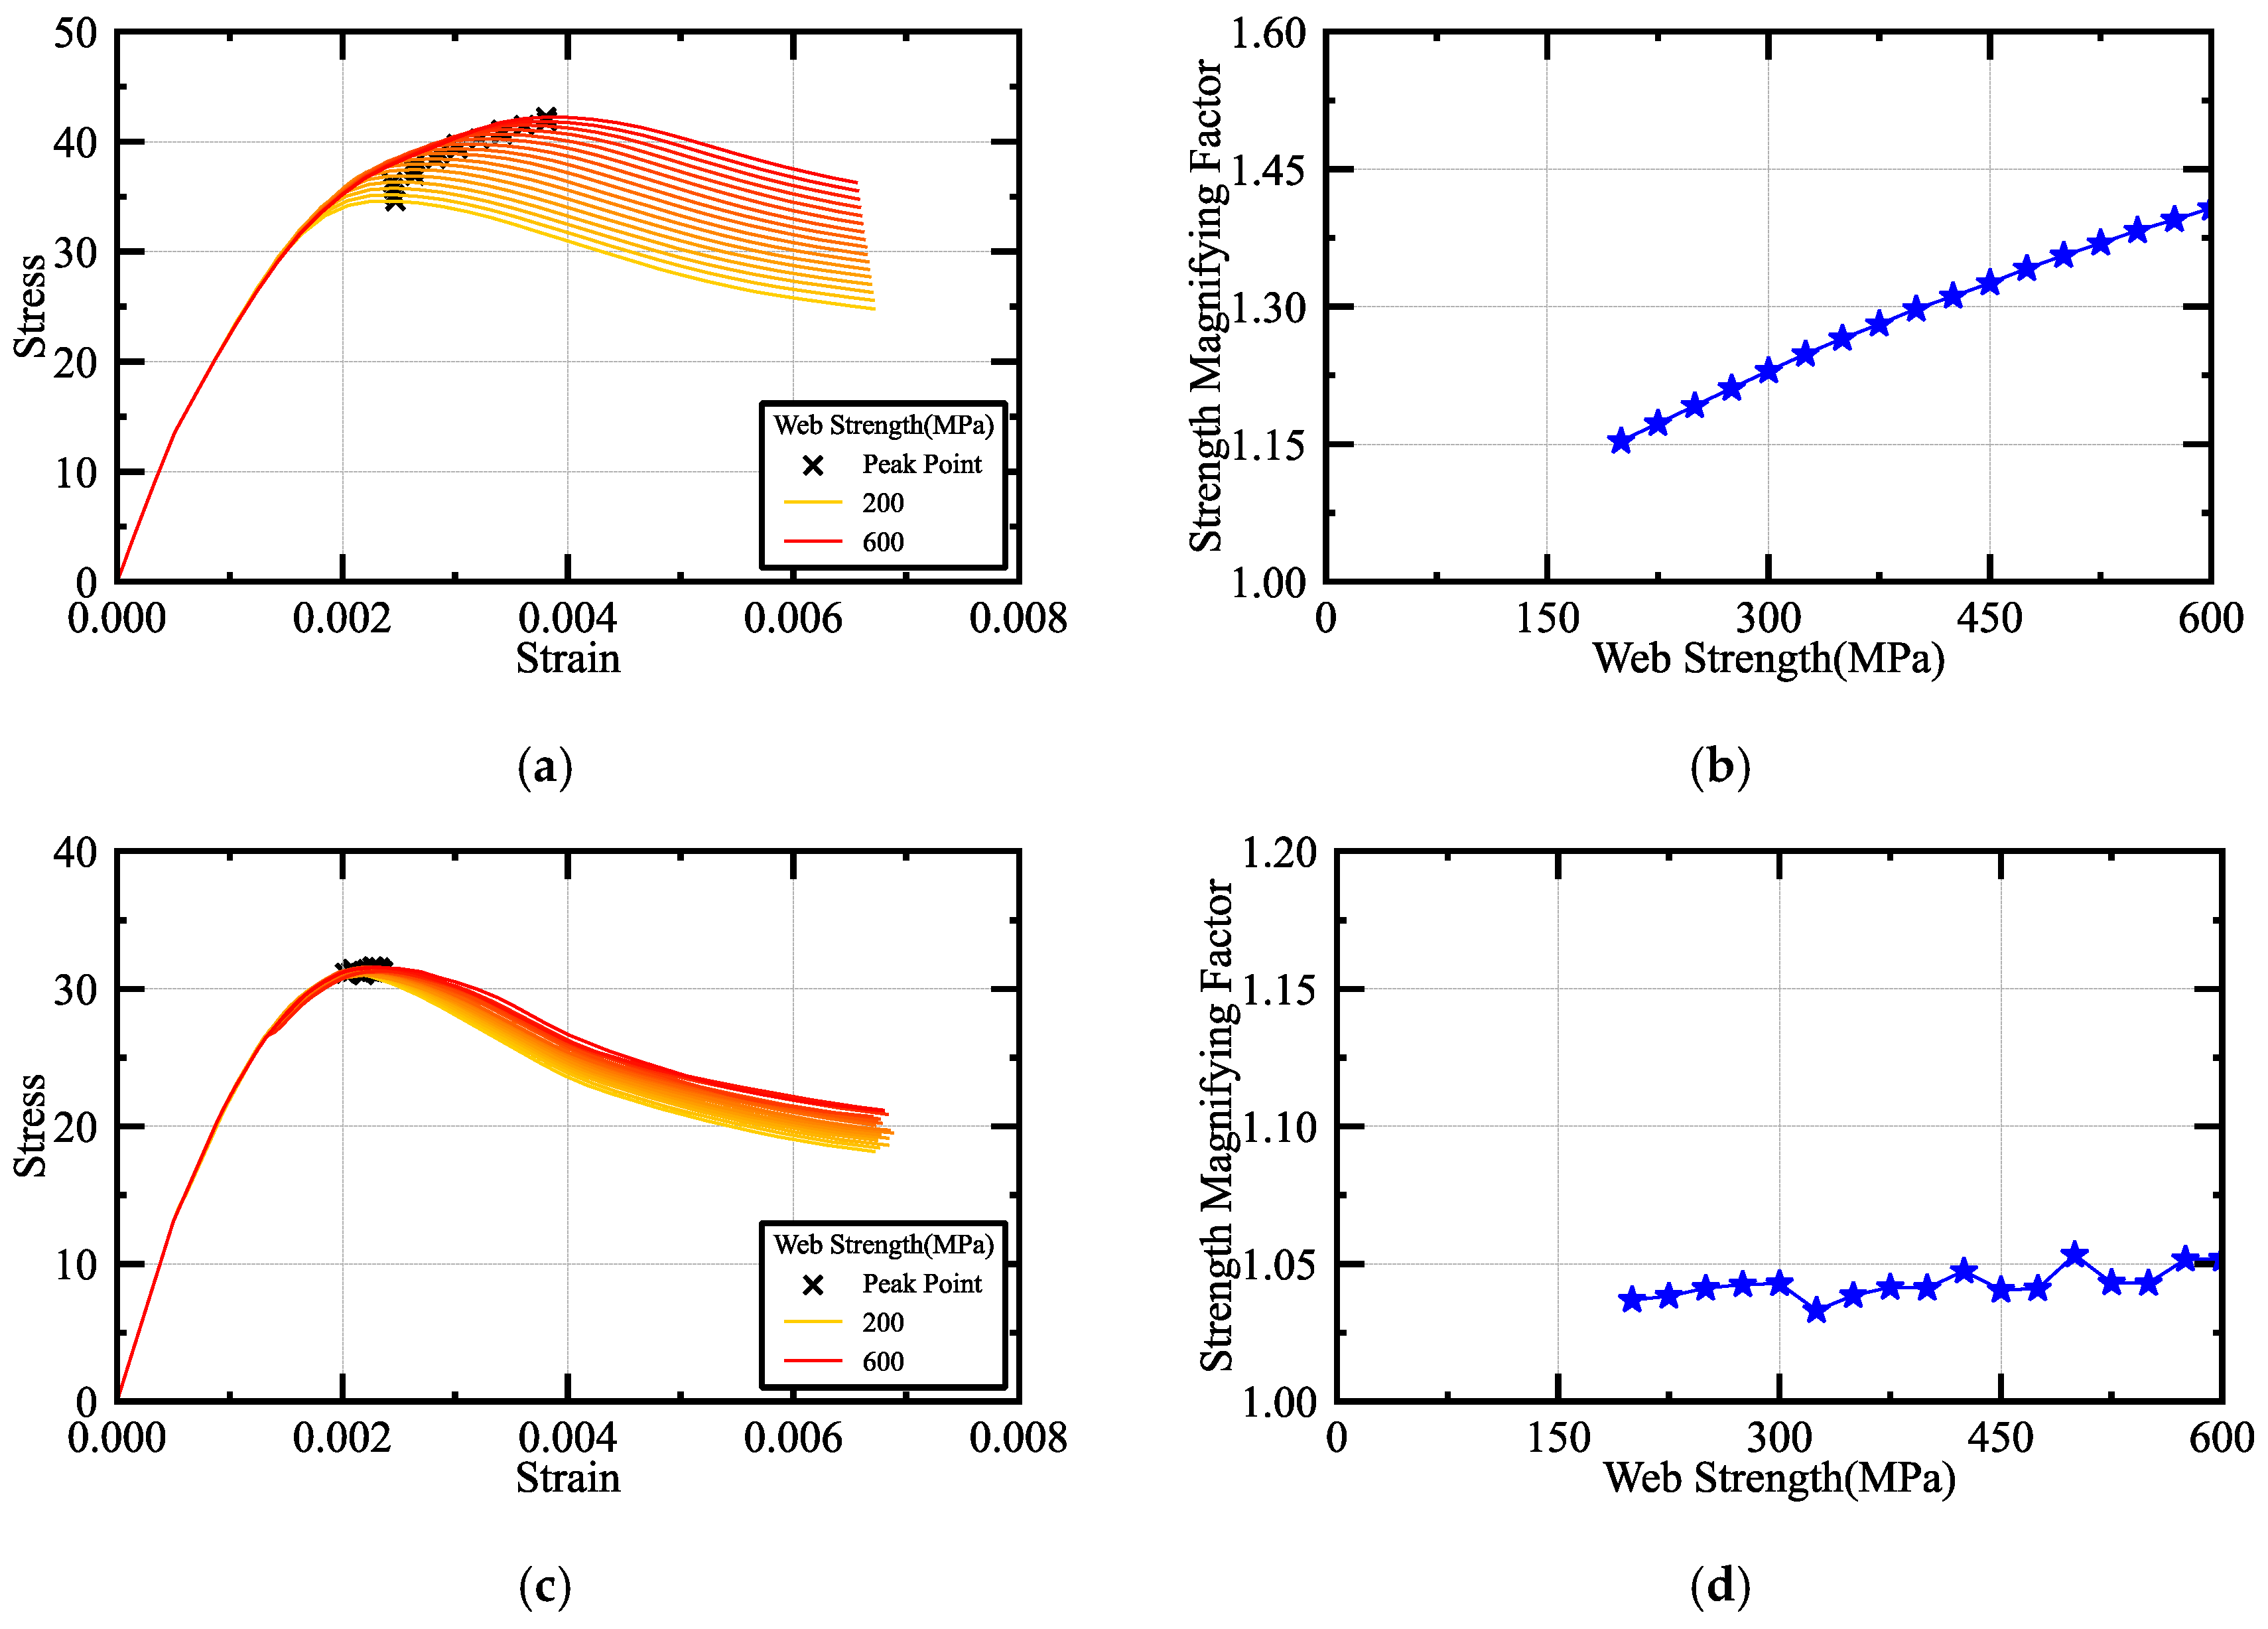
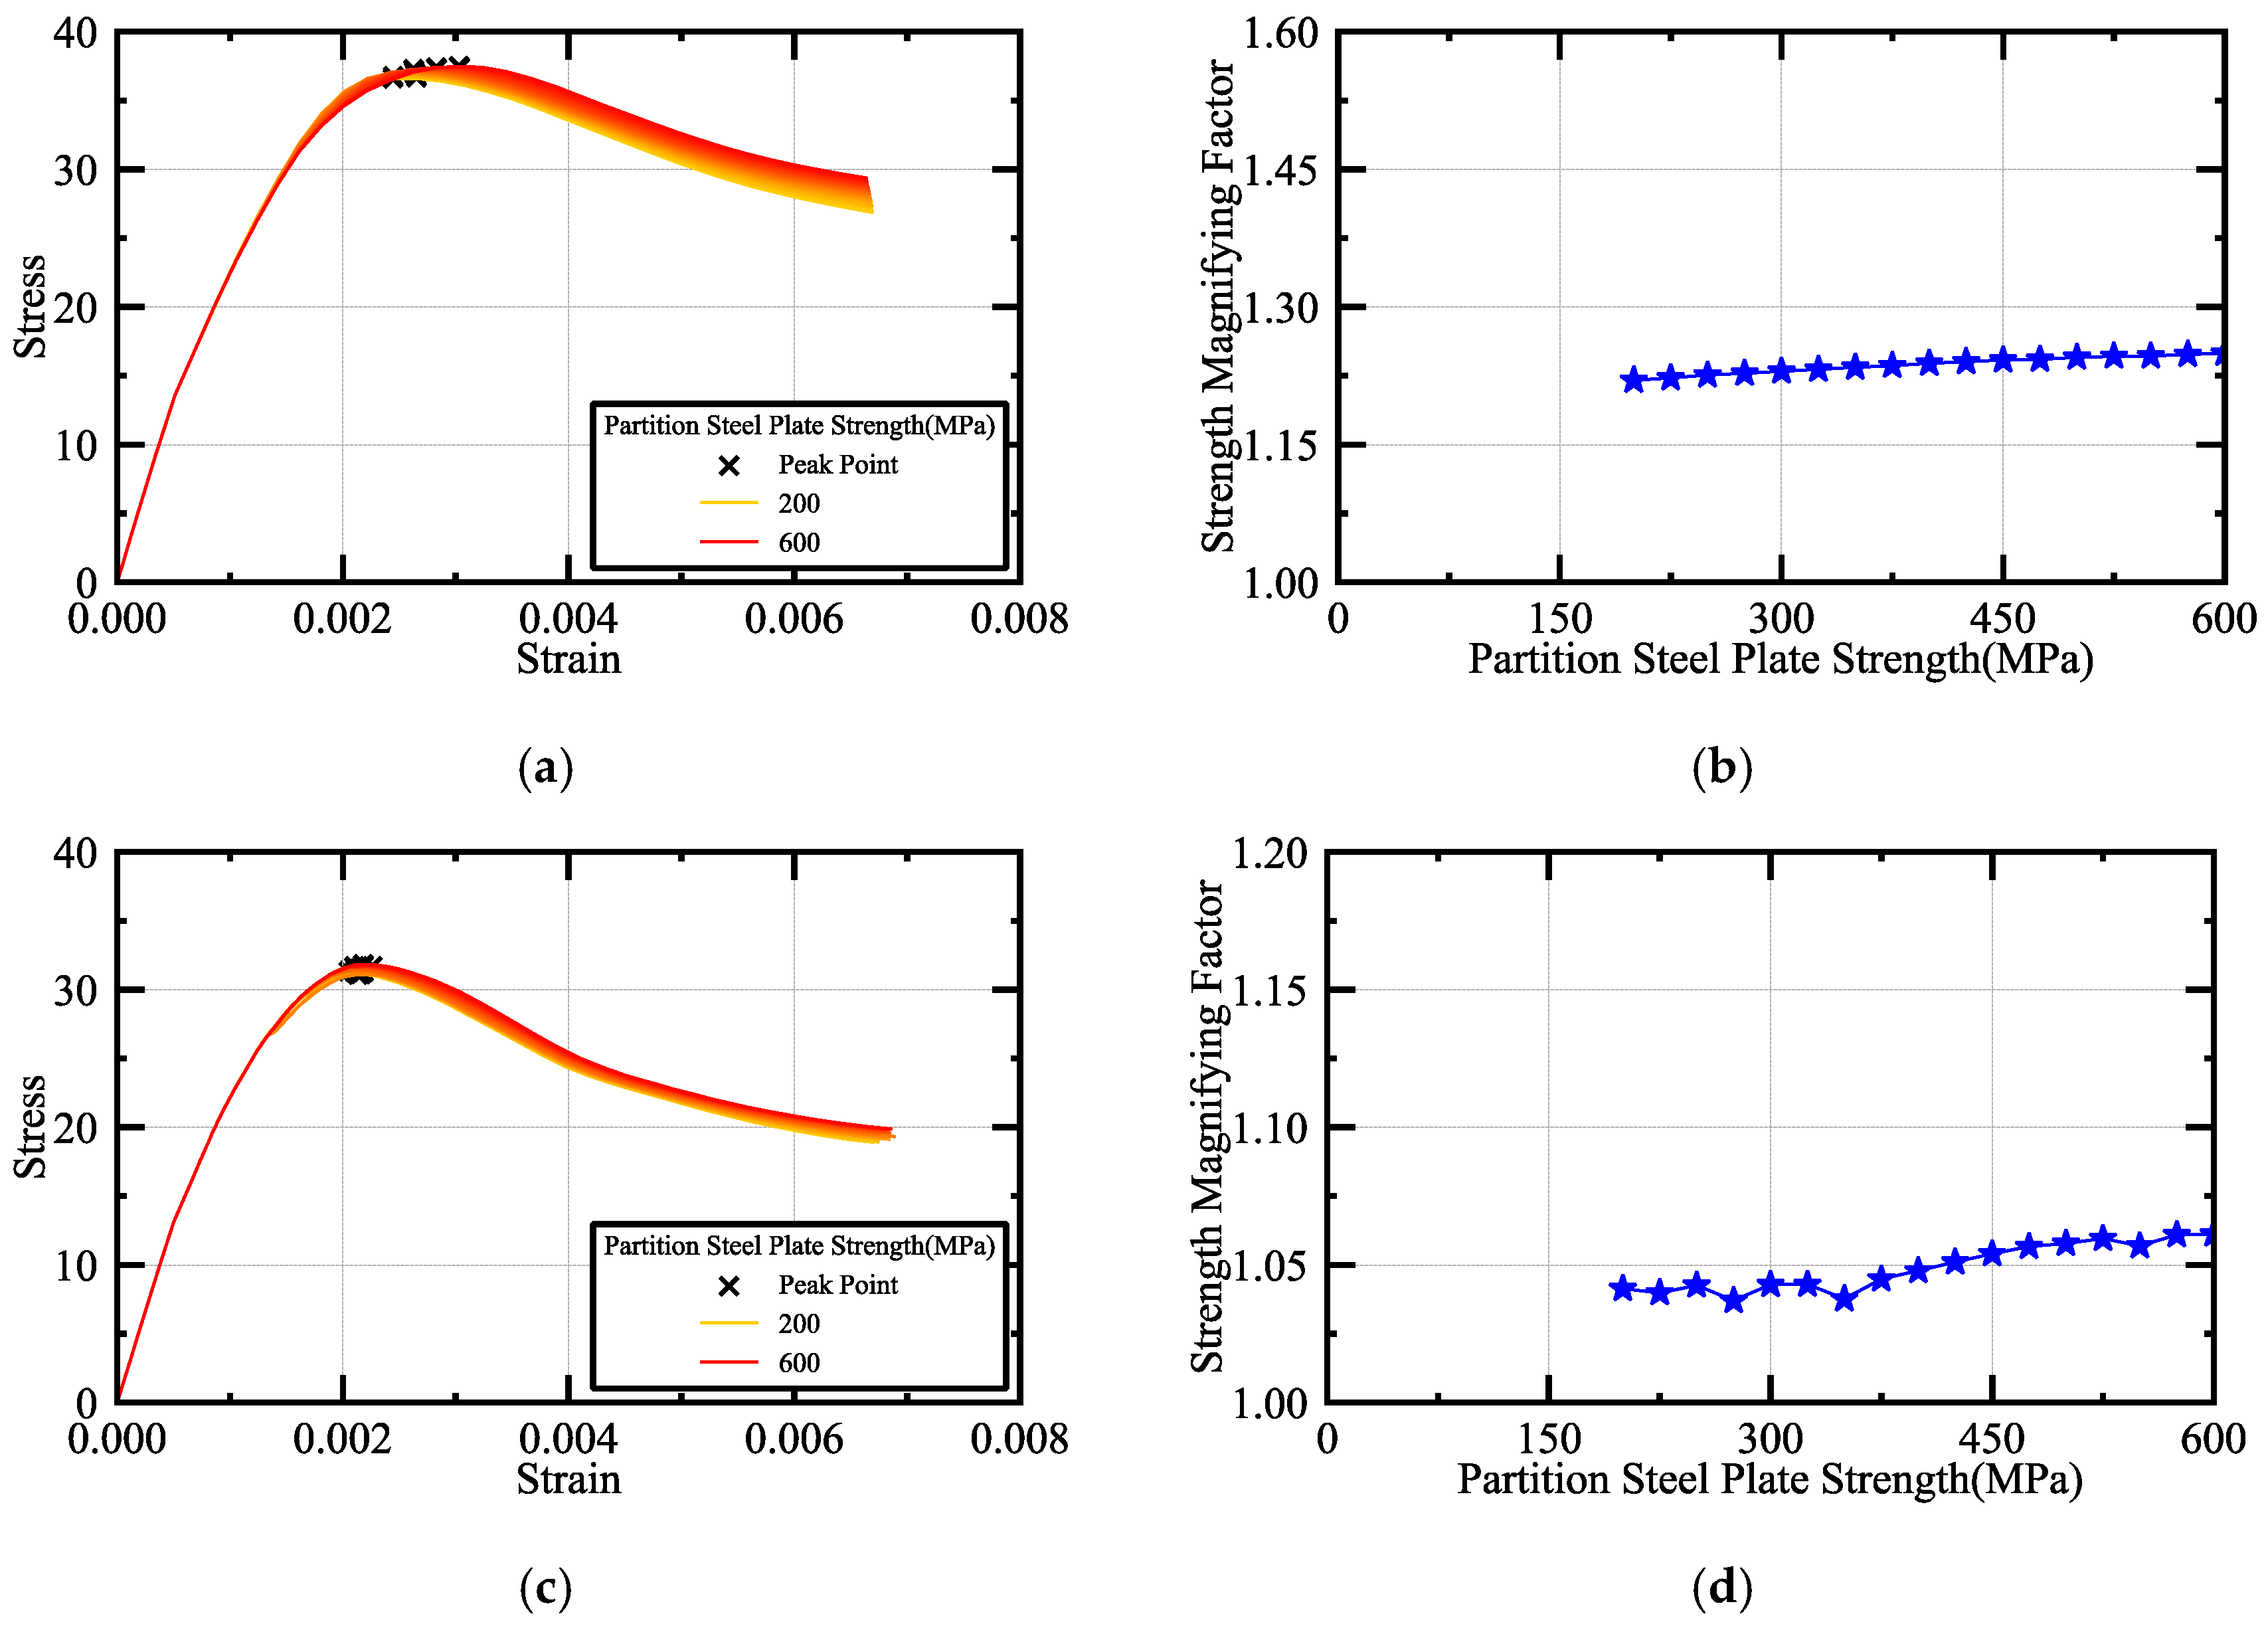
4.3. Parametric Analysis of Steel Strength

This part focuses on the parametric analysis of the steel strength, encompassing web plates, flanges, and diaphragms, each belonging to a different steel category. Utilizing the benchmark models, MDSCCS-1 and MDSCCS-2, a series of batch models were created by altering the steel strength. The results of this parametric analysis, with web plate strength ranging from 200 MPa to 600 MPa, are depicted in Figure 14. This range covers the typical strength grades of commonly utilized steel materials. Specifically, Figure 14a illustrates the stress–strain relationship for MDSCCS-1 under varying web plate thicknesses. An augmentation in web plate steel thickness led to a notable augmentation in peak stress and an increase in peak strain for the concrete. Conversely, for MDSCCS-2, which incorporated thinner steel plates, only a marginal enhancement was noted, hinting at potential constraints from other factors influencing the constraint effect.
Figure 15 presents the outcomes of the parametric study where the flange strength was adjusted between 200 MPa and 600 MPa. In the case of multi-cavity composite structures with varying configurations, the fluctuations in flange strength had negligible implications for their overall mechanical characteristics. Regardless of the flange strength levels, the strength improvement factors for the MDSCCS-1 and MDSCCS-2 models remained relatively stable at approximately 1.23 and 1.05, respectively.
Figure 16 illustrates the results of the parametric investigation where the diaphragm strength was adjusted between 200 MPa and 600 MPa. In the MDSCCS-1 model, as the diaphragm strength increased, there was an enhancement in the concrete’s confinement effect within a limited range of approximately 4%. In contrast, the MDSCCS-2 model, characterized by a lower steel ratio, demonstrated comparable performance across the range of diaphragm strengths, with peak stresses differing by merely around 1% under different diaphragm strengths.

4.4. Parametric Analysis of Concrete Strength

In the context of multi-cavity composite structures, the model’s concrete strength was assumed to fall within a typical range, varying from 20 MPa to 60 MPa. Figure 17 presents the findings, which indicate that as the concrete strength increased, an inverse correlation emerged between the MDSCCS-1 and MDSCCS-2 models and their respective strength enhancement coefficients. Despite variations in the specific numerical values, the overall trends remained consistent. Consequently, it was observed that an augmentation in concrete strength led to a decrease in the strength enhancement coefficient.

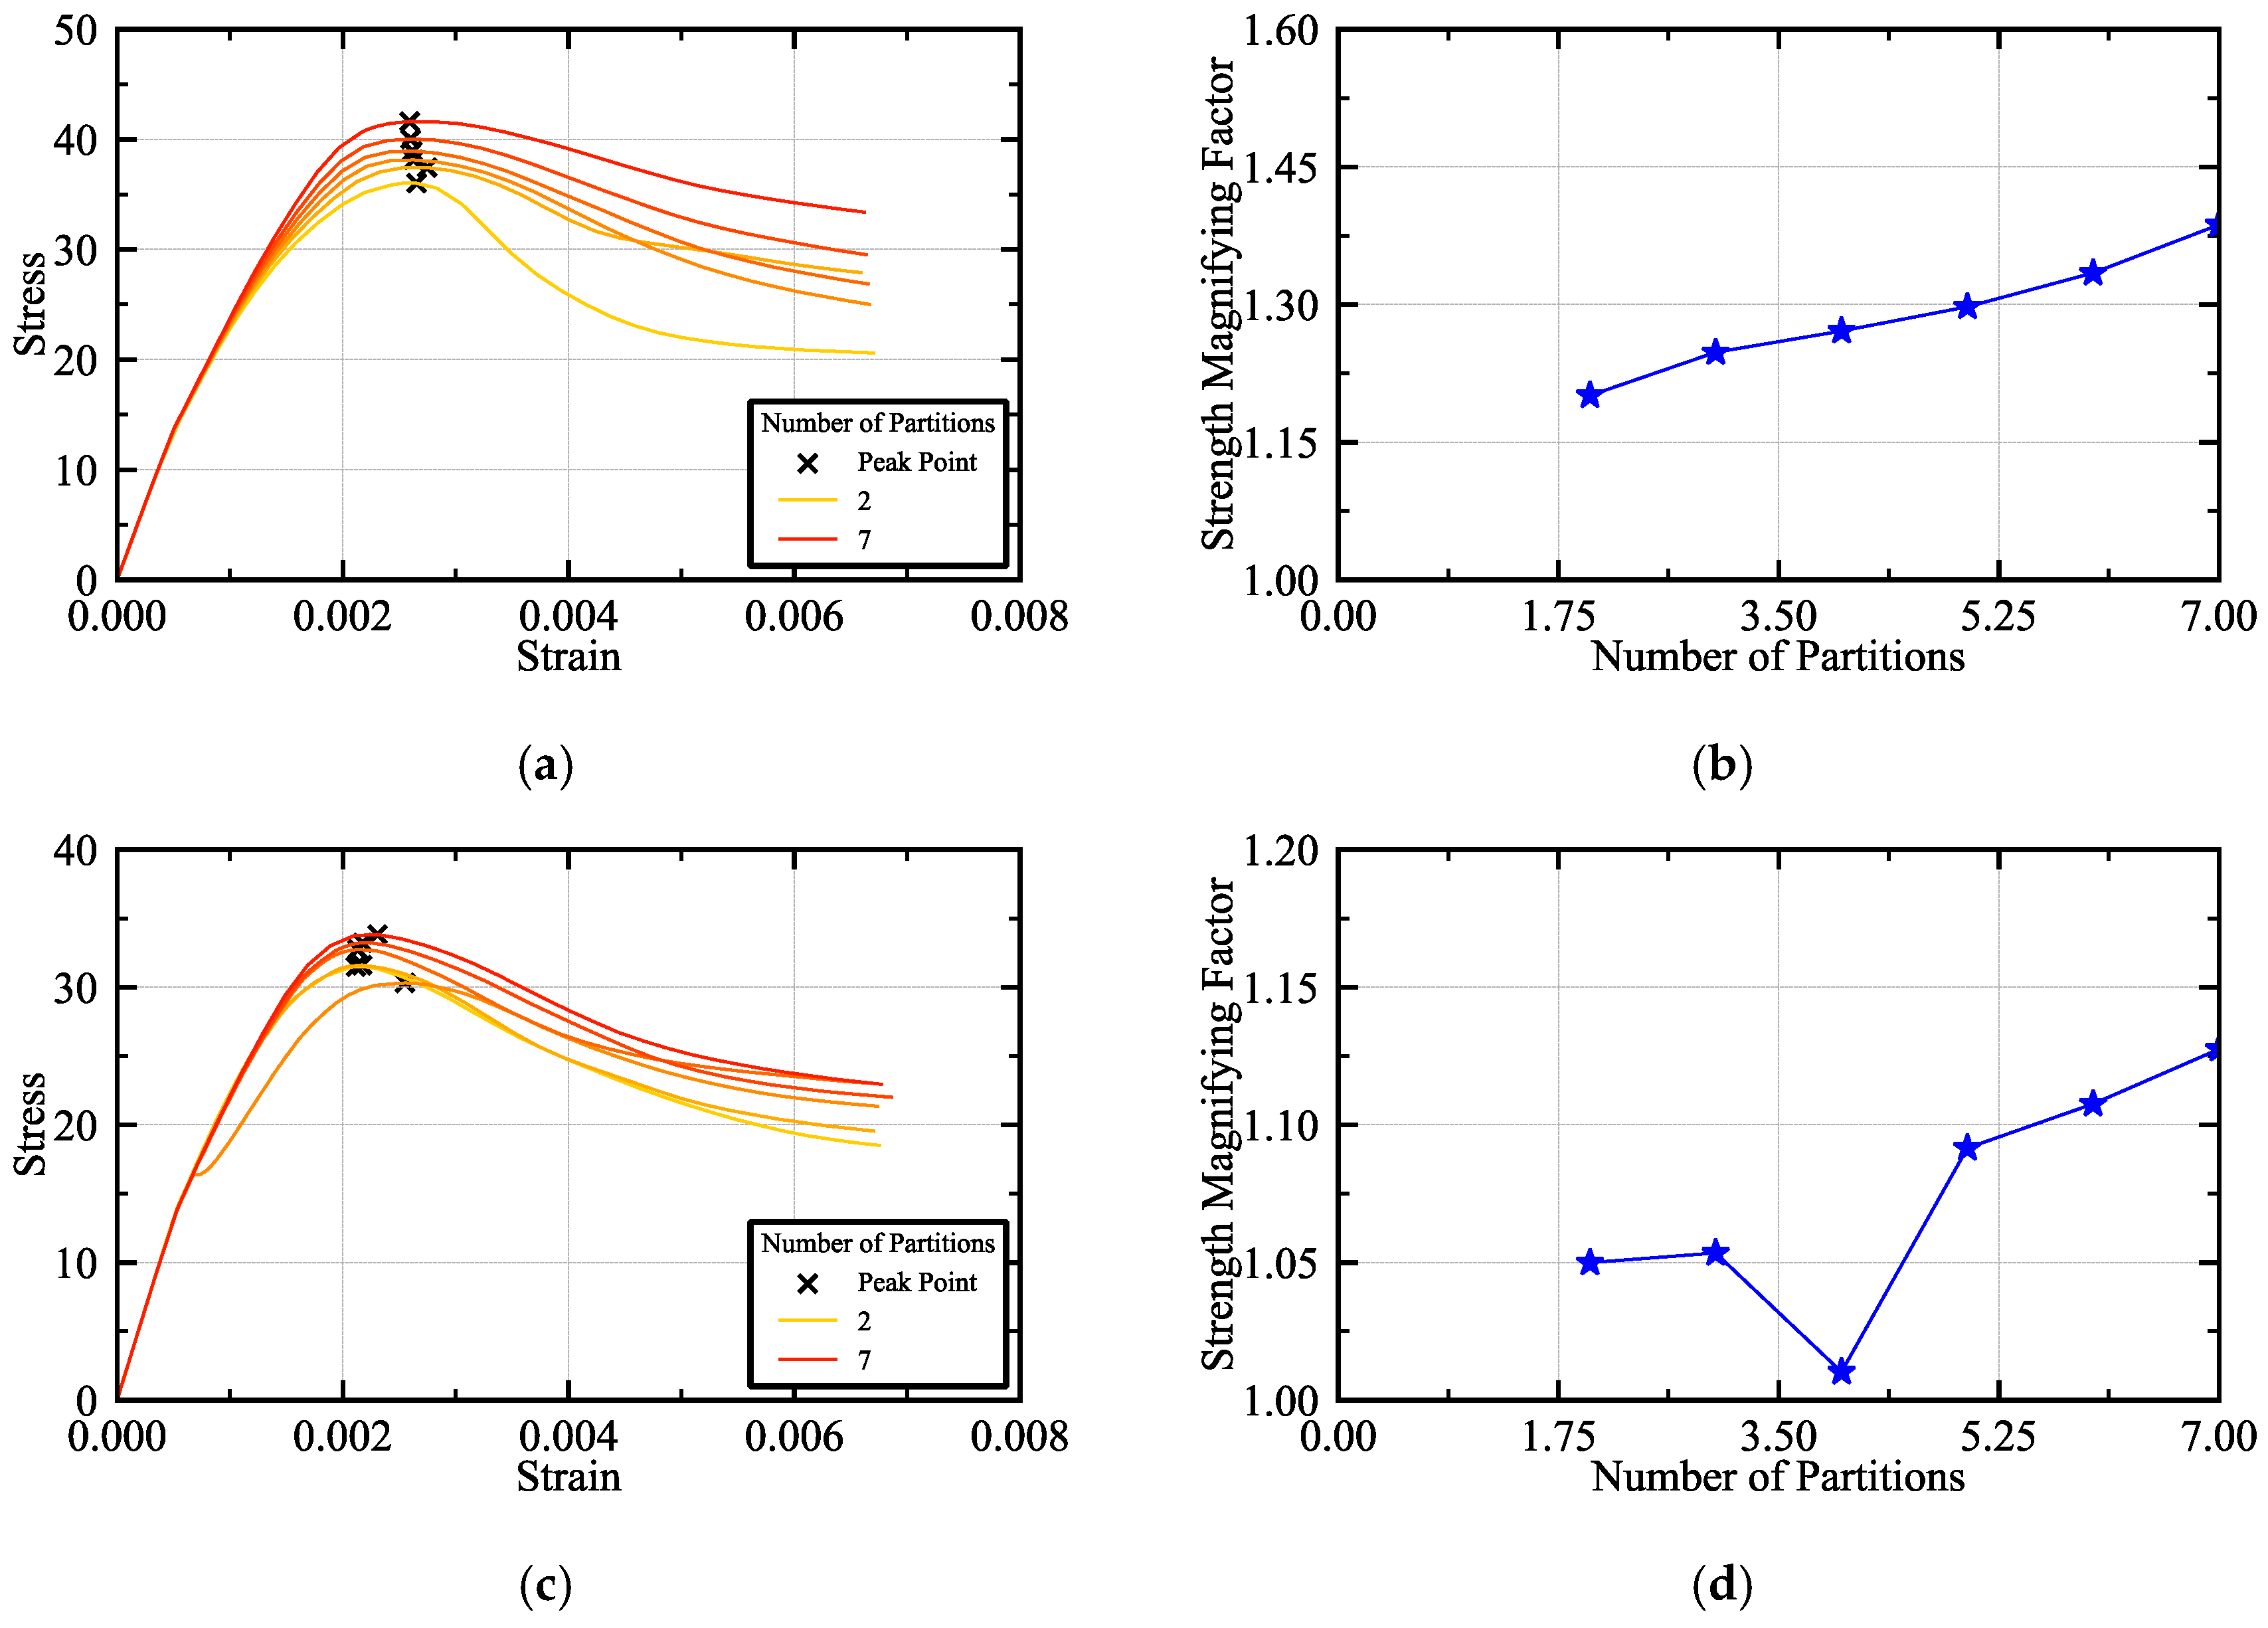
4.5. Parametric Analysis of Cavity Number

Considering the modelling conclusions presented previously, the width of a single cavity is recommended to be not less than the thickness of the structure. Consequently, in modelling and analyzing the number of cavities, the thicknesses of the two baseline models were reduced to 400 mm, while all other parameters remained unchanged. Specifically, with the geometric dimensions remaining constant, the cavity number was varied from two to seven. Figure 18 shows the analysis results. For the MDSCCS-1 model, the strength enhancement coefficient increased with the number of cavities, with the coefficient increasing by approximately 0.2 for the seven-cavity structure compared with the two-cavity structure. A similar trend was observed for the MDSCCS-2 structure, where the strength enhancement coefficient increased by approximately 0.07 from two to seven cavities. Thus, the number of cavities significantly affects the constraint performance.

4.6. Summary of Single-Factor Analysis

This section undertakes a parametric analysis of eleven factors influencing multi-cavity composite structures, comprising three geometric dimensions, six steel material attributes, one concrete strength aspect, and one aspect related to cavity number. The analysis results show that width and height exhibited comparable influence patterns, suggesting a correlation between the strength enhancement coefficient and the shear–span ratio. Conversely, the thickness’s impact on the structure was negligible and warrants further scrutiny in subsequent multi-factorial analyses. Within steel materials, steel at the same location demonstrated similar influence patterns in terms of thickness and strength; however, for steel at disparate locations, web-related parameters had the most prominent influence on the restraint effect, whereas flange and diaphragm-related parameters had lesser impacts. Nevertheless, to ensure construction requirements, similar configurations for steel at different locations should be adopted during the design phase. Additionally, the impact of cavity count necessitates further investigation. Subsequent multi-factorial modeling analyses will establish comprehensive indicators accounting for the influence of various parameters.

5. Multiple Parametric Analysis of Constraint Effects in Multi-Cavity Double Steel Plate–Concrete Composite Structures

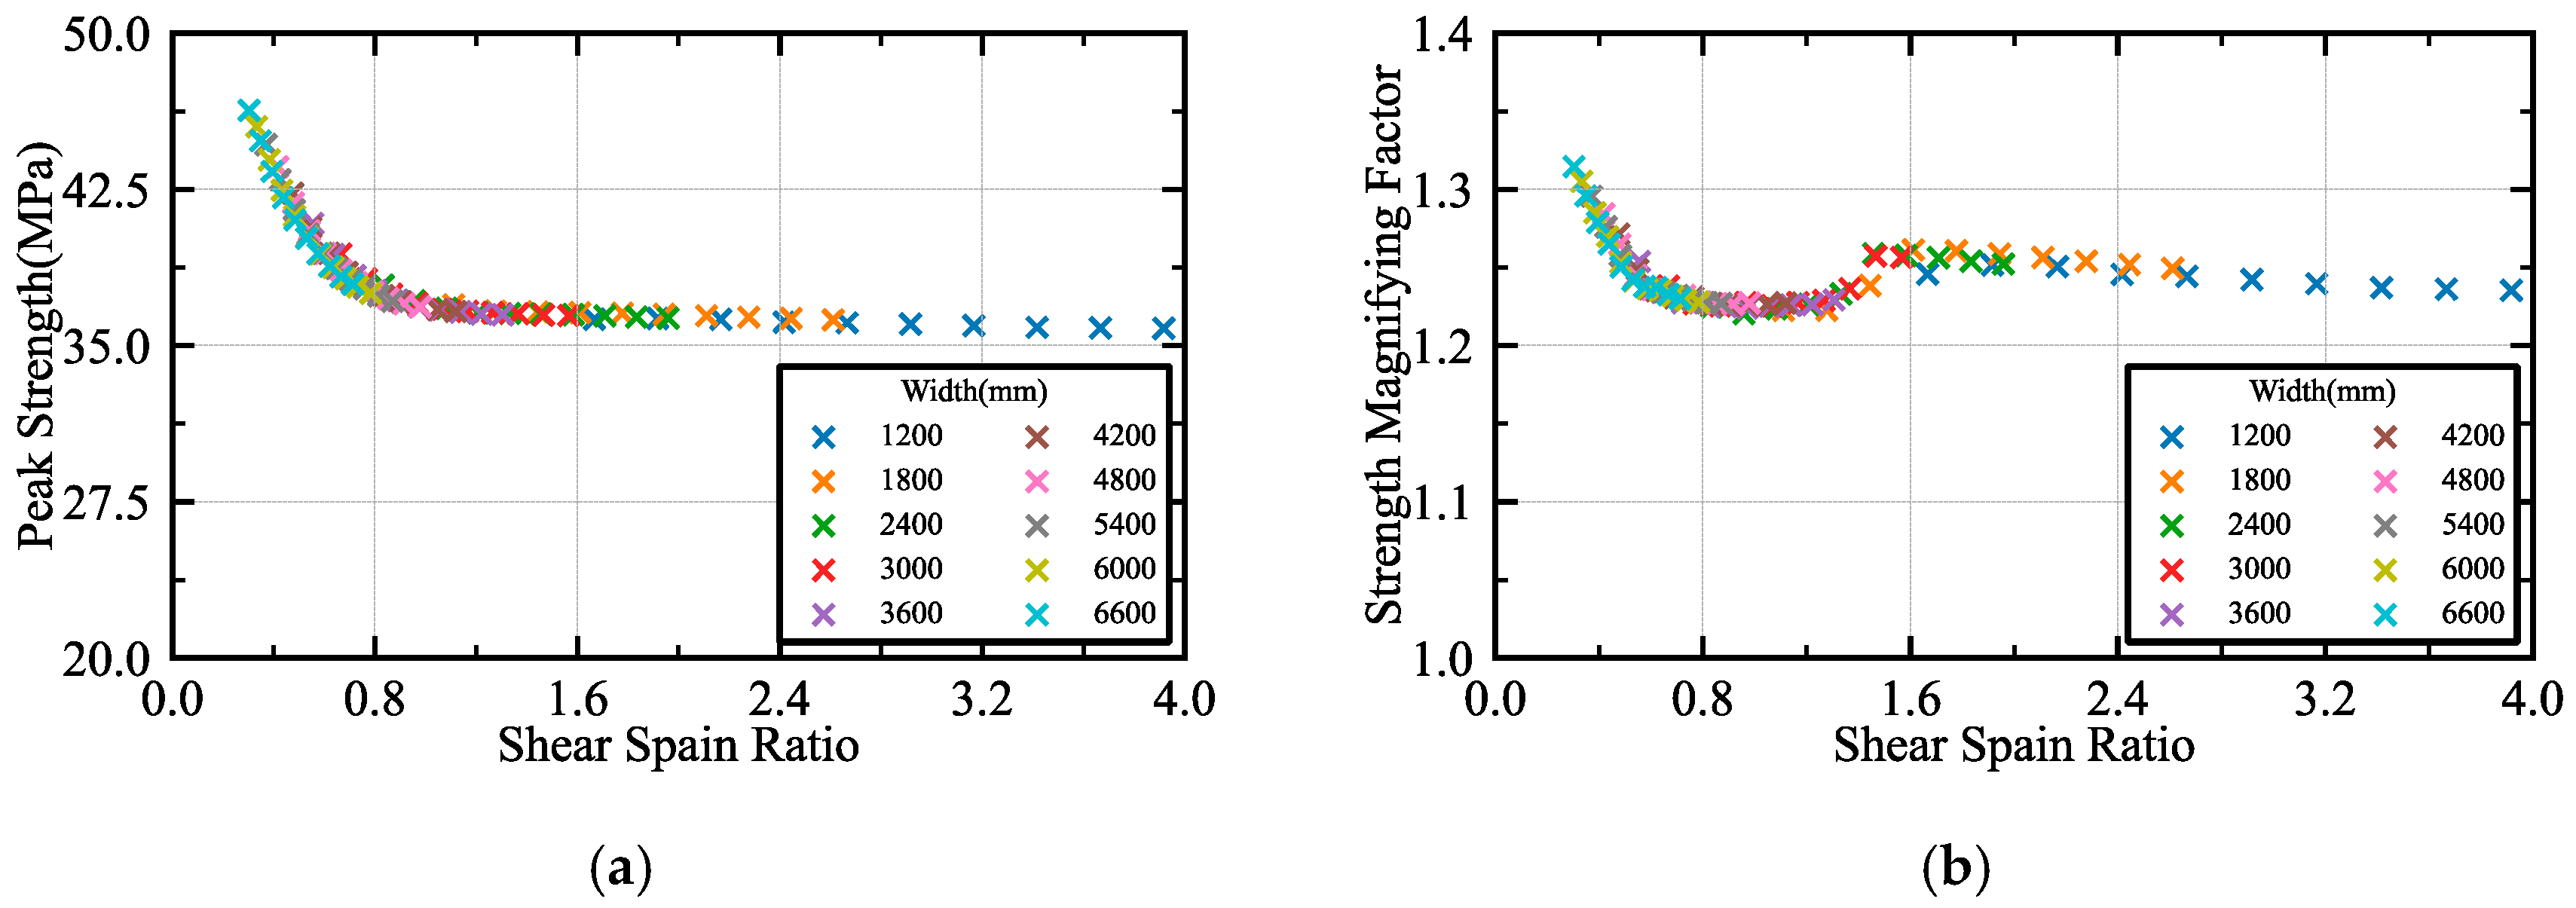
5.1. Dual-Parameter Analysis of Width and Height

This part explored the mechanisms by which the width and height of these structures exert their influence. For analytical modeling, we simultaneously adjusted both dimensions, varying the height between 2000 mm and 4700 mm and the width between 1200 mm and 6600 mm. Notably, the cavity width remained consistent across all models of varying sizes, leading to a proportional change in the number of cavities as the width was altered. Figure 19 illustrates the peak stress and strength enhancement coefficients for a spectrum of models, utilizing the shear–span ratio as the x-axis and distinguishing models by their width in the legend. As the shear–span ratio ascended, the peak stress exhibited a gradual decline. Notably, once the shear–span ratio was lower than 1, the peak stress underwent a rapid descent, though subsequent increases in the shear–span ratio beyond this threshold led to minimal changes in peak stress. This trend underscores the constraint effect and inherent characteristics of concrete. When comparing the strength enhancement coefficient to the corresponding strength of plain concrete for each size, it became evident that, at shear–span ratios exceeding 0.6, the coefficient exhibited minimal variation with changes in the structure’s width and height. Given that the shear–span ratios typically observed in composite structures exceed 0.6, it is plausible to deduce that the strength enhancement coefficient is interlinked with the structure’s width and height.

5.2. Three-Parameter Analysis of Cavity Number, Partition Thickness, and Web Thickness

In multi-cavity composite walls, diaphragms play a crucial role in structural configuration, necessitating an in-depth exploration of their impact. Therefore, a multi-factor modelling analysis was conducted by simultaneously altering three variables: the number of cavities, diaphragm thickness, and web thickness. These parameters were varied as follows: the number of cavities ranged from two to five, while the diaphragm and web thicknesses varied from 6 mm to 28 mm, resulting in 144 models. Figure 20 shows the peak strengths for different diaphragm and web thicknesses with a fixed number of cavities. The impact of the diaphragm thickness was insignificant regardless of the number of cavities. Therefore, it can be inferred that the diaphragm thickness does not affect the performance of the concrete.
Considering the minor impact of the diaphragm thickness on the constraint effect, this study proposes introducing the confinement factor ζ, which does not account for the diaphragm thickness. The specific expressions are presented in Equations (8) and (9).
ζ = f y t w l s / A c f c
l s = 2 ( d + b / N )
where fy is the yield strength of the steel, tw is the thickness of the web, ls is the length of the single-cavity steel plate, Ac is the area of the single-cavity concrete, fc is the compressive strength of the concrete, d is the thickness of the composite structure, b is the width of the composite structure, and N is the number of cavity.
The traditional confinement factor, which considers the thickness of the diaphragm, as proposed by Han et al. [37], is shown in Figure 21a as the independent variable in relation to the strength enhancement coefficient. Conversely, the confinement factor proposed in this study is shown in Figure 21b as the independent variable with respect to the strength enhancement coefficient. Evidently, the proposed confinement factor exhibited a clearer correlation with the strength enhancement coefficient and demonstrated greater explanatory power. This observation is consistent with the mechanical role of diaphragms, which serve to maintain cavity stability and transfer shear, but do not provide direct lateral confinement to the infilled concrete.

6. Research on Full-Parameter Batch Modelling of MDSCCS

6.1. Regression Analysis of Strength Enhancement Coefficient

After the preceding analytical insights, this section details the batch modelling aimed at deriving a comprehensive constraint effect equation. Five variables—width, thickness, cavity number, concrete strength, and steel yield strength—were identified for variation. Models featured uniform web, flange, and diaphragm thicknesses, while those with single-cavity widths narrower than the structural thickness were omitted, yielding a total of 1500 models. Among these, 1342 models converged successfully, with their specific parameters enumerated in Table 2.
The strength enhancement coefficient was modelled using the confinement factor as the predictor variable, as delineated in Equation (10). Figure 22 presents the modelling outcomes. A robust linear relationship was observed between the confinement factor and the strength enhancement factor. A comparison between the predicted strength augmentation factor and the actual constraint effect in Figure 22 revealed that 97.8% of the case study results exhibited an error margin of less than 15%. This underscores the high accuracy of the proposed equation.
f cc / σ 0 = 0.966 + 0.162 ζ
The outliers with substantial errors necessitate further scrutiny. Notably, 18 models possessed a two-cavity configuration, and 23 incorporated a blend of low-strength concrete with high-strength steel. These instances represent uncommon structural designs in practical engineering. Therefore, within typical structural configurations, the formulated equations demonstrated commendable precision.

6.2. Regression Analysis of Peak Strain and Gradient of the Descending Part

The part strain and gradient of the descending part also constitute vital parameters for the constitutive model of concrete, prompting the need for an analysis of the pertinent influence coefficients. Studies have established a robust correlation between the confinement factor and ultimate strain. Figure 23 illustrates the interaction between the confinement factor and ultimate strain; an increment in the confinement factor corresponds to an elevation in the peak strain. Nonetheless, a minor discrepancy emerged due to the discretization inherent in the finite element analysis process and the presence of the plateau region. It is advisable to employ Equation (11) for this purpose. Similarly, the gradient of the descending portion demonstrated a notable relationship with the confinement factor. However, due to its heightened discretization, only preliminary quantitative guidelines were furnished: a gradient of 0.2 is recommended for confinement factors below 2, whereas a gradient of 0.15 is suggested for confinement factors exceeding this threshold. The nominal gradient of the descending portion remained relatively elevated. This was predominantly due to the stronger influence of the confinement factor on the peak strain, leading to a more pronounced normalized gradient of the descending portion. This manifests in the non-normalized stress–strain curve as a more gradually decreasing segment.
ε cc = ( 0.894 + 0.2996 ζ ) ε 0

6.3. Constrained Constitutive of Concrete in MDSCCS

Drawing upon the comprehensive analysis conducted, this research introduces a uniaxial constitutive model for concrete under the influence of constraint effects suitable for multi-cavity composite structures. When subjected to steel confinement, modifications are observed in the peak stress, peak strain, and gradient of the descending part of the concrete. These modifications are mathematically formulated in Equations (12)–(16). For the ascending part, an approach like the Attard constitutive model is employed, wherein the peak stress and peak strain are in accordance with the confinement factor. The descending segment undergoes a linear decrement, with the recommended slope η ranging between 0.15 and 0.2, while maintaining a distinct residual strength fresidue.
σ / f cc = A x + B x 2 1 + ( A 2 ) x + ( B + 1 ) x 2   w h e r e   x = ε / ε cc , x < 1 max ( 1 η x , f residue / f cc )   w h e r e   x = ε / ε cc , x > 1
f cc / σ 0 = 0.966 + 0.162 ζ
ε cc = ( 0.894 + 0.2996 ζ ) ε 0
A = E c ε cc / f cc
B = ( A 1 ) 2 0.55 1
The computational methods and formulas in this study are applicable to multi-cell composite structures with a shear–span ratio exceeding 0.6 and the width of each cell greater than the structural thickness. The concrete strength and steel materials are appropriately matched; high-strength concrete is paired with high-strength steel, and low-strength concrete is paired with low-strength steel. Furthermore, the thicknesses of the flange plates and webs conform to relevant constructional requirements.
In practical applications, the model can be directly implemented into the structural design and nonlinear analysis of MDSCCS-based elements. It offers predictive capability for the uniaxial compressive behavior of confined concrete using easily obtainable input parameters: concrete strength, steel yield strength, cavity number, and plate dimensions. This makes it particularly valuable for wind turbine tower foundations, offshore platforms, and other prefabricated structural systems where MDSCCS are employed.
However, the model is developed based on the following key assumptions and limitations:
(1)
The concrete is monolithic and fully bonded to the steel plates; bond slip and partial interaction are not modeled.
(2)
The shear–span ratio must exceed 0.6, as validated in the simulations. Structures with low height-to-width ratios may require alternative formulations.
(3)
The cavity width should be equal to or greater than the wall thickness, since narrower configurations were excluded due to non-convergence or reduced confinement behavior.
(4)
The model is valid for uniaxial compression only; cyclic loading, multi-axial stress states, or time-dependent effects like creep are not included at this stage.
(5)
The diaphragm influence is excluded from the confinement factor to simplify computation, justified by the minimal effect demonstrated in Section 5.2.
Despite these limitations, the model provides a reliable and simplified tool for initial design and nonlinear performance assessment of MDSCCS under compression. Future extensions will incorporate other load conditions and durability factors.

7. Conclusions

Addressing the constraint effects observed in multi-cavity double steel plate–concrete composite structures, this research developed a finite element model tailored to accurately simulate the structures. A series of finite element parametric studies were undertaken, formulation of a constitutive model for concrete under confinement, specifically applicable to these multi-cavity structures, was found. The principal findings are summarized as follows:
(1)
The CDP-based shell–solid finite element model adeptly captures the comprehensive mechanical behavior of multi-cavity double steel plate composite structures, encompassing initial stiffness, peak stress, peak strain, and associated factors.
(2)
A comprehensive multi-parametric finite element batch analysis was conducted, introducing a parameter—the confinement factor—specifically tailored to quantify the extent of constraint in MDSCCS. This coefficient profoundly influences the peak stress, peak strain, and gradient of the descending part in confined concrete.
(3)
When the confinement factor ζ exceeds 2.0, the recommended descending slope of the stress–strain curve is approximately 0.15, and the ultimate strain increases proportionally with ζ. Moreover, the peak stress amplification factors in MDSCCS-1 and MDSCCS-2 show that typical confinement-enhanced strength coefficients are 1.23 and 1.06, respectively.
(4)
Using batch finite element modeling and statistical regression methodologies, a constitutive model for concrete under uniaxial compression was proposed, specifically designed for MDSCCS.
(5)
The confinement factor and stress–strain model developed herein may serve as a complementary tool or future supplement to existing design provisions, particularly for wind energy or offshore structures where MDSCCS applications are gaining traction.
This study offers significant contributions to the understanding of design methodologies, analytical approaches, and construction techniques of MDSCCS, with particular emphasis on their relevance in wind power engineering and thin-walled structural contexts. Additionally, it establishes a robust basis for subsequent investigations into the performance characteristics of these structures. To improve accuracy and robustness, future work can incorporate probabilistic uncertainty quantification based on model parameters, validate against full-scale physical experiments of MDSCCS under realistic boundary and loading conditions, and extend the database by generating new FE models for broader design spaces.

Author Contributions

Conceptualization, Y.W. and M.T.; methodology, M.T. and J.Z.; software, Y.W.; validation, Y.W.; formal analysis, M.T.; investigation, Y.W. and J.Z.; resources, M.T. and J.Z.; data curation, Y.W.; writing—original draft preparation, Y.W.; writing—review and editing, Y.W., M.T. and J.Z.; visualization, Y.W.; supervision, M.T. and J.Z.; project administration, M.T.; funding acquisition, M.T. All authors have read and agreed to the published version of the manuscript.

Funding

The authors gratefully acknowledge the financial support provided by the National Key Research and Development Program of China (2024YFF0505400), the National Natural Science Foundation of China (Grant No. 52178145), and the China Postdoctoral Science Foundation (2024M763871).

Data Availability Statement

All data, models, and code generated or used during the study appear in the submitted article.

Conflicts of Interest

The authors declare no conflicts of interest.

References

  1. Peng, X.K.; Liu, Z.C.; Jiang, D. A review of multiphase energy conversion in wind power generation. Renew. Sustain. Energy Rev. 2021, 147, 111172. [Google Scholar] [CrossRef]
  2. Zhang, R.; Shen, G.Q.P.; Ni, M.; Wong, J.K.W. An overview on the status quo of onshore and offshore wind power development and wind power enterprise localization in China. Int. J. Green Energy 2019, 16, 1646–1664. [Google Scholar] [CrossRef]
  3. Zhou, X.-H.; Wang, Y.-H.; Deng, R. Hybrid Wind Power Tower Based on Edge Stiffened Combined Shell. Patent CN109404224B, 18 June 2024. (In Chinese). [Google Scholar]
  4. Varma, A.H.; Malushte, S.R.; Sener, K.C.; Lai, Z. Steel-plate composite (SC) walls for safety related nuclear facilities: Design for in-plane forces and out-of-plane moments. Nucl. Eng. Des. 2014, 269, 240–249. [Google Scholar] [CrossRef]
  5. Seo, J.; Varma, A.H.; Sener, K.; Ayhan, D. Steelplate composite (SC) walls: In-plane shear behavior, database, and design. J. Constr. Steel Res. 2016, 119, 202–215. [Google Scholar] [CrossRef]
  6. Yan, J.-B.; Wang, X.-T.; Wang, T. Compressive Behaviour of Normal Weight Concrete Confined by the Steel Face Plates in SCS Sandwich Wall. Constr. Build. Mater. 2018, 171, 437–454. [Google Scholar] [CrossRef]
  7. Shen, K.; Wan, S.; Zhu, Y.; Lyu, D. A softened membrane model for single-box multi-cell composite box-girders with corrugated steel webs under pure torsion. Adv. Bridge Eng. 2022, 3, 2. [Google Scholar] [CrossRef]
  8. Kong, S.-Y.; Fan, J.-S.; Nie, X.; Ding, R.; Sun, Y.-L.; Chen, Y. Pullout behavior of lap splice connections between double-steel-plate composite walls and RC raft foundation in nuclear engineering. Eng. Struct. 2021, 230, 111720. [Google Scholar] [CrossRef]
  9. Deng, R.; Yang, J.-D.; Wang, Y.-H.; Li, Q.-Q.; Yu, Z.; Shen, Q.-W.; Yang, Y. Buckling and ultimate resistance of double-corrugated steel plates under in-plane shear load. Structures 2023, 53, 1267–1282. [Google Scholar] [CrossRef]
  10. Wang, B.-X.; Ding, R.; Fan, J.-S.; Cai, L.-J.; Feng, Z.-M.; Wang, C.-K. Shear performance of single steel-plate concrete composite beams with various transverse reinforcement configurations. Eng. Struct. 2022, 270, 114676. [Google Scholar] [CrossRef]
  11. Yang, Y.; Wu, B.; Xu, L.-Y.; Yao, Y.-P.; Zhang, D.; Zhao, C. Experimental study on the buckling behavior of double steel plate concrete composite slabs with stiffening ribs and tie plates. Eng. Struct. 2022, 255, 113895. [Google Scholar] [CrossRef]
  12. Ozaki, M.; Akita, S.; Osuga, H.; Nakayama, T.; Adachi, N. Study on Steel Plate Reinforced Concrete Panels Subjected to Cyclic In-Plane Shear. Nucl. Eng. Des. 2004, 228, 225–244. [Google Scholar] [CrossRef]
  13. Takeda, T.; Yamaguchi, T.; Nakayama, T.; Akiyama, K.; Kato, Y. Experimental study on shear characteristics of a concrete filled steel plate wall. In Transactions of 13th International Conference on Structural Mechanics in Reactor Technology (SMiRT 13); International Association for Structural Mechanics in Reactor Technology: Raleigh, NC, USA; pp. 21–26. Available online: https://repository.lib.ncsu.edu/server/api/core/bitstreams/291747bc-b889-40d9-ba63-d42131156838/content (accessed on 28 April 2025).
  14. Bu, F.-M. Studies on the Mechanical Performance of Composite Shear Wall with Double Steel Plates and Concrete Filled. Ph.D. Thesis, Tsinghua University, Beijing, China, 2011. (In Chinese). [Google Scholar]
  15. Nie, J.-G.; Ma, X.-W.; Tao, M.-X.; Fan, J.-S.; Bu, F.-M. Effective stiffness of composite shear wall with double plates and filled concrete. J. Constr. Steel Res. 2014, 99, 140–148. [Google Scholar] [CrossRef]
  16. Nie, X.; Wang, J.-J.; Tao, M.-X.; Fan, J.-S.; Bu, F.-M. Experimental study of flexural critical reinforced concrete filled composite plate shear walls. Eng. Struct. 2019, 197, 109439. [Google Scholar] [CrossRef]
  17. Wang, J.-J.; Nie, X.; Bu, F.-M.; Tao, M.-X.; Fan, J.-S. Experimental study and design method of shear-dominated composite plate shear walls. Eng. Struct. 2020, 215, 110656. [Google Scholar] [CrossRef]
  18. Guo, L.; Wang, Y.; Zhang, S. Experimental study of rectangular multi-partition steel-concrete composite shear walls. Thin-Walled Struct. 2018, 130, 577–592. [Google Scholar] [CrossRef]
  19. Wang, K. Study on Mechanism and Design Method of Multi-Cavity Composite Shear Wall With Double Steel Plates And Infilled Concrete. Ph.D. Thesis, Harbin Institute of Technology, Harbin, China, 2022. (In Chinese). [Google Scholar]
  20. Wang, K.; Zhang, W.; Chen, Y.; Ding, Y. Seismic Analysis and Design of Composite Shear Wall with Stiffened Steel Plate and Infilled Concrete. Materials 2021, 15, 182. [Google Scholar] [CrossRef]
  21. Zhang, W.; Wang, K.; Chen, Y.; Ding, Y. Experimental Study on the Seismic Behaviour of Composite Shear Walls with Stiffened Steel Plates and Infilled Concrete. Thin-Walled Struct. 2019, 144, 106279. [Google Scholar] [CrossRef]
  22. Wang, Q. Experimental Study and Finite Element Analysis on Seismic Behavior of Multi-Cavity Steel Plate-Concrete Composite Shear Wall. Ph.D. Thesis, Harbin Institute of Technology, Harbin, China, 2017. (In Chinese). [Google Scholar]
  23. Zhang, X. Experimental and Theoretical Study on Seismic Behavior of Steel Tube Bundle Composite Shear Wall. Ph.D. Thesis, Tianjin University, Tianjin, China, 2016. (In Chinese). [Google Scholar]
  24. Mander, J.A.B.; Priestley, M.J.N. Theoretical Stress-Strain Model for Confined Concrete. J. Struct. Eng. 1988, 114, 1804–1826. [Google Scholar] [CrossRef]
  25. Han, L.-H.; Yao, G.-H.; Tao, Z. Performance of concrete-filled thin-walled steel tubes under pure torsion. Thin-Walled Struct. 2007, 45, 24–36. [Google Scholar] [CrossRef]
  26. Zhong, T.; Wang, Z.B.; Yu, Q. Finite element modelling of concrete-filled steel stub columns under axial compression. J. Constr. Steel Res. 2013, 89, 121–131. [Google Scholar]
  27. Samani, A.K.; Attard, M.M. A stress–strain model for uniaxial and confined concrete under compression. Eng. Struct. 2012, 41, 335–349. [Google Scholar] [CrossRef]
  28. Tao, M.-X.; Wang, Y.-L.; Ma, Z.-Y.; Zhao, J.-Z. Experimental database and analysis of in-plane seismic behaviour of double steel-plate composite walls for wind power tower. Thin-Walled Struct. 2024, 200, 111917. [Google Scholar] [CrossRef]
  29. Yang, Y.; Liu, J.; Fan, J. Buckling behavior of double-skin composite walls: An experimental and modeling study. J. Constr. Steel Res. 2016, 121, 126–135. [Google Scholar] [CrossRef]
  30. Shi, J.; Guo, L.; Gao, S.; Li, Z. Buckling behavior of double skin composite walls under axial compressive load. Constr. Build. Mater. 2022, 321, 126345. [Google Scholar] [CrossRef]
  31. Zhang, Y.; Li, X.; He, Q.; Yan, X. Experimental study on local stability of steel plate concrete composite wall under axial compression. J. Civ. Eng. 2016, 49, 62–68. (In Chinese) [Google Scholar]
  32. European Committee For Standardization. EN 1994-1-1 Eurocode 4: Design of Composite Steel and Concrete Structures-Part 1-1: General Rules and Rules for Buildings; European Committee For Standardization: Brussels, Belgium, 2004. [Google Scholar]
  33. Ministry of Housing and Urban Rural Development of the People’s Republic of China. JGJ 138-2016 Code for Design of Composite Structures; Ministry of Housing and Urban Rural Development of the People’s Republic of China: Beijing, China, 2016. (In Chinese) [Google Scholar]
  34. Hou, H.; Wang, W.; Wang, S. Nonlinear modeling methods for cyclic analysis of double-skin composite shear walls. Thin-Walled Struct. 2023, 187, 110737. [Google Scholar] [CrossRef]
  35. Attard, M.M.; Setunge, S. Stress-Strain Relationship of Confined and Unconfined Concrete. ACI Mater. J. 1996, 93, 432–442. [Google Scholar]
  36. Zhao, Y.; Li, Z.; Ma, H. Experimental and numerical studies on compressive behavior of steel–concrete–steel composite walls considering local buckling and post-buckling effect. Thin-Walled Struct. 2023, 182, 110278. [Google Scholar] [CrossRef]
  37. Han, L.; Tao, Z. Theoretical analysis and experimental study on the mechanical properties of concrete filled square steel tubular under axial compression. J. Civ. Eng. 2001, 2, 17–25. (In Chinese) [Google Scholar]
Figure 1. New type of steel plate–concrete composite wind tower.
Buildings 15 01556 g001
Figure 2. Fundamental form of MDSCCS.
Buildings 15 01556 g002
Figure 4. Schematic diagram of constraint effect.
Buildings 15 01556 g004
Figure 5. Schematic figure of FE model.
Buildings 15 01556 g005
Figure 6. Mesh size analysis of FE model.
Buildings 15 01556 g006
Figure 7. Comparison of test and predicted load–displacement curve of the FE model. (a) Specimen of Shi et al. [30], (b) Specimen of Yang et al. [29], (c) Specimen of Zhao et al. [36], (d) Specimen of Guo et al. [18], (e) Specimen of Zhang et al. [31].
Buildings 15 01556 g007
Figure 8. Parametric analysis of height. (a) Stress–strain curves of the MDSCCS-1 model at different heights, (b) Strength enhancement coefficient of MDSCCS-1 model at different heights, (c) Stress–strain curves of the MDSCCS-2 model at different heights, (d) Strength enhancement factor of the MDSCCS-2 model at different heights.
Buildings 15 01556 g008
Figure 9. Parametric analysis of width. (a) Stress–strain curves of the MDSCCS-1 model at different widths, (b) Strength enhancement coefficient of the MDSCCS-1 model at different widths, (c) Stress–strain curves of the MDSCCS-2 model at different widths, (d) Strength enhancement coefficient of the MDSCCS-2 model at different widths.
Buildings 15 01556 g009
Figure 10. Parametric analysis of thickness. (a) Stress–strain curves of the MDSCCS-1 model at different thicknesses, (b) Strength enhancement coefficient of the MDSCCS-1 model at different thicknesses, (c) Stress–strain curves of the MDSCCS-2 model at different thicknesses, (d) Strength enhancement coefficient of the MDSCCS-2 model at different thicknesses.
Buildings 15 01556 g010
Figure 11. Parametric analysis of web thickness. (a) Stress–strain curves of the MDSCCS-1 model at different web thicknesses, (b) Strength enhancement factors of the MDSCCS-1 model at different web thicknesses, (c) Stress–strain curves of the MDSCCS-2 model at different web thicknesses, (d) Strength enhancement factor of MDSCCS-2 model with different web thicknesses.
Buildings 15 01556 g011
Figure 12. Parametric analysis of flange thickness. (a) Stress–strain curves of the MDSCCS-1 model at different flange thicknesses, (b) Strength enhancement factor of the MDSCCS-1 model at different flange thicknesses, (c) Stress–strain curves of the MDSCCS-2 model under different flange thicknesses, (d) Strength enhancement factors of the MDSCCS-2 model under different flange thicknesses.
Buildings 15 01556 g012
Figure 13. Parametric analysis of diaphragm thickness. (a) Stress–strain curves of the MDSCCS-1 model under different diaphragm thickness, (b) Strength enhancement factor of the MDSCCS-1 model under different diaphragm thickness, (c) Stress–strain curves of the MDSCCS-2 model under different diaphragm thickness, (d) Strength enhancement factor of the MDSCCS-2 model under different diaphragm thickness.
Buildings 15 01556 g013
Figure 14. Parametric analysis of web strength. (a) Stress–strain curves of the MDSCCS-1 model under different web strengths, (b) Strength enhancement factor of the MDSCCS-1 model under different web strengths, (c) Stress–strain curves of the MDSCCS-2 model under different web strengths, (d) Strength enhancement factor of the MDSCCS-2 model under different web strengths.
Buildings 15 01556 g014
Figure 15. Parametric analysis of flange strength. (a) Stress–strain curves of the MDSCCS-1 model under different flange strengths, (b) Strength enhancement coefficient of the MDSCCS-1 model under different flange strengths, (c) Stress–strain curves of the MDSCCS-2 model under different flange strengths, (d) Strength enhancement factor of the MDSCCS-2 model under different flange strengths.
Buildings 15 01556 g015
Figure 16. Parametric analysis of diaphragm strength. (a) Stress–strain curve of the MDSCCS-1 model at different diaphragm strengths, (b) Strength enhancement coefficient of the MDSCCS-1 model at different diaphragm strengths, (c) Stress–strain curves of the MDSCCS-2 model at different diaphragm strengths, (d) Strength enhancement coefficient of the MDSCCS-2 model at different diaphragm strengths.
Buildings 15 01556 g016
Figure 17. Parametric analysis of concrete strength. (a) Stress–strain curves of the MDSCCS-1 model at different concrete strengths, (b) Strength enhancement coefficient of the MDSCCS-1 model at different concrete strengths, (c) Stress–strain curves of the MDSCCS-2 model at different concrete strengths, (d) Strength enhancement coefficient of the MDSCCS-2 model at different concrete strengths.
Buildings 15 01556 g017
Figure 18. Parametric analysis of cavity number. (a) Stress–strain curve of the MDSCCS-1 model at different cavity numbers, (b) Strength enhancement coefficient of the MDSCCS-1 model at different cavity numbers, (c) Stress–strain curves of the MDSCCS-2 model at different cavity numbers, (d) Strength enhancement coefficient of the MDSCCS-2 model at different cavity numbers.
Buildings 15 01556 g018
Figure 19. Multi-factor modelling analysis of width and height. (a) Effect of peak stress on shear–span ratio, (b) Effect of strength enhancement factor on shear–span ratio.
Buildings 15 01556 g019
Figure 20. Peak strengths for different diaphragm and web thicknesses.
Buildings 15 01556 g020
Figure 21. Relationship between different confinement factors and strength enhancement coefficients. (a) Relationship between traditional confinement factor and strength enhancement coefficient, (b) Relationship between confinement factor and strength enhancement coefficient proposed in this paper.
Buildings 15 01556 g021
Figure 22. Calculation results of strength enhancement coefficient. (a) Relationship between confinement factor and strength enhancement coefficient, (b) Relationship between predicted and actual strength enhancement coefficient.
Buildings 15 01556 g022
Figure 23. Calculation results of peak strain and descent slope. (a) Relationship between peak strain and confinement factor, (b) Relationship between slope of descent section and confinement factor.
Buildings 15 01556 g023
Table 1. Benchmark model parameters.
MDSCCS-1MDSCCS-2
Height h3000 mm3000 mm
Thickness d500 mm600 mm
Width bc3000 mm3000 mm
Steel Thickness (tf = tw)20 mm10 mm
Concrete strength fc30 MPa30 MPa
Steel strength fy300 MPa300 MPa
Number of cavities54
Thickness of the steel diaphragms8 mm8 mm
Table 2. Batch modelling parameters.
Fixed ParametersVariable Parameters
Structural thickness: 500 mmStructure width bc: {1500, 2500, 3500} (unit: mm)
Structural height: 3000 mmsteel plate thickness: {6, 11, 16, 21, 26} (unit: mm)
Height of the elastic loading beam: 150 mmCavity number: {2, 3, 4, 5, 6}
Height of the elastic foundation beam: 150 mmConcrete strength fc: {20, 30, 40, 50, 60} (unit: MPa)
Steel strength: {200, 300, 400, 500, 600} (unit: MPa)
Disclaimer/Publisher’s Note: The statements, opinions and data contained in all publications are solely those of the individual author(s) and contributor(s) and not of MDPI and/or the editor(s). MDPI and/or the editor(s) disclaim responsibility for any injury to people or property resulting from any ideas, methods, instructions or products referred to in the content.

