Article

Research on Park Perception and Understanding Methods Based on Multimodal Text–Image Data and Bidirectional Attention Mechanism

1
Faculty of Innovation and Design, City University of Macau, Macau 999078, China
2
School of Urban Architecture, Guangzhou Huali College, Guangzhou 511325, China
3
Zhuhai Dechuang Construction Engineering Consulting Limited Company, Zhuhai 519000, China
*
Authors to whom correspondence should be addressed.
Buildings 2025, 15(9), 1552; https://doi.org/10.3390/buildings15091552
Submission received: 25 March 2025 / Revised: 21 April 2025 / Accepted: 2 May 2025 / Published: 4 May 2025

Abstract

Parks are an important component of urban ecosystems, yet traditional research often relies on single-modal data, such as text or images alone, making it difficult to comprehensively and accurately capture the complex emotional experiences of visitors and their relationships with the environment. This study proposes a park perception and understanding model based on multimodal text–image data and a bidirectional attention mechanism. By integrating text and image data, the model incorporates a bidirectional encoder representations from transformers (BERT)-based text feature extraction module, a Swin Transformer-based image feature extraction module, and a bidirectional cross-attention fusion module, enabling a more precise assessment of visitors’ emotional experiences in parks. Experimental results show that compared to traditional methods such as residual network (ResNet), recurrent neural network (RNN), and long short-term memory (LSTM), the proposed model achieves significant advantages across multiple evaluation metrics, including mean squared error (MSE), mean absolute error (MAE), root mean squared error (RMSE), and the coefficient of determination (R2). Furthermore, using the SHapley Additive exPlanations (SHAP) method, this study identified the key factors influencing visitors’ emotional experiences, such as “water”, “green”, and “sky”, providing a scientific basis for park management and optimization.

1. Introduction

As an important component of urban ecosystems, parks serve key functions in daily leisure, recreation, and social interaction, fostering a connection with nature [1,2,3,4,5,6,7,8]. With the acceleration of urbanization and the improvement of people’s demand for quality of life, parks not only need to satisfy the basic ecological functions but also need to provide quality emotional experiences [9], which poses new challenges to the design and management of parks. Studies have shown that visitors’ emotional experience affects their satisfaction, willingness to visit, and health and well-being in parks [1,10]. Therefore, it is very important to accurately assess the emotional tendencies of park visitors to improve the quality of park services and social values.
Public perception of a park environment is a complex cognitive process that is influenced by a combination of factors such as natural landscape, artificial facilities, social interaction, and air quality [11,12,13,14]. Measuring environmental perception is challenging because of its subjective and intangible nature [15,16]. Traditional assessment methods mainly include questionnaire surveys [17,18], interviews [19,20], field observations [21,22], and case studies [23,24,25]. These conventional methods have obvious shortcomings, such as consuming more time and manpower, having a single source of data, and being susceptible to subjective factors [26,27], which make it difficult to meet the needs of large-scale, real-time, and objective park emotion assessment. Therefore, how to scientifically assess the emotional experience of park visitors with the help of modern computing methods in park operation and management has become an important issue to be solved.
With advancements in computer technology, deep learning has gradually become an important tool for studying the perception of the park environment [16,28,29]. More accurate analysis and automated assessment of affective tendencies are gradually becoming a research hotspot. However, most existing research on park perception relies on single-modal data, such as text or images. Studies based on textual data analyze textual content, such as social media posts, user comments, etc., to infer the public’s emotional disposition towards the environment [30,31,32,33,34]. Models such as RNN, BERT, and LSTM have been widely used in recent years in textual sentiment disposition analysis [30,32,35]. Studies based on image data utilize the visual features of environmental photographs to assess the potential emotional impact of the environment on the public [36,37,38]. Models such as CNN, R-CNN, and ViT (Vision Transformer) are able to detect the effect of images on people’s emotional tendencies [39,40]. Notably, in recent years, Transformer models have demonstrated strong capabilities in handling sentiment analysis and complex data patterns [41,42]. However, single-modal data can only represent human perception from a particular perspective, which not only makes it difficult to complete a full-picture description of complex emotional experiences independently but also fails to accurately reflect the emotional fluctuations of tourists in the changing park environment [43,44].
As a cutting-edge technology in the field of deep learning, multimodal learning methods are able to provide more comprehensive and accurate results by fusing data from different sources and forms [43,44,45,46]. In the research field of park environment perception, multimodal deep learning is still in the exploratory stage. Studies from Yang et al. and Liu et al. suggest that integrating text and image data not only enhances the overall understanding of spatial environments by the model but also improves the accuracy of emotional tendency prediction [27,28]. However, despite the potential of multimodal learning methods to integrate text and image data, existing research still faces two major challenges. First, effectively fusing text and image features remains a critical issue. Text and images belong to fundamentally different modalities [47], with distinct feature spaces and representational structures. Developing models that seamlessly integrate these two types of information is a key challenge in multimodal learning. Second, capturing the intricate interactions between text and images presents another major challenge. Traditional multimodal fusion techniques mostly rely on simple feature concatenation or weighted averaging [48], which limits their ability to fully uncover deep connections between textual and visual data.
To overcome these challenges, this study proposes a park perception and understanding method based on multimodal text–image data and a bidirectional attention mechanism. Specifically, we developed a cross-modal framework that integrates a bidirectional encoder representations from transformers (BERT)-based text feature extraction module, a Swin Transformer-based image feature extraction module, and a bidirectional cross-attention fusion module. Through the deep fusion of multimodal information, the framework enhances the model’s ability to capture visitors’ emotional experiences. This technical framework not only addresses the limitations of unimodal assessment methods but also overcomes the technical obstacle of simple multimodal fusion that makes it difficult to capture deep semantic associations across modalities. The method is able to accurately assess the emotional tendencies of visitors while capturing textual information and image features of the park environment, which enhances the comprehensiveness of urban public space assessment. This data-driven analysis framework not only provides actionable recommendations for urban planning but is also versatile enough to be extended to a wide range of urban public spaces.
The contributions of this paper are as follows:
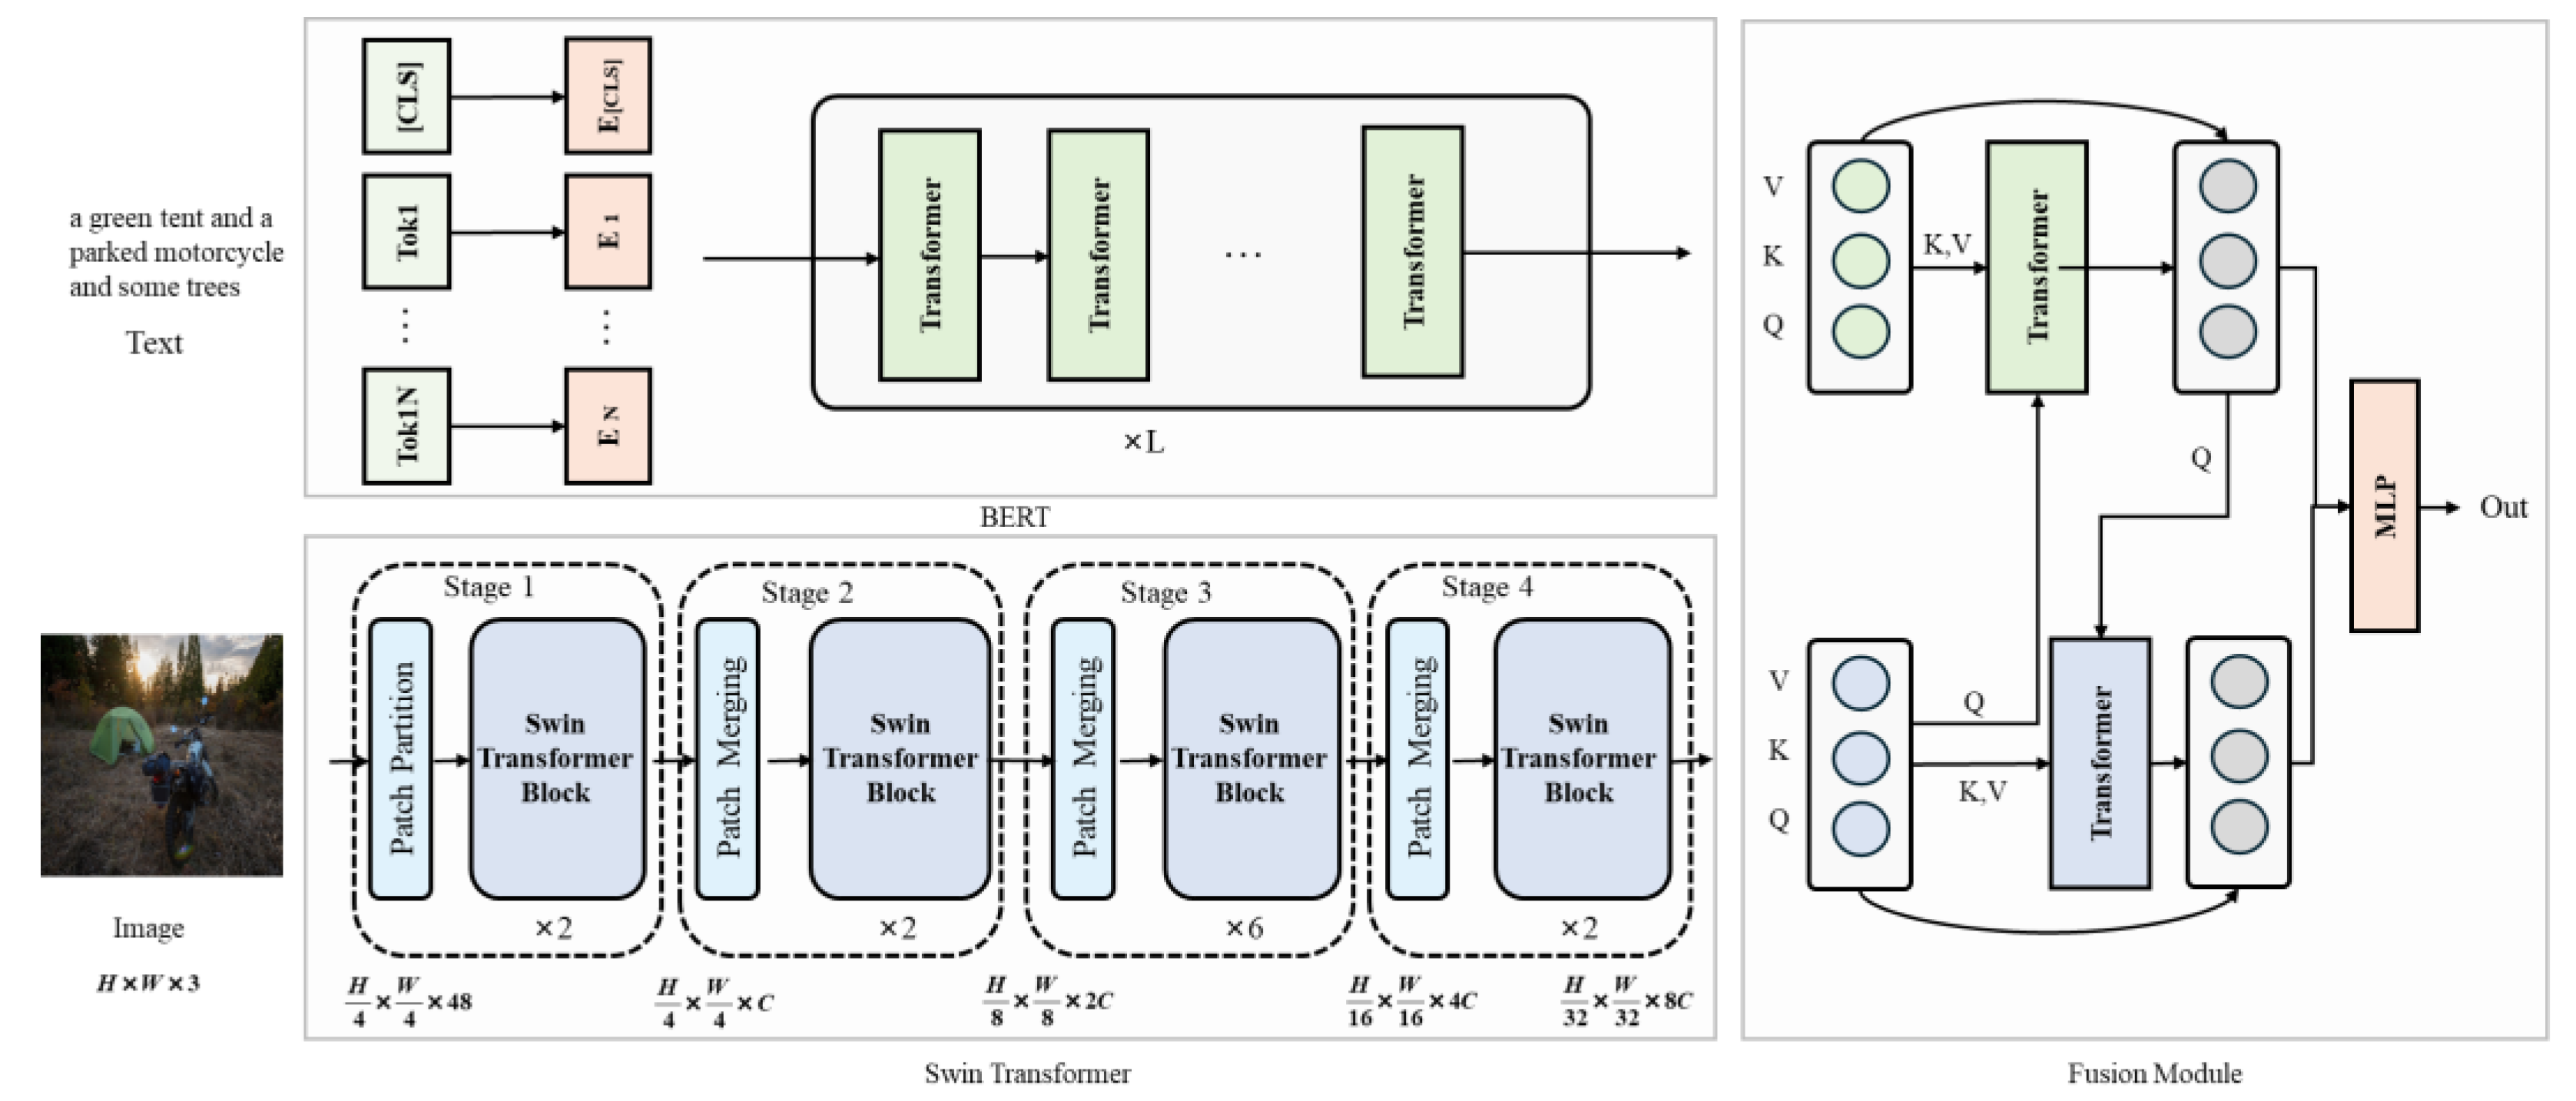
  • The BERT model effectively captures semantic information in text using a bidirectional encoder, whereas the Swin Transformer efficiently extracts visual features from images through a local window self-attention mechanism. This study proposed a park perception and understanding method based on multimodal text–image data to effectively fuse text and image features and capture their interactions.
  • To better integrate BERT and Swin Transformer features, a bidirectional cross-attention mechanism that enables mutual reinforcement of text and image information is introduced in order to enhance the accuracy and robustness of sentiment analysis.
  • In addition, a method that enables an interpretability analysis of the model results is employed, focusing on the significance of key terms, which allowed us to identify key factors of the park environment that influence visitors’ emotional experience, for optimization and providing suggestions for park management.

2. Materials and Methods

2.1. Overall Model Architecture

Parks provide important spaces for leisure and recreation. Their environmental quality directly influences visitors’ emotional experiences. However, fully capturing these emotional experiences by relying only on single-source data is difficult. Therefore, we propose a cross-modal framework that integrates textual descriptions and corresponding image data, to more accurately assess visitors’ emotional tendencies.
The overall model architecture consisting of a text feature extraction, an image feature extraction, and a multimodal cross-fusion module is depicted in Figure 1. First, the input layer receives textual descriptions and associated image data. The text data are processed by a BERT-based text feature extraction module, which captures deep semantic information within the text. For image processing, the Swin Transformer effectively reduces computational complexity and enhances the modeling of long-range dependencies by segmenting the image into multiple local windows and applying self-attention computations within each window. Finally, the bidirectional cross-attention fusion module enhances the interaction between text and image features through text-to-image and image-to-text cross-attention computations. This ensures that the generated comprehensive feature representation includes key information from both modalities, accurately reflecting the emotional sentiment associated with the park.

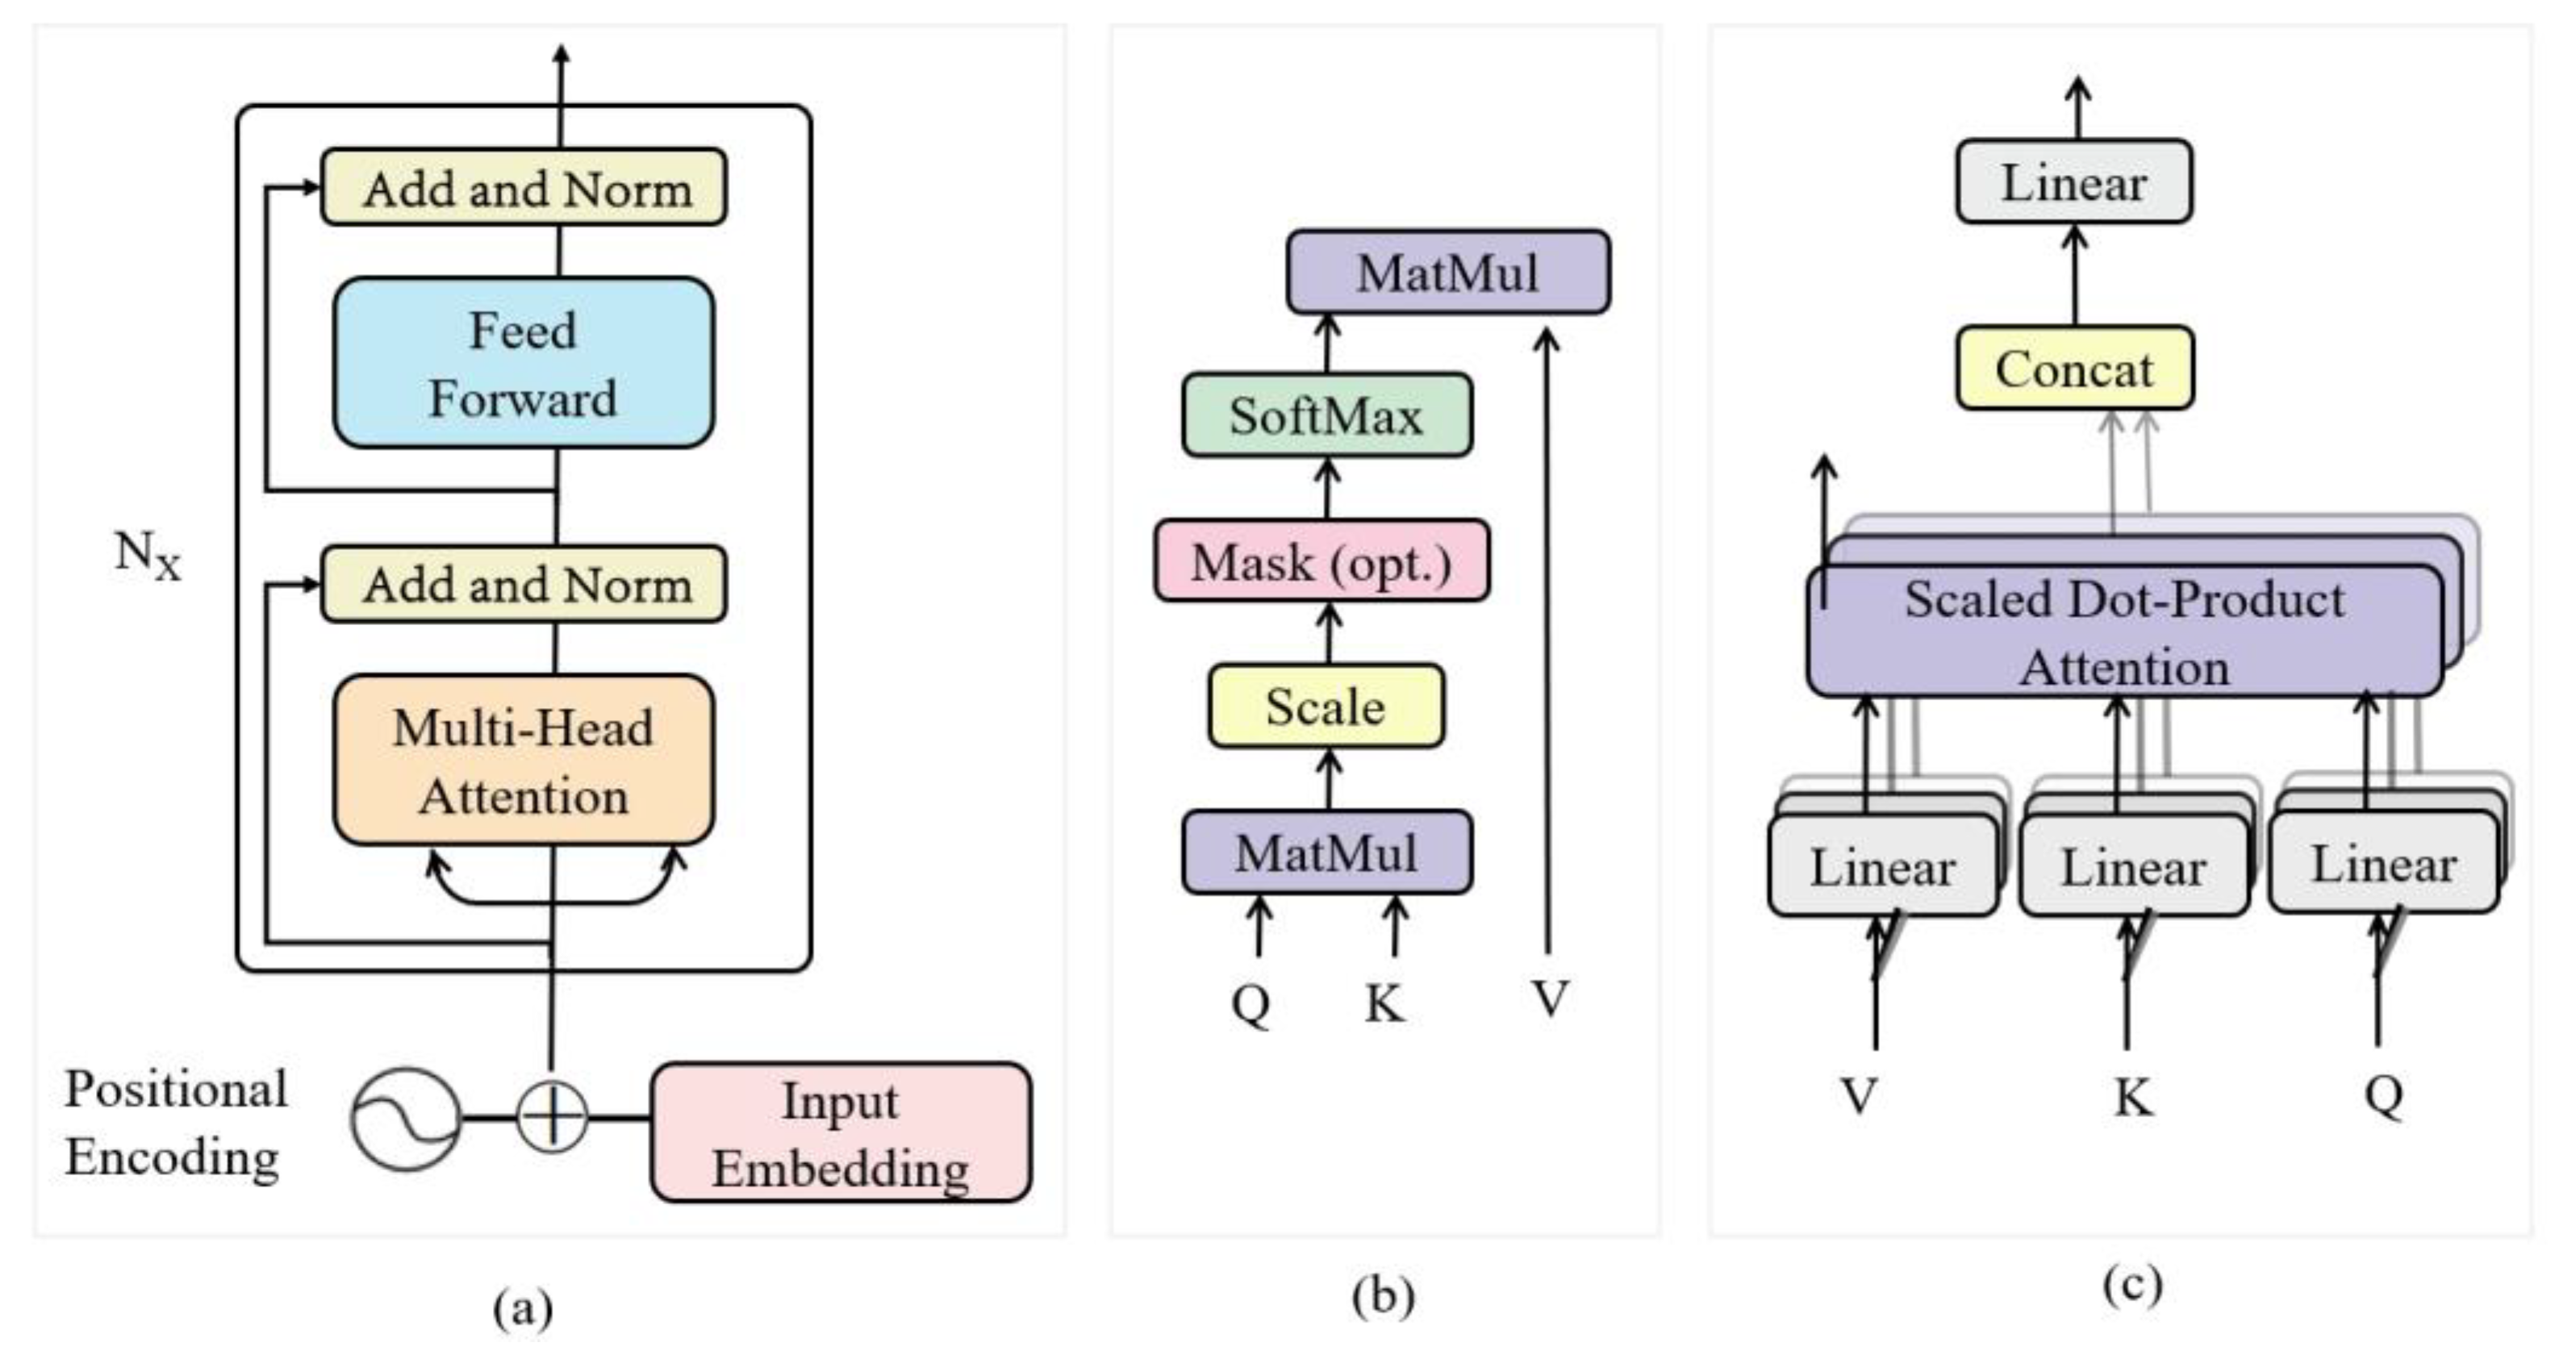
2.2. BERT-Based Text Feature Extraction Module

BERT is a language model based on the Transformer architecture. It employs bidirectional encoders to capture deep semantic information in text and conducts unsupervised learning on large-scale text corpora [49]. Unlike traditional unidirectional language models, BERT simultaneously considers both preceding and succeeding contextual information of a word to capture not only the intrinsic meaning of words but also their relationships with other words, resulting in a more comprehensive and precise text representation. In this study, we utilized a pre-trained BERT model to extract deep semantic information from park-related text. The model was fine-tuned on our dataset to enhance its understanding of sentiment recognition in park perception tasks.
BERT consists of multilayer bidirectional Transformer encoders, with each encoder layer comprising a multi-head self-attention mechanism and a feed-forward neural network (FFN). BERT first converts the input text into a corresponding word embedding representation. Given a text T, BERT generates a series H of context-dependent embedding vectors with dimensions [L, d], where L represents the text length and d is the hidden layer dimension. Since the Transformer lacks recurrent or convolutional structures, explicit positional information is added to capture the sequential order of words. Positional embeddings are fixed mappings that assign different vectors to words based on their position in the sentence.
The self-attention mechanism captures dependencies between different positions by applying three independent linear transformations to generate the query, key, and value matrices. The scaled dot-product attention score is computed as follows:
A t t e n t i o n ( Q , K , V ) = S o f t m a x Q K T d k V
where Q, K, and V are the query, key, and value matrices, respectively, and d k is the dimension of the key vector.
To capture information from various subspaces, BERT employs a multi-head self-attention mechanism. Assuming that there are h attention heads, the output of the i-th head is given as follows:
H e a d i = A t t e n t i o n Q W i Q , K W i K , V W i V
where W i Q , W i K , and W i V are the projection matrices of the query, key, and value of the i-th attention head, respectively.
The outputs of all attention heads are concatenated and transformed linearly:
M u l t i H e a d ( Q , K , V ) = H e a d 1 ; H e a d 2 ; ; H e a d h W O
where W O is the output projection matrix.
Each Transformer encoder layer also includes an FFN, which is applied independently to the output at each position:
F F N ( x ) = R e L U x W 1 + b 1 W 2 + b 2
where x is the data input to the FFN; W and b are the learnable parameters in FFN; and the rectified linear unit ( R e L U ) is the activation function.
To prevent vanishing gradients and accelerate training, BERT employs residual connections and layer normalization after each layer. Figure 2 illustrates the architecture of the BERT-based text feature extraction module and its attention mechanism.
To mitigate overfitting, a specific fine-tuning strategy was employed where only the parameters of BERT’s final layer were fine-tuned, while the weights of the remaining layers were frozen and not updated during the training process. During training, the maximum sequence length was set to 512.

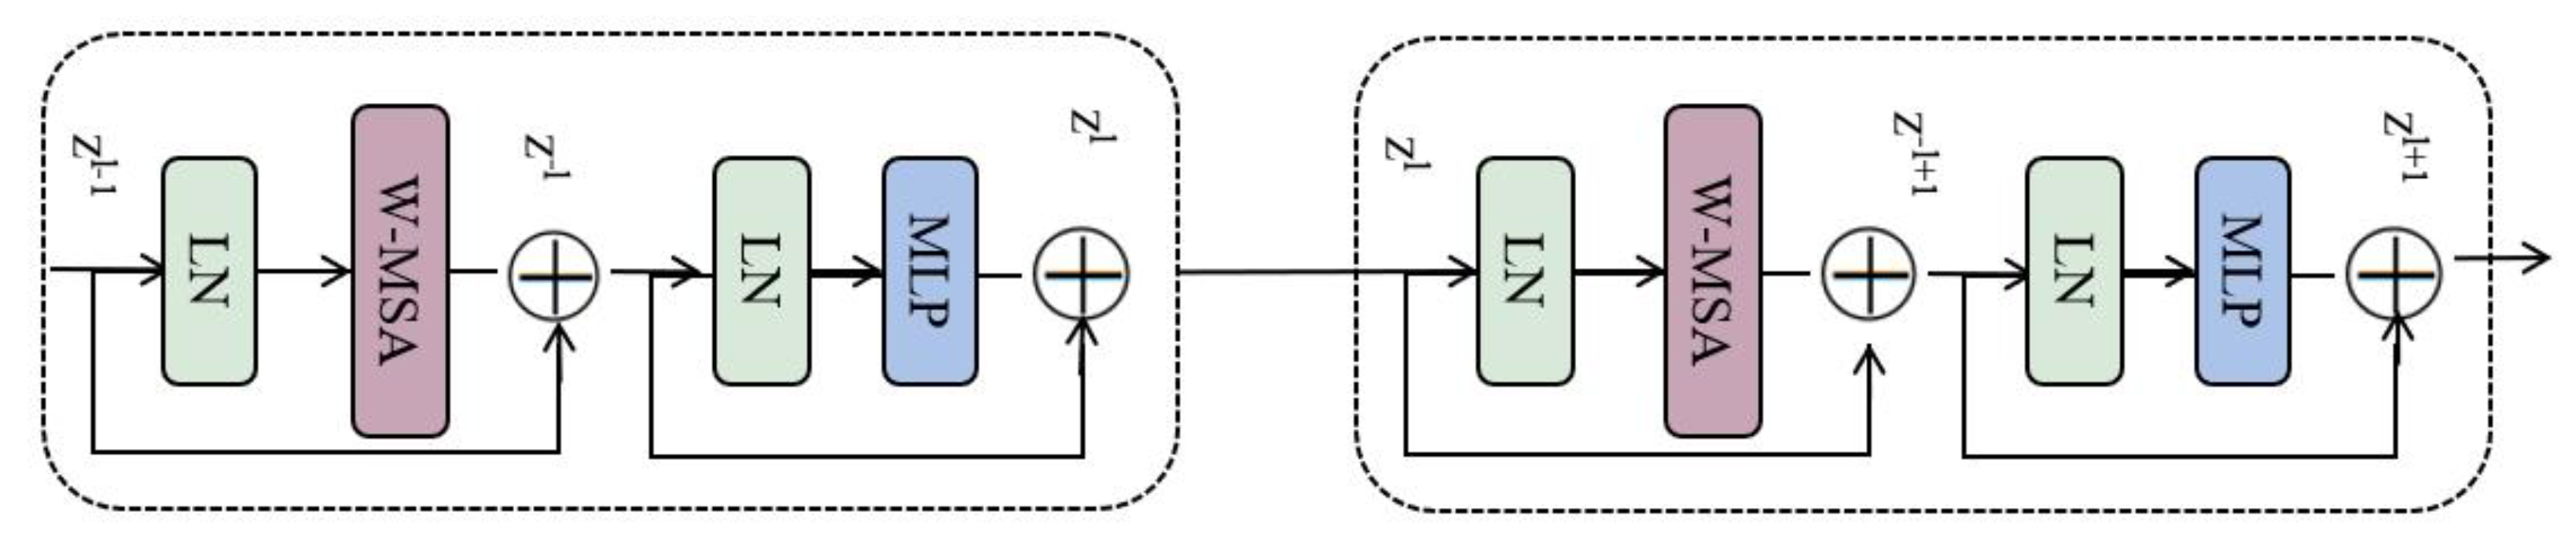
2.3. Swin Transformer-Based Image Perception Module

The Swin Transformer is a vision model based on the Transformer architecture that integrates the concept of local connectivity of the traditional convolutional neural network (CNN) with the self-attention mechanism of the Transformer, enabling the capture of contextual information in images at multiple scales [50]. Traditional Transformers compute self-attention across the entire image, leading to high computational complexity, especially for high-resolution images. The Swin Transformer partitions the image into multiple non-overlapping windows and performs self-attention calculations within each window. Through the “shifted window” mechanism, it efficiently captures both local and global self-attention.
As shown in Figure 3, the input image is first divided into non-overlapping windows, and self-attention is computed within each window. In subsequent layers, the window configuration shifts to facilitate cross-window information exchange, enhancing the model’s ability to capture long-range dependencies while maintaining computational efficiency. The Swin Transformer consists of four hierarchical stages, each comprising several Transformer blocks. As the stages progress, the spatial resolution of the feature map decreases while the number of channels increases accordingly.

2.4. Bidirectional Cross-Attention Fusion Module

In this study, a bidirectional cross-attention fusion module was designed to enhance the interaction and integration of text and image features, thereby improving the accuracy of park emotion analysis. Text features are extracted using the pre-trained language model BERT, and visual features are obtained from image data via the Swin Transformer. To achieve efficient feature fusion, we employed a cross-attention mechanism to process cross-modal information.
The text-to-image cross-attention computation maps key information from features onto image features, capturing the associations between textual descriptions and visual content. Next, the image-to-text cross-attention computation maps key information from image features back onto text features, further reinforcing their mutual interactions. These two stages not only enable deep interaction between text and image features but also preserve the integrity of the original features. Moreover, residual connections enhance the expressiveness of the model.
Finally, the text and image features processed through both cross-attention computations are concatenated to form a comprehensive feature representation. This representation integrates information from both modalities, providing a more complete and accurate reflection of the emotional information embedded in the park environment.

2.5. Data and Evaluation Metrics

In this study, the COCO Caption dataset (https://cocodataset.org) was the primary data source (accessed on 3 February 2025). This dataset is widely used in image recognition and natural language processing tasks. It contains a rich collection of images and corresponding textual descriptions. The COCO Caption dataset has 82,783 samples in the training set; 40,504 samples in the validation set; and 40,775 samples in the test set. Each image is associated with 5 to 7 sentences of descriptive text. This dataset not only spans a broad range of scenarios but also provides detailed annotations, making it highly suitable for cross-modal analysis and research [51]. To focus on the emotional perception of the park environment, we extracted a subset from the COCO dataset comprising image–text pairs related to parks. By extracting samples containing keywords such as “park” and “visitor” and filtering them, we ultimately obtained 30,682 valid samples. We preprocessed and filtered these data, to ensure that the model focuses on learning features relevant to the park environment. For the emotion tendency annotation, we first initially categorize the text data according to “0” (negative), “1” (neutral) or “2” (positive). Then, the text was rated by each of the five experts on its emotional tendency. Ultimately, we determine the sentiment propensity score for each comment by calculating the average of multiple expert ratings to obtain a more precise continuum value to ensure the scientific validity of the data. This approach not only considers sentiment categorization but also quantifies the intensity of sentiment, providing more detailed sentiment analysis results.
As shown in Figure 4, a word cloud analysis was conducted on the extracted park-related texts. This analysis helps visualize key phrases and high-frequency words associated with parks, providing an important reference for subsequent sentiment analysis. The word cloud highlights keywords such as “trees”, “play equipment”, and “roads”, which are closely related to the park environment, indicating that the data selection process is both effective and representative.
To comprehensively assess the model performance, we employed multiple evaluation metrics to measure the differences between predicted results and actual values. Mean squared error (MSE), mean absolute error (MAE), root mean squared error (RMSE), and the coefficient of determination (R2) were used as evaluation metrics. The formulas are as follows:
M S E = 1 n i = 1 n   c y ^ i 2
M A E = 1 n i = 1 n   y i y ^ i
RMSE   = 1 n i = 1 n   y i y ^ i 2
R 2 = 1 i 1 n   y i y ^ i 2 i 1 n   y i y ¯ 2
where y i is the actual value; y ^ i is the predicted value; y ¯ is the mean of the actual values; and n is the sample size.

3. Results

In our experiments, we trained and evaluated the model using filtered data to verify its performance. The model was trained on a device equipped with a 4090 GPU graphics card, utilizing the PyTorch framework. During training, the learning rate was set to 0.0001; the batch size was 96; and a total of 4000 iterations were performed. This configuration ensured that the model could efficiently learn key features from the data within a reasonable timeframe, thus improving its predictive accuracy.

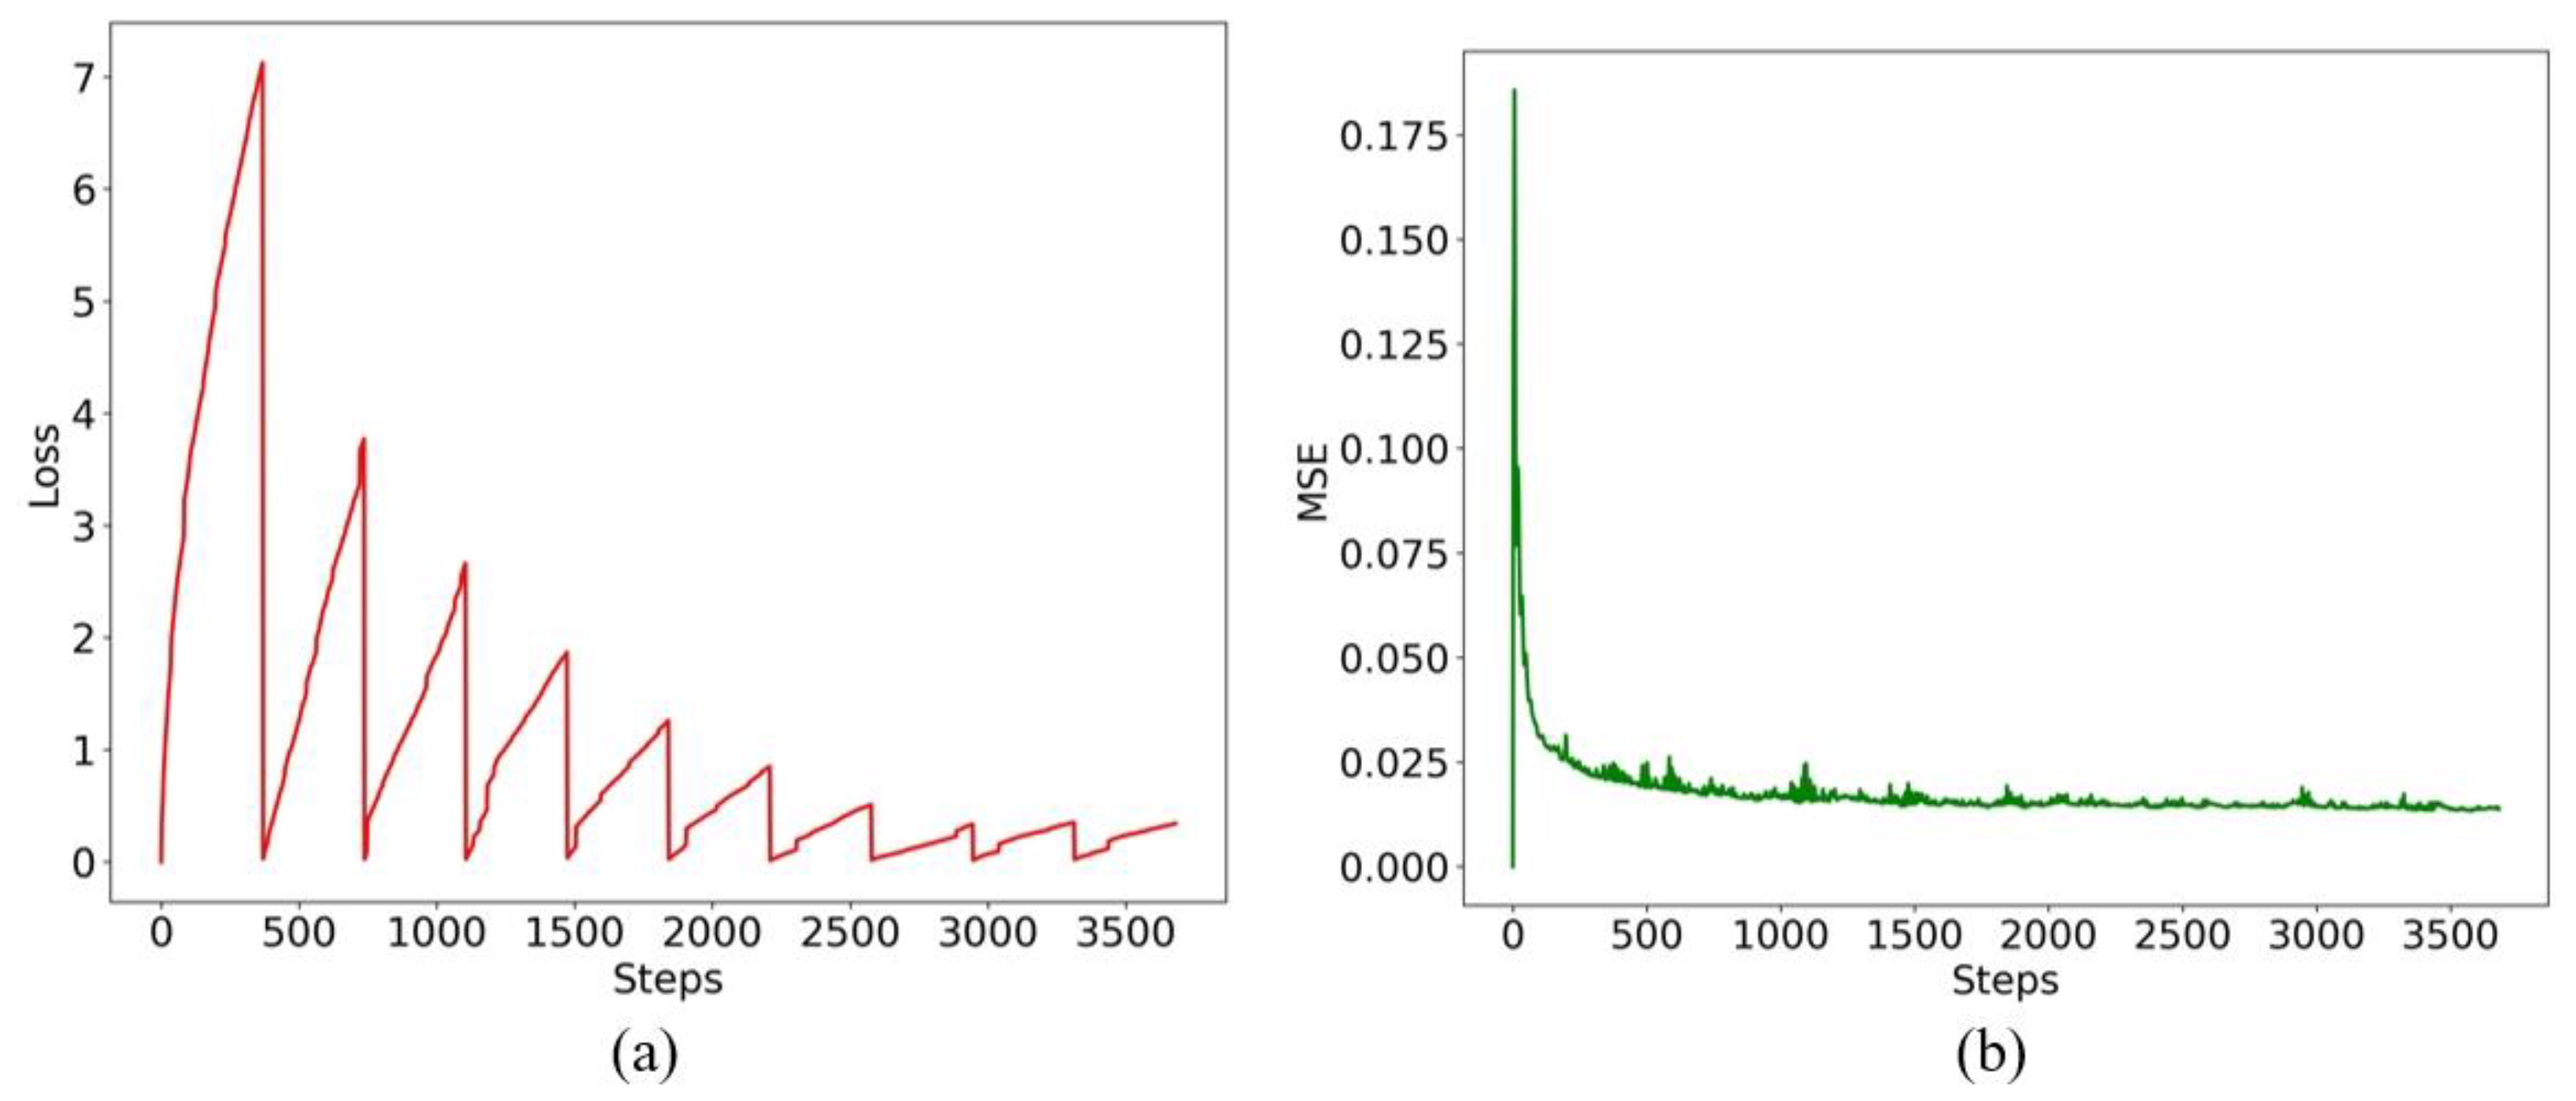
3.1. Experimental Results and Analysis

Figure 5 shows how the loss values and validation errors change during the iterative training process. As the number of training steps increased, the loss value steadily decreased. This continuous reduction in training loss indicates that the model gradually optimizes its parameters to better capture the emotional features in the input data. Meanwhile, the validation error on the validation dataset also showed a steady decline and eventually stabilized. This further demonstrates that the model not only fit the training data well but also has a strong generalization ability for new data to some extent.
To validate the effectiveness of the model, we compared it with models used in previous urban perception studies. The residual network (ResNet), as a deep CNN, excels in processing image data [52]. The recurrent neural network (RNN) was used by Hong et al. for park environment perception analysis [53], and long short-term memory (LSTM) was employed by Ren et al. in their study of urban park satisfaction [54]. As shown in Table 1, significant differences exist in the performance of the various models in the multimodal park affective tendency prediction task. ResNet has relatively higher error metrics in this task, with an R2 value of 0.7992, indicating limitations in fitting complex relationships. In contrast, traditional sequence models such as RNN and LSTM perform better. The error metrics for RNN, including MSE, MAE, and RMSE, are 0.0278, 0.1325, and 0.1764, respectively, outperforming ResNet. Moreover, the R2 value of RNN is 0.8174. These results demonstrated its advantage in handling time series. LSTM further improved RNN’s performance. Its error metrics of MSE, MAE, and RMSE are at 0.0199, 0.1163, and 0.1345, respectively, and its R2 value is 0.94.
The proposed model outperformed all other models across all evaluation metrics, with an MSE of 0.0109, an MAE of 0.0781, an RMSE of 0.1044, and an R2 value of 0.9819 (Table 1). Our model not only fits the training data more accurately but also excels in generalization. It effectively captures the complex relationships between text and images, thereby more precisely predicting emotional tendencies. The results show that by integrating multimodal information and introducing the bidirectional cross-attention mechanism, our model significantly enhances prediction performance.
In order to assess the consistency of the model predictions with subjective user experience, a small sample of manual evaluations was conducted. We first randomly selected 50 samples from the test set, each consisting of an image and its corresponding textual description. Next, we invited 50 users to participate in the assessment process, and all participants went through a short training to understand the process and criteria of the assessment. During the evaluation process, each user will view 50 samples. Subsequently, the user needs to evaluate the prediction results of the four models (our model, ResNet, RNN, LSTM) for each sample, categorized as “Agree” and “Disagree”. “Agree” indicates that the user believes that the model’s predictions are consistent with their emotional experience. “Disagree” indicates that the user believes that the model’s predictions are inconsistent with their emotional experience. Each choice will be recorded on a rating scale, which results in an evaluation that includes each user, each sample, and each model. As shown in Table 2, in the manual evaluation, our model has a higher percentage of agreement than the other three models among all users. The evaluation indicates that our model achieves better consistency in the subjective user experience, proving the validity of the model.

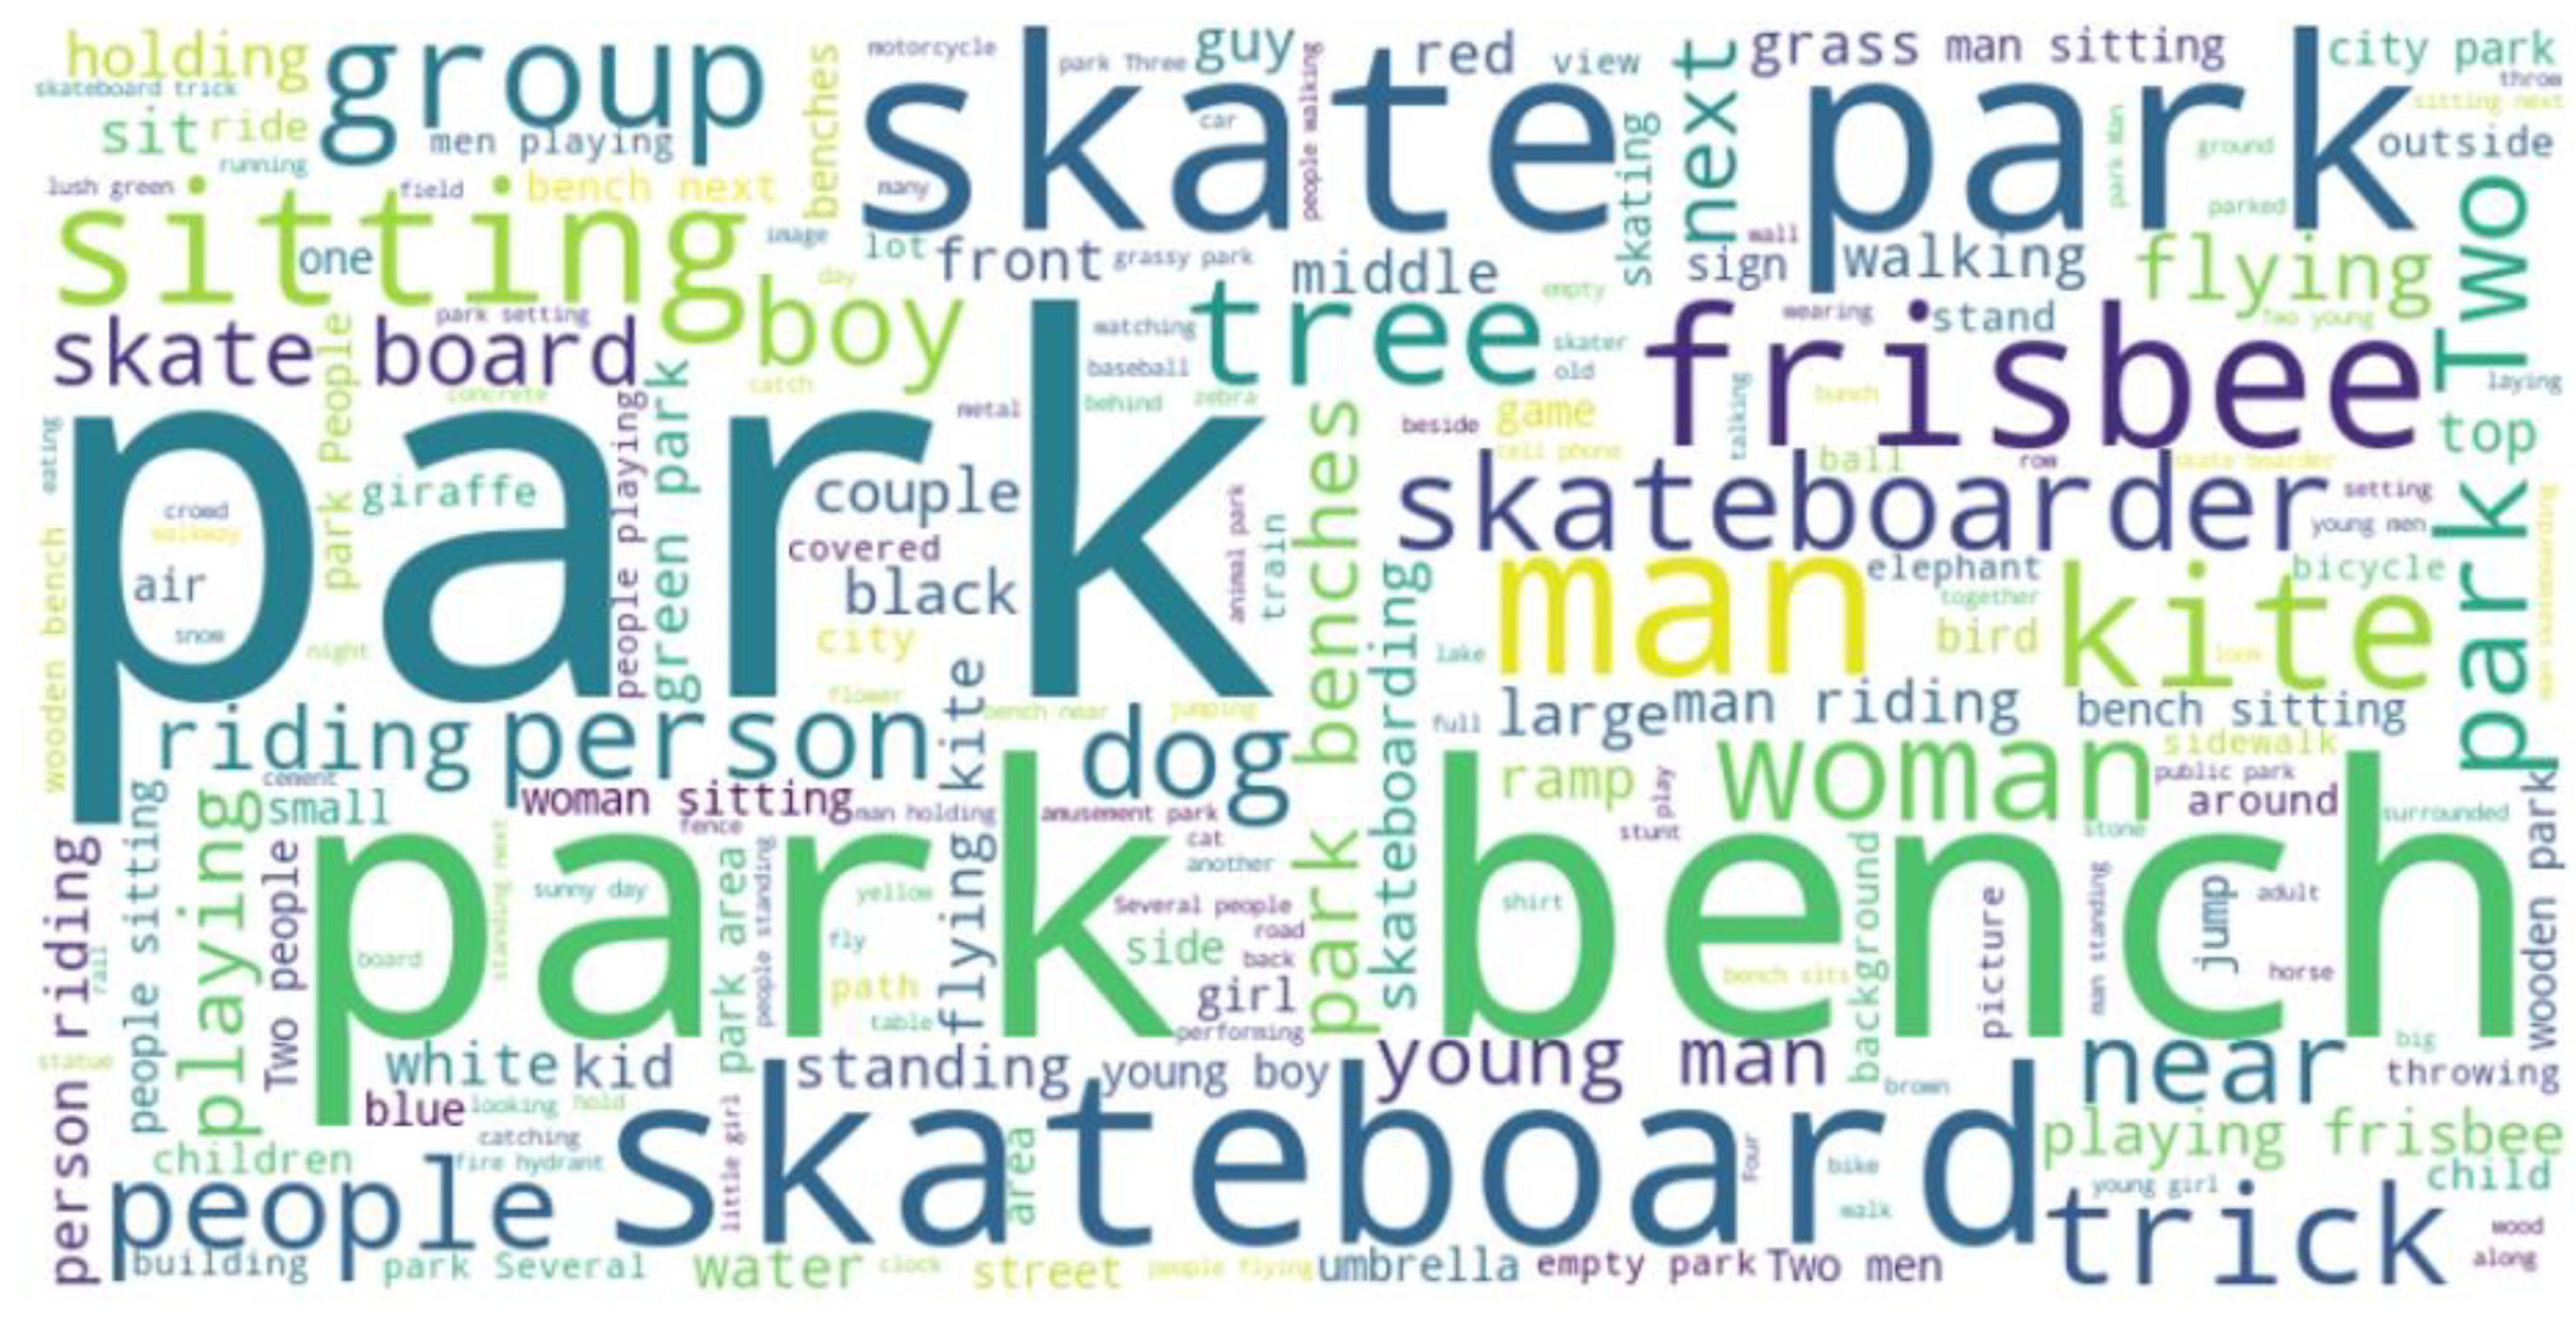
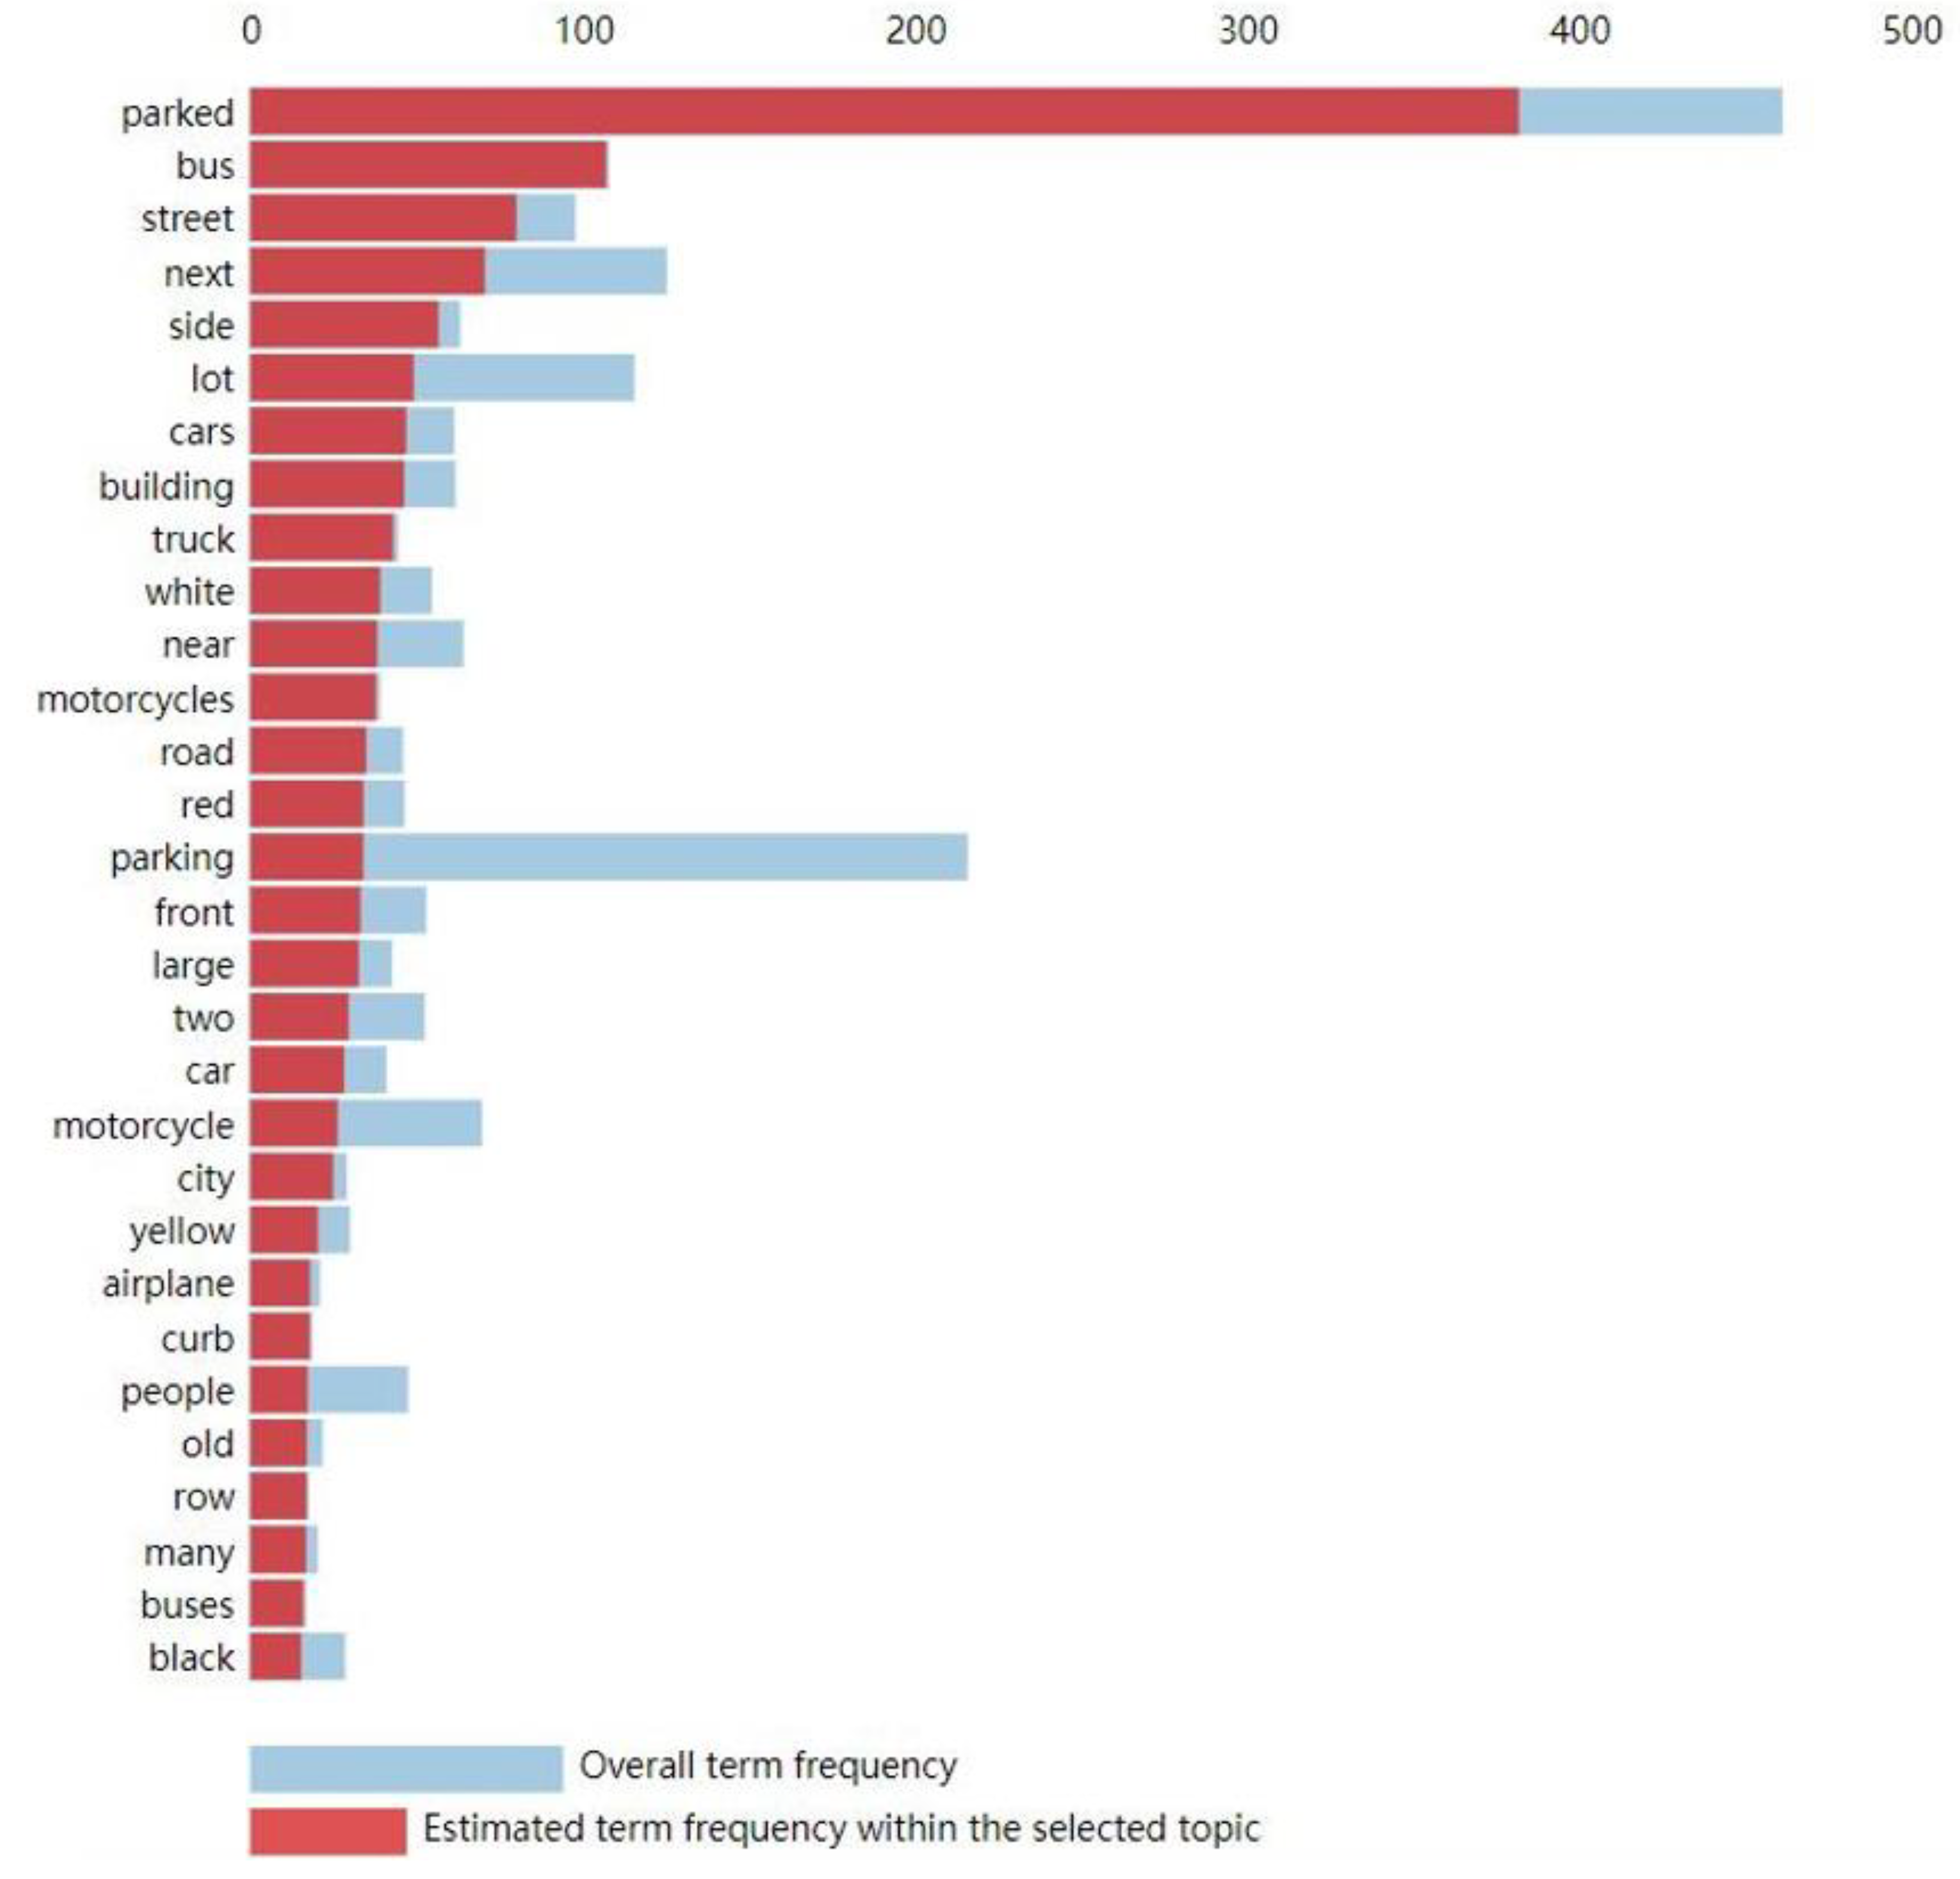
3.2. Theme Word Analysis

As shown in Figure 6, a heat map visualization of the input text was generated for the model using the SHapley Additive exPlanations (SHAP) method. SHAP is a game theory-based approach that explains the output of a complex model by calculating the contribution of each feature to the prediction [55]. The SHAP value measures the marginal contribution of a feature across all possible combinations of features, thus providing a global and local framework for interpretation. This paper reveals which keywords have the most significant impact on predicting the emotional tendencies of park visitors using SHAP, helping intuitively understand the logic behind the model’s decisions. Figure 6 illustrates four specific input text cases. Red represents positive sentiment polarity, while blue represents negative sentiment polarity. The darker the color depth of the text vocabulary, the more critical the park visitor’s emotional tendency embodied by the word.
Figure 7 is the analysis of term importance, which compares the overall word frequency in the entire dataset with the word frequency related to specific sentiment polarity themes. The horizontal axis represents the frequency of occurrence of words. The vertical axis lists the different words. Light blue represents the overall word frequency of the term in the entire dataset, while red represents the frequency of the term related to specific sentiment polarity themes.
As shown in Figure 6 and Figure 7, the theme words “water”, “driveway”, “sky”, “green”, and “near” show relatively high heat values in the input text, indicating that these words have a significant effect on the model’s prediction of park visitors’ emotional tendencies. For instance, the high heat values of “water” and “green” reflect the importance of natural landscapes to visitors’ emotional experiences, whereas the high heat values of “driveway” and “near” suggest the influence of external environmental factors on visitor satisfaction. In addition, red words such as “grass” and “car” indicate positive affective tendencies towards the park. Blue words such as “dirt” and “lone” indicate negative affective tendencies towards the park. This analysis not only helps identify key emotional drivers but also provides a scientific basis for subsequent park management and optimization. By focusing on these high-impact keywords, park managers can make targeted improvements to the park’s overall environmental quality, thus enhancing visitors’ emotional experiences and satisfaction.

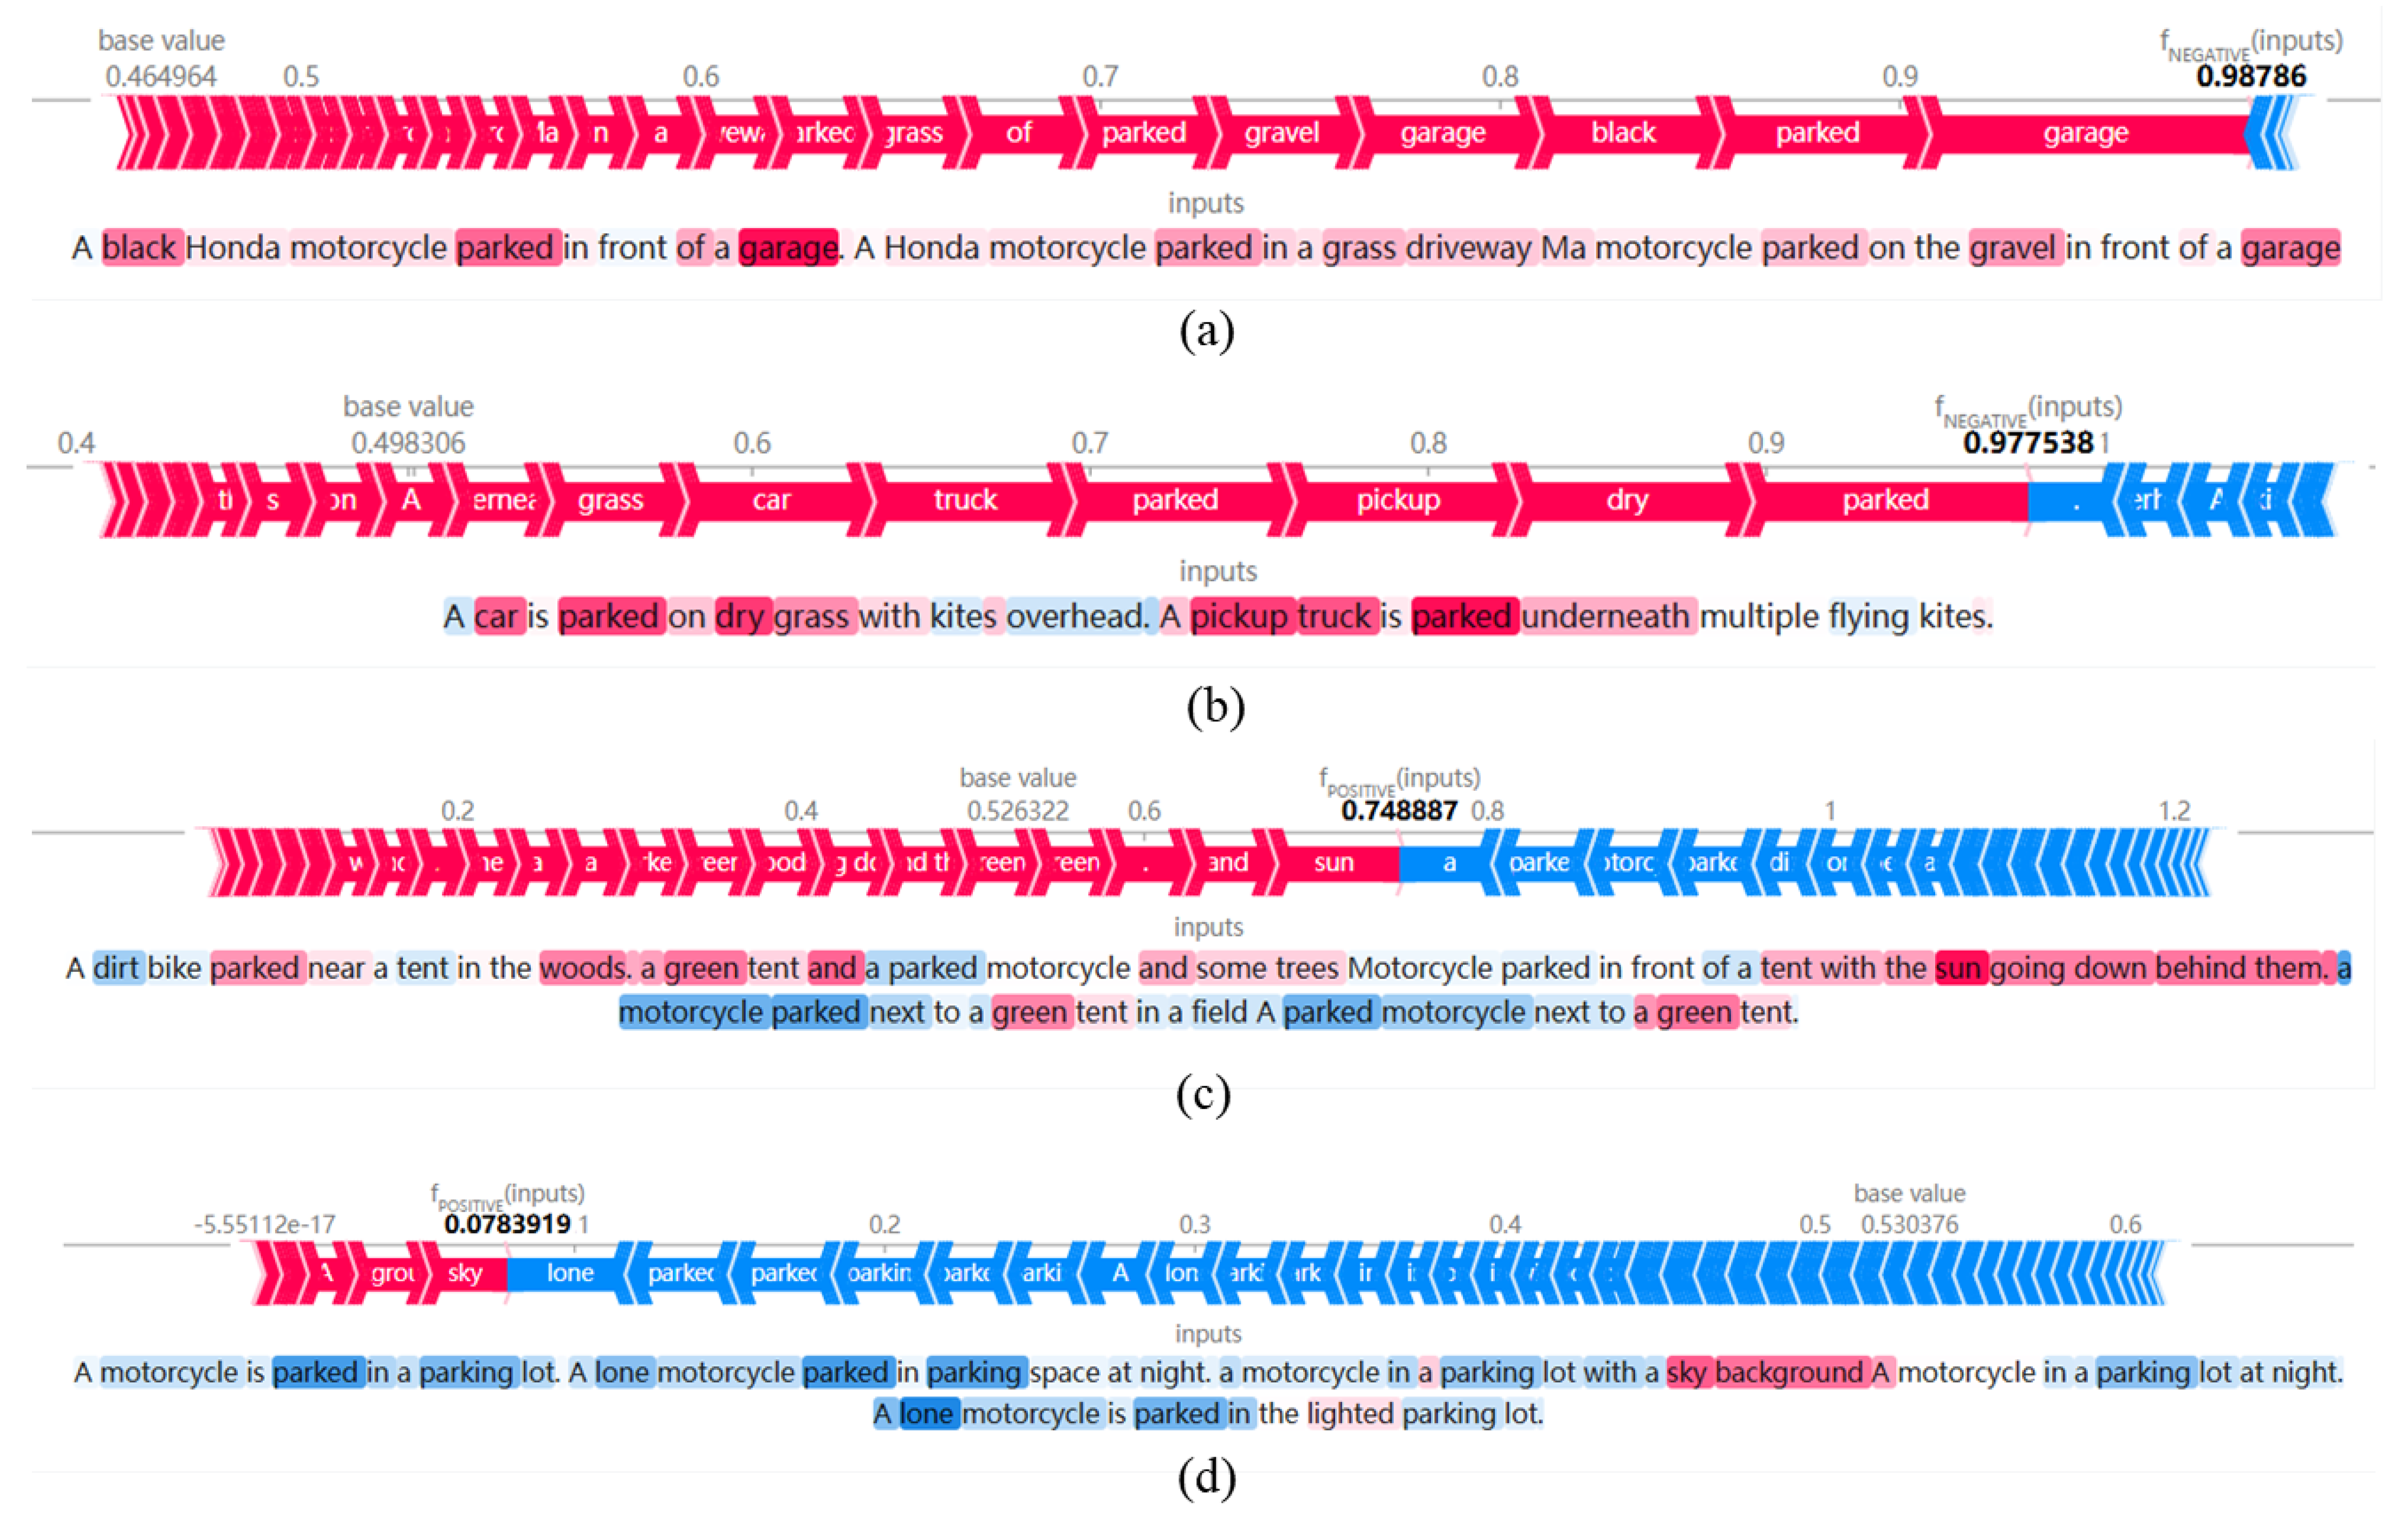
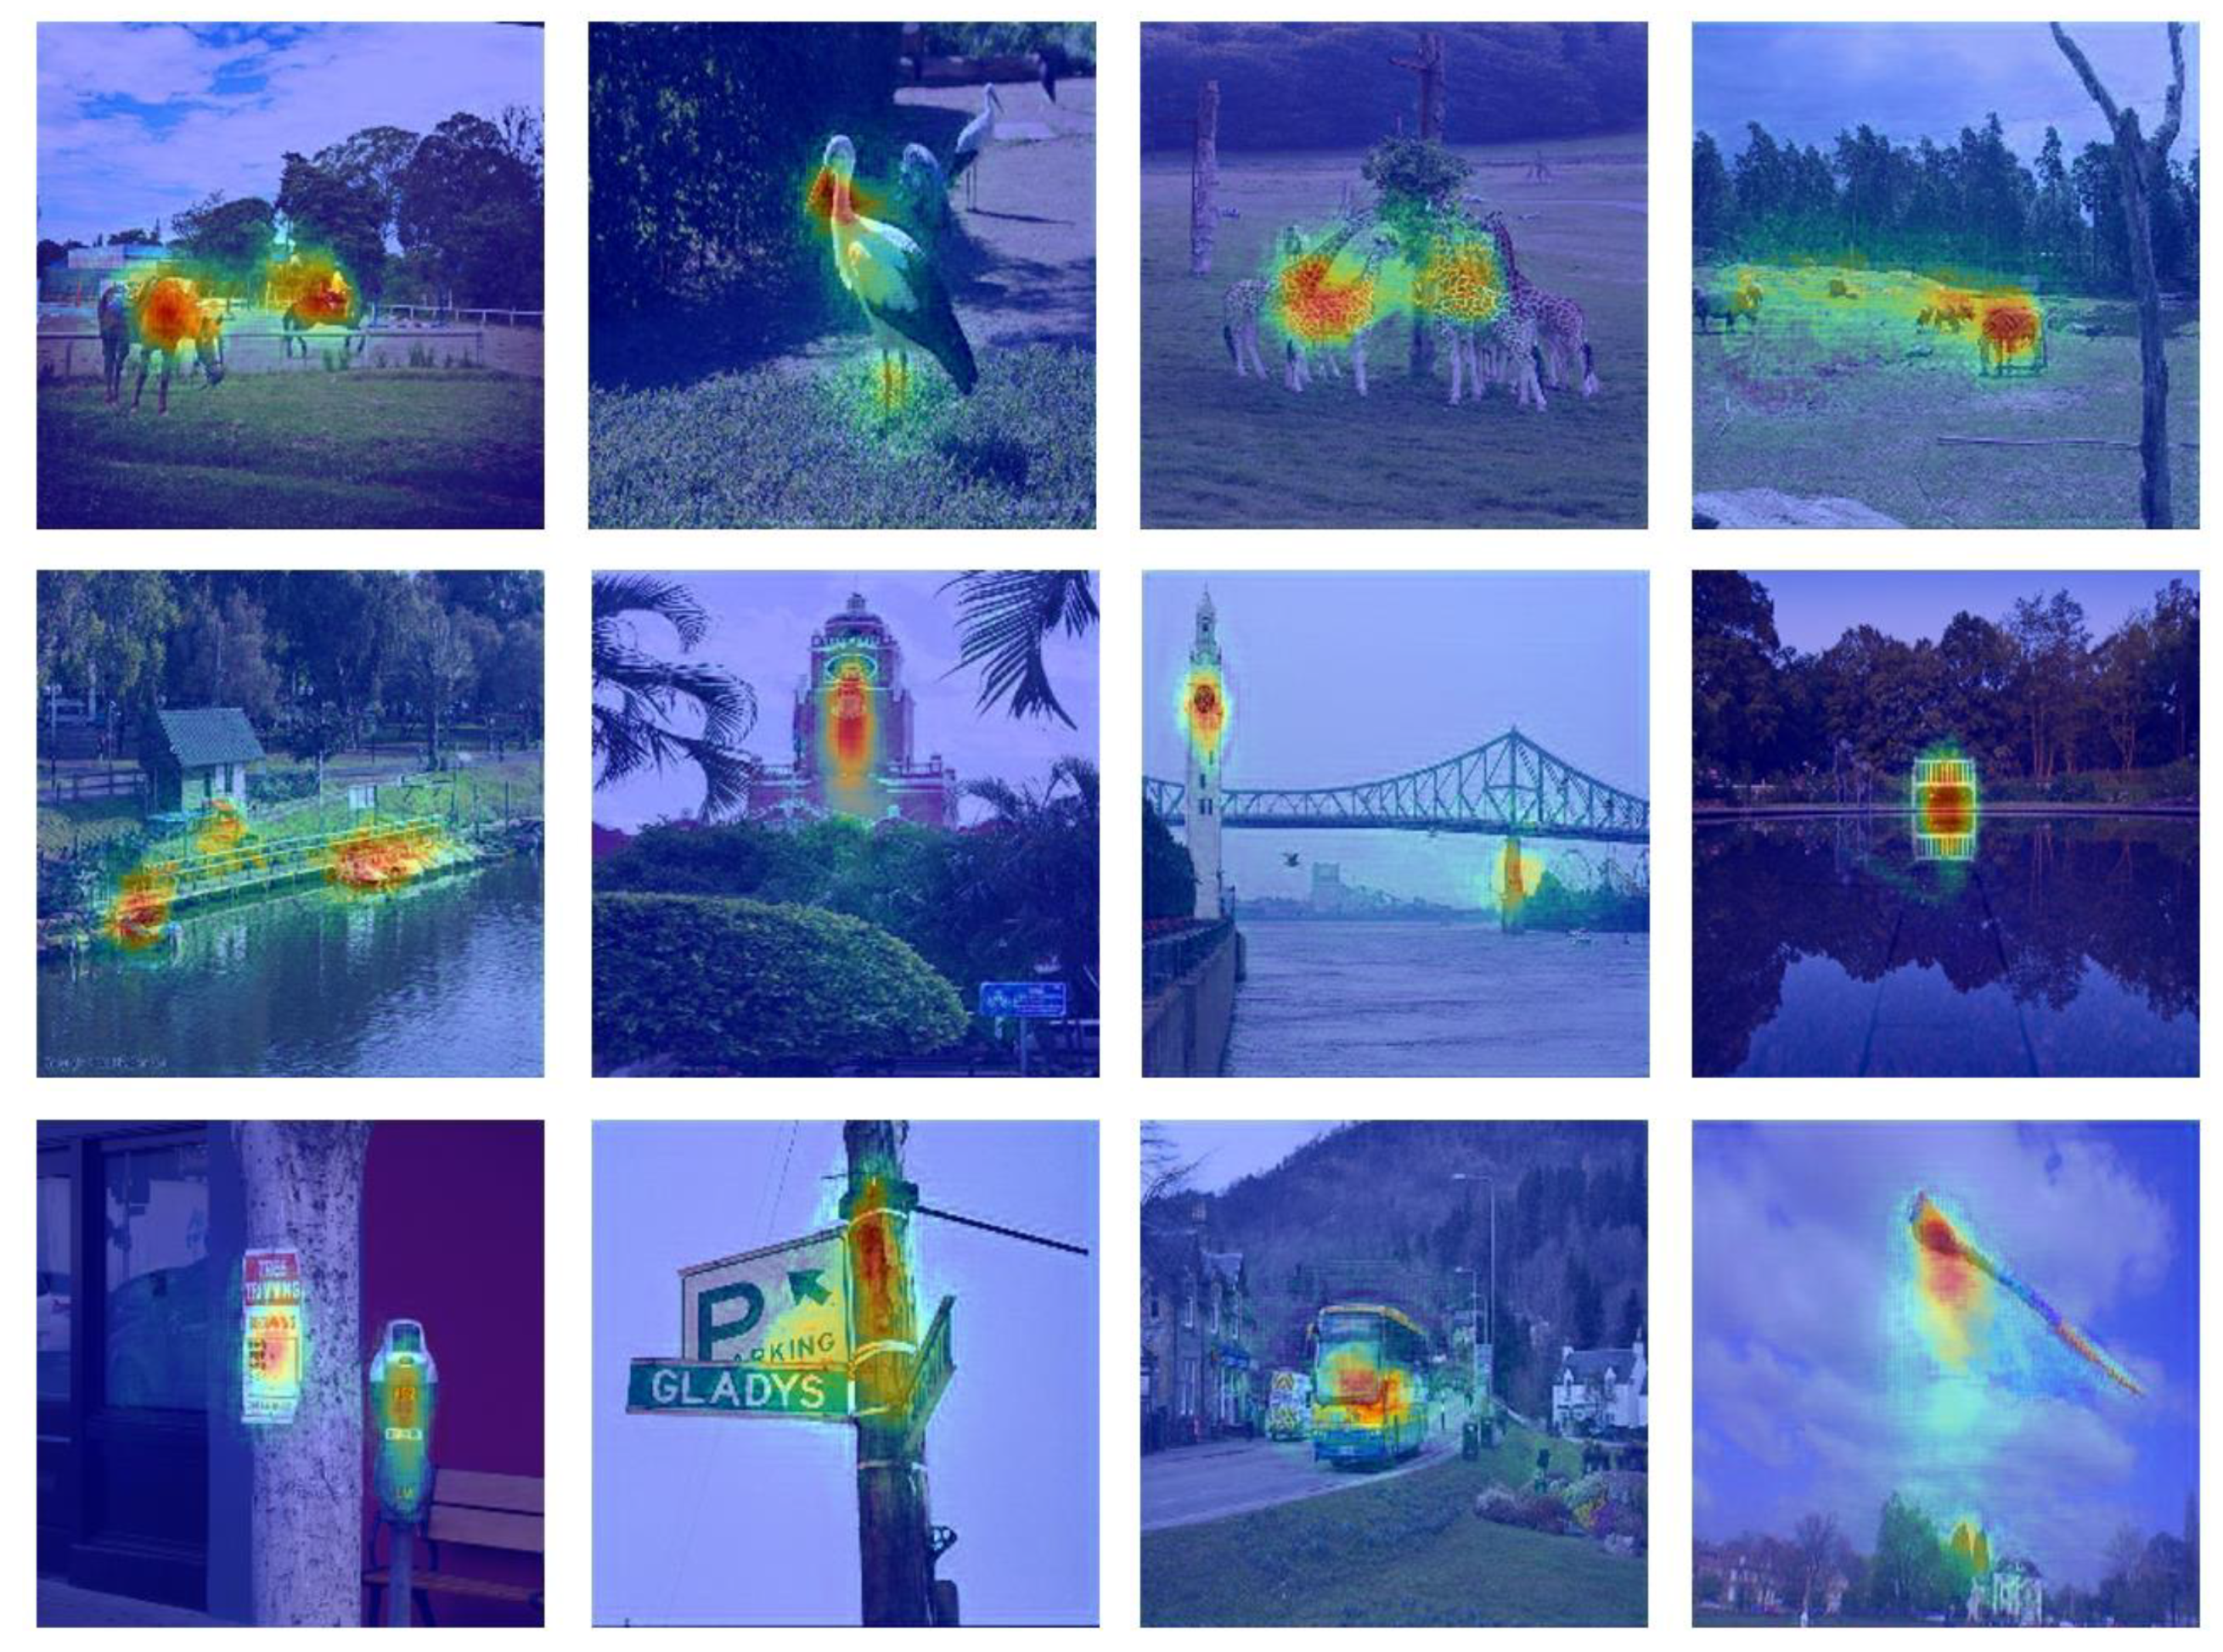
3.3. Saliency Analysis

Saliency analysis plays a key role in image understanding, especially when combining text and image data. Saliency refers to certain areas of an image or specific words in a text having a particularly significant impact on the overall emotional experience. By identifying these salient elements, the emotional tendencies of visitors and their interaction with the environment can be captured more accurately.
As shown in Figure 8, salient region analysis helps us identify the parts of the image that attract the most attention from visitors, such as kites, animals, and landscapes in the park. These regions are often closely related to visitors’ emotional experiences, and an in-depth analysis of these regions can reveal visitors’ points of focus and preferences in the park.

4. Discussion

4.1. Methodological Contributions

The proposed park perception understanding method, which is based on multimodal text–image data and the bidirectional attention mechanism, performed well in experiments. Compared with traditional methods such as ResNet, RNN, and LSTM, our method excels in several evaluation metrics, including MSE, MAE, RMSE, and R2. This advantage is mainly attributed to the model’s ability to effectively integrate text and image features, thereby capturing the complex interactions between them through the bidirectional cross-attention mechanism. The design of the bidirectional attention mechanism allows textual and image information to mutually enhance each other, generating more comprehensive and representative feature representations. The introduction of the attention mechanism effectively handles the multimodal fusion of textual and visual features [56]. This approach demonstrates a strong adaptability for processing multimodal data.

4.2. Theoretical Reflections Based on Phenomenological and Neuroscientific Perspectives

In the study of public space perception, theories from phenomenology and neuroscience provide a deeper conceptual foundation for our research. Phenomenology emphasizes that humans perceive the world through multiple senses, and these perceptions are closely linked to emotions [57]. Our model comprehensively evaluates emotional experiences in parks by integrating both textual and visual sensory information. Neuroscience theories suggest that the integration of emotional cues is primarily driven by multisensory processes, where the brain synthesizes information from multiple senses [58]. Our model is capable of simultaneously analyzing both textual and visual information, similar to how the brain processes these types of data. Furthermore, research has shown that factors such as sound and odor can also influence an individual’s emotional state [59]. Future research will further explore the incorporation of multisensory factors into park perception models.

4.3. Key Factors Influencing Visitors’ Emotional Experiences

Thematic word analysis and significance analysis demonstrated the key elements that may influence the affective tendencies of park visitors. The theme words “water”, “driveway”, “sky”, and “green” have a significant impact on the model’s prediction of park visitors’ affective tendencies. Managers can prioritize improving water systems and vegetation coverage based on the significant influence of “water” and “green”. Popular urban green spaces need to incorporate favorable natural elements and facilities that meet user needs [60]. The type of park elements can influence the importance of visitors’ perceptual indicators. “Water” and “green” are both among the more significant perceptual indicators in the park environment [61]. Meanwhile, the faunal elements identified by the saliency analysis suggest that urban parks may need to focus on enhancing biodiversity. Urban green spaces with rich biodiversity can improve the attention levels of respondents after they are in close contact with such environments [62]. Managers and researchers should monitor the dynamic changes in visitors’ perceived satisfaction with the environment and make timely adjustments to the perceived elements as required [63,64]. As a theme word, “sky” has a high level of heat in the input text. It has not received as much attention as “water” and “green” in previous park perception factors. Understanding that “sky” may be an important perceptual factor for park visitors, park managers, and designers can optimize park activity areas and landscapes for weather and seasonal changes to enhance the emotional experience of visitors. The practical application of the above analysis results may be influenced by the representativeness of the data and the accuracy of model interpretation. Their reliability can be further validated through field research in the future.

4.4. Practical Applications of the Model

The model can provide decision support for future smart park planning. Designers can use the model for emotional simulation assessment and feature sensitivity analysis. During the park design phase, designers can evaluate the emotional effects of different scenarios by inputting renderings and associated text of park design options and allowing the model to predict the emotional responses of potential visitors. Additionally, designers can identify key environmental elements that affect visitors’ emotions through theme word analysis based on the SHAP methodology and then reinforce important positive elements in the design.
The model can be used as a real-time monitoring system to dynamically assess the park environment and visitor experience, providing a feedback system for city managers. The model is integrated with a Geographic Information System (GIS) to generate an “emotion map” using pictures and comments uploaded by visitors, which visualizes the distribution of emotions in different areas of the park. Managers can use the model to identify emotional hotspots and cold zones, providing a basis for resource allocation in the park. In addition, park environments may change seasonally, producing different emotional effects on visitors. The model is able to analyze this seasonal variation and assist managers in developing seasonal park environment optimization strategies.

4.5. Limitations and Future Work

The model has high computational complexity, particularly that the bidirectional cross-attention mechanism and windowing computations of the Swin Transformer require high-performance hardware (e.g., 4090 GPUs). This may limit its deployment in resource-constrained environments. Future research may consider further exploration around model lightweight, efficient computation, and hardware co-optimization.
The experiment utilized a park subset of the COCO Caption dataset. Although it provides high-quality images and corresponding descriptive texts, these contents were not generated by real users in natural interaction scenarios. As a result, these data may lack the nuance, naturalness, and complexity of sentiment expression found in real social media data. This discrepancy implies that although our model performs well on the COCO Caption dataset, its generalization ability may be somewhat compromised when applied directly to analyze real social media graphic data, especially in terms of capturing nuanced sentiment or understanding specific cultural contexts. Future research will further explore the effectiveness of the model in real-world social media data assessment tasks to improve the reliability and usefulness of its application.
The applicability of the model in different types of park environments has to be evaluated and validated. Urban parks contain a variety of types, such as urban pocket parks, forest parks, coastal parks, and community green spaces. Different types of parks exhibit variations in spatial scale, functional positioning, and landscape features. Visitors’ emotional responses may vary depending on the type, scale, or function of the park. For example, people may be more concerned with natural elements such as vegetation and landscape in forest parks [65]. At the same time, users in urban pocket parks may be more concerned with the facilities and social interactions within the site [66]. The ability of the model to generalize for different types of parks requires more testing and validation in the future.
The research model focuses on experimental validation based on the COCO Caption dataset, with no case validation studies or consideration of the effects of differences in geographic patterns, environmental factors, and socio-cultural backgrounds. Differences in the above factors may also affect the adaptability of the model. Therefore, future research will further assess the generalizability and validity of the model by incorporating diverse case studies covering different park geographic, environmental, and cultural contexts.
In our approach, we used expert ratings for the emotional tendency labeling of texts. In the emotion classification system, Plutchik’s wheel subdivided emotions into a variety of basic emotions, and by refining the emotion labels, it is possible to capture the diversity of emotions in a text [67]. The valence–arousal model, on the other hand, is able to quantify the positive and negative affectivity as well as the degree of activation, which can enrich the dimensionality of affect analysis [68]. In future research, we plan to further explore park visitors’ emotion assessment studies by refining emotion labels and emotion intensity in conjunction with the emotion classification system.
As part of this work, we analyzed the contribution of the input text to the prediction results through the SHAP tool, which enhances the interpretability of the text part. At the same time, we investigated the distribution of visual elements through the significance analysis in the experiment and explored the visitors’ points of interest in the visual elements of the park, which further improved the interpretability of the model. Future research could incorporate statistical data and utilize visualization tools from machine learning models such as XGBoost (XGB) and LightGBM (LGB) to further explore the impact of various features, such as the number of park visitors, types and quantities of infrastructure, and other numerical characteristics, thereby providing more comprehensive interpretability analysis.

5. Conclusions

To address the challenges of multimodal feature fusion and cross-modal interaction, this study developed an innovative cross-modal framework that effectively integrates textual and image data using a bidirectional attention mechanism to improve the understanding and prediction of visitors’ emotional tendencies in a park environment. The main conclusions are as follows:
  • The combination of BERT-based text feature extraction and Swin Transformer-based image feature extraction, along with the bidirectional cross-attention mechanism, enables the model to capture the deep interaction between text and images, thereby improving the accuracy of emotional tendency prediction.
  • Compared with traditional methods such as ResNet, RNN, and LSTM, our method excels in several evaluation metrics, including MSE, MAE, RMSE, and R2. This confirms the advantages of the model in handling complex sentiment analysis tasks.
  • The theme word analysis conducted using the SHAP method identified key factors, such as “water”, “green”, and “sky”, that significantly impact visitors’ emotional experiences. These findings not only contribute to a deeper understanding of the emotional drivers of visitors but also provide park managers with concrete directions for enhancing the park environment.
This study has limitations in terms of model computational complexity, data characteristics, scenario applicability, and case validation. First, the computational complexity of the model is high and requires high-performance hardware support, limiting its ability to be deployed in resource-constrained environments. Second, the COCO Caption dataset used in the study, while containing high-quality image–text pairs, may lack the nuance and sentiment expression found in real social media data, which may affect the generalization ability of the model. Further, the validation of the model’s applicability in different types of park environments has not yet been undertaken, and differences in park types may influence visitors’ affective responses. Finally, the current study does not take into account differences in geographical patterns, environmental factors, and socio-cultural contexts, and there is a need to assess the generalizability of the model in more real-world cases.
Future research can be further developed in terms of model weights, the application of real social media data, different park types, and geo-cultural adaptations. Specifically, future work will explore how to make the model run efficiently in environments with limited computational resources and validate the model’s effectiveness in real-world social media data, as well as conduct in-depth tests of the effects of differences in park type and cultural context. In addition, the study plans to further improve the emotion assessment and interpretability of the model by refining the emotion labels, introducing an emotion classification system, and combining other interpretability methods, among other things.
In summary, this study offers an efficient solution for park emotion perception and understanding through an innovative multimodal framework and bidirectional attention mechanism. This technical framework not only addresses the limitations of unimodal assessment methods but also overcomes the technical obstacle of simple multimodal fusion that makes it difficult to capture deep semantic associations across modalities. The method is able to accurately assess the emotional tendencies of visitors while capturing textual information and image features of the park environment, which enhances the comprehensiveness of urban public space assessment. With future technological optimizations and expanded applications, this method is expected to play an even greater role in environmental management and design optimization.

Author Contributions

Conceptualization, data curation, methodology, software, validation, original draft, visualization, writing—review and editing, K.C.; conceptualization, methodology, visualization, writing—review and editing, X.L.; conceptualization, methodology, software, validation, T.X.; data curation, methodology, visualization, R.B. All authors have read and agreed to the published version of the manuscript.

Funding

This research was funded by the Guangdong Province Philosophy and Social Sciences 2023 Annual Discipline Co-construction Project (Grant No. GD23XSH15).

Data Availability Statement

The original contributions presented in this study are included in the article. Further inquiries can be directed to the corresponding author.

Acknowledgments

We thank Editage (https://www.editage.cn) for their linguistic assistance during the preparation of this manuscript (accessed on 21 March 2025).

Conflicts of Interest

Author Tao Xia from company Zhuhai Dechuang Construction Engineering Consulting Limited Company. The remaining authors declare that the research was conducted in the absence of any commercial or finaical relationships that could be construed as a potential conflicts of interest.

Abbreviations

The following abbreviations are used in this manuscript:
BERTBidirectional Encoder Representations from Transformers
CNNConvolutional Neural Network
FFNFeed-Forward Neural Network
LSTMLong Short-Term Memory
MAEMean Absolute Error
MSEMean Squared Error
ReLURectified Linear Unit
RMSERoot Mean Squared Error
RNNRecurrent Neural Network
SHAPSHapley Additive exPlanations

References

  1. Kong, L.; Liu, Z.; Pan, X.; Wang, Y.; Guo, X.; Wu, J. How Do Different Types and Landscape Attributes of Urban Parks Affect Visitors’ Positive Emotions? Landsc. Urban Plan. 2022, 226, 104482. [Google Scholar] [CrossRef]
  2. Kabisch, N.; Kraemer, R.; Masztalerz, O.; Hemmerling, J.; Püffel, C.; Haase, D. Impact of Summer Heat on Urban Park Visitation, Perceived Health and Ecosystem Service Appreciation. Urban For. Urban Green. 2021, 60, 127058. [Google Scholar] [CrossRef]
  3. Bedla, D.; Halecki, W. The Value of River Valleys for Restoring Landscape Features and the Continuity of Urban Ecosystem Functions—A Review. Ecol. Indic. 2021, 129, 107871. [Google Scholar] [CrossRef]
  4. Wang, Y.; Chen, F. Research on Environmental Behavior of Urban Parks in the North of China during Cold Weather—Nankai Park as a Case Study. Buildings 2024, 14, 2742. [Google Scholar] [CrossRef]
  5. Wu, Y.; Zhou, W.; Zhang, H.; Liu, Q.; Yan, Z.; Lan, S. Relationships between Green Space Perceptions, Green Space Use, and the Multidimensional Health of Older People: A Case Study of Fuzhou, China. Buildings 2024, 14, 1544. [Google Scholar] [CrossRef]
  6. Fagerholm, N.; Eilola, S.; Arki, V. Outdoor Recreation and Nature’s Contribution to Well-Being in a Pandemic Situation—Case Turku, Finland. Urban For. Urban Green. 2021, 64, 127257. [Google Scholar] [CrossRef]
  7. Liu, S.; Wang, X. Reexamine the Value of Urban Pocket Parks under the Impact of the COVID-19. Urban For. Urban Green. 2021, 64, 127294. [Google Scholar] [CrossRef]
  8. Puhakka, R. University Students’ Participation in Outdoor Recreation and the Perceived Well-Being Effects of Nature. J. Outdoor Recreat. Tour. 2021, 36, 100425. [Google Scholar] [CrossRef]
  9. Wei, H.; Hauer, R.J.; Sun, Y.; Meng, L.; Guo, P. Emotional Perceptions of People Exposed to Green and Blue Spaces in Forest Parks of Cities at Rapid Urbanization Regions of East China. Urban For. Urban Green. 2022, 78, 127772. [Google Scholar] [CrossRef]
  10. Cheng, Y.; Zhang, J.; Wei, W.; Zhao, B. Effects of Urban Parks on Residents’ Expressed Happiness before and during the COVID-19 Pandemic. Landsc. Urban Plan. 2021, 212, 104118. [Google Scholar] [CrossRef]
  11. Chen, X.; Kang, J. Natural Sounds Can Encourage Social Interactions in Urban Parks. Landsc. Urban Plan. 2023, 239, 104870. [Google Scholar] [CrossRef]
  12. Bi, X.; Gan, X.; Jiang, Z.; Li, Z.; Li, J. How Do Landscape Patterns in Urban Parks Affect Multiple Cultural Ecosystem Services Perceived by Residents? Sci. Total Environ. 2024, 946, 174255. [Google Scholar] [CrossRef] [PubMed]
  13. Himschoot, E.A.; Crump, M.C.; Buckley, S.; Cai, C.; Lawson, S.; White, J.; Beeco, A.; Taff, B.D.; Newman, P. Feelings of Safety for Visitors Recreating Outdoors at Night in Different Artificial Lighting Conditions. J. Environ. Psychol. 2024, 97, 102374. [Google Scholar] [CrossRef]
  14. Xie, C.; Zhao, M.; Li, Y.; Tang, T.; Meng, Z.; Ding, Y. Evaluating the Effectiveness of Environmental Interpretation in National Parks Based on Visitors’ Spatiotemporal Behavior and Emotional Experience: A Case Study of Pudacuo National Park, China. Sustainability 2023, 15, 8027. [Google Scholar] [CrossRef]
  15. Tang, Z.; Zhao, Y.; Fu, M.; Wang, Y.; Xue, J. Which Factors Influence Public Perceptions of Urban Attractions?—A Comparative Study. Ecol. Indic. 2023, 154, 110541. [Google Scholar] [CrossRef]
  16. Huai, S.; Van De Voorde, T. Which Environmental Features Contribute to Positive and Negative Perceptions of Urban Parks? A Cross-Cultural Comparison Using Online Reviews and Natural Language Processing Methods. Landsc. Urban Plan. 2022, 218, 104307. [Google Scholar] [CrossRef]
  17. Yao, W.; Yun, J.; Zhang, Y.; Meng, T.; Mu, Z. Usage Behavior and Health Benefit Perception of Youth in Urban Parks: A Case Study from Qingdao, China. Front. Public Health 2022, 10, 923671. [Google Scholar] [CrossRef]
  18. Subiza-Pérez, M.; Hauru, K.; Korpela, K.; Haapala, A.; Lehvävirta, S. Perceived Environmental Aesthetic Qualities Scale (PEAQS)—A Self-Report Tool for the Evaluation of Green-Blue Spaces. Urban For. Urban Green. 2019, 43, 126383. [Google Scholar] [CrossRef]
  19. Rivera, E.; Timperio, A.; Loh, V.H.Y.; Deforche, B.; Veitch, J. Critical Factors Influencing Adolescents’ Active and Social Park Use: A Qualitative Study Using Walk-along Interviews. Urban For. Urban Green. 2021, 58, 126948. [Google Scholar] [CrossRef]
  20. Yoon, J.I.; Lim, S.; Kim, M.-L.; Joo, J. The Relationship between Perceived Restorativeness and Place Attachment for Hikers at Jeju Gotjawal Provincial Park in South Korea: The Moderating Effect of Environmental Sensitivity. Front. Psychol. 2023, 14, 1201112. [Google Scholar] [CrossRef]
  21. Mak, B.K.L.; Jim, C.Y. Contributions of Human and Environmental Factors to Concerns of Personal Safety and Crime in Urban Parks. Secur. J. 2022, 35, 263–293. [Google Scholar] [CrossRef]
  22. Chitra, B.; Jain, M.; Chundelli, F.A. Understanding the Soundscape Environment of an Urban Park through Landscape Elements. Environ. Technol. Innov. 2020, 19, 100998. [Google Scholar] [CrossRef]
  23. Powers, S.L.; Mowen, A.J.; Webster, N. Development and Validation of a Scale Measuring Public Perceptions of Racial Environmental Justice in Parks. J. Leis. Res. 2024, 55, 1–24. [Google Scholar] [CrossRef]
  24. Zhao, J.; Abdul Aziz, F.; Song, M.; Zhang, H.; Ujang, N.; Xiao, Y.; Cheng, Z. Evaluating Visitor Usage and Safety Perception Experiences in National Forest Parks. Land 2024, 13, 1341. [Google Scholar] [CrossRef]
  25. Gkoltsiou, A.; Paraskevopoulou, A. Landscape Character Assessment, Perception Surveys of Stakeholders and SWOT Analysis: A Holistic Approach to Historical Public Park Management. J. Outdoor Recreat. Tour. 2021, 35, 100418. [Google Scholar] [CrossRef]
  26. Gosal, A.S.; Geijzendorffer, I.R.; Václavík, T.; Poulin, B.; Ziv, G. Using Social Media, Machine Learning and Natural Language Processing to Map Multiple Recreational Beneficiaries. Ecosyst. Serv. 2019, 38, 100958. [Google Scholar] [CrossRef]
  27. Liu, W.; Hu, X.; Song, Z.; Yuan, X. Identifying the Integrated Visual Characteristics of Greenway Landscape: A Focus on Human Perception. Sustain. Cities Soc. 2023, 99, 104937. [Google Scholar] [CrossRef]
  28. Yang, C.; Zhang, Y. Public Emotions and Visual Perception of the East Coast Park in Singapore: A Deep Learning Method Using Social Media Data. Urban For. Urban Green. 2024, 94, 128285. [Google Scholar] [CrossRef]
  29. Zhao, X.; Huang, H.; Lin, G.; Lu, Y. Exploring Temporal and Spatial Patterns and Nonlinear Driving Mechanism of Park Perceptions: A Multi-Source Big Data Study. Sustain. Cities Soc. 2025, 119, 106083. [Google Scholar] [CrossRef]
  30. He, H.; Sun, R.; Li, J.; Li, W. Urban Landscape and Climate Affect Residents’ Sentiments Based on Big Data. Appl. Geogr. 2023, 152, 102902. [Google Scholar] [CrossRef]
  31. Wang, Z.; Miao, Y.; Xu, M.; Zhu, Z.; Qureshi, S.; Chang, Q. Revealing the Differences of Urban Parks’ Services to Human Wellbeing Based upon Social Media Data. Urban For. Urban Green. 2021, 63, 127233. [Google Scholar] [CrossRef]
  32. Li, J.; Fu, J.; Gao, J.; Zhou, R.; Wang, K.; Zhou, K. Effects of the Spatial Patterns of Urban Parks on Public Satisfaction: Evidence from Shanghai, China. Landsc. Ecol. 2023, 38, 1265–1277. [Google Scholar] [CrossRef] [PubMed]
  33. Shang, Z.; Cheng, K.; Jian, Y.; Wang, Z. Comparison and Applicability Study of Analysis Methods for Social Media Text Data: Taking Perception of Urban Parks in Beijing as an Example. Landsc. Archit. Front. 2023, 11, 8. [Google Scholar] [CrossRef]
  34. Huai, S.; Liu, S.; Zheng, T.; Van De Voorde, T. Are Social Media Data and Survey Data Consistent in Measuring Park Visitation, Park Satisfaction, and Their Influencing Factors? A Case Study in Shanghai. Urban For. Urban Green. 2023, 81, 127869. [Google Scholar] [CrossRef]
  35. Kanahuati-Ceballos, M.; Valdivia, L.J. Detection of Depressive Comments on Social Media Using RNN, LSTM, and Random Forest: Comparison and Optimization. Soc. Netw. Anal. Min. 2024, 14, 44. [Google Scholar] [CrossRef]
  36. Luo, J.; Zhao, T.; Cao, L.; Biljecki, F. Water View Imagery: Perception and Evaluation of Urban Waterscapes Worldwide. Ecol. Indic. 2022, 145, 109615. [Google Scholar] [CrossRef]
  37. Yang, C.; Liu, T.; Zhang, S. Using Flickr Data to Understand Image of Urban Public Spaces with a Deep Learning Model: A Case Study of the Haihe River in Tianjin. IJGI 2022, 11, 497. [Google Scholar] [CrossRef]
  38. Zhang, K.; Chen, Y.; Li, C. Discovering the Tourists’ Behaviors and Perceptions in a Tourism Destination by Analyzing Photos’ Visual Content with a Computer Deep Learning Model: The Case of Beijing. Tour. Manag. 2019, 75, 595–608. [Google Scholar] [CrossRef]
  39. Pereira, R.; Mendes, C.; Ribeiro, J.; Ribeiro, R.; Miragaia, R.; Rodrigues, N.; Costa, N.; Pereira, A. Systematic Review of Emotion Detection with Computer Vision and Deep Learning. Sensors 2024, 24, 3484. [Google Scholar] [CrossRef]
  40. Chutia, T.; Baruah, N. A Review on Emotion Detection by Using Deep Learning Techniques. Artif. Intell. Rev. 2024, 57, 203. [Google Scholar] [CrossRef]
  41. Naseem, U.; Razzak, I.; Musial, K.; Imran, M. Transformer Based Deep Intelligent Contextual Embedding for Twitter Sentiment Analysis. Future Gener. Comput. Syst. 2020, 113, 58–69. [Google Scholar] [CrossRef]
  42. Hittawe, M.M.; Harrou, F.; Sun, Y.; Knio, O. Stacked Transformer Models for Enhanced Wind Speed Prediction in the Red Sea. In Proceedings of the 2024 IEEE 22nd International Conference on Industrial Informatics (INDIN), Beijing, China, 18–20 August 2024; pp. 1–7. [Google Scholar] [CrossRef]
  43. Filali, H.; Riffi, J.; Boulealam, C.; Mahraz, M.A.; Tairi, H. Multimodal Emotional Classification Based on Meaningful Learning. BDCC 2022, 6, 95. [Google Scholar] [CrossRef]
  44. Wang, Z.; Zhou, X.; Wang, W.; Liang, C. Emotion Recognition Using Multimodal Deep Learning in Multiple Psychophysiological Signals and Video. Int. J. Mach. Learn. Cyber. 2020, 11, 923–934. [Google Scholar] [CrossRef]
  45. Gandhi, A.; Adhvaryu, K.; Poria, S.; Cambria, E.; Hussain, A. Multimodal Sentiment Analysis: A Systematic Review of History, Datasets, Multimodal Fusion Methods, Applications, Challenges and Future Directions. Inf. Fusion. 2023, 91, 424–444. [Google Scholar] [CrossRef]
  46. Zhang, S.; Yang, Y.; Chen, C.; Zhang, X.; Leng, Q.; Zhao, X. Deep Learning-Based Multimodal Emotion Recognition from Audio, Visual, and Text Modalities: A Systematic Review of Recent Advancements and Future Prospects. Expert Syst. Appl. 2024, 237, 121692. [Google Scholar] [CrossRef]
  47. Wang, Q.; Xu, H.; Wen, Z.; Liang, B.; Yang, M.; Qin, B.; Xu, R. Image-to-Text Conversion and Aspect-Oriented Filtration for Multimodal Aspect-Based Sentiment Analysis. IEEE Trans. Affect. Comput. 2024, 15, 1264–1278. [Google Scholar] [CrossRef]
  48. Jiao, T.; Guo, C.; Feng, X.; Chen, Y.; Song, J. A Comprehensive Survey on Deep Learning Multi-Modal Fusion: Methods, Technologies and Applications. CMC 2024, 80, 1–35. [Google Scholar] [CrossRef]
  49. Devlin, J.; Chang, M.-W.; Lee, K.; Toutanova, K. BERT: Pre-Training of Deep Bidirectional Transformers for Language Understanding. In Proceedings of the 2019 Association for Computational Linguistics North American Chapter Conference: Human Language Technologies (NAACL HLT 2019), Minneapolis, Minnesota, 2–7 June 2019; Volume 1, pp. 4171–4186. [Google Scholar]
  50. Liu, Z.; Lin, Y.; Cao, Y.; Hu, H.; Wei, Y.; Zhang, Z.; Lin, S.; Guo, B. Swin Transformer: Hierarchical Vision Transformer Using Shifted Windows. In Proceedings of the 2021 IEEE/CVF International Conference on Computer Vision (ICCV), Montreal, QC, Canada, 10–17 October 2021; pp. 9992–10002. [Google Scholar] [CrossRef]
  51. Li, K.; Zhang, Y.; Li, K.; Li, Y.; Fu, Y. Image-Text Embedding Learning via Visual and Textual Semantic Reasoning. IEEE Trans. Pattern Anal. Mach. Intell. 2023, 45, 641–656. [Google Scholar] [CrossRef]
  52. Stateczny, A.; Praveena, H.D.; Krishnappa, R.H.; Chythanya, K.R.; Babysarojam, B.B. Optimized Deep Learning Model for Flood Detection Using Satellite Images. Remote Sens. 2023, 15, 5037. [Google Scholar] [CrossRef]
  53. Hong, X.; Huang, Z.; Wang, G.; Liu, J. Long-Term Perceptual Soundscape Modeling of Urban Parks: A Case Study of Three Urban Parks in Vancouver, Canada. Landsc. Archit. 2022, 29, 86–91. [Google Scholar] [CrossRef]
  54. Ren, W.; Zhan, K.; Chen, Z.; Hong, X.-C. Research on Landscape Perception of Urban Parks Based on User-Generated Data. Buildings 2024, 14, 2776. [Google Scholar] [CrossRef]
  55. Lundberg, S.M.; Lee, S.-I. A Unified Approach to Interpreting Model Predictions. In Proceedings of the Advances in Neural Information Processing Systems 30 (NIPS 2017), Long Beach, CA, USA, 4–9 December 2017; Volume 30. [Google Scholar]
  56. Lu, S.; Liu, M.; Yin, L.; Yin, Z.; Liu, X.; Zheng, W. The Multi-Modal Fusion in Visual Question Answering: A Review of Attention Mechanisms. PeerJ Comput. Sci. 2023, 9, e1400. [Google Scholar] [CrossRef] [PubMed]
  57. Lewicka, M. Place Attachment: How Far Have We Come in the Last 40 Years? J. Environ. Psychol. 2011, 31, 207–230. [Google Scholar] [CrossRef]
  58. Choo, C.M.; Bai, S.; Privitera, A.J.; Chen, S.-H.A. Brain Imaging Studies of Multisensory Integration in Emotion Perception: A Scoping Review. Neurosci. Biobehav. Rev. 2025, 172, 106118. [Google Scholar] [CrossRef] [PubMed]
  59. Rodriguez, M.; Kross, E. Sensory Emotion Regulation. Trends Cogn. Sci. 2023, 27, 379–390. [Google Scholar] [CrossRef]
  60. Xu, Z.; Georgiadis, T.; Cremonini, L.; Marini, S.; Toselli, S. The Perceptions and Attitudes of Residents Towards Urban Green Spaces in Emilia-Romagna (Italy)—A Case Study. Land 2024, 14, 13. [Google Scholar] [CrossRef]
  61. Zheng, T.; Yan, Y.; Lu, H.; Pan, Q.; Zhu, J.; Wang, C.; Zhang, W.; Rong, Y.; Zhan, Y. Visitors’ Perception Based on Five Physical Senses on Ecosystem Services of Urban Parks from the Perspective of Landsenses Ecology. Int. J. Sustain. Dev. World Ecol. 2020, 27, 214–223. [Google Scholar] [CrossRef]
  62. Douglas, J.W.A.; Evans, K.L. An Experimental Test of the Impact of Avian Diversity on Attentional Benefits and Enjoyment of People Experiencing Urban Green-space. People Nat. 2022, 4, 243–259. [Google Scholar] [CrossRef]
  63. Wang, H.; Zhu, L.; Zhao, C.; Zheng, S. Urban Ecological Risk Assessment Management Platform. Int. J. Sustain. Dev. World Ecol. 2018, 25, 477–482. [Google Scholar] [CrossRef]
  64. Tang, L.; Wang, L.; Li, Q.; Zhao, J. A Framework Designation for the Assessment of Urban Ecological Risks. Int. J. Sustain. Dev. World Ecol. 2018, 25, 387–395. [Google Scholar] [CrossRef]
  65. Chen, J.; Konijnendijk Van Den Bosch, C.C.; Lin, C.; Liu, F.; Huang, Y.; Huang, Q.; Wang, M.; Zhou, Q.; Dong, J. Effects of Personality, Health and Mood on Satisfaction and Quality Perception of Urban Mountain Parks. Urban For. Urban Green. 2021, 63, 127210. [Google Scholar] [CrossRef]
  66. Dong, J.; Guo, R.; Guo, F.; Guo, X.; Zhang, Z. Pocket Parks-a Systematic Literature Review. Environ. Res. Lett. 2023, 18, 083003. [Google Scholar] [CrossRef]
  67. Wang, X.; Tang, L.R.; Kim, E. More than Words: Do Emotional Content and Linguistic Style Matching Matter on Restaurant Review Helpfulness? Int. J. Hosp. Manag. 2019, 77, 438–447. [Google Scholar] [CrossRef]
  68. Wu, J.-L.; Chung, W.-Y. Sentiment-Based Masked Language Modeling for Improving Sentence-Level Valence–Arousal Prediction. Appl. Intell. 2022, 52, 16353–16369. [Google Scholar] [CrossRef]
Figure 1. Overall model architecture.
Buildings 15 01552 g001
Figure 2. BERT-based text feature extraction module and structure of attention mechanism: (a) attention mechanism; (b) substructures of attention mechanism; (c) multi-head attention.
Buildings 15 01552 g002
Figure 3. Swin-transformer structure.
Buildings 15 01552 g003
Figure 4. Word cloud statistics for data.
Buildings 15 01552 g004
Figure 5. Training loss and validation error curves for different iteration steps: (a) training loss curve; (b) validation error curve.
Buildings 15 01552 g005
Figure 6. SHAP-based heat map analysis of theme words: (a) Example 1; (b) Example 2; (c) Example 3; (d) Example 4. Red represents positive sentiment polarity, while blue represents negative sentiment polarity. The darker the color depth of the text vocabulary, the more critical the park visitor’s emotional tendency embodied by the word.
Buildings 15 01552 g006
Figure 7. Theme word importance analysis. Light blue represents the overall word frequency of the word across the dataset. The red color represents the number of times the word has a word frequency related to a specific emotional tendency theme.
Buildings 15 01552 g007
Figure 8. Analysis of salient regions in the image. The red areas in the figure represent the regions that attract the most attention.
Buildings 15 01552 g008
Table 1. Comparison of different models on MSE, MAE, RMSE, and R2 metrics.
MethodMSEMAERMSER2
ResNet0.03520.15780.22160.7992
RNN0.02780.13250.17640.8174
LSTM0.01990.11630.13450.9424
Our method0.01090.07810.10440.9819
Table 2. Comparison of the consistency of users’ subjective experiences.
MethodSatisfaction Rate of Manual Assessment of
Prediction Results
ResNet0.74
RNN0.82
LSTM0.86
Our method0.92
Disclaimer/Publisher’s Note: The statements, opinions and data contained in all publications are solely those of the individual author(s) and contributor(s) and not of MDPI and/or the editor(s). MDPI and/or the editor(s) disclaim responsibility for any injury to people or property resulting from any ideas, methods, instructions or products referred to in the content.

