Article

Toward Symmetry in Accessible Restrooms Design: Integrating KE, RST, and SVM for Optimized Emotional-Functional Alignment

1
School of Design Art and Media, Nanjing University of Science and Technology, Nanjing 210094, China
2
College of Design and Innovation, Tongji University, Shanghai 200092, China
3
Faculty of Arts and Humanities, University of Macau, Macao 999078, China
*
Authors to whom correspondence should be addressed.
These authors contributed equally to this work.
Buildings 2025, 15(9), 1567; https://doi.org/10.3390/buildings15091567
Submission received: 10 April 2025 / Revised: 3 May 2025 / Accepted: 4 May 2025 / Published: 6 May 2025

Abstract

Accessible restrooms must reconcile code-based functionality with the affective expectations of disabled users. This study develops an integrated Kansei Engineering (KE)–Rough Set Theory (RST)–Support Vector Machine (SVM) workflow that converts user emotions into verifiable design guidelines. Surveys and semi-structured interviews with 50 disabled participants produced nine Kansei words; factor analysis extracted three principal emotional factors—tidiness, utility and care—capturing 75.8% of total variance. The morphological decomposition of 60 restroom samples yielded 41 design attributes, from which RST attribute reduction isolated six critical features. An SVR model with a radial-basis kernel, trained on 90% of the data and validated on the remaining 10%, achieved R2 = 0.931 and RMSE = 0.085. The exhaustive prediction of 15,750 feasible design combinations pinpointed an optimal configuration; follow-up user testing confirmed the improvement in satisfaction (mean 5.1 on a seven-point scale). The KE–RST–SVM workflow thus offers a reproducible, data-driven path for harmonizing emotional and functional objectives in inclusive restroom design, and can be extended to other barrier-free facilities.

1. Introduction

Ensuring the accessibility of public facilities for individuals with disabilities is both a fundamental technical requirement and a reflection of social inclusion. Accessible design, an essential element in built environment planning, seeks to create barrier-free spaces that support equal participation for diverse users, such as individuals with disabilities [1]. Within high-traffic public areas, the availability of properly designed accessible restrooms is a key determinant of mobility and life satisfaction for this group. While many countries have implemented standards for accessible design, these guidelines often fail to address the real needs and emotional experiences of disabled users, leading to facilities that meet technical requirements but fall short of user expectations [2]. Much of the existing research primarily focuses on physical accessibility, with less attention given to the emotional and psychological needs of disabled users [3,4]. Consequently, bridging emotional and physical considerations through systematic, data-driven methods has become an urgent priority in inclusive design research.
From a symmetry-oriented design viewpoint, an inclusive restroom must sustain a dual equilibrium—spatial geometry and user experience—by choreographing circulation routes, sanitary fixtures, and assistive elements into a coherent layout that meets code requirements and nurtures users’ affective comfort. Yet prevailing practice remains anchored in technical compliance, leaving the symmetrical coupling among emotional response, functional performance, and ergonomic support [5] insufficiently explored—a gap this study tackles through its KE–RST–SVM workflow. Recently, Kansei Engineering (KE) has emerged as a crucial framework for exploring users’ emotional responses, thereby informing more user-centered, symmetrically balanced solutions [6]. Yet, when numerous and multifaceted design features must be evaluated, computational complexity increases, and existing research may fail to capture the symmetrical relationships that underlie user satisfaction. These challenges can be mitigated through Rough Set Theory (RST), a mathematical tool adept at processing ambiguous and partial data by trimming superfluous variables [7]. Parallel developments in machine learning, such as Backpropagation Neural Networks (BPNN) [8], Interactive Genetic Algorithms (IGA) [9], Convolutional Neural Networks (CNN) [10], and Generative Adversarial Networks (GAN) [11], have further facilitated the simulation of intricate, nonlinear dynamics linking user emotions to design parameters [12]. Among these, Support Vector Machine (SVM) stands out as a robust model well-suited for predicting and optimizing complex systems [13,14]. Despite the recent infusion of machine learning techniques into built environment scholarship, three critical gaps remain unresolved. First, KE investigations are still largely confined to building appearance or removable fittings rather than full-scale spatial configurations. For example, Montañana et al. [15] translated perceived “prestige” merely into real estate advertising imagery, without addressing the architectural context itself. Second, most SVM applications in architecture pursue performance optimization alone. Cheng et al. [16] applied machine learning to thermo-environmental audits, while Han et al. [17] employed an SVR–PSO hybrid model to predict ventilation efficiency. Although these studies demonstrate the technical viability of KE and SVM, they largely overlook the coupling of affective data. Third, existing KE–SVM workflows stop at the component level and lack a replicable path for mapping user emotions onto multi-attribute spatial layouts. Shao et al. [18], for instance, focused on AI-generated interior styles without addressing inclusive usability. Consequently, a data-driven paradigm capable of harmonizing emotional and functional objectives in accessible restroom design is still absent.
To bridge the identified gaps, this study introduces an integrated KE–RST–SVM paradigm and validates it through design-simulation experiments in inclusive restroom scenarios. The contributions are threefold. (1) Methodological—By systematically coupling affective factor extraction via KE with attribute reduction through RST and performing subsequent non-linear mapping using SVM, we establish a transferable emotion–function unified modeling framework. (2) Technical—By embedding a feature-importance-based interpretability mechanism within the SVM, the approach delivers quantitative decision criteria that balance affective and functional requirements. (3) Practical—By operationalizing this quantifiable workflow, the study yields actionable guidelines for accessible restroom design, equipping designers and policy-makers with implementable insights.

2. Literature Review

2.1. Symmetry in Accessible Restrooms: From Regulation to Socio-Emotional Equity

Striking a balance between functional requirements and emotional needs in public spaces remains a fundamental pursuit in modern inclusive design. The concept of accessible design can be traced back to legislative milestones such as the Architectural Barriers Act (ABA) of 1968 in the United States, which was among the earliest laws mandating accessibility features in public facilities [19]. Subsequently, the Americans with Disabilities Act (ADA) of 1990 expanded the scope to include employment, transportation, and other facets of public services, underscoring the principle of equal participation [20]. While these regulations primarily focus on physical accessibility, the broader idea of symmetry in design implies balancing functional requirements with the psychosocial well-being of all users, including those with varied cultural or social backgrounds [21].
Universal Design and Inclusive Design have further refined this concept by advocating anticipatory barrier removal rather than retro-fit solutions [22,23]. This approach aligns closely with the notion that environments should offer equitable experiences for individuals across diverse abilities, rather than relying on subsequent modifications. However, accessible restroom facilities pivotal for privacy, safety, and autonomy still frequently demonstrate mismatches between official standards and actual user satisfaction [24,25]. Although significant progress has been made, research shows that purely technical adherence may overlook cultural nuances and emotional or psychological comfort [26,27]. Consequently, genuine symmetry in accessible restrooms demands design protocols that meet ergonomic benchmarks and actively respond to disabled users’ subjective and emotional expectations.

2.2. Empirical Progress in KE and Machine Learning for Emotion Design

Achieving genuine symmetry requires an evidence-based linkage between affective wellbeing metrics and verifiable usability performance within a unified design framework. KE, introduced in the 1970s, systematically incorporates users’ subjective impressions—“Kansei”—into design processes [6,28]. After demonstrating success in automotive applications, the approach was extended to multiple fields such as consumer products [29], furniture [30], electronic interfaces, military systems [31], and service design [32]. Central to KE is the principle of quantifying emotional responses and translating them into actionable design guidelines [33]. Eliciting how “safe” or “comfortable” a user feels can inform precise modifications of physical features, contributing to an overall sense of symmetry between user expectation and product attributes.
Although KE has demonstrated wide-ranging applicability, its presence in accessible design has been comparatively limited. Existing studies highlight its promise in assistive devices [34], wheelchair design [35], specialized wudhu facilities [36], and modular furniture solutions for disabled users [37]. Table 1 shows a comparative overview of the algorithms applied to the study of architectural space, through which the advantages and adaptability of the workflow of this study are fully realized. By integrating KE frameworks in restroom design, researchers can more systematically measure and address the emotional perceptions of disabled users, thus creating facilities that better align functional practicality with human-centered symmetry. This research aims to bridge that gap by applying KE, in conjunction with RST and SVM, to decipher the emotional and functional attributes that lead to an optimally symmetrical accessible restroom experience.

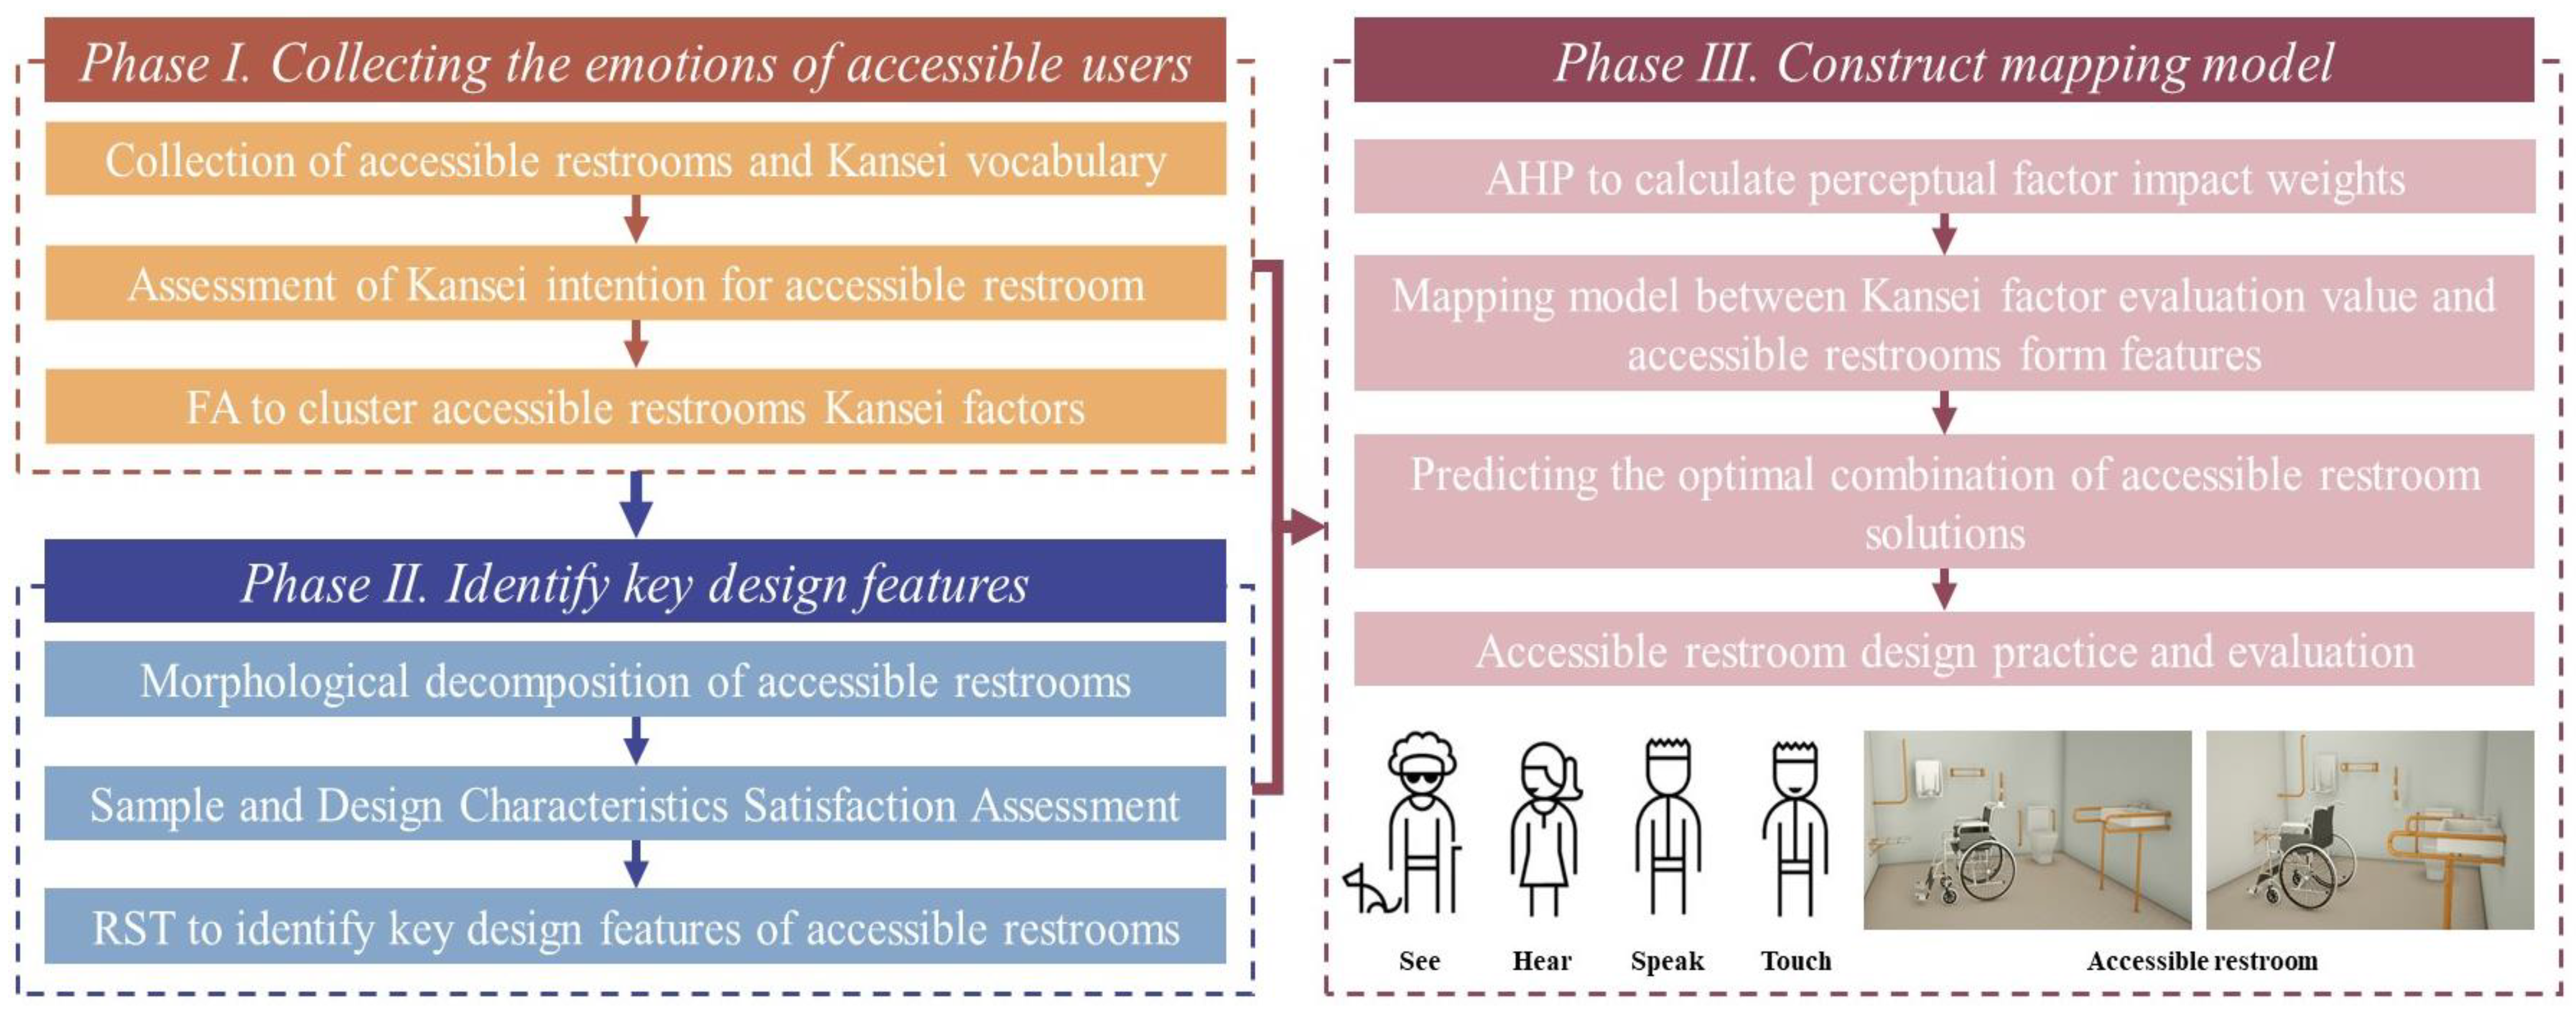
3. Methodological Framework for Applying KE to Accessible Restrooms

By integrating artificial intelligence with KE, this research develops an innovative approach to accessible restroom design that prioritizes disability inclusion and sustainability. An integrated, mixed-methods approach combining qualitative and quantitative techniques underpins this investigation. Through questionnaire surveys and interviews with disabled users, nine emotional words were initially collected and extracted, and three representative emotional words were screened through factor analysis (FA) and clustering methods. Next, the study identified eight design features of accessible restrooms through morphological analysis, simplified these features using RST, and finally identified six key design factors with the most significant impact on users’ emotional needs. The research employed SVM technology to establish a precise correlation model between emotional needs and design parameters. Generated design solutions were visually rendered, then evaluated by 50 participants with diverse disabilities to validate the approach’s practical efficacy.
This specific research steps are as follows: First, the emotional responses of the disabled group to the use of accessible restroom were extracted through FA, and representative emotionalized words were screened from them. Accessible restroom design elements were analyzed through morphological decomposition. RST simplified these features to determine the core design features that ultimately significantly impact users’ emotional needs. Finally, based on the analysis of the questionnaire data, the relationship matrix between emotional evaluation and design features was constructed using the Analytic Hierarchy Process (AHP). The SVM algorithm successfully generated an optimized emotion-to-design mapping system, with Figure 1 illustrating the complete research framework and implementation workflow.

3.1. Introduction to RST Methodology and Steps

Developed by Polish researcher Pawlak in 1982, RST represents a novel mathematical approach for processing ambiguous, contradictory, and partial datasets to determine approximate attribute sets in decision systems [44,45]. This methodology demonstrates particular efficacy in analyzing vague emotional preference data, enabling researchers to examine relationships between users’ affective requirements and design characteristics while extracting implicit patterns and decision rules from complex datasets [46,47]. Within the attribute approximation framework, conditional attributes assigned zero weighting coefficients are identified as irrelevant to decision attributes, and can consequently be removed during the reduction procedure [48]. Therefore, this study adopts the RST attribute approximation algorithm to extract the critical design features of an accessible restroom. The following briefly describes the calculation process.
Step 1: An information system is formally defined as the quadruple S = U , A , V , f , where U represents the universe of discourse containing all evaluation instances; A = C D denotes the attribute set with C D ; C A corresponds to conditional attributes (design parameters); D A represents decision attributes (emotional assessments); V denotes the range of values of the attributes. The function f represents the mapping relationship between attributes and evaluation records, which can also be understood as the set of connections between evaluation records and attributes. This function describes the dependency between attribute values and evaluation records, providing a foundation for the subsequent attribute reduction process. f represents the information function that establishes correspondence between the universe U and attribute set A .
Step 2: The equivalence relation of R to U (as specified in Equation (1)) generates classification classes for design feature attributes, i.e., U / I N D C , and the equivalence class of decision-making attributes (emotional evaluations), i.e., U / I N D D . The equivalence class division based on the original set of features without considering specific conditional attributes is as U / I N D D ,
I N D ( R ) = { ( x , y ) U × U | a A , f ( x , a ) = f ( y , a ) }
As formalized in Equation (1), the information function f assigns to each object–attribute pair x , a U × A its corresponding attribute value f ( x , a ) , completely characterizing the system’s information structure. Here, A includes both conditional attributes and decision attributes. For example, in a dataset containing product features, the conditional attributes may include characteristics such as color and size, while the decision attribute may represent user satisfaction.
Step 3: The dependency measures are defined as follows. r c D quantifies how strongly decision attribute D relies on conditional attribute set C; r c c e D measures D’s dependency on the reduced attribute set C { c e } ; σ c e , computed via Equation (2), represents the significance of attribute c e for D .
σ c e = r c D r c c e D
Equation (2) formally defines the dependency measure r c D as the predictive capacity of conditional attribute set C for determining decision attribute D . This metric is computed through object similarity analysis based on attribute C . For example, if for a set of objects, those with identical values across all conditional attributes also share the same value for the decision attribute, we can consider the degree of dependence to be high.
Step 4: W e denotes the condition attribute indicator weights—see Equation (3).
W e = σ c e λ = 1 n σ c λ

3.2. Introduction to SVM Methodology and Steps

SVM constitutes a supervised learning algorithm primarily employed for binary classification and regression tasks [49]. Its fundamental operation involves identifying an optimal separating hyperplane within the feature space to maximize the margin between classes [50]. When the training samples are linearly indistinguishable, a nonlinear support vector machine is learned through kernel tricks and software interval maximization [51]. This study involves user emotions, which are uncertain, nonlinear, and obey a non-normal distribution [52]. Therefore, a nonlinear support vector machine is selected to model the Kansei mapping of the accessible restroom in this study, and the computational process is briefly described below.
Step 1: Let Φ x denote the eigenvector after mapping x . The model corresponding to dividing the hyperplane in the eigenspace can be represented as
f x = w · Φ x + b
Step 2: Based on the above equation, the original problem is transformed into
m i n 1 2 w 2 + C i = 1 n ξ i + ξ i *
s . t . f x i y i ε + ξ i y i f x i ε + ξ i ξ i 0 ξ i * 0 , i = 1,2 , · · · n
Step 3: The constrained optimization formulation is converted to a dual problem through Lagrangian relaxation, as formally expressed in Equation (7); the kernel function is applied to avoid encountering high-dimensional or infinite-dimensional problems (see Equation (8)), and Equation (9) is obtained after the solution.
m a x 1 2 i = 1 n j = 1 n α i α i * α j α j * K x i , x j ε i = 1 n α i + α i * + i = 1 n y i α i α i *
K x i , x = e x p γ x i x 2
f x = i = 1 n α i α i * K x i , x + b

4. Accessible Restrooms Design Study

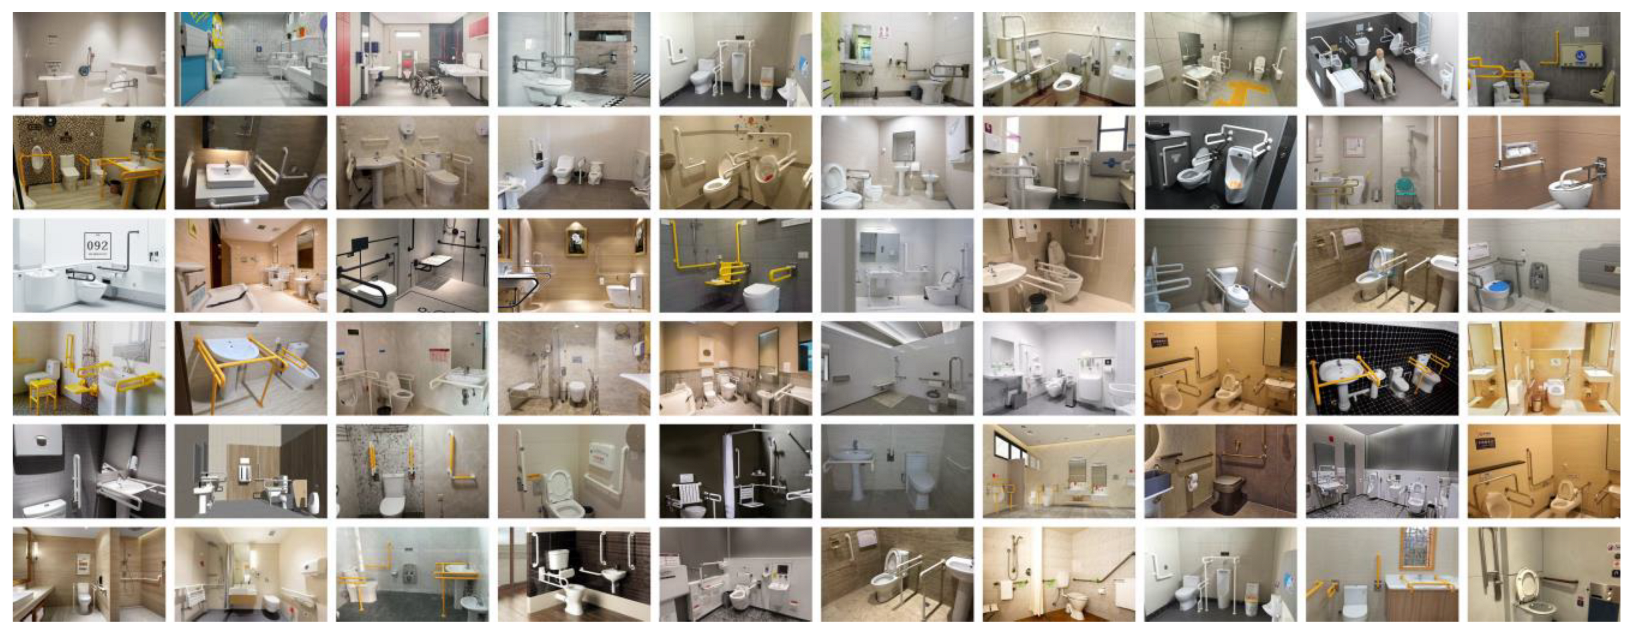
4.1. Morphological Feature Samples and Emotional Word Collection

This study begins from the perspective of an accessible restroom and selects a sample for in-depth analysis. A wide range of 80 samples of accessible restrooms eligible for the study were collected through a specially designed research website. The samples used in this study encompass a variety of accessible restroom types, including differences in color, material, fixture shapes, and lighting intensity, with the goal of ensuring representativeness and diversity. The impacts of image quality on Kansei data validity were mitigated through expert review by five doctoral researchers in accessible environment design disciplines. Images that were blurry, obstructed, or excessively recognizable were excluded to reduce visual biases and ensure the integrity of participants’ emotional responses.
The selection process prioritized both data sample diversity for machine learning training and computational efficiency considerations. It was essential to ensure that the sample size was neither too small nor too large, in order to avoid a decrease in the predictive performance or overfitting of the model. The final dataset comprised 60 representative accessible restroom images (6 × 10 matrix), forming the basis for emotional analysis and design optimization (Figure 2).
In the first stage of emotion word collection, 45 emotion words related to accessible restrooms were collected through user interviews, related literature, and design websites. In the second stage, focus groups were organized to pre-cull similar, functional, and repetitive words, and then a questionnaire was created to designate accessible groups to fill in, and nine groups of words with a voting rate of 60% or more were selected. Table 2 presents the randomized ordering and numbering of emotional vocabulary.

4.2. Downscaling the Emotional Word of Accessible Restroom with FA

Focusing on the sample of accessible restrooms, 50 disabled users were selected for this study. To improve the experiment’s efficiency and shorten the time of user participation, the research group suggested a three-point Likert scale to assess the emotional intention test used for the 60 samples. Through this test, a matrix of affective evaluations for accessible restrooms was collected and constructed (see Table 3). FA using IBM SPSS Statistics 27 assessed affective word consistency, with the results confirming data suitability—KMO = 0.857, and Bartlett’s test of sphericity value = 271.684 (df = 36, p < 0.01) (see Table 4).
Principal component analysis yielded three factors explaining 75.8% of total variance (exceeding the 75% criterion), as documented in Table 5. In the FA rotated component matrix (Table 6), things such as spacious, clean, and bright were classified as the “tidiness factor”; durable, safe, organized, and convenient were classified as the “utility factor”; and warmth and comfort were classified as the “care factor”. After extracting the core user emotional words, the focus group discussed the rationality of the three refined and summarized emotion words, and finally identified the emotional words as tidiness factor, utility factor, and care factor, which were used for the subsequent construction of the emotion data set of accessible restroom users.

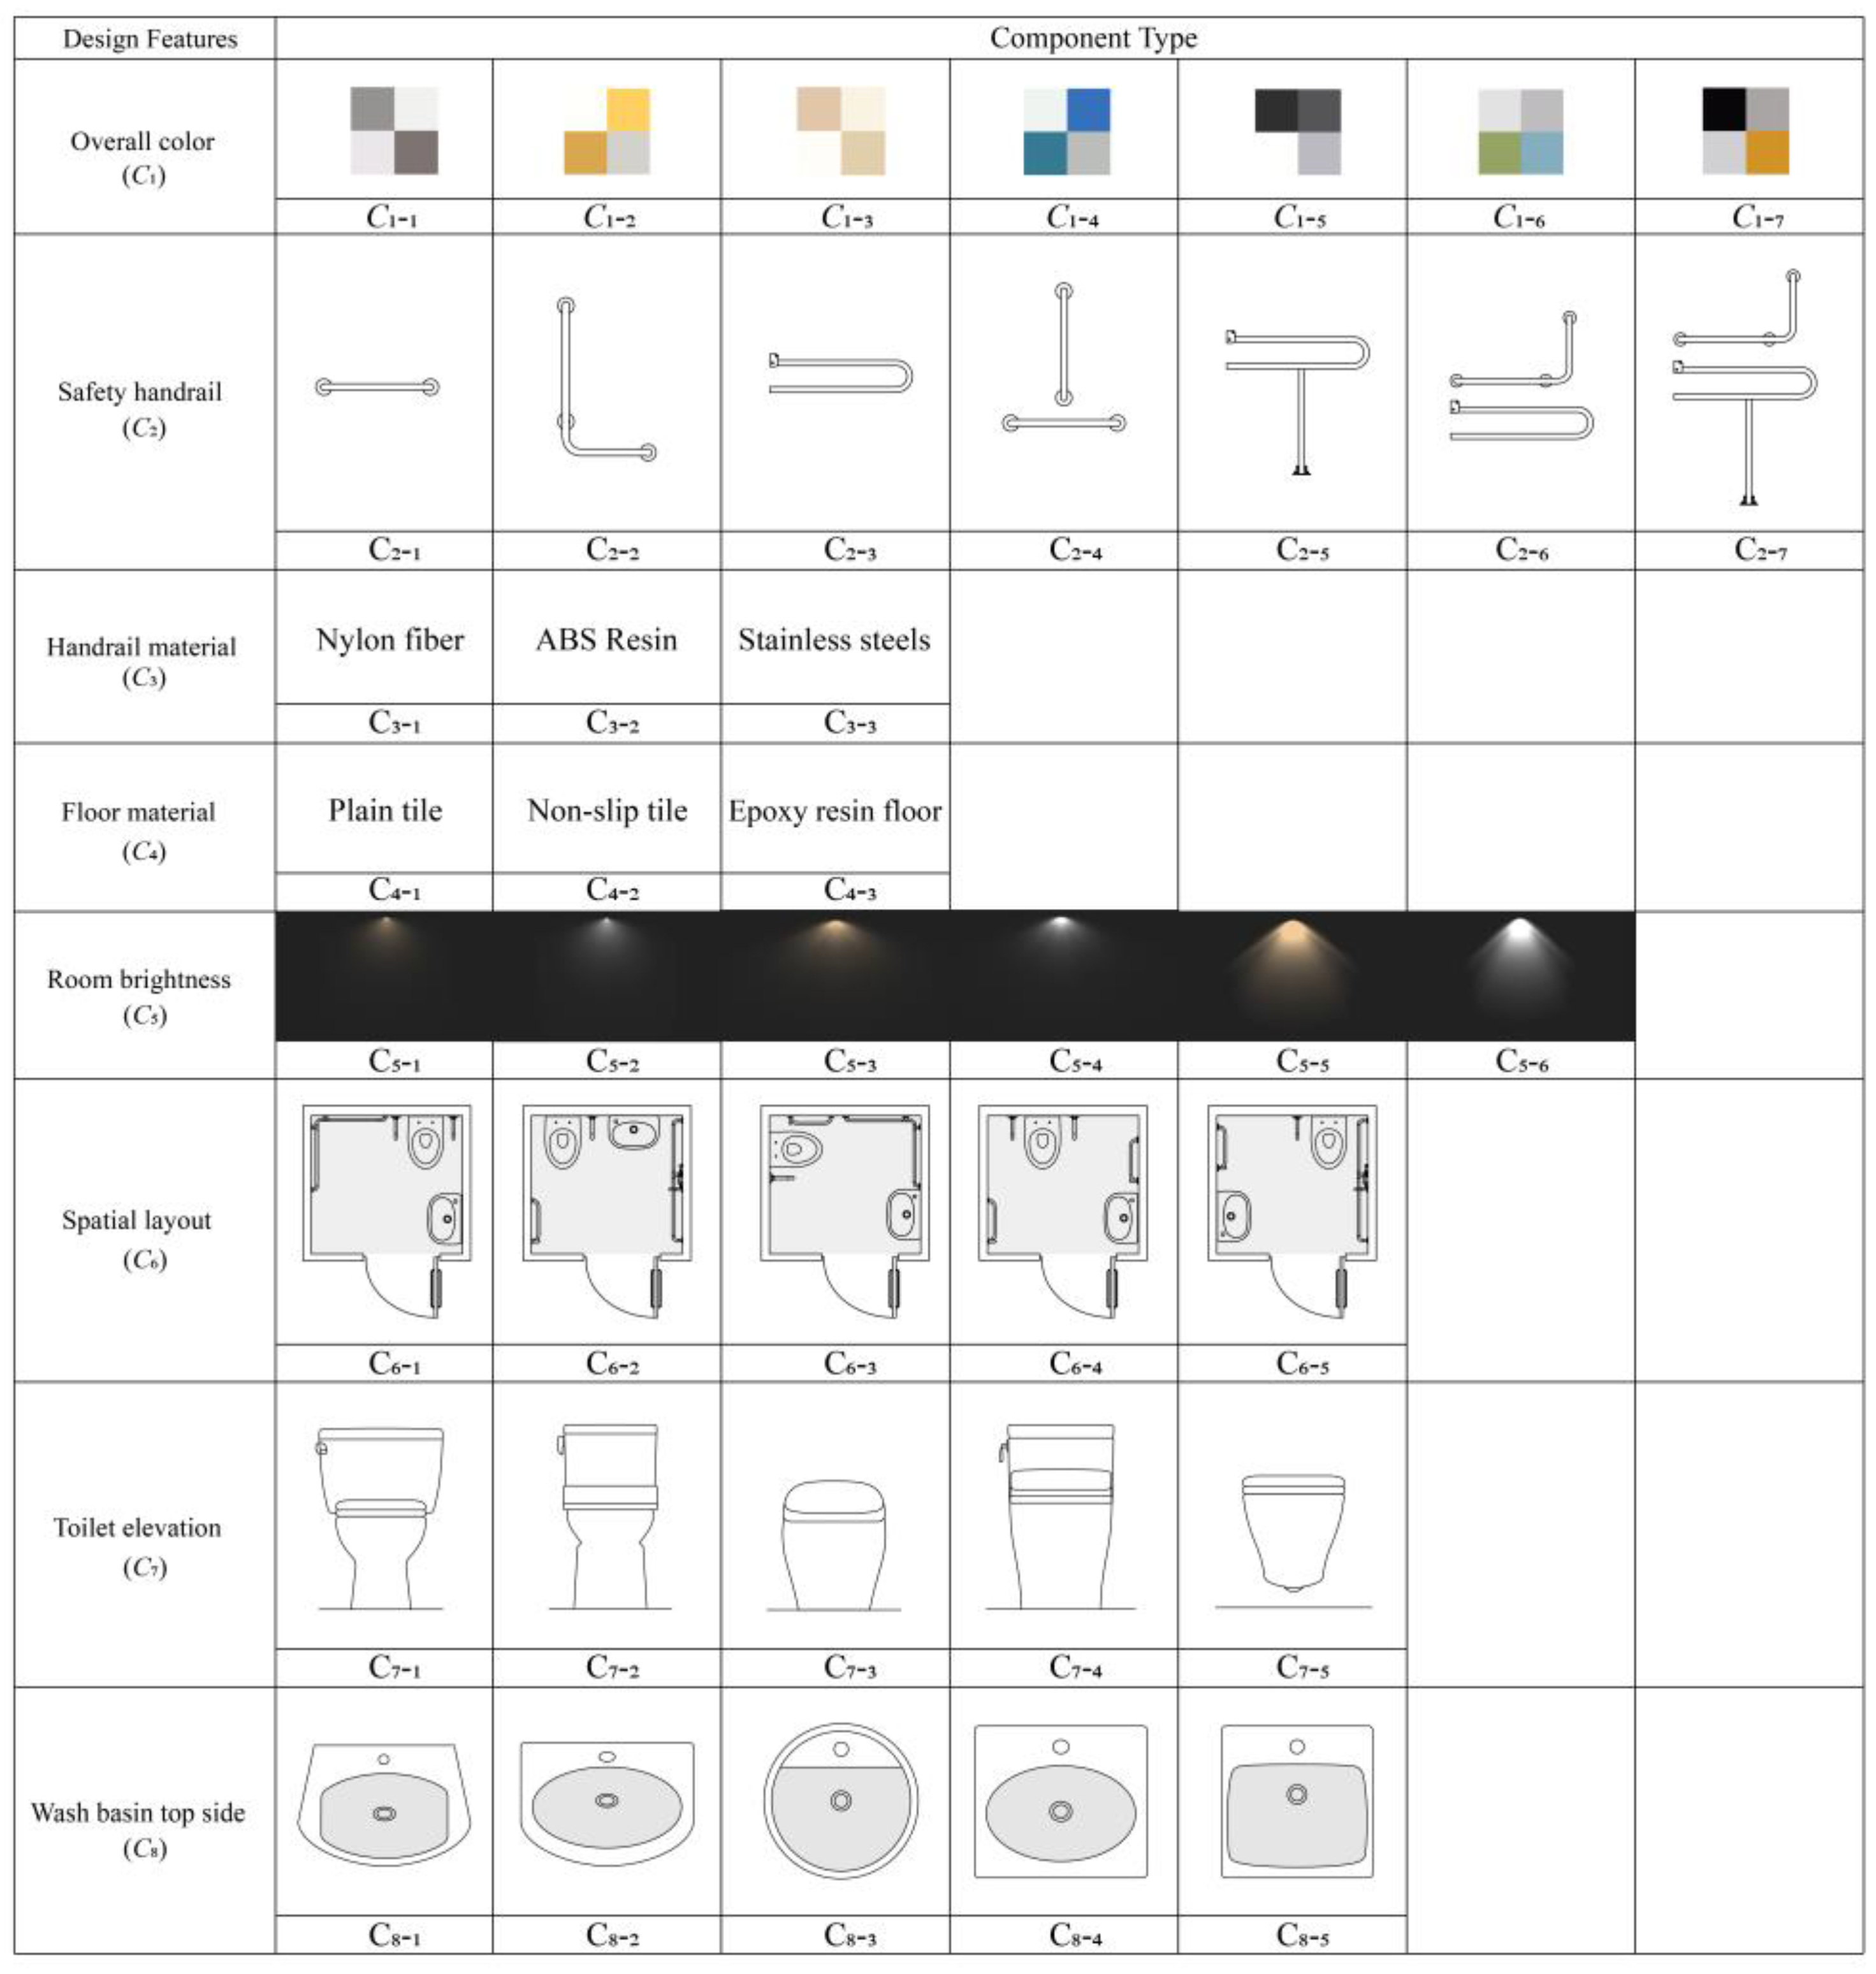
4.3. RST Defines Important Design Features

To ensure a rigorous evaluation of the restroom morphology database, we assembled a panel of five design experts with complementary expertise—one PhD candidate in architectural design (specializing in universal design), two professors of environmental design (with extensive experience in public space planning), and two Master’s researchers in human-centered design (focusing on ergonomic evaluation). Experts were selected based on (1) academic qualifications in relevant design disciplines, (2) a minimum of five years of research or professional experience in spatial design, and (3) prior publications or projects related to accessibility or user-centered design. After initial restroom morphology organization, the expert group objectively evaluated the 60-sample database for core feature identification. Through expert deliberations, the samples were decomposed into eight design features: overall color, safety handrail, handrail material, floor material, room brightness, spatial layout, toilet elevation, and wash basin top side. The analysis yielded 41 distinct design variants across all features (Figure 3).
Given the varying degrees of importance of different design features to user needs, lower-importance features may affect the prediction accuracy of subsequent models. Therefore, this study used the RST algorithm to approximate the attributes of eight design features to improve the recognition accuracy. Sixty restroom samples were systematically classified before conducting user evaluations. A demographically diverse panel of 50 disabled users (gender-balanced) assessed all samples and 41 derived design types through standardized five-point Likert measurements, with one indicating “not at all enhancing the willingness to use”, three indicating “moderate”, and five “significantly increased”. Since the original emotional evaluation data are more continuous, it is necessary to discretize the constant data. To address potential concerns regarding information loss during discretization, we conducted a correlation analysis between the original continuous evaluation scores and their discretized counterparts. The Spearman’s rank-order correlation test revealed a statistically significant strong positive relationship (ρ = 0.89, p < 0.001, 95% CI [0.85, 0.92]), indicating that the discretization process preserved the ordinal structure and discriminative power of the original data. This high correlation coefficient (exceeding the conventional 0.7 threshold for strong associations) empirically validates that the rough set reduction based on discretized data maintains the essential information integrity required for accurate feature selection. Therefore, based on the characteristics of the distribution of the evaluation data, the discretization method proceeds as follows: the evaluation level of interval [1, 2.08] is 1; the evaluation level of interval [2.08, 2.68] is 2; the evaluation level of interval [2.68, 3.28] is 3; the evaluation level of interval [3.28, 3.88] is 4; interval [3.88, 5] has an evaluation rating of 5. The RST conditional attribute, known as C , comprises eight design features; the decision attribute regarding user satisfaction with the accessible restroom is denoted as D . The transformed discrete values can be found in Table 7.
The design feature weight coefficients are computed using the RST attribute approximation algorithm implemented in MATLAB R2024b w 1 = 0 .0.142857, w 2 = 0 , w 3 = 0 , w 4 = 0.142857 , w 5 = 0.285714 , w 6 = 0.142857 , w 7 = 0.142857 , w 8 = 0.142857 . To summarize, the expert panel carefully evaluated the design characteristics, excluding those with zero weighting values during approximation, and ultimately identified six essential features for accessible restroom design—overall color, floor material, room brightness, spatial layout, toilet elevation, and wash basin top side.

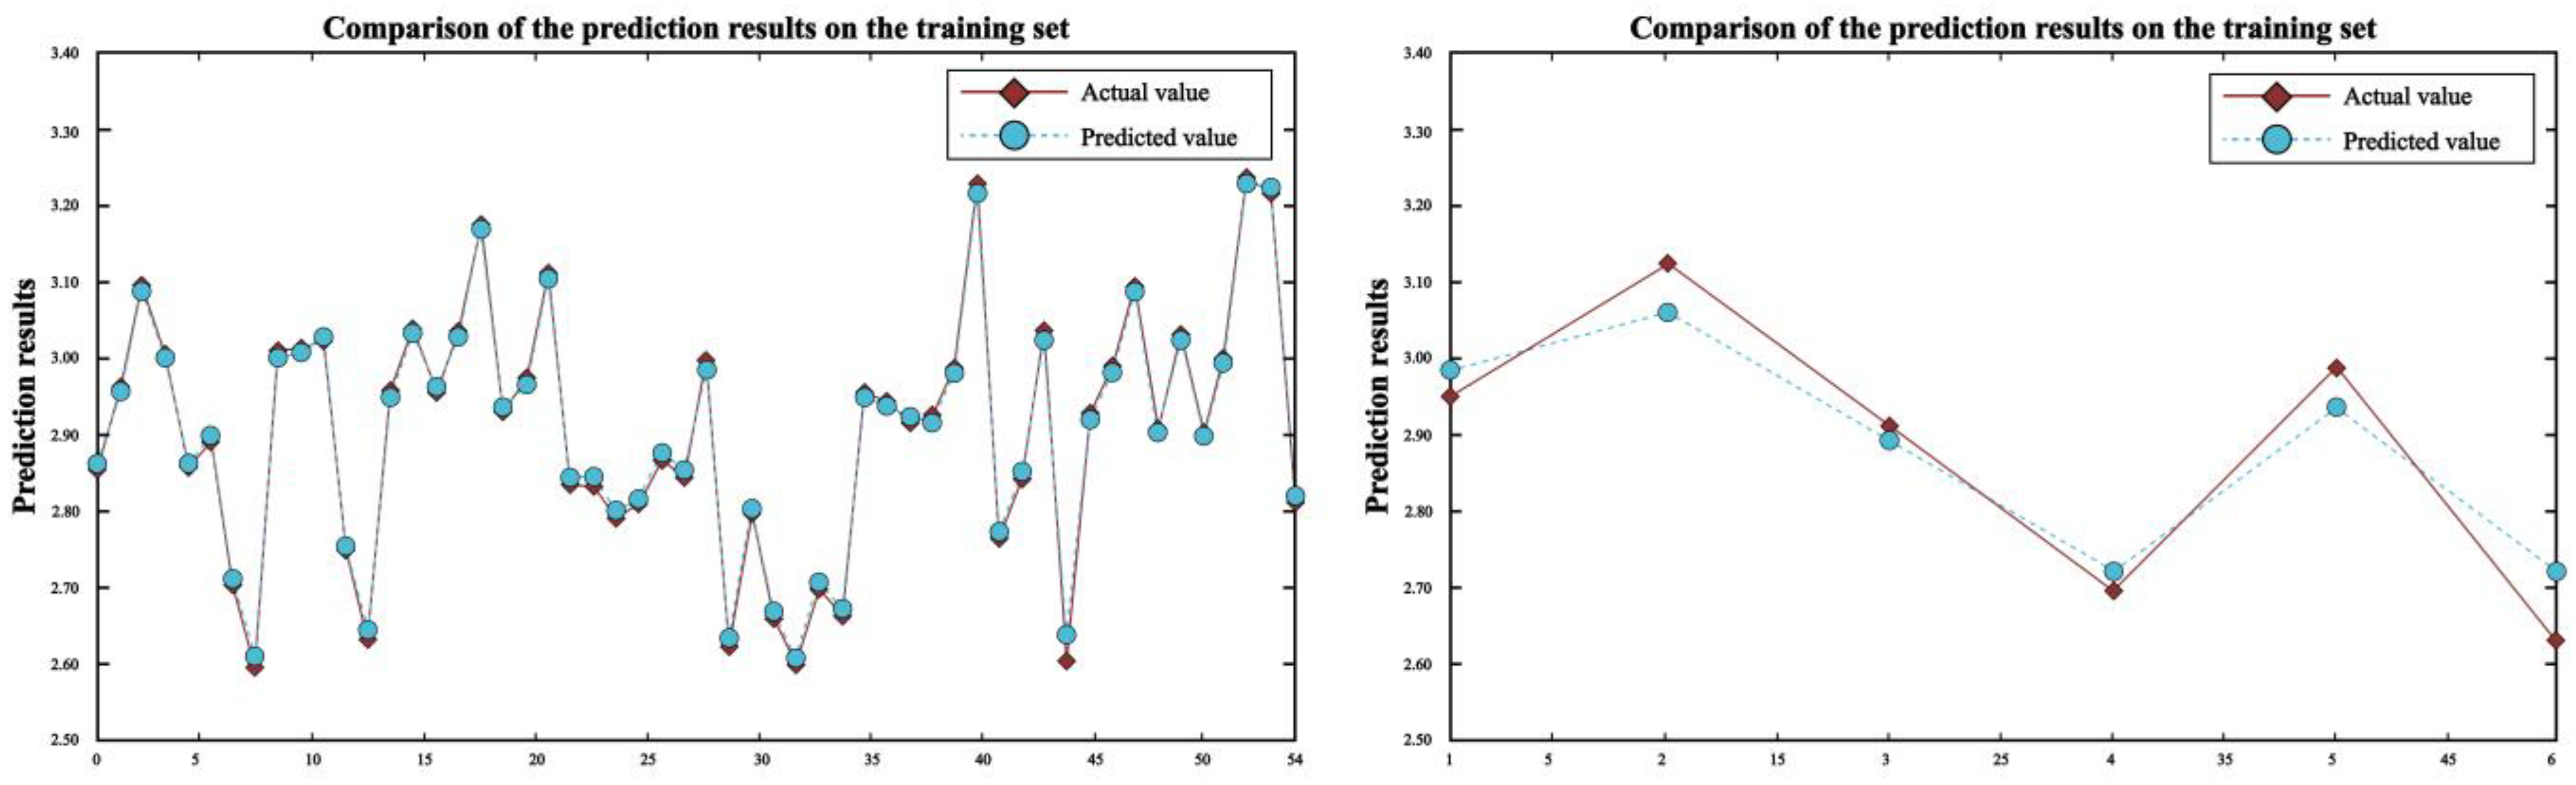
4.4. SVM Algorithm to Build Mapping Models

The study initially employed the three clustered emotional words and 60 samples to develop a five-point Likert scale. Fifty participants were then recruited to evaluate the perceived intention of each sample, followed by calculating the mean emotional assessment score. Secondly, this study used AHP hierarchical analysis [53,54] to calculate the three emotional word weight indicators after clustering, and the specific process is described below. Four members of the expert group (one PhD, two professors and one researcher) were again invited to participate in the hierarchical analysis of hierarchy (AHP) weighting assessment, and another postgraduate student acted as an independent supervisor for the process compliance review. The experts compared the feature importance two by two through two rounds of anonymous scoring (five-level scale method); the consistency ratios (CR) were controlled at <0.1, and the final weighting results were aggregated through a group decision matrix. Supervisors verified the data entry and calculation process to ensure that there was no conflict of interest and that the Delphi specification was met. The assessment details and final indicator weights of the 4 experts are shown in Table 8.
According to the results, it can be seen that the test coefficients C R of the four experts are less than 0.1, which satisfies the consistency test. In summary, in order to make the results of the weighted values more objective, it is necessary to summarize the weighted values of the four experts and find their mean values, concerning utility factor (0.43), tidiness factor (0.2275), and care factor (0.3425). The weights were multiplied with the corresponding emotional assessment means and then summed to obtain the emotional composite assessment value. A matrix (Table 9) was constructed between the emotional composite assessment values and the critical design features of accessible restrooms.
This study employs SVM for predicting user emotions. Although SVM is typically used for classification tasks, its extended version, Support Vector Regression (SVR), effectively handles regression tasks. In this study, user emotions are treated as continuous values, and therefore, SVR is selected for prediction. Depending on the research requirements, one or more Kansei mapping models can be constructed to achieve the final prediction. In the previous phase, to better align the results with users’ diverse emotional needs, the AHP was used to calculate the weights of various emotional needs, ultimately yielding the final average emotional value. As a result, only one Kansei mapping model needs to be constructed for this study. The six key design features, after encoding, are used as input layer data, and the average emotional value, after encoding, serves as the output layer data corresponding to the key emotional needs.
To mitigate potential overfitting and bias due to limited dataset sharing, we implemented rigorous data preprocessing and validation techniques. The quantified emotional demands were analyzed using SVM in MATLAB R2024b, with the dataset first normalized (z-score) to minimize feature scaling effects. To ensure robustness, the data were partitioned into training (90%) and holdout test sets (10%), followed by stratified five-fold cross-validation on the training set to optimize hyperparameters (penalty coefficient C and RBF kernel width gamma). This approach prevents data leakage and provides a more reliable estimate of model generalizability. After iterative optimization, the best-performing parameters (C = 1, gamma = 5.6569) were selected based on cross-validated performance metrics. The test set converges to the better data parameter, the R 2 , RMSE, MAE, and MBE parameters (0.99768, 0.087851, 0.0068429, 0.00048986). The model achieved strong training stability and low error variance, indicating minimal overfitting risk. Meanwhile, the remaining 10% samples of the mapping model were used as a test set to test the model performance with the test set’s R 2 , RMSE, MAE, and MBE parameters (0.93068, 0.08462, 0.08462, 0.08462)—these give SVM parameter results, as shown in Table 10. The close alignment between the cross-validation and the test results ( Δ R 2 < 0.07) suggests the model captures underlying patterns rather than noise, despite dataset size constraints. The mapping models a true value and actual value fitting plot, as shown in Figure 4.
The results demonstrate that the SVM-based emotional mapping model developed in this study exhibits strong predictive performance, with high accuracy, excellent fit, and minimal deviation between predicted and actual values. This model effectively establishes the relationship between special populations’ needs and accessible restroom design features. Consequently, it identifies the optimal design combination that maximizes satisfaction among special populations—specifically, the configuration yielding the highest emotional evaluation score. There are 7 × 3 × 6 × 5 × 5 = 15,750 combination scenarios for the five key design features obtained by using RST approximation. All the combination schemes are coded and brought into the trained SVM model to predict each combination scheme’s corresponding emotional evaluation value, as shown in Table 11. Meanwhile, Table 11 highlights the top three coding schemes in terms of average value for designers’ reference. The analysis reveals that Design Combination #4135 yields the highest predicted emotional value (3.187211) according to the model’s evaluation, corresponding to the design features of overall color (C1-2), floor material (C4-3), room brightness (C5-4), spatial layout (C6-1), toilet elevation (C7-2), and wash basin top side (C8-5).

5. Results and Proposed Design Implementation

The algorithmic framework developed in this study underwent comprehensive evaluation through detailed analysis of the proposed design solutions. During morphological analysis, a comprehensive optimization was performed based on six critical design attributes: overall color (C1-2), floor material (C4-3), room brightness (C5-4), spatial layout (C6-1), toilet elevation (C7-2), and washbasin top side (C8-5). Beyond these algorithmically derived morphological features, three key emotional dimensions, namely, neatness, practicality, and caring, were also thoroughly integrated to ensure a balanced synergy between functional usability and users’ psychological comfort. The conceptual scheme was developed in Cinema 4D R24, utilizing parametric modeling tools to construct the 3D structure from 2D CAD plans. Photorealistic rendering was achieved through Octane Render 2024, employing PBR materials with measured reflectance values and hybrid HDRi lighting. The final 4K output (Figure 5) was generated using path tracing with AI denoising, combining accurate material representation and optimized lighting simulation for design validation. The final result is the conceptual scheme shown in Figure 5. This conceptual scheme serves as a holistic reference for accessible restroom projects, yet it may require context-specific adjustments to accommodate distinct spatial and cultural factors.
A stratified purposive sample of 50 adults with disabilities from East China was recruited; 30 wheelchair users with mobility limitations, 8 individuals with visual impairments (3 totally blind, 5 low-vision), 6 with hearing impairments, and 6 with multiple disabilities. The gender ratio was 60% male to 40% female; ages ranged from 18 to 65 years (M = 37.4, SD = 11.2). Prior to rating, participants reviewed digital renderings of the proposed restroom; blind participants received step-by-step, concrete verbal descriptions to ensure information equivalence. They then rated overall satisfaction and three secondary attributes—neatness, practicality, and caring—on a seven-point Likert scale (1 = “not at all satisfied”, 7 = “very satisfied”).
Mean overall satisfaction reached 5.10 (SD = 0.93), exceeding the neutral midpoint of 4. Mean scores for neatness, practicality, and caring were 5.34, 5.06, and 5.02, respectively, indicating a broadly positive reception. Because the sample was limited to the East China region and was modest in size, and descriptive statistics alone were reported, no significance testing was conducted to compare disability groups or cultural backgrounds; the single-region sample may also reflect culture-specific expectations. Future studies should broaden geographical coverage through multi-site sampling and apply non-parametric or mixed-effects analyses to examine how disability type and regional culture modulate satisfaction, thereby validating the design for a wider disabled population.

6. Discussion

6.1. RST–SVM as a Science-Based Pathway to Emotion–Function Symmetry

The value of this study is not to merely add another machine learning layer, but to demonstrate how RST-guided dimensionality reduction and SVM’s non-linear learning can jointly implement the principle of emotion–function symmetry, thereby providing a scientific design solution that satisfies both affective resonance and functional adequacy. In this research process, RST acts as a symmetry-preserving filter and SVM operates as a joint optimizer, together unifying emotional needs with technical performance. First, RST compresses the original attributes into the smallest subset that still contains key functional indicators and affective surrogates mapped from the Kansei word tidiness factor, utility factor and care factor, thus locking both dimensions at the feature level. The resulting vector is then fed into an RBF-kernel SVM, whose hyper-parameters are tuned via ten-fold cross-validation to prevent the model from biasing toward any single dimension. Empirical validation with fifty participants confirms that the top-ranked configuration attains a satisfaction score well above the neutral midpoint while meeting all accessibility standards, demonstrating that the emotion–function symmetry established in the workflow successfully translates into a tangible design solution.

6.2. Comparison of the Efficiency of Models for Extracting Key Elements

The RST attribute reduction algorithm adopted in this study demonstrates significant theoretical innovation and practical value in the multi-criteria decision-making process for accessible restroom design. Its core advantage lies in the formalized processing mechanism of knowledge granularity: through the mathematical definitions of lower and upper approximation sets, it systematically identifies redundancy and complementarity among design elements. This characteristic enables outstanding performance in scenarios with incomplete engineering data. For instance, in the face of missing user research data, RST can directly perform feature simplification based on knowledge granules without traditional interpolation. Experimental data confirm that the algorithm intelligently reduces eight-dimensional design features to six core attributes (information retention rate ≥ 98%) in just 15.7 milliseconds, improving efficiency by 63.7% compared to the analytic hierarchy process (AHP, 43.2 ms) and by 77.1% compared to the entropy weight method (68.5 ms). More importantly, unlike AHP—which relies on manual judgment matrices (requiring consistency tests with CR < 0.1)—and the entropy weight method—which is based on probabilistic assumptions—RST’s data-driven nature not only avoids subjective bias, but also overcomes the technical limitations of traditional methods in handling incomplete information. This approach provides a more robust and automated solution for design feature optimization in complex, real-world engineering environments.

6.3. Comprehensive Emotional Evaluation and Model Efficiency Comparison

This research employed the SVM model to predict a unified score reflecting users’ composite emotional evaluations. Consolidating multiple emotional factors into a single metric simplifies the mapping between restroom design features and user satisfaction, improving computational efficiency. A potential alternative would be to develop multiple SVM-based models, each targeting a distinct emotional dimension, to provide more granular insights into the influence of each design element. However, such a strategy could substantially raise computational complexity and complicate subsequent design recommendations. This study compared the mean error of constructing three affective models ( R 2 = 0.89524 , RMSE = 0.19472) versus a single affective model ( R 2 = 0.96418 , RMSE = 0.0862355) prior to developing the SVM model. The results demonstrate that this accessible restroom scenario is more suitable for a unified perceptual mapping model. Adopting a single SVM model in this study was a deliberate decision made in order to achieve comprehensive emotional predictions while keeping computational demands manageable. Although multiple models might offer finer distinctions between emotional attributes, our unified approach adequately encapsulates the primary emotional components, thereby lowering overfitting risks and streamlining implementation.
In this study, the superior performance of SVM in emotion–function mapping modeling essentially reflects the principle of structural risk minimization in statistical learning theory. Meanwhile, the comparative experiments revealed that the SVM model with the RBF kernel achieved a prediction accuracy of 0.96418, significantly outperforming the CNN ( R 2 = 0.9380), BPNN ( R 2 = 0.9439), and F-QFD method. Table 12 provides a detailed comparison of the performance of each model on the training and test sets.
In-depth analysis reveals the three-fold nature of its advantages, as follows: (1) Computational efficiency—SVM only takes 2.7 min to complete the training, which is 12.9% faster than CNN (3.1 min) and 22.9% faster than BPNN (3.5 min). (2) Model complexity level—SVM is known for efficient optimization (especially with the RBF kernel on moderate-sized datasets). BPNN and CNN require more epochs and hyperparameter tuning (e.g., learning rate, batch size), increasing training time. MBE shows that SVM (0.0426) has lower systematic bias than BPNN (0.1495) and CNN (0.0250), suggesting more stable predictions. (3) The generalization performance exhibits the smallest generalization gap (training set–test set R2 difference 0.067), outperforming BPNN (0.0792) and CNN (0.0823). It is particularly noteworthy that although BPNN and CNN outperform the training set, their test set performance drops sharply, exposing typical overfitting characteristics. SVM, on the other hand, achieves optimal generalization stability while maintaining prediction accuracy through a structural risk minimization mechanism. These findings provide a methodological paradigm with both theoretical rigor and engineering practicality for use in intelligent decision-making systems in buildings.

6.4. Pathways Toward Explainability and Cross-Context Generalization

Although the existing KE–RST–SVM workflow exhibits high predictive validity, stakeholders cannot fully trust the model because of its black-box nature. As a next step, explainable-AI (XAI) techniques—specifically SHAP value decomposition and counterfactual sensitivity analysis—will be introduced to reveal the marginal contribution of each spatial attribute to the affective prediction scores. This transparency is expected to support evidence-based decision-making by designers and to empower users with disabilities to engage in critique and co-creation, thereby advancing participatory accessibility research. A second limitation is that the perceptual lexicon was derived from a Mandarin-speaking East China cohort, and its semantic loadings may vary across languages and cultures. To improve semantic robustness, a multilingual affective lexicon will be constructed, and multi-group confirmatory factor analysis will be employed to test metric equivalence across at least three geo-cultural contexts (North China, South China, and Southwest China). With respect to scenario scalability, accessible restrooms share structural homology with other high-dependency public facilities such as outpatient clinics, special-education classrooms, and inter-modal transit hubs. We therefore plan to adapt the trained SVM model to these settings via a transfer-learning protocol that (i) freezes lower-level feature weights, (ii) fine-tunes higher-level layers on a small, locale-specific dataset, and (iii) validates performance through a mixed-method user study. This strategy will both test the robustness of the proposed workflow and broaden its social impact. Finally, to control for geographic and demographic heterogeneity, a longitudinal multi-center trial has been scheduled in Shanghai, Guangzhou, and Chengdu. Each site will recruit at least 80 participants, stratified by disability type, gender, and age, and a stratified mixed-effects model will be used to distinguish design fixed effects from site-specific random effects, thereby providing generalizable design guidelines for local policymaking.

7. Conclusions

7.1. Key Findings and Contributions

Through surveys and expert interviews, nine core emotional descriptors regarding accessible restroom use were identified, from which factor analysis and clustering extracted three representative emotional dimensions: tidiness, utility, and care. Morphological analysis followed by RST simplification distilled eight design features into six pivotal elements. An SVM-based mapping model connecting these features with user emotional responses demonstrated satisfactory predictive accuracy, as confirmed by experimental validation.
By integrating KE with data-driven intelligent algorithms, this research makes several contributions to the field of accessible design, as follows:
(a)
Methodological framework. The proposed system bridges the gap between user emotional requirements and design practice, thereby enhancing precision and providing scientific underpinnings for barrier-free facility design;
(b)
By integrating cutting-edge AI methods, the decision support system enhances design choices, bringing advanced computer science and data-driven insights into accessible design practices;
(c)
Novel RST–SVM integration. By fusing RST-based attribute reduction with SVM modeling, we offer a robust barrier-free design process that addresses diverse emotional needs, thus fostering inclusiveness and user satisfaction.

7.2. Broader Implications and Limitations

Beyond facilitating individual well-being for disabled users, this method significantly contributes to broader social inclusion and emphasizes design’s pivotal role in promoting equity and dignity. In addition, it aligns with sustainability principles, minimizing excessive trial and error and resource consumption through data-driven methodologies.
Nevertheless, several limitations merit attention. (1) The study’s participant pool was limited in size, particularly with only 50 participants included in the analysis, and lacked sufficient demographic diversity such as variations in age and disability type, potentially affecting the generalizability of findings. Future research should expand recruitment to ensure broader representation. (2) User preferences and emotional responses were captured through subjective scales or questionnaires, which may lack temporal precision or fail to account for subconscious bias. Integrating physiological instruments such as EEG, eye-tracking, or galvanic skin response for continuous emotion monitoring could offer finer-resolution insights into stress triggers or comfort levels. (3) Although SVR demonstrated efficacy, its performance may plateau with highly nonlinear or high-dimensional data. Hybrid models combining SVR with deep learning for feature extraction or emerging techniques like federated learning to address data privacy in multi-site studies warrant further exploration. (4) The current design framework assumes static user needs, yet disabilities often involve progressive conditions or fluctuating symptoms. Longitudinal studies tracking user interactions with dynamic adjustable systems such as IoT-enabled fixtures would strengthen practical relevance. By addressing these areas, subsequent investigations can refine the proposed approach and continue to elevate the standard of accessible restroom design in the pursuit of symmetrical, user-centered solutions.

Author Contributions

Conceptualization, Z.C., J.T., H.Z. and D.W.; formal analysis, Z.C.; funding acquisition, H.Z.; investigation, J.T.; methodology, J.T. and D.W.; project administration, H.Z.; resources, H.Z.; software, Z.C.; supervision, H.Z. and D.W.; validation, Z.C.; visualization, J.T.; writing—original draft, Z.C. and J.T.; writing—review and editing, D.W. All authors have read and agreed to the published version of the manuscript.

Funding

This research was funded by the Tracking Program for Specially Appointed Professors (Oriental Scholars) in Shanghai Universities, grant number 1400152019.

Data Availability Statement

The original contributions presented in the study are included in the article; further inquiries can be directed to the corresponding authors.

Acknowledgments

All authors would like to thank the anonymous referees for their constructive comments.

Conflicts of Interest

The authors declare no conflicts of interest.

References

  1. Iwarsson, S.; Ståhl, A. Accessibility, usability and universal design—Positioning and definition of concepts describing person-environment relationships. Disabil. Rehabil. 2003, 25, 57–66. [Google Scholar] [CrossRef]
  2. Shinohara, K.; Wobbrock, J.O.; Pratt, W. Incorporating social factors in accessible design. In Proceedings of the 20th International ACM SIGACCESS Conference on Computers and Accessibility, Galway, Ireland, 22–24 October 2018; pp. 149–160. [Google Scholar]
  3. Quintero, C. A review: Accessible technology through participatory design. Disabil. Rehabil. Assist. Technol. 2022, 17, 369–375. [Google Scholar] [CrossRef] [PubMed]
  4. Sarmiento-Pelayo, M.P. Co-design: A central approach to the inclusion of people with disabilities. Rev. Fac. Med. 2015, 63, 149–154. [Google Scholar] [CrossRef]
  5. Lid, I.M. Universal design and disability: An interdisciplinary perspective. Disabil. Rehabil. 2014, 36, 1344–1349. [Google Scholar] [CrossRef] [PubMed]
  6. Nagamachi, M. Kansei engineering: A new ergonomic consumer-oriented technology for product development. Int. J. Ind. Ergon. 1995, 15, 3–11. [Google Scholar] [CrossRef]
  7. Pawlak, Z.; Skowron, A. Rudiments of rough sets. Inf. Sci. 2007, 177, 3–27. [Google Scholar] [CrossRef]
  8. Liu, Z.; Wu, J.; Chen, Q.; Hu, T. An improved Kansei engineering method based on the mining of online product reviews. Alex. Eng. J. 2023, 65, 797–808. [Google Scholar] [CrossRef]
  9. Kang, X.; Nagasawa, S.y. Integrating kansei engineering and interactive genetic algorithm in jiangxi red cultural and creative product design. J. Intell. Fuzzy Syst. 2023, 44, 647–660. [Google Scholar] [CrossRef]
  10. Su, Z.; Yu, S.; Chu, J.; Zhai, Q.; Gong, J.; Fan, H. A novel architecture: Using convolutional neural networks for Kansei attributes automatic evaluation and labeling. Adv. Eng. Inform. 2020, 44, 101055. [Google Scholar] [CrossRef]
  11. Gan, Y.; Ji, Y.; Jiang, S.; Liu, X.; Feng, Z.; Li, Y.; Liu, Y. Integrating aesthetic and emotional preferences in social robot design: An affective design approach with Kansei Engineering and Deep Convolutional Generative Adversarial Network. Int. J. Ind. Ergon. 2021, 83, 103128. [Google Scholar] [CrossRef]
  12. Li, T. Construction and Optimization of an Artificial Intelligence-Assisted Kansei Engineering Product Design Mapping Model. In Proceedings of the 2024 5th International Conference on Education, Knowledge and Information Management (ICEKIM 2024), Chengdu, China, 19–21 April 2024; pp. 920–927. [Google Scholar]
  13. Cherkassky, V.; Ma, Y. Practical selection of SVM parameters and noise estimation for SVM regression. Neural Netw. 2004, 17, 113–126. [Google Scholar] [CrossRef] [PubMed]
  14. Kang, X. Combining rough set theory and support vector regression to the sustainable form design of hybrid electric vehicle. J. Clean. Prod. 2021, 304, 127137. [Google Scholar] [CrossRef]
  15. Montañana, A.; Nolé, M.L.; Llinares, C. Strategic design approaches for eliciting the perception of ‘prestige’ in housing consumers. Buildings 2024, 14, 853. [Google Scholar] [CrossRef]
  16. Cheng, Q.; Wang, H.; Xu, X.; He, T.; Chen, Z. Indoor Thermal Comfort Sector: A Review of Detection and Control Methods for Thermal Environment in Livestock Buildings. Sustainability 2024, 16, 1662. [Google Scholar] [CrossRef]
  17. Han, M.; Zhang, C.; Yin, S.; Jia, J.; Kim, C. Optimization Design of Indoor Environmental Ventilation in Buildings Based on Improved SVR-PSO Model. Sustainability 2024, 16, 5256. [Google Scholar] [CrossRef]
  18. Shao, Z.; Chen, J.; Zeng, H.; Hu, W.; Xu, Q.; Zhang, Y. A new approach to interior design: Generating creative interior design videos of various design styles from indoor texture-free 3D models. Buildings 2024, 14, 1528. [Google Scholar] [CrossRef]
  19. Goldman, C.D. Architectural barriers: A perspective on progress. W. N. Eng. L. Rev. 1982, 5, 465. [Google Scholar]
  20. Hymas, D.R.; Parkinson, B.R. Architectural barriers under the ADA: An answer to the judiciary’s struggle with technical non-compliance. Cal. WL Rev. 2002, 39, 349. [Google Scholar]
  21. Petersen, J.C.; Piletic, C.K. Facility accessibility: Opening the doors to all. J. Phys. Educ. Recreat. Danc. 2006, 77, 38–44. [Google Scholar] [CrossRef]
  22. Persson, H.; Åhman, H.; Yngling, A.A.; Gulliksen, J. Universal design, inclusive design, accessible design, design for all: Different concepts—One goal? On the concept of accessibility—Historical, methodological and philosophical aspects. Univers. Access Inf. Soc. 2015, 14, 505–526. [Google Scholar] [CrossRef]
  23. Story, M.F. Maximizing usability: The principles of universal design. Assist. Technol. 1998, 10, 4–12. [Google Scholar] [CrossRef] [PubMed]
  24. Yuan, H.; Shen, X. Optimizing floor plans of accessible restrooms in elderly long-term care facilities: A path planning approach. Archit. Eng. Des. Manag. 2024, 20, 891–910. [Google Scholar] [CrossRef]
  25. Swayne, M.R.; Calzo, J.P.; Felner, J.K.; Welsh Carroll, M. Developing evidence for building sanitation justice: A multi methods approach to understanding public restroom quantity, quality, accessibility, and user experiences. PLoS ONE 2023, 18, e0288525. [Google Scholar] [CrossRef] [PubMed]
  26. Zallio, M.; Clarkson, P.J. Inclusion, diversity, equity and accessibility in the built environment: A study of architectural design practice. Build. Environ. 2021, 206, 108352. [Google Scholar] [CrossRef]
  27. Arora, S.; Deshpande, A. Inclusive design—Designing barrier-free public spaces. In Design for Tomorrow—Volume 1: Proceedings of ICoRD 2021; Springer: Singapore, 2021; pp. 133–146. [Google Scholar]
  28. Nagamachi, M. Kansei engineering as a powerful consumer-oriented technology for product development. Appl. Ergon. 2002, 33, 289–294. [Google Scholar] [CrossRef]
  29. Yang, C.; Liu, F.; Ye, J. A product form design method integrating Kansei engineering and diffusion model. Adv. Eng. Inform. 2023, 57, 102058. [Google Scholar] [CrossRef]
  30. Fu, L.; Lei, Y.; Zhu, L.; Lv, J. An evaluation and design method for Ming-style furniture integrating Kansei engineering with particle swarm optimization-support vector regression. Adv. Eng. Inform. 2024, 62, 102822. [Google Scholar] [CrossRef]
  31. Ge, Y.; Wang, S.; Han, R.; Peng, J.; Zhang, Z.; Hong, Y.; Yang, Y. Application of Kansei Engineering in aircraft design. Ind. Textila 2023, 74, 534–541. [Google Scholar] [CrossRef]
  32. Wu, L.; Gao, H.; Wang, K.-C.; Yang, C.-H. A Green-IKE Inference System Based on Grey Neural Network Model for Humanized Sustainable Feeling Assessment about Products. Math. Probl. Eng. 2020, 2020, 6391463. [Google Scholar] [CrossRef]
  33. Schütte, S.T.; Eklund, J.; Axelsson, J.R.; Nagamachi, M. Concepts, methods and tools in Kansei engineering. Theor. Issues Ergon. Sci. 2004, 5, 214–231. [Google Scholar] [CrossRef]
  34. Ismail, M.N.; Lokman, A.M.; Abdullah, N.A.S. Formulating Kansei concept of assistive device for people with physical disabilities. In Proceedings of the 2014 3rd International Conference on User Science and Engineering (i-USEr), Shah Alam, Malaysia, 2–5 September 2014; pp. 30–35. [Google Scholar]
  35. Lokman, A.M.; Ismail, M.N.; Abdullah, N.A.S.; Omar, A.R. Kansei wheelchair design based on KJ method. Adv. Sci. Lett. 2017, 23, 4349–4353. [Google Scholar] [CrossRef]
  36. Prabaswari, A.; Fernanda, M.; Jati, N.; Indrawati, S.; Aldhiza, R. Redesign of wudhu facility for disabilities using integrated kansei method. IOP Conf. Ser. Mater. Sci. Eng. 2020, 722, 012016. [Google Scholar] [CrossRef]
  37. Bonenberg, A. Aiding Self-reliance of the elderly and the disabled-modular cupboard with mobile internal units. In Universal Access in Human-Computer Interaction. Access to the Human Environment and Culture, Proceedings of the 9th International Conference, UAHCI 2015, Held as Part of HCI International 2015, Los Angeles, CA, USA, 2–7 August 2015; Proceedings, Part IV 9; Springer: Cham, Switzerland, 2015; pp. 403–412. [Google Scholar]
  38. Tian, J.; Chen, Z.; Yuan, L.; Zhou, H. Optimizing Outdoor Micro-Space Design for Prolonged Activity Duration: A Study Integrating Rough Set Theory and the PSO-SVR Algorithm. Buildings 2024, 14, 3950. [Google Scholar] [CrossRef]
  39. Aparicio-Ruiz, P.; Barbadilla-Martín, E.; Guadix, J.; Nevado, J. Analysis of Variables Affecting Indoor Thermal Comfort in Mediterranean Climates Using Machine Learning. Buildings 2023, 13, 2215. [Google Scholar] [CrossRef]
  40. Yang, Y.; Yang, H.; Meng, F. A Bluetooth Indoor Positioning System Based on Deep Learning with RSSI and AoA. Sensors 2025, 25, 2834. [Google Scholar] [CrossRef]
  41. Anan, M.; Kanaan, K.; Benhaddou, D.; Nasser, N.; Qolomany, B.; Talei, H.; Sawalmeh, A. Occupant-Aware Energy Consumption Prediction in Smart Buildings Using a LSTM Model and Time Series Data. Energies 2024, 17, 6451. [Google Scholar] [CrossRef]
  42. Xiang, L.; Xu, Y.; Cui, J.; Liu, Y.; Wang, R.; Li, G. GM(1,1)-Based Weighted K-Nearest Neighbor Algorithm for Indoor Localization. Remote Sens. 2023, 15, 3706. [Google Scholar] [CrossRef]
  43. Zhao, J.; Suo, W. Research on the Construction and Application of a SVM-Based Quantification Model for Streetscape Visual Complexity. Land 2024, 13, 1953. [Google Scholar] [CrossRef]
  44. Pawlak, Z. Rough sets. Int. J. Comput. Inf. Sci. 1982, 11, 341–356. [Google Scholar] [CrossRef]
  45. Pawlak, Z. Rough set theory and its applications. J. Telecommun. Inf. Technol. 2002, 3, 7–10. [Google Scholar] [CrossRef]
  46. Shieh, M.-D.; Yeh, Y.-E.; Huang, C.-L. Eliciting design knowledge from affective responses using rough sets and Kansei engineering system. J. Ambient. Intell. Humaniz. Comput. 2016, 7, 107–120. [Google Scholar] [CrossRef]
  47. Chen, Z. An Elderly-Oriented Form Design of Low-Speed New Energy Vehicles Based on Rough Set Theory and Support Vector Regression. World Electr. Veh. J. 2024, 15, 389. [Google Scholar] [CrossRef]
  48. Chen, Z. An Elderly-Oriented Design of HMI in Autonomous Driving Cars Based on Rough Set Theory and Backpropagation Neural Network. IEEE Access 2024, 12, 26800–26818. [Google Scholar] [CrossRef]
  49. Chaabane, S.B.; Hijji, M.; Harrabi, R.; Seddik, H. Face recognition based on statistical features and SVM classifier. Multimed. Tools Appl. 2022, 81, 8767–8784. [Google Scholar] [CrossRef]
  50. Yue, S.; Li, P.; Hao, P. SVM classification: Its contents and challenges. Appl. Math.-A J. Chin. Univ. 2003, 18, 332–342. [Google Scholar] [CrossRef]
  51. Shuo, W.; Ming, M. Exploring online intelligent teaching method with machine learning and SVM algorithm. Neural Comput. Appl. 2022, 34, 2583–2596. [Google Scholar] [CrossRef]
  52. Yang, C.-C. A classification-based Kansei engineering system for modeling consumers’ affective responses and analyzing product form features. Expert Syst. Appl. 2011, 38, 11382–11393. [Google Scholar] [CrossRef]
  53. Zuo, Y.; Wang, Z. Subjective product evaluation system based on Kansei Engineering and analytic hierarchy process. Symmetry 2020, 12, 1340. [Google Scholar] [CrossRef]
  54. Du, Y.; Zhang, M.; Cai, M.; Park, K. Construction of Product Appearance Kansei Evaluation Model Based on Online Reviews and FAHP: A Case Study of Household Portable Air Conditioners. Sustainability 2024, 16, 3132. [Google Scholar] [CrossRef]
Figure 1. Proposed research structure for product biomimetic design.
Buildings 15 01567 g001
Figure 2. A database of 60 samples of accessible restrooms.
Buildings 15 01567 g002
Figure 3. Morphological deconstruction of an accessible restroom.
Buildings 15 01567 g003
Figure 4. SVM mapping model’s predictive set and test values set fitting plot.
Buildings 15 01567 g004
Figure 5. Optimized design solutions for accessible restroom.
Buildings 15 01567 g005
Table 1. Overview of the algorithms applied to the study of architectural space.
AlgorithmSpatial ApplicationFuzzy
Expression
Reasoning ComplexityLoss RateData
Representation
PSO-SVR [38]Outdoor micro-space form-findingMediumMediumLowMedium
RF [39]Office thermal comfort diagnosticsLowMediumMediumMedium
CNN [40]Complex indoor way-finding meshesLowHighMediumHigh
LSTM [41]Smart-building load forecastingLowHighMediumMedium
KNN [42]Indoor locationMediumLowHighMedium
SVM [43]Urban Streetscape VisualMediumMediumLowMedium
Table 2. Emotional words related to accessible restrooms.
ComfortSpaciousCleanBrightOrganizedWarmthDurableSafeConvenient
Table 3. Kansei evaluation of accessible restrooms.
NoComfortSpaciousCleanBrightOrganizedWarmthDurableSafeConvenient
12.801.972.502.372.332.432.272.402.40
22.432.532.602.472.502.072.432.332.30
32.702.802.672.502.432.532.502.602.47
582.402.232.472.432.172.272.272.172.30
592.472.102.272.432.272.402.202.172.43
602.502.772.632.472.332.502.402.402.47
Table 4. Factor analysis suitability tests.
KMO Sampling Adequacy Measure.0.857
Bartlett’s sphericity testAppro. Chi-Square274.684
df36
Sig.<0.01
Table 5. FA total variance explained.
IESum of Squared LoadingsSum of Squared Rotated Loadings
SumVar./%Cum./%SumVar./%Cum./%SumVar./%Cum./%
14.72152.45252.4524.72152.45252.4522.70230.0230.02
21.31414.60167.0541.31414.60167.0542.13523.72853.748
30.7868.73275.7850.7868.73275.7851.98322.03775.785
40.6397.09682.882
50.4595.09787.979
60.3543.93391.912
70.293.22595.137
80.2512.78597.922
90.1872.078100
Table 6. FA rotated component.
Kansei WordComponent
123
10.0380.2010.845
20.8670.2090.079
30.8290.1770.202
40.7330.2430.180
50.5050.6320.367
60.2400.1190.862
70.5280.616−0.058
80.3420.6660.516
90.1270.8510.205
Table 7. Discrete decision table for accessible restrooms.
No.Overall ColorSafety HandrailHandrail MaterialFloor
Material
Room BrightnessSpatial LayoutToilet
Elevation
Wash
Basin Top Side
D
1342233452
2455534523
3424432434
58354435433
59535214433
60332445442
Table 8. AHP expert assessment rules and consistency tests.
ExpertKansei FactorUtility
Factor
Tidiness FactorCare FactorWeight (W) W λ m a x C I C R
1 Utility 1 4 5 0.67 Utility 3.08 0.04 0.08
Tidiness 1/4 1 3 0.23 Tidiness
Care 1/5 1/3 1 0.10 Care
2 Utility 1 2 5 0.57 Utility 3.02 0.01 0.02
Tidiness 1/2 1 4 0.33 Tidiness
Care 1/5 1/4 1 0.10 Care
3 Utility 1 3 1/4 0.23 Utility 3.08 0.04 0.08
Tidiness 1/3 1 1/5 0.10 Tidiness
Care 4 5 1 0.67 Care
4 Utility 1 1 2 0.25 Utility 3 0 0
Tidiness 1 1 2 0.25 Tidiness
Care 1/2 1/2 1 0.50 Care
Table 9. Mapping model between restroom design features and Kansei factor evaluation value.
No.Overall ColorFloor MaterialRoom
Brightness
Spatial
Layout
Toilet
Elevation
Wash Basin Top SideEvaluation Value
11141413.0337
24242352.9866
32343142.6042
581344123.2265
593122442.9953
601334432.9385
Table 10. SVM parameter results.
Parameter R 2 RMSEMAEMBE
Training set0.997680.0878510.00684290.00048986
Test set0.930680.084620.084620.08462
Table 11. SVM mapping model for accessible restroom Kansei predictive value.
No.Overall ColorFloor MaterialRoom
Brightness
Spatial
Layout
Toilet
Elevation
Wash Basin Top SidePredictive Value
11111112.893248
21111122.861935
31111132.861935
18851341253.169948
41352341253.187211
42602351253.147104
15,7487365532.877173
15,7497365542.871681
15,7507365552.877758
Table 12. Comparison of mean values of parameter results for Kansei mapping models.
Model R 2 RMSEMAEMBE
SVM0.96420.08620.04570.0426
BPNN0.94390.15450.12850.1495
CNN0.93800.16000.13400.0250
Disclaimer/Publisher’s Note: The statements, opinions and data contained in all publications are solely those of the individual author(s) and contributor(s) and not of MDPI and/or the editor(s). MDPI and/or the editor(s) disclaim responsibility for any injury to people or property resulting from any ideas, methods, instructions or products referred to in the content.

