
Sustaining Green Building Incentives: A Tripartite Evolutionary Game Analysis and the Synergistic “Technology–Reputation–Policy” Pathway


Abstract
1. Introduction
2. Literature Review
2.1. Research on Incentive Mechanisms for Green Building Promotion Policies
2.2. Research on Factors Influencing Green Building Adoption
2.3. Research on Stakeholder Dynamics in Green Building Promotion
2.4. Research on “Technology–Reputation–Policy” Synergistic Mechanism
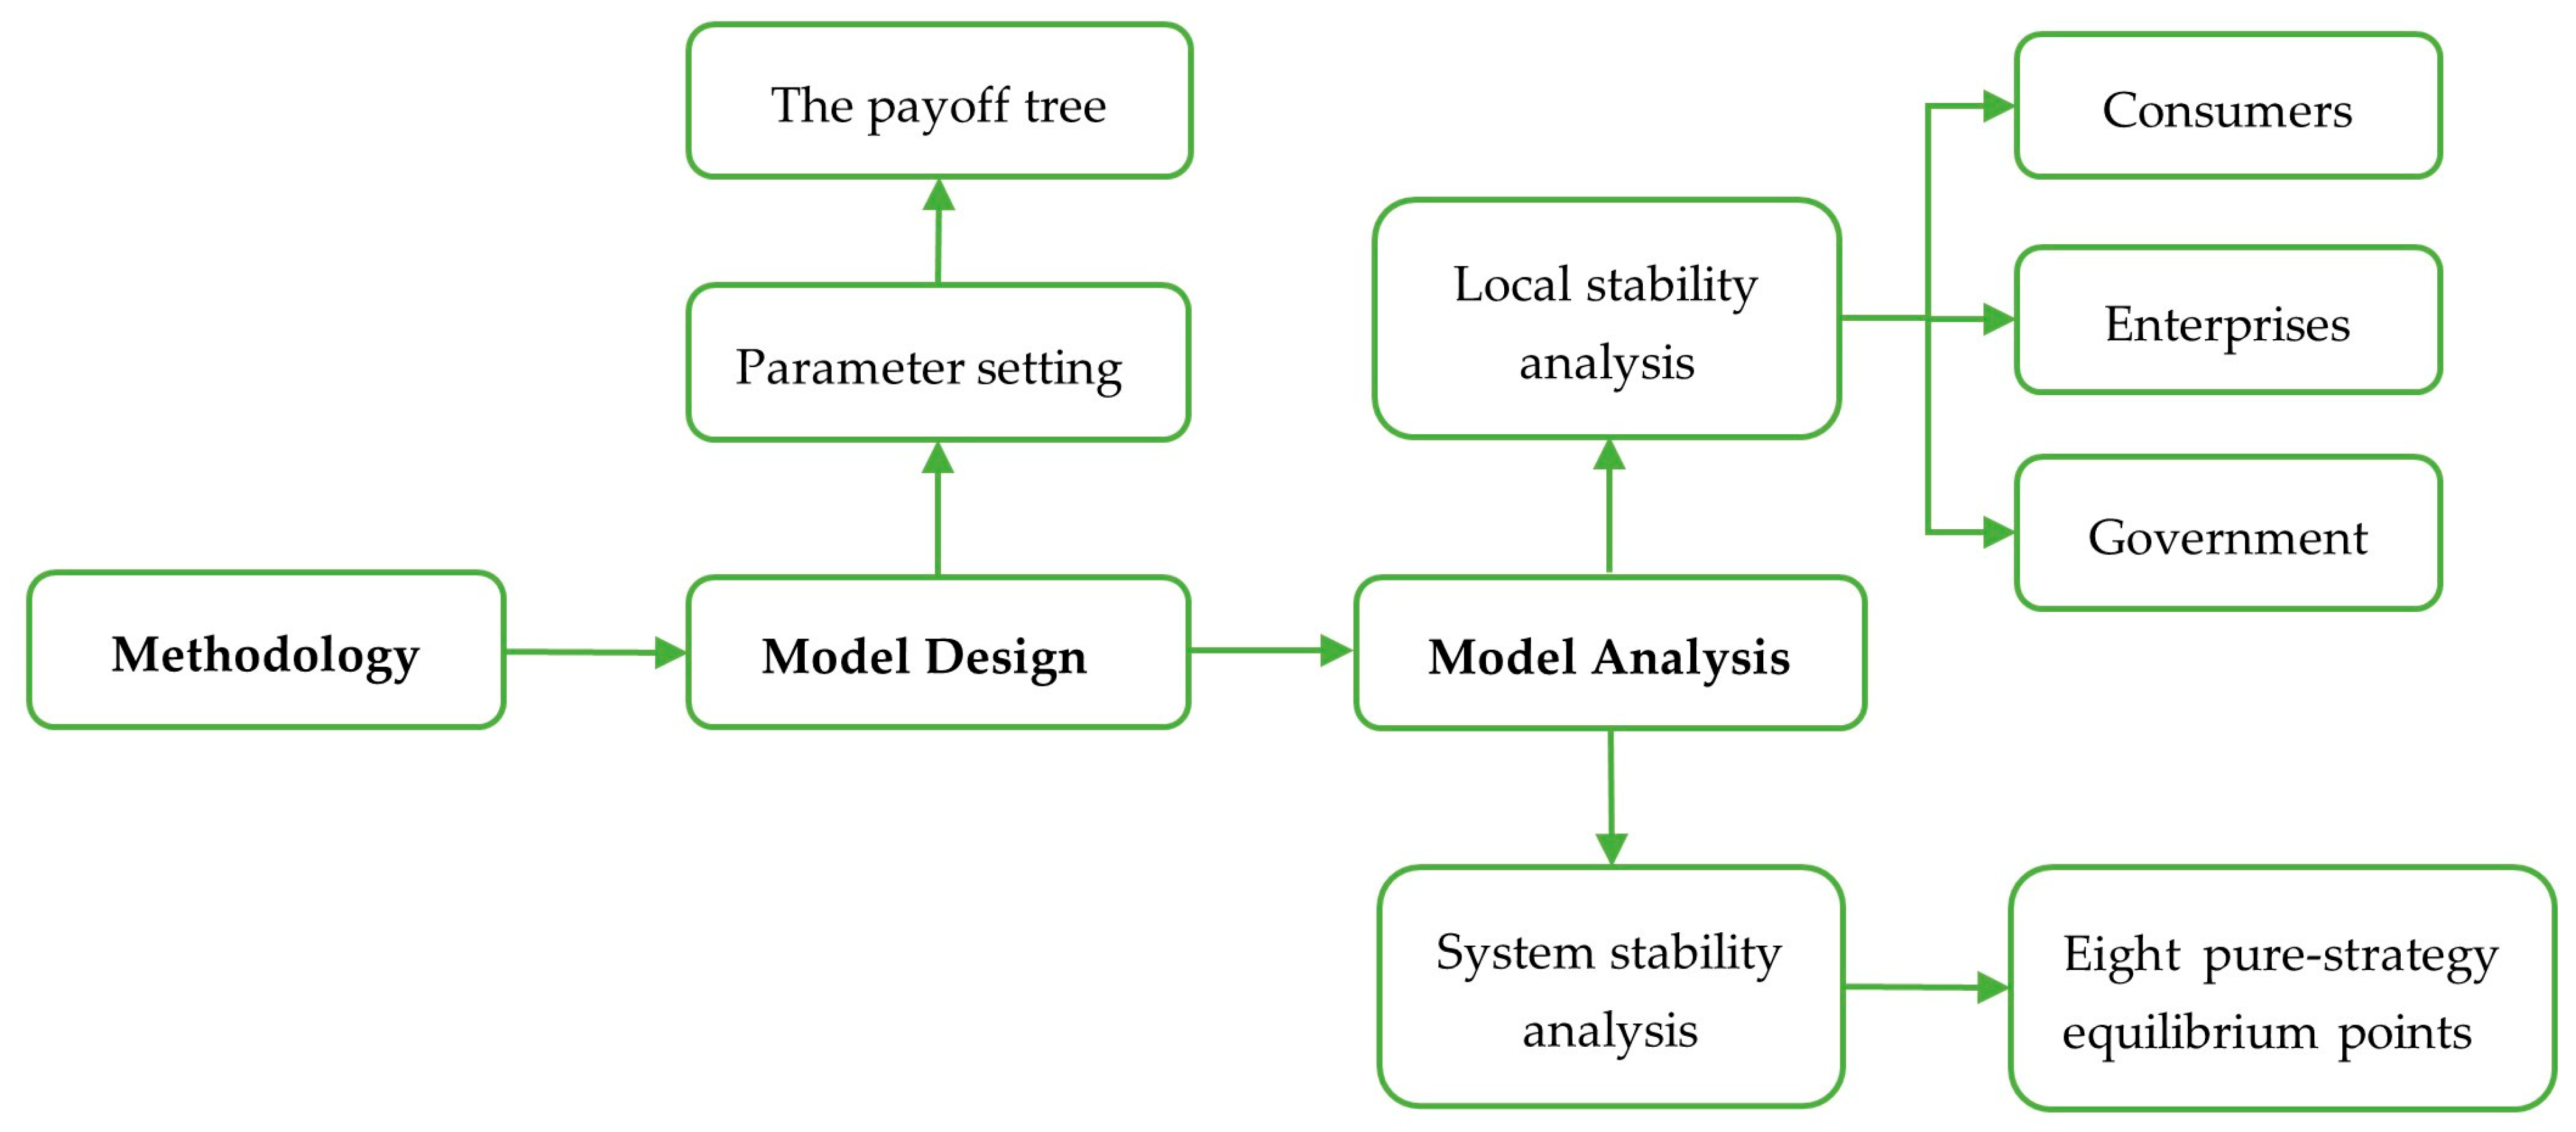
3. Methodology
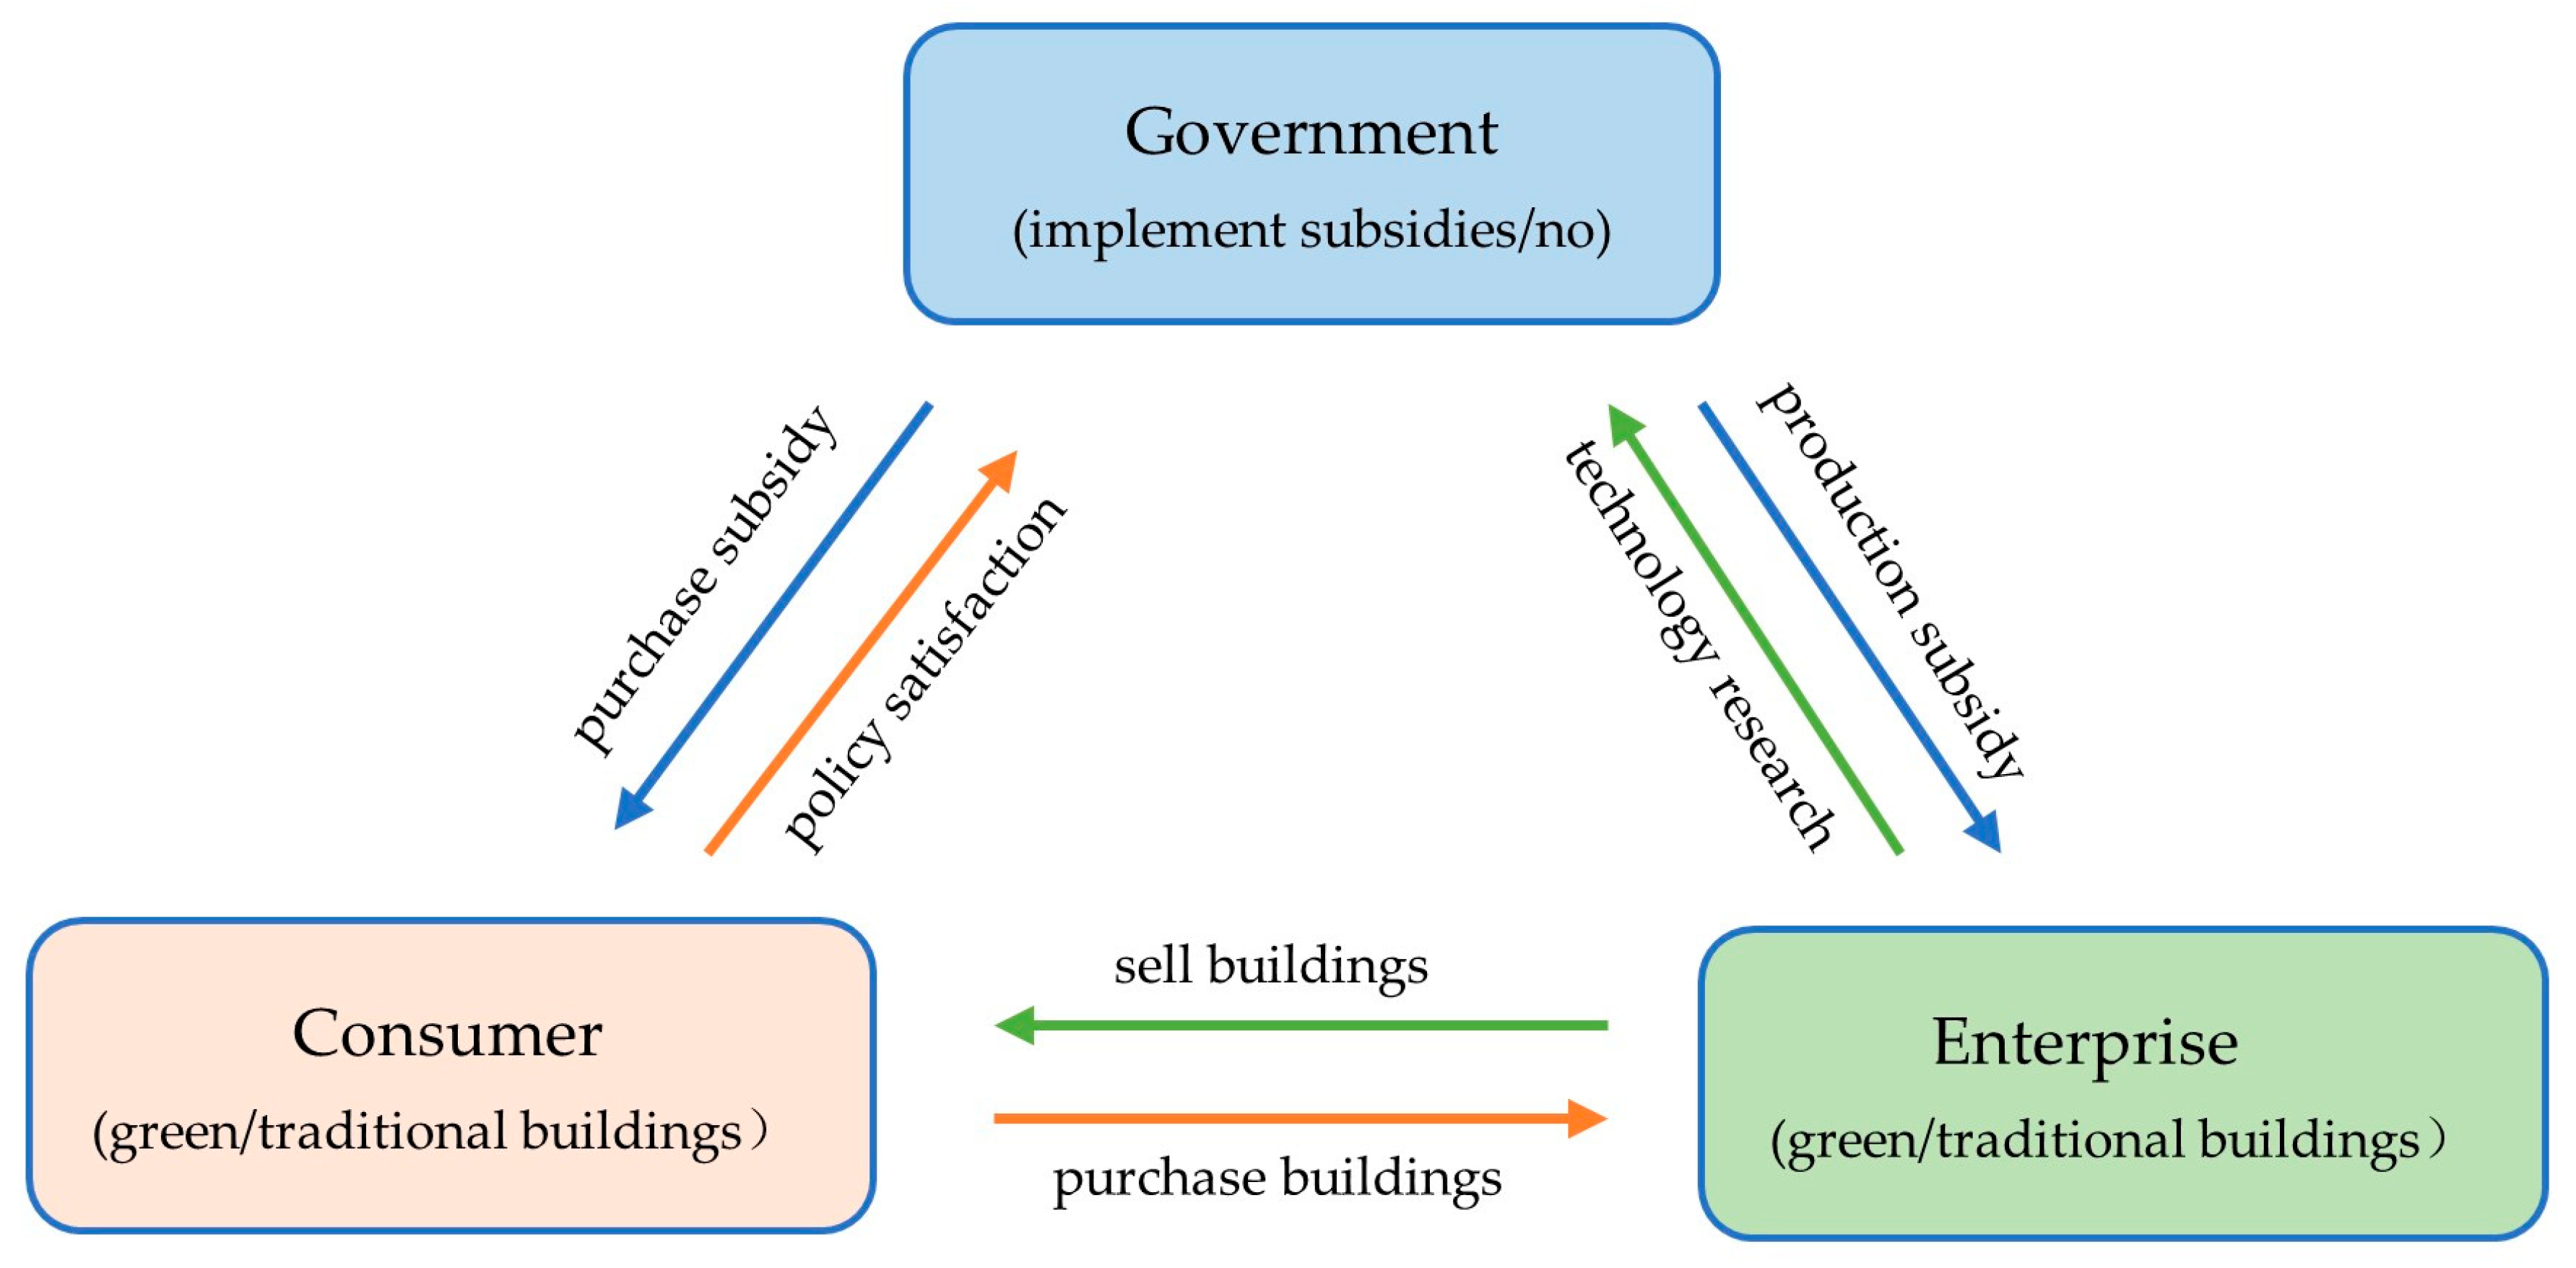
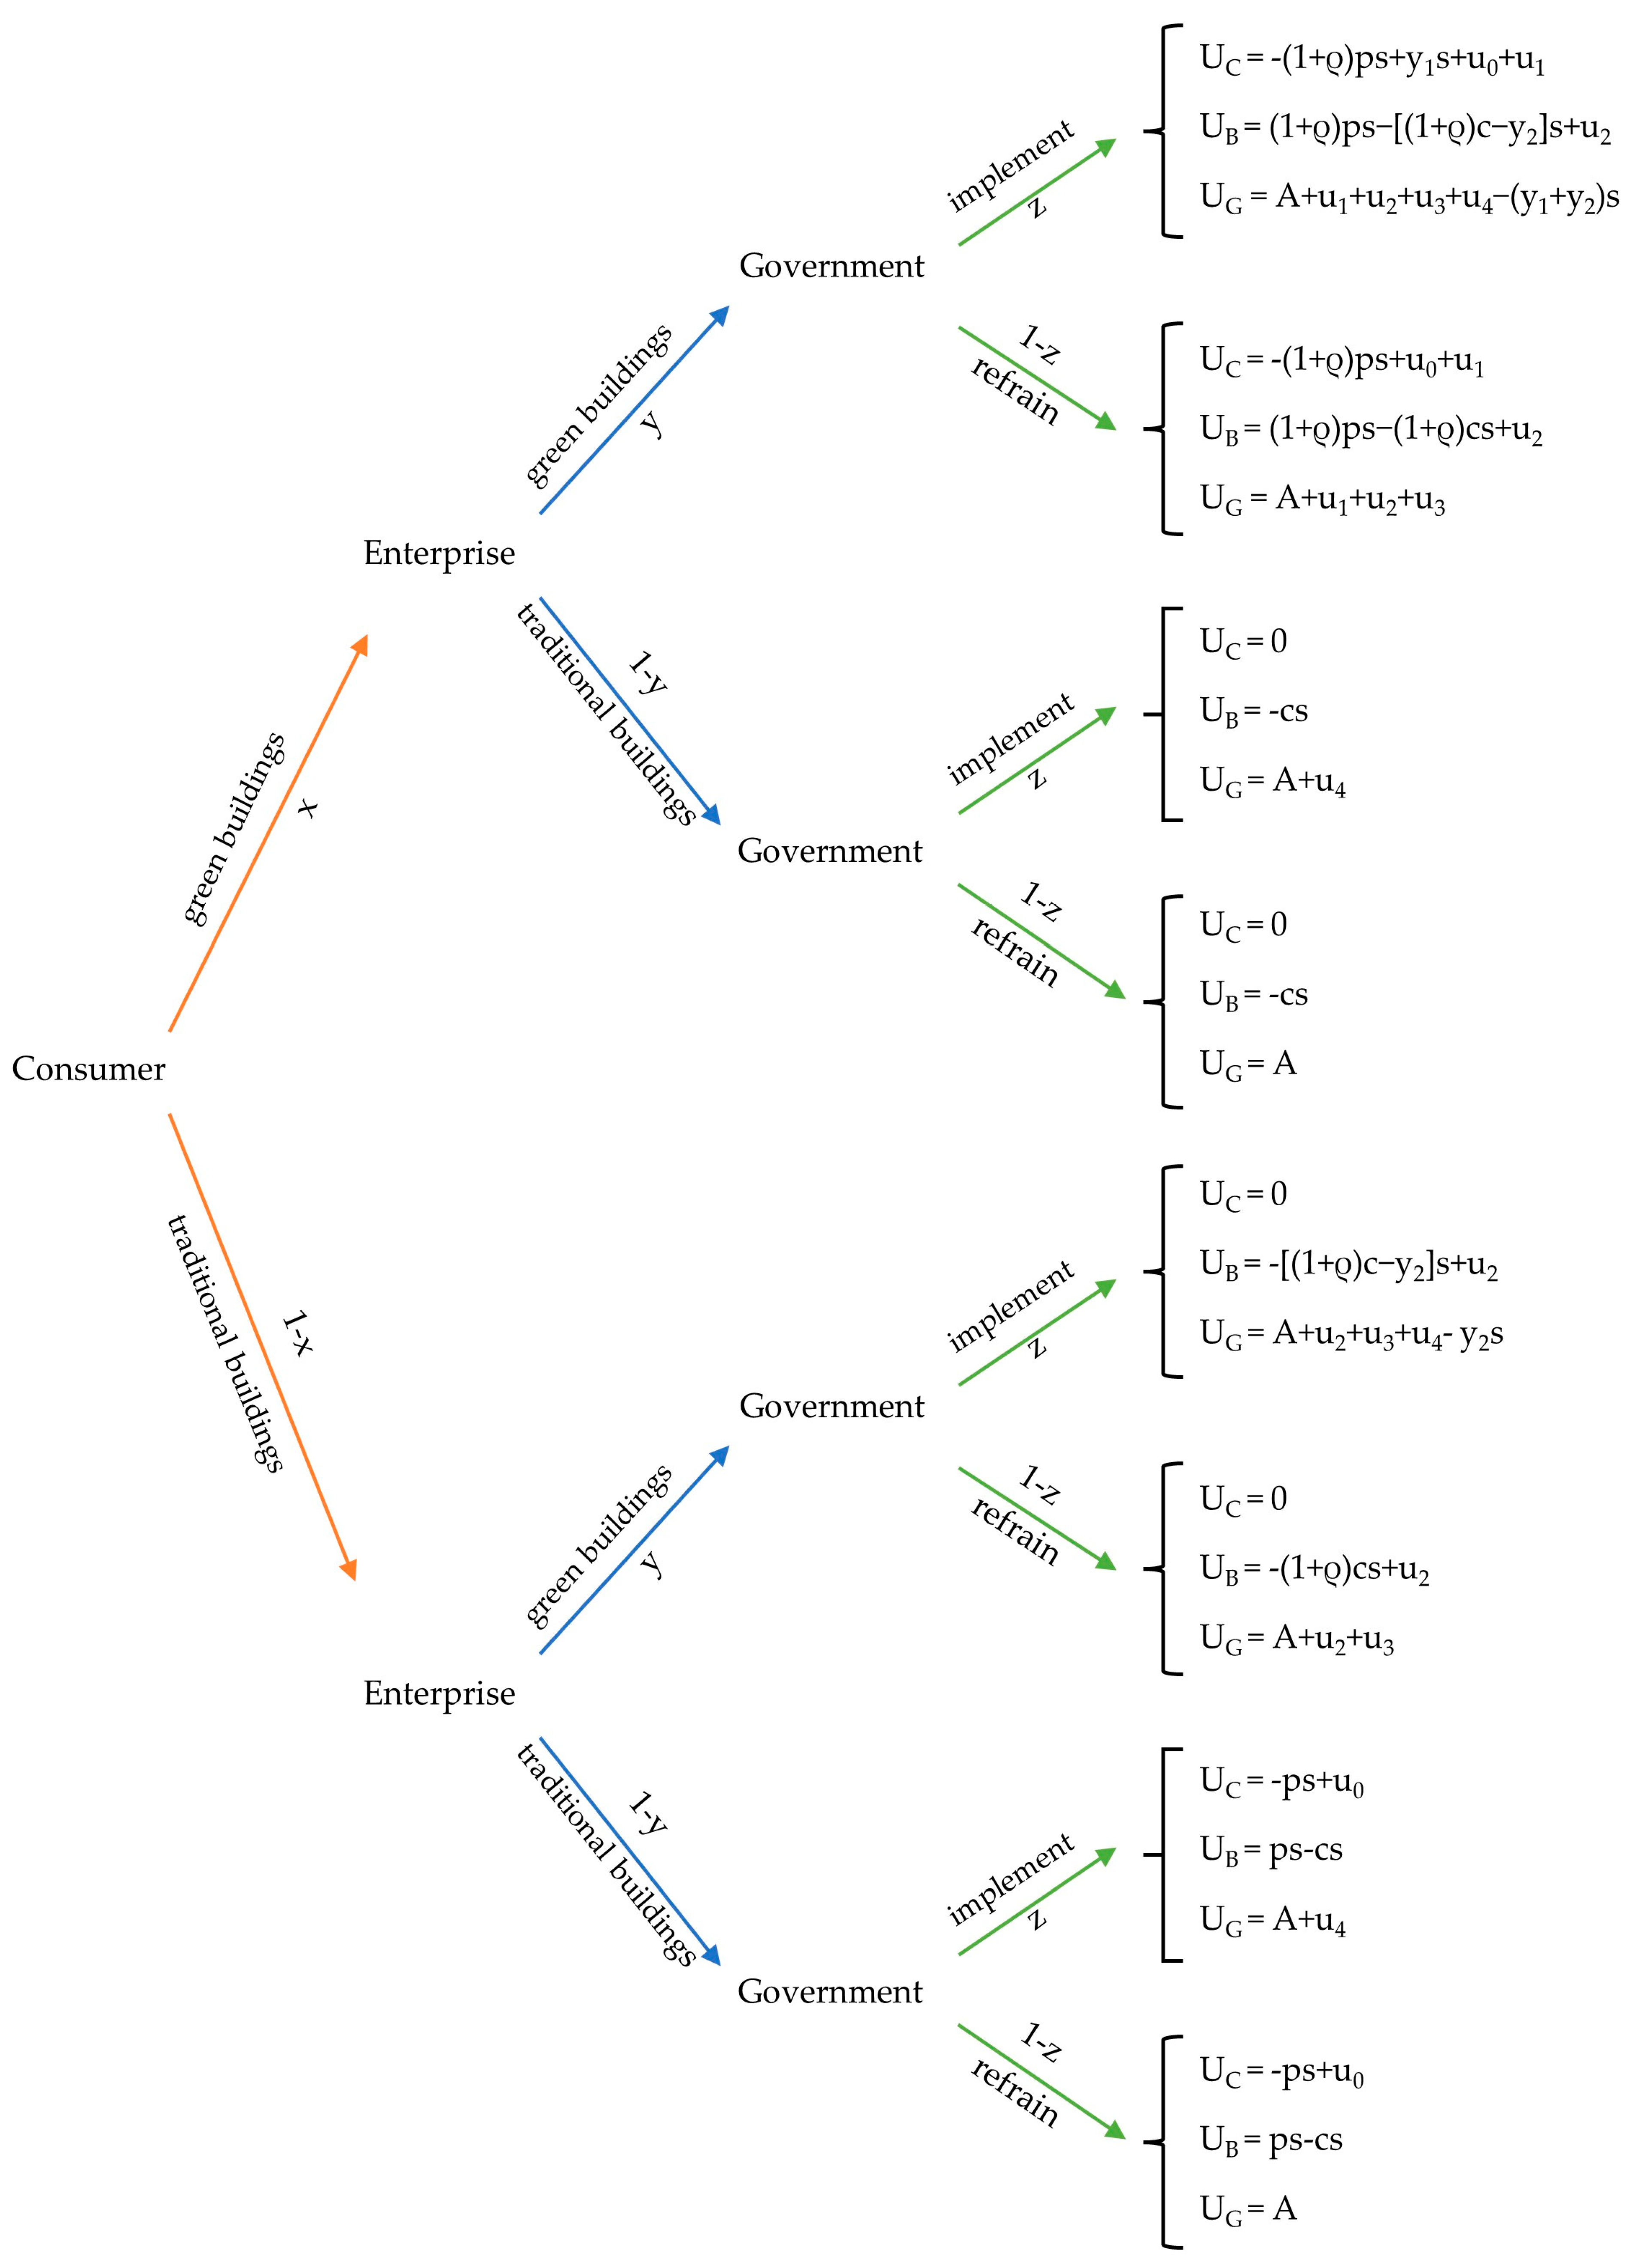
3.1. Model Design
3.2. Model Analysis
3.2.1. Strategic Stability Analysis of Consumers
+ y(1 − z)[−(1 + ρ)ps + u0 + u1] + (1 − y)(1 − z) × 0
3.2.2. Strategic Stability Analysis of Enterprises
+ x(1 − z) [(1 + ρ)ps − (1 + ρ)cs + u2] + (1 − x)(1 − z) [−(1 + ρ)cs + u2]
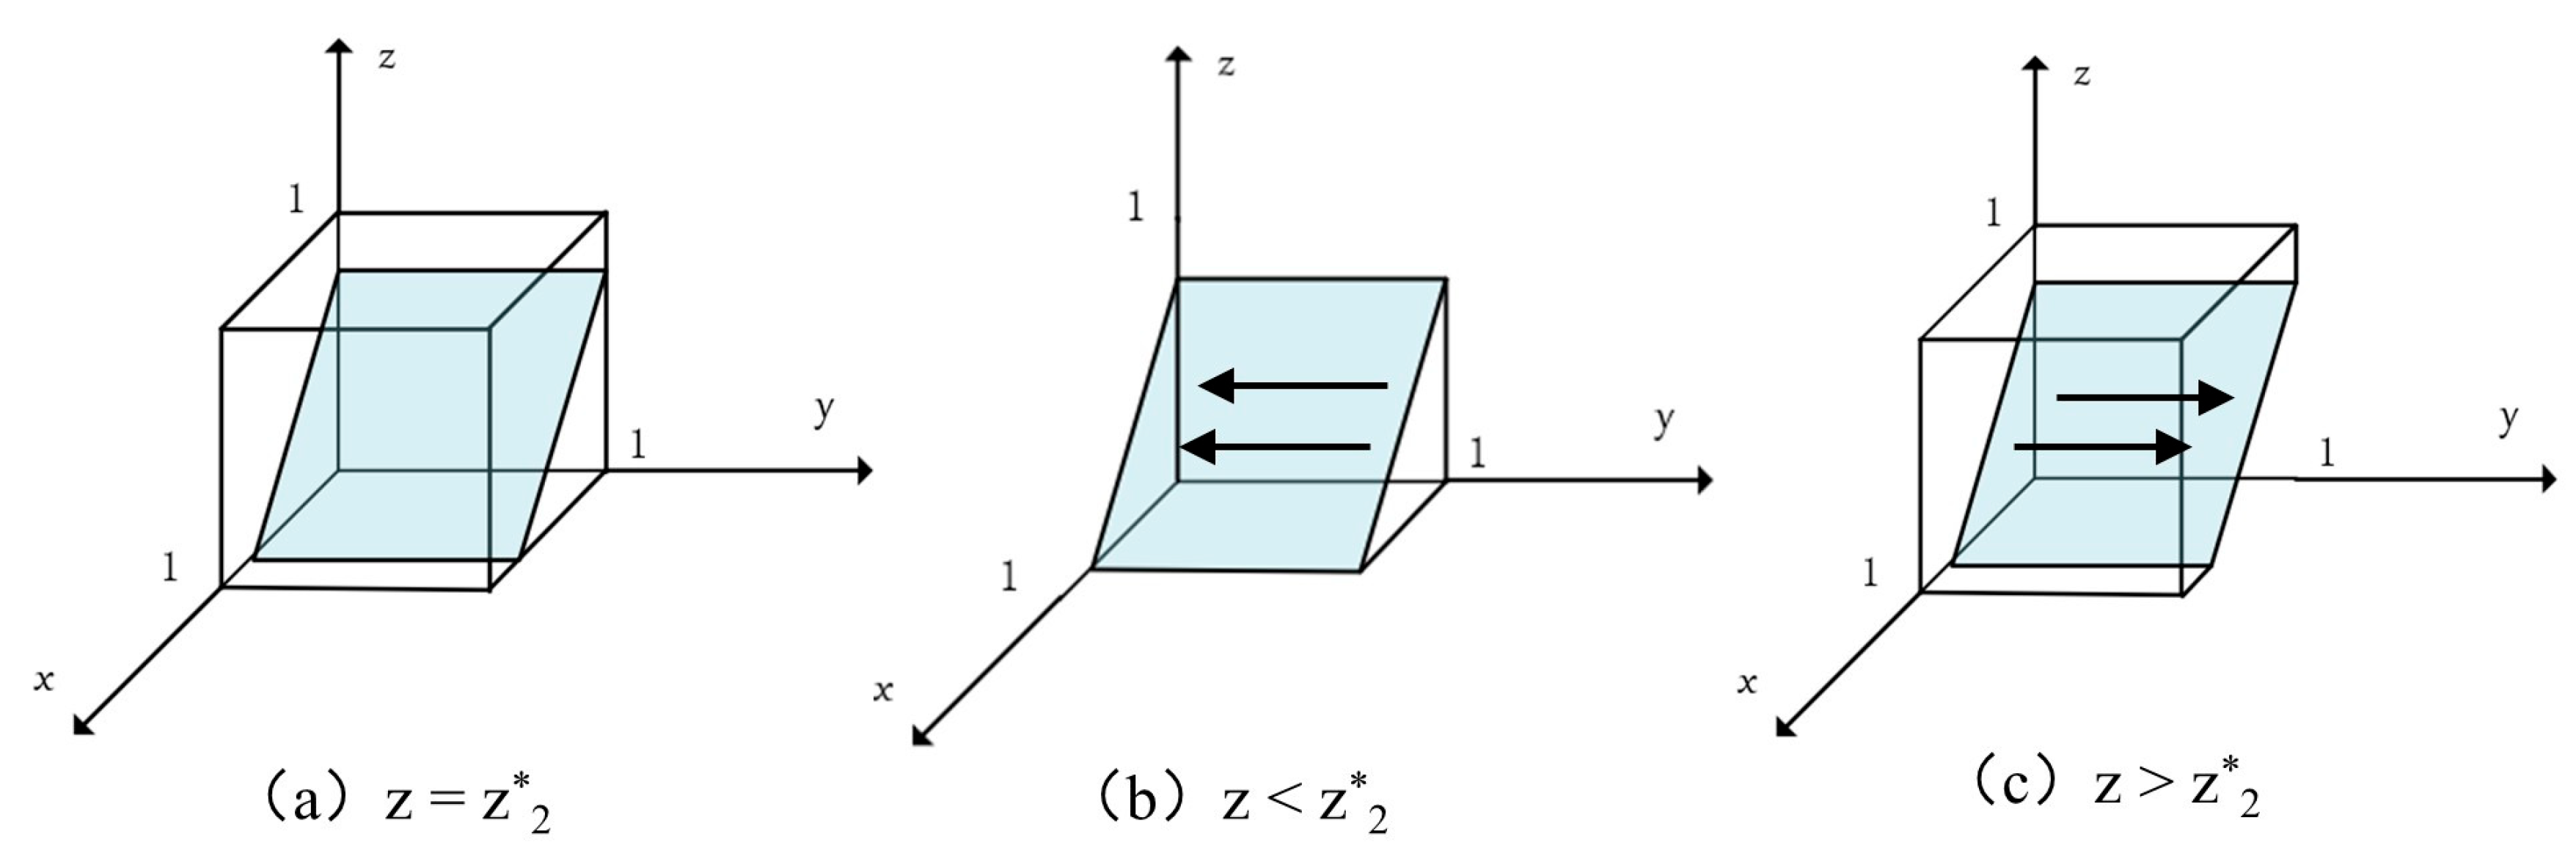
3.2.3. Strategic Stability Analysis of Government
+ (1 − x)y (A + u2 + u3 + u4 − γ2s) + (1 − x)(1 − y) (A + u4)
3.2.4. Stability Analysis of System Equilibrium Points
3.3. Limitations of the Methods
4. Numerical Simulation Analysis
4.1. Parameter Assignment
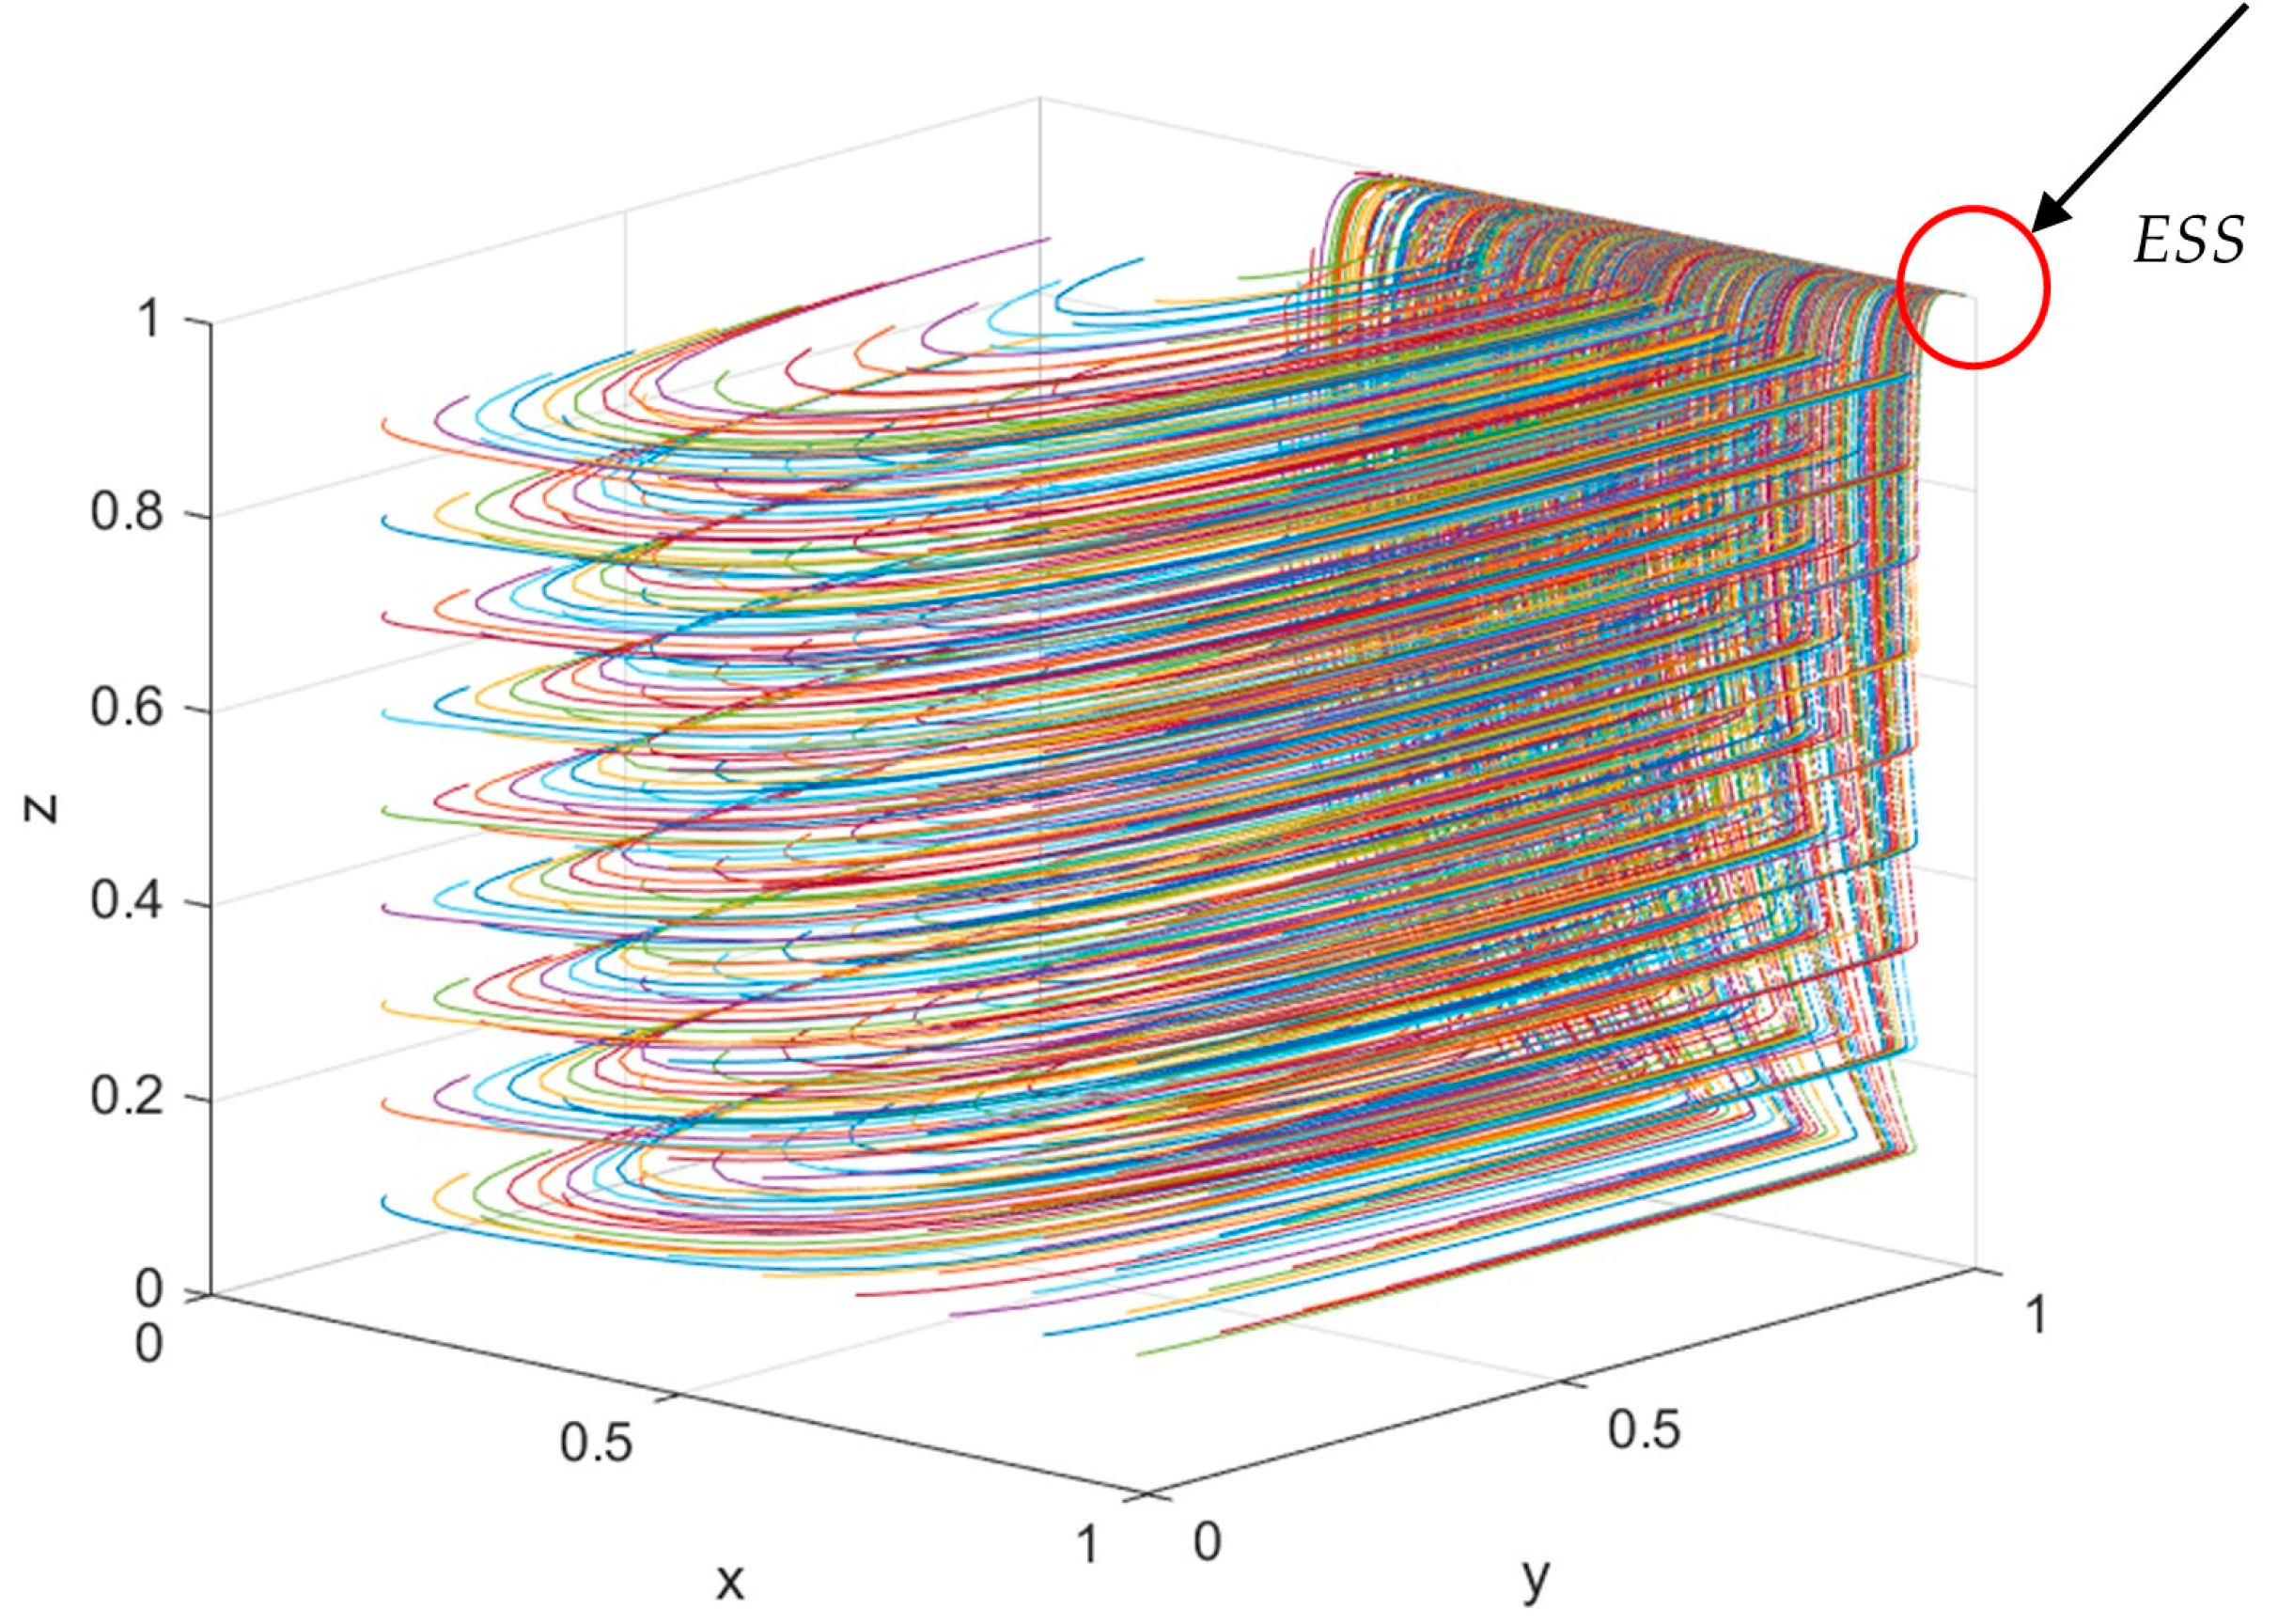
4.2. Overall Stable Point Analysis
4.2.1. High Reputation Benefit
4.2.2. Low Reputation Benefit
4.3. Impact of Parameter Variations on Game Participants’ Strategies
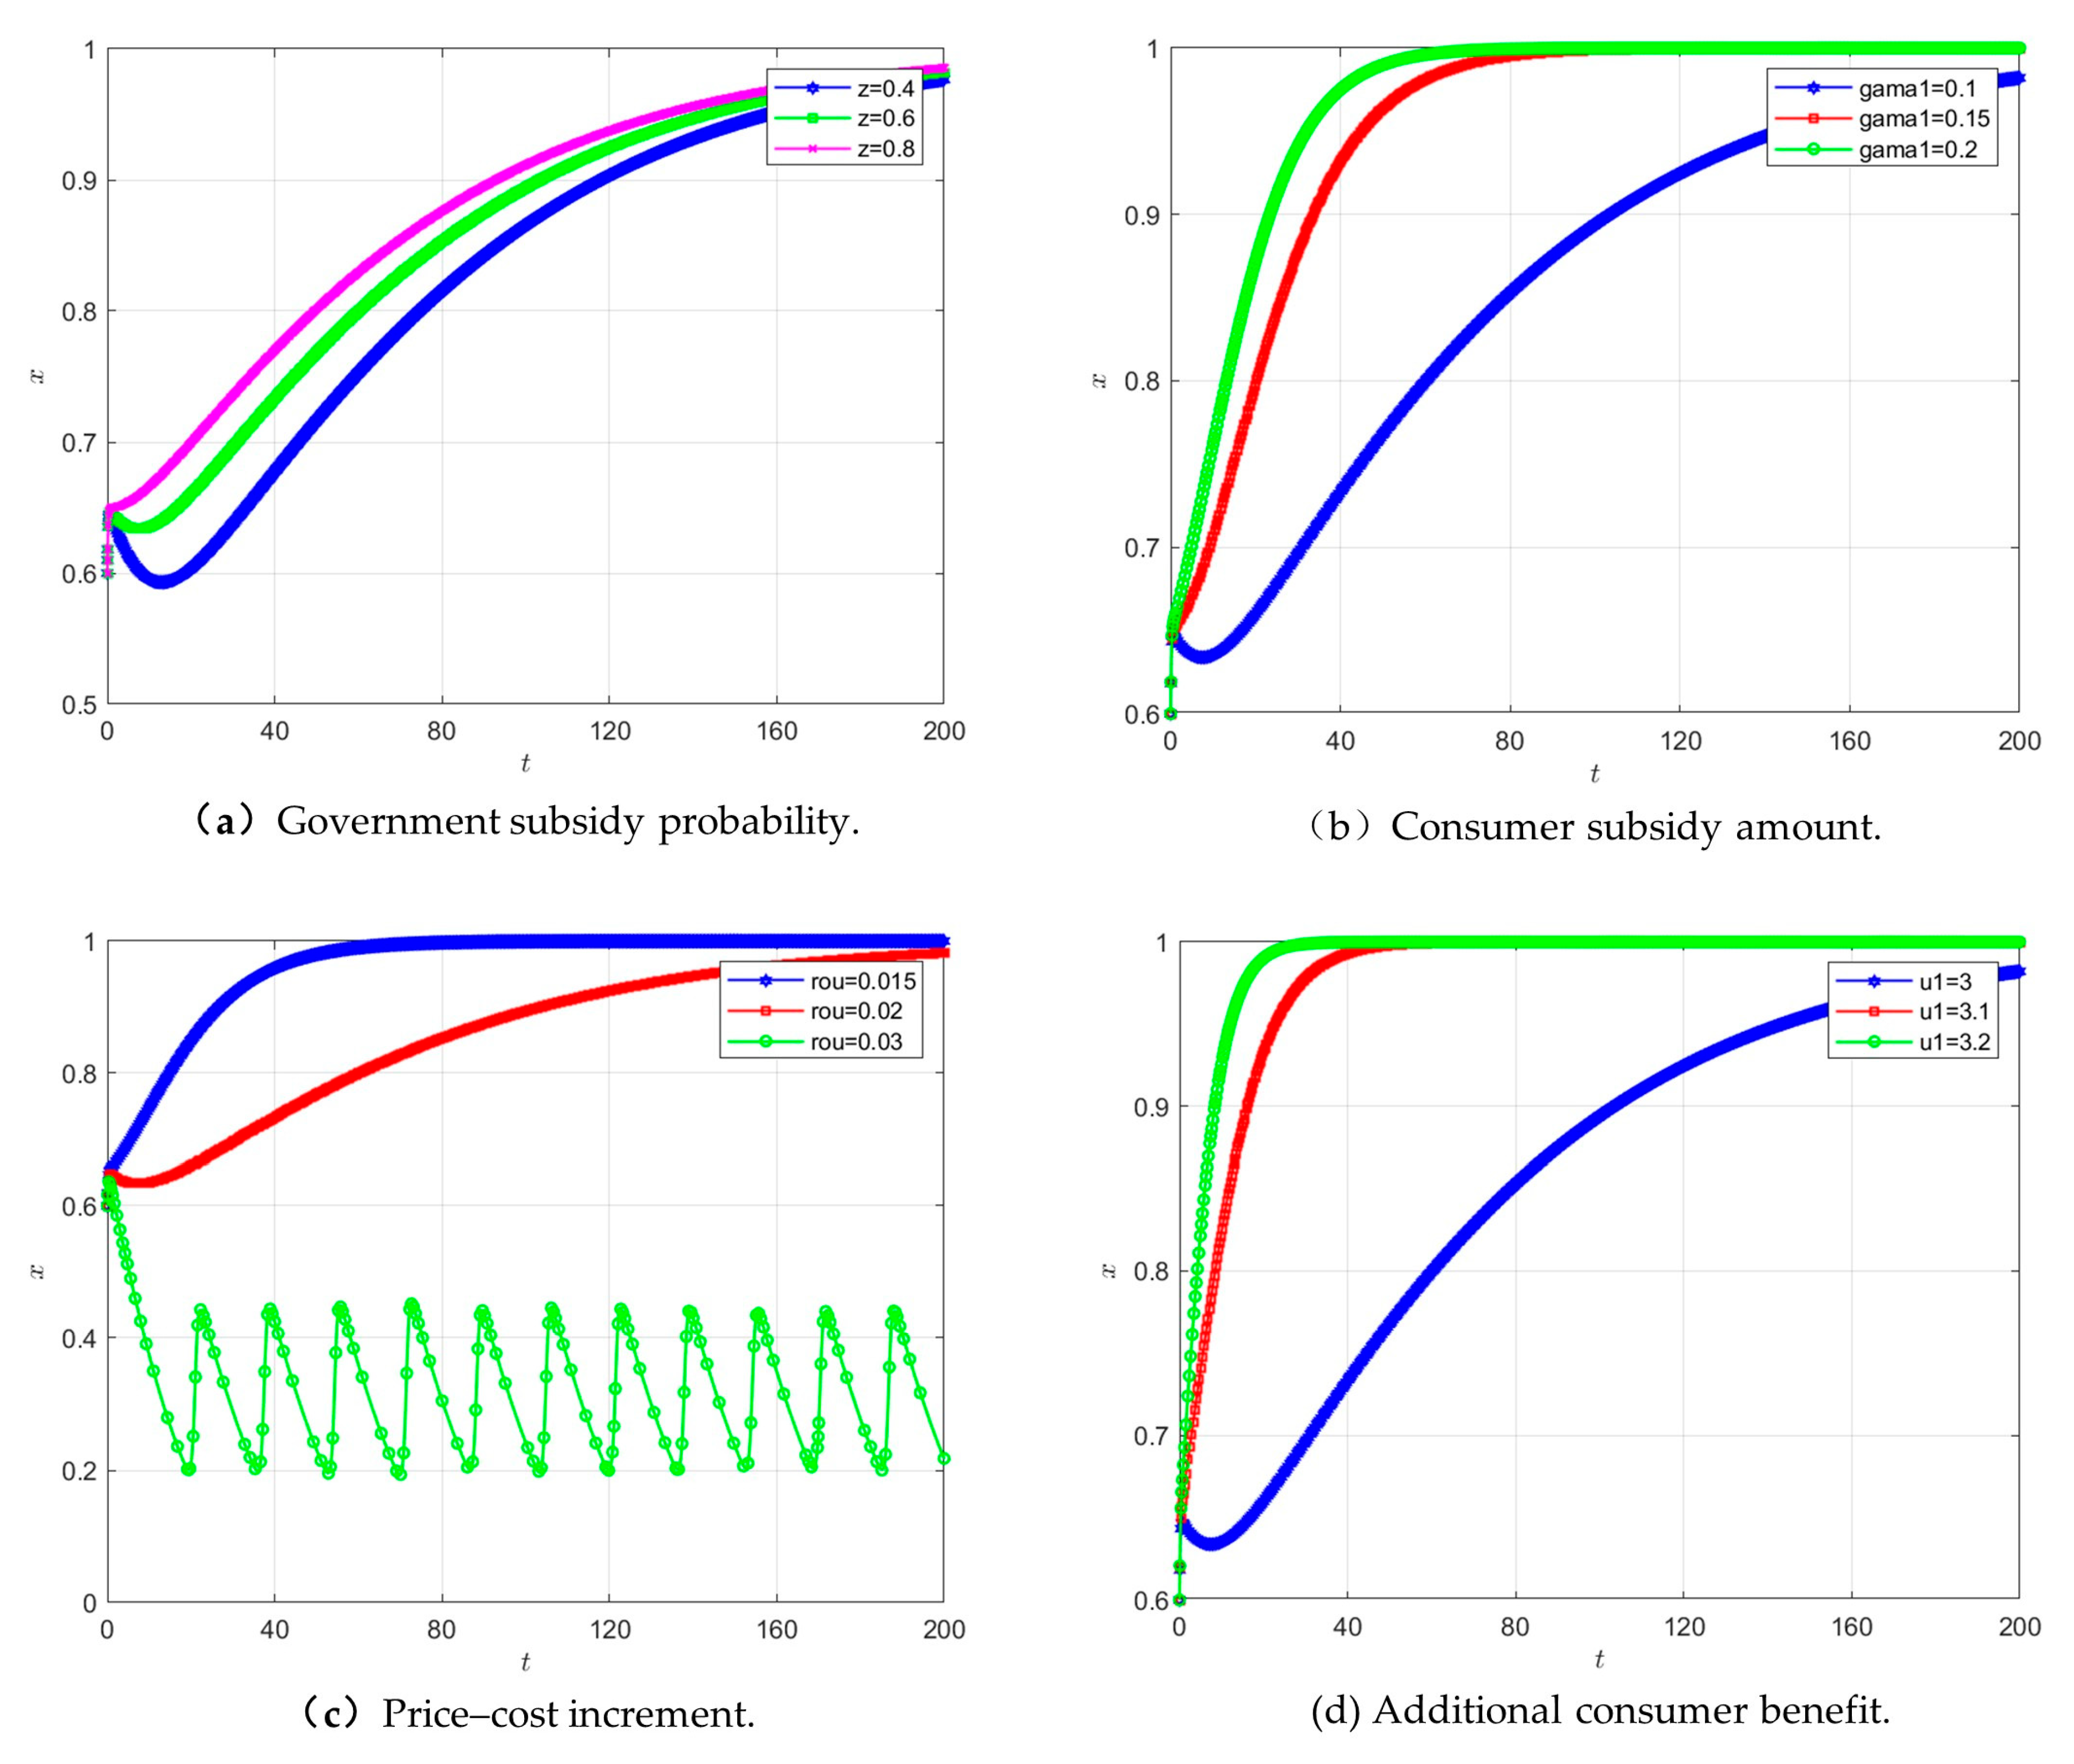
4.3.1. Consumers
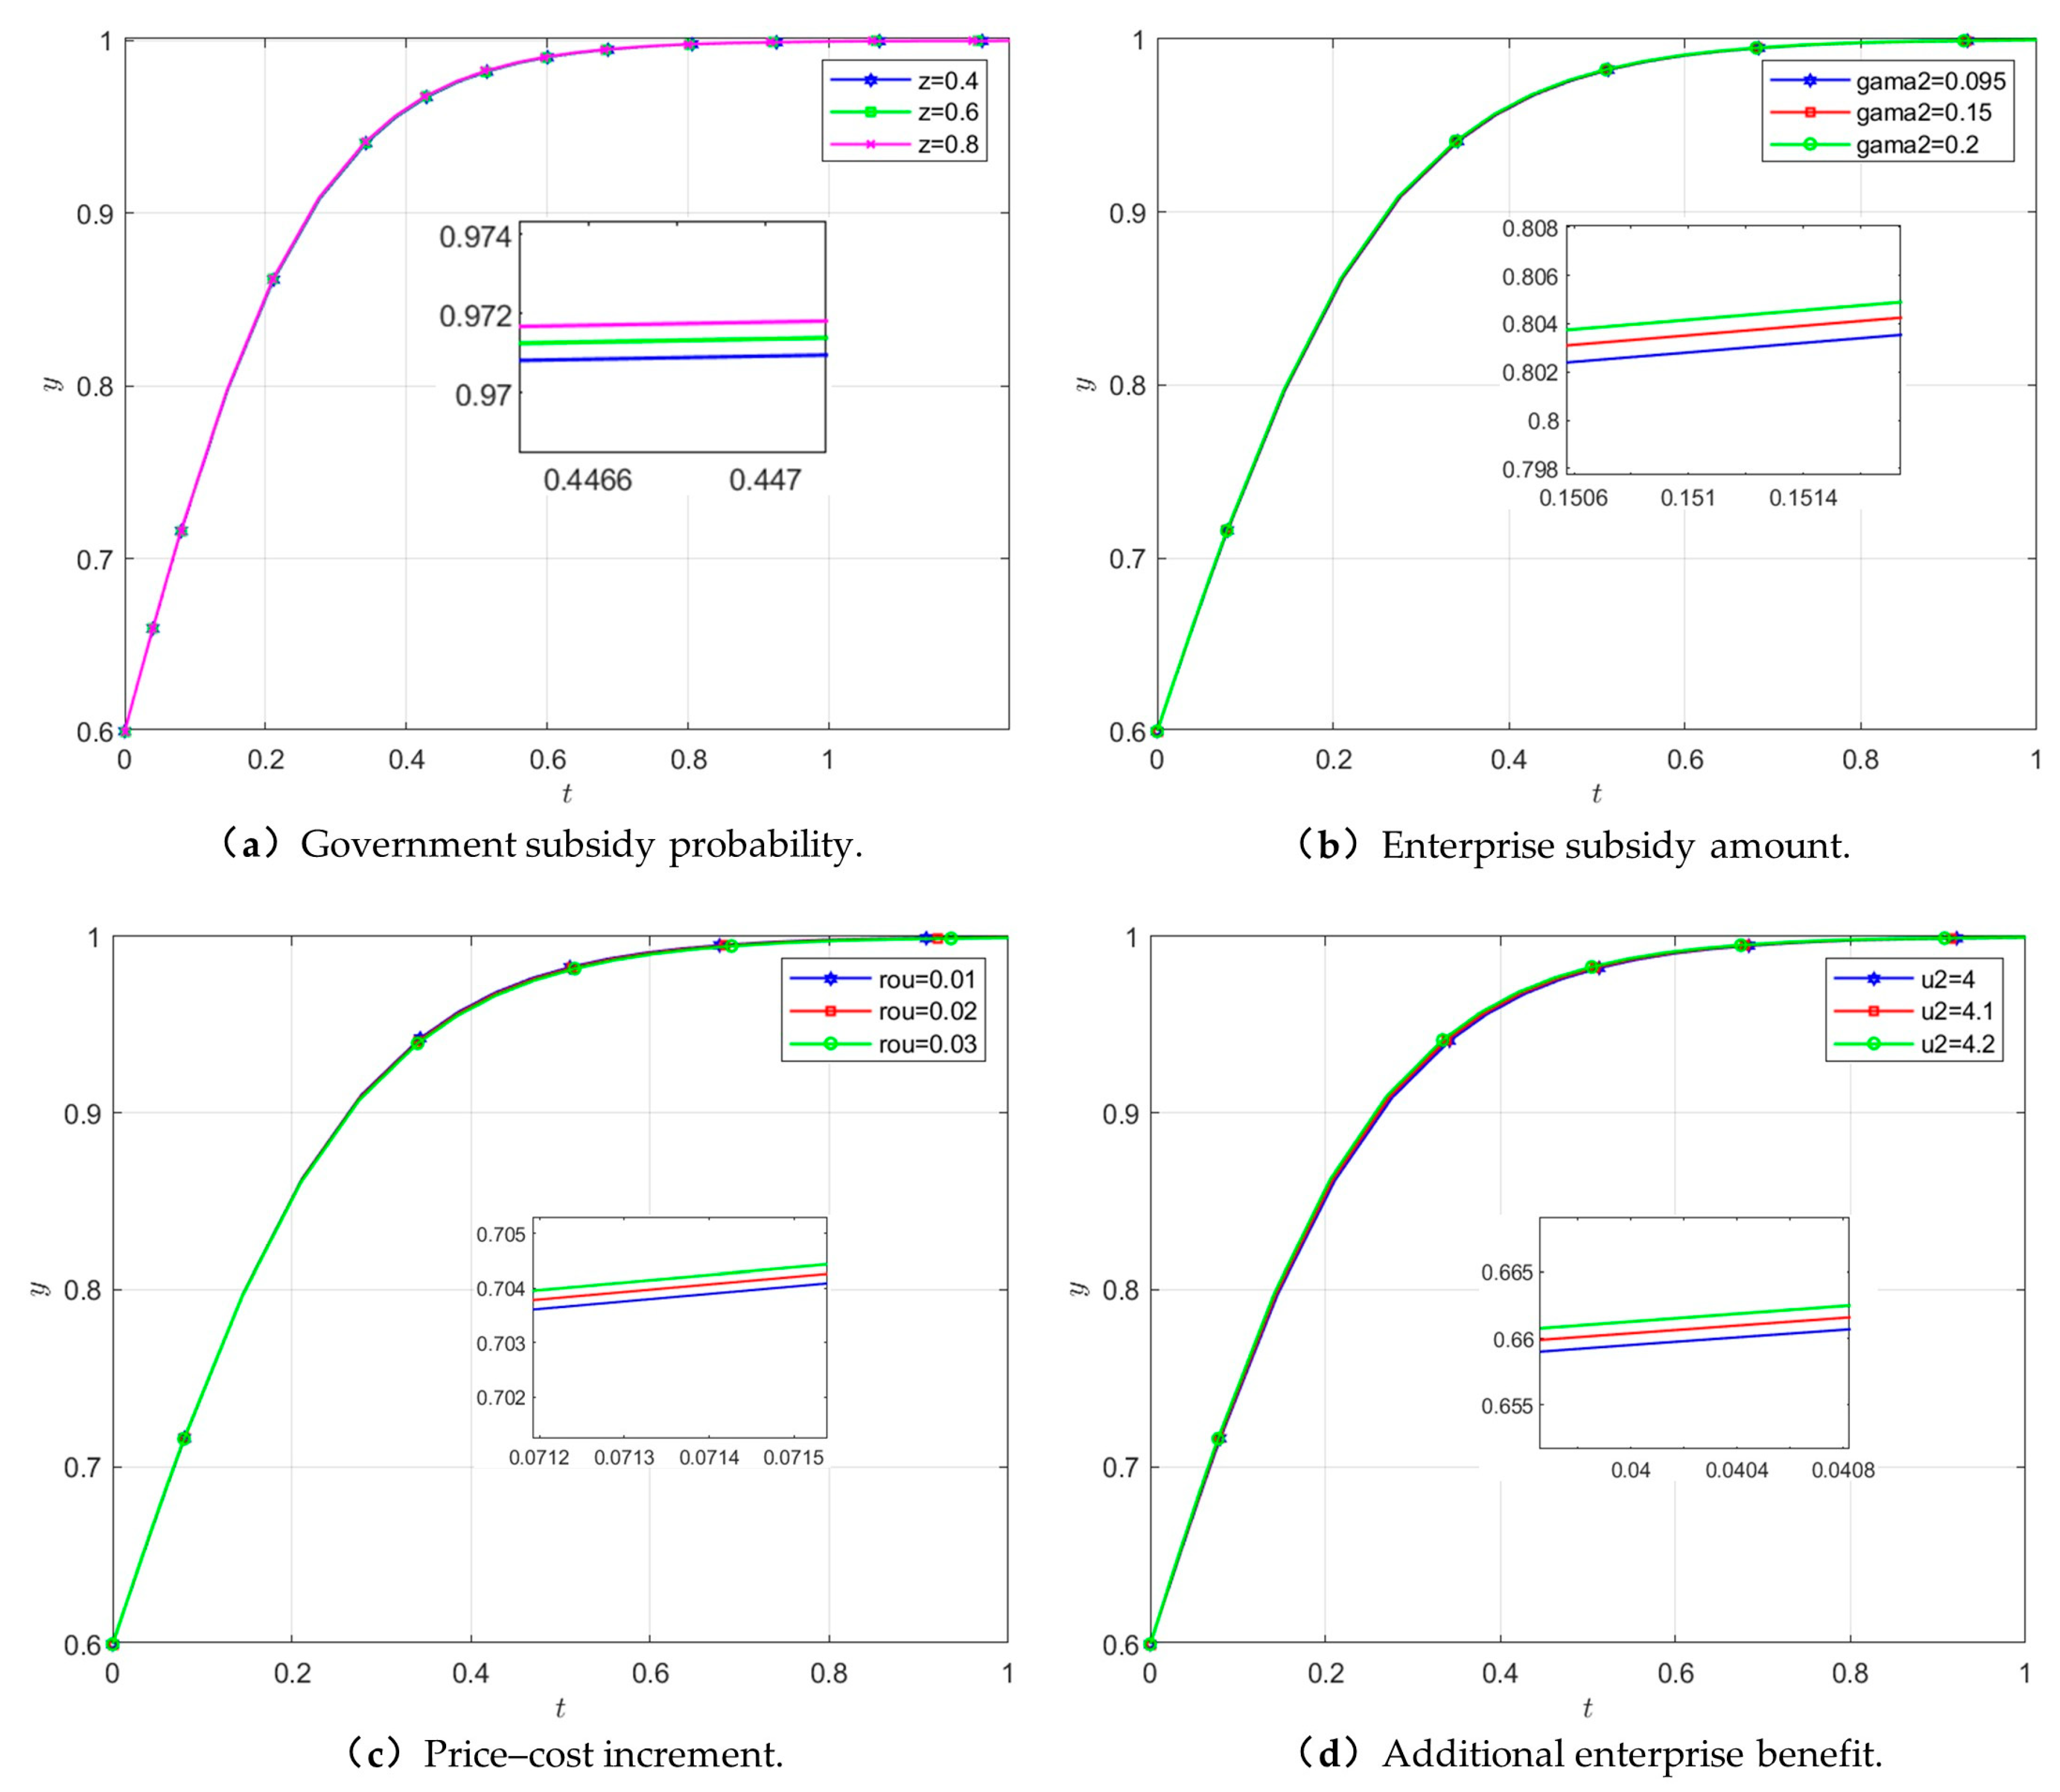
4.3.2. Enterprises
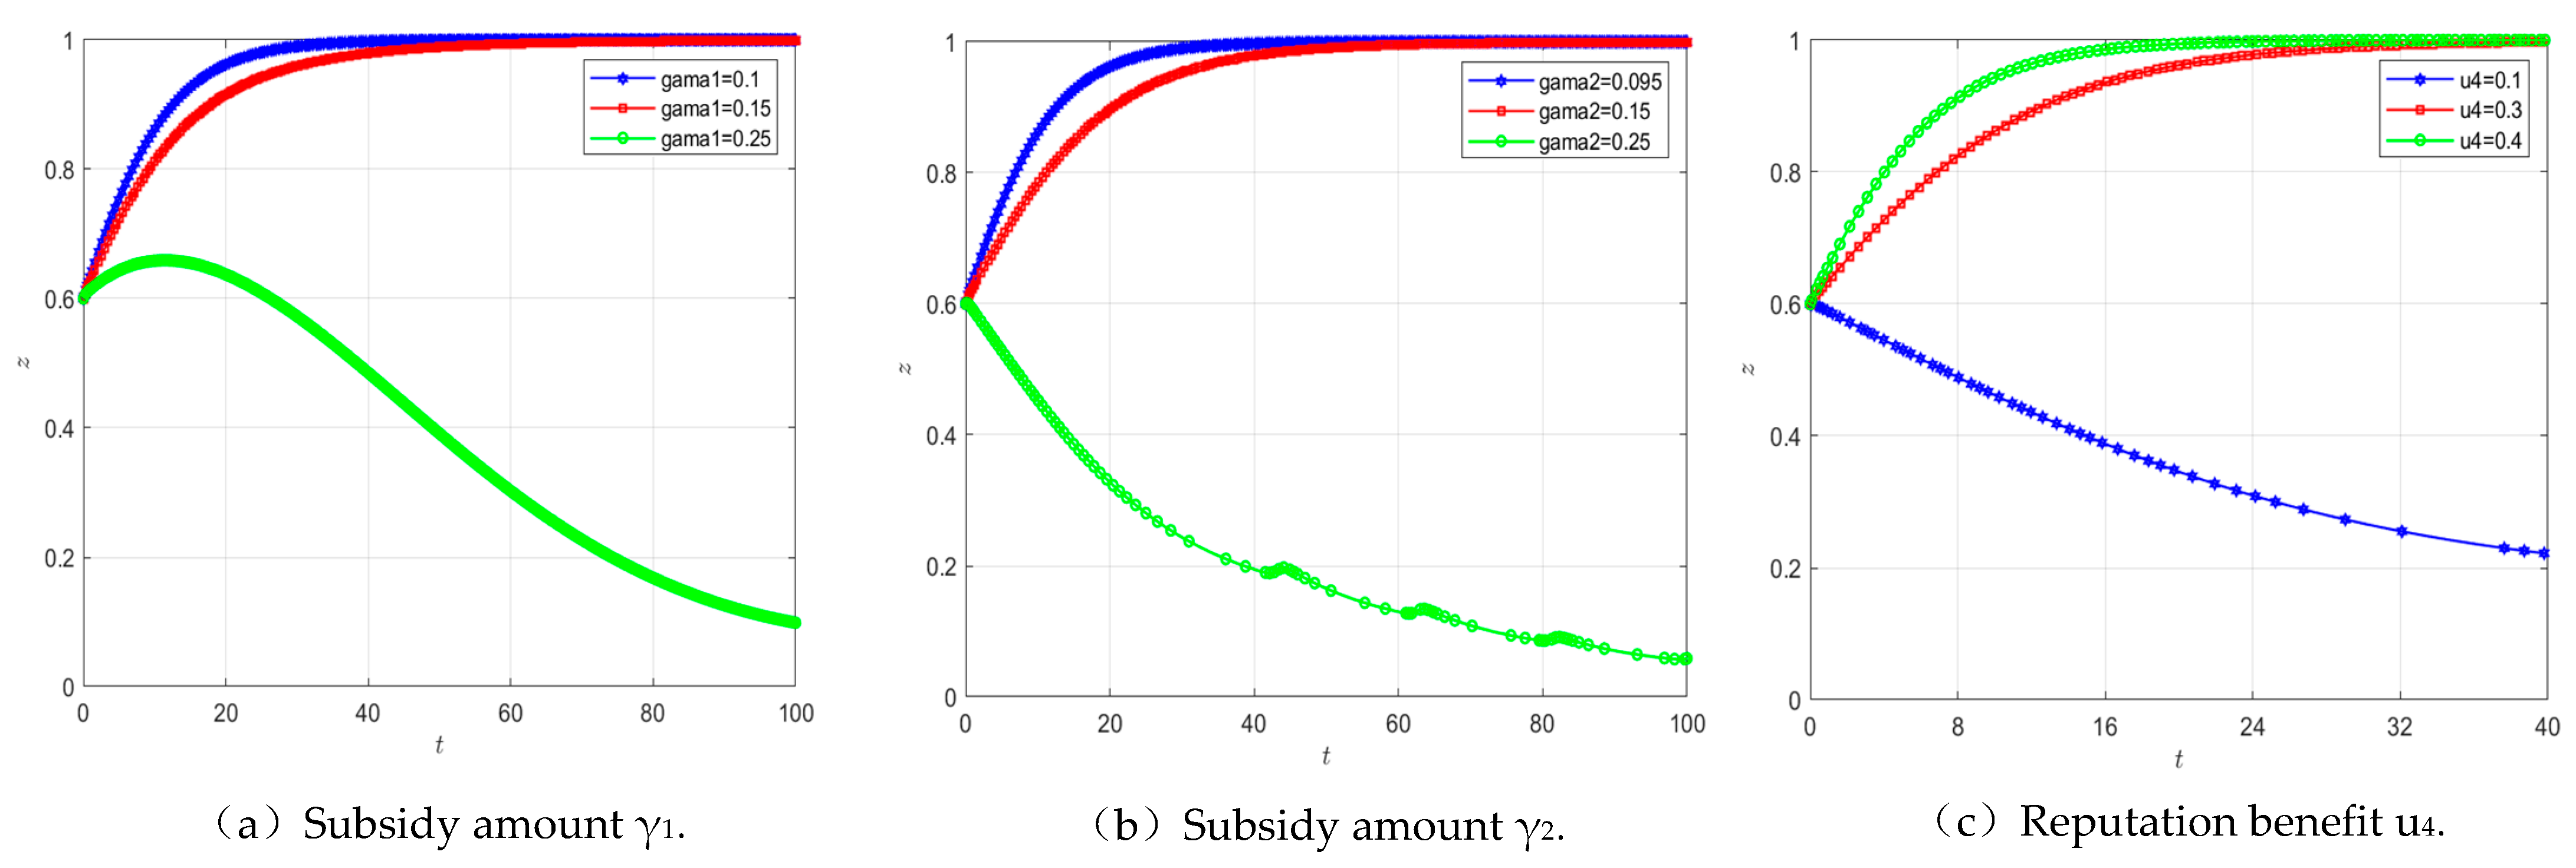
4.3.3. Government
4.4. Policy Sensitivity Analysis Under Carbon-Neutrality Goals
4.4.1. Multi-Scenario Policy Combination Design
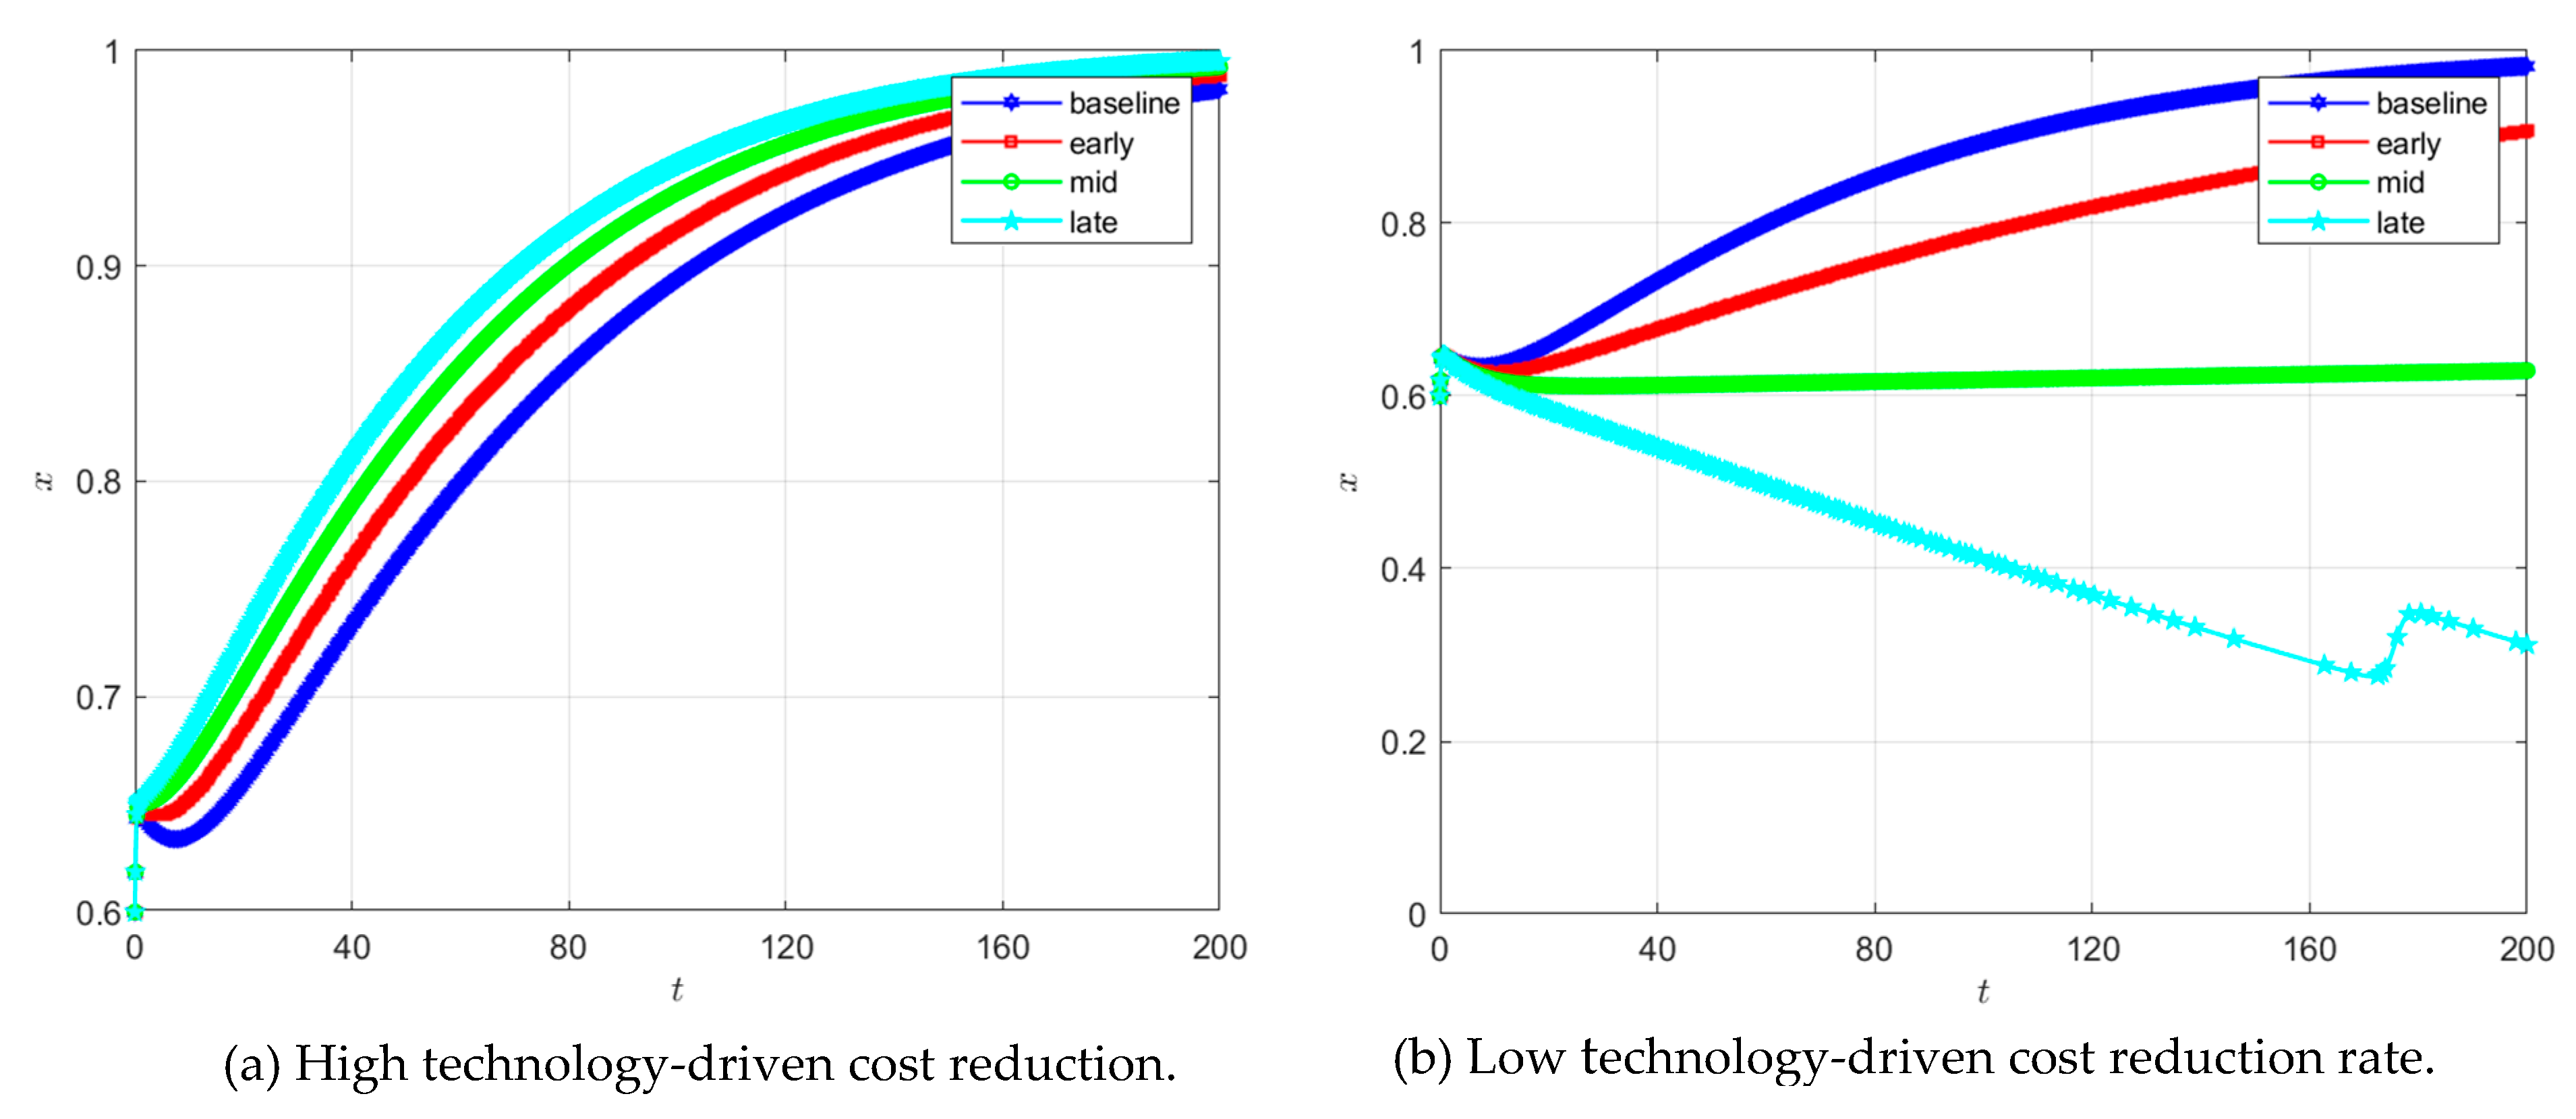
4.4.2. Incentive Effects of Different Subsidy–Technology Pathways on Consumers
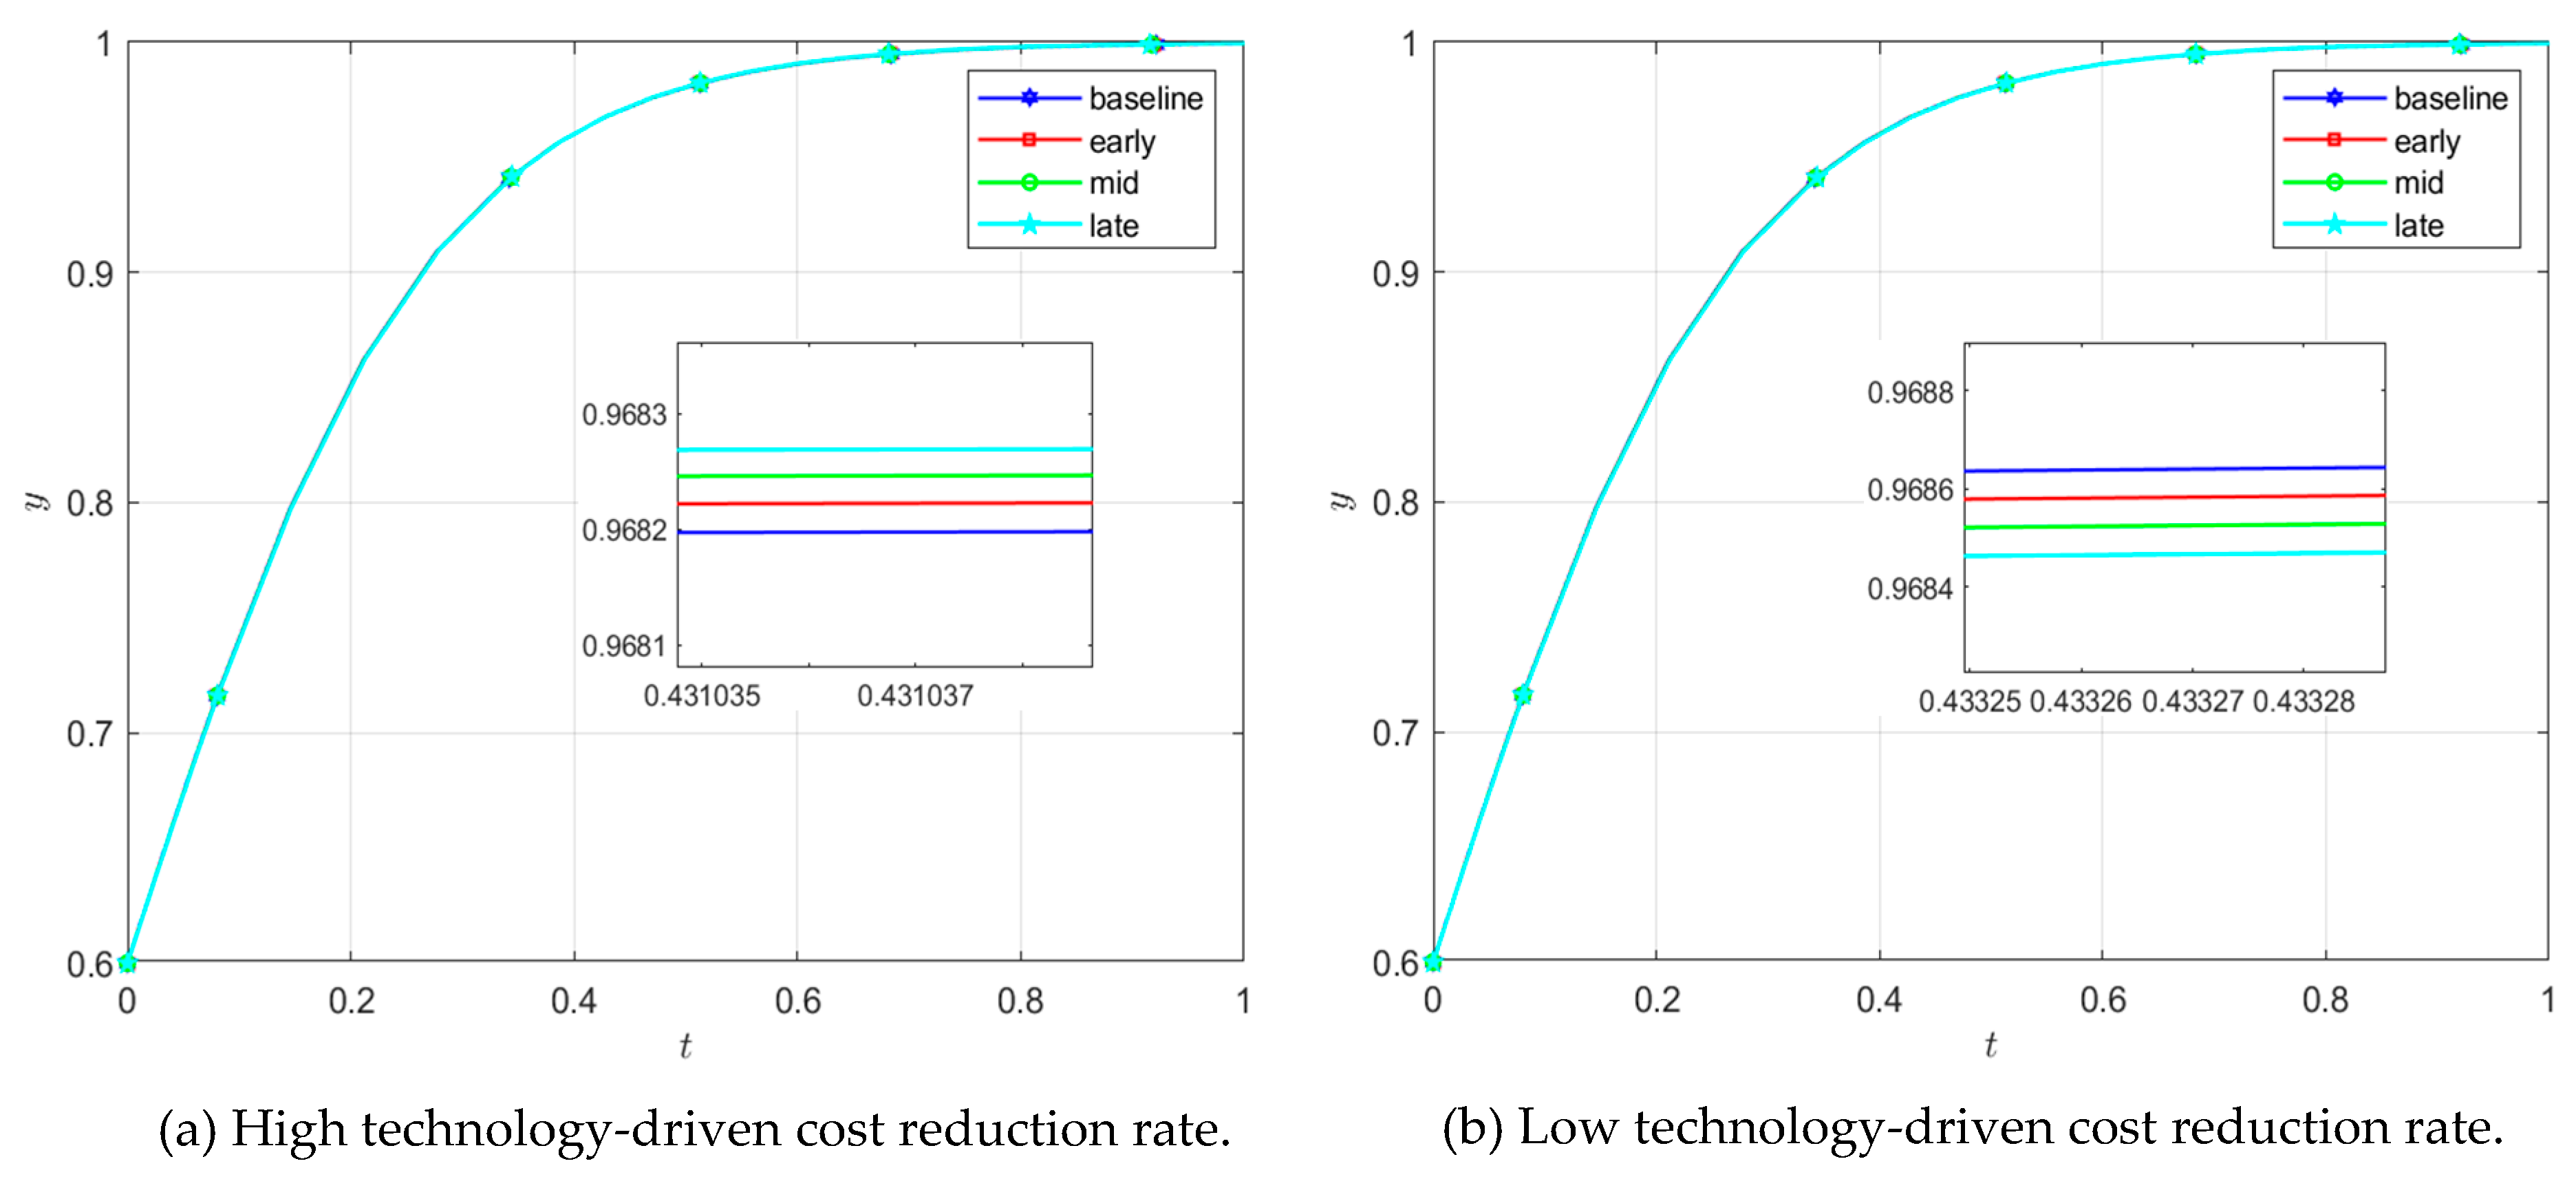
4.4.3. Incentive Effects of Different Subsidy–Technology Pathways on Enterprises
4.4.4. Summary
4.5. “Technology–Reputation–Policy” Synergy Mechanism Theoretical Model
4.5.1. Theoretical Framework Construction
4.5.2. Mathematical Expression
4.5.3. Dynamic Equations of the Synergy Mechanism
4.5.4. Interpretation of Policy Implications
4.5.5. Model Limitations and Future Directions
5. Case Study: Policy Simulation and Optimization for Green Buildings in Shenzhen
5.1. Case Background
5.2. Parameter Calibration
5.2.1. Shenzhen Parameter Calibration
5.2.2. Beijing Parameter Calibration
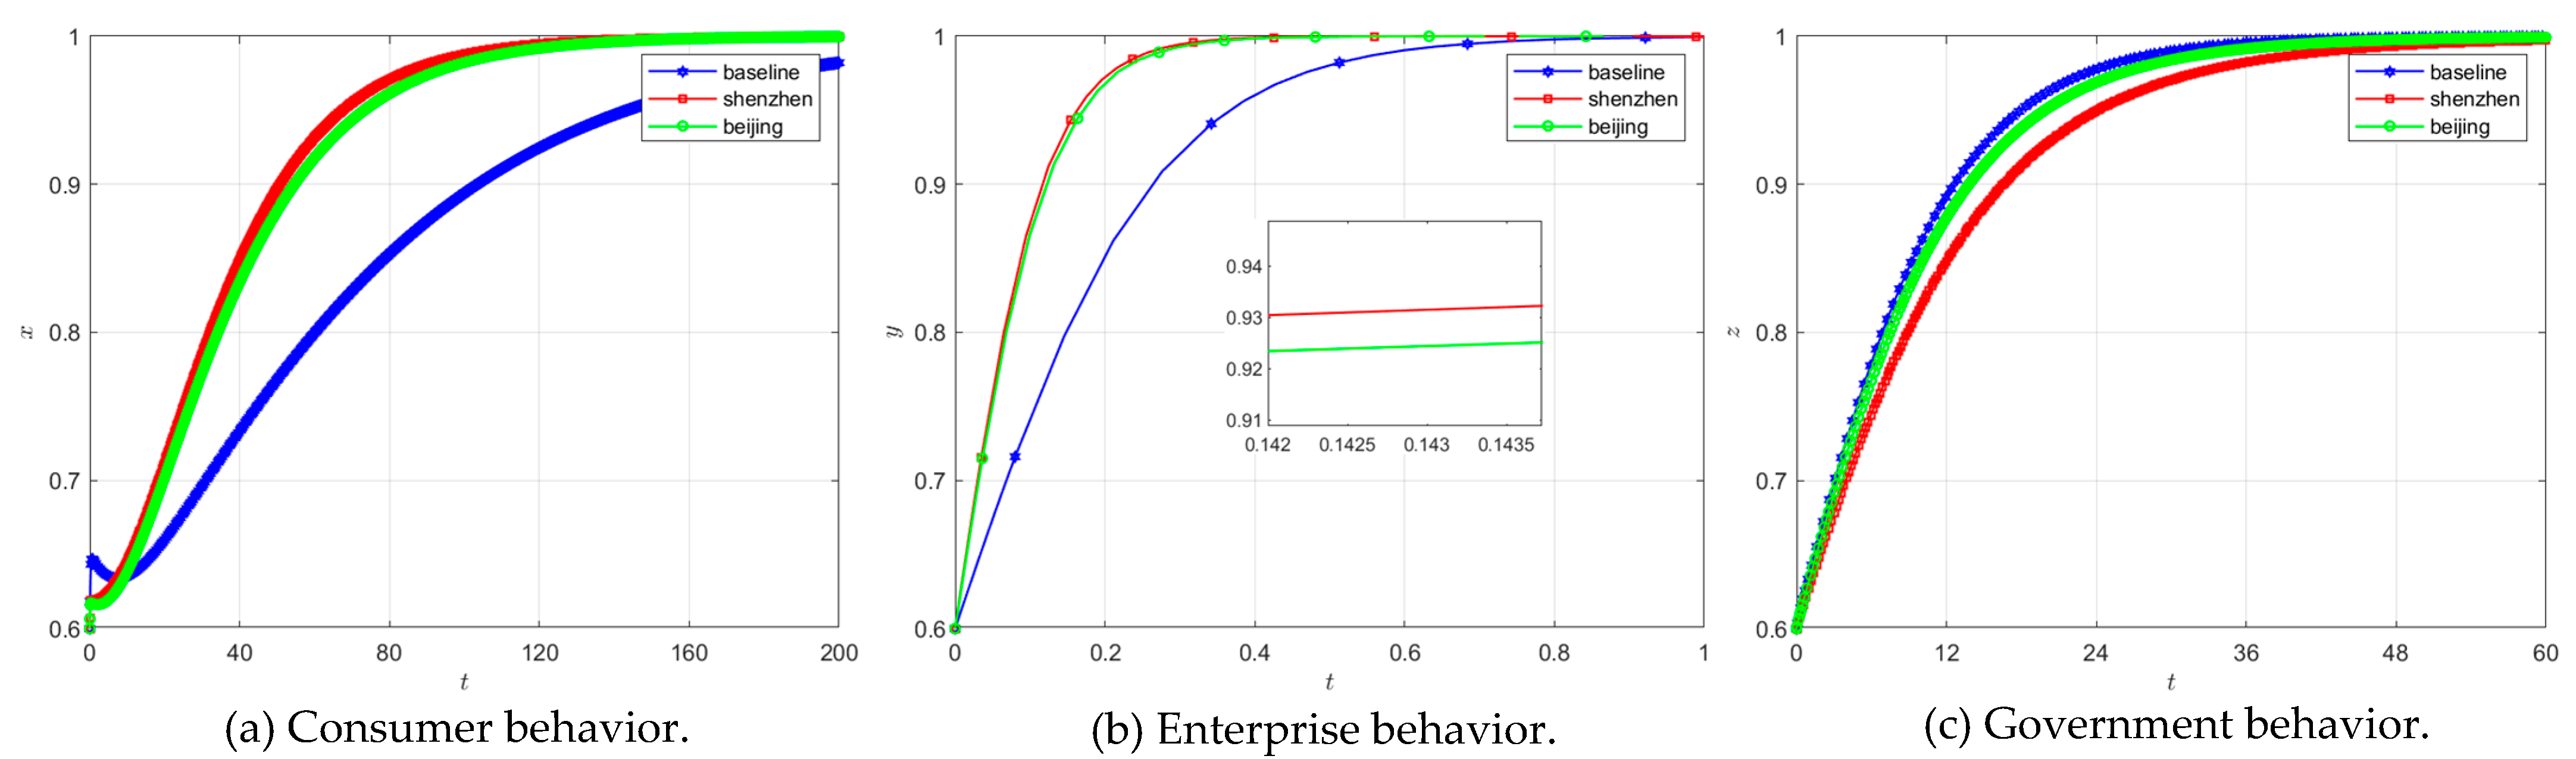
5.3. Model Simulation
5.4. Policy Recommendations Based on Evolutionary Analysis
6. Discussion, Implications, and Limitations
6.1. Discussion
6.2. Implications
6.2.1. Theoretical Implications
6.2.2. Practical Implications
6.3. Research Limitations and Future Directions
7. Conclusions and Recommendations
7.1. Policy Recommendations
7.1.1. Micro-Level: Enterprise Strategies
7.1.2. Macro-Level: National Policies
Author Contributions
Funding
Data Availability Statement
Conflicts of Interest
References
- Vitriana, V.; Ferry, H.; Rina, K. Lesson Learned from Implementation of Green Building Concepts towards Sustainable Development: A Case Study of a State-Owned Enterprises (BUMN) Head Office in Cilacap. E3S Web Conf. 2025, 605, 03029. [Google Scholar] [CrossRef]
- Olabi, G.; Shehata, N.; Issa, H.; Mohamed, O.; Mahmoud, M.; Abdelkareem, M.; Abdelzaher, M. The Role of Green Buildings in Achieving the Sustainable Development Goals. Int. J. Thermofluids 2025, 25, 101002. [Google Scholar] [CrossRef]
- World Green Building Trends Report. Available online: www.worldgbc.org (accessed on 1 February 2025).
- Huang, N. Introduction to Green Building Policy Measures in Australia and a Comparative Analysis with China. Build. Energy Effic. 2021, 49, 52–58. [Google Scholar] [CrossRef]
- Rastinifard, N.; Ramezani, M. Mitigating Urban Heat Islands: The Role of Green Building Strategies. Int. J. Environ. Clim. Change 2024, 14, 647–662. [Google Scholar] [CrossRef]
- Salihu, R.; Melissa, C.; Nasid, A.; Hadi, N. Benefits and Challenges of Implementing Green Building Development in Nigeria. Built Environ. Proj. Asset Manag. 2024, 14, 399–413. [Google Scholar] [CrossRef]
- Zhao, C.; Liu, M.; Wang, K. Monetary Valuation of the Environmental Benefits of Green Building: A Case Study of China. J. Clean. Prod. 2022, 365, 132704. [Google Scholar] [CrossRef]
- Opinions on Fully, Accurately, and Comprehensively Implementing the New Development Philosophy to Achieve Carbon Peak and Carbon Neutrality. Available online: https://www.gov.cn/zhengce/2021-10/24/content_5644613.htm (accessed on 1 February 2025).
- The 14th Five-Year Plan for Building Energy Efficiency and Green Building Development. Available online: https://www.gov.cn/zhengce/zhengceku/2022-03/12/content_5678698.htm (accessed on 1 February 2025).
- China Green Building Development Report (2021). Available online: https://www.cabee.org/site/content/24583.html (accessed on 1 February 2025).
- Wang, S.; Zhu, D. Strategies for Promoting Green Buildings: Integrating Evolutionary Game and SEIR Models. Sci. Rep. 2025, 15, 558. [Google Scholar] [CrossRef] [PubMed]
- Kwame, E.; Julian, J.; Kwaku, D.; Henry, M. Analytical Taxonomy of Challenges to the Implementation of Green Building Projects in South Africa. Int. J. Constr. Manag. 2023, 23, 286–296. [Google Scholar] [CrossRef]
- Yang, Y.; Yang, S.; Yang, Y.; Yun, X.; Wang, Y. Study on Green Transformation Evolution of Construction Enterprises Based on Dissemination and Complex Network Game. Sustainability 2024, 16, 10130. [Google Scholar] [CrossRef]
- Zhang, Y.; Xie, D.; Zhen, T.; Zhou, Z.; Guo, B.; Dai, Z. Decoding Strategies in Green Building Supply Chain Implementation: A System Dynamics-Augmented Tripartite Evolutionary Game Analysis Considering Consumer Green Preferences. Buildings 2025, 15, 840. [Google Scholar] [CrossRef]
- Zhang, D.; He, Y. The Roles and Synergies of Actors in the Green Building Transition: Lessons from Singapore. Sustainability 2022, 14, 13264. [Google Scholar] [CrossRef]
- D’Agostino, D.; Falco, D.F.; Minelli, F.; Minechiello, F. New Robust Multi-Criteria Decision-Making Framework for Thermal Insulation of Buildings under Conflicting Stakeholder Interests. Appl. Energy 2024, 376, 124262. [Google Scholar] [CrossRef]
- Ren, W.; Kim, K. A Study on the Green Building Trend in China—From 2001 to 2022, Focusing on Research Topic Words. Sustainability 2023, 15, 13505. [Google Scholar] [CrossRef]
- Zhao, Y.; Gao, G.; Zhang, J.; Yu, M. Impact of Carbon Tax on Green Building Development: An Evolutionary Game Analysis. Energy Policy 2024, 195, 114401. [Google Scholar] [CrossRef]
- Zhang, Y.; Chen, L.; Yusuyin, A.; Hau, L. Impact of Green Credit Policy on Green Innovation in Construction Enterprises. Financ. Res. Lett. 2025, 75, 106863. [Google Scholar] [CrossRef]
- He, L.; Chen, L. The Incentive Effects of Different Government Subsidy Policies on Green Buildings. Renew. Sustain. Energy Rev. 2021, 135, 110123. [Google Scholar] [CrossRef]
- Chen, Z. Economic Benefit Analysis of Green Building Based on Fuzzy Logic and Bilateral Game Model. J. Intell. Fuzzy Syst. 2019, 37, 301–313. [Google Scholar] [CrossRef]
- Liang, X.; Fu, Y. Research on the Evolutionary Game of Green Building Supply Side under Government Dynamic Reward-Punishment Mechanisms. Chin. J. Manag. Sci. 2021, 29, 184–194. [Google Scholar] [CrossRef]
- Li, X.; Wang, C.; Kassem, M.; Liu, Y.; Ali, K. Study on Green Building Promotion Incentive Strategy Based on Evolutionary Game between Government and Construction Unit. Sustainability 2022, 14, 10155. [Google Scholar] [CrossRef]
- Samuel, E.; Isaac, O.; Alex, O. Demystifying Cost Misperception as a Challenge to Green Building Adoption in Nigeria. J. Eng. Des. Technol. 2022, 20, 1716–1737. [Google Scholar] [CrossRef]
- Taherkhani, R. Barriers to Green Building Implementation in Developing Countries: The Case of Iran. Environ. Dev. Sustain. 2023, 26, 28389–28421. [Google Scholar] [CrossRef]
- Oke, S.; Aliu, O.; Duduyegbe, M.; Oke, A. Assessing Awareness and Adoption of Green Policies and Programs for Sustainable Development: Perspectives from Construction Practitioners in Nigeria. Sustainability 2025, 17, 2202. [Google Scholar] [CrossRef]
- Masyhur, T.; Alias, H.; Haron, A.; Zulkafli, Z. A Systematic Review on Green Practices in the Malaysian Construction Industry: Status, Challenges, Key Motivations, Rating Systems and Technology Evolution. Energy Build. 2024, 320, 114550. [Google Scholar] [CrossRef]
- Wang, C.; Xie, X.; Shuai, C.; Ma, X.; Wang, Z.; Chen, Y.; Chen, X.; Strezov, V. Influencing Factors of Green Building Practitioners’ Competition Perceptions: Evidence from China. Int. J. Constr. Manag. 2025, 25, 385–397. [Google Scholar] [CrossRef]
- Quangdung, T.; Sajjad, N.; TuHieu, N.; NgocKhoa, H.; TuanHai, D.; VietPhuong, N.; ManhHung, N.; QuocKhanh, P.; Theson, K. Empirical Examination of Factors Influencing the Adoption of Green Building Technologies: The Perspective of Construction Developers in Developing Economies. Sustainability 2020, 12, 8067. [Google Scholar] [CrossRef]
- Hu, M.; Zhang, H. Research on the Influence Mechanism of Cognitive Level and Perceived Value on Green Food Consumption Intention. For. Econ. 2023, 45, 36–53. [Google Scholar] [CrossRef]
- Ofek, S.; Portnov, A. Differential Effect of Knowledge on Stakeholders’ Willingness to Pay Green Building Price Premium: Implications for Cleaner Production. J. Clean. Prod. 2020, 251, 119575. [Google Scholar] [CrossRef]
- Souza, D.; Silva, D.; Ivete, D. Factors Affecting Green Building Consumer Behaviour: Evidence from Brazil. Int. J. Sustain. Dev. World Ecol. 2023, 30, 164–178. [Google Scholar] [CrossRef]
- Felix, L.; Daniel, D.; Edward, B.; Kawame, S.; Alexander, B.M. Stimulation Strategies to Promote Green Building Uptake in Developing Countries: The Case of Ghana. J. Eng. Des. Technol. 2024, 22, 1012–1029. [Google Scholar] [CrossRef]
- Zhang, F.; Liu, B.; An, G. Do Government Subsidies Induce Green Transition of Construction Industry? Evidence from Listed Firms in China. Buildings 2024, 14, 1261. [Google Scholar] [CrossRef]
- Okwandu, A.; Esho, A.; Iluyomade, T.; Olatunde, T. The Role of Policy and Regulation in Promoting Green Buildings. World J. Adv. Res. Rev. 2024, 22, 139–150. [Google Scholar] [CrossRef]
- Ning, X.; Ye, X.; Li, H.; Darmicka, R.; Martin, S. Evolutionary Game Analysis of Optimal Strategies for Construction Stakeholders in Promoting the Adoption of Green Building Technology Innovation. J. Constr. Eng. Manag. 2024, 150, 04024037. [Google Scholar] [CrossRef]
- Xue, F.; Zhou, X.; Yan, G.; Xu, S. Evolutionary Game Analysis of Green Building Promotion Mechanism Based on SD. In Proceedings of the 2019 International Conference on Economic Management and Model Engineering (ICEMME), Malacca, Malaysia, 6–8 December 2019; pp. 356–359. [Google Scholar] [CrossRef]
- Gu, R.; Zeng, X.; Song, Y.; Li, P.; Tong, S. Evolutionary Game Analysis of Supply-Side Entities in Green Construction under Dual Carbon Goals. Constr. Econ. 2024, 45, 455–461. [Google Scholar] [CrossRef]
- Liu, Y.; Zuo, J.; Pan, M.; Ge, Q.; Chang, R.; Feng, X.; Fu, Y.; Dong, N. The Incentive Mechanism and Decision-Making Behavior in the Green Building Supply Market: A Tripartite Evolutionary Game Analysis. Build. Environ. 2022, 214, 108903. [Google Scholar] [CrossRef]
- Wei, Y. Evolutionary Game Analysis of Stakeholders in Green and Traditional Buildings Considering Government, Developers, and Consumers. Constr. Econ. 2023, 44, 613–618. [Google Scholar] [CrossRef]
- Li, W.; Huang, X.; He, Z.; Wang, Y.; Han, L.; Qiu, W. Input-Output Benefit Analysis of Green Building Incremental Cost Based on DEA-Entropy Weight Method. Buildings 2022, 12, 2239. [Google Scholar] [CrossRef]
- Cheng, L.; Yang, R.; Wang, X.; Yu, T. Research on Long-Term Evolutionary Stable Equilibrium Characteristics of Tripartite Multi-Strategy Game Systems. Control Theory Appl. 2021, 38, 1631–1661. [Google Scholar] [CrossRef]
- Lyapunov, A. The General Problem of the Stability of Motion. Int. J. Control 1992, 55, 531–534. [Google Scholar] [CrossRef]
- Tao, X. A Preliminary Study on Incremental Costs of Green Building and Its Impact on Construction Cost. Guangzhou Constr. 2022, 50, 65–68. [Google Scholar]
- Beijing Municipal Commission of Housing and Urban-Rural Development. Interim Measures for Municipal Reward Funds for Prefabricated Buildings, Green Buildings, and Green Ecological Demonstration Zone Projects in Beijing; Beijing Municipal Commission of Housing and Urban-Rural Development: Beijing, China, 2020.
- Shanghai Housing and Urban and Rural Construction Management Commission. Special Support Measures for Building Energy Efficiency and Green Building Demonstration Projects in Shanghai; Shanghai Housing and Urban and Rural Construction Management Commission: Shanghai, China, 2020.
- Fu, Z. The Impact of Subsidy Phase-Out Policies on Innovation Performance of New Energy Vehicle Enterprises. J. Yanbian Univ. Nat. Sci. 2024, 50, 107–114. [Google Scholar] [CrossRef]
- Shenzhen Municipal People’s Government. Regulations on Green Buildings in Shenzhen Special Economic Zone; Gazette of the People’s Government of Shenzhen Municipality: Shenzhen, China, 2022; Volume 25, pp. 1–11.
- Xu, X.; Ma, X.; Lu, S.; Chang, M.; Hu, Y.; Yang, B.; Zhang, Z. Investigation on Satisfaction with Health Performance of Green Public Housing: A Case Study of Three Typical Projects in Shenzhen. Build. Sci. 2022, 38, 266–274. [Google Scholar] [CrossRef]
- Li, H.; Liu, D.; Han, Z.; Sun, Y.; Wang, L.; Zhang, J. Simulation Analysis of the Three-Party Evolutionary Game of Green Building Market Players Under Carbon Trading Policy. Environ. Sci. Pollut. Res. 2023, 30, 117591–117608. [Google Scholar] [CrossRef]


| Parameter | Definition | Parameter | Definition |
|---|---|---|---|
| c | Cost of traditional buildings | u0 | Basic utility from purchasing buildings |
| p | Selling price of traditional buildings | u1 | Additional utility from purchasing green buildings |
| ρ | Price–cost increment ratio | u2 | Additional profit from producing green buildings |
| s | Floor area | u3 | Environmental benefits |
| γ1 | Subsidy for purchasing green buildings | u4 | Government reputational benefits |
| γ2 | Subsidy for producing green buildings | A | Government baseline revenue |
| Equilibrium Point | Eigenvalue | Stability Condition |
|---|---|---|
| E1 (0,0,0) | λ1 = ps − u0 λ2 = u2 − ps − cρs λ3 = u4 > 0 | saddle point or unstable equilibrium |
| E2 (0,1,0) | λ1 = u0 + u1 − (1 + ρ)ps λ2 = ps − u2 + cρs λ3 = u4 − γ2s | ρ > − 1
u2 > ps + cρs u4 < γ2s |
| E3 (0,0,1) | λ1 = ps − u0 λ2 = u2 + γ2s − ps − cρs λ3 = −u4 < 0 | p < u2 < cρs + ps − γ2s |
| E4 (0,1,1) | λ1 = u0 + u1 + γ1s − (1 + ρ)ps λ2 = ps − γ2s − u2 + cρs λ3 = γ2s − u4 | ρ > − 1 u2 > ps − γ2s + cρs u4 > γ2s |
| E5 (1,0,0) | λ1 = u0 − ps λ2 = u2 − cρs + (1 + ρ)ps λ3 = u4 > 0 | saddle point or unstable equilibrium |
| E6 (1,1,0) | λ1 = (1 + ρ)ps − u1 − u0 λ2 = −u2 − (1 + ρ)ps + cρs < 0 λ3 = u4 − s(γ1 + γ2) | ρ < − 1 u4 < s(γ1 + γ2) |
| E7 (1,0,1) | λ1 = u0 − ps λ2 = u2 + γ2s − cρs + (1 + ρ)ps > 0 λ3 = −u4 < 0 | saddle point |
| E8 (1,1,1) | λ1 = ps − u1 − γ1s − u0 + pρs λ2 = cρs − γ2s − u2 − (1 + ρ)ps < 0 λ3 = s(γ1 + γ2) − u4 | ρ < − 1 u4 > s(γ1 + γ2) |
| Project Type | Incremental Costs of Green Buildings (RNB/m2) | ||
|---|---|---|---|
| National Standard One-Star | National Standard Two-Star | National Standard Three-Star | |
| Residential | 20~60 | 70~110 | 120~160 |
| Office | 40~80 | 95~135 | 195~235 |
| u0 | u1 | u2 | u4 | p | s | γ1 | γ2 | c | ρ |
|---|---|---|---|---|---|---|---|---|---|
| 8 | 3 | 4 | 0.3/0.1 | 10.864 | 1 | 0.1 | 0.095 | 4.15 | 0.02 |
| Scenario | Subsidy Amount γ1/γ2 | Price–Cost Increment ρ (High/Low Technology-Driven Cost Reduction Rate) |
|---|---|---|
| Baseline | 0.1/0.095 | 0.02/0.02 |
| Early stage | 0.08/0.075 | 0.018/0.019 |
| Mid-stage | 0.06/0.055 | 0.016/0.018 |
| Late stage | 0.04/0.035 | 0.014/0.017 |
| Deviation Point | Implication | Recommended Measures |
|---|---|---|
| M1 (+, +, +) | High price–cost increment, high government reputation benefit, excessive subsidies. | Reduce subsidies to enterprises and consumers; increase subsidies for technological innovation. |
| M2 (+, +, −) | High price–cost increment, high government reputation benefit, insufficient subsidies. | Raise subsidies for consumers and enhance support for technological innovation. |
| M3 (+, −, +) | High price–cost increment, low government reputation benefit, excessive subsidies. | Reduce subsidies to enterprises to compel accelerated technological innovation. |
| M4 (+, −, −) | High price–cost increment, low government reputation benefit, insufficient subsidies. | The system may lose stability; requires intervention from higher-level government support. |
| M5 (−, +, +) | Low price–cost increment, high government reputation benefit, excessive subsidies. | Reduce consumer subsidies; further boost subsidies for technological innovation. |
| M6 (−, +, −) | Low price–cost increment, high government reputation benefit, insufficient subsidies. | Increase subsidies for consumers. |
| M7 (−, −, +) | Low price–cost increment, low government reputation benefit, excessive subsidies. | Reduce subsidies to both consumers and enterprises. |
| M8 (−, −, −) | Low price–cost increment, low government reputation benefit, insufficient subsidies. | Cut subsidies to enterprises and technological innovation; redirect subsidies to consumers. |
| Primary Indicators | Air | Water | Comfort | |||
| Secondary Indicators | Air Quality | Underground Parking Air Quality | Drinking Water Quality | Domestic Hot Water Quality | Noise Environment | Light Environment |
| Project A | 2.23 | 1.72 | 1.98 | 1.61 | 1.63 | 2.25 |
| Project B | 2.30 | 1.77 | 2.10 | 1.89 | 1.61 | 2.351 |
| Project C | 2.03 | 1.95 | 1.97 | 2.01 | 1.31 | 2.23 |
| Weighted Avg. | 2.13 | 1.86 | 2.00 | 1.92 | 1.43 | 2.30 |
| Primary Indicators | Comfort | Fitness | Humanity | Service | ||
| Secondary Indicators | Thermal–Humidity Environment | Ergonomic Design of Facilities | Sports Facilities | Public Space and Humanization Facilities | Property Management Services | |
| Project A | 2.19 | 1.97 | 1.85 | 2.08 | 1.86 | |
| Project B | 2.34 | 1.99 | 2.01 | 2.08 | 2.13 | |
| Project C | 2.03 | 1.78 | 1.88 | 1.97 | 1.64 | |
| Weighted Avg. | 2.13 | 1.87 | 1.91 | 2.01 | 1.79 | |
| u0 | u1 | u2 | u4 | p | s | γ1 | γ2 | c | ρ |
|---|---|---|---|---|---|---|---|---|---|
| 47.5 | 3.2 | 4 | 0.3 | 50 | 1 | 0.12 | 0.115 | 5.8 | 0.0155 |
| u0 | u1 | u2 | u4 | p | s | γ1 | γ2 | c | ρ |
|---|---|---|---|---|---|---|---|---|---|
| 44.6 | 3 | 4 | 0.3 | 46.8 | 1 | 0.12 | 0.095 | 4.8 | 0.0188 |
Disclaimer/Publisher’s Note: The statements, opinions and data contained in all publications are solely those of the individual author(s) and contributor(s) and not of MDPI and/or the editor(s). MDPI and/or the editor(s) disclaim responsibility for any injury to people or property resulting from any ideas, methods, instructions or products referred to in the content. |
© 2025 by the authors. Licensee MDPI, Basel, Switzerland. This article is an open access article distributed under the terms and conditions of the Creative Commons Attribution (CC BY) license (https://creativecommons.org/licenses/by/4.0/).
Share and Cite
Zhao, Y.; Ma, Y.; Zhong, F. Sustaining Green Building Incentives: A Tripartite Evolutionary Game Analysis and the Synergistic “Technology–Reputation–Policy” Pathway. Buildings 2025, 15, 1537. https://doi.org/10.3390/buildings15091537
Zhao Y, Ma Y, Zhong F. Sustaining Green Building Incentives: A Tripartite Evolutionary Game Analysis and the Synergistic “Technology–Reputation–Policy” Pathway. Buildings. 2025; 15(9):1537. https://doi.org/10.3390/buildings15091537
Chicago/Turabian StyleZhao, Yuxiao, Yonghuan Ma, and Fanglei Zhong. 2025. "Sustaining Green Building Incentives: A Tripartite Evolutionary Game Analysis and the Synergistic “Technology–Reputation–Policy” Pathway" Buildings 15, no. 9: 1537. https://doi.org/10.3390/buildings15091537
APA StyleZhao, Y., Ma, Y., & Zhong, F. (2025). Sustaining Green Building Incentives: A Tripartite Evolutionary Game Analysis and the Synergistic “Technology–Reputation–Policy” Pathway. Buildings, 15(9), 1537. https://doi.org/10.3390/buildings15091537