Article

Stability Analysis of the Surrounding Rock of Deep Underground Engineering Under the Action of Thermal-Solid Coupling

1
School of Civil Engineering, Henan Polytechnic University, Jiaozuo 454003, China
2
China Railway Fifth Survey and Design Institute Group Co., Ltd., Beijing 102600, China
3
Henan First Geological and Mineral Investigation Institute Co., Ltd., Luoyang 471023, China
4
Henan Provincial Key Laboratory of Gold-Silver Polymetallic Metallogenic Series and Deep Prediction, Luoyang 471023, China
5
China Key Laboratory of Precious Metal Analysis and Exploration Technology, Ministry of Natural Resources, Luoyang 471023, China
6
China School of Civil Engineering and Architecture, Wuhan University of Technology, Wuhan 430070, China
*
Author to whom correspondence should be addressed.
Buildings 2025, 15(9), 1500; https://doi.org/10.3390/buildings15091500
Submission received: 26 March 2025 / Revised: 19 April 2025 / Accepted: 23 April 2025 / Published: 29 April 2025

Abstract

When developing deep subsurface infrastructure in areas with intense geothermal activity, the significant temperature gradient inevitably leads to low-temperature contraction and high-temperature expansion of the rock body, resulting in changes in the rock’s mechanical properties. These thermodynamic effects can easily lead to the destabilization and subsequent collapse of the rock. There exists a pressing necessity to methodically evaluate the surrounding rock stability encountered in deep underground engineering under the action of thermal-solid coupling. This study constructed a multi-physical field coupling nonlinear calculation model based on a high-precision three-dimensional finite difference method, systematically analyzed the interdependent effects between the original rock temperature and excavation-induced disturbance, and then analyzed the dynamic changes in temperature, stress, and displacement fields along with plastic zone of surrounding rock of the deep underground engineering under thermal-solid coupling. The results indicate that the closer to the excavation contour surface, the lower the surrounding rock temperature, while the temperature gradient increased correspondingly. The farther away from the excavation contour face, the closer the temperature was to the original rock temperature. As the original rock temperature climbed from 30 °C to 90 °C, the increment of vault displacement was 2.45 times that of arch bottom displacement, and the influence of temperature change on vault deformation was more significant. The horizontal displacement magnitudes at the different original temperatures followed the following order: sidewall > spandrel > skewback, and at an original rock temperature of 90 °C, the sidewall horizontal displacement reached 15.31 cm. With the elevation of the original rock temperature, the distribution range and concentration degree of the maximum and minimum principal stresses increased obviously, and both were compression-dominated. The types of plastic zones in the surrounding rock were mainly characterized by shear stress-induced yielding and tensile stress-induced damage failure. When the original rock temperature increased to 90 °C, the rock mass extending up to 1.5 m from the excavation contour surface formed a large area of damage zone. The closer the working face was to the monitoring section, the faster the temperature dropped, and the displacement changed in the monitoring section. The findings offer a theoretical basis for engineering practice, and it is of great significance to ensure the safety of the project.

1. Introduction

With the continuous growth of global resource demand and the acceleration of urbanization, underground engineering, as an important technical means to support energy development, transportation network construction, and urban space expansion, has gradually formed a multidisciplinary technical system [1]. However, the disturbance effect of rock and solid mass caused by engineering excavation will not only induce surface subsidence [2], ground fissures [3], and significant interference with adjacent underground scientific research facilities [1], but its construction process is also easily restricted by complex geological conditions [4] and human engineering activities. Therefore, it is necessary to carry out long-term monitoring of underground engineering [5] and obtain multiple response information. In addition, the advancements in underground engineering technology have enabled tunnels to be constructed at increasingly greater depths [6,7]. The construction process is facing a more severe and more complex geological environment [8], which poses a huge challenge to designing and constructing deep underground engineering (taking China as an example, as shown in Figure 1a (Henan First Geological and Mineral Investigation Institute Co., Ltd., Luoyang, China)).
Due to the presence of deep underground engineering in high ground stress fields and high rock temperature fields, the construction process is prone to compound catastrophic effects such as high-temperature and high-pressure water inrush, high-temperature heat damage and rockburst [9,10], and so on (Figure 1b), which critically compromise the safety and stability of deep underground engineering projects and cause structural failures in tunnels, human casualties [11], and substantial economic losses. Taking the Brenner Base Tunnel in Italy as an example, its maximum buried depth is about 1800 m, and the average geothermal gradient is 25 K/km [12]. These conditions led to increased thermal stress in the supporting structure and abnormal solidification of concrete, seriously affecting the normal construction of the tunnel. The Nige Tunnel on the Yunnan–Guangxi Railway has a maximum buried depth of approximately 640 m and an original rock temperature of up to 88.8 °C [13]. During construction, frequent rockbursts occurred in the surrounding rock. Additionally, high-temperature water surges (with temperatures reaching 63.4 °C) further complicated the process, making construction extremely difficult. Underground engineers must maintain real-time awareness of thermodynamic characteristics and deformation dynamics in the surrounding rock and respond to the possible stability problems of the surrounding rock in advance. Therefore, comprehensive studies must be conducted to examine the thermal mechanical behavior patterns and stability characteristics of the surrounding rock in deep underground engineering, particularly under coupled thermal-solid interactions that integrate both in situ geothermal conditions and excavation-induced stress redistributions, to provide theoretical support for high-temperature deep underground engineering practices.
At present, the stability of the surrounding rock in underground engineering has attracted attention at home and abroad [14,15,16,17,18,19,20]. Numerous studies have investigated surrounding rock stability under thermal-solid coupling conditions, yielding significant research outcomes [21,22,23,24,25]. In terms of theoretical analysis, Birch [26] investigated the correction of temperature for different terrains, obtained corrections for two geothermal temperature gradients, and proposed a mathematical expression for the temperature of the protolith at a specific depth below the surface of the mountain body. Shao et al. [27] derived the thermoelastic theoretical solutions for the temperature, displacement, and stress fields of circular tunnels under high rock temperature conditions by means of dimensionless and differential equation level solutions. Che et al. [28] developed an analytical solution for the temperature distribution in surrounding rock formations, performed dimensionless characterization of the system, and formulated a correlating equation linking the dimensionless thermal penetration depth to the Biot number. However, surrounding rock stability during the construction of deep underground works under thermal-solid coupling in a high rock temperature environment is a highly nonlinear mathematical problem with changing environmental conditions and the coupled influence of excavation perturbation triggering factors. It is very tough to theoretically characterize the response of the surrounding rock throughout the construction period under thermal-solid coupling. Model tests and in situ tests can reproduce the real environment and accurately portray the mechanical behavior of the surrounding rock under the action of thermal-solid coupling. Yin et al. [29] studied the influence of rock thermal stress on the plastic zone expansion of deep tunnels under high rock temperature conditions. This was studied by deriving the plastic zone boundary formula of a high ground temperature tunnel and combining it with the field hydraulic fracturing test results. Zhu et al. [30] completed field monitoring of the temperature and humidity in the tunnel and the surrounding rock in the process of the construction of the Fengshun Tunnel and analyzed the spatial characteristics of the temperature field in a high ground temperature tunnel. Li et al. [31] independently developed a large-scale physical model of the temperature field loading system and tunnel excavation device and studied the rock burst problem of the surrounding rock under the interaction between elevated geothermal conditions and high ground stress. However, the design and implementation of the model test is a large investment and time-consuming, and due to the limitations of the deployment of the monitoring system, model tests and in situ tests cannot obtain the full-field multivariate datasets of rock throughout the excavation process. With the maturity of numerical simulation methods, its advantages in cost-effectiveness, accuracy, and controllability have led more and more scholars to adopt it to study the stability of underground engineering surrounding rock under thermal-solid coupling. Sun et al. [32] developed a model test system using model tests, numerical simulations, and in situ monitoring and studied the temperature distribution of a tunnel under high ground temperature. Yu et al. [33] developed an optimized numerical simulation technique to analyze the frost crack propagation under the smoothed particle hydrodynamics (SPH) framework. Based on theoretical analysis, combined with field monitoring and discrete element model simulation, Li et al. [34] investigated the temperature distribution law and plastic zone dynamic change in a jointed rock mass under high temperature. Xu et al. [35] analyzed the Niger tunnel as a representative research subject in his case-based investigation, monitored the temperature distribution of surrounding rock covering all sections of thermal damage grade, numerically simulated the temperature field of tunnel, and investigated the spatiotemporal evolution mechanism of temperature fields in high-temperature geothermal highway tunnels. Li et al. [36] established an elastoplastic hydraulic fracture propagation model for deep reservoirs. Under high temperature and confining pressure differences, the enhancement of plasticity was considered by analyzing the elastoplastic deformation and nonlinear fracture of rocks. Yu et al. [37] used a fracture marker to reflect the different modes of SPH particles and simulated the thermal-hydro-mechanical damage process inside the rock structure. Jia et al. [38] established a rock thermal-mechanical damage coupling model and its parameter evolution equations, used ABAQUS as a platform to establish a numerical calculation model of a buried soft rock tunnel, and studied the mechanical behavior and damage process of the surrounding rock under the joint effect of temperature and excavation unloading. The above research results strongly promote research on the stability of underground engineering surrounding rock under thermal-solid coupling, and provide theoretical support for the safe construction of underground engineering under a high geothermal environment.
The current research focuses on the thermal-solid response of the surrounding rock in shallow underground engineering under a high-temperature environment. There are relatively few studies on the stability of deep engineering under different original rock temperatures. And the surrounding rock response under the double disturbance of temperature fluctuation and excavation in deep engineering during dynamic construction is not fully studied. In this paper, a three-dimensional finite difference numerical simulation method was used to construct a thermal-solid coupling nonlinear mechanical model considering the original rock temperature and excavation process conditions. In this paper, according to the evolution mechanisms of the temperature, displacement, stress fields, and plastic zone of surrounding rock during deep underground excavation under different original rock temperatures, the mechanical response law of the surrounding rock under the coupling condition of the original rock temperature and continuous excavation disturbance under thermal-solid coupling was revealed. This research provides important theoretical and practical insights for precisely evaluating the effect of high rock temperatures on surrounding rock stability, which is essential for ensuring construction safety in deep underground engineering projects during their operational phases.

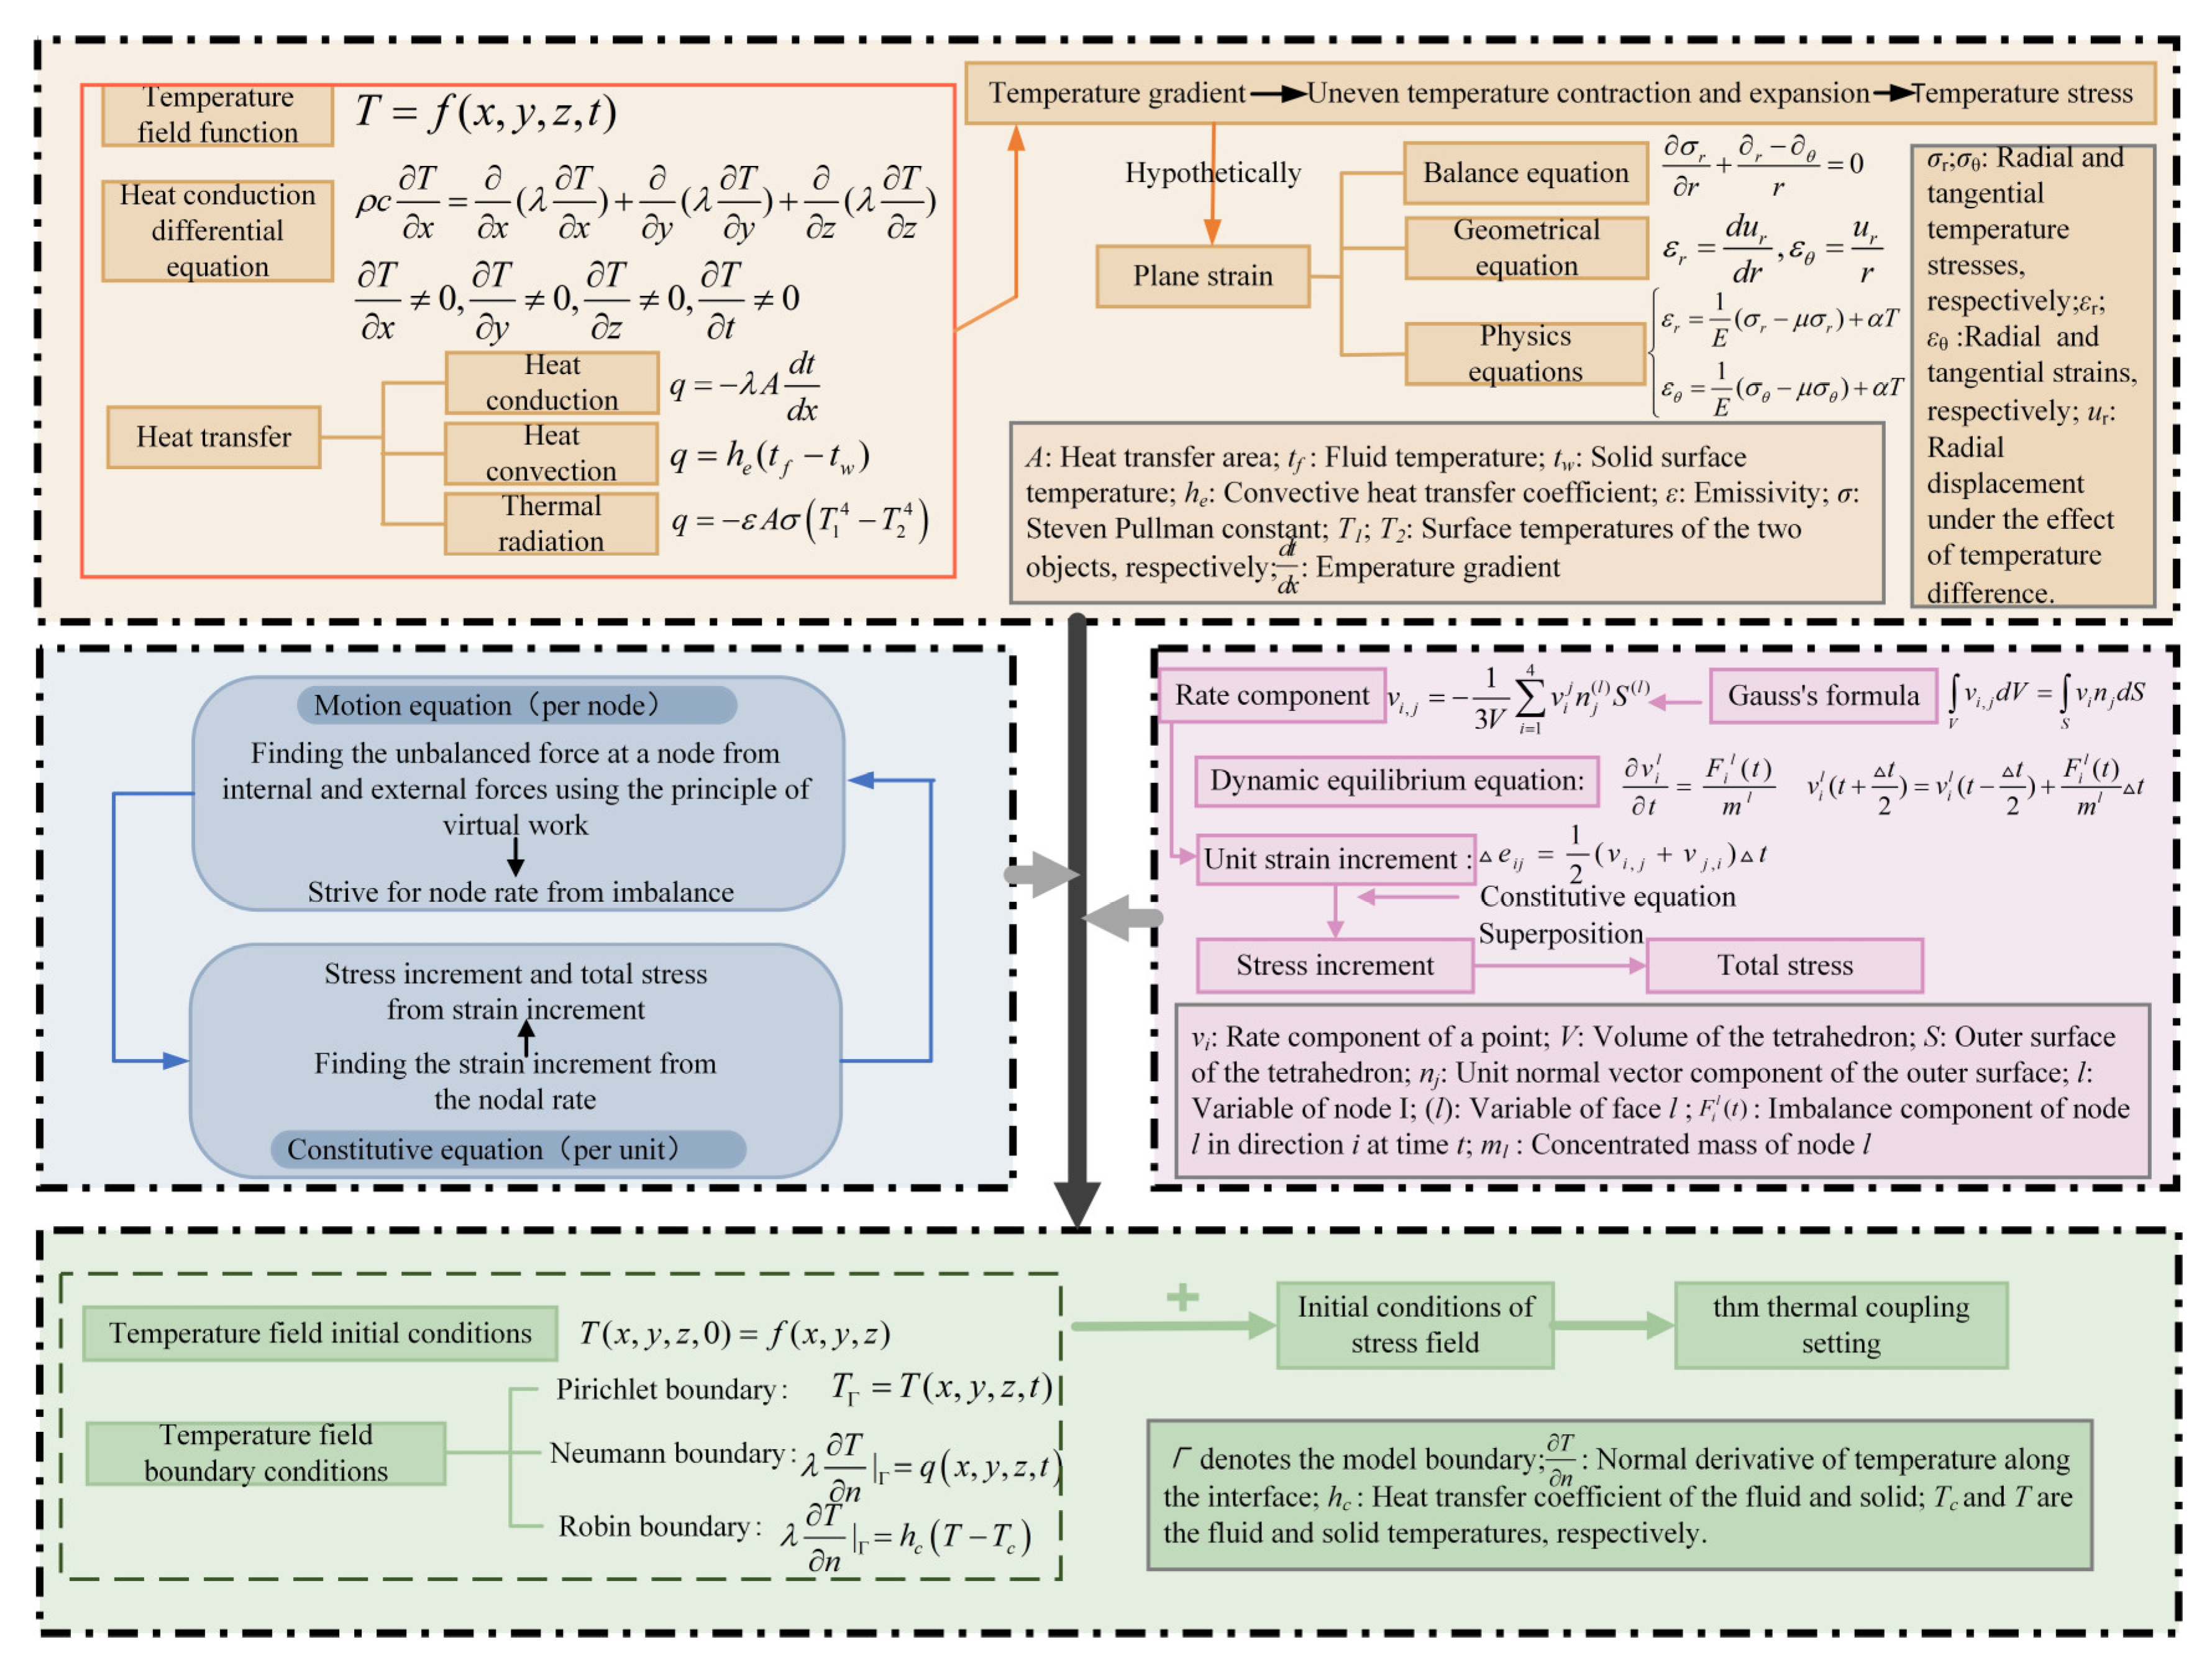
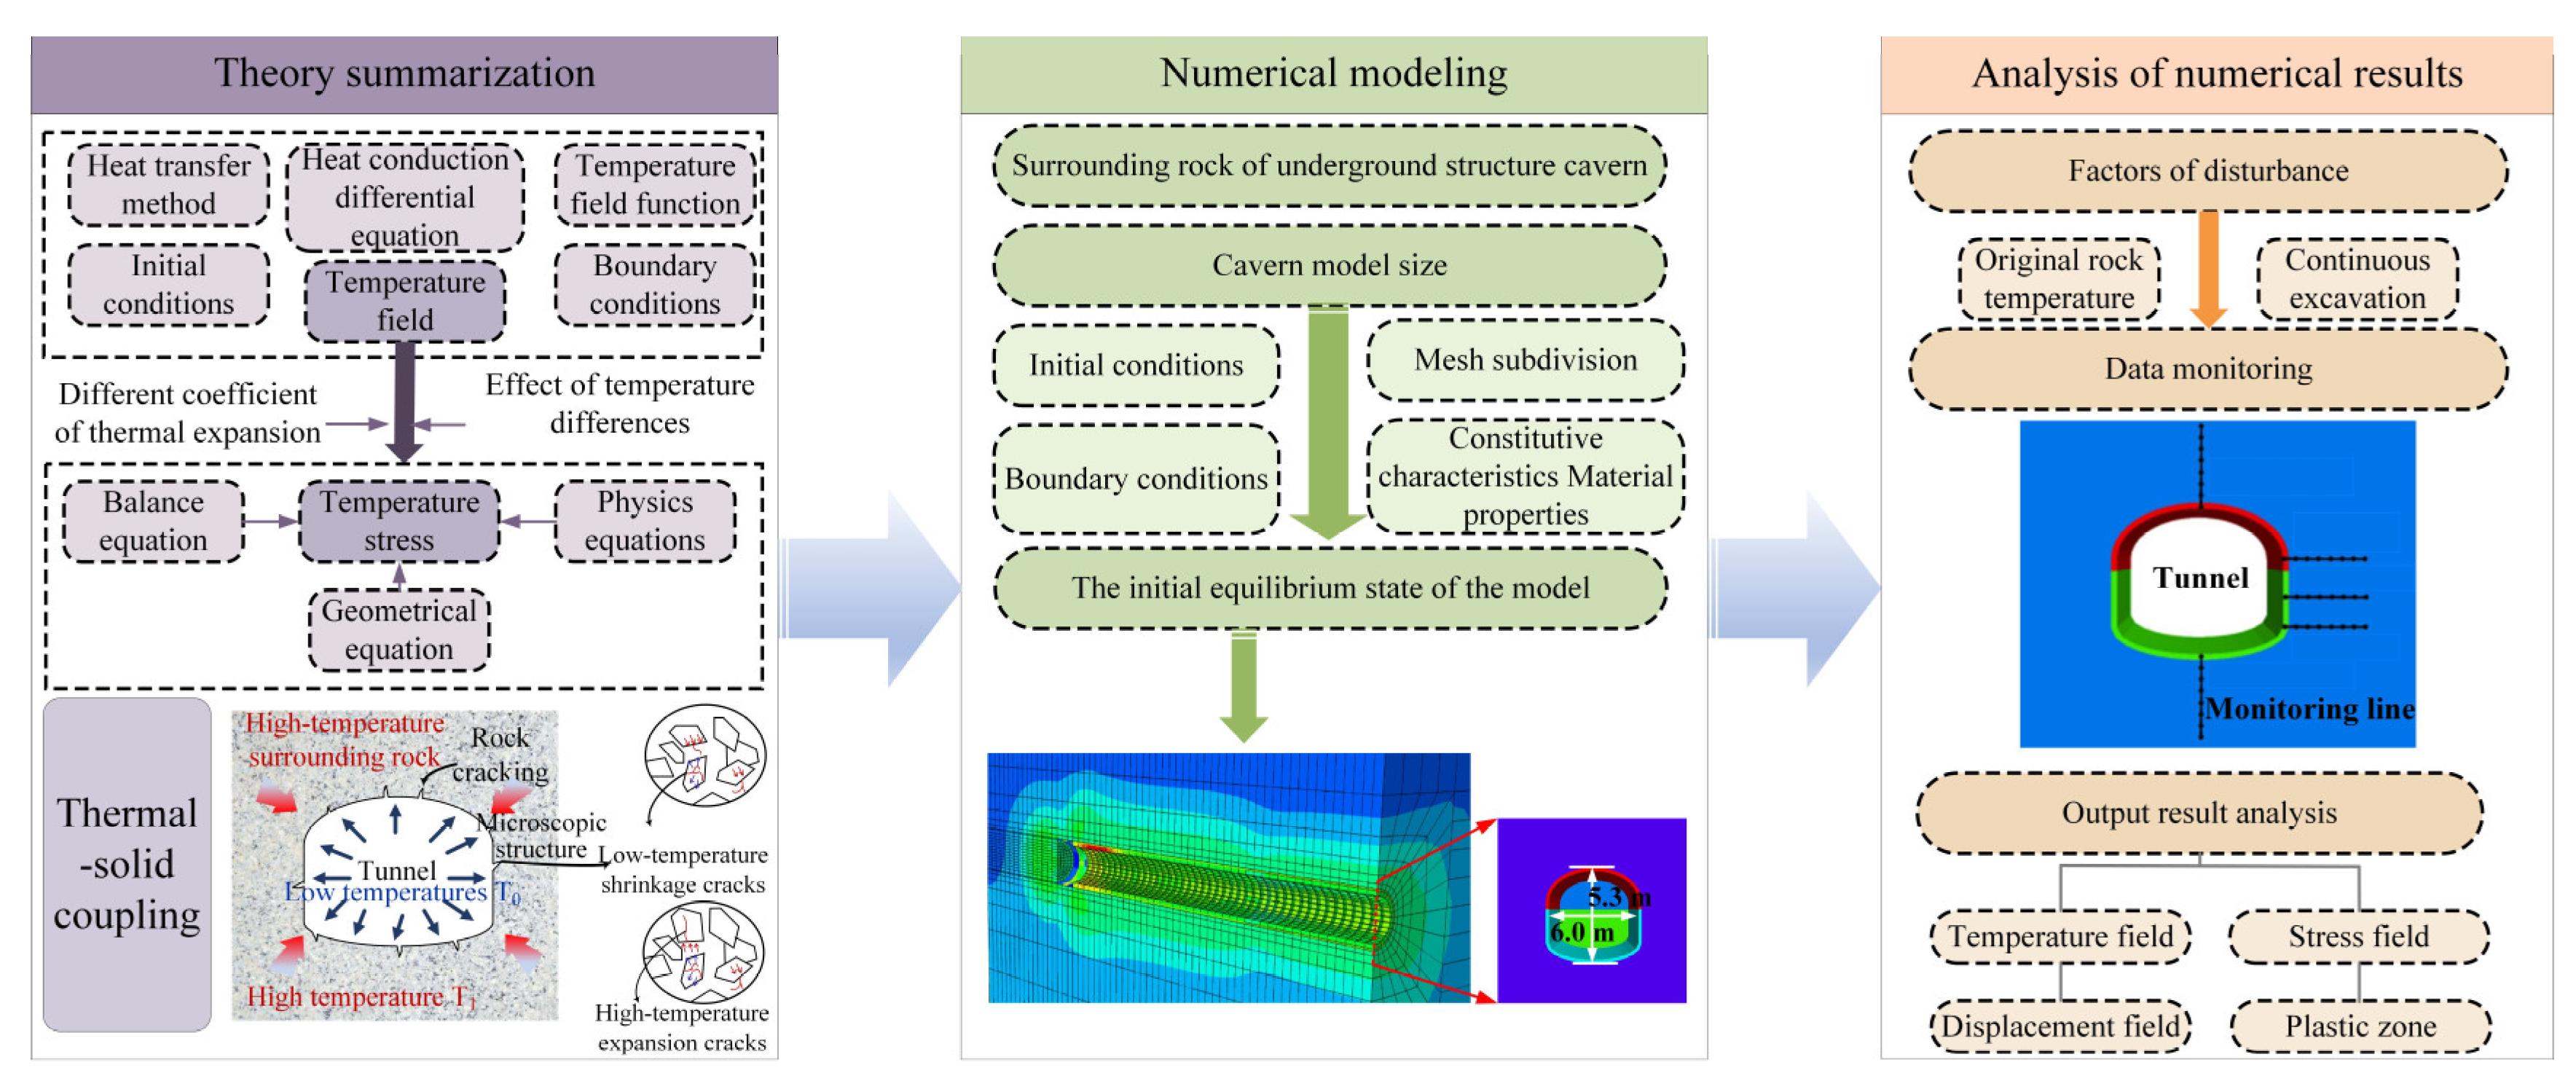
2. Thermal-Solid Coupling Analysis Based on Finite Difference Method

FLAC3D 5.0 is a computational simulation software employing the finite difference method, which is extensively utilized in the field of geotechnical engineering. The software has a strong nonlinear solution ability, contains a variety of constitutive models, has multiple calculation models such as static force and temperature [39], and can realize the coupling among various physical fields. The thermal-solid interaction of rock mass under high rock temperature and high ground stress can be effectively simulated by reasonably setting the material models, boundary conditions, and coupling process.
The simulation software adopts a hybrid discrete method. It uses the principle of virtual work to calculate nodal imbalance forces from stress and external forces. The nodal rate is then determined based on the imbalance; using the nodal rate, the strain increment is calculated, which is then used to find the stress increment and the total stress. In summary, the finite difference solution is a cyclic computation of the equations of motion and the principal constitutive equations. When the software is used for the study of thermal-solid coupling, it is clear that the heat transfer of deep underground engineering cavern excavation has three modes, namely heat conduction, heat convection, and heat radiation, which interact with each other to realize the process of temperature and heat transfer. When the model is built, the thermal boundary constraints encompass a Dirichlet boundary condition that defines the prescribed temperature distribution along the model boundary, the Neumann boundary condition that gives the density of heat fluxes on the model boundary, and the Robin boundary condition that describes the phenomenon of convective heat transfer between the object’s exterior and the surrounding fluids and gives the temperature of the fluids on the model boundary and the coefficients of convective heat transfer between the model and the fluids. Together with other boundary and original conditions, they define the original state of the model in preparation for performing excavation or changing other simulation conditions (Figure 2).
Building on the theoretical foundation above, this study proposed a numerical analysis process to accurately describe the response of the surrounding rock during deep underground engineering excavation under different original rock temperatures. The process addressed the stability of the surrounding rock under thermal-solid coupling effects using the FLAC3D 5.0 numerical simulation platform. As shown in Figure 3, this methodology systematically integrated thermal and mechanical interactions during deep underground construction. The process is as follows: (1) Analyze the thermal-solid coupling mechanism, the solution principle of the software, and the solution process of the thermal-solid coupling problem based on the finite-difference numerical simulation platform. (2) Establish the surrounding rock block model in the platform and mesh the 3D numerical model. Select the constitutive model of the material and input its parameters, and proceed to define the boundary conditions, original conditions, and stress field. (3) Simulate the tunnel excavation process under different original rock temperature conditions and analyze the dynamic response patterns of the surrounding rock during the construction process using data collected from monitoring points. This study visualized the multivariate information response of the surrounding rock under the combined effect of changing rock temperature and excavation activities.

3. Numerical Modeling of Deep Underground Engineering Determination

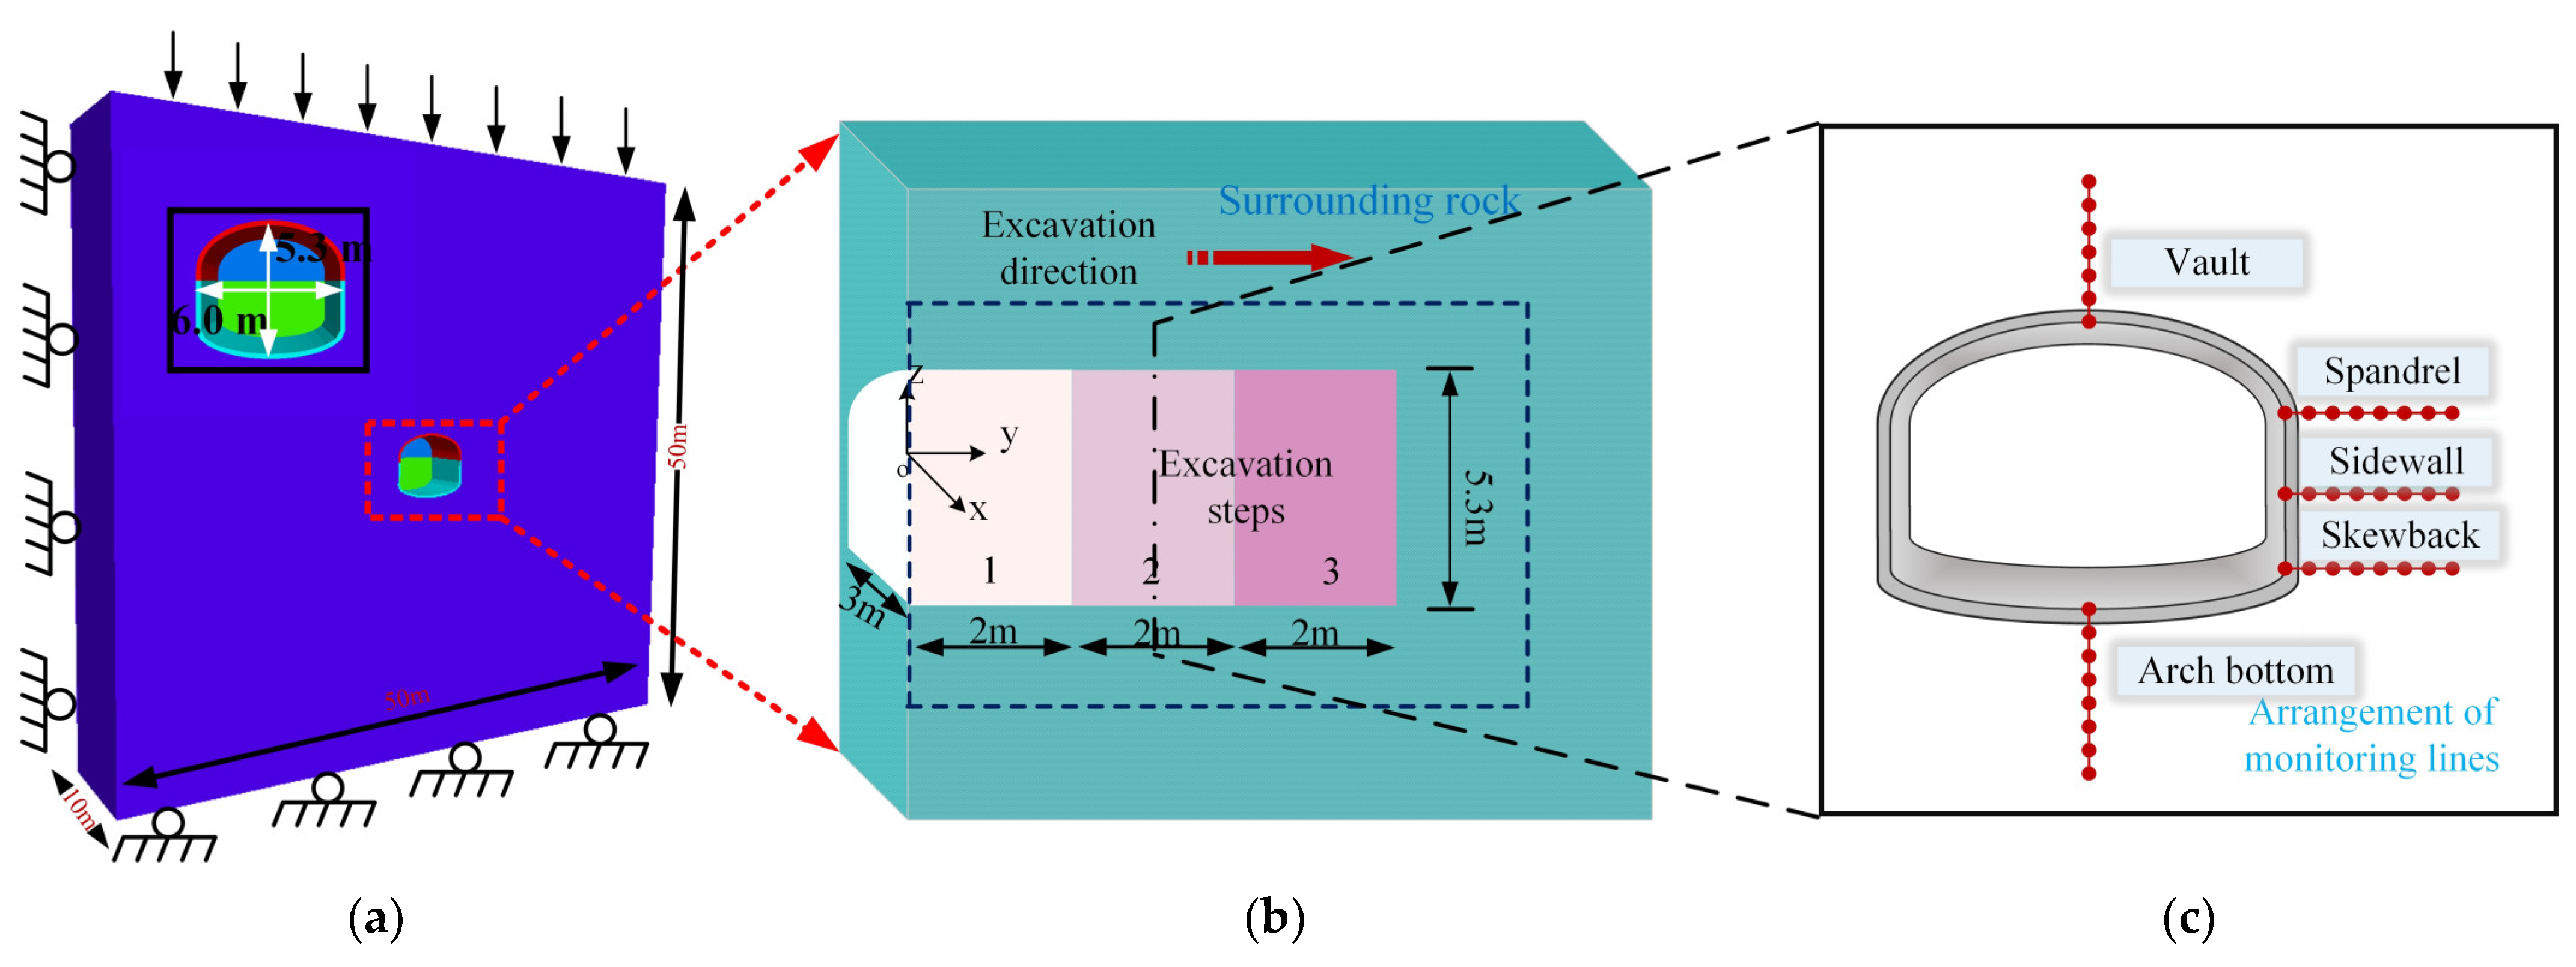
3.1. Numerical Modeling Establishment and Parameter Determination

Constructing numerical computational models of deep underground engineering in three-dimensional finite-difference computational simulation software. The origin of the model is the cavern center. The excavation direction defined the positive orientation of the Y-axis, and the X-axis was defined perpendicular to the Y-axis within the horizontal plane. And the positive orientation of the Z-axis was defined as the vertically upward direction. The model has a clear distance of 5.3 m between the vault and the arch bottom, and a clear distance of 6 m between the left and right sides. Based on St. Venant’s principle and the scope of influence of tunnel excavation [40], this model was configured with a width of 50 m, height of 50 m, burial depth of 1200 m, and longitudinal depth of 10 m, as demonstrated in Figure 4a.
In the numerical model, the numerical analysis employed the Mohr–Coulomb failure criterion to characterize the mechanical behavior of the surrounding rock. The shotcrete layer was simulated using a solid unit and treated as an isotropic linear elastic material, and the gauge of the sprayed layer was 200 mm. The rock bolts were modeled by a cable structure unit with a diameter of 22 mm and were anchored in full length. Table 1 and Table 2 present the physical and mechanical parameters characterizing the surrounding rock, initial shotcrete support layer, and anchoring system components.

3.2. Boundary Conditions and Numerical Calculation Scheme

The surrounding boundary of the model was the same as that of the original rock, and the ventilation temperature of the surrounding rock wall was 20 °C; this was the temperature boundary condition of the model, which was prepared for simulating the heat transfer between the rock, the surrounding rock, and the air in the cavern. According to the burial depth, the weight of the overlying rock mass of the tunnel was converted into a vertical load applied to the model’s upper boundary. It was calculated to exert a pressure of 30 MPa at the model’s top. Normal constraint boundaries were imposed on the left and right sides and the front and back sides, and the bottom surface was fixed.
The ambient temperature in the tunnel should not be higher than 28 °C [41], and according to the literature research, the temperature of the surrounding rock of some domestic high geothermal tunnels has reached a maximum of 89.5 °C [42]. To study the changes in the temperature, displacement, stress field, and plastic zone of the surrounding rock during the construction of deep underground engineering under different original rock temperature conditions, this paper sets the modeled original rock temperatures to 30 °C, 50 °C, 70 °C, and 90 °C, respectively. This study simplified the construction excavation of the cavern by adopting a full-section excavation method, with each excavation advance limited to 2 m. After each excavation, conduct a thermal-solid coupling analysis for a specified period, followed by rock bolting and shotcreting. The above steps were circulated sequentially to complete three times of digging and excavation of deep underground engineering, and the simplified excavation scenarios and simulation schemes are shown in Figure 4b and Table 3.
To investigate the dynamic response regularity of the surrounding rock during the construction, different monitoring lines were set at different sections of the model. Due to the symmetrical structure of the model, only the right half of the model was arranged with monitoring lines, as demonstrated in Figure 4c.

4. Results and Analysis of Thermal-Solid Coupling Simulation

In this section, numerical simulations of the proposed experimental scheme were carried out to compare the evolution in the temperature field, displacement, stress, and plastic zone of the surrounding rock during continuous excavation of the cavern under the temperatures of 30 °C, 50 °C, 70 °C, and 90 °C and to investigate the influence of the synergistic effects of different original rock temperature and excavation-induced disturbance on the stability of surrounding rock of the tunnel.

4.1. Multi-Field Evolution Patterns of Surrounding Rock Under Different Original Rock Temperatures

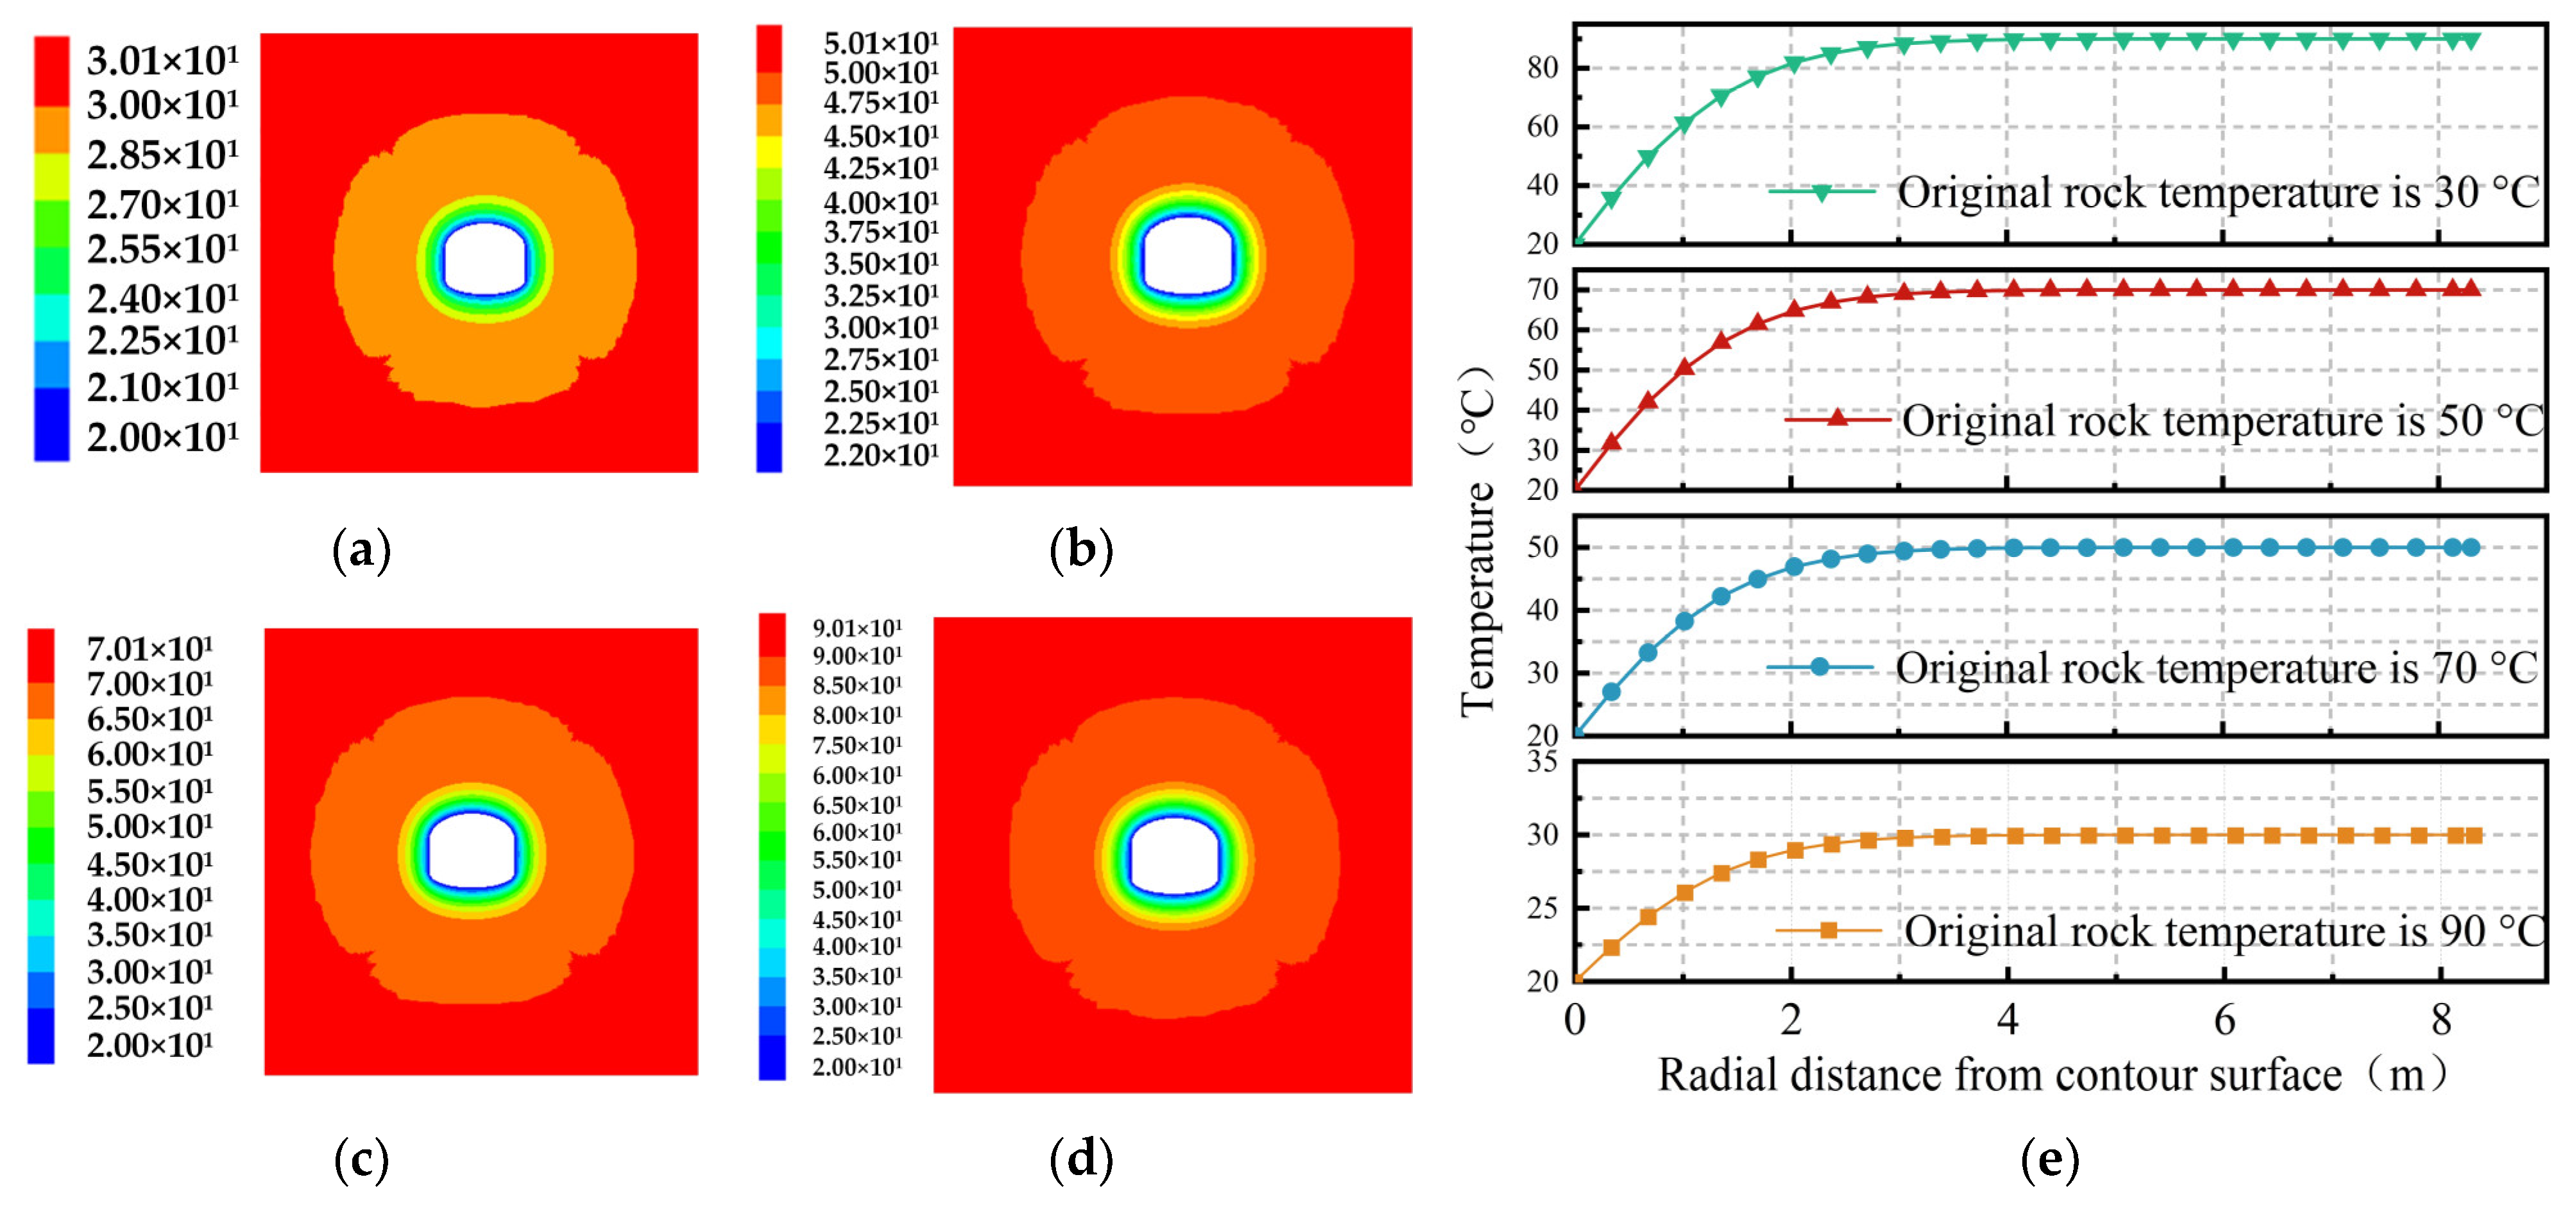
4.1.1. Evolution Patterns of Surrounding Rock Temperature Field

After excavating three times, thermal distribution patterns in the surrounding rock at a 3 m section of underground engineering under different original rock temperature conditions are demonstrated in Figure 5a–d.
As demonstrated in Figure 5, the change trend of the temperature field of the underground engineering section was basically the same under different original rock temperature conditions. The temperature near the contour surface and the working face of the underground engineering was the lowest. This was mainly because when the air flowed in the cave, the air near the rock wall had a lower flow velocity than that on the contour surface of the cave. Under this action, the rock adjacent to the wall of the cavern and the air formed a laminar bottom layer, where the mode of heat transfer between the rock wall and the air is mainly heat conduction. Under the effect of heat conduction, the temperature change was more obvious, and the change was consistent with the shape of the contour surface of the cavern. The temperature variation curves at different distances along the radial direction of the engineering contour surface are shown in Figure 5e. Figure 5e demonstrates that under different original rock temperatures, the change trend of surrounding rock temperature was consistent, that is, the temperature of the engineering contour surface and the distance of 0~2 m away from it was lower, but the temperature gradient in this area was larger and gradually increased with the increase in the original rock temperature. As the distance from the contour surface of the cavern increases to 4 m, the surrounding rock temperature increased significantly and gradually approached the original rock temperature, but the temperature gradient decreased accordingly. It shows that the nearer an area is to the excavation, the more significant the impact on the temperature field; after being far away from the excavation contour surface of the project, the influence exerted by ventilation on the temperature diminished progressively over time.

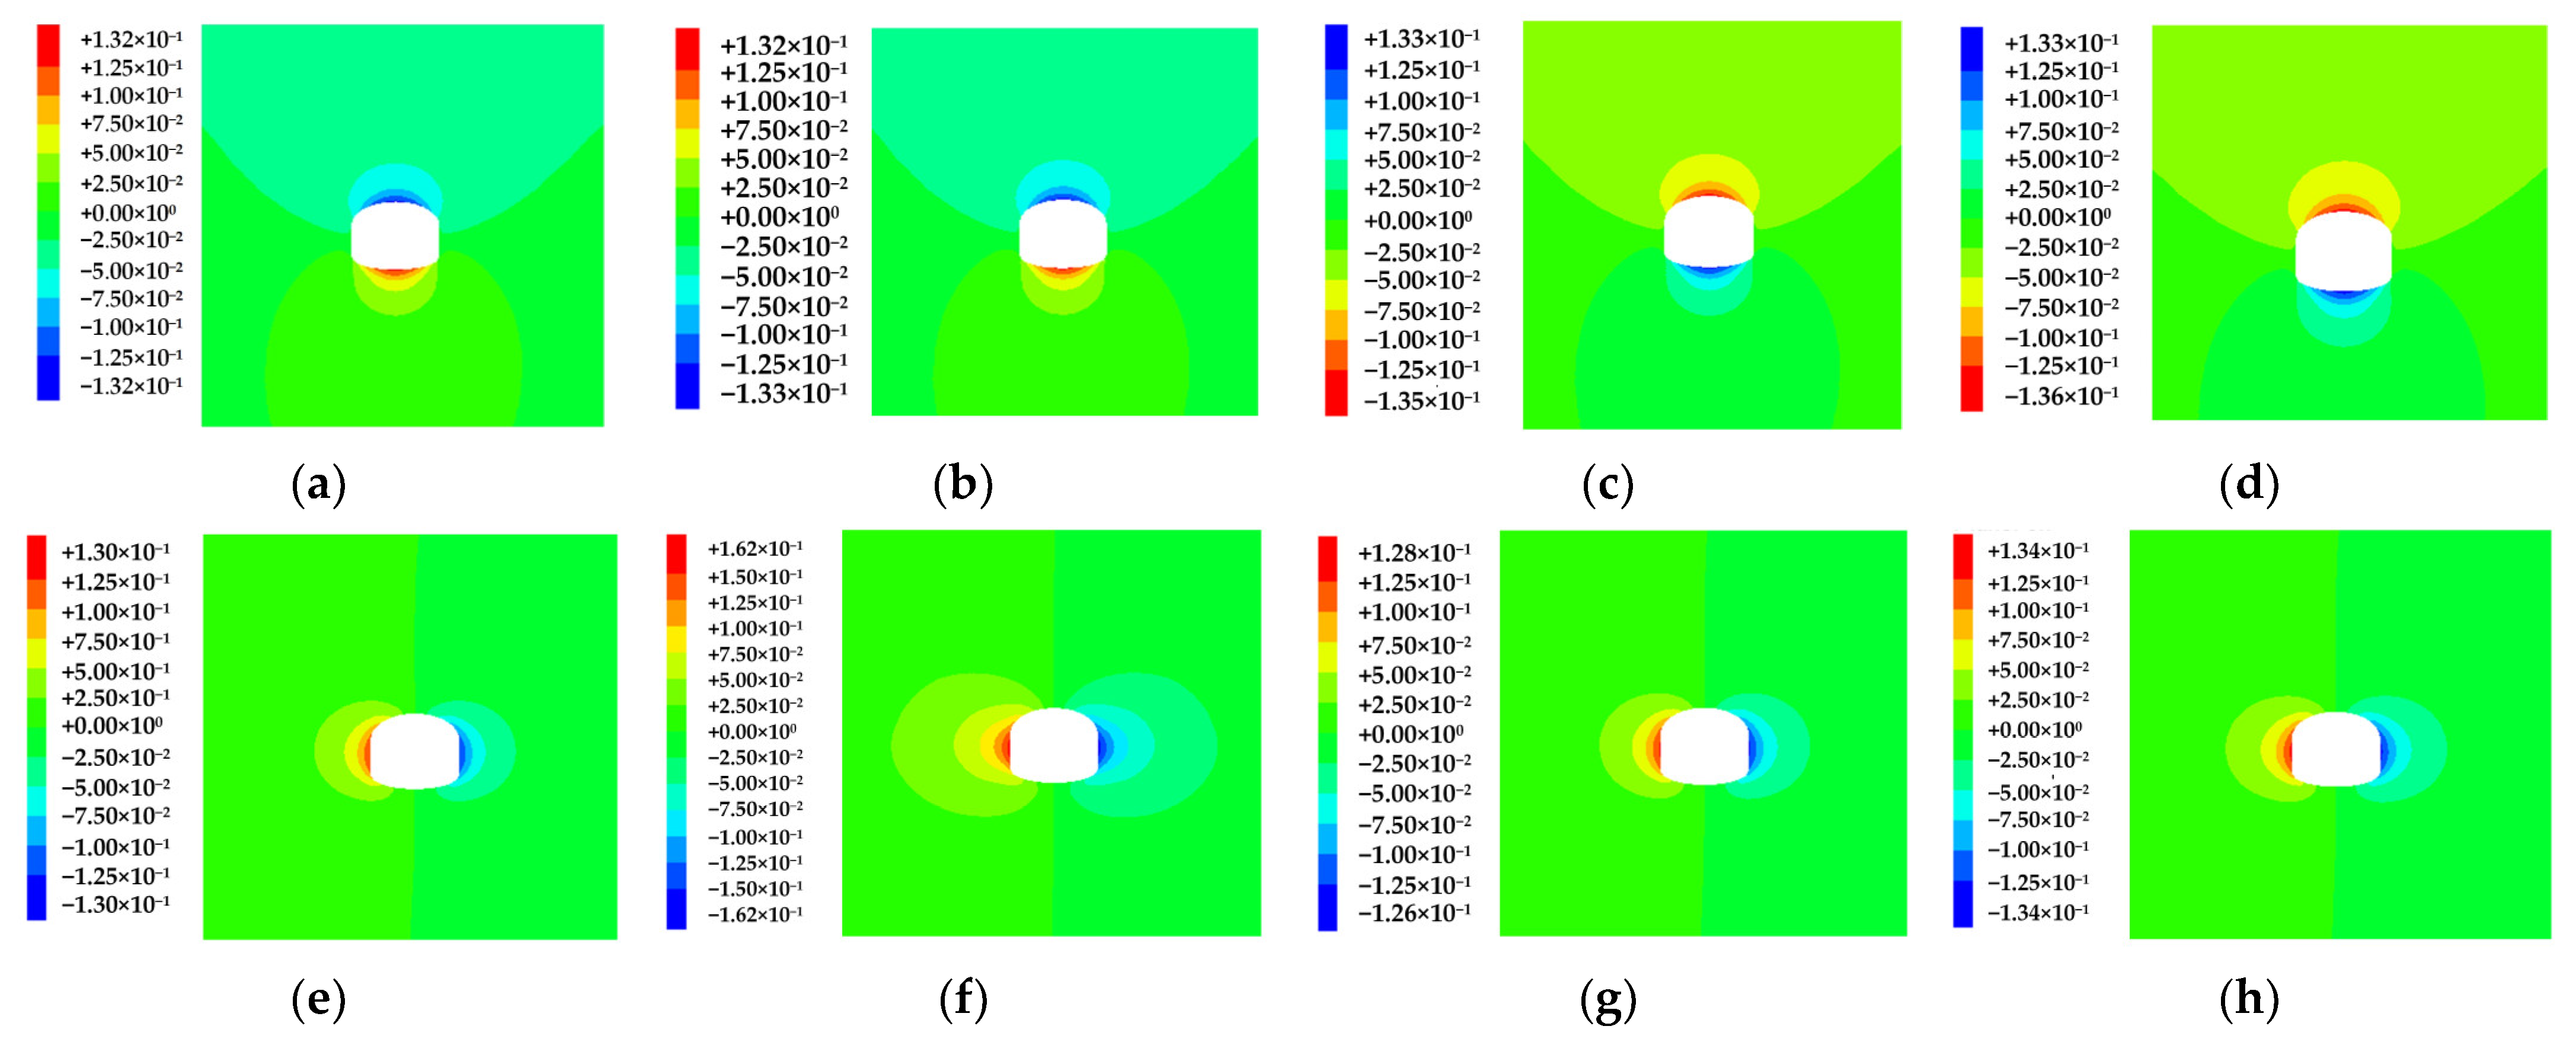
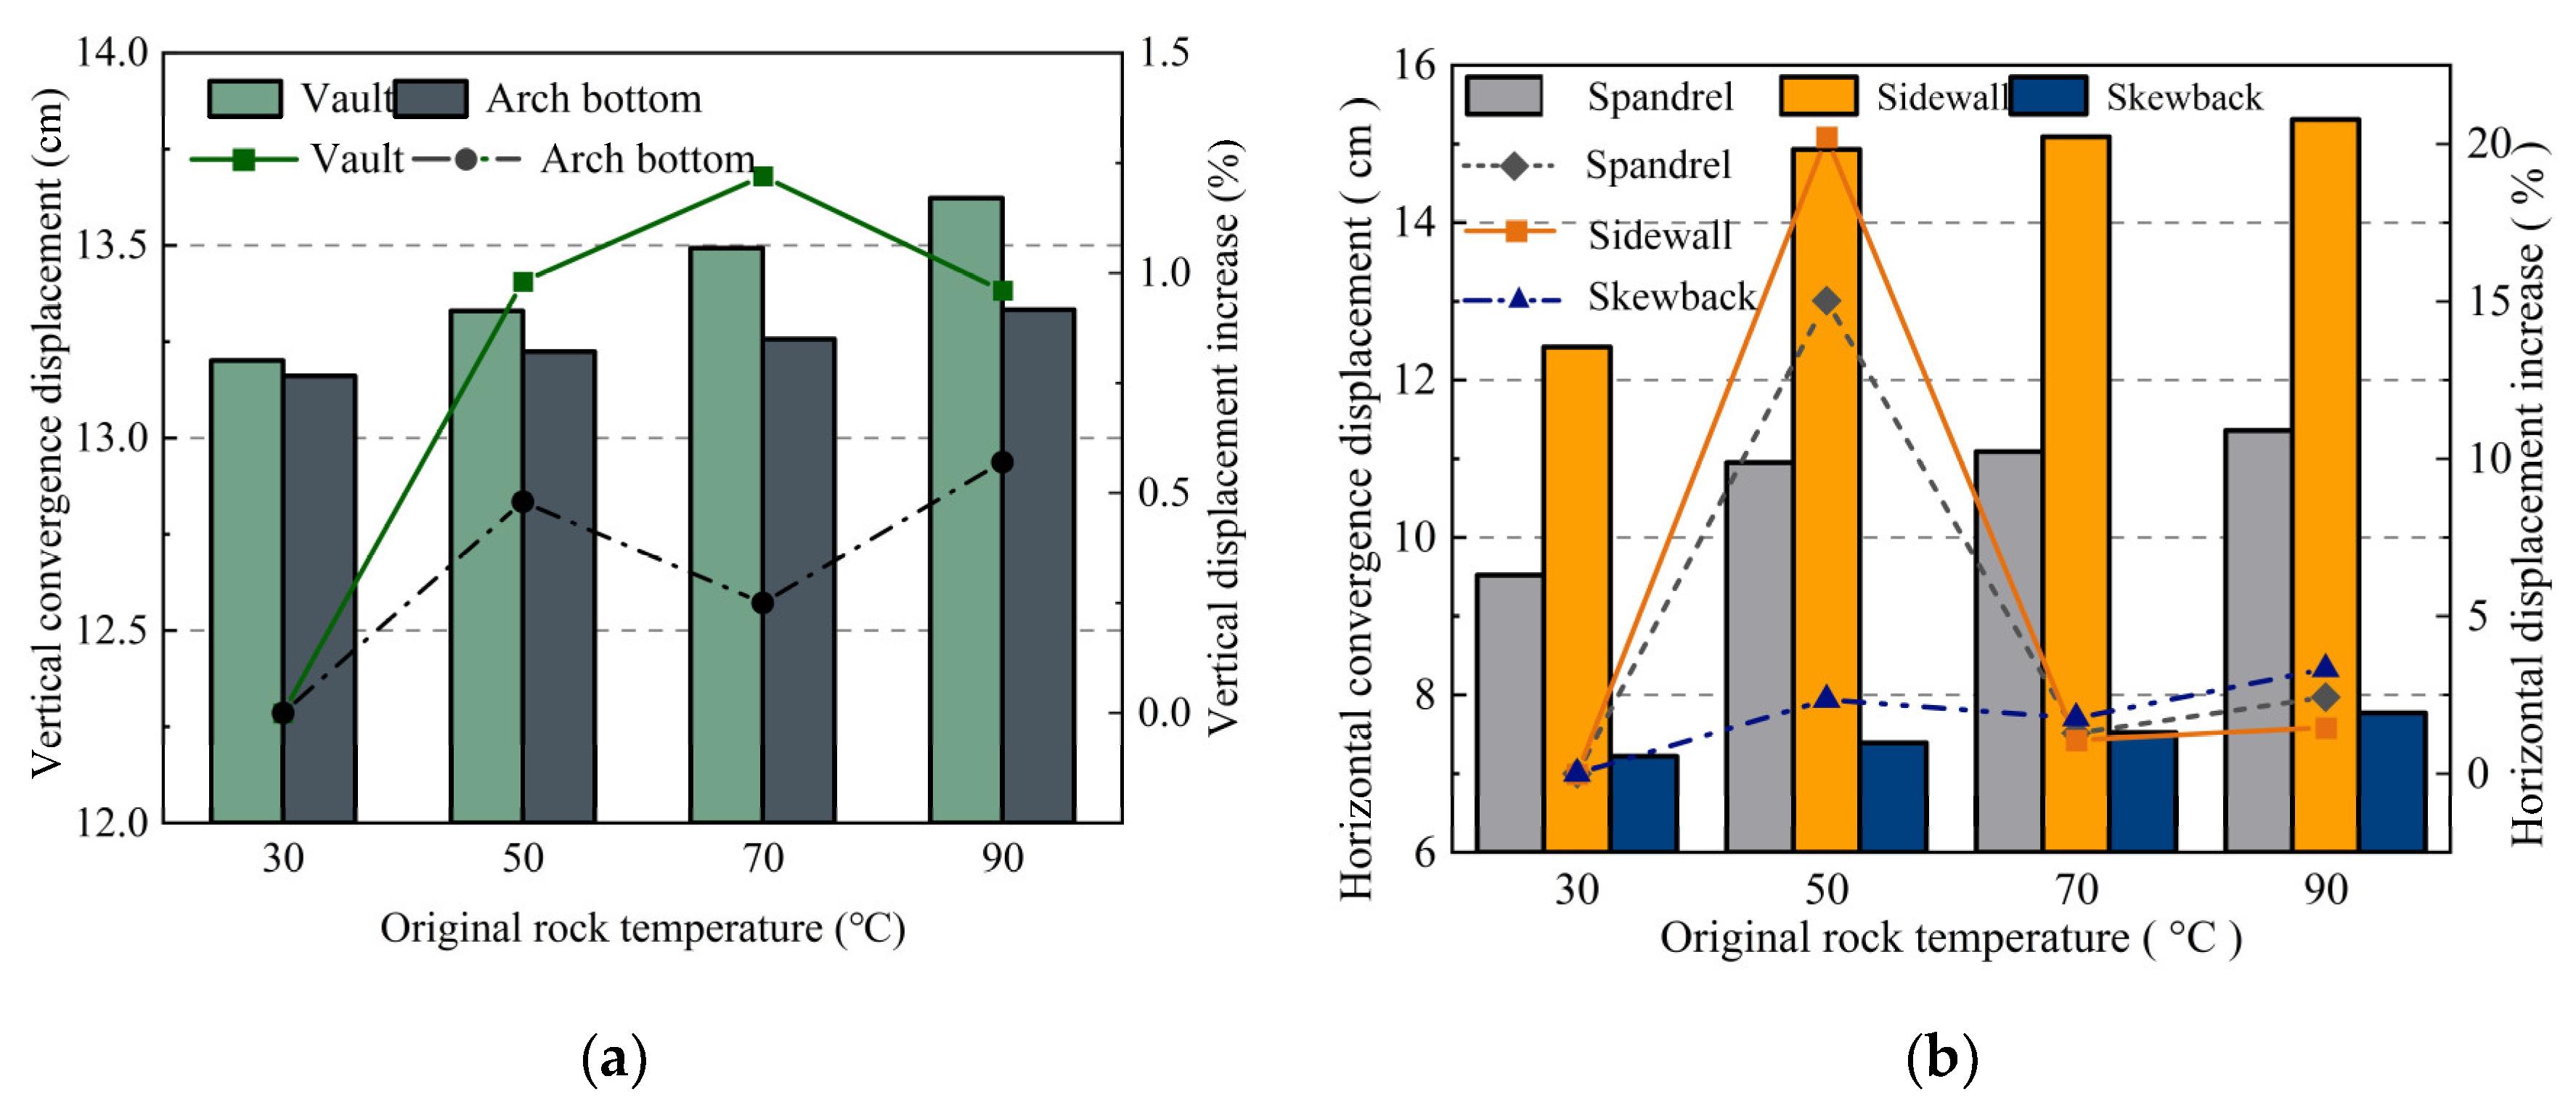
4.1.2. Evolution Patterns of Surrounding Rock Displacement Field

The horizontal and vertical displacement of deep underground engineering is the main content of construction process monitoring and measurement, and it is also the most direct reflection of the change in the surrounding rock stress state in deep underground engineering. Figure 6a–d demonstrate the displacement of vault and arch bottom at the 3 m section in the axial direction after the excavation of underground engineering under different original rock temperature conditions. The figure demonstrates that after the completion of the three excavations, under the combined effect of intense geostatic pressure and thermal stress, the adjacent rock formations underwent displacement towards the cavern’s inner spaces. The lager vertical displacement occurred at the vault and arch bottom, and the vertical displacement at the sidewall was almost unchanged. The vertical displacement of the caverns with different original rock temperatures was concentrated in the rock mass above the vault and below the arch bottom. With the increase in the original rock temperature, the influence range of the displacement above and below the cavern increased gradually. As the original rock temperature reached 90 °C, the influence range of the vertical displacement reached 10 m above the vault, which was about 2 times the cavern diameter.
The horizontal displacement nephogram at the axial 3 m section of the deep underground engineering after three excavations is demonstrated in Figure 6e–h. Figure 6 demonstrates that the horizontal displacement of the surrounding rock under different original rock temperatures showed a good law. The horizontal displacement at the monitoring point of the sidewall was the largest, the horizontal displacement of the upper and lower sides was gradually reduced, and the horizontal displacement of the surrounding rock at the spandrel and skewback was reduced to a minimum. Comparing Figure 6e–h, the results demonstrate a positive correlation between the rock temperature and the magnitude of horizontal displacement. The disturbance range of the surrounding rock increased with the increase in the original rock temperature during excavation.
The final vertical displacement values of the vault and arch bottom of the surrounding rock under different original rock temperatures were analyzed. Figure 7a demonstrates that the displacement of both gradually increased with the increase in original rock temperature, and the subsidence magnitude of the vault under different original rock temperature conditions exceeded the uplift displacement at the arch bottom. As the original rock temperature increased from 30 °C to 90 °C, the vault settlement value was 4.22 mm, the arch bottom uplift value was 1.72 mm, and the increment of vault displacement was 2.45 times that of the arch bottom displacement. The influence of temperature change on vault deformation was more significant.
The statistical data of the horizontal displacement of different parts of the surrounding rock under different original rock temperatures are demonstrated in Figure 7b. The figure demonstrates that the horizontal displacement of the spandrel, sidewall, and skewback at different original rock temperatures increased with the rise in the original rock temperature. The displacement of different parts at different original rock temperatures followed the following order: sidewall > spandrel > skewback. At 50 °C, after excavation, the displacement of the sidewall was 3.98 cm higher than the horizontal displacement of the spandrel, representing a 36% increase relative to the spandrel’s displacement; the reason was that the rock in the sidewalls, originally subjected to vertical stress, formed a free surface due to the lack of support after cavern excavation. Compared to the spandrel and skewback of an arch structure, the displacement of surrounding rock in this area increased significantly.

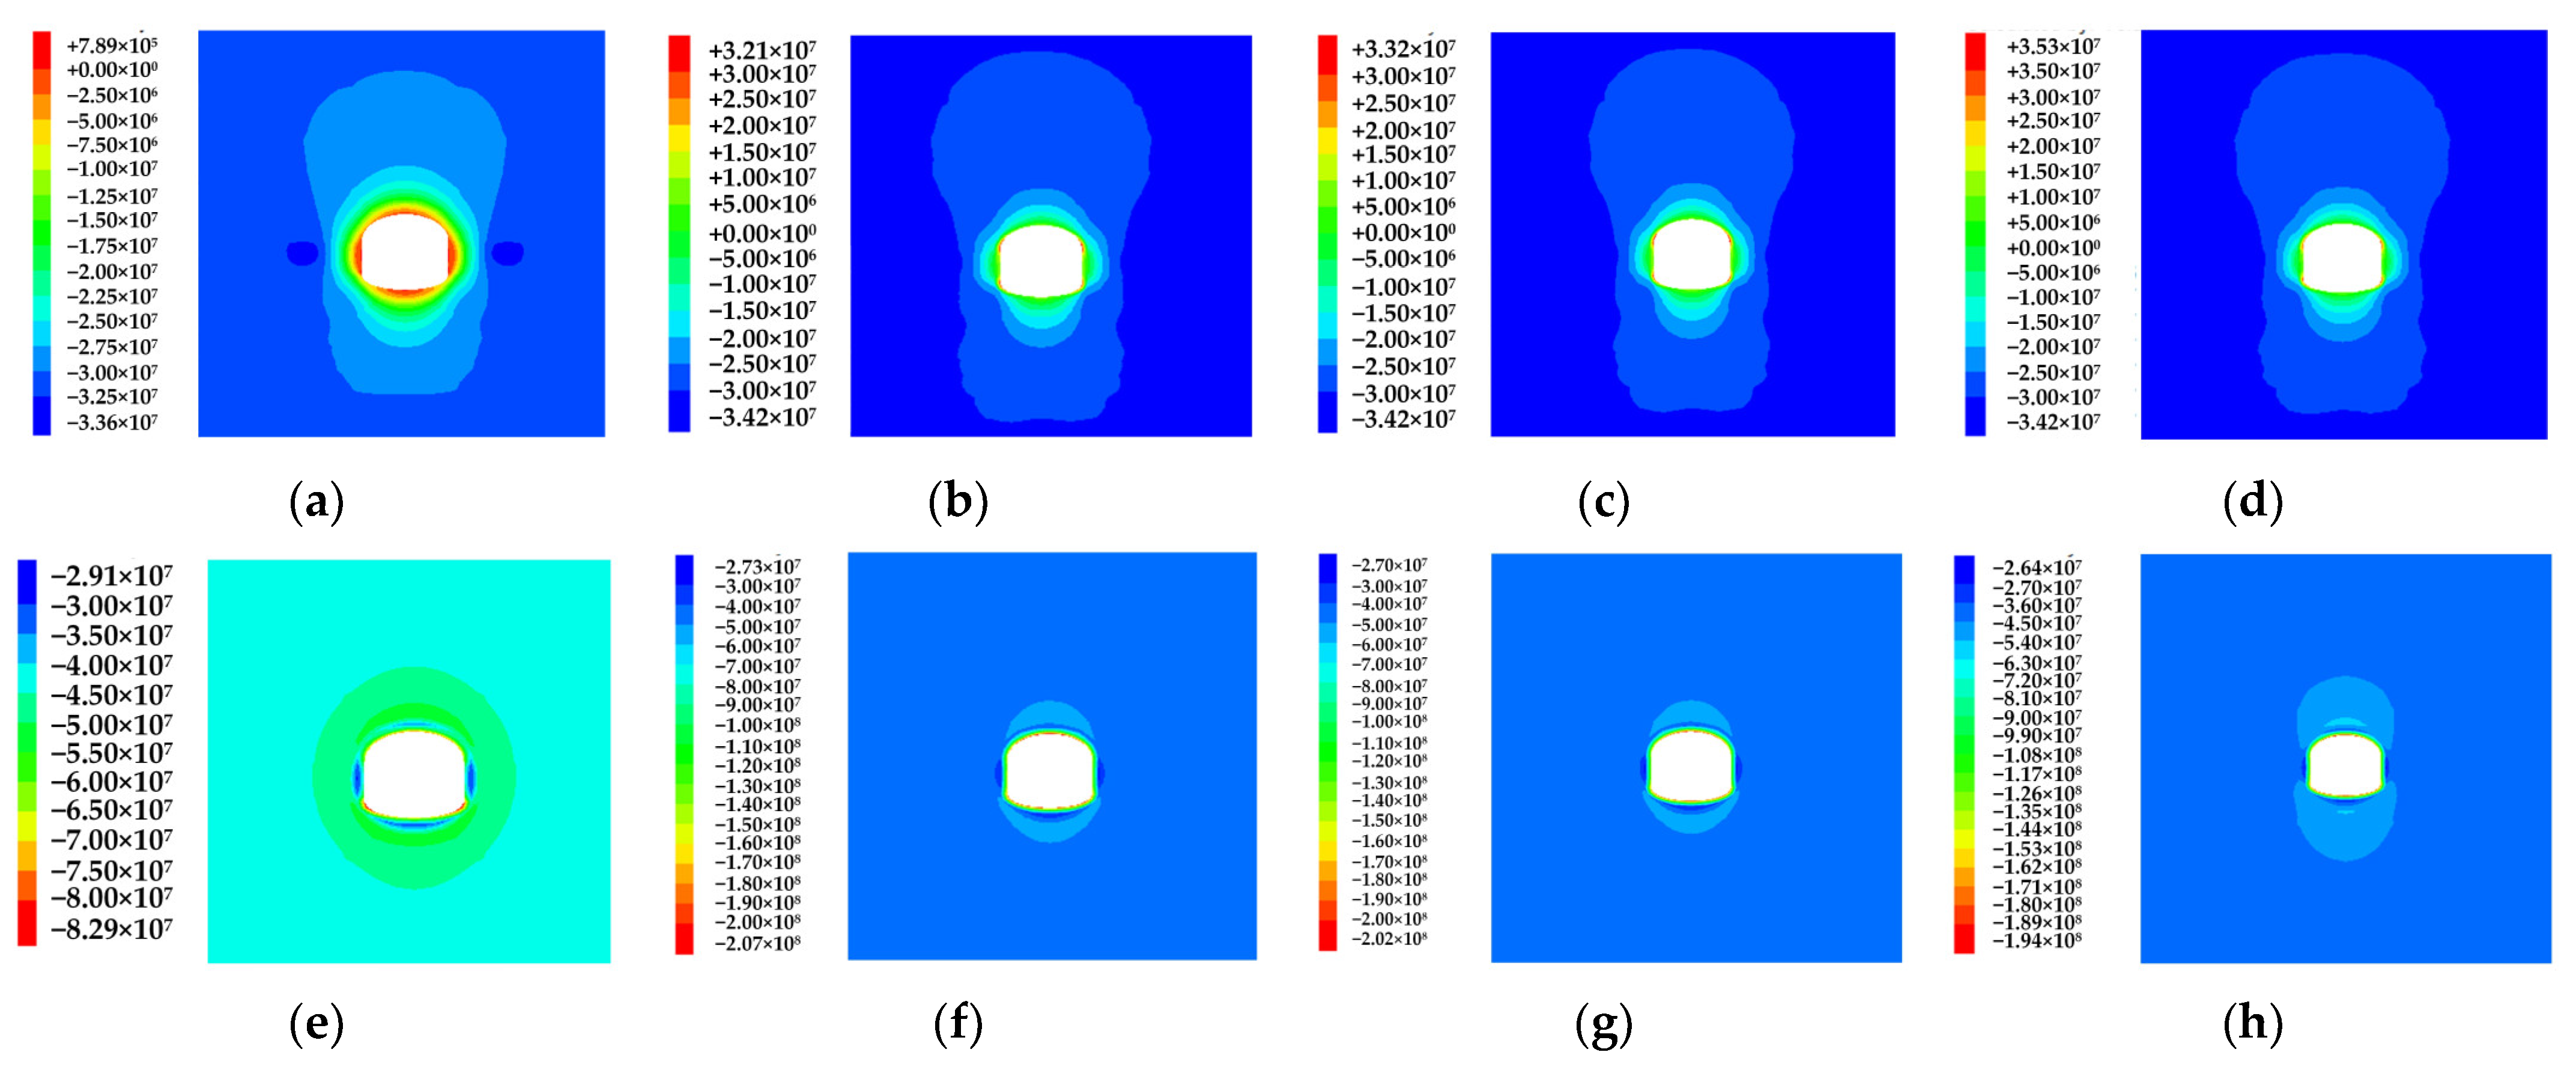
4.1.3. Evolution Patterns of Surrounding Rock Stress Field

The maximum principal stress nephogram at the axial 3 m section of deep underground engineering after three excavations under different original rock temperatures is shown in Figure 8a–d. It demonstrates that after excavation, with the change in the original rock temperature, the stress concentration occurred at different parts of the excavation section of the engineering. When the original rock temperature was 30 °C (Figure 8a), within a specific zone near the excavation contour surface, the stress state in the rock masses exhibited predominantly compressive characteristics after the redistribution of the surrounding rock stress, but the tensile stress concentration occurred in a small range of the cavern wall. The concentrated tensile stress of 0.78 MPa appeared on both sides of the sidewall, vault, and arch bottom of the cavern. Due to the existence of micro-cracks and pores in the rock and soil, it shows strong compressive capacity in the uniaxial compression test, while the tensile capacity is relatively weak. Therefore, the rock has the risk of being cracked in the tensile stress concentration area. As shown in Figure 8b,c, as the original rock temperature rose to 50 °C and 70 °C, the maximum principal stress showed a similar distribution law. The tensile stress occurred in the range of about 1 m in the radial direction of the contour surface of the cavern. Significant tensile stress concentration occurred at the spandrel and skewback on both sides of the cavern, and the local maximum tensile stress reached 32.13 MPa and 33.18 MPa, respectively, which was a high-risk part of the cavern. When the original rock temperature reached 90 °C, the stress concentration intensified in critical zones of the surrounding rock, with maximum tensile stress at the spandrel reaching 35.33 MPa. Overall, the effect of temperature on the surrounding rock cannot be ignored.
The distribution of the minimum principal stress after the excavation under different original rock temperatures is depicted in Figure 8e–h. As evidenced in Figure 8, compressive stress persisted as the dominant component in the minimum principal stress field observed within the post-excavation rock mass. Figure 8e demonstrates that the minimum principal stress value was the largest near the skewback (about 80 MPa), and there was a small range of minimum principal stress concentration area on the sidewall and the arch bottom. The variation range of the minimum principal stress exhibited a marginally broader magnitude under an original rock temperature of 50 °C compared to conditions where the temperature was 30 °C, and the variation range of the vault and both sides of the arch bottom of the cavern was obviously larger than that of the sidewall. With the increase in the original rock temperature, there were obvious minimum principal stress concentration areas at 0.8 m above the vault of the cavern vault and 1.0 m below the arch bottom. It indicates that this part of the rock mass bore a large compressive stress under the effect of stress and temperature. When the temperature of the original rock reached 90 °C (Figure 8h), the stress concentration range and concentration degree above the vault and below the arch bottom of the cavern were further increased, indicating that the effect of temperature on the rock mass was very great at this time. Here, special reinforcement should be paid attention to the vault and skewback.

4.1.4. Evolution Patterns of Plastic Zone of Surrounding Rock

To study the distribution patterns of the plastic zone of the surrounding rock, the radial plastic zone nephogram at the axial 3 m section of the cavern under different original rock temperatures was extracted, as demonstrated in Figure 9.
Figure 9 demonstrates that the expansion of the plastic zone after cavern excavation had similar patterns under different original rock temperature conditions. When the temperature was 30 °C (Figure 9a), the plastic zone after the excavation was mainly concentrated in the range of 1.0 m in the upper part of the vault, and the plastic zone tended to extend to the spandrel on both sides of the cavern. At this time, there was only about a 0.4 m thick plastic zone at the spandrel; the plastic zone in the lower part was mainly concentrated in the range of 0.2 m~0.7 m below the skewback and arch bottom on both sides of the cavern. When the original rock’s temperature reached 50 °C, the range of the plastic zone at the vault further increased, and the upper 1.2 m zone of the vault exhibited extensive shear-type failure, propagating into the spandrel region. At this time, the skewback and the arch bottom were scattered with a small range of plastic zone, but there was a tendency to gradually converge to form a large range of plastic zone. When the original rock’s temperature increased to 70 °C and 90 °C, the range of the plastic zone increased significantly, and a large area of damage zone was formed in the rock within 1.5 m of the excavation contour surface of the cavern, indicating that the cumulative damage of the surrounding rock induced by the high rock temperature made the plastic zone interpenetrate in the excavation process.
Rock masses exhibit relatively low shear strength compared to their tensile strength. Therefore, during the cavern excavation process, the types of plastic zones in the surrounding rock are mainly characterized by shear stress-induced yielding and tensile stress-induced damage failure. Figure 9a–d demonstrate that under different original temperatures, the distribution of plastic zone was that the shear damage failure and tensile failure zone were significantly larger than the compressive failure zone. In the same section, the plastic zone exhibited progressive expansion corresponding to elevated original temperature. This shows that the distribution area of the plastic zone is directly related to the original rock temperature. The higher the temperature of the original rock, the larger the area and the greater the depth of the plastic zone.

4.2. Multi-Field Evolution Patterns of Surrounding Rock Under Continuous Excavation

4.2.1. Evolution Patterns of Surrounding Rock Temperature Field

Taking the original rock temperature of 50 °C as an example, the temperature field evolution pattern of the cavern’s surrounding rock throughout the excavation process was examined. Figure 10a–c show the temperature field distribution nephogram at the axial 3 m section of the cavern under different excavation processes. From Figure 10a, it can be seen that when the cavern was excavated to 2 m, the temperature at the center of the section decreased the most, with the highest drop of 9.6 °C. The thermostat ring was centered on the middle of the cavern and continuously diffused to the deep in the ring. When the excavation reached 4 m, as shown in (Figure 10b), the temperature also propagated to the interior regions of rock in an annular manner; the surrounding rock’s temperature variation range was considerably amplified compared to the first excavation, especially near the cavern’s contour surface. When the excavation reached 6 m (Figure 10c), the temperature variation range still grew but at a lesser rate than it did during the secondary excavation. This was mainly because, as time advances, the effect of excavation on deep surrounding rock becomes weak, and the deep stratum rock mass is in a relatively stable temperature state. After reaching a certain depth, the rock temperature was no longer affected by excavation disturbance and tended to be stable.
In the excavation process, the study investigated temperature variations in the surrounding rock across different depths above the vault of the 3 m excavation section. Figure 11 demonstrates that the farther the rock was from the excavation contour surface, the higher the temperature was, and the range of temperature variation in the surrounding rock gradually decreased with the increase in excavation steps and depth into the surrounding rock. The temperature of the surrounding rock changed the most when the excavation reached 4 m. Taking the temperature at the vault of the cavern as an example, the temperature reached 60% of the cooling value of the whole stage in a short time after the second footage excavation. The heat convection with the air will take away most of the heat in the rock and make it cool rapidly. As the rock moved away from the contour face over time, its primary thermal transfer mechanism shifted from convective heat exchange with airflow to thermal interaction with neighboring geological materials. Therefore, the change trend of the surrounding rock temperature gradually weakened along the depth direction. At depths of 0.4 m and 0.8 m from the excavation contour surface of the cavern, the surrounding rock temperature had a significant turning point after the excavation to the 3 m working section. When the depth reached 2.0 m, the surrounding rock temperature change was further weakened. When the depth reached 4 m and 6 m, the surrounding rock temperature showed no obvious change and tended to be stable.

4.2.2. Evolution Patterns of Surrounding Rock Displacement Field

To investigate the variation patterns of vertical cavern deformation during excavation activities, this research focused on an original rock temperature of 50 °C to analyze displacement patterns and mechanical responses of the surrounding rock throughout the excavation phase. Under different excavation processes, the vertical displacement distribution patterns at the 3 m cross-section and the corresponding monitored displacement variations during excavation progression are, respectively, presented in Figure 12a–c and Figure 13. According to Figure 12a–c, the vault and arch bottom have undergone vertical deformation after the first excavation. According to the monitoring data (Figure 13a), the early settlement of the vault was about 20 mm, accounting for 18.5% of the final settlement after the three excavations of the cavern. When the working face advanced to the monitoring section, vertical displacement at the vault and arch bottom increased rapidly. It was mainly because the excavation caused the rock to form a free face, the stress was redistributed, and the vault and the arch bottom produced large elastic deformation under the effect of stress, showing a large deformation rate (Figure 12b). When the working face passed through the monitoring section and excavated to 6 m, the vertical displacement deformation rate gradually decreased, and the convergent movement patterns emerged between the vault and arch bottom sections (Figure 13a). The main reason was that the excavation working surface was gradually moving away from the monitoring points, and the influence caused by the excavation activity was gradually reduced. And because of the construction of the rock bolt and the follow-up of the initial shotcrete, the supporting structure and the surrounding rock gradually formed a good whole, sharing the load-induced deformation, which had a significant inhibitory effect on the surrounding rock deformation.
Taking the original rock temperature of 50 °C as an example, the horizontal deformation evolution patterns of the surrounding rock during the excavation were monitored. Figure 12d–f present a nephogram illustrating horizontal displacement distributions within the surrounding rock at the 3 m axial cross-section of the cavern after each excavation footage of 2 m. Figure 13b is the horizontal displacement monitoring nephogram of different parts of the cavern. Figure 12d–f demonstrate that the surrounding rock in front of the working face has shrunk inward after the first excavation, and the surrounding rock adjacent to the cavern had the largest displacement. With the increase in the distance between the surrounding rock and the cavern, the horizontal displacement gradually decreased (Figure 12d). As demonstrated in Figure 13b, the rock mass adjacent to the cavern exhibited a gradual increase in deformation across various monitoring locations, with lateral displacements reaching approximately 3.0 cm following the first excavation. With the excavation, the horizontal displacement of the monitoring point increased sharply when the construction reached the monitoring section. At this stage, the sidewall horizontal displacement was about 9.2 cm, accounting for 65.7% of the horizontal displacement of the final section. At this moment, the deformation growth rate of the surrounding rock was large, which could easily cause serious geological problems such as large area collapse. When the cavern was continuously excavated to 6 m of the cavern axis, the monitoring section was behind the excavation face, but due to the excavation-induced disturbance, the horizontal displacement of the cavern sidewall, spandrel, and skewback also increased to varying degrees, and the deformation eventually stabilized over time. After the deformation was stable, the horizontal displacement at the spandrel was accumulated to 12.45 cm, the sidewall horizontal displacement was accumulated to 14.13 cm, and the final horizontal displacement at the skewback was 9.09 cm.

5. Discussion

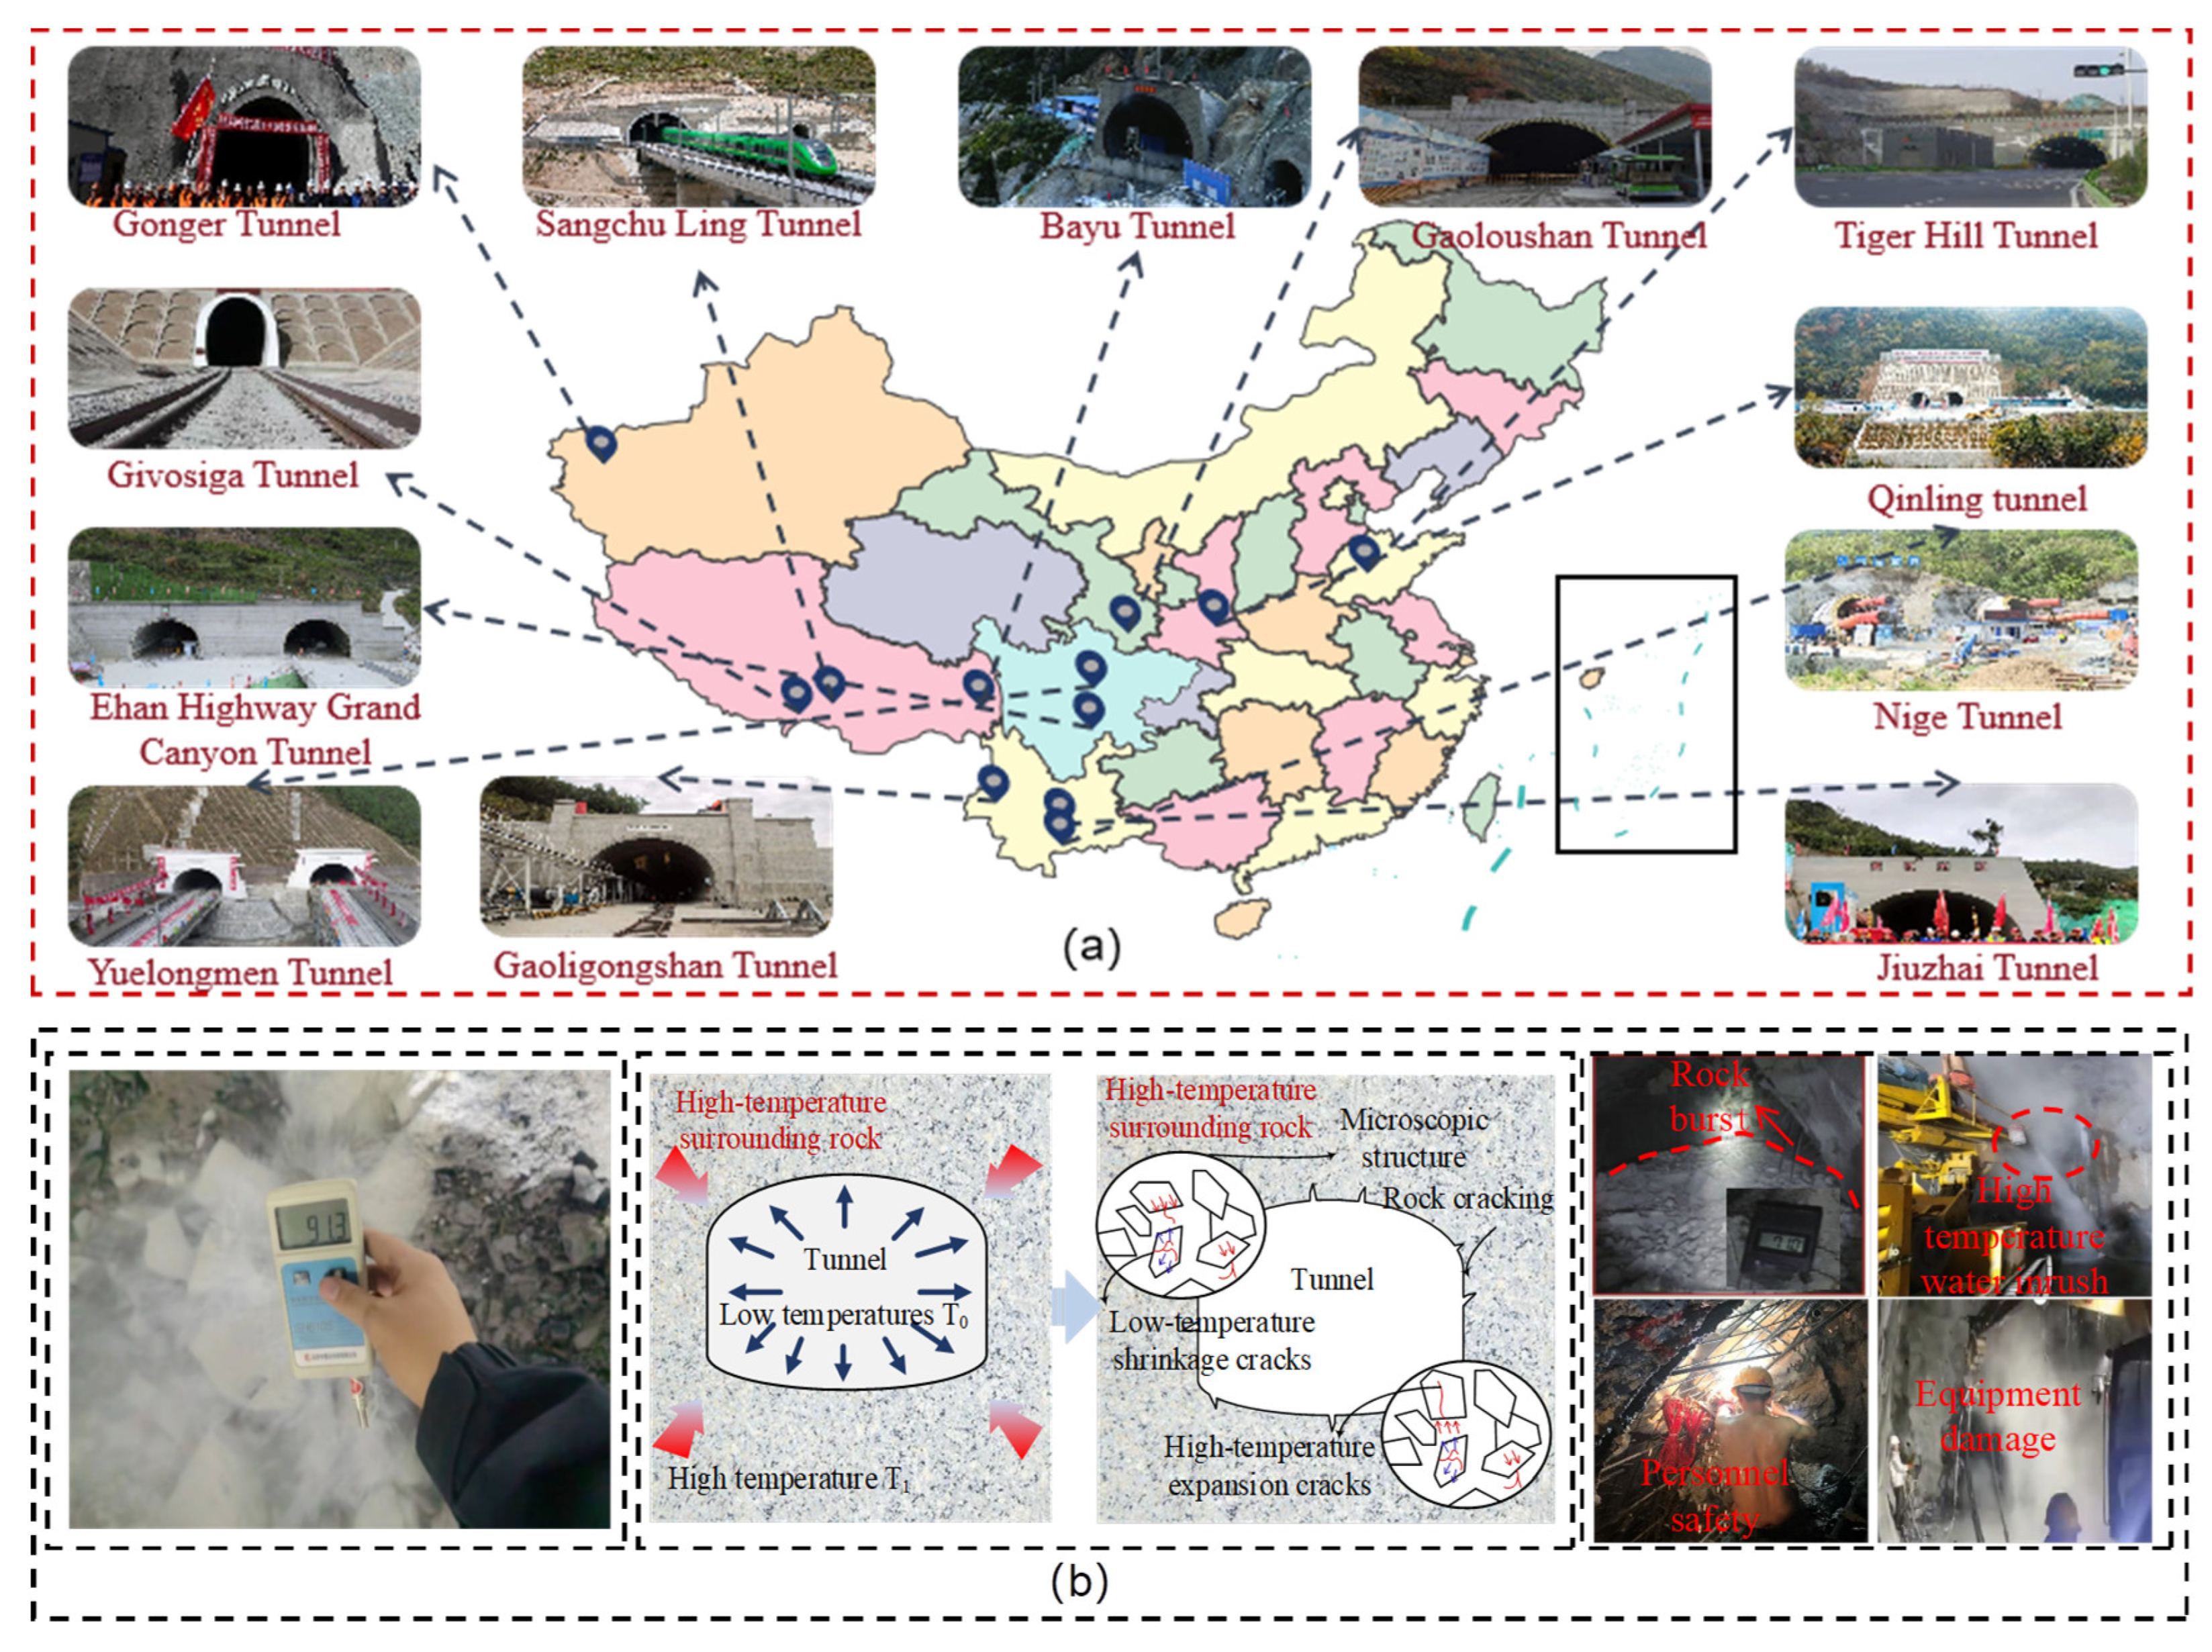
5.1. Disaster Forms Caused by High Rock Temperature

High rock temperature is one of the inevitable geological disasters in the process of underground engineering construction. High temperatures in the engineering environment can easily lead to damp heat, which may affect workers’ health, reduce the service life of equipment, lower labor efficiency, and slow down construction progress. At the same time, the excavation disturbance causes fluctuations in the rock temperature, which alters the mechanical properties of the rock. These changes may easily lead to large deformations in the surrounding rock and even result in major engineering disasters such as collapses and rockbursts. After the excavation is completed, high temperatures will continue to affect the supporting structure of the underground project, thereby reducing its structural strength and threatening the stability of the construction.

5.2. Effect of Thermal-Solid Coupling on Surrounding Rock Stability

The above research results demonstrate that the increase in the original temperature will have substantial effects on the temperature, displacement, stress field, and plastic zone of the surrounding rock. The closer the surrounding rock was to the excavation contour surface, the lower the temperature and the greater the temperature gradient. The higher the temperature, the greater the deformation of the surrounding rock, and the maximum vertical displacement and horizontal displacement occurred in the vault and sidewall. The range and concentration of the principal stress and the area of the plastic zone also increased with increasing temperature. In the process of continuous excavation, the temperature and deformation rate were the largest when the working face was near the monitoring section. These results can provide important reference values for engineering practice.

5.3. Engineering Value and Prevention Measures

In the process of engineering construction, it is necessary to carry out advanced geological prediction according to the actual project and formulate a dynamic adjustment monitoring scheme to respond to the change in multi-source information in time, encrypt monitoring points near the excavation face, and establish a real-time early warning system. To reduce the adverse effects of high rock temperature on construction personnel and equipment, preventive measures such as ventilation, cooling, and heat insulation of the surrounding rock should be carried out in time. In view of the possible disasters such as a large deformation of surrounding rock, rockburst, high temperature water inrush, and support system failure in construction, advanced support measures such as advanced small pipe and advanced deep hole grouting should be carried out, and the support time and support strength of the support system should be optimized, especially in the areas of large deformation and stress concentration, such as the vault, arch bottom, and side wall, where targeted reinforcement measures should be taken.
The research results provide theoretical support for the stability evaluation and construction control of surrounding rock in high temperature and deep-buried engineering, especially in the aspects of temperature field monitoring, support structure optimization, and dynamic monitoring scheme design. Future research can further combine the characteristics of heterogeneous rock mass, multi-physical field coupling, and the effect of different excavation methods to improve the engineering applicability of the model.

6. Conclusions

This study developed a nonlinear thermal-solid coupling computational model utilizing the finite difference approach, which incorporated different original rock temperature conditions and phased excavation processes into the numerical simulation framework. The evolution patterns of the temperature, displacement, stress fields, and plastic zone of the surrounding rock during continuous excavation of deep underground engineering under different original rock temperatures were analyzed. The key findings are as follows:
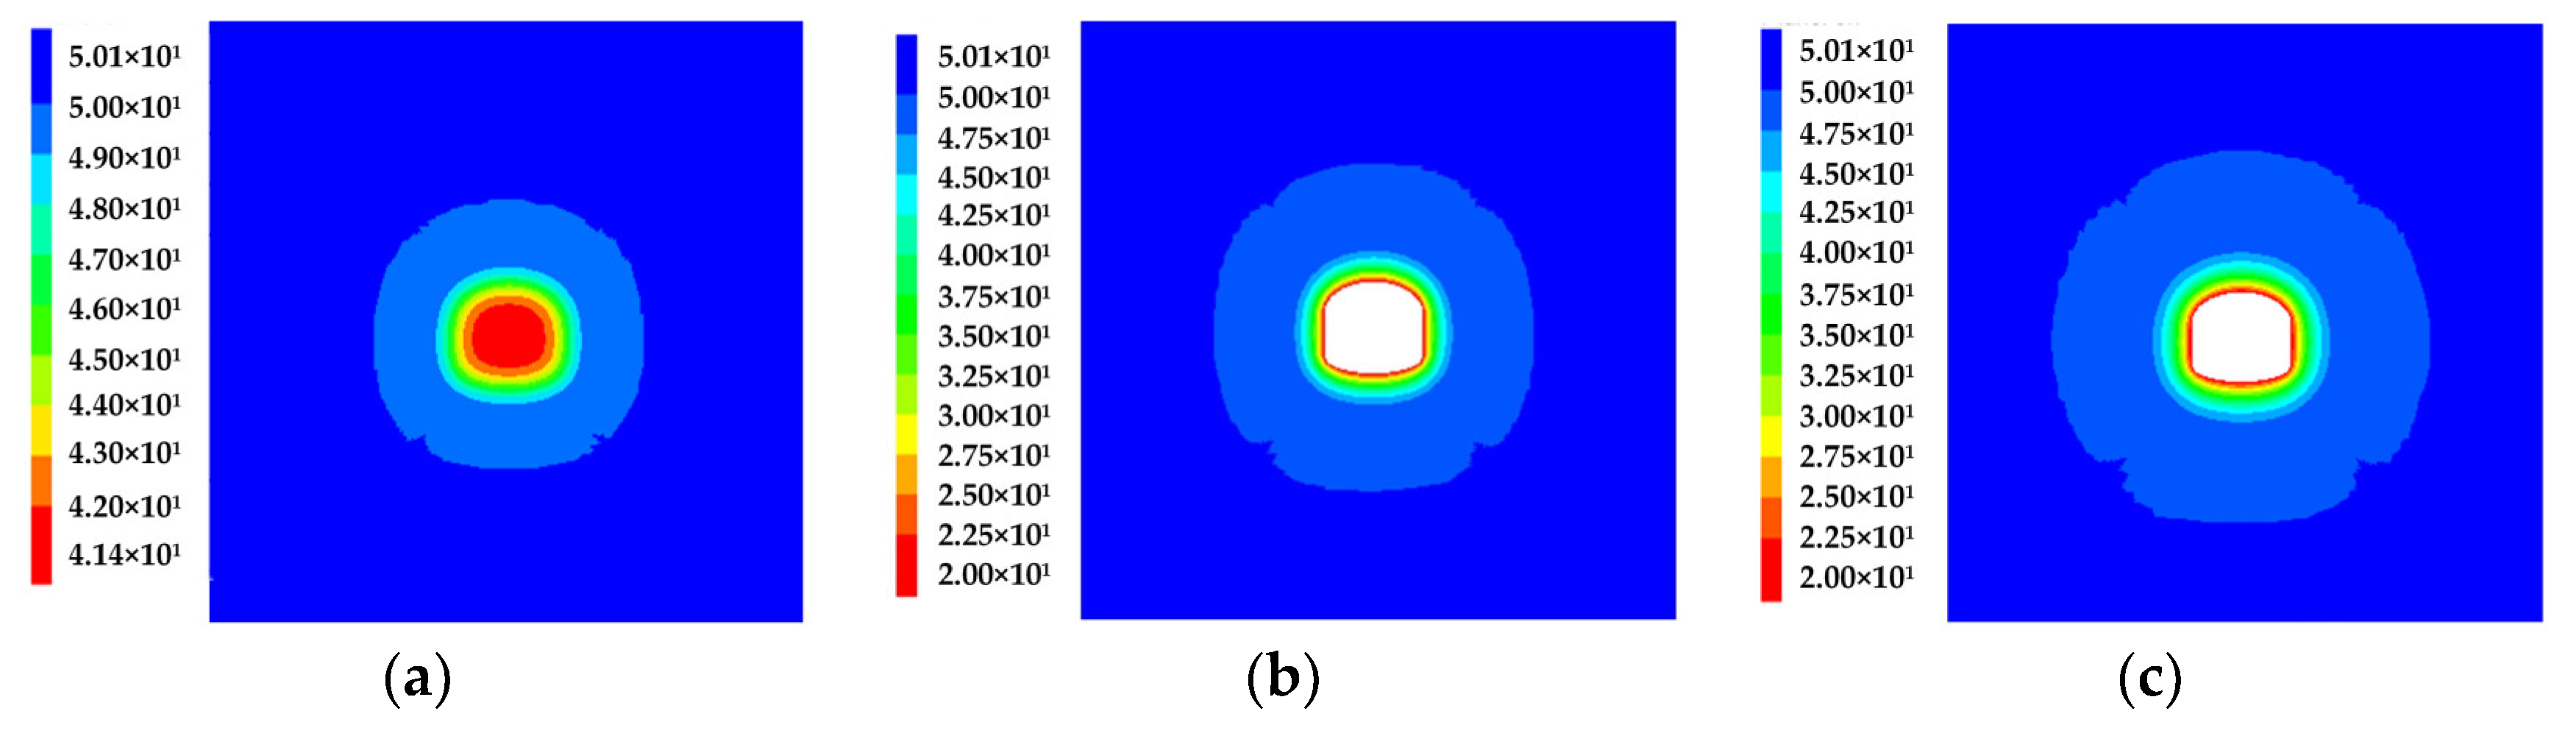
  • After the completion of the three excavations, the distribution pattern of the isotherm was consistent with the geometric characteristics of the contour surface of the cavern. The temperature of the surrounding rock near the contour surface of the cavern was lower, but the temperature gradient was larger. At the same time, the temperature gradient of the surrounding rock gradually increased with the increase in the original rock temperature, and the temperature of the deep surrounding rock tended towards the original rock temperature.
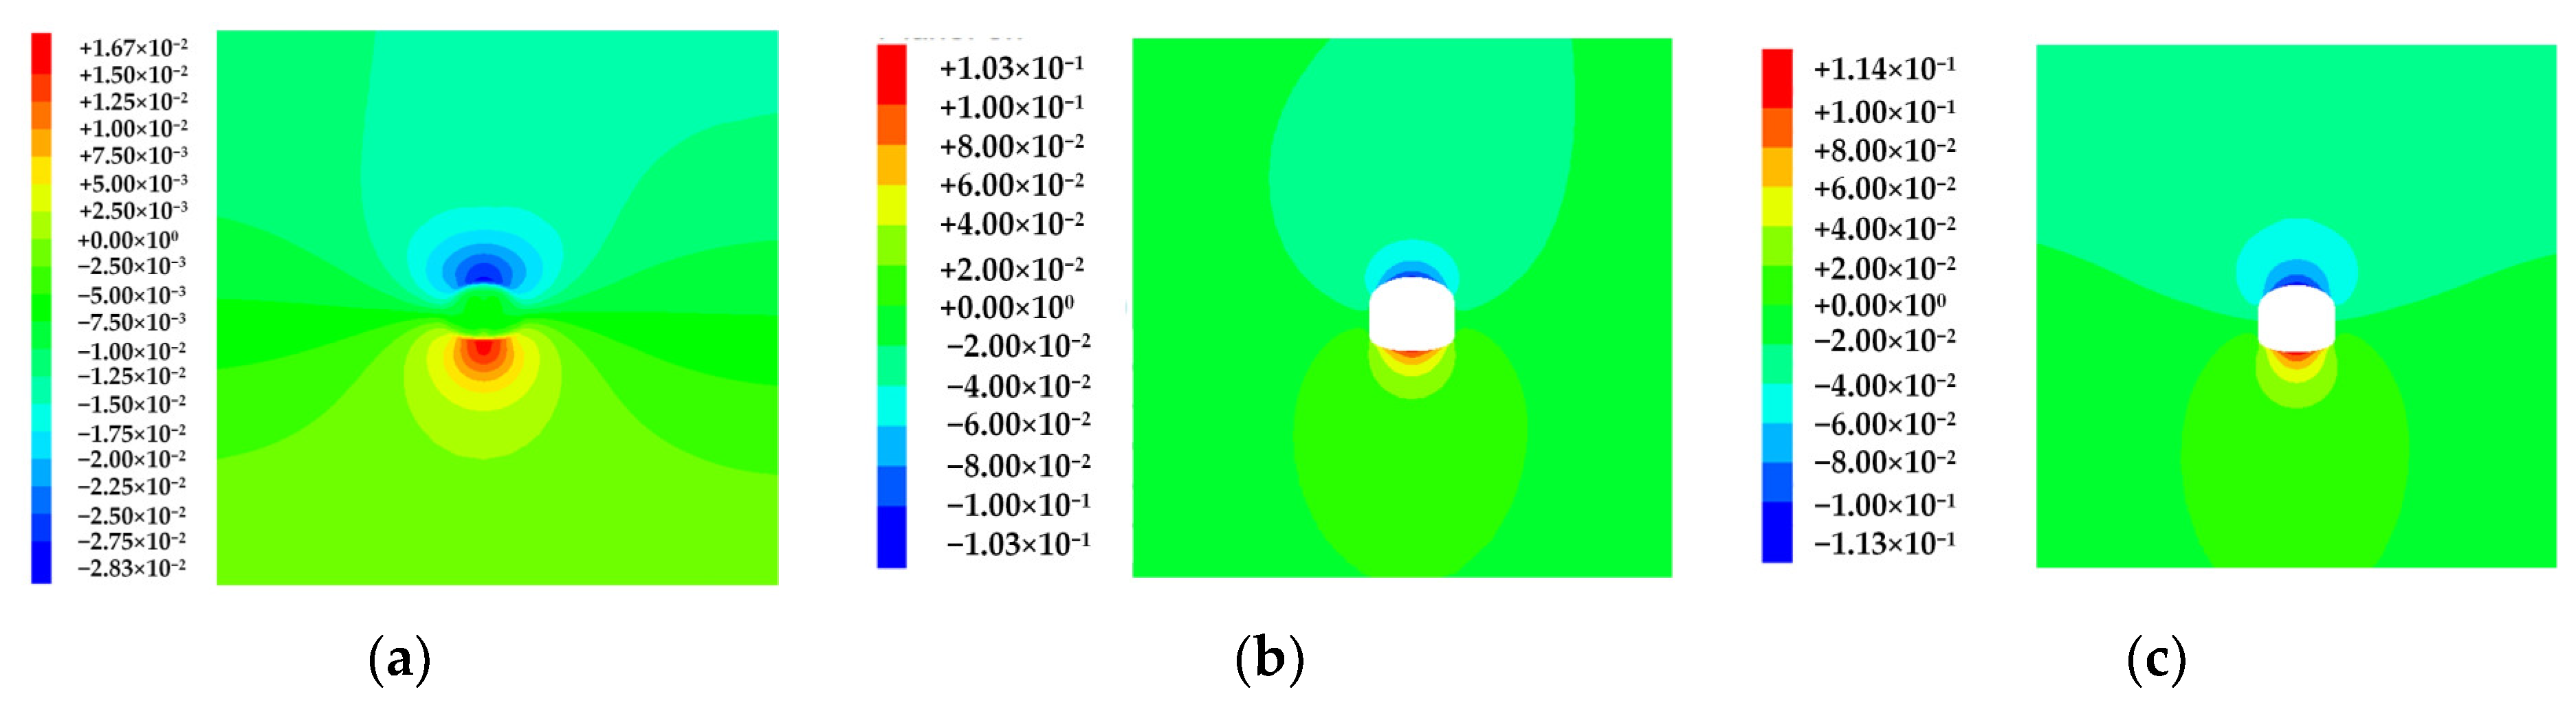
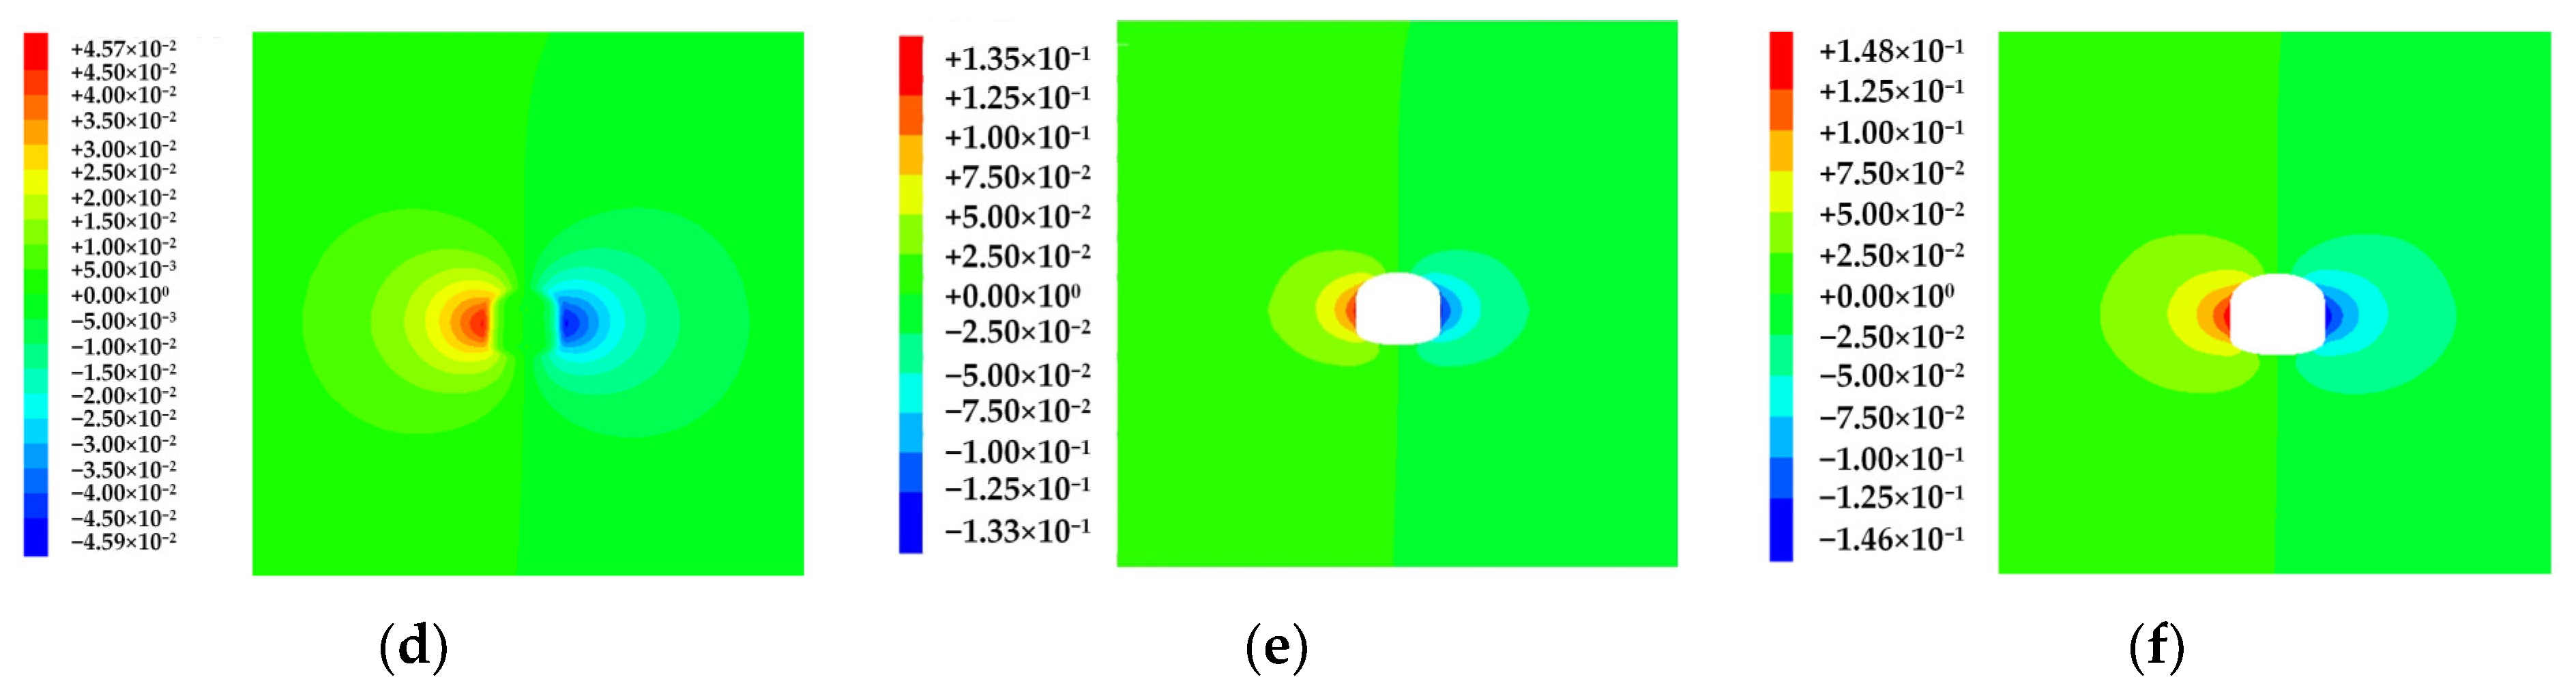
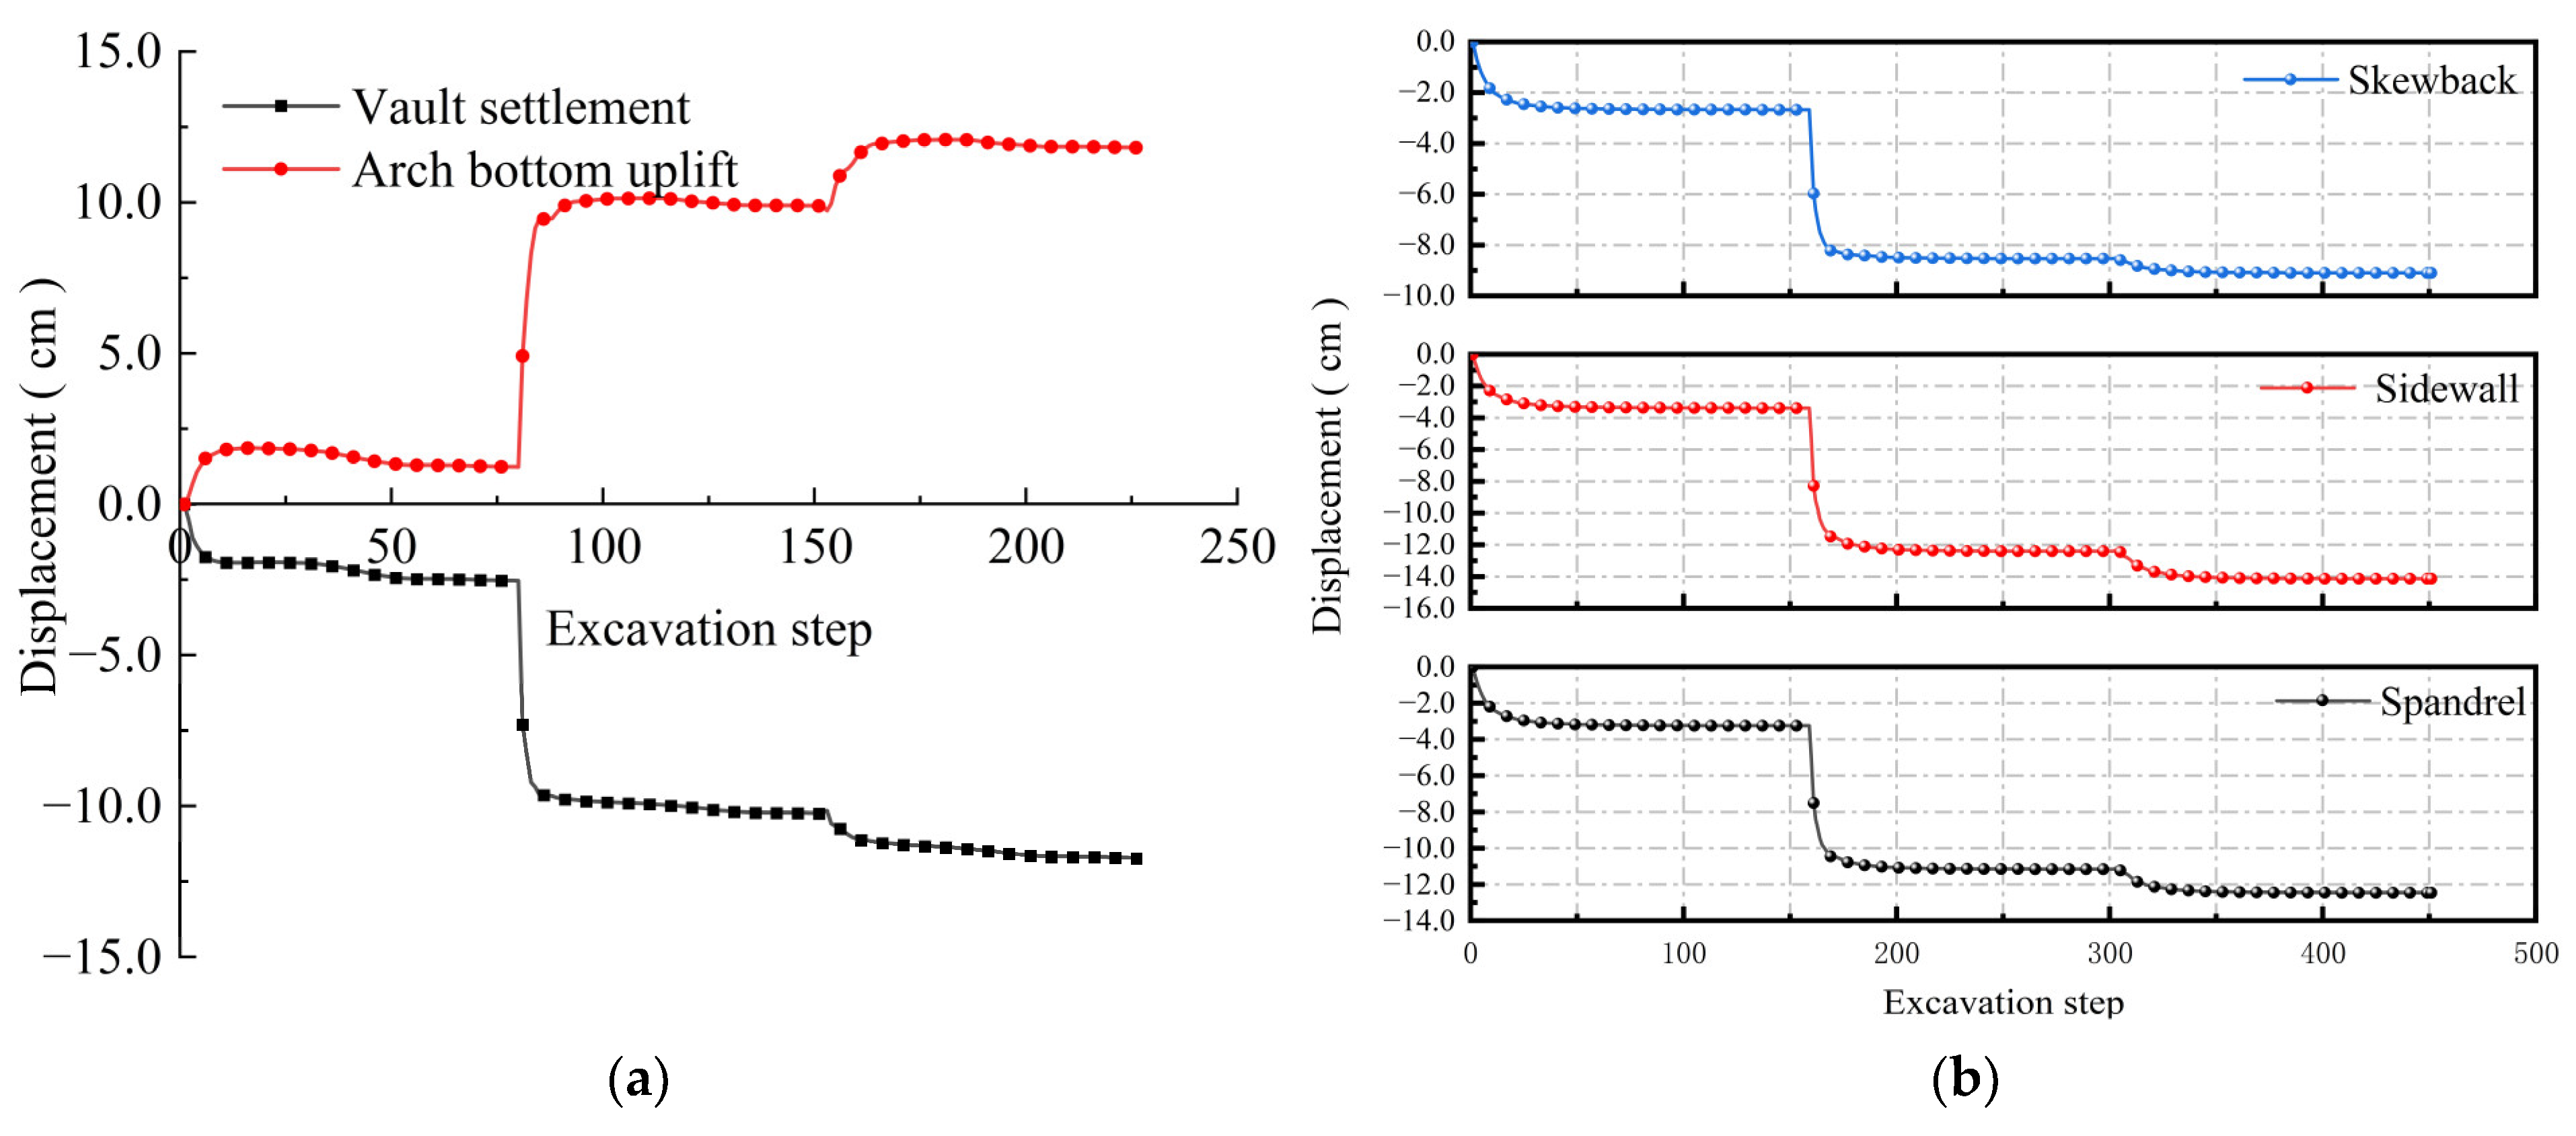
  • After the excavation, the greatest vertical displacement was observed at the vault and the bottom of the arch, and the lager horizontal displacement occurred in the middle of the sidewall of the cavern. Under different original rock temperature conditions, the vertical displacement exhibited a vault settlement value > the arch bottom uplift value. As the original rock temperature climbed from 30 °C to 90 °C, the increment of vault displacement was 2.45 times that of arch bottom displacement, and the influence of temperature change on the vault was more significant. At the same time, the horizontal displacement at different temperatures exhibited sidewall displacement > spandrel displacement > skewback displacement.
  • The maximum principal stress was mainly compressive stress in a certain range of the contour surface of the cavern, and the tensile stress concentration phenomenon occurred in a small range. With the increase in temperature, the stress concentration degree further increased, and the concentration phenomenon at the spandrel and skewback on both sides was more obvious. The minimum principal stress was mainly compressive stress, and the variation range and stress concentration degree of the minimum principal stress on both sides of the cavern increased obviously with the increase in the original rock temperature.
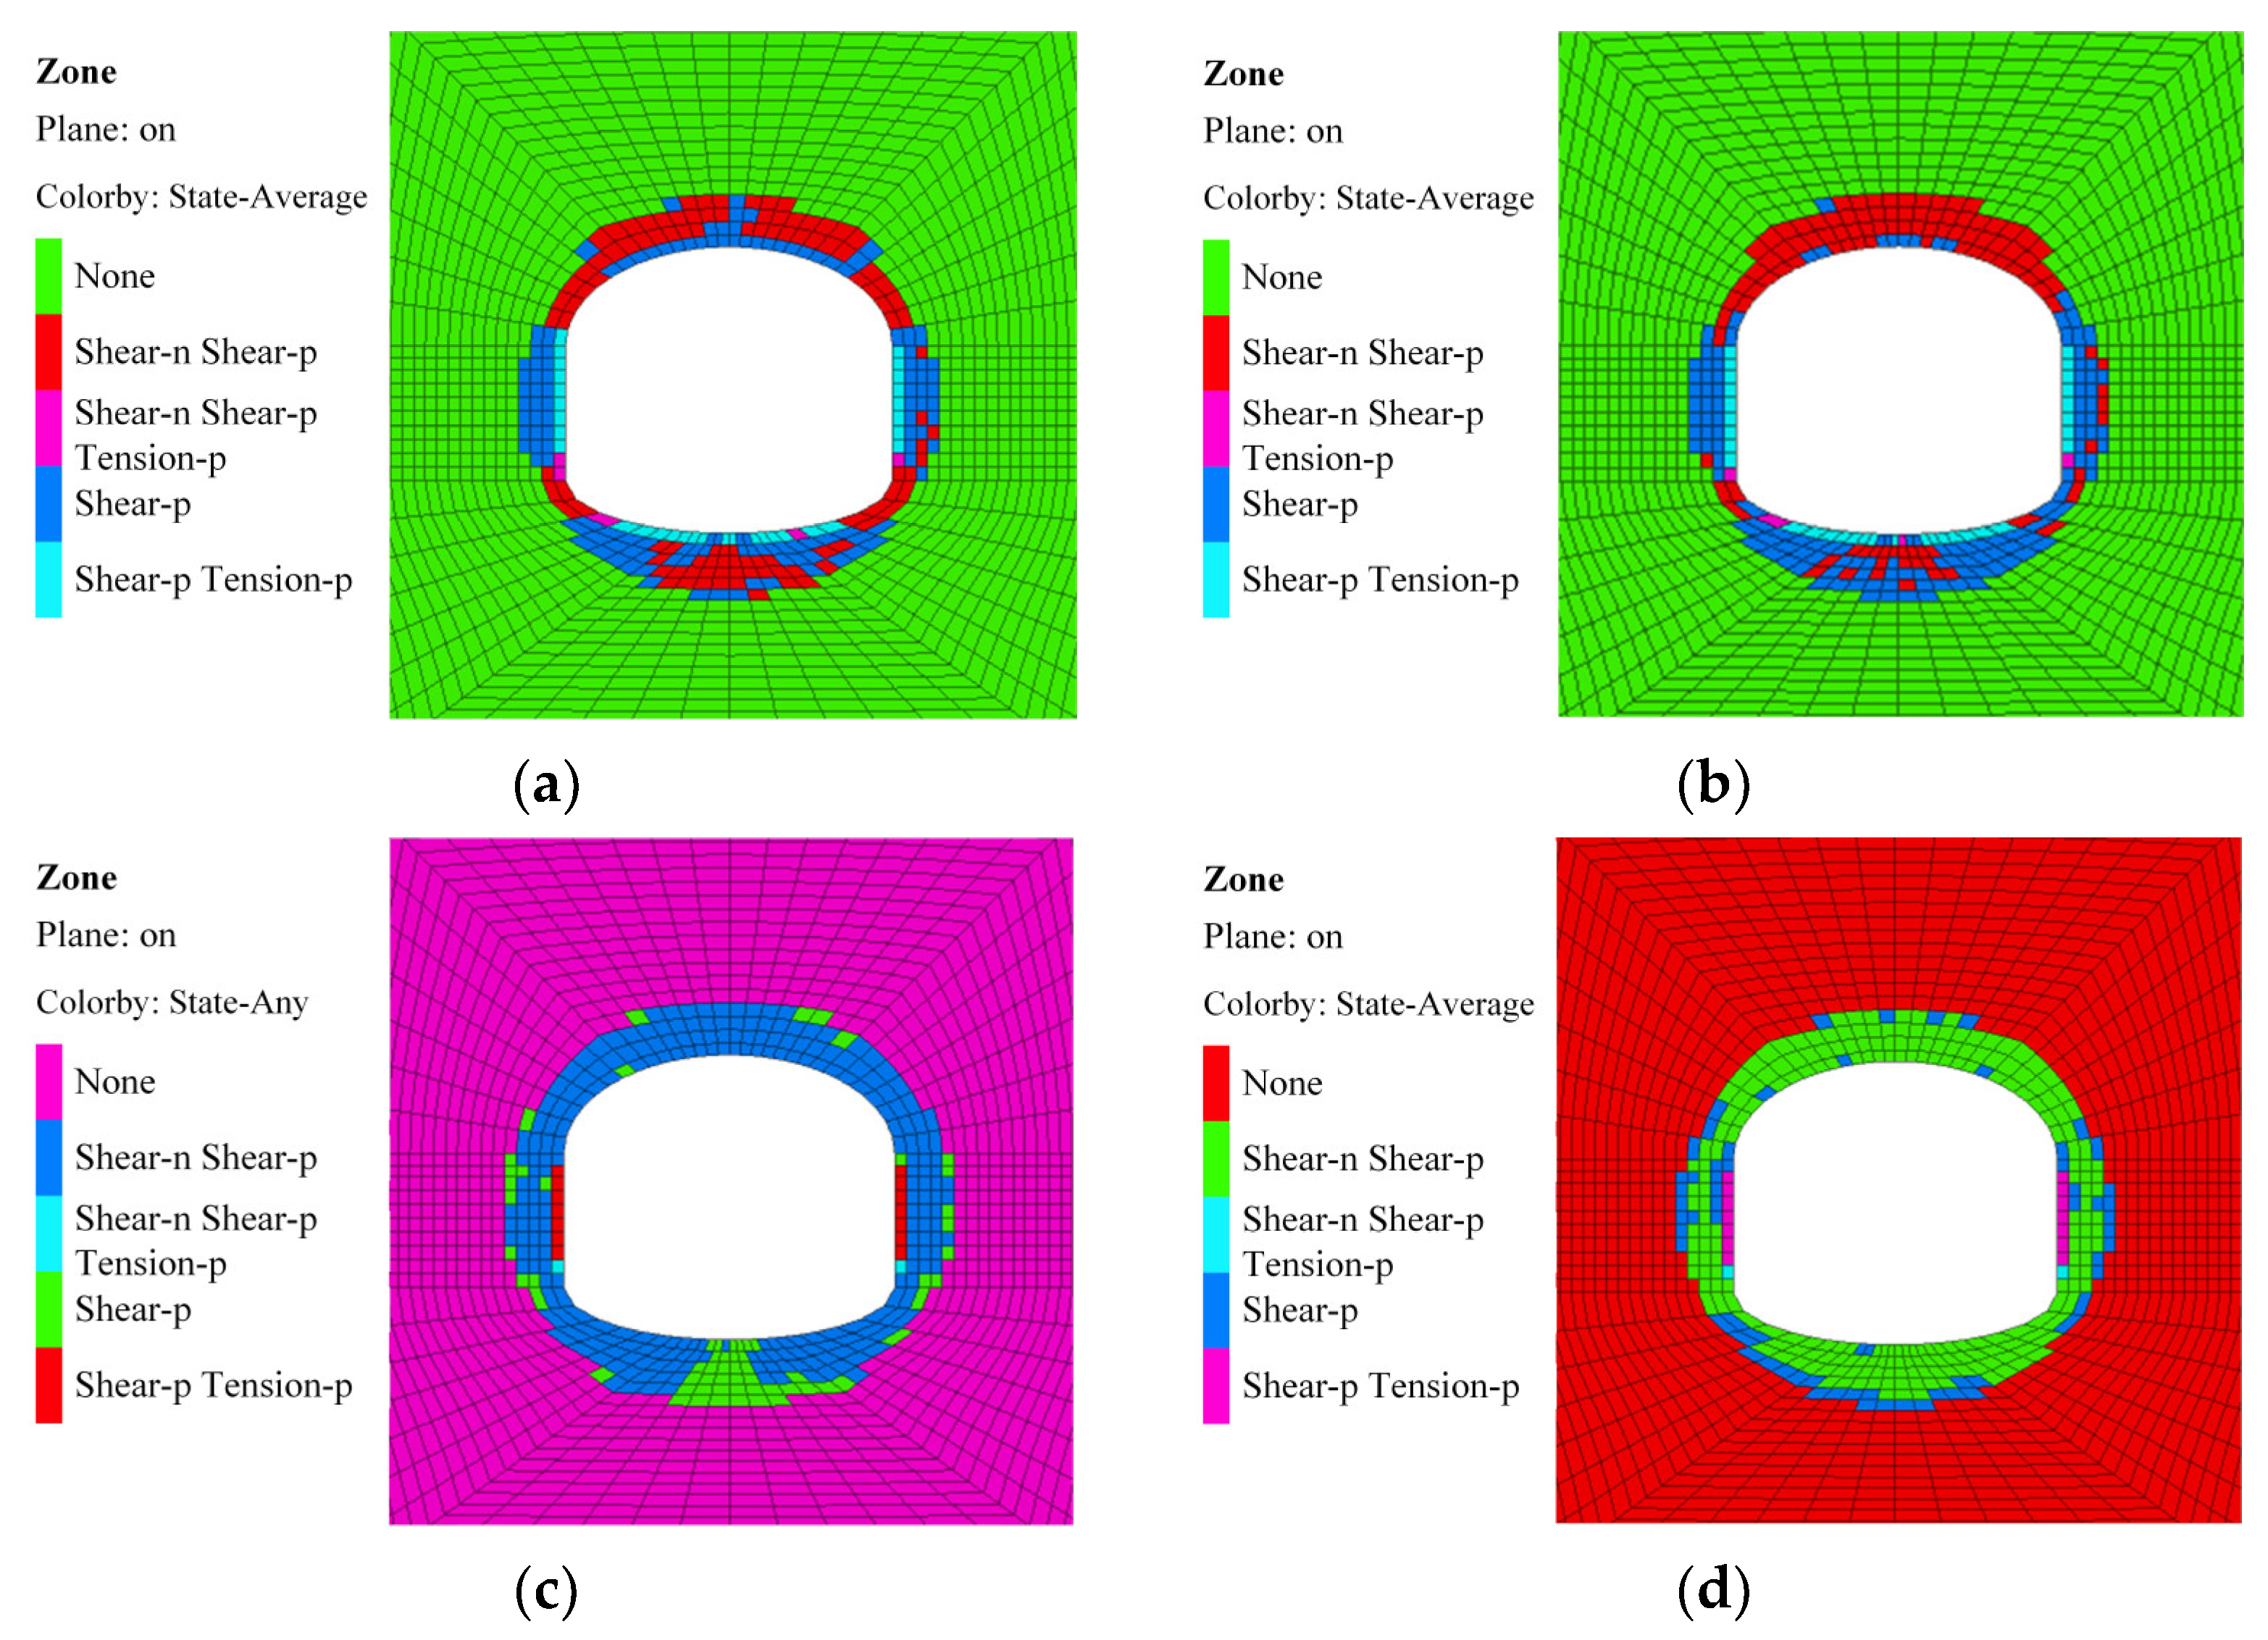
  • There was a direct relationship between the distribution area of the plastic zone and the temperature of the surrounding rock. The higher the original rock temperature, the greater the depth of the plastic zone. The types of plastic zones in the surrounding rock were mainly characterized by shear stress-induced yielding and tensile stress-induced damage failure. When the original rock temperature increased from 30 °C to 90 °C, the rock mass extending up to 1.5 m from the excavation contour surface formed a large area of damage zone, and the plastic zone changed from sporadic distribution on the contour surface of the cavern to the gradual convergence to form a large-scale plastic zone, and the area of the plastic zone increased obviously.
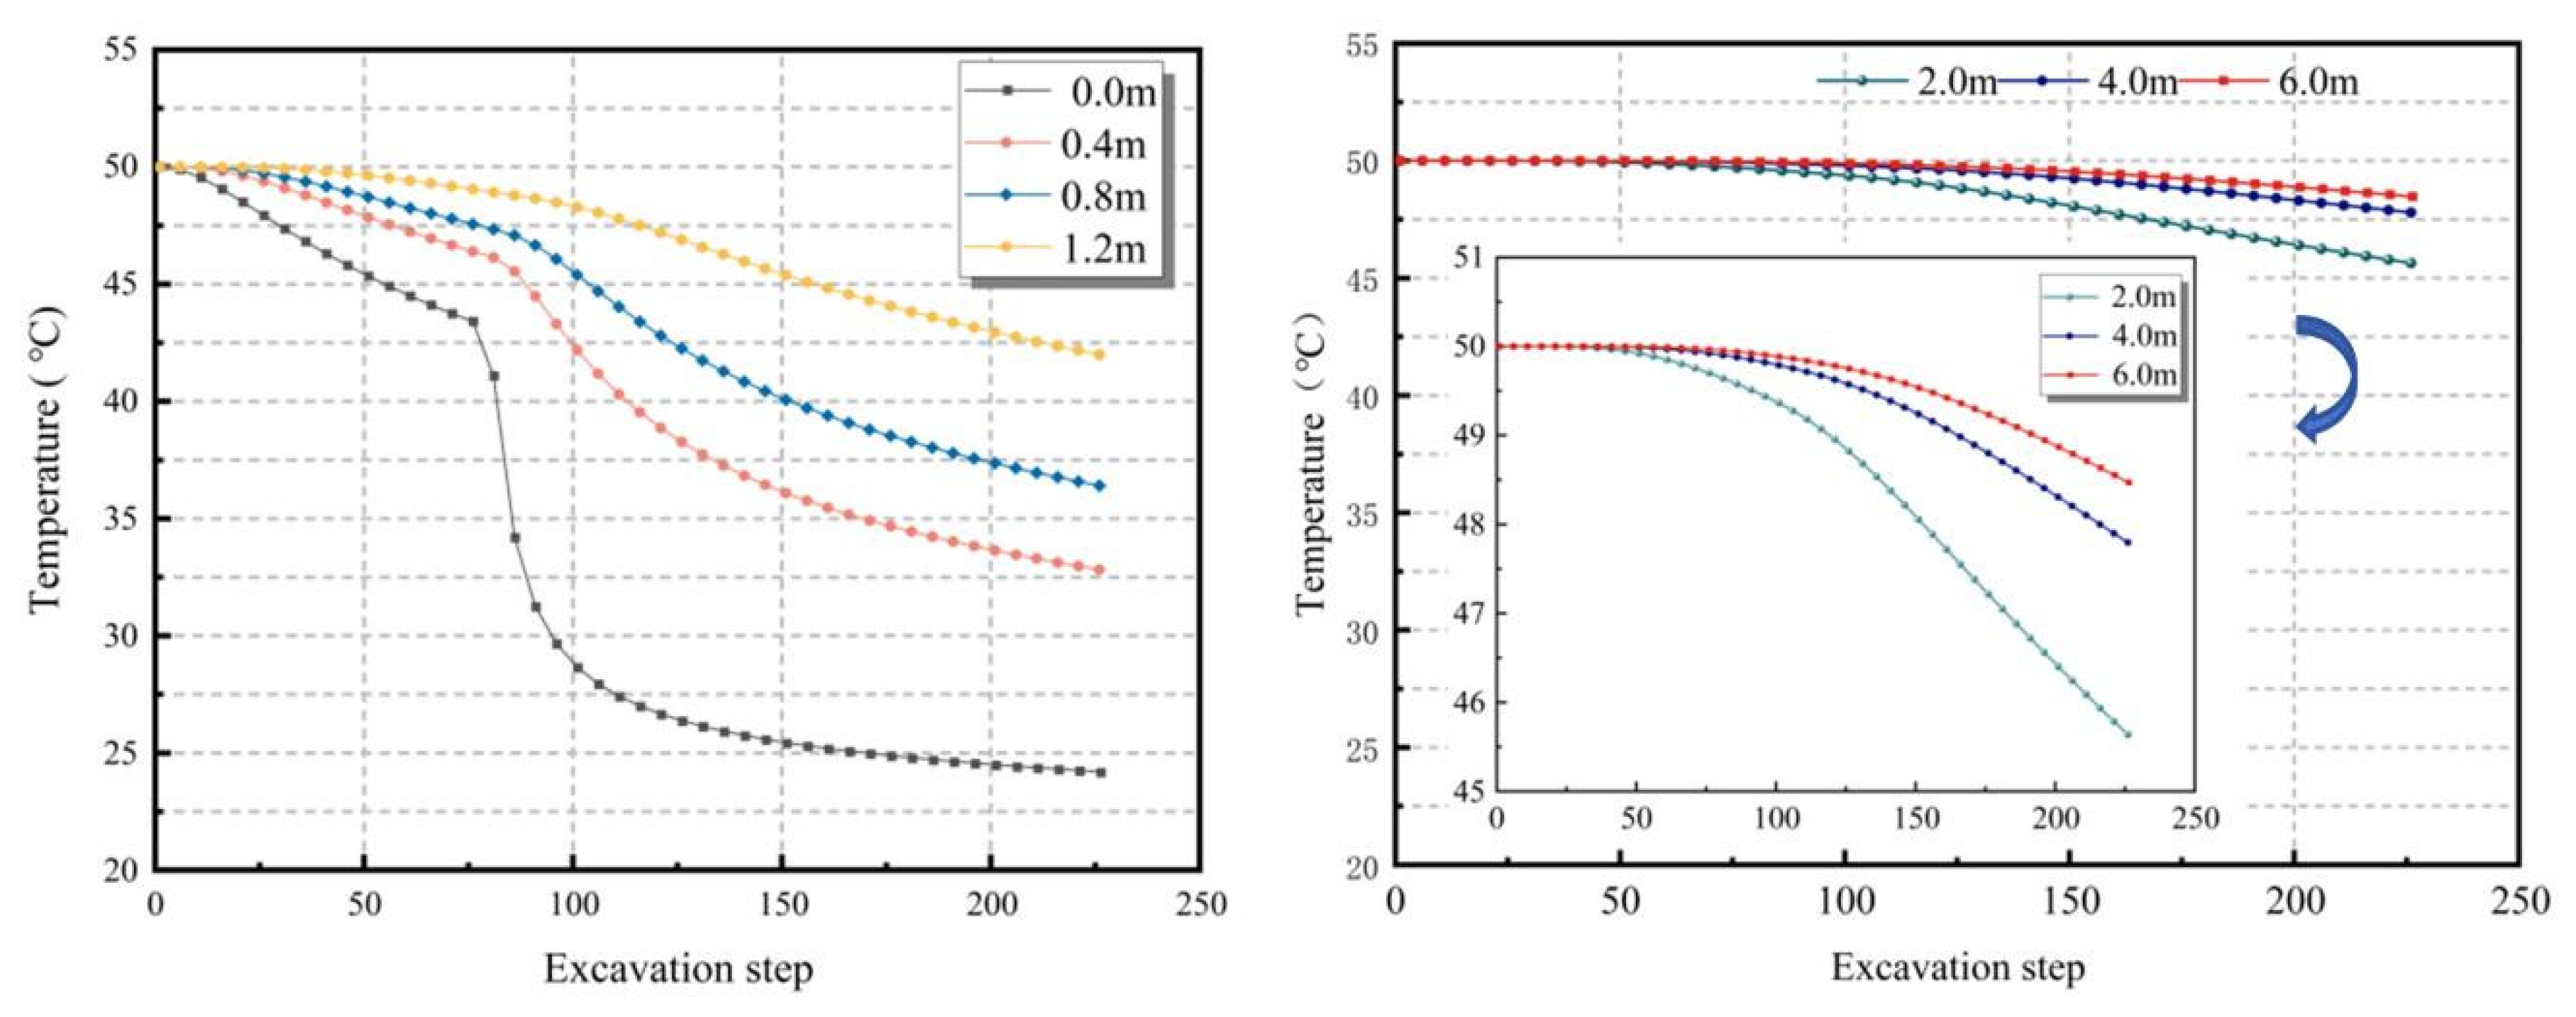
  • During the continuous excavation of deep underground engineering, the thermostat ring diffused to the depth in a ring centered on the middle of the cavern. The closer the working face was to the monitoring section, the faster the temperature dropped at the monitoring surface and the greater the displacement change. When the working face advanced to the monitoring section, the speed of the monitoring section temperature decreased the fastest, and the displacement changed the most. When the excavation continued to the rear of the monitoring section, the temperature continued to decline, and the deformation continued to increase, but the rate of change decreased significantly.

Author Contributions

Conceptualization, J.G. and X.D.; Methodology, H.S., J.G., and X.D.; Software, X.D., Y.Q. and L.C.; Validation, J.G. and Y.Q.; Formal Analysis, L.C.; Investigation, H.S. and J.G.; Resources, J.G., H.S. and L.C.; Data Curation, X.D.; Writing—Original Draft Preparation, H.S., J.G. and X.D.; Writing—Review and Editing, Y.Q., X.D. and J.G.; Visualization, Y.Q. and L.C.; Supervision, J.G. and Y.Q.; Project Administration, H.S. All authors have read and agreed to the published version of the manuscript.

Funding

This study was supported by the National Natural Science Foundation of China (Grant No. 52178388) and the Enterprise Commissioned Topic (Grant Nos. JG013, H21-134).

Data Availability Statement

The data that support the findings of this study are available from the corresponding author upon reasonable request.

Acknowledgments

The authors are very grateful to the teachers for their help, the financial support of the funding agencies, and the reviewers for their valuable comments and suggestions to improve the quality of this paper.

Conflicts of Interest

Author Hongbin Shi was employed by the company China Railway Fifth Survey and Design Institute Group Co., Ltd. Author Yanbo Qing was employed by the company Henan First Geological and Mineral Investigation Institute Co., Ltd. The remaining authors declare that the research was conducted in the absence of any commercial or financial relationships that could be construed as a potential conflict of interest.

References

  1. Schaumann, M.; Gamba, D.; Morales, H.G.; Corsini, R.; Guinchard, M.; Scislo, L.; Wenninger, J. The effect of ground motion on the LHC and HL-LHC beam orbit. Nucl. Instrum. Methods Phys. Res. Sect. A 2023, 1055, 168495. [Google Scholar] [CrossRef]
  2. Cai, Y.F.; Jin, Y.T.; Wang, Z.Y.; Chen, T.; Wang, Y.R.; Kong, W.Y.; Xiao, W.; Li, X.J.; Lian, X.G.; Hu, H.F. A review of monitoring, calculation, and simulation methods for ground subsidence induced by coal mining. Int. J. Coal Sci. Technol. 2023, 10, 32. [Google Scholar] [CrossRef]
  3. Zhao, Y.X.; Zhang, K.N.; Ling, C.W.; Guo, J.H.; Sun, B. A novel method combining strata movement and UAV infrared remote sensing technology to evaluate mining ground damage. Int. J. Coal Sci. Technol. 2024, 11, 83. [Google Scholar] [CrossRef]
  4. Łacny, Ł.; Ścisło, Ł.; Guinchard, M. Application of probabilistic power spectral density technique to monitoring the long-term vibrational behaviour of CERN seismic network stations. Vib. Phys. Syst. 2020, 31, 2020311. [Google Scholar]
  5. Liu, C.; Liu, Y.H.; Chen, Y.H.; Zhao, C.J.; Qiu, J.L.; Wu, D.Y.; Liu, T.; Fan, H.B.; Qin, Y.W.; Tang, K.J. A State-of-the-Practice Review of Three-Dimensional Laser Scanning Technology for Tunnel Distress Monitoring. J. Perform. Constr. Fac. 2023, 37, 03123001. [Google Scholar] [CrossRef]
  6. Barla, G. Full-face excavation of large tunnels in difficult conditions. J. Rock Mech. Geotech. Eng. 2016, 8, 294–303. [Google Scholar] [CrossRef]
  7. Panda, M.K.; Mohanty, S.; Pingua, B.M.P.; Mishra, A.K. Engineering geological and geotechnical investigations along the head race tunnel in Teesta Stage-III hydroelectric project, India. Eng. Geol. 2014, 181, 297–308. [Google Scholar] [CrossRef]
  8. Guo, X.S.; Fan, N.; Liu, Y.H.; Liu, X.L.; Wang, Z.K.; Xie, X.T.; Jia, Y.G. Deep seabed mining: Frontiers in engineering geology and environment. Int. J. Coal Sci. Technol. 2023, 10, 23. [Google Scholar] [CrossRef]
  9. Li, Y.T.; Gao, X.H. Assessment of variations in shear strain energy induced by fault coseismic slip in deep longwall mining. Int. J. Coal Sci. Technol. 2025, 12, 3. [Google Scholar] [CrossRef]
  10. Akdag, S.; Karakus, M.; Taheri, A.; Nguyen, G.; He, M.C. Effects of thermal damage on strain burst mechanism for brittle rocks under true-triaxial loading conditions. Rock Mech. Rock Eng. 2018, 51, 1657–1682. [Google Scholar] [CrossRef]
  11. Hu, Y.P.; Wang, M.N.; Wang, Q.L.; Liu, D.G.; Tong, J.J. Field test of thermal environment and thermal adaptation of workers in high geothermal tunnel. Build. Environ. 2019, 160, 106174. [Google Scholar]
  12. Geisler, T.; Voit, K.; Burger, U.; Cordes, T.; Lehner, F.; Götzl, G.; Wolf, M.; Marcher, T. Geothermal Potential of the Brenner Base Tunnel-Initial Evaluations. Processes 2022, 10, 972. [Google Scholar] [CrossRef]
  13. Wen, T.; Hu, Z.; Wang, Y.K.; Zhang, Z.H.; Sun, Y.S. Monitoring and analysis of geotemperature during the tunnel construction. Energies 2020, 15, 736. [Google Scholar] [CrossRef]
  14. Yu, S.Y.; Ren, X.H.; Zhang, J.X.; Sun, Z.H. Numerical simulation on the excavation damage of Jinping deep tunnels based on the SPH method. Geomech. Geophys. Geo-Energy Geo-Resour. 2023, 9, 1. [Google Scholar] [CrossRef]
  15. Yu, S.Y.; Yang, X.K.; Ren, X.H. Shear Damage simulations of rock masses containing fissure-holes using an improved SPH method. Materials 2023, 16, 2640. [Google Scholar] [CrossRef]
  16. Li, P.; Liu, Y.; Cai, M.F.; Miao, S.J.; Li, Y.; Wu, Y.F.; Gorjian, M. Contemporary stress state in the Zhao-Ping metallogenic belt, eastern China, and its correlation to regional geological tectonics. Int. J. Coal Sci. Technol. 2025, 12, 29. [Google Scholar] [CrossRef]
  17. Wang, S.Y.; Yu, S.Y.; Hu, X.Y.; Yang, B.K. Effects of folded fissure properties on tunnel model failure: Experiments and numerical simulations. Eng. Fract. Mech. 2024, 310, 110487. [Google Scholar] [CrossRef]
  18. Hu, X.Y.; Huang, S.B.; Yu, S.Y.; Li, Y.F.; Dong, J.G. Investigations on the fracture mechanisms of Z-shaped fissured rock-like specimens. Theor. Appl. Fract. Mech. 2024, 134, 104748. [Google Scholar] [CrossRef]
  19. Yan, F.Y.; Wang, E.Z.; Liu, X.L.; Qi, C.Z.; Jia, W. Experimental study on strain localization and slow deformation evolution in small-scale specimens. Int. J. Coal Sci. Technol. 2015, 12, 30. [Google Scholar] [CrossRef]
  20. Hu, X.Y.; Huang, S.B.; Yu, S.Y.; Li, Y.F.; Wang, X.Y. Study on the interaction mechanisms between the fissure arrays and circular tunnels by physical experiment and meshless numerical method. Theor. Appl. Fract. Mech. 2025, 138, 104935. [Google Scholar] [CrossRef]
  21. Yao, X.C.; Li, N.; Wang, K.C.; Lv, G.; He, M.M. Experimental and analytical study on mechanical properties of high rock temperature diversion tunnel. Adv. Civ. Eng. 2019, 2019, 9537153. [Google Scholar] [CrossRef]
  22. Xin, L.; Li, J.Z.; Niu, M.F.; Li, C.; Wu, J.; Wang, B.W.; Xu, W.H.; Feng, M.Z.; Ma, Y. Numerical simulation of thermo-solid coupling under the condition of unidirectional heating of underground coal gasification overlying rock. Asia-Pac. J. Chem. Eng. 2023, 18, e2890. [Google Scholar] [CrossRef]
  23. Wu, Z.H.; Song, H.L.; Li, L.P.; Zhou, Z.Q.; Zou, Y.J.; Sun, W.J.B.; Liu, H.; Lou, Y.L. Study on the damage evolution process and fractal of quartz-filled shale under thermal-mechanical coupling. Geofluids 2021, 2021, 8843120. [Google Scholar] [CrossRef]
  24. Mo, Z.G.; Jiang, H.B.; Hou, X.B. Three-dimensional numerical simulation analysis of temperature field in high ground temperature tunnel. Water Resour. Hydropower Eng. 2017, 48, 57–62. [Google Scholar]
  25. Meng, W.; He, C.; Zhang, J.B. Inversion analysis of initial ground stress field of rock mass under high ground temperature and high ground stress. Chin. J. Rock Mech. Eng. 2020, 39, 749–760. [Google Scholar]
  26. Birch, F. Flow of heat in the front range, colorado. Geol. Soc. Am. Bull. 1950, 61, 567–630. [Google Scholar] [CrossRef]
  27. Shao, Z.S.; Qiao, R.J.; Wang, X.Y. Elastic theoretical solution of temperature and thermal stress field in high ground temperature tunnel. Rock Soil Mech. 2013, 34, 1–8. [Google Scholar]
  28. Che, J.G.; Li, A.G.; Guo, J.N.; Ma, Y.Q.; Li, J.X.; Yang, C.Q.; Che, L.F. Theoretical and experimental investigation on the thermal penetration depth in the surrounding rock of a deeply buried high-temperature tunnel. Int. J. Therm. Sci. 2024, 198, 108876. [Google Scholar] [CrossRef]
  29. Yin, Y.C.; Jiang, H.B.; Zhang, J.; Lu, G.D.; Li, Q.L. The influence of rock thermal stress on the morphology and expansion pattern of the plastic zone in the surrounding rock of a deep-buried tunnel under high geothermal temperature conditions. Appl. Sci. 2024, 14, 7589. [Google Scholar] [CrossRef]
  30. Zhu, Y.M.; Chen, S.G. Research on temperature field monitoring and construction cooling technology of high geothermal tunnel. Subgrade Eng. 2019, 3, 115–119. [Google Scholar]
  31. Li, T.B.; Pan, H.R.; Chen, G.Q.; Meng, L.B. Physical model test of temperature effect of tunnel rockburst under thermal-mechanical effect. Chin. J. Rock Mech. Eng. 2018, 37, 261–273. [Google Scholar]
  32. Sun, S.B.; Yan, S.H.; Cao, X.P.; Zhang, W. Distribution law of the Initial temperature field in a railway tunnel with high rock temperature: A model test and numerical analysis. Appl. Sci. 2023, 13, 1638. [Google Scholar] [CrossRef]
  33. Yu, S.Y.; Huang, S.B.; Li, Y.F.; Liang, Z.L. Insights into the frost cracking mechanisms of concrete by using the coupled thermo-hydro-mechanical-damage meshless method. Theor. Appl. Fract. Mech. 2025, 136, 104814. [Google Scholar] [CrossRef]
  34. Li, K.B.; Jiang, H.B.; Wei, G.; Xiang, P.F. Evolution characteristics of plastic zone in jointed rock mass of high-temperature hydraulic tunnel. Appl. Sci. 2023, 13, 11005. [Google Scholar] [CrossRef]
  35. Xu, D.; Zhang, B.W.; Ai, Z.B.; Bo, X.B.; Pan, H.B.; Chen, S.J. Spatial-temporal evolution principle of temperature field in a high-temperature geothermal highway tunnel. Ain Shams Eng. J. 2023, 14, 101965. [Google Scholar] [CrossRef]
  36. Li, J.B.; Meng, S.W.; Wang, S.L.; Liu, H.; Dong, K.X.; Lu, Q.Y. The propagation mechanism of elastoplastic hydraulic fracture in deep reservoir. Int. J. Coal Sci. Technol. 2025, 12, 21. [Google Scholar] [CrossRef]
  37. Yu, S.Y.; Ren, X.H.; Zhang, J.X. Using an improved SPH algorithm to simulate thermo-hydro-mechanical-damage coupling problems in rock masses. Case Stud. Therm. Eng. 2023, 47, 103085. [Google Scholar] [CrossRef]
  38. Jia, S.P.; Wu, B.; Chen, W.Z.; Wu, G.J.; Gao, M.; Gong, J. Stability analysis of surrounding rock of deep buried tunnel under thermal-stress-damage coupling effect. Rock Soil Mech. 2014, 35, 2375–2384. [Google Scholar]
  39. Jiang, C. Research on the Design Method of Primary Support Structure of High Ground Temperature Tunnel Based on Thermal-Mechanical Coupling Effect. Doctoral Dissertation, Southwest Jiaotong University, Chengdu, China, 2022. Available online: https://kns.cnki.net/kcms2/article/abstract?v=N5Mfx_KcSpIUQeAZs30uWaPu7S8WsvPFyKOf9e0odwrpXTRXr7EFWC4_JrlZhv5r9T0g_lUSzhSdehrG6VlHdwTJvFDA83l1p6xlsxikQA81jLnzAGj52eCrWbDgdEkdk3pnpNqdg1y6AlZg2Sv5OWpor8vCLzidC0aP4VxvdBc=&uniplatform=NZKPT (accessed on 25 March 2025).
  40. Zhao, M.; Guo, J.Q.; Li, S.H.; Liang, S.F.; Sun, F.Y. Stability analysis of surrounding rock and initial support of tunnel undercrossing multi-situational goafs: A reference of construction guidance. Appl. Sci. 2024, 14, 7412. [Google Scholar] [CrossRef]
  41. Cui, G.Y.; Wei, Y.F.; Xiong, Y.; Wang, D.Y.; Tian, X.L. Study on the ambient temperature control technology for construction of a tunnel near heat-conducting fault and with high rock temperature. Mod. Tunn. Technol. 2023, 60, 246–254. [Google Scholar]
  42. Yan, J.; He, C.; Wang, B.; Xu, G.; Wu, F.Y. Study on the characteristics and mechanism of rock burst in high geothermal and high stress tunnel. J. China Rallway Soc. 2020, 42, 186–194. [Google Scholar]
Figure 1. Some deep-buried tunnels with high rock temperature in China and the disaster caused by high rock temperature. (a) Tunnel situation; (b) Disaster situation.
Buildings 15 01500 g001
Figure 2. Thermal-solid coupling based on finite difference method.
Buildings 15 01500 g002
Figure 3. Numerical analysis flow of thermal-solid coupling based on finite difference method.
Buildings 15 01500 g003
Figure 4. Numerical model and detection point arrangement: (a) model size; (b) excavation; (c) arrangement of monitoring points.
Buildings 15 01500 g004
Figure 5. Temperature field of surrounding rock under different original rock temperature conditions (unit: °C): (a) T = 30 °C, temperature field; (b) T = 50 °C, temperature field; (c) T = 70 °C, temperature field; (d) T = 90 °C, temperature field; (e) radial distance from contour surface.
Buildings 15 01500 g005
Figure 6. Surrounding rock deformation of deep underground engineering under different original rock temperatures (unit: m). (a) T = 30 °C, vertical displacement; (b) T = 50 °C, vertical displacement; (c) T = 70 °C, vertical displacement; (d) T = 90 °C, vertical displacement; (e) T = 30 °C, horizontal displacement; (f) T = 50 °C, horizontal displacement; (g) T = 70 °C, horizontal displacement; (h) T = 90 °C, horizontal displacement.
Buildings 15 01500 g006
Figure 7. Displacements of different parts at different original rock temperatures: (a) vertical displacement; (b) horizontal displacement.
Buildings 15 01500 g007
Figure 8. The principal stress nephogram of surrounding rock under different original rock temperature (unit: Pa): (a) T = 30 °C, maximum principal stress; (b) T = 50 °C, maximum principal stress; (c) T = 70 °C, maximum principal stress; (d) T = 90 °C, maximum principal stress; (e) T = 30 °C, minimum principal stress; (f) T = 50 °C, minimum principal stress; (g) T = 70 °C, minimum principal stress; (h) T = 90 °C, minimum principal stress.
Buildings 15 01500 g008
Figure 9. Distribution of plastic zone of surrounding rock at different original rock temperatures: (a) T = 30 °C, plastic zone; (b) T = 50 °C, plastic zone; (c) T = 70 °C, plastic zone; (d) T = 90 °C, plastic zone.
Buildings 15 01500 g009
Figure 10. The temperature field distribution nephogram of surrounding rock during continuous excavation (°C): (a) excavation to 2 m, temperature field; (b) excavation to 4 m, temperature field; (c) excavation to 6 m, temperature field.
Buildings 15 01500 g010
Figure 11. The variation patterns of temperature at different depths above the vault with the excavation step.
Buildings 15 01500 g011
Figure 12. The displacement field nephogram of surrounding rock during continuous excavation (m): (a) excavating to 2 m, vertical displacement; (b) excavating to 4 m, vertical displacement; (c) excavating to 6 m, vertical displacement; (d) horizontal displacement when excavated to 2 m; (e) horizontal displacement when excavation to 4 m; (f) horizontal displacement when excavated to 6 m.
Buildings 15 01500 g012aBuildings 15 01500 g012b
Figure 13. Displacement time history curve: (a) vertical displacement time history curve of vault and arch bottom; (b) horizontal displacement time history curves of side wall, spandrel, and skewback.
Buildings 15 01500 g013
Table 1. Physical and mechanical parameters of surrounding rock.
Material TypeDensity (kg/m3)Shear Modulus (GPa)Bulk Modulus (GPa)Cohesive Force (MPa)Angle of Internal Friction
(°)
Thermal Conductivity (W/(m·°C))Specific Heat
J/(kg·°C)
Coefficient of Linear Thermal Expansion
(1/°C)
Surrounding rock25003.365.387.824.52.788401 × 10−5
initial spray200012.620.7——————
Table 2. Concerned parameters of rock bolt and slurry.
Elastic Modulus (GPa)Tensile Strength (N/mm2)Slurry Cohesion (MPa)Cement Slurry Stiffness (GPa)Friction Angle of Slurry
(°)
Outer Perimeter of Cement Slurry (m)Cross-Section (m2)
2004000.80.7301.01.52 × 10−3
Table 3. Numerical simulation scheme.
°Cm
1: Different original rock temperature 1-1306
1-2506
1-3706
1-4906
2: Different excavation processes2-1502
2-2504
2-3506
Disclaimer/Publisher’s Note: The statements, opinions and data contained in all publications are solely those of the individual author(s) and contributor(s) and not of MDPI and/or the editor(s). MDPI and/or the editor(s) disclaim responsibility for any injury to people or property resulting from any ideas, methods, instructions or products referred to in the content.

