Article

Analysis of Pile–Soil Interaction Mechanisms for Wind Turbine Tower Foundations in Collapsible Loess Under Multi-Hazard Coupled Loading

1
School of Civil Engineering, Chang’an University, Xi’an 710064, China
2
China Anneng Group Science Industry Co., Ltd., Beijing 102627, China
*
Author to whom correspondence should be addressed.
Buildings 2025, 15(13), 2152; https://doi.org/10.3390/buildings15132152
Submission received: 16 May 2025 / Revised: 18 June 2025 / Accepted: 18 June 2025 / Published: 20 June 2025

Abstract

This study investigates the stability of high-rise wind turbine tower foundations in collapsible loess regions through finite element analysis. The mechanisms by which wind load, extreme rainfall load, and seismic load interact during the dynamic response of a pile foundation under single-action and intercoupling conditions are analyzed. A comprehensive multi-parameter analytical model is developed to evaluate pile foundation stability, incorporating key indicators including pile skin friction, average axial stress of pile groups, horizontal displacement at pile tops, and pile inclination. The results show that, among single-load conditions, seismic loading has the most pronounced impact on foundation stability. The peak horizontal displacement at the pile top induced by seismic loads reaches 10.07 mm, substantially exceeding the effects of wind and rainfall loads, posing a direct threat to wind turbine tower safety. Under coupled loading conditions, notable nonlinear interaction effects emerge. Wind–earthquake coupled loading amplifies horizontal displacement by 1.85 times compared to single seismic loading. Rainfall–earthquake coupled loading reduces the peak of positive skin friction by 20.17%. Notably, all seismic-involved loading combinations significantly compromise the pile foundation safety margin. The seismic load is the dominant influencing factor in various loading conditions, and its coupling with other loads induces nonlinear superposition effects. These findings provide critical insights for wind turbine foundation design in collapsible loess areas and strongly support the need for enhanced seismic considerations in engineering practice.

1. Introduction

In recent years, wind power construction in collapsible loess regions (wet-collapsible loess) of Northwest China has expanded significantly. However, the distinct geological characteristics of loess foundations make them susceptible to significant wet-induced collapsible deformation, while the bearing capacity can be drastically reduced by earthquake-induced soil liquefaction. These issues frequently result in foundation failure. To enhance the operational stability of wind turbine towers, it is essential to investigate the pile–soil interaction mechanisms for wind turbine tower foundations in collapsible loess under various loading conditions.
Northwest China is a wind energy-rich region, where wind intensity is generally high. Therefore, studying the pile–soil response mechanisms under wind loading is essential. Most studies primarily focused on pile–soil interaction under vertical loads, providing a basis for subsequent research on wind loading. For example, in Liu’s study [1], the load transfer mechanism of a single pile was revealed, which marked a significant breakthrough. This study confirmed that the core parameter of the load transfer function is pile displacement, not the relative pile–soil displacement or pile compression. The research also derived prediction formulas for pile skin friction and axial pile load by correcting misconceptions in traditional models. Building on this, many further studies have come out. Alsharedah et al. [2] explored the behavior of a single pile supporting a 5-MW wind turbine under a horizontal load using a nonlinear three-dimensional finite element model. It was found that pile performance was influenced by soil strength and the embedment depth-to-diameter ratio (L/D). The bending moment profile near failure load demonstrated flexible pile behavior even at low L/D ratios, challenging the traditional assumption of pile rigidity. Zuo et al. [3] investigated the dynamic response of offshore wind turbines in operation, with particular focus on soil-structure interaction effects on foundation fatigue performance. The research indicated that accounting for soil-structure interaction enables more accurate foundation fatigue life assessment. Liu et al. [4] investigated the effects of aerodynamic imbalance, induced by blade pitch angle errors (PAEs), on the fatigue performance of embedded steel ring (ESR) foundations for onshore wind turbines (WTs). The study demonstrated that aerodynamic imbalance accelerates foundation fatigue damage through amplified load amplitudes and stress fluctuations, providing critical theoretical support for the design, operation, maintenance, and standardization of onshore wind turbine foundations. Xia [5] separately examined dynamic and static wind load effects on transmission tower foundation stability, demonstrating that static wind load simulations can yield reliable stability analysis results.
Although Northwest China is typically arid, extreme rainfall events have occurred frequently in recent years [6,7,8]. Heavy rainfall-induced changes in soil moisture content, foundation softening, and erosion effects may further compromise wind turbine foundation stability. Therefore, many scholars have investigated pile foundation stability under rainfall loading. Early studies primarily focused on soil moisture variation on the static behavior of pile foundations. Later research has further clarified the seepage–stress coupling mechanisms. For instance, dynamic variations in matrix suction within unsaturated soils significantly alter pile–soil interface friction characteristics. Meanwhile, seepage forces caused by pore water pressure gradients accelerate pile-surrounding soil softening, potentially leading to progressive failure surfaces. Recently, research has mainly focused on multifield coupling numerical models to characterize the combined effects of rainfall intensity, duration, and soil permeability. For example, Zhen et al. [9] investigated the destructive effects of short-term extreme rainfall on loess slopes in Yan’an City, Shaanxi Province. Bian et al. [10] performed large-scale field experiments investigating the load-bearing characteristics of bridge pile foundations in collapsible loess areas under water-saturated conditions, along with preventive measures against negative skin friction. The results showed that water saturation induces collapsible deformation in loess, increasing negative skin friction on pile foundations and thereby reducing their load-bearing capacity. Tang et al. [11] analyzed rainfall-induced infiltration in collapsible loess and its impact on structural stability. Their study demonstrated that rainfall infiltration significantly increases the compressibility of loess, leading to surface subsidence and differential settlement, which in turn worsens structural stability risks.
In contrast to the gradual effects of rainfall infiltration, seismic loads are abrupt and characterized by high-intensity dynamic impacts. Northwest China, situated within a seismically active zone along the northeastern margin of the Qinghai-Tibet Plateau, has historically experienced numerous moderate-to-strong earthquakes. The horizontal inertial forces and foundation liquefaction risks induced by seismic motion may lead to sudden instability of wind turbine foundations, posing significantly greater destructive potential than static loading conditions. Numerous studies have investigated seismic loading scenarios in detail. For example, Alotta et al. [12] proposed a novel tuned inertial damper (TID) system for seismic response mitigation in onshore wind turbine towers. The results demonstrated that the TID can effectively reduce tower top displacement and acceleration, while simultaneously decreasing base shear forces and bending moments. Huang [13] investigated the dynamic response of a 10 MW reference wind turbine using a finite element model developed at the Technical University of Denmark under seismic loading conditions. The results revealed that foundation type significantly influences wind turbine response characteristics, and proper consideration of self-weight effects is essential for accurate dynamic response evaluation during seismic events.
In the context of soil–structure interaction modeling under complex geological and loading conditions, the Mohr–Coulomb (M–C) model has been widely employed in related studies. For instance, in research on pile–soil interaction in collapsible loess [14,15,16,17], the M–C model is utilized to represent the shear strength behavior of loess, which is critical for estimating pile skin friction. By accounting for the relationship between normal stress and shear stress along potential failure planes in the soil, the model provides a solid basis for understanding the mechanical response of soil around piles under various loading conditions. Although advanced constitutive models (e.g., the Barcelona Basic Model, BBM) offer more detailed characterizations, the appropriately calibrated M–C model [18,19] remains widely accepted in engineering applications. It effectively captures the essential strength and failure characteristics necessary for evaluating global stability and deformation behavior in such complex environments.
In conclusion, most existing studies primarily focus on pile–soil interaction mechanisms under individual loading conditions (Table 1, Line 1). However, it is essential to investigate the nonlinear effects of combined loading scenarios on the dynamic response of foundations during complex multi-hazard events such as wind, rainfall, and earthquakes. Therefore, in this study, the stability of wind turbine foundations under various coupled loads is analyzed using the finite element software ABAQUS 2023 (64-bit version). By comparing the numerical variations in key response parameters, such as horizontal displacement and axial stress at the pile top, the extent of coupled effects, including “rainfall-induced soil saturation accelerating seismic liquefaction” and “wind-induced loading exacerbating soil weakening”, can be quantitatively evaluated. This enables the identification of the disaster chain effect laws under multi-field coupling and the proposal of displacement-based safety thresholds. The findings of this research offer valuable technical support for engineering applications and disaster-resilient design in collapsible loess regions.

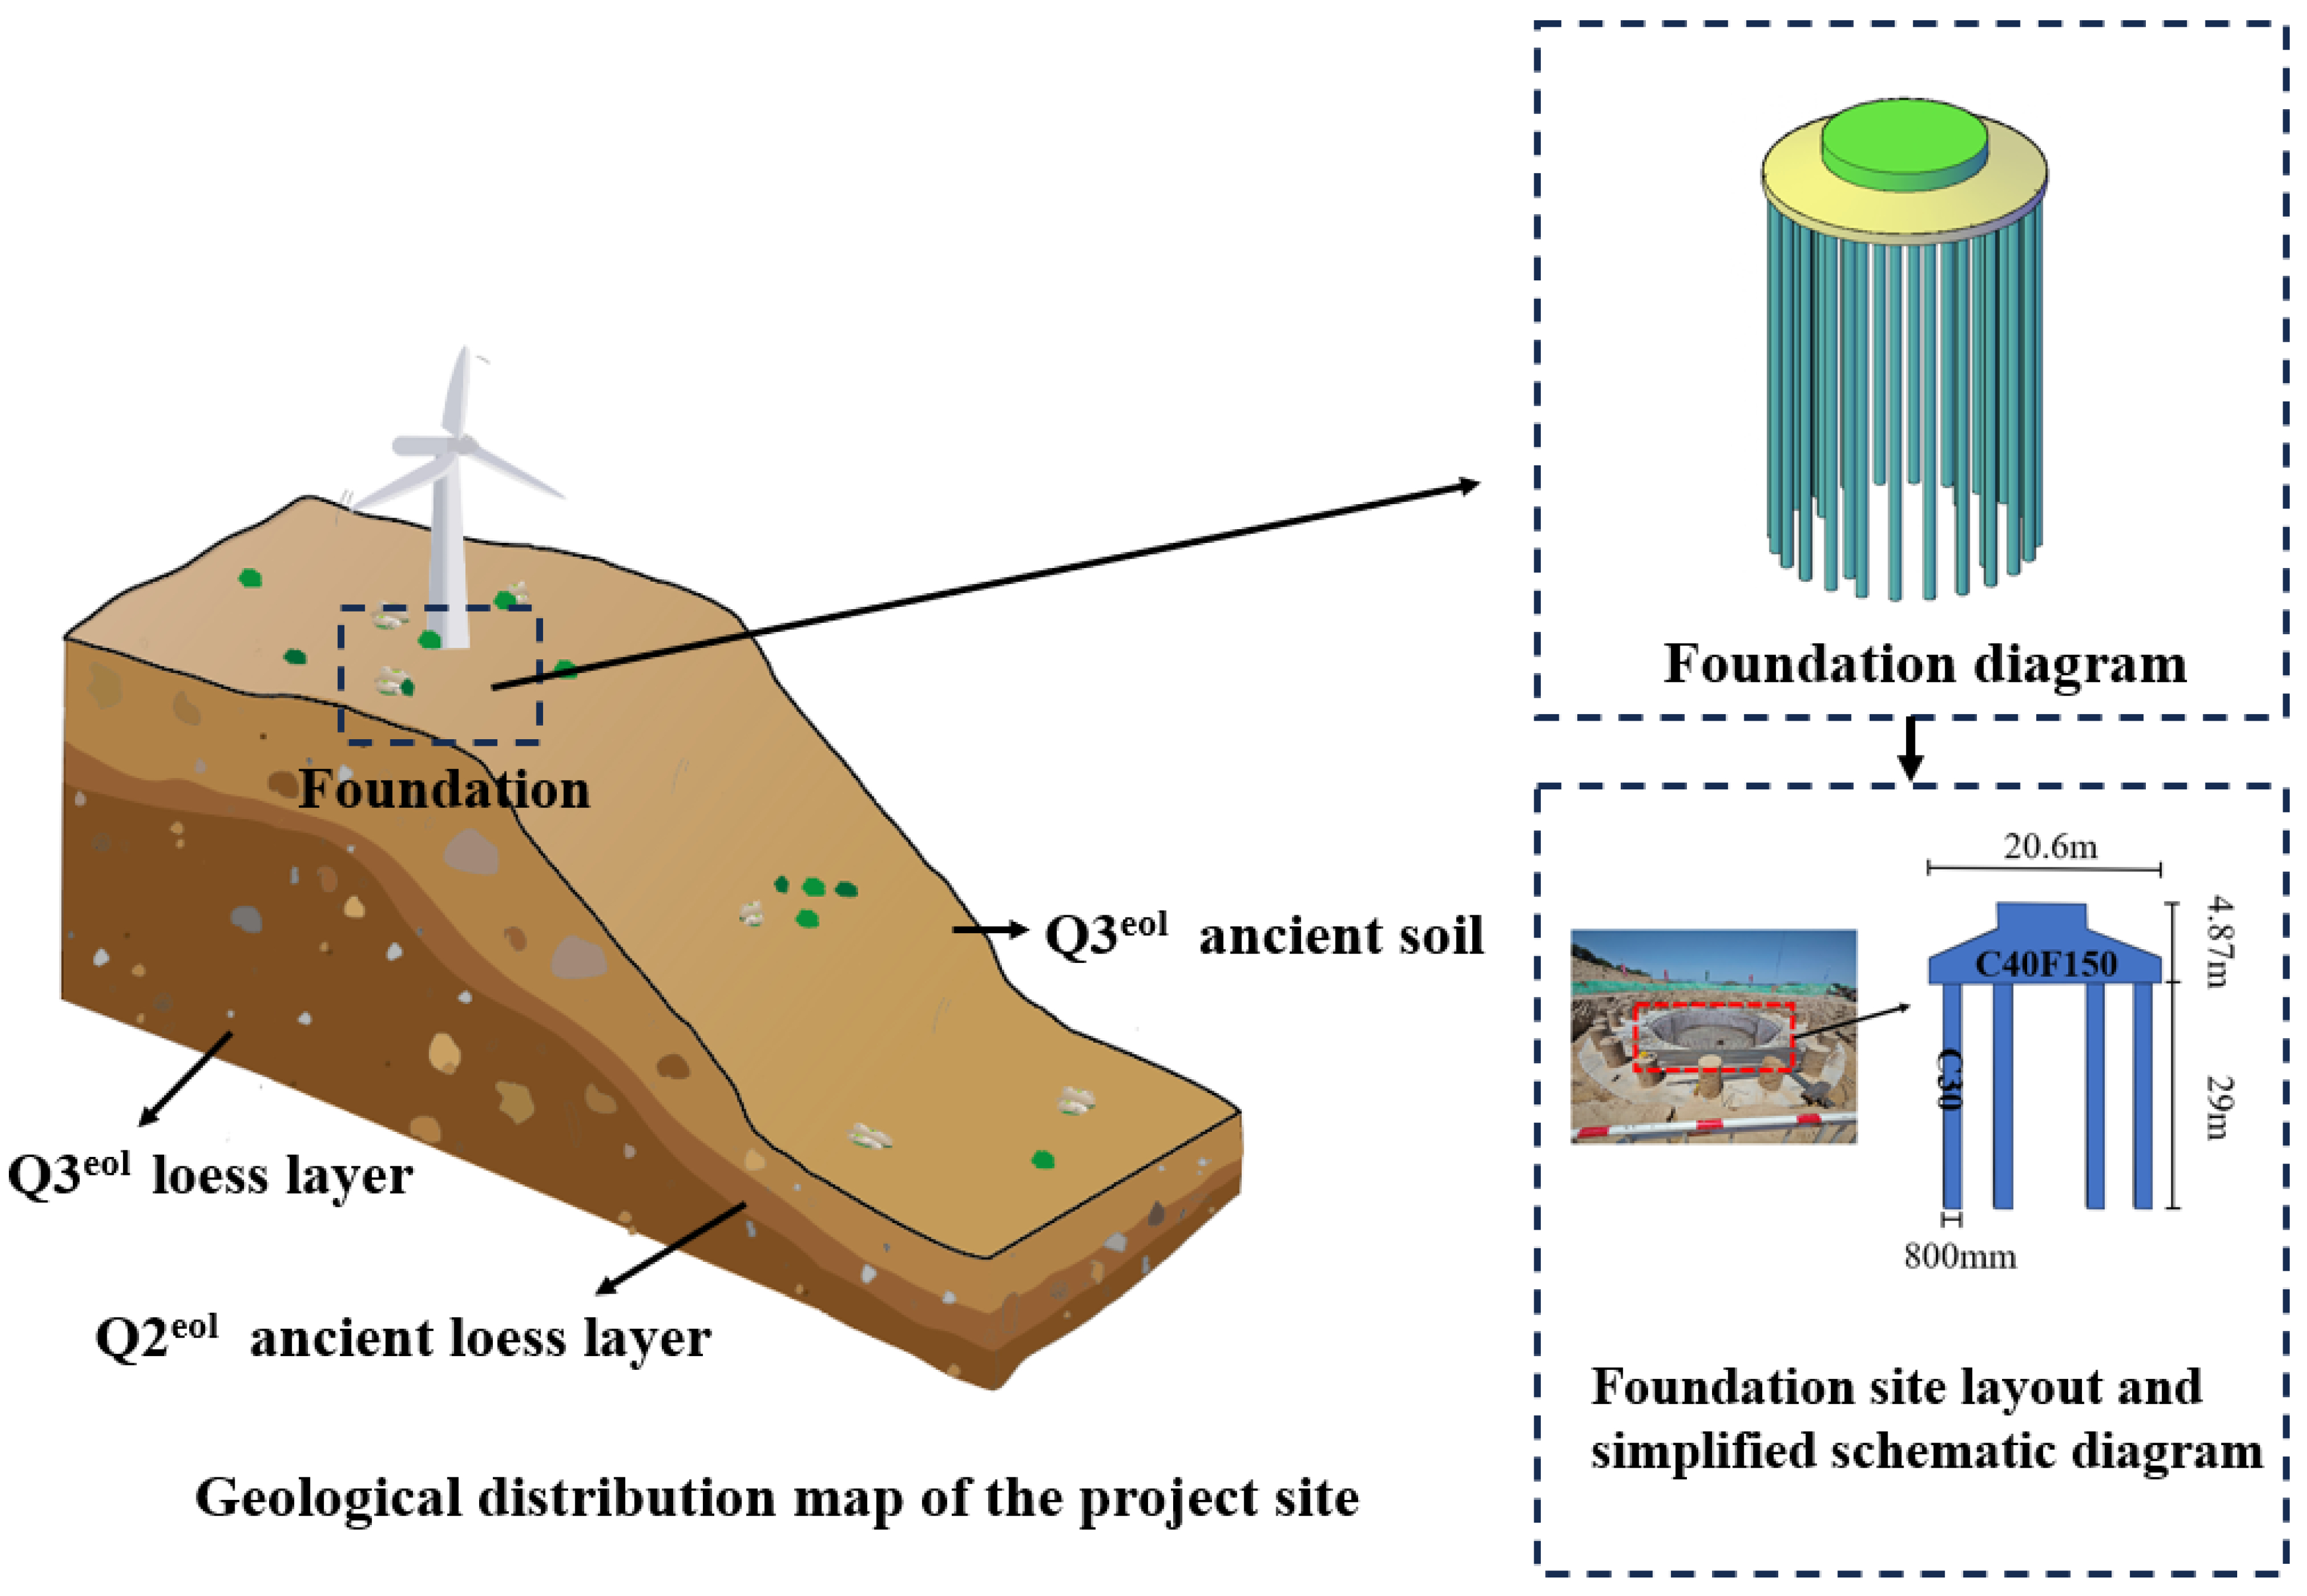
2. Engineering Background

This study focuses on a 100 MW wind power generation project located in Ansai, Shaan Xi Province. The wind farm covers approximately 101.6 km2 with a planned installed capacity of 20 × 5 MW units. The site is primarily characterized by loessal hilly terrain, with elevations ranging from 1350 to 1530 m above sea level. Field investigations reveal that slopes adjacent to wind turbine foundations exhibit gradients between 30° and 60°, with the majority measuring approximately 35°. The foundation-to-slope crest distance measures 20 m. Surface land cover primarily comprises farmland, wasteland, and forested areas. The geomorphological map of the study area is shown in Figure 1.
As shown in Figure 2 and Table 2, the subsurface stratigraphy of the site area primarily consists of Quaternary deposits, vertically stratified as follows from top to bottom: Late Pleistocene aeolian loess (Q3eol); Late Pleistocene aeolian paleosol (Q3eol); and Middle Pleistocene aeolian loess (Q2eol).
As shown in Figure 2, the project utilizes dry-construction cast-in-place concrete pile cap foundations for wind turbine support. The foundation specifications include: a pile diameter of 800 mm and a length of 29 m, using C30 grade concrete. The bearing platform of the pile group has a diameter of 20.6 m and an excavation depth of 4.87 m, constructed with C40F150 grade concrete.

3. Numerical Analysis

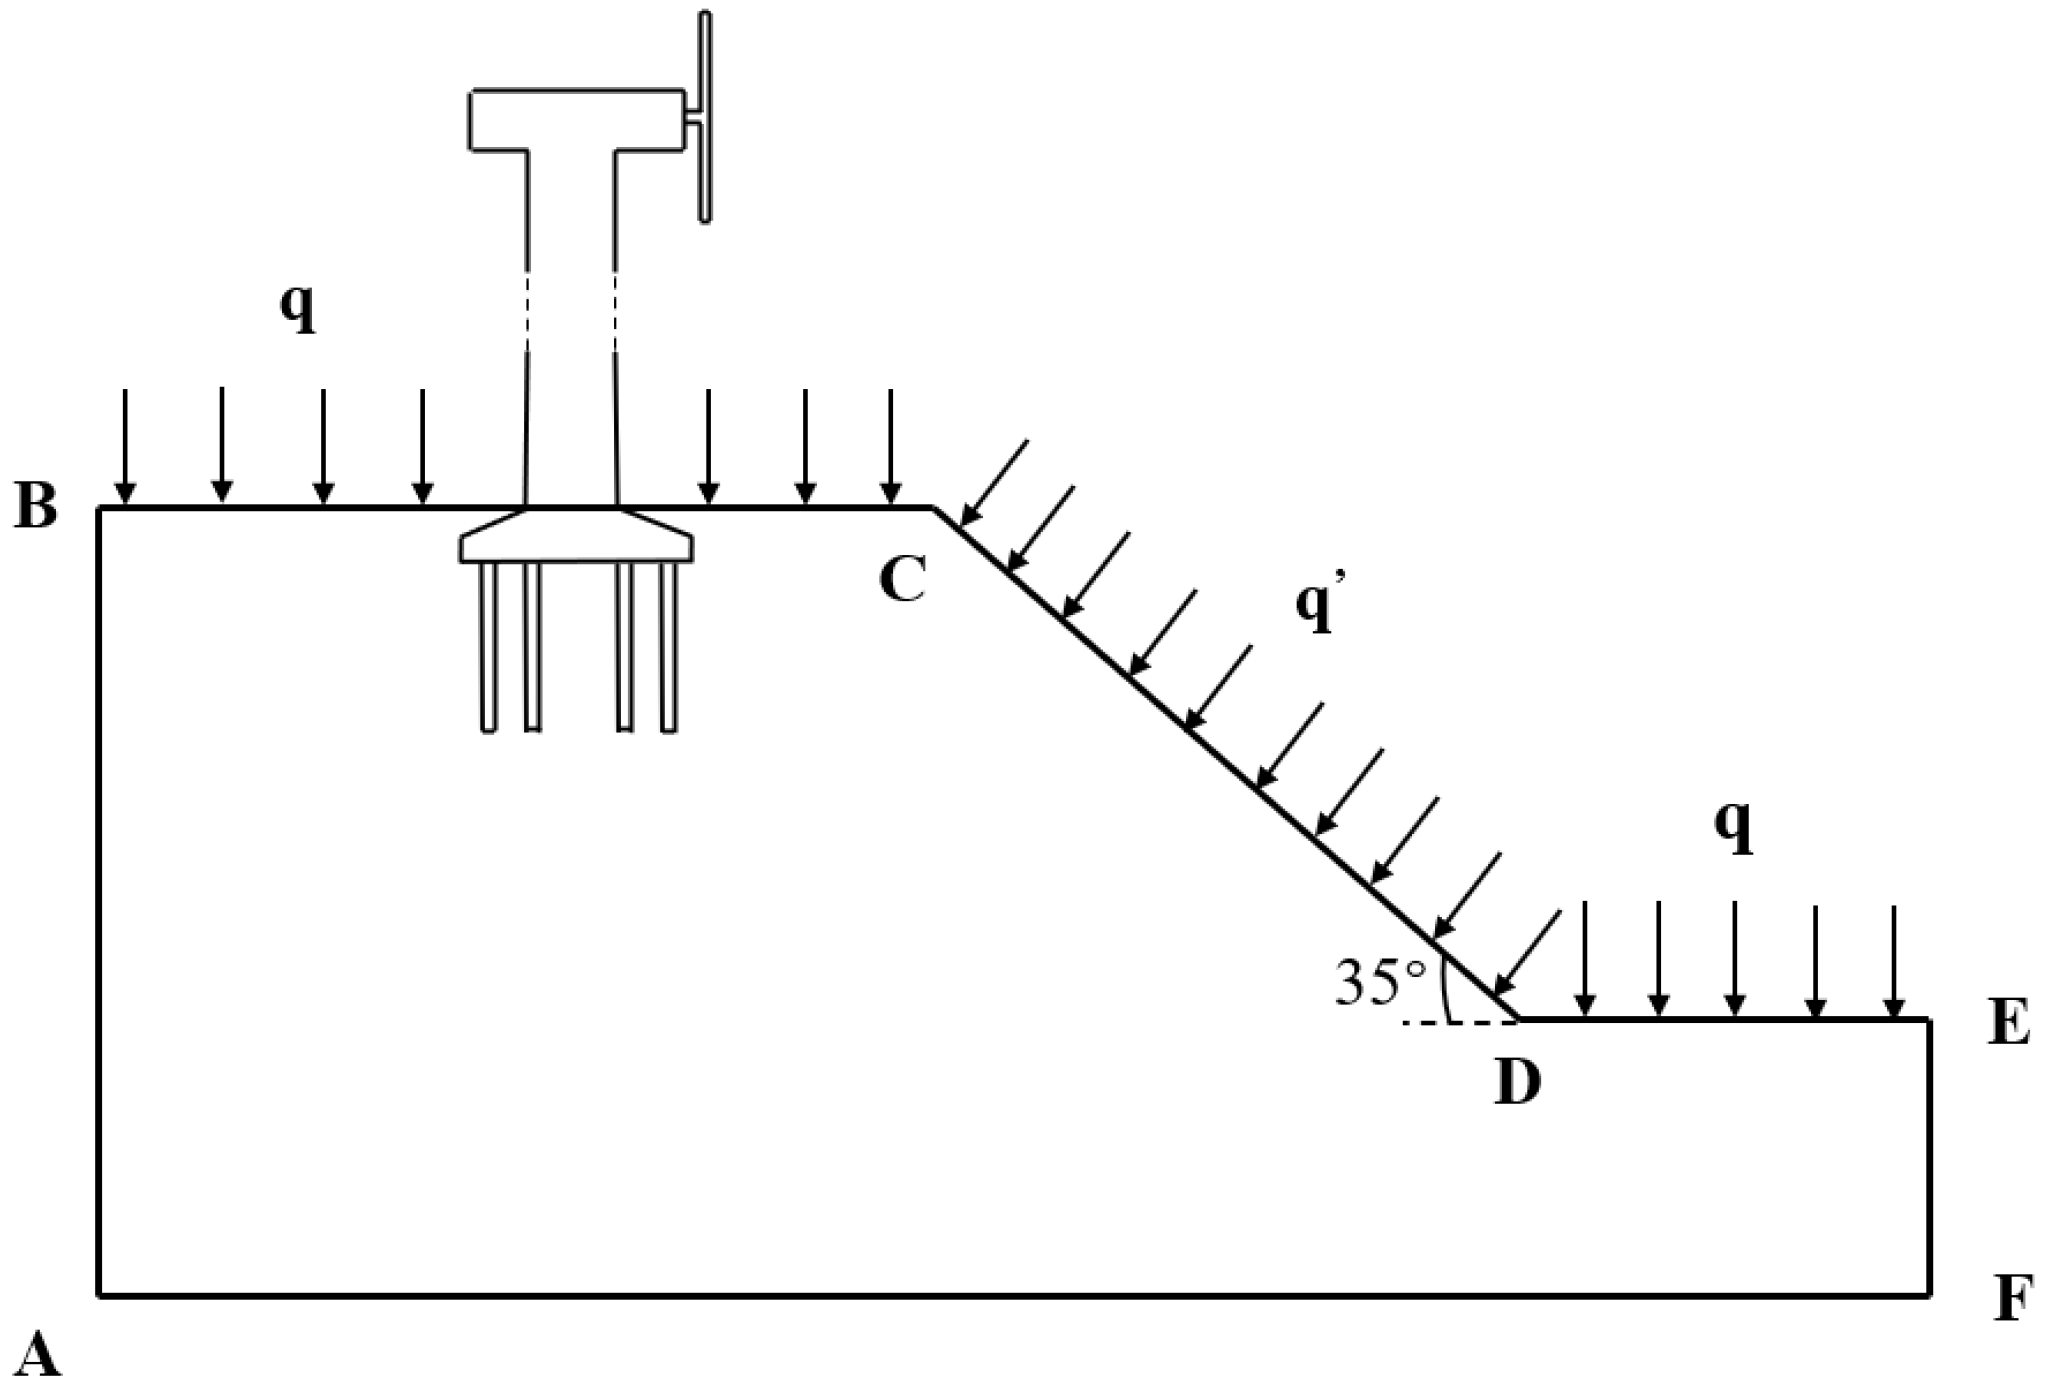
3.1. Model Construction

In this study, the finite element software ABAQUS is used to develop a numerical model of the pile-foundation system for wind turbine towers on collapsible loess. The model is used to systematically analyze the pile–soil interaction mechanisms under a variety of loading conditions.
The tower foundation is modeled at a 1:1 scale. In order to minimize the influence of boundary effects, the height of the model is 100 m, which is more than three times the depth of the pile foundation, and the upper boundary is 130 m long. The adjacent slope to the wind turbine foundation has a height of 60 m with a 35° inclination angle, as detailed in Figure 3.
To simplify the computational model, the paleosol layer, representing a relatively small proportion of the original stratigraphy, is omitted [20]. Corresponding parameter adjustments are made to the remaining loess layers. Detailed material parameters for both soil layers and wind turbine tower components are provided in Table 3.
To ensure simulation accuracy, the foundation and soil are modeled using solid elements with CPE4 meshing for stress–strain analysis. The Mohr–Coulomb constitutive model is applied to characterize soil behavior [19,21,22], while fluid–structure interaction analysis employs CPE4P elements for soil meshing to account for pore pressure effects.
The modeling process consists of two main stages: in situ stress analysis and loading analysis. During the in situ stress analysis stage, initial geostatic equilibrium is achieved through the combined application of the element birth/death technique and automatic in-situ stress balancing method [23,24,25]. The specific methodology involves first obtaining initial in situ soil stresses prior to loading analysis and then reading these stresses during formal analysis. When obtaining the initial in situ stress, the material properties of piles and caps are specified as the properties of non-collapsible loess, but this may cause difficulties in the calculation of the numerical model. Therefore, the density of piles and caps is set to 0. Since the volume occupied by the pile is very small compared with the volume of the whole soil, the error caused by this treatment is acceptable.
After obtaining the initial soil stresses, the ‘soil-pile structure’ is replaced with a ‘concrete-pile structure’, and the contact interface is updated to ‘penalty contact’. The model then undergoes a final automatic stress balancing before proceeding to the loading analysis phase.
The finite element model applies lateral and vertical constraints to the left soil boundary, implements full displacement constraints (x, y, z directions) at the base, and maintains free boundary conditions on both the top surface and right side.

3.2. Axial Stress Analysis and Verification for Wind Turbine Foundation Systems

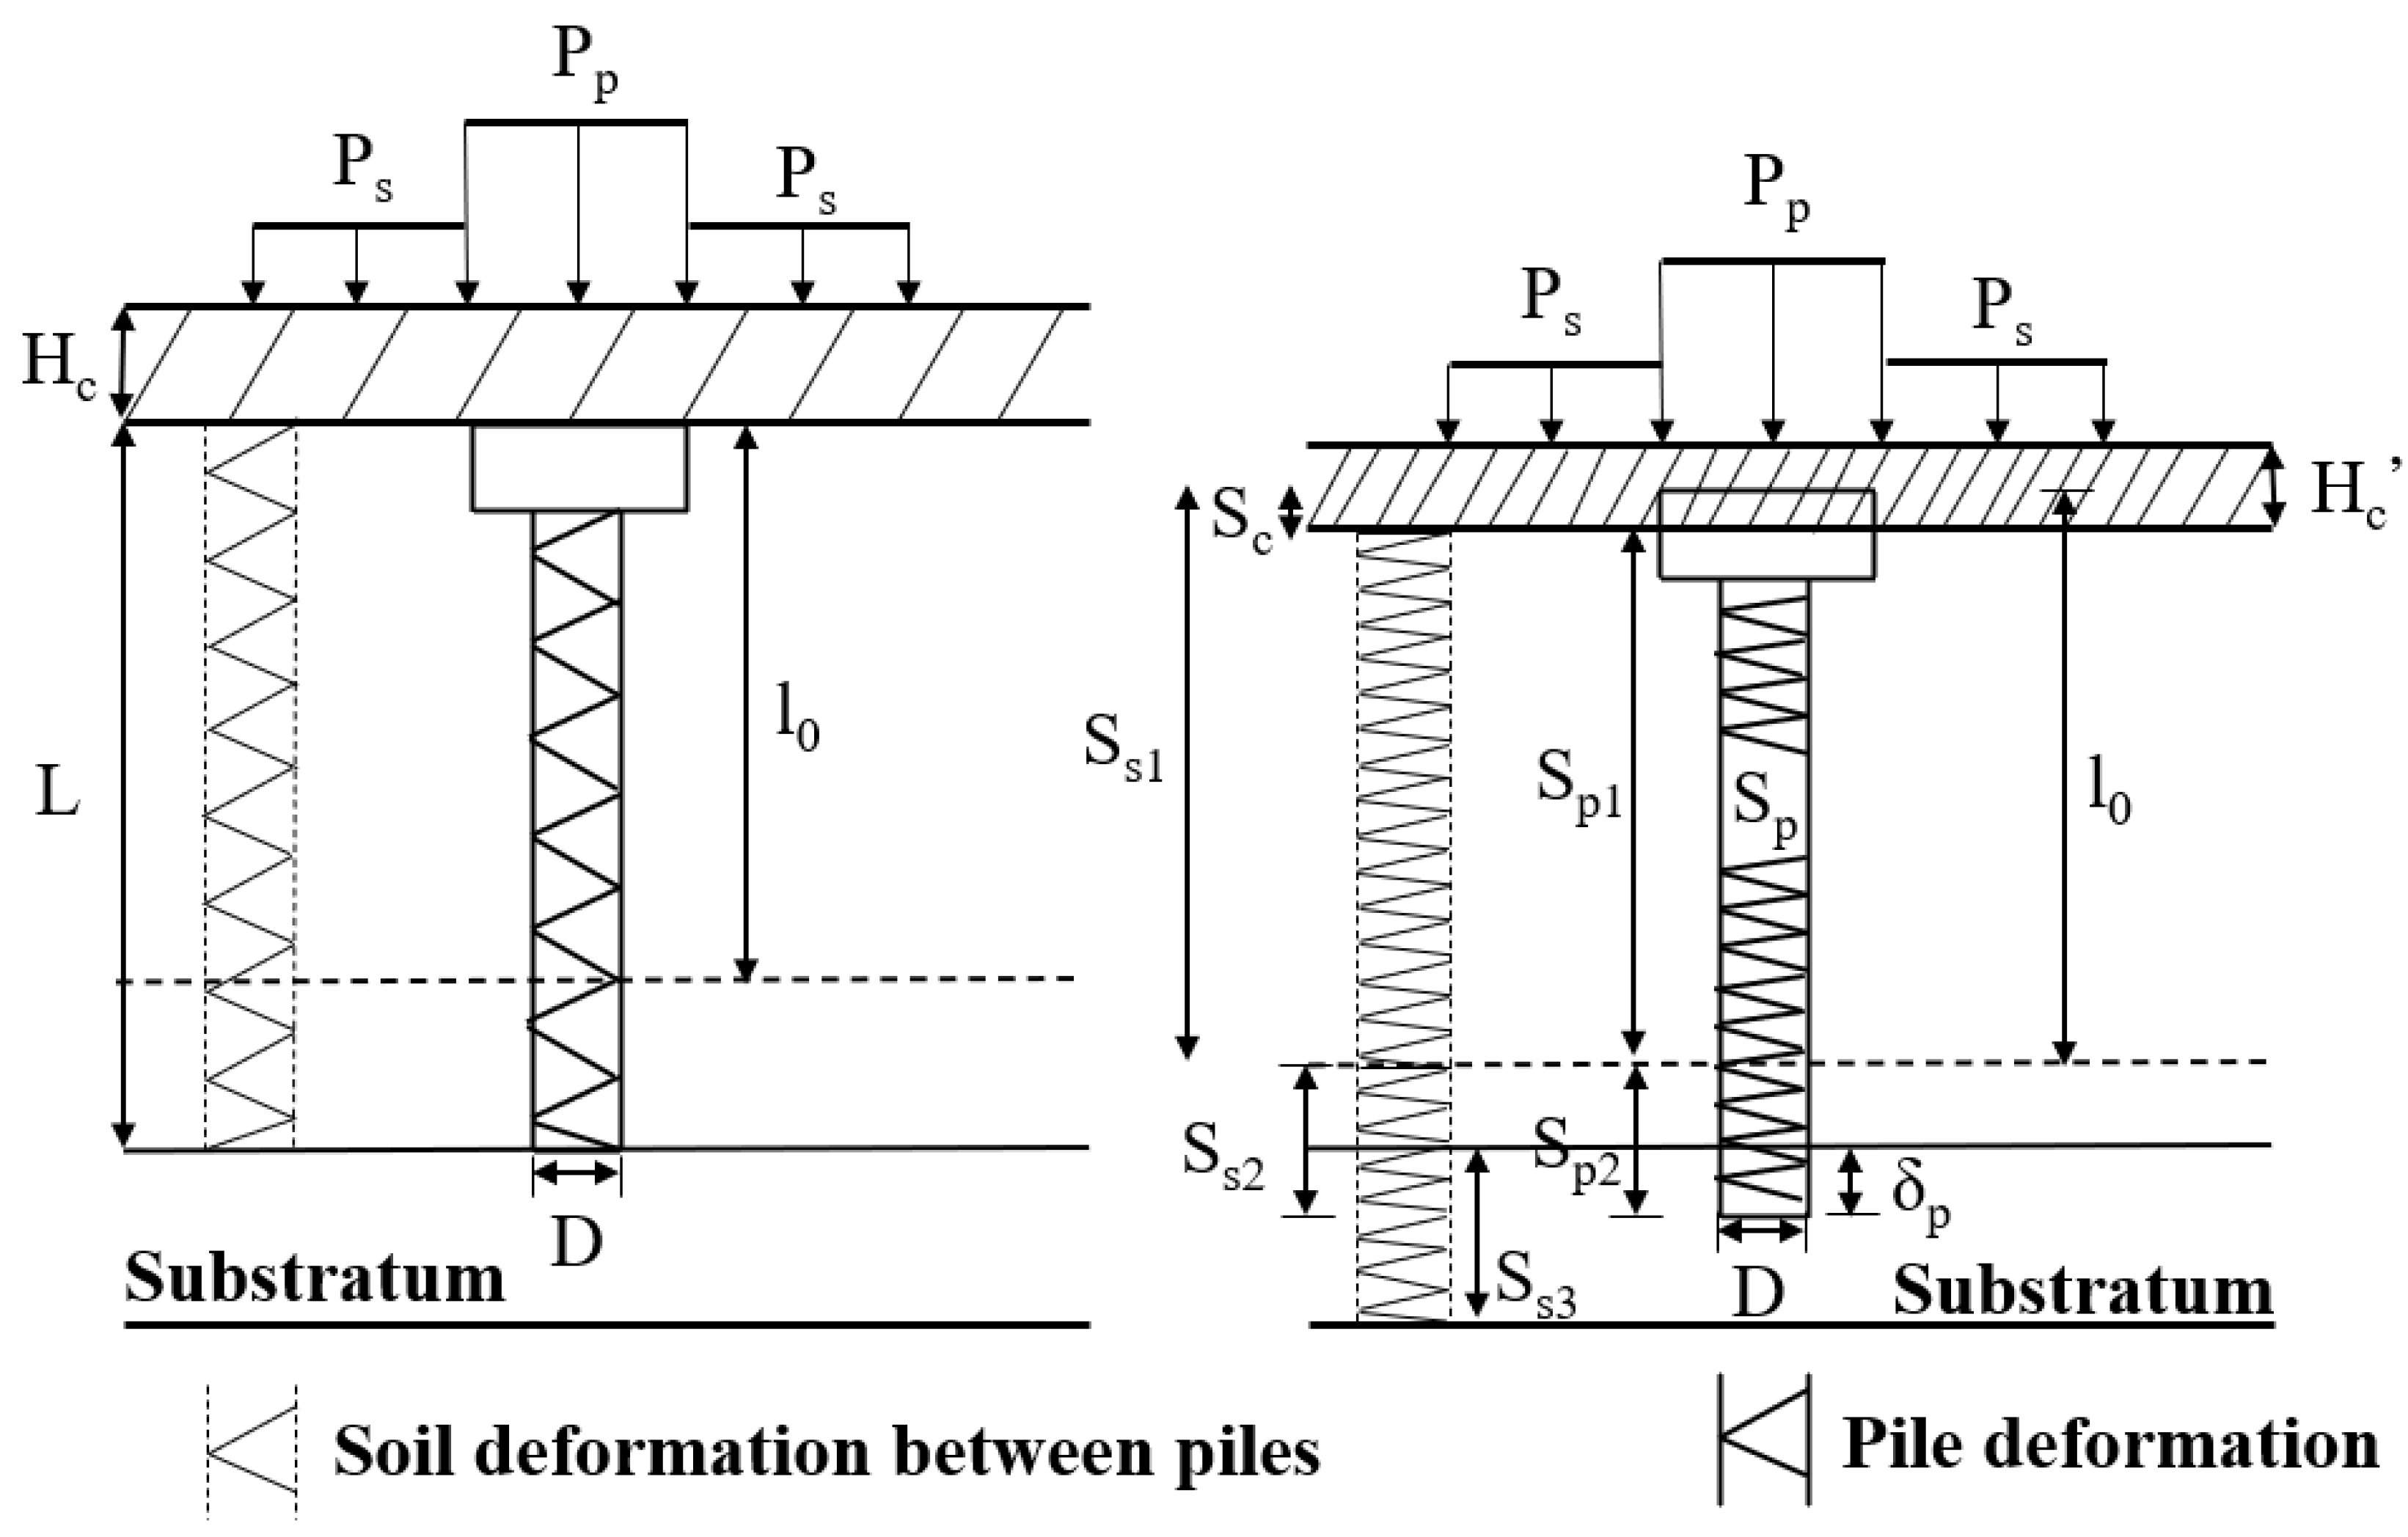
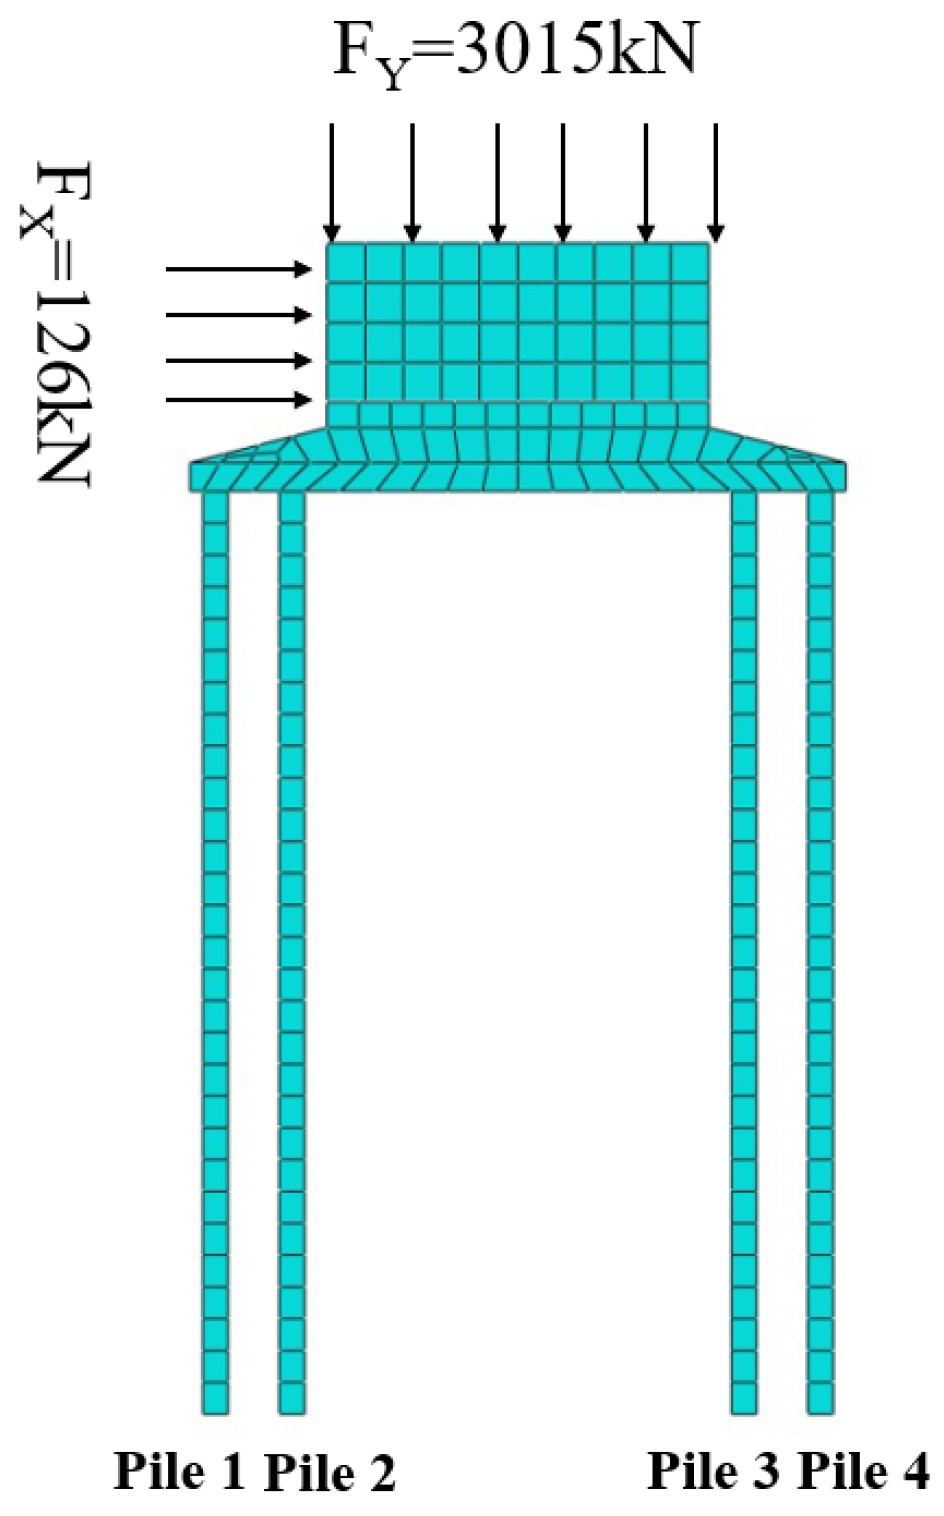
3.2.1. Derivation of Theoretical Calculation Formula for Axial Stress of Wind Turbine Foundation Systems

Based on the calculation method of the pile–soil stress ratio of a rigid pile composite foundation proposed by Miao [26] and combined with the load characteristics of wind turbine tower foundation, the following assumptions are made for the convenience of deriving the axial stress formula of a pile:
(1)
It is assumed that the foundation soil is a semi-infinite elastic body without considering the boundary effect. If the foundation is composed of multi-layer soil, the relevant parameters shall be weighted and averaged according to the thickness of each soil layer, while ignoring the impact of construction on soil uniformity.
(2)
The load is uniformly distributed and acts on the pile cap and soil surface under the adjustment of the cushion.
(3)
We regard the cushion layer as a homogeneous elastomer.
(4)
The piles are arranged at equal intervals, and the geometric properties and mechanical properties of the piles are completely consistent. The pile material is regarded as a linear elastic body, which satisfies Hooke’s law.
(5)
Ignoring the high-frequency vibration effect of dynamic load, the quasi-static analysis method is used to carry out the research.
The relationship between pile side skin friction and pile–soil relative displacement is shown in Figure 4. The mathematical expression is as follows:
τ ( z ) = τ u δ u δ = k δ δ δ u k δ u δ δ u
where τ ( z ) is the side skin friction, τ u is the ultimate side friction, δ is the pile–soil relative displacement, δ u is the ultimate relative displacement, and k is the proportional coefficient of side skin friction.
The deformation coordination diagram of composite foundation considering the interaction of the pile-cushion layers–soil is shown in Figure 5. P is the uniformly distributed load, H c is the thickness of the cushion layers, E c is the deformation modulus of the cushion layers, L is the length of the pile, D is the diameter of pile, C is the perimeter of pile, A p is the area of the pile end, A c p is the area of the pile cap, E s is the average modulus of the soil between the piles, S p is the compression deformation of the pile body, and δ p is the penetration amount of the pile end into the substratum.
After the uniform load is adjusted by the cushion layers, the uniform load acting on the top of the pile cap is P p , the uniform load acting on the surface of the soil between the piles is P s , and l 0 is the neutral point depth. In order to simplify the calculation, the pile side skin friction is uniformly distributed along the length of the pile, respectively, above and below the neutral point.
We refer to the study [26] and put forward the following axial force equilibrium equation:
d N ( z ) d z = c τ 1 ( z ) ( 0 z l 0 ) c τ 2 ( z ) ( l 0 z L )
where N ( z ) is the axial force of the pile at the depth of z, and τ 1 ( z ) and τ 2 ( z ) are the skin friction on the side of the pile above and below the neutral point, respectively.
When z = 0 , there are the following:
N 0 = P p A p
where N 0 is the axial force at the pile top.
When z l 0 , S c is the deformation of the pile top inserted into the cushion, S p 1 is the compression deformation of the pile above the neutral point, and S s 1 is the compression deformation of the soil between the piles. Therefore, the following is true:
S c = P p E c H c
S s 1 = P s E s l 0
S p 1 = P p E p l 0
τ 1 = k δ 1
δ 1 = S c + ( S p 1 S s 1 ) z l 0
where δ 1 is the pile–soil relative displacement above the neutral point.
When z = l 0 , the conditions for deformation coordination of the pile–soil–cushion layers are as follows:
S s 1 = S p 1 + S c
Therefore:
N l 0 = P p A p 1 2 k c S c l 0
where N l 0 is the axial stress at the neutral point. Due to the action of the load, the thickness of the cushion layer changes from H c to H c . Then:
P s = E c H c H c H c
When z l 0 , S p 2 is the compression deformation of the pile above the neutral point, and S s 2 is the compression deformation of the soil between the piles. Therefore:
S s 2 = 1 E s P s ( L l 0 )
S p 2 = 1 E p β P p ( L l 0 )
β = A p 1 2 E c k c l 0 H c
τ 2 = k δ 2
δ 2 = δ p S s 3 + ( S p 2 S s 2 ) ( z l 0 ) L l 0
where β is the comprehensive correction factor, δ 2 is the pile–soil relative displacement below the neutral point, and S s 3 is the compression deformation of the substratum.
Substitute Equations (8) and (16) into Equations (7) and (15), respectively, and the expressions for the side skin friction of the pile are as follows:
τ 1 ( z ) = k S C + S P 1 S S 1 l 0 z
τ 2 ( z ) = k δ p S s 1 + S p 2 S s 2 L l 0 z l 0
Substitute Equations (17) and (18) into Equation (2), and perform integration to obtain the axial stress distribution equation:
N ( z ) = P p A p k c S c z c k ( S s 1 S p 1 ) 2 l 0 z 2 0 z l 0 k c ( δ p S s 3 ) ( z l 0 ) + k c ( S p 2 S s 2 ) 2 ( L l 0 ) ( z l 0 ) 2 + β P p l 0 z L
Then, the expression for the axial stress is as follows:
σ ( z ) = N ( z ) A p

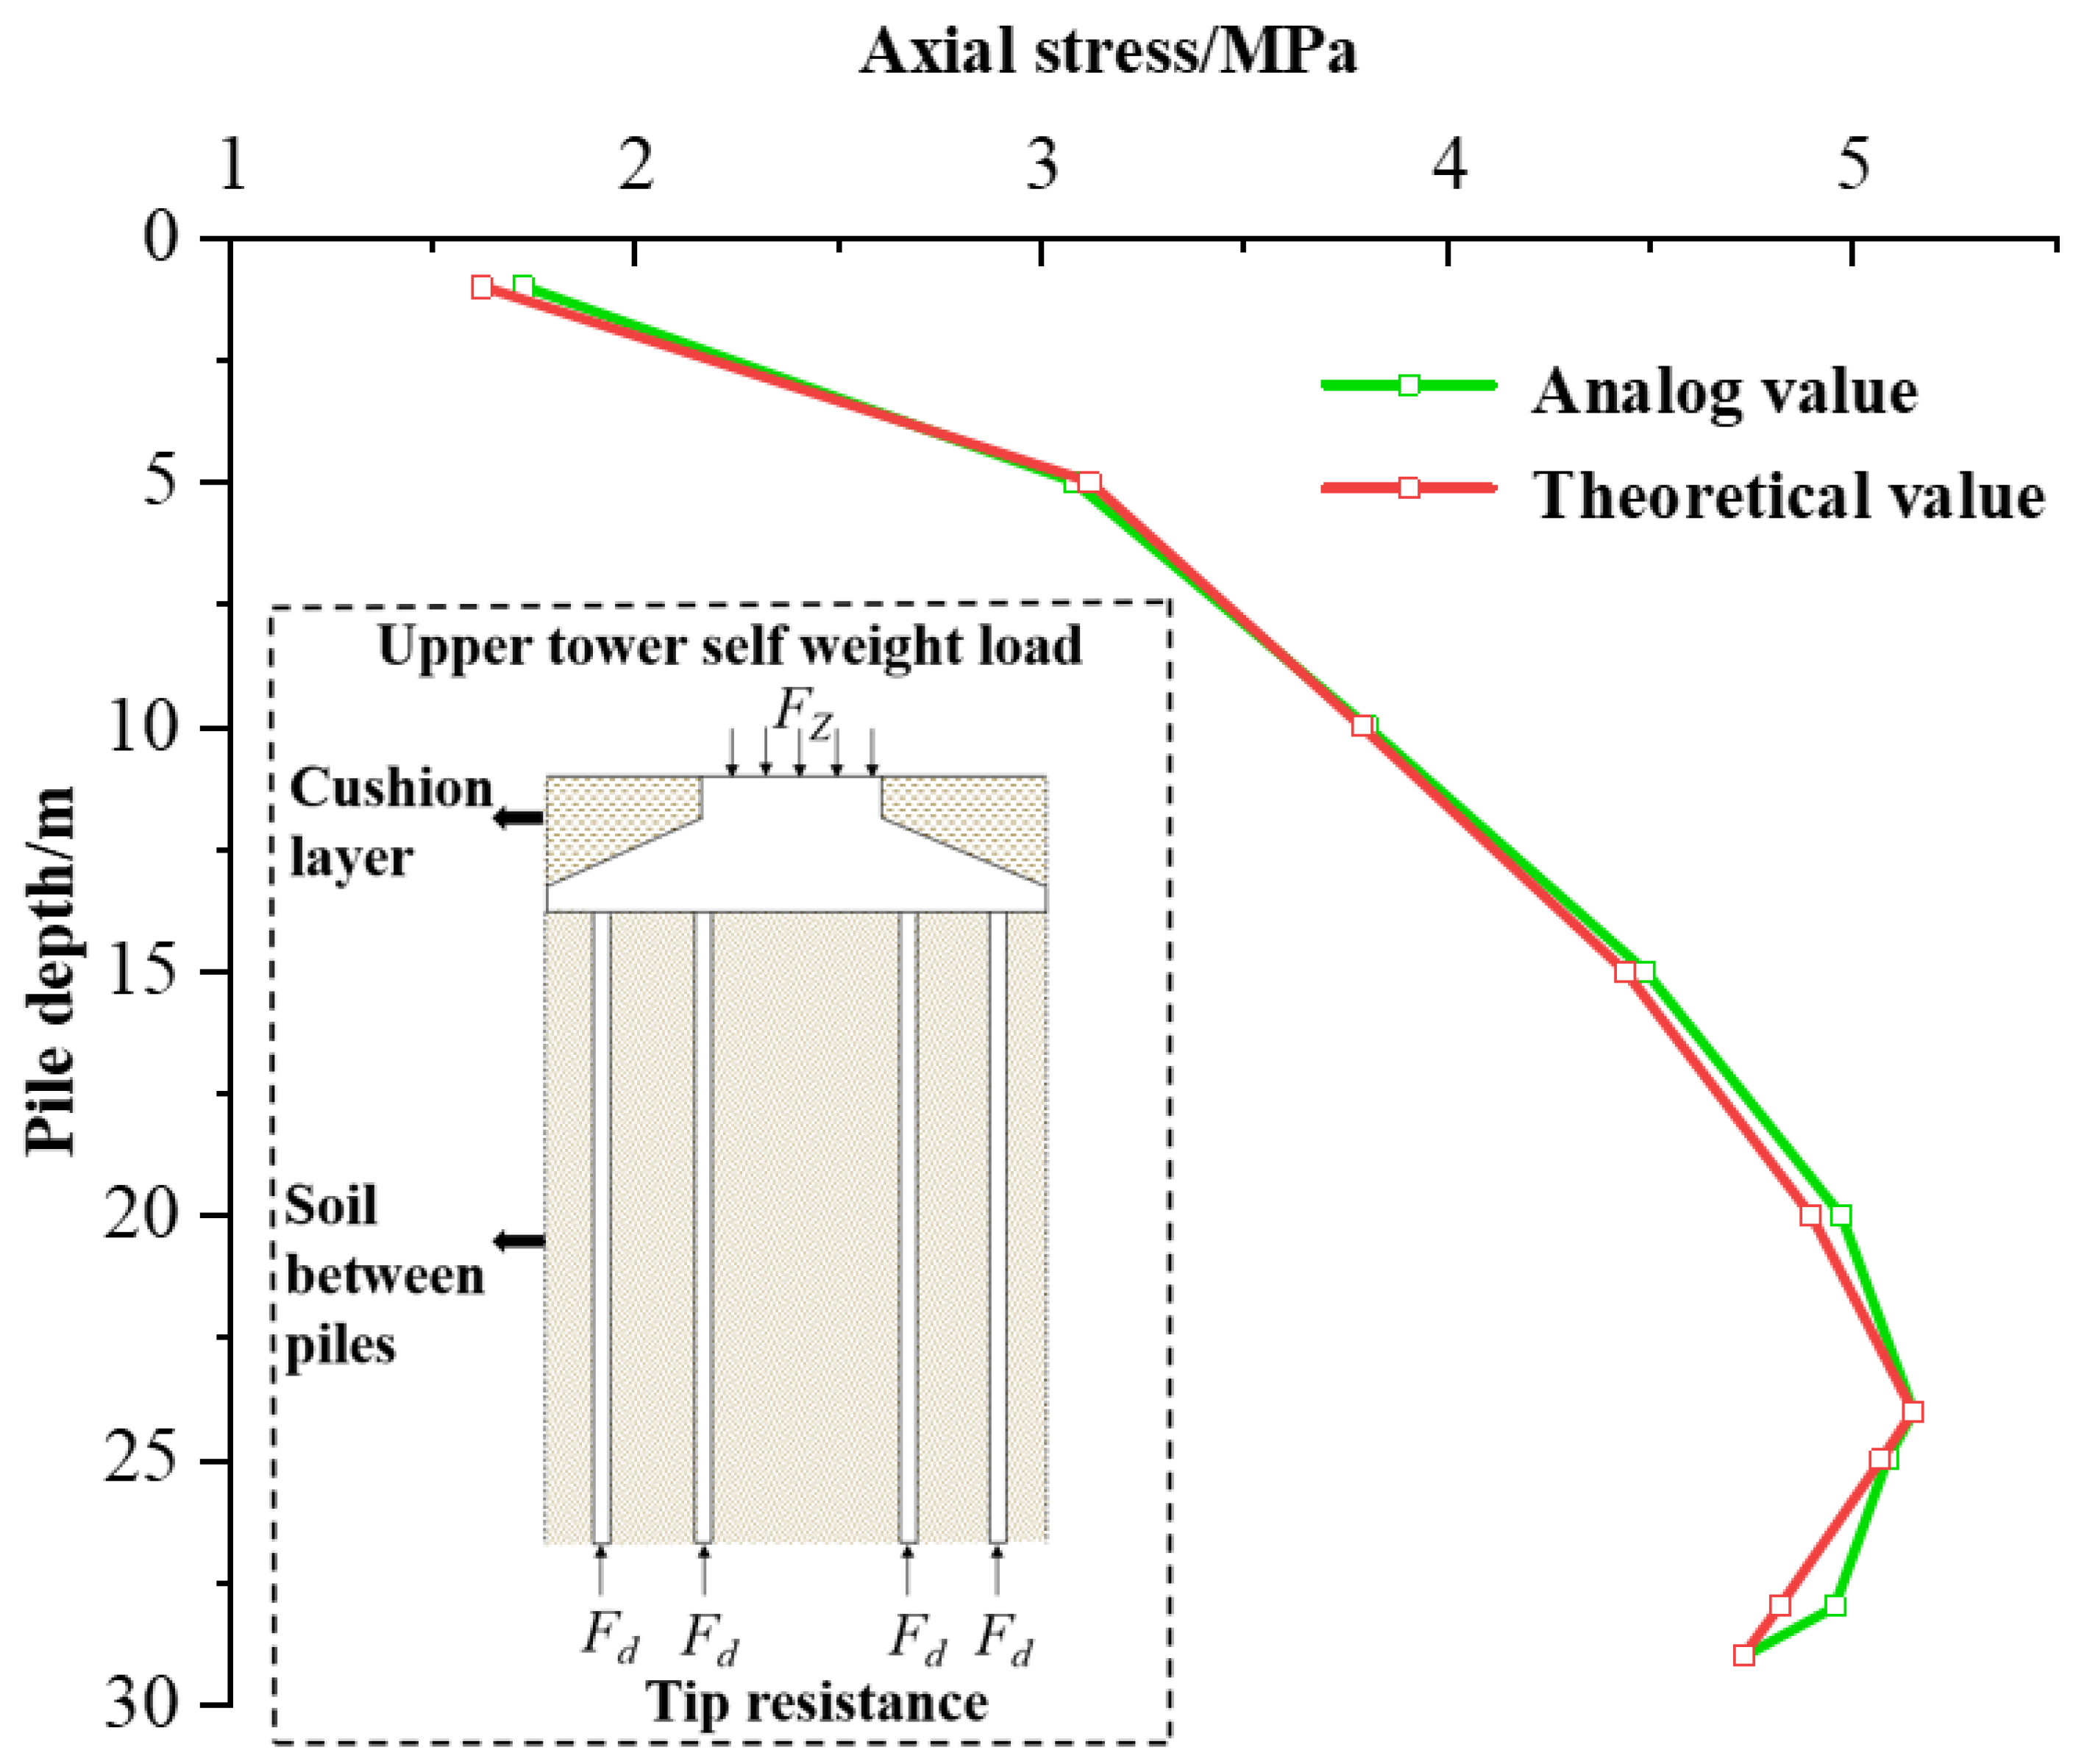
3.2.2. Axial Stress Verification for Wind Turbine Foundation Systems

The calculation error of the pile–soil stress ratio in the model test in reference [26] is less than 5%, which indirectly verifies the reliability of Formula (19).
In order to facilitate the calculation, the average axial stress of the pile group is taken as the comparison index in this study. The average axial stress of the pile group of the wind turbine tower foundation under the self-weight load is calculated through Formula (19) and numerical simulation, and the accuracy of the numerical simulation is verified by comparison. The comparison results are presented in Table 4.
In order to clearly compare the differences between the two methods, the calculated values from both approaches are organized and presented in Table 3; the maximum discrepancy between the theoretical calculations and finite element simulation results is 2.1%, which is within the allowable range specified by the relevant codes.
As shown in Figure 6, the axial stress curve derived from theoretical calculations demonstrates strong agreement with the finite element simulation results, and the abrupt change values of the two curves are very close, at 23.8 m and 24 m, respectively. Therefore, the reliability of the proposed numerical model is validated.

3.3. Analysis of Pile–Soil Interaction Mechanisms Under Single-Load Conditions

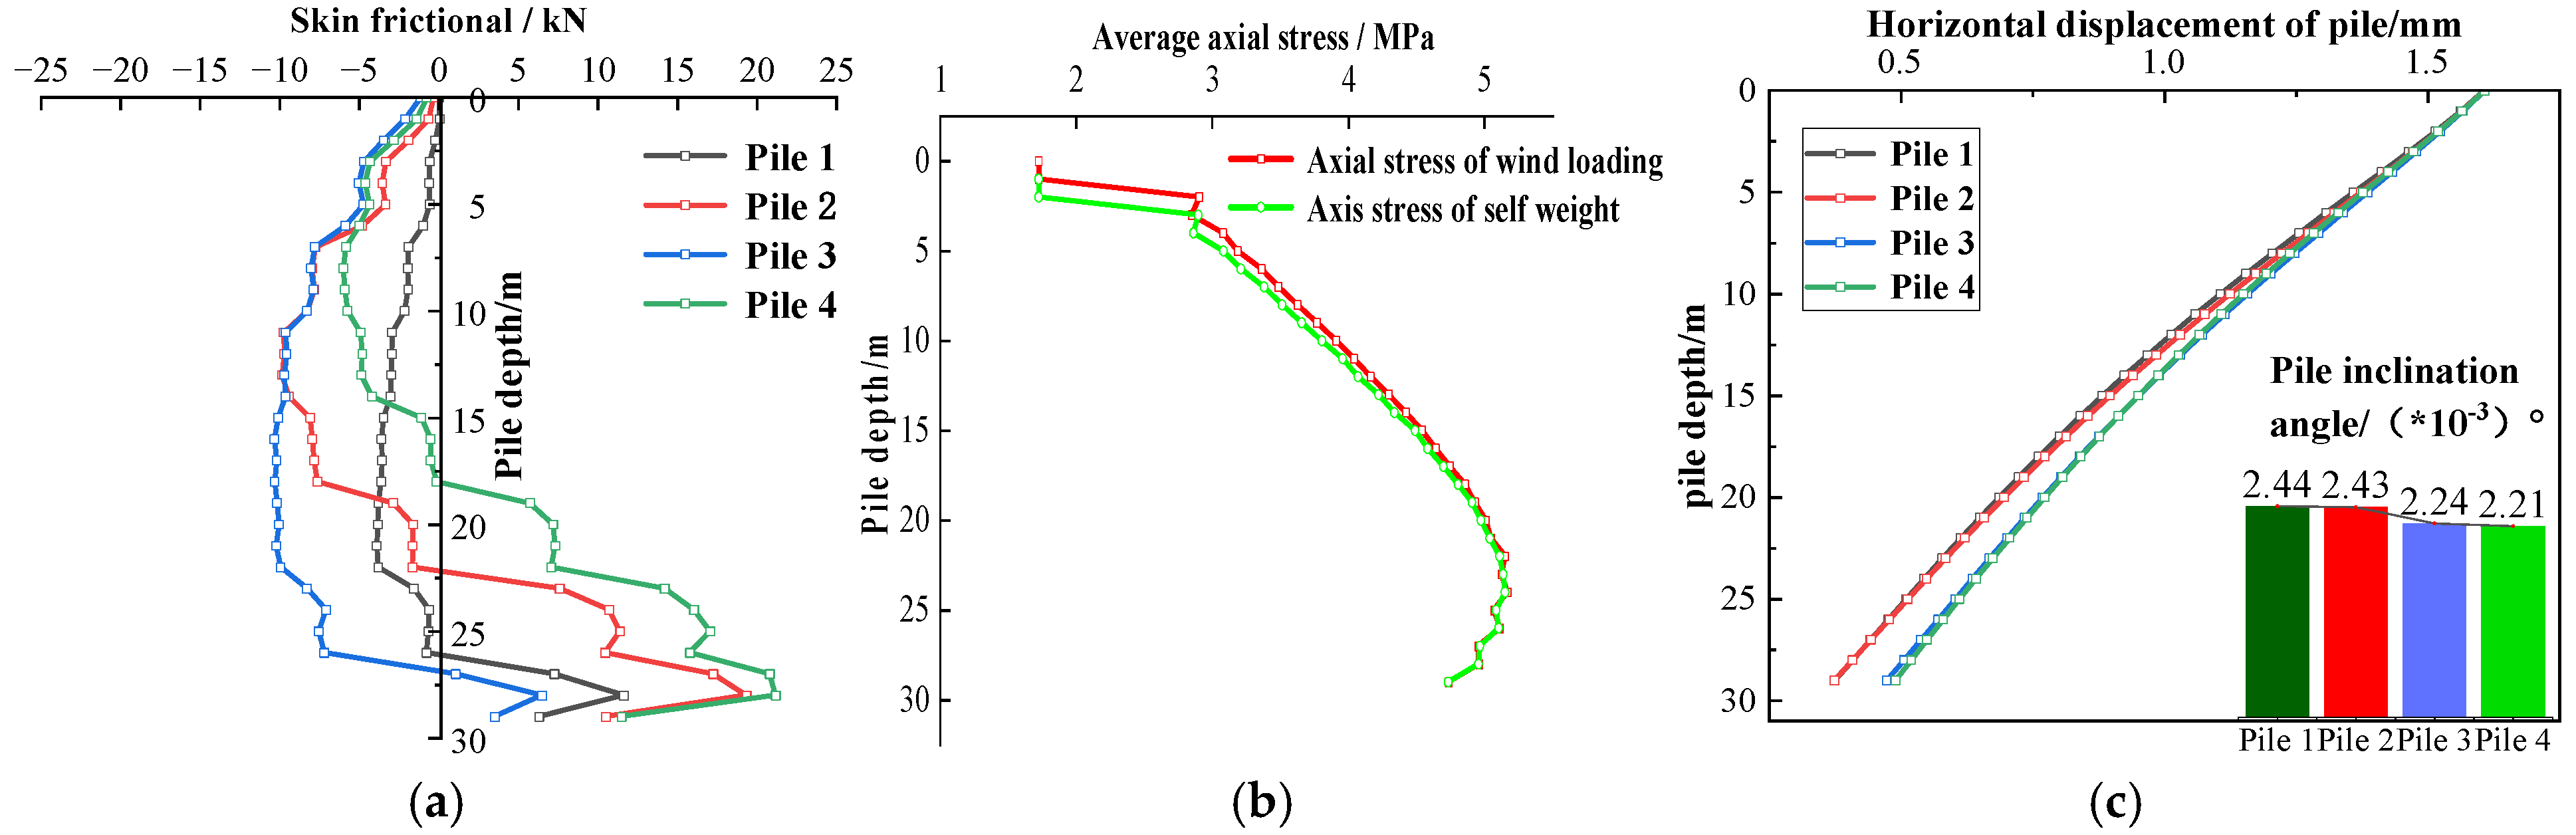
3.3.1. Analysis of Pile–Soil Interaction Mechanisms Under Wind Load Conditions

In the numerical simulation of wind turbine structures, the equivalent load method is employed to simplify the superstructure, enhancing computational efficiency while ensuring foundation stability. The specific implementation steps are as follows: (1) determining the total structural self-weight through material density and component volume calculations based on design parameters for the tower, nacelle, and blades; (2) applying the resultant force as a concentrated load at the geometric center of the tower foundation top, satisfying static equivalence principles [27,28,29]. For wind load calculations, the internationally recognized wind load formulation is adopted, and is shown as follows:
F ω = 1 2 ρ V 2 G A
where ρ represents the air density, V denotes the design reference wind speed, G is the aerodynamic drag coefficient, and A represents the windward area. The calculated wind load is resolved into its horizontal resultant component, with the action point determined via a weighted average method according to the height distribution of the component. Following spatial vector superposition principles, both self-weight and wind load are converted into concentrated force boundary conditions compatible with the numerical model. These forces are subsequently applied to the nodal group at the tower foundation’s top surface.
In this study, the horizontally applied wind load (left to right direction) induces an overturning tendency at the pile foundation top. The lateral constraint of the pile foundation near the slope side is weak, and the foundation soil may have plastic deformation or looseness, making the pile more prone to tension or lateral slip, increasing the risk of overall instability. Considering that normal operating load conditions represent the most frequent working state of wind turbine towers, the cumulative damage caused by repeated loading often plays a dominant role in structural degradation. Therefore, the pile–soil interaction of a wind turbine tower under normal operating wind loads is focused on in this study. To simulate the wind load realistically, it is applied as a pressure-based distributed load on the structural surface in ABAQUS. Field survey data indicate that the final horizontal force on the top of the foundation is 126 kN, and the vertical force on the top of the foundation is 3015 kN, as shown in Figure 7.
Figure 8 shows the corresponding pile–soil interaction responses under wind load conditions.
Figure 8 shows the pile–soil interaction mechanism under wind loading, demonstrating systematic response characteristics of the wind turbine tower foundation. As shown in Figure 8a, the evolution of pile skin friction can be divided into three distinct stages:
(1)
Above the neutral point, the continuous pushing effect of wind load causes the pile to have an upward pulling trend, and the pile is subjected to the downward dragging force of the surrounding soil, resulting in an accumulated increase in the negative skin friction. The maximum negative skin friction of the pile group occurred at pile 3, reaching a peak value of 10.23 kN.
(2)
At the neutral plane depth, the direction of skin friction reverses. At this stage, the pile end begins to press into the deep, compacted soil layer, resulting in a rapid increase in the positive skin friction. The maximum positive skin friction of the pile group was observed at pile 4, reaching a peak value of 21.18 kN.
(3)
Finally, due to the sudden release of soil stress near the bottom of the pile, the skin friction sharply decreases. Notably, the neutral point depths of piles 3 and 4 near the slope are the deepest at 26.5 m and the shallowest at 18 m, respectively.
To enhance computational efficiency, the pile group and cap are modeled as a unified system. Accordingly, all subsequent axial stress distribution analyses represent averaged values across the pile group.
Compared to the self-weight condition, shown in Figure 8b, the pile group under wind loading exhibits higher average axial stresses, particularly within the 0–5 m depth range, where stresses increase by up to 7.58% due to wind-induced overturning moments. With increasing depth, this bending effect is progressively transferred to the surrounding soil, leading to stress stabilization below 20 m. The maximum axial stress within the pile reaches 5.15 MPa.
Figure 8c further illustrates the displacement characteristics, revealing the influence of slope proximity. Although all pile top displacements reach 1.61 mm, the displacement of the pile bottom near the slope increased significantly, such as pile 4, which increased by 31.17% compared to pile 1. Such differential displacements result in a progressive decrease in pile inclination angles from the central zone toward the slope, forming a progressive inclination mode. The inadequate lateral support provided by the slope-side soil forces the pile foundation to adapt its inclination angles to preserve global stability.

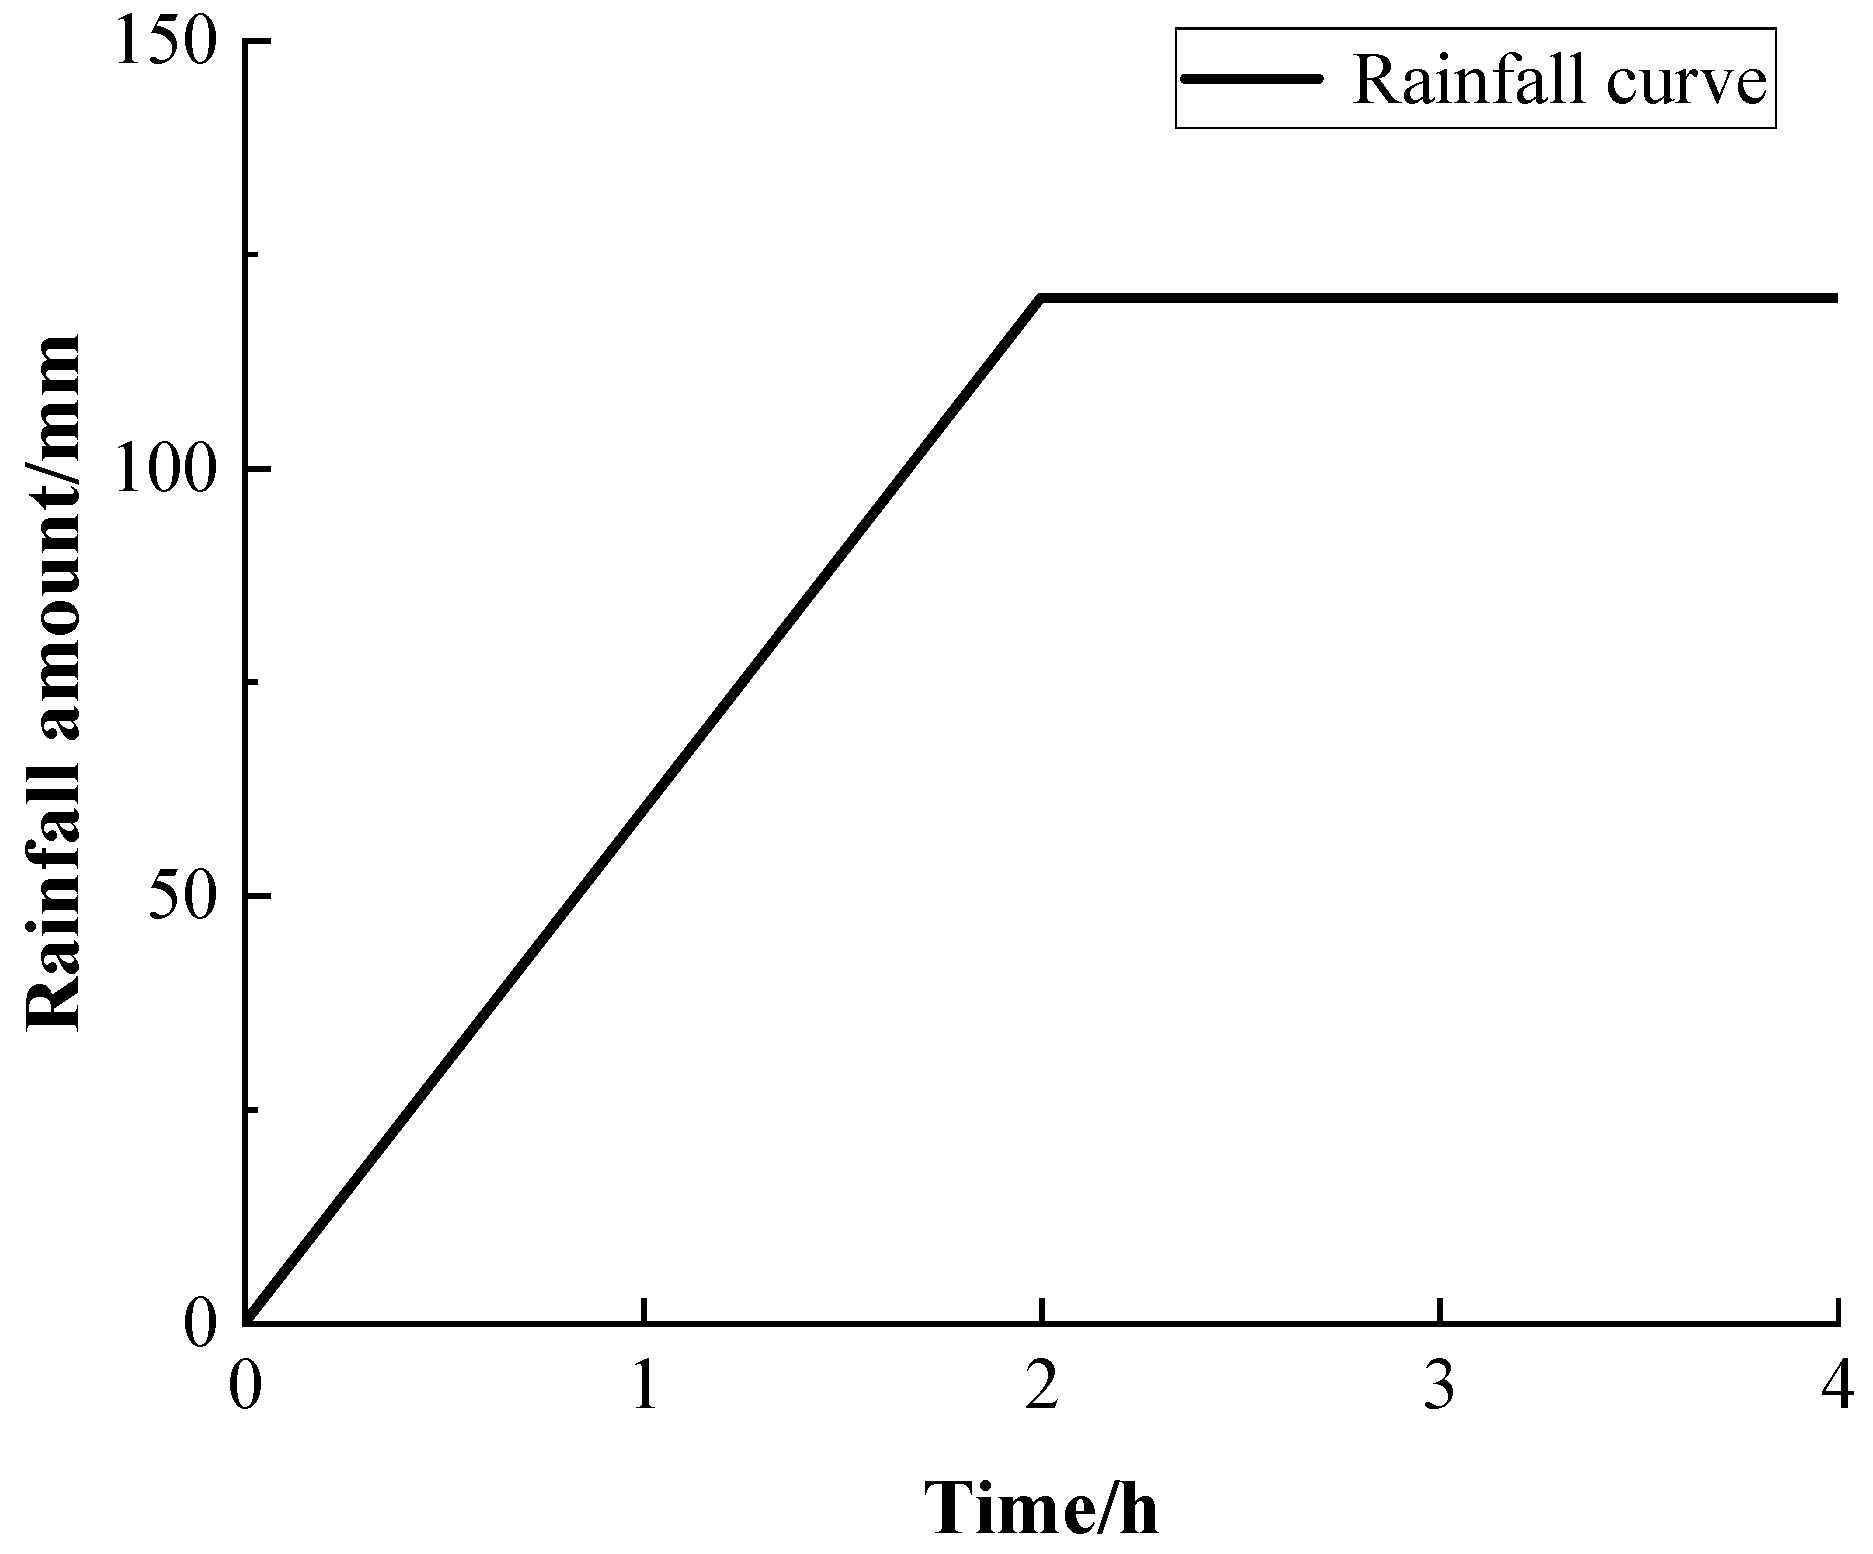
3.3.2. Analysis of Pile–Soil Interaction Mechanisms Under Extreme Rainfall Conditions

Based on the rainfall characteristics of the Ansai region and experimental data from Zhen et al. [9], the short-term extreme rainfall conditions in this region are simulated with a maximum rainfall intensity of 120 mm/h and a duration of 4 h. The rainfall curve is shown in Figure 9.
In order to reasonably simulate the interaction between rainfall infiltration and soil deformation, the formula of unsaturated soil permeability coefficient varying with matrix suction is introduced as follows:
K w = a w K w S a w + b w ( u a u w ) c w
where K w S is the permeability coefficient of the soil when it is saturated, u a and u w are the air pressure and water pressure in the soil, respectively, and a w , b w , and c w are the material coefficients, which are taken as 1000, 0.01, and 1.7, respectively.
The rainfall infiltration process is described by three factors: rainfall intensity q , allowable infiltration capacity of soil f p , and hydraulic conductivity K w S when the soil is saturated. When q < K w S , all rainfall infiltrates into the soil, and the infiltration rate remains unchanged. When f p > K w S , the depth of the rainfall increases and the infiltration capacity decreases, but does not reach the infiltration peak value. When q > f p , under certain rainfall conditions, a portion of the rainfall is not absorbed or infiltrated by the soil, resulting in surface runoff. When the rainfall reaches its peak, the infiltration rate of the soil will gradually decrease.
For numerical simulation of rainfall load, rainfall load is applied to the upper surface of the model in the form of ‘surface pore flow’, and the rainfall load intensity of slope CD is as follows:
q = q cos ( 35 )
The soil permeability coefficient k is 5 × 10⁻⁶ m/s, and the initial void ratio is 1, the pore pressure at boundaries BC, CD, and DE is 0, and the slope CD is set as a free drainage surface, as shown in Figure 10.
Figure 11 shows the corresponding pile–soil interaction responses under extreme rainfall conditions.
For subsequent working condition analyses, pile 4 (adjacent to the slope) is selected as the representative case to systematically evaluate variations in pile–soil interaction mechanisms under different loading conditions.
Figure 11 shows the time-dependent pile–soil interaction mechanism under rainfall loading. As shown in Figure 11a, the pile’s positive skin friction peaks at 24.13 kN during the first hour of rainfall, primarily due to the temporary strengthening effect of matrix suction in unsaturated loess. Initially, a low soil moisture content promotes capillary forces that form a microscopic skeletal structure between particles, enhancing the pile–soil interface friction. With progressive rainfall infiltration, increasing pore water pressure reduces effective stress, causing positive skin friction to attenuate by from 15.29% to 20.44 kN.
As shown in Figure 11b, the pile group’s average axial stress demonstrates a gradual temporal decay correlated with rainfall duration, peaking at 5.26 MPa during the initial 1 h rainfall period before declining by from 4.51% to 5.02 MPa under sustained precipitation.
Figure 11c clearly shows that, under extreme rainfall conditions, the pile’s horizontal displacement curve progressively transitions from an “I” to a slight “S” shape with increasing rainfall duration, accompanied by a gradually accumulating displacement. After 4 h of rainfall, the horizontal displacement at the pile top reaches 2.01 mm. This behavior is attributed to rapid water infiltration during heavy rainfall, causing swift saturation of shallow soils. The consequent softening of near-surface soils reduces lateral support in the upper pile zone, promoting bending deformation and accelerated horizontal displacement. Conversely, deeper soil layers maintain stronger constraints, limiting further displacement and generating the observed nonlinear displacement curve characteristics.

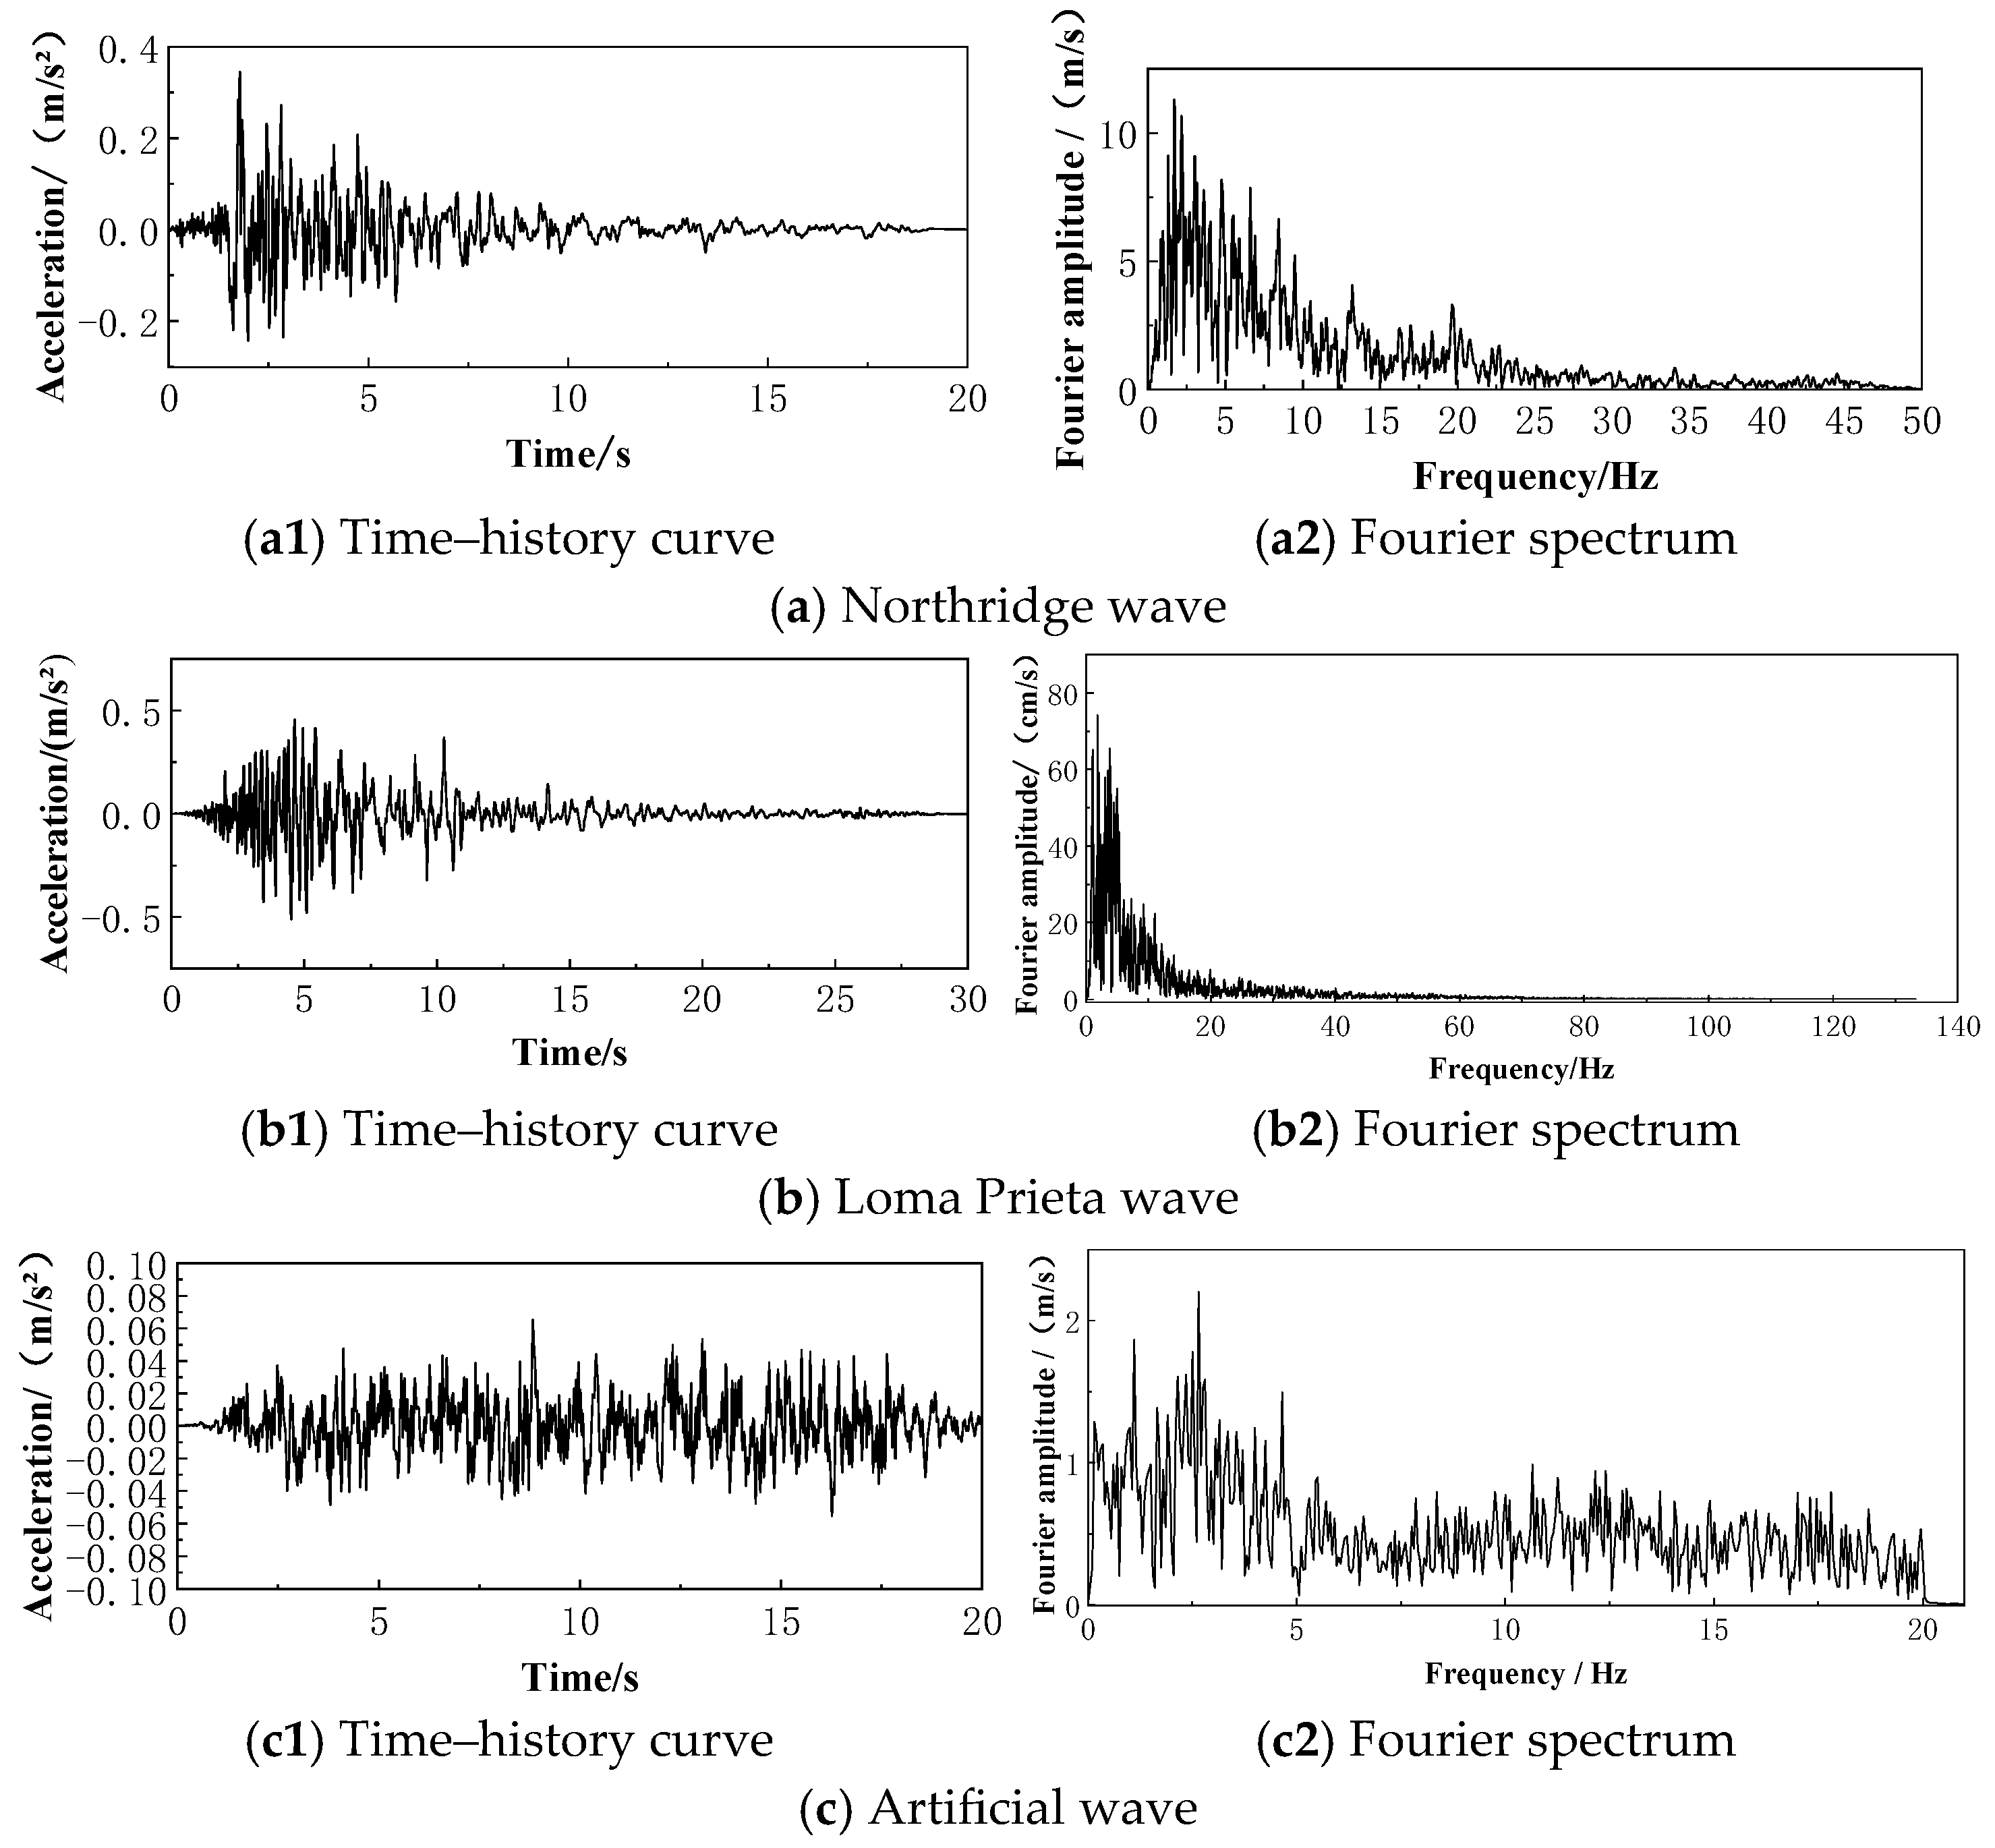
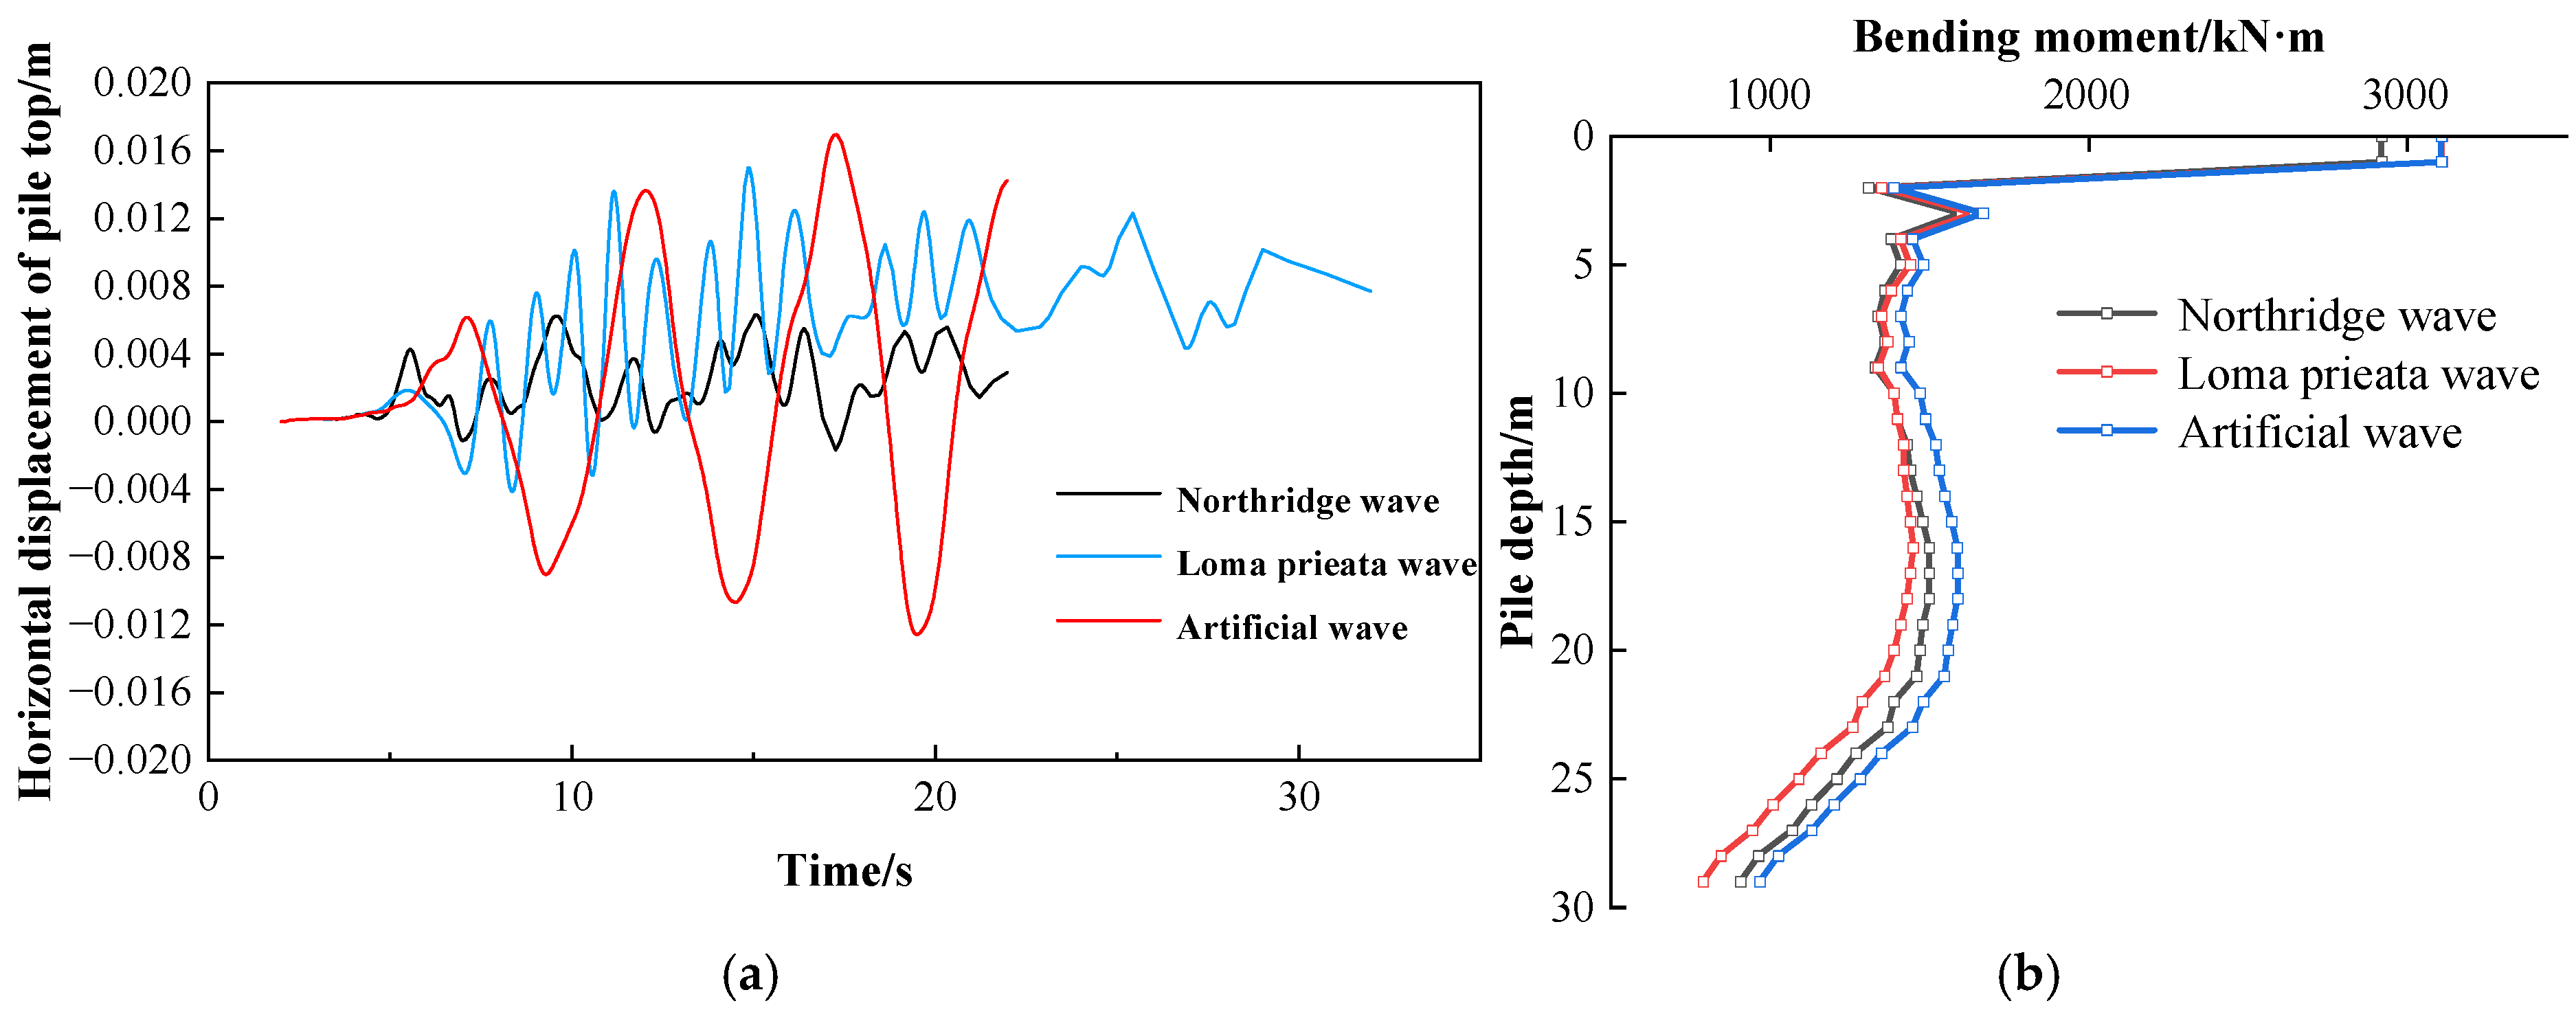
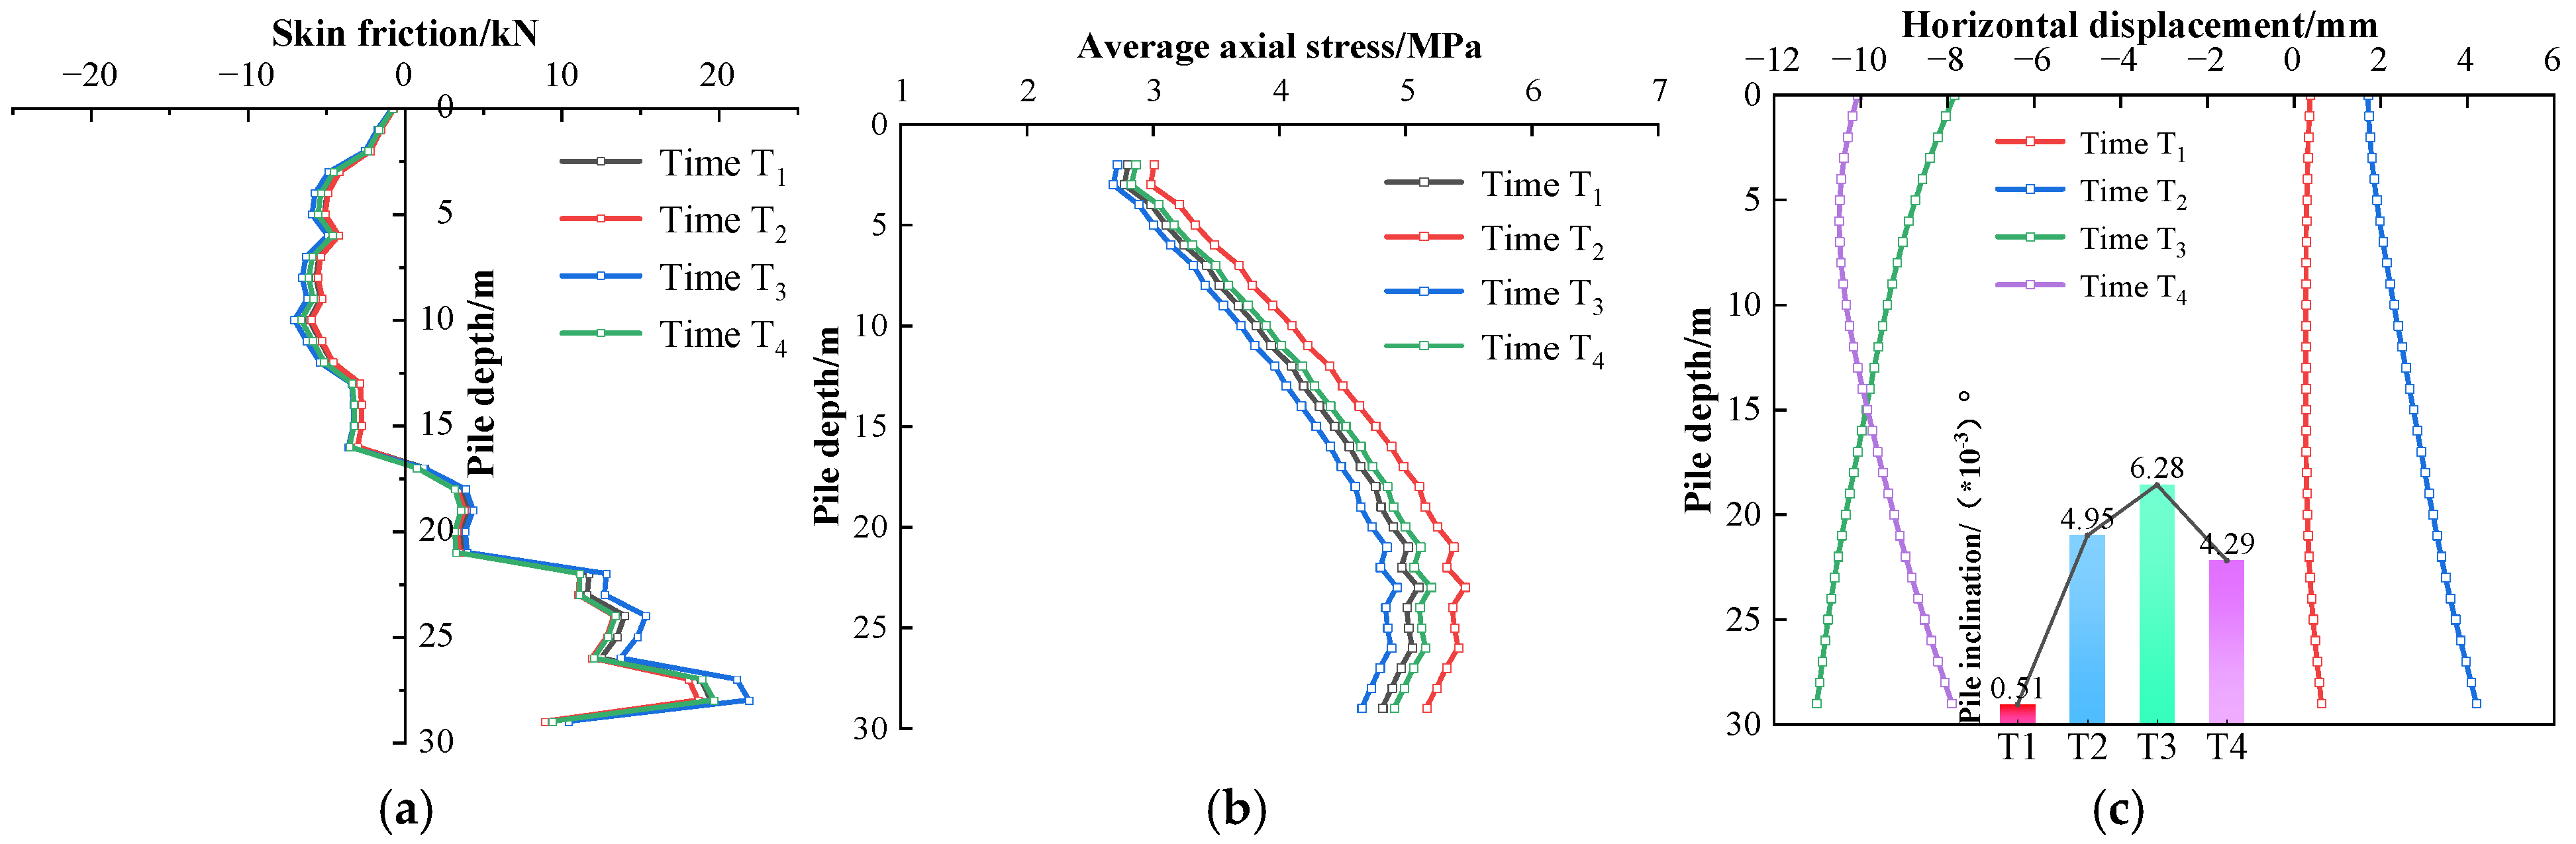
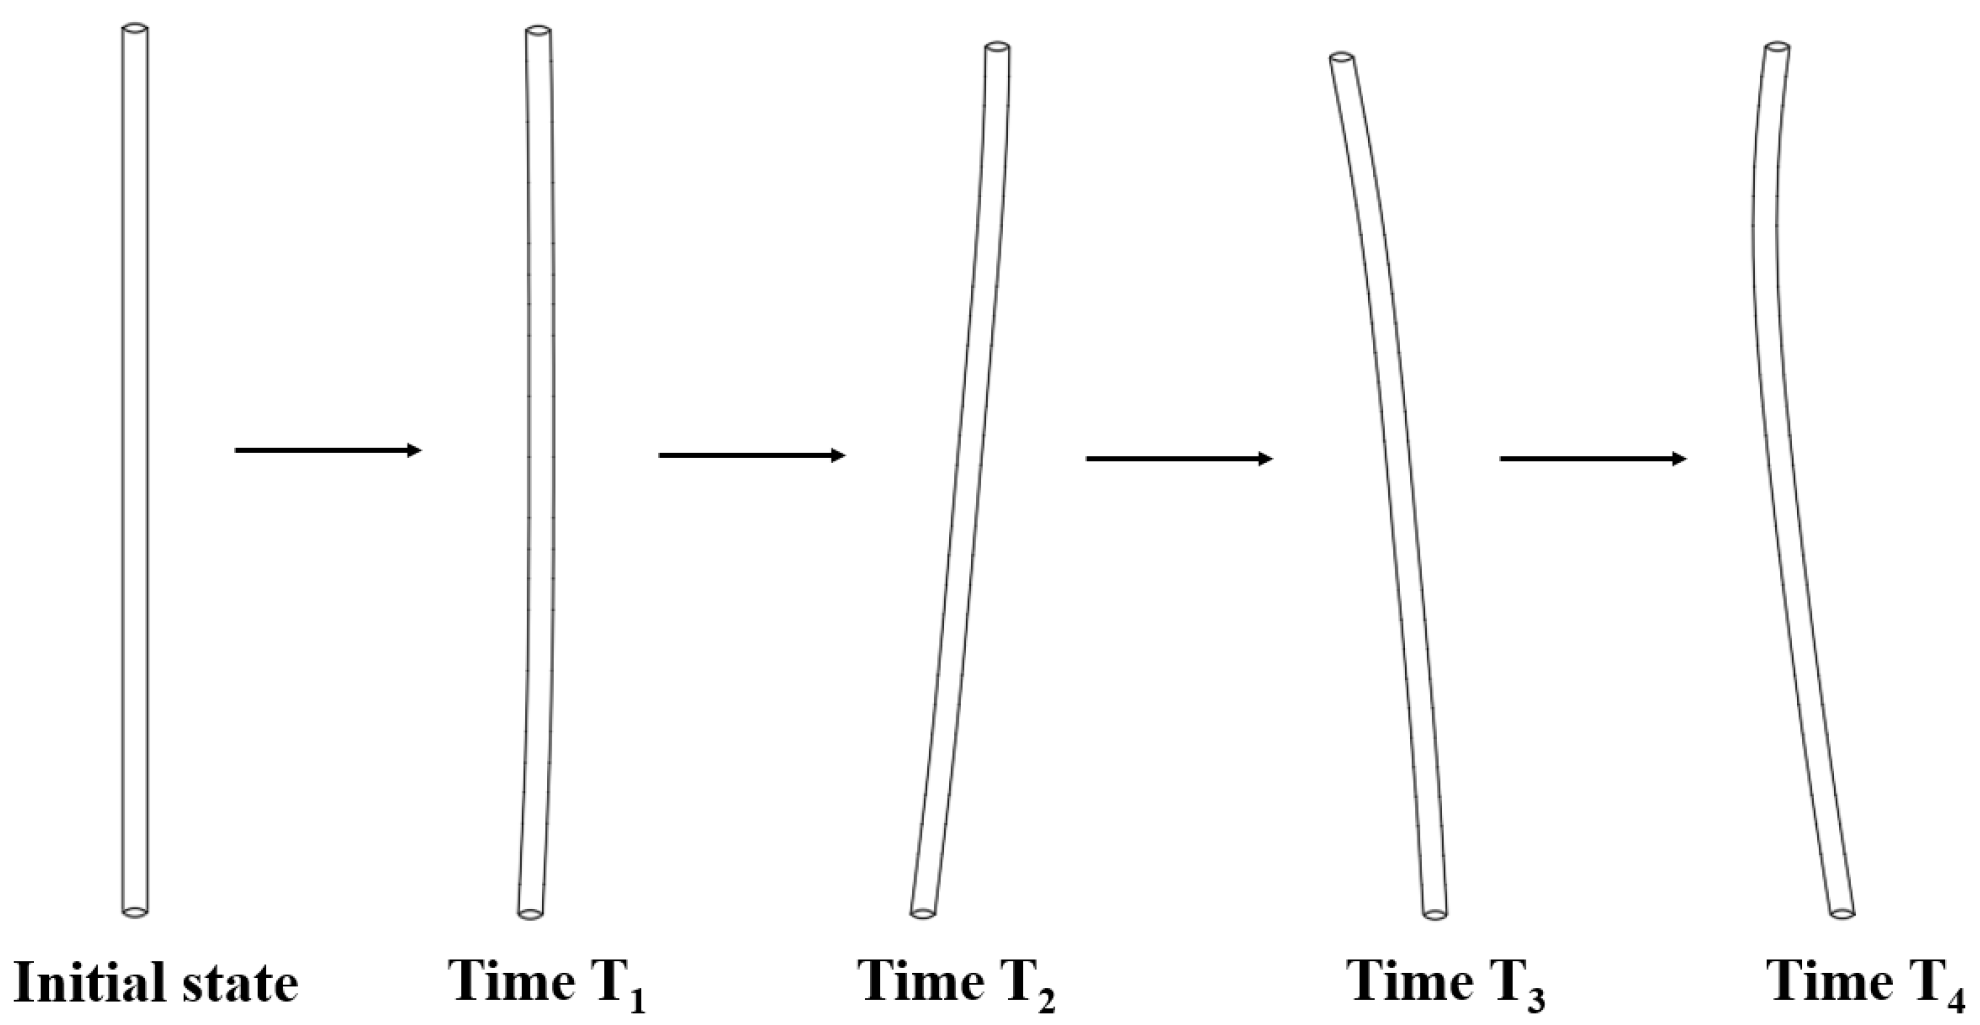
3.3.3. Analysis of Pile–Soil Interaction Mechanisms Under Seismic Load Conditions

According to the engineering geological survey report of the project, the classification of the project site is Class III. In accordance with China’s seismic code (GB 18306-2015) [30], the seismic motion parameters are defined based on a 10% probability of exceedance in 50 years, corresponding to a mean return period of 475 years. Under these conditions, the peak ground acceleration of the seismic motion is 0.065 g, the characteristic period of the seismic response spectrum is 0.45 s, the corresponding basic seismic intensity is Grade 6, and the design seismic group is the first group. We use the time history analysis method to select the acceleration time history curves of real earthquake records and artificial waves. Three seismic waves appropriate for Class III sites are selected from the PEER Ground Motion Database in this study, including (1) the Northridge earthquake, which occurred in 1994 (Arleta Station) and is suitable for soft soil conditions and with a characteristic period compatible with the site; (2) the Loma Prieta earthquake, which occurred in 1989 (Capitola Station) and matches the target spectrum for Class III sites; (3) an artificial wave synthesized according to code-specified response spectra. The acceleration time–history curves and corresponding Fourier spectra are presented in Figure 12a–c.
In the finite element model, viscoelastic artificial boundary conditions are implemented to accurately simulate seismic wave propagation, employing the equivalent nodal force method for seismic input [31,32]. The seismic excitation is modeled as vertically propagating shear waves (SV waves). Through a self-developed programming platform, the ground motion acceleration time–history data undergo numerical integration and transformation into equivalent nodal forces, which are then applied to boundary nodes to achieve dynamic excitation.
To improve research efficiency, scholars [33,34,35,36,37] have proposed a seismic wave screening strategy based on key response parameters (e.g., displacement and pile bending moment). This methodology not only reduces computational complexity but also enables focused analysis of critical loading conditions, proving particularly advantageous for preliminary assessments of complex structural systems.
The horizontal displacement of the pile top is an intuitive parameter for evaluating the overall response of pile foundations to ground motion, particularly critical for assessing the stability of pile foundations near slopes. Meanwhile, to avoid overlooking the inconsistency between internal forces and displacements, for example, some seismic loads may induce local high bending moments in the pile body due to high-frequency components while causing minimal displacement responses. Therefore, in this study, the most critical seismic waves are identified by considering both the pile-top horizontal displacement and the pile-body bending moment under the three types of seismic loading, as shown in Figure 13.
As shown in Figure 13, the artificial wave induces significantly larger pile top horizontal displacements and higher bending moments compared to the other two seismic waves and is accordingly selected for subsequent seismic analysis.
Based on site-specific seismic parameters and artificial wave characteristics, the acceleration time–history and Fourier spectrum of the artificial wave are analyzed in this study. Extracting lateral skin friction time–history data at 1 m depth intervals proves labor-intensive and computationally cumbersome. Therefore, four representative time points are selected to comprehensively represent seismic motion features: (1) T1 = 2.2039 s (corresponding to the dominant frequency energy concentration near the characteristic period), (2) T2 = 8.829 s (representing the peak ground acceleration), (3) T3 = 12 s (the midpoint of the energy duration, indicative of the primary seismic action phase), and (4) T4 = 18 s (marking the end of the motion attenuation stage). These time points capture the intensity, spectral characteristics, sustained action, and attenuation behavior of seismic motion, providing critical data for structural response analysis [38,39,40].
Figure 14 reveals the corresponding pile–soil interaction mechanism under seismic loading.
Analysis of pile–soil interaction mechanisms under artificial seismic loading (see Figure 14) reveals that the neutral point occurs near 17 m depth. Figure 14a,b shows a soil stiffness evolution characterized by softening and subsequent recovery. At the time of peak ground acceleration (T2 = 8.829 s), significant soil softening around the pile reduces positive skin friction to a minimum of 18.69 kN, while inertial effects induce maximum axial stress (5.47 MPa) in the pile. By the midpoint of the energy duration (T3 = 12 s), the rearrangement of soil particles reestablishes the interparticle frictional structure, increasing lateral skin friction by from 17.28% to 21.92 kN and reducing peak average axial stress by 11% due to enhanced soil constraints. Figure 14c shows delayed pile displacement response, with maximum horizontal displacement (10.07 mm) occurring at vibration attenuation completion (T4 = 18 s), while maximum average inclination (0.00628°) appears at T3. This demonstrates the dynamic equilibrium of pile oscillation during soil stiffness recovery, further corroborated by seismic deformation patterns in Figure 15.
Table 5 shows distinct pile–soil interaction responses under different loading conditions. Wind loads lead to progressive foundation tilting, extreme rainfall alters shallow soil properties to compromise stability, and seismic actions trigger brittle pile failure through dynamic inertial effects. Consequently, engineering practice requires specific mitigation measures: (1) addressing slope-edge effects for wind loading, (2) implementing shallow soil reinforcement for rainfall conditions, and (3) enforcing strict displacement controls under seismic events.

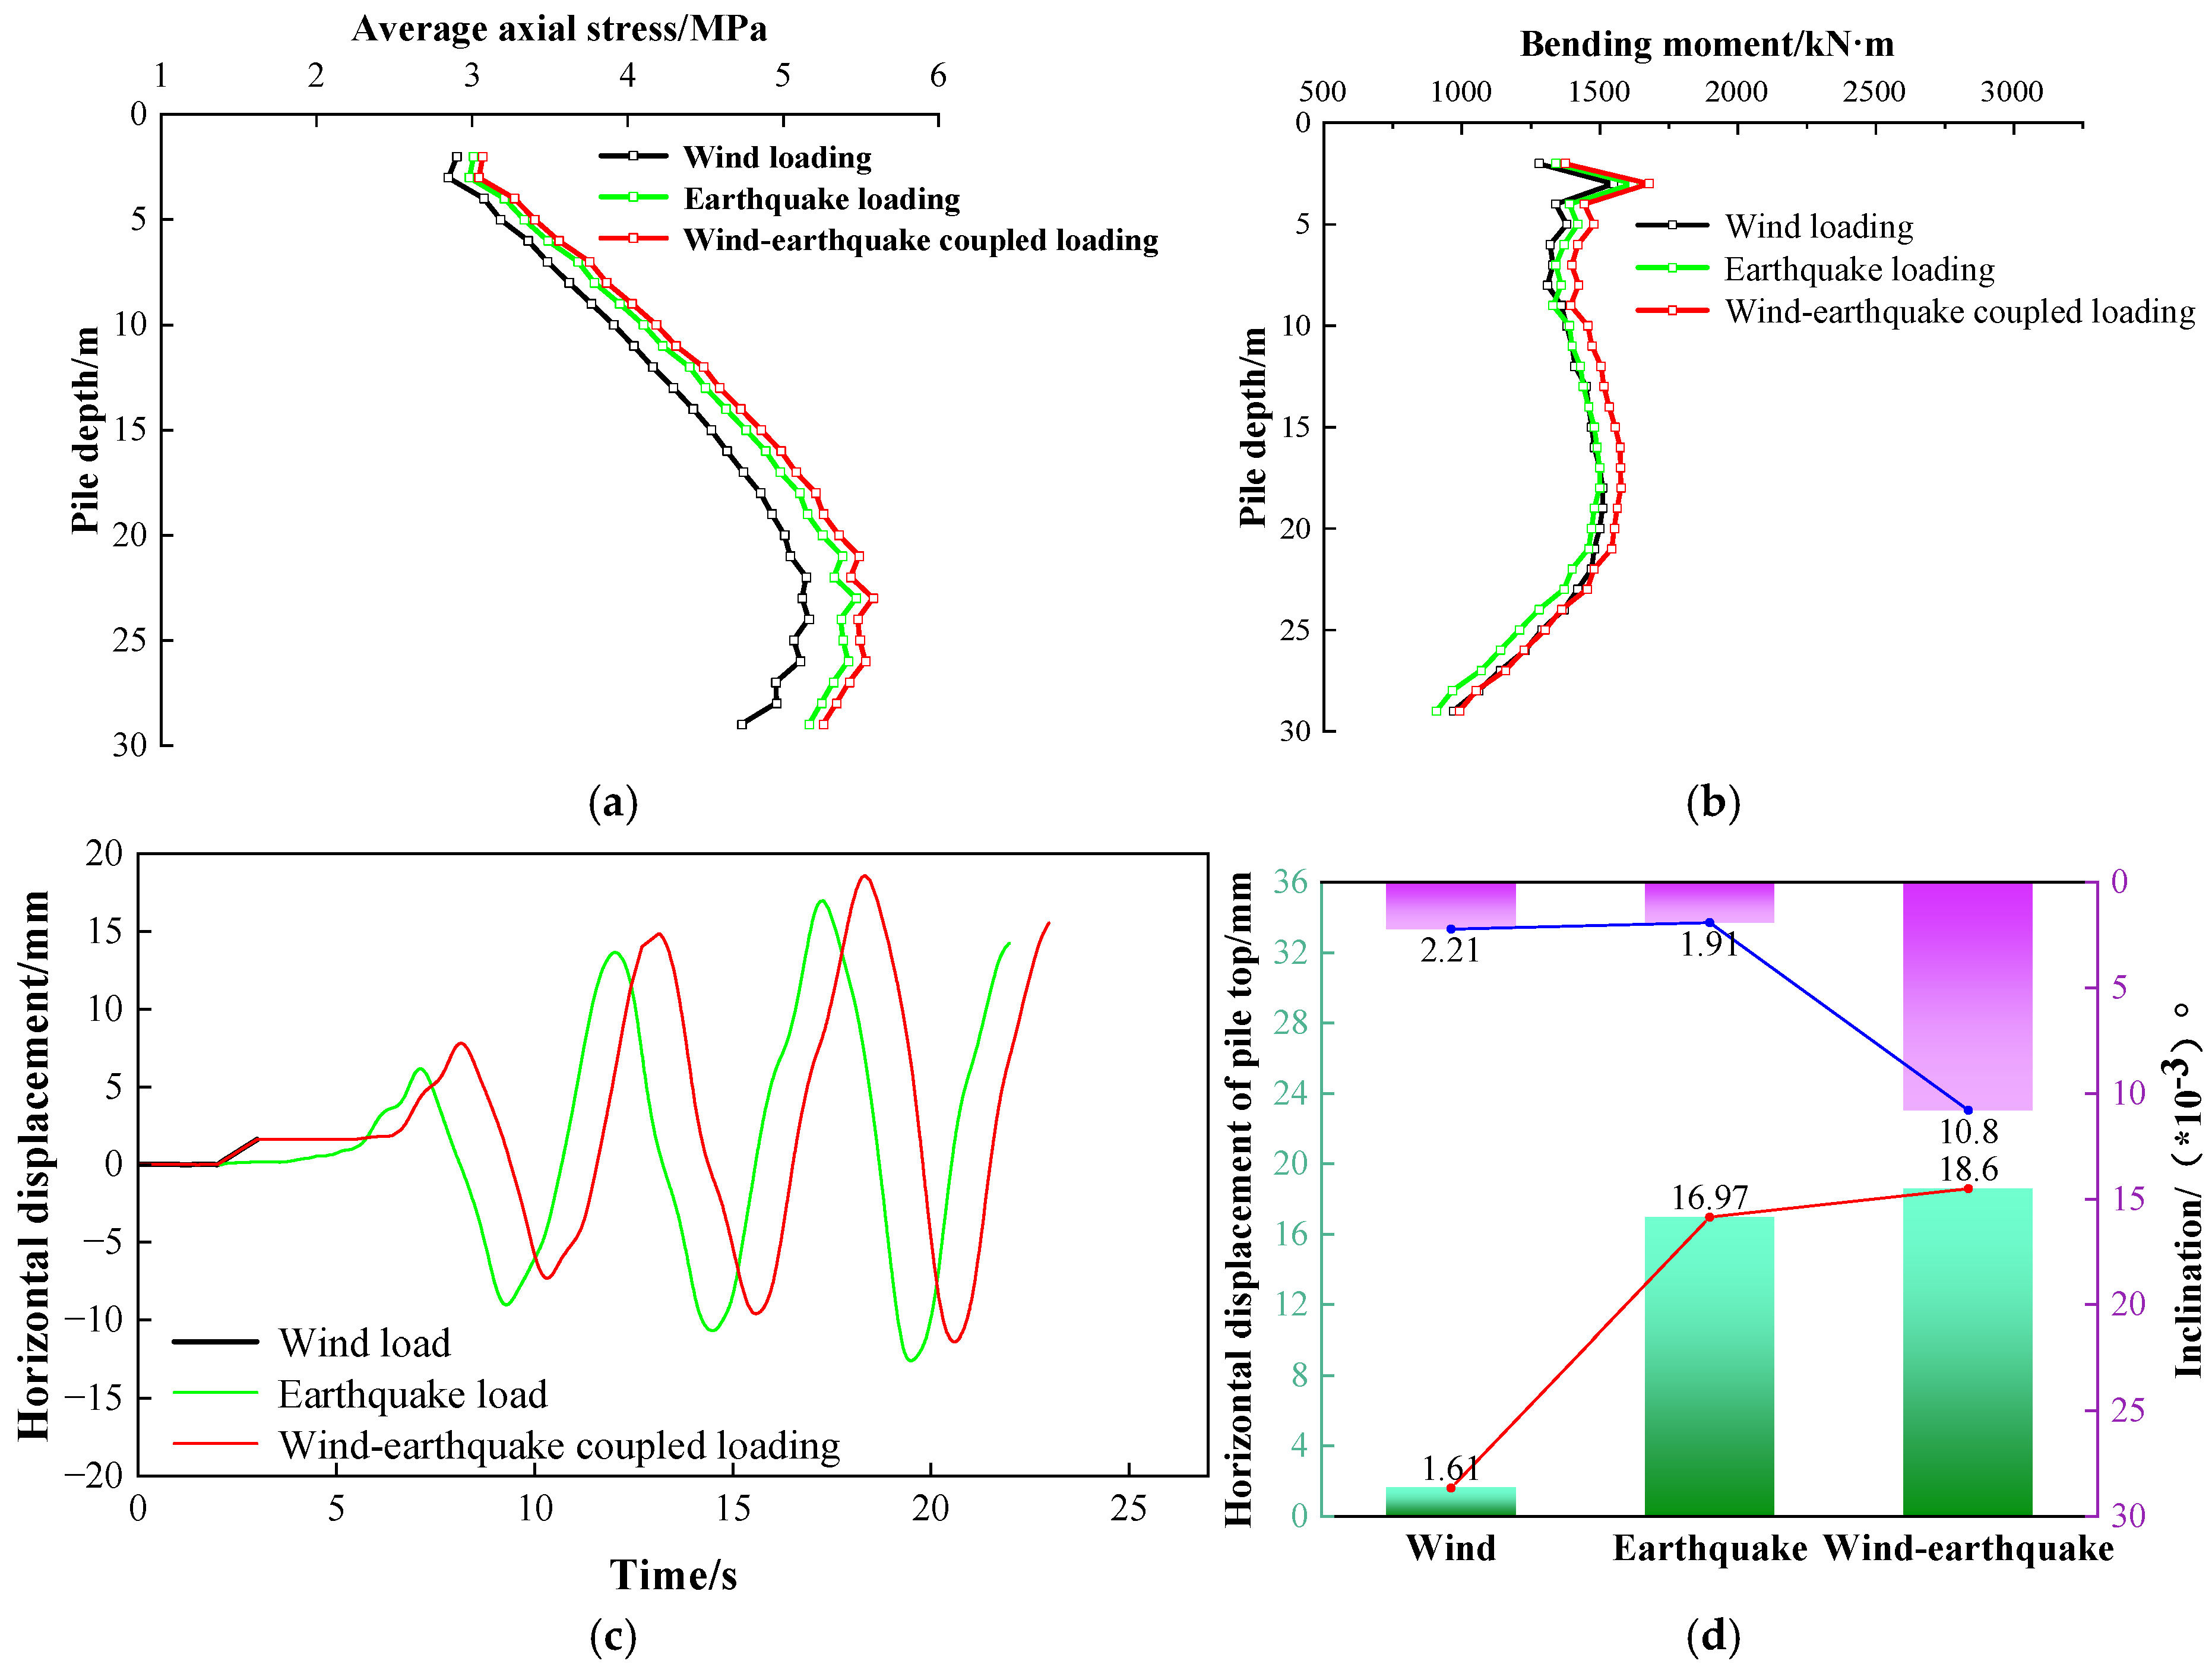
3.4. Analysis of Pile–Soil Interaction Mechanisms Under Coupled Loading Conditions

The mechanistic analysis of pile–soil interactions under individual loading conditions in Section 3.3 reveals distinct response characteristics: wind loads induce progressive bending through steady-state thrust, and rainfall infiltration induces shallow soil softening and pore pressure accumulation, while seismic motions trigger soil degradation via high-frequency impacts and energy duration effects. However, real-world engineering scenarios often involve coupled multi-load events, such as typhoon–rainstorm events or post-earthquake landslides exacerbated by subsequent rainfall. These coupled effects may synergistically influence pile–soil interactions, for instance, rainwater infiltration can amplify seismic-induced soil softening, while seismic residual deformation may compromise soil drainage capacity. Current research has primarily addressed single-hazard conditions, leaving the nonlinear superposition mechanisms of pile–soil systems under coupled multi-hazard scenarios systematically underexplored. Therefore, three representative coupled-hazard conditions are systematically simulated in this study: (1) wind–rainfall interaction, (2) combined wind–earthquake action, and (3) seismic–rainfall chain effects, aiming to identify sudden-change thresholds and failure mechanisms in pile foundation responses while providing multidimensional disaster resilience criteria for pile design in complex environments.
Notably, based on the disaster history of Ansai District in Yan’an, natural disasters often occur in sequence, so sequentially coupled scenarios are focused on in this study rather than simultaneous multi-load applications. For the method of load application, a step-by-step analysis of extreme loads is adopted without introducing coupling coefficients in this study. This is because, for the safe operation of wind turbine towers in collapsible loess areas, the cumulative damage caused by phased hazards is more worthy of attention than instantaneous interactions.
The coupled wind–rainfall loading condition reduces soil strength through rainwater infiltration while amplifying pile-top displacement. Therefore, shallow soil softening effects on pile skin friction, cumulative displacement, and inclination changes at the pile top under combined wind–rainfall loading are specifically examined in this study. The corresponding analytical results are shown in Figure 16a–c.
Figure 16a shows that, under coupled wind–rain loading, pile skin friction above the neutral point follows the same trend as in individual loading conditions, with deviations emerging at approximately 20 m depth where the coupled-load curve consistently sits between the two single-load curves. The peak positive skin friction reaches 20.90 kN under coupled loading, which is a 1.34% reduction compared to wind-only loading and a 2.26% increase relative to rainfall-only loading. Figure 16b,c reveals a quasi-linear superposition effect on pile-top horizontal displacement, with the coupled condition inducing 3.63 mm displacement (2% above linear superposition predictions) and 6.7% greater average inclination than linearly combined single-load cases. These nonlinear responses stem from spatiotemporal variations in soil softening and load synergy effects: rainfall-induced saturation rapidly increases pore water pressure, reducing effective stress and shear strength to diminish skin friction while promoting super-linear displacement growth. Concurrent non-uniform soil softening establishes a lateral stiffness gradient near the slope, amplifying pile bending deformation and significantly increasing average inclination angles.
Under coupled wind–earthquake loading conditions, the transient seismic impact superimposes on the steady-state wind thrust, altering pile–soil interaction mechanisms. Consequently, this study concentrates on pile bending moment variations and residual displacement effects at the pile top under combined loading, as shown in Figure 17.
Figure 17a shows that coupled wind–earthquake loading induces higher average axial stresses in pile groups compared to individual loading conditions, reaching a peak of 5.58 MPa due to the combined effects of sustained lateral wind thrust and transient seismic impulses. Figure 17b shows that coupled loading induces significantly larger bending moments (peak: 1678.95 kN·m) in the 5–20 m depth range, with 8.32% and 3.64% increases compared to wind-only and earthquake-only conditions, respectively. Below this depth range, the bending moments gradually decline to match seismic-load levels. Figure 17c,d reveals that the coupled loading induces 18.60 mm pile-top displacement (9.62% greater than seismic-only cases) and 10.8 × 10⁻³° average inclination. This amplified response occurs because, under the action of wind–earthquake coupling load, the lateral force continuously exerted by the wind load induces the initial displacement of the pile body, resulting in microcracks in the soil around the pile and reducing its stiffness. Subsequently, the high-frequency impact of seismic load generates energy resonance in the pre-damaged zones, and the initial displacement amplifies the seismic inertia effect, resulting in an increase in the total displacement of the pile top.
Under coupled rainfall–earthquake loading conditions, seismic activity induces soil cracking while concurrent rainfall infiltration exacerbates soil softening and pore pressure accumulation. Given this coupled hydro-mechanical effect, this study concentrates on analyzing the evolution law of the average axial stress and skin friction of pile groups, as shown in Figure 18.
Figure 18a,b shows that, under coupled rainfall–earthquake loading, the pile’s peak positive skin friction declines to 17.89 kN compared to single-load conditions, while the pile group’s average axial stress peaks at 5.63 MPa, exceeding single rainfall and earthquake loading by 7.03% and 2.86%, respectively. As illustrated in Figure 18c, time–history curves of skin friction at three characteristic depths (1 m shallow layer, 17 m near the neutral point, and 25 m deep layer) reveal distinct response patterns: shallow and neutral-point zones show 16.30% and 60.96% reduced friction amplitudes versus seismic-only loading, while the deep layer exhibits a 10.81% amplitude increase. These observations result from coupled hydro-mechanical effects, where rainfall infiltration saturates shallow soils, reducing effective stress and shear strength through elevated pore pressure, while seismic vibrations further degrade soil–pile interface bonding. Conversely, deeper soils maintain lower saturation due to delayed permeability, with seismic vibrations facilitating particle rearrangement into localized dense zones, thereby enhancing frictional resistance.
Table 6 shows that coupled loading conditions reduce peak positive skin friction by approximately 2.28–20.17%, potentially compromising the pile group’s overall bearing capacity and inducing superstructure differential settlement or tilting. While the peak average axial stress shows limited variation (with coupled loading marginally exceeding single-load cases), this suggests relatively low axial stress sensitivity to coupled effects, likely constrained by the pile group’s collaborative bearing capacity. In contrast, dynamic coupled loading dramatically amplifies pile-top horizontal displacement. For example, the wind–earthquake coupled condition produces 18.6 mm displacement, exhibiting 1.59-fold nonlinear amplification beyond single-load summation, with significant implications for the stability of high-rise buildings. Due to the substantial amplification of pile foundation horizontal displacements under earthquake-dominant coupled loading conditions, displacement control should be prioritized in the design of collapsible loess tower foundations. For projects similar to this study, this research proposes a tiered safety threshold based on relevant codes [44,45]: single environmental load (e.g., earthquake only) ≤ 10 mm; coupling loads conditions (e.g., earthquake dominated) ≤ 15 mm.

4. Conclusions

In this study, the ABAQUS finite element software is employed to analyze wind, extreme rainfall, and seismic loading effects on pile foundation behavior under both individual and coupled loading conditions. The main findings are as follows:
(1)
The distinct pile–soil interaction mechanisms under single-load conditions are as follows: wind loads cause progressive pile inclination through sustained lateral thrust, rainfall loading reveals time-dependent coupling effects, where prolonged duration increases shallow soil saturation and progressively reduces pile group bearing capacity, and seismic loading induces staged soil stiffness evolution (“softening-recovery”) via rapid seismic wave fluctuations.
(2)
The load-coupling effect reveals significant nonlinearity in both resistance and displacement responses, reducing structural stability through two mechanisms: reducing safety reserves via resistance attenuation (e.g., 2.28–20.17% reduction in peak positive skin friction under coupled loading) and displacement amplification (e.g., 1.85-fold nonlinear increase in pile-top horizontal displacement for wind–earthquake coupling versus seismic-only conditions).
(3)
The analysis confirms that seismic loading, whether it occurs independently or as part of coupled loading conditions, poses significant stability risks to pile foundations. Consequently, seismic design measures for wind turbine towers require particular emphasis in engineering practice.
(4)
Through site-specific simulations of the 100 MW wind farm in the Ansai loess hilly area, it is indicated that, during the construction of wind turbine tower foundations on this loess hilly site, the pile length should be 29 m for gentle slopes (with a gradient <35°) and 32–35 m for steep slopes (with a gradient >45°) to enhance the end bearing capacity and control the nonlinear displacement growth primarily caused by seismic loads. Additionally, the concrete of the pile foundations needs to be upgraded from C30 to C35 to enable them to bear an axial stress of 5.63 MPa under critical conditions.

Author Contributions

Conceptualization, S.C., K.F. and L.Z.; methodology, S.C., K.F., L.Z. and S.Y.; formal analysis, S.C., K.F., L.Z. and X.L.; writing—review and editing, S.C., K.F., L.Z. and H.D.; supervision, S.C., K.F., L.Z., S.Y., H.D. and X.L. All authors have read and agreed to the published version of the manuscript.

Funding

This research was funded by the Shaanxi Province Key Research and Development Plan Project (No. 2025SF-YBXM-525, No. 2025SF-YBXM-539), Natural Science Foundation of Shaanxi Province (No. 2025JC-YBMS-535), Research on Dynamic Characteristics of rubber particle Modified Foundation and Key technology of structural shock absorption (Approval number: KJYF-2023-7GS-CG08).

Data Availability Statement

The data used to support the findings of this study are included in the article.

Acknowledgments

We fully appreciate the editors and all anonymous reviewers for their constructive comments on this manuscript.

Conflicts of Interest

Author Lang Zhao was employed by China Anneng Group Science Industry Co., Ltd. The remaining authors declare that the research was conducted in the absence of any commercial or financial relationships that could be construed as a potential conflict of interest.

References

  1. Liu, C.; Zhao, F.; Qi, S.; Sun, W. On interaction between single pile and soil and mechanism of load transferring. J. Eng. Geol. 2004, 12, 406–410. [Google Scholar]
  2. Alsharedah, Y.; Newson, T.; El Naggar, M.H. A 3-D modelling of monopile behaviour under laterally applied loading. Geomech. Geophys. Geo-Energy Geo-Resour. 2024, 10, 173. [Google Scholar] [CrossRef]
  3. Zuo, H.; Bi, K.; Hao, H. Dynamic analyses of operating offshore wind turbines including soil-structure interaction. Eng. Struct. 2018, 157, 42–62. [Google Scholar] [CrossRef]
  4. Liu, Z.; Li, P.; Zhang, H.; Han, Q.; Qin, C.; Fan, S.; Xu, Z. Research on the Effect of Aerodynamic Imbalance on Fatigue Performance of a Wind Turbine Foundation with Embedded Steel Ring. Buildings 2024, 14, 1141. [Google Scholar] [CrossRef]
  5. Xia, S.R. Stability Study of Transmission Tower Foundation System under Strong Wind. Master’s Thesis, Wuhan University of Technology, Wuhan, China, 2018. [Google Scholar]
  6. Lu, S.; Hu, Z.; Yu, H.; Fan, W.; Fu, C.; Wu, D. Changes of extreme precipitation and its associated mechanisms in Northwest China. Adv. Atmos. Sci. 2021, 38, 1665–1681. [Google Scholar] [CrossRef]
  7. Du, W.; Kang, S.; Qin, X.; Ji, Z.; Sun, W.; Chen, J.; Yang, J.; Chen, D. Can summer monsoon moisture invade the Jade Pass in Northwestern China? Clim. Dyn. 2020, 55, 3101–3115. [Google Scholar] [CrossRef]
  8. Gu, W.; Chen, L.J.; Wang, Y.G.; Gao, H.; Wang, L.; Liu, Y.Y. Extreme precipitation over northern China in autumn 2021 and joint contributions of tropical and mid-latitude factors. Adv. Clim. Change Res. 2022, 13, 835–842. [Google Scholar] [CrossRef]
  9. Zhen, J.; Yang, X.; Wang, B.; Fan, H.; Meng, M. Study on the destruction of backfilled loess slopes by short-term extreme rainfall erosion. Bull. Eng. Geol. Environ. 2023, 82, 406. [Google Scholar] [CrossRef]
  10. Bian, H.; Wei, J. Bearing Characteristics and Negative Skin Friction Preventive Measures for Highway Bridge Pile Foundations in Collapsible Loess Areas Under Water Immersion. Water 2024, 16, 3587. [Google Scholar] [CrossRef]
  11. Tang, K.; Liu, D.; Xie, S.; Qiu, J.; Lai, J.; Liu, T.; Fang, Y. Analysis of loess water migration regularity and failure response of tunnel structure under rainfall environment. Bull. Eng. Geol. Environ. 2024, 83, 251. [Google Scholar] [CrossRef]
  12. Alotta, G.; Biondo, C.; Giaralis, A.; Failla, G. Seismic protection of land-based wind turbine towers using the tuned inerter damper. Structures 2023, 51, 640–656. [Google Scholar] [CrossRef]
  13. Huang, H.S. Simulations of 10MW wind turbine under seismic loadings. Compos. Struct. 2022, 279, 114686. [Google Scholar] [CrossRef]
  14. Wang, X.; Wang, X.; Li, J.; Liu, D.; Zhang, Y.; Jiang, D. Field Test Study of Performance of Bored Piles in Collapsible Loess. Appl. Sci. 2023, 13, 13113. [Google Scholar] [CrossRef]
  15. Gao, D.; Zhao, K.; Ma, B.; Han, Z.; Fan, J.; Akhtar, M.M. Research on the bearing behavior of single pile in self-weight collapsible loess areas. PLoS ONE 2023, 18, e0290878. [Google Scholar] [CrossRef]
  16. Liu, X.; Li, M.; Liao, H.; Huang, B.; Liu, S. Mechanical Properties of Adjacent Pile Bases in Collapsible Loess under Metro Depot. Appl. Sci. 2024, 14, 5819. [Google Scholar] [CrossRef]
  17. Hou, J.; Lu, Y.; Wang, J.; Yu, K. Calculation Model of Compaction Coefficient of Soil among SP−PSC Pile Group on Collapsible Loess Foundation. Appl. Sci. 2023, 13, 4003. [Google Scholar] [CrossRef]
  18. Yan, D.; Yu, J.; Wang, Y.; Zhou, L.; Tian, Y.; Zhang, N. Soil particle modeling and parameter calibration based on discrete element method. Agriculture 2022, 12, 1421. [Google Scholar] [CrossRef]
  19. Wen, H.; Deng, S.; Zhang, W.; Cheng, Q.; Wu, J.; Hu, D.; Feng, G.-L. A simplified approach to estimating the collapsible behavior of loess. Adv. Civil Eng. 2020, 2020, 3712595. [Google Scholar] [CrossRef]
  20. Xie, Y.; Yuan, C.; Bai, W. A Simplified Analysis Method for Seismic Response of Pile Foundation. Appl. Sci. 2023, 13, 12398. [Google Scholar] [CrossRef]
  21. Yang, Y.; Zhu, L.; Ma, H. Research on Vertical Bearing Capacity of Ram-compacted Pile with Vibrating Gravel Base in Collapsible Loess Foundation. In Proceedings of the 2017 2nd International Conference on Materials Science, Machinery and Energy Engineering (MSMEE 2017), Dalian, China, 13–14 May 2017; Atlantis Press: Dordrecht, The Netherlands, 2017; pp. 1062–1070. [Google Scholar]
  22. Given, J.; Soga, K. Comparison of Simple and Advanced Constitutive Models with Column Collapse Simulations in the Material Point Method. In Proceedings of the Geo-Congress, Los Angeles, CA, USA, 26–29 March 2023; pp. 30–39. [Google Scholar]
  23. Qiu, Y.; Wang, J.; Zhang, C.; Hua, L.; Zhou, Z. Numerical simulation study on the impact of excavation on existing Subway stations based on BIM-FEM framework. Buildings 2024, 14, 1444. [Google Scholar] [CrossRef]
  24. Alisawi, A.T.; Collins, P.E.F.; Cashell, K.A. Novel Methodology for Scaling and Simulating Structural Behaviour for Soil–Structure Systems Subjected to Extreme Loading Conditions. Appl. Sci. 2023, 13, 8626. [Google Scholar] [CrossRef]
  25. Tan, W.; Lei, Z.; Wang, Y.; Liu, J.; Lai, P.; Mei, Y.; Liu, W.; Zhou, D. Analyzing the Impact of Deep Excavation on Retaining Structure Deformation Based on Element Tracking. Buildings 2024, 14, 3069. [Google Scholar] [CrossRef]
  26. Miao, L.C.; Wang, F.; Lv, W.H. Calculation method of pile-soil stress ratio of rigid pile composite foundation. J. Undergr. Space Eng. 2014, 10, 1270–1274+1280. [Google Scholar]
  27. Gong, K.; Chen, X. Improved modeling of equivalent static loads on wind turbine towers. Wind Struct. 2015, 20, 609–622. [Google Scholar] [CrossRef]
  28. Freebury, G.; Musial, W. Determining equivalent damage loading for full-scale wind turbine blade fatigue tests. In Proceedings of the 2000 ASME Wind Energy Symposium, Reno, NV, USA, 10–13 January 2000; Volume 50. [Google Scholar]
  29. Gao, G.; Shu, H.; Yi, Z.; Yang, S.; Dai, J.; Zhang, F. A Scaled Numerical Simulation Model for Structural Analysis of Large Wind Turbine Blade. Energies 2024, 17, 4849. [Google Scholar] [CrossRef]
  30. GB 18306-2015; Seismic Ground Motion Parameters Zonation Map of China. General Administration of Quality Supervision, Inspection and Quarantine of the People’s Republic of China: Beijing, China; Standardization Administration of China: Beijing, China, 2015.
  31. Liu, X.; Meng, Q.; Xu, L.; Liu, Y.; Tian, X. Modular Steel Buildings Based on Self-Locking-Unlockable Connections Seismic Performance Analysis. Buildings 2025, 15, 678. [Google Scholar] [CrossRef]
  32. Li, S.; Liu, J.; Bao, X.; Jia, Y.; Chen, Y.; Xiao, L. Implementation of artificial boundary substructure seismic input method in ABAQUS. Nat. Disasters 2020, 29, 133–141. [Google Scholar]
  33. Katsanos, E.I.; Sextos, A.G.; Manolis, G.D. Selection of earthquake ground motion records: A state-of-the-art review from a structural engineering perspective. Soil Dyn. Earthq. Eng. 2010, 30, 157–169. [Google Scholar] [CrossRef]
  34. Wang, G. A ground motion selection and modification method capturing response spectrum characteristics and variability of scenario earthquakes. Soil Dyn. Earthq. Eng. 2011, 31, 611–625. [Google Scholar] [CrossRef]
  35. Zhang, L.; Liu, Y.; Hu, J. Statistical analysis of earthquake-induced bending moment in fixed-head piles embedded in soft clay. J. Eng. Mech. 2017, 143, 04017059. [Google Scholar] [CrossRef]
  36. Wang, R.; Hu, Z.; Hao, Z.; Chen, L.; Shi, G.; Hou, R.; Zuo, R. Seismic Vulnerability Analysis of Long-Span Prestressed Concrete Composite Box Girder Bridge with Corrugated Steel Webs under Construction. Buildings 2023, 13, 1598. [Google Scholar] [CrossRef]
  37. Hasanoğlu, S.; Güllü, A.; Dindar, A.A.; Müderrisoğlu, Z.; Özkaynak, H.; Bozer, A. Optimal selection and scaling of ground motion records compatible with input energy and acceleration spectra. Earthq. Eng. Struct. Dyn. 2024, 53, 2382–2404. [Google Scholar] [CrossRef]
  38. He, Q.; Li, X.; Dong, D.; Li, Y.; Yang, Y. Research on Peak Acceleration and Spectral Attenuation Characteristics of Near Field Vibration. J. Geotech. Eng. 2015, 37, 2014–2023. [Google Scholar]
  39. Shi, J.; Zhang, L.; Ma, T.; Zhai, Y. Study on the cumulative damage effect of concrete gravity dams considering the duration of strong earthquake energy. J. Water Resour. Water Eng. 2020, 31, 174–179. [Google Scholar]
  40. Wang, S.; Yu, R.; Li, X. The Influence of Seismic Time Frequency Characteristics on Seismic Response of Soil Sites. J. Civil Eng. 2021, 54, 101–113. [Google Scholar]
  41. Li, Q.; Qing, Y.; Cui, K.; Zhnag, D.; Li, P. Research progress on dynamic characteristics and constitutive models of soil under long-term cyclic loading. J. Southwest Jiaotong Univ. 2024, 59, 377–391. [Google Scholar]
  42. Qiao, F.; Chang, C.; Bo, J.; Wang, L.; Wang, J. Study on the dynamic characteristics of loess. Sustainability 2023, 15, 5428. [Google Scholar] [CrossRef]
  43. Yan, W.; Tian, X.; Wu, Z.; Wang, P.; Kang, L. Seismic effects of loess slopes using physical modeling and numerical simulation. Front. Earth Sci. 2023, 10, 1058701. [Google Scholar]
  44. NB/T 10311-2019; Technical Specification for Design of Foundation of Wind Turbine Generators in Wind Farms. National Energy Administration of the People’s Republic of China: Beijing, China, 2019.
  45. GB 50025-2018; Code for Construction in Collapsible Loess Areas. Ministry of Housing and Urban–Rural Development of the People’s Republic of China: Beijing, China, 2018.
Figure 1. Topographic and geomorphic map of the wind turbine site study area.
Buildings 15 02152 g001
Figure 2. Diagrams of geology and foundation for the investigated study case wind turbine project site.
Buildings 15 02152 g002
Figure 3. Numerical model diagram.
Buildings 15 02152 g003
Figure 4. Relationship between side skin friction of pile and relative displacement.
Buildings 15 02152 g004
Figure 5. Diagram of deformation coordination of pile composite foundation.
Buildings 15 02152 g005
Figure 6. Axial stress comparison diagram due to the self-weight action of the wind tower.
Buildings 15 02152 g006
Figure 7. Mesh distribution of pile cap and pile shaft.
Buildings 15 02152 g007
Figure 8. Mechanism diagram of pile−soil interaction under wind load conditions: (a) skin friction curve diagram along pile depth; (b) average axial stress diagram along pile depth; (c) pile displacement inclination diagram.
Buildings 15 02152 g008
Figure 9. Rainfall curve.
Buildings 15 02152 g009
Figure 10. Diagram of model rainfall load.
Buildings 15 02152 g010
Figure 11. Time−history diagram of pile−soil interaction mechanisms under extreme rainfall conditions: (a) skin friction curve diagram along pile depth; (b) average axial stress diagram along pile depth; (c) pile displacement diagram.
Buildings 15 02152 g011
Figure 12. Seismic wave acceleration time–history curve and Fourier spectrum.
Buildings 15 02152 g012
Figure 13. Time–history curves of pile top displacement and pile body bending moment diagram under different seismic loads: (a) Time–history curve of horizontal displacement at pile top; (b) pile bending moment diagram.
Buildings 15 02152 g013
Figure 14. Time–history diagram of pile–soil interaction mechanism under artificial wave seismic load: (a) skin friction curve diagram along pile depth; (b) average axial stress diagram along pile depth; (c) pile displacement inclination diagram.
Buildings 15 02152 g014
Figure 15. Deformation diagram of a pile under the artificial seismic wave ground vibration load.
Buildings 15 02152 g015
Figure 16. Time–history diagram of pile–soil interaction mechanisms under coupled wind–rainfall loading: (a) skin friction curve diagram along pile depth; (b) time–history curve of horizontal displacement of pile top; (c) pile displacement inclination diagram.
Buildings 15 02152 g016
Figure 17. Time–history diagram of pile–soil interaction mechanisms under coupled wind–earthquake loading: (a) average axial stress diagram along pile depth; (b) pile bending moment diagram; (c) time–history curve of horizontal displacement at pile top; (d) pile displacement inclination diagram.
Buildings 15 02152 g017
Figure 18. Time–history diagram of pile–soil interaction mechanisms under coupled rainfall–earthquake loading: (a) skin friction curve diagram along pile depth; (b) average axial stress diagram along pile depth; (c) skin friction time–history diagram.
Buildings 15 02152 g018
Table 1. Key distinctions between this study and existing multi-hazard research on pile foundations.
AspectPrior StudiesThis Study
Hazard scopeSingle load (Wind or Rain or Quake) [1,2,3,4,5,9,10,11,12,13]Wind, extreme rainfall, seismic mutual coupling load
Geological FocusGeneric soils [2,3], Saturated loess [10]Explicitly accounts for loess’ unique wet-collapsible deformation and seismic liquefaction
Innovation AimGeneral structural response [12]Pile–soil interaction mechanisms for wind turbine stability
Design outputQualitative resilience [12], Empirical safety factors [5]Parametric safety thresholds
Table 2. Stratigraphic parameters.
Natural Unit Weight
(kN/m3)
Compression Modulus (MPa)Cohesion
(kPa)
Friction Angle (°)
Q3eol loess layer15.609.202620
Q3eol ancient soil 17.4511.083021
Q2eol ancient loess layer16.649.933322
Table 3. Material parameters of each component of the numerical model.
MaterialDensity
(kg/m3)
Modulus of Elasticity (MPa)Poisson’s RatioFriction Angle (°)Cohesion
(kPa)
Upper soil1590100.32535.5
Lower soil1700100.33038
Wind turbine tower foundation240032,5000.25--
Table 4. Comparison between theoretical calculation and finite element analysis of average axial stress of pile shaft.
DepthTheoretical Value
(MPa)
Analog Value
(MPa)
Relative Error
0–12 m0.82–5.010.80–4.95≤2.1%
12–24 m5.01–5.154.95–5.12≤2.15%
24–29 m5.15–4.725.12–4.70≤2.08%
Table 5. Comparison of dynamic response of pile 4 under single-load conditions.
Comparison ItemsWind LoadExtreme Rainfall Load Seismic Load
Neutral point position (m)18.0018.0017.00
Maximum lateral skin friction (kN)21.1824.1321.92
Maximum horizontal displacement (mm)1.612.0110.07
Maximum axial stress of pile groups (kN)5.155.265.47
Mechanism of actionContinuous pushing leads to gradual tilting of the pile bodyTime-dependent coupling effects dominateThe staged evolution of soil stiffness featuring initial softening followed by recovery
Trend of lateral skin friction variationThe pile near the slope has the highest skin frictionInitial increase followed by decreaseinitial decrease followed by an increase and subsequent reduction
Axial stress response characteristicsSignificant increase in shallow layersprogressive linear decaydynamic oscillatory variation
Cumulative displacement modeprogressive tilting modeS-shaped transition from I-shaped, and shallow dominatedhysteretic response
Evolution of soil stiffnessWeakening of lateral confinement → Deep-layer stiffness compensationrapid shallow-layer degradation → gradual deep-layer evolutionstiffness softening → particle restructuring recovery → dynamic equilibrium [41,42,43]
Table 6. Pile–soil response of pile 4 under single and coupled loading conditions.
Load CombinationWindExtreme
Rainfall
EarthquakeWind–Rainfall
Coupled
Wind–Earthquake CoupledRainfall–Earthquake Coupled
Pile Response Parameters
Maximum positive skin friction (kN)21.1824.1321.9220.9020.2917.89
Maximum average axial stress of pile group (MPa)5.155.265.475.165.585.63
Peak horizontal displacement of pile (mm)1.612.0110.073.6318.618.35
Disclaimer/Publisher’s Note: The statements, opinions and data contained in all publications are solely those of the individual author(s) and contributor(s) and not of MDPI and/or the editor(s). MDPI and/or the editor(s) disclaim responsibility for any injury to people or property resulting from any ideas, methods, instructions or products referred to in the content.

