Article

Environmental Risk Mitigation via Deep Learning Modeling of Compressive Strength in Green Concrete Incorporating Incinerator Ash

by
Amin Amraee
1,
Seyed Azim Hosseini
1,*,
Farshid Farokhizadeh
2 and
Mohammad Hassan Haeri
1
1
Department of Civil Engineering, South Tehran Branch, Islamic Azad University, Tehran 1477893855, Iran
2
Industrial Management, Imam Hossein University, Tehran 1698715861, Iran
*
Author to whom correspondence should be addressed.
Buildings 2025, 15(7), 1103; https://doi.org/10.3390/buildings15071103
Submission received: 15 February 2025 / Revised: 1 March 2025 / Accepted: 14 March 2025 / Published: 28 March 2025
(This article belongs to the Section Building Materials, and Repair & Renovation)

Abstract

:
Green concrete uses incinerator ash or lightweight ash as a substitute for cement. It retains the properties of conventional concrete. Initial laboratory tests have determined the optimum mix design, weight variation, and compressive strength. Defined as an environmentally friendly material, green concrete reduces pollution or improves environmental conditions during production. This study incorporates incinerator ash, a toxic byproduct of waste disposal, into concrete production through a phased laboratory and numerical approach. A database for deep learning modeling was created using Convolutional Neural Networks (CNNs) and the Multi-Verse Optimizer (MVO) algorithm. After evaluating the efficiency and structure of the deep learning model through MATLAB coding, the focus shifted to analyzing the sensitivity of the input parameters on the output parameter using MATLAB for coding, training, and evaluation. The initial results indicate a significant effect of incinerator ash on the compressive strength of concrete. In addition, the deep learning modeling results show that the regression coefficient (R) of 90% reflects the accuracy and efficiency of the deep learning model for the current mix design. The error index, which is also reported, shows that the applied deep learning modeling method achieves optimal performance, with an average error of 0.14. The sensitivity analysis results of the introduced optimal model show that among the five input parameters, cement weight (W) has the greatest influence on compressive strength, as indicated by the statistical group distances from the baseline, percentage values, and average values.

1. Introduction

The term green concrete refers to environmentally friendly concrete. Currently, cement production accounts for about 7% of the harmful environmental pollution affecting the ozone layer, with each ton of cement produced releasing nearly one ton of carbon dioxide. Moreover, Iran’s commitment to reducing greenhouse gas emissions by 2025 under the Paris Agreement requires a shift in the construction industry towards eco-friendly concrete systems. Many of these green systems are already being implemented in the United States and European countries. Structural research and standards, such as the Building Research Establishment Environmental Assessment Method (BREEAM) in the United Kingdom and the Leadership in Energy and Environmental Design (LEED) standard in the United States, are among the most prominent environmental rating systems. These systems are designed to provide guidelines for architects and building owners to minimize negative impacts on the environment and ecosystems. They also emphasize the effective and optimized use of natural resources. Globally, buildings are responsible for nearly half of greenhouse gas emissions, energy consumption, and raw material use. Throughout history, humans have continuously innovated in architecture to organize their surroundings and meet their basic needs, aiming to create a livable environment that addresses both physical and mental well-being. Today, despite the availability of modern materials and technological advances—some of which are costly and environmentally damaging—the desired comfort is not always achieved; sustainable architecture has partially addressed this issue. In recent years, the construction industry has grown rapidly, leading to a significant increase in concrete consumption. As a result, we are facing a shortage of conventional construction materials such as cement and aggregates. Green concrete is a viable alternative to reduce the demand for traditional building materials. In the modern era, green architecture has gained significant importance through the use of innovative materials, smart and nano technologies, and an emphasis on renewable rather than non-renewable resources. As a result, green concrete can be an important step towards creating healthier living spaces, promoting sustainability and improving the quality of life.
The significant increase in waste generation worldwide in recent decades has led to the widespread adoption of incineration technology as a method of reducing the volume and weight of municipal waste and recovering energy from it. However, due to the presence of heavy metals and toxic compounds such as dioxins and furans in the ash produced from municipal waste incineration, the management and neutralization of these materials is of critical importance [1]. A study conducted by Maknoun et al. in 2021 investigated different methods of stabilization and solidification of incineration ash to mitigate the environmental risks associated with this material [2]. In 2022, Divandari and Maknoun evaluated the performance of hot mix asphalt reinforced with incinerator ash and demonstrated that this method could effectively reduce environmental pollution. Global population growth and the increase in waste production, along with the expansion of landfills, have exacerbated environmental pollution [3]. In this context, incineration technology, which reduces the volume of municipal solid waste by 90%, is recognized as an effective solution for waste management. After the incineration process, the remaining ash, known as bottom ash, accumulates in landfills, with millions of tons produced annually. Recent studies have examined the use of incinerator ash in the construction industry, including the production of ceramics, cement blocks, and concrete mixes, with positive results in the strength and durability of these products. For example, a study published by Mohammadi et al. in 2023 in the Journal of Civil Engineering and Modern Technologies examined the mechanical properties and durability of geopolymers (alkali-activated slag) containing fly ash and demonstrated that these mixtures could improve the strength and stability of structures [4]. In addition, Razieh Garshasbi in 2019 and Saeidi and Abedini in 2020 investigated the feasibility of using incineration ash in lightweight concrete production. These studies suggest that the use of incineration ash in concrete production can serve as a solution to reduce the consumption of non-renewable natural resources, such as cement, and reduce environmental pollution. In 2020, Sahraeian and colleagues investigated the feasibility of using fly ash and bottom ash in the construction of concrete and asphalt pavements [5]. Municipal solid waste and medical waste, especially during the COVID-19 pandemic, have posed challenges to waste management systems due to the significant increase in the volume of waste containing hazardous and carcinogenic materials. The World Health Organization reported in 2022 that the volume of medical waste increased more than sixfold during the pandemic, putting immense pressure on waste management systems [6]. Furthermore, a study by Lee et al. in 2023 investigated the durability and sustainability of engineered concrete made from municipal solid waste incinerator bottom ash (MSWIBA) [7]. This research used Portland cement (OPC), granulated blast furnace slag (GGBFS), and fly ash (FA) as binders to produce lightweight artificial aggregates from incinerator ash and demonstrated that these compositions can help reduce the environmental hazards associated with the accumulation of municipal waste [7].
Machine learning models for predicting the compressive strength of self-compacting concrete incorporating incinerated biomedical waste ash is another study conducted by Nahushananda Chakravarthy et al. in 2023 [8]. Artificial neural network modeling was used to predict the compressive strength of self-compacting concrete based on a database containing experimental tests. Jigal Lee’s research in 2021 investigated the compressive strength of concrete containing municipal solid waste incinerator ash [9]. In 2024, Altunci conducted a comprehensive study on the estimation of the compressive strength of concrete using machine learning models [10]. That review study examined various methods for predicting and estimating the compressive strength of concrete using deep learning approaches. “Multi-Objective Optimization of Sustainable Concrete Containing Fly Ash Based on Environmental and Mechanical Considerations” is another study conducted by Onyelowe and colleagues in 2022 [11]. After presenting the theoretical foundations and reviewing the technical literature, that study examined the research gap in this area. Based on the review of relevant publications, a major limitation identified in this research is the lack of sufficient data for effective modeling. To address this, an extensive laboratory program was conducted to provide the necessary data. In addition, two domestic projects involving green concrete and a sample of green concrete incorporating incinerator fly ash were presented. These included the National Housing Project in Shahrekord (200 units by Kian Kar Company (Dubai, United Arab Emirates)) and the Tehran-North Freeway Bridge Project in the second section (Rahyab Melal Company (Tehran, Iran)), which serve as practical examples of green concrete. The summaries in this part show that green concrete has attracted the interest of Iranian researchers since 2011, and its principles were established in the international literature between 2003 and 2005. Despite the ongoing research, numerical studies and deep learning modeling in this area are rarely addressed. Therefore, the lack of comprehensive research that includes both laboratory experiments and numerical modeling is clearly evident. Furthermore, the results of previous studies on the mix design of green concrete with incinerator ash have been used as guidelines and templates in the third section of this study. This highlights the obvious research gap in the numerical modeling of the compressive strength of green concrete with incinerator ash.
Based on the review of the technical literature and the study of publications in the research field, one of the main limitations of the present study is the lack of sufficient data for modeling. Therefore, this study aims to address this limitation by conducting a laboratory program to provide the necessary data for modeling.
Given that concrete is one of the main materials used in the construction process in Iran, the main objective of this research is to conduct a sensitivity analysis in modeling the prediction of the compressive strength of concrete incorporating incinerator ash using deep learning methods. The data used in this research were extracted from a series of tests conducted in the concrete technology laboratory of Sazeh Pey Consulting Engineers. The first part of this article provides an introduction and literature review of the technical aspects of the research. The second part presents and defines the research methodology. The third part examines the deep learning methods used. The fourth part discusses the database and modeling conditions. Finally, the fifth part analyzes the sensitivity results.

2. Methodology

In this research, the methodology consists of several main stages. In the first stage, a laboratory program was designed and executed to complete the necessary database for modeling using deep learning methods. In this stage, compressive strength tests were conducted as the most important part of the experiments. In addition, to design the composite concrete mix using incinerator ash, all the required tests were conducted with different percentages of incinerator ash [8]. Figure 1 shows an example of pictures related to the required tests. In addition, Table 1 shows an example of the different weight percentages of materials used in the C30 concrete mix design. Figure 2 shows the aggregates which used on concrete mix design.
Upon completion of the experimental program, a deep learning model was developed. In this process, a combination of Convolutional Neural Networks (CNNs), one of the most widely used and effective models in deep learning, and the Multi-Verse Optimizer (MVO) algorithm was used for implementation in the MATLAB 9.5 software environment [8]. In this phase, the optimal neural network structure was evaluated using various evaluation metrics, and the best model configuration was identified. The final phase of this research focuses on a sensitivity analysis and the investigation of the impact of input parameters on the output parameters of the model.

2.1. Convolutional Neural Network (CNN)

A Convolutional Neural Network (CNN) was used as a deep learning model to extract complex features from the input data. In this study, the CNN was used to predict the compressive strength of concrete based on influencing parameters. The network architecture consists of convolutional layers, activation layers (such as ReLU), pooling layers, and fully connected layers. The convolutional layers extract essential features from the input data, while the pooling layers reduce dimensionality and prevent overfitting. Finally, the fully connected layers process the extracted features and predict the compressive strength of the concrete. The weights and hyperparameters of this network were first assigned and then optimized using the MVO algorithm to improve the accuracy of the model.

2.2. MVO Algorithm

The Multi-Verse Optimizer (MVO) is a metaheuristic algorithm inspired by cosmic phenomena, using the concepts of galaxies, black holes, and white holes to explore the solution space. In this algorithm, each galaxy represents a potential solution, and its fitness value is calculated based on its alignment with the objective function. The optimization process consists of two main phases: exploration and exploitation. During the exploration phase, weaker galaxies are influenced by stronger ones, and their positions are adjusted by controlled random selection. In the exploitation phase, galaxies are moved closer to the best-known solution to improve accuracy. Two key parameters, the wormhole existence probability (WEP) and the traveling distance rate (TDR), regulate the balance between these two phases. This iterative process continues until the best galaxy is identified as the optimal solution, and its values are used to fine-tune the CNN weights.

2.3. Data Collection

In this study, the mix design of green concrete is investigated in two stages. Prior to the main research, comprehensive information on lightweight green concrete and the properties of incinerator ash is gathered through literature reviews and visits to incineration plants. In the first stage, laboratory tests are designed and conducted to develop the mix design, measure weight changes, and evaluate the strength of the green concrete. This is achieved through compressive strength tests on 5 × 5 cm and 10 × 10 cm concrete and mortar samples. Once these tests are completed and the desired results are obtained, the necessary data are collected for the second stage—theoretical studies using software calculations. In the second stage, additional studies are carried out to select the optimization algorithm and the artificial neural network, with the necessary modeling performed using MATLAB software. The performance of the modeling is then evaluated using various evaluation indicators such as the correlation coefficient (R2) and error indices such as the root mean square error (RMSE). Finally, a sensitivity analysis is performed to interpret the results of the deep learning modeling. This study uses MATLAB and EXCEL 2023 software.
The purpose of this part is to outline the research methodology and study approach. This section explains the principles of the laboratory program, the materials used, and the method of deep learning modeling. In addition, preliminary information about the research is provided, and the analysis of the results is discussed in the following section. The research methodology algorithm is briefly summarized in Figure 1 without a breakdown structure. Each phase of this flowchart has several subphases, which are described in detail in the next section. The laboratory program in this study is based on ABA and ACI standards, and all material and concrete tests were conducted according to ASTM standards. Material tests such as aggregate gradation, water consumption, and cement also followed ASTM standards and guidelines.

3. Laboratory Program

In this study, concrete samples were selected and prepared with different ash contents ranging from 0 to 20%. For each mix, the amount of superplasticizer SP was set at approximately 2.5% (as plasticizer), and the water/cement ratio was adjusted based on the concrete grade: 0.32 for grade 60, 0.36 for grade 40, and 0.4 for grade 20. The ash percentages were chosen within this range based on previous studies to achieve optimum workability and strength. A reference concrete (no ash) with 0% ash content was used as a control sample to evaluate the mechanical properties. Five concrete strength grades were considered in this investigation, including 20, 30, 40, 50, and 60. For each grade, different ash contents were tested to evaluate the effect of this material on the composite concrete properties. A total of 100 cubic specimens were selected for compressive strength testing, with each specimen containing different proportions of material. The goal of this experimental program was to establish a comprehensive database to support deep learning modeling. Table 1 and Table 2 show examples of the mix designs for categories 30 and 60.
First, incinerator ash and pea gravel are mixed in a rotary mixer for 2 min. Fine sand, washed sand, and stone powder are then added to the mixture, and mixing continues for another 2 min. One third of the total mixing water is added to the mixture, followed by 1 min of mixing, after which cement is added and mixed for another 4 min [9]. The next third of the water is then added, and the mixture is mixed for an additional 1 min. Finally, the remaining water and a superplasticizer are added, and mixing continues for the final 4 min [10]. The total mixing time is 14 min. After preparation, a slump test is performed on the concrete, or the mix is poured into a V-funnel for testing. In the final stage, the prepared mixture is poured into cubic 15 × 15 cm molds, with three molds assigned to each sample [11].
It should be noted that similar tables have been prepared for other concrete grades such as C20, C40, and C50. However, due to the length of this article, these tables are not presented here. They are available on request if required.

Benefits of Using Waste Incineration Ash in Concrete

Concrete is the most widely used construction material in the world, with cement as its primary binding component. Over the past three decades, cement production has increased dramatically worldwide, and Iran’s cement production is expected to triple by 2050. However, cement production raises significant environmental concerns. Each ton of clinker produced emits approximately one ton of CO2 into the atmosphere, accounting for approximately 5–7% of global CO2 emissions. The primary sources of these emissions in cement production are fuel combustion and the decomposition of CaCO3 into CaO and CO2. India is the world’s second largest cement producer after China, producing 280 million tons of cement in 2014, with an expected annual growth rate of 8 to 10 percent in the coming years. Iran ranks fourth in global cement production. As the industry’s needs continue to grow, cement prices have steadily increased due to rising demand and raw material costs.
The energy consumption and CO2 emissions associated with cement production can be reduced by using fly ash as a partial replacement for clinker. This approach allows for the productive use of an industrial byproduct that would otherwise end up in landfills. The use of fly ash as a cement replacement in concrete or as an additive offers numerous economic, technical, and environmental benefits. The cost of fly ash is significantly lower than that of cement, estimated at about IRR 500,000 per cubic meter of concrete production.
The use of fly ash offers three main advantages: (1) use of low-cost raw materials, (2) conservation of natural resources, and (3) elimination of toxic substances. Fly ash is not a waste, but a valuable resource. Despite studies highlighting the benefits of fly ash and global and Iranian standards allowing up to 35% replacement of cement with fly ash, the majority of fly ash in Iran still ends up in landfills [12]. This is mainly due to the unpredictable development of mechanical properties due to the significant variation in fly ash compositions worldwide and the lack of awareness regarding the potential benefits of incorporating fly ash into concrete. Incinerator ash can increase the compressive strength of concrete over time due to pozzolanic reactions between the ash and the free calcium hydroxide released during cement hydration. Constructing concrete with incinerator ash benefits the environment in two ways: (1) reducing cement consumption, thereby reducing the environmental impact of cement production, and (2) incorporating incinerator ash into concrete, thereby reducing the environmental impact of landfill disposal.

4. Numerical Modeling Using Deep Learning Methods

In this section, the deep learning method is explored. A combination of Convolutional Neural Networks (CNNs) and the Multi-Verse Optimizer (MVO) algorithm is used for this purpose. An experimental program was designed to complete the information database. According to this program, 100 cubic concrete specimens with dimensions of 15 × 15 × 15 cm were prepared and the mix design was recorded. After 28 days of curing under standard conditions, the specimens were subjected to compressive failure tests. The data collected from these tests were compiled into a database, as shown in Table 3. The input and output parameters were chosen such that coarse aggregate, fine aggregate (sand), and percentage of incinerator ash were chosen as input parameters. The aim was to reduce the number of input parameters to achieve a better convergence of the neural network with the available data. In addition, the weights of water and cement were selected as other input parameters. Therefore, the five input parameters are coarse aggregate (CA), fine aggregate (FA), ash weight (AW), cement (C), and water (W). The 28-day compressive strength (Fc) was considered as the only output parameter for the modeling.
The selection of input parameters for neural network modeling and optimization plays a crucial role in the performance and prediction accuracy of the model. The reasons for selecting each input parameter are as follows: Coarse aggregate (CA) has a significant effect on the compressive strength of concrete. Including this parameter as an input helps the model to evaluate and calculate the influence of coarse aggregate on compressive strength. Fine aggregate (FA), or sand, is also an essential component of concrete. This parameter allows the model to analyze the effect of varying amounts of sand in the concrete mix on compressive strength. Ash weight (AW): combustion ash is used as an additive in concrete. This parameter allows the model to evaluate the effect of ash addition on the mechanical properties of concrete and to determine its effect on compressive strength. Cement (C) is a primary component of concrete that plays a critical role in binding other components. Including this parameter as an input helps the model evaluate the effect of cement quantity on the compressive strength of concrete. Water (W): the water–cement ratio (W/C) is a key factor in determining the quality and strength of concrete. Selecting water weight as an input parameter allows the model to analyze the effect of this ratio on compressive strength. The primary goal of selecting these parameters is to reduce the number of input parameters to achieve better convergence between the neural network and the available data. In addition, selecting these five key parameters allows the model to more accurately predict concrete behavior.

4.1. Implementation of Deep Learning Method

This section describes the implementation of neural network coding, training, and evaluation using MATLAB 9.5 (R2018b). MATLAB is highly preferred by researchers for its comprehensive features, advanced programming capabilities, diverse training algorithms, and robust neural network structures, as well as its powerful processing and statistical analysis capabilities for solving engineering problems. To evaluate the effectiveness of the deep learning method, two key metrics were used: the regression coefficient (R) and the root mean squared error (RMSE), as shown in the following figures [12]. Figure 3 shows the training curve for the implemented coding. After training, the weights are stored and the network is ready for use. The selection of the type and structure of the neural network was determined through a trial-and-error process. Furthermore, this process was repeated to introduce the optimal structure for the deep learning method, ensuring the best performance.

4.1.1. Convolutional Neural Network (CNN) Configuration

In this study, a Convolutional Neural Network (CNN) was developed to predict the compressive strength of concrete using various influencing parameters. The network architecture consists of convolutional layers, activation functions, pooling layers, and fully connected layers. The convolutional layers extract spatial features from the input data, while the pooling layers reduce dimensionality and prevent overfitting. The final fully connected layers process the extracted features to generate the output prediction. The dataset was divided into training and test sets using the LoadDivideData (NameDataSet) function, with the training data set to dataTrain.MaxEpoch = 50, indicating that the model was trained for 50 epochs. The CNN weights and hyperparameters were optimized using the Multi-Verse Optimizer (MVO) to improve accuracy. The model was trained using the OptimizingCNNUsingMA (dataTrain.arams) function, where the parameters were fine-tuned using metaheuristic optimization. The testing phase was performed using predict (netTrain, dataTest.Inputs), and the outputs were unnormalized using the maximum values of the dataset. The evaluation metrics were computed using EvaluatePlot(dataTrain.Targets, Results.YPredTr, ‘Train’) and EvaluatePlot (dataTest.Targets, YPredTs, ‘Test’) to compare the predicted and actual values. Figure 4 also shows the training curve for the implemented coding with better accuracy.

4.1.2. Multi-Verse Optimizer (MVO) Configuration

The Multi-Verse Optimizer (MVO) was used to optimize the weights and hyperparameters of the CNN to ensure better convergence and improved prediction accuracy. The optimization process was implemented using CostFunction = @ (x) CostNNRegression (x, TrainData), where the objective function minimizes the regression error. The parameters of the algorithm were set as follows:
  • Number of Variables (nVar): 5;
  • Variable Range (VarMin, VarMax): 0 to 1;
  • Maximum Iterations (MaxIt): 100;
  • Population Size (nPop): 50;
  • Wormhole Existence Probability (WEP) Range: WEP_Max = 1, WEP_Min = 0.2;
  • Traveling Distance Rate (TDR): decreases over iterations as TDR = 1 − ((it)1/6/(MaxIt)1/6)
First, the algorithm generated a population of galaxies using Universes(i).Position = unifrnd (VarMin, VarMax, [1, nVar]), and their fitness values were evaluated. The exploration phase was controlled by normalized inflation rates using RouletteWheelSelection (−SO_Inflation_rates), where galaxies with lower inflation rates had a higher probability of selection. During the exploitation phase, galaxies adjusted their positions using BestUniverse.Position (j) ± TDR × ((VarMax − VarMin) × rand + VarMin) to ensure convergence to the best solution. Optimization continued for MaxIt = 100 iterations, and the best universe (optimal solution) was determined based on the minimum fitness value. The final CNN model was trained with the optimized parameters, and its performance was evaluated. The convergence curve of the MVO was visualized using plot(1:MaxIt, BestCost, ‘LineWidth’, 2), showing a progressive reduction in the prediction error. The results confirmed that the integration of CNN with MVO significantly improved the predictive performance of the model in concrete compressive strength estimation.
In addition, to increase the generalization power of the network, the cross-validation method was used to stop training. Accordingly, the database was divided into three sets: training, evaluation, and testing. All evaluation metrics were used to evaluate the performance and accuracy of the deep learning method. In total, 70% of the data is used for training, 15% for evaluation set, and 15% for testing set.
Figure 3 illustrates the deep learning training process over 100 epochs. The graph highlights the performance of the model, with the root mean square error (RMSE) at 32, indicating the level of prediction error. In general, a lower RMSE value indicates a higher prediction accuracy of the model. The X-axis represents the number of training epochs, while the Y-axis represents the error or loss value. Ideally, the error curve should decrease as the number of epochs increases, reflecting the model’s improvement in fitting the training data. Close proximity between the training and validation curves indicates a well-performing model with minimal overfitting or underfitting problems [13]. At the end of the training period, an RMSE of 32 indicates that the model has converged to its final weights and is ready to predict new data.
In addition, error histograms and regression plots for the training, testing, and validation processes are shown in Figure 5 and Figure 6. It can be observed that the error value of the MVO algorithm drops below 0.4 at iteration 60, demonstrating the high performance of this algorithm.
This figure illustrates the performance of the combined deep learning model over a series of iterations. The curve highlights the model’s learning process, showing how the error rate decreases as training progresses, eventually reaching optimal performance.
This figure shows the training curve for the dual combined deep learning model, illustrating its performance over the course of training iterations. The curve typically shows how the model learns and adapts by reducing the error rate over successive iterations, ultimately aiming to achieve optimal learning and predictive capabilities.
This figure shows the regression coefficient, which indicates how well the combined deep learning model fits the data.
Smith (1986) suggested the following ranges for evaluating the correlation coefficient between zero and one [14].
R 0.8
Relationship (1): There is a strong correlation between the two sets of variables.
0.2 < R < 0.8
Relationship (2): There is a correlation between the two sets of variables.
R < 0.2
Relationship (3): There is a very weak correlation between the two sets of variables.
In this study, R was used to evaluate the correlation between the results obtained from multilayer perceptron-based models.
A value of 91% indicates a high degree of correlation between the predicted results and the actual values, demonstrating the effectiveness of the model in accurately capturing the underlying patterns in the data [15].
The deep learning method was implemented using MATLAB coding, and the code used is available for review and distribution upon request. The implementation involves several key steps:
Coding and training in MATLAB: The deep learning model was developed using MATLAB 9.5 (R2018b) due to its robust features, including extensive functionality, advanced programming capabilities, diverse training algorithms, and powerful processing and statistical analysis tools [16]. These features make MATLAB a preferred choice for researchers tackling complex engineering problems. Error metrics and performance evaluation: to evaluate the performance of the model, several error metrics were used, including root mean square error (RMSE) and regression coefficient (R). The figures provide a detailed view of the accuracy and error distribution of the model:
Figure 3 shows the training curve over 100 epochs, showing the reduction in error as the model learns from the training data, achieving an RMSE of 32.
Figure 5 shows a similar training plot for an alternative deep learning structure, continuing the process of finding the optimal configuration.
Figure 6 shows the training curve for a dual combined deep learning model, showing how the model adapts and minimizes error over successive iterations.
Figure 7 shows the regression coefficient for the combined deep learning model, with a value of 91%, indicating a strong correlation between predicted and actual results.
Identifying the optimal structure: the process of determining the optimal deep learning structure involves iterative tuning and evaluation. This trial-and-error approach ensures that the model achieves the best possible performance while adapting to the specifics of the dataset being used.
Error histograms and regression analysis: Figure 5 and Figure 6 show error histograms and regression plots for the training, testing, and validation processes. These figures show that the error value of the Multi-Verse Optimizer (MVO) algorithm falls below 0.4 at iteration 60, demonstrating its high effectiveness. Model applicability and results: The final model, based on deep learning techniques, shows satisfactory performance in modeling the compressive strength of green concrete containing incineration ash. This is evident from the low RMSE values and high regression coefficients observed. Overall, the implementation of this deep learning method provides a reliable approach for predicting the compressive strength of green concrete, taking advantage of the advanced capabilities of MATLAB for both coding and model training. Finally, the root mean square error (RMSE) before combining the MVO algorithm with the artificial neural network was about 30, which decreased to 0.14 after applying this algorithm.

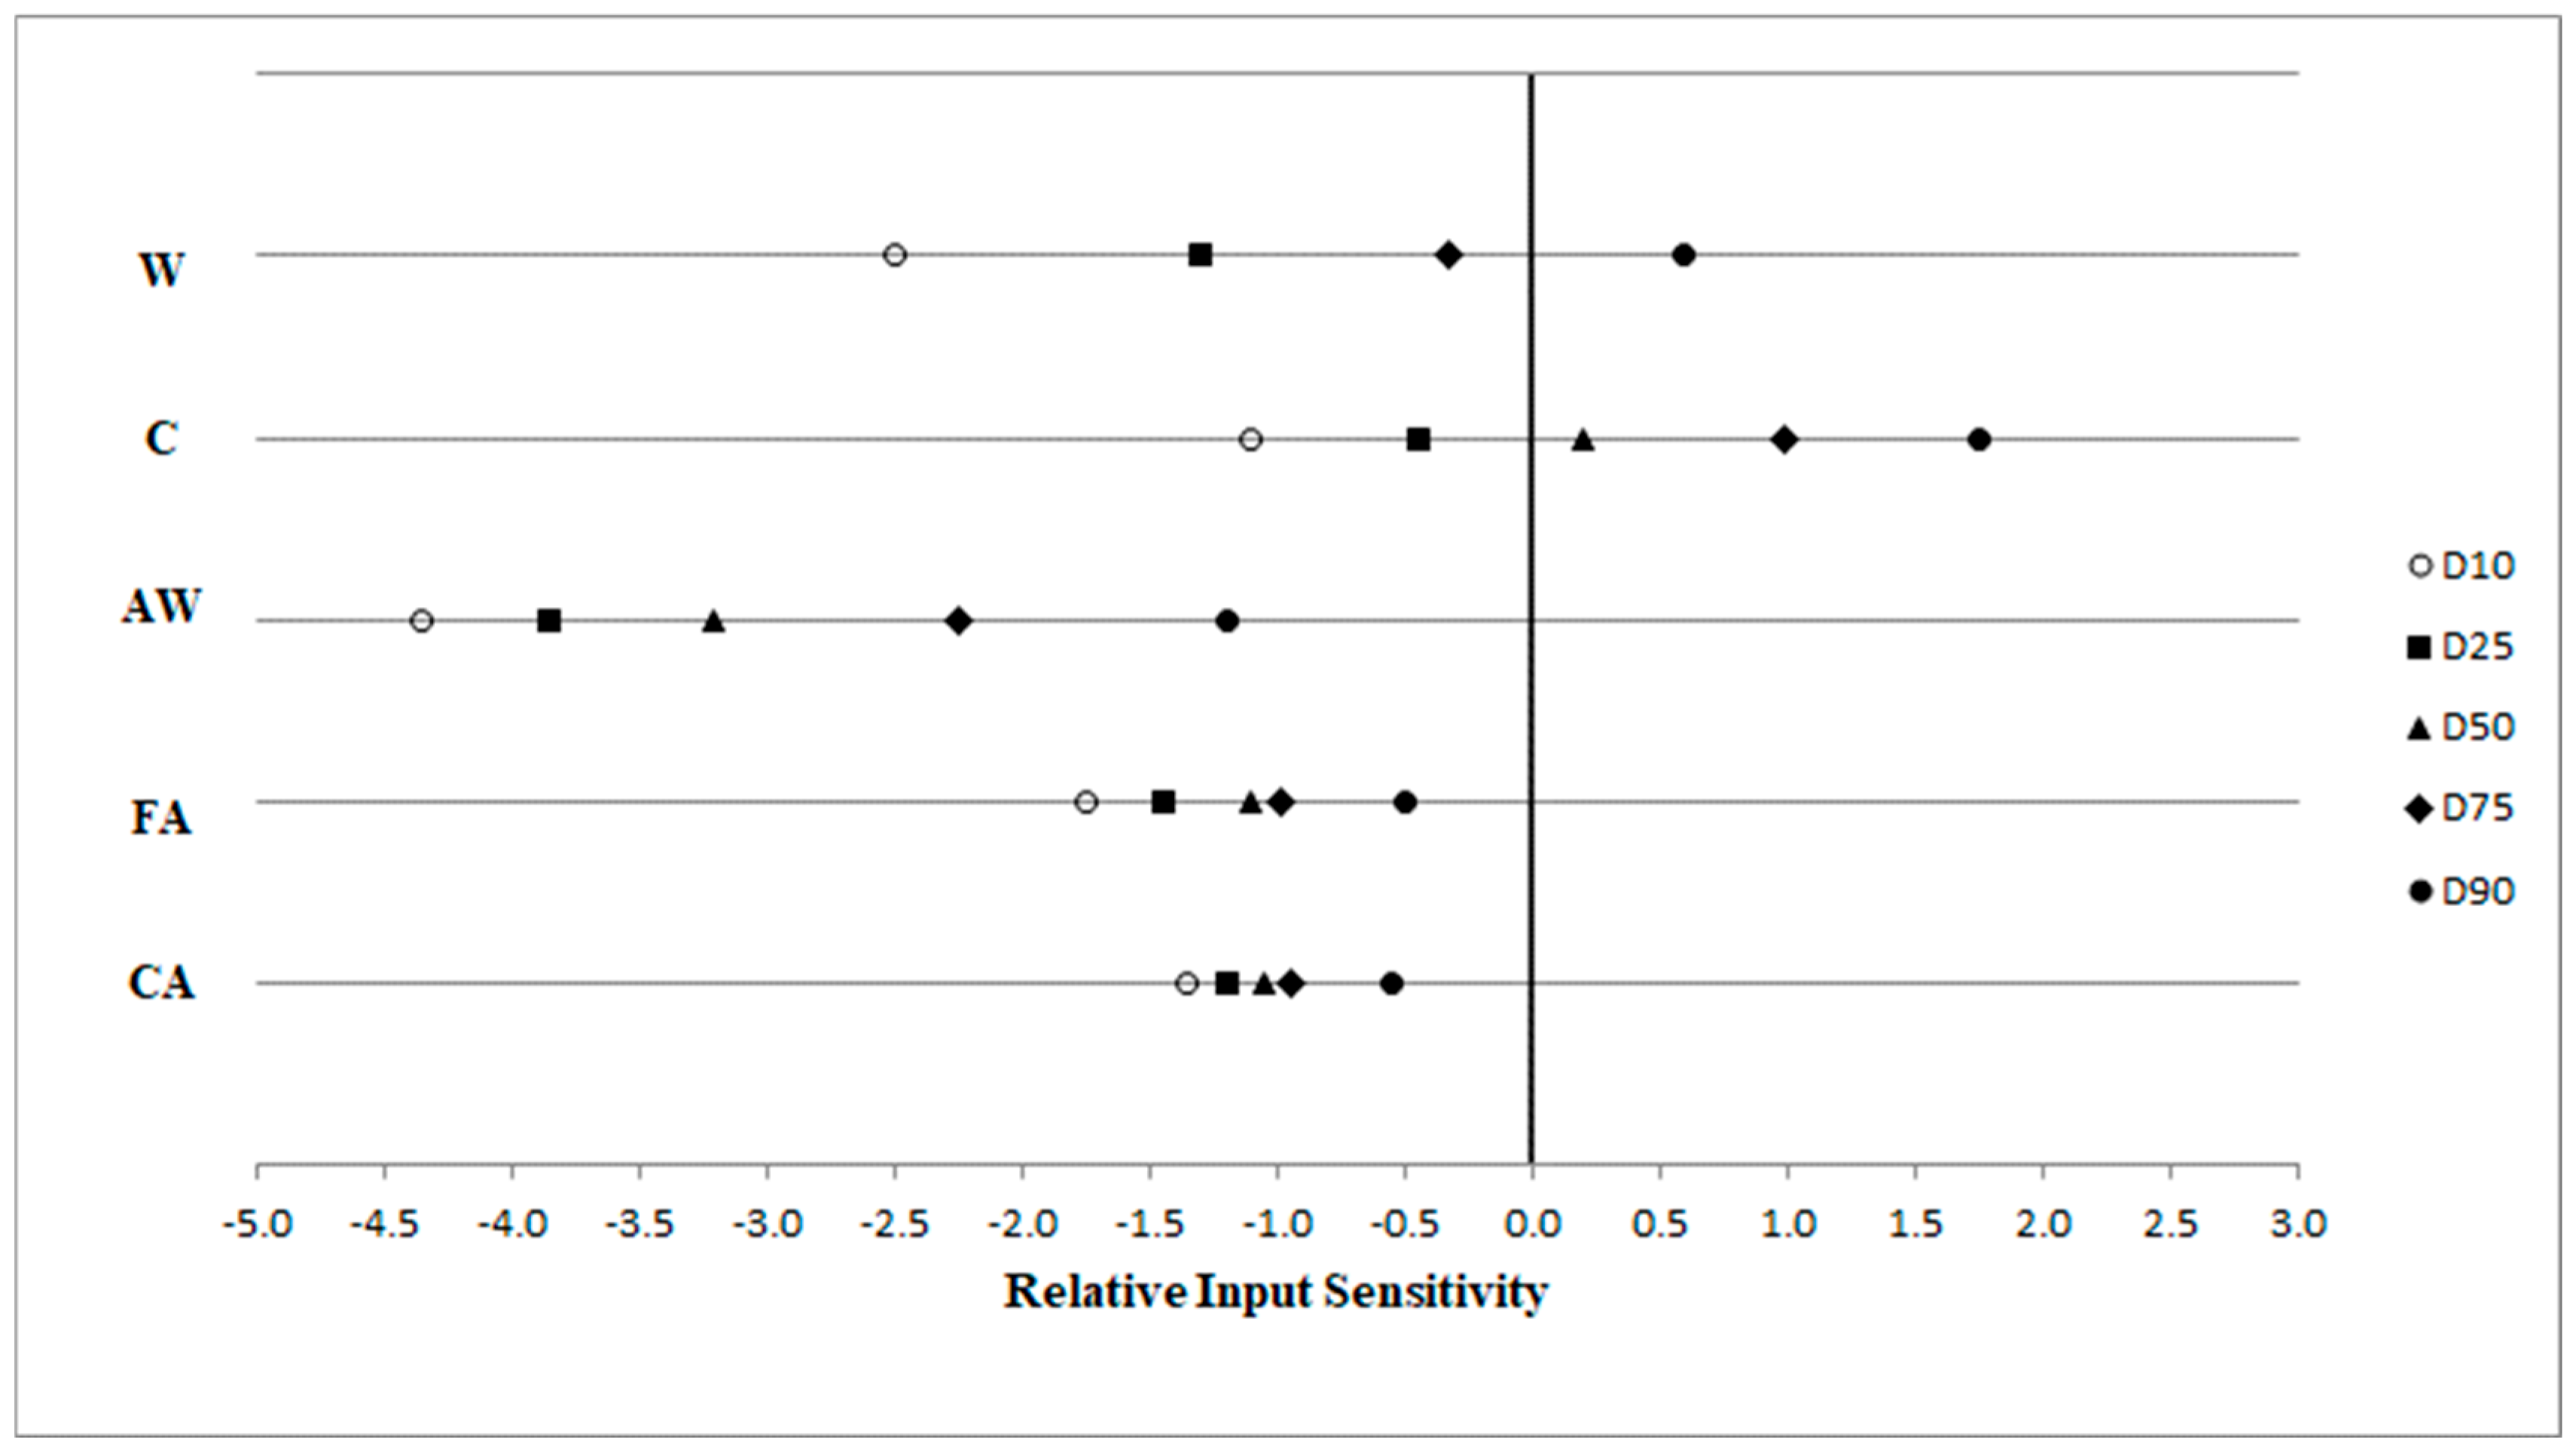
5. Sensitivity Analysis

Deep learning methods and machine learning algorithms are very versatile and effective when reliable and sufficient data are available. However, the behavior and impact of input parameters on the output is often not explicitly clear. Therefore, it is crucial to perform a sensitivity analysis to interpret how input parameters affect the output. Various methods for performing sensitivity analyses in these models have been discussed in several studies. For example, Liu and colleagues found that the effect of each input parameter on the output variables, both in magnitude and direction, cannot be fully determined over the entire input space using their method [17]. Therefore, they used a statistical analysis method based on the derivative of the network output with respect to the input (output sensitivity to input). They conducted a sensitivity analysis on the efficiency of pipe production and stated that examining the relationships within neural networks gives users greater confidence in the predictive power of the network and facilitates the use of these models in scientific and engineering work [17]. In this section, we first establish the derivative relationship of the output with respect to the input for the optimal network structures determined at each stage. Then, the effect of five main input variables is studied. This study is based on a statistical analysis of the relative derivative values of the model outputs with respect to the desired inputs at 500 points within the five-dimensional input space under consideration. These points were selected using a normal distribution function. Given the availability of 100 datasets and the need for significantly more data for the sensitivity analysis, the SIMLAB 4.0 software was used. For this purpose, the statistical method for relative sensitivity values used by Lu et al. (2001) [18] was applied. In this method, five statistical percentiles (D10, D25, D50, D75, and D90) of the relative sensitivity values of the output data were determined. This method allows us to determine the effect of increasing or decreasing each input on the output and the overall prevailing trend across the input space based on random samples taken. Explanations and definitions of the results obtained by this method are as follows [19]:

Interpretation of Sensitivity Analysis Results

  • D10 represents a relative sensitivity value where 90% of the values are above this value and 10% are below this value. Therefore, if D10 is positive, it indicates that there is a greater than 90% chance that the relative sensitivity is positive. In other words, there is a greater than 90% chance that the output will increase as the input increases [20].
  • D90 represents a relative sensitivity value where 90% of the values are below this value and 10% are above this value. Therefore, if D90 is negative, it indicates that there is a greater than 90% probability that the output will decrease as the input increases [20].
  • D25 and D75: The explanations for D25 and D75 are similar to those for D10 and D90 [21].
  • D50: When this value is at the baseline (zero sensitivity), it indicates that there is a 50% chance that the output will either increase or decrease as the input increases [21].
An input with a distribution of Relative Sensitivity Percentages around the baseline has less impact on the output than an input with a distribution of Relative Sensitivity Percentages farther from the baseline. By examining the distance and values of the statistical percentiles, the degree of influence of each variable on the output can be assessed and compared [22]. As mentioned earlier, it is better to use relative sensitivity values rather than absolute sensitivity values to compare the degree of influence of input variables. Table 4 shows the mean values of the relative sensitivity of compressive strength to the input variables discussed.
This table summarizes the average relative sensitivity values for the compressive strength of concrete with respect to the five main input parameters: coarse aggregate (CA), fine aggregate (FA), ash weight (AW), cement (C), and water (W). These values indicate how changes in each parameter affect the compressive strength and provide insight into which variables have the most significant impact on the model’s predictions.
Below are the statistical percentile values of the relative sensitivity of compressive strength to each of the five input parameters for the model used in Figure 8. As shown in the figure, more than 75% of the relative sensitivity values for water weight (W) are negative. This indicates a decrease in compressive strength as the water weight index (W) increases. For the other input parameter, cement weight (C), it is evident that a larger proportion of the relative sensitivity values are around the zero axis, but the positive values dominate, indicating an increase in compressive strength with an increase in this parameter. These results help to illustrate the different effects of the input parameters on the output, highlighting the critical role of sensitivity analysis in understanding and optimizing model performance [23].
The most negative relative sensitivity values are attributed to the ash weight, indicating the greatest reduction in compressive strength [24]. As shown in Figure 7, the other two input parameters, coarse aggregate weight and fine aggregate weight, also have negative relative sensitivity values, indicating that increasing these parameters reduces the compressive strength of the resulting concrete. In particular, the effect of fine aggregate is more pronounced. Comparing the effects of these five input parameters on the compressive strength, based on the statistical percentile distances from the baseline, the percentage values (Figure 8), and the average relative values (Table 4), it can be concluded that the weight of cement (W) has the most significant influence on the compressive strength.

6. Discussion and Conclusions

This paper explores the role and effectiveness of deep learning methods and machine learning algorithms in modeling and predicting the compressive strength of green concrete using incineration ash. The findings indicate that these methods can provide accurate predictions when sufficient and reliable data are available. A sensitivity analysis revealed that different input parameters have varying impacts on model output, helping to optimize model performance. Cement production pollutes, and shifting the construction industry in Iran towards green concrete systems is imperative, particularly in light of Iran’s commitment to reducing greenhouse gases by 2025 under the Paris Agreement. This study’s laboratory program creates a database for modeling with deep learning methods. It uses a combination of CNNs and an MVO algorithm coded in MATLAB. The research methodology includes evaluating optimal neural network structures and conducting a sensitivity analysis to assess the impact of input parameters on the modeled output. The input and output parameters were chosen to optimize the neural network model’s convergence with available data. The input parameters are coarse aggregate (CA), fine aggregate (FA), ash weight (AW), cement (C), and water (W). The 28-day compressive strength (Fc) is the sole output parameter. MATLAB 9.5 (2018b) was used for coding, training, and evaluation due to its robust capabilities. The performance of the deep learning method was evaluated using the regression coefficient (R) and the root mean squared error (RMSE). The results of the deep learning-based modeling are as follows:
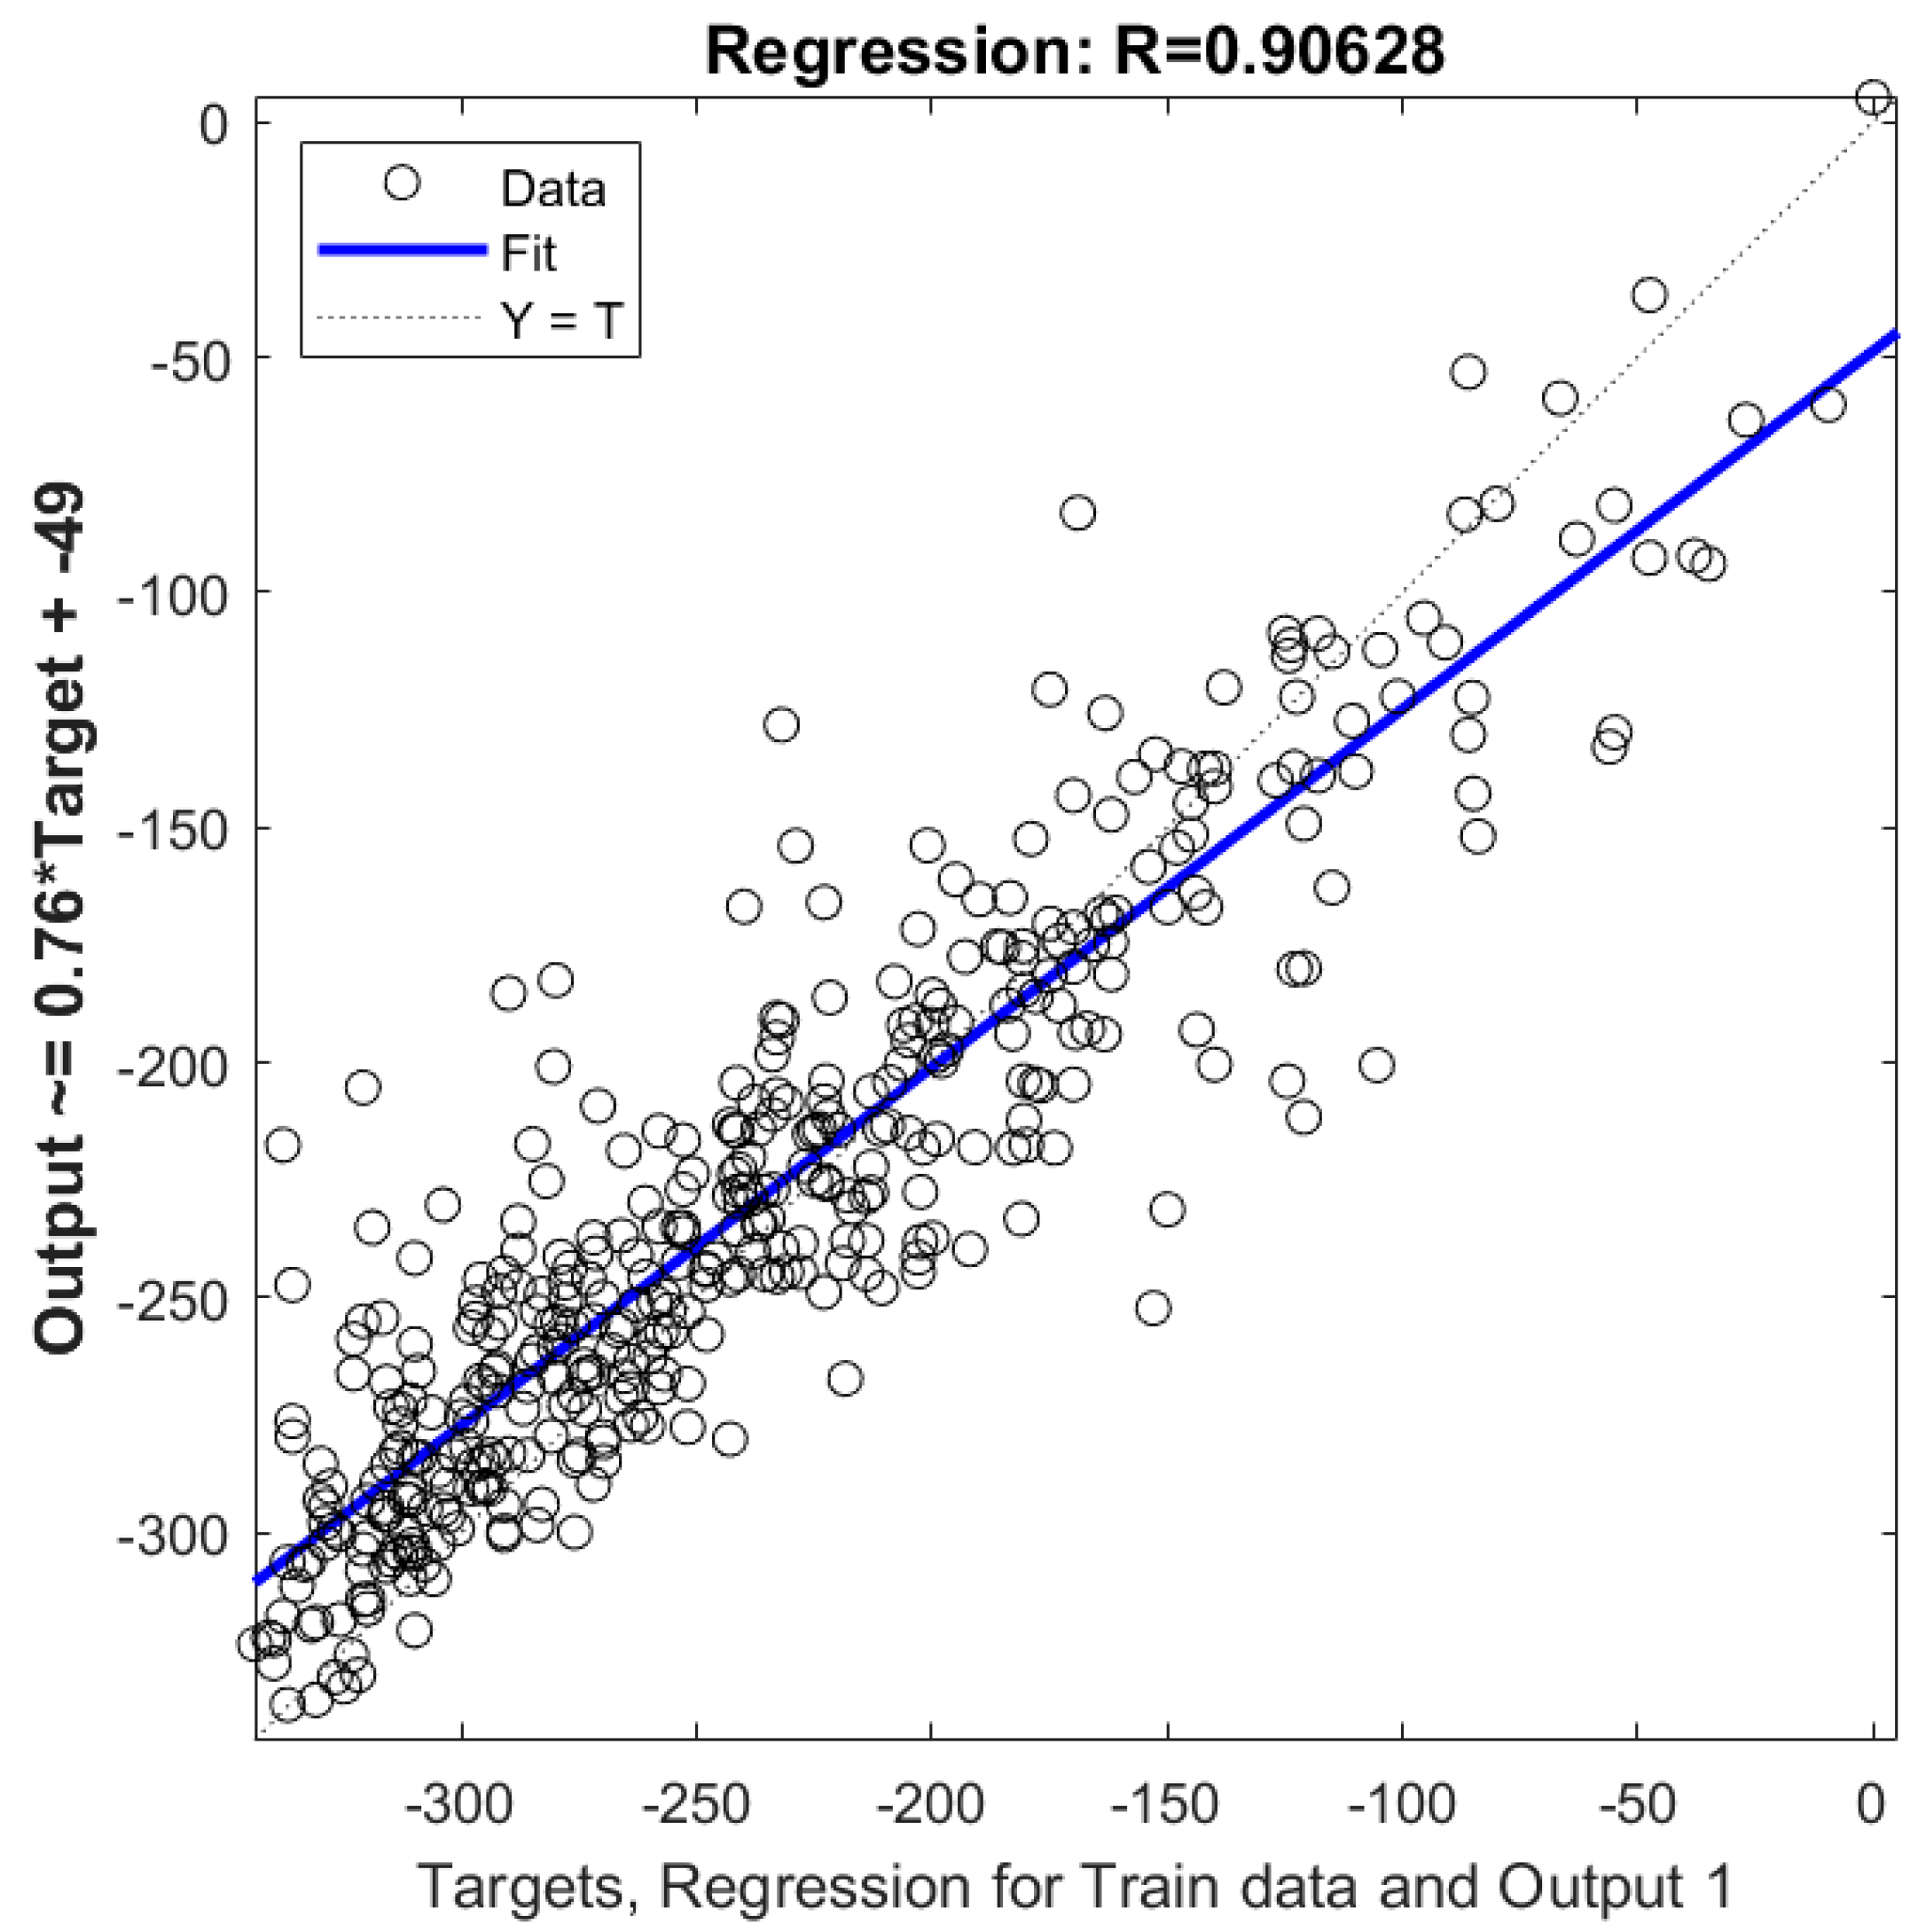
  • The regression coefficient (R) of 90% in these models indicates the effectiveness of the deep learning method in modeling the present mix design.
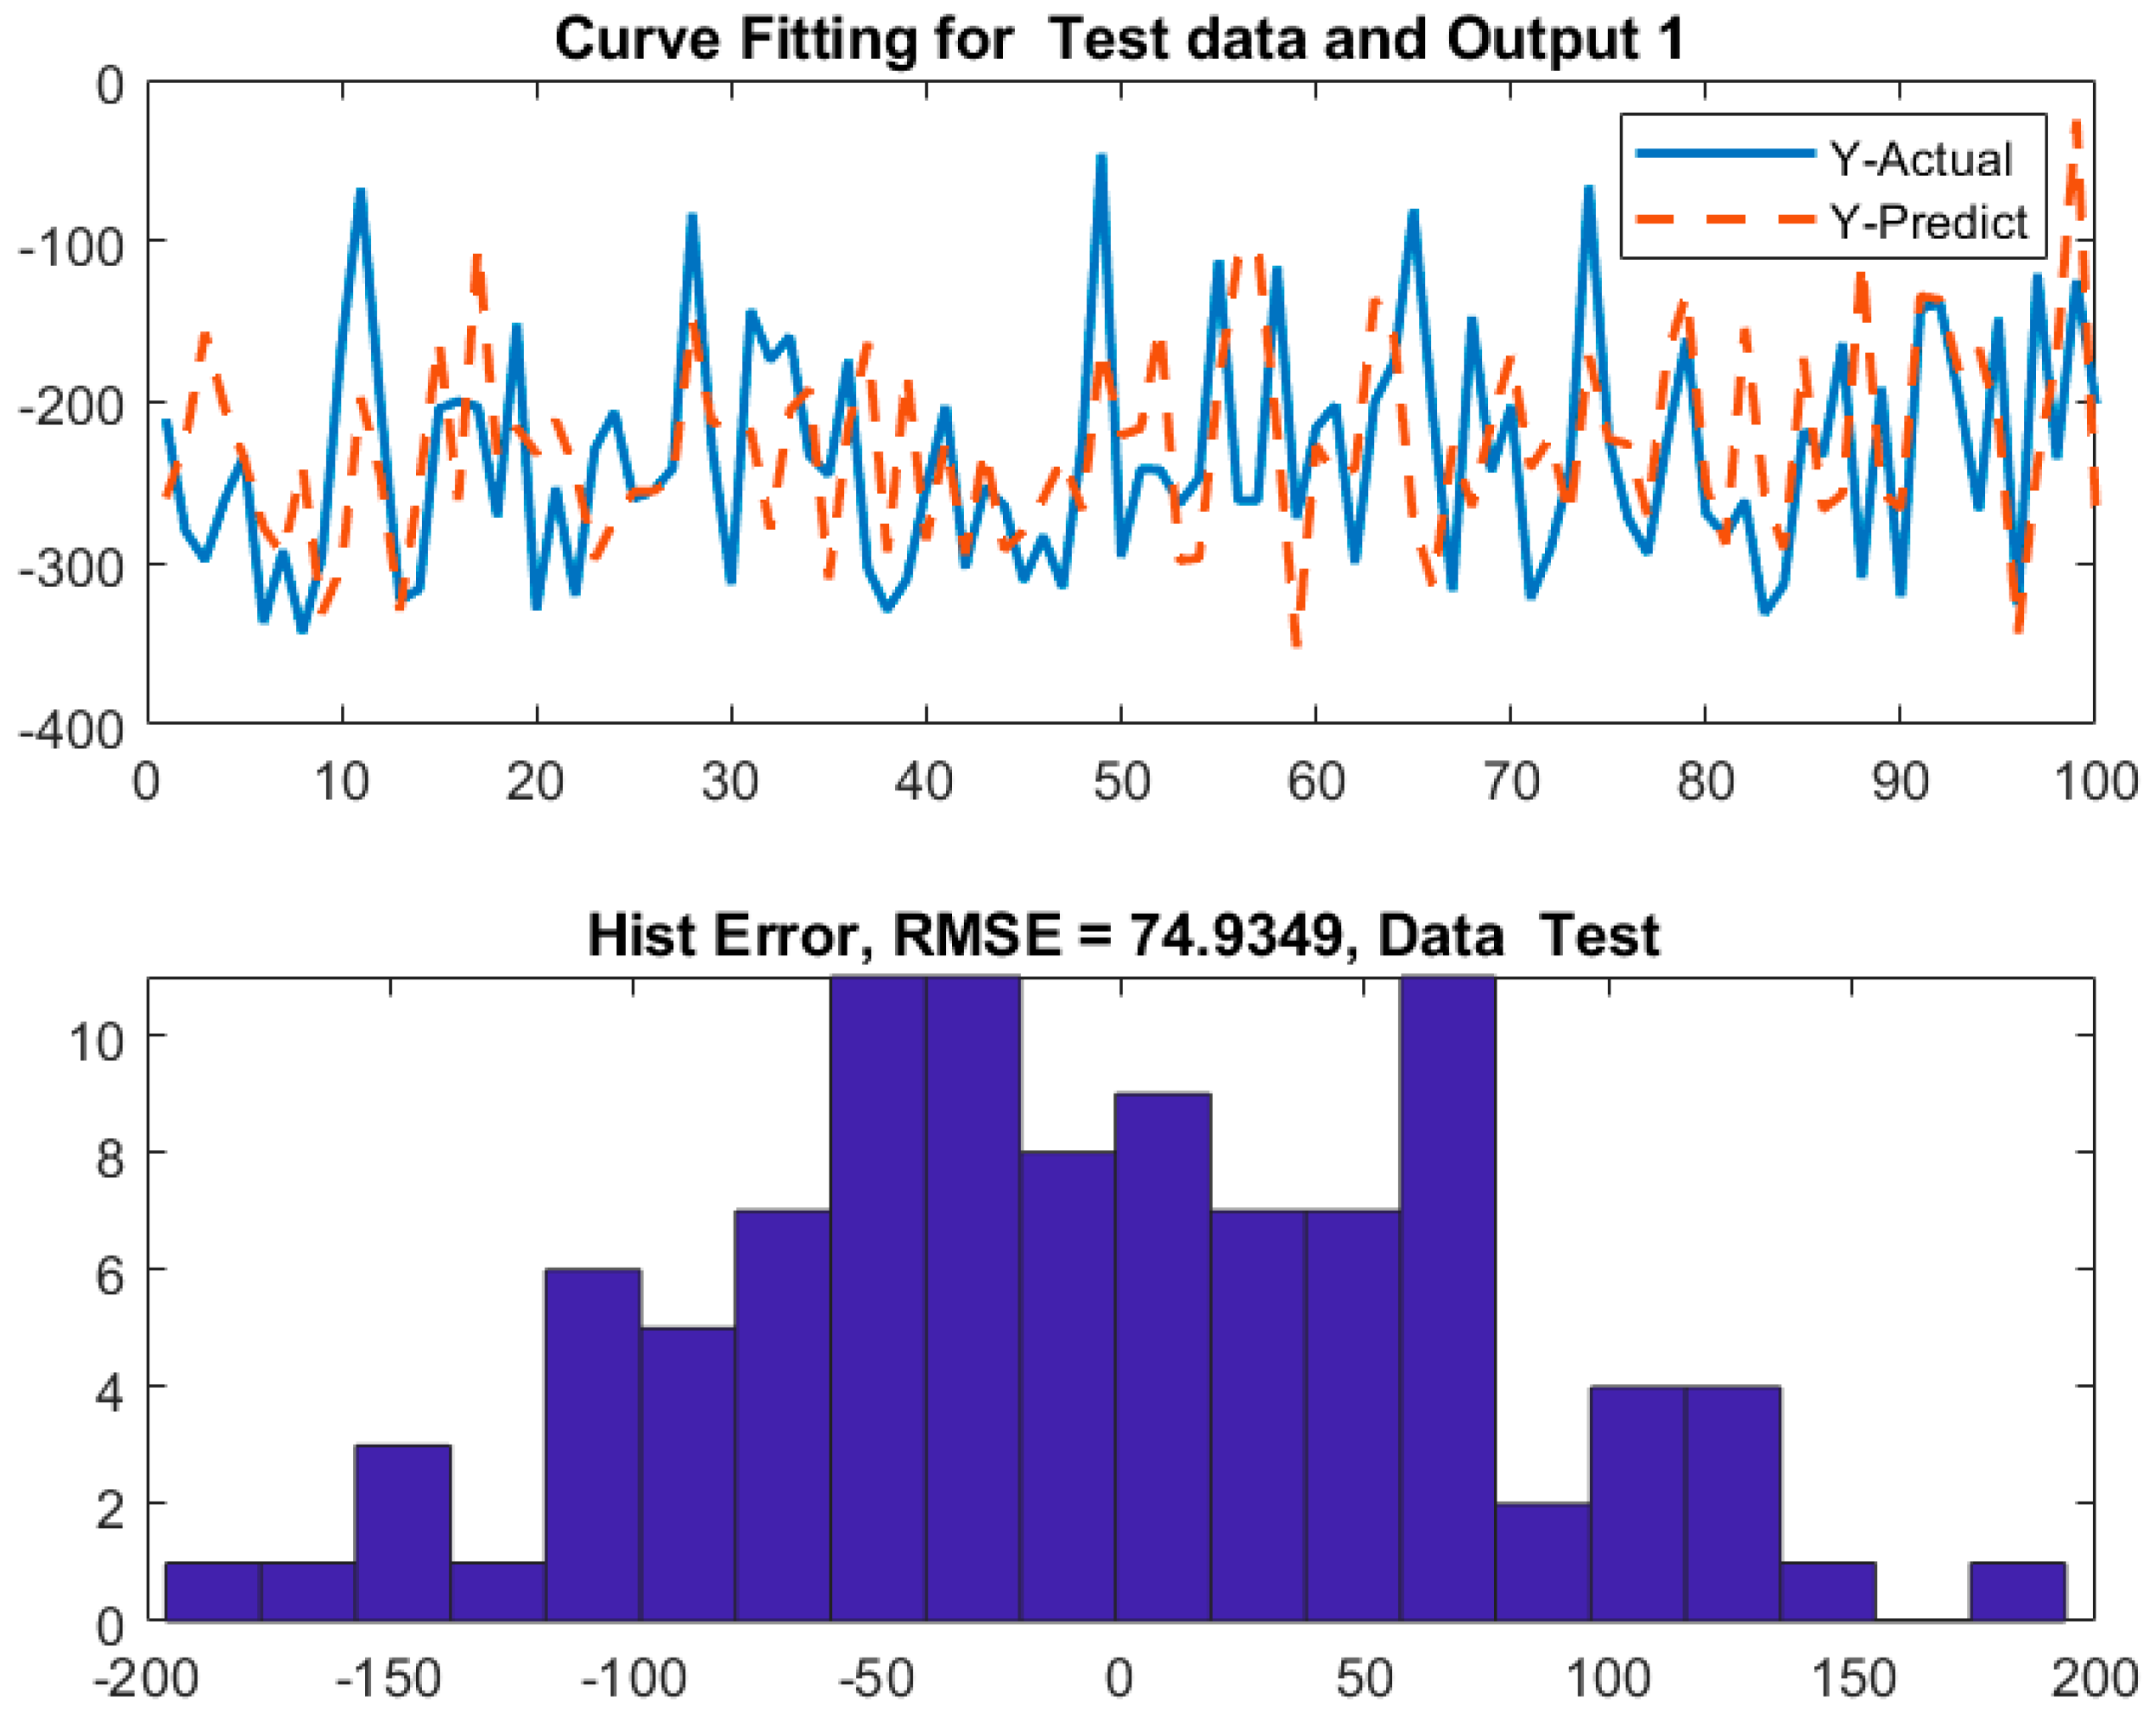
  • The applied deep learning method demonstrated the best performance based on the regression coefficient across the three datasets: training, testing, and evaluation.
  • The error metric, specifically the root mean squared error (RMSE), demonstrates that the two-layer perceptron network with eight neurons exhibited optimal performance, with an average RMSE of 0.14.
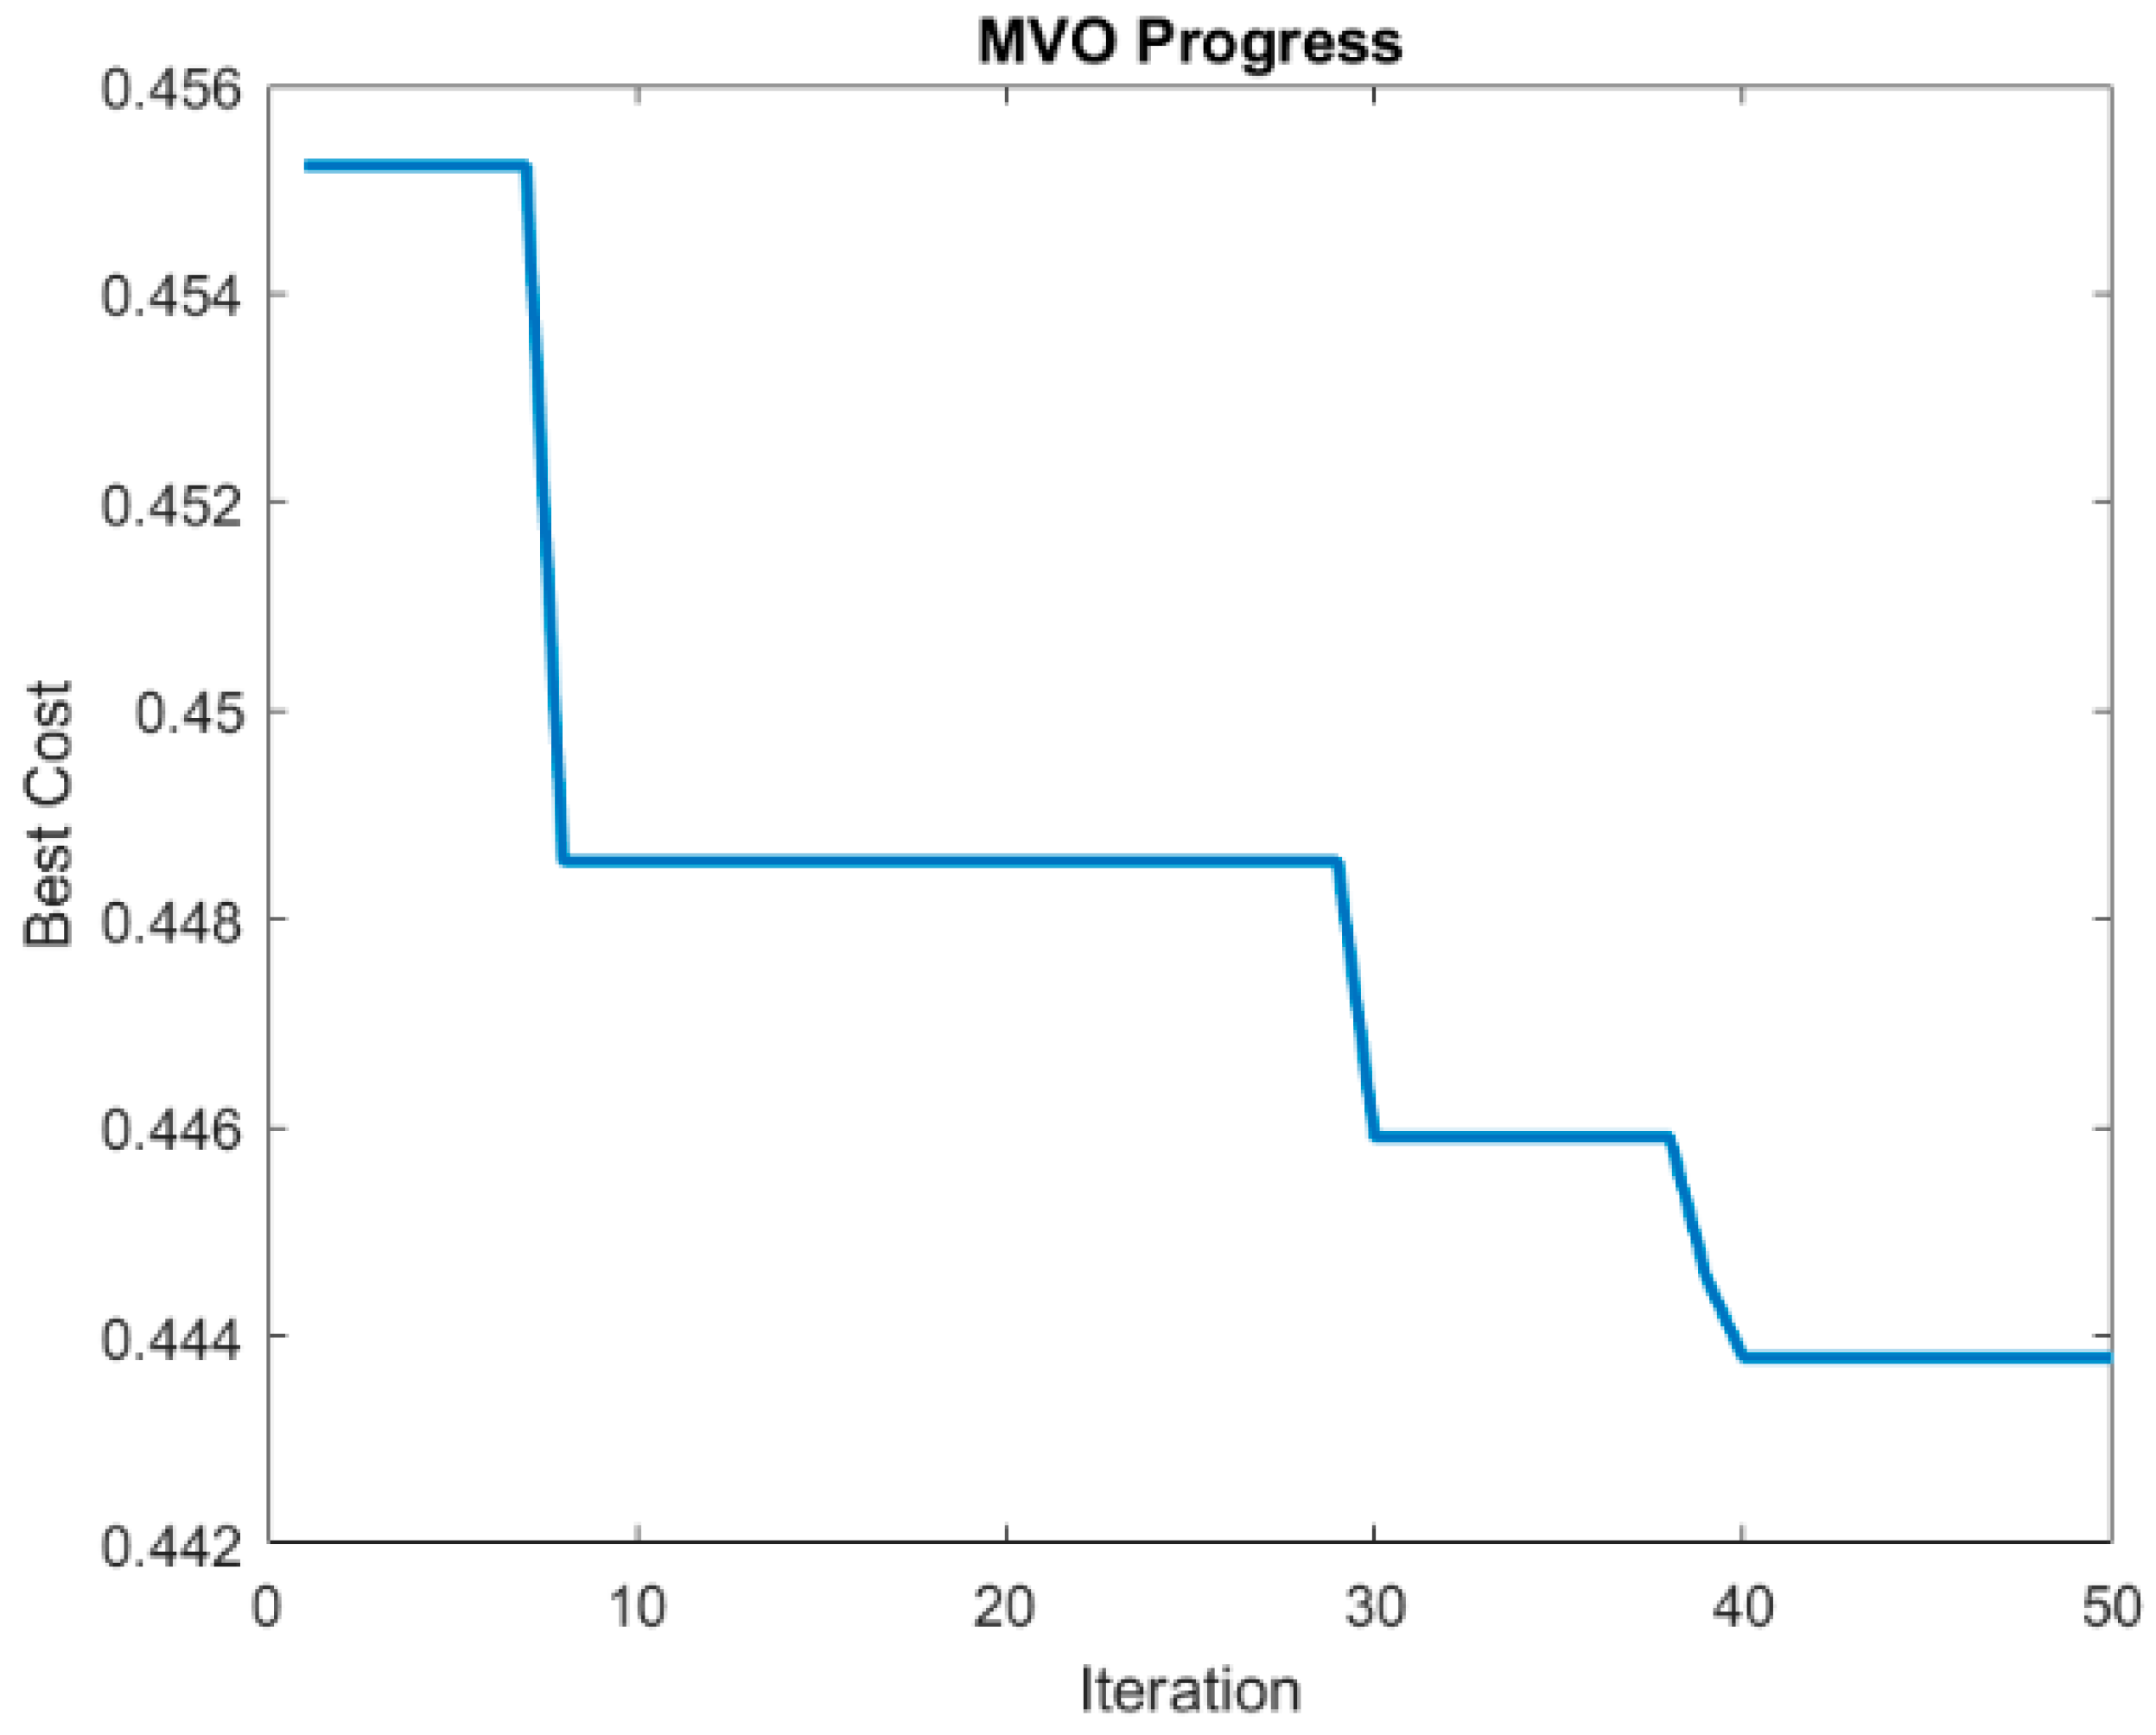
  • The error index (RMSE) prior to the integration of the MVO algorithm with the artificial neural network was approximately 30, which diminished to 0.14 following the implementation of this algorithm.
  • The most salient result of this research concerns the sensitivity analysis of the optimized model. It was observed that the most negative values in relative sensitivity belong to the incineration ash weight, indicating the greatest decrease in compressive strength. Similarly, the weights of coarse aggregate and fine aggregate also have negative relative sensitivity values, showing that an increase in their amounts leads to a decrease in compressive strength. The impact of fine aggregate is particularly more significant. A comparative analysis of the effects of these five input parameters on compressive strength reveals that cement weight has the most significant influence.
In light of the extant research in this domain, the following research propositions are put forward:
  • Implementation of the deep learning modeling method developed in this study for the purpose of predicting the compressive strength of concrete.
  • Implementation of the current study’s mix design in concrete projects and economic analysis of the proposed mix design in comparison to analogous designs.
  • Utilization of alternative machine learning methods for modeling in the present research and comparison of the results thereof.

Author Contributions

Methodology, S.A.H.; Software, F.F.; Formal analysis, M.H.H.; Writing—review & editing, A.A. All authors have read and agreed to the published version of the manuscript.

Funding

This research received no external funding.

Data Availability Statement

Data is contained within the article.

Conflicts of Interest

The authors declare no conflict of interest.

References

  1. Gharshasbi, R.; Zare Nejad, H. Applications of Incineration Ash. In Proceedings of the Fifth National Environmental Engineering Conference, Tehran, Tehran, Iran, 21–22 November 2011; Available online: https://civilica.com/doc/122065 (accessed on 14 February 2025).
  2. Gheskin Tabrizi, M.R.; Maknoon, R.; Ebadi, T.; Nikravan, M. Review and Analysis of Research on Urban Incineration Ash Management Methods with Emphasis on Stabilization and Solidification. In Proceedings of the Twelfth National Civil Engineering Congress, Tabriz, Tabriz, Iran, 27 May 2020; Available online: https://civilica.com/doc/1120332 (accessed on 14 February 2025).
  3. Saeidi, F.; Abedini Karshk, M. Technology of Lightweight Concrete Made from Incineration Ash. In Proceedings of the National Conference on Human, Environment, and Sustainable Development, Hamadan, Iran, 10 March 2010; Available online: https://civilica.com/doc/106687 (accessed on 14 February 2025).
  4. Sahraei Karam Basti, M.; Divandari, H.; Abolfathi, B. Feasibility of Using Fly Ash and Bottom Ash from Incineration in Concrete and Asphalt Pavements. 2019. Available online: https://civilica.com/doc/1006682 (accessed on 14 February 2025).
  5. Divandari, H.; Hosein Janzadeh, H.; Sahraei Karam Basti, M. Evaluation of Hot Asphalt Performance with Incineration Ash Additive. In Proceedings of the Thirteenth National Conference and Exhibition on Asphalt, Bitumen, and Machinery, Tehran, Iran, 24–26 October 2021; Available online: https://civilica.com/doc/1360885 (accessed on 14 February 2025).
  6. Akhoundi, M.; Ramset, M.H.; Pour Rostam, T.; Golsorkh Pehlaviani, A. A New Method for Producing Eco-Friendly Concrete Using Waste PET Plastic and Silica Fume and Evaluating Its Mechanical Properties and Durability in Roller Compacted Concrete Pavement. Amirkabir J. Civ. Eng. 2021, 53, 1107–1116. [Google Scholar] [CrossRef]
  7. Naqipour, M.; Ahmadi, S.; Gorji Nejad, F. Investigating the Effect of Coal Waste on the Mechanical Behavior of Green Concrete. 2021. Available online: https://civilica.com/doc/1995308 (accessed on 14 February 2025).
  8. Chakravarthy, H.G.N.; Seenappa, K.M.; Naganna, S.R.; Pruthviraja, D. Machine Learning Models for the Prediction of the Compressive Strength of Self-Compacting Concrete Incorporating Incinerated Bio-Medical Waste Ash. Sustainability 2023, 15, 13621. [Google Scholar] [CrossRef]
  9. Li, J. Municipal Solid Waste Incineration Ash-Incorporated Concrete: One Step towards Environmental Justice. Buildings 2021, 11, 495. [Google Scholar] [CrossRef]
  10. Altuncı, Y.T. A Comprehensive Study on the Estimation of Concrete Compressive Strength Using Machine Learning Models. Buildings 2024, 14, 3851. [Google Scholar] [CrossRef]
  11. Onyelowe, K.C.; Kontoni, D.-P.N.; Ebid, A.M.; Dabbaghi, F.; Soleymani, A.; Jahangir, H.; Nehdi, M.L. Multi-Objective Optimization of Sustainable Concrete Containing Fly Ash Based on Environmental and Mechanical Considerations. Buildings 2022, 12, 948. [Google Scholar] [CrossRef]
  12. Emami Korende, M.; Nourbakhsh, S.N. Optimization of Steel Structure Weight Using Artificial Neural Network Method. New Approaches Civ. Eng. 2020, 4, 63–77. [Google Scholar]
  13. Mostofi Nejad, D. Technology and Mix Design of Concrete, 22nd ed.; Arkan Danesh: Tehran, Iran, 2010. [Google Scholar]
  14. Adding Fly Ash to Concrete; Iran Concrete Technology and Specialty Clinic: Tehran, Iran, 2015.
  15. Shafabakhsh, G.; Mohammadi Janaki, A. Evaluation of mechanical properties and durability of geopolymer concrete pavement fly ash and siflica fume. Q. J. Transp. Eng. 2021, 12, 855–872. [Google Scholar] [CrossRef]
  16. Emami, M. Modelling and Prediction of Coarse Grained Alluvium Behavior by Pressuremeter Test Results and Laboratory Chamber. Doctoral Dissertation, Tarbiat Modares University, Tehran, Iran, 2014. [Google Scholar]
  17. Emami, M. Application of Artifitial Neural Networks in Pressuremeter Test Results. Master of Science Thesis, Tarbiat Modares University, Tehran, Iran, 2009. [Google Scholar]
  18. Lu, M.; Abourizk, S.M.; Hermann, U.H. Sensitivity Analisys of neural networks in spool fabrication productivity studies. J. Comp. Civ. Eng. 2001, 15, 299–308. [Google Scholar]
  19. Emami, M.; Yasrobi, S.S. Modeling and interpretation of pressuremeter test results with artificial neural networks. Geotech. Geol. Eng. 2014, 32, 375–389. [Google Scholar]
  20. Yasrebi, S.S.; Emami, M. Application of Artificial Neural Networks (ANNs) in prediction and interpretation of pressuremeter test results. In Proceedings of the 12th International Conference of International Association for Computer Methods and Advances in Geomechanics (IACMAG), Goa, India, 1–6 October 2008; pp. 1634–1638. [Google Scholar]
  21. Farahani, J.N.; Shafigh, P.; Mahmud, H.B. Production of A Green Lightweight Aggregate Concrete by Incorporating High Volume Locally Available Waste Materials. Procedia Eng. 2017, 184, 778–783. [Google Scholar] [CrossRef]
  22. Emami, M.; Yasrobi, S.S. Modelling of pressuremeter tests with artifitial neural networks. Sharif J. Civ. Eng. 2012, 2, 25–36. [Google Scholar]
  23. Alderete, N.M.; Joseph, A.M.; Van den Heede, P.; Matthys, S.; De Belie, N. Effective and sustainable use of municipal solid waste incineration bottom ash in concrete regarding strength and durability. Resour. Conserv. Recycl. 2021, 167, 105356. [Google Scholar]
  24. Wu, M.H.; Lin, C.L.; Huang, W.C.; Chen, J.W. Characteristics of pervious concrete using incineration bottom ash in place of sandstone graded material. Constr. Build. Mater. 2016, 111, 618–624. [Google Scholar]
Figure 1. Flowchart of the current research.
Buildings 15 01103 g001
Figure 2. Weighed consumables based on the mixing plan.
Buildings 15 01103 g002
Figure 3. CNN training diagram.
Buildings 15 01103 g003
Figure 4. CNN histogram and curve fitting diagram.
Buildings 15 01103 g004
Figure 5. Performance curve of the combined deep learning code.
Buildings 15 01103 g005
Figure 6. Training curve of the dual combined deep learning code.
Buildings 15 01103 g006
Figure 7. Regression coefficient of the combined deep learning code with a value of 91%.
Buildings 15 01103 g007
Figure 8. Sensitivity analysis of deep learning method on input parameters.
Buildings 15 01103 g008
Table 1. Specifications of samples made in the laboratory program for C30 concrete (the weight values are in kilograms).
MaterialsC30F20C30F15C30F10C30F5C30F0
Cement3.843.773.73.994.2
Ash0.768 0.566 0.42 0.21 0
Gravel10.04 10.19 10.39 10.30 10.30
Sand12.76 12.97 13.2 13.11 13.11
Water2.5442.42.242.42.4
Superplasticizer0.115 0.111 0.124 0.11 0.11
Ash Percent20%15%10%5%0%
Table 2. Specifications of samples made in the laboratory program for C60 concrete (the weight values are in kilograms).
MaterialsC60F20C60F15C60F10C60F5C60F0
Cement4.614.95.18 5.47 5.76
Ash1.15 0.86 0.580.29 0
Gravel9.32 9.48 9.53 9.53 9.53
Sand11.86 12.0612.13 12.13 11.77
Water1.841.841.841.841.84
Superplasticizer0.144 0.144 0.144 0.144 0.144
Ash Percent20%15%10%5%0%
Table 3. Sample of input and output database.
Output ParameterInput Parameters
Fc (kg/cm2)W (kg)C (kg)AW (kg)FA (kg)CA (kg)
1152.581.920.3514.1111.05
1052.551.950.3814.1511.08
1252.562.040.3214.0811.04
1162.612.180.3514.1211.08
1282.482.270.3114.1311.12
1232.542.420.3614.1511.06
1182.552.350.3314.2111.07
1192.631.980.3114.1611.10
3052.553.850.79812.9510.08
3122.543.750.7812.8510.15
3182.453.780.5812.8810.18
3252.563.760.5812.9110.23
3312.233.680.4613.2310.38
3262.353.730.4513.1510.45
3152.383.750.2513.2310.33
3102.484.020.2313.1510.35
3162.534.20013.2610.38
Table 4. Mean values of relative sensitivity of compressive strength to input parameters.
OutputFC
InputWCAWFACA
Relative Mean−0.9280.246−2.920−1.165−1.015
Disclaimer/Publisher’s Note: The statements, opinions and data contained in all publications are solely those of the individual author(s) and contributor(s) and not of MDPI and/or the editor(s). MDPI and/or the editor(s) disclaim responsibility for any injury to people or property resulting from any ideas, methods, instructions or products referred to in the content.

