Article

Optimization of Natural Ventilation via Computational Fluid Dynamics Simulation and Hybrid Beetle Antennae Search and Particle Swarm Optimization Algorithm for Yungang Grottoes, China

1
Department of Automation, School of Mechatronic Engineering and Automation, Key Laboratory of Silicate Cultural Relics Conservation (Shanghai University) Ministry of Education, Shanghai University, Shanghai 200444, China
2
The Research Institute of Yungang, Datong 037007, China
3
Institute for the Conservation of Cultural Heritage, School of Cultural Heritage and Information Management, Shanghai University, Shanghai 200444, China
*
Authors to whom correspondence should be addressed.
Buildings 2025, 15(6), 937; https://doi.org/10.3390/buildings15060937
Submission received: 12 February 2025 / Revised: 7 March 2025 / Accepted: 14 March 2025 / Published: 16 March 2025
(This article belongs to the Section Building Energy, Physics, Environment, and Systems)

Abstract

The Yungang Grottoes are undergoing degradation by weather and environmental erosion. Here, we propose a natural ventilation strategy to optimize the environments in Cave 9 and Cave 10 of the Yungang Grottoes. The novelty of this work is to use an effective computational fluid dynamics (CFD) simulation and a hybrid of the beetle antennae search and particle swarm optimization algorithms (BAS–PSO) to determine which natural ventilation scenario yields the maximum total heat transfer rate (Qmax). A CFD hygrothermal model is first developed and shows high precision in predicting temperature and humidity conditions based on real-time measured data. The natural ventilation efficiency is enhanced by different configurations of doors and windows with four ventilation rates. Combined with eXtreme Gradient Boosting (XGBoost) fitting, the hybrid BAS–PSO algorithm yields the largest Qmax (5746.74 W), which is further confirmed by CFD simulations with the outcome of a comparable Qmax (5730.67 W). It indicates that the hybrid algorithm exhibits a good performance in the identification of optimal configurations. The effectiveness of the proposed natural ventilation strategy is verified by on-site measured data. Our findings provide an effective natural ventilation strategy that is beneficial to the energy-efficient preservation of the Yungang Grottoes.

1. Introduction

Grottoes, with their integration of murals, stone statues, and religious expression, have attracted much attention due to their great artistic, historical, and cultural significance [1,2,3]. The Yungang Grottoes are ancient Chinese Buddhist cave art steeped in the history of over 1500 years, consisting of 53 Buddhist caves with more than 51,000 stone statues [4]. The site was listed as a World Heritage site by the United Nations Educational, Scientific, and Cultural Organization (UNESCO) in 2001 because of its extraordinary cultural and artistic value. The Yungang Grottoes are composed of miscellaneous sandstone and are undergoing degradation by weather, environmental erosion (e.g., water, moisture), and visitors. Hence, how to protect the Yungang Grottoes has become a matter of great urgency and has triggered many interesting investigations [5,6,7,8]. A support vector machine regression prediction model was proposed to predict the weathering levels of the Yungang Grottoes and had a good performance, with an error of less than 8.16% [9]. Wang et al. studied the spatial distributions of temperature and moisture in the Yungang Grottoes and used a preliminary monitoring method to assess the amount of condensation water [10]. Qiao et al. employed hyperspectral images and an automated system to improve the extraction accuracy of scratched murals from the Yungang Grottoes [11].
It is notable that thousands of tourists have thronged through the Yungang Grottoes in recent years, resulting in the change in the cave environment, including an uncomfortable temperature, high relative humidity (RH), and a high CO2 concentration. It is harmful to the murals and painted statues in the caves. The ventilation strategy is an effective approach to optimize the cave environment. Zhang et al. proposed a heritage building information model to optimize the RH of underground heritage sites [12]. This approach controls the RH by developing an effective ventilation system based on computational fluid dynamics (CFD) simulation, instead of employing chemical methods such as the use of surface protection materials. Luo et al. employed a split air conditioning system to develop an independent environmental control method to simultaneously satisfy visitors and relics in an archaeology museum [13]. They also studied the effect of the arrangement of air inlets/outlets on the control of the local environment in unearthed relics museums, and found that a good local environmental control for the preservation area could be achieved by developing a displacement ventilation system in which an equilibrium of the soil–air environment was obtained [14]. Wang et al. used a mechanical ventilation system to effectively reduce CO2 concentration by the increase in the air exchange rate in the Mogao Grottoes [15].
However, the above-mentioned ventilation systems are energy–consuming forms of mechanical ventilation. To achieve the goal of net zero energy consumption, natural ventilation with operable doors or windows is a prospective solution [16]. A novel machine-learning model was developed to predict the natural ventilation, and it was tested successfully in a smart building to maintain good indoor air quality and thermal comfort [17]. Park et al. determined the crucial parameters related to natural ventilation to control the opening and closing of windows in homes. They found that the Random Forest algorithm could predict window opening and closing behavior with high accuracy when seven key indoor and outdoor parameters were applied [18]. Natural ventilation is also used to protect historical buildings by analyzing and optimizing the indoor air temperature and RH. For example, Bay et al. studied the correlation between natural ventilation and the indoor environment in a historic religious building. They employed a three-dimensional CFD model combined with real monitored data to evaluate the suitability of natural ventilation, and they found that a night ventilation scenario could maintain relative humidity and comfort [19]. Nevertheless, these investigations primarily focus on indoor natural ventilation in the buildings and are inappropriate for the Yungang Grottoes for two reasons. (1) The statues in the caves and many visitors share the same limited space in the Yungang Grottoes, which is quite different from buildings with large spaces and a few visitors. (2) The caves of the Yungang Grottoes have irregular shapes, nonlinear arcs, and different height distributions, which leads to a complex hygrothermal environment. Therefore, a question arises as to how to provide an appropriate environment using natural ventilation in the Yungang Grottoes.
In this study, we design and optimize the natural ventilation in Cave 9 and Cave 10 of the Yungang Grottoes, China. A real-time monitoring system with sensor devices is first set up on site to record the temperature and relative humidity. Then, a CFD model is developed based on real-time data collecting to provide a reasonable management plan and design of natural ventilation in Cave 9 and Cave 10. Finally, CFD simulation and a hybrid of a beetle antennae search–particle swarm optimization (BAS–PSO) intelligent algorithm is used to optimize the natural ventilation by the control of windows and doors.

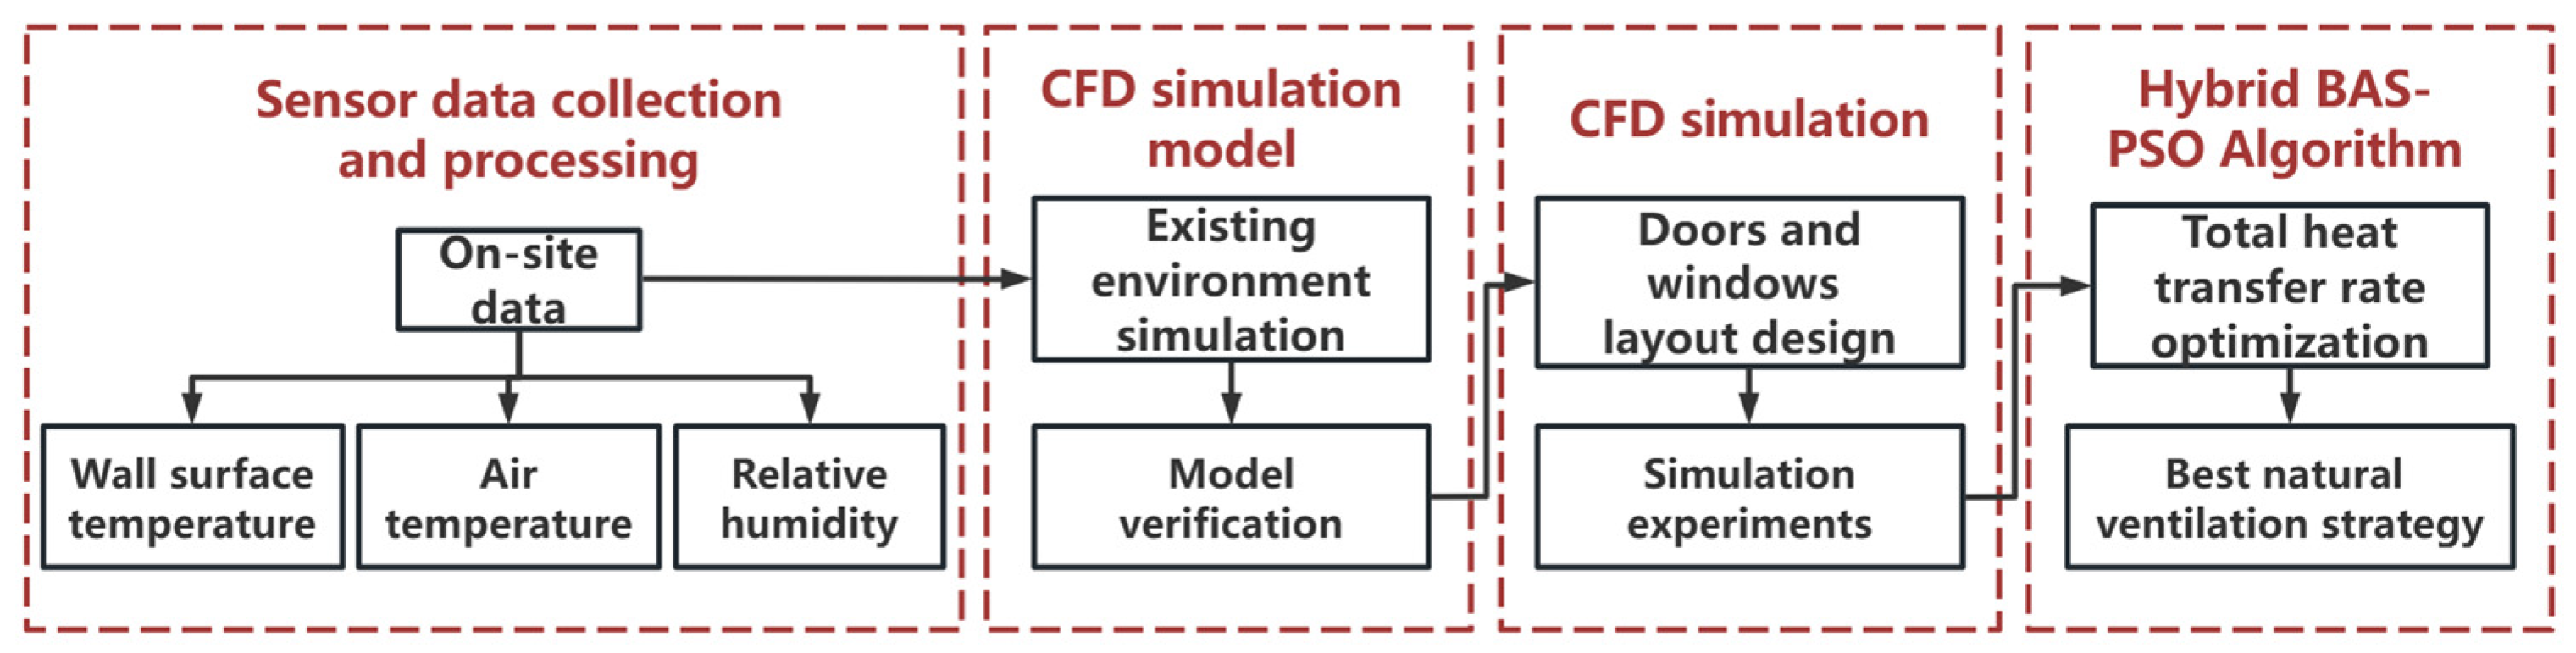
2. Methods and Procedures

Cave 9 and Cave 10 of the Yungang Grottoes were chosen to be studied. Figure 1 shows the flowchart of the methodology in this work. It is composed of four main steps. (1) Sensor data collection and processing: the installed sensors recorded the real-time wall surface temperature, air temperature, and relative humidity in Cave 9 and Cave 10. It provided experimental data to build a CFD model. (2) The establishment of a CFD model: this included the mesh generation, the numerical simulation of the existing environment, and model verification. (3) CFD simulation: this involved the layout design by the consideration of the type, location, and position of windows and doors. The orthogonal test was used to simplify the number of simulation experiments, then CFD simulations were carried out to yield a dataset including different configurations of doors and windows, and the total heat transfer rate. (4) A hybrid BAS–PSO algorithm was used to optimize the total heat transfer rate and subsequently find the maximum value. Hence, the optimized configuration of windows and doors was obtained, leading to an achievement of the best natural ventilation strategy.

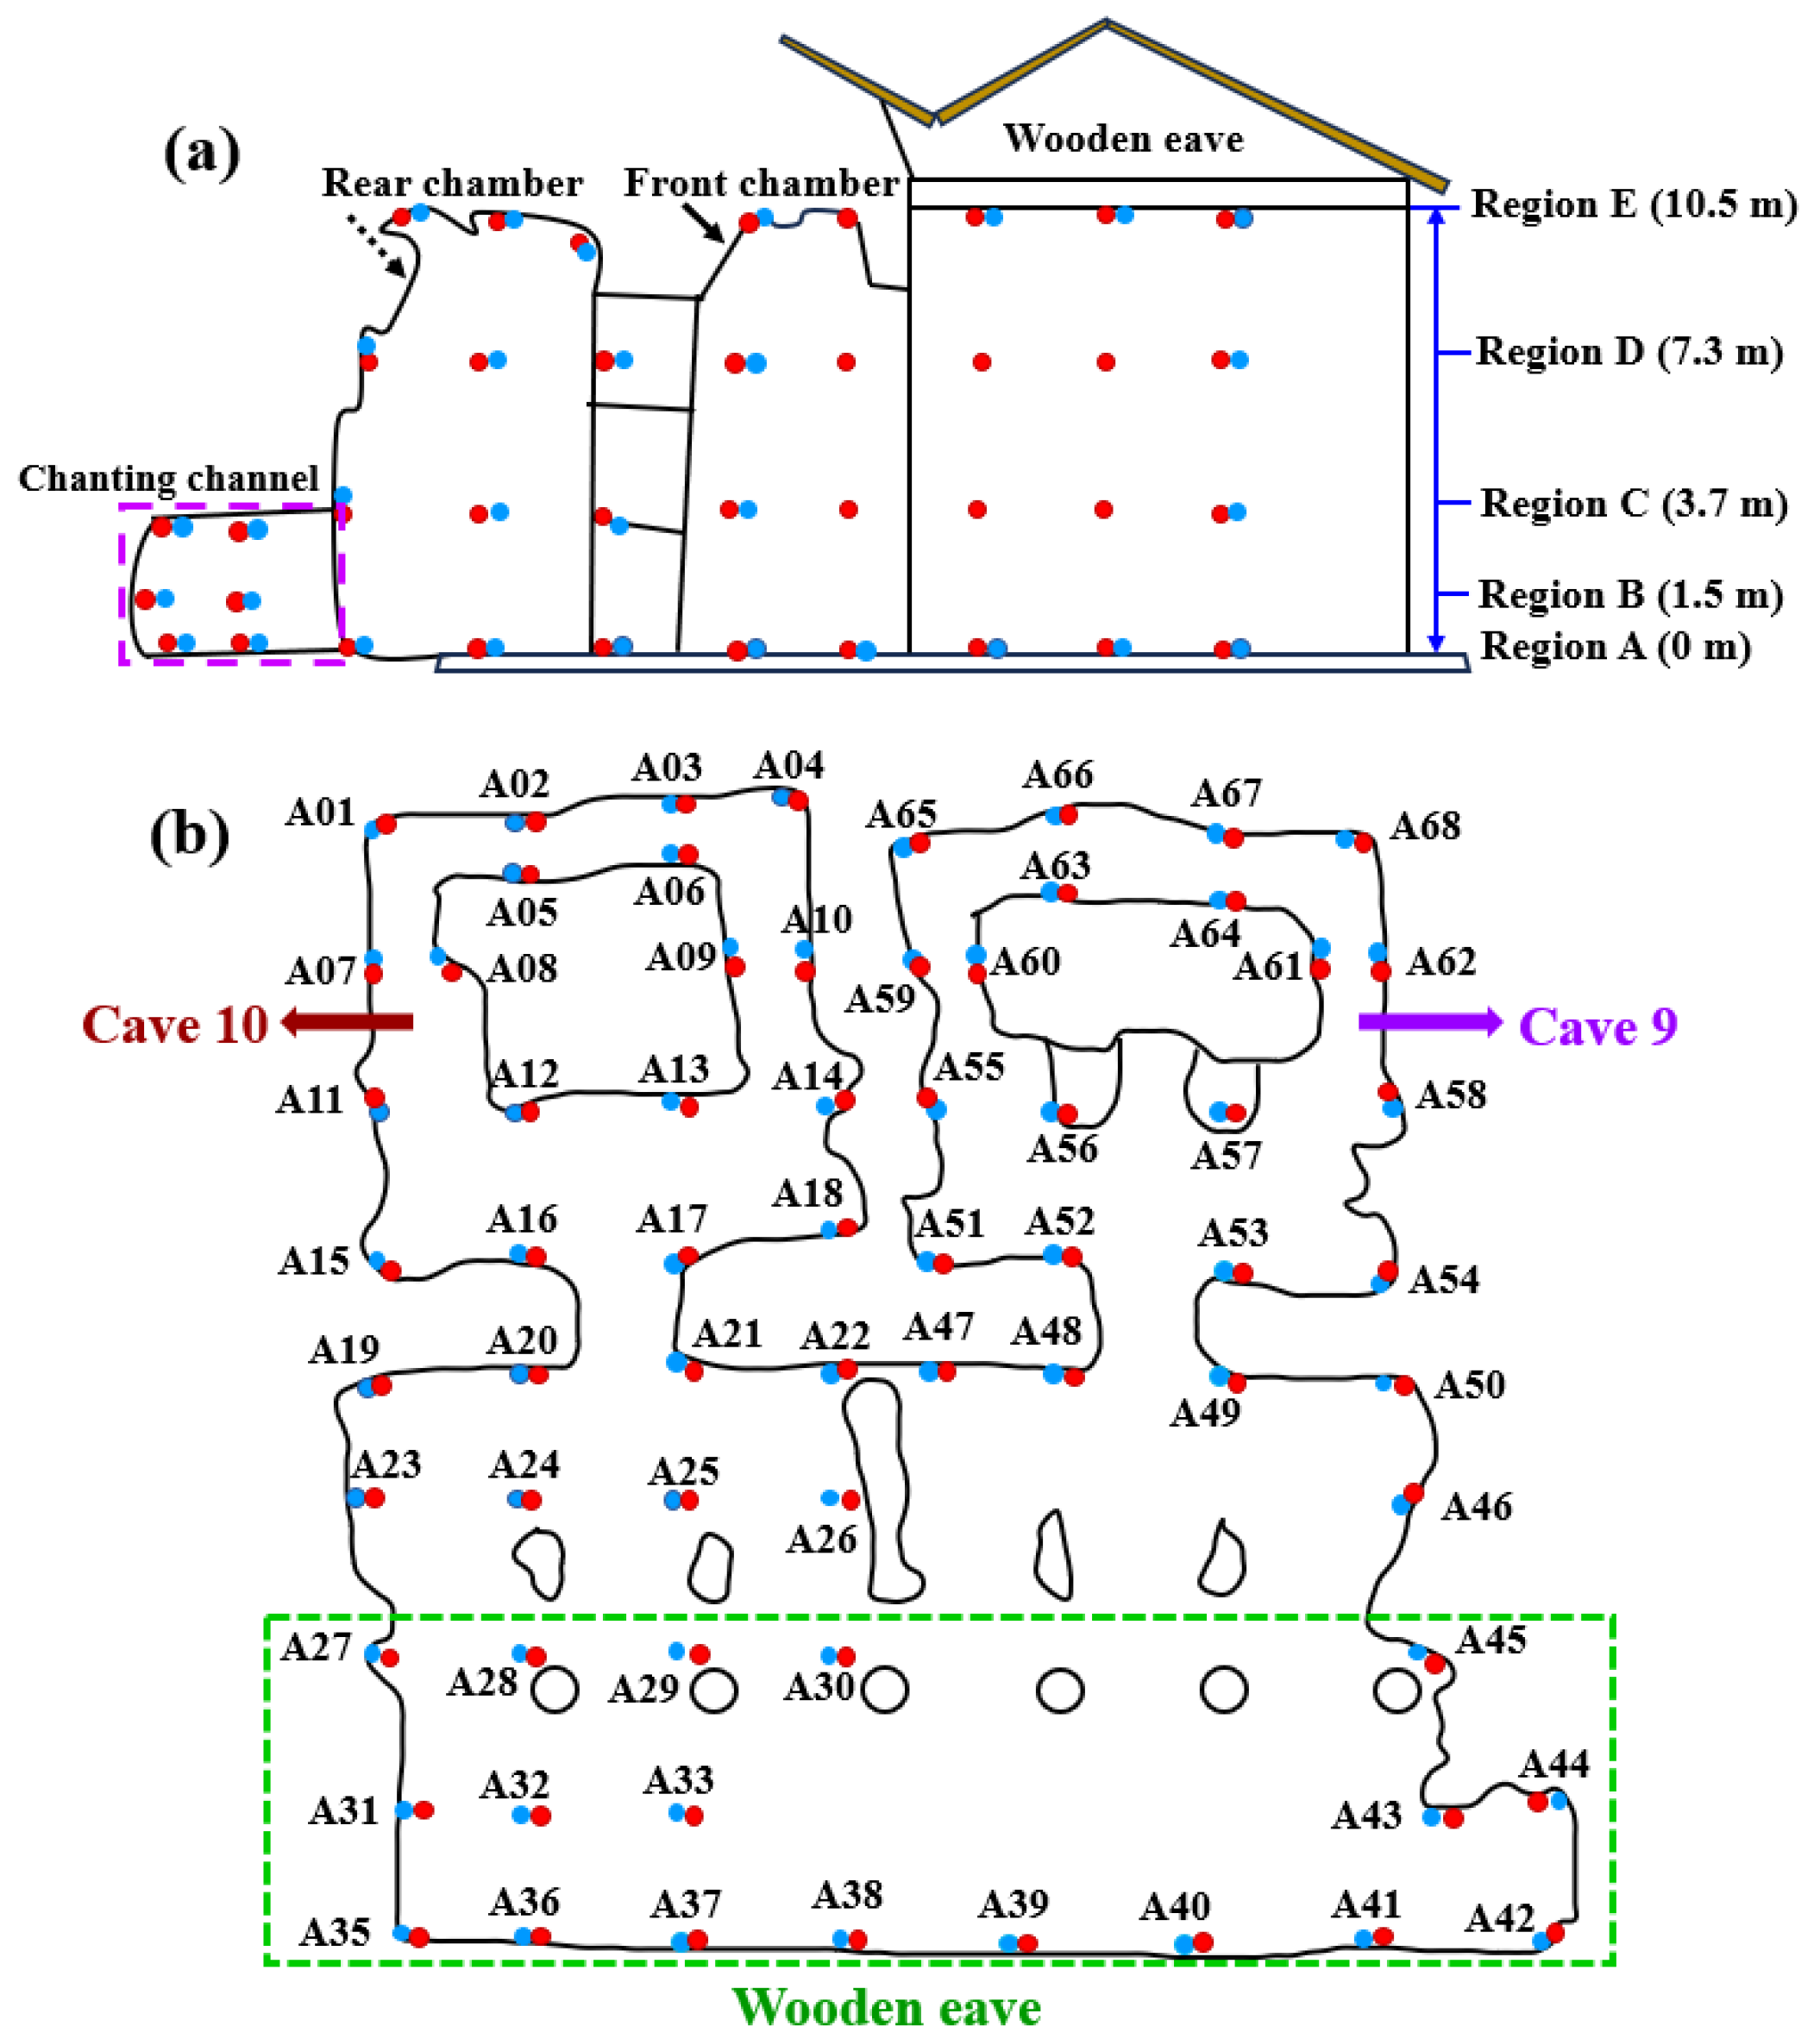
2.1. The Locations of Sensors

Cave 9 and Cave 10 in the Yungang Grottoes now share a wooden eave structure, as shown in Figure 2a. The schematic diagram of the layout of the doors and windows in the eave is shown in Figure 2b. There are three wooden doors, four big windows, and seven small windows. Three doors have the same size, with 2.5 m in width and 4.55 m in height. Four big windows have the same height (2.62 m), but show different widths. The widths of 2.3 m, 2.5 m, and 2.9 m are marked as brown, blue, and pink, respectively in Figure 2b. Seven small windows show the same height of 1.48 m, while they exhibit different widths of 2.3 m, 2.5 m, and 2.9 m.
Both Cave 9 and Cave 10 consist of a front chamber (marked as a solid-line arrow), a rear chamber (marked as a dashed-line arrow), and a chanting channel (marked as a dashed-line rectangle); see the vertical view in Figure 3a. The locations of sensors are determined by the sizes of Cave 9 and Cave 10. The front chamber and rear chamber of Cave 9 have a size of 12.25 m (length) × 4.55 m (width) × 10.80 m (height) and 11.00 m × 7.30 m × 10.82 m, respectively. The front chamber and rear chamber of Cave 10 show the sizes of 11.86 m × 4.35 m × 11.83 m and 11.40 m × 7.02 m × 10.81 m. The height of the chanting channel is about 3 m. An extensive monitoring system with sensor devices was installed based on the heights of Cave 9 and Cave 10. In Figure 3a, the sensors were distributed in five regions, marked as Region A, Region B, Region C, Region D, and Region E, with the respective heights of 0 m, 1.5 m, 3.7 m, 7.3 m, and 10.5 m. In total, 184 sensors were used to measure cave wall temperatures (marked as blue dots) and 190 sensors were set up to monitor air temperatures and RH (marked as red dots) in this work. The monitoring interval of all sensors was 5 min. The temperatures were measured with an accuracy of ±0.3 °C in a range of −40–80 °C, and RH was recorded with the accuracy of ± 3% in a range of 0–100%. There are 67 monitoring points in Region A, and the plan view of the sensor locations is shown in Figure 3b. The sensor locations in the wooden eave are shown in a dashed-line green rectangle. The locations of sensors in regions B–E are exhibited in Figures S1–S4 of the Supplementary Materials.

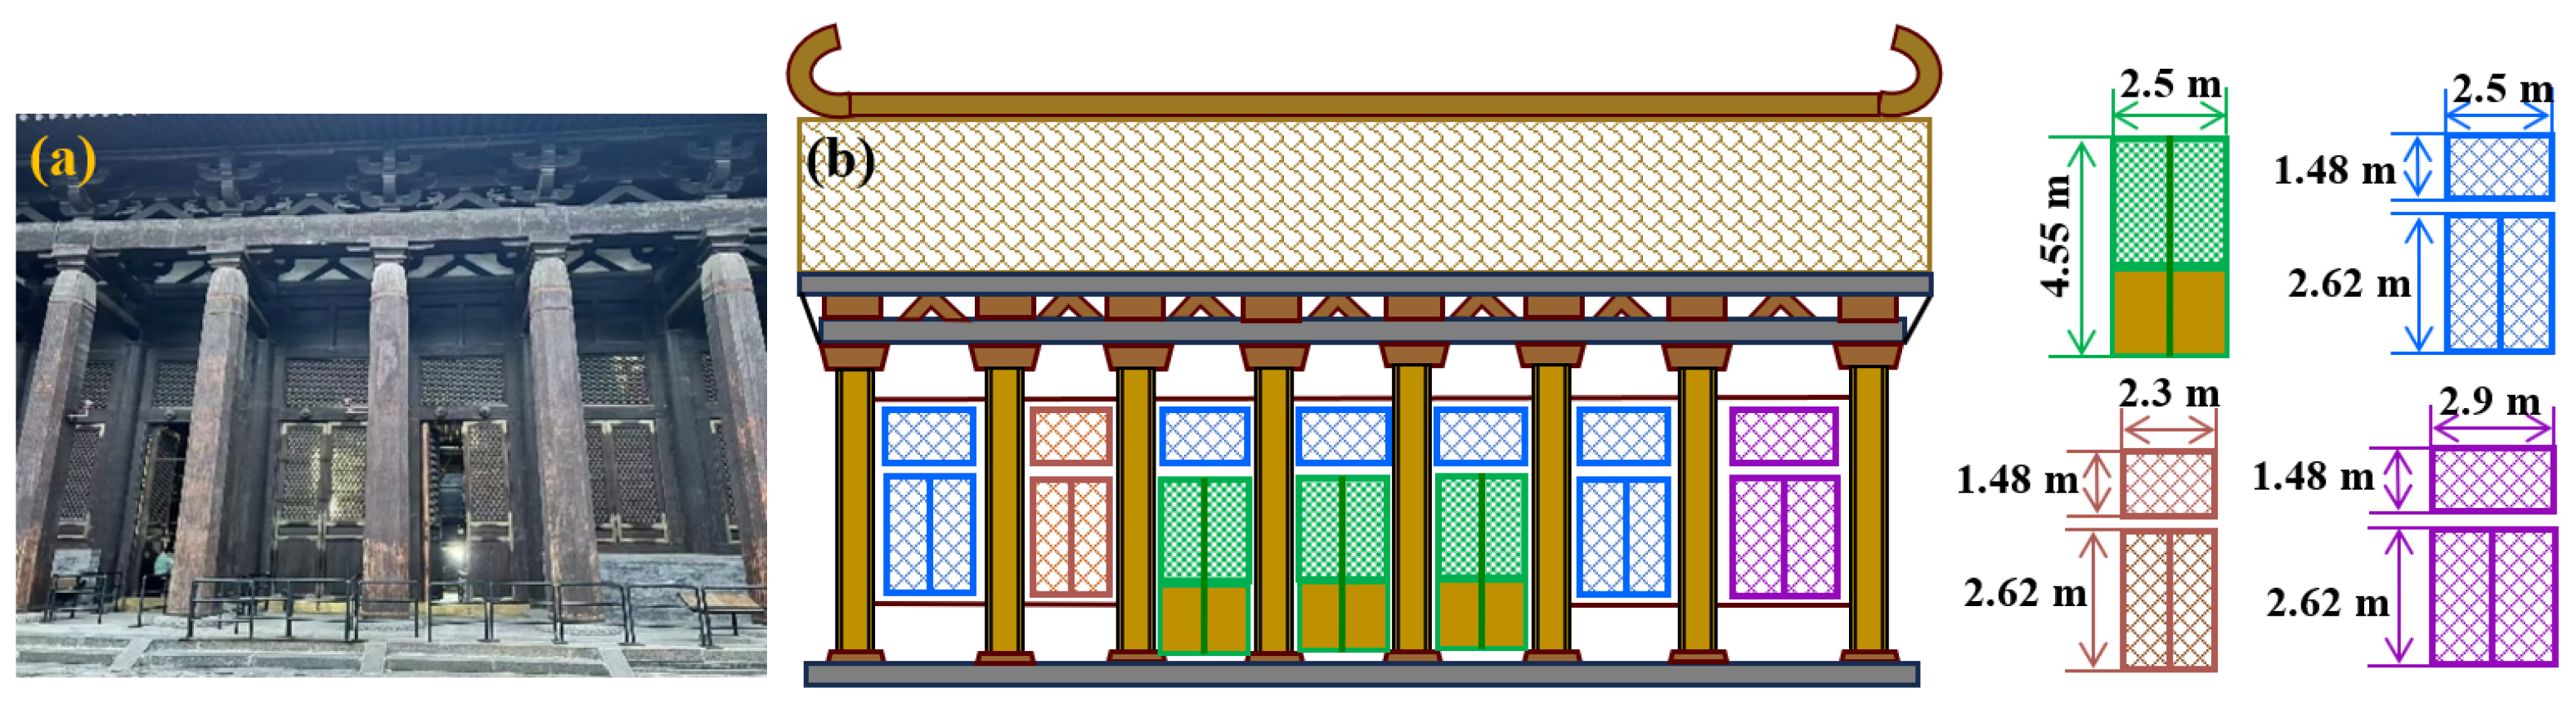
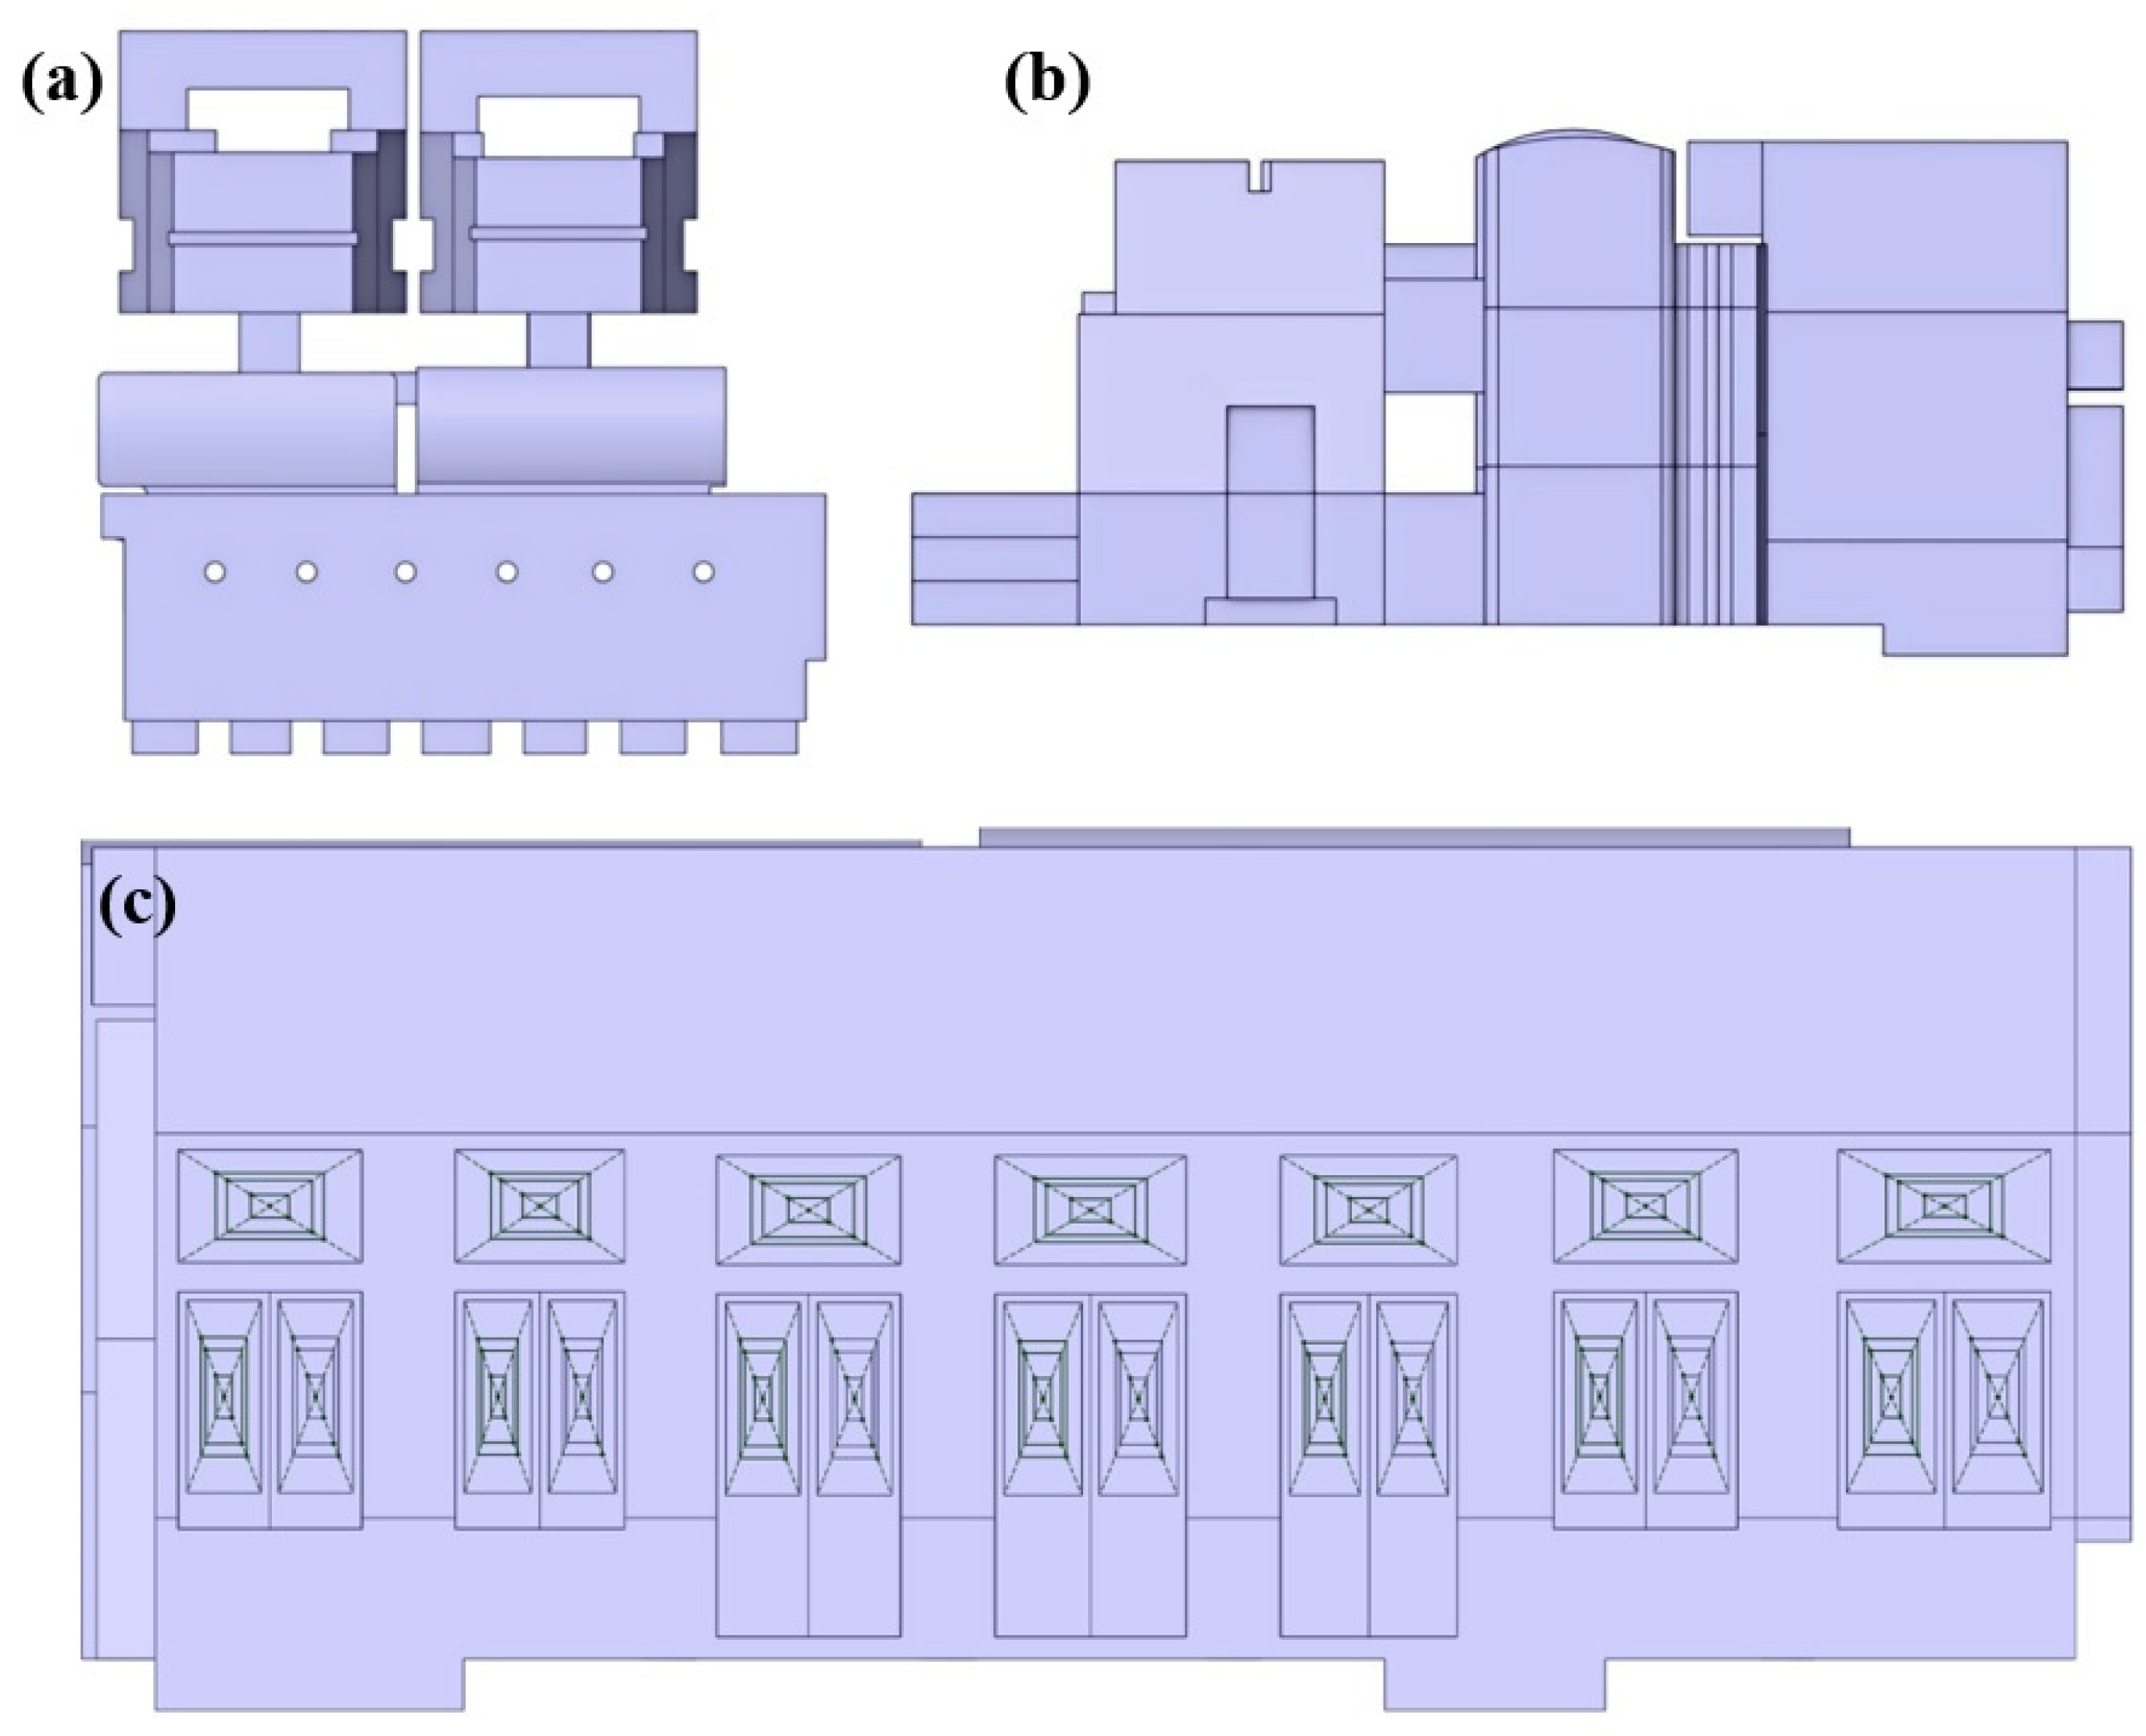
2.2. Simulation Model

Although real-time measurement is a direct method to reflect the real conditions in Cave 9 and Cave 10, it also has several limitations. (1) Key environmental parameters, such as total heat transfer rate, are difficult to measure accurately due to the complexity of the environment. (2) The changes in weather outside and the number of tourists in caves can cause the fluctuations of temperatures and RH, leading to less precise measurement. To address these limitations, we established a CFD simulation hygrothermal model using ANSYS SpaceClaim 2023 R2 software and employed on-site measured data as simulation boundary conditions. The effects of various conditions of doors and windows on natural ventilation were determined by CFD simulations. Some features were simplified to reduce the complexity of simulations, such as the following: (i) the cave walls were assumed to be smooth; (ii) the angle between Caves 9 and 10 was ignored. Figure 4a,b shows the plan view and vertical view of the hygrothermal model developed for CFD simulations based on these simplifications.
In the wooden eave, three doors and four big windows were divided into left and right halves with the ventilation rates set as 10%, 50%, 80%, and 100%. The ventilation rates in the seven small windows were set as 0%, 10%, 50%, and 80%. For each ventilation rate, the corresponding equivalent ventilation area was designed as the inlet of the simulation model, while all remaining areas were set as walls; see Figure 4c. This approach involved the consideration of various combinations of door and window configurations and ventilation rates within a single simulation model.
The established model used ANSYS FLUENT Meshing 2023 R2 software with a mixed cell type for grid generation. To balance computational accuracy and efficiency, the optimal number of nodes and cells were set as 9,352,449 and 3,615,541, respectively. Five testing models with mesh numbers of 460,319, 1,038,007, 2,263,776, 3,615,541, and 4,263,776 were selected to validate grid independence. Numerical simulations demonstrated that the relative deviation of air temperature and relative humidity between the 3,615,541 and 4,263,776 cells remained below 2.5%. The calculation result was basically independent when the grid was composed of 3,615,541 cells, which could satisfy the calculation precision. Since excessive grid densities may significantly increase computational overhead and impede convergence rates, 3,615,541 cells was finally chosen as the optimal number. Element quality metrics, defined as a normalized composite index ranging from 0 to 1, were used to quantitatively evaluate the mesh regularity. In this work, element quality was in the range from 1.2666 × 10⁻² to 1 with an average value of 0.83507, demonstrating superior mesh uniformity. Skewness represents the deviation from an ideal polyhedron and indicates optimal symmetry when it approaches zero. The skewness in this work is in the range from 7.8675 × 10⁻⁷ to 0.99781 with the average value of 0.23112, which indicates the presence of minor geometric distortion and meets high-precision computational fluid dynamics requirements. Orthogonal quality serves as a critical metric for evaluating grid orthogonality. For the current model, the orthogonal quality values range from 2.1873 × 10⁻³ to 0.9936, with a domain-averaged value of 0.76735. The statistical characteristics of all parameters confirm the reliability of the grid system and the robustness of the numerical simulations.
The numerical simulations used the pressure-based solver in ANSYS FLUENT 2023 R2 with a double-precision formulation to resolve stationary hygrothermal flows inside the grottoes. The governing equations were solved using the SST k–omega RANS model and the default turbulence model constants. The species transport model was activated to determine the relative humidity and employed the water vapor mass fraction as a boundary to replicate realistic moisture distribution. The spatial discretization employed a second-order upwind scheme for momentum, turbulence quantities (turbulent kinetic energy, and specific dissipation rate), energy, and species transport equations, ensuring consistent numerical accuracy. The Coupled algorithm handled pressure–velocity coupling and showed good robustness for flows dominated by thermal gradients.

2.3. Orthogonal Experimental Design

As an effective experimental method, the orthogonal test has been widely used to extract essential features and achieve the most efficient combination of experimental parameters [20,21,22,23,24]. In this study, 21 controllable openings were obtained based on Figure 4c. Each opening had 4 ventilation rates, as shown in Table 1. The experiments were designed using an L64 (421) orthogonal table. Four big windows were denoted as W1#, W2#, W3#, and W4#. Three doors were termed D1#, D2#, and D3#. Seven small windows were named, from SW1# to SW7#. The L and R in Table 1 represent the left and right halves, respectively.

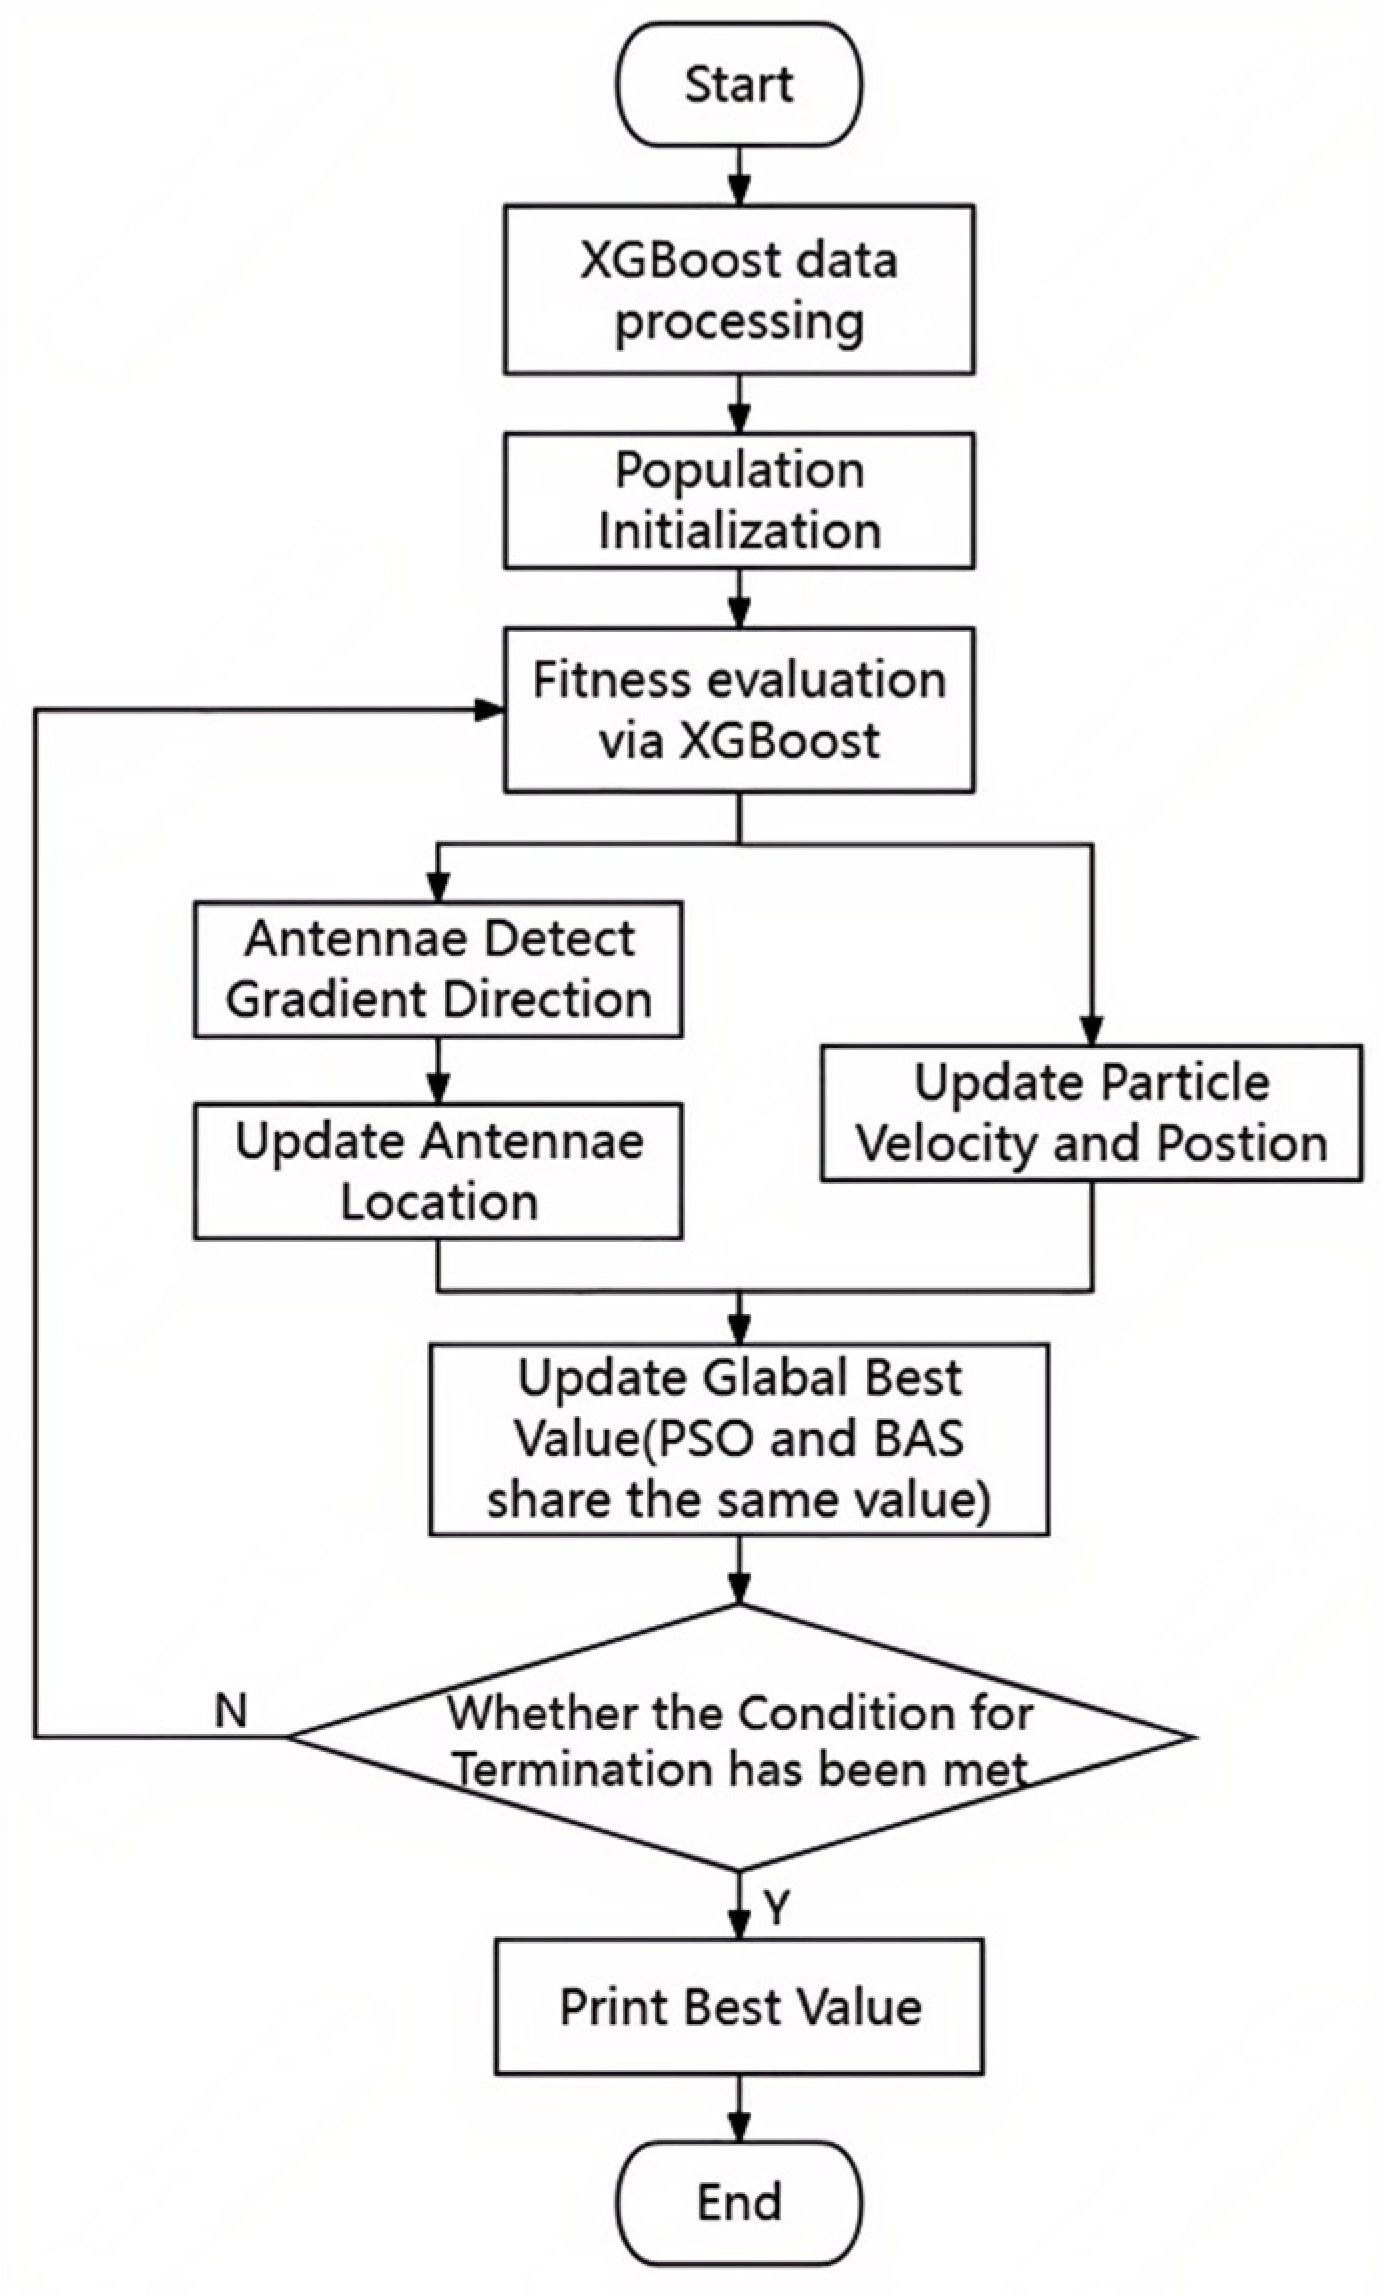
2.4. Intelligent Hybrid Algorithm

Although the orthogonal experimental method effectively reduces the number of experimental iterations, it may omit the optimal configurations of doors and windows. To overcome this limitation, this study proposed a hybrid BAS–PSO algorithm, which was guided by eXtreme Gradient Boosting (XGBoost) fitting to optimize the total heat transfer rate and identify the best combination of parameters. XGBoost is a learning algorithm exhibiting fast operation and high accuracy, and it has wide applications in assessment, prediction, and sensitivity analysis [25,26,27]. XGBoost requires different training and testing groups during its operation. In this study, the input data were randomly divided into two groups: 85% of the simulation experiment data were served as the training group, and 15% were served as the testing group.
Inspired by the foraging behavior of beetles using antennae to sense odor intensity and locate food, the BAS algorithm is distinguished by its robustness, efficient optimization, and simplicity. It has extensive applications in various domains, including power dispatching, image processing, and path planning [28,29,30]. The optimization process of the beetle antennae search algorithm is shown as follows.
A beetle orientation is inherently random at any position. This randomness is represented by a directional vector b that is generated and normalized:
b = r a n d n , 1 r a n d n , 1
The positions of the left and right antennae of a beetle are calculated by
x l e f t = x i + b · v x r i g h t = x i b · v
where v is the sensing range of the beetle antennae. To update the beetle position, the odor concentration detected by both antennae is evaluated and given by
x t = x t 1 + s t * b * s i g n f x l t f x r t
where sign is defined as
s i g n = 1 ,   f x l t f x r t > 0 0 ,   f x l t f x r t = 0 1 ,   f x l t f x r t < 0
When the fitness value detected by the right antenna is greater, the beetle moves to the right, and vice versa. When the fitness values of both antennae are equal, the beetle remains stationary. Then, it regenerates a new random direction, and subsequently recalculates its step size for subsequent movement.
The PSO is an evolutionary algorithm inspired by bird flock foraging, which was initially introduced by Kennedy and Eberhart [31,32]. It has been used widely due to its simplicity, high accuracy, and rapid convergence. Each particle adjusts its position and velocity in every iteration based on personal and global optima. The rules governing these updates are defined by Equations (5)–(9). First, given a n-dimensional search space and a swarm consisting of N particles, the position of particle i(Xi) in the search space can be expressed as
X i = x i 1 , x i 2   , , x i n
where i = 1, 2, 3, …, n. The velocity vector (Vi) is also in n-dimensional space and is given by
V i = v i 1 , v i 2   , , v i n
The best position reached by particle i(Pibest), representing the personal best or individual extremum, is shown as
P i b e s t = p i 1 , p i 2   , , p i n
The best position attained by the swarm, termed as the global best (Pgbest) or group extremum, is given by
P g b e s t = p g 1 , p g 2   , , p g n
The velocity and position of the particles are updated as follows:
v i d j + 1 = w × v i d j + c 1 r 1 p i d j x i d j + c 2 r 2 p g d j x i d j x i d j + 1 = x i d j + v i d j + 1
where d = 1, 2, 3 …… n, the j is the current number of iterations, w is the inertia weight, c1 and c2 are the acceleration constants, and r1 and r2 are random numbers ranging from 0 to 1.
Although the BAS and PSO algorithms have their distinct advantages, they also exhibit some limitations. For example, the PSO algorithm is usually limited by premature convergence and susceptibility to local optima [33]. These drawbacks occur because particles solely rely on historical global and individual best positions during the searching process, making it difficult to escape local optima in complex problem-solving cases. Moreover, the performance of the PSO algorithm is influenced by the number of particles and the parameter settings. A smaller number of particles increases the risk of being trapped in local optima, while a larger number of particles increases the computational cost and reduces efficiency. The tuning of multiple parameters in the PSO evolution equation also significantly affects the performance, as different configurations yield various outcomes. In contrast to the PSO algorithm, the BAS algorithm conducts optimization using only a single beetle rather than a population. Hence, it requires fewer parameters, leading to a reduction in computational complexity. However, the BAS algorithm suffers from slow convergence and less accuracy in addressing high-dimensional complex problems, resulting in local optima and suboptimal accuracy [30].
Here, a hybrid BAS–PSO optimization algorithm was proposed in this study to overcome the above limitations. XGBoost was first employed to convert discrete CFD data into continuous decision variables, allowing the rapid fitness evaluation of door and window configurations through its trained regression model. Then, using the fitness predictions generated by XGBoost, the BAS algorithm created localized search paths via random directional perturbations of its left and right antennae, guiding beetle individuals toward high-fitness regions through fitness comparisons of predicted values. At the same time, the PSO algorithm dynamically adjusted the global exploration trajectory of the particle swarm by the incorporation of the predicted fitness of historically optimal solutions, balancing global exploration via social cognition and individual experience. In the hybrid framework, the PSO algorithm and the BAS algorithm share iterative updates of positions and fitness values. The integrated algorithm balanced local exploitation and global exploration to avoid local optima and ultimately converge to optimal solutions. Figure 5 shows the flowchart of the hybrid BAS–PSO algorithm. It begins with training an XGBoost surrogate regression model on discrete CFD data to continuous fitness values. Then, several parameters are initialized, including the beetle population size (m), step size (d), and a random direction vector (b). The parameters of the PSO algorithm consist of the particle swarm size (k), initial particle positions (x), velocities (v), inertia weight (w), and learning factors (c1 and c2). The maximum number of iterations (N) is set as 100. Beetles and particles are randomly distributed in the search space, and their initial fitness values are computed using the XGBoost model. During each iteration, both BAS and PSO algorithms are applied to optimize the fitness function, as defined in Equations (1)–(9). The global optimal solution is dynamically updated by selecting the highest fitness value between BAS and PSO (g = argmax (fBAS, fPSO)). Next, the optimal position in the BAS algorithm is used to refine the swarm positions of the PSO particles, or the global optimum of PSO is fed back to the BAS as a reference target. This iterative process continues until the termination condition is met. Once the stopping criterion is satisfied, the global optimal solution is output, and the algorithm terminates.

3. Results

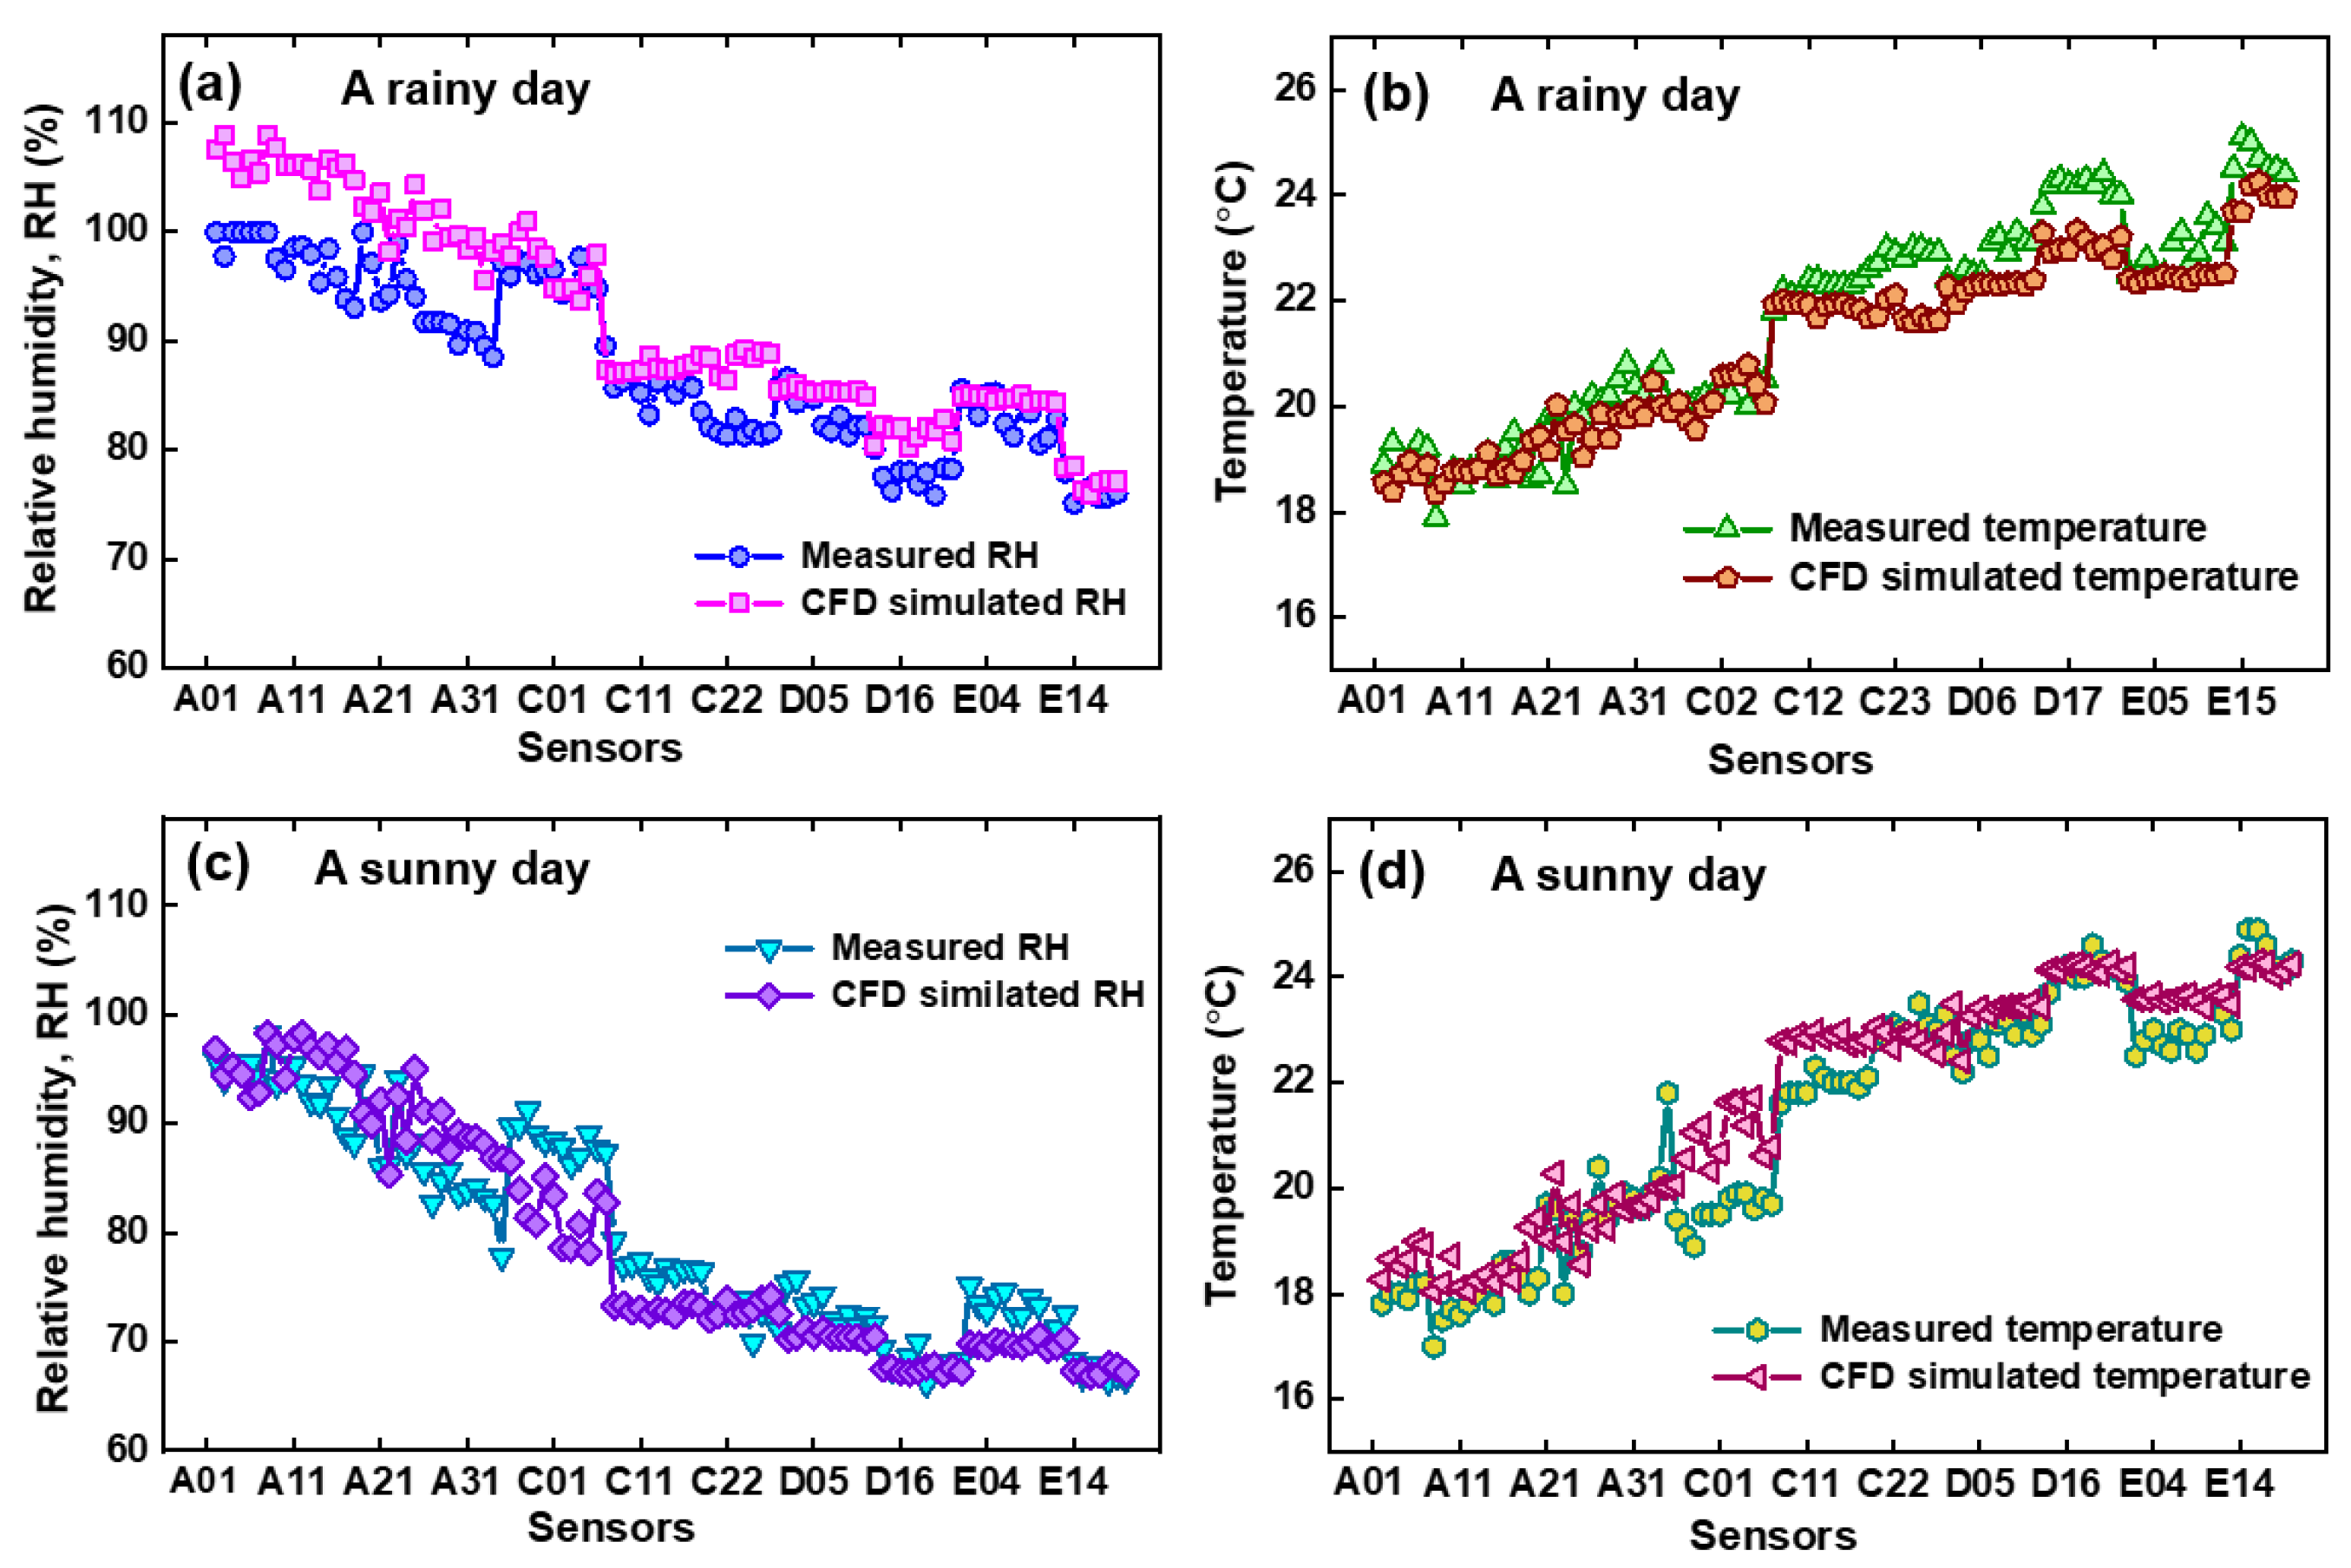
3.1. Model Validation
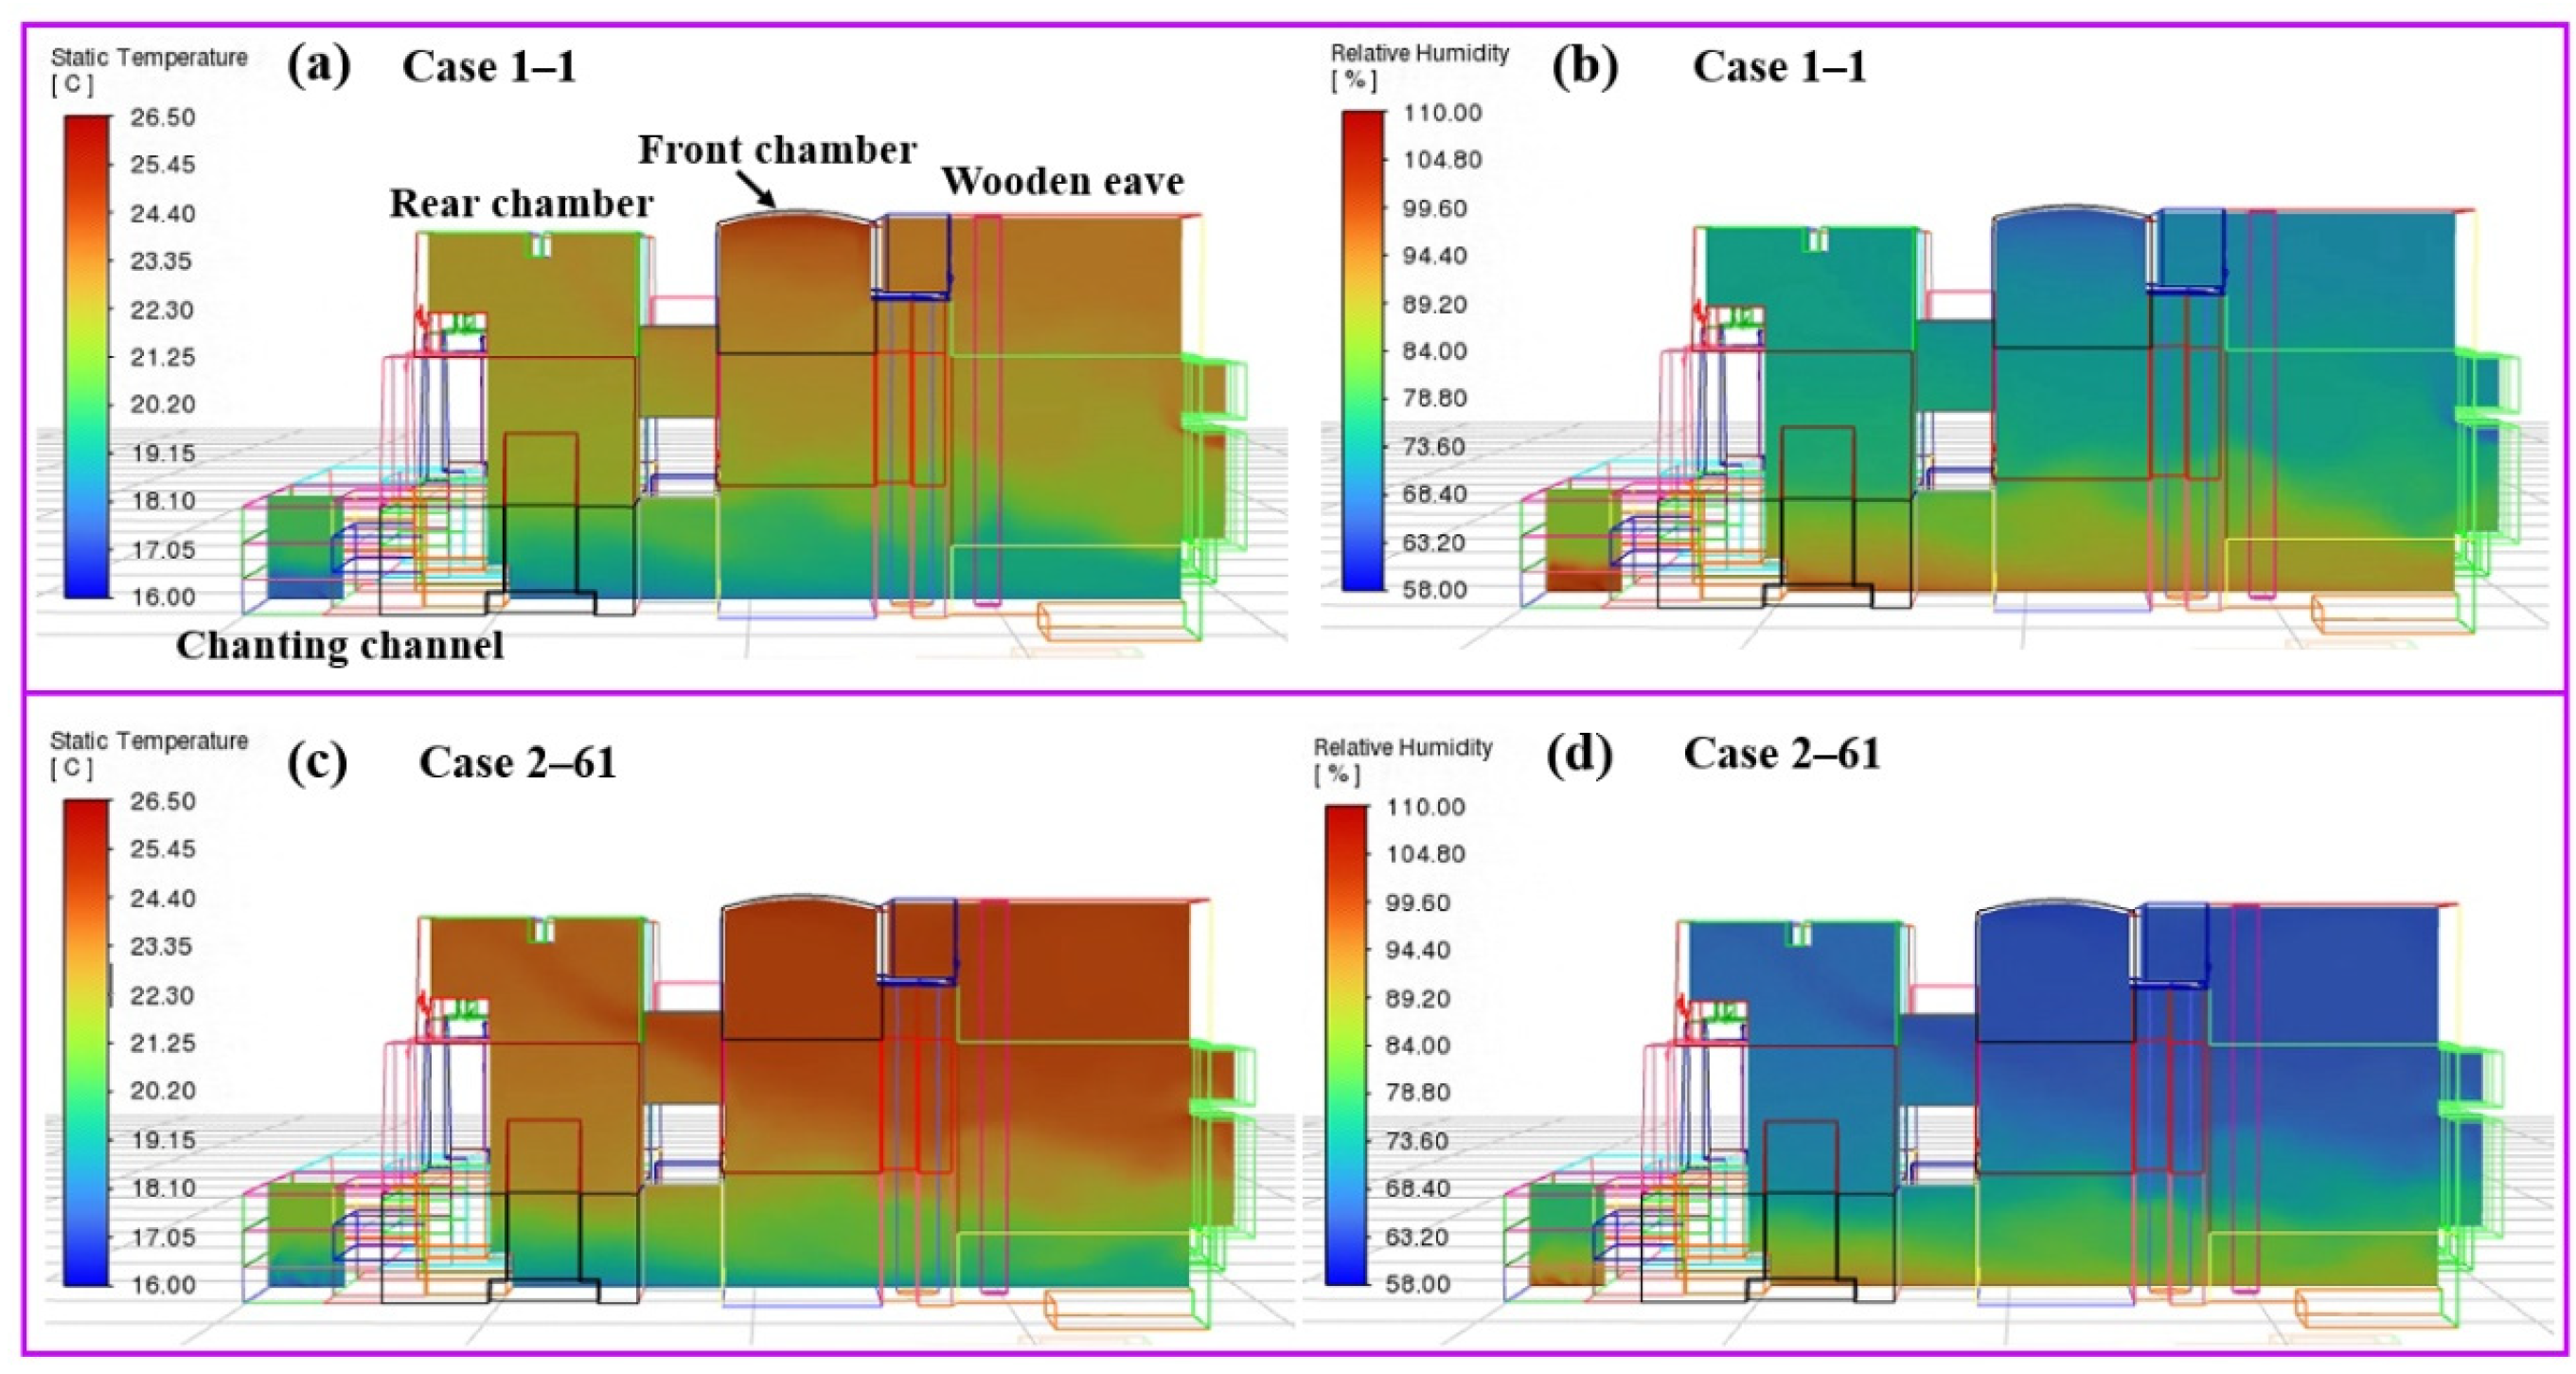
The model for CFD simulation is validated by the measured real-time temperatures and RH, which can reduce the risk of creating a model with uncertainty about grottoes. Here, two days in summer with different temperatures and humidity levels were selected from the on-site measured data to examine the validity of the model. One is a rainy day (11 August 2023) and termed Scenario (1), and the other is a sunny day (15 August 2023) and named Scenario (2). Figure 6a,b show the comparison of RH and temperature in a rainy day between the measured and simulated data. The values from real-time measured data compared with the results from the CFD simulation on a sunny day are shown in Figure 6c,d. The calculated mean relative error (MRE) and root mean square error (RMSE) of the temperature and RH are shown in Table 2. In the case of Scenario (1), the respective MREs of the temperature and RH are 2.71% and 4.96%, and the RMSEs of the temperature and RH are 0.80 and 5.69. In case of Scenario (2), the MRE and RMSE of the temperature are 2.99% and 0.77, and the MRE and RMSE of the RH are 3.92% and 3.98, respectively. This indicates that the simulation model exhibits high accuracy, which can accurately simulate the hygrothermal environment in Cave 9 and Cave 10 and provide reliable outputs.

3.2. CFD Simulation

According to the orthogonal experimental design shown in Table 1, two sets of experimental schemes with a total of 128 combinations of doors and windows were performed in each CFD simulation. The number of experiments is termed Case M–N, where M represents experimental schemes (1 or 2) and N is the experimental group (from 1 to 64). The real-time measured data of temperature and RH at 11:00 am on 12 August 2023 were chosen as boundary conditions in CFD simulations. Note that the natural ventilation strategy is effective when the external air can exchange heat in the front chambers, and especially in the rear chambers and the chanting paths of Cave 9 and Cave 10. The total heat transfer rate (Q) represents the heat absorbed or released by the object during the temperature change and is widely used in thermal engineering [34,35]. Hence, in CFD simulations, Q is used to evaluate the efficiency of a natural ventilation strategy. That is, this work aims to find the maximum total heat transfer rate (Qmax), resulting in the most efficient natural ventilation.
After CFD simulations, we chose and compared two different configurations of doors and windows (Case 1–1 and Case 2–61) to understand the effects of configurations on natural ventilation. The detailed configurations of doors and windows in the two cases are shown in Table S1 in the Supplementary Materials. The simulation results show that Case 2–61 achieves the highest Q (5358.35 W), while Case 1–1 has the lowest Q (2231.02 W). The temperature distribution is illustrated in the temperature cloud diagrams. In Case 1–1, although the air can exchange heat with the rear chamber, the distribution of temperature in the front chamber, rear chamber, and chanting channel is not uniform; see Figure 7a. For example, the air temperature at a height of 2 m above the ground in the front chamber is approximately 20 °C, while the temperature at the top of the front chamber is around 24.7 °C. Moreover, the average temperature in the chanting channel is 17 °C, which is lower than the real-time measured temperature of 26.2 °C. Similarly, the distribution of RH in front chamber and rear chamber in Case 1–1 is also not uniform, as shown in Figure 7b. This indicates that natural ventilation efficiency is not satisfied in Case 1–1. In contrast, the temperature cloud diagram for Case 2–61 in Figure 7c reveals that the natural ventilation strategy leads to more uniform heat transfer across the wooden eave, the front chambers, and the rear chambers. This results in a homogeneous air temperature increase of approximately 2 °C. In Figure 7d, the distributed RH in Case 2–61 is more uniform than that in Case 1–1. It suggests that the efficiency of natural ventilation can be improved by modifying the configuration of doors and windows on the wooden eave of Cave 9 and Cave 10.

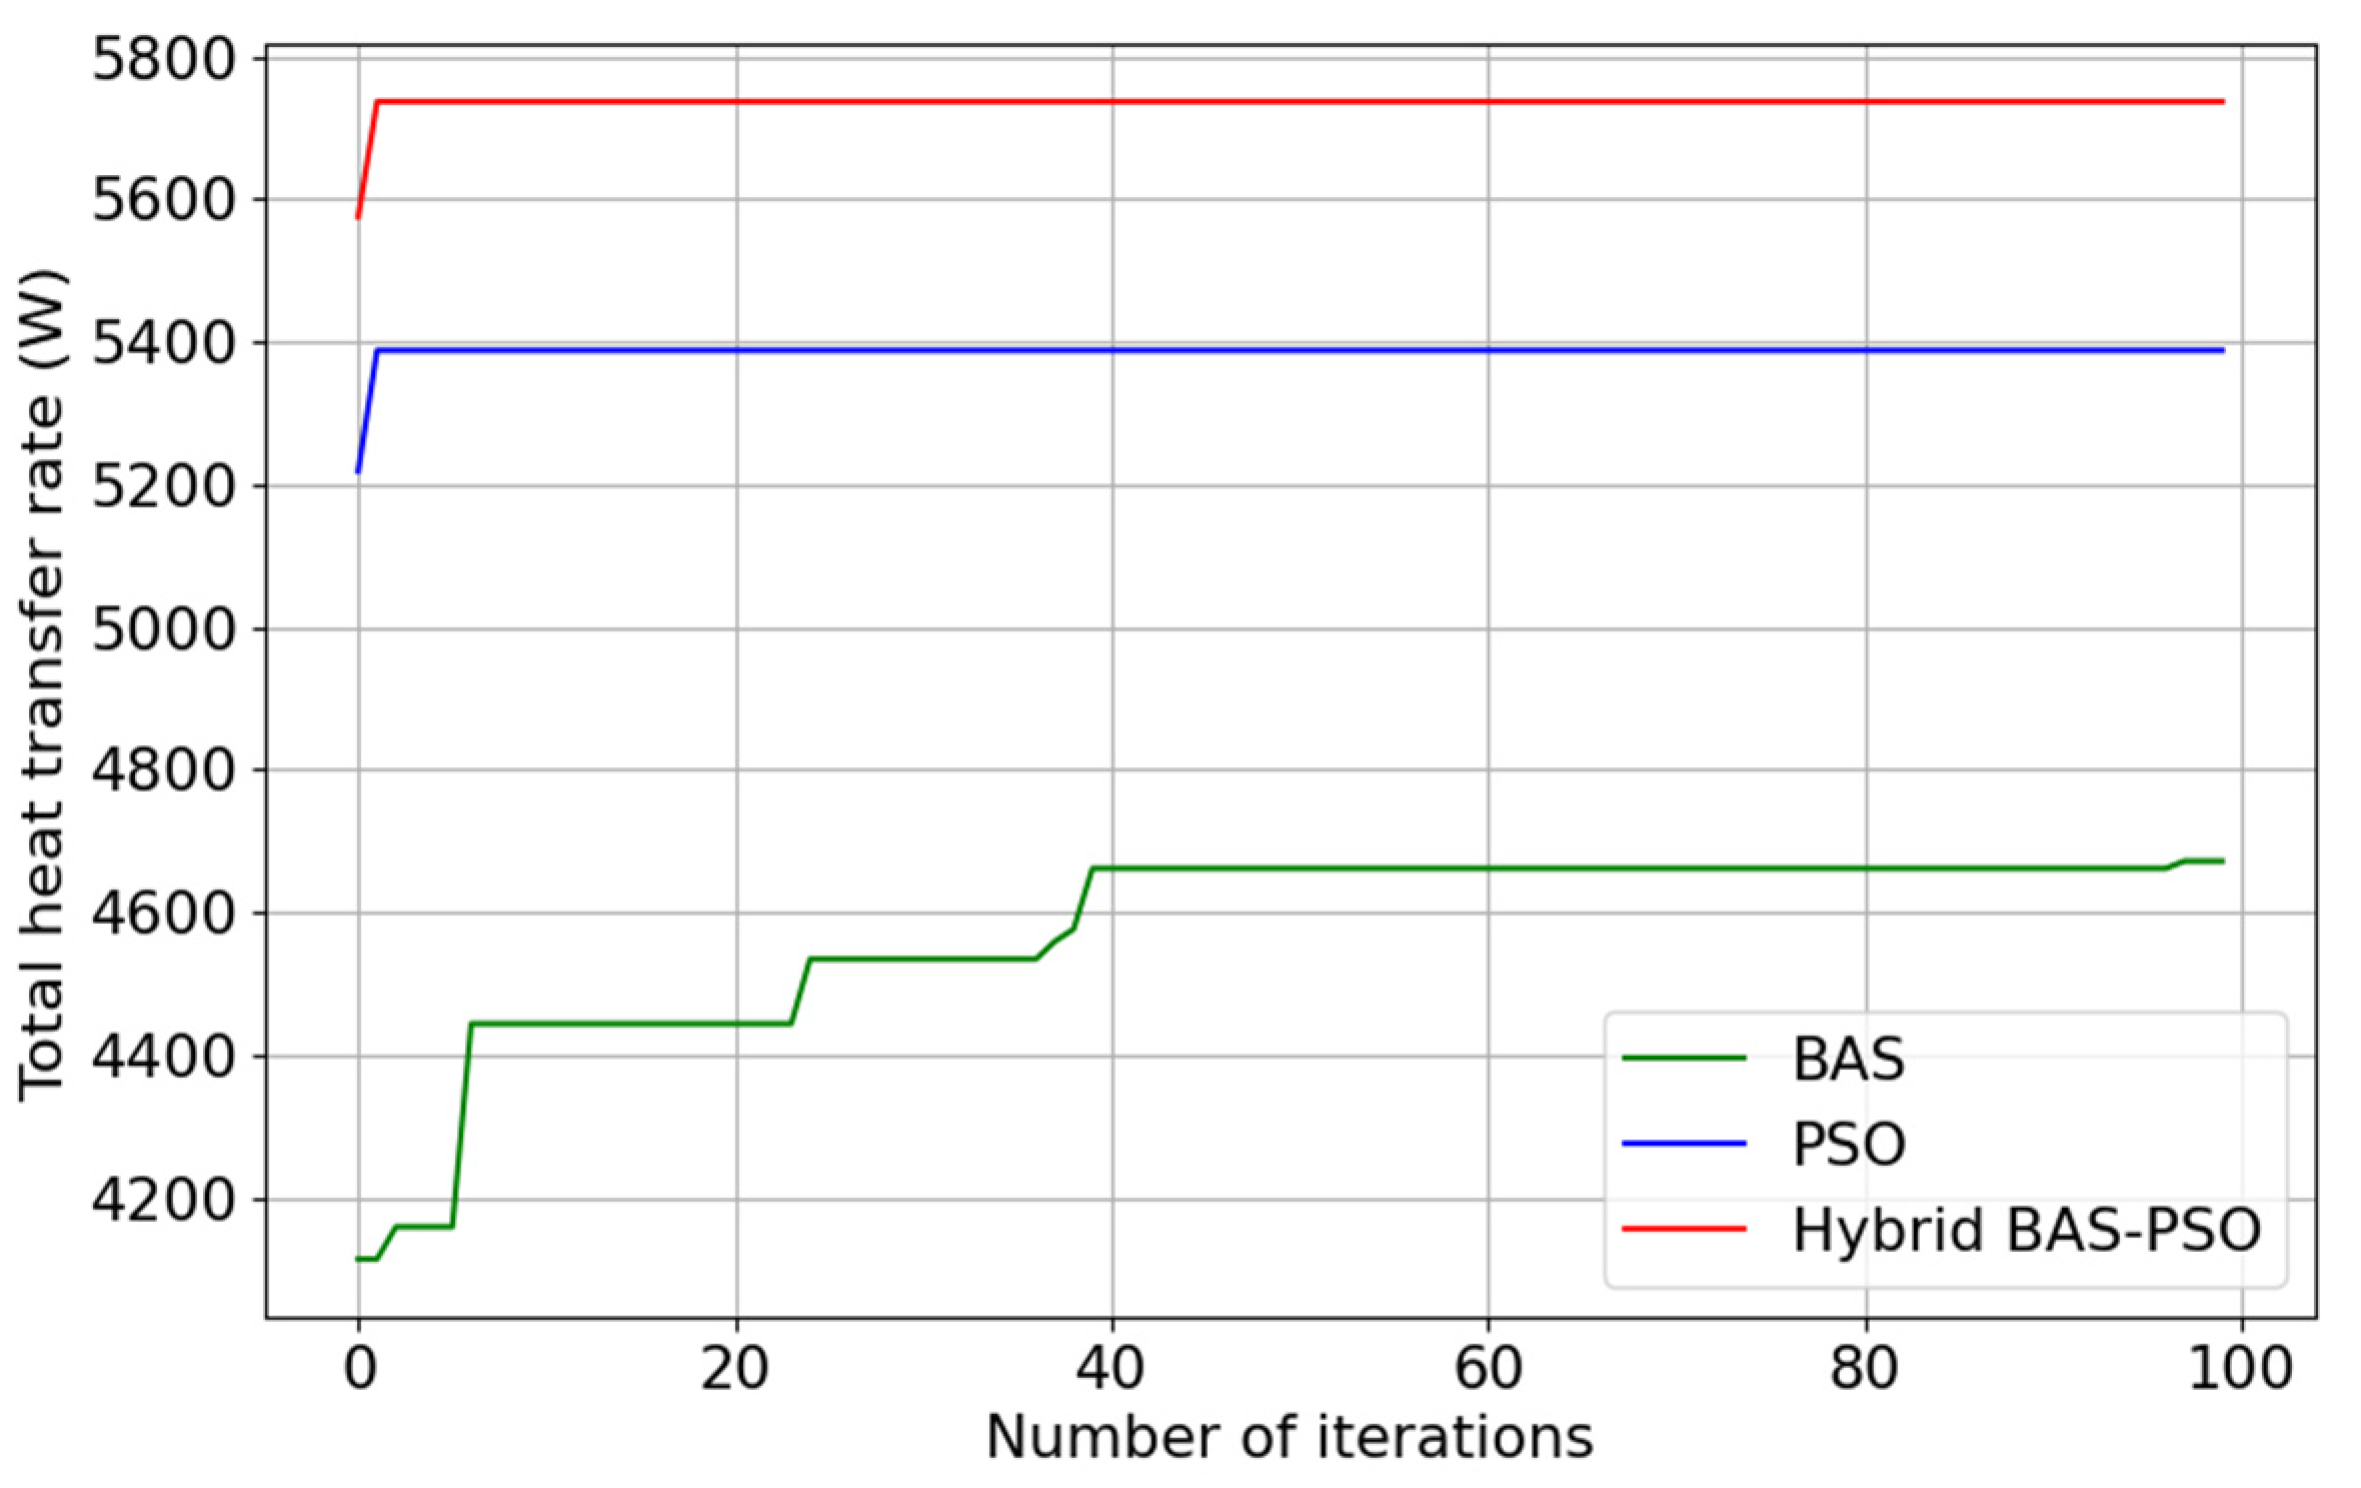
3.3. XGBoost Fitting and Comparative Analysis of Algorithm Performances

Various training and testing groups are required in the performance of XGBoost. Of CFD simulated data, 85% were used as the training group, and 15% were employed as the testing group. Figure 8a,b shows the fitting result of the training group and testing group. The XGBoost algorithm effectively fits the simulated data, suggesting that it provides an accurate model to illustrate the relationship between ventilation configurations and total heat transfer rate. The coefficient of determination (R-squared, R2) is used to evaluate the XGBoost fitting performance. The parameter of R2 indicates the percentage of variability of targets with values from 0 to 1 [36]. Table 3 lists the values of R2 obtained from the XGBoost model. The respective R2 values for the training and testing datasets are 0.9992 and 0.8442, indicating that the XGBoost model has a good fitting performance.
Figure 9 shows the convergence curves of the BAS, PSO, and the hybrid BAS–PSO algorithms in the optimization performance. It clearly illustrates that the hybrid BAS–PSO algorithm converges after approximately three iterations, showing superior optimization performance during the convergence phase. Moreover, it achieves the largest maximum total heat transfer rate (Qmax = 5746.74 W) among the three algorithms. In contrast, the standard BAS algorithm tends to converge toward a local optimum (Qmax ≈ 4650 W) after approximately 40 iterations. Although the PSO algorithm shows a high iteration speed, which is the same as that of the hybrid algorithm, it fails to locate the global optimum (Qmax ≈ 5400 W). This suggests that the hybrid BAS–PSO algorithm exhibits the best convergence performance.

3.4. Optimization of Total Heat Transfer Rate

Range analysis serves as a statistical tool for examining the outcomes of orthogonal experiments. This method facilitates the identification of key factors that significantly impact the experimental results, as well as the determination of the most favorable combination of levels for these factors [37]. Table 4 shows the range analysis result, in which K i (i = 1, 2, 3, 4) represents the sum of the total heat transfer rate at the ith level of a certain factor, and R reflects the influence of each factor. A larger R value indicates a greater impact of the factor on the total heat transfer rate. In the column of best levels, the footnotes 1, 2, 3, and 4 represent different ventilation rates (see Table 2). It is found from Table 4 that the optimal combination obtained by range analysis is as follows: the right half of the big window (W3#) is given an 80% ventilation rate, the small window (SW2#) is given a 10% ventilation rate, the small window (SW4#) is given a 50% ventilation rate, and the remaining doors and windows are given the maximum ventilation rate.
Table 5 shows the comparison of Qmax obtained from different methods. The hybrid algorithm achieved a Qmax of 5746.74 W, higher than the 5358.35 W of the orthogonal experiment and the 5578.59 W of the range analysis. Moreover, simulation-based validation further confirmed the reliability of the hybrid algorithm, yielding a verified value of 5730.67 W. This indicates that the hybrid algorithm is the most efficient approach to optimize the natural ventilation strategy. Table 6 lists the results of the optimal configurations of doors and windows obtained through three different experimental methods (the orthogonal experiments, range analysis, and the hybrid BAS–PSO algorithm). The experimental results in Table 6 indicate that most doors/windows require a 100% ventilation rate to ensure effective air exchange inside the cave via natural ventilation. Furthermore, approximately 20% of openings need to operate with less than a 50% ventilation rate to mitigate localized airflow recirculation. The hybrid BAS–PSO algorithm result suggests that W2#R, SW#1, SW#3, and SW#5 should maintain a 0% ventilation rate (continuously closed state), while other openings are supposed to be set at a 100% ventilation rate (fully open state).

3.5. On-Site Verification of Natural Ventilation Strategy Efficiency

The effectiveness of the natural ventilation strategy proposed in this study is verified through on-site measurements. In fact, Cave 9 is open to tourists, while Cave 10 is open to limited visitors. Hence, we chose Cave 10 to perform the verification. Two sunny days, 20 August 2023 and 21 August 2023, were chosen due to their similar outdoor temperatures (29.8 °C and 29.4 °C). The optimal configurations of doors and windows (W2#R, SW#1, SW#3, and SW#5 were maintained in a continuously closed state, while others were kept in a fully open state) were carried out on 20 August 2023. Non-optimal configurations of doors and windows were performed on 21 August 2023. It can be seen in Figure 3 that sensors were distributed in five regions in the front chamber and the rear chamber. We chose real-time data from sensors in Region A (on the ground) and Region E (on the top) in the front and rear chambers to have a comparison. We also used on-site data from Region A and Region C in the chanting channel, which is the deepest region in Cave 10. The working time from 8:00 am to 6:00 pm was chosen to record temperature changes. Figure 10 shows the measured on-site temperatures as a function of time in the front chamber, rear chamber, and chanting channel. In Figure 10a, the average temperatures in Region A and Region E increased with the increase in time. Moreover, the measured temperatures in Region E were higher than those in Region A. It is worth noting that the measured temperatures in both Region A and Region E on 20 August 2023 were higher than those on 21 August 2023. Similar behavior can be observed in Figure 10b,c. It suggests that the natural ventilation strategy used on 20 August 2023 (with optimal configurations of doors and windows) is more effective than that used on 21 August 2023 (with non-optimal configurations).

4. Discussions

Indoor air quality is very important and has unambiguous effects on human health. For example, a high indoor CO2 level leads to sick building syndrome (SBS) risk [38]. Moreover, the comfort level of the indoor environment can affect physical health and work efficiency because a lot of people spend more than 80% of their time indoors in a day [39,40,41,42].
The indoor air quality in historic buildings (e.g., museums, heritage sites) influences not only visitors, but also the artwork held in it. The Yungang Grottoes are open year-round to visitors and tourists. This occupancy pattern leads to high CO2 concentrations and an uncomfortable hygrothermal environment (air temperature and relative humidity). The Yungang Grottoes regeneration process can improve heritage preservation by the optimization of the temperature and relative humidity in the caves. Ventilation is an effective approach and can be divided into mechanical and natural ventilation. However, the current Cave 9 and Cave 10 of Yungang Grottoes can not have a mechanical ventilation system installed in them due to the priority of preserving the artwork. Hence, natural ventilation is the primary strategy, but several challenges are still present. (1) Although natural ventilation by the control of windows is widely used in residential buildings [17,18,43], it is a great challenge to employ the principles of residential buildings because Cave 9 and Cave 10 have irregular shapes with nonlinear arcs. (2) It is difficult to frequently operate the opening of the windows and doors on the eave due to on-site constraints of the grottoes. To solve these problems, CFD simulations are used in this work as a substitution for on-site experiments, as they have been used in studies of the natural ventilation of buildings [19,44]. A high-precision CFD model was established based on measured temperature and humidity from sensors installed in Caves 9 and 10, leading to the achievement of a RMSE of less than 0.8 °C and 5.69% RH compared with on-site measurements.
To overcome limitations of high-precision solutions under limited resources in orthogonal experimental design, a novel hybrid BAS–PSO algorithm integrated with XGBoost surrogate modeling was developed. This hybrid algorithm has some advantages. For example, it defines the ventilation rate of doors and windows as a continuous decision variable within a value range from 0 to 1. This flexibility enables the algorithm to comprehensively explore the parameter space and significantly increase the probability of identifying the optimal configuration of doors and windows. Moreover, the hybrid algorithm integrates the directional perception mechanism of the BAS algorithm with the group collaboration advantage of the PSO algorithm, which effectively avoids local optima. Therefore, the BAS–PSO algorithm exhibits superior parameter flexibility, optimization efficiency, and global search capability in window–door configuration optimization, providing an efficient solution for the intelligent regulation of complex ventilation systems.
The natural ventilation can be characterized by indoor and outdoor parameters. These parameters are divided into outdoor-driven parameters (e.g., outdoor temperature, solar radiation), indoor-driven parameters (e.g., indoor temperature, relative humidity), and time-dependent parameters (e.g., CO2 concentration) [18]. It was reported that the parameters of indoor and outdoor temperatures in residential buildings were used to determine the window status [45,46]. Wang et al. found that the indoor temperature could be easily measured, leading to it being an important parameter to explain window opening behavior [47]. Jeong et al. reported that the outdoor temperature could change occupant behavior by the control of window opening in twenty occupied housing units [48]. Yao et al. found that the indoor and outdoor relative humidity were key parameters for explaining the probabilities of window opening and closing [49]. However, these previous studies suggest that it is difficult to accurately predict natural ventilation because the importance of these parameters is different in various sample homes, buildings, and seasonal climates.
In this work, we use the maximum total heat transfer rate (Qmax) to evaluate the efficiency of a natural ventilation strategy based on realistic conditions of Cave 9 and Cave 10 of the Yungang Grottoes. The higher the Qmax is, the greater efficiency the natural ventilation achieves. In comparison to standard BAS and PSO algorithms, the hybrid BAS–PSO algorithm obtains the largest value of Qmax (5746.74 W), suggesting the hybrid BAS–PSO algorithm is superior to the standard BAS algorithm and PSO algorithm. We also compare the optimal configurations of doors and windows obtained from three different methods, that is, orthogonal experiments, range analysis, and the hybrid BAS–PSO algorithm. The optimal configurations of doors and windows can be obtained from these results. That is, W2#R, SW#1, SW#3, and SW#5 should be maintained continuously in the closed state, whereas other doors and windows should be kept in the fully open state. This is confirmed by on-site measured data. The optimal configurations of doors and windows were performed on 20 August 2023 and non-optimal configurations were carried out on 21 August 2023. It can be seen in Figure 10 that the heat transfer occurs in the front chamber, rear chamber, and chanting channel. Moreover, the heat transfer on 20 August 2023 was more effective than that on 21 August 2023. These on-site data verified that the proposed natural ventilation strategy is effective in this work.

5. Conclusions

The optimization of the natural ventilation in Cave 9 and Cave 10 of the Yungang Grottoes is investigated. The main conclusions are shown as follows:
(1)
A CFD simulation model for the hygrothermal environment within the grottoes is developed. The accuracy of this model is validated through real-time measured data on site, exhibiting high precision in predicting temperature and relative humidity under various operational conditions.
(2)
The natural ventilation efficiency of the grottoes can be effectively enhanced by employing various ventilation rates and different configurations of the doors and windows on the wooden eave of Cave 9 and Cave 10.
(3)
XGBoost shows a good fitting performance, with an R2 of 0.9584. The hybrid BAS–PSO algorithm, combined with XGBoost fitting, shows strong performance in optimization, leading to the achievement of the highest Qmax of 5746.74 W. The hybrid BAS–PSO algorithm exhibits superiority in the optimization of natural ventilation over traditional BAS and PSO algorithms.
(4)
The hybrid BAS–PSO algorithm yields the optimal configurations of openings of doors and windows. That is, a 10% ventilation rate is employed for the W2#R, SW1#, SW3#, and SW5# windows, and the other doors and windows remain set at the maximum ventilation rate. It is further validated by CFD simulations, confirming its reliability. The proposed natural ventilation strategy is validated by on-site measured data, indicating that it is effective.

Supplementary Materials

The following supporting information can be downloaded at https://www.mdpi.com/article/10.3390/buildings15060937/s1, Figure S1: (a) The on-site sensor locations in the chanting channel; (b) vertical cross–section of sensor locations in Cave 9 and Cave 10 of the Yungang Grottoes; (c) the plan view of sensor locations in Region B in Cave 9 and Cave 10; Figure S2: (a) Vertical view of sensor locations in Cave 9 and Cave 10; (b) the plan view of sensor locations in Region C in Cave 9 and Cave 10; Figure S3: (a) Vertical cross-section of sensor locations; (b) the plan view of sensor locations in Region D in Cave 9 and Cave 10; Figure S4: (a) Vertical view of locations of sensors in Cave 9 and Cave 10; (b) the plan view of sensor locations in Region E in Cave 10; Table S1: The configurations of doors and windows of Case 1–1 and Case 2–61.

Author Contributions

Methodology, formal analysis, writing—original draft preparation, writing—review and editing, X.X.; data curation, visualization, formal analysis, H.Y.; visualization, data curation, formal analysis, J.H.; conceptualization, methodology, funding acquisition, supervision, T.L. All authors have read and agreed to the published version of the manuscript.

Funding

This research was funded by Science and Technology Major Special Program Project of Shanxi Province (Grant No. 202201150501024).

Data Availability Statement

Data are unavailable due to privacy concerns.

Acknowledgments

The authors thank Lunrui Gao and Zhenkun Su from Shanghai University for their assistance with the experiments.

Conflicts of Interest

The authors declare no conflicts of interest.

References

  1. Yao, S.S.; Yan, Z.F.; Ma, Q.; Xu, B.K.; Zhang, Z.M.; Bi, W.B.; Zhang, J.J. Analysis of the annual hygrothermal environment in the Maijishan Grottoes by field measurements and numerical simulations. Build. Environ. 2022, 221, 109229. [Google Scholar] [CrossRef]
  2. Huang, J.Z.; Zhang, R.Y.; Luo, Q.Y.; Guo, X.W.; Cao, M.G. Study on optimal design of Grotto-eave system with cable inerter viscous damper for vibration control. Buildings 2022, 12, 661. [Google Scholar] [CrossRef]
  3. Hao, N.; Wang, Y.L.; Wu, X.C.; Duan, Y.F.; Li, P.S.; He, M.C. Real-Time Experimental Monitoring for Water Absorption Evolution Behaviors of Sandstone in Mogao Grottoes, China. Energies 2022, 15, 8504. [Google Scholar] [CrossRef]
  4. Geng, H.; Zhang, S.J.; Zhi, J.H.; Zhang, R.P.; Ren, J.G.; Ro, C.U. Acid solution decreases the compressional wave velocity of sandstone from the Yungang Grottoes, Datong, China. Herit. Sci. 2019, 7, 4. [Google Scholar] [CrossRef]
  5. Zhang, R.Y.; Cheng, Y.; Huang, J.Z.; Zhang, Y.; Yan, H.B. Unsupervised weathering identification of grottoes sandstone via statistical features of acoustic emission signals and graph neural network. Herit. Sci. 2024, 12, 323. [Google Scholar] [CrossRef]
  6. Mao, D.Q.; Wang, X.D.; Meng, J.; Ma, X.M.; Jiang, X.W.; Wan, L.; Yan, H.B.; Fan, Y. Infiltration Assessments on Top of Yungang Grottoes by Time–Lapse Electrical Resistivity Tomography. Hydrology 2022, 9, 77. [Google Scholar] [CrossRef]
  7. Liu, C.C.; Liu, Y.B.; Ren, W.Z.; Xu, W.H.; Cai, S.M.; Wang, J.X. An adaptive prediction method for mechanical properties deterioration of sandstone under freeze–thaw cycles: A case study of Yungang Grottoes. Herit. Sci. 2021, 9, 154. [Google Scholar] [CrossRef]
  8. Yang, X.J.; Wang, J.M.; Zhu, C.; He, M.C. Effect of water on long-term strength of column rocks based on creep behavior in Yungang grottoes, China. Geotech. Geol. Eng. 2019, 37, 173–183. [Google Scholar] [CrossRef]
  9. Meng, T.H.; Lu, Y.H.; Zhao, G.Z.; Yang, C.Q.; Ren, J.G.; Shi, Y.L. A synthetic approach to weathering degree classification of stone relics case study of the Yungang Grottoes. Herit. Sci. 2018, 6, 1. [Google Scholar] [CrossRef]
  10. Wang, X.S.; Wan, L.; Huang, J.Z.; Cao, W.B.; Xu, F.; Dong, P. Variable temperature and moisture conditions in Yungang Grottoes, China, and their impacts on ancient sculptures. Environ. Earth Sci. 2014, 72, 3079–3088. [Google Scholar] [CrossRef]
  11. Qiao, K.Z.; Hou, M.L.; Lyu, S.Q.; Li, L.H. Extraction and restoration of scratched murals based on hyperspectral imaging—A case study of murals in the East Wall of the sixth grotto of Yungang Grottoes, Datong, China. Herit. Sci. 2024, 12, 123. [Google Scholar] [CrossRef]
  12. Zhang, J.Y.; Kwok, H.H.L.; Luo, H.; Tong, J.C.K.; Cheng, J.C.P. Automatic relative humidity optimization in underground heritage sites through ventilation system based on digital twins. Build. Environ. 2022, 216, 108999. [Google Scholar] [CrossRef]
  13. Luo, X.L.; Gu, Z.L.; Wang, Z.S.; Tian, W.; Li, K. An independent and simultaneous operational mode of air conditioning systems for visitors and relics in archaeology museum. Appl. Therm. Eng. 2016, 100, 911–924. [Google Scholar] [CrossRef]
  14. Luo, X.L.; Huang, X.Y.; Feng, Z.B.; Li, J.; Gu, Z.L. Influence of air inlet/outlet arrangement of displacement ventilation on local environment control for unearthed relics within site museum. Energy Build. 2021, 246, 111116. [Google Scholar] [CrossRef]
  15. Wang, J.L.; Yan, Z.F.; Wang, X.D.; Zhang, Z.M.; Shang, R.H.; Bi, W.B. Experimental research on mechanical ventilation system for Cave 328 in Mogao Grottoes, Dunhuang, China. Energy Build. 2016, 130, 692–696. [Google Scholar] [CrossRef]
  16. Zhang, J.J.; Yan, Z.F.; Zhang, Z.M.; Bi, W.B.; Yan, S.S. A new correlation for single-sided natural ventilation rate based on full-scale experimental study in Mogao Grottoes, Dunhuang, China. Buildings 2023, 13, 1298. [Google Scholar] [CrossRef]
  17. Zhang, W.; Wu, W.T.; Norford, L.; Li, N.; Malkawi, A. Model predictive control of short-term winter natural ventilation in a smart building using machine learning algorithms. J. Build. Eng. 2023, 73, 106602. [Google Scholar] [CrossRef]
  18. Park, J.S.; An, Y.M.; Jeong, J.W. Determinants of manual window control for natural ventilation in homes. Build. Environ. 2023, 244, 110741. [Google Scholar] [CrossRef]
  19. Bay, E.; Martinez–Molina, A.; Dupont, W.A. Assessment of natural ventilation strategies in historical buildings in a hot and humid climate using energy and CFD simulations. J. Build. Eng. 2022, 51, 104287. [Google Scholar] [CrossRef]
  20. Xie, N.; Wei, W.; Ba, J.; Yang, T. Operation parameters study on the performance of PEMFC based orthogonal test method. Case Stud. Therm. Eng. 2024, 61, 105035. [Google Scholar] [CrossRef]
  21. Bo, K.; Ji, F.Z.; Zhao, Z.Q.; Fan, L.M.; Wang, M.S. Optimum design of large–diameter reverse circulation drill bit for drilling rescue wells using orthogonal experimental method and CFD simulation. Energies 2023, 16, 3913. [Google Scholar] [CrossRef]
  22. Yang, X.D.; Jiang, Z.A.; Chen, J.H.; Chen, Y.; Yang, B. Optimization of ventilation and dust removal parameters in plateau extra-long tunnel inclined shaft based on orthogonal numerical simulation test method. Constr. Build. Mater. 2024, 455, 139131. [Google Scholar] [CrossRef]
  23. Xu, Y.K.; Wei, X.B.; Xia, Y.F.; Yu, Y.L.; Zeng, L.J.; Cao, G.Y.; Cao, J. Prompt design of direction air supply using CFD–based proper orthogonal decomposition method considering locally dense sample distribution. Build. Environ. 2023, 244, 110812. [Google Scholar] [CrossRef]
  24. Jiang, X.H.; Zhou, C.J.; Su, J.; Jin, G.H.; Shen, R. Injection parameter design to improve the high-speed gear heat dissipation: CFD simulation and regression orthogonal experiment. Simul. Model. Pract. Th. 2023, 128, 102795. [Google Scholar] [CrossRef]
  25. Gharagoz, M.M.; Noureldin, M.; Kim, J. Explainable machine learning (XML) framework for seismic assessment of structures using Extreme Gradient Boosting (XGBoost). Eng. Struct. 2025, 327, 119621. [Google Scholar] [CrossRef]
  26. Clarke, A.; Yates, D.; Blanchard, C.; Islam, M.Z.; Ford, R.; Rehman, S.; Walsh, R. The effect of dataset construction and data pre-processing on the eXtreme Gradient Boosting algorithm applied to head rice yield prediction in Australia. Comput. Electron. Agr. 2024, 219, 108716. [Google Scholar] [CrossRef]
  27. Lin, H.J.; Li, L.; Qiang, Y.; Zhang, Y.; Liang, S.Y.; Xu, X.L.; Li, H.J.; Hu, S.C. Sensitivity analysis of slope stability based on eXtreme gradient boosting and SHapley Additive exPlanations: An exploratory study. Heliyon 2024, 10, e35871. [Google Scholar] [CrossRef]
  28. Jiang, X.Y.; Li, S. BAS: Beetle antennae search algorithm for optimization problems. Int. J. Robot. Control 2018, 1, 1–4. [Google Scholar] [CrossRef]
  29. Chen, C.Z.; Cao, L.; Chen, Y.D.; Chen, B.H.; Yue, Y.G. A comprehensive survey of convergence analysis of beetle antennae search algorithm and its applications. Artif. Intell. Rev. 2024, 57, 141. [Google Scholar] [CrossRef]
  30. Liao, L.F.; Yang, H. A review of beetle antennae search algorithm. Comput. Eng. Appl. 2021, 57, 54–64. [Google Scholar]
  31. Kennedy, J. The particle swarm: Social adaptation of knowledge. In Proceedings of the 1997 IEEE International Conference on Evolutionary Computation (ICEC ’97), Indianapolis, IN, USA, 13–16 April 1997; pp. 303–308. [Google Scholar]
  32. Shi, Y.H.; Eberhart, R. A Modified Particle Swarm Optimizer. In Proceedings of the IEEE World Congress on Computational Intelligence, Anchorage, AK, USA, 4–9 May 1998; pp. 69–73. [Google Scholar]
  33. Xu, H.; Liu, S.; Ma, Y.; Lan, H.X. The adaptive algorithm of fuzzy logic system based on modified particle swarm optimization. Comput. Eng. Appl. 2000, 7, 62–63. [Google Scholar]
  34. Chhokar, C.; Ebadi, M.; Bahrami, M. The total heat transfer rate in the evaporating thin film: A new analytical solution. Int. Commun. Heat Mass Transf. 2025, 162, 108653. [Google Scholar] [CrossRef]
  35. Yemalwad, Y.; Aasi, H.K.; Srivastava, A. Dynamic measurements of thermal boundary layer and heat transfer rates along a heated flat plate under the influence of ultrasonic field. Appl. Therm. Eng. 2025, 266, 125734. [Google Scholar] [CrossRef]
  36. Liu, Q.; Wang, Z.R.; Xu, H.L.; Lian, W.H.; Chen, Y.L. Inverse modeling of PM2.5 concentration using a particle swarm optimization XGBoost model. Environ. Sci. 2024, 49, 1–16. [Google Scholar]
  37. Wu, L.; Xu, M.N.; Zhang, H.P.; Wu, W.; Ding, J.M. Numerical simulation of Pantograph-Catenary coupling de-icing based on orthogonal experiment method. Trans. Nanjing Univ. Aeronaut. Astronaut. 2023, 40, 29–41. [Google Scholar]
  38. Seppänen, O.; Fisk, W.J. Association of ventilation system type with SBS symptoms in office workers. Indoor Air. 2002, 12, 98–112. [Google Scholar] [CrossRef]
  39. Leech, J.A.; Nelson, W.C.; Burnett, R.T.; Aaron, S.; Raizenne, M.E. It’s about time: A comparison of Canadian and American time–activity patterns. J. Expo. Anal. Environ. Epidemiol. 2002, 12, 427–432. [Google Scholar] [CrossRef]
  40. Brasche, S.; Bischof, W. Daily time spent indoors in German homes–Baseline data for the assessment of indoor exposure of German occupants. Int. J. Hyg. Environ. Health 2005, 208, 247–253. [Google Scholar] [CrossRef]
  41. Yin, X.; Muhieldeen, M.W.; Razman, R.; Ee, J.Y.C. Multi–objective optimization of window configuration and furniture arrangement for the natural ventilation of office buildings using Taguchi-based grey relational analysis. Energy Build. 2023, 296, 113385. [Google Scholar] [CrossRef]
  42. Wyon, D.P. The effects of indoor air quality on performance and productivity. Indoor. Air. 2004, 14, 92–101. [Google Scholar] [CrossRef]
  43. Chen, S.; Zhang, G.; Xia, X.; Chen, Y.; Setunge, S.; Shi, L. The impacts of occupant behavior on building energy consumption: A review. Sustain. Energy Technol. Assess. 2021, 45, 101212. [Google Scholar] [CrossRef]
  44. Zhang, X.L.; Weerasuriya, A.U.; Tse, K.T. CFD simulation of natural ventilation of a generic building in various incident wind directions: Comparison of turbulence modelling, evaluation methods, and ventilation mechanisms. Energy Build. 2020, 229, 110516. [Google Scholar] [CrossRef]
  45. Jones, R.V.; Fuertes, A.; Gregori, E.; Giretti, A. Stochastic behavioural models of occupants’ main bedroom window operation for UK residential buildings. Build. Environ. 2017, 118, 144–158. [Google Scholar] [CrossRef]
  46. Andersen, R.; Fabi, V.; Toftum, J.; Corgnati, S.P.; Olesen, B.W. Window opening behaviour modelled from measurements in Danish dwellings. Build. Environ. 2013, 69, 101–113. [Google Scholar] [CrossRef]
  47. Wang, Y.; Tahmasebi, F.; Cooper, E.; Stamp, S.; Chalabi, Z.; Burman, E.; Mumovic, D. Exploring the relationship between window operation behavior and thermal and air quality factors: A case study of UK residential buildings. J. Build. Eng. 2022, 48, 103997. [Google Scholar] [CrossRef]
  48. Jeong, B.; Jeong, J.W.; Park, J.S. Occupant behavior regarding the manual control of windows in residential buildings. Energy Build. 2016, 127, 206–216. [Google Scholar] [CrossRef]
  49. Yao, M.; Zhao, B. Factors affecting occupants’ interactions with windows in residential buildings in Beijing, China. Procedia Eng. 2017, 205, 3428–3434. [Google Scholar] [CrossRef]
Figure 1. The flow diagram of the methodology.
Buildings 15 00937 g001
Figure 2. (a) The picture taken of the wooden eave of Cave 9 and Cave 10. (b) The schematic diagram of the layout of doors and windows with different sizes in the eave.
Buildings 15 00937 g002
Figure 3. (a) Vertical cross-section of sensor locations in Cave 9 and Cave 10. (b) The plan view of sensor locations in Region A in Cave 9 and Cave 10.
Buildings 15 00937 g003
Figure 4. The proposed model for CFD simulations. The plan view (a) and vertical cross-section view (b) of Cave 9 and Cave 10. (c) The layout of doors and windows in the wooden eave.
Buildings 15 00937 g004
Figure 5. The flowchart of the hybrid BAS–PSO algorithm.
Buildings 15 00937 g005
Figure 6. The comparison of the RH and temperature between measured and CFD simulated data. (a,b) A rainy day; (c,d) a sunny day.
Buildings 15 00937 g006
Figure 7. The CFD simulations of temperature and RH. (a,b) Case 1–1; (c,d) Case 2–61.
Buildings 15 00937 g007
Figure 8. The XGBoost fitting performance. (a) The training group; (b) The testing group.
Buildings 15 00937 g008
Figure 9. Optimization of total heat transfer rate from three different algorithms.
Buildings 15 00937 g009
Figure 10. The measured on-site temperatures as a function of time. (a) The front chamber; (b) The rear chamber; (c) The chanting channel.
Buildings 15 00937 g010
Table 1. The designed orthogonal experiment plan.
Level1234
Factor
W1#L10%50%80%100%
W1#R10%50%80%100%
W2#L10%50%80%100%
W2#R10%50%80%100%
W3#L10%50%80%100%
W3#R10%50%80%100%
W4#L10%50%80%100%
W4#R10%50%80%100%
D1#L10%50%80%100%
D1#R10%50%80%100%
D2#L10%50%80%100%
D2#R10%50%80%100%
D3#L10%50%80%100%
D3#R10%50%80%100%
SW1#0%10%50%80%
SW2#0%10%50%80%
SW3#0%10%50%80%
SW4#0%10%50%80%
SW5#0%10%50%80%
SW6#0%10%50%80%
SW7#0%10%50%80%
Table 2. The calculated mean relative error (MRE) and root mean square error (RMSE) of the temperature and relative humidity (RH) in two selected scenarios.
ScenarioTimeTemperature (MRE)Temperature (RMSE)RH
(MRE)
RH
(RMSE)
Scenario (1)12:00 am, 11 August 20232.71%0.804.96%5.69
Scenario (2)10:00 am, 15 August 20232.99%0.773.92%3.98
Table 3. The XGBoost fitting performance using the coefficient of determination (R2).
ScenarioTraining GroupTesting GroupAll
R20.99920.84420.9584
Table 4. Range analysis of total heat transfer rate for different natural ventilation strategies.
FactorK1K2K3K4RBest Levels
W1#L4282.594341.614375.594456.55173.96(W1#L)4
W1#R4306.374343.954361.204444.82138.44(W1#R)4
W2#L4312.574332.254354.384457.14144.57(W2#L)4
W2#R4158.524380.354438.564478.91320.39(W2#R)4
W3#L4286.884317.034378.224474.22187.34(W3#L)4
W3#R4271.444397.954399.034387.92127.59(W3#R)3
W4#L4267.264361.614347.934479.55212.28(W4#L)4
W4#R4156.384374.974416.974508.03351.66(W4#R)4
D1#L4193.904288.524242.574731.35537.45(D1#L)4
D1#R4158.664307.944310.584679.16520.50(D1#R)4
D2#L4151.514293.844330.634680.37528.86(D2#L)4
D2#R4242.374281.344304.204628.43386.05(D2#R)4
D3#L4214.344290.044288.494663.47449.13(D3#L)4
D3#R4212.614296.504305.854641.38428.77(D3#R)4
SW1#4376.104312.804383.454383.9971.20(SW1#)4
SW2#4360.144402.954329.314363.9573.63(SW2#)2
SW3#4332.464261.434409.454453.00191.56(SW3#)4
SW4#4229.564419.184435.114372.49205.55(SW4#)3
SW5#4332.064350.514356.434417.3485.29(SW5#)4
SW6#4303.004360.724382.424410.20107.21(SW6#)4
SW7#4364.004309.234390.984392.1482.91(SW7#)4
Table 5. The maximum total heat transfer rate (Qmax) obtained by various methods.
MethodsOrthogonal
Experiment
Range
Analysis
Hybrid
Algorithm
Simulation Verification of Algorithm Result
Qmax5358.35 W5578.59 W5746.74 W5730.67 W
Table 6. The comparison of optimal natural ventilation strategies obtained from three different experimental methods.
Orthogonal Experiments
Result
Range Analysis
Result
Hybrid Algorithm
Result
(W1#L)4(W1#L)4(W1#L)4
(W1#R)4(W1#R)4(W1#R)4
(W2#L)4(W2#L)4(W2#L)4
(W2#R)1(W2#R)4(W2#R)1
(W3#L)4(W3#L)4(W3#L)4
(W3#R)4(W3#R)3(W3#R)4
(W4#L)4(W4#L)4(W4#L)4
(W4#R)1(W4#R)4(W4#R)4
(D1#L)4(D1#L)4(D1#L)4
(D1#R)1(D1#R)4(D1#R)4
(D2#L)1(D2#L)4(D2#L)4
(D2#R)4(D2#R)4(D2#R)4
(D3#L)4(D3#L)4(D3#L)4
(D3#R)4(D3#R)4(D3#R)4
(SW1#)4(SW1#)4(SW1#)1
(SW2#)4(SW2#)2(SW2#)4
(SW3#)4(SW3#)4(SW3#)1
(SW4#)1(SW4#)3(SW4#)4
(SW5#)4(SW5#)4(SW5#)1
(SW6#)4(SW6#)4(SW6#)4
(SW7#)4(SW7#)4(SW7#)4
Disclaimer/Publisher’s Note: The statements, opinions and data contained in all publications are solely those of the individual author(s) and contributor(s) and not of MDPI and/or the editor(s). MDPI and/or the editor(s) disclaim responsibility for any injury to people or property resulting from any ideas, methods, instructions or products referred to in the content.

