Article

Evaluating the Impact of Vertical Green Systems on Building Temperature Regulation: Effects of Shading Density and Proximity

Department of Landscape Architecture, Integrated Research Center for Green Technologies, National Chin-Yi University of Technology, Taichung 41170, Taiwan
*
Author to whom correspondence should be addressed.
Buildings 2025, 15(3), 445; https://doi.org/10.3390/buildings15030445
Submission received: 13 December 2024 / Revised: 25 January 2025 / Accepted: 27 January 2025 / Published: 31 January 2025
(This article belongs to the Collection Sustainable Buildings in the Built Environment)

Abstract

Urban heat islands and increasing energy consumption in subtropical regions such as Taiwan present substantial challenges, particularly in densely populated areas where traditional green spaces are limited. To address these issues, vertical green systems (VGSs) have emerged as a sustainable solution to improve building energy efficiency and mitigate urban heat. This study investigates the impact of VGSs on building temperature regulation, specifically focusing on the effects of shading density and the distance from the building facade. Two experimental setups were assessed, with VGSs positioned at distances of 50 cm and 100 cm, and shading densities of 70% and 95%. Experiments conducted between May and September 2022, under full sunlight (average temperature of 33 °C), revealed that a VGS with a 95% shading density significantly reduced solar radiation to below 50 W/m2. Additionally, it lowered interior temperatures by 0.5–2.1 °C and decreased surface temperatures by 5–12 °C when positioned 100 cm from the building. The VGS also enhanced temperature stability, maintaining interior temperature fluctuations within 1 °C compared to 4 °C in the control group. These results demonstrate that higher shading densities and increased distances from the building facade optimize temperature control and energy efficiency. The findings offer valuable insights for sustainable urban building design, suggesting that VGSs with greater shading densities and appropriate distances provide significant benefits in reducing solar radiation, surface temperatures, and interior temperature fluctuations.

1. Introduction

Since the late 18th century, the Second Industrial Revolution has driven significant advancements in industrial production, leading to increased reliance on machines over human and animal labor. While this transformation improved productivity, it also resulted in significant energy consumption and the release of air pollutants, severely impacting the environment. By the late 20th century, extreme weather phenomena became increasingly evident, with the accumulation of greenhouse gases exacerbating global warming and intensifying the urban heat island effect [1].
In response, international organizations such as the United Nations Environment Programme (UNEP), the International Union for Conservation of Nature (IUCN), and the Worldwide Fund for Nature (WWF) emphasized sustainable development through the World Conservation Strategy. These efforts prompted global initiatives to address environmental challenges, including research on energy-saving systems and green technologies [2,3].
Buildings are a significant contributor to energy consumption, accounting for approximately 47% of global energy use—surpassing the transportation and industrial sectors. Studies suggest that buildings have up to 65% energy-saving potential, which could reduce global energy consumption by 25% if fully realized [4,5,6,7]. Consequently, enhancing building energy efficiency has become a priority worldwide.
Taiwan, situated in a subtropical region with high urban density, faces acute urban heat island effects due to extensive solid surface paving. Residents heavily rely on air conditioning to mitigate hot temperatures and humidity, contributing to increased energy demand and worsening air pollution. Studies show that areas with urban parks experience temperature differences of up to 4.5 °C compared to non-green spaces, highlighting the cooling benefits of greenery [8,9,10,11,12,13].
Given Taiwan’s limited land availability, traditional green spaces are scarce, prompting the exploration of vertical greening systems (VGSs) as a feasible solution. A VGS not only enhances urban greenery but also improves building energy efficiency by mitigating heat gain. However, the benefits of VGSs vary depending on factors such as distance from the building and shading density. Existing studies have shown that a VGS can reduce wall temperatures by up to 13.1 °C in summer and stabilize indoor temperatures during winter [14,15,16,17,18,19,20,21,22,23,24]. Moreover, these systems have demonstrated potential to decrease cooling energy consumption by 8–20.5% in warm climates and reduce heating requirements by up to 28.6% in colder conditions [25,26,27,28,29].
Despite extensive research on the benefits of VGSs, the current literature often lacks a systematic and comprehensive evaluation of their performance under varying conditions. Furthermore, the application of VGSs in suburban and infrastructure contexts, such as bridges and highways, remains underexplored [30].
This study aims to address these gaps by systematically investigating the effect of VGS distance (50 cm and 100 cm) and shading density (70% and 95%) on building temperature regulation. By analyzing their impact on internal and external temperatures, surface temperatures, and solar radiation, this research provides valuable insights for optimizing VGS configurations and contributing to sustainable urban construction and energy efficiency.

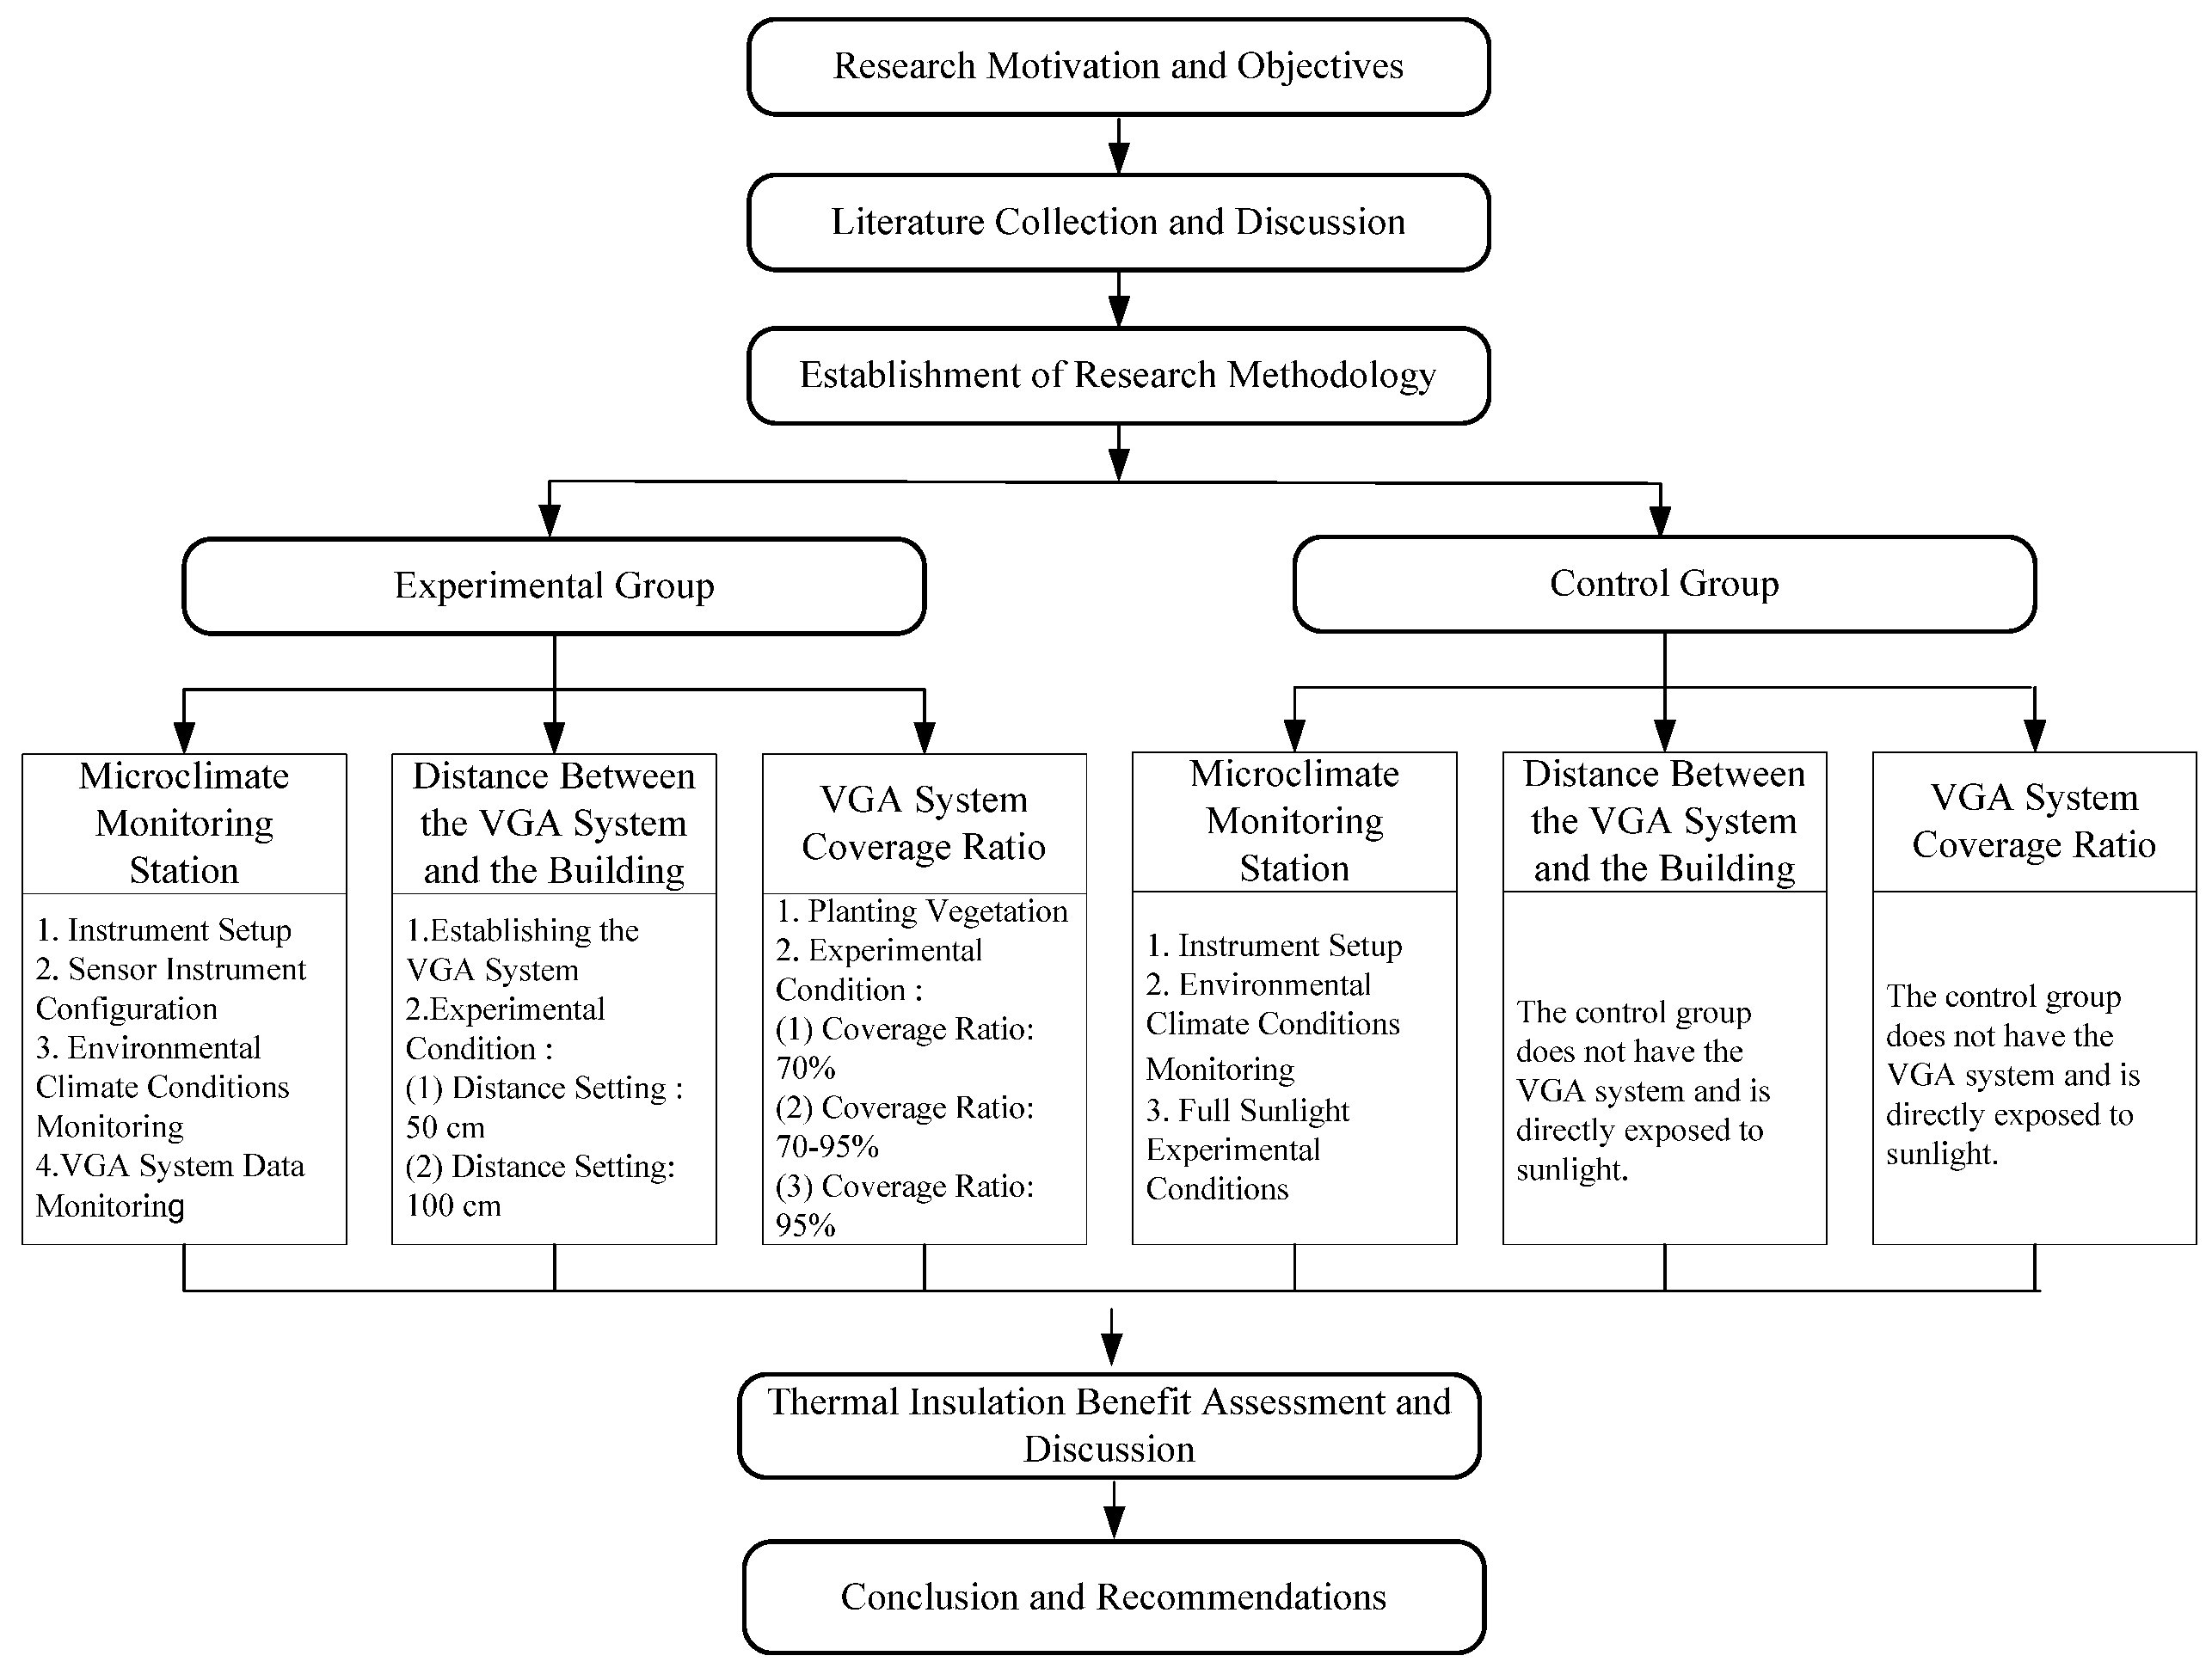
2. Experimental Setup and Methodology

This study aims to investigate the impact of vertical greening coverage and its distance from buildings on thermal insulation effectiveness. In this experiment, the vertical green system (VGS) itself is designed to function as the primary means of thermal insulation, without any additional thermal insulation materials applied to the building surfaces. This approach ensures that the observed effects are solely attributable to the VGS.
The experimental setup was conducted under Taiwan’s climatic conditions, characterized by a subtropical climate and significant afternoon sun exposure, particularly on west-facing walls. To evaluate the thermal regulation performance of the VGS, the experiments were specifically focused on the west side of the buildings, which are most susceptible to heat gain.
Experimental Setup:
Two mock buildings were constructed for the study as follows:
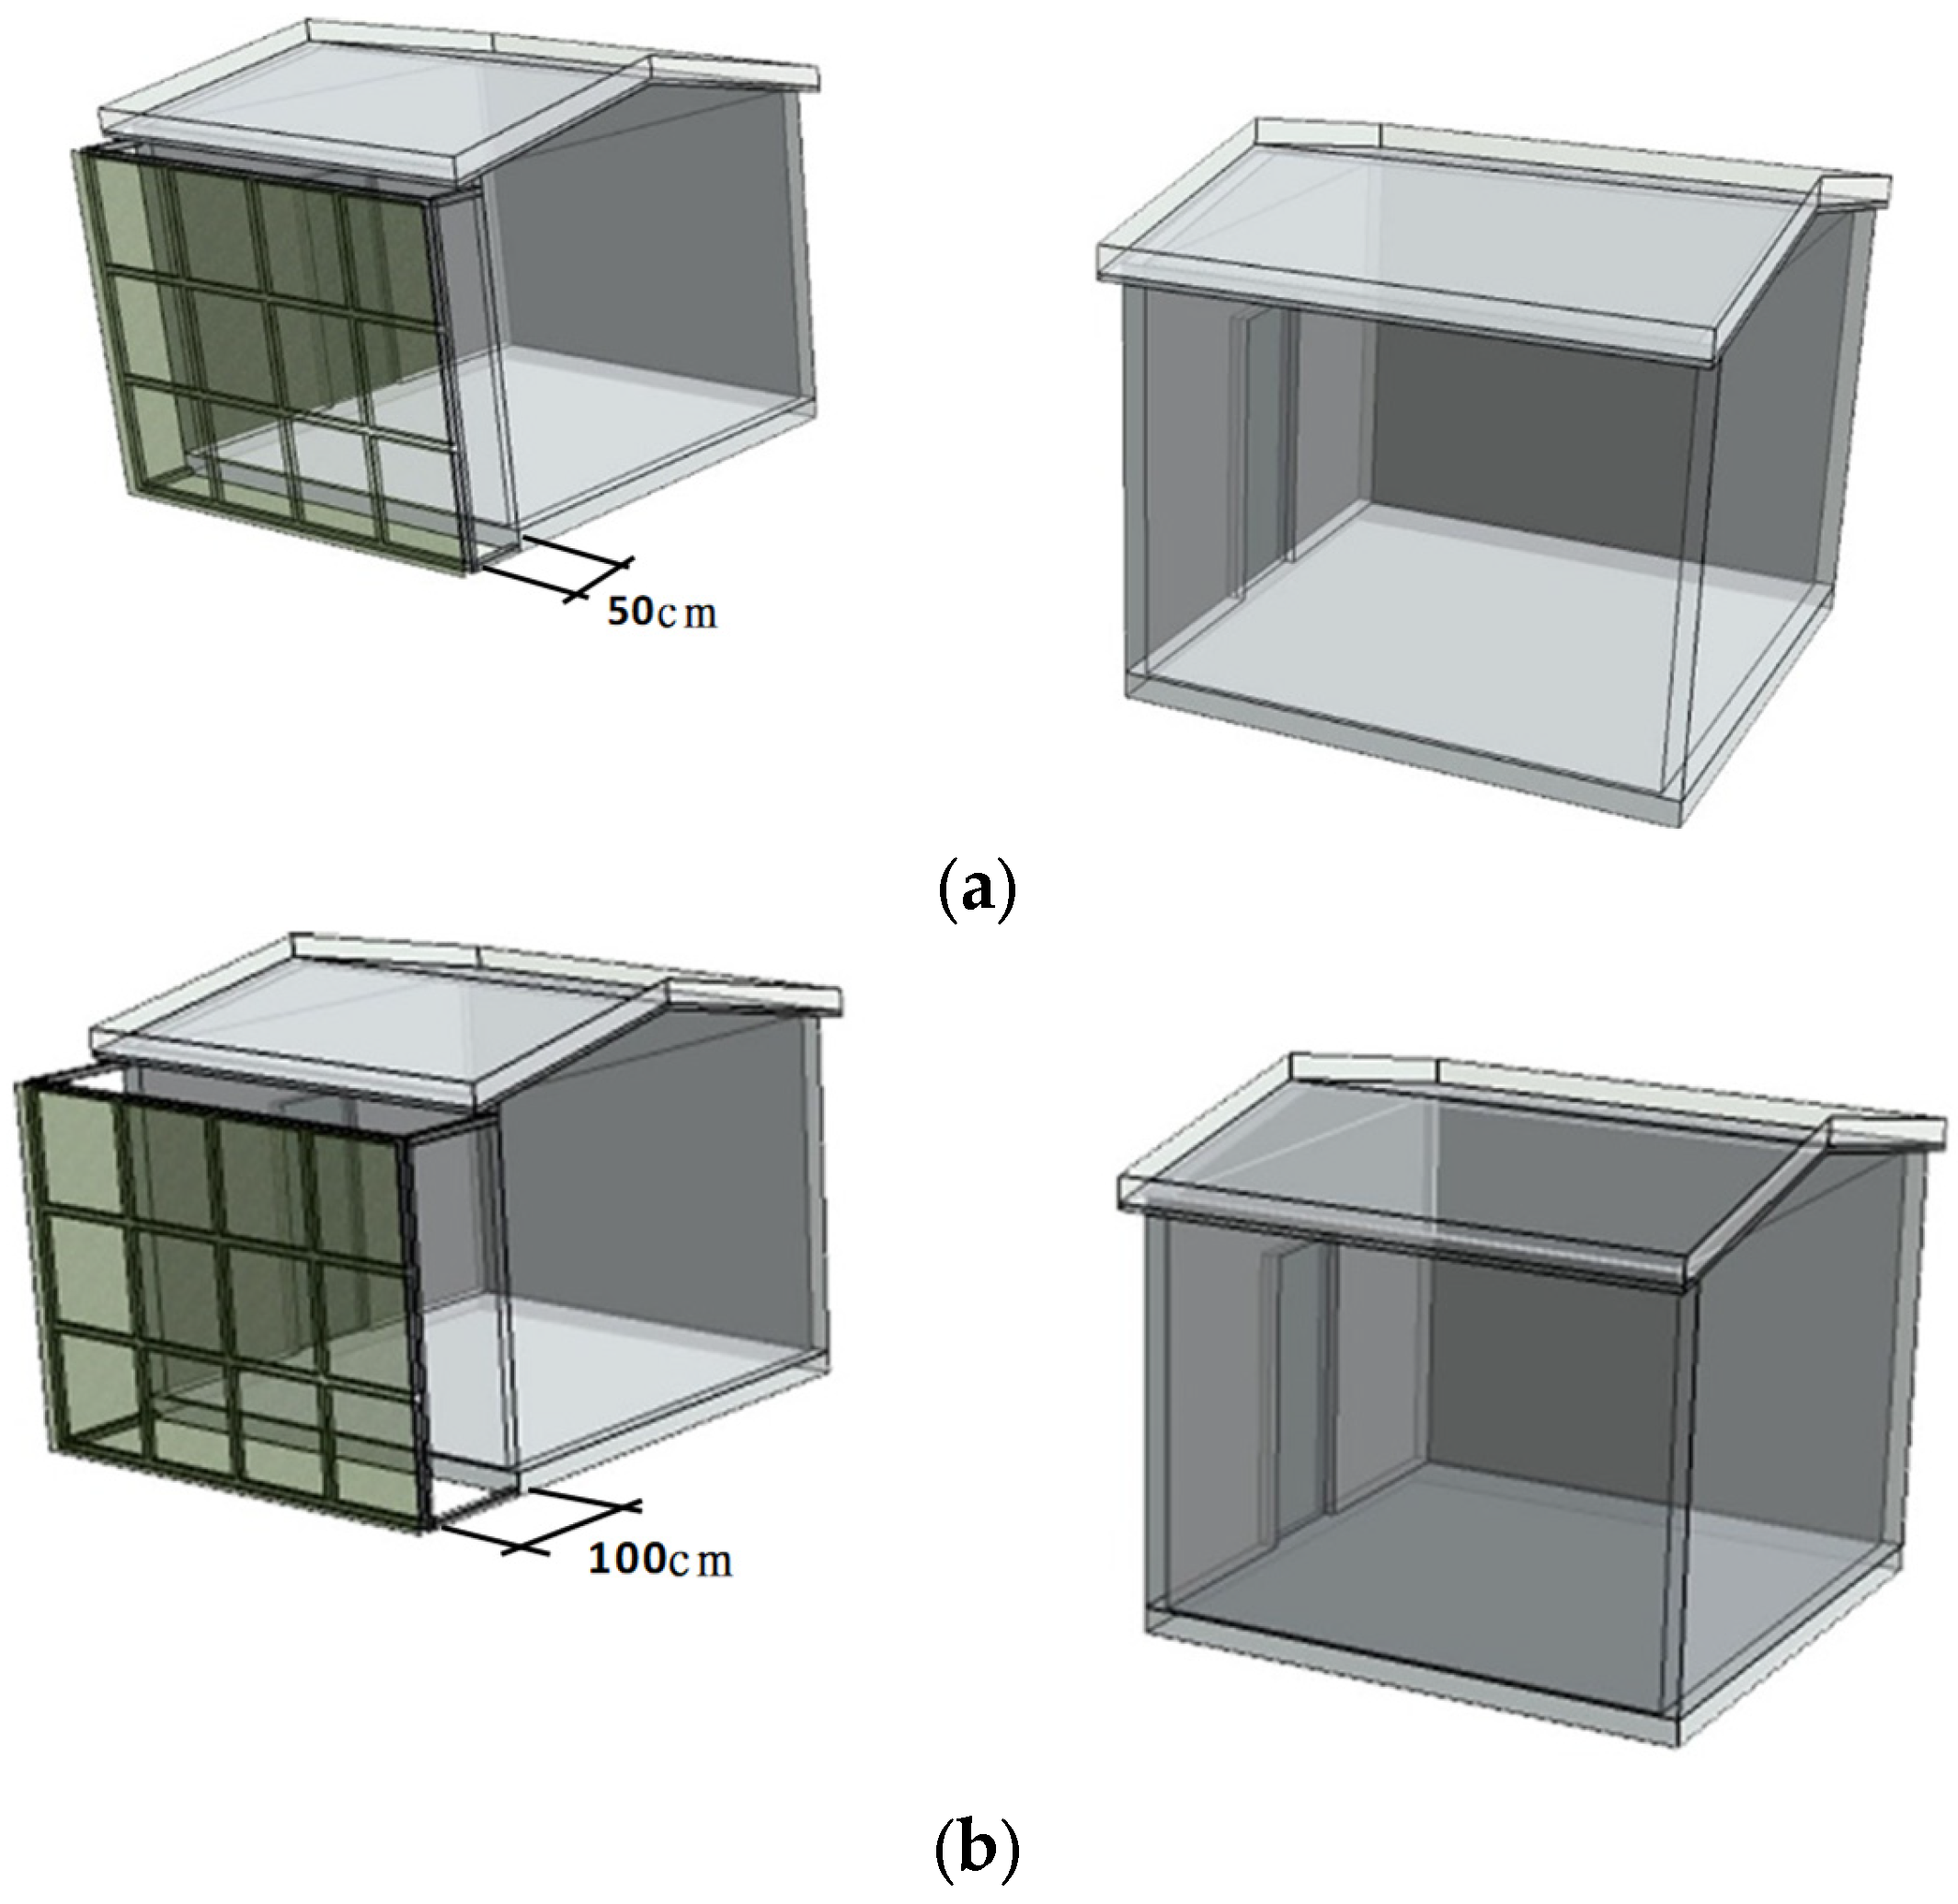
  • Experimental Group: Vertical greening systems were installed on the west side of the buildings. The experiments examined how the distance between the vertical greening system and the building, as well as various levels of green coverage, affected indoor temperature changes. Experimental conditions included the following:
    (1)
    Distance: Vertical greening systems placed 50 cm and 100 cm away from the building.
    (2)
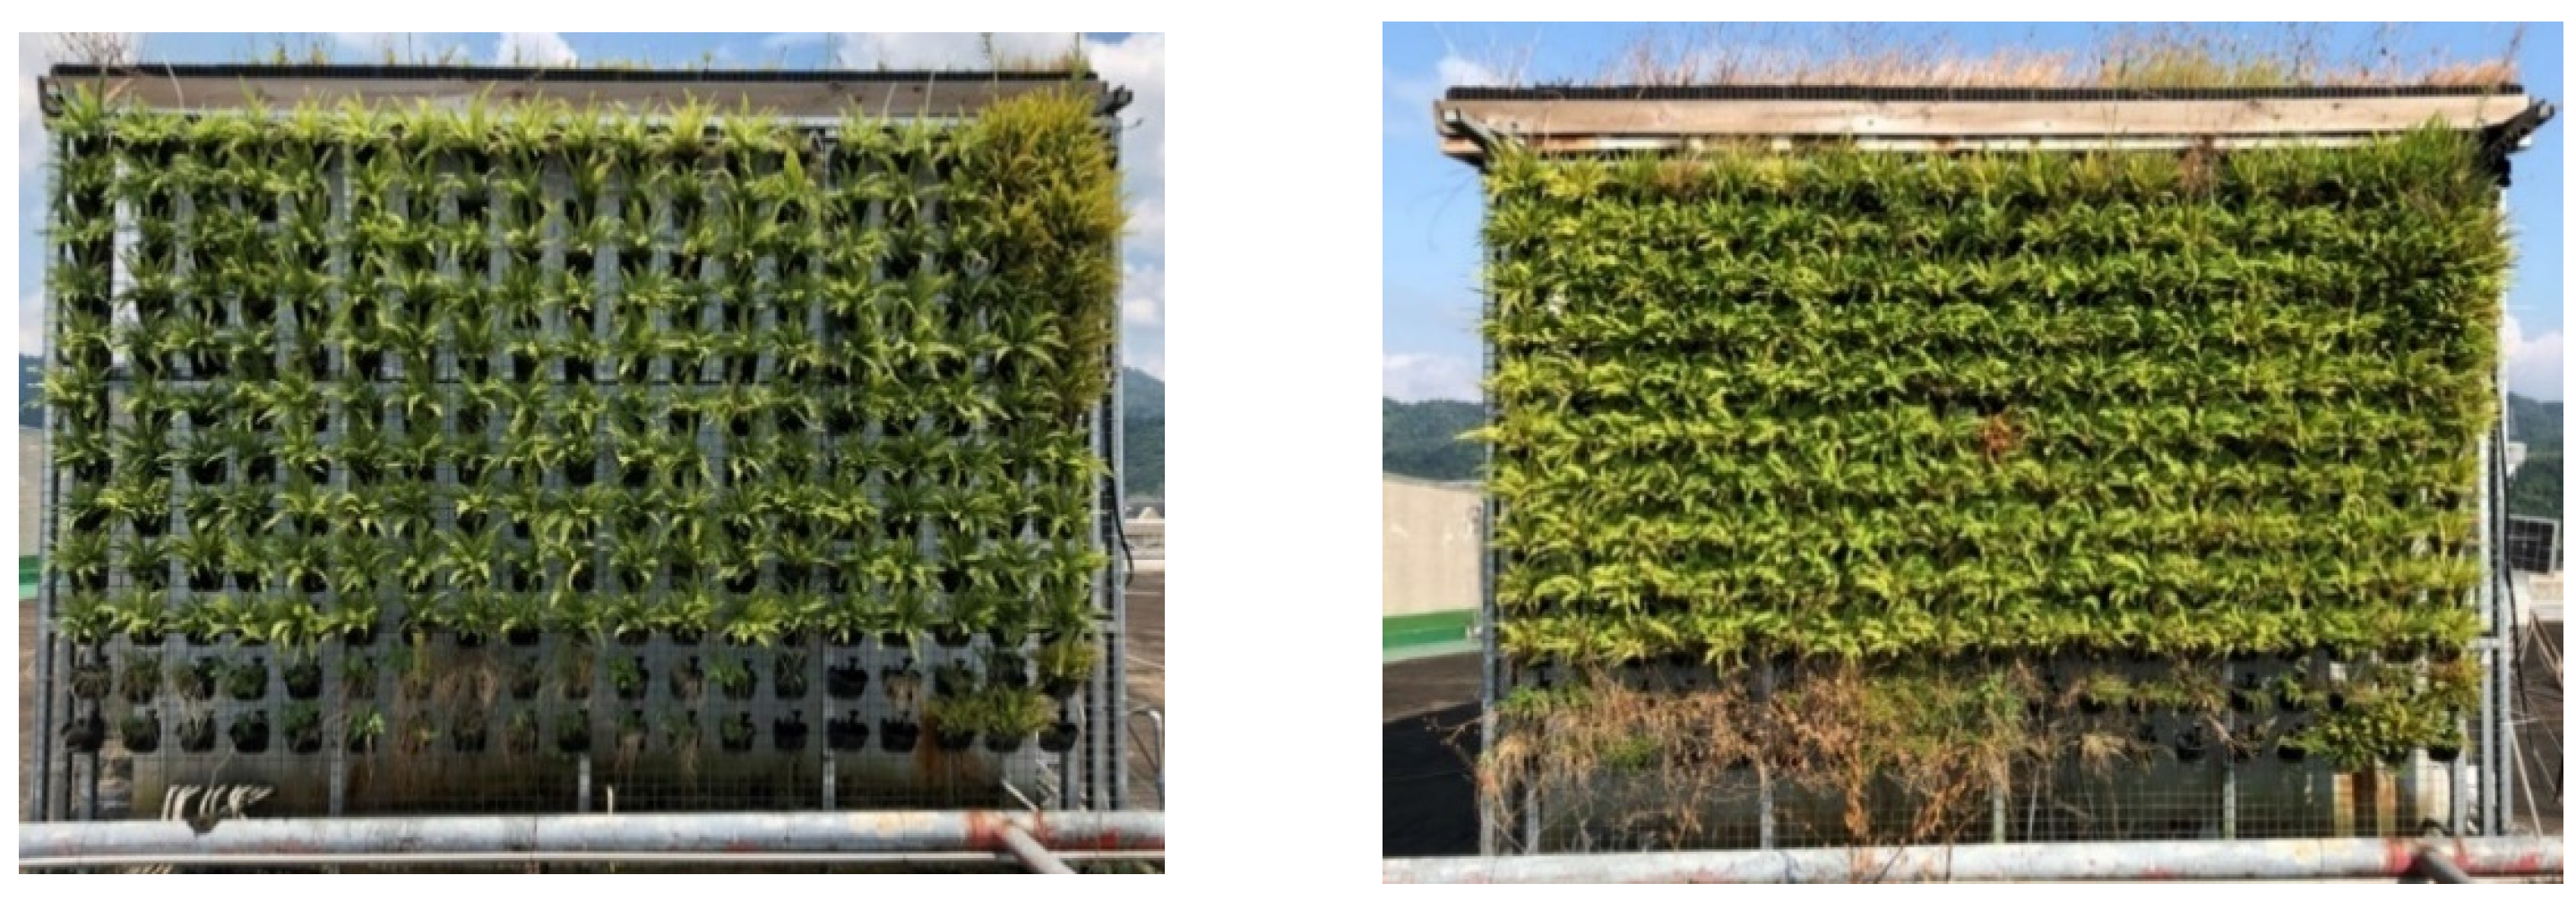
    Coverage: Three levels of green coverage were assessed, namely, below 70%, 70–95%, and above 95%.
  • Control Group: This group used the same building materials and design as the experimental group but did not include any vertical greening systems. It served as a baseline for comparison to synchronize the collection of experimental data.
The experimental procedure is shown in Figure 1.
Methodology:
  • Temperature Sensor Deployment: Thirty temperature sensors were installed inside each building to monitor changes in indoor temperature.
  • Meteorological Monitoring Stations: An outdoor environmental meteorological station was set up. Additionally, a mini-environmental meteorological station was installed between the vertical greening system and the building in the experimental group. The corresponding monitoring equipment was also placed in the same location for the control group.
  • Data Collection: Data collected included surface temperature, environmental humidity, radiant heat, and changes in indoor temperature. The data were analyzed statistically based on different experimental conditions (e.g., distances of 50 cm and 100 cm from the building and varying levels of green coverage) to assess the impact of these factors on the building’s energy-saving effects.
  • Thermal Imaging: A thermal imaging camera was used to assess the heat distribution and thermal effects on the west-facing walls under different vertical greening distances and shading levels. This analysis further examined how varying conditions of vertical greening influenced temperature changes on building walls.
  • This study used the Wilcoxon Signed-Rank Test to analyze the cooling effects of different greening system schemes. The test compares temperature differences between the experimental group (with greening systems) and the control group (without greening systems), determining whether the temperature reduction is statistically significant.

2.1. Vertical Green System Setting

Taichung City, located in central Taiwan (Figure 2), experiences a subtropical monsoon climate with pronounced summer characteristics. From May to September 2022, Taichung frequently encounters elevated temperatures, with daytime temperatures typically ranging between 32 °C and 36 °C, and occasionally exceeding 36 °C. The afternoon sun exposure, particularly intense from noon to 4 p.m., results in significant heat accumulation in buildings. Additionally, the relative humidity during these months is often above 70%, exacerbating the discomfort from the heat. These elevated temperatures challenge building cooling efficiency, making energy-saving and heat-reduction strategies crucial in local building design. The climatic conditions in Taichung provide a relevant context for this study, especially in evaluating the effectiveness of vertical greening systems in mitigating summer heat accumulation in buildings.
The experimental site is located on the rooftop of the Ching-Yung Building at National Chin-Yi University of Technology in Taichung City, Taiwan, located at a latitude of 24.23321° N. This places the site approximately 2691 km north of the equator (see Figure 3a). The site covers an area of 925 m2 and is free from any surrounding structures that might obstruct sunlight, ensuring that the experiment is not influenced by nearby buildings (see Figure 3b). The site is equipped with a comprehensive drainage system, preventing interruptions due to external factors. To minimize external environmental interference with the monitoring data, both experimental buildings are enclosed structures (see Figure 3c). The experiments were conducted from May to September 2022 under full sunlight and without precipitation, with temperatures around 33 °C. The two experimental buildings, representing the experimental and control groups, have identical dimensions: 4.2 m in length, 2.4 m in width, and 3.17 m in height. Both buildings have their entrances facing true north and are spaced 6 m apart to avoid mutual influence.
Three meteorological monitoring stations were set up within the experimental site to measure atmospheric temperature, solar radiation, relative humidity, wind speed, wind direction, and surface temperature. One station was dedicated to environmental background monitoring and was placed 9 m away from both buildings. The remaining two stations were positioned on the west side of the experimental and control buildings, respectively, to compare the impact of having versus not having a vertical greening system on the buildings (see Figure 4). In this study, the orientation of the test buildings—one being the experimental building and the other the control building—towards the north plays a crucial role in understanding the changes in solar azimuth angles and their effects on sunlight exposure. This information is essential for interpreting the variations in solar position and their impact on the experiment’s outcomes.
On the west side of the experimental building, an adjustable vertical greening system was installed. This decision was based on the observation that heat accumulation in Taiwanese buildings typically occurs between noon and 4 p.m.. Therefore, the green wall was placed on the west side of the building. The vertical greening system covers the entire west facade, measuring 4.2 m in width and 3.1 m in height. For comparison purposes, two different distances for the movable green wall were assessed, namely, 50 cm and 100 cm (see Figure 5). This setup aimed to evaluate the impact of varying distances on the building’s thermal insulation performance. In Figure 5, the x-axis corresponds to the West-facing Wall Width (cm), while the y-axis represents the Wall Height (cm). Its schematic diagram is shown in Figure 6. This pattern is further illustrated in Figures 11, 15, 18 and 22. These figures may illustrate the variations in surface temperature of the west-facing interior wall of the building and further explain the impact of different greening configurations and their distances from the building on thermal effects, providing a reference for optimizing greening designs and building thermal performance.

2.2. Vertical Green System Vegetation Setting

In this experiment, Nephrolepis exaltata (Boston Fern) was chosen as the primary plant for the vertical greening system. This species was selected due to its excellent environmental adaptability and rapid growth, making it highly suitable for vertical greening applications. The study examined two distinct levels of coverage: below 70% and above 95%.
A coverage rate of 70% was used when the plants were initially installed, indicating that the vegetation had not yet fully covered the entire wall surface. Conversely, a coverage rate of over 95% was achieved after the plants had grown for a period, reaching the full coverage required by the experiment. The purpose of this setup was to compare the impact of different coverage rates on the thermal insulation effectiveness of the vertical greening system, to evaluate how varying levels of vegetation coverage affect temperature regulation (see Figure 7).

2.3. Season and Temperature Selection

The experiment was conducted in Taiwan, with the selected season being summer (May–September 2022) and under clear weather conditions. The ambient temperature range during the experiment was set between 28 °C and 35 °C. Given Taiwan’s subtropical climate, energy consumption during the summer is primarily focused on air conditioning systems to meet indoor cooling needs. Therefore, the study was conducted in the summer to evaluate the thermal insulation effectiveness of the vertical greening system under high-temperature conditions.
Based on meteorological data for Taiwan’s summer, the average temperature ranges from approximately 28–29 °C, with extreme high temperatures reaching up to 34–35 °C. This temperature range was chosen for the experiment to accurately reflect typical summer conditions. Additionally, to minimize the impact of external factors such as rain or cloud cover, the experiments were conducted on sunny days to ensure the accuracy and consistency of the data.

2.4. Statistical Analysis Method

This study utilizes the Wilcoxon Signed-Rank Test primarily due to its applicability to paired data and its non-parametric nature. The Wilcoxon Signed-Rank Test imposes fewer assumptions regarding the data distribution and provides robust analytical results, especially for small sample sizes. As such, this testing method more accurately reflects the impact of the greening system on building temperature control at different time points, supporting the reliability of the research conclusions.

2.4.1. Statistical and Testing Method Explanation

To compare whether there is a significant difference in temperature control between the experimental group (with greening systems) and the control group (without greening systems), this study uses the Wilcoxon Signed-Rank Test, a non-parametric method for analyzing whether there is a statistically significant difference between paired or related samples.

2.4.2. Theoretical Basis for Test Method Selection

(1)
Nature of the Data: The data in this study consist of temperature differences between the experimental and control groups at the same time points, representing paired sample data. The temperature data may not follow a normal distribution, and traditional parametric tests (such as paired sample t-tests) are less accurate for non-normally distributed data. Therefore, the Wilcoxon Signed-Rank Test was chosen.
(2)
Characteristics of the Wilcoxon Test: The Wilcoxon Signed-Rank Test does not require assumptions about the normality of the data, making it suitable for skewed or small sample data with high robustness. The test compares the differences between each paired sample, ranks the absolute values of the differences, and sums the positive ranks and negative ranks, allowing the test of whether significant differences exist between the two groups.
(3)
Hypothesis Setup:
Null Hypothesis (H0).
The distribution of the two groups is the same, meaning the experimental group with the greening system does not significantly affect the temperature difference.
Alternative Hypothesis (H1).
The distribution of the two groups differs, meaning the experimental group with the greening system significantly affects the temperature difference.

2.4.3. Statistical Analysis Process

(1)
Difference Calculation: For each time point, calculate the paired temperature differences between the experimental and control groups, recording positive and negative signs.
(2)
Ranking: Rank the absolute values of the differences, assigning ranks and noting the positive and negative ranks.
(3)
Test Statistic Calculation: Compute the sum of the positive and negative ranks and obtain the test statistic (W value) and p-value using statistical software.
(4)
Result Interpretation: Based on the test results (p-value and significance level α), determine whether to reject the null hypothesis.

2.4.4. Theoretical Significance of Test Results

If the p-value is less than the significance level (e.g., α = 0.05), this indicates a significant difference in the temperature distribution between the experimental group with the greening system and the control group without it. This supports the hypothesis that the experimental group significantly affects temperature control.

3. Experimental Instruments and Monitoring Equipment

3.1. Instruments and Equipment

To comprehensively assess the benefits of the vertical greening system, this study established a complete monitoring system to ensure data accuracy and comprehensiveness. The system includes environmental meteorological stations, mini-environmental monitoring stations, and 30 indoor temperature sensors. The details of the equipment used are as follows:
(1)
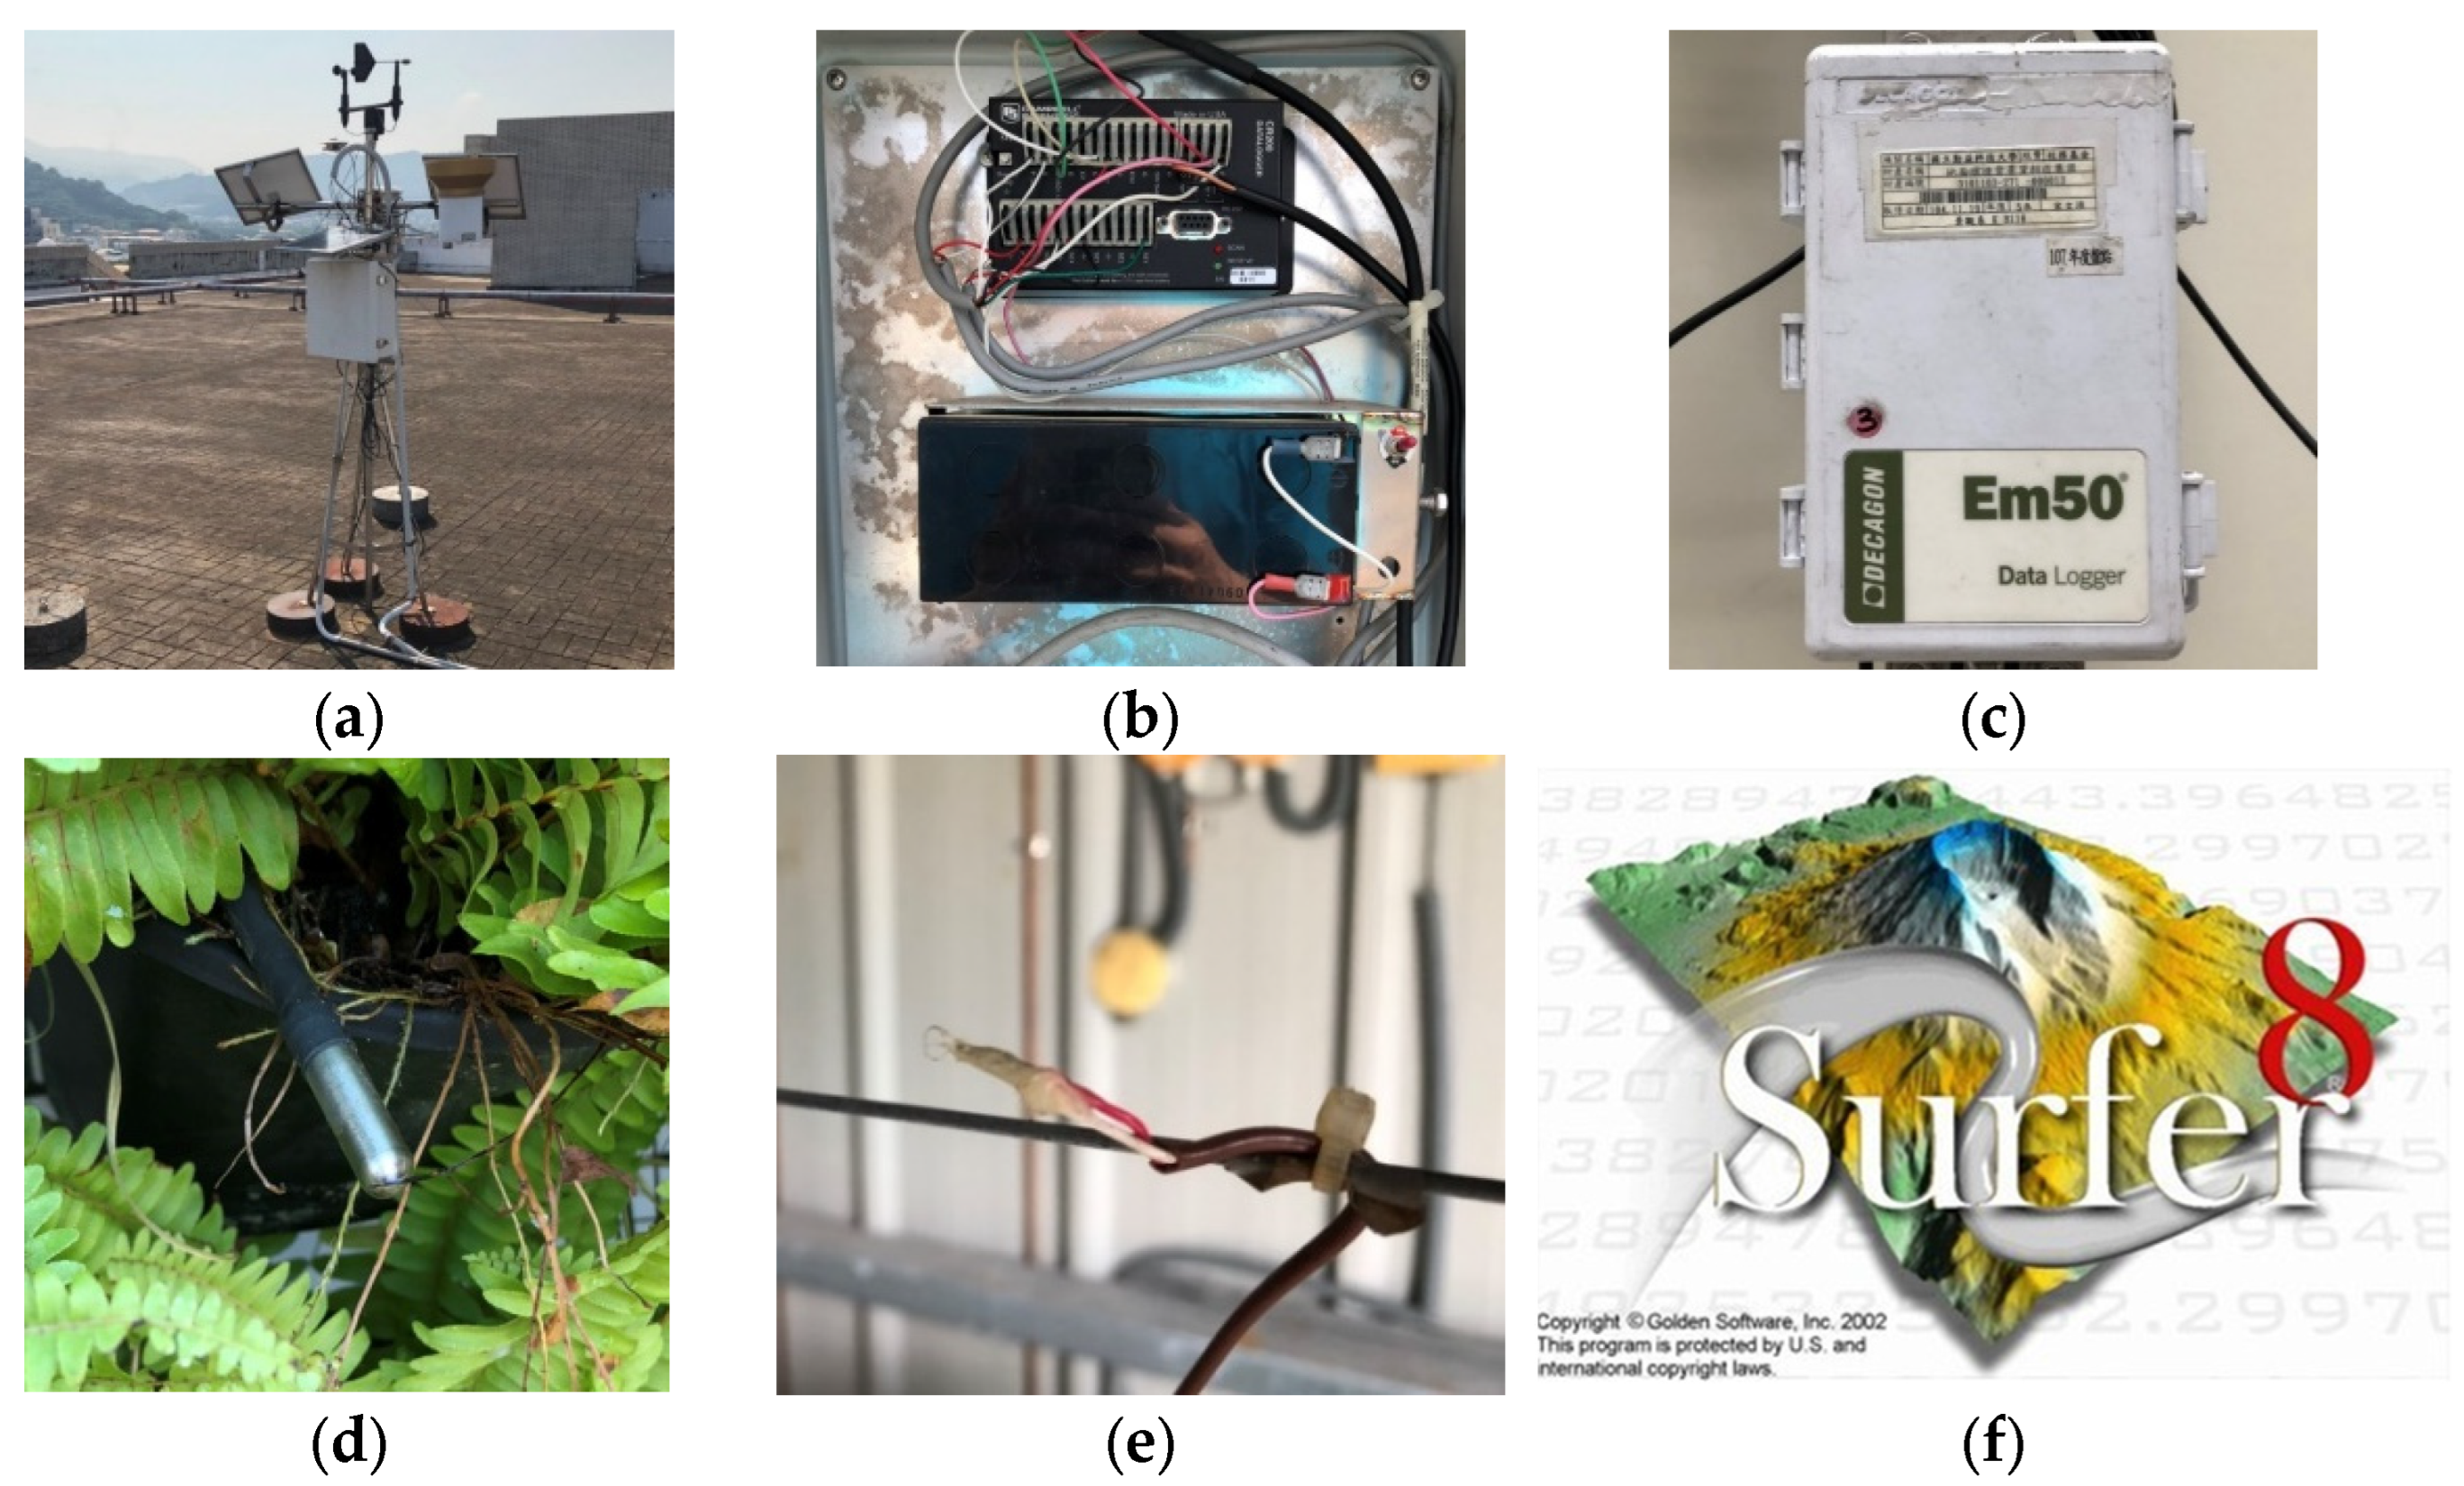
Environmental Meteorological Stations: These stations provide macro climate conditions for the experimental site, including atmospheric temperature, relative humidity, wind direction, wind speed, and solar radiation, Figure 8a. Data from these stations are collected using a CR200 data logger, manufactured by Campbell Scientific, located in Logan, UT, USA. This data serves as the basis for comparing the experimental and control groups (Figure 8b).
(2)
Mini-Environmental Monitoring Stations: Located on the west-facing exterior walls of both the experimental and control buildings, these stations compare environmental parameter changes under conditions with and without the vertical greening system, Figure 8c. They record atmospheric temperature, relative humidity, wind direction, wind speed, and solar radiation, as well as surface temperatures of the west-facing walls and the vertical greening system, Figure 8d. This setup helps to clearly understand the impact of the vertical greening system on building wall temperatures.
(3)
Indoor Temperature Sensors: A thermocouple sensor consists of a loop made of two conductors with different properties. When the junctions of the two metals are at different temperatures, a temperature difference is created, which generates a thermoelectric potential. This, in turn, produces a measurable voltage that can be used to determine the temperature. In this study, thirty sensors were placed 80 cm from the west wall to accurately monitor indoor temperature variations, Figure 8e.
(4)
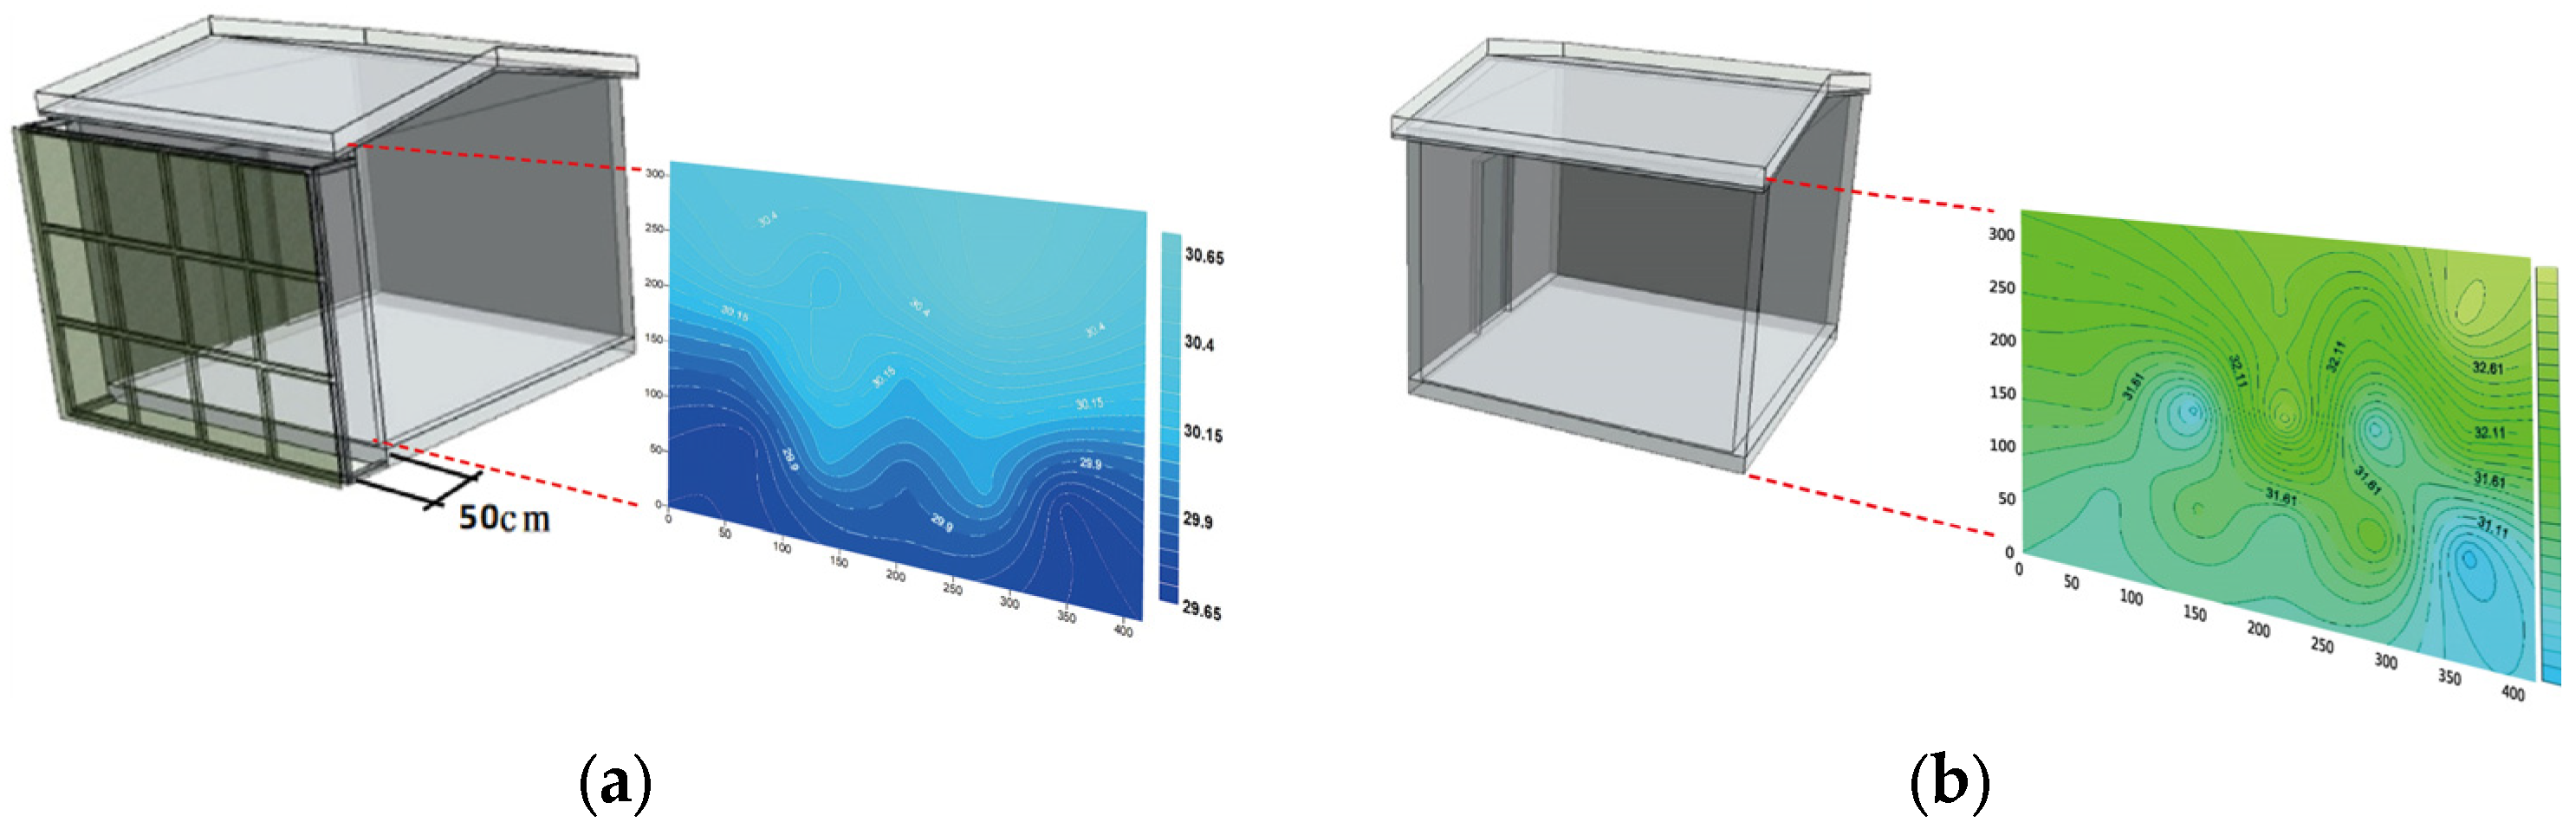
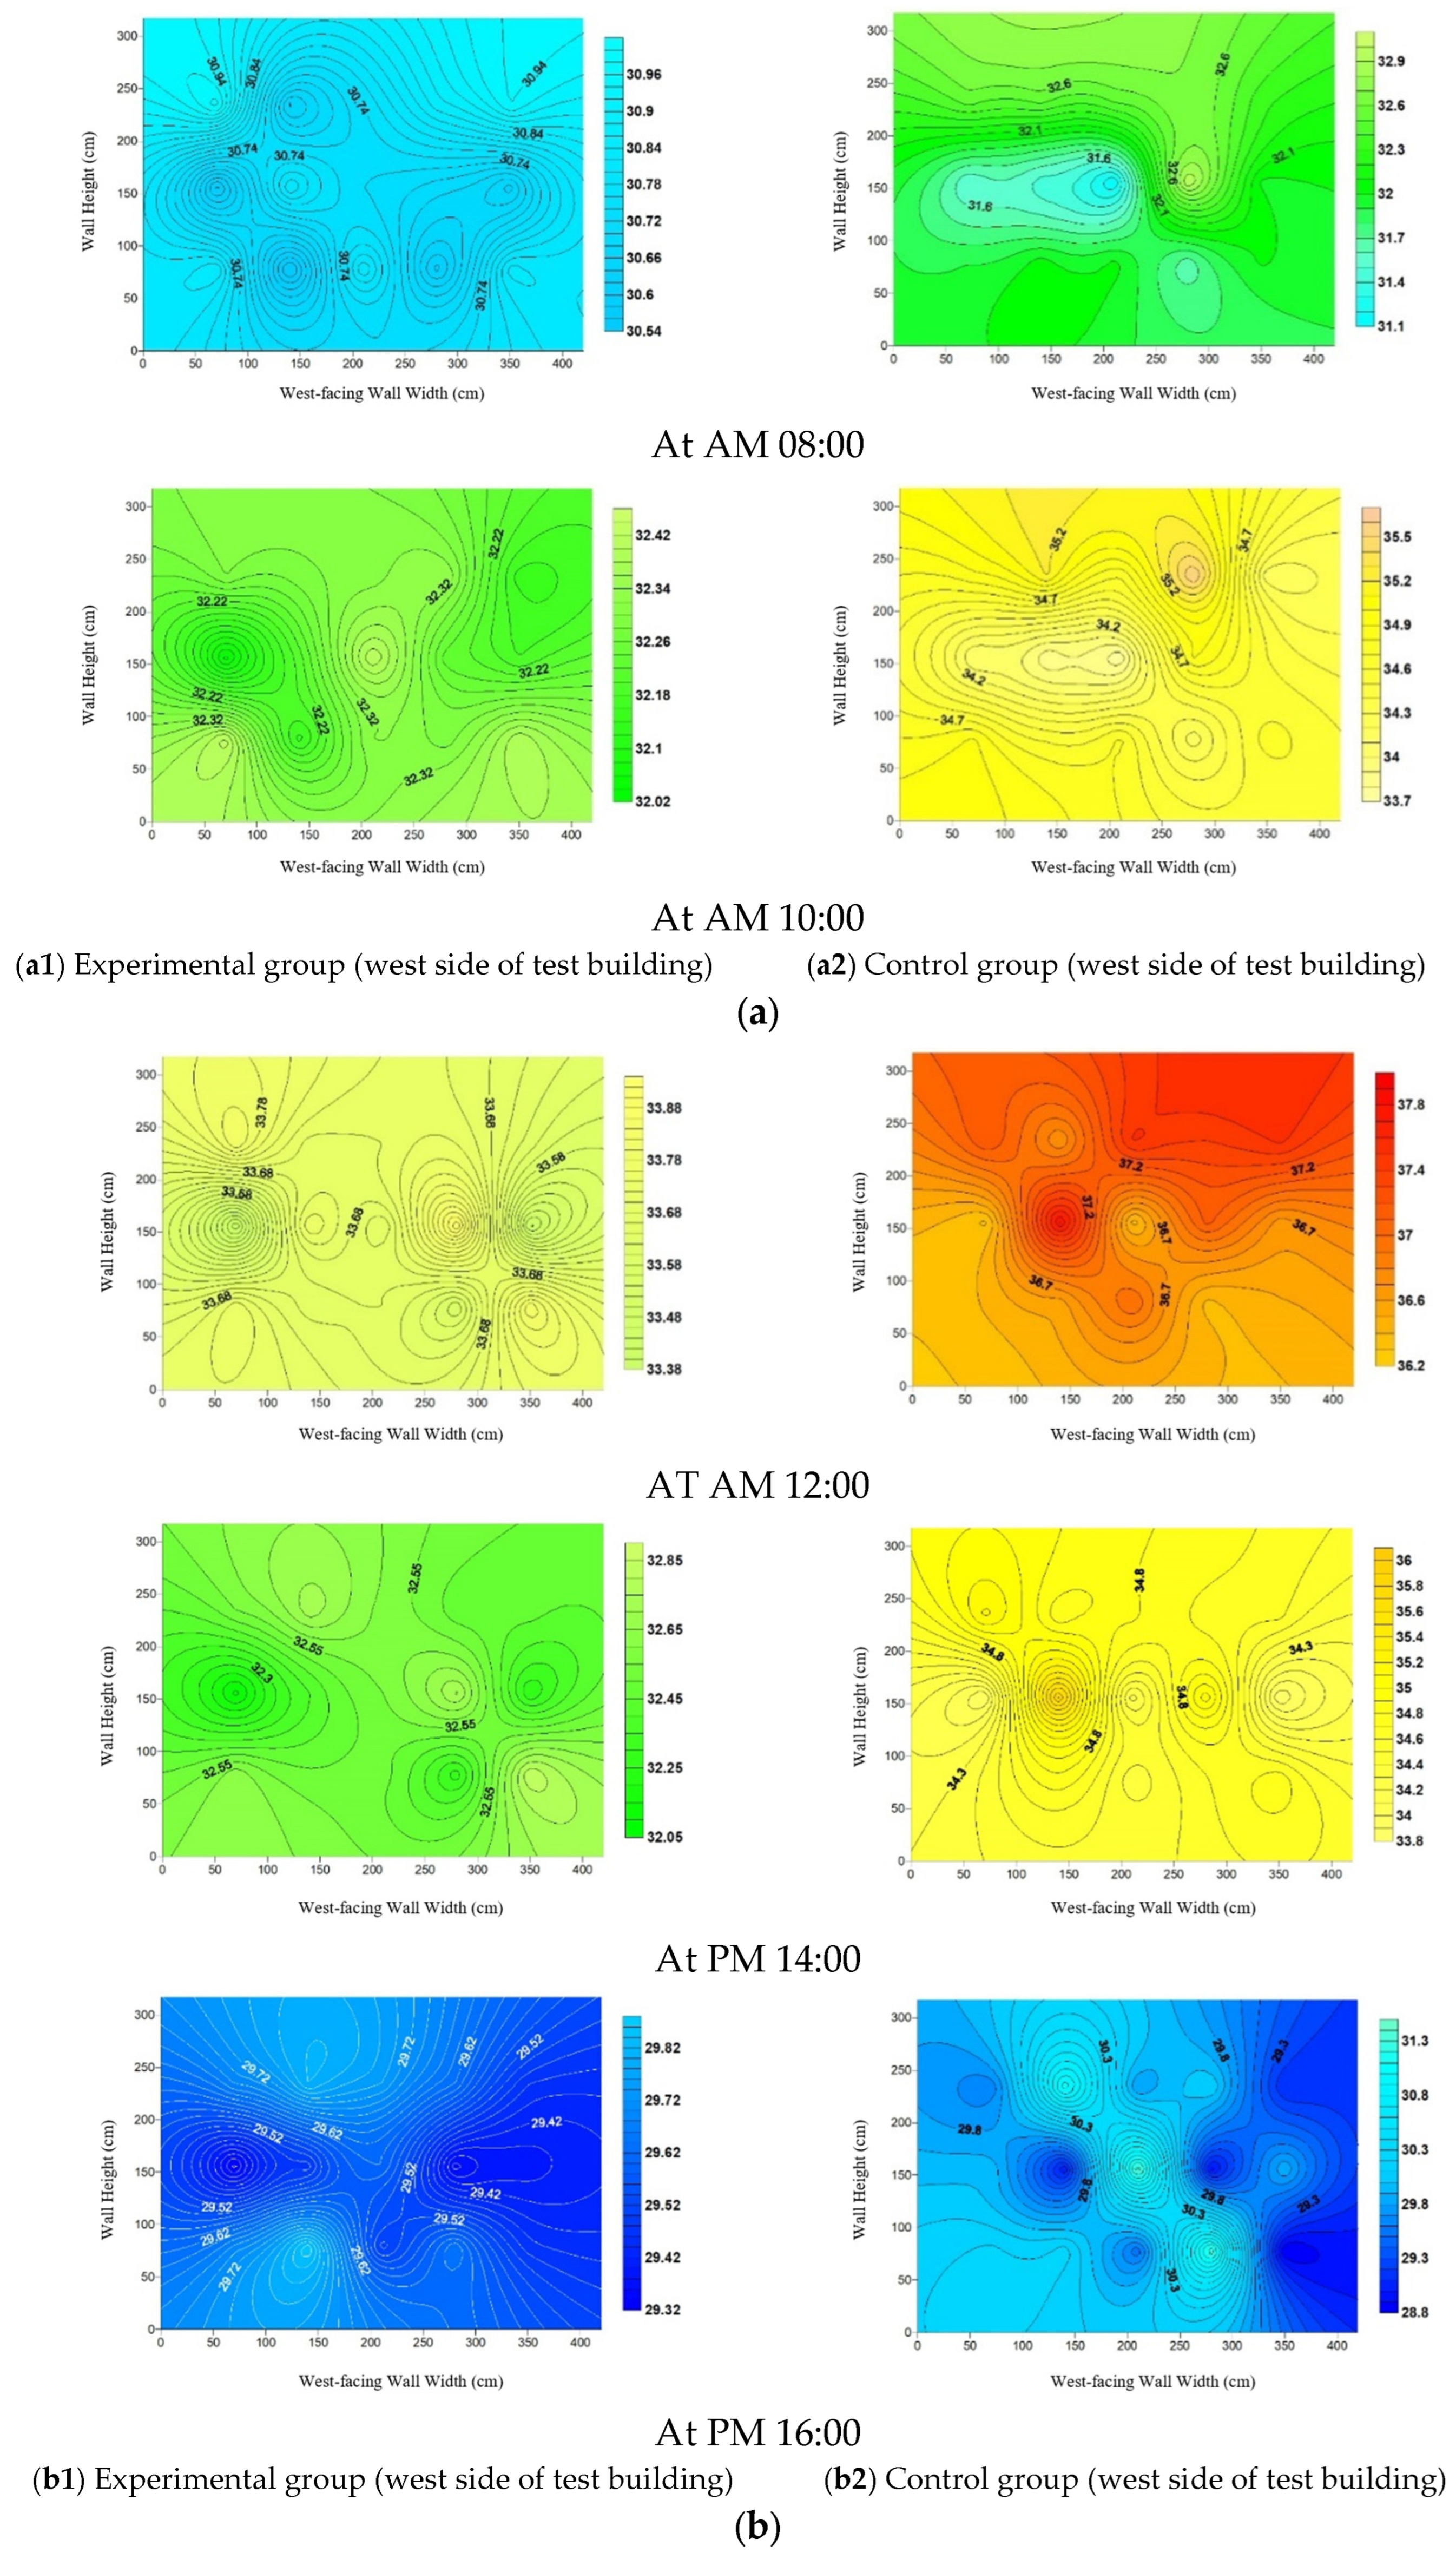
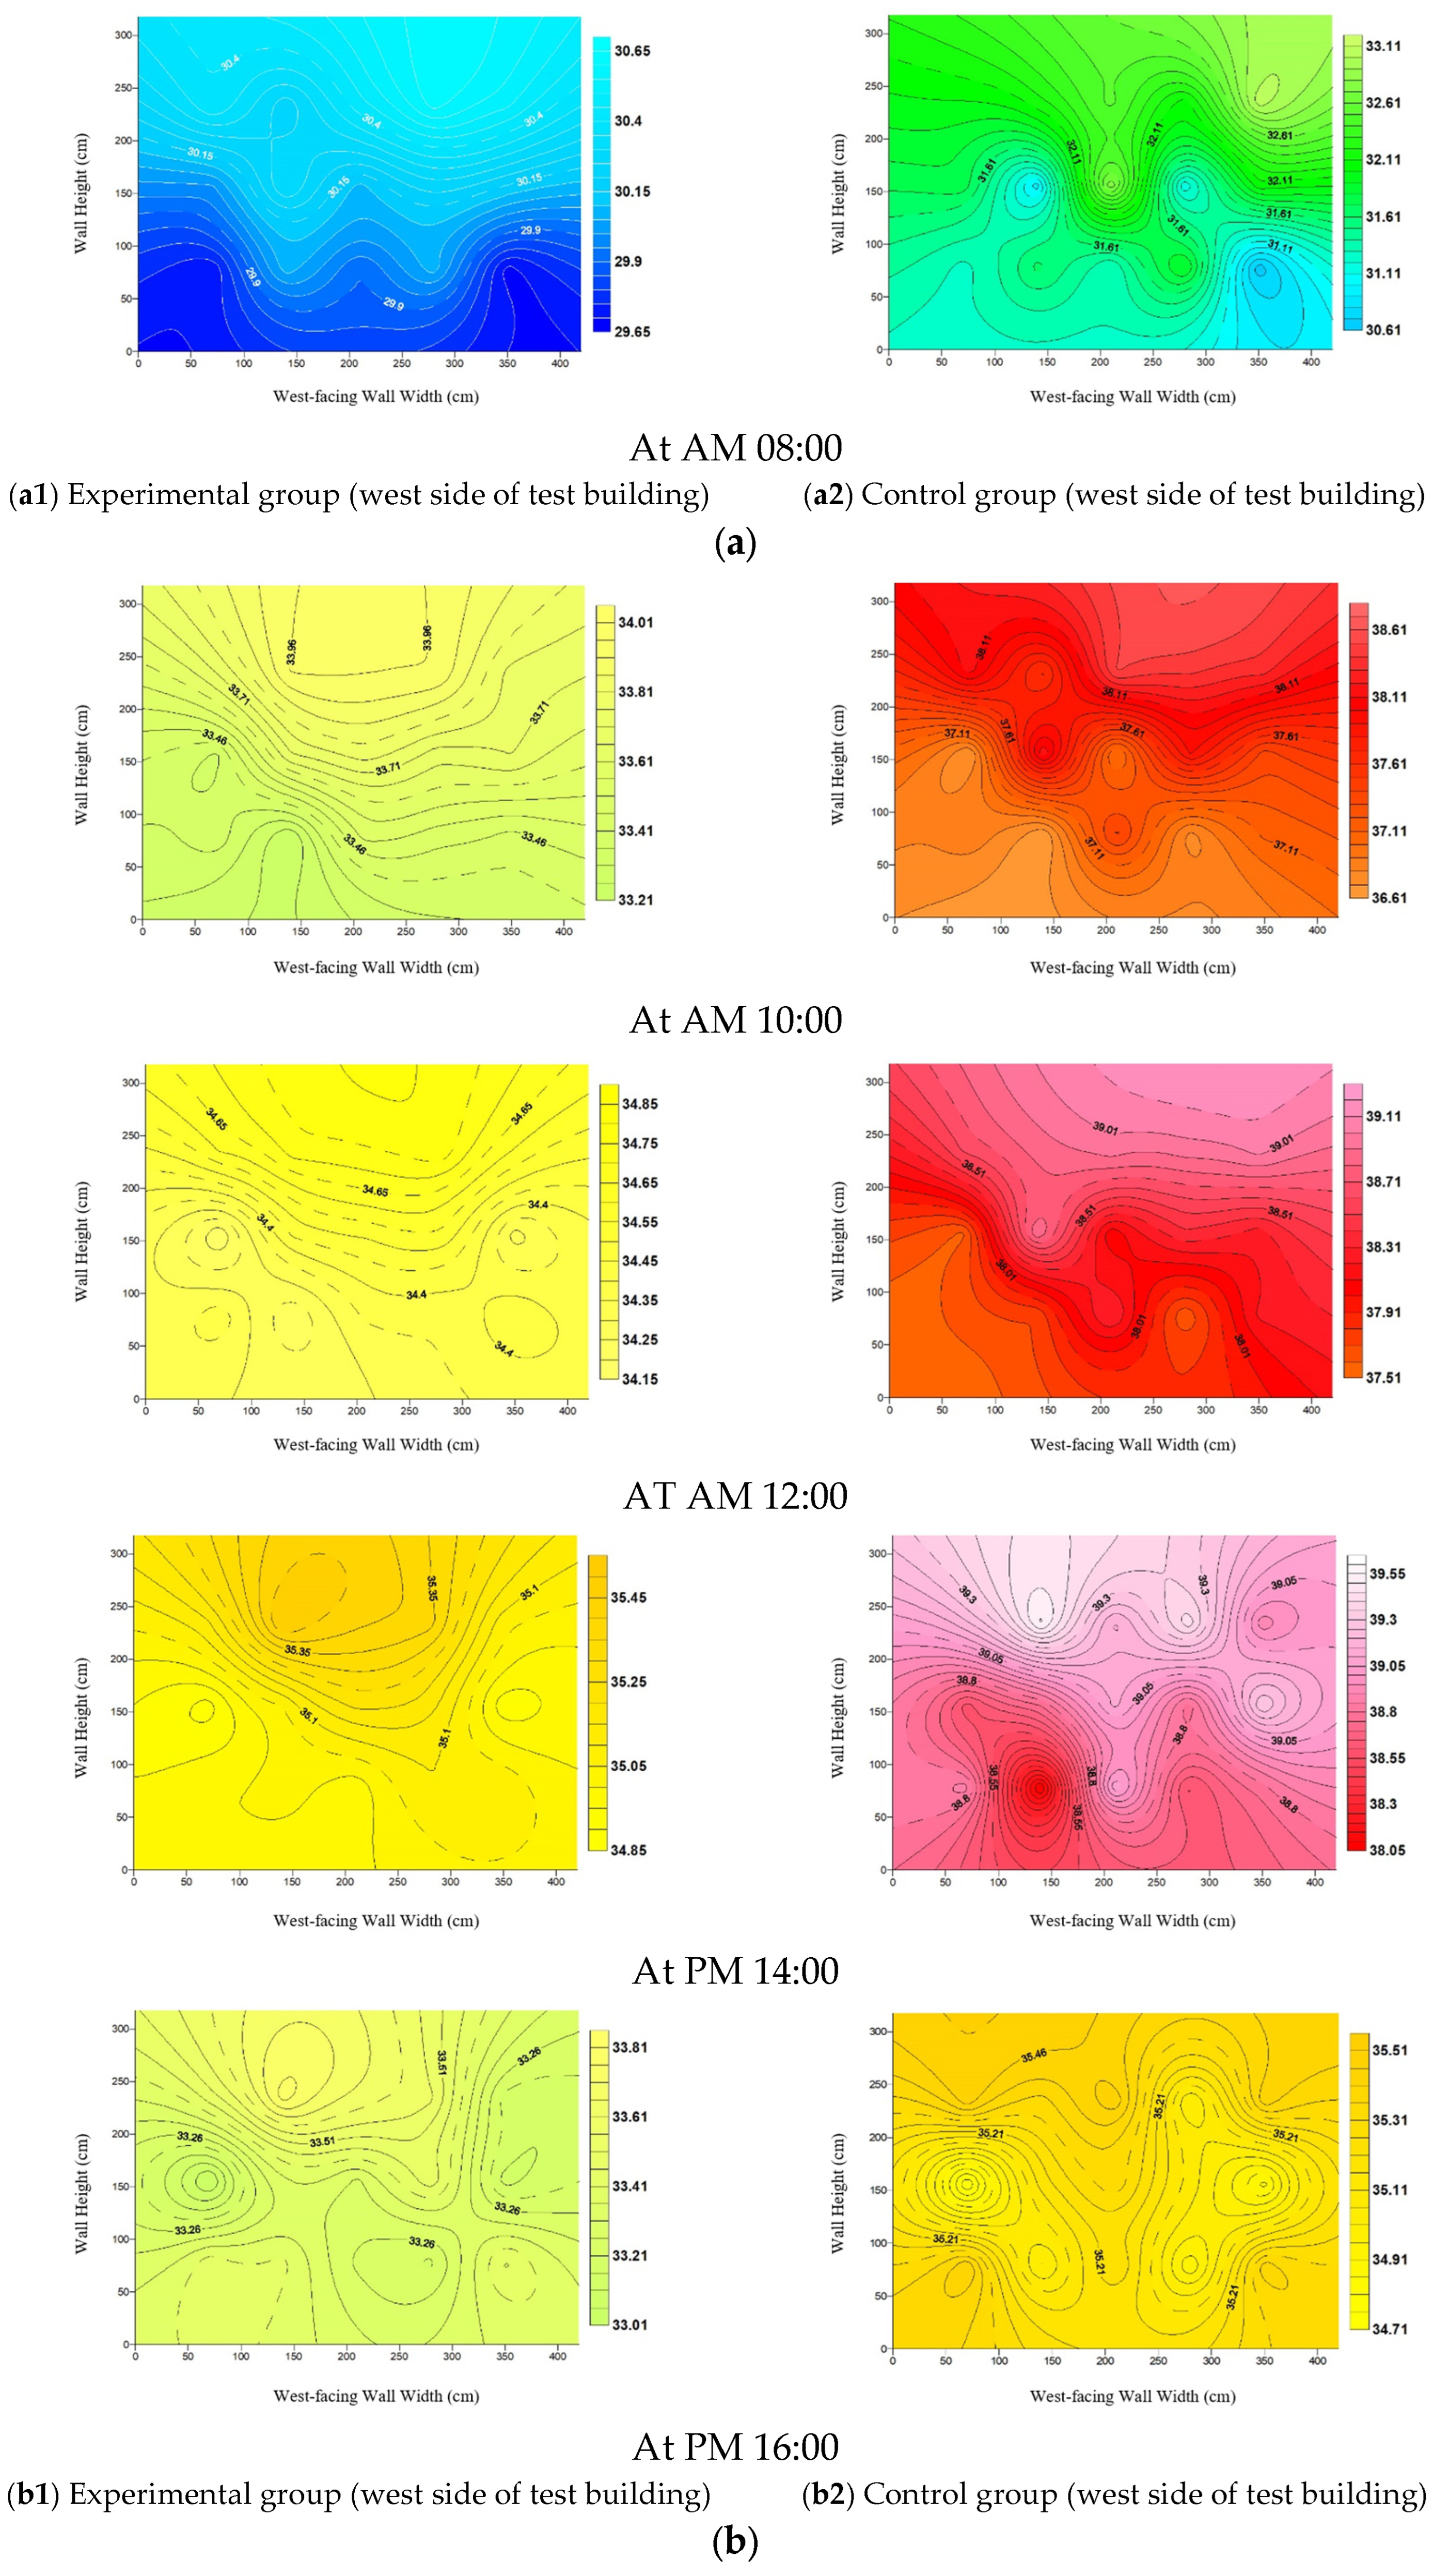
Surfer simulation software was developed by Golden Software as Surfer v26. It features a highly professional gridding design, enabling the rapid creation of professional 2D and 3D images. Surfer can use XYZ data to generate various contour maps and 3D grid maps, and is widely used in terrain modeling, landscape visualization, surface analysis, and watershed management. During the research process, data were collected through temperature sensors and visualized using Surfer 8.0 software, Figure 8f, producing detailed charts of indoor temperature changes. This analysis further evaluates the effect of the vertical greening system on indoor temperatures.

3.2. Data Presentation Methodology

During the experiment, data were analyzed on a weekly basis. Specifically, data from environmental meteorological stations were compared at similar time points to ensure simultaneity and comparability. Key comparison items included atmospheric temperature, solar radiation, exterior wall surface temperature, and temperature variations at 30 indoor points.
The comparison process involved the following steps:
(1)
Data Collection and Organization: Collect and organize data from environmental meteorological stations, including atmospheric temperature and solar radiation, as well as surface temperature data from mini-environmental monitoring stations on the exterior walls and the vertical greening systems. This was performed weekly.
(2)
Temperature Variation Analysis: Analyze how the collected data affect the temperature changes at the 30 indoor points.
(3)
Statistical Analysis: Perform statistical analysis on the data to evaluate the benefits and performance of different vertical greening system distances.
This comparison method helps in gaining a deeper understanding of the impact of vertical greening systems on the internal environment of buildings under varying distance conditions and provides references for best practices in future vertical greening system installations.

4. Results and Discussion

4.1. Vertical Green System at 50 cm Distance and 70% Opacity

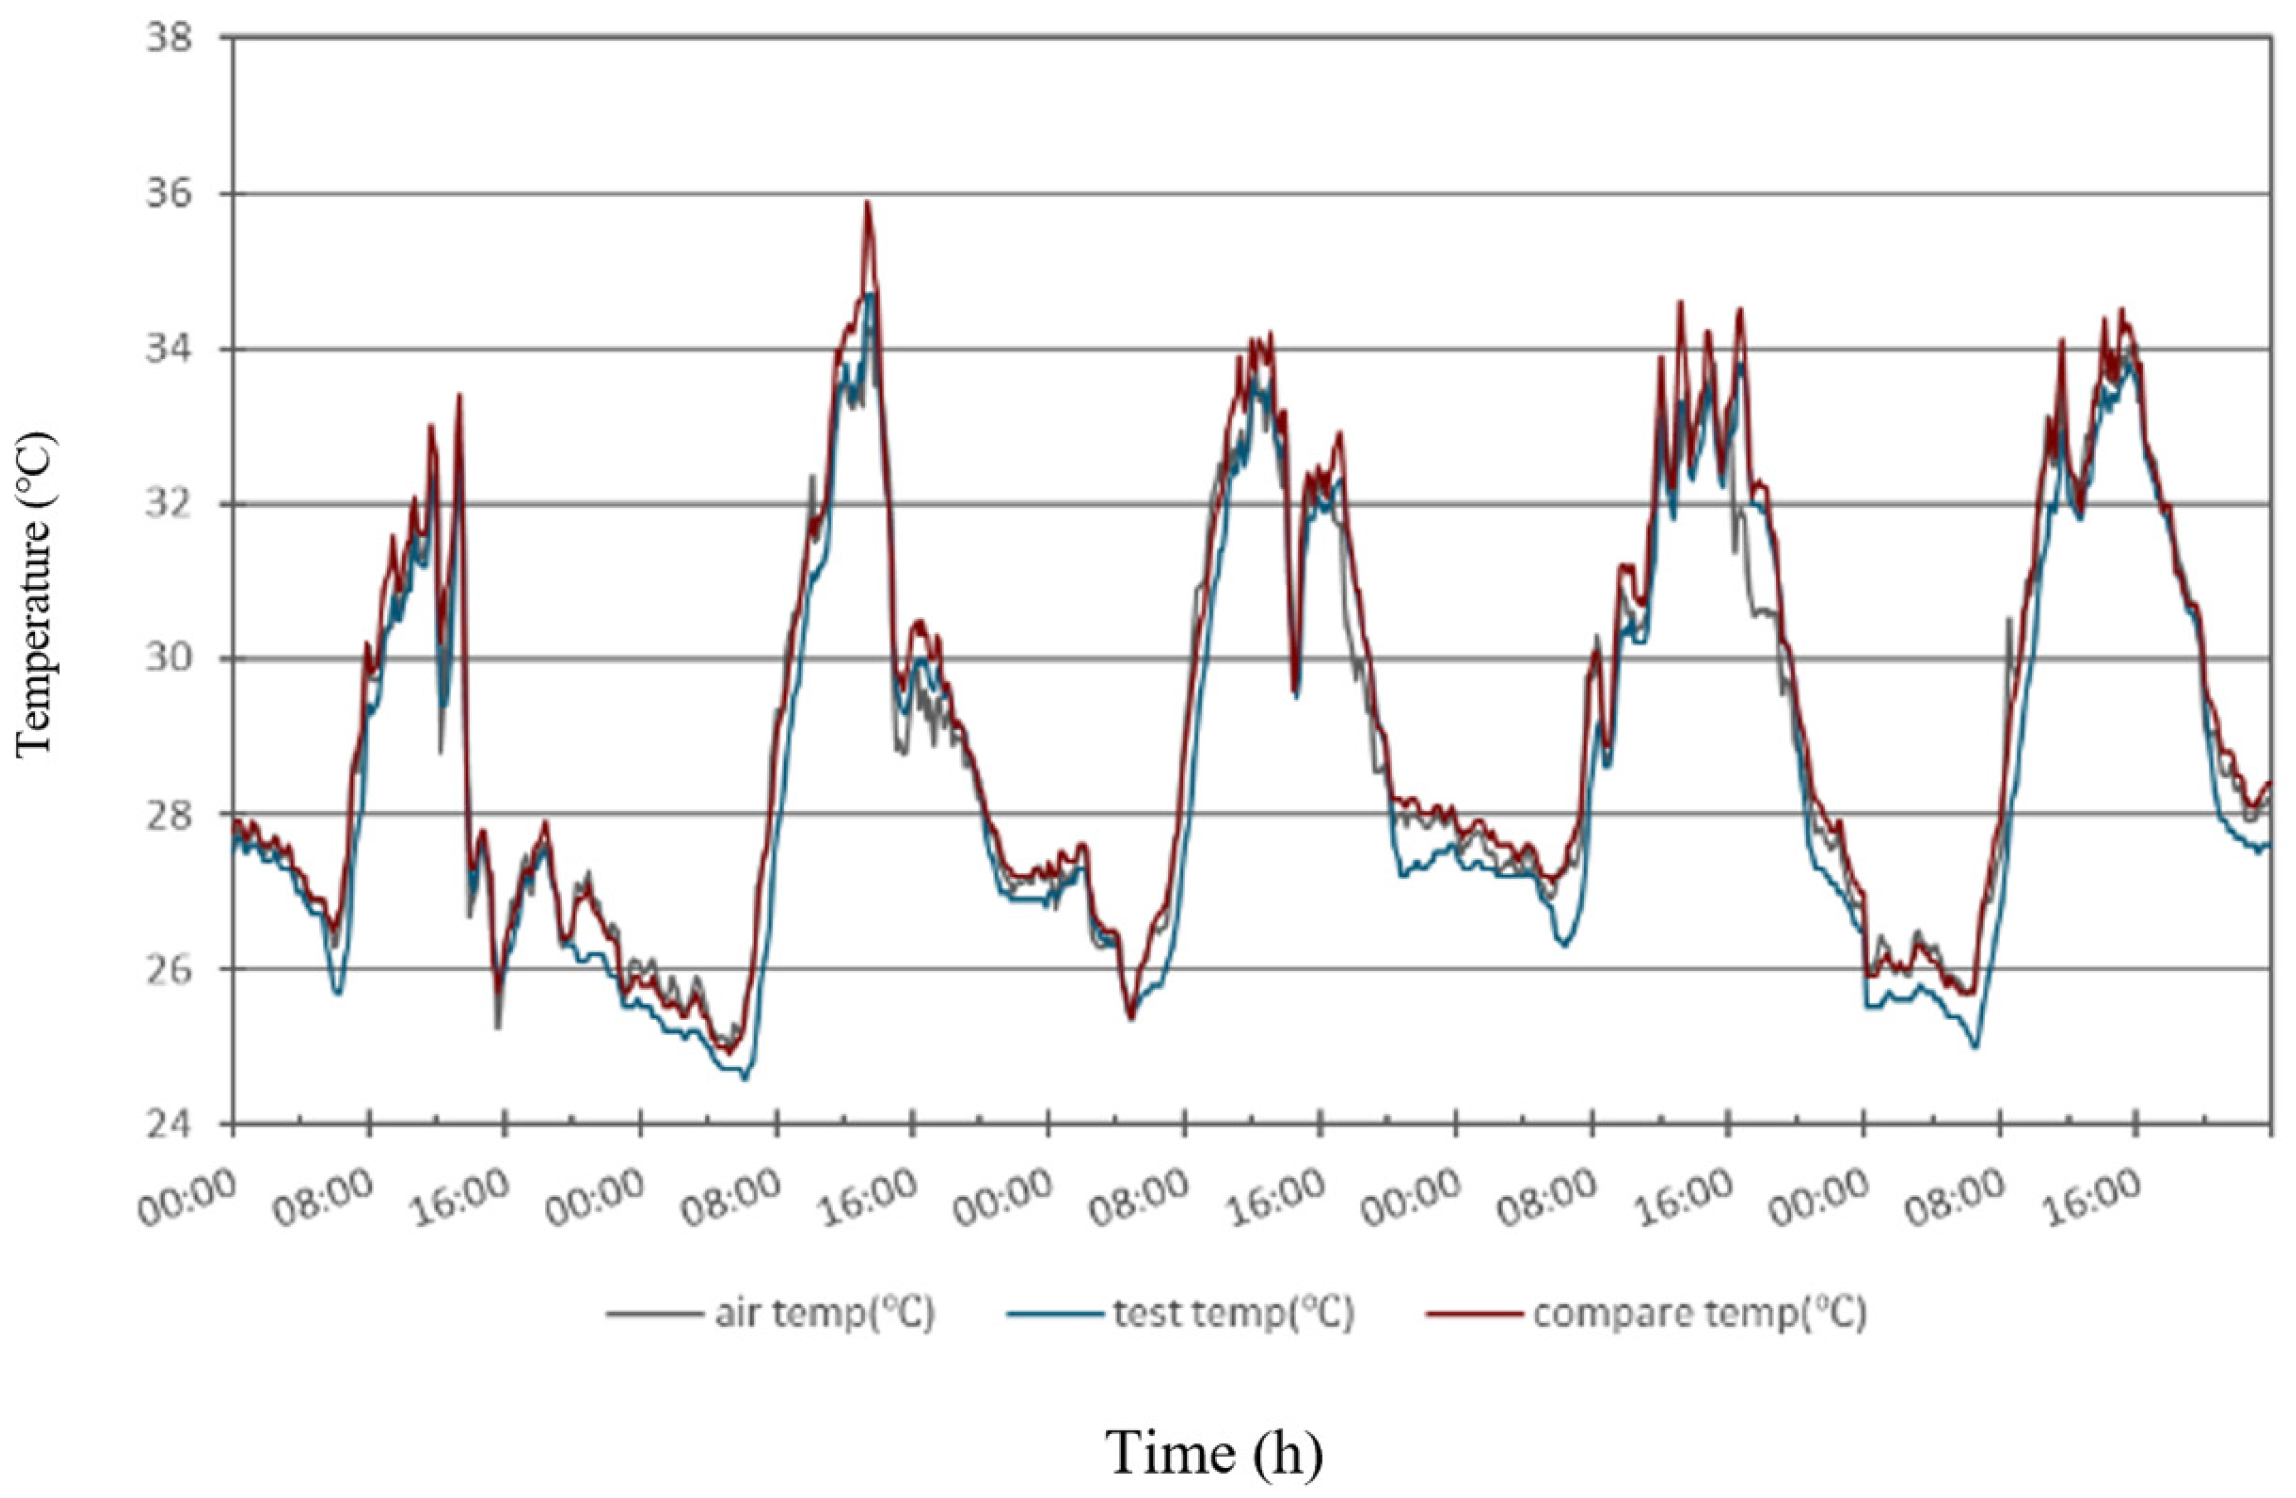
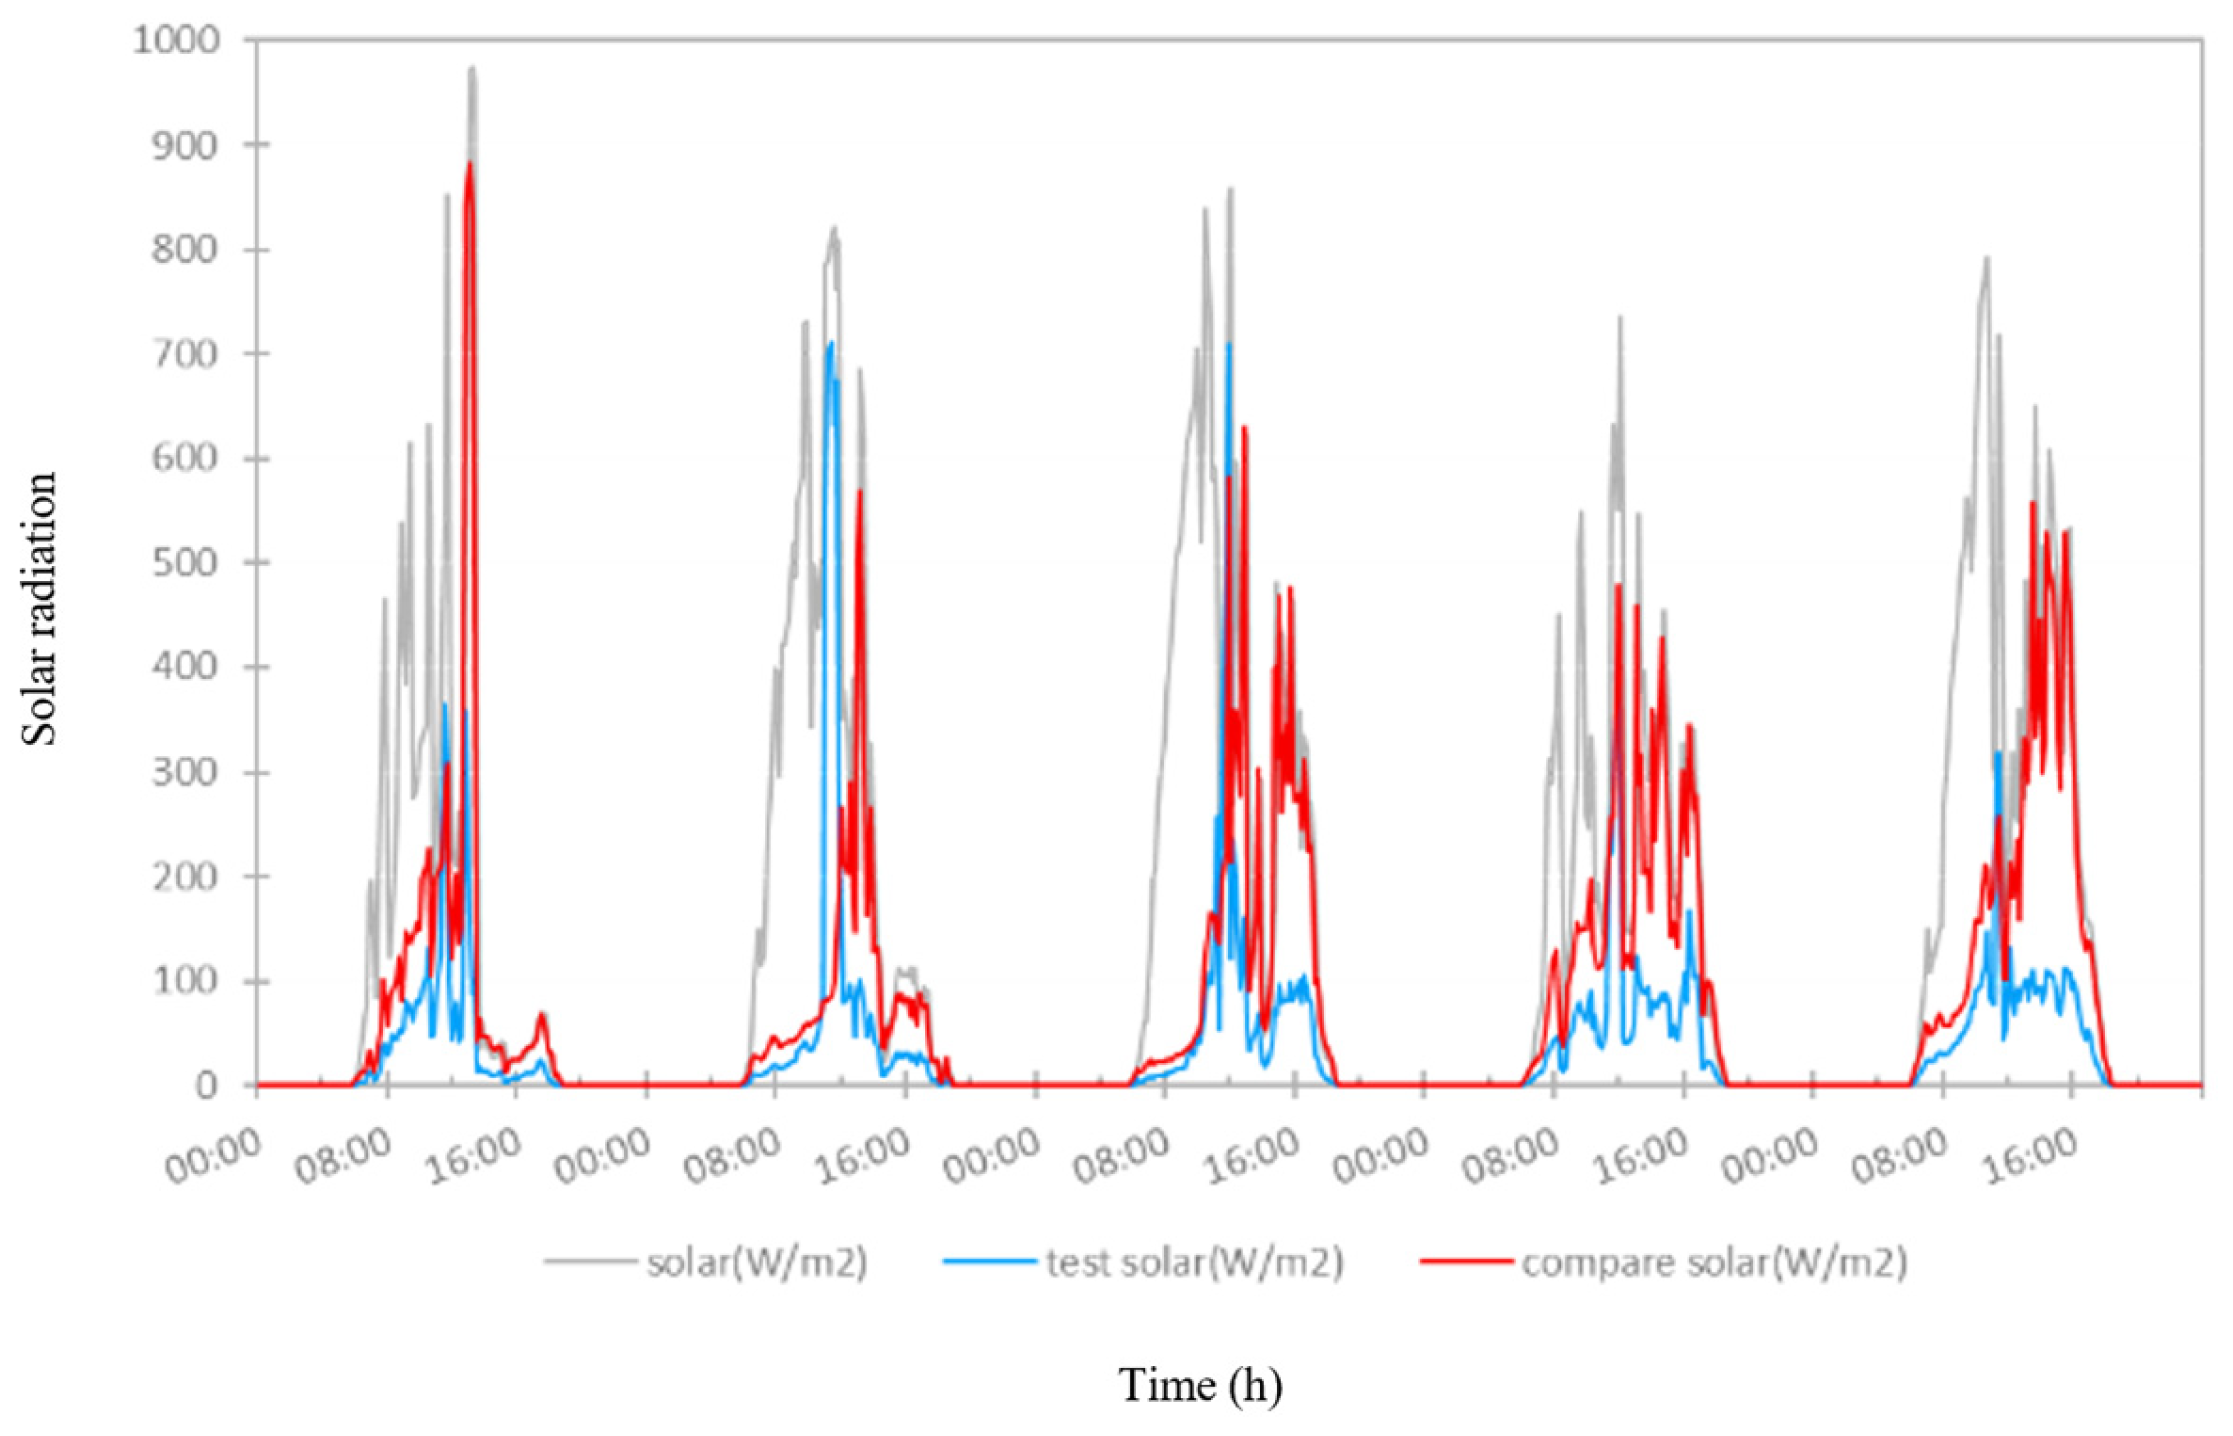
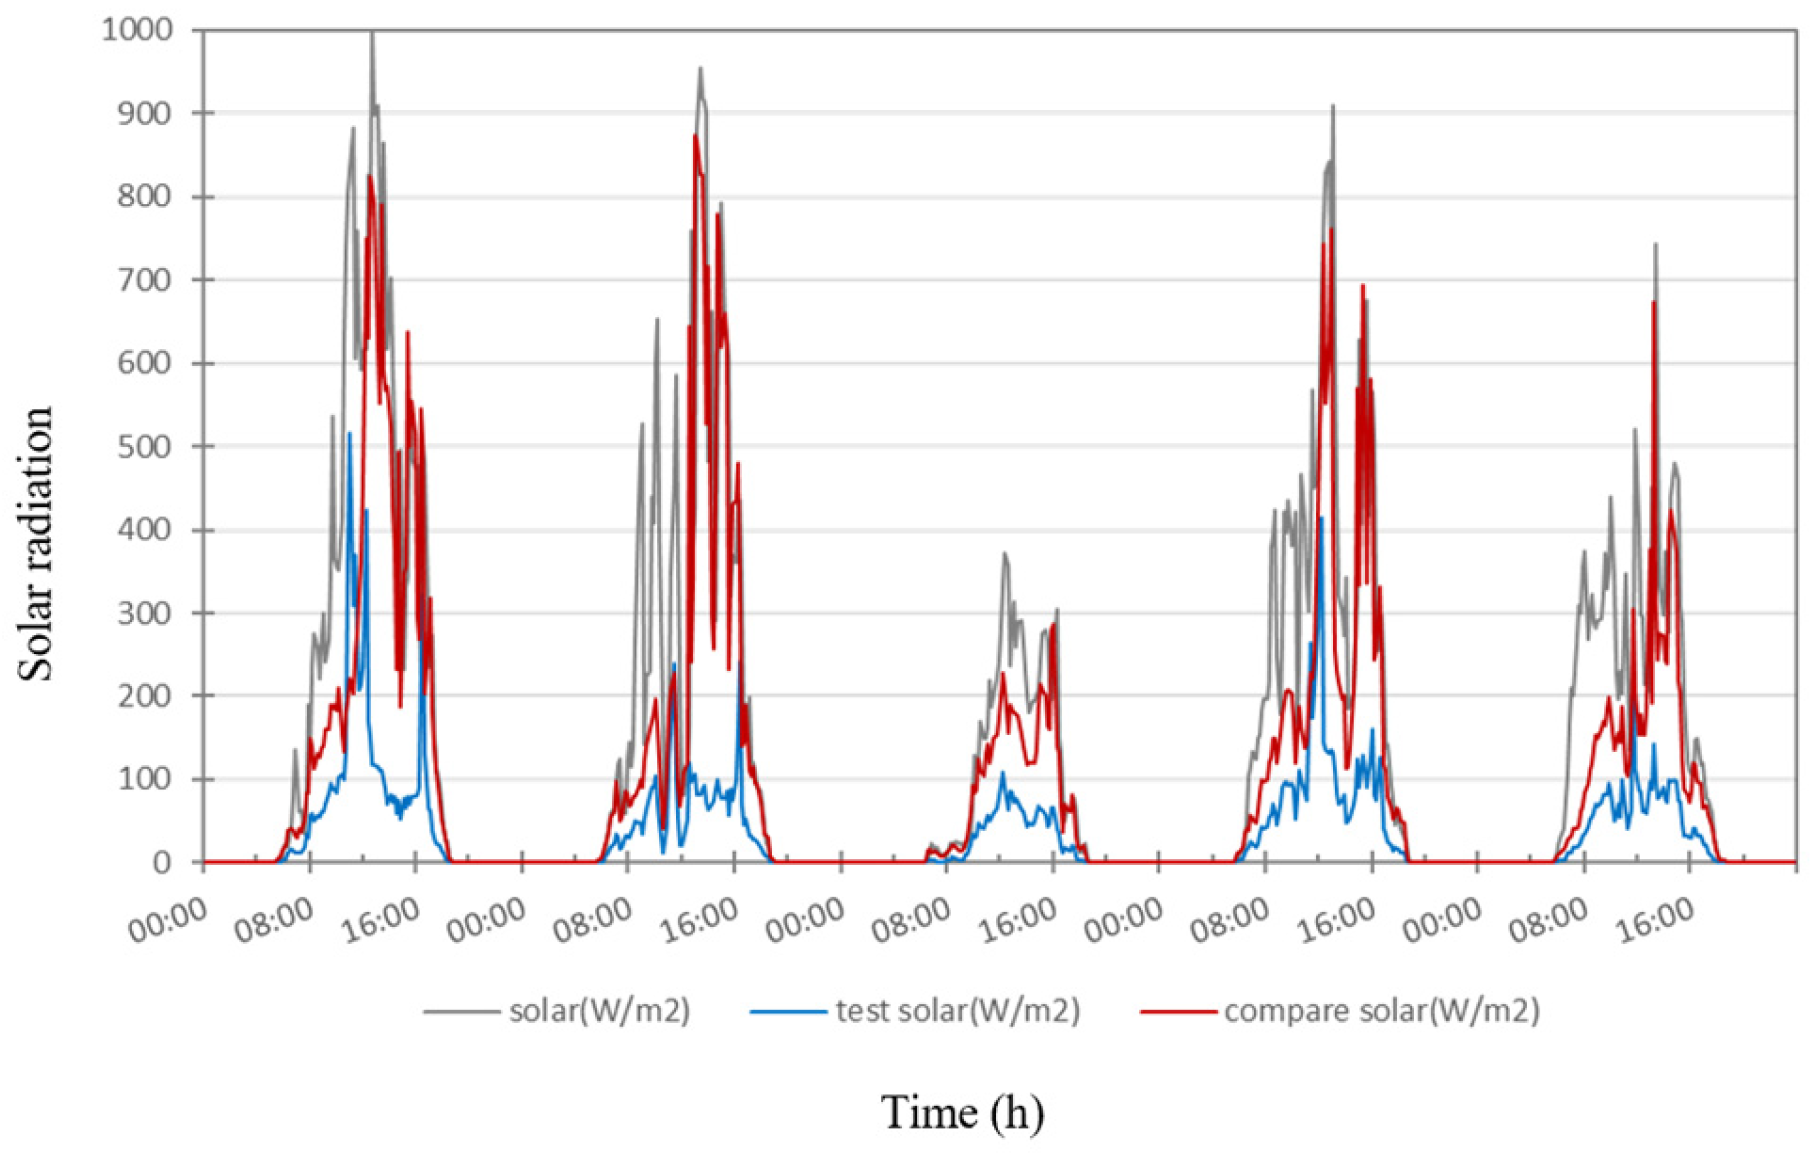
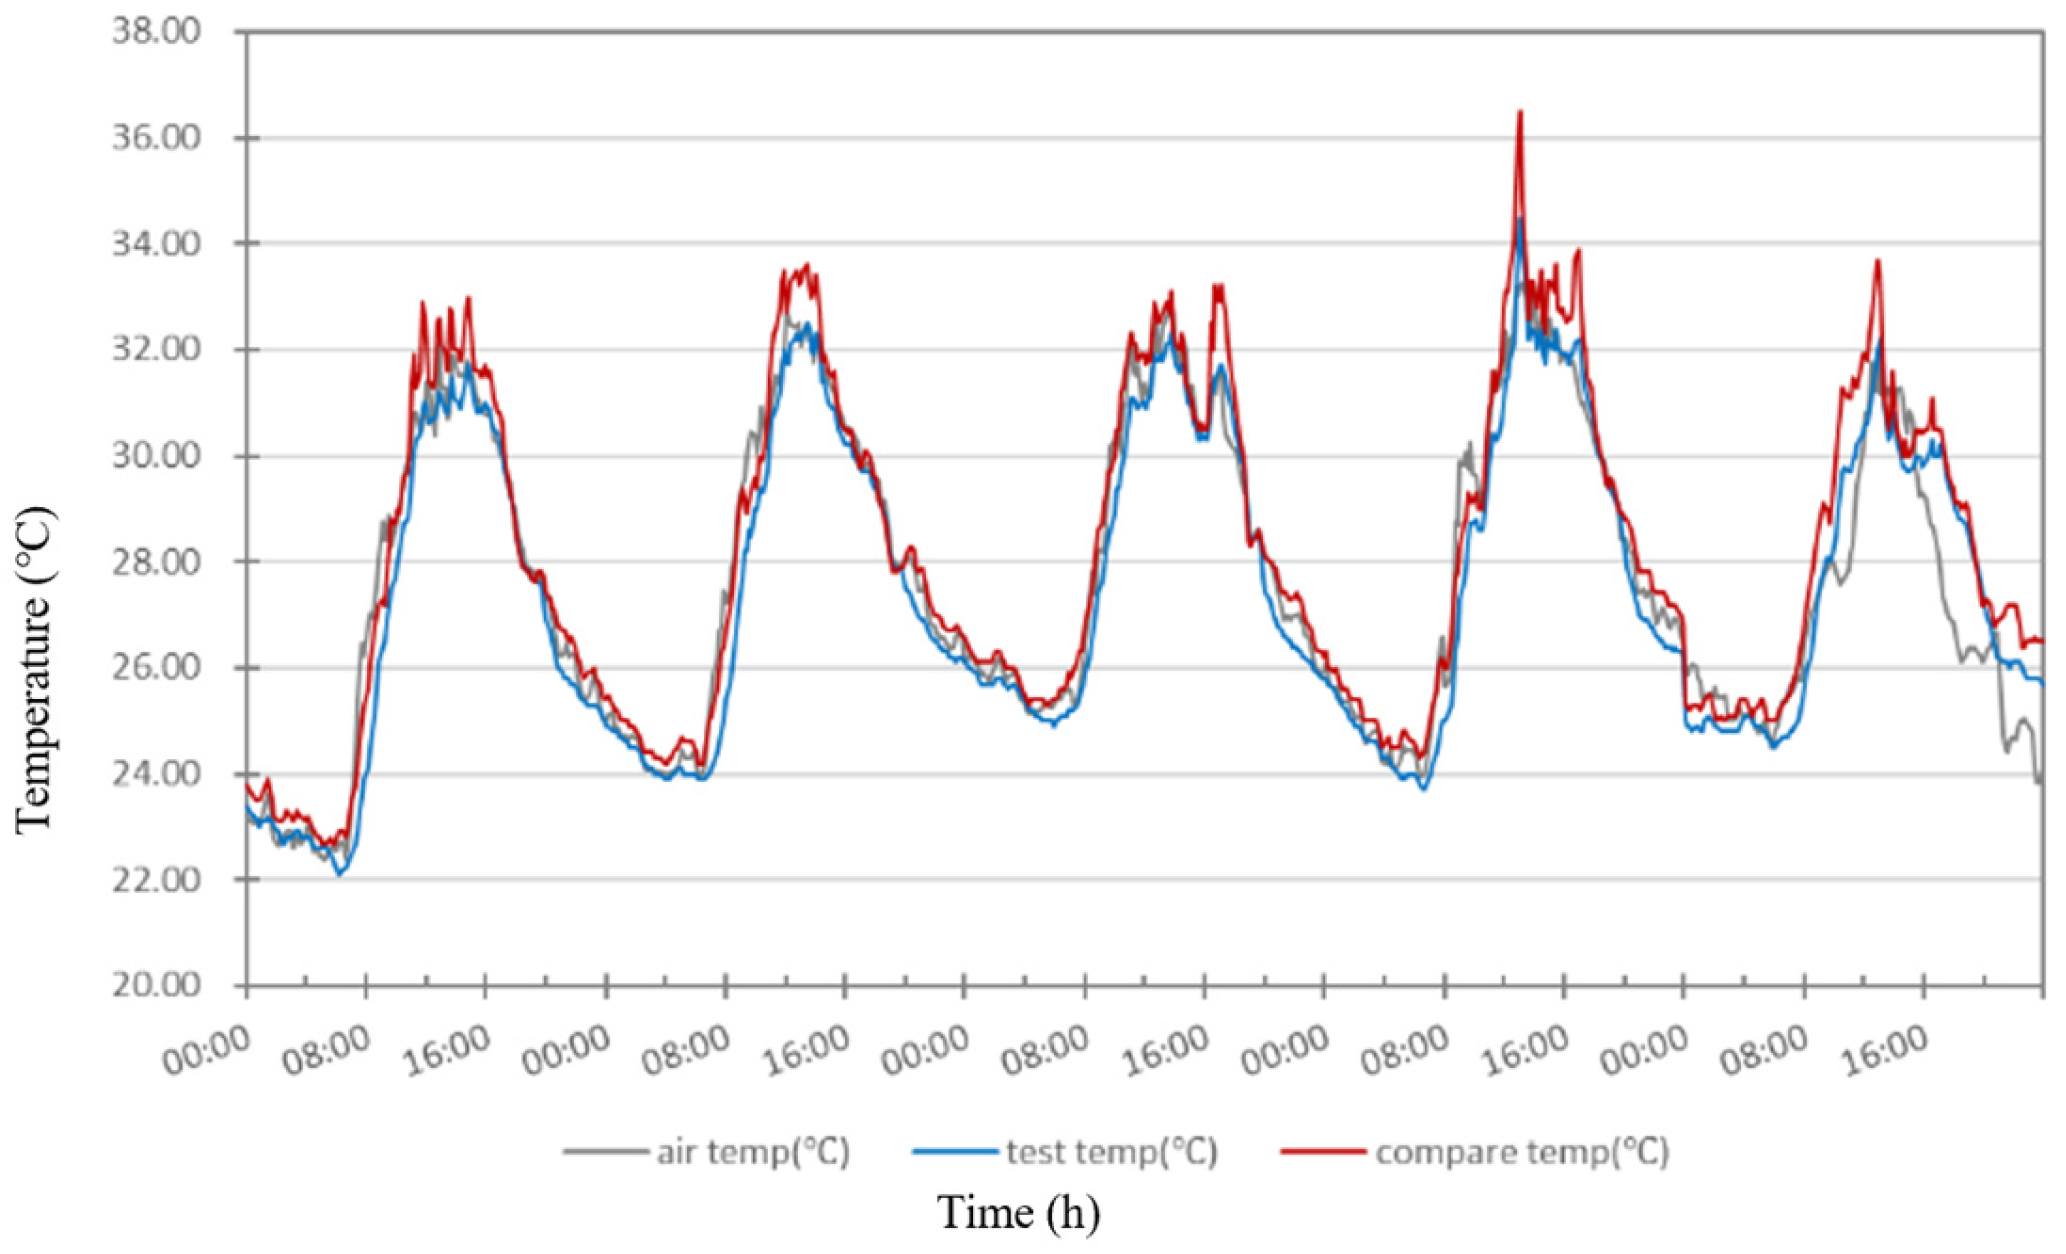
4.1.1. Temperature Variation and Solar Radiation Variation for VGS with Distance 50 cm and Opacity 70%

To help clarify the influence of environmental temperature on indoor temperature, we provided a graph before Figure 6 showing the temperature range from 8 am to 6 pm for both outdoor and indoor temperatures on the same day at the same time, without the vertical greening system (VGS). This will allow a clearer comparison between the external temperature and the indoor temperature variations, demonstrating how the environment influences the interior conditions.
Figure 9 illustrates the temperature variations over five days for the vertical green system set at a 50 cm distance and 70% opacity. From the data, it is challenging to discern distinct temperature changes among the environmental monitoring station, the experimental group, and the control group. The temperature trends across the three setups are similar, with only minor differences observed. Notably, the temperatures reach their daily peak between 12:00 and 16:00. During this period, the control group exhibits the highest temperatures compared to the experimental group and the environmental monitoring station. The experimental group’s temperatures are 0.3–0.5 °C lower than those of the control group, aligning more closely with the environmental temperature.
Figure 10 depicts the solar radiation variations over the same five-day period. The solar radiation values start to rise around 06:00, corresponding to sunrise, and decrease to zero around 18:30, indicating sunset. Prior to 12:00, both the experimental and control groups show lower solar radiation values compared to the environmental monitoring station. This discrepancy was due to the placement of the micro-weather stations on the western side of the buildings. Between 11:00 and 16:00, the differences in solar radiation become more apparent. After 12:00, the control group’s solar radiation values align closely with those of the environmental monitoring station, as there was no vertical green system to obstruct the radiation. Conversely, the experimental group, with its vertical green system in place, exhibits solar radiation values ranging between 100 and 200 W/m2, showing a significant reduction compared to the control group. The maximum difference in solar radiation values between the experimental and control groups is between 490 and 730 W/m2.

4.1.2. Vertical Green System at 50 cm Distance and 70% Opacity: Indoor Temperature Variations

Daily Temperature Variation in the Experimental and Control Groups
Table 1 indicates that the most significant temperature differences between the experimental and control groups occurred between 09:00 a.m. and 02:00 p.m.. During this period, the experimental group’s temperature is notably lower, with the peak difference observed at 12:00 p.m., where it is 3.86 °C lower than the control group’s temperature. After 02:00 p.m., the temperatures of both groups begin to converge, suggesting that factors other than vertical greening benefits influence the temperature differences. After 12:00 p.m., as the sun moved westward, the effectiveness of vertical greening diminished due to the coverage being below 70%, thereby reducing its impact. Additionally, in the early morning (07:00 a.m.) and late afternoon (after 04:00 p.m.), the experimental group’s temperatures were often higher than those of the control group, due to the rapid heat dissipation of the metal exterior of the building.
Figure 11 presents the indoor temperature variations on the western side of the buildings for both groups. Simulation maps of temperature distribution reveal that differences between the experimental and control groups started to appear around 08:00 a.m.. Before noon, the experimental group maintained a more stable temperature compared to the control group, which showed a steeper rise in temperature. At noon, the highest temperature of the day, the simulation maps indicate that the control group had a higher color temperature compared to the experimental group.
This suggests a vertical temperature gradient in the control group, with heat transferring from the upper to the lower parts of the wall. In contrast, the experimental group’s temperature distribution is more even, with no significant gradients. After noon, the temperatures in both groups gradually converged, and by 04:00 p.m., the simulation maps showed minimal temperature differences between the two groups, reflecting similar temperature profiles throughout the remainder of the day.

4.2. Vertical Green System at 50 cm Distance and 95% Opacity

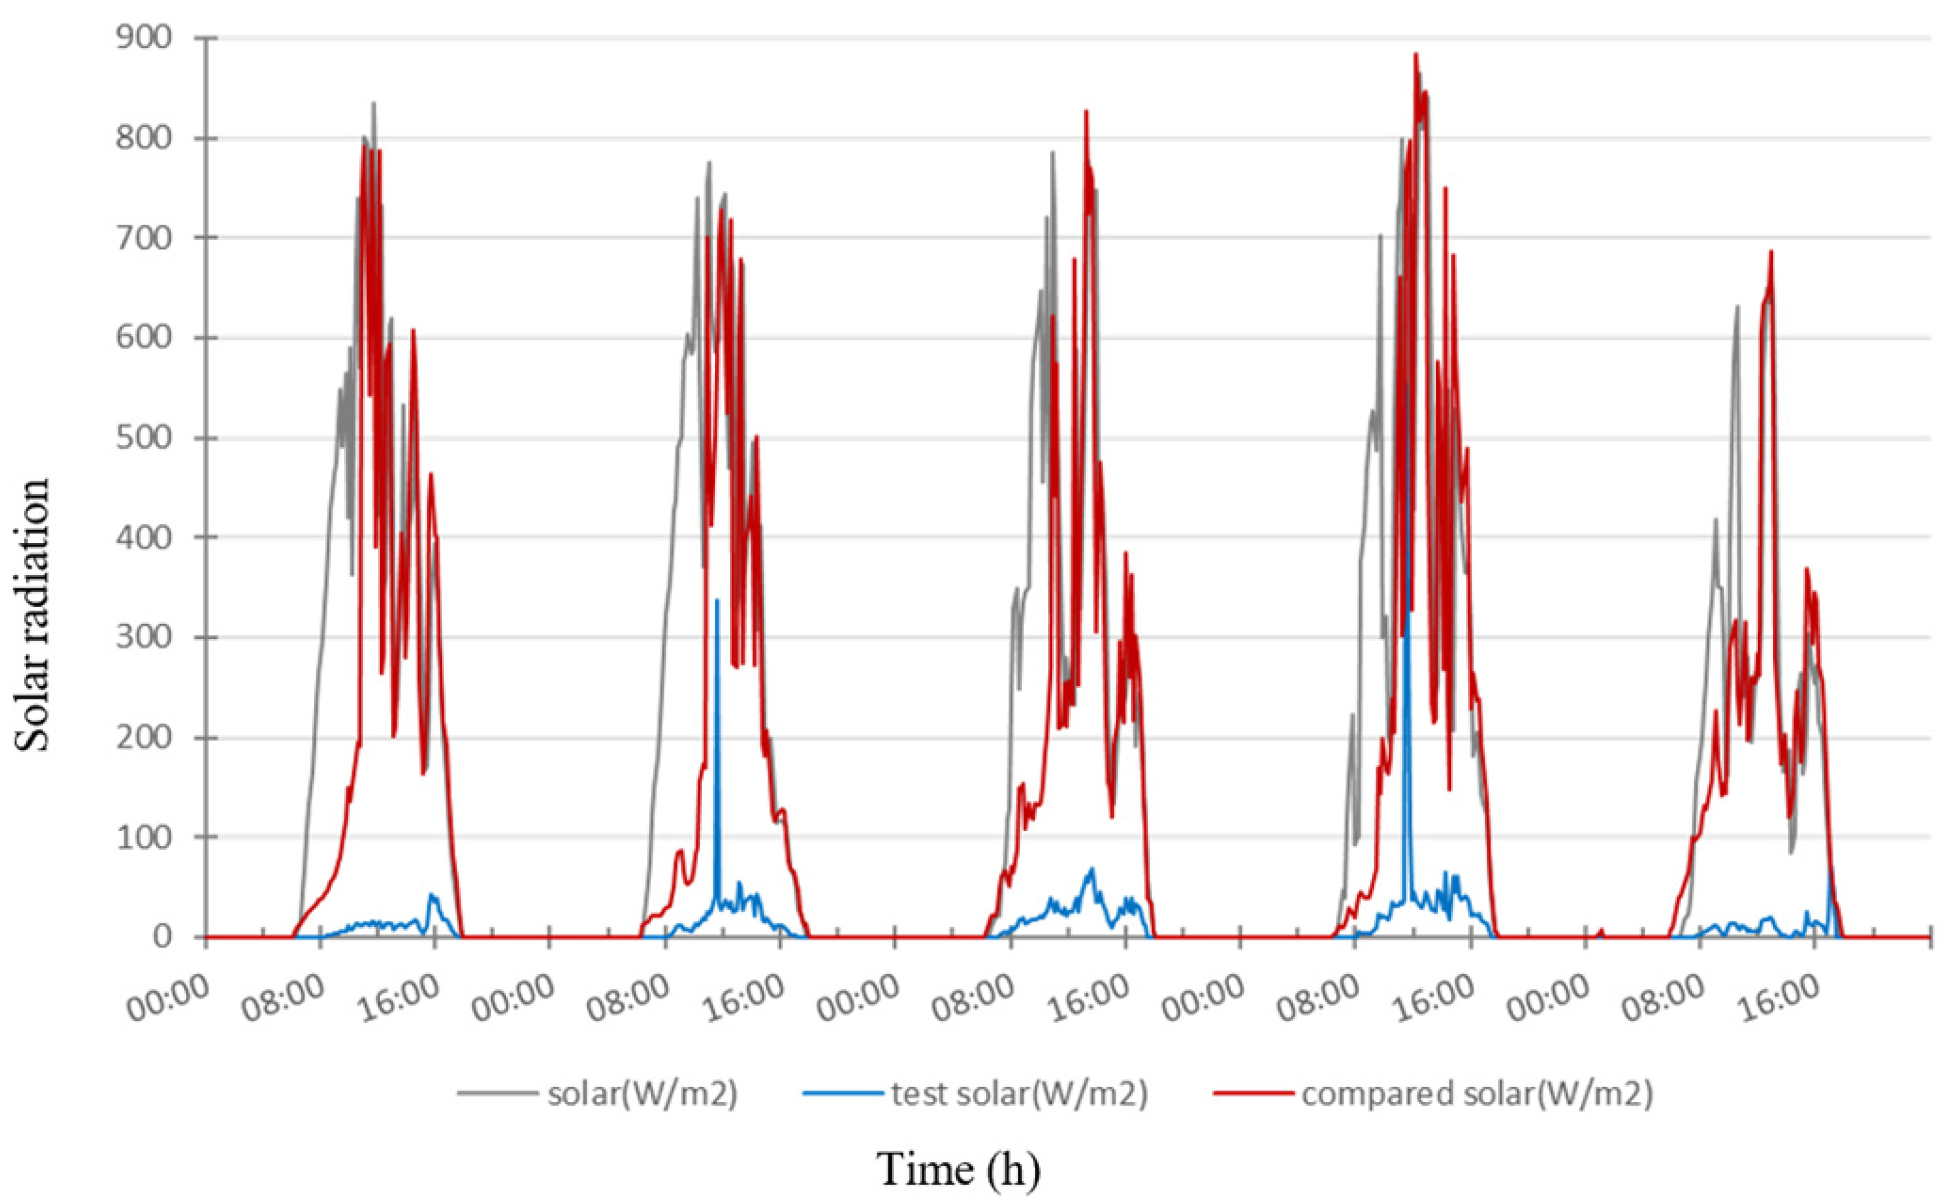
4.2.1. Temperature Variation and Solar Radiation Variation for VGS with Distance 50 cm and Opacity 95%

Figure 12 illustrates the temperature variations over a five-day period for the vertical green system with a distance of 50 cm and 95% opacity. During the peak temperature period between 11:00 and 16:00 each day, the control group exhibited the highest temperatures among the three setups. In contrast, the experimental group’s temperatures were close to the ambient temperatures, with a slight reduction compared to the control group. The maximum temperature difference between the experimental group and the control group during this period was approximately 1–2.5 °C. Figure 13 displays the changes in solar radiation values over the same five-day period. Solar radiation started to increase from 06:00 as the sun rose, reaching peak levels between 12:00 and 16:00, with values ranging from 640 to 750 W/m2. The experimental group with a vertical green system at 95% opacity effectively blocked a massive portion of solar radiation, with the highest recorded values between 25 and 31 W/m2. Figure 14 shows the changes in surface temperatures over the five days. Surface temperatures began to accumulate heat from 08:00, with the rate of temperature increase becoming more pronounced after 12:00. Temperatures continued to rise, reaching their highest values by 16:00. The average wall temperature of the control group could reach up to 55 °C, with some areas peaking at 61 °C. In comparison, the temperature differences between the control group and the experimental group, as well as the environment and the vertical green system, ranged from 18 to 22.4 °C.

4.2.2. Vertical Green System at 50 cm Distance and 95% Opacity: Temperature Variation Between Experimental and Control Groups

Daily Temperature Variation in the Experimental and Control Groups
Table 2 demonstrates that the most significant temperature differences between the experimental and control groups occurred between 08:00 a.m. and 04:00 p.m.. The greatest temperature difference was observed at 01:00 p.m., with the experimental group’s temperature being 5.09 °C lower than that of the control group. During this period, the minimum temperature in the experimental group was also 3.49 °C lower. From 09:00 a.m. to 03:00 p.m., the average maximum temperature difference exceeded 4.4 °C. In contrast, without rooftop green cover or vertical greening, internal temperature differences in the control group could reach up to approximately 1.6 °C.
After 12:00 p.m., the temperature difference remained pronounced until 03:00 p.m., after which it began to stabilize, indicating the effective temperature mitigation provided by the vertical greening system. Additionally, at 07:00 a.m. and after 06:00 p.m., the experimental group’s temperature was occasionally higher than that of the control group. This was due to the rapid heat dissipation of the building’s corrugated iron exterior, whereas the vertical greening system exhibited more moderate temperature fluctuations, resulting in higher temperatures in the experimental group before sunrise and after sunset compared to the control group.
Figure 15 illustrates temperature changes on the western side of the indoor environment for the vertical green system with a 50 cm distance and 95% opacity. A noticeable temperature difference between the experimental and control groups emerged from 08:00 a.m., reaching its peak between 12:00 p.m. and 01:00 p.m., with the experimental group being 4.65–5.09 °C cooler.
The control group’s temperature distribution, as shown in the simulation diagrams, reveals a clear vertical heat transfer from the upper to the lower part of the building. Starting around 09:00 a.m., signs of heat accumulation at the upper section became visible, with the most pronounced heat transfer occurring between 12:00 p.m. and 02:00 p.m.. By 01:00 p.m., the temperature distribution indicated a significant difference, with the upper part of the building reaching 40.51 °C and the lower part recording 38.31 °C, resulting in a 2.2 °C difference between the highest and lowest points within the control group’s indoor environment.

4.3. Vertical Green System at 100 cm Distance and 70% Opacity

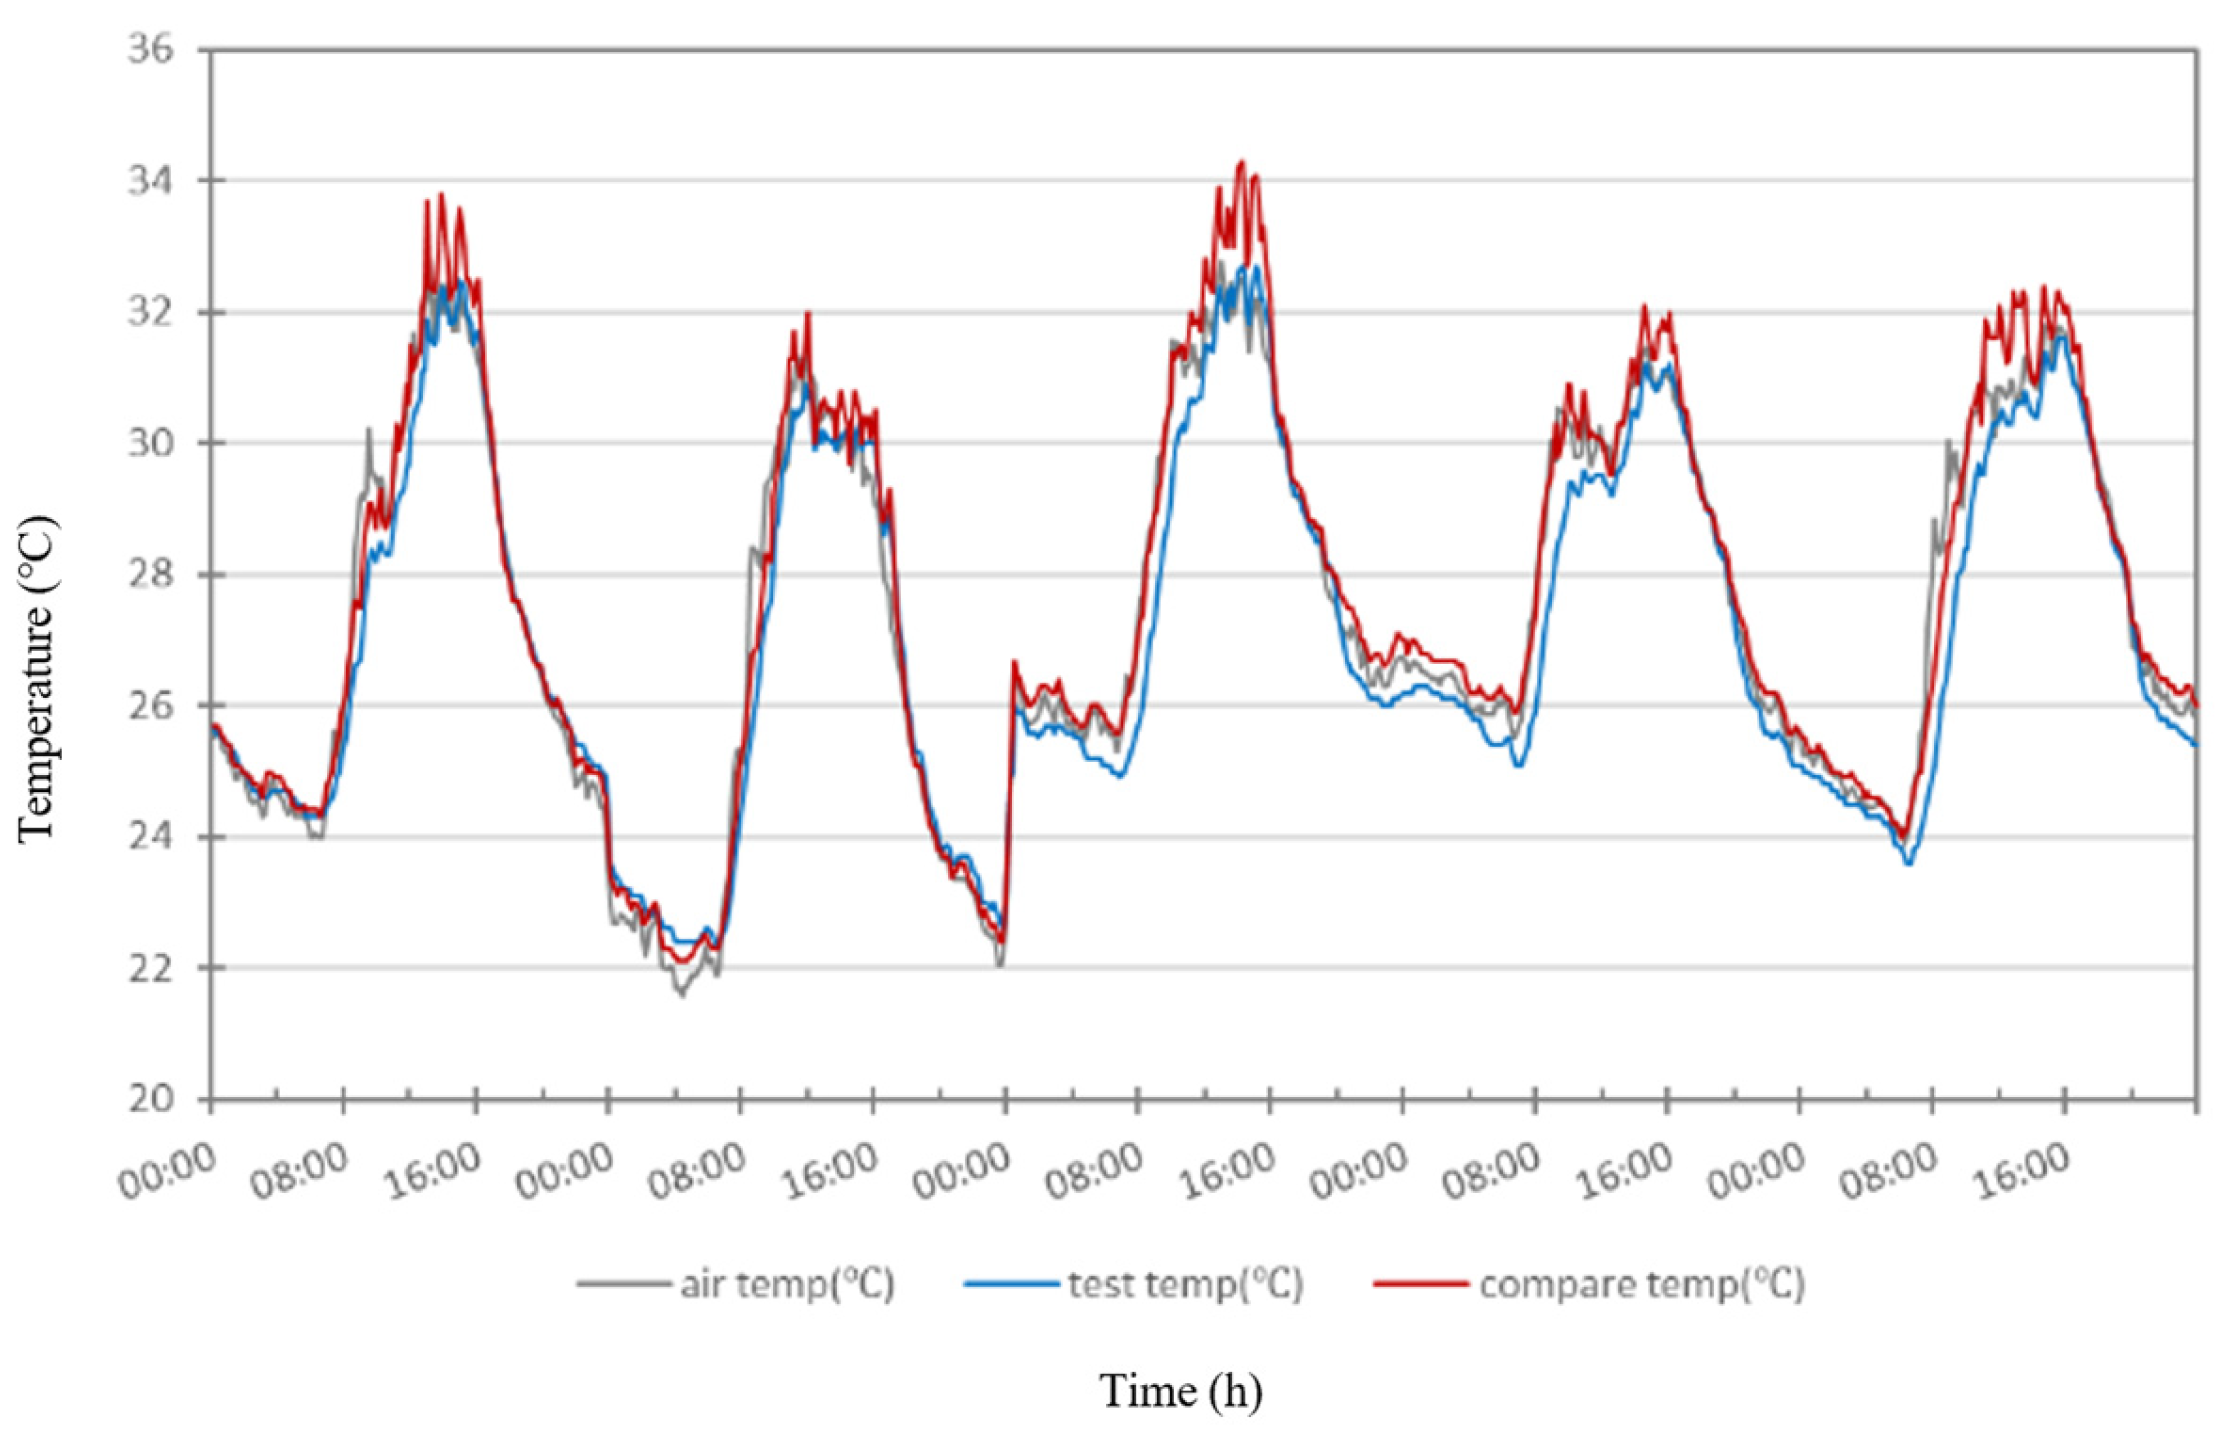
4.3.1. Temperature Variation and Solar Radiation Variation for VGS with Distance 100 cm and Opacity 70%

Figure 16 illustrates the temperature variations over a five-day period for the vertical green system with a 100 cm distance and 70% opacity. During the peak temperature period from 11:00 to 16:00 each day, the temperature differences among the three groups were not significant. The experimental group, with the vertical green system, and the environment monitoring station both show slightly lower temperatures compared to the control group, with a maximum difference of approximately 0.5–0.8 °C.
Figure 17 shows the solar radiation values over the same period. Solar radiation values began to rise around 06:00, corresponding to sunrise, and dropped to zero around 18:30 at sunset. Between 11:00 and 16:00, the time when solar radiation was at its peak, notable differences can be observed. The experimental group, which had the vertical green system, experienced solar radiation values ranging between 100 and 200 W/m2. During noon, around 12:00, the solar radiation in the experimental group briefly spiked, which was more pronounced compared to the vertical green system at 50 cm distance. This was due to the 100 cm gap between the vertical green system and the building, allowing more direct sunlight to penetrate the system at midday.

4.3.2. Vertical Green System at 100 cm Distance and 70% Opacity: Temperature Variation Between Experimental and Control Groups

Daily Temperature Variation in the Experimental and Control Groups
Table 3 highlights that the most significant temperature differences between the experimental and control groups occurred from 08:00 a.m. to 04:00 p.m., with the experimental group’s indoor temperature being 4–6.3 °C lower than that of the control group. During this period, the minimum temperatures in the experimental group were also 3.25–4.45 °C lower. From 09:00 a.m. to 03:00 p.m., the average maximum temperature difference exceeded 5.89 °C. In contrast, without rooftop green cover or vertical greening, the control group experienced internal temperature differences up to approximately 2.7 °C. The temperature discrepancy between the experimental and control groups was pronounced from 09:00 a.m. until 06:00 p.m., after which the temperatures started to converge. This indicates the vertical greening system’s effectiveness in mitigating indoor temperature increases. At 07:00 a.m., the experimental group’s temperature was occasionally higher than that of the control group due to the rapid heat dissipation of the building’s corrugated iron exterior. The vertical greening system moderated these fluctuations, leading to higher temperatures in the experimental group before sunrise and after sunset.
Figure 18 illustrates that the indoor temperature distribution simulation charts show significant differences between the experimental and control groups starting from 08:00 a.m., with these differences persisting until after 06:00 p.m., when temperatures began to stabilize. During peak temperature periods from 11:00 a.m. to 03:00 p.m., the control group exhibited higher color temperatures and a clear vertical gradient of heat transfer from the top to the bottom of the building. By 12:00 p.m., the top temperature reached 40.3 °C, while the bottom temperature was 38.1 °C, resulting in a 2.2 °C difference. Conversely, the temperature distribution in the experimental group remained more uniform, with minimal variations—only a 1.1 °C difference at 09:00 a.m. and brief heat accumulation of up to 1 °C between 01:00 p.m. and 03:00 p.m.. The vertical greening system in the experimental group contributed to more stable indoor temperature and reduced heat accumulation. After 05:00 p.m., temperatures in both groups became indistinguishable. Comparing simulations for vertical greening with a 100 cm coverage rate of less than 70% versus higher coverage rates shows that while temperature variations and peak temperatures remained consistent, higher coverage rates provided more uniform temperatures due to increased shading.

4.4. Vertical Green System at 100 cm Distance and 95% Opacity

4.4.1. Temperature Variation and Solar Radiation Variation for VGS with Distance 100 cm and Opacity 95%

Figure 19 shows the temperature variations over a five-day period for the vertical green system with a 100 cm distance and 95% opacity. During the peak temperature period from 11:00 to 16:00 each day, the control group exhibited the highest temperatures among the three groups. The experimental group’s temperatures were closer to the environmental temperature and were slightly lower, with a maximum temperature difference of 0.5–2.1 °C compared to the control group. Figure 20 illustrates the solar radiation values over the same period. Solar radiation values began to rise around 06:00, with peak radiation occurring between 12:00 and 16:00, reaching up to 720–896 W/m2. The vertical green system with over 95% opacity effectively reduced solar radiation to a maximum of 3.7–38 W/m2. During noon, around 12:00, there was a brief spike in solar radiation in the experimental group due to the 100 cm gap between the green system and the building, which allowed more direct sunlight to penetrate. Figure 21 depicts surface temperature changes over five days. Surface temperatures started to rise from 08:00 and increased more noticeably after 12:00, reaching their peak by 16:00. The control group’s wall surface temperature averaged 55 °C, with a maximum of 63 °C. In contrast, the experimental group’s wall surface temperature, along with the temperature recorded at the environment monitoring station and the vertical green system surface, showed a temperature difference ranging from 15 to 28.1 °C. During this period, the vertical green system surface temperature remained between 35 and 48 °C, while the western wall of the experimental building maintained a temperature between 33 and 35 °C. This indicates the effective heat insulation provided by the vertical green system.
In summary, the vertical green system at a 100 cm distance with 95% opacity demonstrates a significant cooling effect by reducing both surface temperatures and solar radiation exposure compared to the control group.

4.4.2. Vertical Green System at 100 cm Distance and 95% Opacity: Temperature Variation Between Experimental and Control Groups

Daily Temperature Variation in the Experimental and Control Groups
Table 4 reveals that the most pronounced temperature differences between the experimental and control groups occurred from 08:00 a.m. to 04:00 p.m.. During this period, the experimental group’s indoor temperatures were consistently 4–6.3 °C lower than those in the control group. The minimum temperatures in the experimental group during this period were also 3.25–4.45 °C lower. From 09:00 a.m. to 03:00 p.m., the average maximum temperature difference exceeded 5.89 °C. In contrast, the control group’s temperatures, without any rooftop or vertical greening, showed internal differences up to approximately 2.7 °C. After 09:00 a.m., the temperature discrepancy between the groups was significant and persisted until 06:00 p.m., indicating that the vertical greening system effectively moderates indoor temperature increases. However, at 07:00 a.m., the experimental group’s temperatures could be higher than those of the control group due to the rapid heat dissipation of the building’s corrugated iron material. Despite this, the vertical greening system reduced overall temperature fluctuations, resulting in higher temperatures in the experimental group before sunrise and after sunset compared to the control group.
Figure 22 illustrates the indoor temperature variations on the western side of the building for both groups throughout the day. From 08:00 a.m., a noticeable temperature difference becomes evident, lasting until 06:00 p.m.. The control group exhibits a significantly faster temperature increase, with a consistent temperature difference of approximately 2 °C throughout the day. During peak temperature hours from 12:00 p.m. to 04:00 p.m., the control group shows higher temperatures compared to the experimental group. For example, at 12:00 p.m., the temperature at the top of the control group’s building reaches 41.3 °C, while the bottom registers 38.4 °C, showing a 2.9 °C variation. Conversely, the experimental group maintains a more uniform temperature distribution, with minimal variations—only 0.6 °C at 11:00 a.m. and a brief 1 °C difference during the peak period from 01:00 p.m. to 03:00 p.m.. This uniformity underscores the vertical greening system’s effectiveness in stabilizing indoor temperatures and mitigating extreme fluctuations compared to the control group.

4.5. Vertical Green System Statistical Analysis

To accurately assess the effectiveness of various vertical green systems (VGSs) on buildings under different conditions, we employed a statistical analysis focusing on confidence intervals. This analysis compares the temperature distributions of different VGS configurations under similar environmental conditions (full sunlight, no rain, and approximately 33 °C daily temperature) over a five-day period. We examined the highest temperatures recorded during five distinct time periods to determine which VGS configuration provides the best benefits.

4.5.1. Statistical Analysis of Air Temperature

Based on the statistical analysis results from Table 1, Table 2, Table 3 and Table 4, Table 5 summarizes the temperature ranges, medians, Wilcoxon Signed-Rank Test results, p-values, and statistical conclusions for the different experimental and control group scenarios.
The Wilcoxon Signed-Rank Test results for all conditions show p-values significantly less than 0.05, leading to the rejection of the Null Hypothesis (H0). This confirms that the experimental group with the greening system significantly differs from the control group, demonstrating the system’s effectiveness in reducing temperature differences around the building surfaces.
This study further conducted a median analysis using a statistical 2 × 2 table, and the results are shown in Table 6.
From the table, it can be seen that distance has a relatively minor effect on cooling performance, whether at the shorter experimental distance of 50 cm or the longer distance of 100 cm. Under both opacity conditions (70% and 95%), changes in distance did not show significant differences in cooling effects. This indicates that opacity plays a much more dominant role in regulating indoor temperature compared to distance. Particularly under the 70% opacity condition, regardless of whether the distance is 50 cm or 100 cm, the temperature difference between the experimental and control groups is relatively significant, reflecting the enhanced cooling effect of lower opacity.

4.5.2. Discussion Based on the Statistical Analysis

The analysis of the maximum temperature differences across various configurations of the greening system revealed valuable insights:
  • At 50 cm distance and 70% opacity: This configuration demonstrated the smallest maximum temperature difference of 9.39 °C, indicating significant cooling effects with a narrower temperature range compared to the other setups.
  • At 50 cm distance and 95% opacity: The maximum temperature difference increased to 13.21 °C, but the cooling effect remained notable. However, the temperature range was larger than in the 70% opacity configuration.
  • At 100 cm distance and 70% opacity: This setup had a maximum temperature difference of 13.42 °C, demonstrating good cooling effects, although it showed slightly lower efficiency compared to the 50 cm distance configurations.
  • At 100 cm distance and 95% opacity: With the highest maximum temperature difference of 15.20 °C, this scheme displayed the greatest temperature variation, but it still provided significant cooling.
The statistical tests confirmed the effectiveness of the greening system in all conditions. The p-values were significantly lower than 0.05 across all setups, confirming that the temperature differences between the experimental and control groups were statistically significant: 1. 50 cm distance and 70% opacity: p = 1.05 × 10⁻⁴; 2. 50 cm distance and 95% opacity: p = 5.96 × 10⁻⁷; 3.100 cm distance and 70% opacity: p = 2.38 × 10⁻⁷; 4.100 cm distance and 95% opacity: p = 2.38 × 10⁻⁷.
In terms of determining the best configuration:
  • At 50 cm distance and 70% opacity: This setup exhibited the smallest maximum temperature difference (9.39 °C) and notable cooling effects. However, the median temperature of 31.25 °C was higher than that of other configurations, suggesting a slightly weaker overall cooling performance.
  • At 50 cm distance and 95% opacity: Despite the higher maximum temperature difference of 13.21 °C, this configuration achieved the most significant cooling effect, with a median temperature of 33.41 °C, making it the best overall choice.
  • At 100 cm distance and 70% opacity: With a maximum temperature difference of 13.42 °C, this setup provided a cooling effect that was slightly less effective than the 50 cm distance and 95% opacity setup.
  • At 100 cm distance and 95% opacity: This configuration, with the highest maximum temperature difference (15.20 °C), showed the largest temperature spread but had the weakest cooling performance compared to the other options.
Thus, the 50 cm distance and 95% opacity configuration emerged as the most effective option for optimizing the cooling benefits of the greening system, while still maintaining a balance between temperature reduction and system efficiency.

5. Conclusions

This study evaluated the impact of vertical green systems (VGSs) on building temperature regulation by simulating two types of buildings: a control building, which retained its original design, and an experimental building equipped with VGSs. The VGSs varied in distance (50 cm and 100 cm) from the building and shading density (70% and 95%). The experiments were conducted under full sunlight and no precipitation conditions, with an average daily temperature of around 33 °C. The following conclusions were drawn.

5.1. Ambient Influence

(1)
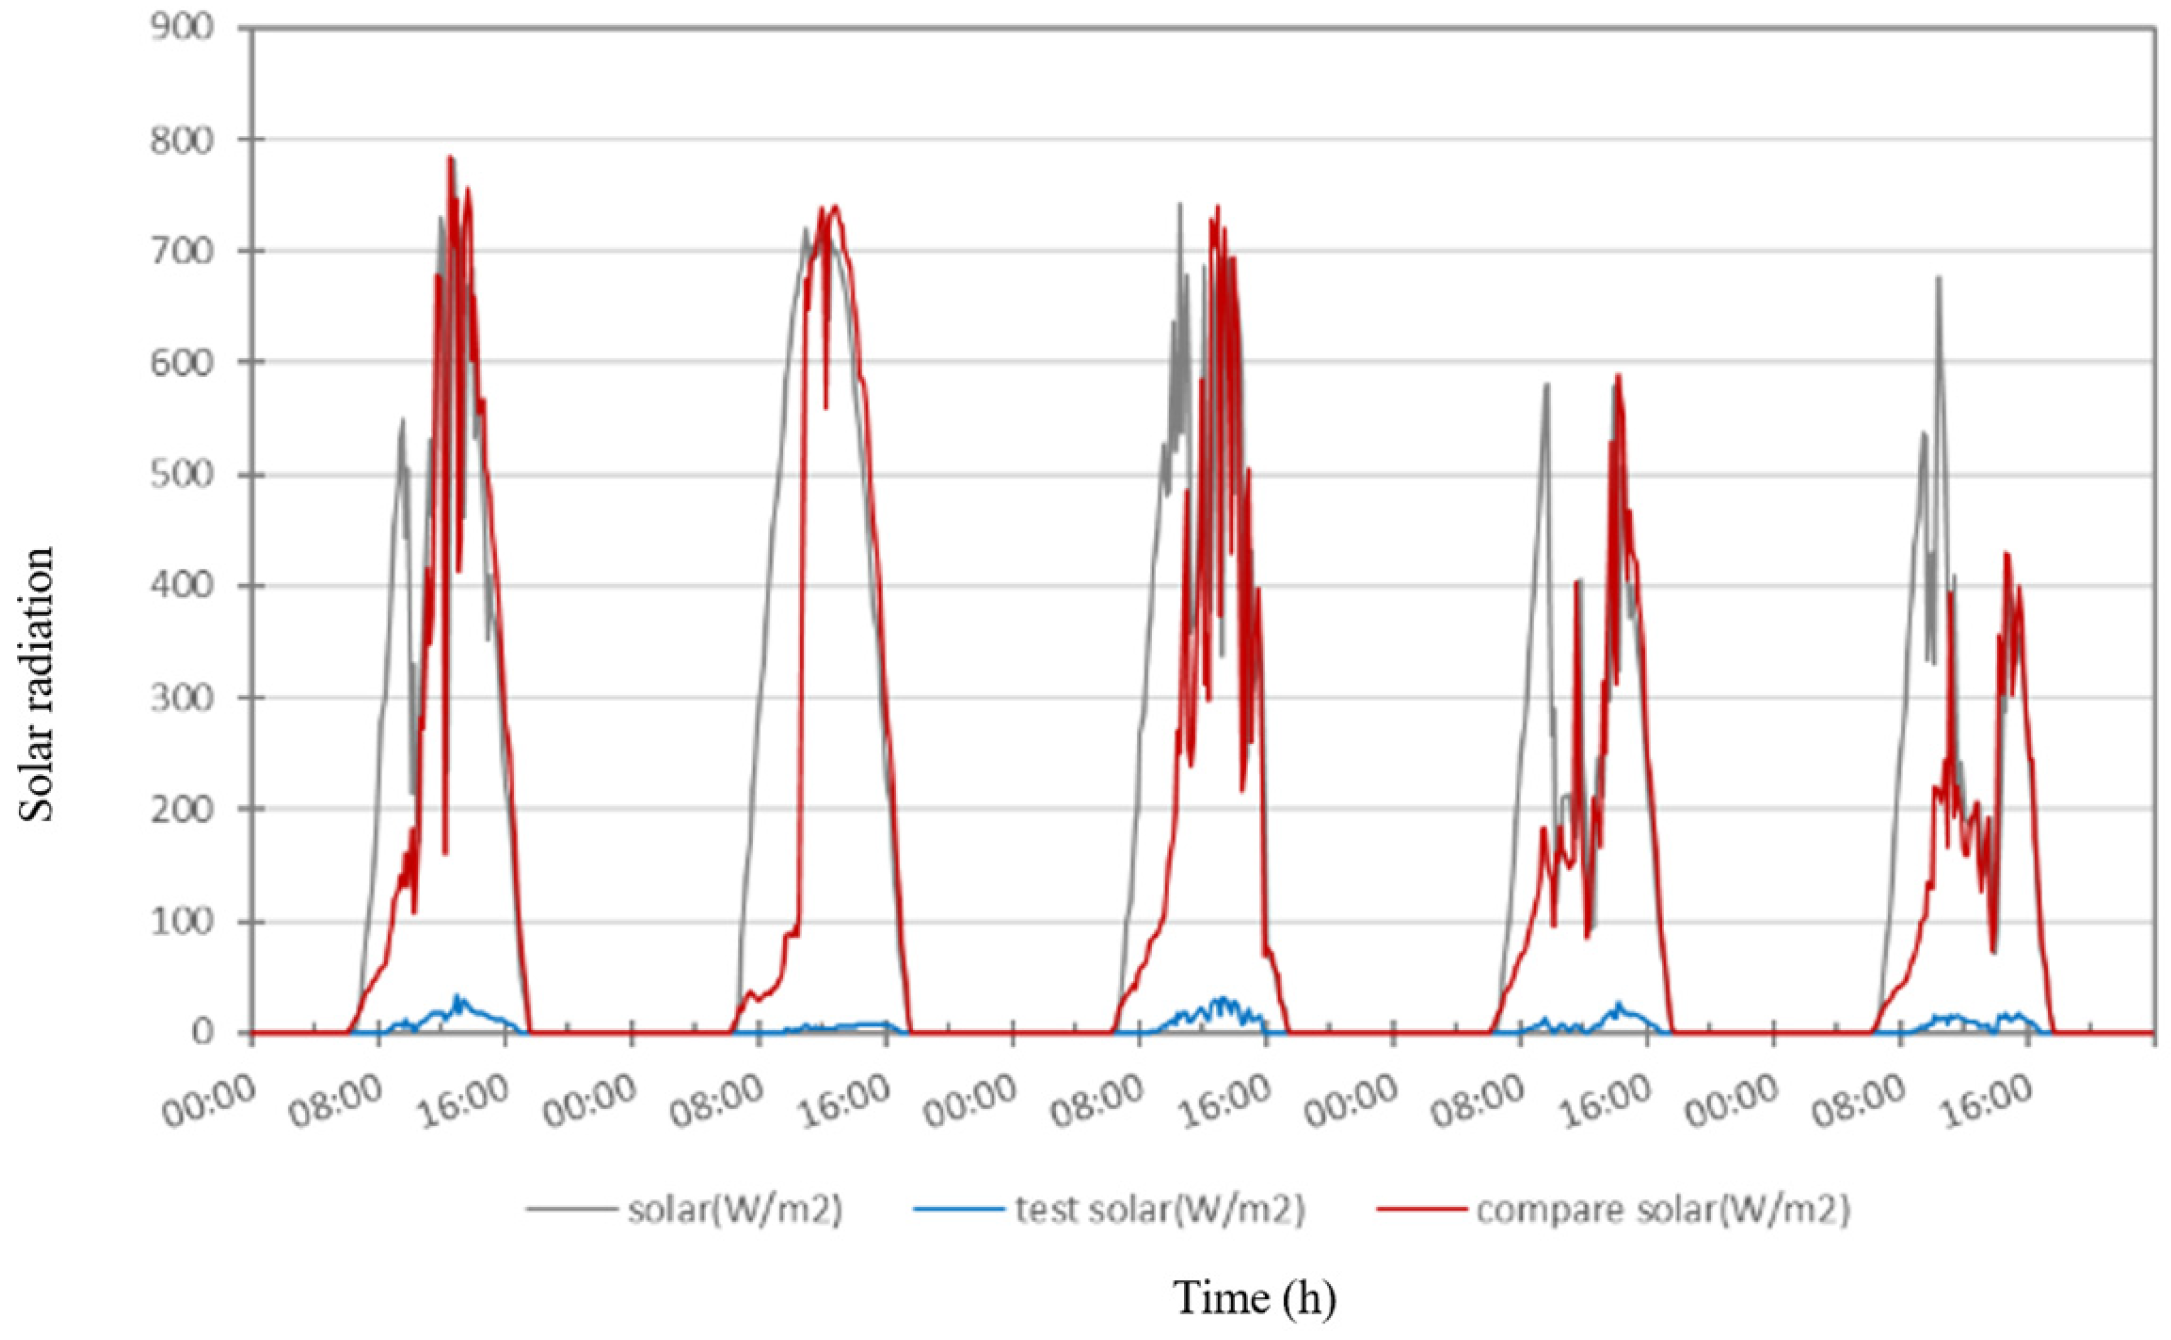
Effectiveness of Shading: Vertical green systems (VGSs) are effective in reducing solar radiation. With a shading rate of 70%, the solar radiation dropped to 100–200 W/m2. For shading rates of 95% or higher, the solar radiation was reduced to below 50 W/m2, regardless of whether the VGS was positioned 100 cm or 50 cm from the building.
(2)
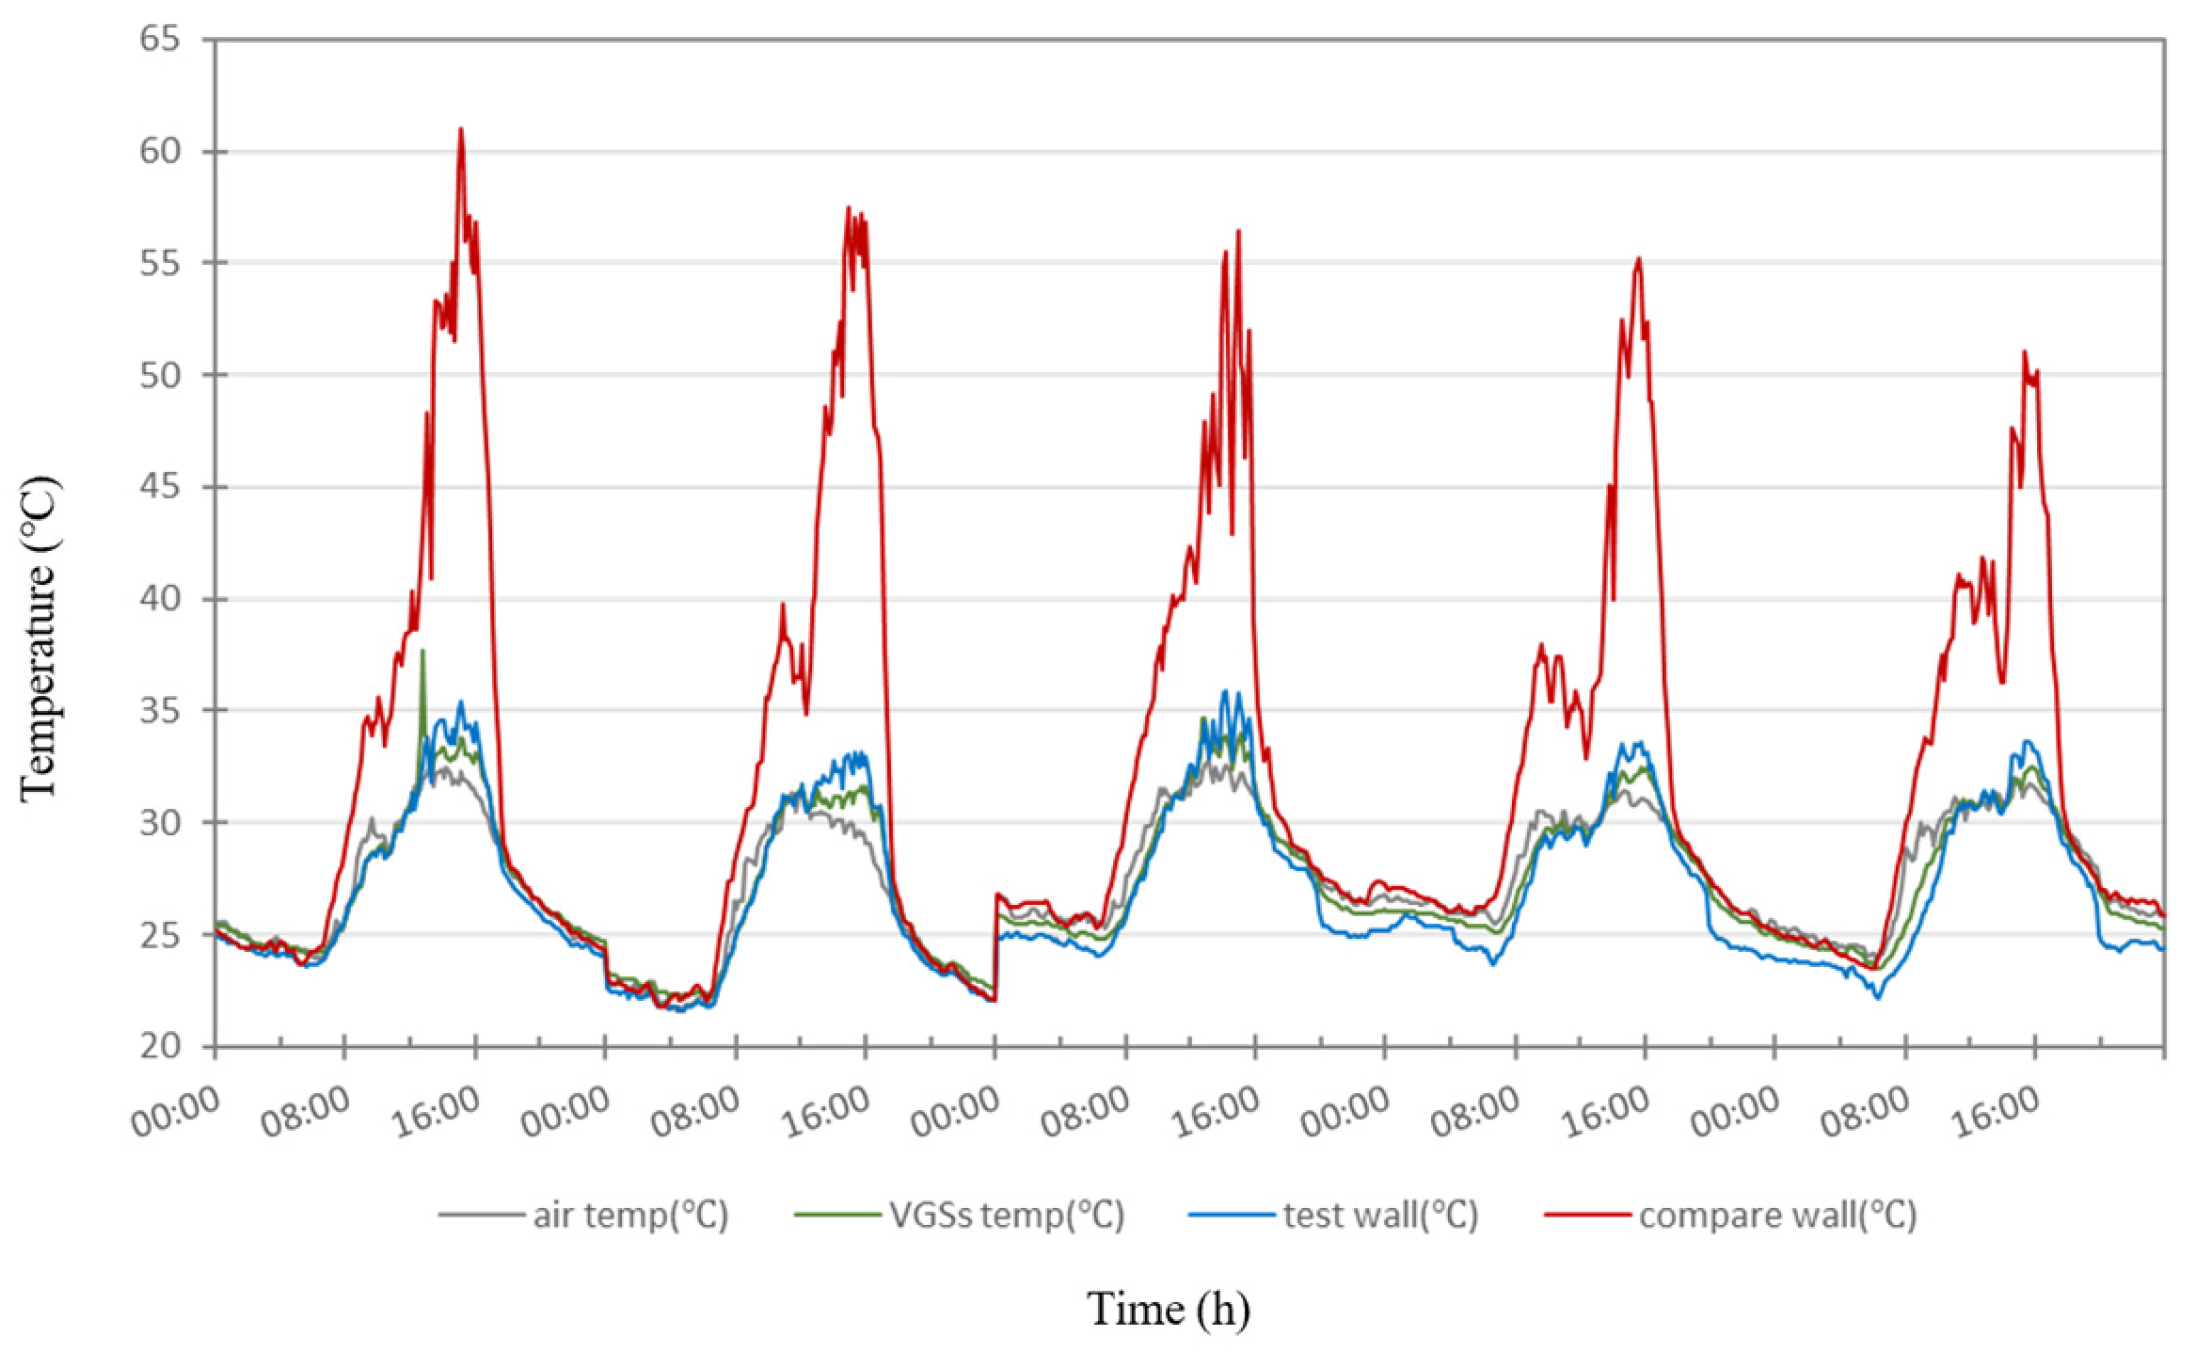
Temperature Reduction: Higher shading density enhances temperature control. Between 13:00 and 16:00, during peak sunlight, the temperature inside a VGS with a 70% shading rate was about 0.5–0.8 °C lower compared to the control. When the shading rate reached 95% or higher, the temperature inside the VGS was reduced by 0.5–2.1 °C compared to the control without any VGS.
(3)
Statistical Analysis: Figure 20 and Figure 21 reveal that while VGSs offer thermal insulation benefits, their effectiveness varies and is not consistently stable under different conditions. The performance of VGSs demonstrated variability and was not uniformly significant.

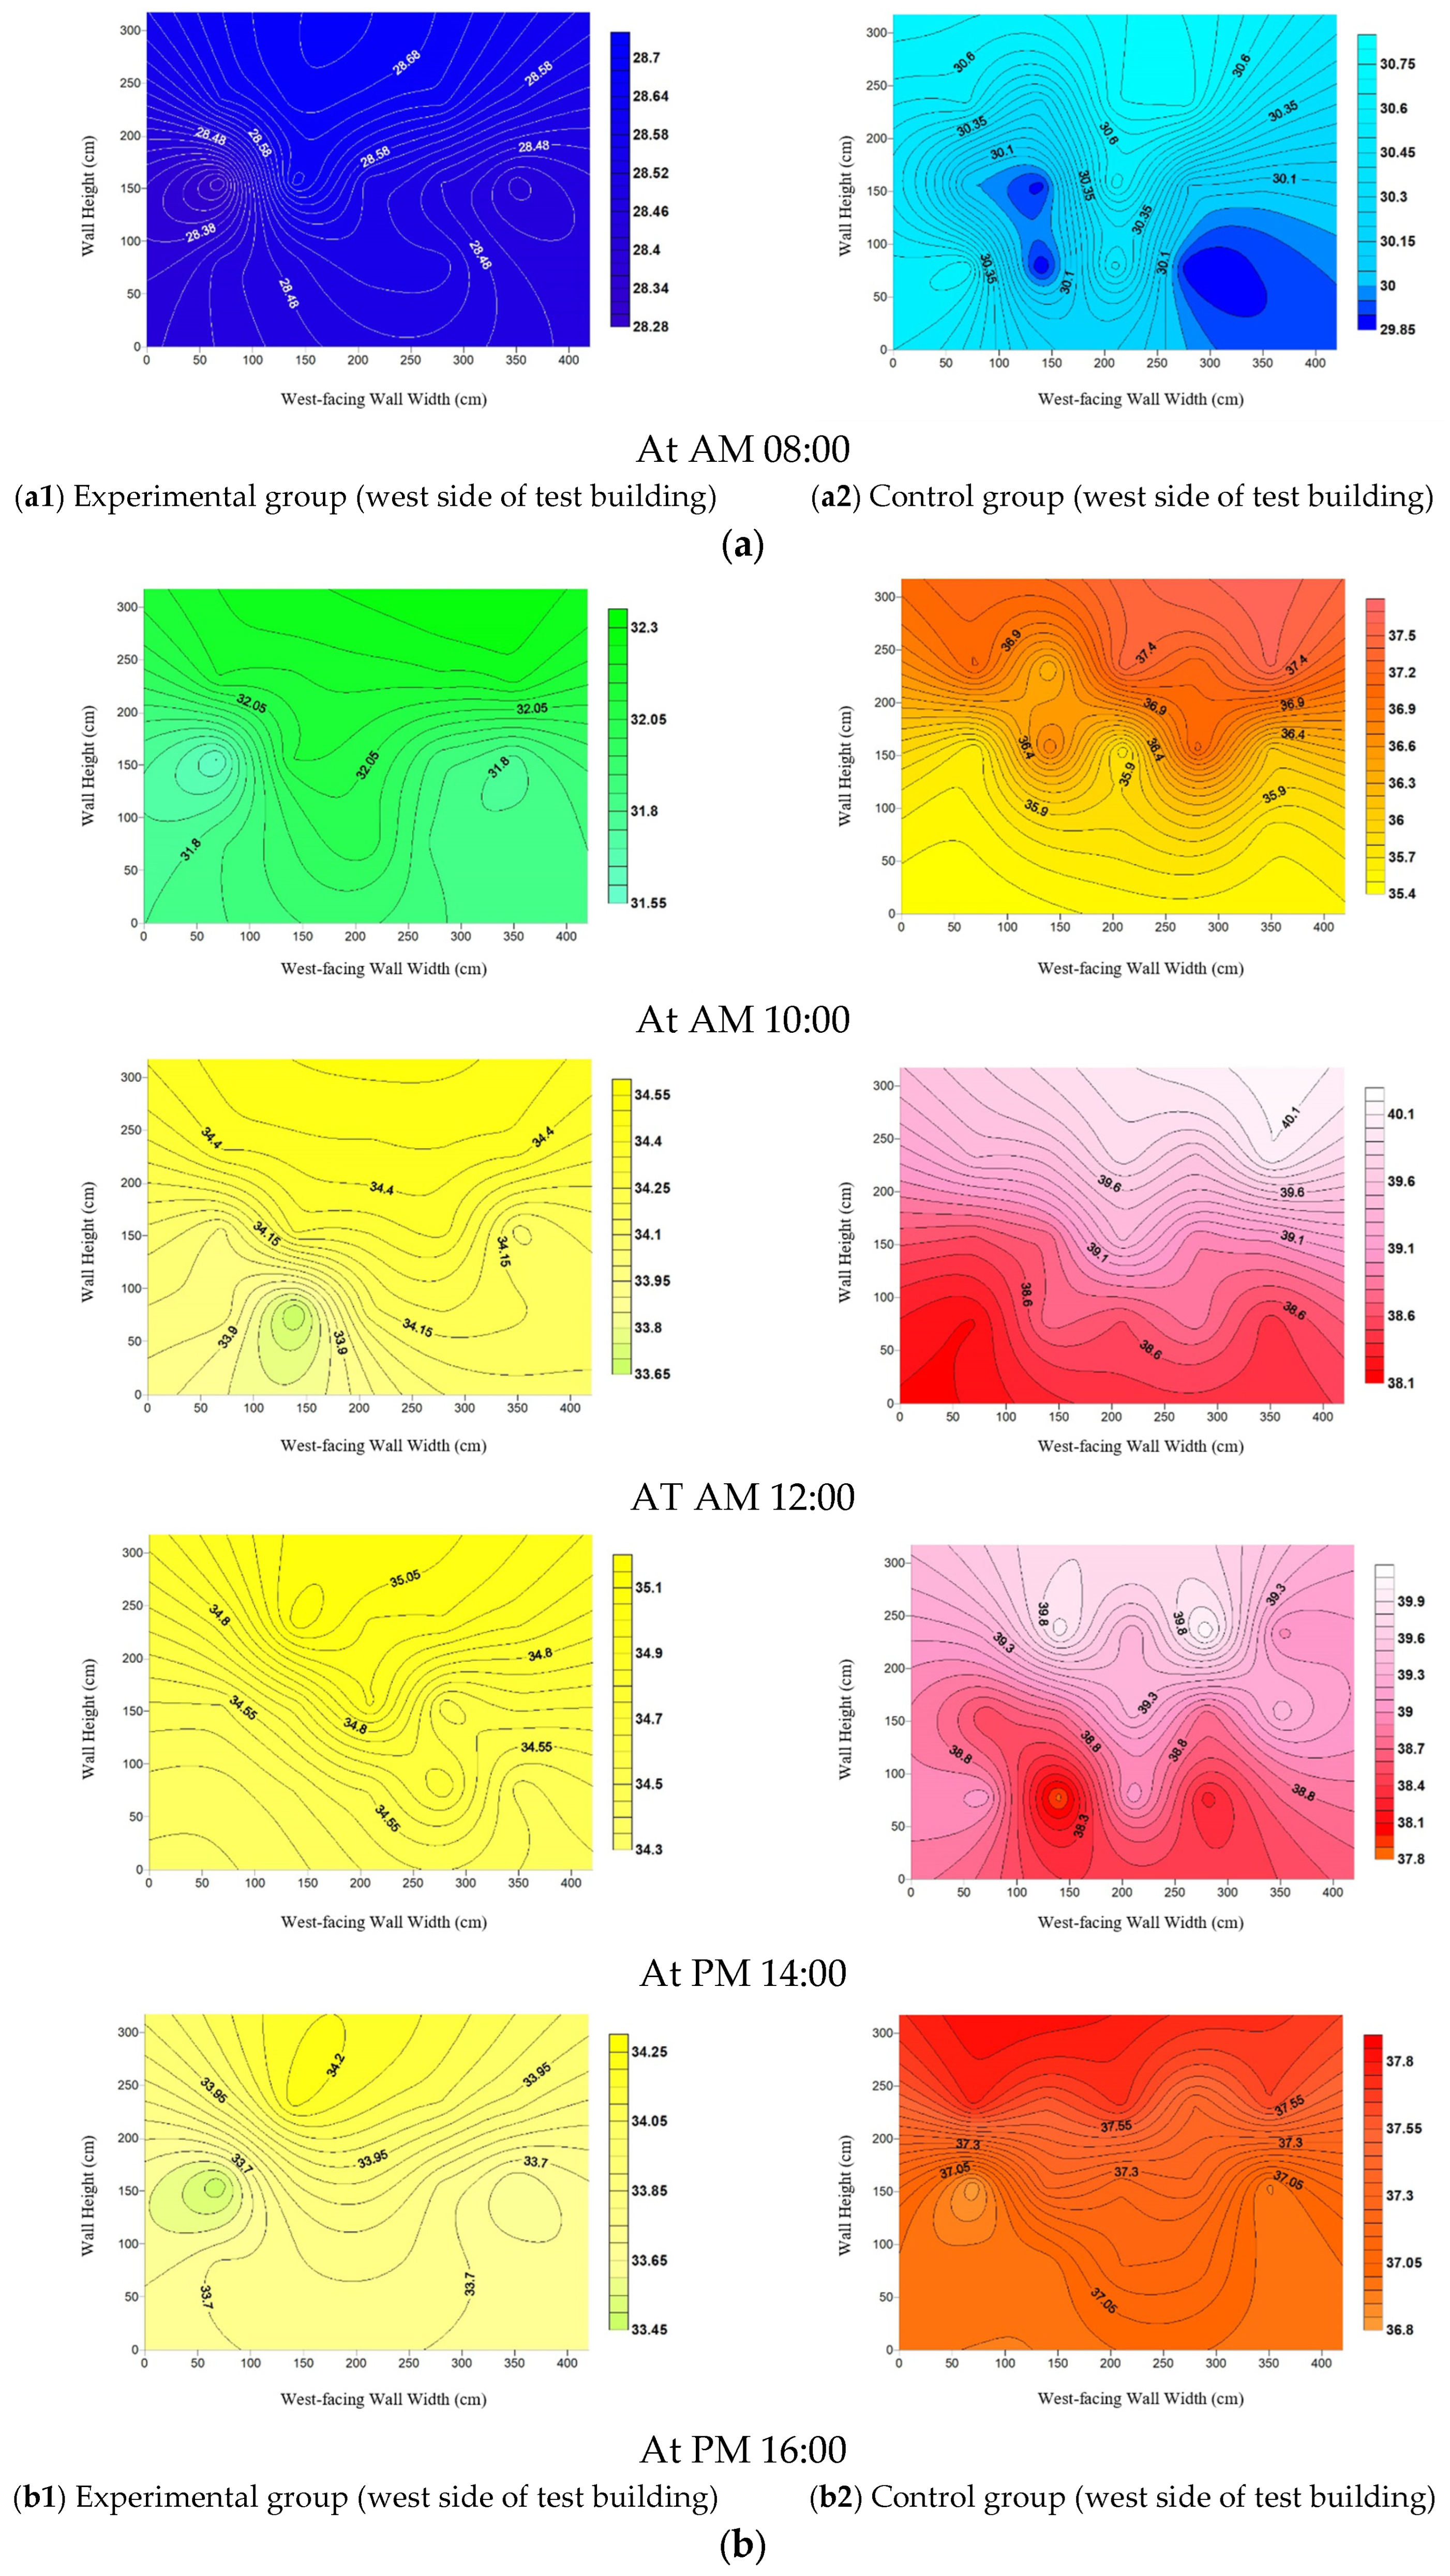
5.2. Surface Temperature

(1)
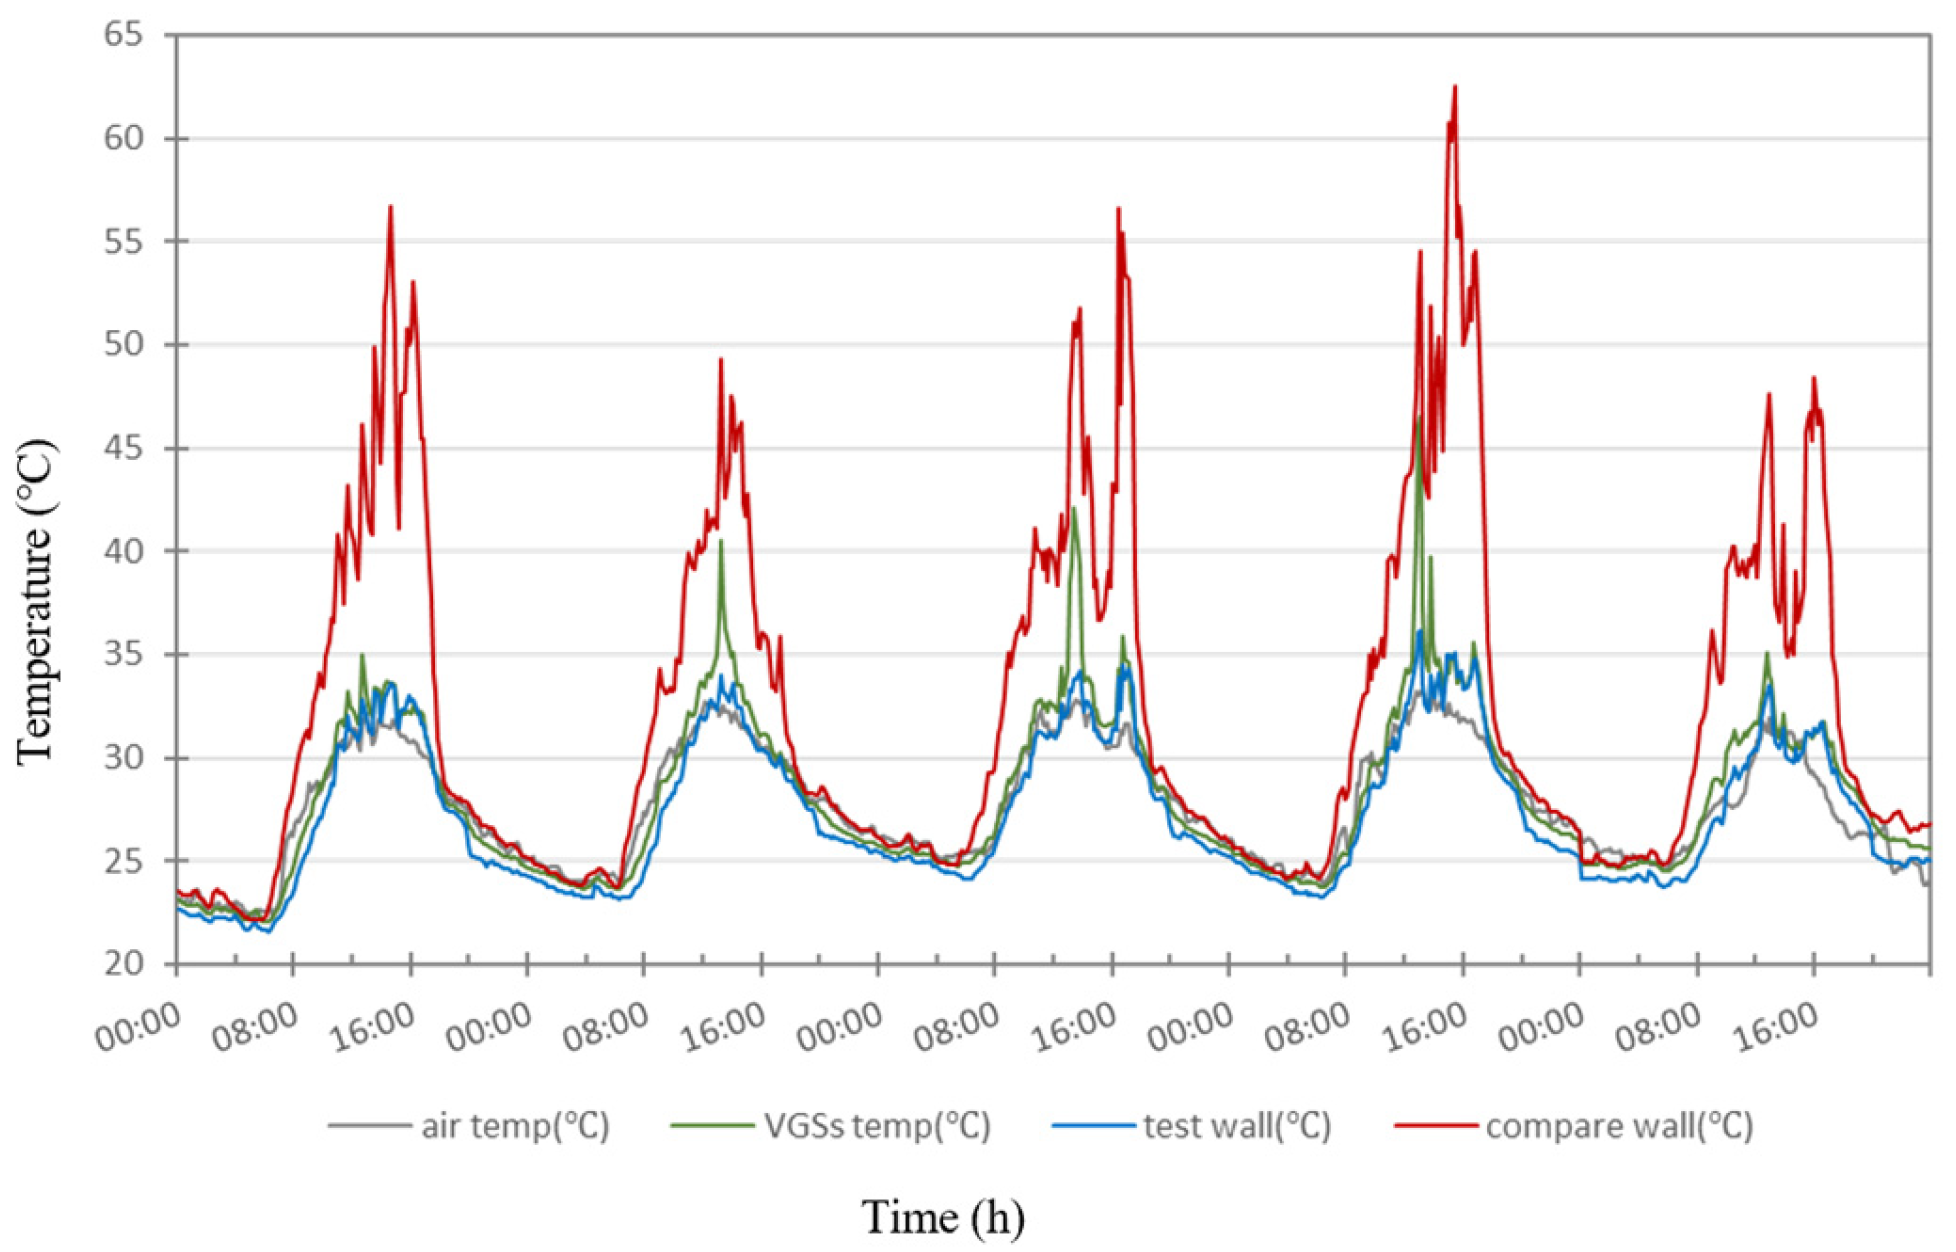
Temperature Reduction: A vertical green system (VGS) with a shading rate of 95% significantly reduced surface temperatures during peak sun hours (13:00–16:00). Walls with this VGS configuration had surface temperatures averaging 5–12 °C lower than those of control walls, with temperature differences ranging from 10 to 31 °C.
(2)
Distance from Wall: Analysis shows that a VGS positioned 100 cm from the wall was more effective than one positioned 50 cm away. During peak hours, the 100 cm distance effectively blocked more solar heat from reaching the wall, providing a clear advantage over the 50 cm distance, particularly between 14:00 and 16:00.

5.3. Interior Temperature

(1)
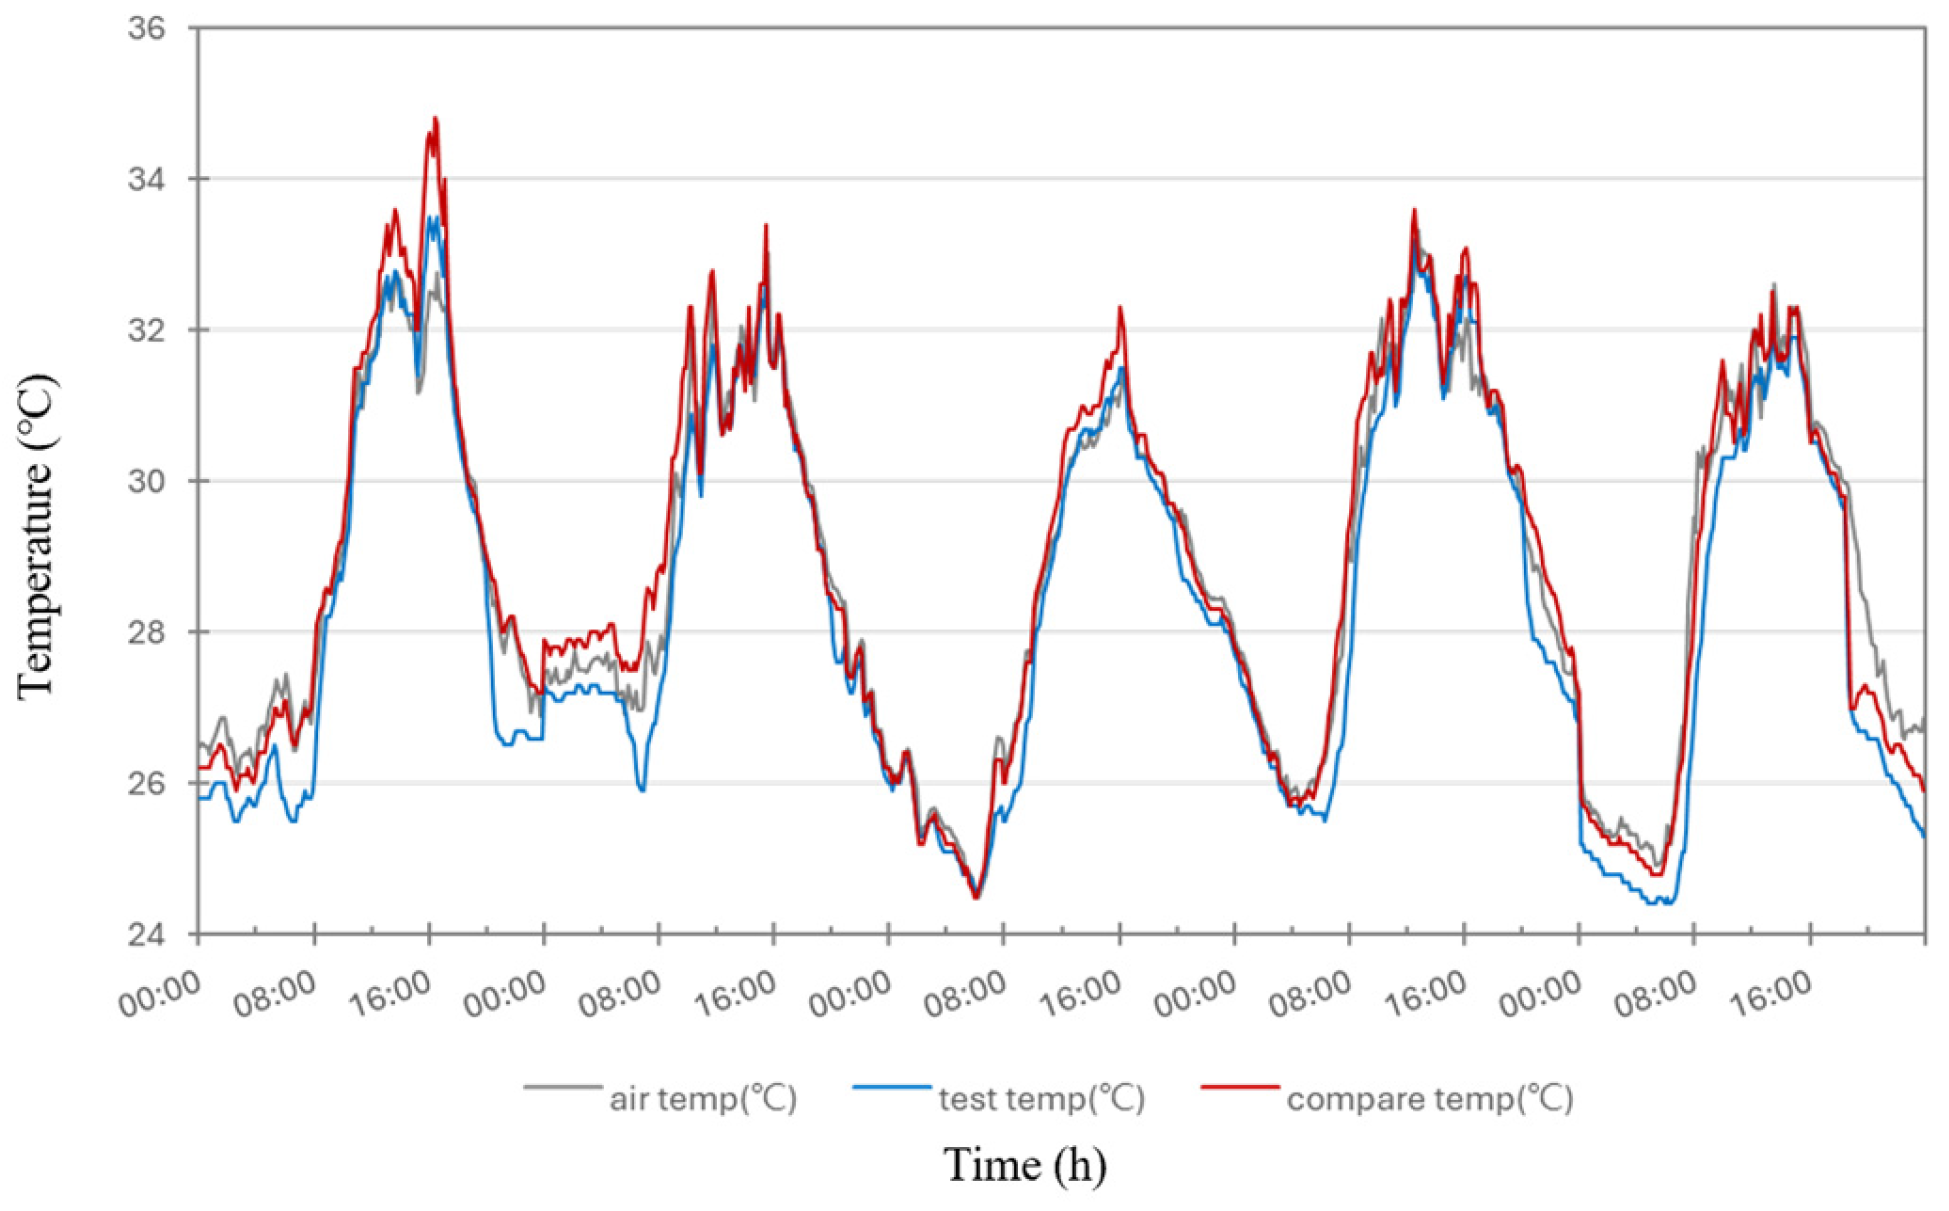
Temperature Difference: The most significant temperature difference between the experimental and control groups occurred with a VGS positioned 100 cm away from the wall and a shading rate of 95%, reaching up to 6.3 °C. Typically, with 95% shading, the temperature difference was around 4–5 °C, whereas with a 70% shading rate, it averaged 2–3 °C.
(2)
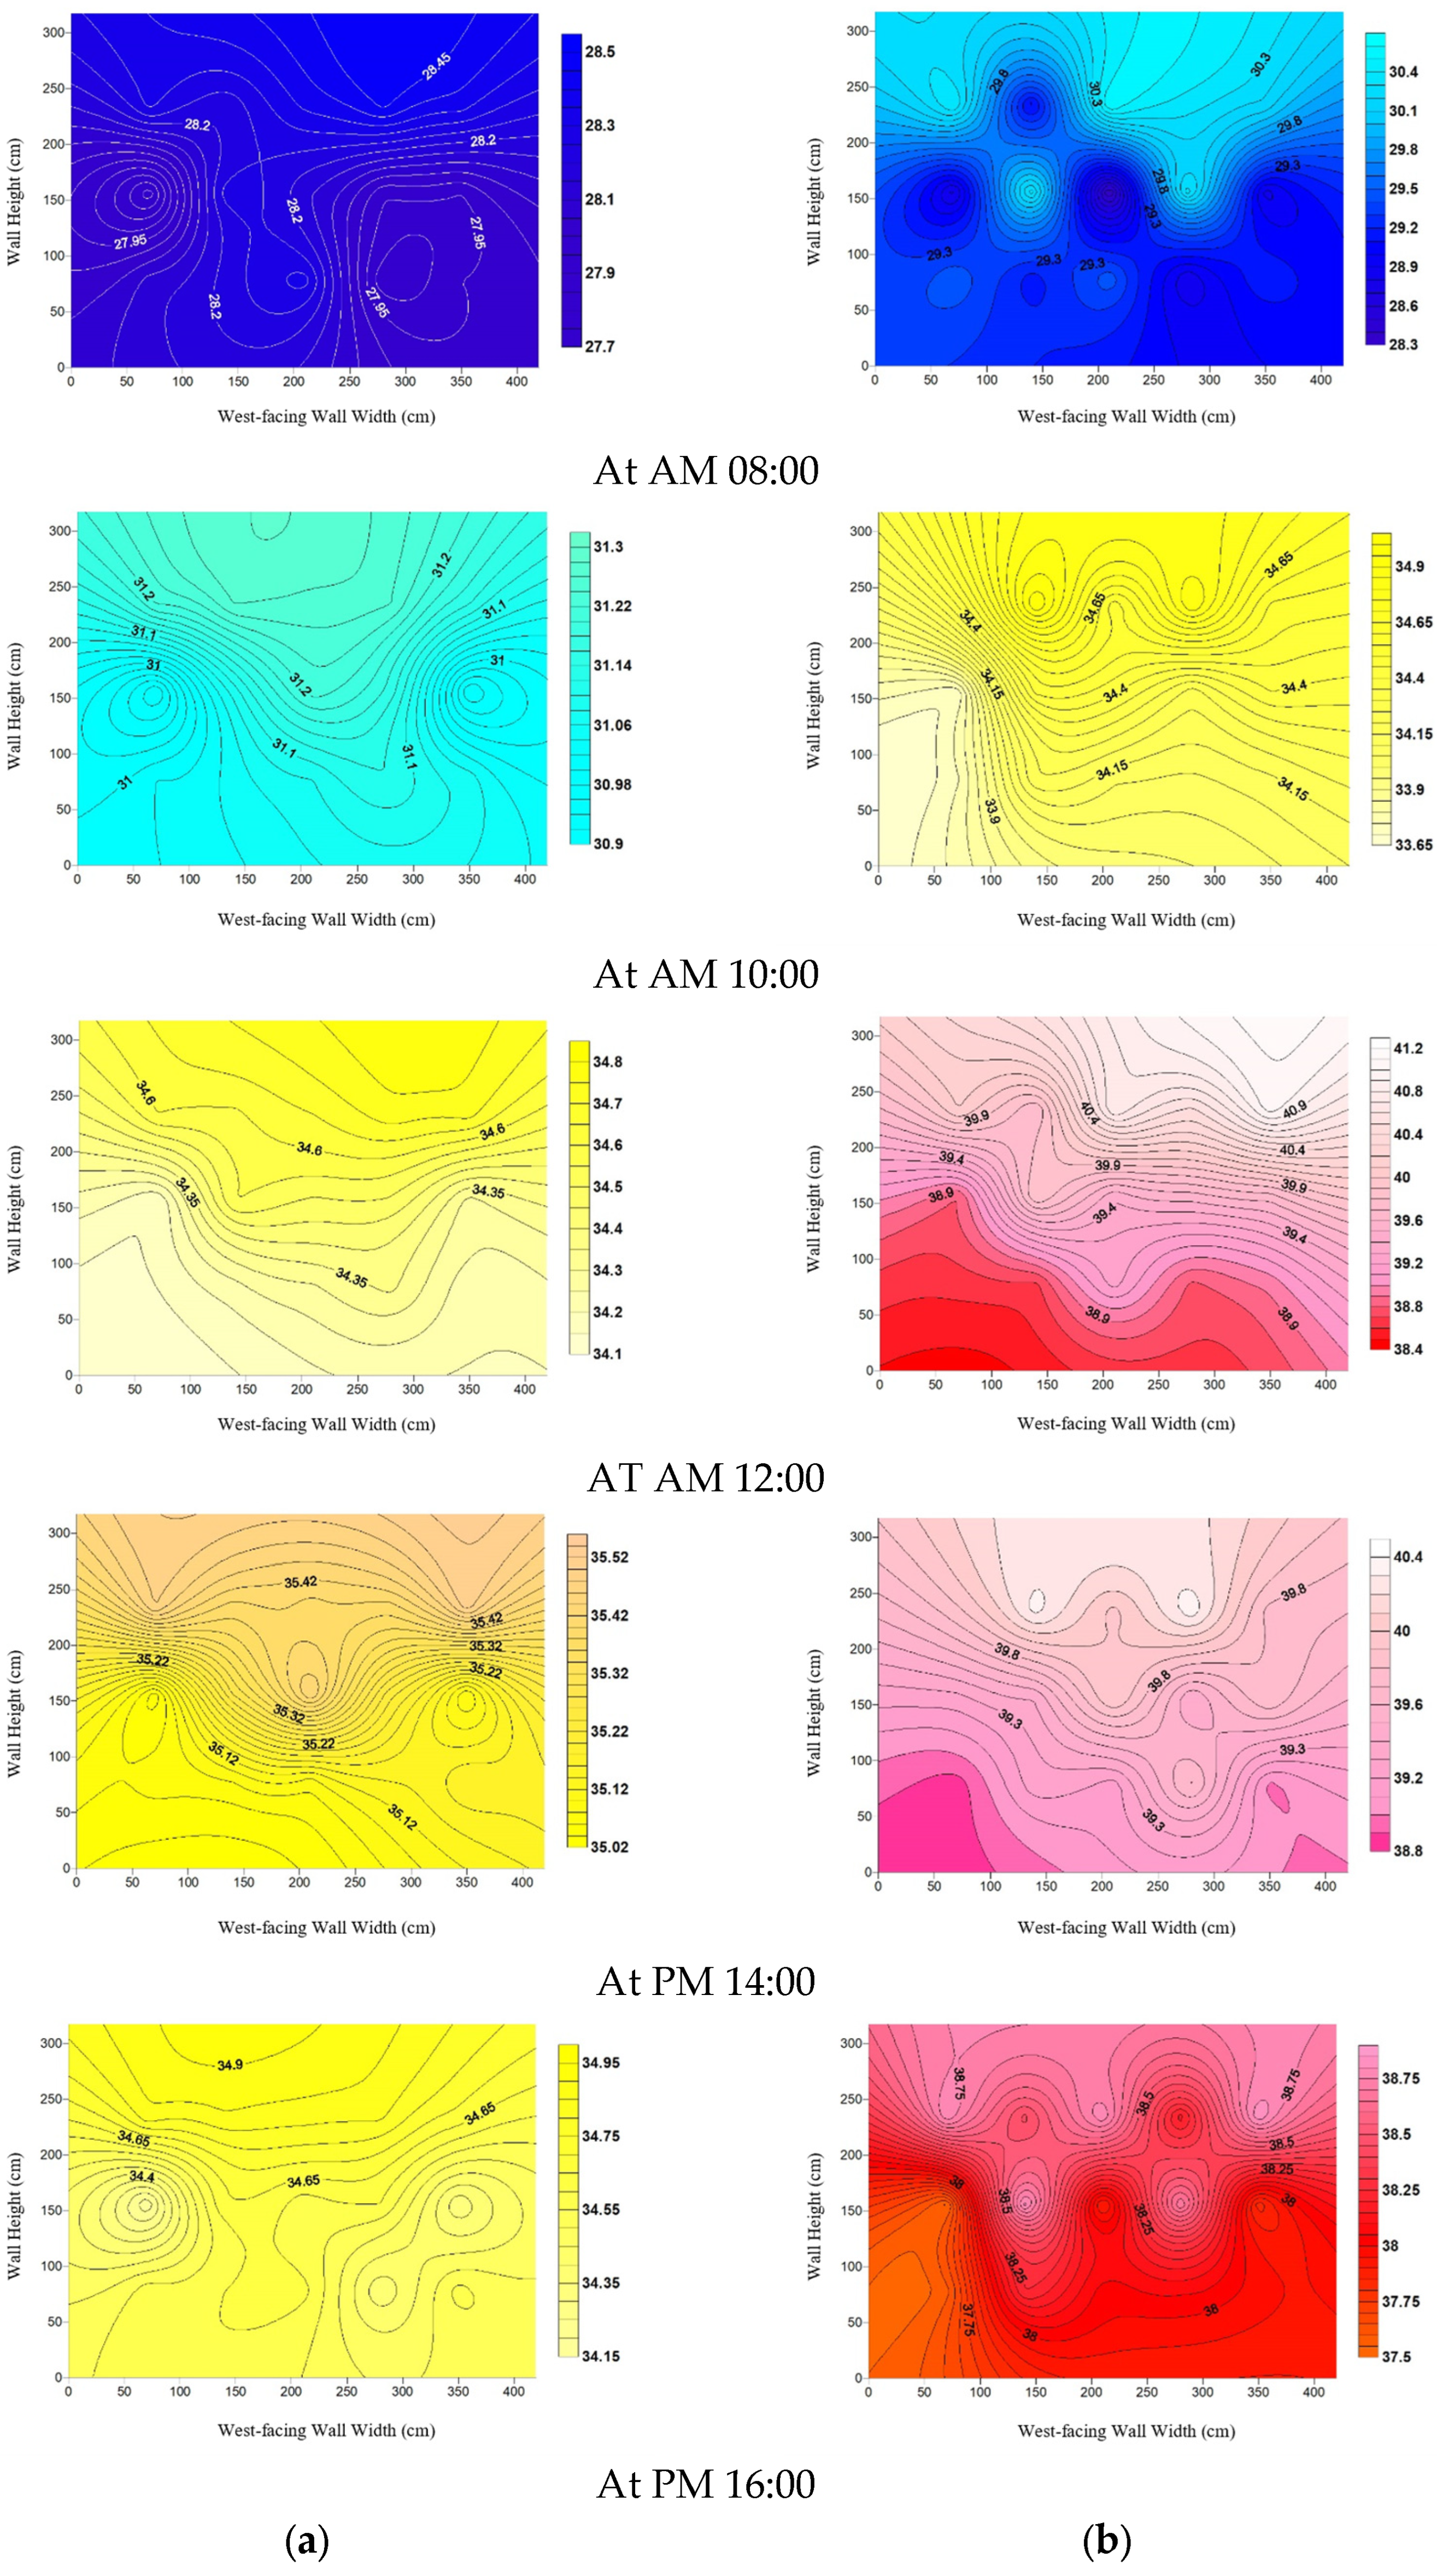
Temperature Stability: Simulation results using Surfer 8.0 demonstrated that the VGS effectively reduced temperature fluctuations, maintaining a more stable interior temperature. The VGS setup showed a variation of within 1 °C, while the control group experienced nearly 4 °C of variation during peak times.
(3)
The statistical analysis reveals that while changes in distance (such as between 50 cm and 100 cm with 95% opacity) slightly enhance the cooling effects, the 50 cm distance with 95% opacity still yields the best overall cooling performance. This finding suggests that, when designing vertical green systems, carefully selecting the optimal combination of shading rate (e.g., 95% opacity) and distance (e.g., 50 cm) can achieve the most effective temperature regulation, particularly in reducing solar radiation and improving indoor temperature stability.
(4)
The study then investigates the effects of the shading rate and distance of vertical green systems on indoor cooling performance, employing a detailed 2 × 2 experimental design. The results show that opacity is the key factor influencing cooling performance, with 70% opacity outperforming 95% opacity in cooling effectiveness. Specifically, under both 50 cm and 100 cm distance conditions, the 70% opacity group demonstrates significant cooling benefits, as indicated by a higher temperature difference. However, variations in distance have a relatively minor impact on cooling performance. In both opacity conditions (70% and 95%), changes in distance from 50 cm to 100 cm produce limited effects on indoor temperature, underscoring the dominant role of opacity in regulating cooling performance.
In conclusion, the cooling effect of vertical green systems is primarily influenced by opacity. While the contribution of distance to cooling performance is less significant compared to opacity, it still provides some benefit in certain design schemes. Therefore, future greening designs should choose the most suitable shading rate and distance configuration based on specific application needs to achieve optimal cooling performance.

Author Contributions

Conceptualization, T.-Y.C. and W.-P.S.; methodology, T.-Y.C. and W.-P.S.; software, T.-Y.C.; formal analysis, C.-L.L.; data curation, T.-Y.C. and W.-P.S.; writing—original draft preparation, T.-Y.C. and W.-P.S.; writing—review and editing, T.-Y.C. and C.-L.L.; visualization, T.-Y.C. and W.-P.S.; project administration, W.-P.S.; funding acquisition, W.-P.S. All authors have read and agreed to the published version of the manuscript.

Funding

This research was funded by the Ministry of Science and Technology, Taiwan, under grant number NSC 106-2221-E-167-006.

Data Availability Statement

All data are available within the article and from the corresponding author upon request.

Conflicts of Interest

The authors declare no conflicts of interest.

References

  1. Collins, M.; Stocker, T.F.; Qin, D.; Plattner, G.K.; Tignor, M.M.B.; Allen, S.K.; Boschung, J.; Nauels, A.; Xia, Y.; Bex, V.; et al. Climate Change 2013: The Physical Science Basis. In Working Group I Contribution to the IPCC Fifth Assessment Report; Chapter 12: Long-Term Climate Change: Projections, Commitments and Irreversibility (Section 12.3.1.3); Cambridge University Press: Cambridge, UK, 2013; pp. 1045–1047. [Google Scholar]
  2. Tamzi, A. The UN Convention on International Watercourses as a Framework for Avoidance and Settlement of Waterlaw Disputes. Leiden J. Int. Law 1998, 11, 441–473. [Google Scholar] [CrossRef]
  3. Gupta, J. Leadership in the Climate Regime: Inspiring the Commitment of Developing Countries in the Post-Kyoto Phase. Rev. Eur. Comp. Int. Environ. Law 1998, 7, 180–190. [Google Scholar] [CrossRef]
  4. National Intelligence Council (NIC), United States Government. Global Trends 2025. Popul. Dev. Rev. 2009, 35, 209–214. [Google Scholar] [CrossRef]
  5. U.S. Energy Information Administration. U.S. Energy Information. Available online: https://www.eia.gov/energyexplained/?page=us_energy_home (accessed on 21 September 2024).
  6. U.S. Environmental Protection Agency. Overview of Greenhouse Gases. Available online: https://www.epa.gov/ghgemissions/overview-greenhouse-gases (accessed on 21 September 2024).
  7. Better Buildings Solution Center. Available online: https://betterbuildingssolutioncenter.energy.gov/ (accessed on 21 September 2024).
  8. National Taiwan University. Open Energy Review. Available online: https://rsprc.ntu.edu.tw/web/research/research_in.jsp?lang=en&rp_id=RP1729239776933 (accessed on 26 January 2025).
  9. Taiwan Climate Change Adaptation Platform. Available online: https://tccip.ncdr.nat.gov.tw/ds_05_03.aspx (accessed on 21 September 2024).
  10. Central Weather Bureau. Taiwan Climate Change Statistical Report 1897–2008; Central Weather Bureau: Taipei, Taiwan, 2009.
  11. Liu, S.C.; Wang, C.H.; Shiu, C.J.; Chang, H.W.; Hsiao, C.K.; Liaw, S.H. Reduction in Sunshine Duration over Taiwan: Causes and Implications. Terr. Atmos. Ocean. Sci. 2002, 13, 523–546. [Google Scholar] [CrossRef] [PubMed]
  12. Intergovernmental Panel on Climate Change (IPCC). Climate Change 2001: The Scientific Basis; Houghton, J.T., Ding, Y., Griggs, D.J., Noguer, M., Van der Linden, P.J., Dai, X., Maskell, K., Johnson, C.A., Eds.; Cambridge University Press: Cambridge, UK, 2001. [Google Scholar]
  13. Taichung City Government. Research on Urban Cooling Strategies in Taichung City; Taichung City Government: Taichung City, Taiwan, 2024.
  14. Wang, P.; Wong, Y.H.; Tan, C.Y.; Li, S.; Chong, W.T. Vertical Greening Systems: Technological Benefits, Progresses and Prospects. Sustainability 2022, 14, 12997. [Google Scholar] [CrossRef]
  15. Seyam, S. The impact of greenery systems on building energy: Systematic review. J. Build. Eng. 2019, 26, 100887. [Google Scholar] [CrossRef]
  16. Bevilacqua, P. The effectiveness of green roofs in reducing building energy consumption across different climates: A summary of literature results. Renew. Sustain. Energy Rev. 2021, 151, 111523. [Google Scholar] [CrossRef]
  17. Khan, I.H.; Munawer, T. A Systematic Review of Economic Sustainability of Vertical Greenery Systems for Buildings. Constr. Econ. Build. 2024, 24, 119–143. [Google Scholar] [CrossRef]
  18. Rupasinghe, H.T.; Halwatura, R.U. Benefits of implementing vertical greening in tropical climates. Urban For. Urban Green. 2020, 53, 126708. [Google Scholar] [CrossRef]
  19. Wong, N.H.; Tan, A.Y.K.; Chen, Y.; Sekar, K.; Tan, P.Y.; Chan, D.; Chiang, K.; Wong, N.C. Thermal evaluation of vertical greenery systems for building walls. Build. Environ. 2010, 45, 663–672. [Google Scholar] [CrossRef]
  20. Manouchehri, M.; López, J.S.; López, M.V. Sustainable Design of Vertical Greenery Systems: A Comprehensive Framework. Sustainability 2024, 16, 3249. [Google Scholar] [CrossRef]
  21. Haggag, M.; Hassan, A.; Elmasry, S. Experimental study on reduced heat gain through green facades in a high heat load climate. Energy Build. 2014, 82, 668–674. [Google Scholar] [CrossRef]
  22. Susorova, I.; Angulo, M.; Bahrami, P.; Stephens, B. A model of vegetated exterior facades for evaluation of wall thermal performance. Build. Environ. 2013, 67, 1–13. [Google Scholar] [CrossRef]
  23. Scarpa, M.; Mazzali, U.; Peron, F. Modeling the energy performance of living walls: Validation against field measurements in temperate climate. Energy Build. 2014, 79, 155–163. [Google Scholar] [CrossRef]
  24. Hao, X.; Lin, Y.; Tan, H.; Yang, K. Experimental investigation on the thermal performance of a vertical greening system with green roof in wet and cold climates during winter. Energy Build. 2019, 183, 105–117. [Google Scholar]
  25. Chen, Q.; Li, B.; Liu, X. An experimental evaluation of the living wall system in hot and humid climate. Energy Build. 2013, 61, 298–307. [Google Scholar] [CrossRef]
  26. Stav, Y.; Lawson, G. Vertical vegetation design decisions and their impact on energy consumption in subtropical cities. WIT Trans. Ecol. Environ. 2012, 155, 489–500. [Google Scholar]
  27. Dledjig, R.; Bozonnet, E.; Belarbi, R. Analysis of thermal effects of vegetated envelopes: Integration of a validated model in building energy simulation program. Energy Build. 2015, 86, 93–103. [Google Scholar] [CrossRef]
  28. Farrokhirad, E.; Rigillo, M.; Köhler, M.; Perini, K. Optimising vertical greening systems for sustainability: An integrated design approach. Int. J. Sustain. Energy 2024, 43, 1. [Google Scholar] [CrossRef]
  29. Carlos, J.S. Simulation assessment of living wall thermal performance in winter in the climate of Portugal. Build. Simul. 2014, 8, 3–11. [Google Scholar] [CrossRef]
  30. Peña-García, A.; López, J.C.; Grindlay, A.I. Decrease of energy demands of lighting installations in road tunnels based on the forestation of portal surroundings with climbing plants. Tunn. Undergr. Space Technol. 2015, 46, 111–115. [Google Scholar] [CrossRef]
Figure 1. Research flowchart of experiment.
Buildings 15 00445 g001
Figure 2. The relative location of this experimental site in Taichung, Taiwan (Non-English terms in this figure indicate original Chinese location names from the map data).
Buildings 15 00445 g002
Figure 3. Photographs of the experimental field. (a) Experimental field on the rooftop, (b) exterior view of the experimental house, (c) interior view of the experimental house.
Buildings 15 00445 g003
Figure 4. Floor plan of the experimental house in the experimental field. (1) Experimental group of the experimental house, (2) control group of the experimental house, (3) environmental weather monitoring station, (4) mini-environmental weather monitoring station for the experimental group, (5) mini-environmental weather monitoring station for the control group.
Buildings 15 00445 g004
Figure 5. Distance between the movable vertical greening system and the building. (a) Vertical green system 50 cm, (b) vertical green system 100 cm.
Buildings 15 00445 g005
Figure 6. The temperature fluctuations on the west interior wall of the building. (a) Experimental group, (b) control group.
Buildings 15 00445 g006
Figure 7. Green coverage ratio of the vertical greening in the experimental house.
Buildings 15 00445 g007
Figure 8. Relevant experimental equipment and analysis software used in this study. (a) Environmental weather monitoring station, (b) environmental weather monitoring station data logger CR200, (c) mini-environmental monitoring station Em50, manufactured by SmarterHome.sk, located in Chorvátsky Grob, Slovakia. (d) surface temperature sensor, (e) 30 indoor temperature measurement points, (f) Surfer 8.0 simulation and analysis software (https://surfer.software.informer.com/8.0/, accessed on 26 January 2025).
Buildings 15 00445 g008
Figure 9. VGSs 50 cm 70% opacity temperature. Figure annotation: air temp: temperature from the environmental monitoring station; test temp: temperature of the experimental group; compare temp: temperature of the control group.
Buildings 15 00445 g009
Figure 10. VGSs 50 cm 70% opacity solar. Figure annotation: solar: solar data from the environmental monitoring station; test solar: solar data of the experimental group; compare solar: solar data of the control group.
Buildings 15 00445 g010
Figure 11. (a) Indoor temperature variation over time for experimental and control groups (vertical green system at 50 cm distance and 70% opacity). (b) Indoor temperature variation over time for experimental and control groups (vertical green system at 50 cm distance and 70% opacity).
Buildings 15 00445 g011
Figure 12. VGSs 50 cm 95% up opacity temperature. Figure annotation: air temp: temperature from the environmental monitoring station; test temp: temperature of the experimental group; compare temp: temperature of the control group.
Buildings 15 00445 g012
Figure 13. VGSs 50 cm 95% up opacity solar. Figure annotation: solar: solar data from the environmental monitoring station; test solar: solar data of the experimental group; compare solar: solar data of the control group.
Buildings 15 00445 g013
Figure 14. VGSs 50 cm 95% up opacity surface temperature. Figure annotation: air temp: temperature from the environmental monitoring station; test temp: temperature of the experimental group; compare temp: temperature of the control group.
Buildings 15 00445 g014
Figure 15. (a) Indoor temperature variation over time for experimental and control groups (vertical green system at 50 cm distance and 95% opacity). (b) Indoor temperature variation over time for experimental and control groups (vertical green system at 50 cm distance and 95% opacity).
Buildings 15 00445 g015
Figure 16. VGSs 100 cm 70% opacity temperature. Figure annotation: air temp: temperature from the environmental monitoring station; test temp: temperature of the experimental group; compare temp: temperature of the control group.
Buildings 15 00445 g016
Figure 17. VGSs 100 cm 70% opacity solar. Figure annotation: solar: solar data from the environmental monitoring station; test solar: solar data of the experimental group; compare solar: solar data of the control group.
Buildings 15 00445 g017
Figure 18. (a) Indoor temperature variation over time for experimental and control groups (vertical green system at 100 cm distance and 70% opacity). (b) Indoor temperature variation over time for experimental and control groups (vertical green system at 100 cm distance and 70% opacity).
Buildings 15 00445 g018
Figure 19. VGSs 100 cm 95% up opacity temperature. Figure annotation: air temp: temperature from the environmental monitoring station; test temp: temperature of the experimental group; compare temp: temperature of the control group.
Buildings 15 00445 g019
Figure 20. VGSs 100 cm 95% up opacity solar. Figure annotation: solar: solar data from the environmental monitoring station; test solar: solar data of the experimental group; compare solar: solar data of the control group.
Buildings 15 00445 g020
Figure 21. VGSs 100 cm 95% up opacity surface temperature. Figure annotation: air temp: temperature from the environmental monitoring station; test temp: temperature of the experimental group; compare temp: temperature of the control group.
Buildings 15 00445 g021
Figure 22. Indoor temperature variation over time for experimental and control groups (vertical green system at 100 cm distance and 95% opacity). (a) Experimental group (west side of test building). (b) Control group (west side of test building).
Buildings 15 00445 g022
Table 1. Environmental and Material Parameters for Vertical Green System at 50 cm Distance and 70% Opacity: Indoor Temperature Variations.
TimeExtremesUnitExperimental Group West SideControl Group West SideTemperature Difference
07:00Max°C29.0130.11.09
Min°C28.4127.4−1.01
08:00Max°C30.9933.12.11
Min°C30.5331.10.57
09:00Max°C31.7234.62.88
Min°C31.2432.811.57
10:00Max°C32.3435.53.16
Min°C32.1533.71.55
11:00Max°C33.0636.153.09
Min°C32.7035.052.80
12:00Max°C33.9437.83.86
Min°C33.3836.22.82
13:00Max°C33.4236.853.48
Min°C33.2835.352.07
14:00Max°C32.9036.03.10
Min°C32.0533.81.75
15:00Max°C31.2532.91.65
Min°C30.4030.90.50
16:00Max°C29.8831.51.62
Min°C29.3228.8−0.52
17:00Max°C29.4230.71.28
Min°C28.9028.5−0.40
18:00Max°C29.4030.61.20
Min°C28.7828.4−0.38
Table 2. Environmental and Material Parameters for Vertical Green System at 50 cm Distance and 95% Opacity: Indoor Temperature Variations.
TimeExtremesUnitExperimental Group West SideControl Group West SideTemperature Difference
07:00Max°C28.0629.711.65
Min°C27.3027.01−0.29
08:00Max°C30.7033.212.51
Min°C29.6530.610.96
09:00Max°C32.7036.413.71
Min°C31.6534.212.56
10:00Max°C34.0138.814.80
Min°C33.2136.613.40
11:00Max°C34.3639.014.65
Min°C33.6136.813.20
12:00Max°C34.8539.314.46
Min°C34.1537.513.36
13:00Max°C35.4240.515.09
Min°C34.8238.313.49
14:00Max°C35.5539.654.10
Min°C34.8538.053.20
15:00Max°C35.0639.114.05
Min°C34.4637.112.65
16:00Max°C33.8135.611.80
Min°C33.0134.711.70
17:00Max°C32.3533.300.95
Min°C31.6532.350.70
18:00Max°C31.2632.411.15
Min°C30.7630.61−0.15
Table 3. Environmental and Material Parameters for Vertical Green System at 100 cm Distance and 70% Opacity: Indoor Temperature Variations.
TimeExtremesUnitExperimental Group West SideControl Group West SideTemperature Difference
07:00Max°C27.4829.41.92
Min°C26.9826.5−0.48
08:00Max°C28.730.852.15
Min°C28.2829.851.57
09:00Max°C31.5536.24.65
Min°C30.4533.73.25
10:00Max°C32.337.85.5
Min°C31.5535.43.85
11:00Max°C34.140.46.3
Min°C33.237.74.5
12:00Max°C34.5540.35.75
Min°C33.6538.14.45
13:00Max°C34.6639.44.74
Min°C34.137.83.7
14:00Max°C35.240.25.0
Min°C34.337.83.5
15:00Max°C35.539.54.0
Min°C34.138.053.95
16:00Max°C34.2537.93.65
Min°C33.4536.83.35
17:00Max°C32.6834.82.12
Min°C32.1233.851.73
18:00Max°C31.4532.751.3
Min°C30.731.450.75
Table 4. Environmental and Material Parameters for Vertical Green System at 100 cm Distance and 95% Opacity: Indoor Temperature Variations.
TimeExtremesUnitExperimental Group West SideControl Group West SideTemperature Difference
07:00Max°C27.128.31.2
Min°C26.326.0−0.3
08:00Max°C28.530.72.2
Min°C27.728.30.6
09:00Max°C31.5536.04.45
Min°C30.3533.53.15
10:00Max°C31.335.053.75
Min°C30.933.652.75
11:00Max°C33.2438.55.26
Min°C32.6436.23.56
12:00Max°C34.841.36.5
Min°C34.138.44.3
13:00Max°C35.7641.55.74
Min°C35.239.74.5
14:00Max°C35.5240.54.98
Min°C35.0238.83.78
15:00Max°C35.640.65.0
Min°C34.7538.43.65
16:00Max°C34.9538.93.95
Min°C34.1537.53.35
17:00Max°C34.237.23.0
Min°C33.435.72.3
18:00Max°C32.7534.21.45
Min°C32.0532.90.85
Table 5. Statistical analysis results and summary for different schemes.
ConditionExperimental Group Temperature RangeControl Group Temperature RangeExperimental Group MedianControl Group MedianWilcoxon Signed-Rank Test Resultsp-ValueConclusion
50 cm distance and 70% opacity28.41–33.94 °C30.63–37.80 °C31.25 °C35.46 °CPositive ranks: 20 (experimental group temperature lower than control); negative ranks: 4 (experimental group temperature higher than control); statistic: 13; Z-value: −3.90Exact Prob: 1.05 × 10⁻⁴; Asymp Prob: 9.62 × 10⁻⁵The temperature difference distribution between the experimental and control groups is significantly different, indicating that the greening system effectively reduced the temperature difference.
50 cm distance and 95% opacity27.30–35.55 °C27.01–40.51 °C33.41 °C36.51 °CPositive ranks: 22; negative ranks: 2; statistic: 3; Z-value: −4.19Exact Prob: 5.96 × 10⁻⁷; Asymp Prob: 2.84 × 10⁻⁵There is a significant difference in temperature distribution, and the greening system effectively regulates temperature.
100 cm distance and 70% opacity26.98–35.50 °C26.50–40.40 °C32.98 °C37.25 °CPositive ranks: 23; negative ranks: 1; statistic: 1; Z-value: −4.24Exact Prob: 2.38 × 10⁻⁷; Asymp Prob: 2.21 × 10⁻⁵There is a significant temperature difference between the groups, showing a notable cooling effect of the greening system.
100 cm distance and 95% opacity26.30–35.76 °C26.00–41.50 °C33.32 °C36.70 °CPositive ranks: 23; negative ranks: 1; statistic: 1; Z-value: −4.24Exact Prob: 2.38 × 10⁻⁷; Asymp Prob: 2.21 × 10⁻⁵The experimental group shows a significant temperature difference compared to the control group, indicating effective cooling.
Table 6. Median (°C) analysis for experimental and control groups.
50 cm Distance100 cm Distance
70% Opacity31.25/35.4632.98/37.25
95% Opacity33.41/36.5133.32/36.70
Note: each cell contains “Experimental Group Median/Control Group Median”.
Disclaimer/Publisher’s Note: The statements, opinions and data contained in all publications are solely those of the individual author(s) and contributor(s) and not of MDPI and/or the editor(s). MDPI and/or the editor(s) disclaim responsibility for any injury to people or property resulting from any ideas, methods, instructions or products referred to in the content.

