Article

Degradation Law of Dynamic Mechanical Properties of Coral Concrete Under Marine Environment

1
Hualan Design and Consulting Group Company Ltd., Nanning 530012, China
2
College of Civil Engineering and Architecture, Key Laboratory of Disaster Prevention and Structural Safety of Ministry of Education, Guangxi Key Laboratory of Disaster Prevention and Structural Safety, Scientific Research Center of Engineering Mechanics, Guangxi University, Nanning 530004, China
3
Guangxi Bossco Environmental Protection Technology Co., Ltd., Nanning 530007, China
4
Guangxi Polytechnic of Construction, Nanning 530007, China
*
Author to whom correspondence should be addressed.
Buildings 2025, 15(23), 4288; https://doi.org/10.3390/buildings15234288
Submission received: 22 October 2025 / Revised: 19 November 2025 / Accepted: 24 November 2025 / Published: 26 November 2025

Abstract

The impact mechanical properties of coral aggregate seawater concrete (CASC) are crucial for its application in island construction. This study examines how the dynamic compressive mechanical properties of CASC degrade in a marine setting. Laboratory tests were conducted to simulate the corrosion of CASC under three different immersion scenarios: full immersion (FI), semi-immersion (SI), and salt spray (SS). Dynamic compressive mechanical property tests were performed using a split Hopkinson pressure bar (SHPB). The study analyzed the effects of immersion condition and duration on key dynamic properties, including strength, elasticity, dynamic increase factor (DIF, defined as the ratio of dynamic strength to static strength), and energy dissipation. The experimental stress–strain data were fitted using the Guo model. Results show that the dynamic strength and energy dissipation in FI and SI conditions first increased, peaking at 30 days of corrosion, before decreasing. The DIF of CASC was linearly related to the strain rate and was largest in the SS zone, followed by the SI zone, and smallest in the FI zone. The experimental stress–strain data were well fitted by the Guo model, validating its effectiveness and offering insights into CASC use in island-reef engineering.

1. Introduction

Currently, in order to develop and utilize marine resources, a large amount of concrete materials are required for the construction of marine island projects. Due to the scarcity of resources on the islands, transporting construction materials (especially aggregates and freshwater resources) from land to the islands would greatly increase the transport costs. The mining of coral can have an environmental impact on the coastline [1]. On the basis of protecting the ecological environment of the island reefs, coral aggregate seawater concrete (CASC) adopts seawater and coral near the island as raw materials, which can effectively solve the problem of high costs of transporting materials in the construction of island projects [2,3]. Coral aggregate is a calcium carbonate-type natural lightweight aggregate, with a rough and porous surface [4,5], which is conducive to hydration, and CASC has higher early strength [6,7,8] than ordinary concrete under the same mix proportion. Due to the low strength of the aggregate [9], the final strength of CASC is relatively weaker than that of ordinary concrete with the same mix ratio [10,11,12]. At present, the strength of CASC can generally reach the grade of C40 [8,11,13], which already meets the requirements of most of the structural strength of the project.
Concrete structures in marine environments face persistent challenges due to corrosion and long-term durability concerns. In recent years, extensive research has been conducted on the durability of concrete structures adding new admixtures in marine corrosive environments. Hosseinzadehfard and Mobaraki [14] found that replacing 25% of micro-silica with natural pozzolan significantly enhanced the durability of reinforced concrete. Based on this finding, the author further evaluated the performance of reinforced concrete beams incorporating this admixture [15]. Alexander and Shashikala [16] found that compared with ordinary concrete, geopolymer concrete has stronger resistance to seawater erosion. The enhanced durability of concrete structures signifies a substantially extended service life in marine-corrosive environments. Consequently, this leads to reduced long-term maintenance demands and associated environmental impacts. Furthermore, the incorporation of admixtures diminishes the reliance on cement, aligning with the prevailing research trend toward sustainable development.
In the real marine environment, the service environment of concrete structures is far more complex than on land. Seawater and sea spray contain a large number of chloride ions, sulfate ions, magnesium ions, and other corrosive ions, accelerating concrete corrosion [17,18,19,20,21]. Chloride-ion damage to reinforced concrete structures is mainly free-state chloride-ion diffusion to the surface of steel reinforcement caused by the corrosion of steel reinforcement [22]. Coral concrete chloride-ion’s apparent diffusion coefficient is 0.5 times higher than that of ordinary concrete, and its resistance to the diffusion of chloride ions is weaker [23]. The mixing of metakaolin [19] and ground granulated blast furnace slag (GGBS) [20] can hinder chloride-ion diffusion. However, chloride ions in seawater also accelerate the cement-hydration process when the chloride-ion content does not exceed 2%, so that the concrete exhibits higher early strength [24]. The destructive mechanism of sulfate ions on concrete structures is through the chemical reaction with calcium hydroxide to generate expansion corrosion products such as ettringite and gypsum, which destroy the denseness of the cement paste and reduce the strength of concrete. Magnesium ions react with calcium hydroxide, a cement hydration product that is slightly soluble in water, to generate magnesium hydroxide with lower solubility, which lowers the pH value of the solution, accelerates the dissolution of the cement hydration product [25], and reduces the internal bond strength of the concrete. Different usage environments have a greater impact on the service life of CASC [26]. Seawater salt-spray environments [27] and wet/dry cycling environments [28] significantly contribute to the diffusion of chloride ions within the CASC, resulting in a shorter service life of the CASC components. The deterioration of CASC ‘s mechanical properties in the dry and wet cycle of freshwater is more pronounced than that in the seawater immersion environment, and the slag-based geopolymers can enhance the mechanical properties and durability of CASC in the dry and wet cycle [29,30].
In addition, the structure not only has to withstand impacts such as wave beating, earthquakes, tsunamis, and ship impacts but also future maritime disputes; the island project is very vulnerable to shelling as a military target, so research on the impact resistance of the island infrastructure is particularly important. Current research on the impact resistance of coral concrete is mainly through the split Hopkinson pressure bar (SHPB). Qin et al. [31] found that compared with ordinary concrete, coral concrete has a higher dynamic increase factor (DIF) under high-strain-rate impact, where cracks are more likely to penetrate through the coral aggregate with lower strength, generating more cracks to dissipate energy. Scholars have conducted impact compression tests on fiber-reinforced coral concrete and found that sisal fiber, hybrid carbon fibers, polypropylene fiber, polyvinyl acetate (PVA) fiber, and basalt fiber have reinforcing and toughening effects on CASC [32,33,34,35]. Guo et al. and Chen et al. [36,37] investigated the CASC mechanical-property damage and crack-extension law, and established a constitutive model.
In summary, research have been conducted on the corrosion mechanism and dynamic mechanical properties of CASC, respectively. However, concrete structures in service in the marine environment have already experienced corrosion from the marine environment when subjected to impact loads. In other words, extreme conditions where both loads are applied simultaneously may exist. In addition, the effect of different exposure conditions to the marine environment on the dynamic compressive performance of CASC is not yet known. There seems to be no relevant reports on the above subject at present.
To fill this gap, this paper investigates the deterioration of dynamic compressive properties in coral aggregate seawater concrete (CASC) under marine environments. An accelerated laboratory corrosion protocol was employed to corrode CASC specimens, which were then subjected to dynamic impact tests to evaluate the degradation of their mechanical properties. This study provides guidance for the design of impact resistance of CASC in marine environments. This study is organized as follows: Section 2 describes the raw materials and test methods. Section 3 analyses the damage modes, dynamic mechanical properties, strain-rate effect, peak strain, energy dissipation, and micro-analysis of CASC under high strain-rate impact. Section 4 illustrates the Guo model of the dynamic stress–strain relationship of CASC. Section 5 draws conclusions.

2. Materials and Methods

2.1. Materials

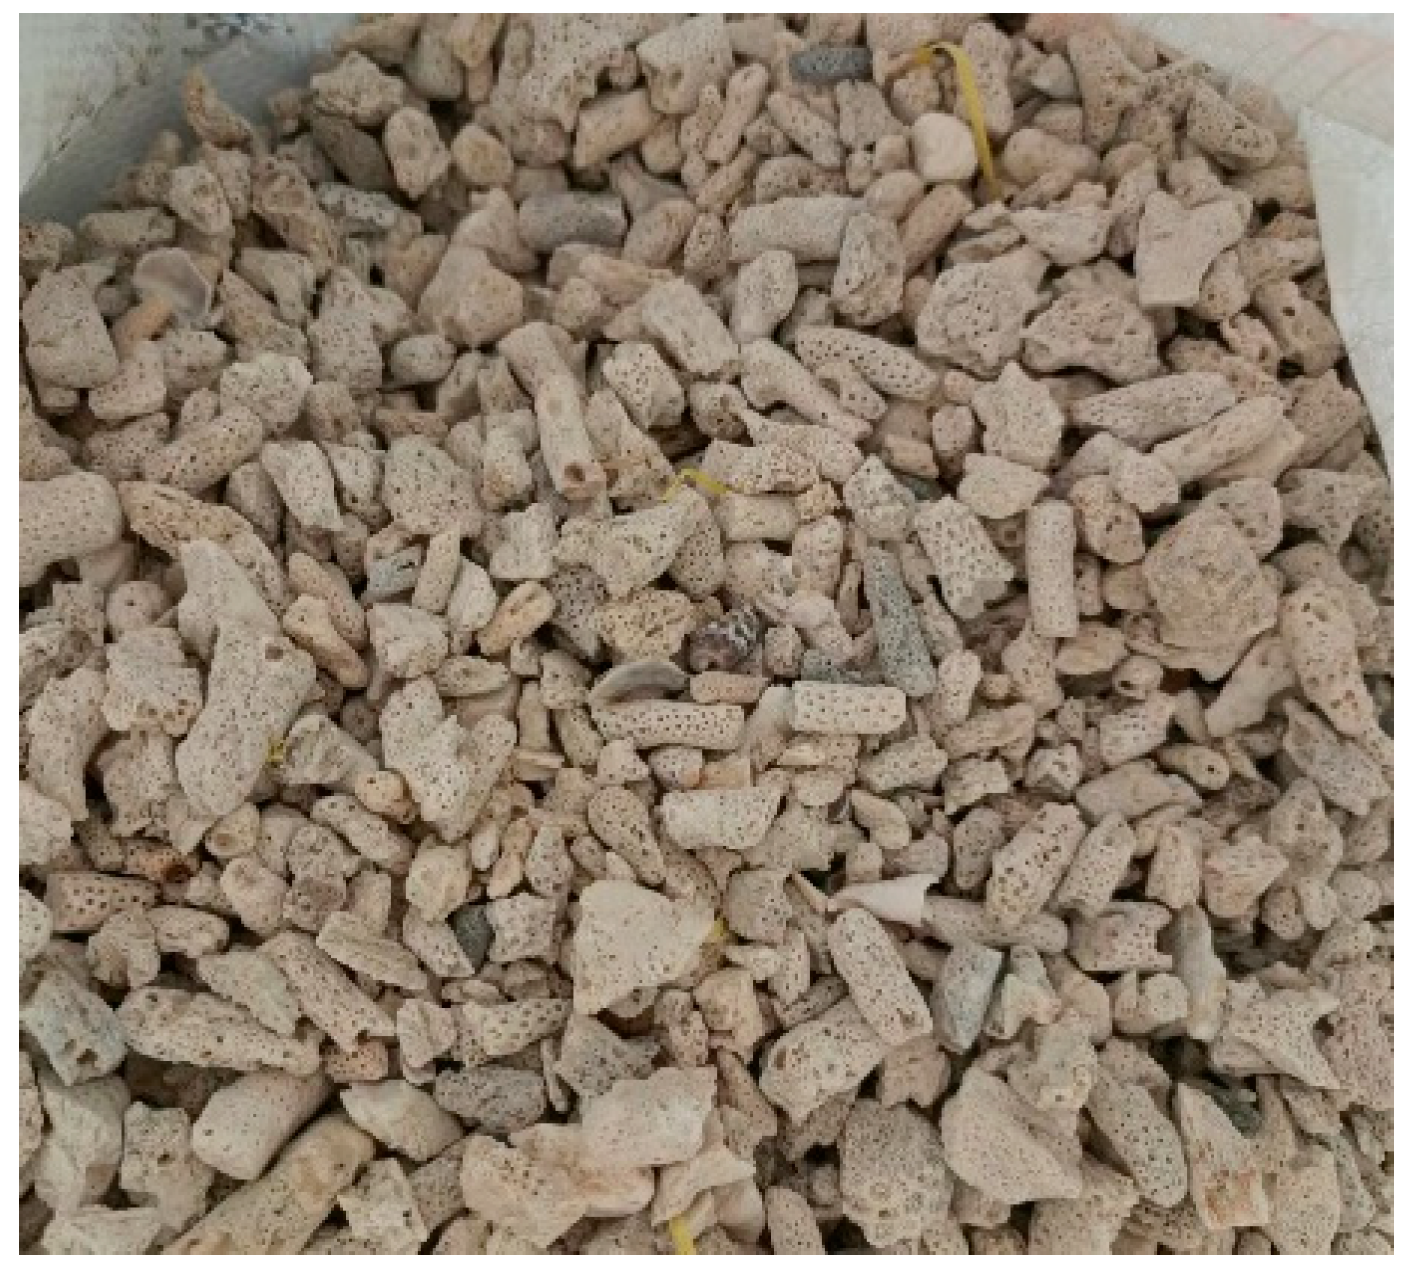
In this paper, the P·O42.5 ordinary silicate cement produced by Guangxi Fusui Conch Cement Co, Ltd. was selected. The main chemical composition of the cement is shown in Table 1. Fine aggregate was selected from coral sand in the South China Sea waters, as shown in Figure 1, with the main performance indexes detailed in Table 2. Coarse aggregate was selected from coral in the South China Sea waters, and the size range of the particles screened by crushing was 5–20 mm part, as shown in Figure 2. The performance indexes are shown in Table 3. To replicate real seawater, a sea crystal solution from Jiangxi Yantong Technology Company was used as the mixing water for coral concrete. According to the ion concentration in the sea area of Beibu Gulf of Guangxi, sea crystals and freshwater were combined in a mass ratio of 1:30 to create artificial seawater.

2.2. Specimens Preparation

This paper was based on the Technical Specification for Lightweight Aggregate Concrete Structures (JGJ 12-2006) [38], Specification for the Design of Normal Concrete Proportions (JGJ 55-2011) [39], and Technical Specification for the Application of Coral Aggregate Concrete (T/CECS 694-2020) [40]; the required coral concrete mix ratios were determined as shown in Table 4.
Due to the SHPB impact compression test on the specimen, the CASC specimen size was selected as a Φ100 mm × 50 mm cylinder. The test was designed for three corrosion conditions (full immersion, semi-immersion, and salt spray). The corrosion time was 120 d, the four testing times were 30 d, 60 d, 90 d, and 120 d, respectively, and 15 specimens were sampled for each condition. Before the corrosion process began, fifteen specimens were taken for an impact test to calibrate the initial condition. A total of 195 cylindrical CASC specimens were used in this paper, and the casting work was completed in one go. The specimens were maintained in a conservation box filled with artificial seawater. The concentration of artificial seawater in the conservation box matched that of natural seawater. The conservation period lasted 28 days, which was not included in the corrosion time. Following the durability test method [41], after the conservation period, the specimens were removed, placed in a constant temperature box at 60 °C for 48 h for drying, and then transferred to the corrosion device for the corrosion test.

2.3. Laboratory Modeling Methods for Different Marine Environments

In this paper, a multi-condition seawater corrosion test device was designed and self-made by using dry and wet cycles as an acceleration mode, combined with the actual marine environment. The device consists of three parts: a fog-making machine, a polyvinyl chloride (PVC) connecting pipe, and a plastic immersion box, as shown in Figure 3a. Initially, the humidifier atomized the artificial seawater into a salt mist containing corrosive ions. Subsequently, the salt mist was introduced into the immersion box through the PVC connecting pipe, creating a salt-mist environment inside the box. To ensure the mobility of the salt spray, the top cover of the soaking box had openings, the center had air inlet holes, and it was surrounded by exhaust holes.
Stack three specimens as a group from bottom to top in the immersion box. The distance between each two groups of specimens should be more than 50 mm to ensure the smooth flow of water and salt spray. The specimens were positioned around the air inlet holes to ensure uniform corrosion by seawater and salt spray, as shown in Figure 3b. Artificial seawater was poured into the immersion box until the water level reached the middle height line of the middle specimen. The specimen at the bottom was completely immersed in artificial seawater, which was called the full-immersion zone (FI-CASC); the specimen at the middle was immersed in seawater at the lower part and exposed to salt spray at the upper part, which was called the semi-immersion zone (SI-CASC). The top specimen was not in direct contact with the water surface but only with the salt spray, which was called the salt spray zone (SS-CASC), as shown in Figure 3c. Due to the corrosive ions in the artificial seawater reacting with the cement hydration products in the CASC, leading to a decrease in seawater ion concentration, the artificial seawater used in the test had to be reconfigured and replaced every 15 days, which complied with the requirement of replacing it at least once every 30 days as stipulated in the durability test method [41].
The wet and dry cycle program designed includes total corrosion time, sampling interval, wet- and dry-cycle period, and wet- and dry-time ratio. This paper followed the durability test method [41]. To avoid the interference of temperature stress on the corrosion test, the specimens would be allowed to cool down in the air for 1 h after drying before being placed in the seawater corrosion environment. The specimens would undergo seawater or salt-spray corrosion for 15 ± 0.5 h; the drying time is 8 ± 0.5 h. After 120 days in the employed accelerated corrosion environments, the static compressive strength of CASC decreased by 29.5–38.2% [42], a reduction significantly more pronounced than the 5.4–14.4% loss reported by Zhang et al. after one year of exposure [29]. By comparison, it can be seen that the accelerated corrosion test designed in this paper is more efficient and the corrosion effect is more obvious.
A scanning electron microscope (SEM) was used to reveal the influence mechanism of the marine environment on the macroscopic mechanical properties of CASC at the microscopic level.

2.4. Impact Test Program

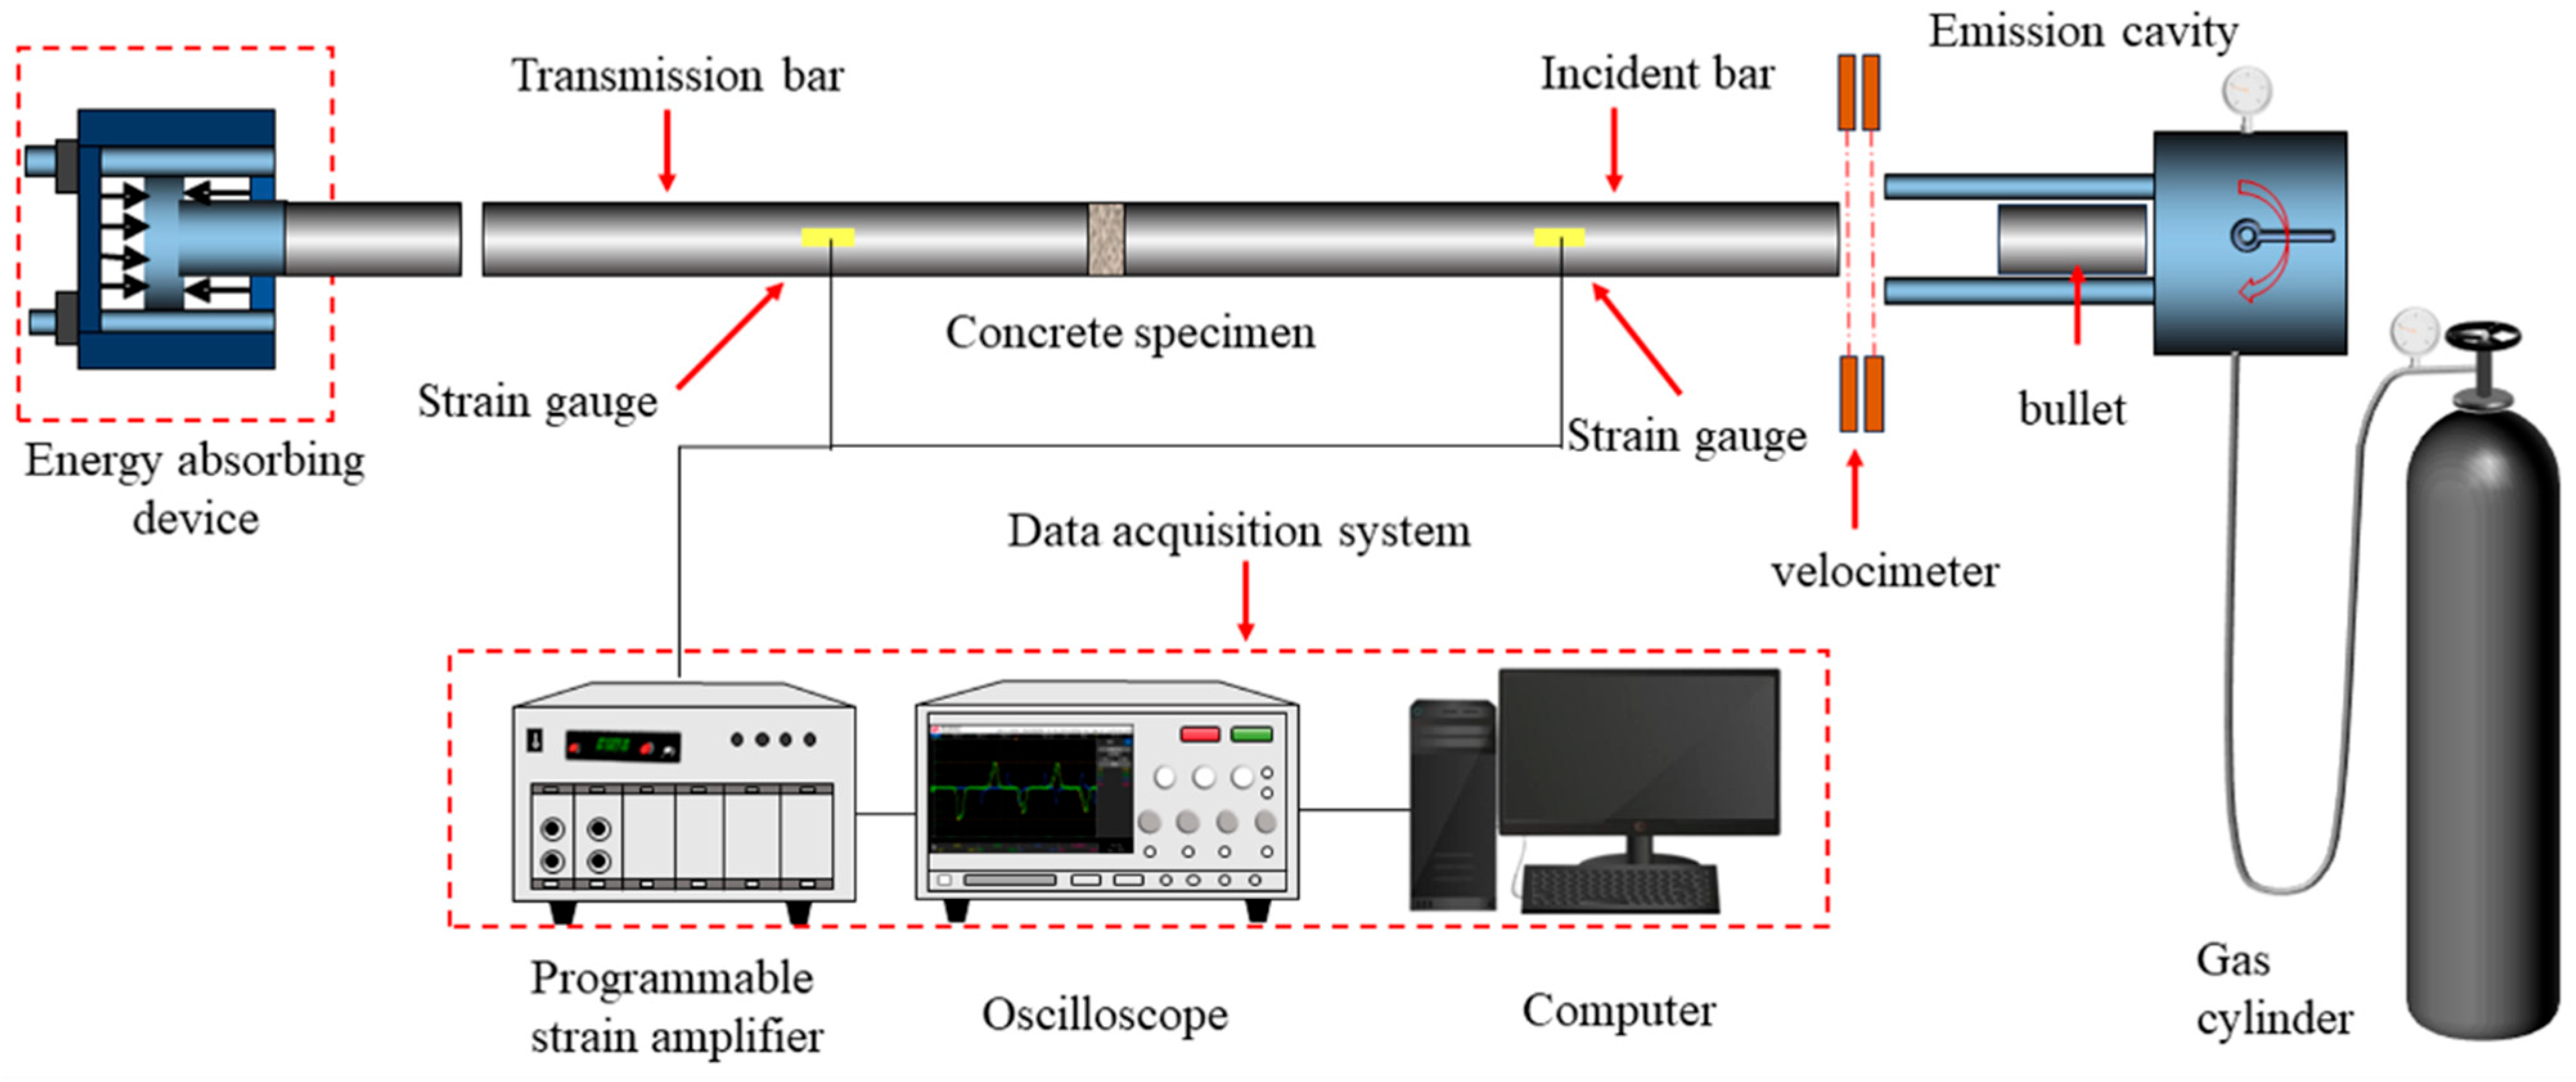
In this paper, the SHPB setup of Guangxi University School of Civil and Architectural Engineering was used for the impact compression test, which mainly consists of a launching device, an incident rod, a transmitting rod, an absorbing device, and a data acquisition device. Figure 4 shows the working principle of SHPB. All the bars were steel, elastic modulus: 210 GPa, density: 7850 kg × m−3, with diameter: 100 mm, bullet length: 400 mm, incident bar length: 5000 mm, and transmission bar length: 3000 mm.
The impact of the projectile at the free end of the input bar developed a compressive longitudinal incident wave, εi. Once this wave reached the interface of the bar and the specimen, a part of it, εr, was reflected, whereas another part went through the specimen and was transmitted to the output bar, εt. These three basic waves were recorded by the gauges pasted on the input and output bars. According to the wave propagation theory [43], the average stress, strain, and strain rate of specimens can be calculated by the following equation:
σ = AE A 0 ε t
ε = 2 C 0 l 0 0 t ε r d t
E and C0 are Young’s modulus and the elastic wave speed of the bar. A and A0 are the cross-sectional areas of the bar and the specimen, and l0 is the length of the specimen.
The measured stress waveforms are shown in Figure 5a. It could be seen that the incident wave from the incident bar was almost entirely transmitted to the transmission bar, forming a transmitted wave. Only a small portion of the wave was reflected, indicating that the specimen could achieve good stress equilibrium.
Since there was no uniform standard for the strain-rate value of SHPB dynamic compression tests, and it was difficult to achieve a constant strain-rate loading of concrete material with a large diameter SHPB, the strain-rate calculation in this paper adopted the average value of the strain rate within the range of linear strain change in strain with time as the test strain rate, as shown in Figure 5b.
Impact testing was conducted on 15 specimens for each of the three corrosive environments. The 15 specimens were divided into five groups, with three specimens in each group. Due to the different corrosion times affecting deformation performance, it was not possible to accurately control the strain rate of the specimens. Therefore, impact testing was carried out on the five groups at impact air pressures ranging from 0.22 MPa to 0.34 MPa. The strain rates ranged at 45 s−1~55 s−1 for the low strain rate, 65 s−1~75 s−1 was the medium strain rate, and 95 s−1~105 s−1 was taken as the high strain rate. The average strain rate within each group was considered as the group result.

3. Results and Discussion

3.1. Impact Damage Patterns

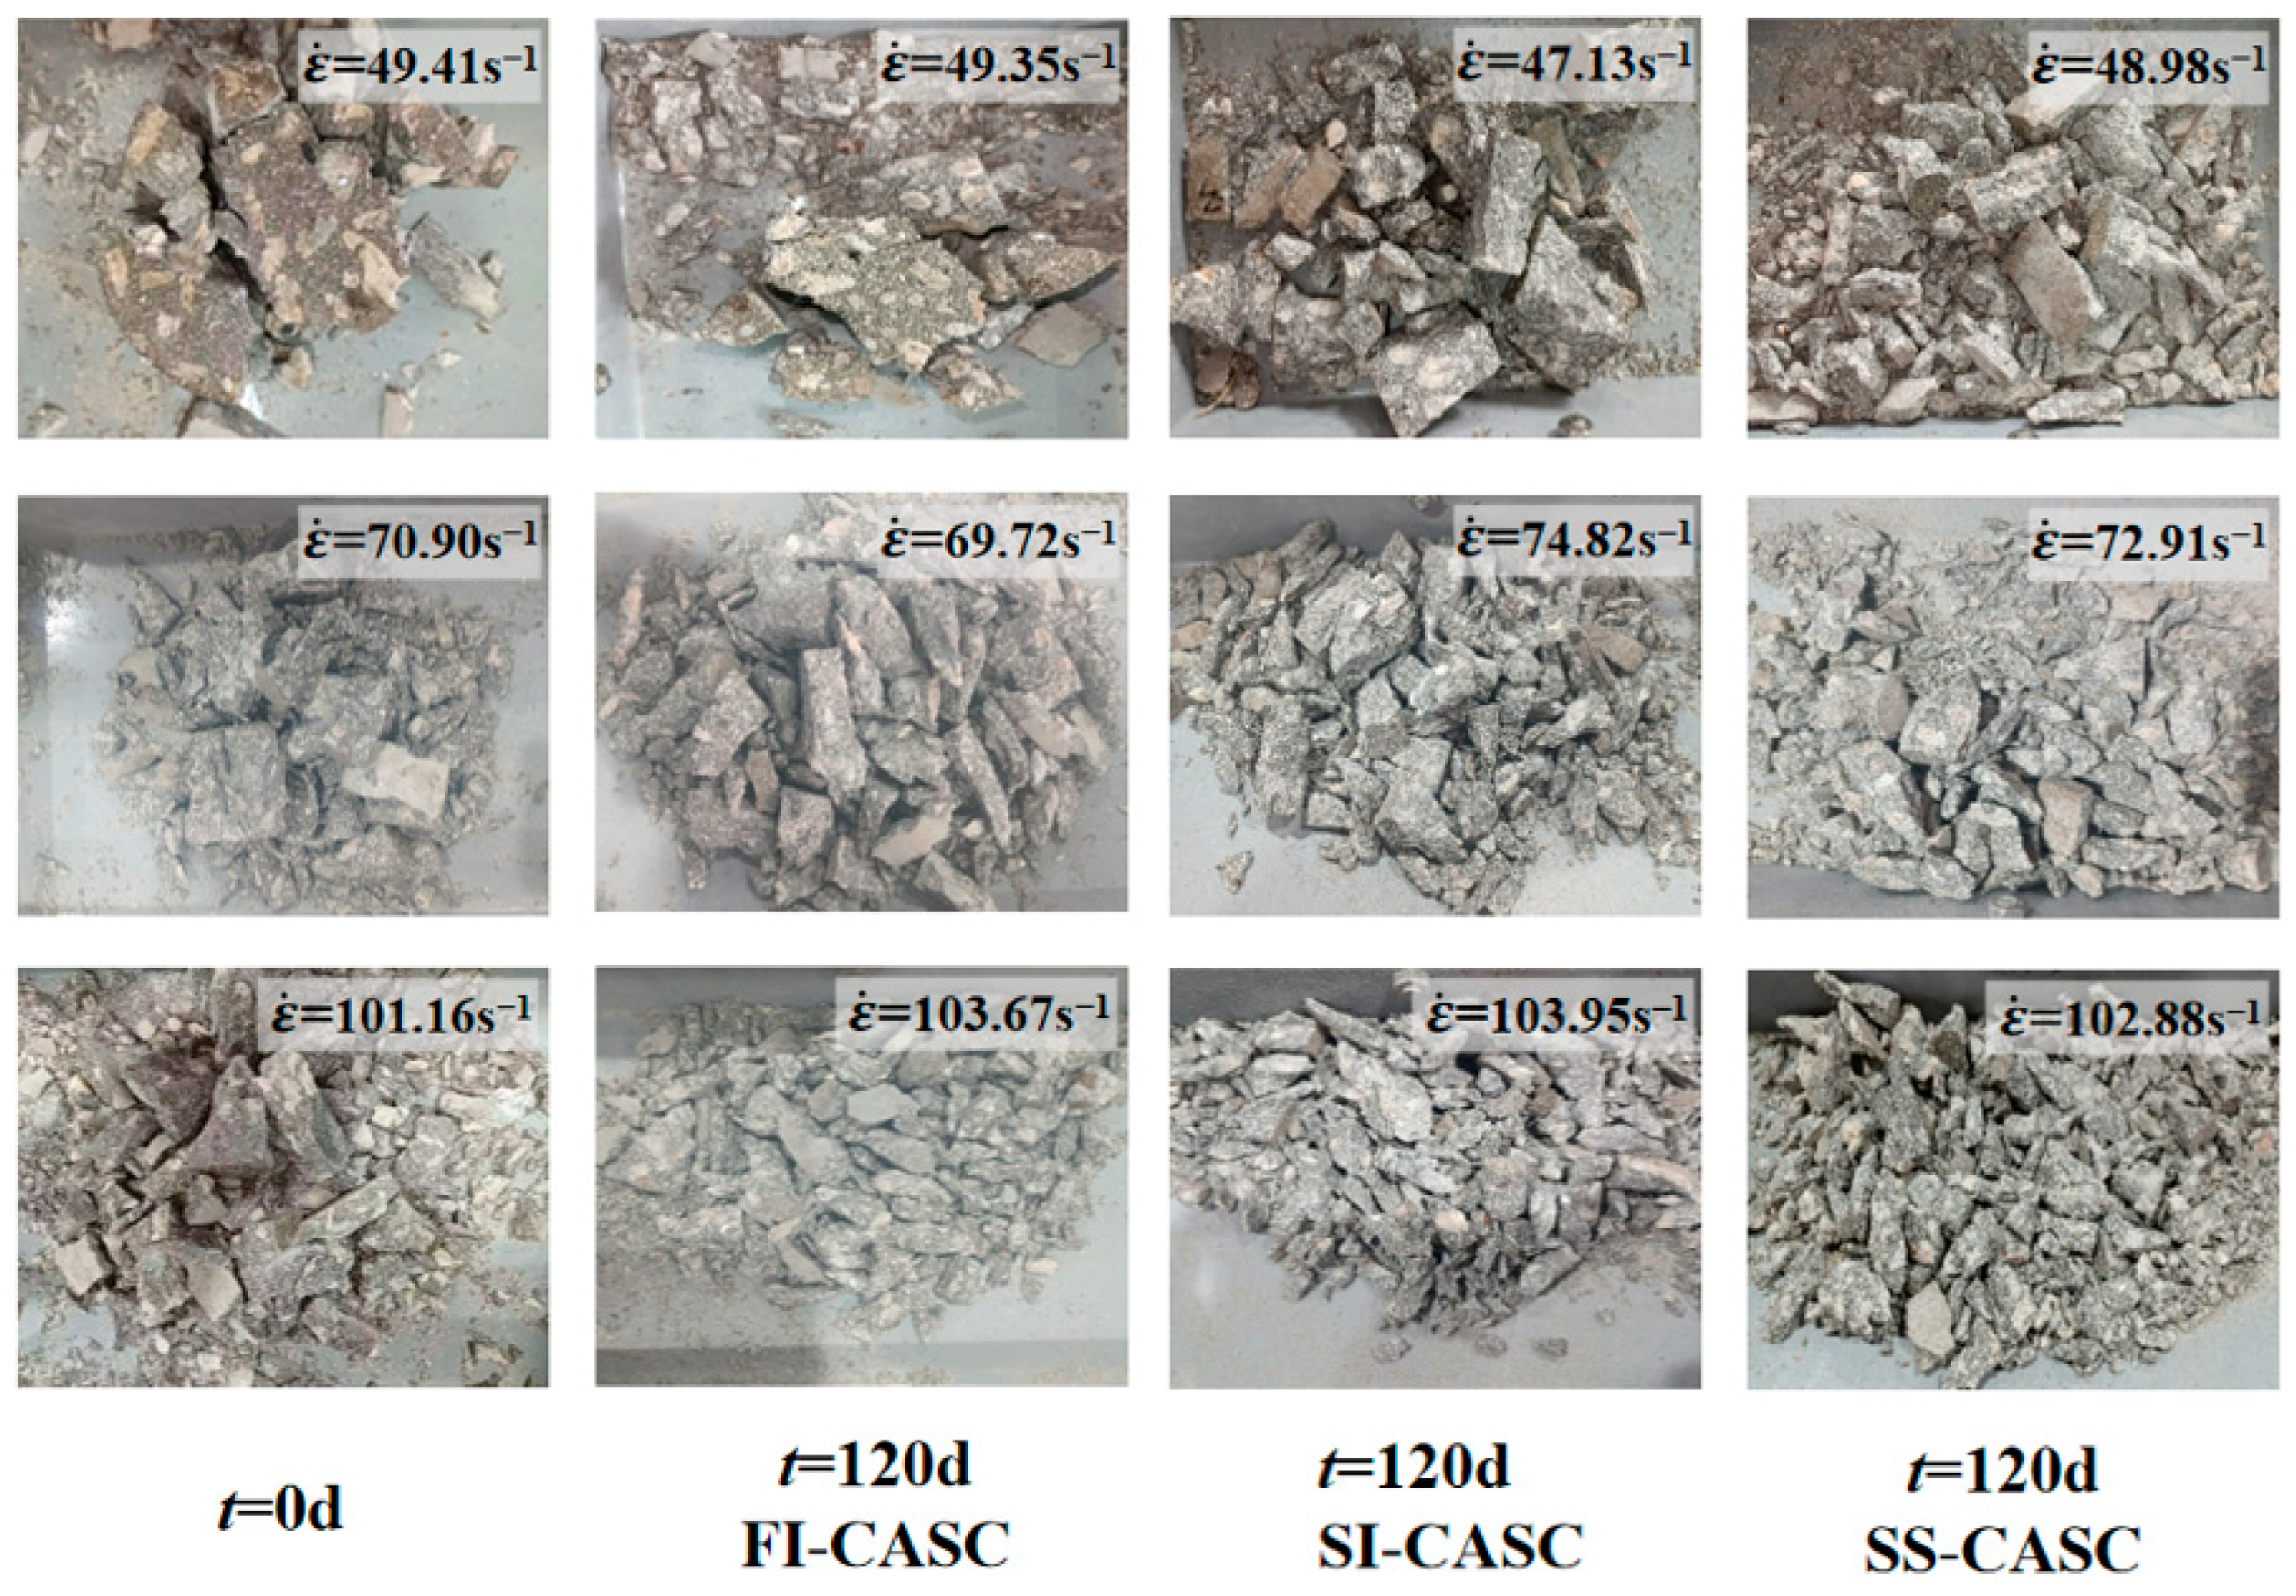
In this paper, CASC fragments after impact at two corrosion time nodes of 0 d and 120 d are selected as research objects to analyze the effects of different corrosion conditions and strain rates on the damage morphology of CASC specimens. The shock compression failures of CASC at different strain rates are shown in Figure 6. After the CASC specimen was impacted by SHPB, the comparison of the damage patterns under different strain rates showed the following: under low strain rate, cracks were generated in the circular compression surface of the specimen and passed through the specimen in the height direction. The edges of the specimen were broken into several blocks of different sizes and a small amount of powder. The center of the specimen was broken into some columnar blocks of large sizes, whose heights were the same as the heights of the specimen before crushing. The damage patterns of the CASC impacts under medium strain rate were as follows: the impact damage pattern of CASC increased, and the shape of the broken pieces changed mainly to flakes. CASC under high strain rate was subjected to stronger impact compression force, the specimens under different corrosion conditions accumulated large energy in a very short time, and a large number of small irregular cracks were produced inside the specimens. The specimens cracked along these cracks, the fragment size was further reduced, and the number of fragments increased, producing a very large number of fine fragments and powders.

3.2. Stress–Strain Curve

The stress–strain curves of the specimens in the three corrosive environments versus the corrosion time are shown in Figure 7.
The relationship between stress–strain curves and strain rates of specimens in three corrosive environments is shown in Figure 8.

3.3. Dynamic Strength and Modulus of Elasticity

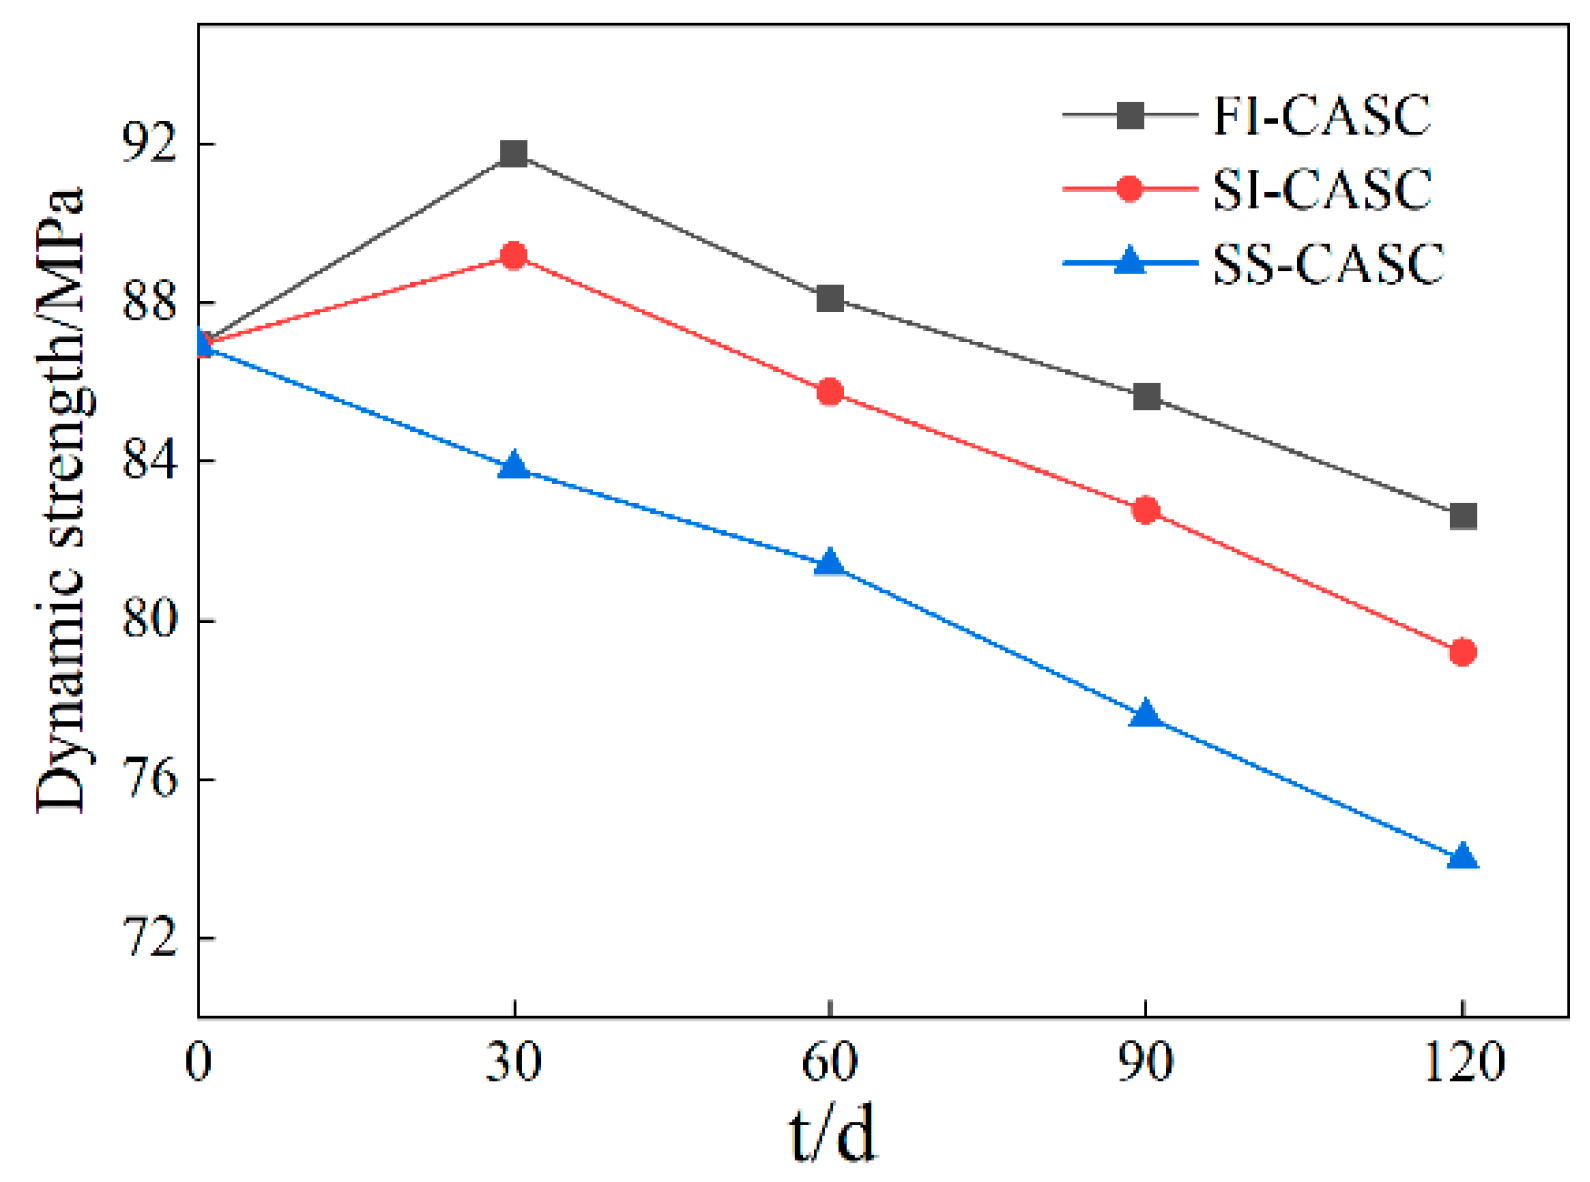
The dynamic strength σd of CASC under different marine environments and corrosion time nodes obtained from the SHPB test is shown in Table 5, and its variation curve with corrosion time t is shown in Figure 9.
Comparing the dynamic strength σd of CASC under different marine environments with the change rule of corrosion time in Figure 9, it can be seen that with the increase in corrosion time, the dynamic strength σd of CASC specimens under different marine environments has decreased, but the trend of decrease is slightly different. The specimens in the full-immersion area and half-immersion area show a trend of first increase and then decrease in dynamic compressive strength during the 120 d corrosion cycle, with the highest strength measured at 30 d of corrosion time. The strength of the specimens in the salt spray area decreased most severely, with a gradual decrease in strength over time. The initial increases in the strength of FI-CASC and SI-CASC at 30 d is attributed to the cement hydration reaction between SO42− and the hydration products, which generates corrosion products to fill the initial pores inside the specimen, making it more compact and increasing the dynamic strength σd. Beyond this critical point, the dynamic strength σd starts to decrease as further corrosion products are produced, leading to expansion stresses and crack propagation. However, SS-CASC underwent more severe corrosion, accelerating the formation of detrimental pores, which prevented any increase in dynamic strength.
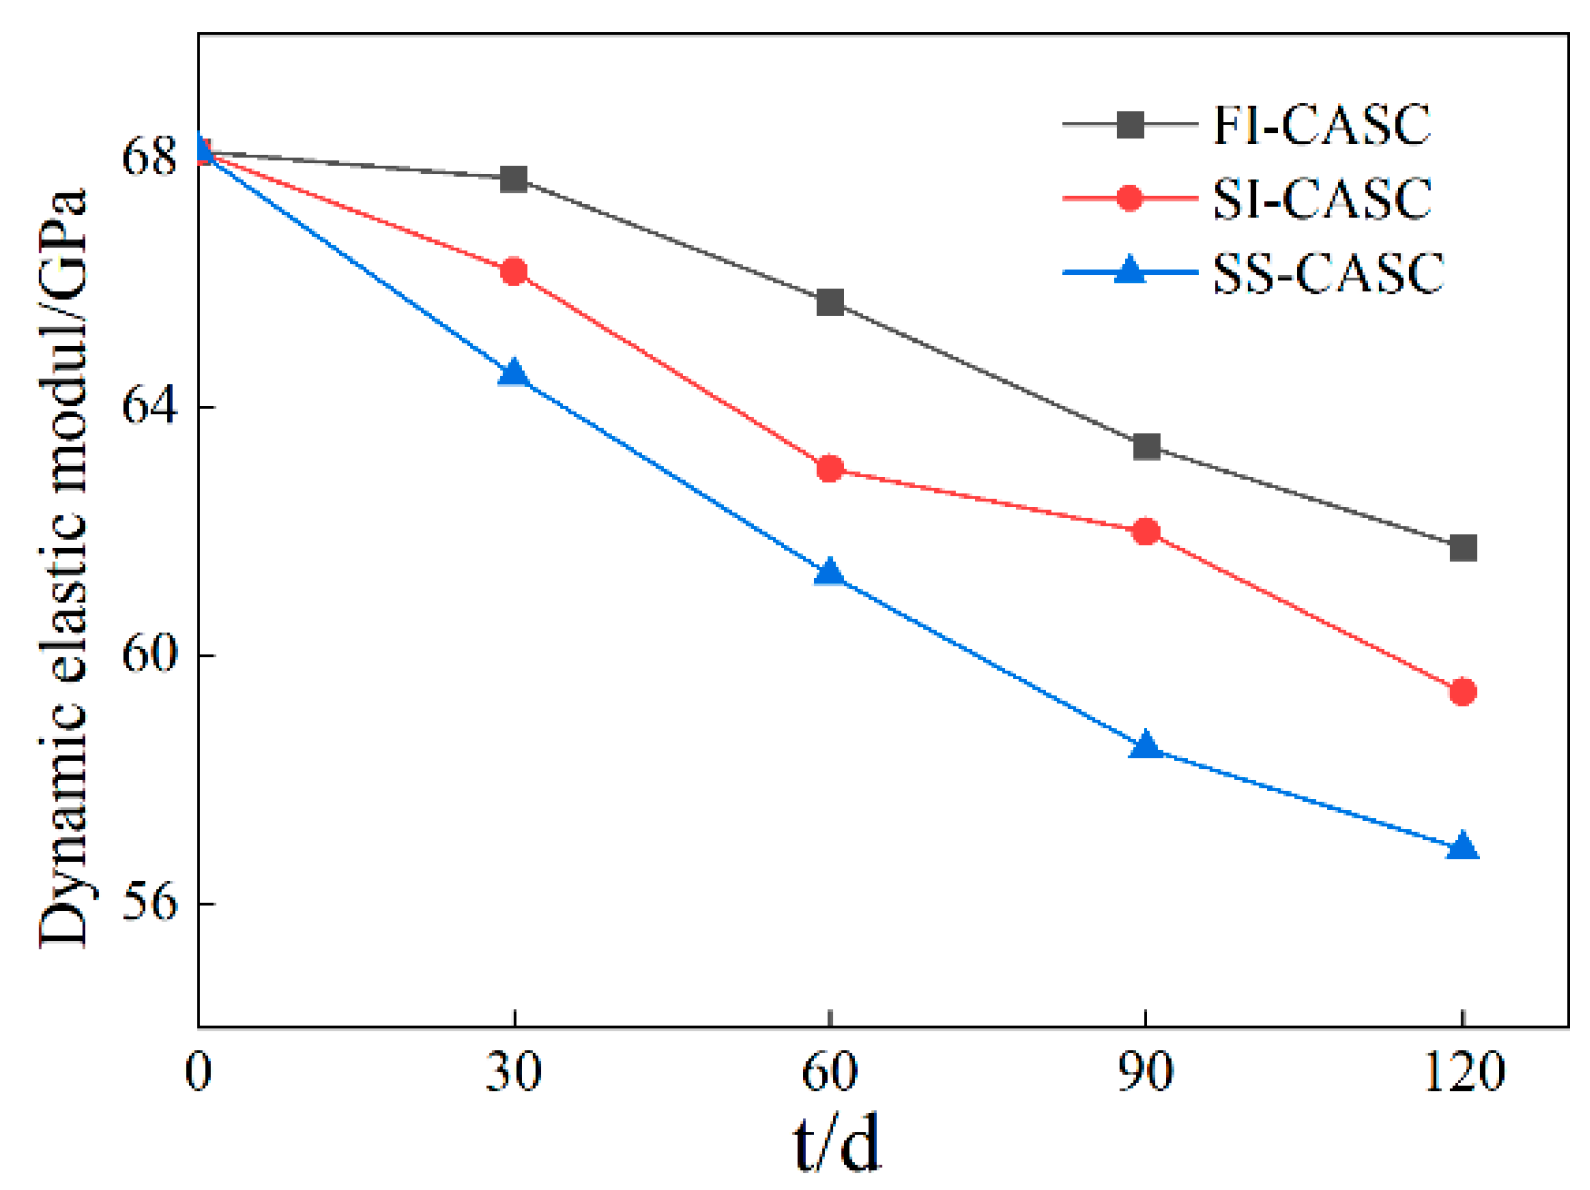
Figure 10 shows the changes in the dynamic elasticity modulus (Ed) of CASC specimens. As the corrosion time increases, Ed gradually decreases. The CASC specimens exposed to salt spray experienced a faster rate of decline in dynamic modulus of elasticity. When comparing the changes in Ed and dynamic strength over time, at t = 30 d of corrosion, the dynamic strength of CASC in full-immersion and semi-immersion areas exhibited varying degrees of increase [44]. However, the dynamic modulus of elasticity started to decrease slightly at t = 30 d. This is a significant difference between the dynamic elastic modulus and the dynamic strength of SI-CASC and FI-CASC. This indicates that during this stage, pores and micro-cracks resulting from the expansion of swelling corrosion products may exert minimal influence on strength due to their small dimensions. Thus, it did not significantly weaken strength but reduced the dynamic elastic modulus.

3.4. Strain-Rate Effects

The static compressive strength of CASC under different marine environments and corrosive time nodes obtained from the test [42], compared with the same corrosive conditions, found that the dynamic strength of CASC was about twice as much as the static compressive strength under the same corrosive conditions. This is due to the concrete’s strain rate absorbing more energy, leading to a large amount of energy being accumulated internally in the concrete, putting it in a high-stress state. This phenomenon is known as the strain-rate effect of concrete materials. Generally, the strain-rate effect of concrete materials can be characterized by the dynamic increase factor (DIF), which is calculated as follows:
D I F = σ d σ s
σd and σs are the SHPB dynamic strength and static compressive strength.
Figure 11 illustrates the changes in the DIF of CASC under various corrosion conditions and time intervals. The analysis revealed that DIF increased gradually with corrosion duration, exhibiting an inverse relationship with dynamic compressive strength. This suggests that while dynamic compressive strength decreased with corrosion, static compressive strength decreased faster. This phenomenon occurs because internal cracks develop in the concrete as corrosion progresses, causing the structure to weaken gradually. Static loading allows enough time for the detachment of the broken part of the specimen, leading to a decrease in the compression area and consequently reducing the nominal strength of the specimen under test.
Comparing the changes in DIF in the three corrosive environments, the full-immersion and half-immersion zones showed a decrease of around 30 d. This is because the corrosion products filled the internal voids of the concrete and became dense, and the static compressive strength was significantly enhanced. In contrast, the relative dynamic compressive strength was less enhanced, leading to decreased DIF. The dynamic modulus of elasticity Ed versus the strain rate of CASC in three marine environments and at different strain rates obtained from SHPB tests are shown in Figure 12. The variation curves of DIF at different strain rates are shown in Figure 13. Under all three corrosion conditions, both the dynamic elastic modulus and DIF of CASC exhibited a consistent strain-rate effect, increasing with the strain rate. This indicates an enhanced resistance to elastic deformation under higher loading rates. Furthermore, the strain-rate sensitivity of the DIF was most pronounced in the salt-spray zone, while being comparable between the semi-immersion and full-immersion environments.
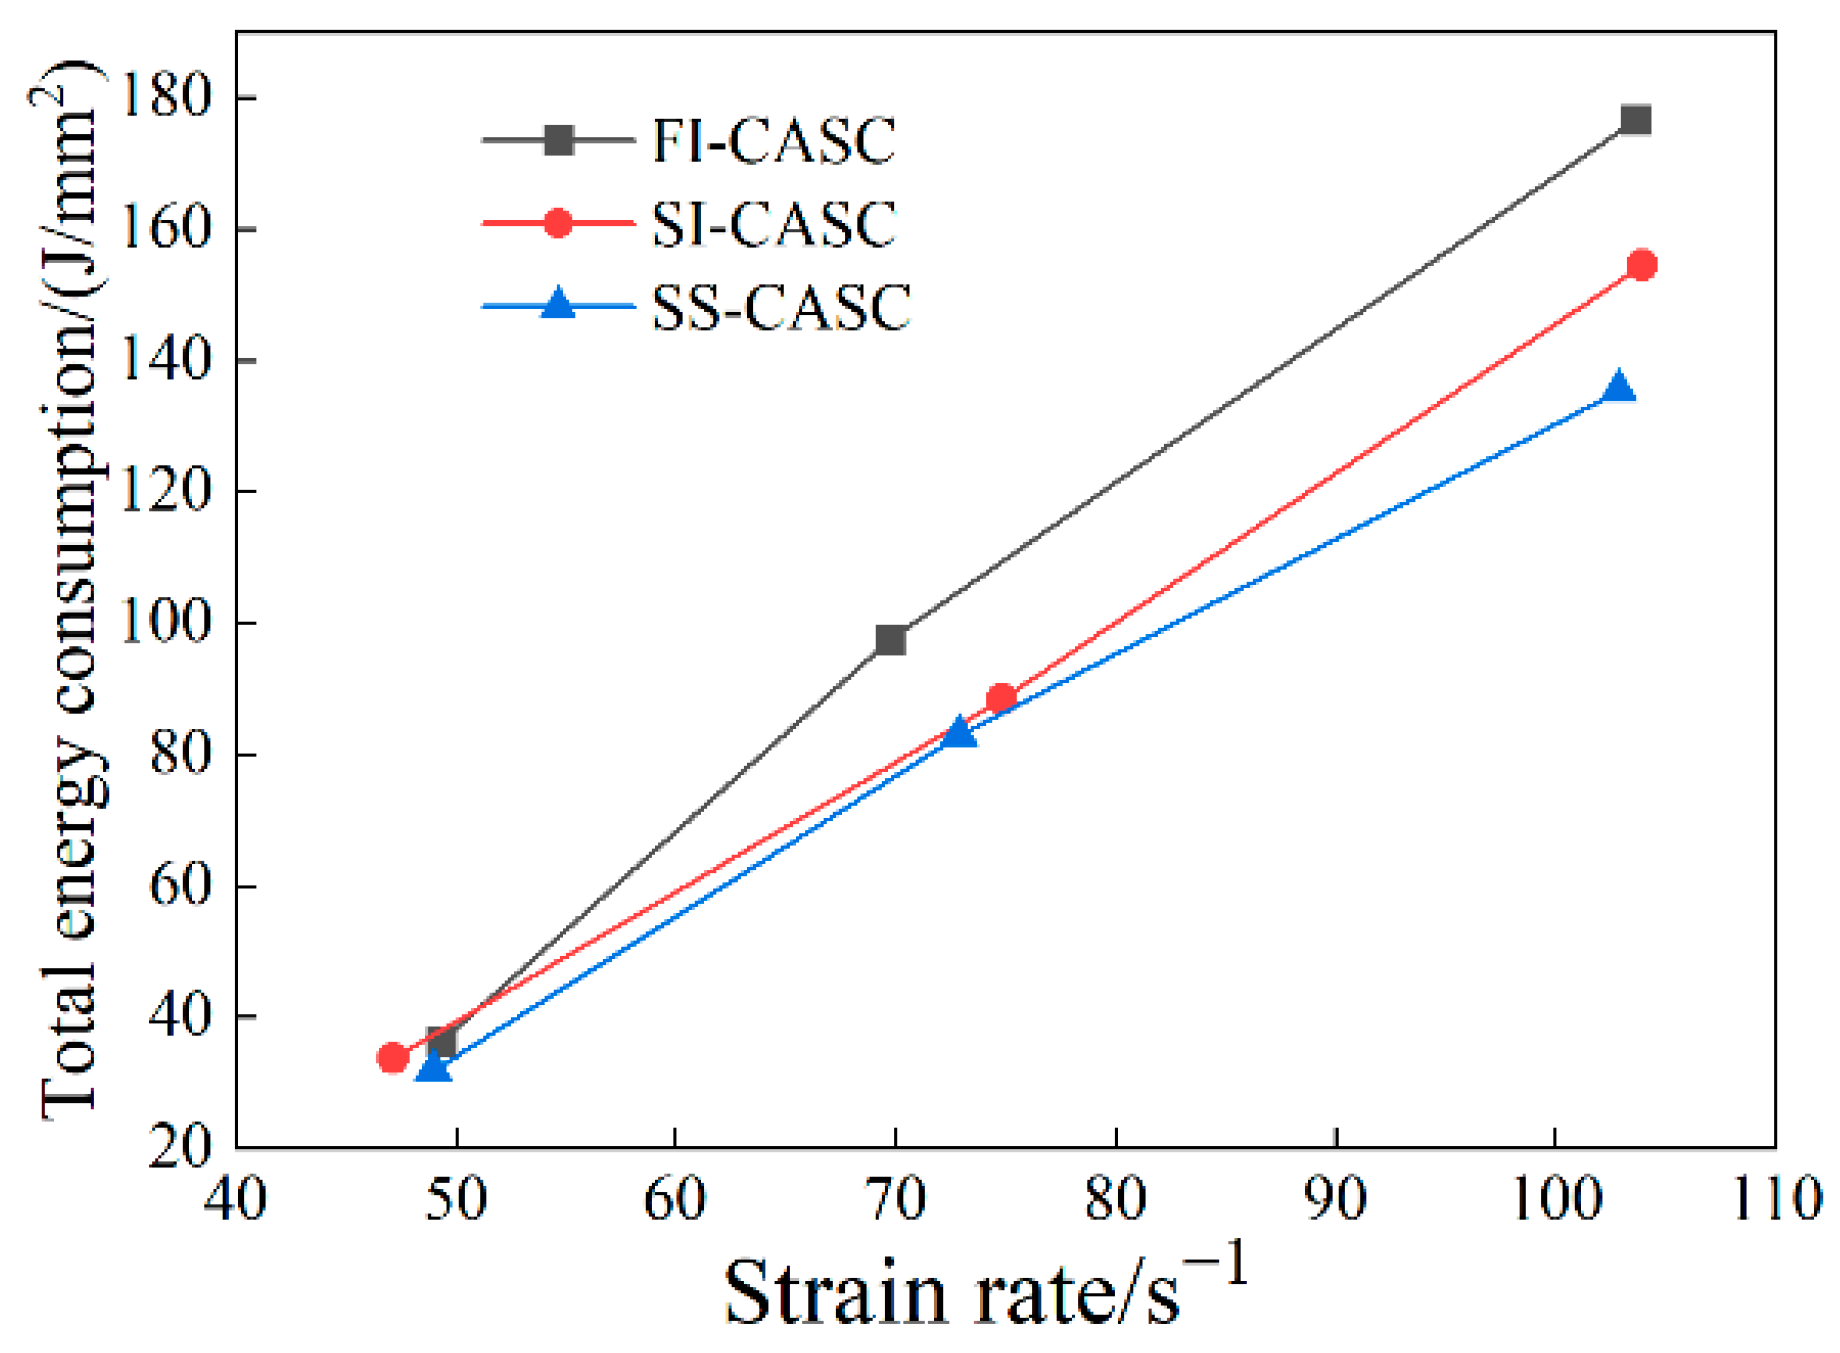
Figure 14 shows the variation curves of the total energy consumption of CASC under different strain rates, and the total energy consumption of CASC specimens under the three working conditions all increased significantly with the increase in strain rate, among which the total energy consumption in the salt-spray area was the most sensitive to the change in strain rate. When the CASC specimens reach high strain rates, more cracks are generated due to energy diffusion with larger diameters. CASC specimens produce more cracks in the cement paste and aggregate due to more energy input, the dynamic strength increases, and the spaces provided by the new cracks allow for greater deformation to dissipate the energy.

3.5. Peak Strain

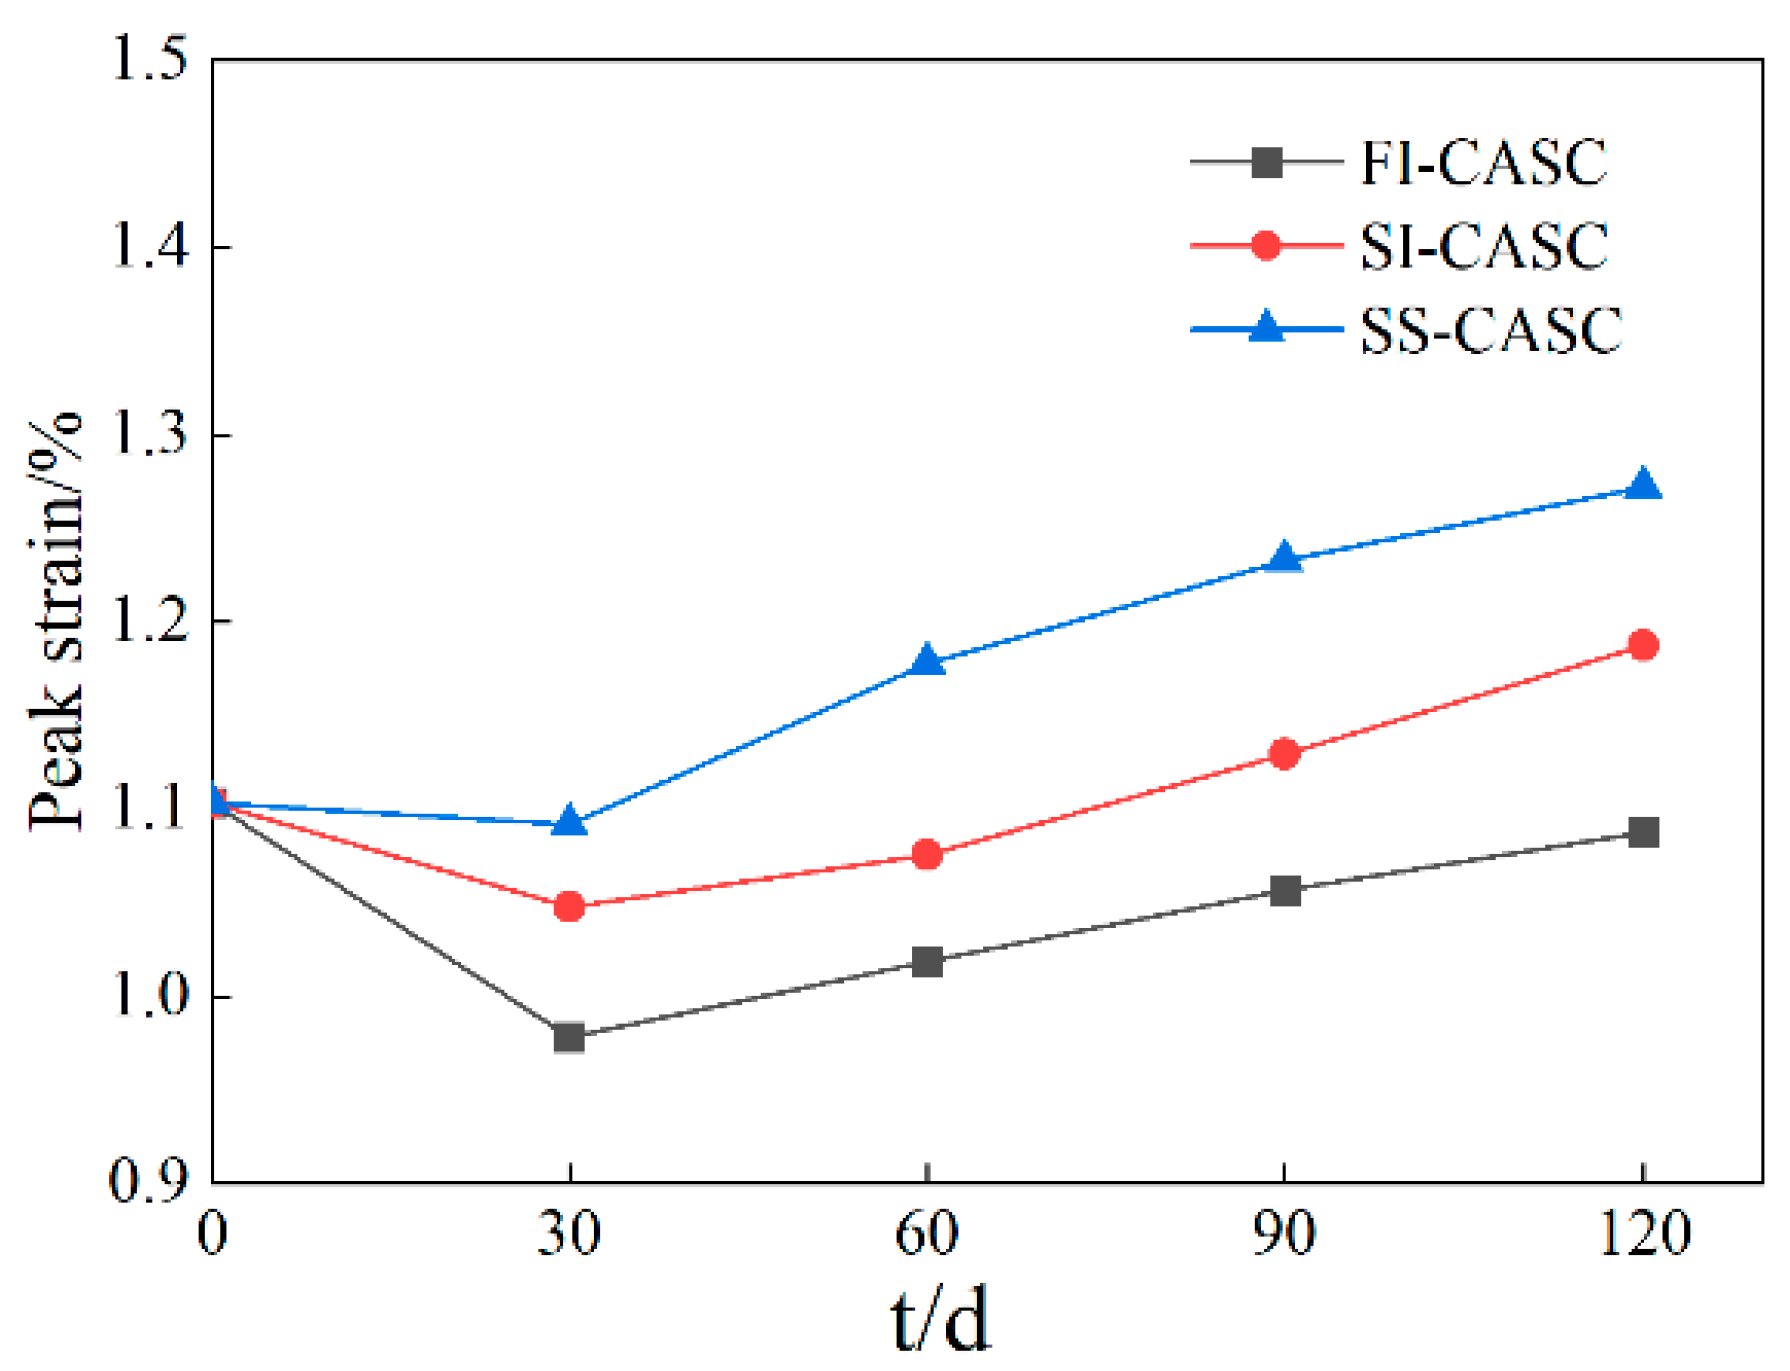
In the SHPB test, the peak strain corresponds to when the concrete material reaches its peak stress, reflecting the deformation capacity of the concrete material. Figure 15 shows the peak strain of CASC under different marine environments and corrosion time nodes. Under all three corrosion conditions, the peak strain of CASC specimens exhibited a consistent trend of an initial decrease followed by a subsequent increase with prolonged exposure. However, the initial decrease was most subtle in the salt-spray zone, while being more pronounced in both the semi-immersion and full-immersion zones. For any given corrosion time, the salt-spray zone consistently exhibited the highest peak strain, followed by the semi-immersion and full-immersion zones. In fact, with the wet and dry cycles, the corrosive ions invading the CASC produced many corrosion products, which increased and enlarged the internal pores of the specimens. Previous studies have found that specimen porosity and average pore size increase during hydrochloric acid corrosion of concrete [45]. These pores lead to a decrease in the compactness of CASC specimens while providing more space for the deformation of CASC, thus increasing the deformation capacity of CASC specimens. Therefore, when seawater and salt-spray corrosion proceeds to a certain extent, the peak strain of the specimen increases with the increase in corrosion time.

3.6. Analysis of Total Energy Consumption

The concrete material absorbs part of the energy of the incident wave from the beginning of the impact loading until it breaks and fails, and this energy is dissipated along the newly created cracks during the damage of the specimen. From the law of energy conservation, it can be seen that the energy absorbed and dissipated by the specimen during the loading process is equal. The energy absorbed per unit volume of concrete material during this process is called the total energy consumption, and its value is equivalent to the area enclosed by the stress–strain curve and the axes of the specimen during the loading process. Figure 16 shows the variation curve of total energy consumption of CASC, and the analysis finds that the total energy consumption in all three corrosion environments is a decreasing trend, with a decrease of 10.58% in the full-immersion zone, 18.85% in the semi-immersion zone, and 23.97% in the salt-spray zone at 120 d. The total energy consumption in the full-immersion zone was 10.58%, 18.85%, and 23.97%, respectively. In the full-immersion zone, the corrosion products filled the aggregate voids in the pre-corrosion period, which led to an increase in the energy consumption effect at 30 d.

3.7. Micro-Analysis

A scanning electron microscope (SEM) system was used to observe the microscopic morphology of CASC. Figure 17 shows the SEM image of uncorroded CASC; there is a small number of irregular cracks, micropores, and other initial damage, and the internal structure is relatively dense. Figure 18 shows the SEM images of full-immersion, semi-immersion and salt-spray CASC at 30 d of corrosion, respectively. At corrosion time t = 30 d, no particularly obvious corrosion products were found in the CASC in the full-immersion area, and only a small amount of clusters and rice grains were found. This indicates that in the initial stage of wet and dry cycles, only a small amount of harmful ions are in the concrete interior, the generation of corrosion products on the pore space mainly plays the role of filling, while the concrete continues the hydration process, the continued generation of C-S-H gel and Ca(OH)2; for CASC at this time, the densification and the initial state of the compactness is not much different, and there is even a small increase in its mechanical properties. The corrosion effect of CASC in the semi-immersion area and the salt-spray area is significant, and the presence of clusters of ettringite continues to diffuse and intertwine along the pores while generating more cracks and forming more ion channels to exacerbate the corrosion and damage process. Figure 19 shows the SEM images of full-immersion, semi-immersion, and salt-spray CASC at 120 d of corrosion, respectively. After 120 d of corrosion, a small amount of flaky and needle-like corrosion products were present on the surface of CASC under all three conditions. Micro-cracks were fully developed, some cracks penetrated through the material, and larger ion entry channels were formed.

4. Dynamic Model

Various impact-resistance performance indexes of CASC have a strong strain-rate effect under impact loading, but similar to the loading condition of static compression, its stress–strain curve is also divided into ascending and descending segments with the peak point as the boundary. Therefore, in this section, the curve of CASC specimens under different corrosion conditions and strain rates at a corrosion time of 120 d is fitted by using the Guo model of this paper. The model proposed by Guo adopts a cubic polynomial in the ascending segment and the rational segmented function in the descending segment to reflect the full curve of uniaxial compression stress–strain in concrete, and the equations are shown in Equations (4) and (5):
y = a x + a 2 x 3 + 3 2 a x 2 0 x 1
y = x b ( x 1 ) 2 + x x > 1
where x = ε ε c 1 , y = σ σ c 1 , both are dimensionless quantities, ε c is the peak strain, and σ c is the peak stress of the concrete. The advantages of the Guo model over the other models mentioned above are as follows:
  • Capable of capturing all geometric characteristics of the experimental curve, this model offers accurate fitting over a wide range of strains. Its broad applicability enables a superior representation of concrete’s stress performance.
  • There is only one parameter for each of the ascending and descending segments, and the parameters are independent of each other, so the formula is simple.
  • Parameters a and b have definite physical significance and can reflect the deformation modulus, deformation properties, etc., of concrete.
The fitted parameters of the ascending and descending segments and their phase relationships are shown in Table 6, and the comparisons of the fitted and actual curves are shown in Figure 20, Figure 21 and Figure 22.
From Table 6 and Figure 20, Figure 21 and Figure 22, it can be seen that the model fits the stress–strain curves under dynamic loading conditions better, and the fitted curves are in good agreement with the test curves. Its correlation coefficient of the rising section is more than 0.9, and the correlation coefficient of the falling section is lower than 0.8 due to the large discrete nature of the falling section, and the rest are all over 0.85.

5. Conclusions

This paper investigates the degradation patterns of the dynamic compressive resistance of CASC in various marine environments. An accelerated corrosion scheme was employed to corrode CASC specimens, followed by dynamic impact tests. The degradation of various properties was analyzed and studied, leading to the following key conclusions:
(1)
The dynamic strength, dynamic modulus of elasticity, and total energy consumption of CASC specimens under the three corrosion conditions decreased substantially with the corrosion time during the 120 d corrosion cycle, and the degree in decrease was largest in the salt-spray zone, followed by the semi-immersion zone, and smallest in the full-immersion zone. However, due to the pore-filling effect of CASC caused by corrosion products, the dynamic strength and total energy consumption of the specimens located in the full-immersion zone appeared to be elevated at 30 d of corrosion, whereas those located in the salt-spray zone showed monotonically decreasing dynamic strength and total energy consumption. Combining the trends of dynamic strength of CASC in the full-immersion and semi-immersion zones, it can be surmised that a similar critical point exists in the early stage of corrosion for the specimens with CASC located in the salt-spray zone, after which the effect of corrosion products on CASC is dominated by destruction. It is noteworthy that the dynamic elastic moduli of both SI-CASC and FI-CASC demonstrate a continuous decline, contrasting with the trend in dynamic strength. This behavior is attributed to the formation of fine micro-cracks and pores from corrosion-product expansion. While these defects have an insignificant effect on dynamic strength, they substantially reduce the dynamic elastic modulus.
(2)
The DIF under the three corrosion conditions increases with the increase in corrosion time and strain rate, and the size was largest in the salt-spray zone, followed by the semi-immersion zone, and smallest in the full-immersion zone. When the corrosion time is the same, with the increase in strain rate, the dynamic strength of CASC in all three conditions shows a stronger strain-rate effect than that of ordinary concrete, which is mainly due to the fact that under stronger impact loading, CASC specimens produce a large number of cracks in a short time in order to obtain the shortest energy release path, and due to the low strength of coral aggregate itself, the cracks can directly pass through the coral aggregate to dissipate the energy, thus making the dynamic strength increase.
(3)
The stress–strain curves of CASC with a corrosion time of 120 d at different strain rates were fitted using the Guo model, which was a good fit, with the correlation coefficients of the ascending segments being greater than 0.9, and the correlation parameters of the coefficients of the descending segments being greater than 0.85, except for a few data. Its effectiveness was verified, and insights were provided for the application of CASC in engineering.
For future research, the authors suggest conducting studies on the mechanical properties of coral concrete components after exposure to various corrosive environments and exploring their dynamic responses under complex conditions. Additionally, at the micro-mechanical level, it is recommended to use homogenization methods to investigate coral concrete under different corrosive environments and conduct a more in-depth analysis of the mechanism of performance degradation.

Author Contributions

Y.Z.: Investigation, Project Administration, Funding Acquisition, Resources, Conceptualization, Methodology, Data Curation. Y.L. (Yansong Luo): Writing—Original Draft, Data Curation, Visualization, Formal Analysis, Methodology. J.Z.: Writing—Original Draft, Writing—Review and Editing, Data Curation, Investigation, Formal Analysis, Visualization, Methodology, Conceptualization. S.H.: Investigation, Formal Analysis, Visualization, Methodology, Conceptualization. Y.L. (Yuejing Luo): Data Curation, Investigation, Formal Analysis, Visualization, Methodology, Conceptualization. P.Y.: Project Administration, Funding Acquisition, Writing—Review and Editing, Resources, Conceptualization, Data Curation. All authors have read and agreed to the published version of the manuscript.

Funding

This research was funded by the General Program of Guangxi Science and Technology Base and Talent Project (AD23026015), General Program of Natural Science Foundation of Guangxi Province (2024GXNSFAA010206), National Natural Science Foundation of China (12472380), and Natural Science and Technology Innovation Development Multiplication Program of Guangxi University (2023BZRC020).

Data Availability Statement

The original contributions presented in this study are included in the article. Further inquiries can be directed at the corresponding author.

Conflicts of Interest

Authors Yi Zhong and Yuejing Luo were employed by the company Hualan Design and Consulting Group Company Ltd. Author Sheng He was employed by the company Guangxi Bossco Environmental Protection Technology Co., Ltd. Author Yuejing Luo was employed by the company Guangxi Polytechnic of Construction. The remaining authors declare that the research was conducted in the absence of any commercial or financial relationships that could be construed as a potential conflict of interest.

References

  1. Caras, T.; Pasternak, Z. Long-term environmental impact of coral mining at the Wakatobi marine park, Indonesia. Ocean Coast. Manag. 2009, 52, 539–544. [Google Scholar] [CrossRef]
  2. Rasmusson, I.S. Concrete at Advance Bases. J. Am. Concr. Inst. 1946, 17, 541–551. [Google Scholar]
  3. Cao, Y.; Bao, J.; Zhang, P.; Sun, Y.; Cui, Y. A state-of-the-art review on the durability of seawater coral aggregate concrete exposed to marine environment. J. Build. Eng. 2022, 60, 105199. [Google Scholar] [CrossRef]
  4. Zhang, J.; Wu, Z.; Zhang, Y.; Fang, Q.; Yu, H.; Jiang, C. Mesoscopic characteristics and macroscopic mechanical properties of coral aggregates. Constr. Build. Mater. 2021, 309, 125125. [Google Scholar] [CrossRef]
  5. Lyu, B.; Wang, A.; Zhang, Z.; Liu, K.; Xu, H.; Shi, L.; Sun, D. Coral aggregate concrete: Numerical description of physical, chemical and morphological properties of coral aggregate. Cem. Concr. Compos. 2019, 100, 25–34. [Google Scholar] [CrossRef]
  6. Shi, Z.; Shui, Z.; Li, Q.; Geng, H. Combined effect of metakaolin and sea water on performance and microstructures of concrete. Constr. Build. Mater. 2015, 74, 57–64. [Google Scholar] [CrossRef]
  7. Zhang, X.; Zuo, J.; Wang, Z.; Cai, Y.; Zhou, Y. The evolution of the microstructure and mechanical properties of coral aggregate mortar under uniaxial compression using ultrasonic analysis. Constr. Build. Mater. 2021, 300, 124000. [Google Scholar] [CrossRef]
  8. Su, W.; Liu, J.; Liu, L.; Chen, Z.; Shi, C. Progresses of high-performance coral aggregate concrete (HPCAC): A review. Cem. Concr. Compos. 2023, 140, 105059. [Google Scholar] [CrossRef]
  9. Ma, L.; Li, Z.; Wang, M.; Wei, H.; Fan, P. Effects of size and loading rate on the mechanical properties of single coral particles. Powder Technol. 2019, 342, 961–971. [Google Scholar] [CrossRef]
  10. Huang, Y.; Li, X.; Lu, Y.; Wang, H.; Wang, Q.; Sun, H.; Li, D. Effect of mix component on the mechanical properties of coral concrete under axial compression. Constr. Build. Mater. 2019, 223, 736–754. [Google Scholar] [CrossRef]
  11. Ma, L.; Li, Z.; Liu, J.; Duan, L.; Wu, J. Mechanical properties of coral concrete subjected to uniaxial dynamic compression. Constr. Build. Mater. 2019, 199, 244–255. [Google Scholar] [CrossRef]
  12. Wu, W.; Wang, R.; Zhu, C.; Meng, Q. The effect of fly ash and silica fume on mechanical properties and durability of coral aggregate concrete. Constr. Build. Mater. 2018, 185, 69–78. [Google Scholar] [CrossRef]
  13. Chen, X.; Yu, H.; Ma, H.; Xu, Y.; Gao, Y.; Mei, Q.; Dou, X.; Da, B. Analysis of service life and reliability of C50CASC structures in the splash zone of the South China Sea. Constr. Build. Mater. 2024, 441, 137524. [Google Scholar] [CrossRef]
  14. Hosseinzadehfard, E.; Mobaraki, B. Investigating concrete durability: The impact of natural pozzolan as a partial substitute for microsilica in concrete mixtures. Constr. Build. Mater. 2024, 419, 135491. [Google Scholar] [CrossRef]
  15. Hosseinzadehfard, E.; Mobaraki, B. Corrosion performance and strain behavior of reinforced concrete: Effect of natural pozzolan as partial substitute for microsilica in concrete mixtures. Structures 2025, 79, 109397. [Google Scholar] [CrossRef]
  16. Alexander, A.E.; Shashikala, A.P. Studies on the mechanical and durability performance of textile reinforced geopolymer concrete beams. Mater. Today Commun. 2023, 35, 105837. [Google Scholar] [CrossRef]
  17. Gaylarde, C.C.; Ortega-Morales, B.O. Biodeterioration and Chemical Corrosion of Concrete in the Marine Environment: Too Complex for Prediction. Microorganisms 2023, 11, 2438. [Google Scholar] [CrossRef]
  18. Noushini, A.; Castel, A.; Aldred, J.; Rawal, A. Chloride diffusion resistance and chloride binding capacity of fly ash-based geopolymer concrete. Cem. Concr. Compos. 2020, 105, 103290. [Google Scholar] [CrossRef]
  19. Homayoonmehr, R.; Ramezanianpour, A.A.; Mirdarsoltany, M. Influence of metakaolin on fresh properties, mechanical properties and corrosion resistance of concrete and its sustainability issues: A review. J. Build. Eng. 2021, 44, 103011. [Google Scholar] [CrossRef]
  20. Kim, S.; Kim, Y.; Usman, M.; Park, C.; Hanif, A. Durability of slag waste incorporated steel fiber-reinforced concrete in marine environment. J. Build. Eng. 2021, 33, 101641. [Google Scholar] [CrossRef]
  21. Aziz, M.A.; Aleem, S.A.; Heikal, M.; Didamony, H. Hydration and durability of sulphate-resisting and slag cement blends in Caron’s Lake water. Cem. Concr. Res. 2005, 35, 1592–1600. [Google Scholar] [CrossRef]
  22. Li, F.; Yuan, Y.; Li, C.-Q. Corrosion propagation of prestressing steel strands in concrete subject to chloride attack. Constr. Build. Mater. 2011, 25, 3878–3885. [Google Scholar] [CrossRef]
  23. Da, B.; Yu, H.; Ma, H.; Tan, Y.; Mi, R.; Dou, X. Chloride diffusion study of coral concrete in a marine environment. Constr. Build. Mater. 2016, 123, 47–58. [Google Scholar] [CrossRef]
  24. Liu, W.; Du, H.; Li, Y.; Yi, P.; Luo, Y.; Tang, L.; Xing, F. Effects of chloride content on early hydration performance of cement pastes. Mater. Today Commun. 2023, 35, 106257. [Google Scholar] [CrossRef]
  25. Geng, J.; Easterbrook, D.; Li, L.; Mo, L. The stability of bound chlorides in cement paste with sulfate attack. Cem. Concr. Res. 2015, 68, 211–222. [Google Scholar] [CrossRef]
  26. Yu, H.; Da, B.; Ma, H.; Dou, X.; Wu, Z. Service life prediction of coral aggregate concrete structure under island reef environment. Constr. Build. Mater. 2020, 246, 118390. [Google Scholar] [CrossRef]
  27. Huang, D.; Niu, D.; Su, L.; Liu, Y.; Guo, B.; Xia, Q.; Peng, G. Diffusion behavior of chloride in coral aggregate concrete in marine salt-spray environment. Constr. Build. Mater. 2022, 316, 125878. [Google Scholar] [CrossRef]
  28. Wang, G.; Wu, Q.; Zhou, H.; Peng, C.; Chen, W. Diffusion of chloride ion in coral aggregate seawater concrete under marine environment. Constr. Build. Mater. 2021, 284, 122821. [Google Scholar] [CrossRef]
  29. Zhang, B.; Zhu, H. Durability of seawater coral aggregate concrete under seawater immersion and dry-wet cycles. J. Build. Eng. 2023, 66, 105894. [Google Scholar] [CrossRef]
  30. Zhang, B.; Peng, H.; Xiong, T.; Zhu, H. Towards enhancing the durability of seawater coral aggregate concrete under drying-wetting cycles with slag-based geopolymers. J. Sustain. Cem. Based Mater. 2024, 13, 389–401. [Google Scholar] [CrossRef]
  31. Qin, Q.; Meng, Q.; Mei, Q.; Wu, K.; Wang, C.; Zhang, J. Dynamic response characteristics of coral reef sand concrete under impact loading. J. Build. Eng. 2023, 66, 105847. [Google Scholar] [CrossRef]
  32. Ma, H.; Yue, C.; Yu, H.; Mei, Q.; Chen, L.; Zhang, J.; Zhang, Y.; Jiang, X. Experimental study and numerical simulation of impact compression mechanical properties of high strength coral aggregate seawater concrete. Int. J. Impact Eng. 2020, 137, 103466. [Google Scholar] [CrossRef]
  33. Wang, Z.; Li, P.; Han, Y.; Hao, R.; Liu, W. Dynamic compressive properties of seawater coral aggregate concrete (SCAC) reinforced with mono or hybrid fibers. Constr. Build. Mater. 2022, 340, 127801. [Google Scholar] [CrossRef]
  34. Fu, Q.; Xu, W.; He, J.; Su, L.; Song, H.; Niu, D. Dynamic strength criteria for basalt fibre-reinforced coral aggregate concrete. Compos. Commun. 2021, 28, 100983. [Google Scholar] [CrossRef]
  35. Qin, Y.; Xu, D.; Zhang, S.; Fan, X. Dynamic behavior of carbon nanotubes and basalt fiber reinforced coral sand cement mortar at high strain rates. Constr. Build. Mater. 2022, 340, 127396. [Google Scholar] [CrossRef]
  36. Guo, J.; Yu, H.; Ma, H.; Wu, Z. Damage and deterioration characteristics of basic magnesium sulfate cement-coral aggregate concrete exposed to elevated temperature. Eng. Fail. Anal. 2022, 137, 106275. [Google Scholar] [CrossRef]
  37. Chen, B.; Yu, H.; Zhang, J.; Ma, H. Evolution law of crack propagation and crack mode in coral aggregate concrete under compression: Experimental study and 3D mesoscopic analysis. Theor. Appl. Fract. Mech. 2022, 122, 103663. [Google Scholar] [CrossRef]
  38. JGJ 12-2006; Technical Specification for Lightweight Aggregate Concrete Structures. National Standards of the Republic of China: Beijing, China, 2006.
  39. JGJ 55-2011; Specification for Mix Proportion Design of Ordinary Concrete. Ministry of Housing and Urban-Rural Development of the People’s Republic of China: Beijing, China, 2011.
  40. T/CECS 694-2020; Technical Specification for Coral Aggregate Concrete. China Academy of Building Research: Beijing, China, 2020.
  41. GB/T 50082; Standard for Test Methods of Long-Term Performance and Durability of Ordinary Concrete. Ministry of Housing and Urban-Rural Development of PRC: Beijing, China, 2009.
  42. Yu, P.; Qin, K.; Chen, Z.; Ren, Z.; Zhang, J. Degradation Behavior of Coral Concrete Exposed to Different Marine Environments. 2026. Available online: https://dl.astm.org/jte/article-abstract/doi/10.1520/JTE20240546/30299/Degradation-Behavior-of-Coral-Concrete-Exposed-to?redirectedFrom=fulltext (accessed on 21 October 2025).
  43. Gray, G.T., III. Classic Split-Hopkinson Pressure Bar Testing. In Mechanical Testing and Evaluation; Kuhn, H., Medlin, D., Eds.; ASM International: Almere, The Netherlands, 2000; pp. 462–476. ISBN 978-1-62708-176-4. [Google Scholar]
  44. Huang, D.; Niu, D.; Su, L.; Pan, D.; Liu, Y. Durability of coral aggregate concrete under coupling action of sulfate, chloride and drying-wetting cycles. Case Stud. Constr. Mater. 2022, 16, e01003. [Google Scholar] [CrossRef]
  45. Yu, P.; Qiu, H.; He, S.; Qin, Y.; Zhou, Y. Pore structure and prediction of mechanical properties by ANN of concrete mixed MK and SF under hydrochloric acid corrosion. Constr. Build. Mater. 2023, 409, 133665. [Google Scholar] [CrossRef]
Figure 1. Coral sand.
Buildings 15 04288 g001
Figure 2. Coral coarse aggregate.
Buildings 15 04288 g002
Figure 3. Drying-wet circle test equipment and placing method of samples in the box. (a) Dry and wet cycle tester; (b) horizontal placement of CASC specimens in the box; (c) vertical placement of the specimen in the box.
Buildings 15 04288 g003
Figure 4. Schematic illustration of the SHPB system.
Buildings 15 04288 g004
Figure 5. Waveforms for rod impact and strain-rate calculation method. (a) Waveforms for rod impact; (b) strain-rate calculation method.
Buildings 15 04288 g005
Figure 6. Shock compression failures of CASC at different strain rates.
Buildings 15 04288 g006
Figure 7. Impact compressive stress–strain curves of CASC under different corrosion times. ( ε ˙ = 65 s−1∼75 s−1). (a) FI-CASC; (b) SI-CASC; (c) SS-CASC.
Buildings 15 04288 g007
Figure 8. Impact compressive stress–strain curves of CASC at different strain rates (t = 120 d). (a) FI-CASC; (b) SI-CASC; (c) SS-CASC.
Buildings 15 04288 g008
Figure 9. Dynamic strength curves of CASC under different corrosive environments with corrosion time ( ε ˙ = 65 s−1∼75 s−1).
Buildings 15 04288 g009
Figure 10. Dynamic elastic modulus Ed of CASC decreases with the corrosion time in different corrosive environments ( ε ˙ = 65 s−1∼75 s−1).
Buildings 15 04288 g010
Figure 11. DIF of CASC under different corrosive environments with corrosion time ( ε ˙ = 45 s−1∼50 s−1).
Buildings 15 04288 g011
Figure 12. Dynamic elastic modulus of CASC increases as the strain rate increases. (t = 120 d).
Buildings 15 04288 g012
Figure 13. DIF variation curve of CASC increases as the strain rate increases. (t = 120 d).
Buildings 15 04288 g013
Figure 14. Total energy consumption curve of CASC increases as the strain rate increases. (t = 120 d).
Buildings 15 04288 g014
Figure 15. Change curve of peak strain of CASC at different corrosion time t ( ε ˙ = 45 s−1∼50 s−1).
Buildings 15 04288 g015
Figure 16. Total energy consumption curve of CASC at different corrosion times ( ε ˙ = 65 s−1∼75 s−1).
Buildings 15 04288 g016
Figure 17. SEM image of uncorroded CASC.
Buildings 15 04288 g017
Figure 18. SEM images of full-immersion, semi-immersion, and salt-spray CASC at 30 d of corrosion. (a) FI-CASC; (b) SI-CASC; (c) SS-CASC.
Buildings 15 04288 g018
Figure 19. SEM images of full-immersion, semi-immersion, and salt-spray CASC at 120 d of corrosion. (a) FI-CASC; (b) SI-CASC; (c) SS-CASC.
Buildings 15 04288 g019
Figure 20. Comparison diagram of stress–strain curves fitting for dynamic compressive test (t = 120 d, FI-CASC). (a) 49.35 s−1; (b) 69.72 s−1; (c) 103.67 s−1.
Buildings 15 04288 g020
Figure 21. Comparison diagrams of stress–strain curves fitting for dynamic compressive test (t = 120 d, SI-CASC). (a) 47.13s−1; (b) 74.82 s−1; (c) 103.95 s−1.
Buildings 15 04288 g021
Figure 22. Comparison diagram of stress–strain curves fitting for dynamic compressive test (t = 120 d, SS-CASC). (a) 48.98 s−1; (b) 72.91 s−1; (c) 102.88 s−1.
Buildings 15 04288 g022
Table 1. Chemical composition of cement.
Chemical
Component
CaOSiO2Al2O3Fe2O3SO3MgOOther
Mass fraction (%)65.2421.125.344.631.581.250.84
Table 2. Main performance indexes of fine aggregate.
Fine ModulusApparent Density
(g × cm−3)
Stacking Density
(g × cm−3)
Moisture Content
(%)
Dust Content
(%)
3.02.8001.2982.9%0.5%
Table 3. Main mechanical properties of coarse aggregate.
Apparent Density
(g × cm−3)
Bulk Density
(g × cm−3)
Water Content
(%)
Dust Content
(%)
Press Strength (MPa)Particle Gradation (mm)
1.8410.9152.62.93.15~20
Table 4. Coral concrete mix ratio.
Cement
(kg × m−3)
Coral
(kg × m−3)
Coral Sand (kg × m−3)Seawater Consumption
(kg × m−3)
Water Reducer (kg × m−3)Water-Binder RatioThe Sand Coarse Aggregate Ratio
708531614248120.350.54
Table 5. Dynamic strength σd of CASC at different corrosion times ( ε ˙ = 65 s−1∼75 s−1).
t/dσd/MPa
FI-CASCSI-CASCSS-CASC
086.9486.9486.94
3091.7589.1783.84
6088.1385.7481.39
9085.6583.7877.58
12082.6679.1973.99
Table 6. Stress–strain curve fitting parameters of CASC (t = 120 d).
ID ε ˙ /s−1Rising PhaseDescending Phase
a R 2 b R 2
FI-CASC49.350.5110.98452515.1390.7606
69.72−0.6160.98504.9390.8970
103.671.6910.99032.9270.8687
SI-CASC47.13−0.4200.9166309.8850.9694
74.820.2440.96706.0890.8770
103.951.2590.99605.2700.9600
SS-CASC48.98−0.1670.93631715.1560.9539
72.910.3080.989913.2080.9730
102.881.6420.9963.8810.8797
Disclaimer/Publisher’s Note: The statements, opinions and data contained in all publications are solely those of the individual author(s) and contributor(s) and not of MDPI and/or the editor(s). MDPI and/or the editor(s) disclaim responsibility for any injury to people or property resulting from any ideas, methods, instructions or products referred to in the content.