Article

Occupant-Centric Control of Split Air Conditioners, Personal Desktop Fans and Lights Based on Wi-Fi Probe Technology

1
College of Civil Engineering, Hunan University, Changsha 410082, China
2
Key Laboratory of Building Safety and Energy Efficiency of Ministry of Education, Hunan University, Changsha 410082, China
*
Author to whom correspondence should be addressed.
Buildings 2025, 15(23), 4285; https://doi.org/10.3390/buildings15234285
Submission received: 31 October 2025 / Revised: 22 November 2025 / Accepted: 25 November 2025 / Published: 26 November 2025

Abstract

Although research on occupancy detection has been extensive, most studies have focused on improving detection accuracy, while the application of occupancy models to device control remains limited. This paper presented an occupant-centric control (OCC) of split air conditioners, personal desktop fans, and lights based on the Wi-Fi probe technology, Internet of Things (IoT), and time-of-use (TOU) electricity rates. Firstly, a machine-learning model based on Wi-Fi signals for occupancy detection was developed. The occupancy detection model integrated convolutional neural networks, gradient boosting classifier, and random forest (CNN-GBC-RF) models to identify four types of occupant statuses: arrival, leave, stay, and outside. Subsequently, the occupancy status and TOU rates information were integrated with IoT-enabled devices to dynamically control the space split air conditioners, personal desktop fans, and personal lights. This study implemented two experimental scenarios: a baseline scenario with fixed device operations and an OCC scenario. The OCC scenario dynamically adjusted device operation based on real-time occupancy status, TOU electricity rates, desktop illuminances, and dry-bulb air temperatures. Finally, a 16-day experiment was conducted in a multi-occupant office room to evaluate both occupancy detection model performance and the effectiveness of the proposed OCC-based scenario. Subjective questionnaires were collected to evaluate the thermal comfort under different scenarios. The results showed that the CNN-GBC-RF model had an overall detection accuracy of 97.0%. Additionally, the OCC-based scenario achieved a relative reduction of 39.9%, a relative reduction of 41.6% compared to the baseline scenario. The thermal comfort of the occupants under the OCC scenario was close to the baseline scenario. The results indicated that the proposed OCC-based control scenario contributed to improving energy efficiency while maintaining occupant thermal comfort.

1. Introduction

In 2020, the energy consumption of building operation and building construction in China accounted for about 21% and 10% of China’s total primary energy consumption, respectively [1]. This phenomenon highlights the urgent need and significant potential for improving energy efficiency in the building sector and reducing carbon emissions [2]. One critical challenge is the increasing stress on the power grid, especially during the peak load periods, which can even lead to blackouts [3]. Demand response (DR) is a highly effective strategy to mitigate this issue by leveraging the energy flexibility of buildings to reduce or shift electricity demand during peak hours [4].
Deploying the DR control strategies in buildings enables both electricity cost savings and peak load reduction. One commonly used strategy is temperature reset, in which the HVAC setpoint temperature is increased during peak periods compared to normal periods. Hu et al. [5] investigated the effectiveness of the temperature reset strategy in a residential bedroom in Hong Kong. They found that increasing the setpoint temperature by 2 °C resulted in a 66.15% reduction in peak load. Peng et al. [6] utilized temperature reset strategy to analyze the DR potential of urban buildings in Changsha City, China. This approach resulted in an increase in indoor temperature, which thereby compromised occupant thermal comfort. Another DR control strategy was to implement compensatory measures before the peak period, such as pre-cooling [7,8]. Nelson et al. [9] adopted the strategy involving pre-cooling air and building envelope before the peak period, with a subsequent setpoint setback during the peak period in a residential building. The simulation results indicated that the strategy achieved annual economic savings of 14.9% in Kona compared to the fixed setpoint strategy. Dehwah et al. [10] also proposed a pre-cooling strategy utilizing the thermal inertia of the building envelope to pre-cool a medium office building. Jiang et al. [11] conducted a model predictive control-based pre-cooling strategy in single-family homes. Most research related to DR were based on simulation, and the temperature reset strategy may compromise occupant satisfaction.
Among the diverse drivers of energy consumption in buildings, occupant behavior (OB) is one of the key factors influencing building energy consumption [12]. Analyzing OB and using it as the basis for building system control enables occupant-centric control (OCC) [13]. OCC has been proposed as a control strategy based on occupant presence and behavior [14], aiming to balance occupant comfort with energy efficiency [15]. Yuan et al. [16] conducted a pre-heating experiment based on a data-driven model of air conditioner usage behavior. Mahmud et al. [17] proposed an occupancy-based control method that adjusts the cooling setpoint temperature and the on/off states of lighting. However, existing studies on OCC primarily focus on occupant satisfaction without considering the specific requirements of DR events, such as reducing electricity costs based on time-of-use (TOU) rates.
OCC can be achieved through occupancy detection technologies to obtain occupancy information, including occupant presence, number, and location. Table 1 summarizes studies related to occupancy detection. Occupancy detection technologies can be categorized into intrusive and non-intrusive methods [18]. Intrusive occupancy detection methods commonly include deploying cameras, installing audio sensors within the room, or requiring the occupants to wear location-tracking tags. Sun et al. [19] utilized cameras, audio sensors, and temperature sensors to achieve indoor presence detection. Tan et al. [20] integrated environmental sensor data, image data, and audio data for presence detection in residential buildings. The aforementioned methods involved challenges related to occupant privacy. Li et al. [21] deployed an Ultra-Wideband indoor positioning system to collect occupant trajectory data. This way required occupants to wear additional location-tracking devices, thereby increasing their burden. Non-intrusive occupancy detection methods include utilizing environmental sensors, passive infrared sensors [22], and Wi-Fi signal indirectly. Banihashemi et al. and Wang et al. [23,24] indirectly achieve presence/absence detection by temperature and humidity sensors and CO2 concentration sensors. With the widespread utilization of smartphones and Wi-Fi access points (APs), occupancy detection approaches based on Wi-Fi signals were adopted. Salman et al. [25] developed an adaptive binary classification model for occupant presence based on Wi-Fi channel state information (CSI). This approach demonstrated an accuracy of 98.25%. Abolhassani et al. [26] utilized Wi-Fi CSI combined with Random Forest models to estimate occupant numbers. The developed model achieved a testing accuracy of 77%. The aforementioned studies mainly focus on improving the accuracy of occupancy detection algorithms, with limited exploration of integrating occupancy models into real device control to evaluate building energy performance.
Utilizing the developed occupancy detection model to control energy-consuming devices facilitates enhanced building energy management. Zou et al. [27] developed a model based on Wi-Fi signals to detect occupancy and control lighting accordingly. The model achieved an average accuracy of 98.85%. Compared to static scheduling, the occupancy-driven control strategy resulted in an 82.83% energy saving of artificial lights in a multi-functional office building. Wang et al. [28] proposed an ensemble learning model based on Wi-Fi signals to predict occupant numbers, thereby adjusting fresh air volume and cooling load of HVAC systems. Gao et al. [29] developed an occupant-based control of a lighting system based on Wi-Fi signal. The system then automatically controlled desktop lights based on the detected occupancy states. The occupancy detection model achieved an accuracy of 69.7%. However, few studies have taken DR events into consideration. The case study conducted in this research simultaneously incorporates occupancy information and TOU prices.
The application of Internet of Things (IoT) sensing technology in buildings enabled real-time acquisition of data, including environmental parameters and real-time control of devices. Tanasiev et al. [30] integrated wireless sensors into the HVAC system for monitoring indoor temperature, humidity, and CO2 concentration, which were used to adjust the setpoint temperature and airflow speed of the HVAC system. Carli et al. [31] utilized a smart sensor network to gather parameters such as indoor temperature, CO2 levels, and the number of occupants, which were used to optimize temperature setpoint and outdoor air volume of the HVAC system. Li et al. [32] utilized a wireless sensor network to monitor indoor temperature and CO2 concentration for optimizing HVAC setpoints and fresh air volume. Png et al. [33] proposed a scheduling algorithm that integrated temperature and humidity sensors and CO2 sensors to dynamically control chiller temperature and flow rate of the HVAC system. Malkawi et al. [34] utilized a sensor network to collect data on indoor temperature, CO2 levels, and outdoor weather conditions, thereby optimizing the operation of windows. Zhang et al. [35] utilized smart thermostats to collect indoor temperature while enabling real-time control of HVAC on/off operations and setpoint adjustments. In this study, IoT devices were used to monitor temperature and illuminance at each workstation and to control split air conditioners, personal fans, and lights.
Based on the points discussed above, a few existing studies have applied the developed occupancy detection models to actual device control while simultaneously considering DR events. Therefore, this paper proposed an OCC-based framework that included OB model development, data sensing and storage, actual control deployment, and performance evaluation. Based on this framework, this paper implemented a case study in a multi-occupant office room, where two experimental scenarios were conducted to evaluate occupancy model performance and actual control effect.

2. Methodology

Figure 1 presents the overall workflow of the study, which consists of three primary steps. The first step was to develop a machine learning-based model to detect occupancy status using Wi-Fi signal data. Wi-Fi probes were installed along the entry and exit paths of office rooms to collect Wi-Fi signal data serving as a dataset for model training. This dataset comprised two parts: Wi-Fi signal data for training the CNN-GBC model and historical states sequence for the RF model. The machine learning models employed included a convolutional neural network (CNN), a gradient boosting classifier (GBC), and a random forest (RF). The second step involved establishing an online control system. First, IoT sensors and Wi-Fi probes were used to acquire Wi-Fi signal, indoor temperature, and desktop illuminance. The trained CNN-GBC-RF model was then utilized to detect occupant status based on the monitored Wi-Fi signal data. Subsequently, occupancy state, indoor temperature, desktop illuminance, and TOU rates were transmitted to the OBIoT server [16], where predefined control rules were applied to desktop lights, desktop fans, and air conditioners (AC) in real time. Finally, based on the developed model and online control system, a field study was conducted to validate the applicability and effectiveness of the proposed framework. Two control scenarios were designed, and four metrics were utilized to evaluate performance. Energy consumption and electricity costs were used to assess energy efficiency, while DR potential quantified the contribution to grid stability. Thermal comfort questionnaires and occupant feedback were applied to evaluate the impact on occupant satisfaction.

2.1. Experimental Setting and Data Collection

2.1.1. Overview of the Case Room and Experimental Devices

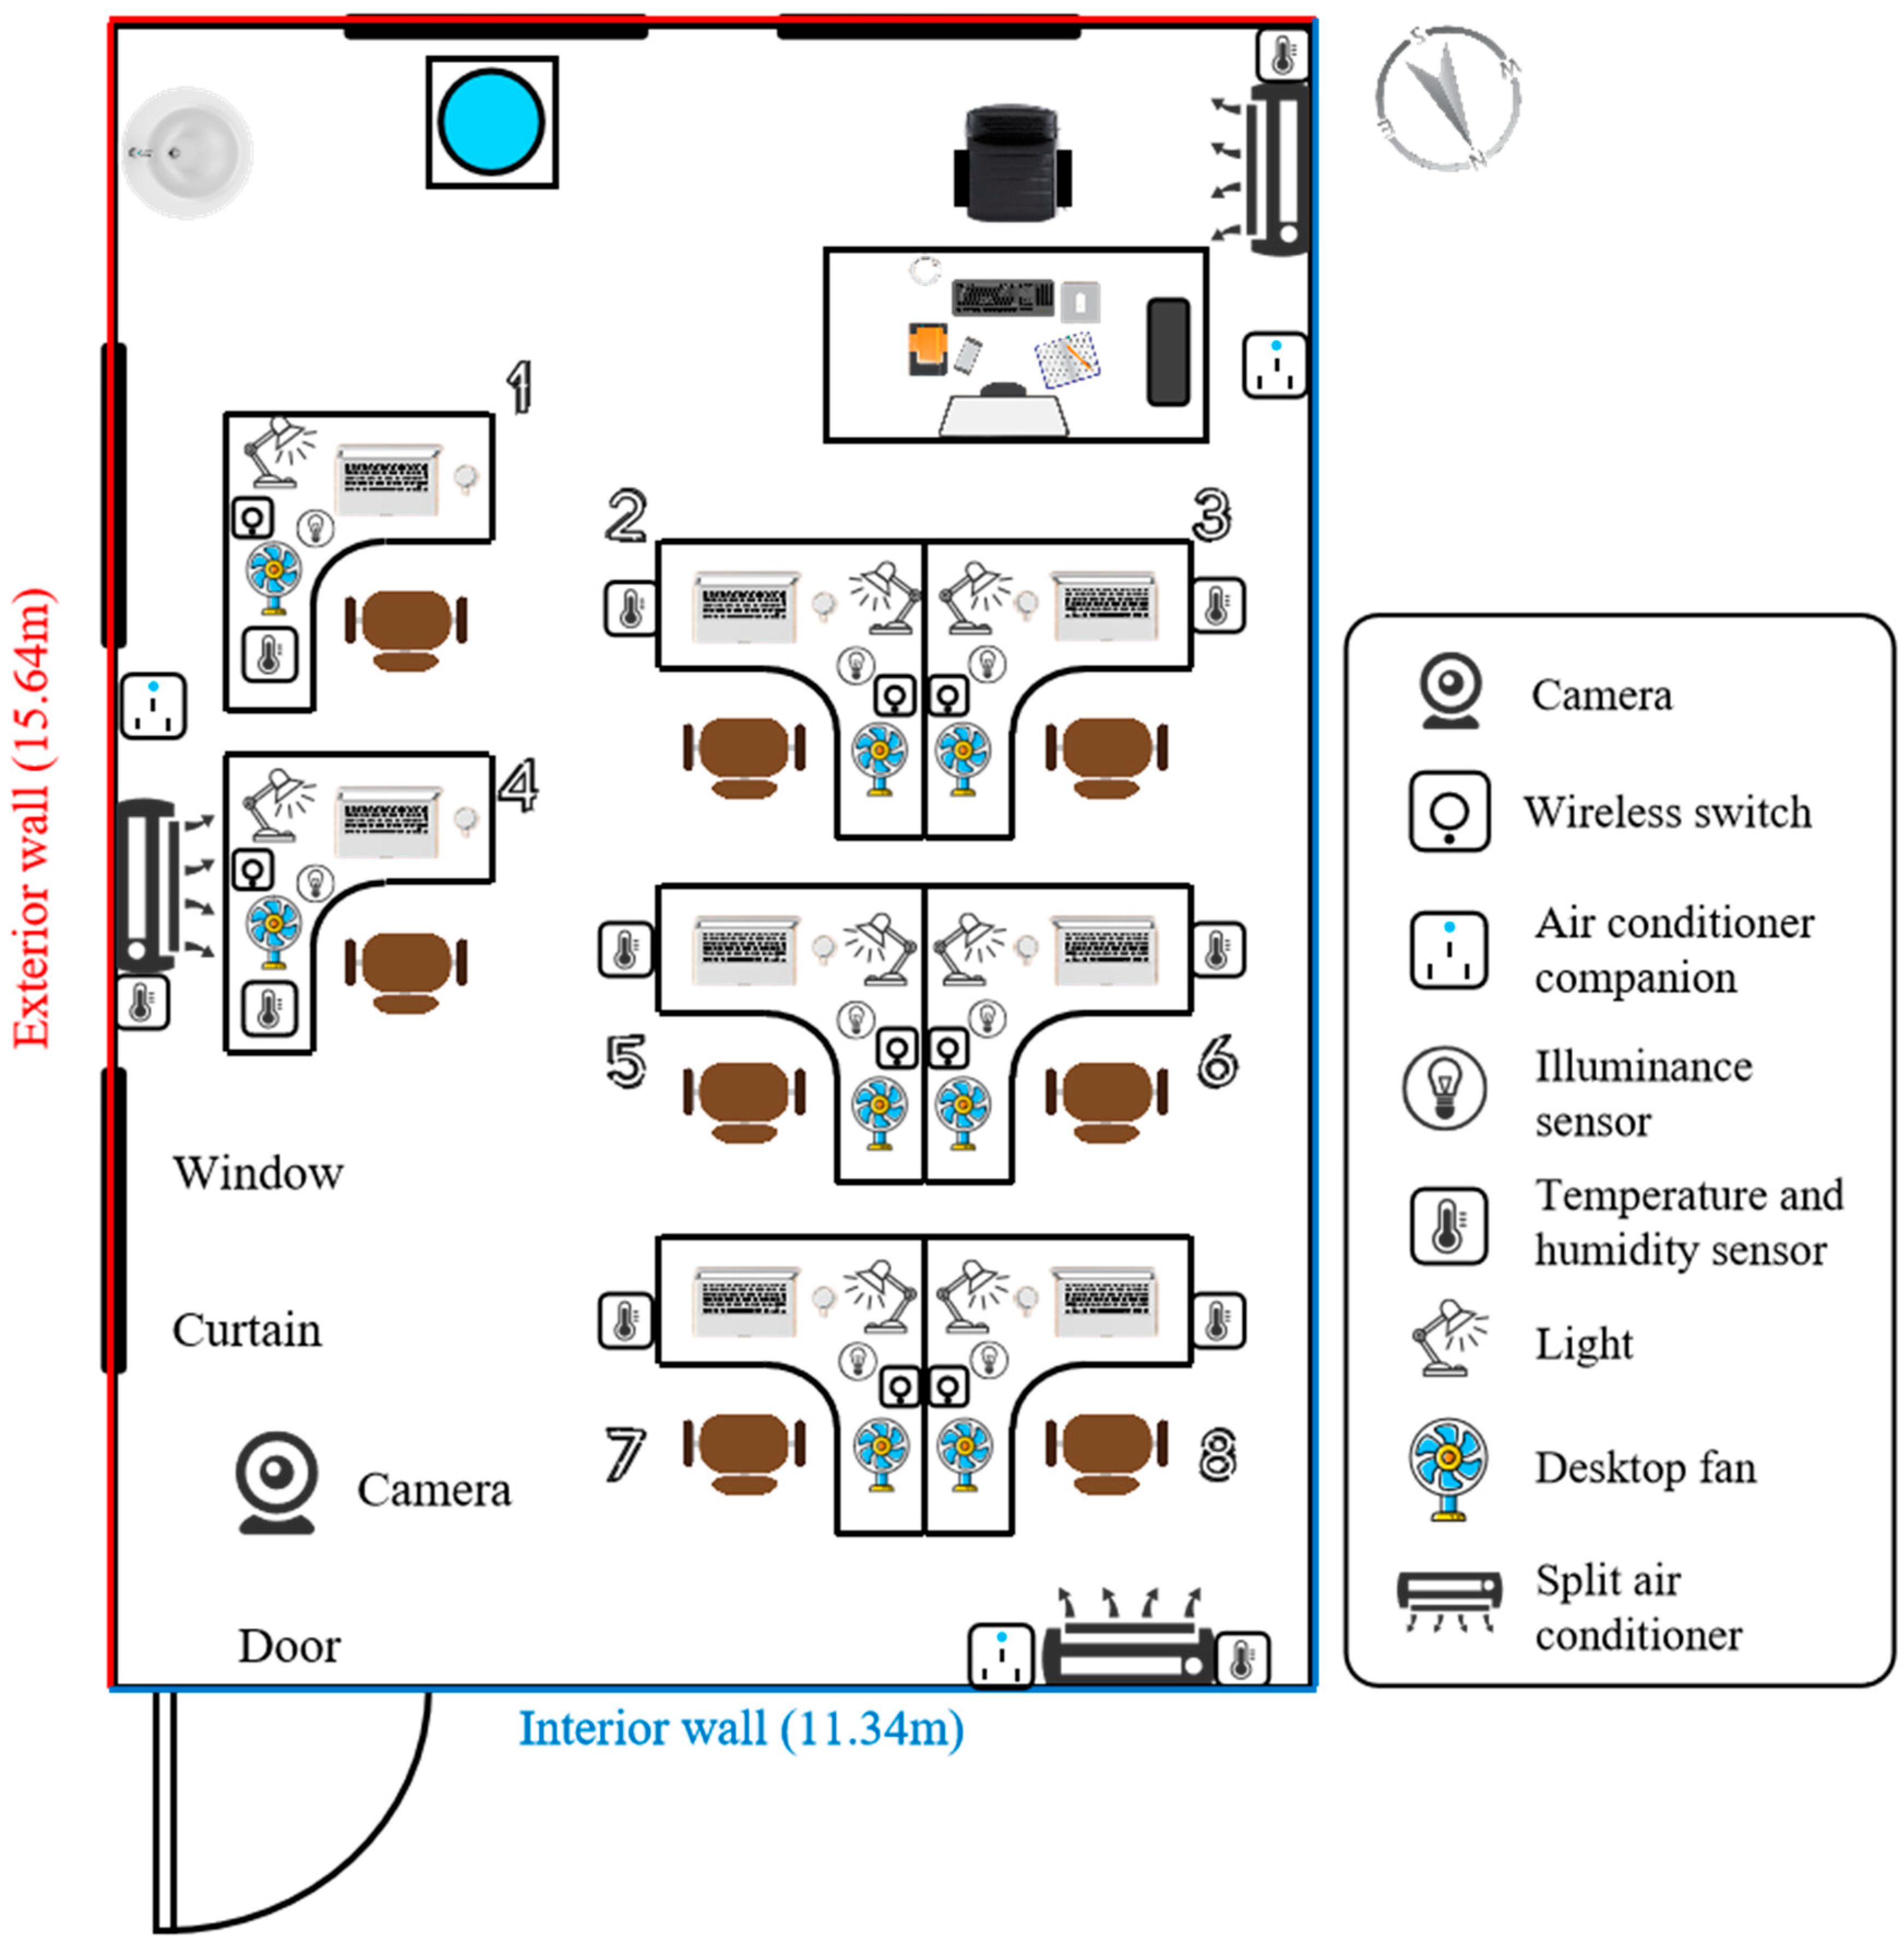
The experimental case room was an office at Hunan University in Changsha, which lies in the hot-summer and cold-winter climate zone. It was located on the southwest corner of the top floor of an educational building. The room measures 7.6 m in length, 5.6 m in width, and 4.3 m in height. The room has four windows, with a window-to-wall ratio of 10.9%. The interior layout of the case room is shown in Figure 2. The case room contained eight student workstations and one teacher workstation. Each student workstation has a laptop, a personal desktop fan, a desktop light, an illuminance sensor, a wireless switch, and a temperature and humidity sensor. The case room also has three split air conditioners connected to three IoT devices called air conditioner companion. The split air conditioners used in this study were inverter-type units with a rated cooling capacity of 3500 W.
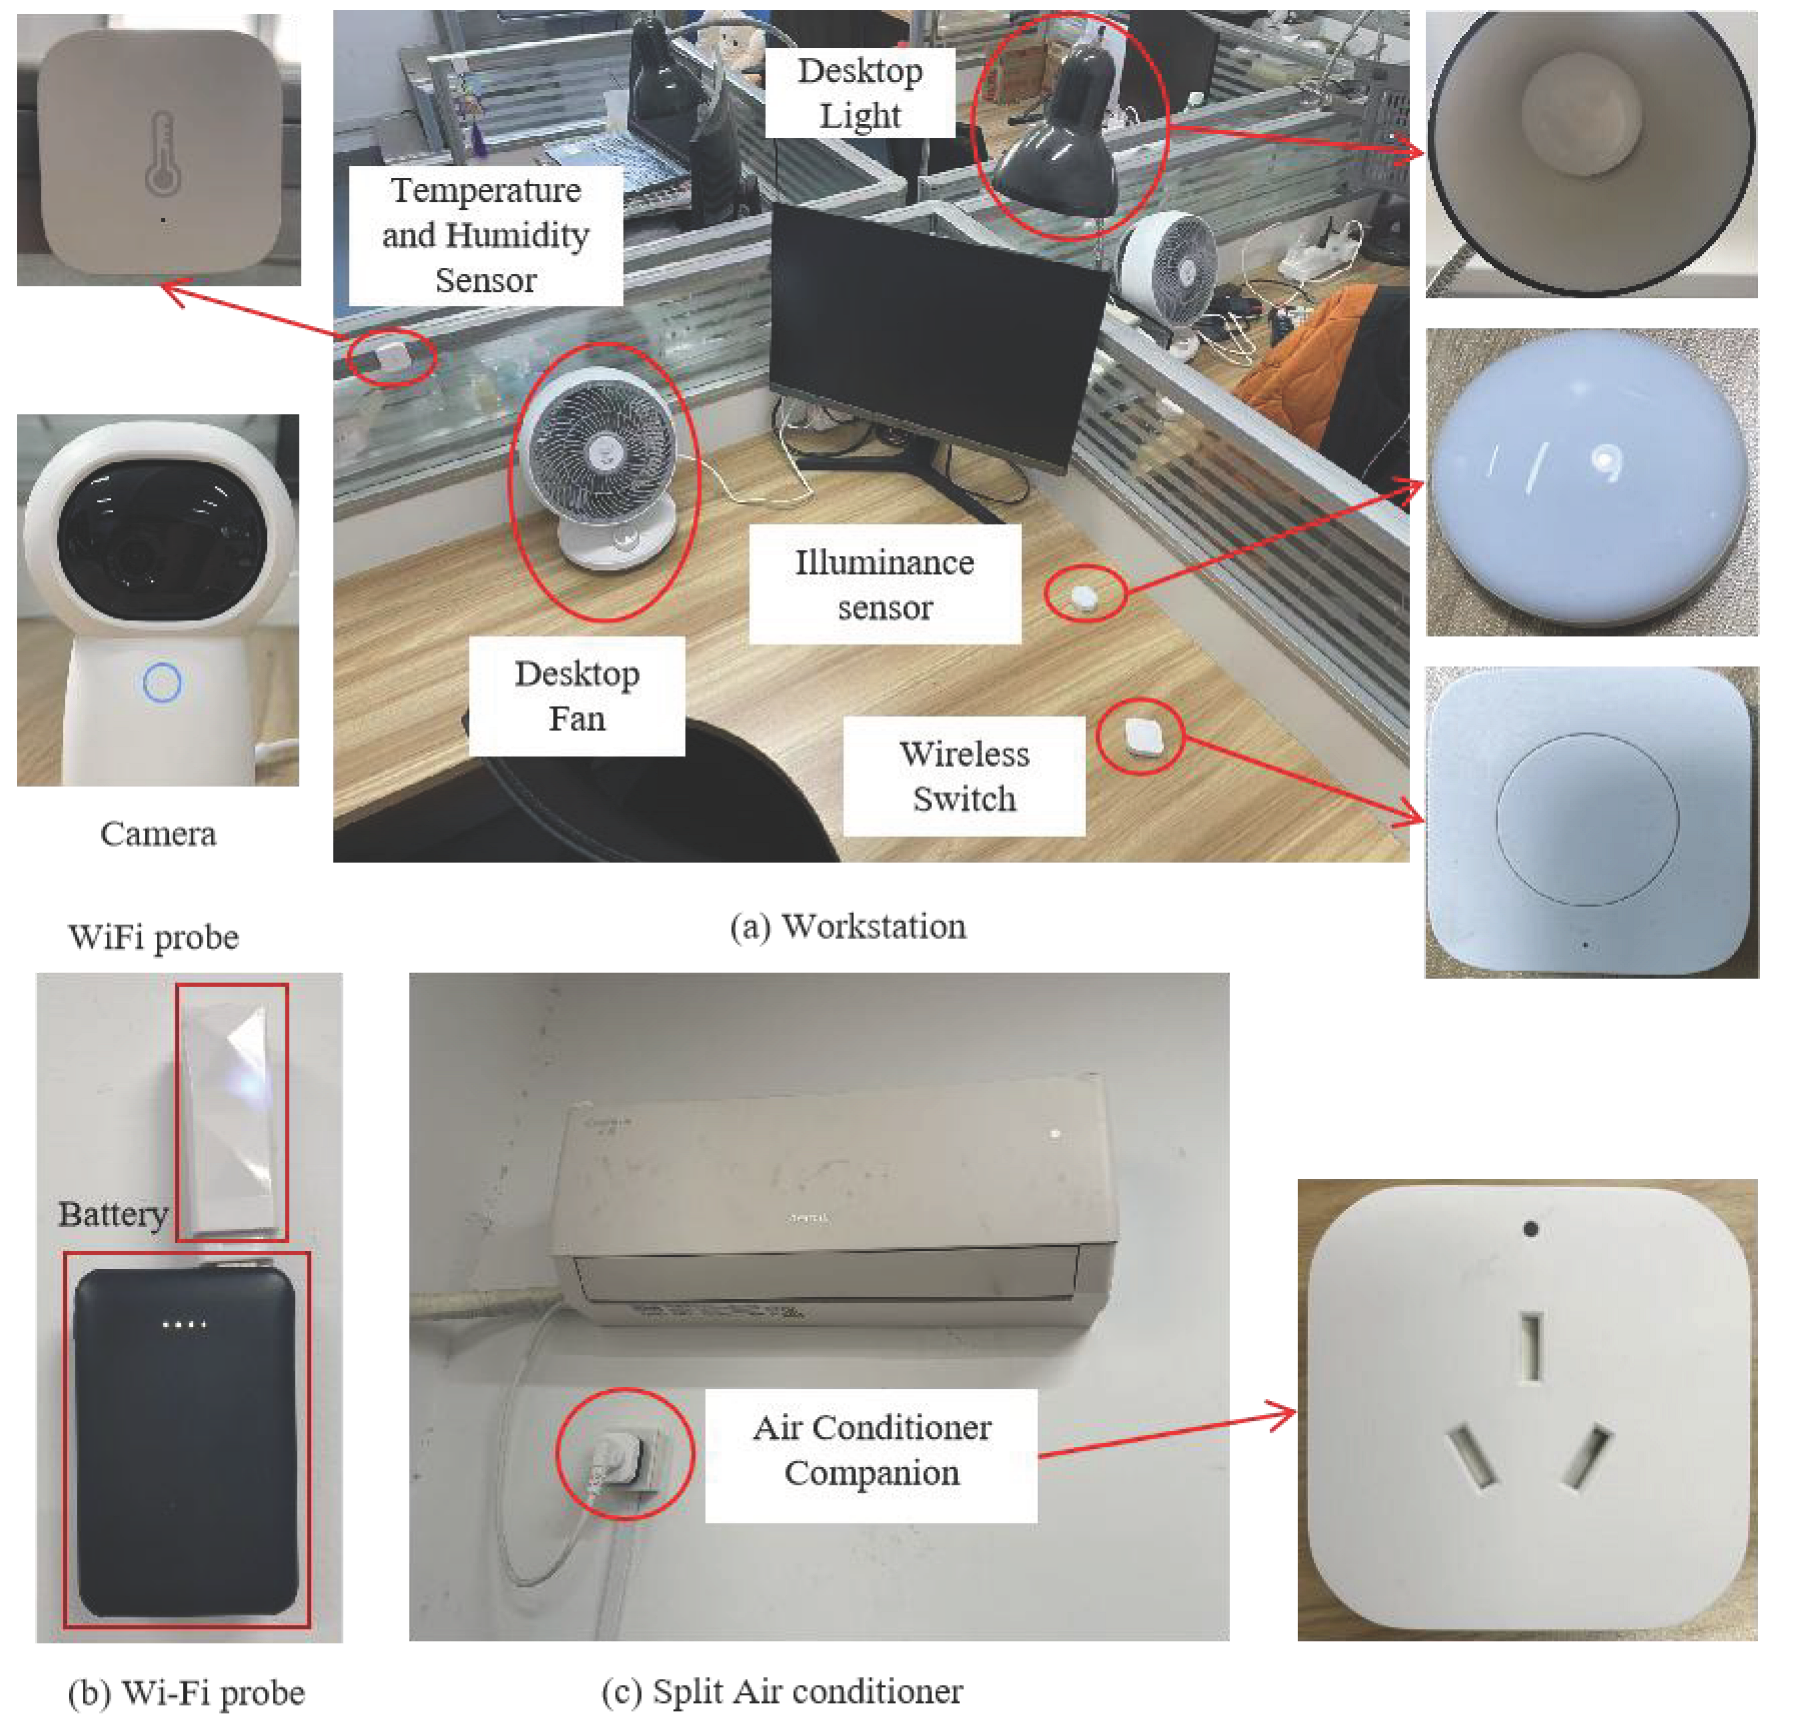
The list of experimental devices used in this study are listed in Table 2. A temperature and humidity sensor and an illuminance sensor were installed at each workstation to measure the workstation temperature and desktop illuminance, respectively. The operational parameters of the ACs, including power, setpoint temperature, and airspeed, are recorded using air conditioner companions installed at plugs. Control commands are sent to the companions by calling an Application Programming Interface (API) request, which then transmits infrared signals to physically control the ACs. Desktop lights and fans are also controlled via API requests. The wireless switch enables occupants to manually override the automated device control and records these overrides. In addition, a camera was installed at the entrance of the case room to manually record the ground-truth occupancy status. Historical outdoor weather data, such as outdoor temperature, relative humidity, and wind speed, are collected by an outdoor weather station installed on the rooftop. Figure 3 provides a detailed deployment of the experimental equipment.

2.1.2. Collection of Wi-Fi Signal Data

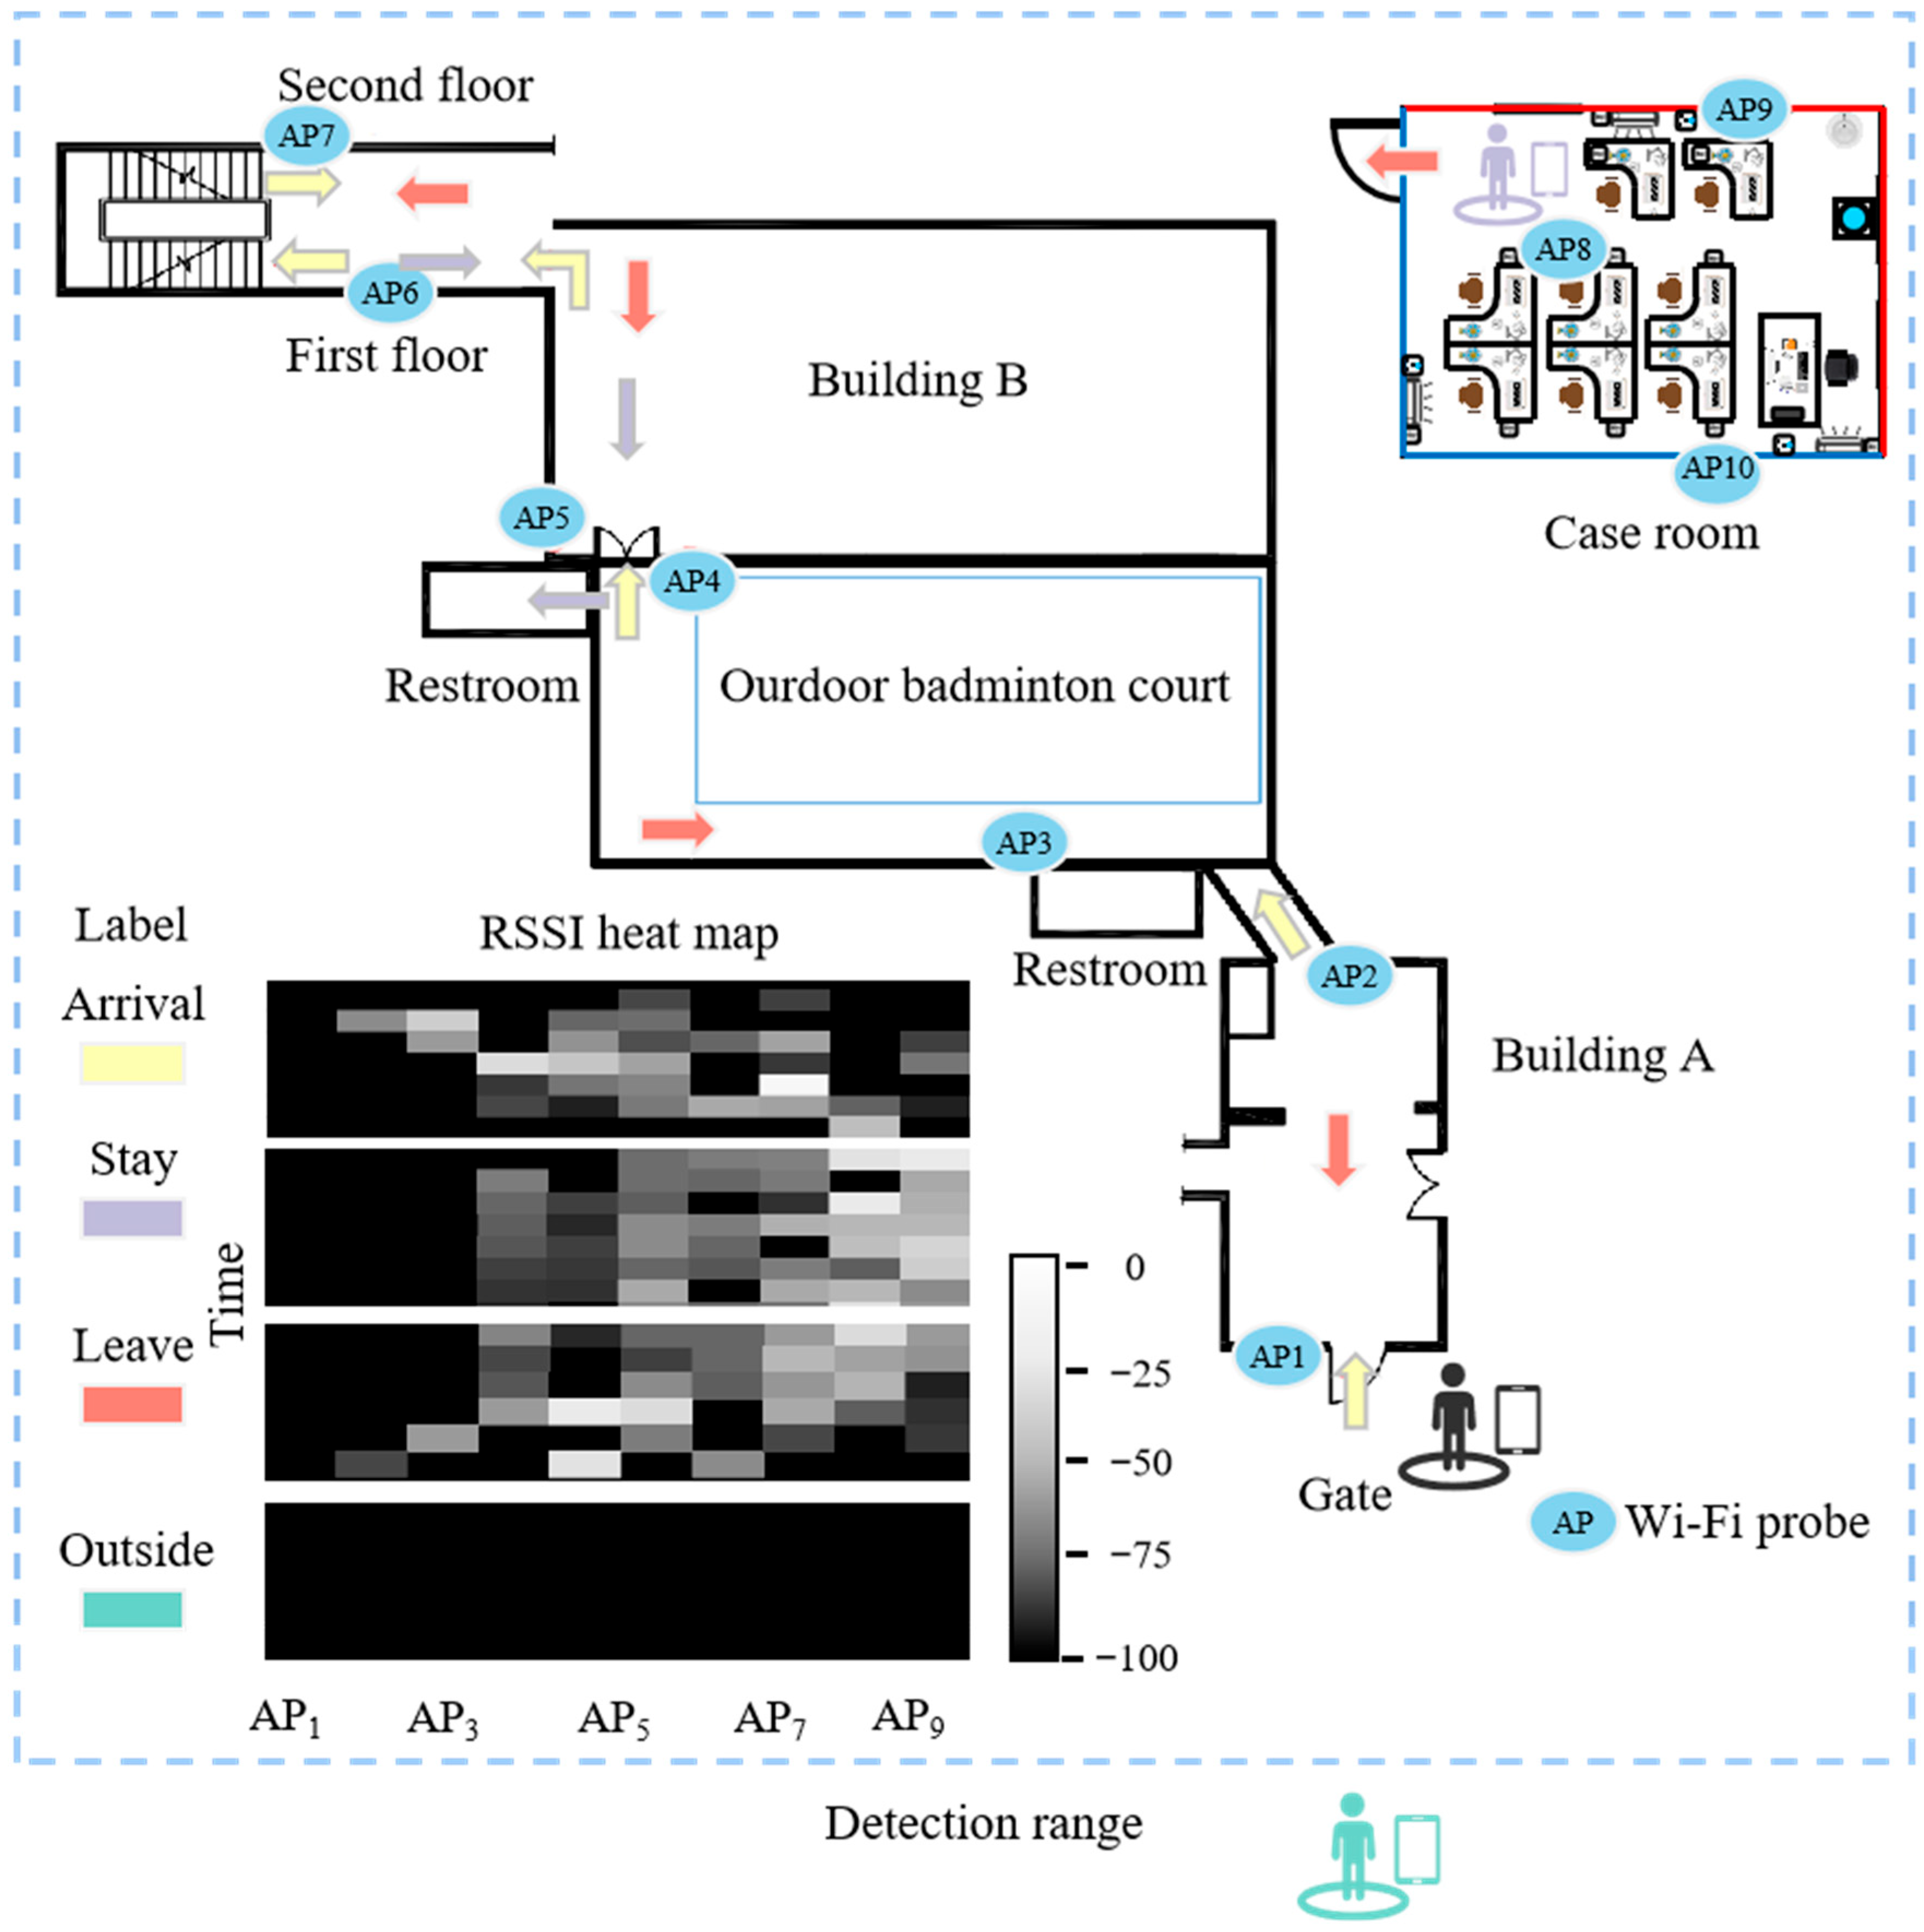
In addition to the collection of indoor environmental parameters, Wi-Fi signal data was collected by Wi-Fi probes along the path where occupants enter and exit. To enter the case room, the occupants had to pass through Building A, the outdoor badminton court, and Building B, and then go up to the second floor, as shown in Figure 4. When occupants carrying smartphones entered or exited the case room through a gate, Wi-Fi probes captured the target media access control (MAC) address and received signal strength indicator (RSSI) values. The MAC address is a unique hardware identifier for each smartphone. RSSI, which ranges from −100 to 0, measures the power of a received radio signal and typically decreases as the distance between the smartphone and the AP increases. Wi-Fi signal data collected by the probes was transmitted to a local server using the User Datagram Protocol. Based on the ground-truth occupancy states obtained from the camera, the collected data were organized and labeled for subsequent model training. The MAC addresses and RSSI values were used for the occupancy detection in this study. All device identifiers were anonymized before analysis, and no personally identifiable information was collected to ensure occupant privacy.
As illustrated in Figure 4, occupancy states are classified into four types: arrival, stay, leave, and outside in this study. The arrival denotes an occupant entering the detection range, from a gate to the office room along a predefined path. The stay signifies that the occupant remains inside the detection range, including the office room and surrounding facilities. For example, the situation of occupants temporarily leaving for the restroom will be identified as stay. Leave refers to the act of exiting the detection range, which is the converse of arrival. Outside indicates that an occupant is completely beyond the monitored area.
Figure 4 also demonstrates the variation characteristics of RSSI values under four occupancy states. Each row represents the RSSI values collected over a 10 s interval arranged in increasing time order from top to bottom, while each column corresponds to an AP. A smaller RSSI value corresponds to a darker color, where 0 is represented by white and −100 by black. When an occupant enters the office room, RSSI values gradually increase from AP1 to AP10. Wi-Fi signal data for the CNN-GBC model training were collected by instructing participants to enter and exit the office room along the path. After data cleaning and labeling, a total of 7063 samples were obtained, including 1689 labeled as outside, 914 as arrival, 3260 as stay, and 1200 as leave, as shown in Table 3. The dataset was split into a training set (80%) for model training and a testing set (20%) for model validation.
The RF model was trained using a real operation dataset, which included detected occupancy status sequences and ground-truth occupancy states. The ground-truth occupant states recorded by a camera were utilized to validate missing data due to signal loss. After data organization, a total of 663 samples were available for the RF model training.

2.2. Occupancy Detection Model Development

2.2.1. Occupancy Detection Modeling Based on CNN-GBC-RF

In the previous study [29], an occupancy detection module based on the CNN-GBC model was developed to provide real-time detection of occupancy states. The model classified occupancy states into three categories: enter, stay, and leave. However, this model exhibited a limitation during practical application. As shown in Figure 5, the occupants were occasionally misclassified as outdoor when they were indoors due to the signal loss. This issue arises because mobile phones at rest typically initiate network requests less frequently. To address this problem, this study incorporated an RF model on its basis and refined the occupancy states into four categories: arrival, stay, leave, and outside.
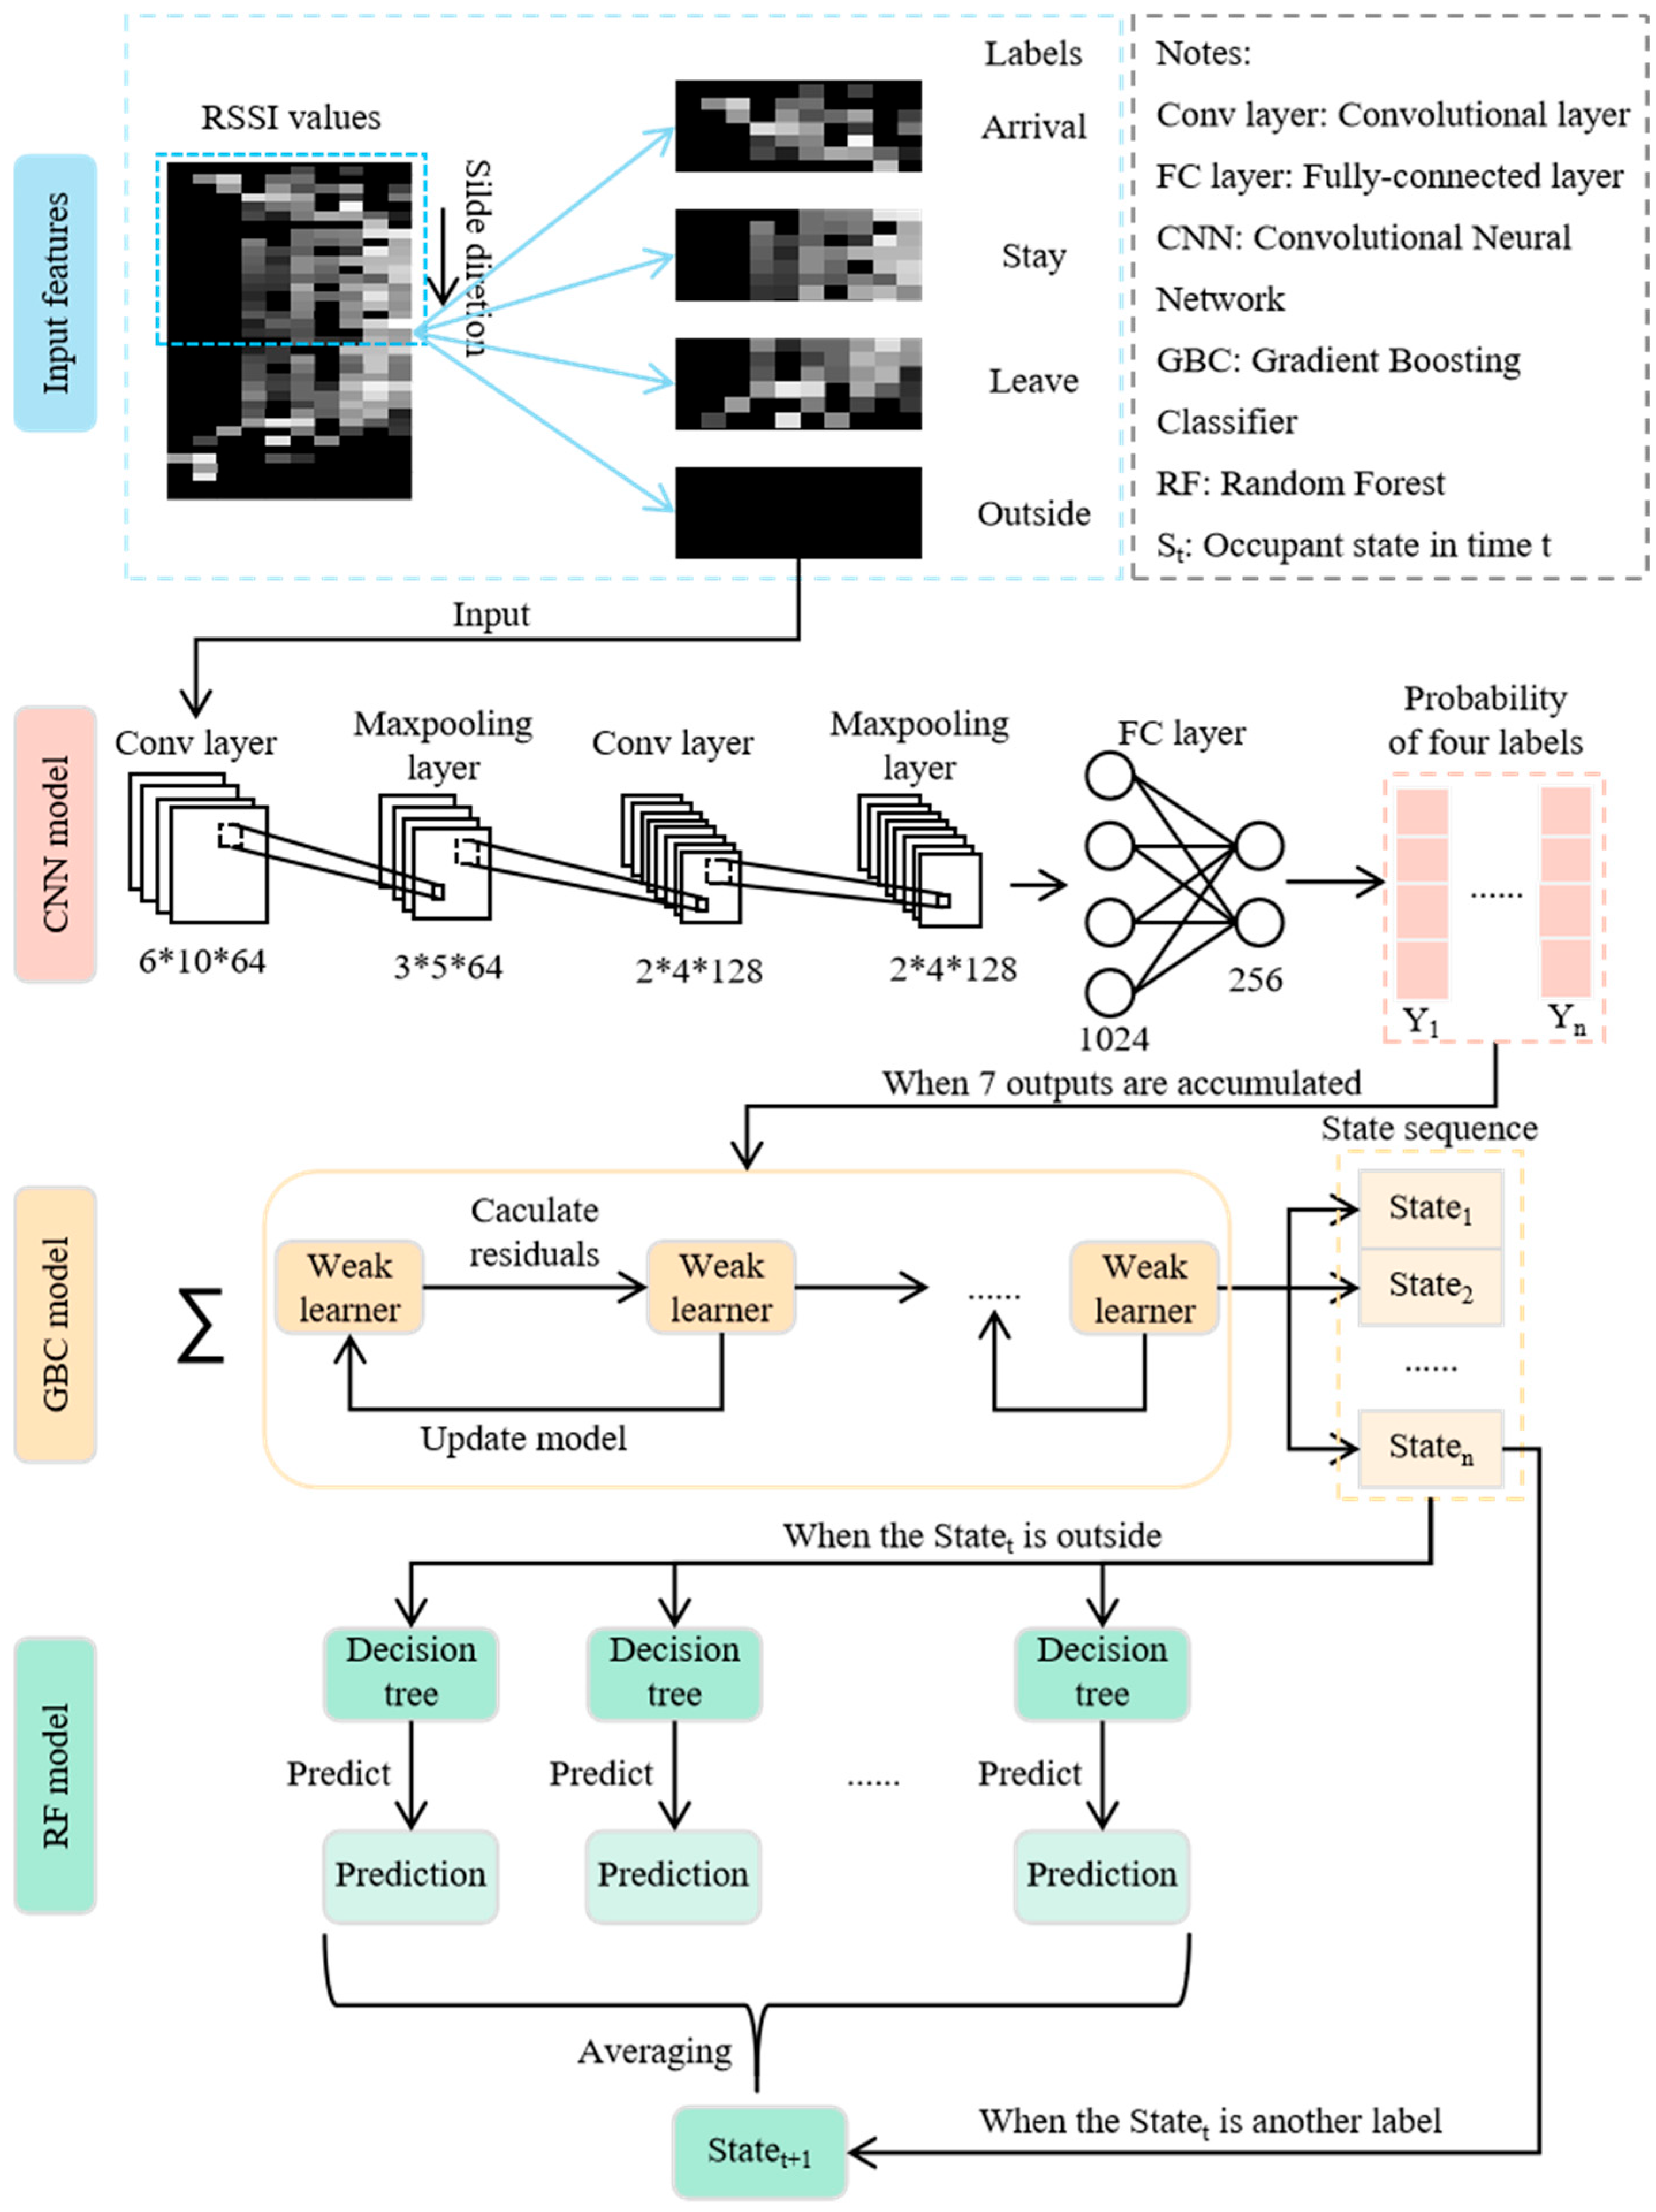
This study proposed a cascaded model comprising CNN, GBC, and RF models, with its detailed structure illustrated in Figure 6. The CNN model comprises two convolution-pooling stages. The first convolutional layer employs 64 convolution kernels of size 2 × 2, followed by a second layer with 128 convolution kernels of size 3 × 3. Each convolutional output is subsequently processed through a max-pooling operation. Considering the time-variability of Wi-Fi signals, a sliding window of 60 s with a step of 10 s was established. Within each window, RSSI values are obtained every 10 s from ten Wi-Fi probes, forming a 6 × 10 feature matrix. After normalization, this matrix is fed into the CNN to generate the probability of four labels.
When the CNN accumulated seven consecutive outputs, a 7 × 4 feature matrix was constructed and input into the GBC model, which is composed of sequentially boosted weak learners (decision trees in this study). This enables the GBC to predict occupancy states based on the RSSI values within a two-minute time window. When the GBC model outputs the outside, the historical occupancy state sequence from the previous five minutes is subsequently fed into the RF model to verify whether the outside state is true. If identified as false, the occupancy state at the next timestep is corrected to stay; otherwise, it remains outside. When the GBC outputs other labels, the RF model remains inactive, and the GBC prediction is directly adopted.
Additionally, to prevent potential RF over-corrections when the CNN-GBC model fails to capture the leave state, a rule-based judgment mechanism was incorporated. If the CNN-GBC continuously outputs the outside state ten times, the correction of the RF model is withheld.
In the previous experiments [29], the response time of device control was 6 to 14 min due to problems in data transmission and processing. In this study, the code for data processing was optimized, reducing the time delay to 2 min.

2.2.2. Model Performance Evaluation

The occupancy detection performance of the model is evaluated using a confusion matrix. Specifically, based on the combinations of predicted and true labels, all samples can be classified into four categories: True Positive (TP), False Negative (FN), False Positive (FP), and True Negative (TN). According to these values, the accuracy, precision, and recall are calculated by Equations (1)–(4):
Accuracy   =   TP + TN TP + FP + FN + TN
Precision = TP TP + FP
Recall = TP TP + FN
F 1   Score = 2 × Precision × Recall Precision + Recall
where
TP : the true label is a positive class, and the predicted label is also positive;
FN : the true label is a positive class, but the predicted label is negative;
FP : the true label is the negative class, but the predicted label is positive;
TN : the true label is the negative class, and the predicted label is negative.

2.3. Control System Establishment

By deployment of the IoT sensors and Wi-Fi probes, this study developed an online control system, which aims to dynamically control AC, personal desktop fans, and desktop lights in real-time according to the predefined rules, leveraging the real-time acquisition of Wi-Fi signal, workstation temperature, desktop illuminance, and TOU electricity rates.

2.3.1. Workflow of the Control System

The workflow of the control system is demonstrated in Figure 7. The control system is divided into the occupancy detection module and the online control module. For the occupancy detection module, when an occupant carrying a smartphone enters or leaves the case room, Wi-Fi probes capture the target MAC address and RSSI values and transmit them to the local server for data processing. The processing includes missing value imputation and organizing the data into the required format. After the Wi-Fi signal data and historical occupancy states are collected, the pre-trained model is invoked to generate the detected occupancy states at one-minute intervals. The detected occupancy states are stored in a JSON format file, which contains the user ID (MAC address), timestamp, and occupancy states. For the control module, control commands are sent to IoT devices based on the latest occupancy status, workstation temperature, desktop illuminance, and TOU electricity rates, following predefined control rules.

2.3.2. Control Scenarios

Two control scenarios were designed in this study to investigate their implementation effectiveness in real building environments. The detailed description is as follows:
(1)
Baseline scenario
For the baseline scenario, the AC is maintained at a setpoint of 26 °C during occupied hours, while the desktop lights and personal desktop fans are manually controlled by wireless switches without external intervention.
(2)
OCC scenario
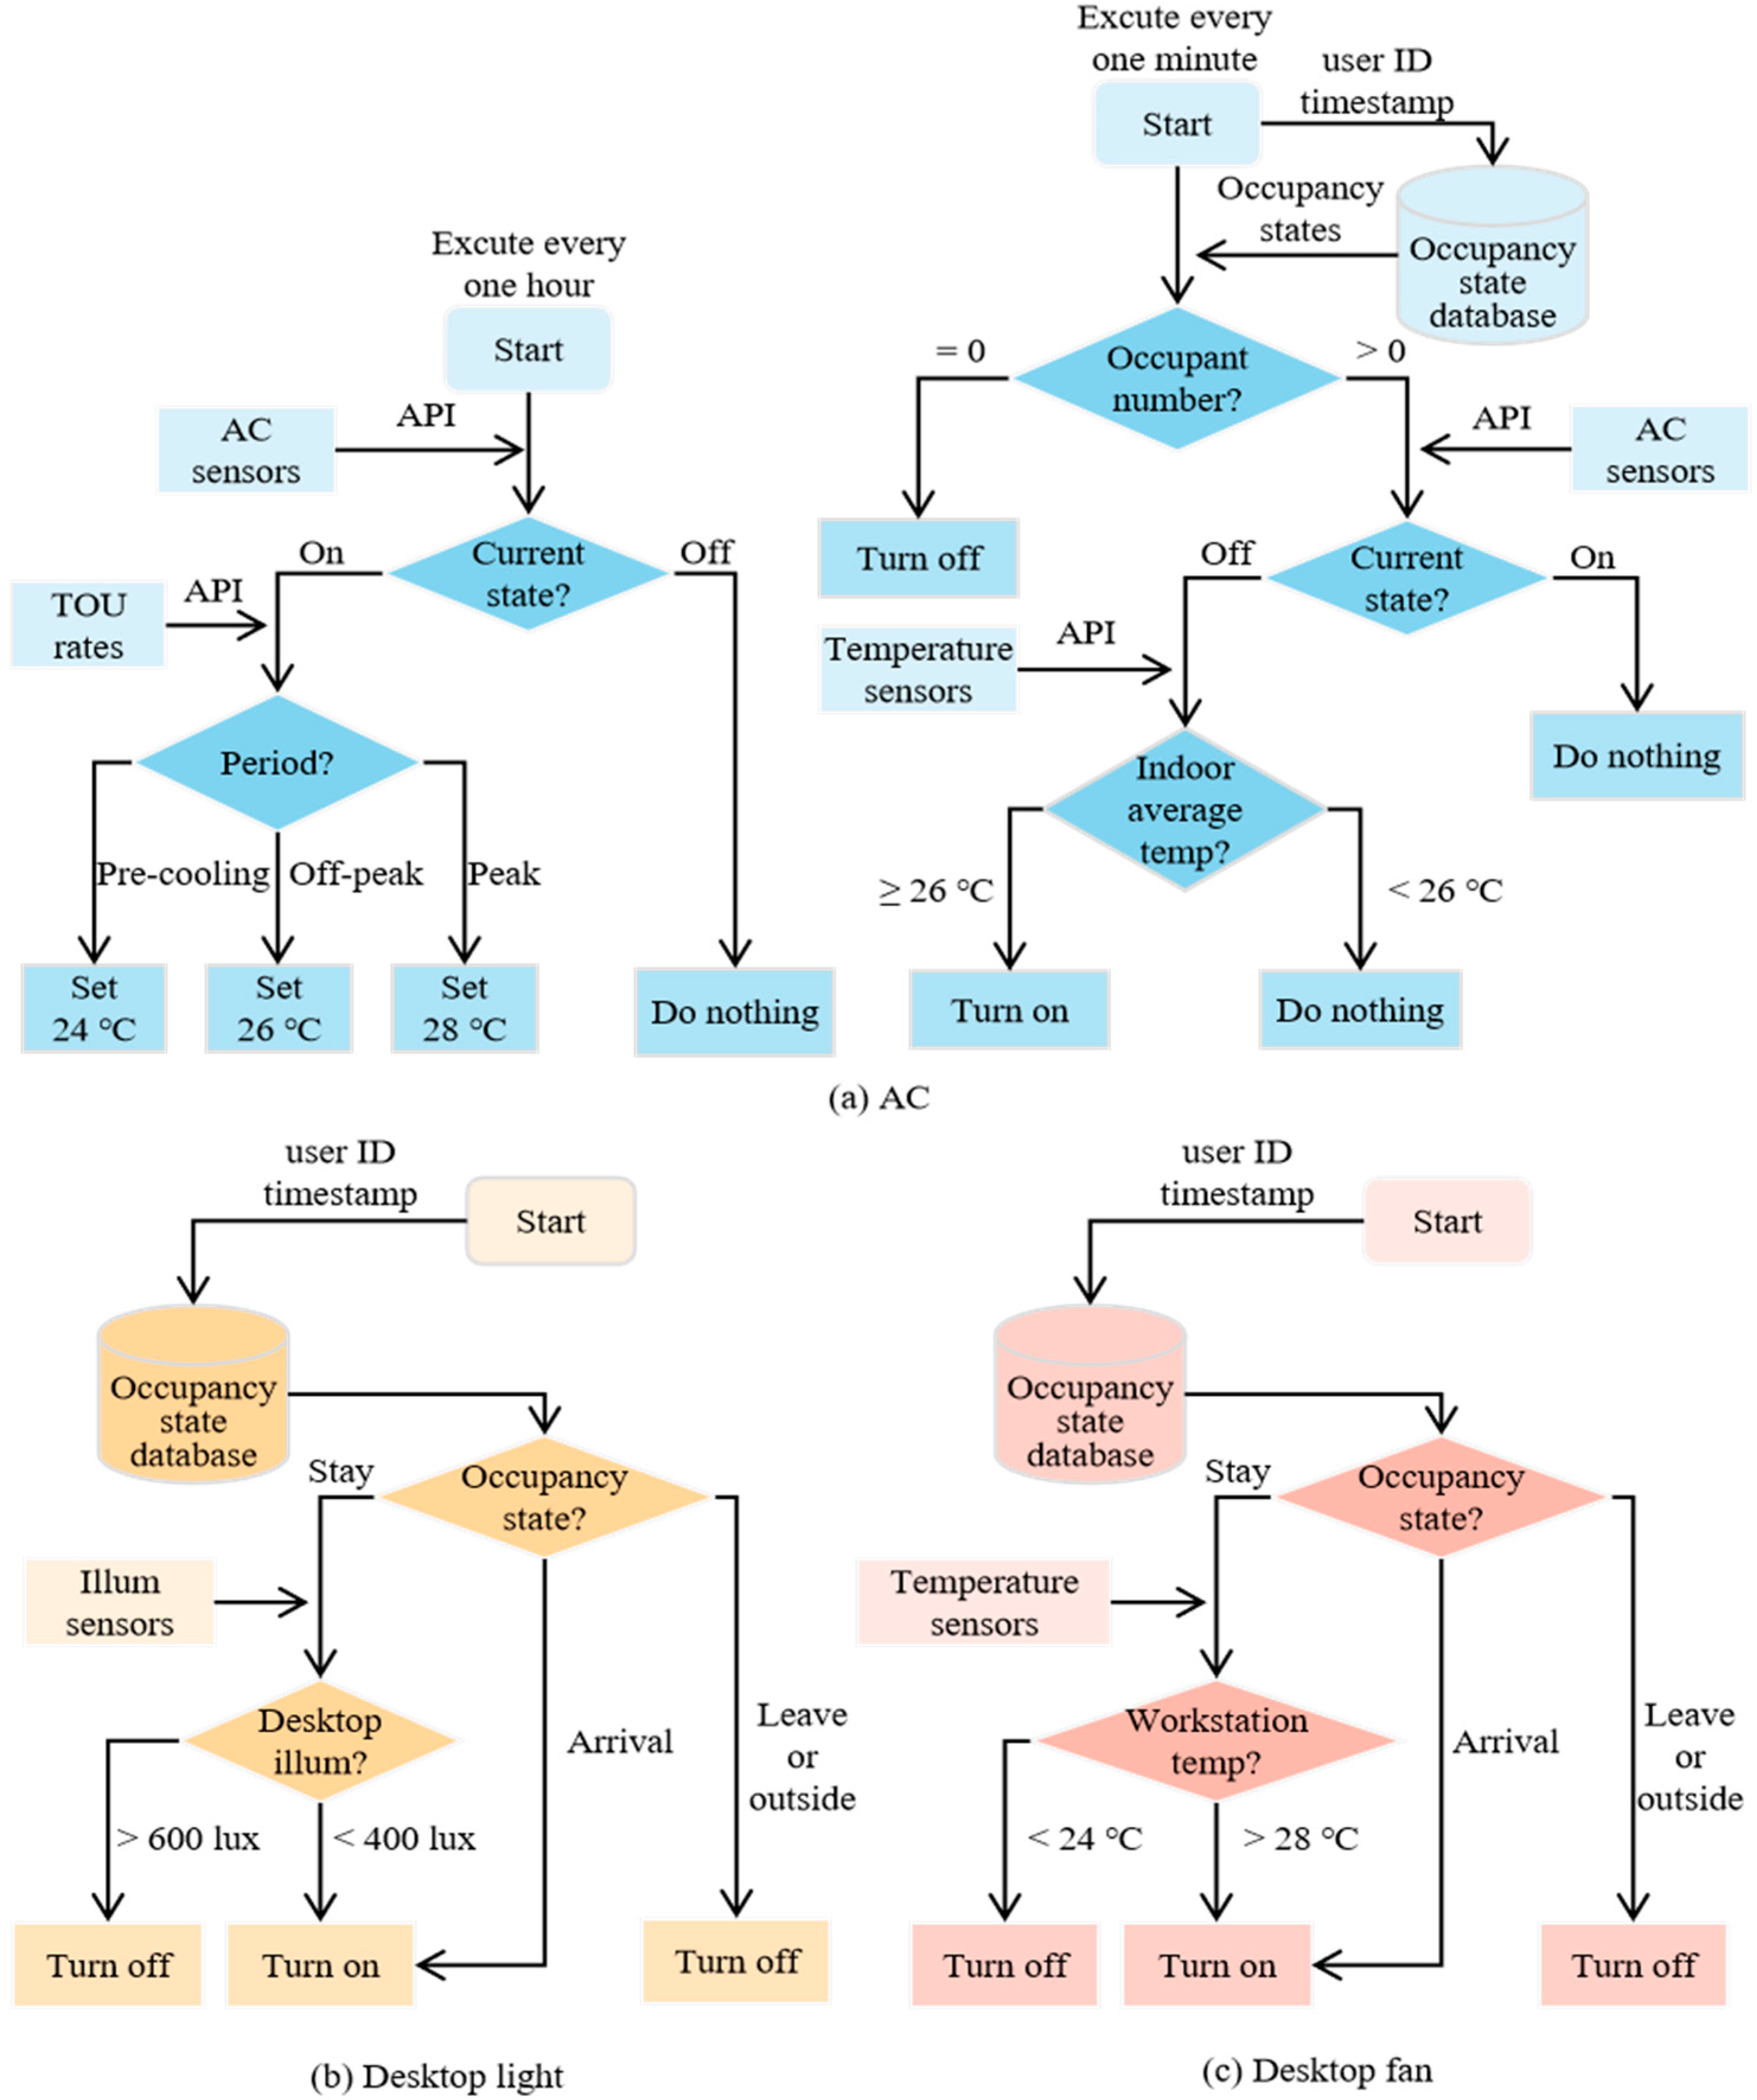
Figure 8 illustrates the control logic under this scenario. In this study, the three ACs are controlled as a whole simultaneously, with two cyclic control processes implemented. The first process operates at one-minute intervals to manage the on/off status. The occupancy states acquired from the occupancy state database are initially used to calculate the occupant number. If the current occupant number is 0, the AC sensor sends ‘off’ command to the ACs. If the occupant number is greater than 0, further judgment is performed based on the operational status and indoor average temperature. Specifically, when the AC is currently off and indoor average temperature exceeds 26 °C, the AC is switched to ‘off’ mode. The second process operates at one hour to optimize the setpoint. When the AC status is on, the setpoint temperature is adjusted according to TOU electricity rates. The detailed TOU electricity rates and time period divisions in Hunan province are shown in Table 4. Based on this tariff and the typical working hours in our study, three periods are defined: pre-cooling, peak, and off-peak. Specifically, the pre-cooling period is defined as one hour before the peak period (11:00–14:00). According to the ASHRAE Standard [36] and the related study [37], the setpoint temperatures are set to 24 °C for pre-cooling, 28 °C for peak, and 26 °C for off-peak, respectively.
Desktop lights and fan controls follow a one-minute time step. As shown in Figure 8b,c, when an occupant turns to the arrival state, the desktop light and fan are turned on. Conversely, for leave or outside states, both are turned off. If the occupant remains in the stay state and the workstation illuminance is below 400 lux, the desktop light remains on; once the illuminance exceeds 600 lux, the desktop light turns off. When the occupant stays indoors, the personal desktop fan operation is adjusted based on the workstation temperature. Specifically, the personal desktop fan is turned on when the temperature exceeds 28 °C and off when it is lower than 24 °C.

2.4. Result Evaluation

2.4.1. Cooling Degree-Day Normalization

Outdoor weather conditions significantly influence the energy consumption of AC. During the experiments, the mean outdoor temperature was 22.50 °C (Std = 4.39 °C) in the baseline scenario and 24.48 °C (Std = 4.01 °C) in the OCC scenario. In this study, the commonly used method of cooling degree-day (CDD) [38] was adopted to isolate the effects of outdoor weather conditions. The CDD is calculated according to Equation (5):
CDD d   =   max ( 0 , T avg , d T base )
where
CDD d represents the cooling degree-day of a certain day;
T avg , d is the average outdoor temperature on a certain day;
T base is the base outdoor temperature, which refers to the temperature threshold of no cooling required. The parameter was selected as 18 °C in this study.

2.4.2. Statistical Analysis

The independent two-sample t-test is used to determine if there is a significant difference between the means of two independent samples. The significance level (α) was set at 0.05 in this study. When the calculated p-value < 0.05, the null hypothesis was rejected, indicating a statistically significant difference between the two groups. Conversely, the difference was considered not significant. The formula is as follows:
t = x 1 ¯ x 2 ¯ s 1 2 n 1 + s 1 2 n 1
where
t represent means of sample 1 and sample 2, respectively;
x 1 ¯   and   x 2 ¯ represent means of sample 1 and sample 2, respectively;
s 1   and   s 2 represent standard deviations of sample 1 and sample 2, respectively
n 1   and   n 2 represent sample sizes of sample 1 and sample 2, respectively.

2.4.3. Subjective Occupant Feedback

This study collected occupant feedback through two main channels: online thermal comfort questionnaires [39] and a wireless switch installed at each workstation. Participants were required to complete a subjective questionnaire hourly to evaluate their thermal comfort level and preference. The range of thermal comfort score was 1 to 10, with higher scores indicating better thermal comfort conditions. The detailed content of the survey questionnaire is provided in Table 5. Meanwhile, the wireless switch enabled occupants to directly control their devices while simultaneously recording these interactions.

3. Results

A 16-day experiment was conducted, comprising 10 days conducting the OCC scenario and 6 days employing the baseline scenario. All required data were collected by IoT sensors, Wi-Fi probes, and an outdoor weather station.

3.1. Accuracy of the CNN-GBC Model

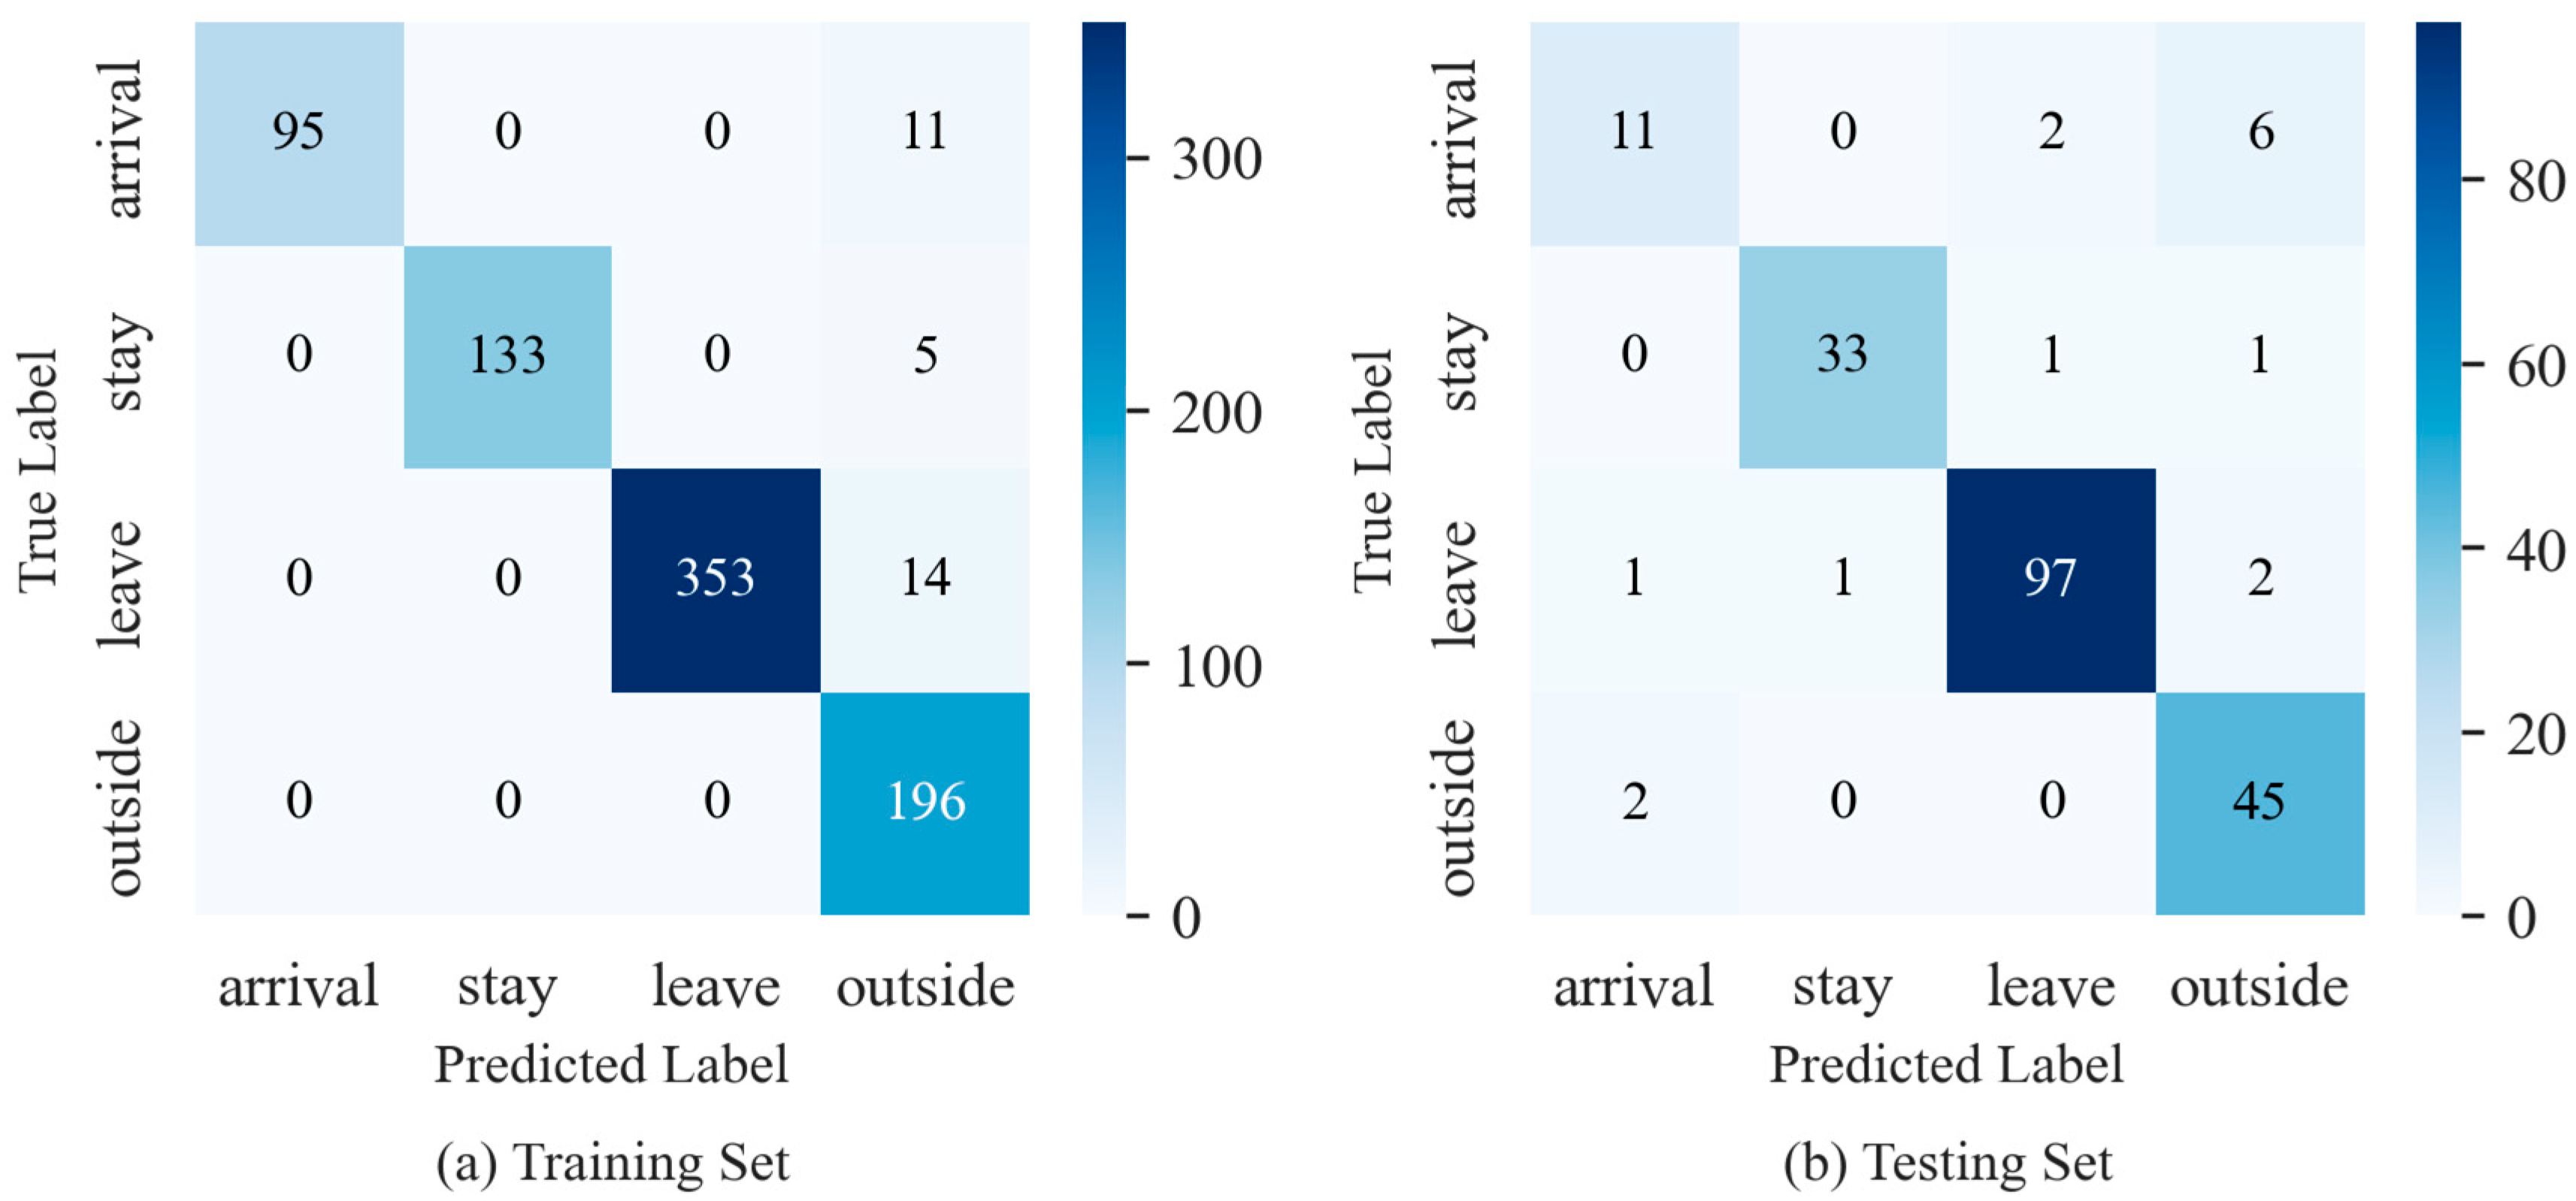
After collecting and preprocessing Wi-Fi signal data, the CNN-GBC model was trained and evaluated on this processed Wi-Fi signal dataset. The dataset was split into training set and testing set at an 8:2 ratio. Figure 9 illustrates the performance of the CNN-GBC model in recognizing occupancy status. After introducing the outside label, the overall accuracy of the CNN-GBC model was 96.3% for the training set and 92.1% for the testing set. The model exhibited satisfactory performance across the training set and testing set.

3.2. Practical Performance of the CNN-GBC-RF Model

3.2.1. The Signal Loss During Real Operation

Based on the collected Wi-Fi signal data, the analysis of signal loss during real operation was conducted. The occupancy detection operated at one-minute granularity. As shown in Table 6, the total number of signal loss incidents was 3668, ranging from 35 to 1817 times per person, with an average of 458.5 times per person. The total occupancy duration was 265.78 h. Signal loss rate was defined as the number of signal loss incidents per occupied hour. The signal loss rate ranged from 0.82 to 44.92 times per hour, with an overall signal loss rate of 13.80 times per hour. These results indicate that signal loss occurred frequently during real operation, especially for occupants 2, 4, and 7. Under the original CNN-GBC model, these signal losses were detected as the outside state, thereby consequently introducing a problem for the control algorithm.

3.2.2. Integration of RF Model with CNN-GBC Model to Solve Signal Loss Problem

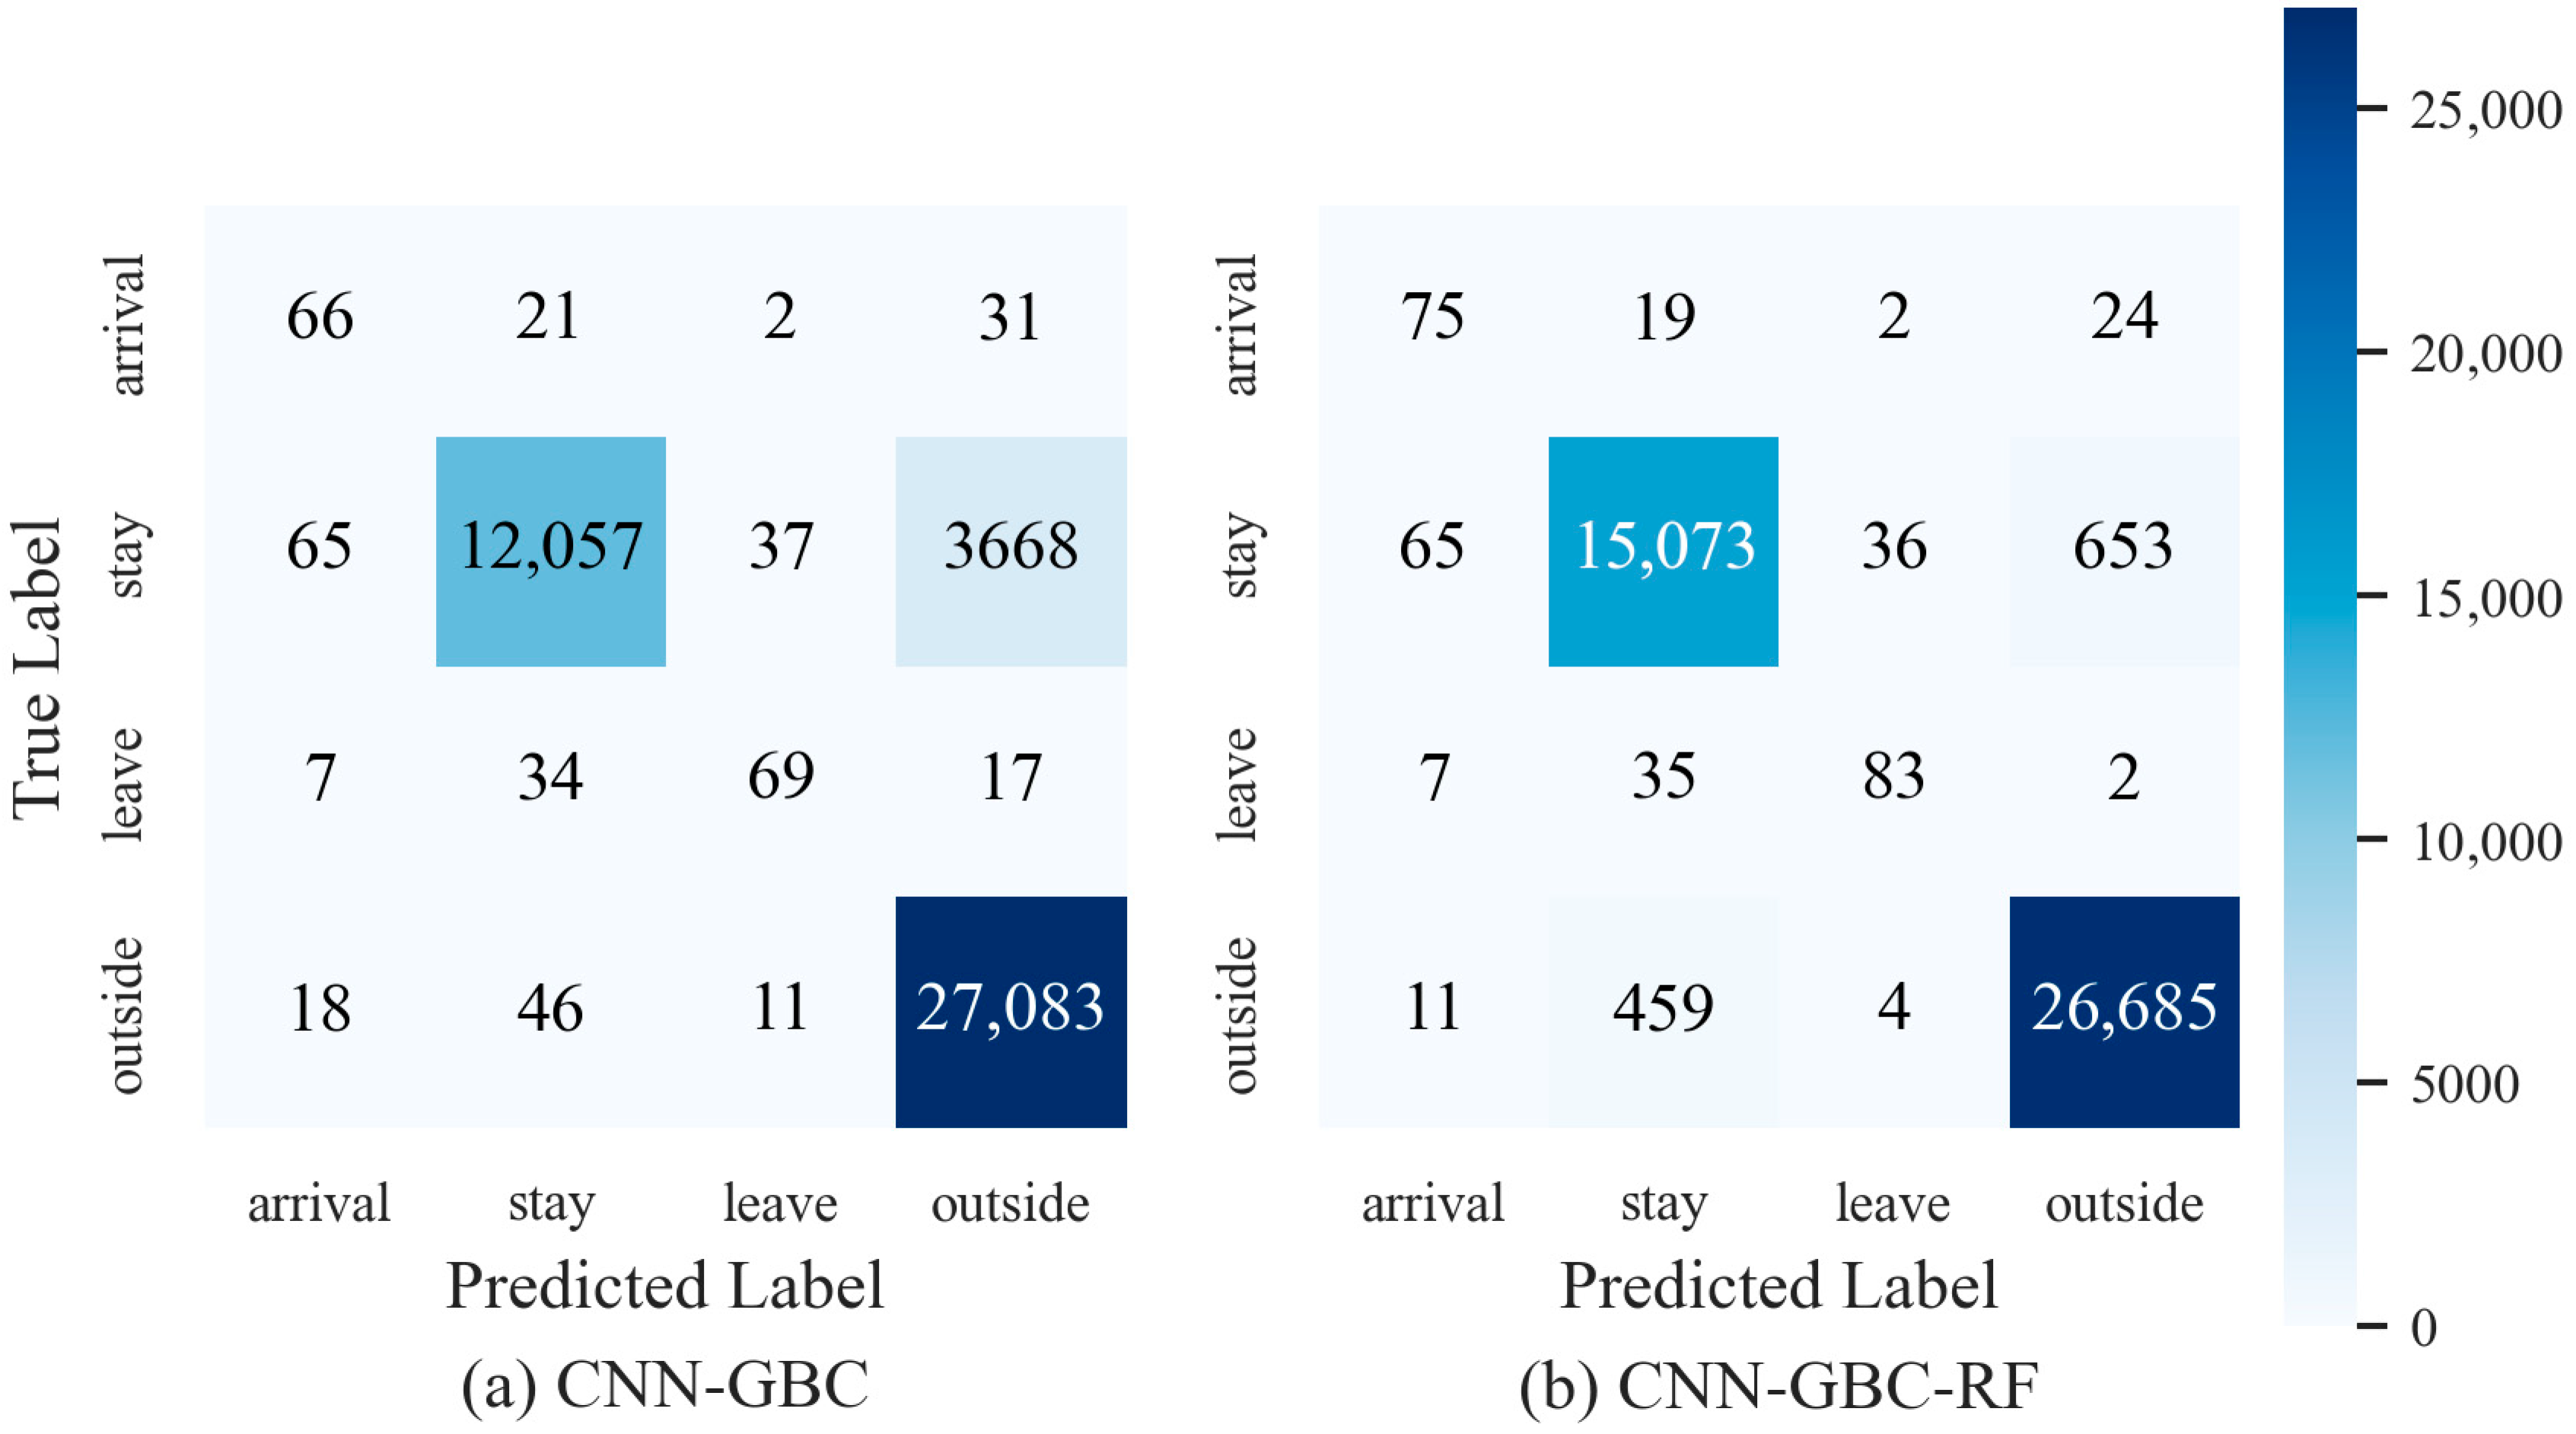
The RF model was introduced to address the issue of signal loss. Table 7 demonstrates the performance of the RF model in signal loss detection. The total number of signal loss incidents was 3668. The RF model subsequently corrected the occupancy state to stay within 3020 signal loss incidents. The remaining 648 signal loss incidents were not detected. Among the 27,144 true outside states, the model incorrectly detected 459 instances as the stay state. The RF model achieved an accuracy of 96.4% in signal loss detection, consequently reducing misclassification of occupancy status.

3.2.3. The Comparison of the CNN-GBC Model and the CNN-GBC-RF Model

The overall performance of the CNN-GBC model and the CNN-GBC-RF model in occupancy status detection was compared. As shown in Figure 10, the CNN-GBC model achieved an accuracy of 90.9% and an F1 score of 0.709, while the CNN-GBC-RF model achieved 97.0% and 0.784, respectively. These results indicate that the integration of the RF model improved the performance of occupancy state detection. However, both models demonstrated limited effectiveness in identifying the arrival (precision: 42.3% and 47.5%) and leave (precision: 58.0% and 66.4%) labels. This was primarily due to the short duration of these states, which makes capturing signal changes challenging.
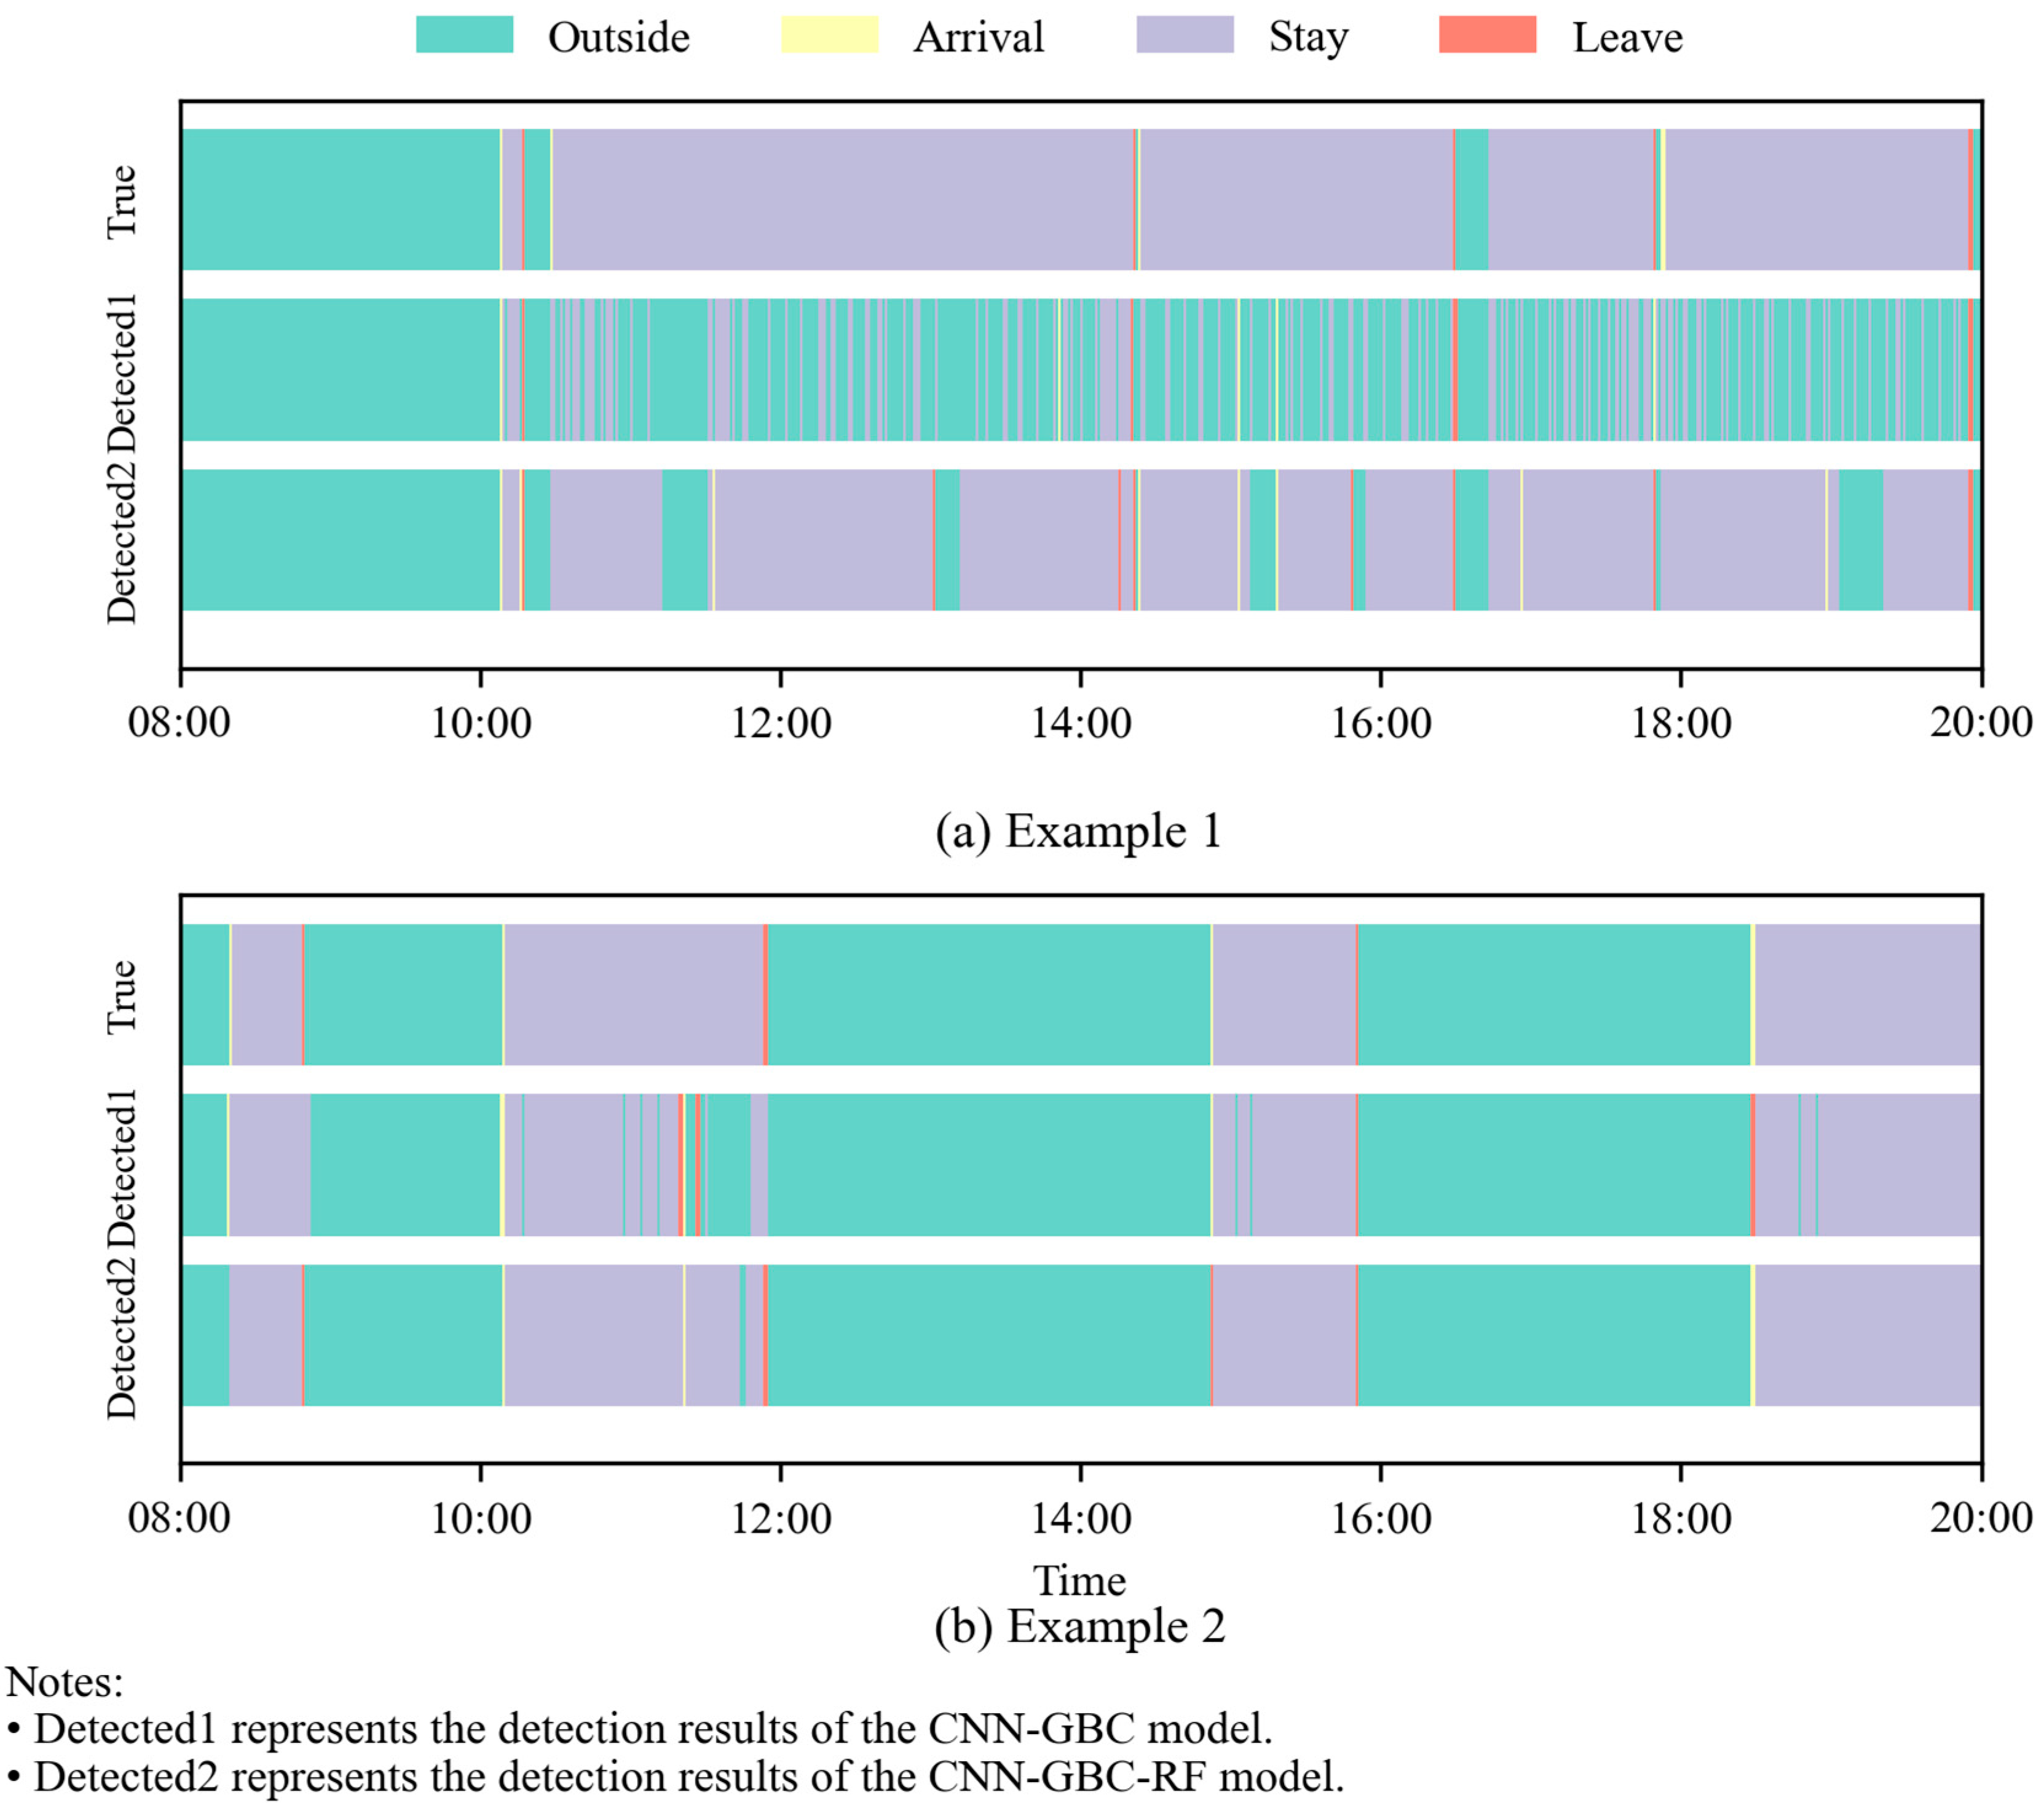
As shown in Table 6, occupants 2, 4, and 7 demonstrated high signal loss rates, with the remaining occupants showing low signal loss. Therefore, two representative examples were selected to compare the true and detected states of the CNN-GBC model and the CNN-GBC-RF model, as illustrated in Figure 11. Figure 11a illustrates the occupancy detection performance of the CNN-GBC and CNN-GBC-RF models under high signal loss condition. Figure 11b presents the detection performance under low signal loss condition. These results indicate that the integration of the RF model reduces the misclassification of indoor occupants as outside state.

3.3. Experimental Results from OCC and Baseline Scenarios

3.3.1. Effectiveness of AC Switch and Setpoint Control

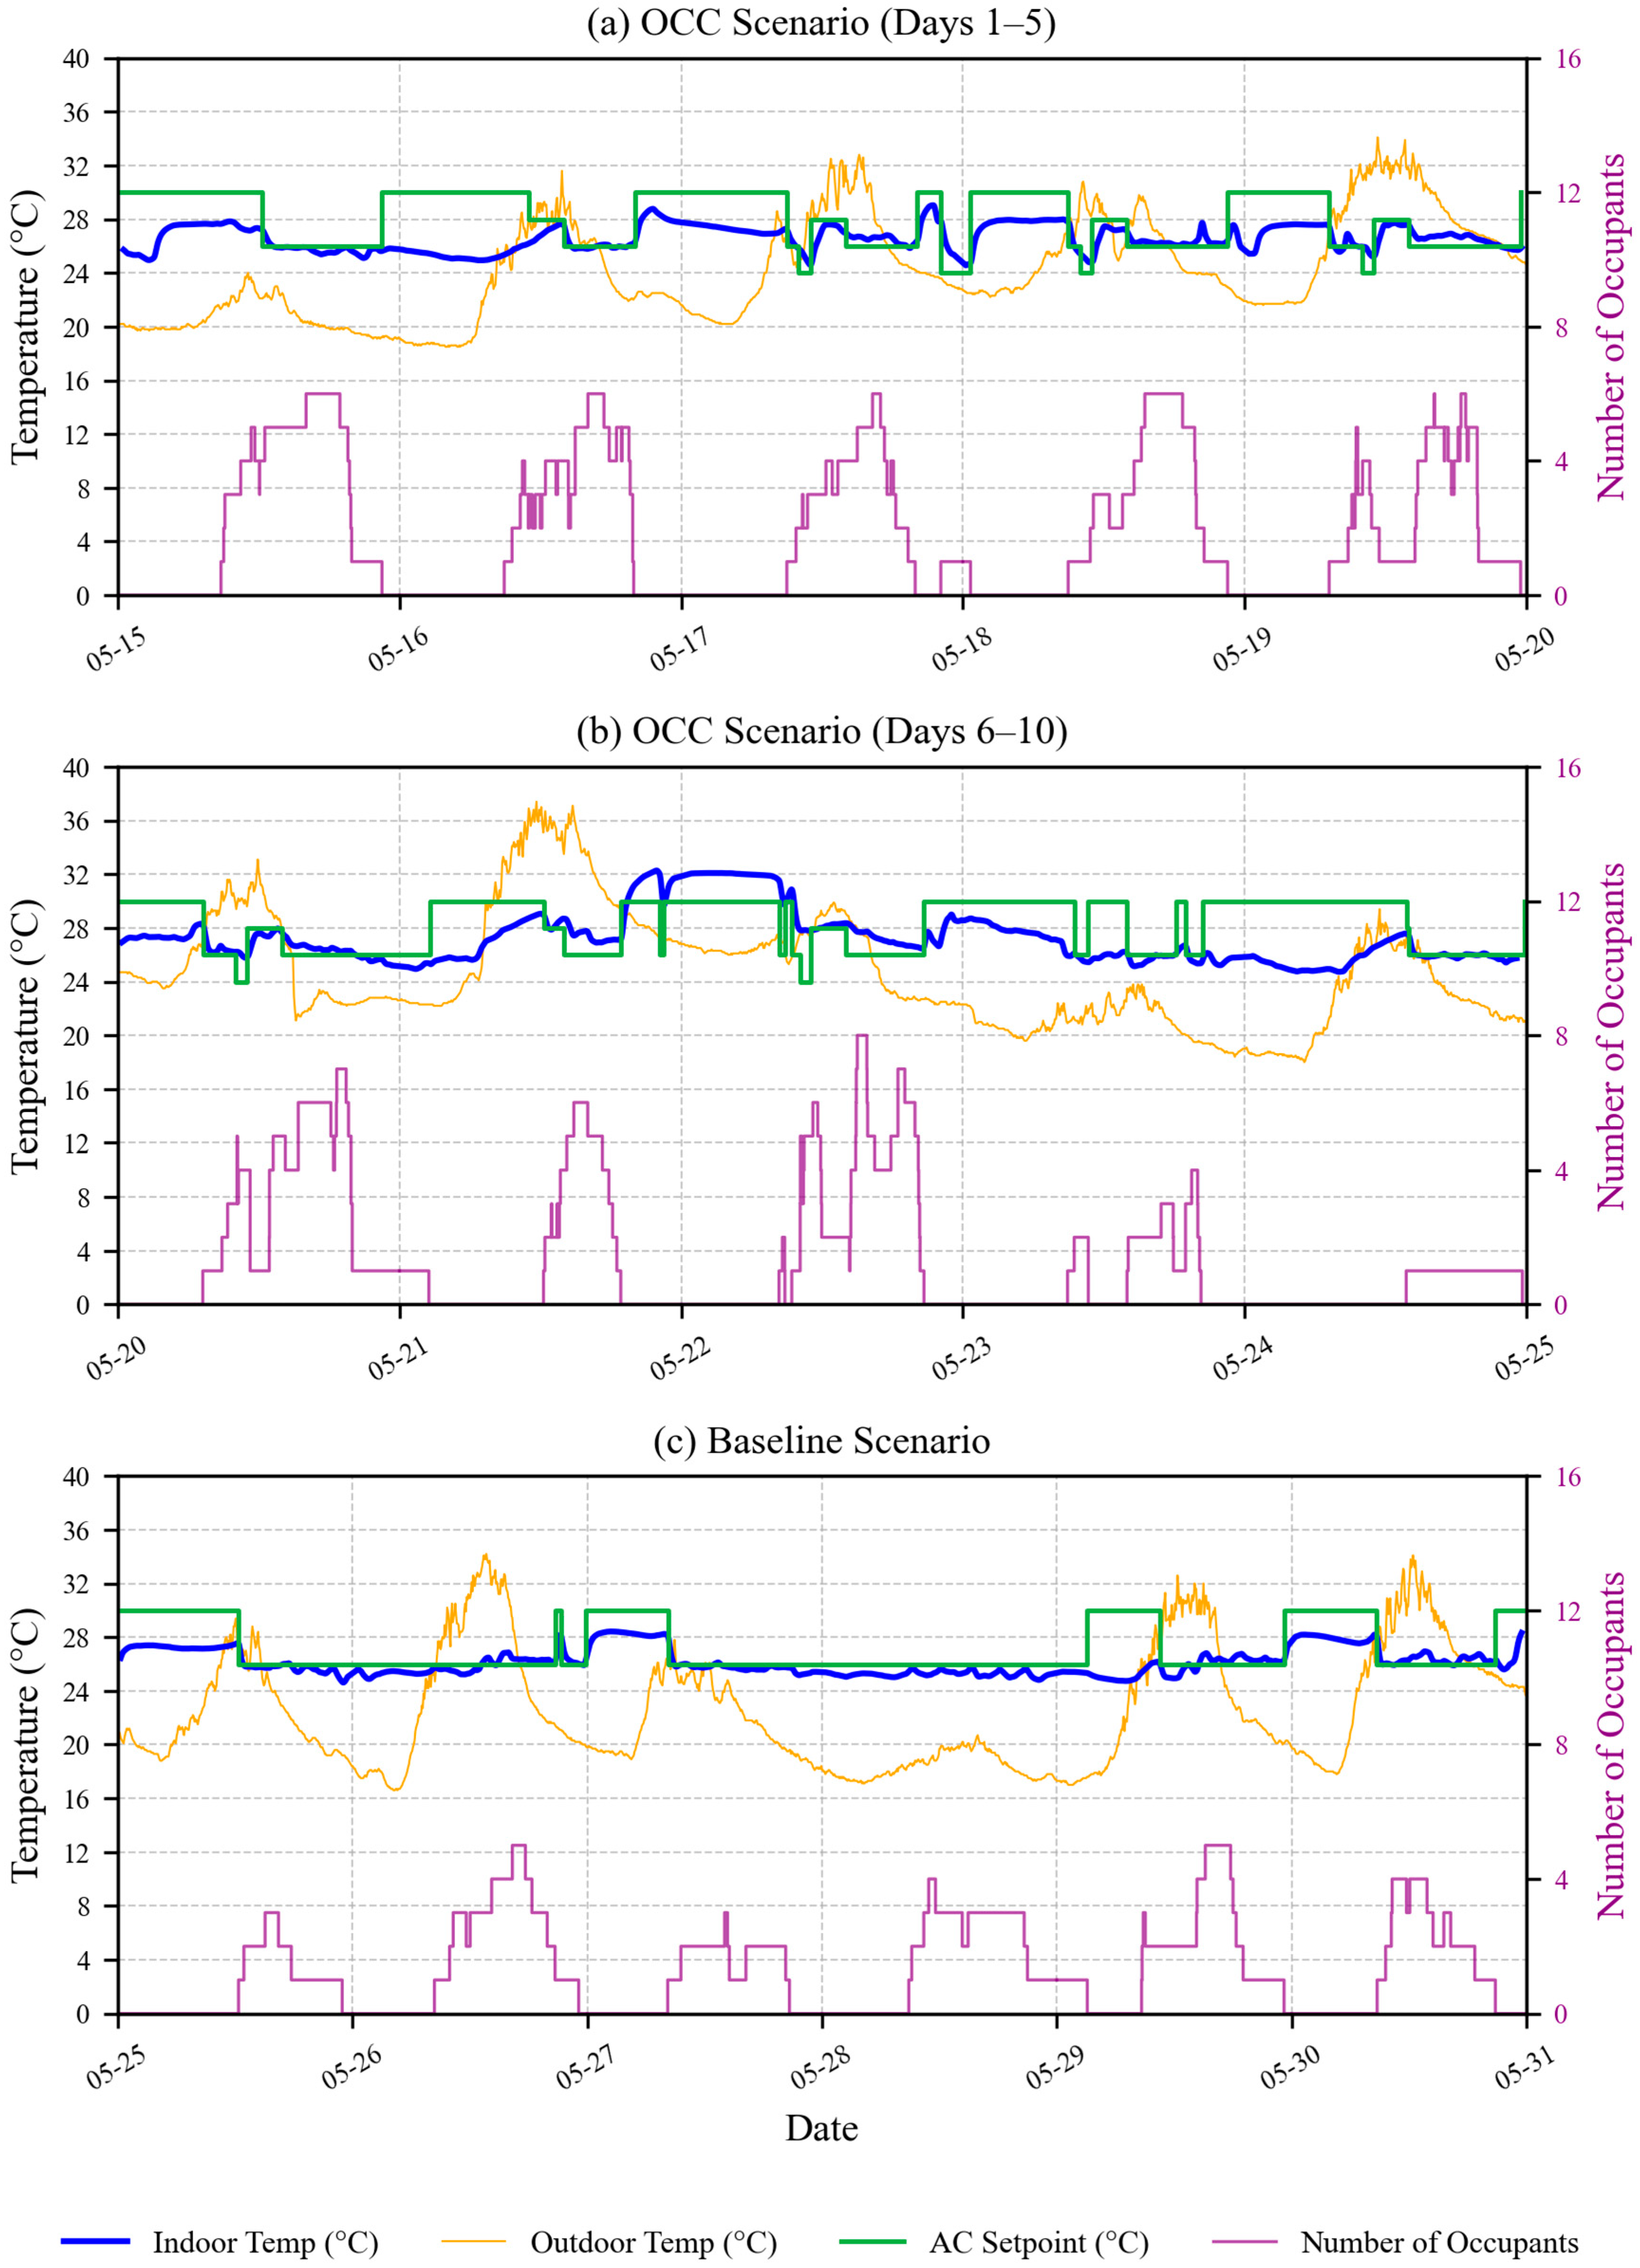
The profiles of indoor average temperature, outdoor temperatures, AC setpoint temperature, and number of occupants during the experiment are illustrated in Figure 12. The AC setpoint of 30 °C signifies its off state. Under the OCC scenario, the system automatically turned on the AC 6 out of 10 times upon the first occupant arriving in the room, as shown in Table 8. Conversely, when the last occupant left, the system turned off the AC in all instances (10 out of 10 times). During working hours, the system successfully turned off the AC in all instances (3 out of 3 times) when the room transitioned from occupied to unoccupied, and turned it on in all 3 instances when the room transitioned from unoccupied to occupied. Notably, on May 21st, the AC remained on despite the room being unoccupied.
Table 9 presents a summary of the AC setpoint control. The system achieved an overall accuracy of 96.7% (232 out of 240 h). The probability of correctly setting AC to 30 °C during unoccupied periods was the highest at 98.0% (144 out of 147 h). During the pre-cooling period, the proportion of correctly setting 24 °C was the lowest at 80%. Both the 26 °C and 28 °C setpoints achieved an accuracy of 95.5%. Under the baseline scenario, on two of six days, the last occupant forgot to turn off the AC upon leaving the room, leading to energy waste. This observation aligns with the study [14], which found that, among 21 surveyed campus office rooms, the probability of the last occupant leaving without turning off the AC was 30.9%.
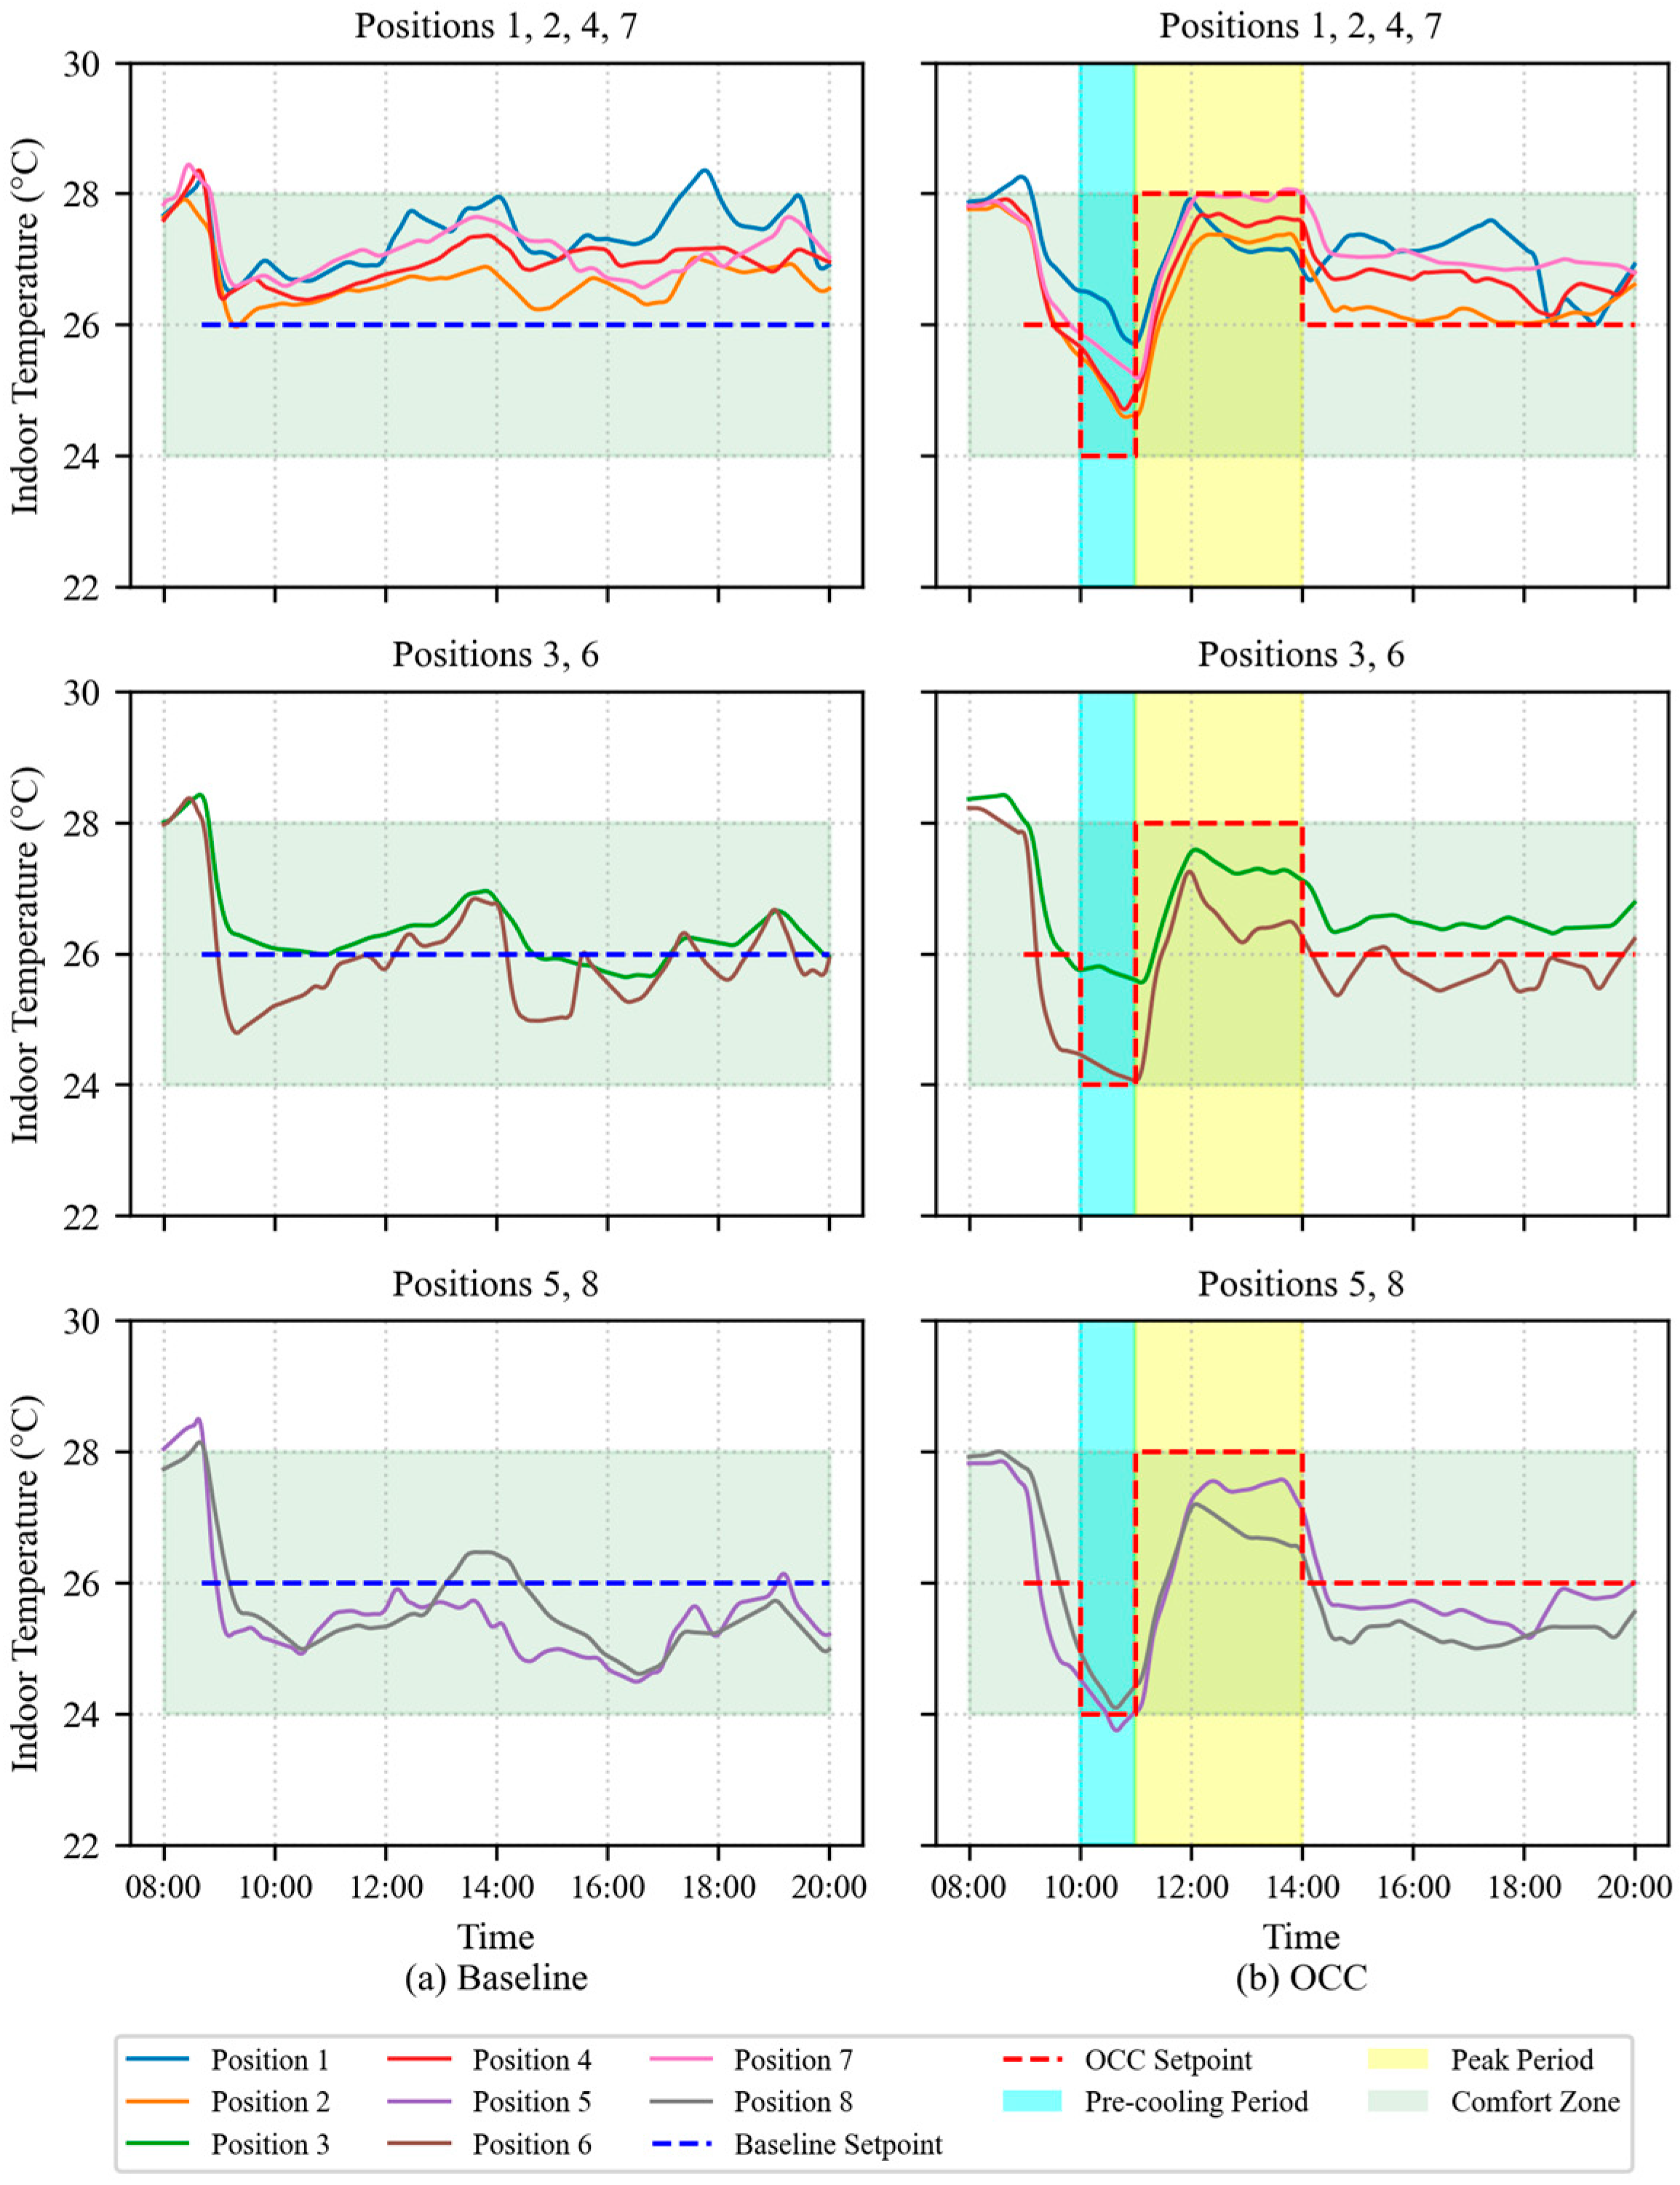
In multi-person office spaces, AC cooling leads to uneven temperature distribution. Two representative days were selected to present the variations in workstation temperatures at different positions under each scenario. As illustrated in Figure 13a, the eight positions can be categorized into three categories based on their temperature profiles under the baseline scenario. Positions 1, 2, 4, and 7 form the first category, where temperatures were consistently higher than the room setpoint. Workstation temperatures at positions 3 and 6 barely reached the setpoint. Temperatures of positions 5 and 8 remained below the room setpoint.
As shown in Figure 13b, under the OCC scenario, the indoor temperature decreased to the setpoint of 26 °C within an average of 36.38 min after the first occupant arrived. During the pre-cooling period, the indoor temperature decreased to 24 °C within an average of 56.25 min. In the peak period, the indoor temperature subsequently rose to 28 °C after an average of 101.75 min. Previous experimental results indicated that the optimal pre-cooling duration for this room was one hour, during which the thermal storage capacity reached its maximum.

3.3.2. Effectiveness of Desktop Lights and Fans Control

The control of desktop lights was based on occupancy states and desktop illuminance. During the experimental period, the control effectiveness of desktop lights for all workstations was statistically analyzed, as presented in Table 10. When occupants were present and desktop illuminance was below 400 lux, the system turned on the desktop lights with an 86.3% probability (125.6 out of 145.5 h). Conversely, when occupants were present and desktop illuminance exceeded 600 lux, the system turned off the desktop lights with a probability of 30.0% (3.9 out of 13.1 h). During the unoccupied periods, the desktop lights remained off with an 81.8% probability (1353.5 out of 1654.2 h).
The control of desktop fans was determined by occupancy states and workstation temperature. The control performance of desktop fans across all workstations was summarized in Table 11. When occupants were present and the workstation temperature exceeded 28 °C, the system turned on the desktop fans with a probability of 82.1% (26.1 out of 31.8 h). Due to the cooling capacity limitations of the AC, none of workstation temperatures dropped below 24 °C. During unoccupied periods, the desktop fans remained off with a probability of 88.4% (1461.5 out of 1654.2 h). These results indicate that the control system can effectively execute control actions in accordance with predefined rules.

3.3.3. AC Energy Consumption Analysis

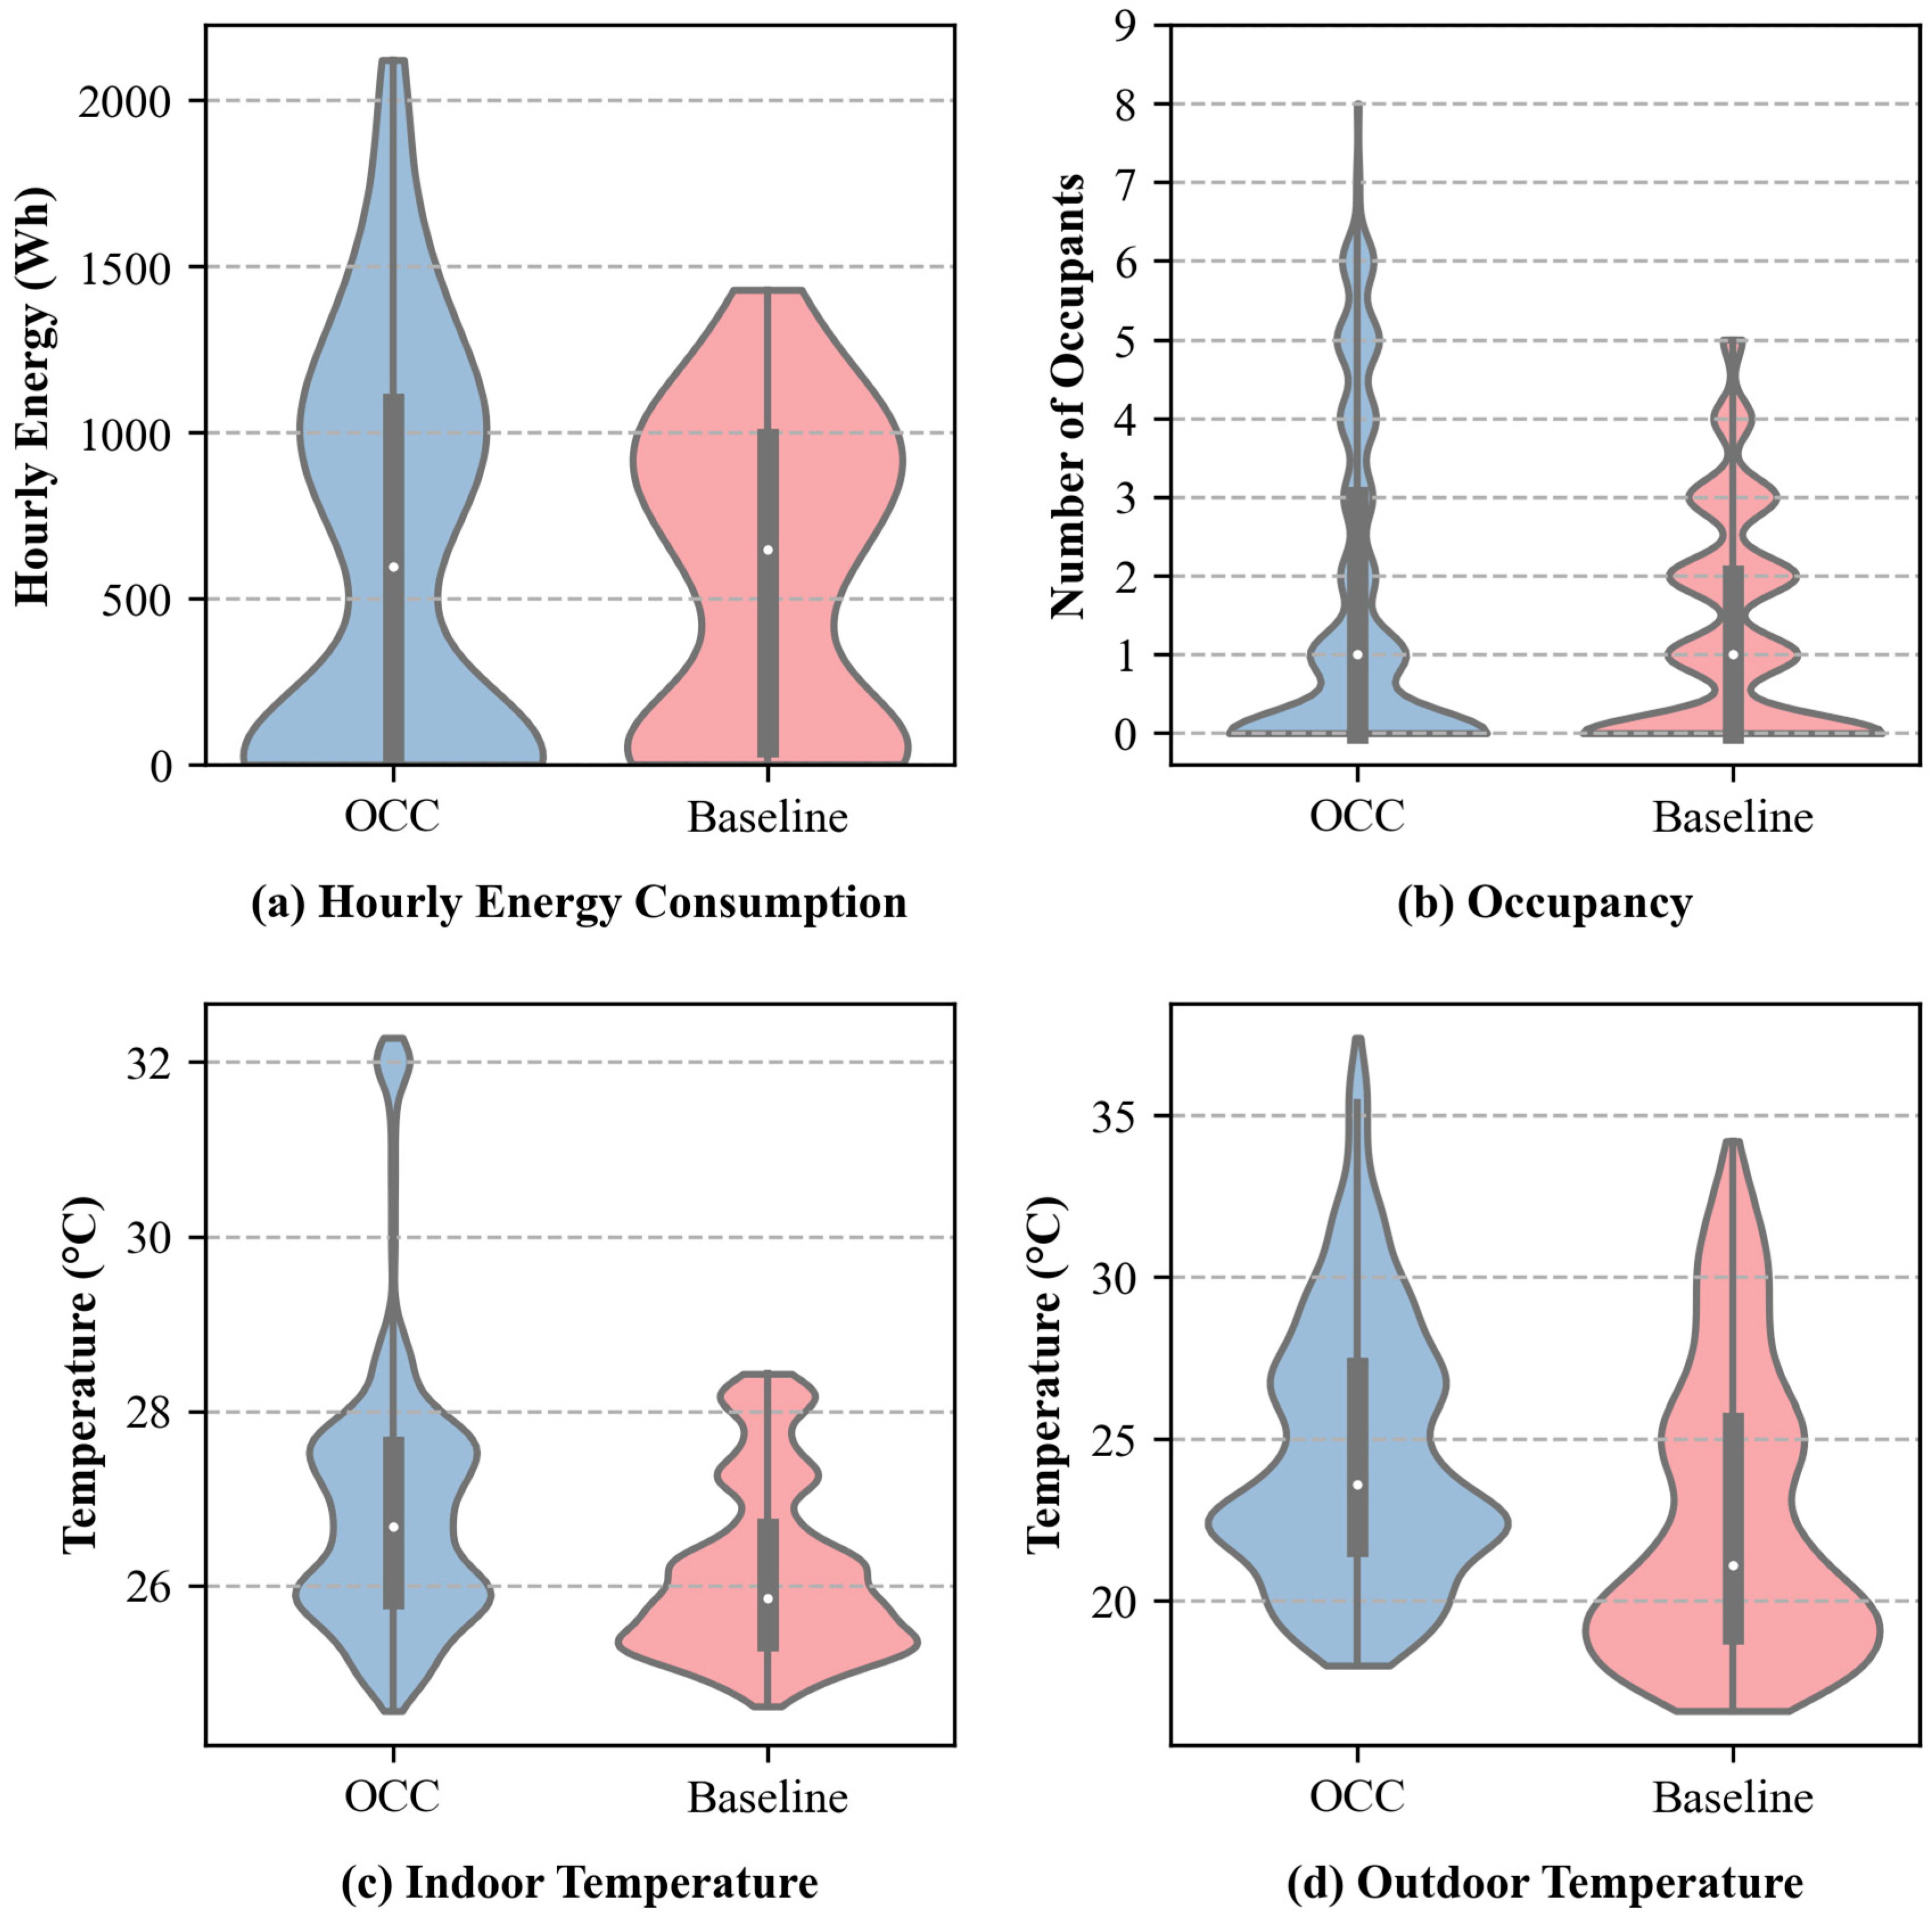
Figure 14 illustrates the distribution of hourly energy consumption, occupancy, indoor temperature, and outdoor temperature under two scenarios. In the baseline scenario, the mean outdoor temperature was 22.50 °C (Std = 4.39 °C), the mean indoor temperature was 26.14 °C (Std = 0.97 °C), and the average number of occupants during working hours was 2.20. In the OCC scenario, the mean outdoor temperature was 24.48 °C (Std = 4.01 °C), the mean indoor temperature was 26.91 °C (Std = 1.53 °C), and the average number of occupants during working hours was 2.76. Outdoor temperature has a substantial influence on energy consumption. Therefore, a t-test was conducted to examine whether there was a significant difference in outdoor temperature between the two scenarios. The result (p-value ≈ 0) indicated that the outdoor temperatures differed significantly. To address this issue, CDD normalization was conducted. The average CDD was 4.50 °C·day for the baseline scenario and 6.48 °C·day for the OCC scenario. The total energy consumption of the baseline and OCC scenarios was 23.98 kWh/(°C·day) and 39.95 kWh/(°C·day), respectively. Compared to the baseline scenario, the energy consumption has a relative reduction of 39.9% under OCC.
Two comparable days were selected to analyze the DR potential. A t-test (p-value = 0.879 > 0.05) was conducted, and the results indicated that there was no significant difference in outdoor temperature between the two days. Figure 15 shows the hourly energy consumption of the OCC and baseline day. During the pre-cooling period (9:00 to 10:00), the energy consumption on the OCC day exceeded the baseline scenario by 422.58 W·h. During the peak period (11:00 to 14:00), OCC day demonstrated a load reduction of 950.66 W·h (31.74%) relative to the baseline scenario. For the remaining periods, slight differences in energy consumption were observed due to different outdoor weather conditions.

3.3.4. Thermal Comfort Analysis

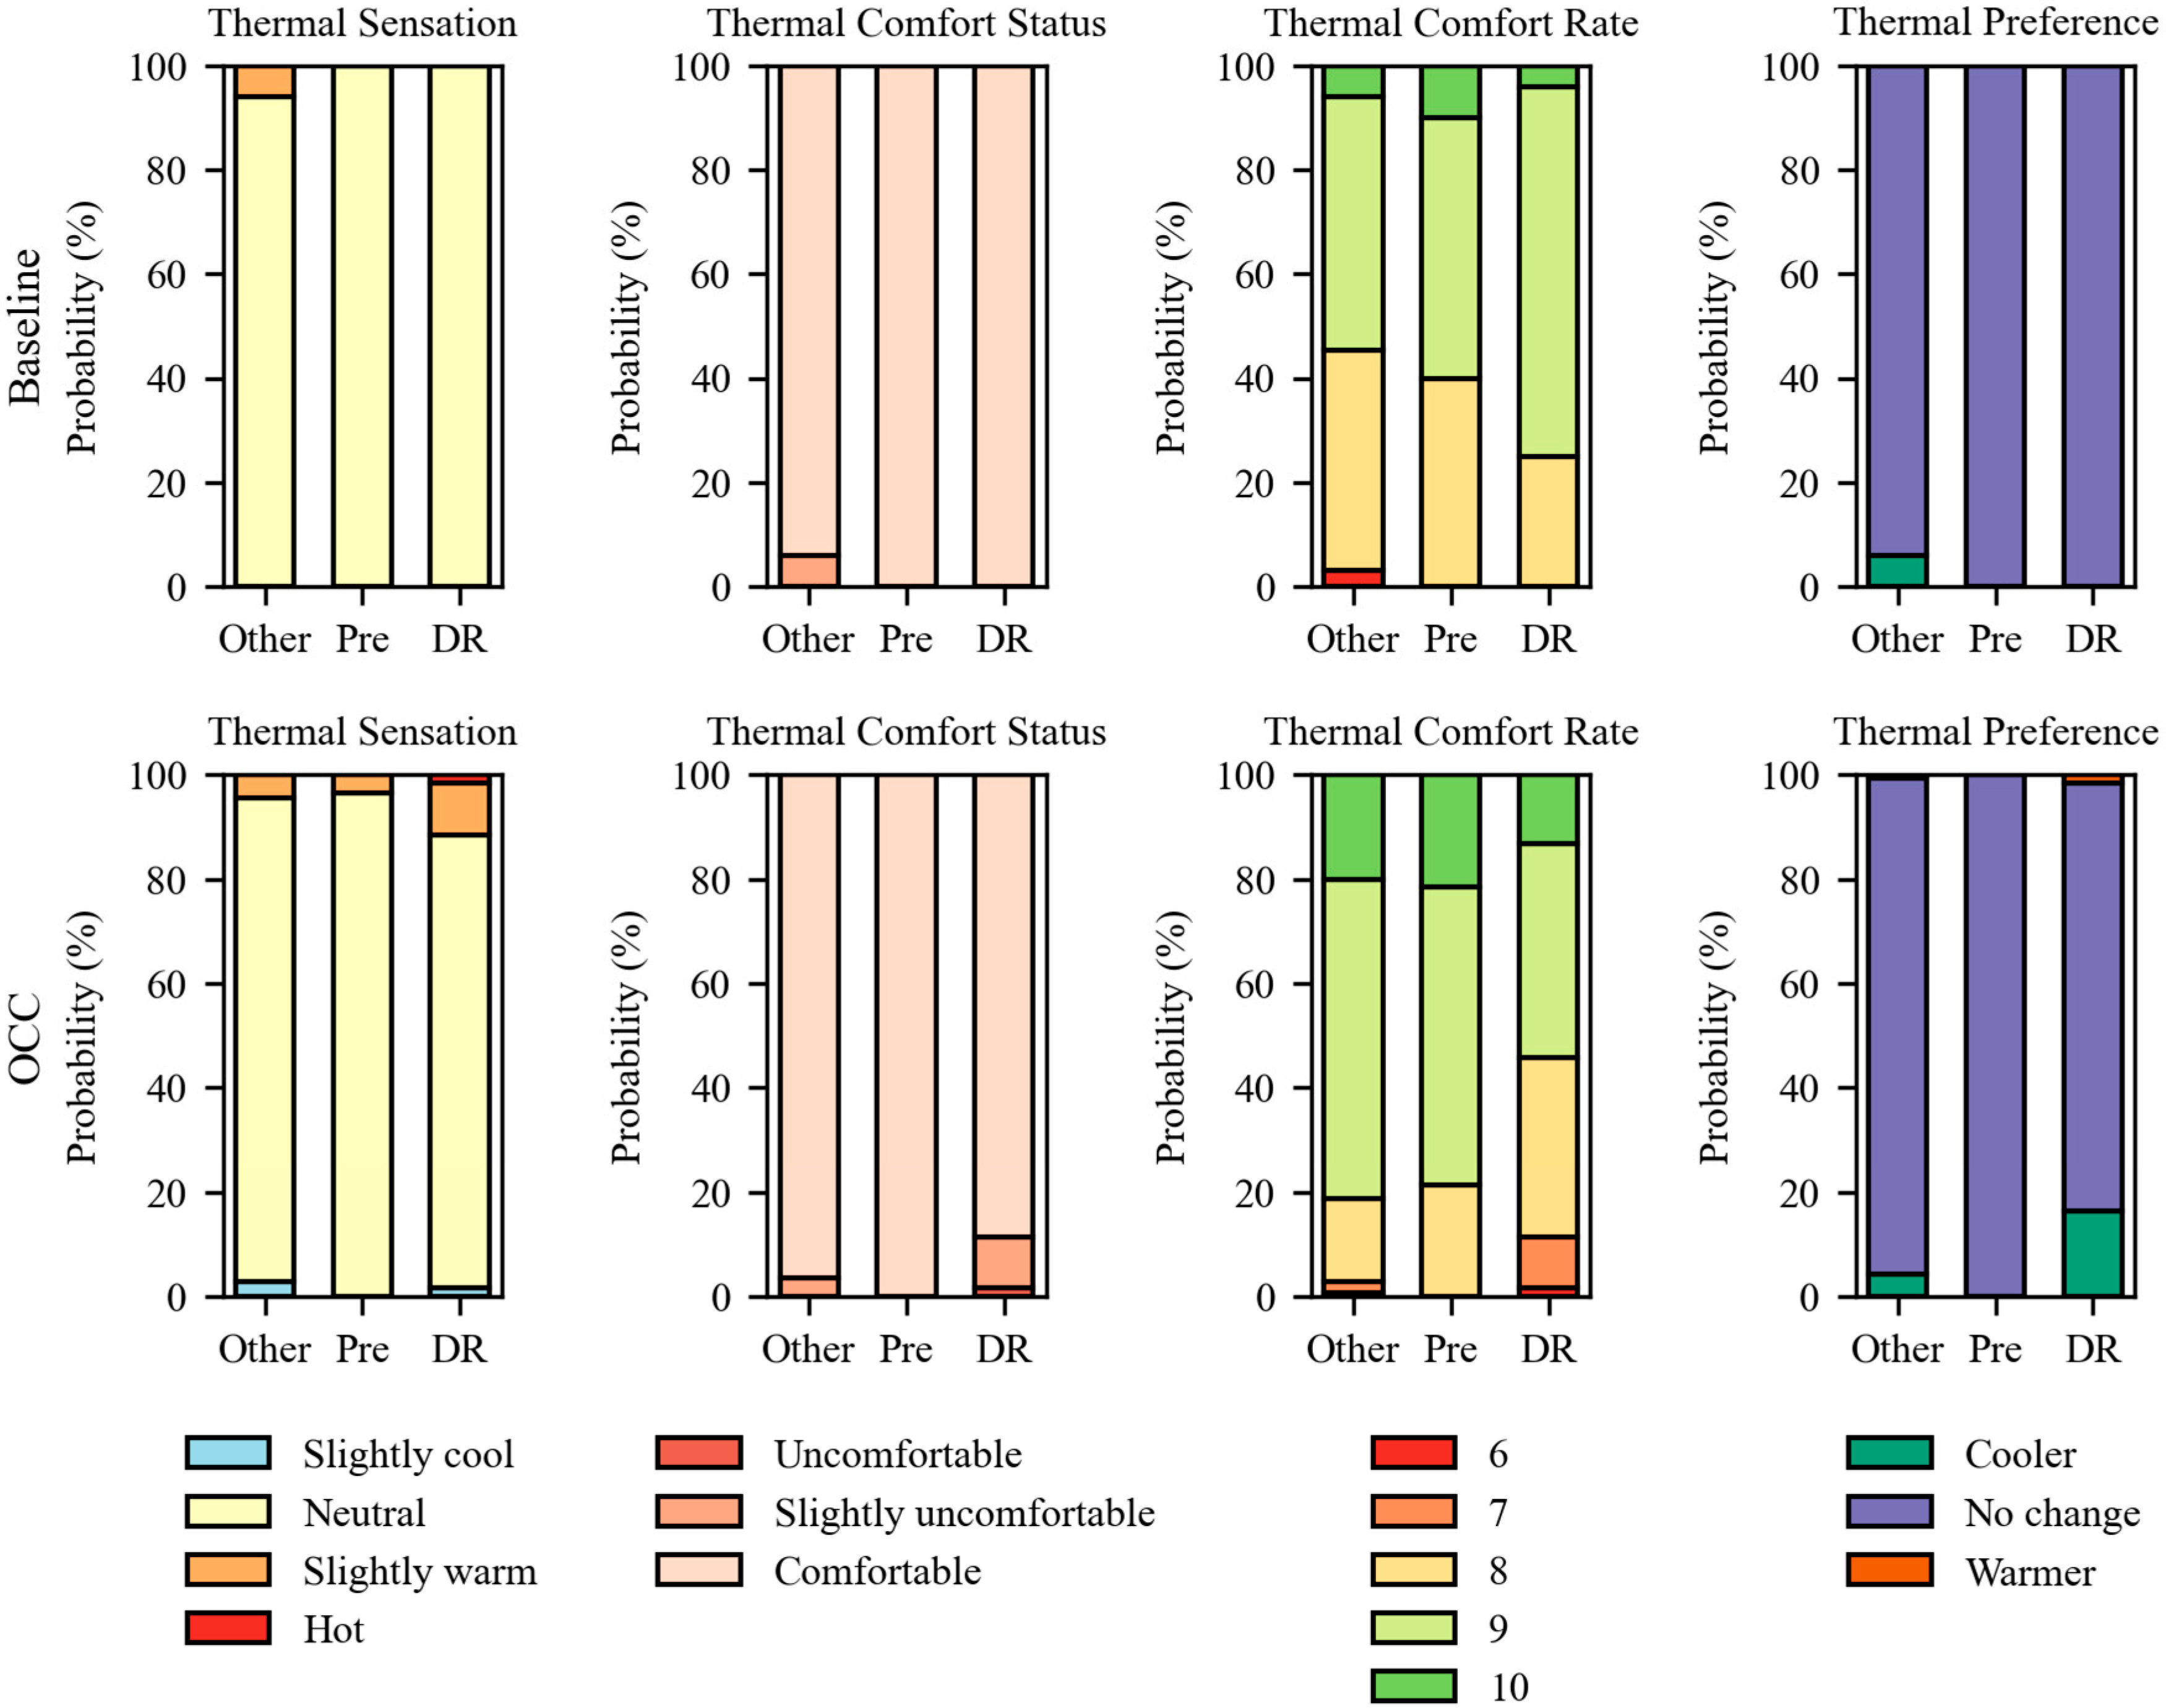
Based on the collected subjective thermal comfort questionnaires, the thermal comfort of occupants was analyzed. Figure 16 shows the distribution of various thermal comfort metrics during the experiment. Under the baseline scenario, 97% of occupants felt neutral and comfortable. In terms of thermal preference, 97% of occupants hoped the environment remained unchanged, and a small part (3%) preferred a cooler environment. Under the OCC scenario, a small portion of occupants felt slightly uncomfortable (4.82%) or uncomfortable (0.44%). This was primarily attributed to increased indoor temperatures during peak periods, which adversely affected thermal comfort. Specifically, the average thermal comfort score during peak periods in the OCC scenario (8.54) was lower than the baseline scenario (8.79). The average thermal comfort rate of the OCC scenario was 8.86, compared to 8.66 under the baseline scenario. A t-test (p-value = 0.074 > 0.05) was conducted, and the results indicated that there was no significant difference in thermal comfort levels between the two scenarios.

3.3.5. Overall Performance of the OCC Scenario

Based on the data collected from sensors, the energy consumption, electricity cost, and average thermal comfort rates for the two control strategies were evaluated. Table 12 summarizes the comparative performance of the two scenarios. Compared to the baseline scenario, the OCC scenario achieved a 39.9% relative difference in energy consumption, a 41.6% relative reduction in electricity cost, and a similar thermal comfort level. These results represent approximate comparative differences under similar weather conditions, as other key factors, such as internal heat gains and solar radiation, were not considered.

4. Discussion

This study proposed a comprehensive OCC-based framework that integrates OB model development, data sensing and storage, actual control deployment, and overall evaluation systems. The framework leverages IoT sensing technologies and Wi-Fi communication to optimize the operation of energy-consuming devices under DR events. The proposed method demonstrates the potential of integrating OCC with DR in grid-interactive buildings.
This study found that infrequent smartphone usage led to signal loss problems, consequently causing the occupancy detection model to misclassify occupants as outside states [29]. The introduction of the RF model effectively mitigated this problem. However, we observed varying degrees of signal loss across different smartphone models. Specifically, occupants 2, 4, and 7 experienced more severe signal loss compared to other occupants. This discrepancy might be attributed to differences in phone transmission power or the signal management strategies employed by different operating systems. This phenomenon presents a challenge to the generalization capability of the model, especially in environments with diverse user devices. Furthermore, the system reduced the time delay between actual states and detected states to 2 min, compared to the 12 min in [29]. While this delay is acceptable for energy-saving objectives, it may be a limitation for providing immediate control action. Future research will consider incorporating smartphone models as an input feature for the model and combining Wi-Fi sensing with other low-intrusive sensors to address these problems.
Previous studies on occupancy detection primarily focused on presence/absence [19,20] or occupant number [26,28]. In contrast, this study extends the detection framework by incorporating short-duration arrival and leave states. Based on this design, short absences, such as occupants leaving the room temporarily (e.g., to use the restroom), thereby avoiding frequent switching of devices. Compared to Wi-Fi-based occupancy studies [25,26,27], the proposed model demonstrated satisfactory detection accuracy. However, its performance in recognizing short-duration arrival and leave states was less ideal. Future work will continue to collect additional training samples to enhance detection accuracy. Moreover, the current study was deployed in an office room with eight occupants, where each occupant’s signal was processed and detected independently. Future research will consider deploying the model to spaces with more occupants, such as classrooms, to further explore its detection performance.
Compared to studies [5,6], the developed online control system can reduce building energy consumption while maintaining occupant thermal comfort. Although the experimental results demonstrate that the developed online control system achieves the intended objectives, some limitations remain in the current study. For AC, pre-cooling and temperature reset strategies were employed, utilizing fixed operational parameters. Compared to [11], this approach may limit the applicability under fluctuating outdoor weather conditions. Regarding desktop lights and fans, the experiments found that using a fixed on/off threshold resulted in frequent switching, which negatively impacts occupant satisfaction. Future work will explore dynamic optimized control strategies based on IoT sensing data, such as data-driven model predictive control. In this study, the thermal comfort score was measured on a 1–10 scale, while feedback on lighting and air movement was lacking. Future research will investigate the use of a qualitative Likert scale and extend the incorporate of satisfaction with lighting and air movement. Although the calculation of energy consumption difference employs CDD normalization, other key factors also significantly impact actual energy demand, such as internal heat gains, solar radiation, and outdoor wind speed. Future work should incorporate a building energy model to explicitly account for these influencing parameters, thereby enabling more rigorous comparison.
This study investigated the temperature distribution across different workstations and found that the case room exhibited uneven temperature distribution. Different genders tend to different thermal environments. For example, most males prefer conditions, whereas most females are inclined toward warmer environments. In addition, personal preference is also a critical factor influencing thermal comfort satisfaction. Future work may explore adaptive workstation layouts or personalized control strategies [40] that take into account both gender differences and individual preferences in thermal comfort.
This study was conducted in a multi-person office environment to validate the proposed approach. While the results demonstrate its effectiveness, several limitations remain regarding its generalization to multi-room office environments, where occupants frequently move between interconnected spaces. Such inter-room movement affects both the temporal and spatial resolution of occupancy detection. Temporally, frequent movement can cause misclassifications or short-term instability, particularly when the transition duration is shorter than the sensing or processing interval. Spatially, signal attenuation and reflection caused by walls may reduce the distinguishability of occupancy states across rooms, especially for occupants located near room boundaries. Future work will extend the system to multiple offices within a whole building to examine its performance under realistic inter-room movement patterns and to explore optimized spatial AP configurations.

5. Conclusions

This study proposed a complete OCC-based framework including from OB development to results evaluation, and developed an online control system based on IoT sensing technology and Wi-Fi communication. Practical experiments conducted in a multi-person office environment were used to analyze the performance of the CNN-GBC-RF model and the effectiveness of the OCC. The main conclusions of this paper are summarized as follows:
  • This study improved the occupancy detection model by incorporating a RF model. During real operation, the improved CNN-GBC-RF model achieved a robust overall accuracy of 97.0%, demonstrating that the introduction of the RF model effectively enhances the occupancy detection.
  • This study developed an IoT-enabled online control system, incorporating an occupancy detection model. The system achieved an 84.6% accuracy in switching the AC on or off, and a 96.7% accuracy in setting the AC temperature. After the occupants left, the probabilities of turning off the desktop lights and desktop fans were 81.8% and 88.4%, respectively. These results indicate that the control system is capable of switching off devices when occupants are absent to achieve energy savings.
  • Compared to the baseline scenario, the proposed OCC scenario achieves an energy-saving rate of 39.9%, a cost-saving rate of 41.6%, and a similar thermal comfort level. These results indicate that the online control system contributes to improving building energy efficiency while maintaining the occupant thermal comfort.

Author Contributions

Conceptualization, Y.C.; methodology, Y.C. and K.Z.; software, K.Z. and L.G.; validation, K.Z., Y.Y. and L.G.; formal analysis, K.Z. and Y.Y.; investigation, K.Z. and L.G.; resources, Y.C.; data curation, K.Z.; writing—original draft preparation, K.Z.; writing—review and editing, Y.C., L.G. and Y.Y.; visualization, K.Z. and Y.Y.; supervision, Y.C.; project administration, Y.C.; funding acquisition, Y.C. All authors have read and agreed to the published version of the manuscript.

Funding

This research was funded by “A Project (Key grant) Supported by the Scientific Research Fund of Hunan Provincial Education Department, China (No. 23A0033)”. Additional support was provided by “A Project Supported by the Scientific Research Fund of Hunan Provincial Education Department, China (No. 2023JGZD027)”. Additional support was provided by “A Project Supported by the Key Research and Development Project of Hunan Province, China (No. 2025JK2072)”.

Institutional Review Board Statement

Ethics approval was waived for this study. The experiment involved non-invasive environmental control within standard comfort ranges and the online questionnaire was administered anonymously via the Wenjuan Xing platform (https://www.wjx.cn/, accessed on 15 May 2025), in compliance with regulatory requirements. The questionnaire link was non-traceable and collected no direct or indirect identifiers. No names, gender, contact details, IDs, IP addresses, health/medical/psychological data, political opinions, religious beliefs, or any other sensitive personal information were collected; responses were analyzed only in aggregate.

Informed Consent Statement

Informed consent was obtained from all subjects involved in the study.

Data Availability Statement

Publicly available datasets were analyzed in this study. This data can be found here: https://github.com/Serendipityzkj/Wi-Fi-occupancy-research (accessed on 22 November 2025).

Acknowledgments

During the preparation of this work, the authors used Grammarly and ChatGPT 5 to improve readability and detect spelling/grammar mistakes. After using this tool/service, the authors reviewed and edited the content as needed and took full responsibility for the content of the publication.

Conflicts of Interest

The authors declare no conflict of interest.

References

  1. Hu, S.; Zhang, Y.; Yang, Z.; Yan, D.; Jiang, Y. Challenges and Opportunities for Carbon Neutrality in China’s Building Sector—Modelling and Data. Build. Simul. 2022, 15, 1899–1921. [Google Scholar] [CrossRef]
  2. Lima Azevedo, I.; Morgan, M.G.; Palmer, K.; Lave, L.B. Reducing U.S. Residential Energy Use and CO2 Emissions: How Much, How Soon, and at What Cost? Environ. Sci. Technol. 2013, 47, 2502–2511. [Google Scholar] [CrossRef]
  3. Meimand, M.; Jazizadeh, F. A Personal Touch to Demand Response: An Occupant-Centric Control Strategy for HVAC Systems Using Personalized Comfort Models. Energy Build. 2024, 303, 113769. [Google Scholar] [CrossRef]
  4. Xu, D.; Zhong, F.; Bai, Z.; Wu, Z.; Yang, X.; Gao, M. Real-Time Multi-Energy Demand Response for High-Renewable Buildings. Energy Build. 2023, 281, 112764. [Google Scholar] [CrossRef]
  5. Hu, M.; Xiao, F.; Wang, L. Investigation of Demand Response Potentials of Residential Air Conditioners in Smart Grids Using Grey-Box Room Thermal Model. Appl. Energy 2017, 207, 324–335. [Google Scholar] [CrossRef]
  6. Peng, C.; Chen, Z.; Yang, J.; Liu, Z.; Yan, D.; Chen, Y. Assessment of Electricity Consumption Reduction Potential for City-Scale Buildings under Different Demand Response Strategies. Energy Build. 2023, 297, 113473. [Google Scholar] [CrossRef]
  7. You, Z.; Sun, Y.; Mo, S.; Zou, W.; Zhang, X.; Gao, D. Experimental Evaluation of the Effects of Passive Phase Change Material Walls on the Building Demand Response for Smart Grid Applications. Buildings 2022, 12, 1830. [Google Scholar] [CrossRef]
  8. Sun, Y.; Zhao, T.; Lyu, S. Model-Based Investigation on Building Thermal Mass Utilization and Flexibility Enhancement of Air Conditioning Loads. Build. Simul. 2024, 17, 1289–1308. [Google Scholar] [CrossRef]
  9. Nelson, J.; Johnson, N.G.; Chinimilli, P.T.; Zhang, W. Residential Cooling Using Separated and Coupled Precooling and Thermal Energy Storage Strategies. Appl. Energy 2019, 252, 113414. [Google Scholar] [CrossRef]
  10. Dehwah, A.H.A.; Krarti, M. Performance of Precooling Strategies Using Switchable Insulation Systems for Commercial Buildings. Appl. Energy 2021, 303, 117631. [Google Scholar] [CrossRef]
  11. Jiang, Y.; Andrew Ejenakevwe, K.; Wang, J.; Tang, C.Y.; Song, L. Development, Implementation, and Impact Analysis of Model Predictive Control-Based Optimal Precooling Using Smart Home Thermostats. Energy Build. 2024, 303, 113790. [Google Scholar] [CrossRef]
  12. Hong, T.; Yan, D.; D’Oca, S.; Chen, C. fei Ten Questions Concerning Occupant Behavior in Buildings: The Big Picture. Build. Environ. 2017, 114, 518–530. [Google Scholar] [CrossRef]
  13. Yuan, Y.; Song, C.; Gao, L.; Zeng, K.; Chen, Y. A Review of Current Research on Occupant-Centric Control for Improving Comfort and Energy Efficiency. Build. Simul. 2024, 17, 1675–1692. [Google Scholar] [CrossRef]
  14. Yuan, Y.; Gao, L.; Zeng, K.; Chen, Y. Space-Level Air Conditioner Electricity Consumption and Occupant Behavior Analysis on a University Campus. Energy Build. 2023, 300, 113646. [Google Scholar] [CrossRef]
  15. Um-e-Habiba; Ahmed, I.; Asif, M.; Alhelou, H.H.; Khalid, M. A Review on Enhancing Energy Efficiency and Adaptability through System Integration for Smart Buildings. J. Build. Eng. 2024, 89, 109354. [Google Scholar] [CrossRef]
  16. Yuan, Y.; Song, C.; Zeng, K.; Gao, L.; Huang, Y.; Chen, Y. An Occupant-Centric Control Case Study Based on Internet of Things and Data Mining for an Office Space. J. Build. Eng. 2025, 101, 111925. [Google Scholar] [CrossRef]
  17. Mahmud, A.; Dhrubo, E.A.; Ahmed, S.S.; Chowdhury, A.H.; Hossain, M.F.; Rahman, H.; Masood, N.-A. Energy Conservation for Existing Cooling and Lighting Loads. Energy 2022, 255, 124588. [Google Scholar] [CrossRef]
  18. He, L.; Liu, Y.; Zhang, J. An Occupancy-Informed Customized Price Design for Consumers: A Stackelberg Game Approach. IEEE Trans. Smart Grid 2022, 13, 1988–1999. [Google Scholar] [CrossRef]
  19. Sun, K. DMFF: Deep Multimodel Feature Fusion for Building Occupancy Detection. Build. Environ. 2024, 253, 111355. [Google Scholar] [CrossRef]
  20. Tan, S.Y.; Jacoby, M.; Saha, H.; Florita, A.; Henze, G.; Sarkar, S. Multimodal Sensor Fusion Framework for Residential Building Occupancy Detection. Energy Build. 2022, 258, 111828. [Google Scholar] [CrossRef]
  21. Li, L.; Li, X.; Yang, Y.; Dong, J. Indoor Tracking Trajectory Data Similarity Analysis with a Deep Convolutional Autoencoder. Sustain. Cities Soc. 2019, 45, 588–595. [Google Scholar] [CrossRef]
  22. Jin, Y.; Yan, D.; Zhang, X.; An, J.; Han, M. A Data-Driven Model Predictive Control for Lighting System Based on Historical Occupancy in an Office Building: Methodology Development. Build. Simul. 2021, 14, 219–235. [Google Scholar] [CrossRef]
  23. Banihashemi, F.; Weber, M.; Deghim, F.; Zong, C.; Lang, W. Occupancy Modeling on Non-Intrusive Indoor Environmental Data through Machine Learning. Build. Environ. 2024, 254, 111382. [Google Scholar] [CrossRef]
  24. Wang, C.; Jiang, J.; Roth, T.; Nguyen, C.; Liu, Y.; Lee, H. Integrated Sensor Data Processing for Occupancy Detection in Residential Buildings. Energy Build. 2021, 237, 110810. [Google Scholar] [CrossRef]
  25. Salman, M.; Caceres-Najarro, L.A.; Seo, Y.D.; Noh, Y. WiSOM: WiFi-Enabled Self-Adaptive System for Monitoring the Occupancy in Smart Buildings. Energy 2024, 294, 130420. [Google Scholar] [CrossRef]
  26. Samareh Abolhassani, S.; Zandifar, A.; Ghourchian, N.; Amayri, M.; Bouguila, N.; Eicker, U. Occupant Counting Model Development for Urban Building Energy Modeling Using Commercial Off-the-Shelf Wi-Fi Sensing Technology. Build. Environ. 2024, 258, 111548. [Google Scholar] [CrossRef]
  27. Zou, H.; Zhou, Y.; Jiang, H.; Chien, S.-C.; Xie, L.; Spanos, C.J. WinLight: A WiFi-Based Occupancy-Driven Lighting Control System for Smart Building. Energy Build. 2018, 158, 924–938. [Google Scholar] [CrossRef]
  28. Wang, W.; Hong, T.; Li, N.; Wang, R.Q.; Chen, J. Linking Energy-Cyber-Physical Systems with Occupancy Prediction and Interpretation through WiFi Probe-Based Ensemble Classification. Appl. Energy 2019, 236, 55–69. [Google Scholar] [CrossRef]
  29. Gao, L.; Yuan, Y.; Xiao, L.; Li, W.; Qin, J.; Wu, J.; Chen, Y. Occupant-Based Control of Lighting System for Multi-Person Office Rooms Based on WiFi Probe Technology. Build. Environ. 2025, 269, 112421. [Google Scholar] [CrossRef]
  30. Tanasiev, V.; Pluteanu, Ș.; Necula, H.; Pătrașcu, R. Enhancing Monitoring and Control of an HVAC System through IoT. Energies 2022, 15, 924. [Google Scholar] [CrossRef]
  31. Carli, R.; Cavone, G.; Othman, S.B.; Dotoli, M. IoT Based Architecture for Model Predictive Control of HVAC Systems in Smart Buildings. Sensors 2020, 20, 781. [Google Scholar] [CrossRef] [PubMed]
  32. Li, W.; Li, H.; Wang, S. An Event-Driven Multi-Agent Based Distributed Optimal Control Strategy for HVAC Systems in IoT-Enabled Smart Buildings. Autom. Constr. 2021, 132, 103919. [Google Scholar] [CrossRef]
  33. Png, E.; Srinivasan, S.; Bekiroglu, K.; Chaoyang, J.; Su, R.; Poolla, K. An Internet of Things Upgrade for Smart and Scalable Heating, Ventilation and Air-Conditioning Control in Commercial Buildings. Appl. Energy 2019, 239, 408–424. [Google Scholar] [CrossRef]
  34. Malkawi, A.; Ervin, S.; Han, X.; Chen, E.X.; Lim, S.; Ampanavos, S.; Howard, P. Design and Applications of an IoT Architecture for Data-Driven Smart Building Operations and Experimentation. Energy Build. 2023, 295, 113291. [Google Scholar] [CrossRef]
  35. Zhang, X.; Pipattanasomporn, M.; Chen, T.; Rahman, S. An IoT-Based Thermal Model Learning Framework for Smart Buildings. IEEE Internet Things J. 2020, 7, 518–527. [Google Scholar] [CrossRef]
  36. ASHRAE Standard 55; Thermal Environmental Conditions for Human Occupancy. American Society of Heating, Refrigerating and Air-Conditioning Engineers (ASHRAE): Atlanta, GA, USA, 2017.
  37. Wang, J.; Wei, Z.; Zhu, Y.; Zheng, C.; Li, B.; Zhai, X. Demand Response via Optimal Pre-Cooling Combined with Temperature Reset Strategy for Air Conditioning System: A Case Study of Office Building. Energy 2023, 282, 128751. [Google Scholar] [CrossRef]
  38. Wang, N.; Makhmalbaf, A.; Srivastava, V.; Hathaway, J.E. Simulation-Based Coefficients for Adjusting Climate Impact on Energy Consumption of Commercial Buildings. Build. Simul. 2017, 10, 309–322. [Google Scholar] [CrossRef]
  39. Wang, Y.; Han, Y.; Wu, Y.; Korkina, E.; Zhou, Z.; Gagarin, V. An Occupant-Centric Adaptive Façade Based on Real-Time and Contactless Glare and Thermal Discomfort Estimation Using Deep Learning Algorithm. Build. Environ. 2022, 214, 108907. [Google Scholar] [CrossRef]
  40. Chen, Y.; Raphael, B.; Sekhar, S.C. Experimental and Simulated Energy Performance of a Personalized Ventilation System with Individual Airflow Control in a Hot and Humid Climate. Build. Environ. 2016, 96, 283–292. [Google Scholar] [CrossRef]
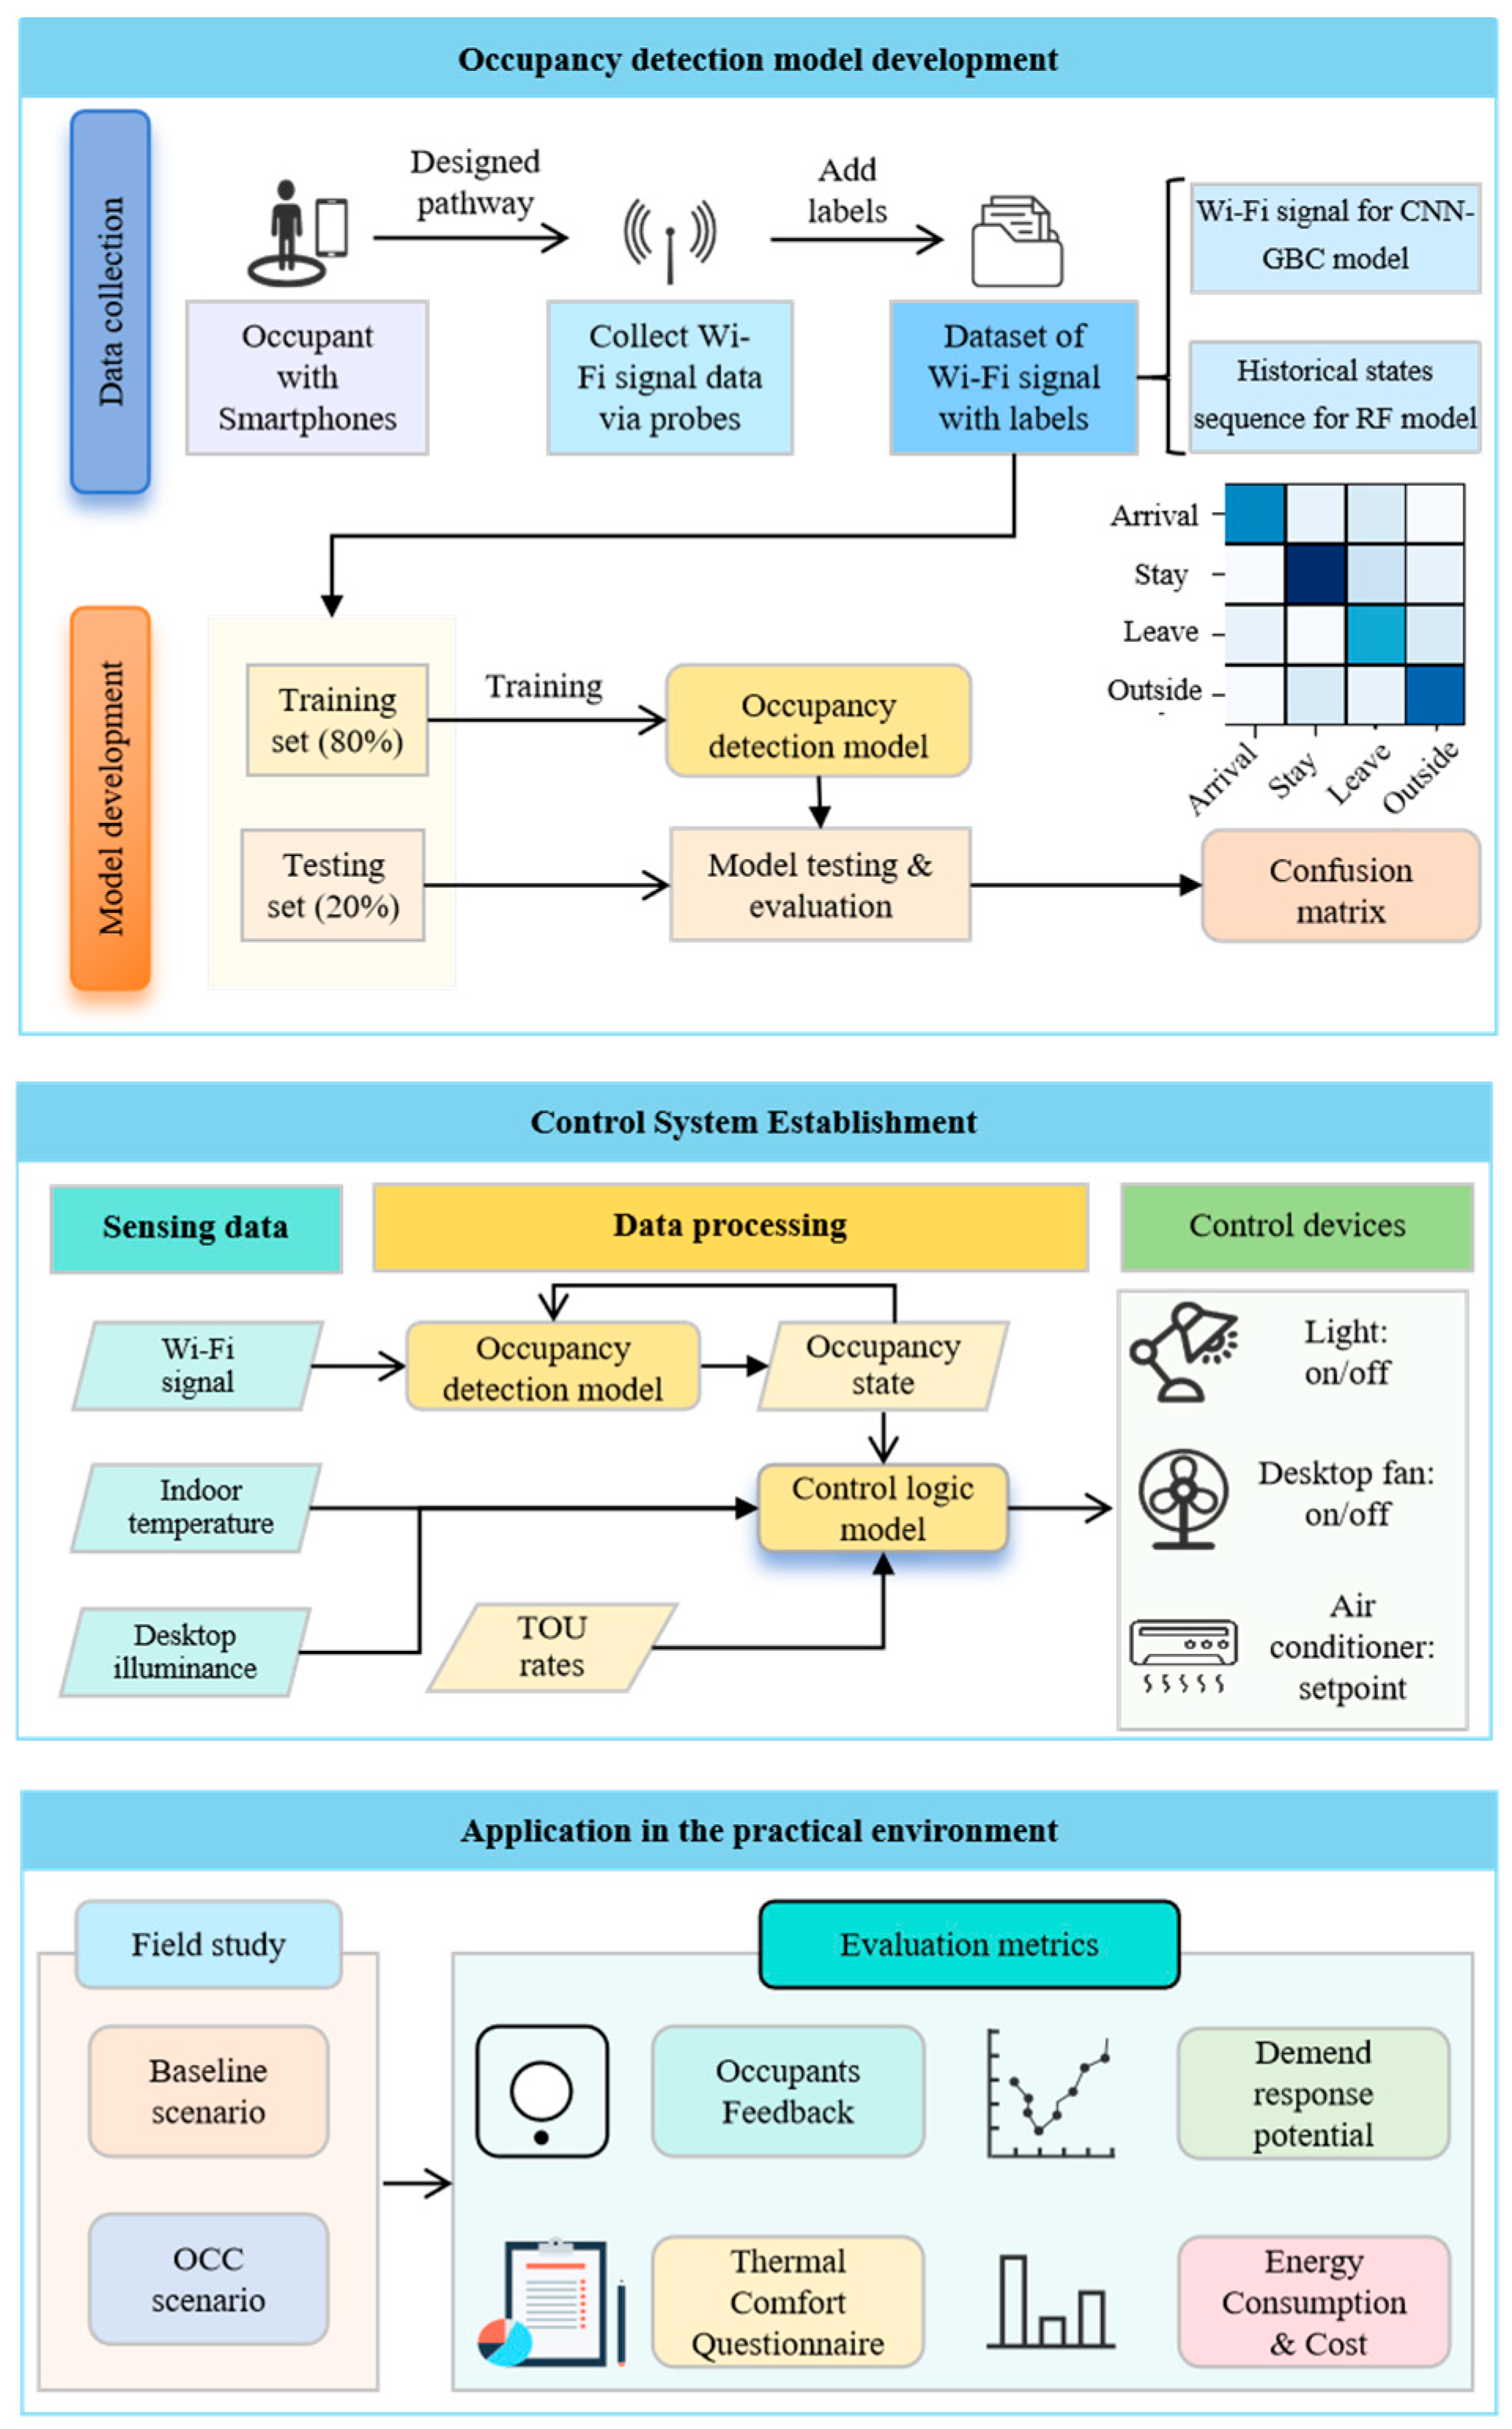
Figure 1. The overall workflow of the paper.
Buildings 15 04285 g001
Figure 2. The interior layout of the case room.
Buildings 15 04285 g002
Figure 3. The deployment of experimental equipment.
Buildings 15 04285 g003
Figure 4. The definition and RSSI heat map of the four occupancy states.
Buildings 15 04285 g004
Figure 5. The comparison of detected and observed occupancy states during practical application.
Buildings 15 04285 g005
Figure 6. The structure diagram of the CNN-GBC-RF model.
Buildings 15 04285 g006
Figure 7. The sequence diagram of the online control system.
Buildings 15 04285 g007
Figure 8. The control logic under the OCC scenario: (a) AC, (b) desktop light, (c) desktop fan.
Buildings 15 04285 g008
Figure 9. The confusion matrix in the training set and testing set: (a) training set and (b) testing set.
Buildings 15 04285 g009
Figure 10. The practical performance of (a) CNN-GBC model and (b) CNN-GBC-RF model.
Buildings 15 04285 g010
Figure 11. Comparison of true and detected states by the CNN-GBC and CNN-GBC-RF models.
Buildings 15 04285 g011
Figure 12. Profiles of indoor average temperature, outdoor temperature, AC setpoint, and numbers of occupants during the experiment.
Buildings 15 04285 g012
Figure 13. Temperature profiles at different workstations under two scenarios: (a) Baseline, (b) OCC.
Buildings 15 04285 g013
Figure 14. Distribution of (a) Hourly Energy Consumption, (b) Occupancy, (c) Indoor Temperature, and (d) Outdoor Temperature.
Buildings 15 04285 g014
Figure 15. Hourly energy consumption comparison: Baseline and OCC.
Buildings 15 04285 g015
Figure 16. Thermal comfort conditions during the experiment.
Buildings 15 04285 g016
Table 1. Summary of occupancy detection studies.
ReferenceOccupancy TypeControlled DeviceType
Sun et al. [19], Tan et al. [20]PresenceNoIntrusive
Li et al. [21]LocationNo
Banihashemi et al. and Wang et al. [23,24]PresenceNoNon-intrusive
Salman et al. [25]PresenceNo
Abolhassani et al. [26]Occupant numbersNo
Zou et al. [27]Presence and locationLighting
Wang et al. [28]Occupant numbersHVAC systems
Gao et al. [29]Enter, stay, and leaveLighting
Table 2. The list of experimental devices.
DeviceNumberFunctionInstallation Location
Temperature and humidity sensor8Monitor environmental temperature and humidity dataWorkstation
Illuminance sensor8Monitor the desktop illuminanceDesk
Air conditioner companion3Monitor the power consumption and control the operation of the ACPlug
Desktop light8Adjust the desktop illuminanceWorkstation
Personal desktop fan8Deliver air to the workstationWorkstation
Wireless switch8Enable occupants to manually override device controlsDesk
Camera1Record ground-truth occupancy statesDoor
Wi-Fi probes10Collect Wi-Fi signal dataWall
Outdoor weather station1Collect the historical outdoor weather parametersRooftop
Table 3. The sample numbers of the CNN-GBC model training.
LabelsArrivalStayLeaveOutsideTotal
Number9143260120016897063
Table 4. TOU electricity rates in Hunan province.
Tariff TypeTimeElectricity Price (RMB/kWh)
Valley0:00–7:00
23:00–24:00
0.345
Flat7:00–11:00
14:00–18:00
0.801
Peak11:00–14:00
22:00–23:00
1.254
Critical peak18:00–22:001.496
Source: https://www.95598.cn/osgweb/ipSupportDetailItems (accessed on 21 March 2025).
Table 5. The subjective thermal comfort questionnaire.
No.QuestionsResponses
1What is your position number?1 to 8
2What is your current thermal sensation?Hot, warm, slightly warm, neutral, cool, cold
3What is your current thermal comfort state?Comfortable, slightly uncomfortable, uncomfortable, very uncomfortable, intolerable
4Please rate the current thermal environment.1 to 10
5What is your current thermal preference?Warmer, no change, cooler
Table 6. The signal loss incidents during real operation.
PositionNumber of Signal LossOccupied HoursSignal Loss Rate/
(Times per Hour)
133650.46.67
22505.7743.33
34047.620.84
4112125.6843.65
53530.631.14
64839.581.21
7181740.4544.92
82125.650.82
Total3668265.7813.80
Table 7. The performance of the RF model in signal loss detection.
PositionSignal Loss
Detected as Stay
Signal Loss
Detected as Outside
True Outside
Detected as Stay
True Outside
Detected as Outside
130729742288
222030345020
3394202514
4821298533786
53341073438
6455352979
71535277732872
8201633788
Total302064845926,685
Table 8. Summary of the automatic AC on/off control.
Turn on When First ArrivalTurn off When Last DepartureTurn off
(Occupied to Unoccupied)
Turn on (Unoccupied to Occupied)
Expected times101033
Actual times61033
Table 9. Summary of the automatic AC setpoint control.
Expected SetpointActual Setpoint
24 °C26 °C28 °C30 °C
24 °C4100
26 °C16302
28 °C01210
30 °C030144
Table 10. Summary of the desktop lights control.
PositionE < 400 lux (Occupied)400 lux < E < 600 lux (Occupied)E > 600 lux (Occupied)Unoccupied
Observed HoursHours of onObserved
Hours
Observed HoursHours of offObserved HoursHours of off
15.20.539.45.81.7189.6150.1
20.60.25.10.00.0234.2206.2
321.019.326.30.40.1192.4152.6
423.522.22.20.00.0214.3173.3
521.120.99.60.00.0209.4169.8
637.236.92.40.00.0200.4159.9
714.73.618.96.92.1199.6161.0
822.222.13.50.00.0214.4180.5
Total145.5125.6107.213.13.91654.21353.5
Notes: E represents the desktop illuminance.
Table 11. Summary of the desktop fans control.
PositionT < 24 °C (Occupied)24 °C < T < 28 °C (Occupied)T > 28 °C (Occupied)Unoccupied
Observed HoursHours of offObserved
Hours
Observed HoursHours of onObserved HoursHours of off
10.00.042.08.46.9189.6160.4
20.00.03.82.02.0234.2225.4
30.00.039.68.06.5192.4161.8
40.00.025.70.00.0214.3188.8
50.00.030.20.50.0209.4186.6
60.00.038.31.31.3200.4175.7
70.00.028.811.69.4199.6174.7
80.00.025.70.00.0214.4187.9
Total0.00.0234.031.826.11654.21461.5
Notes: T represents the workstation temperature.
Table 12. Comparison of energy consumption, electricity cost, and average thermal comfort rates among different scenarios.
ScenarioEnergy Consumption kWh/(°C·Day)Electricity Cost RMB/(°C·Day)Average Thermal Comfort Rates
Baseline39.9541.598.66
OCC23.9824.288.86
Difference39.9%41.6%2.3%
Disclaimer/Publisher’s Note: The statements, opinions and data contained in all publications are solely those of the individual author(s) and contributor(s) and not of MDPI and/or the editor(s). MDPI and/or the editor(s) disclaim responsibility for any injury to people or property resulting from any ideas, methods, instructions or products referred to in the content.