Figure 3.
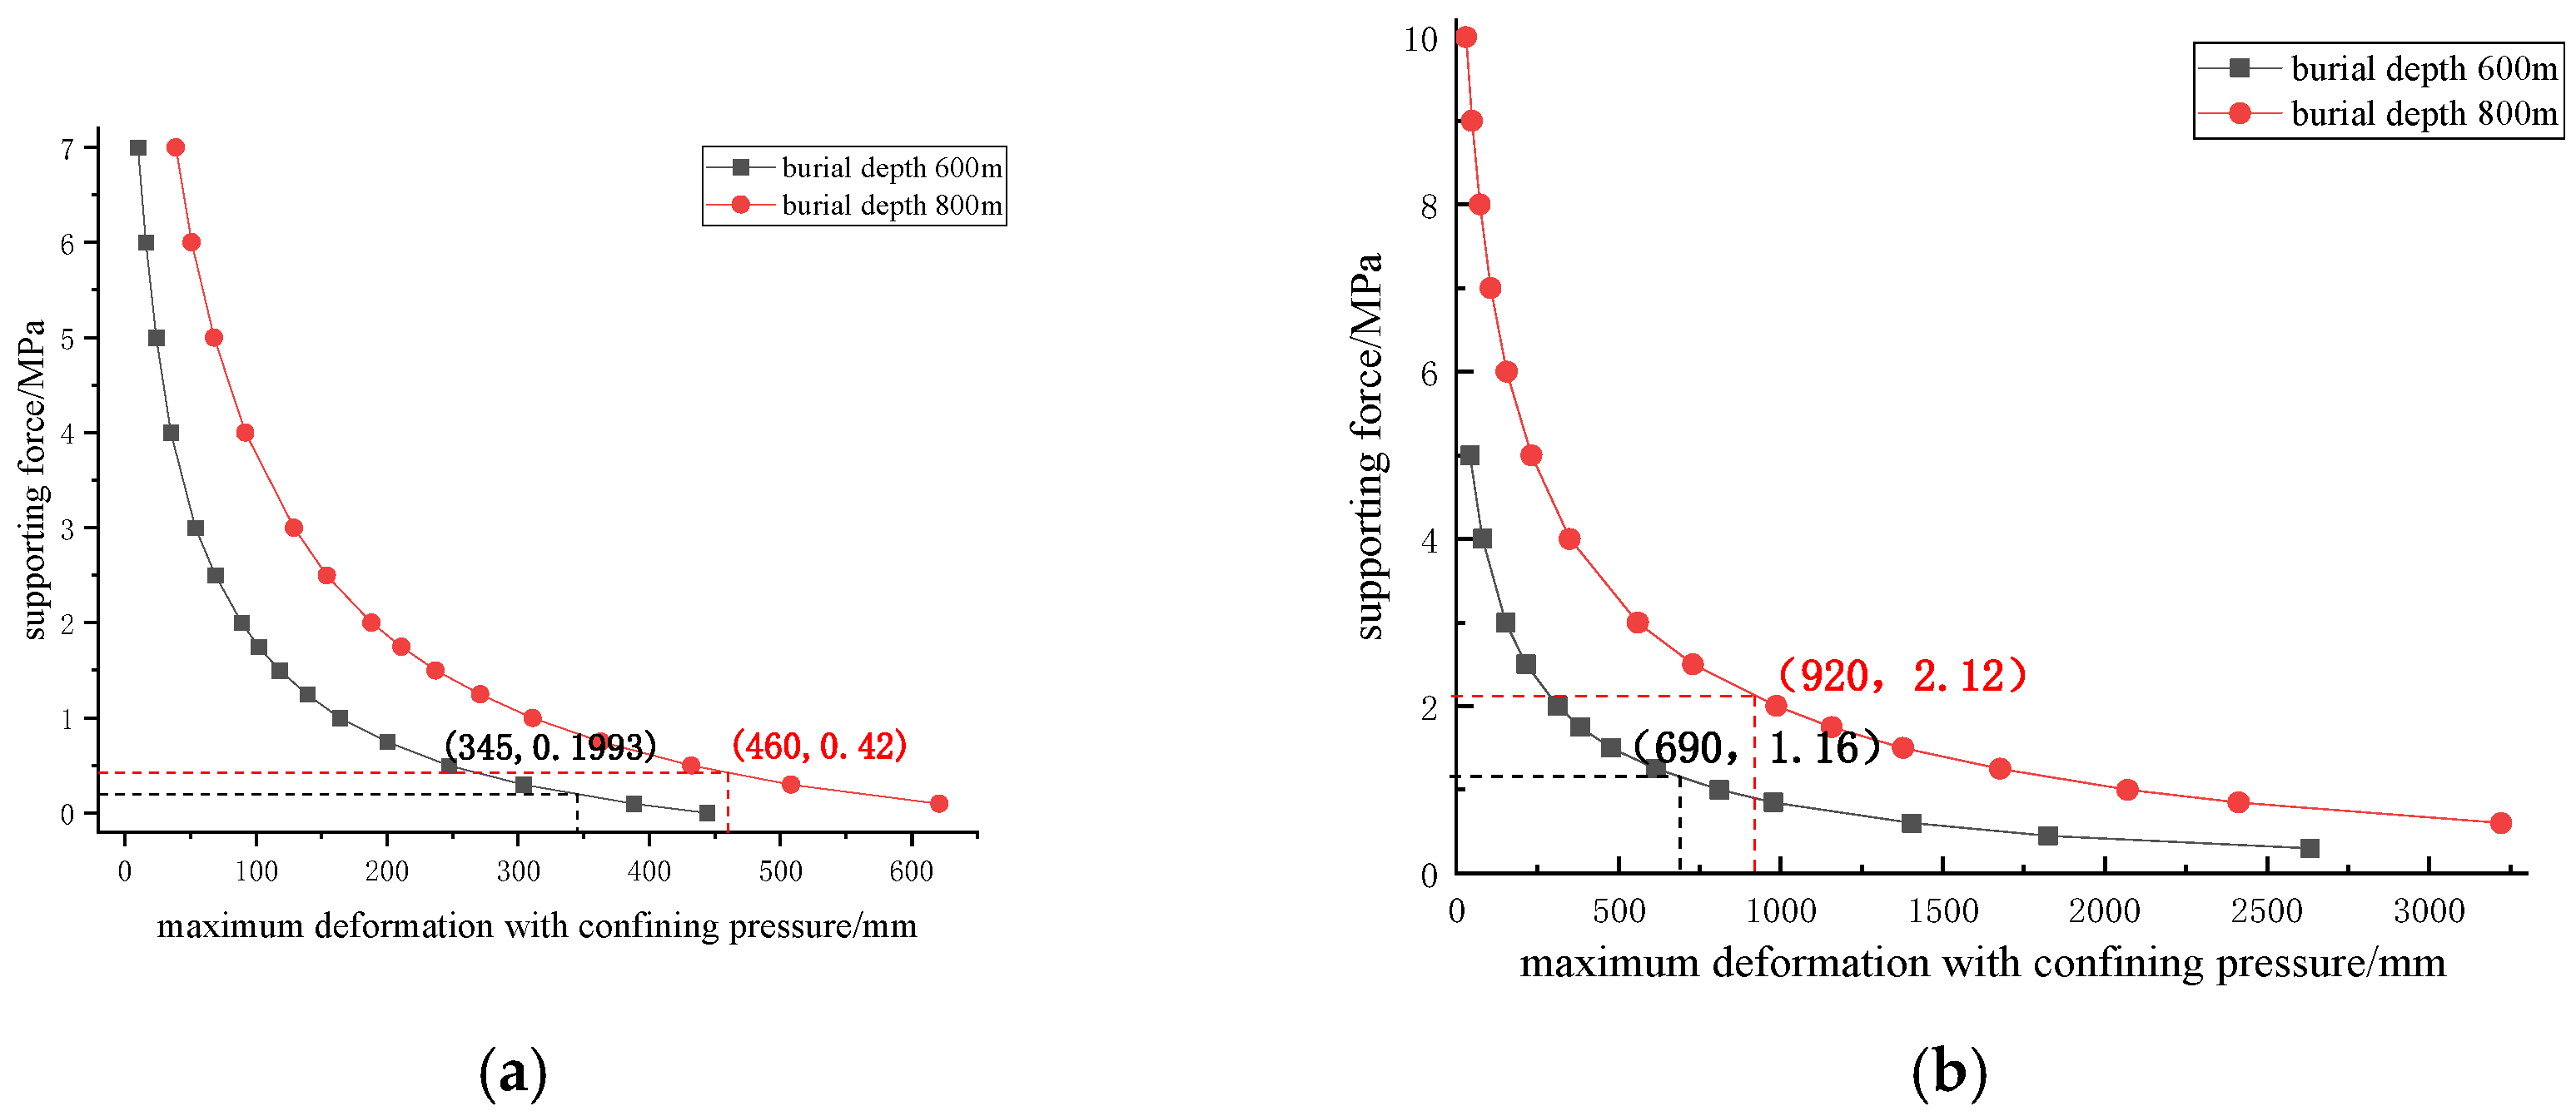
Relationship curve between support force and maximum deformation of surrounding rock for grade IV rock and grade V rock: (a) grade IV rock; (b) grade V rock.
Figure 3.
Relationship curve between support force and maximum deformation of surrounding rock for grade IV rock and grade V rock: (a) grade IV rock; (b) grade V rock.
Figure 4.
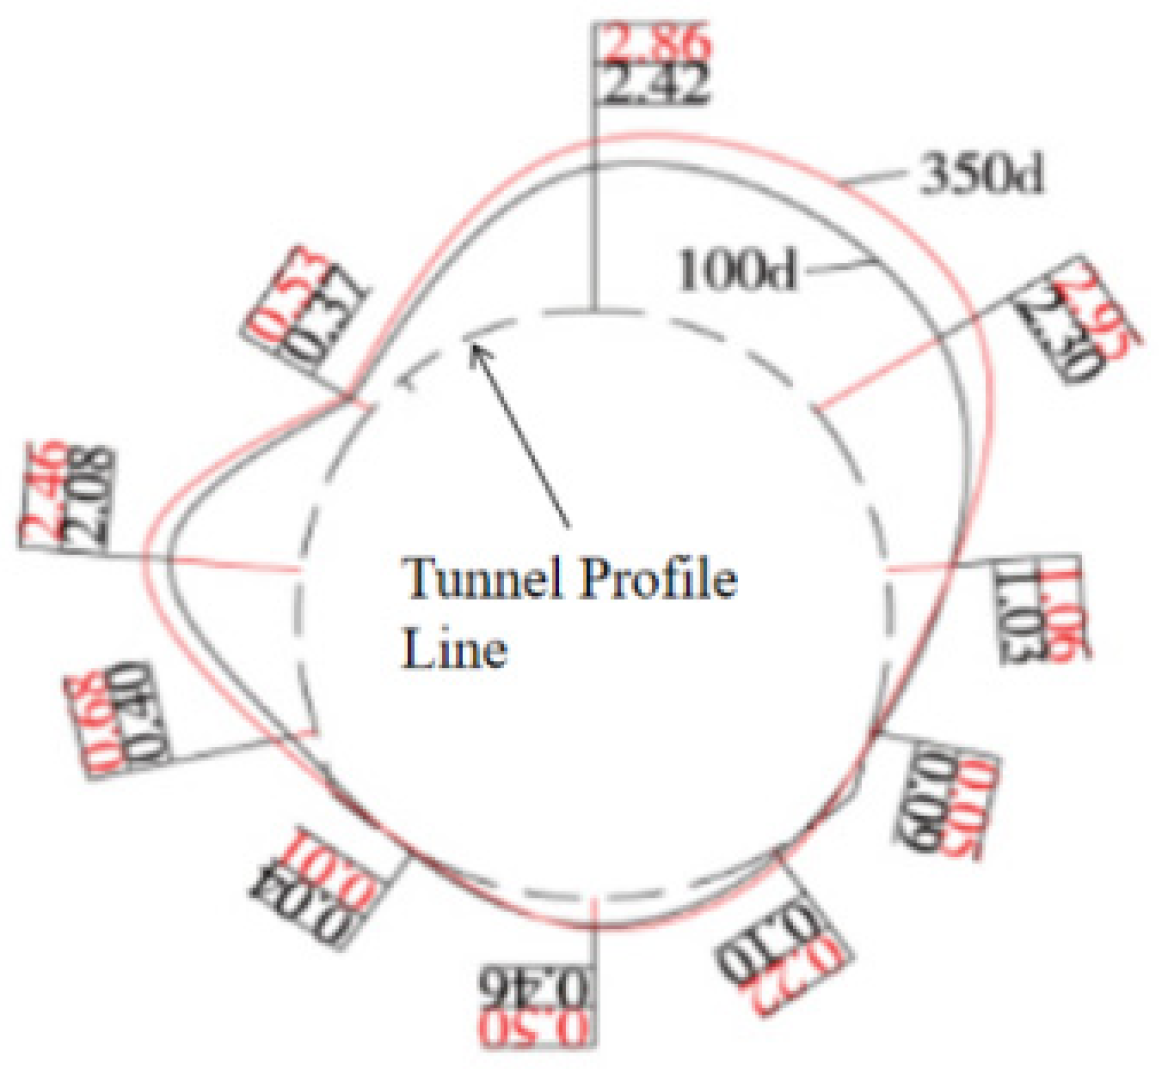
Measured surrounding rock pressure of Mao County Tunnel, Chengdu–Lanzhou Railway (Unit: MPa).
Figure 4.
Measured surrounding rock pressure of Mao County Tunnel, Chengdu–Lanzhou Railway (Unit: MPa).
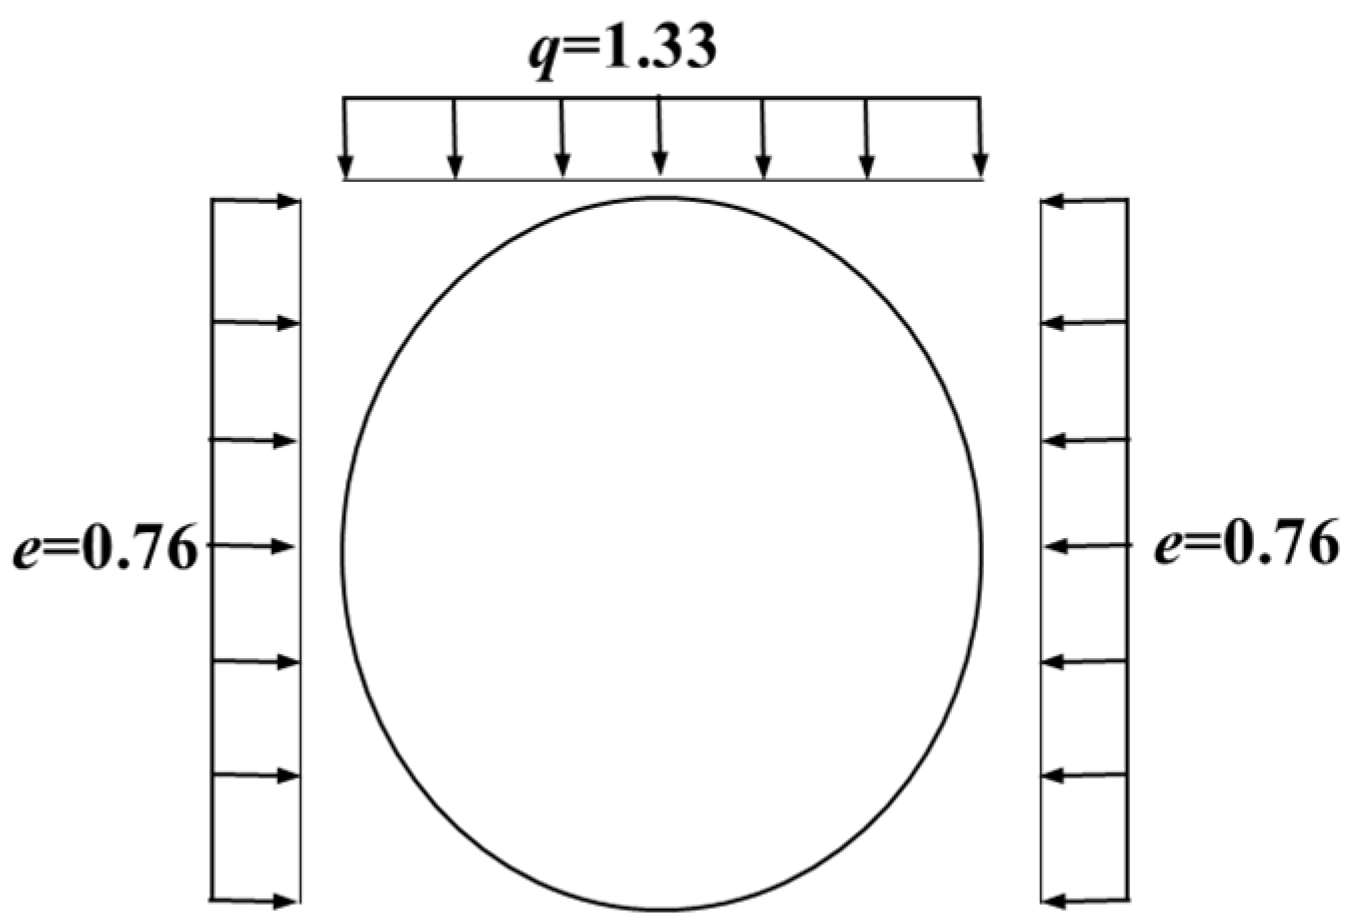
Figure 5.
Equivalent processed surrounding rock pressure of Mao County Tunnel, Chengdu–Lanzhou Railway (Unit: MPa).
Figure 5.
Equivalent processed surrounding rock pressure of Mao County Tunnel, Chengdu–Lanzhou Railway (Unit: MPa).
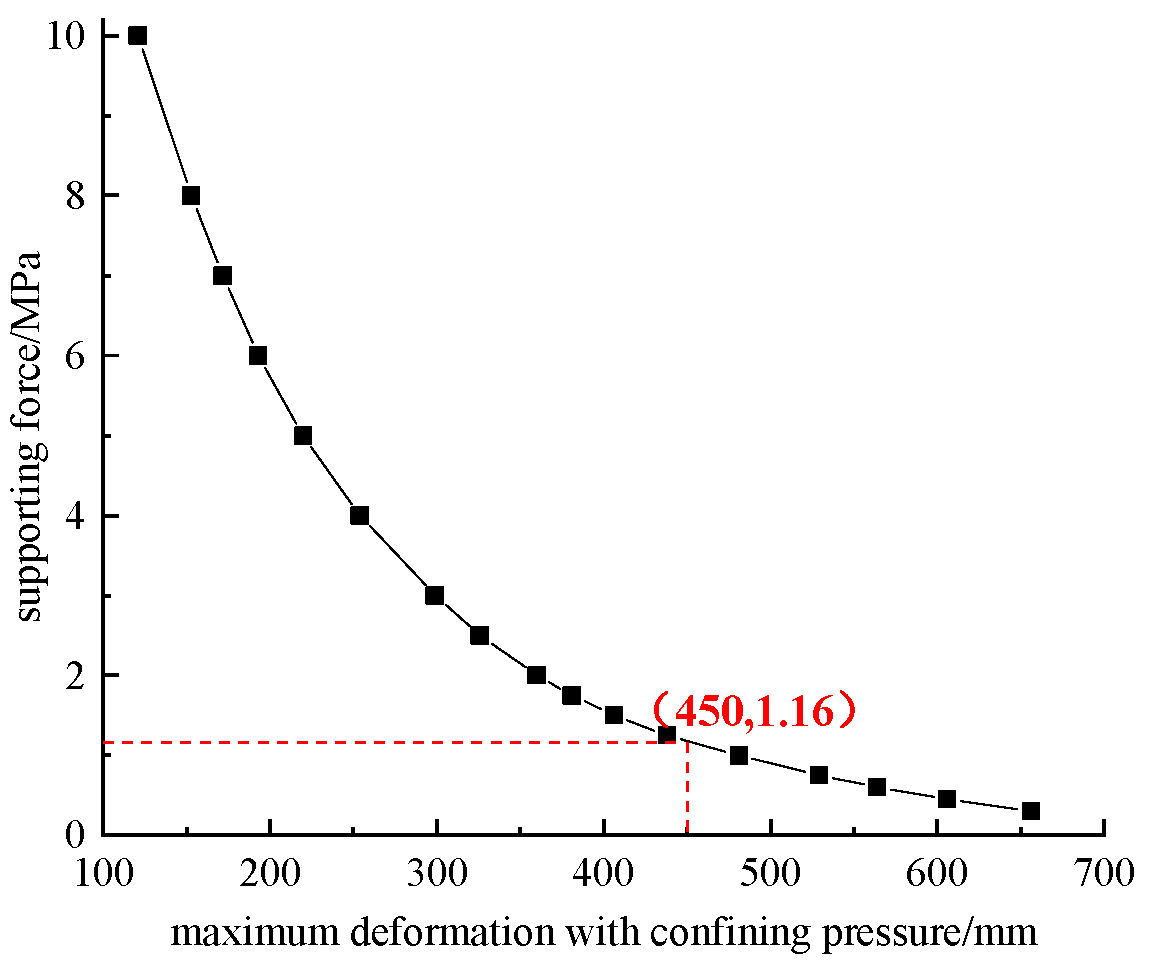
Figure 6.
Relationship curve between support force and maximum deformation of surrounding rock for Mao County Tunnel, Chengdu–Lanzhou Railway.
Figure 6.
Relationship curve between support force and maximum deformation of surrounding rock for Mao County Tunnel, Chengdu–Lanzhou Railway.
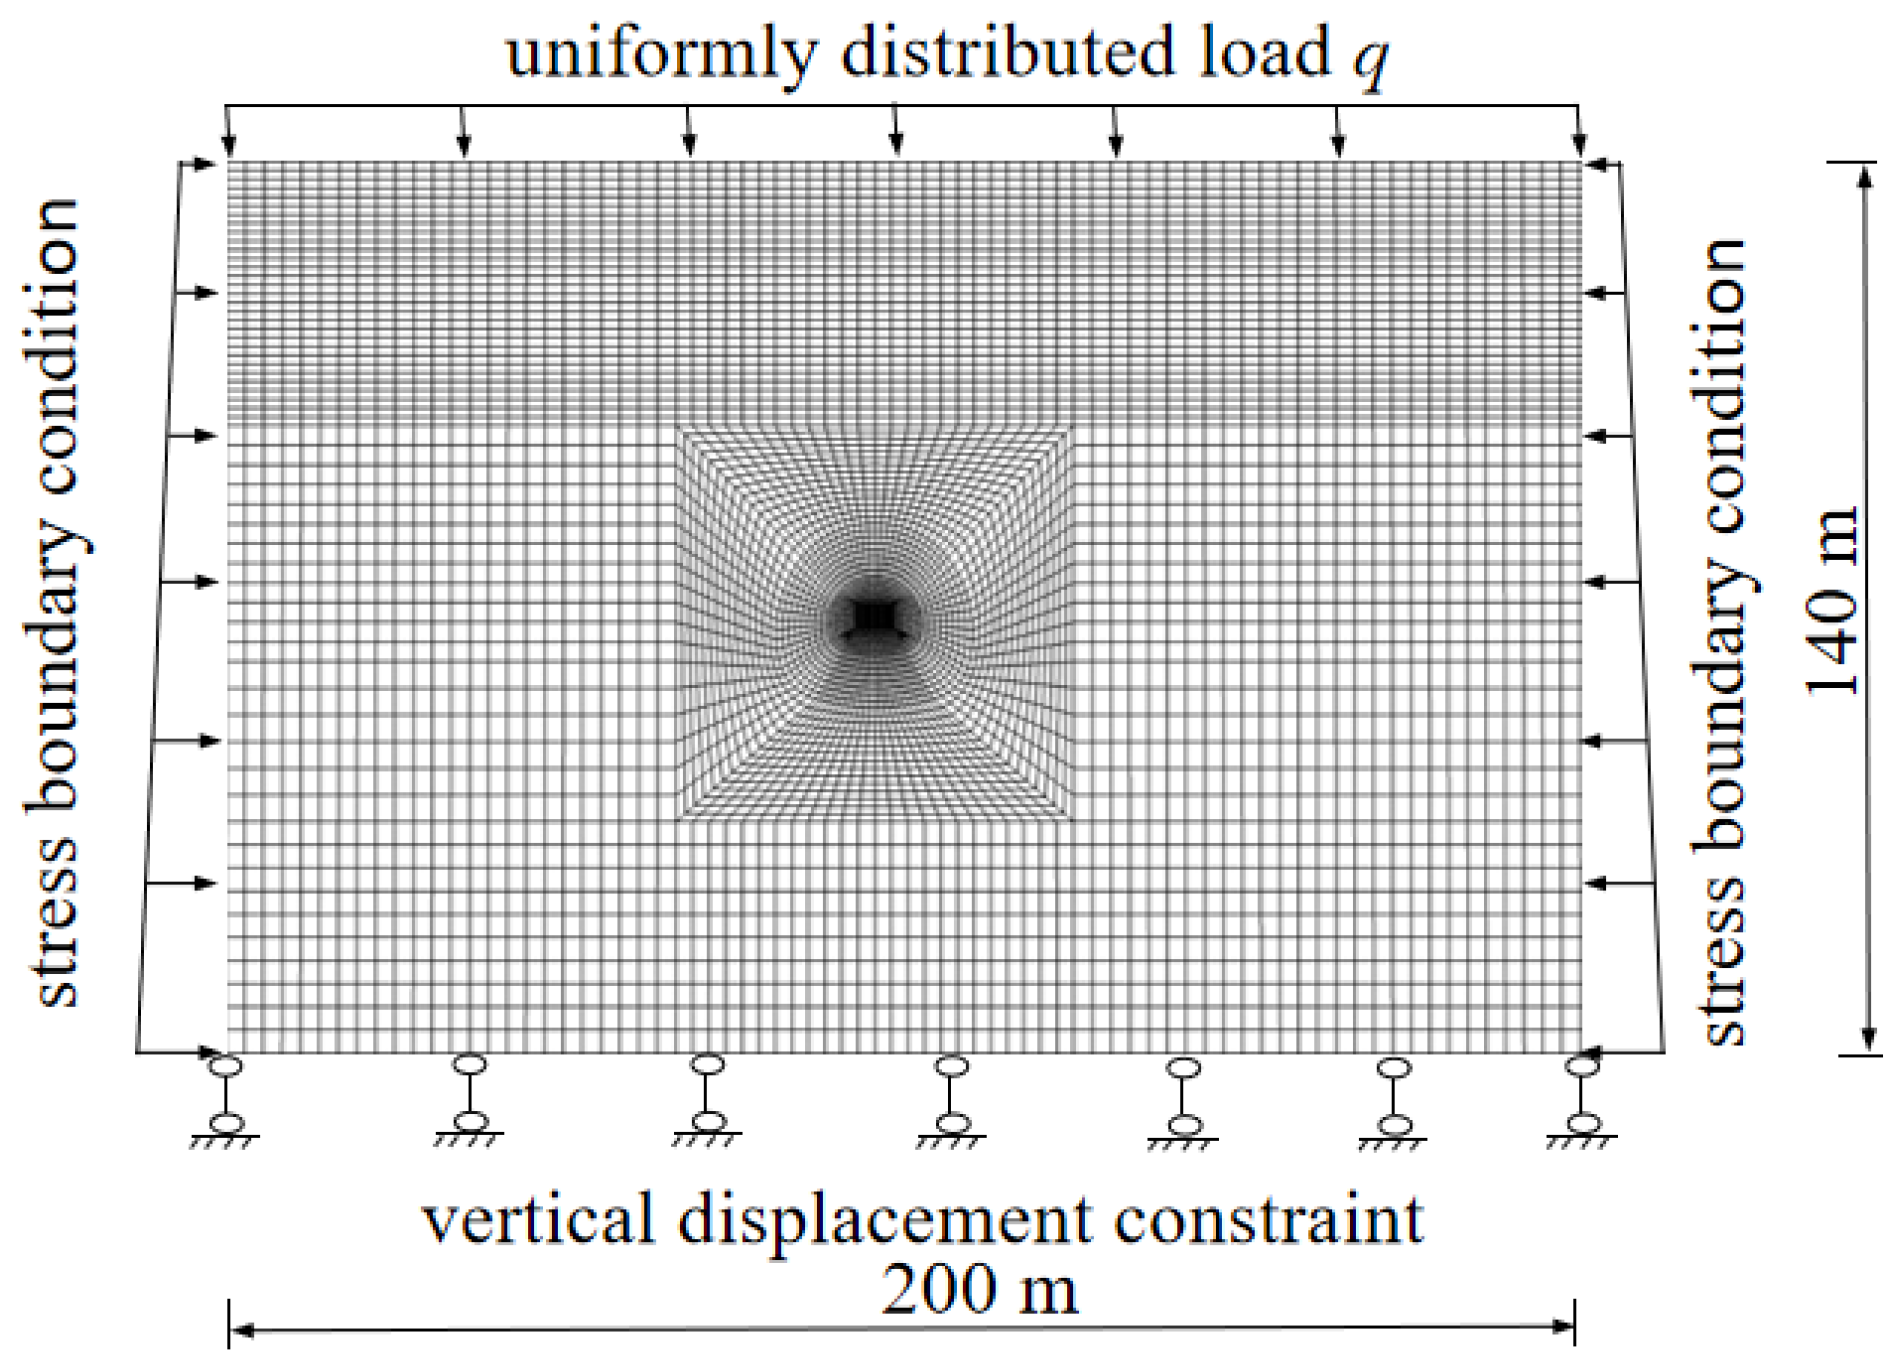
Figure 7.
Numerical Model of the Tunnel.
Figure 7.
Numerical Model of the Tunnel.
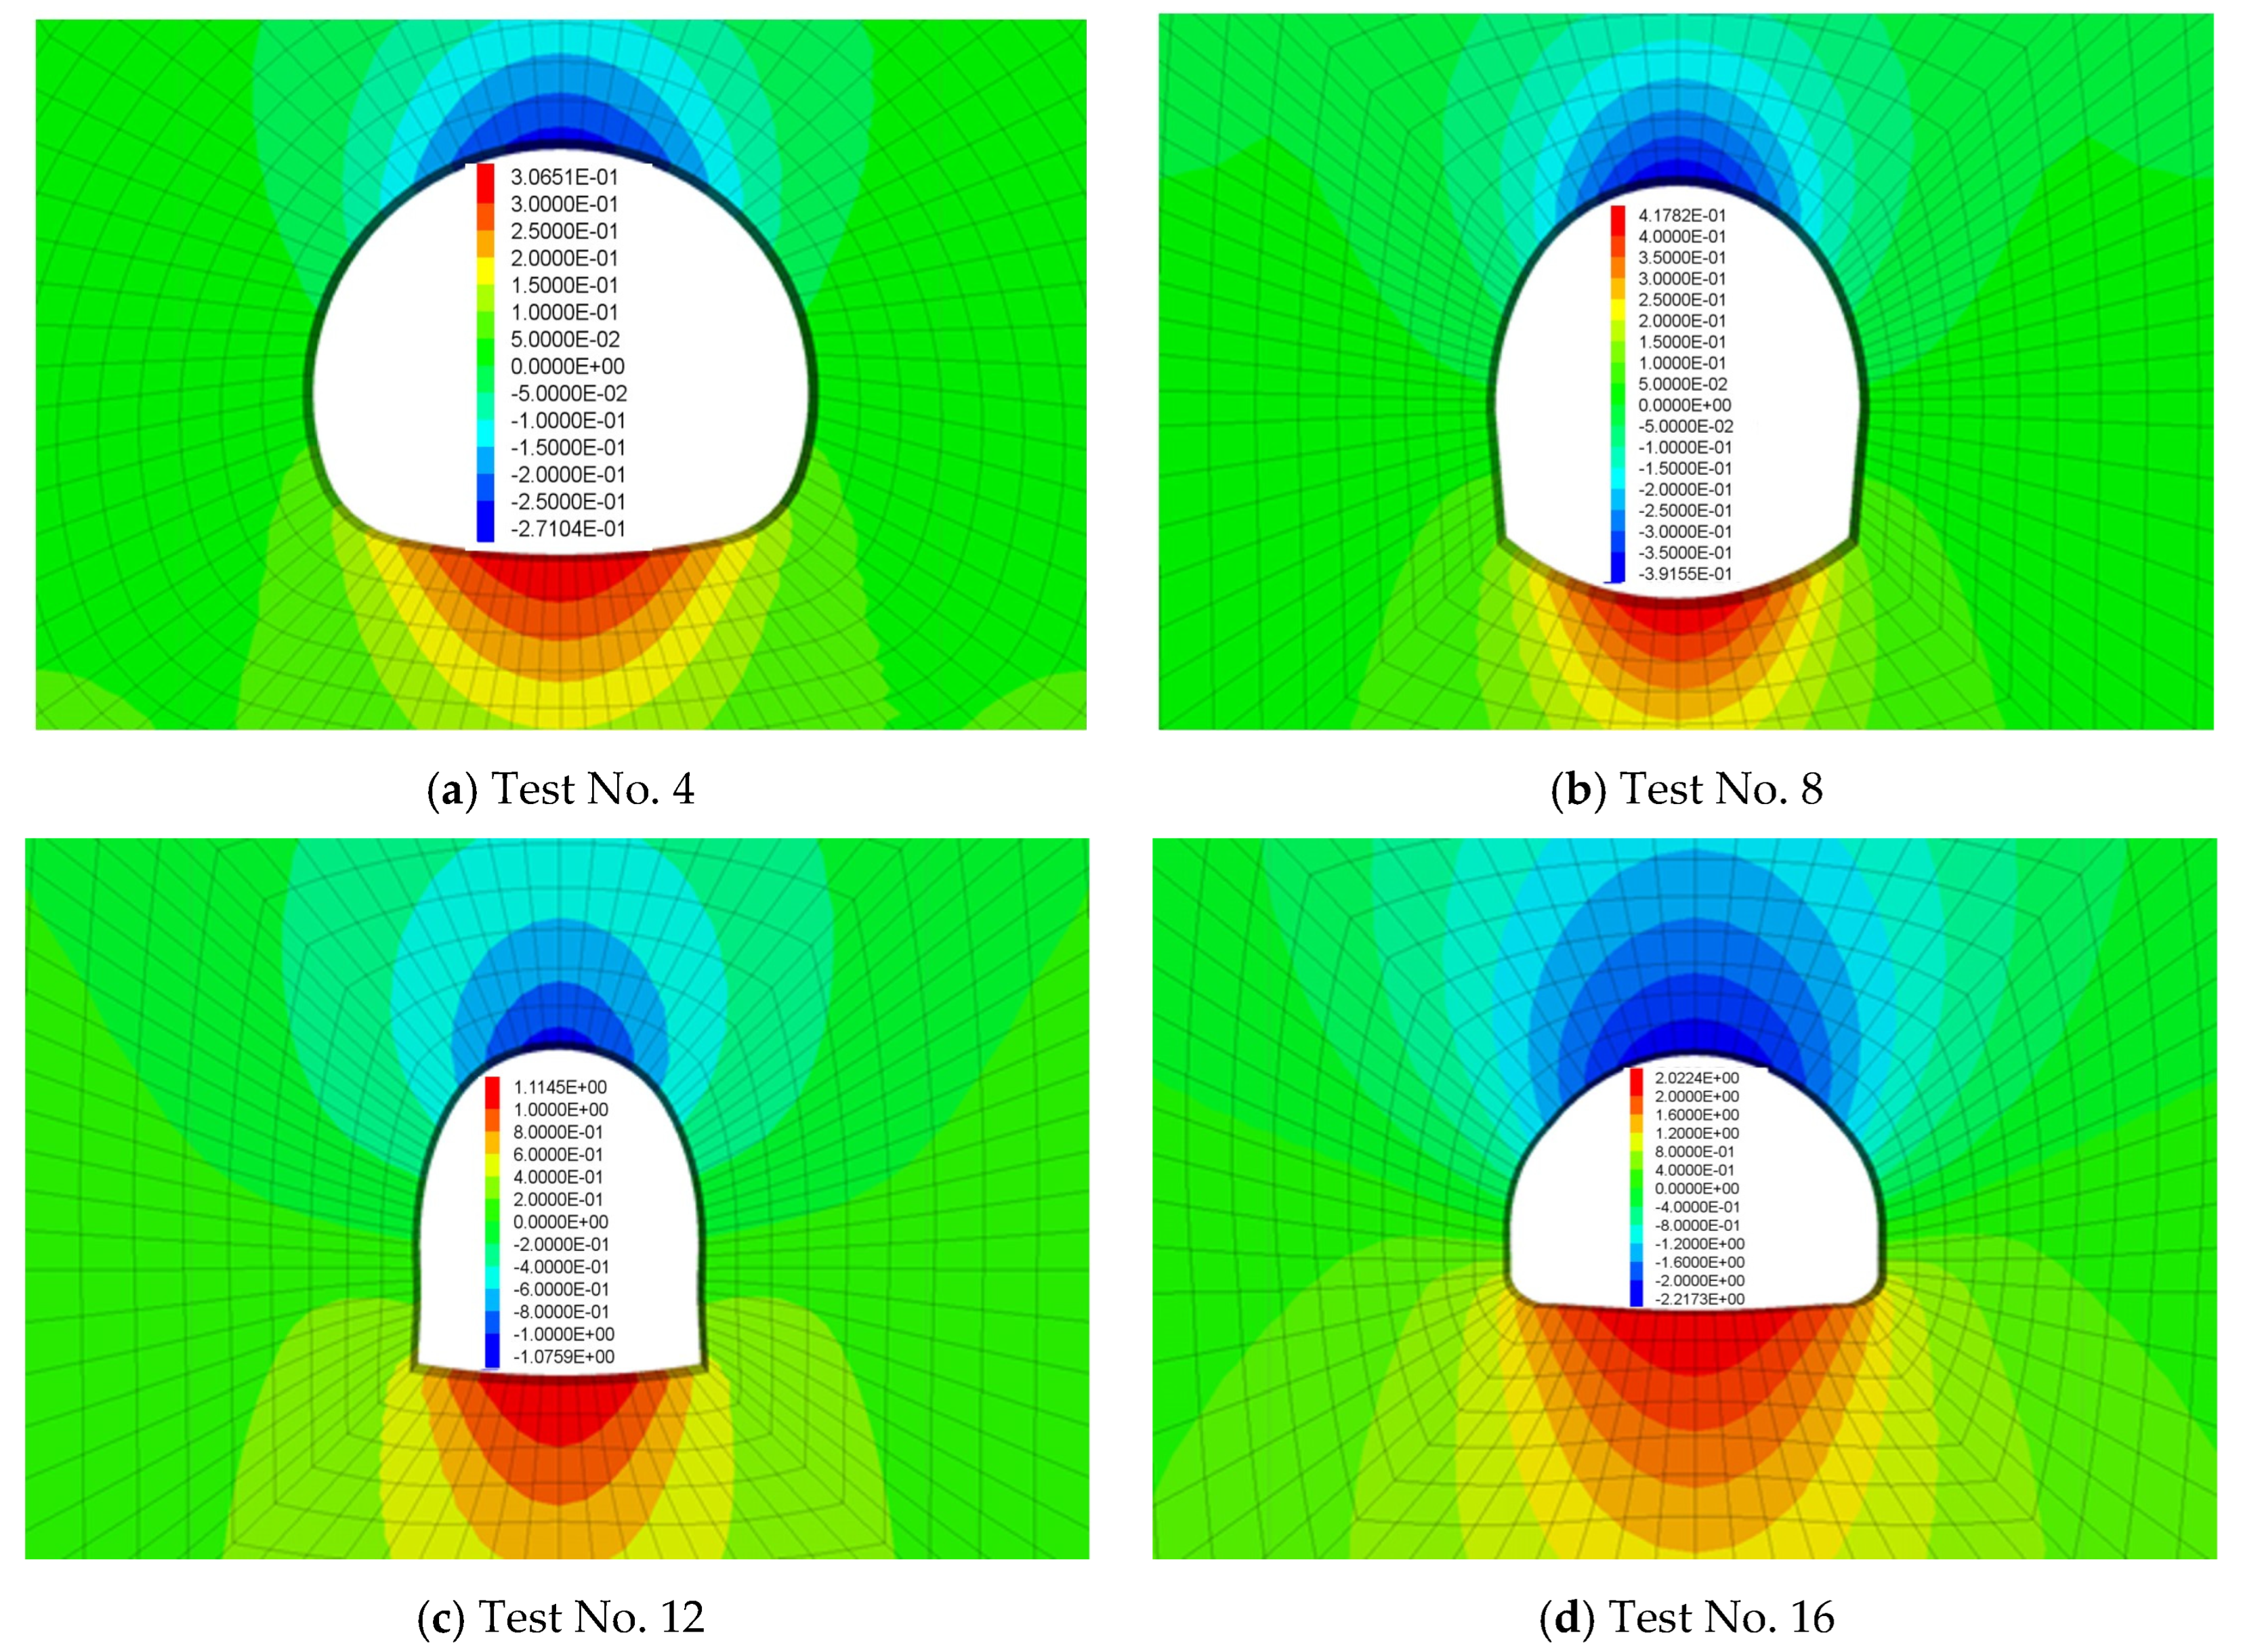
Figure 8.
Maximum deformation of surrounding rock at a support pressure of 1 MPa.
Figure 8.
Maximum deformation of surrounding rock at a support pressure of 1 MPa.
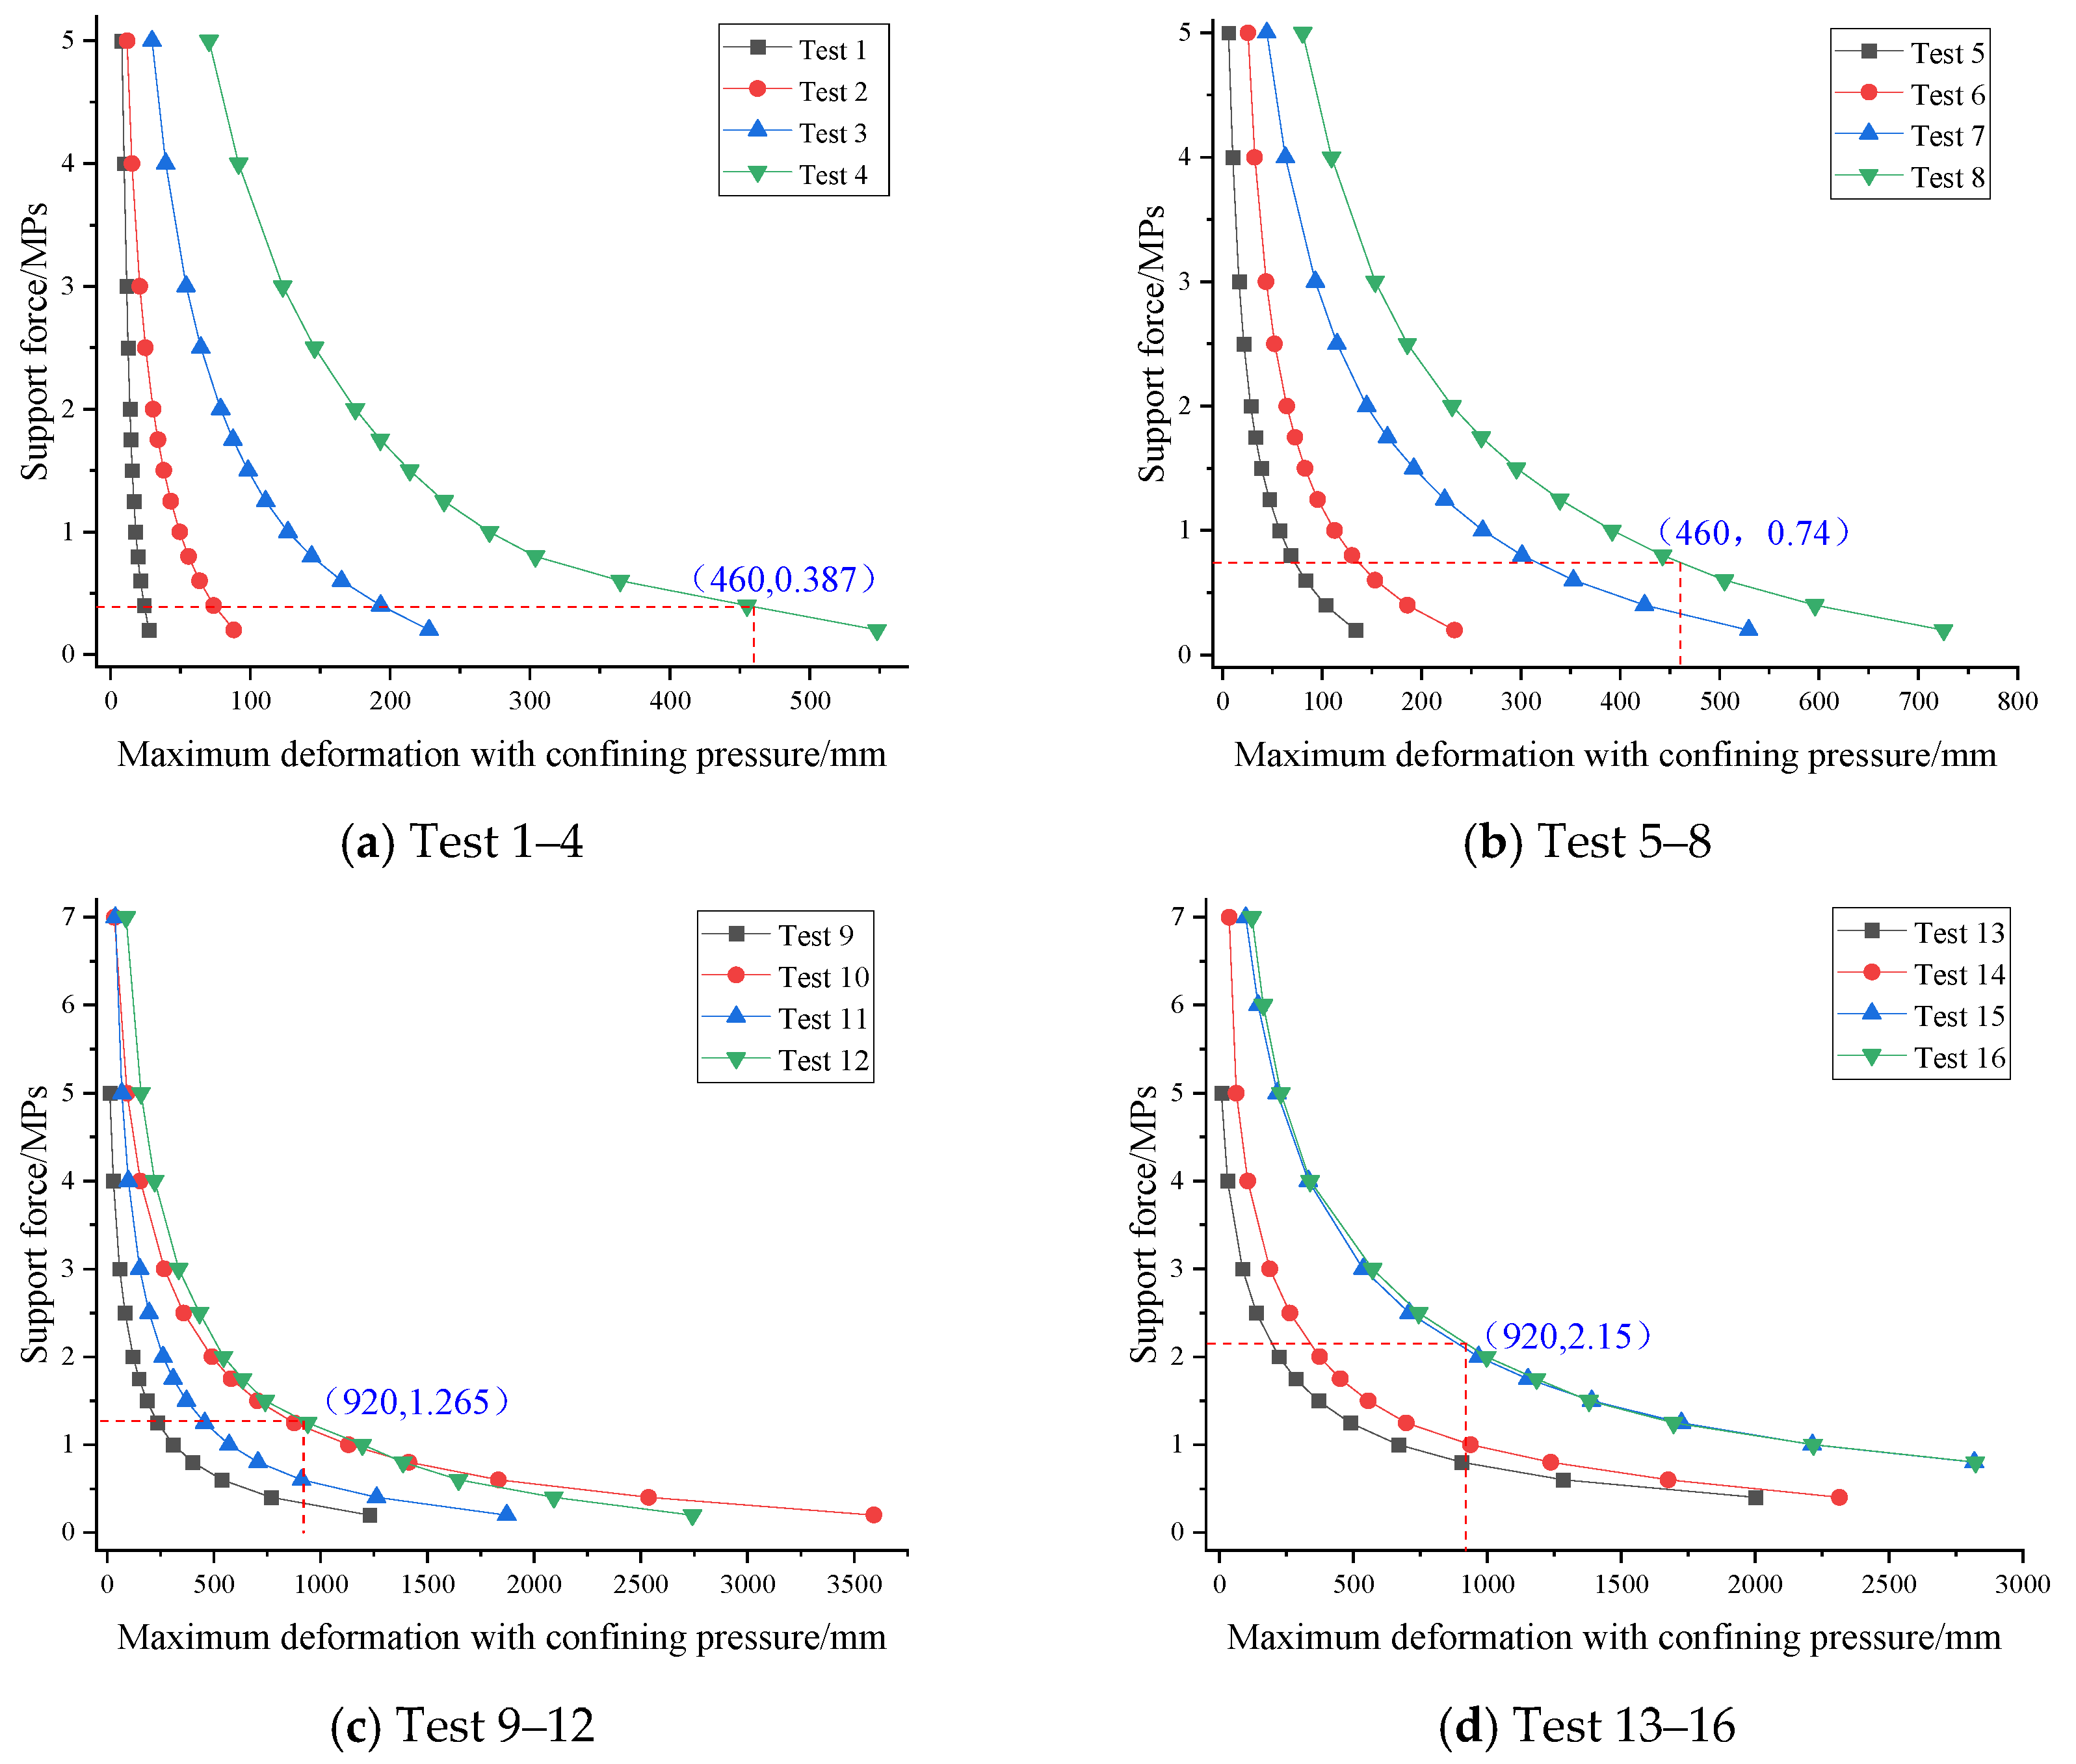
Figure 9.
Relationship Curves between support pressure and maximum surrounding rock deformation for all test schemes: (a) Test 1–4; (b) Test 5–8; (c) Test 9–12; (d) Test 13–16.
Figure 9.
Relationship Curves between support pressure and maximum surrounding rock deformation for all test schemes: (a) Test 1–4; (b) Test 5–8; (c) Test 9–12; (d) Test 13–16.
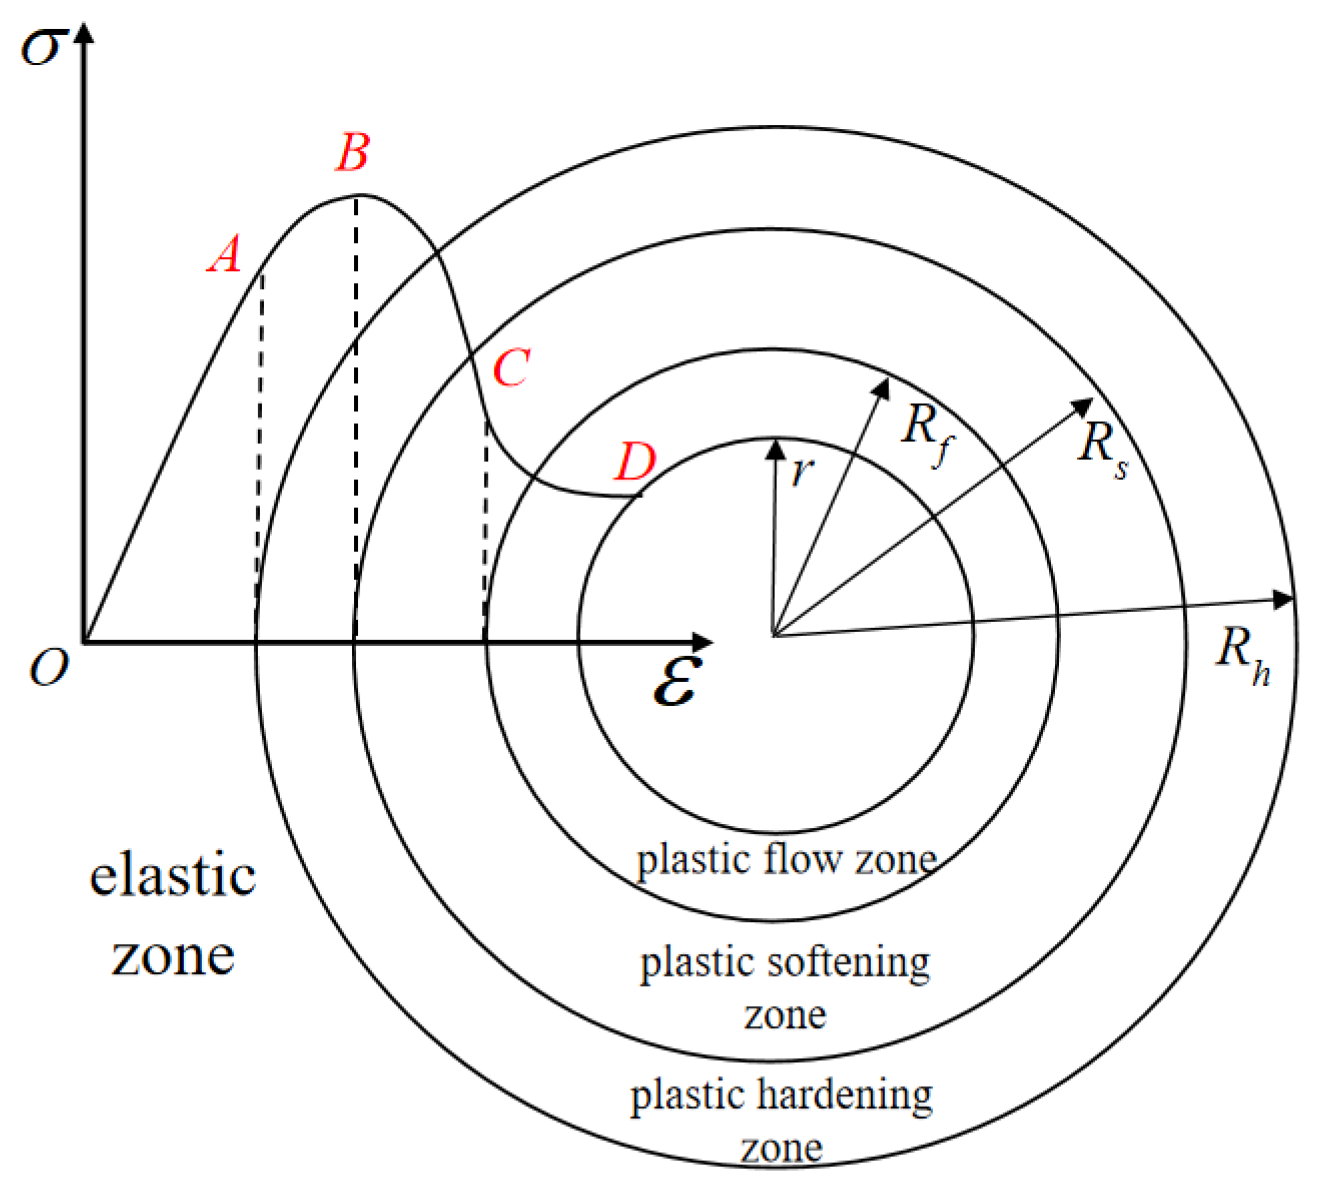
Figure 10.
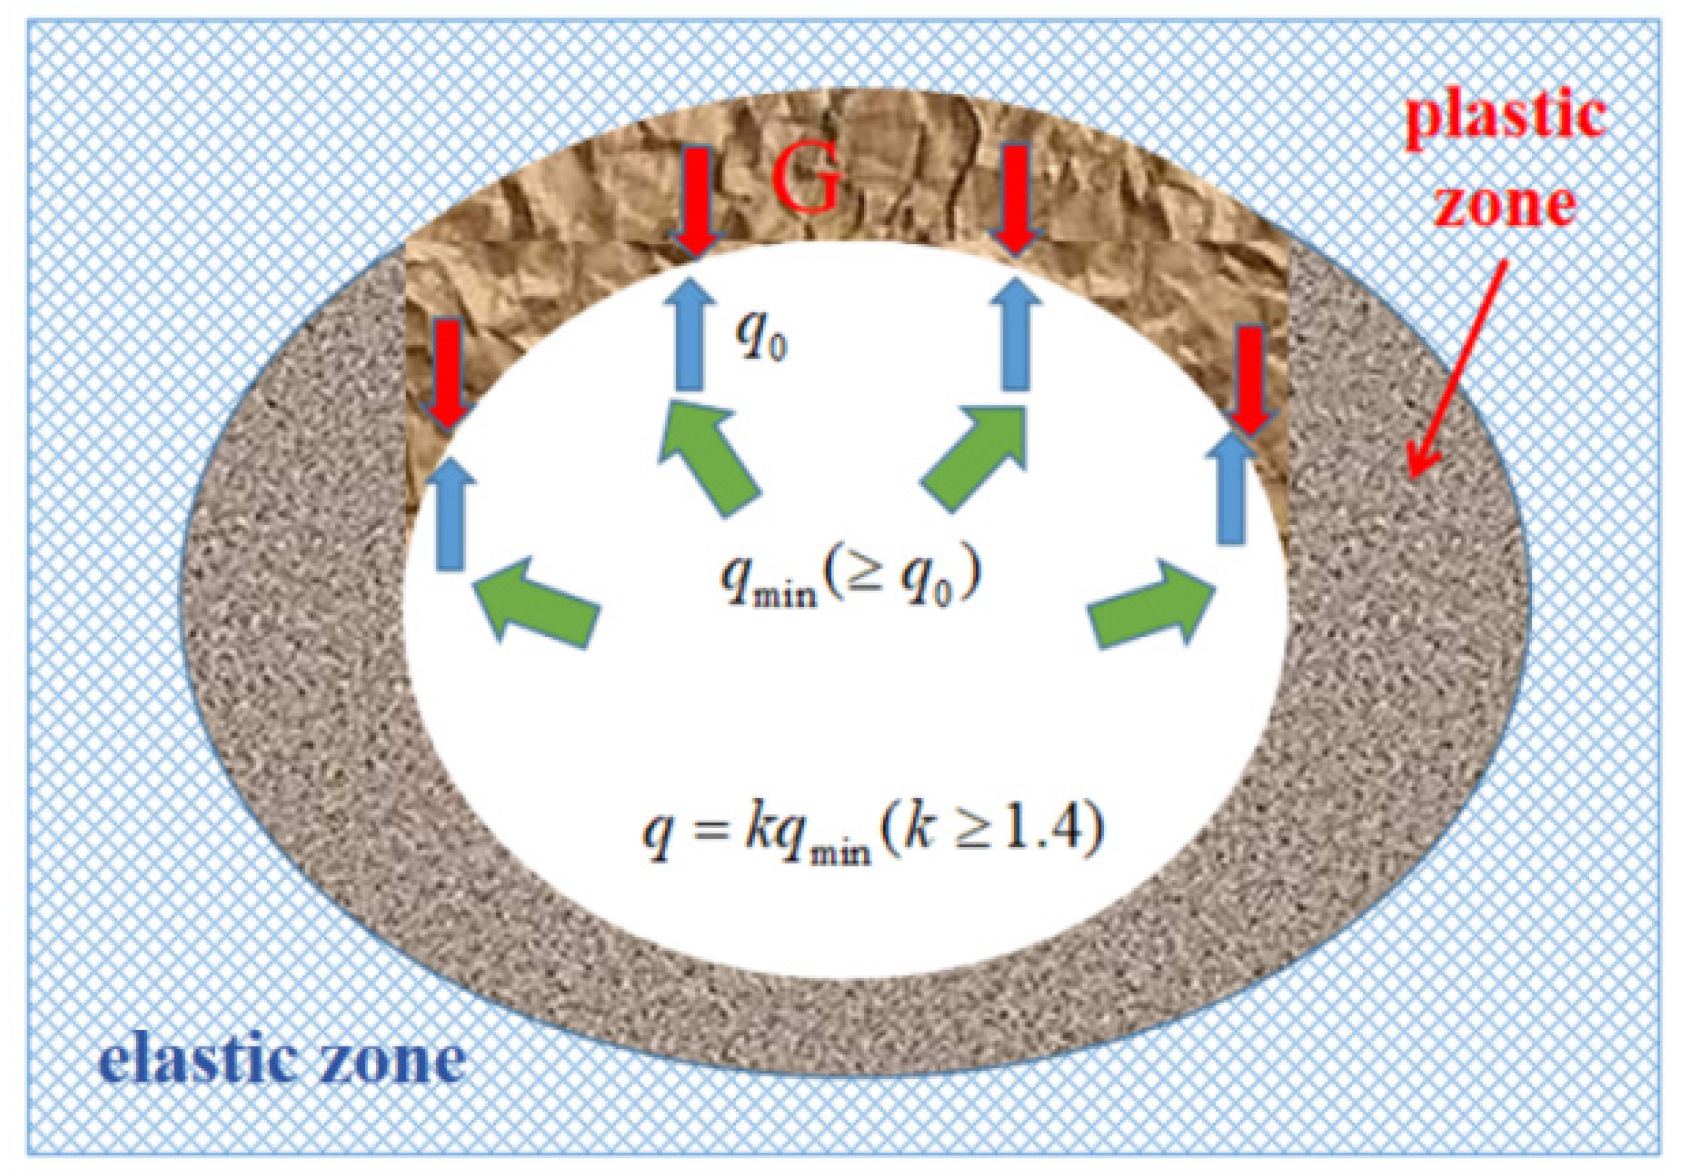
Rock mass zoning after excavation of soft rock tunnel.
Figure 10.
Rock mass zoning after excavation of soft rock tunnel.
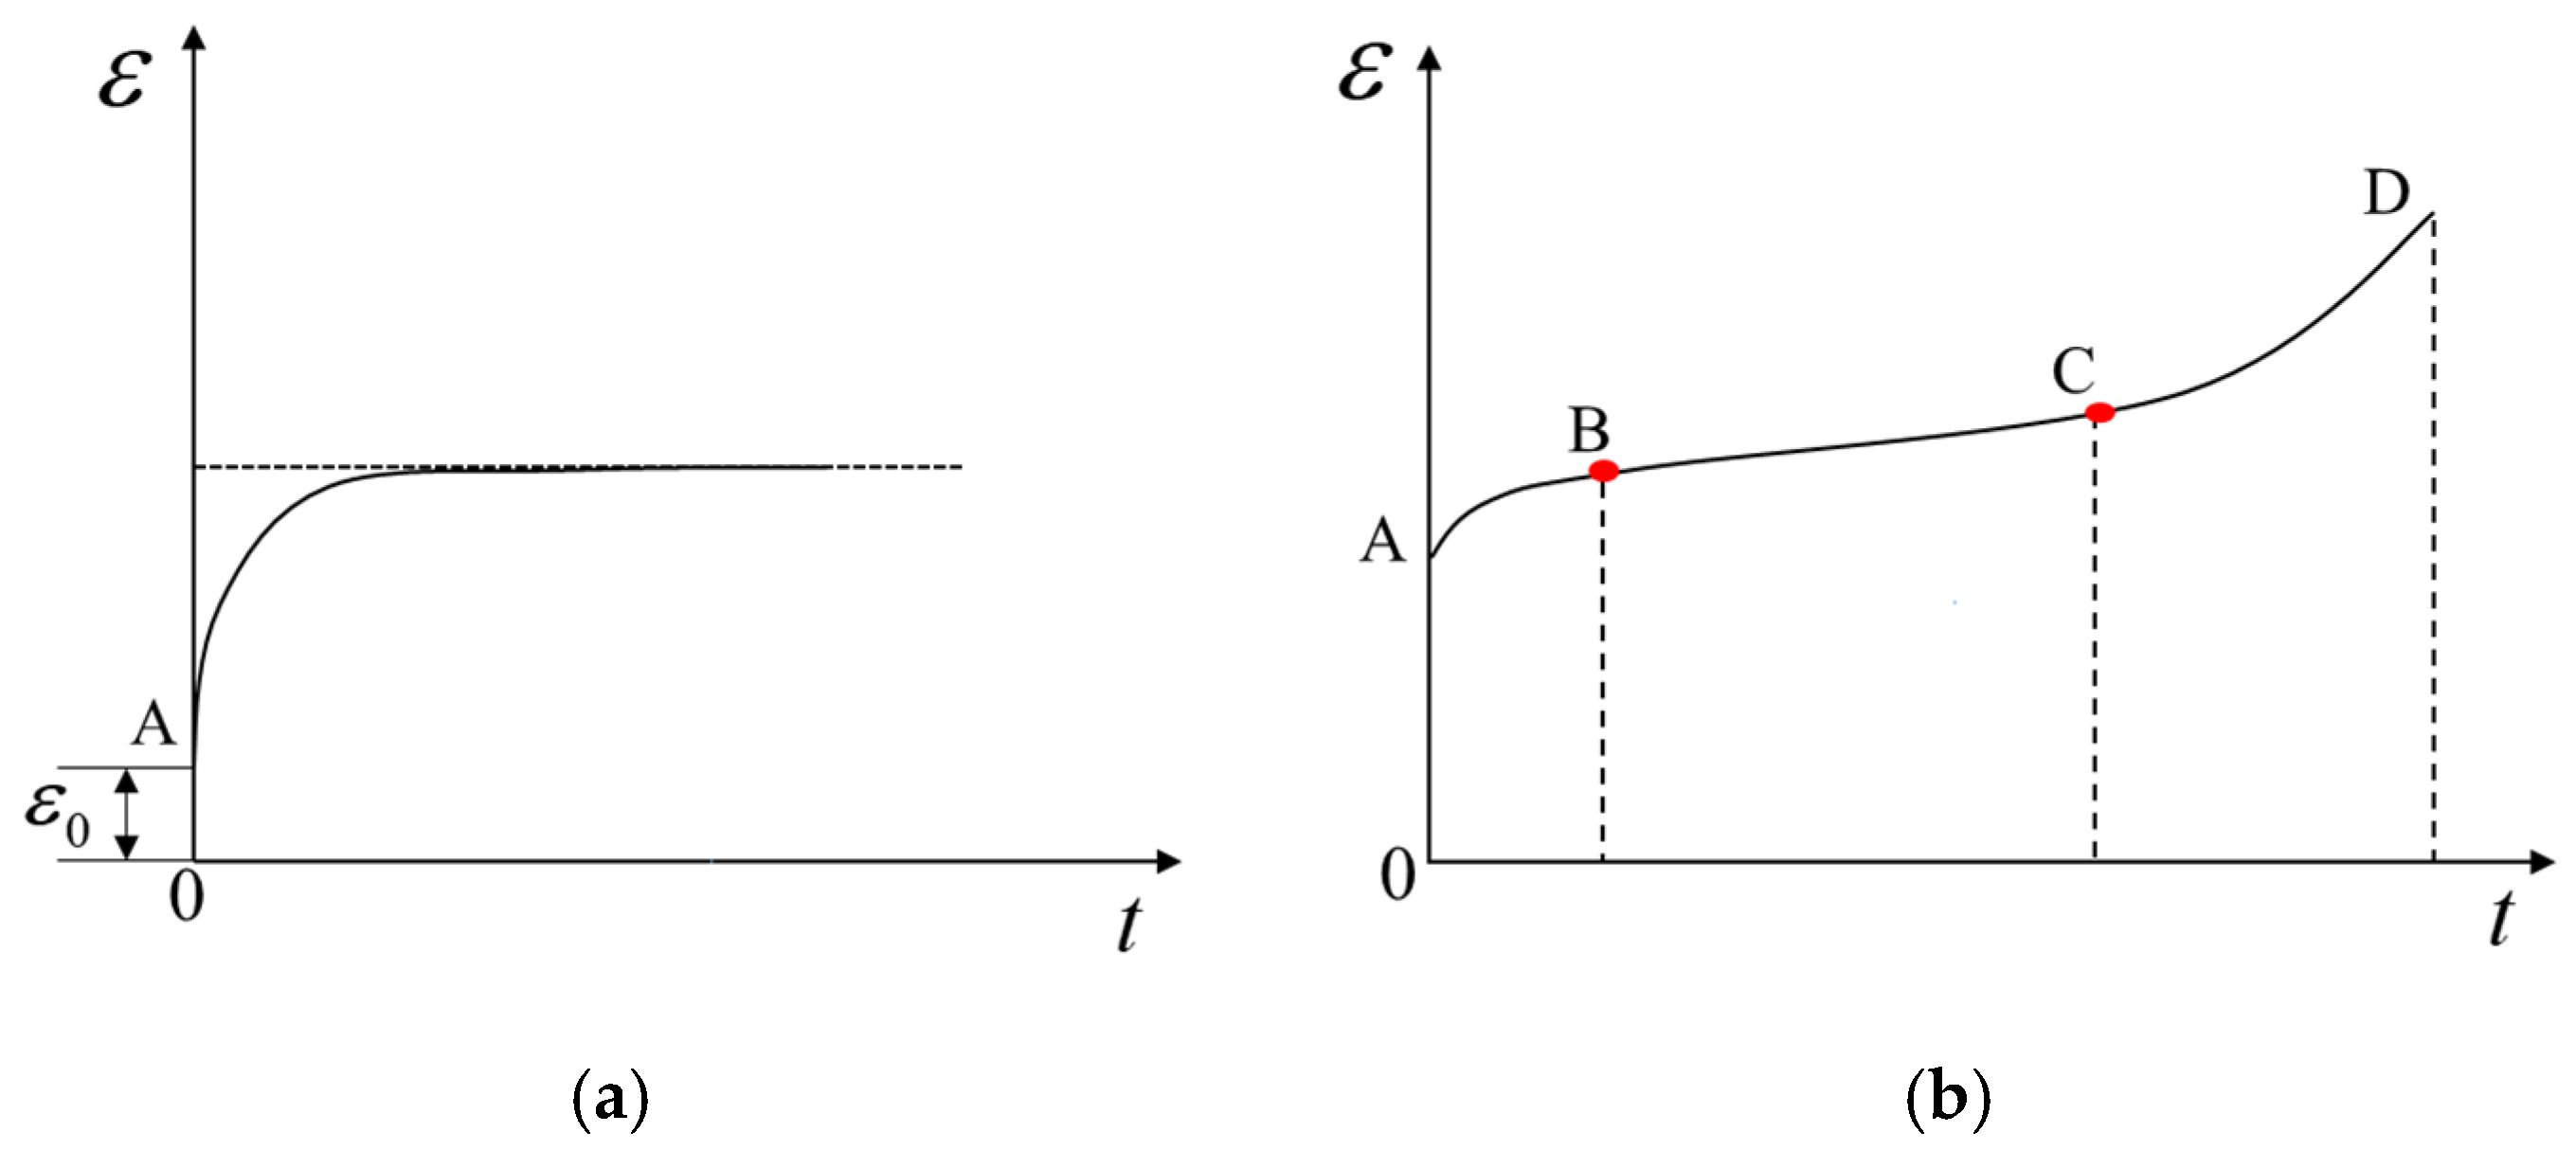
Figure 11.
Creep curves of rock: (a) stable creep; (b) unstable creep.
Figure 11.
Creep curves of rock: (a) stable creep; (b) unstable creep.
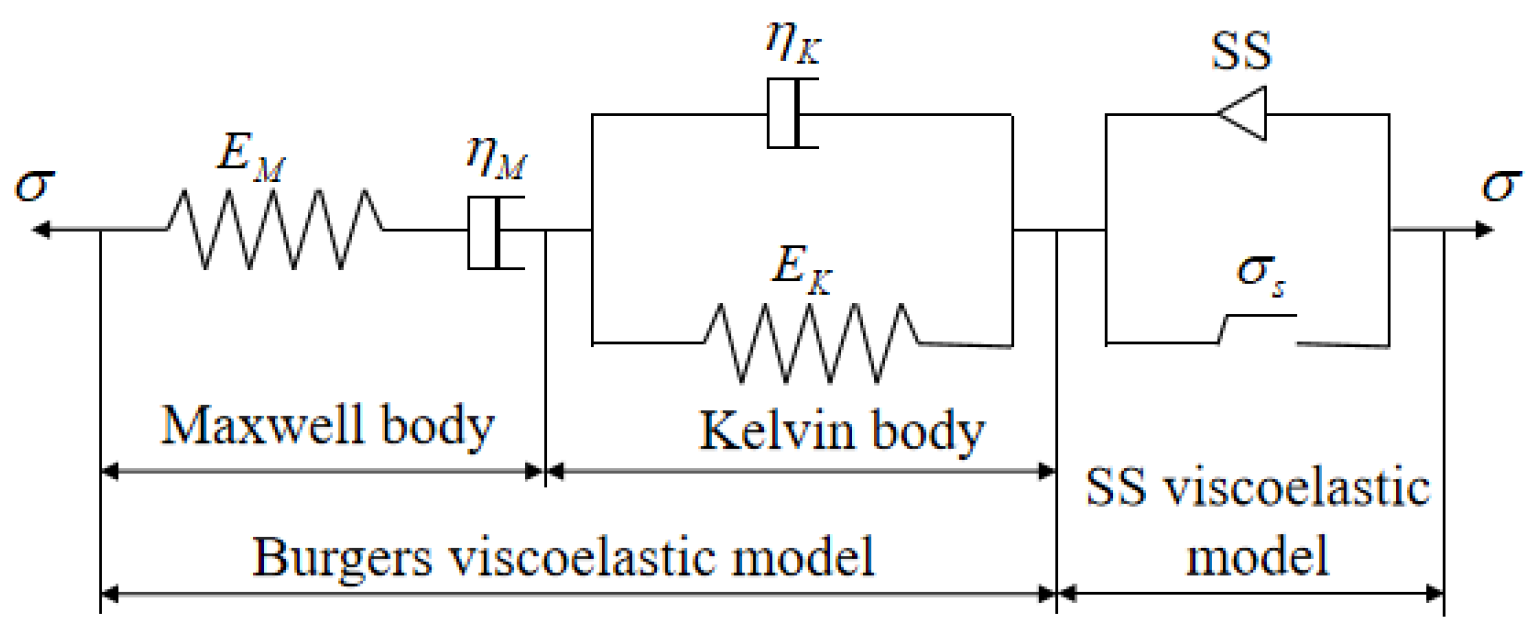
Figure 12.
Viscoelastic–plastic strain softening creep mechanical model for soft rock.
Figure 12.
Viscoelastic–plastic strain softening creep mechanical model for soft rock.
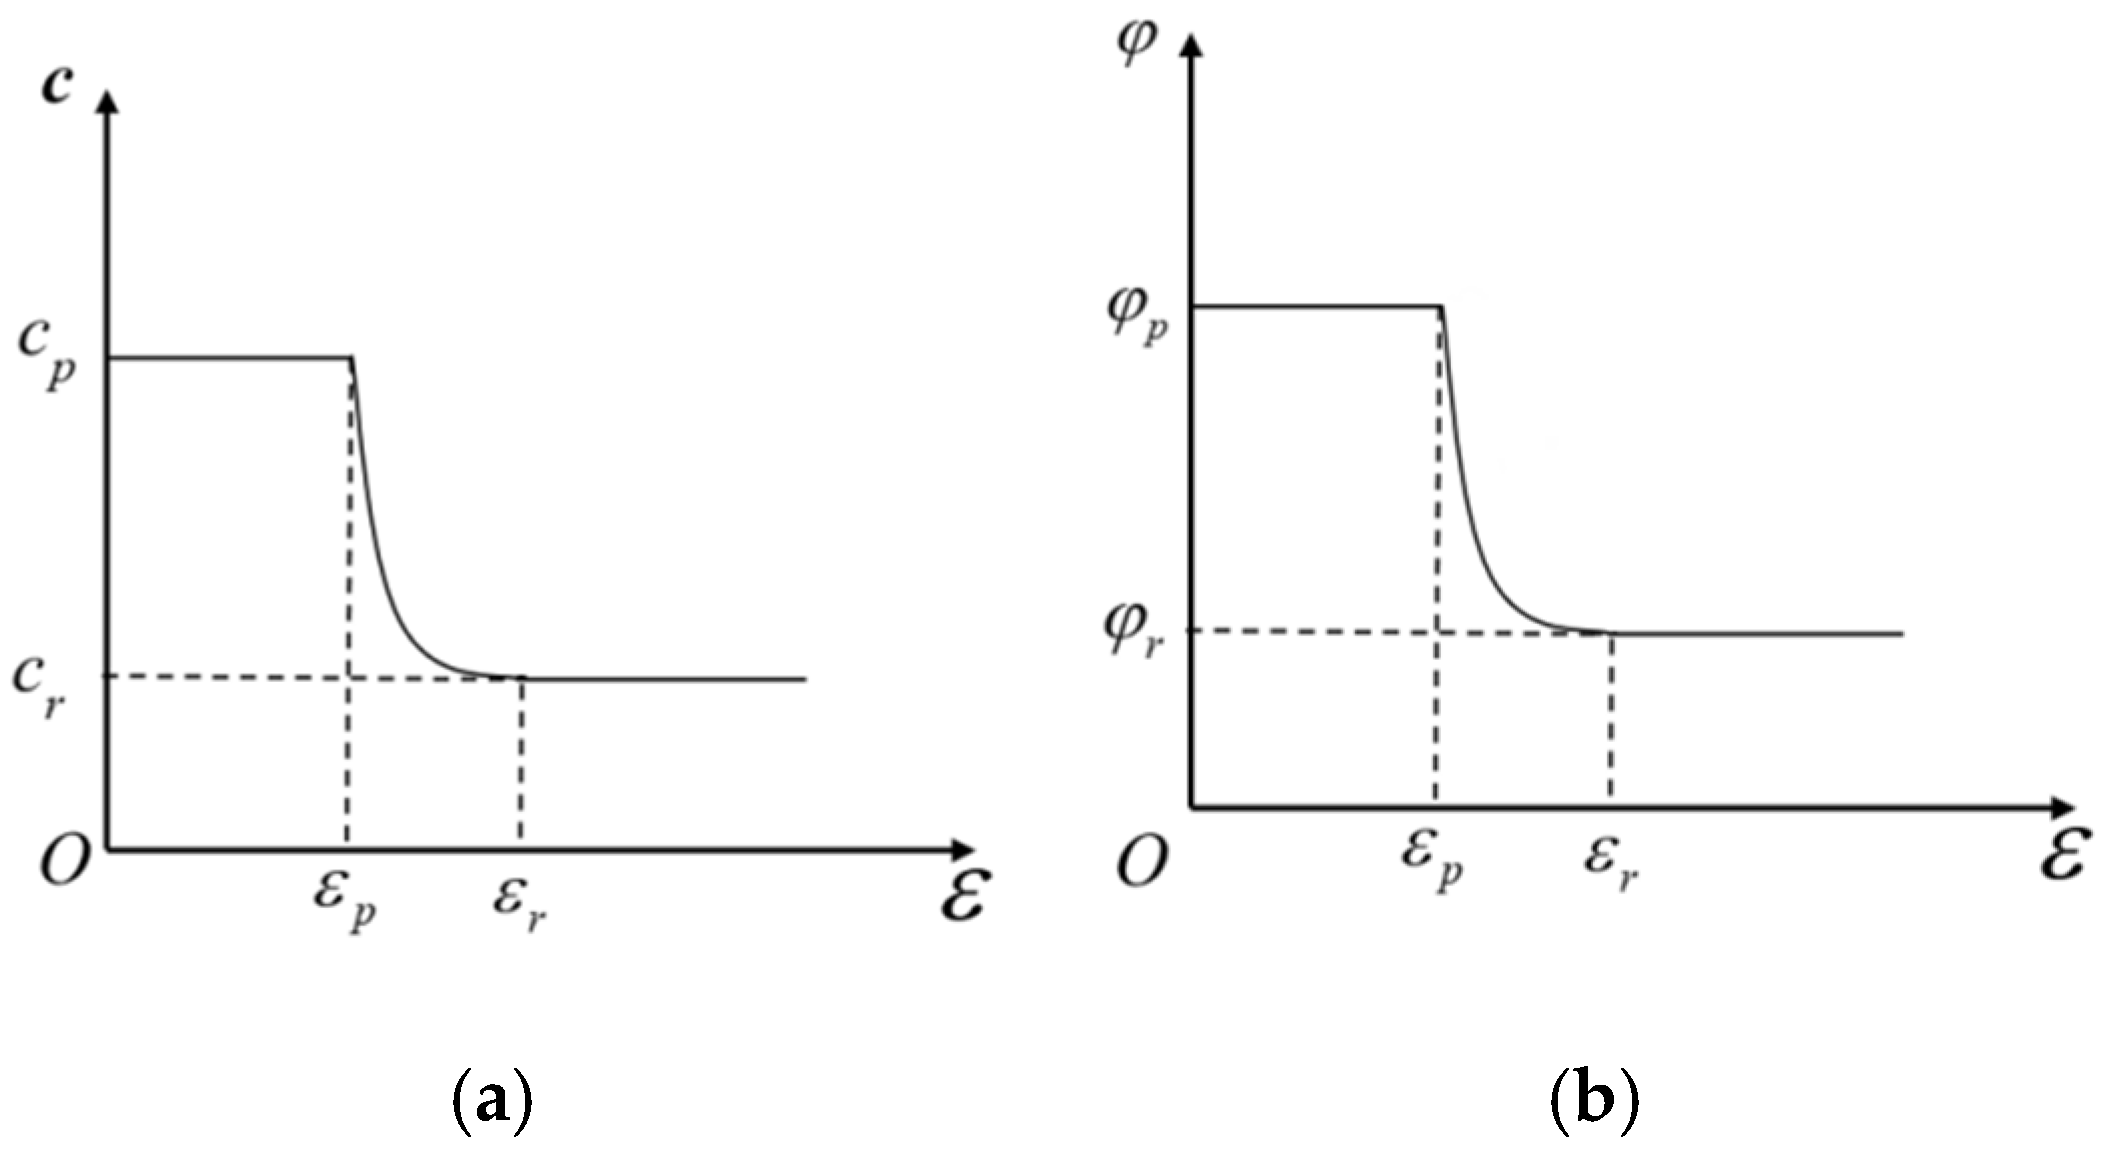
Figure 13.
Variation in shear strength of rock materials with parameters: (a) cohesion c; (b) friction angle.
Figure 13.
Variation in shear strength of rock materials with parameters: (a) cohesion c; (b) friction angle.
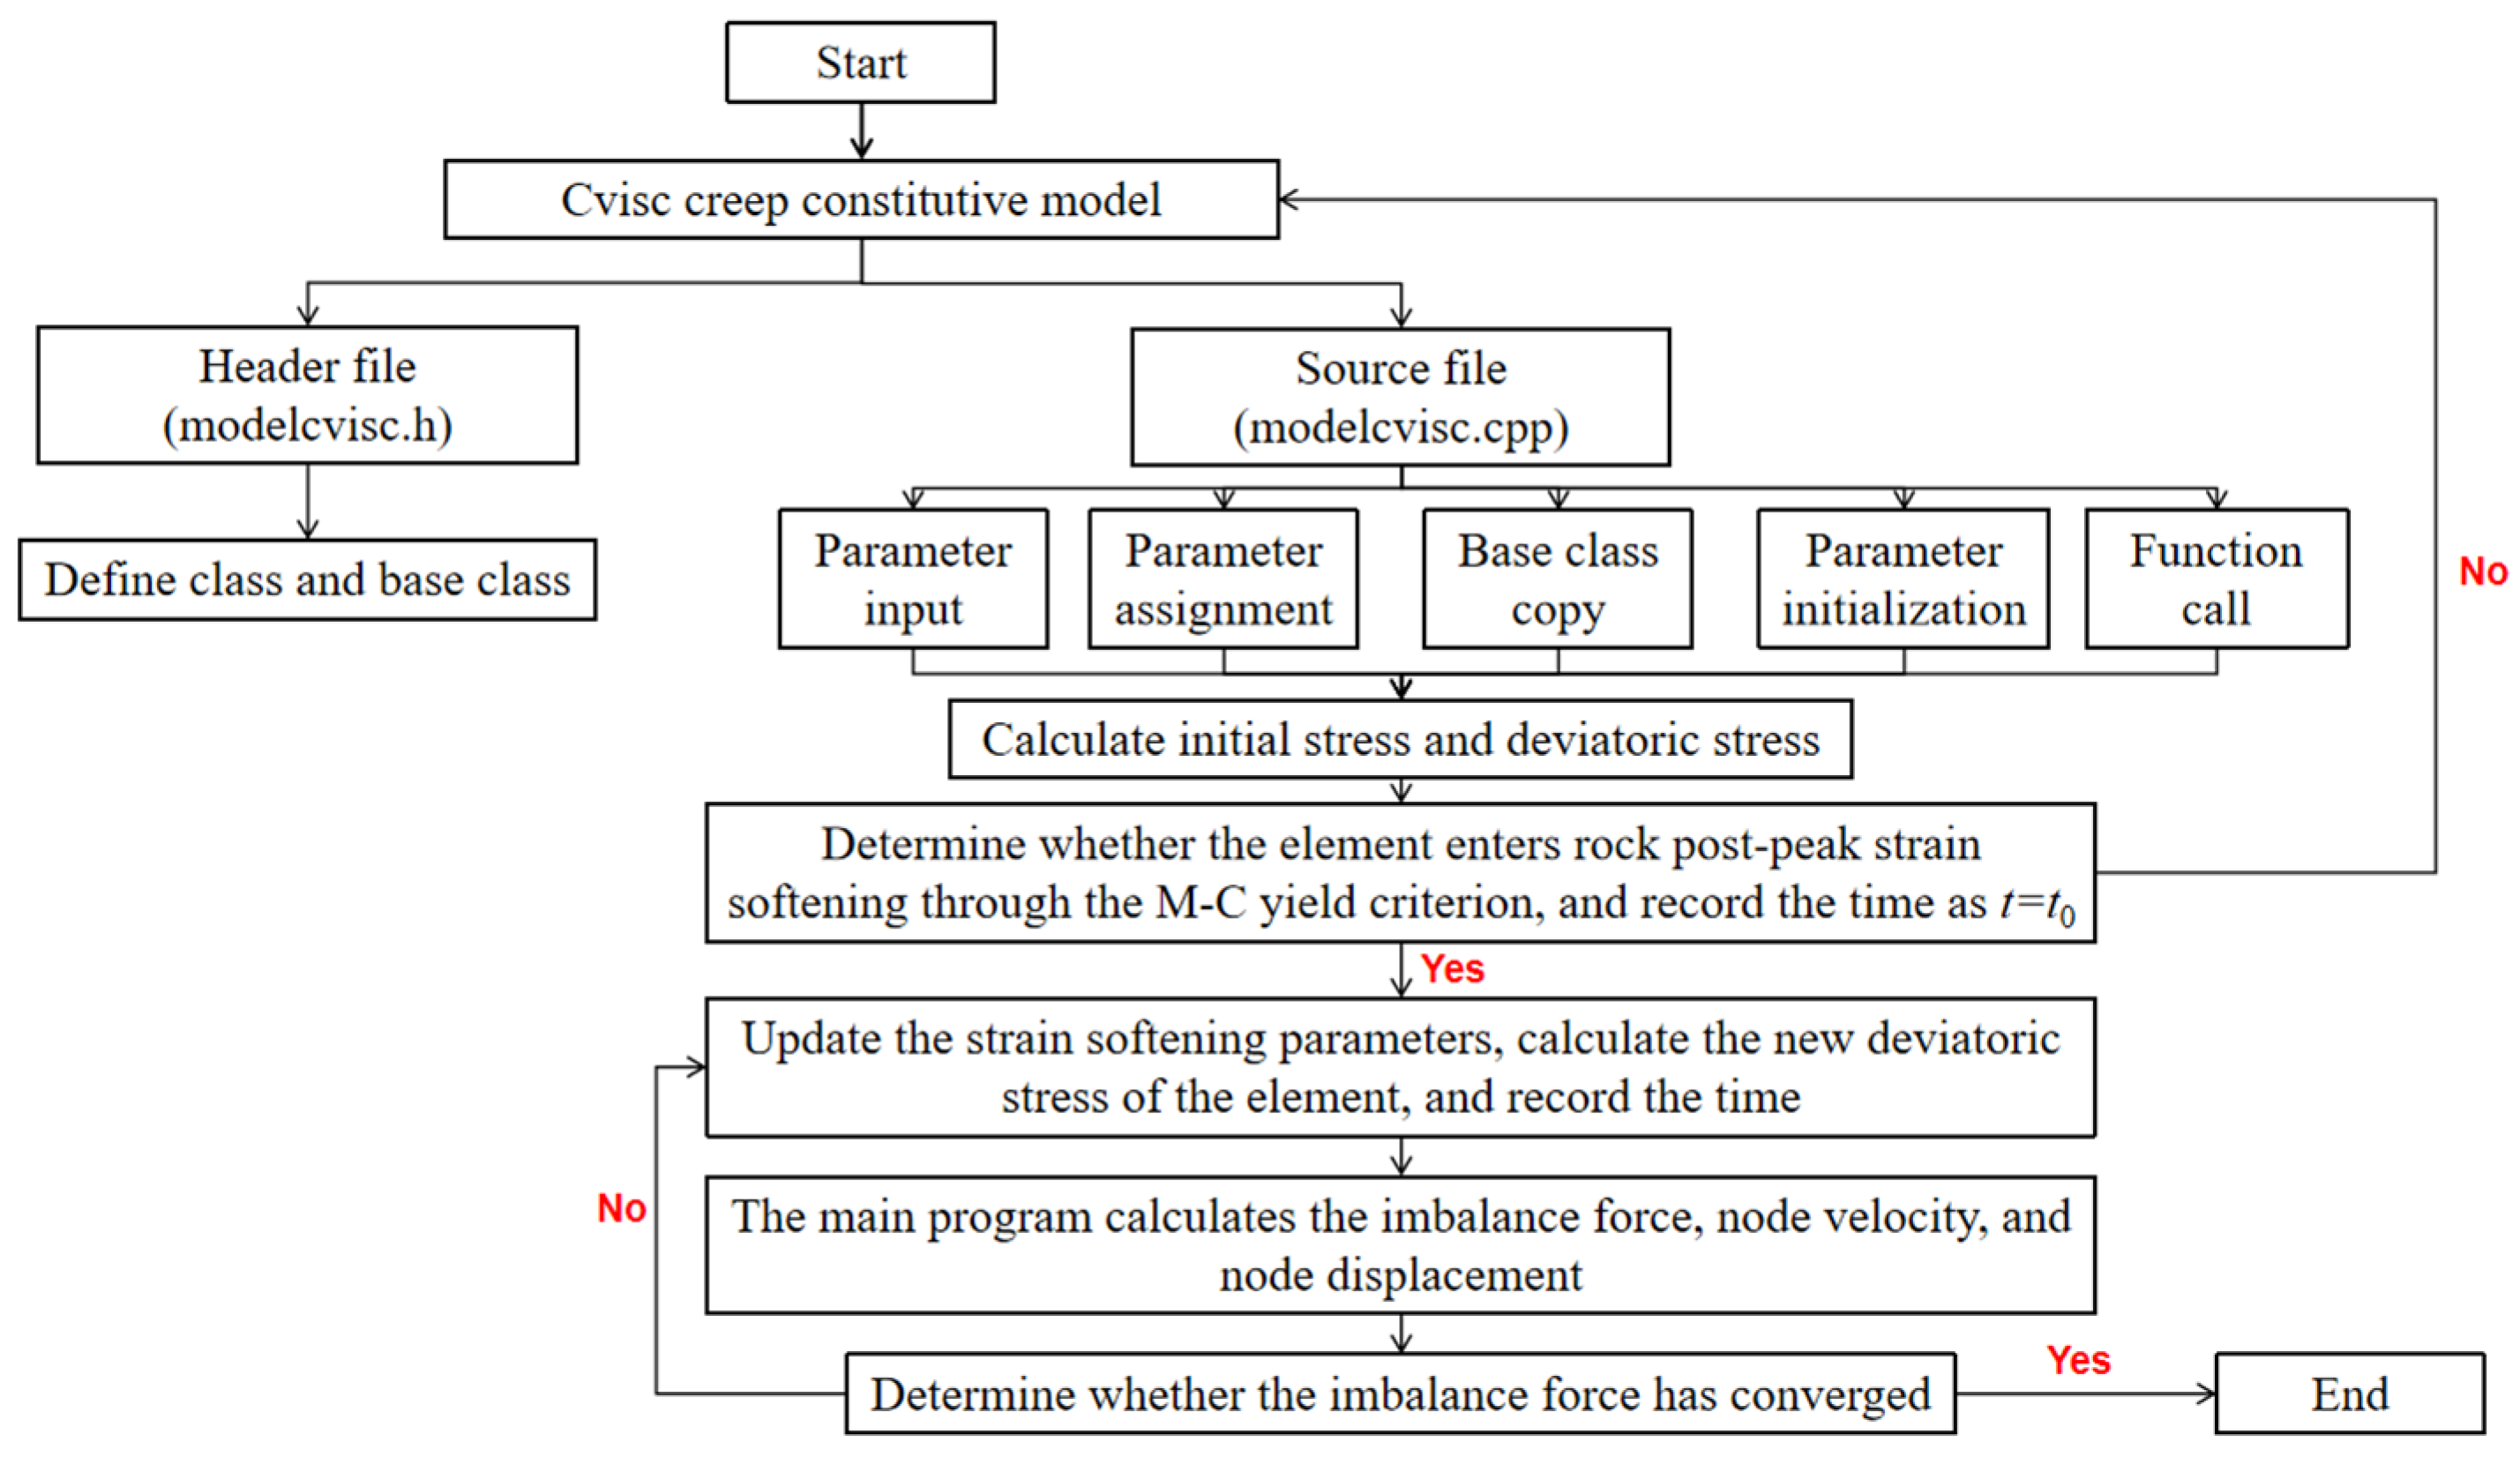
Figure 14.
Program development flowchart.
Figure 14.
Program development flowchart.
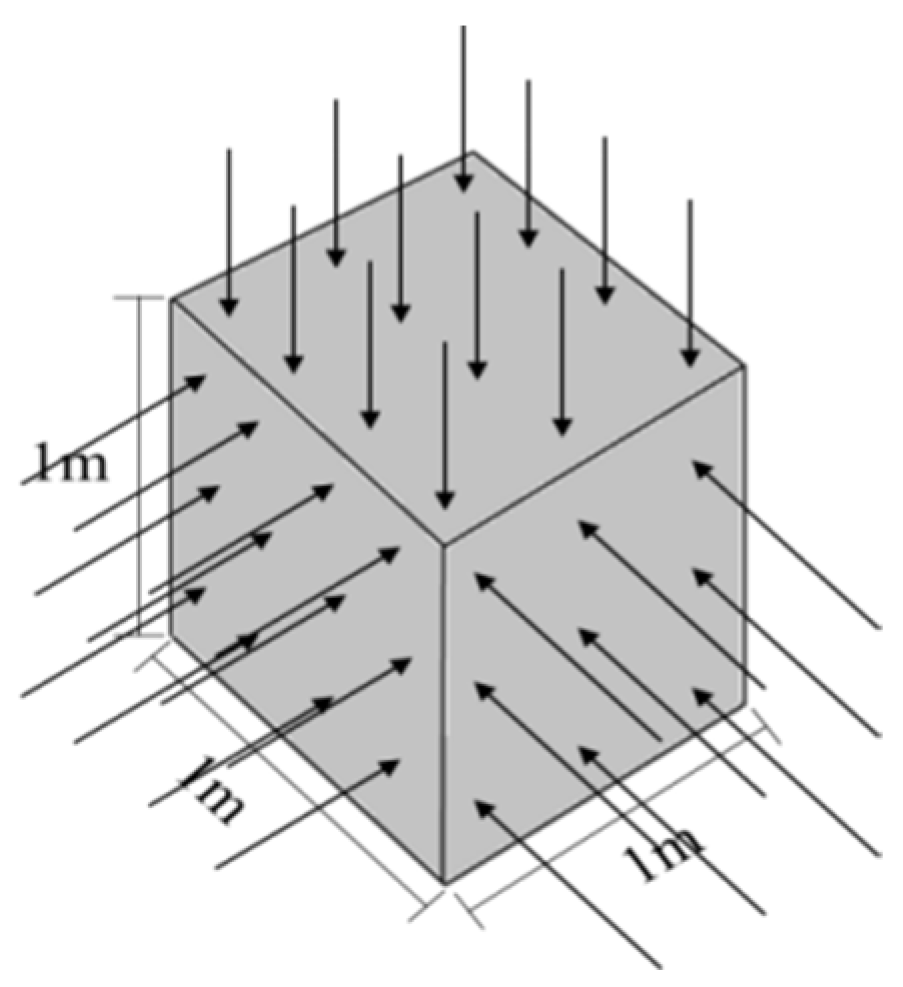
Figure 15.
Calculation model.
Figure 15.
Calculation model.
Figure 16.
Variation curves of axial strain with time for Cvisc model and custom model.
Figure 16.
Variation curves of axial strain with time for Cvisc model and custom model.
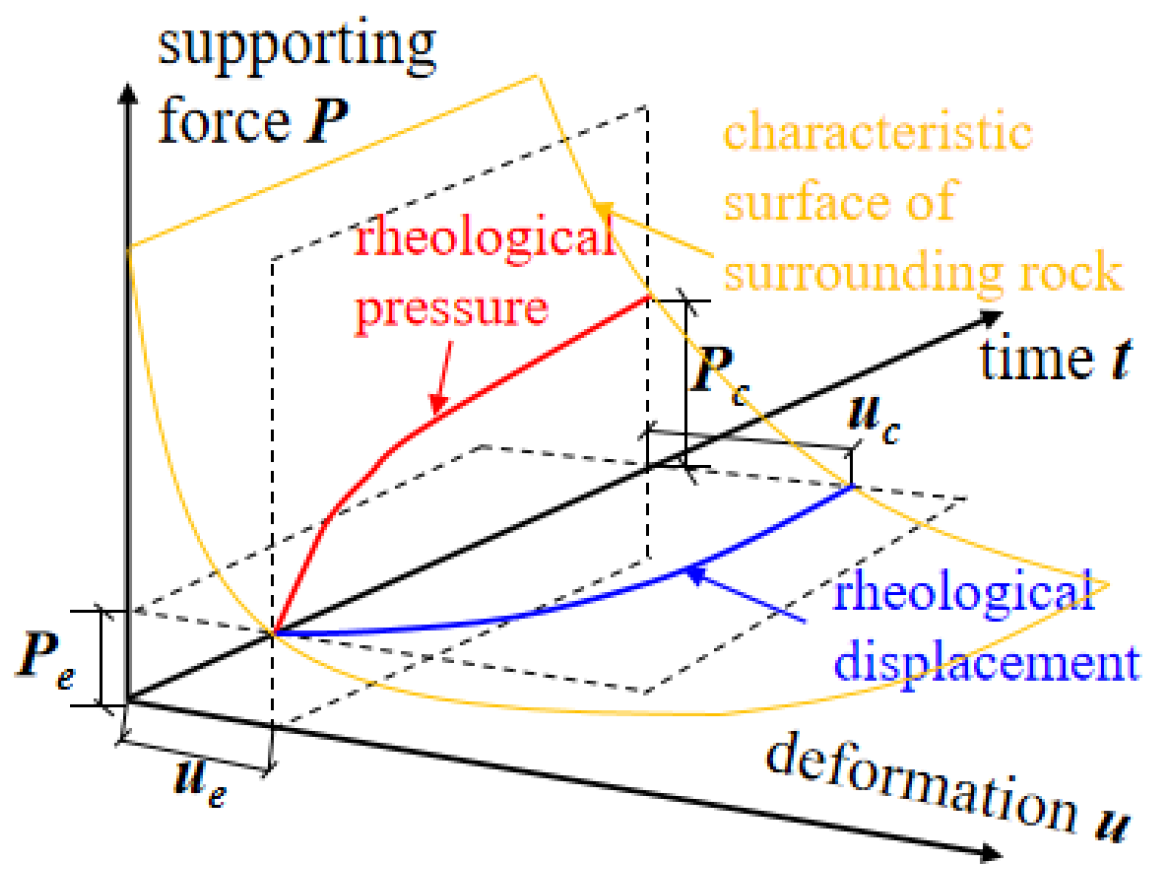
Figure 17.
Schematic diagram of surrounding rock characteristic surface.
Figure 17.
Schematic diagram of surrounding rock characteristic surface.
Figure 18.
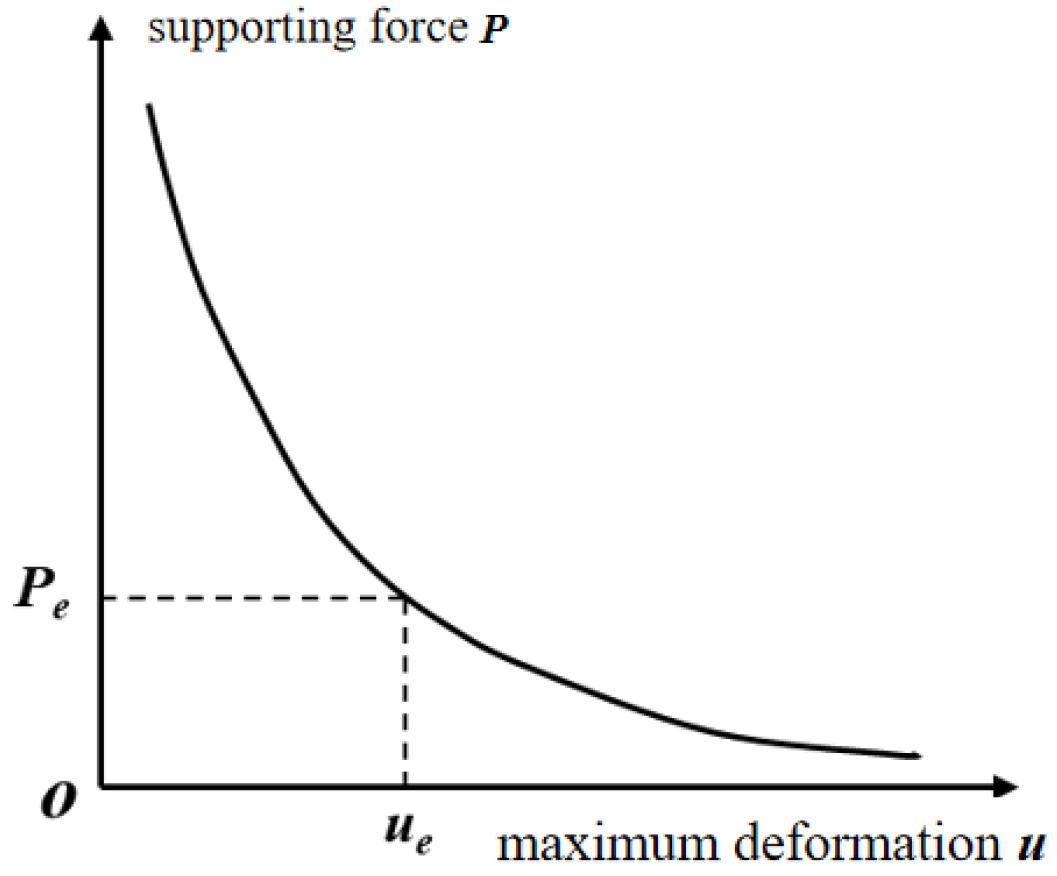
Relationship curve between support force and maximum deformation of surrounding rock at t = 0.
Figure 18.
Relationship curve between support force and maximum deformation of surrounding rock at t = 0.
Figure 19.
Relationship curve between support force and maximum deformation of surrounding rock at different times.
Figure 19.
Relationship curve between support force and maximum deformation of surrounding rock at different times.
Figure 20.
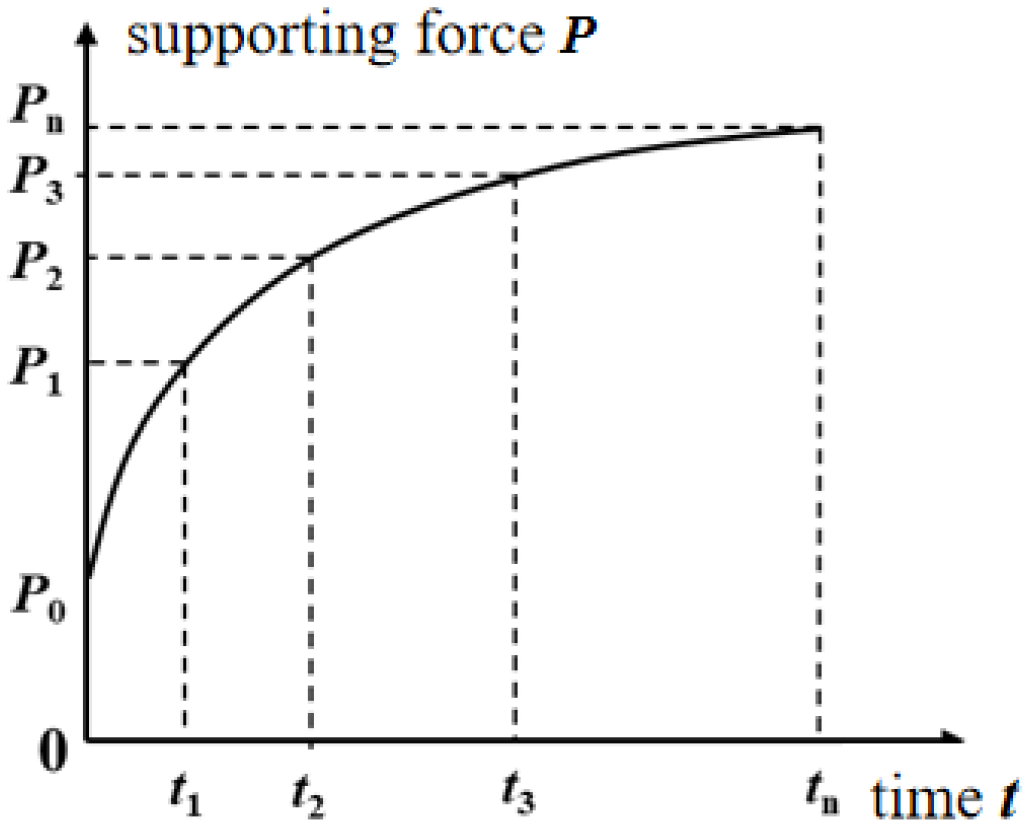
Relationship curve of support force with time.
Figure 20.
Relationship curve of support force with time.
Figure 21.
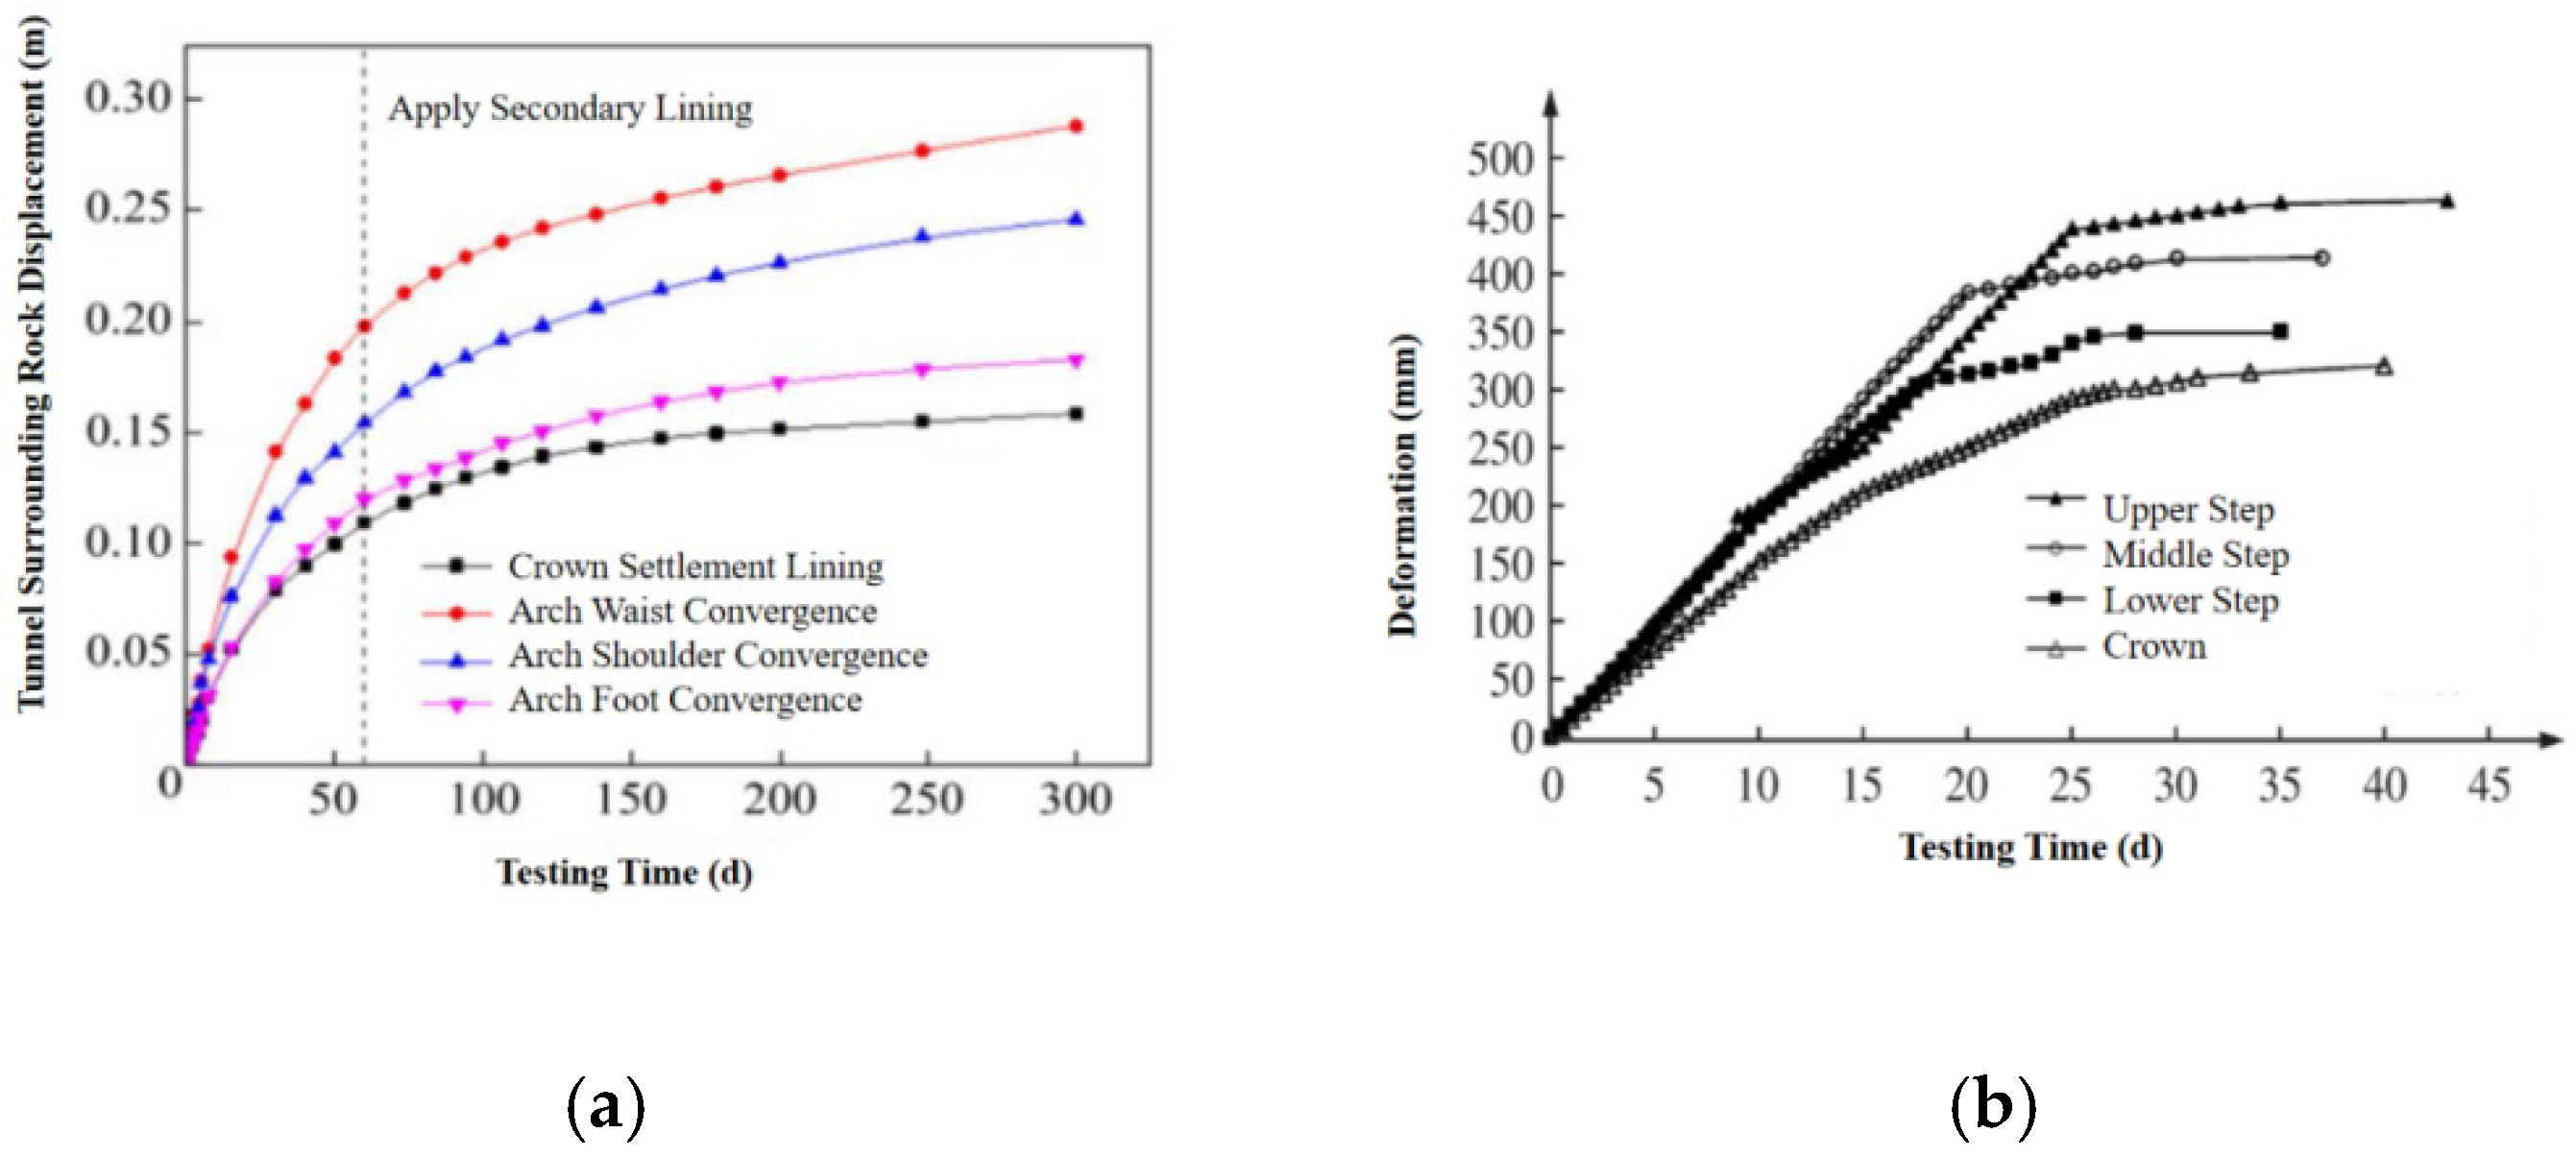
Tunnel surrounding rock displacement of Chengdu–Lanzhou Railway and Lan–Yu Railway Xinchengzi Tunnel: (a) Chengdu–Lanzhou Railway; (b) Lan–Yu Railway Xinchengzi Tunnel.
Figure 21.
Tunnel surrounding rock displacement of Chengdu–Lanzhou Railway and Lan–Yu Railway Xinchengzi Tunnel: (a) Chengdu–Lanzhou Railway; (b) Lan–Yu Railway Xinchengzi Tunnel.
Figure 22.
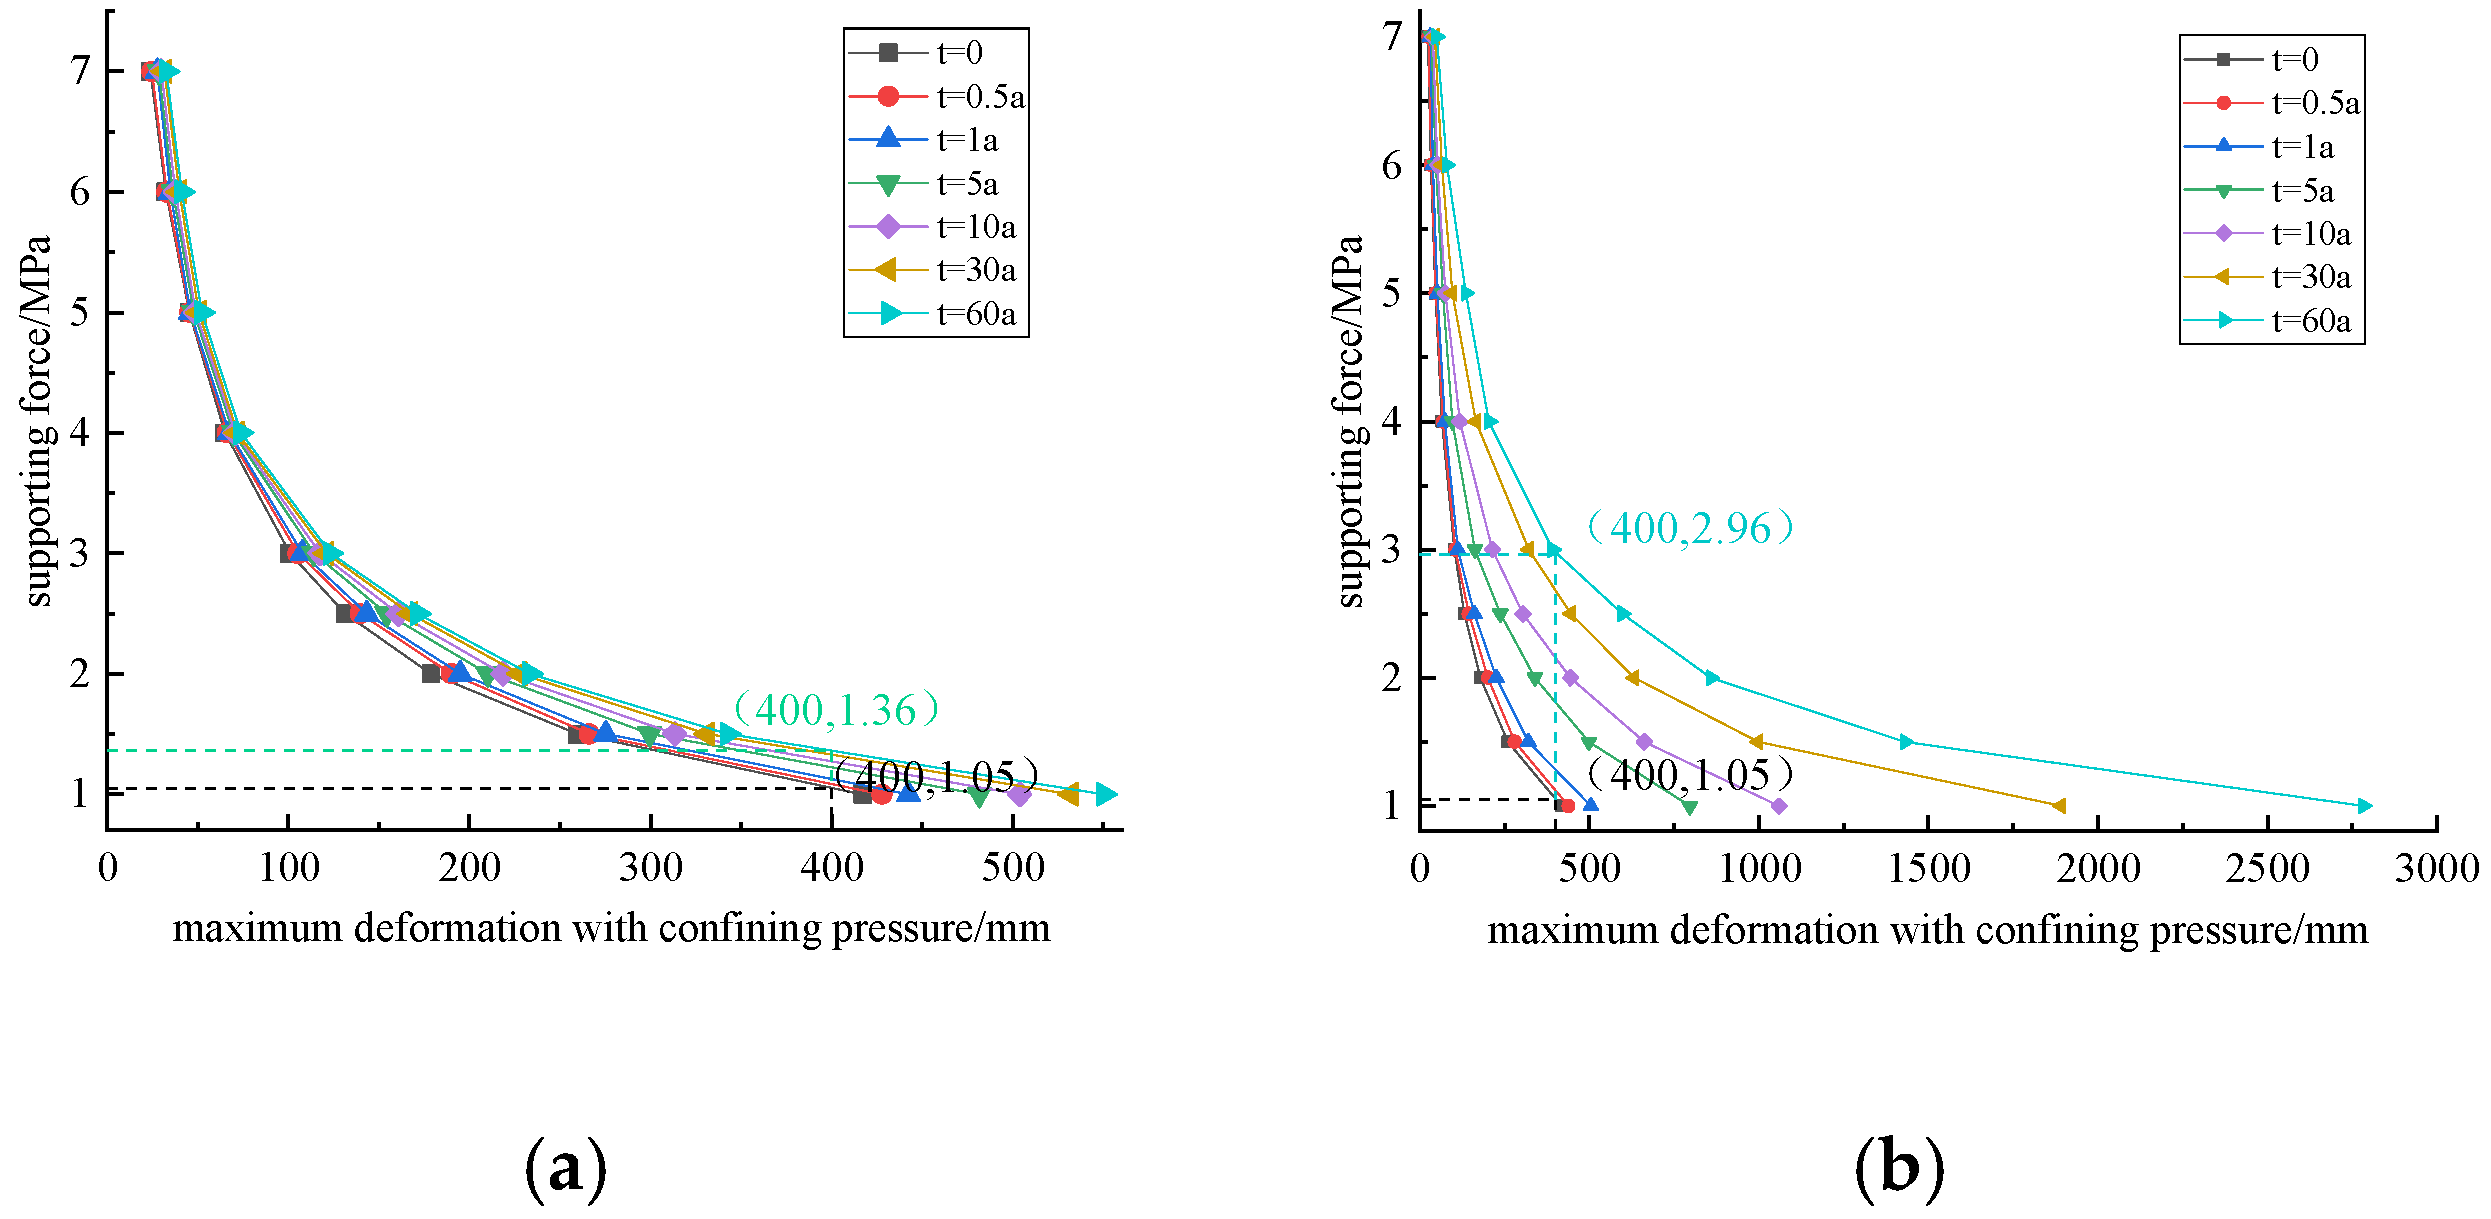
Relationship curve between support force and maximum deformation of surrounding rock considering time effect: (a) group 1 of creep parameters; (b) group 2 of creep parameters.
Figure 22.
Relationship curve between support force and maximum deformation of surrounding rock considering time effect: (a) group 1 of creep parameters; (b) group 2 of creep parameters.
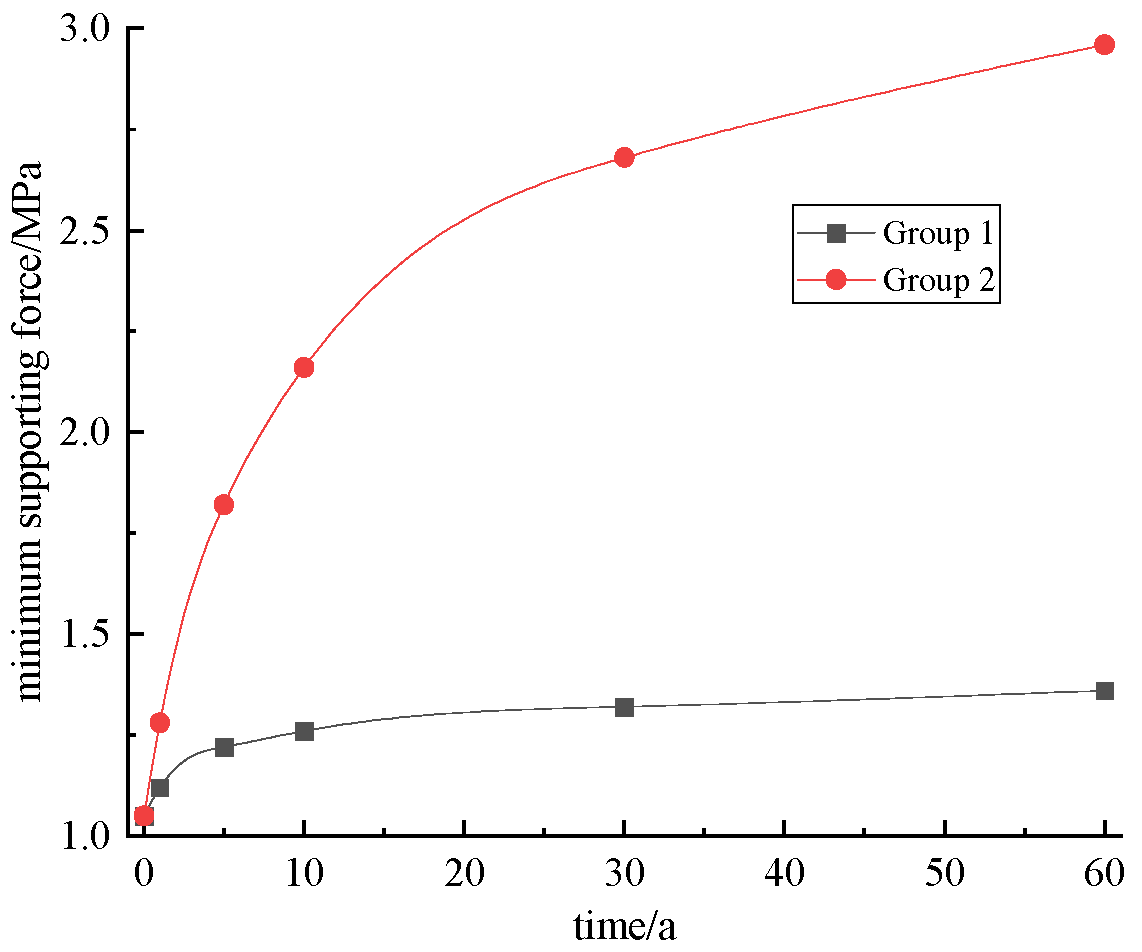
Figure 23.
Variation curve of minimum support force with time under different creep parameters.
Figure 23.
Variation curve of minimum support force with time under different creep parameters.
Figure 24.
Calculation model of rock-anchor bearing arch strength.
Figure 24.
Calculation model of rock-anchor bearing arch strength.
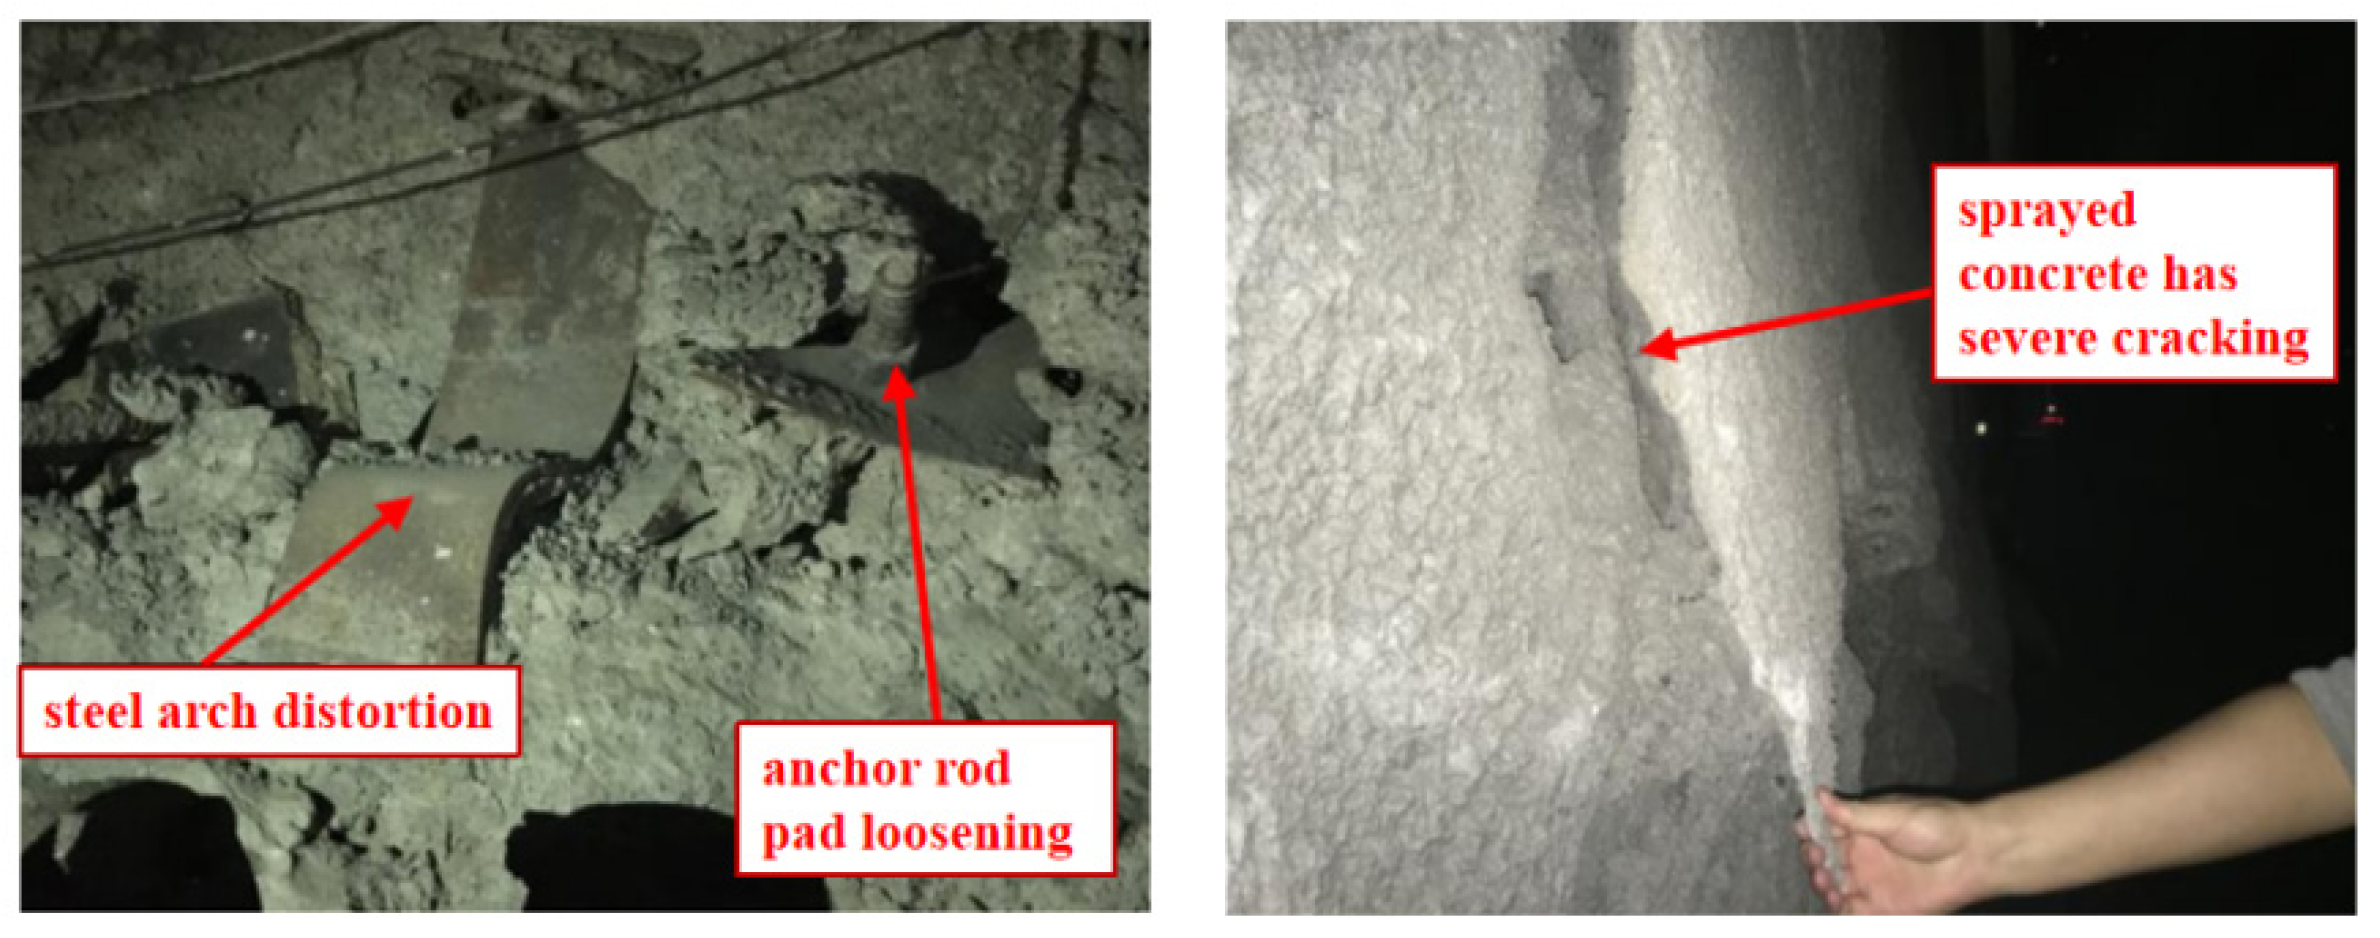
Figure 25.
Deformation and damage characteristics of initial support structure.
Figure 25.
Deformation and damage characteristics of initial support structure.
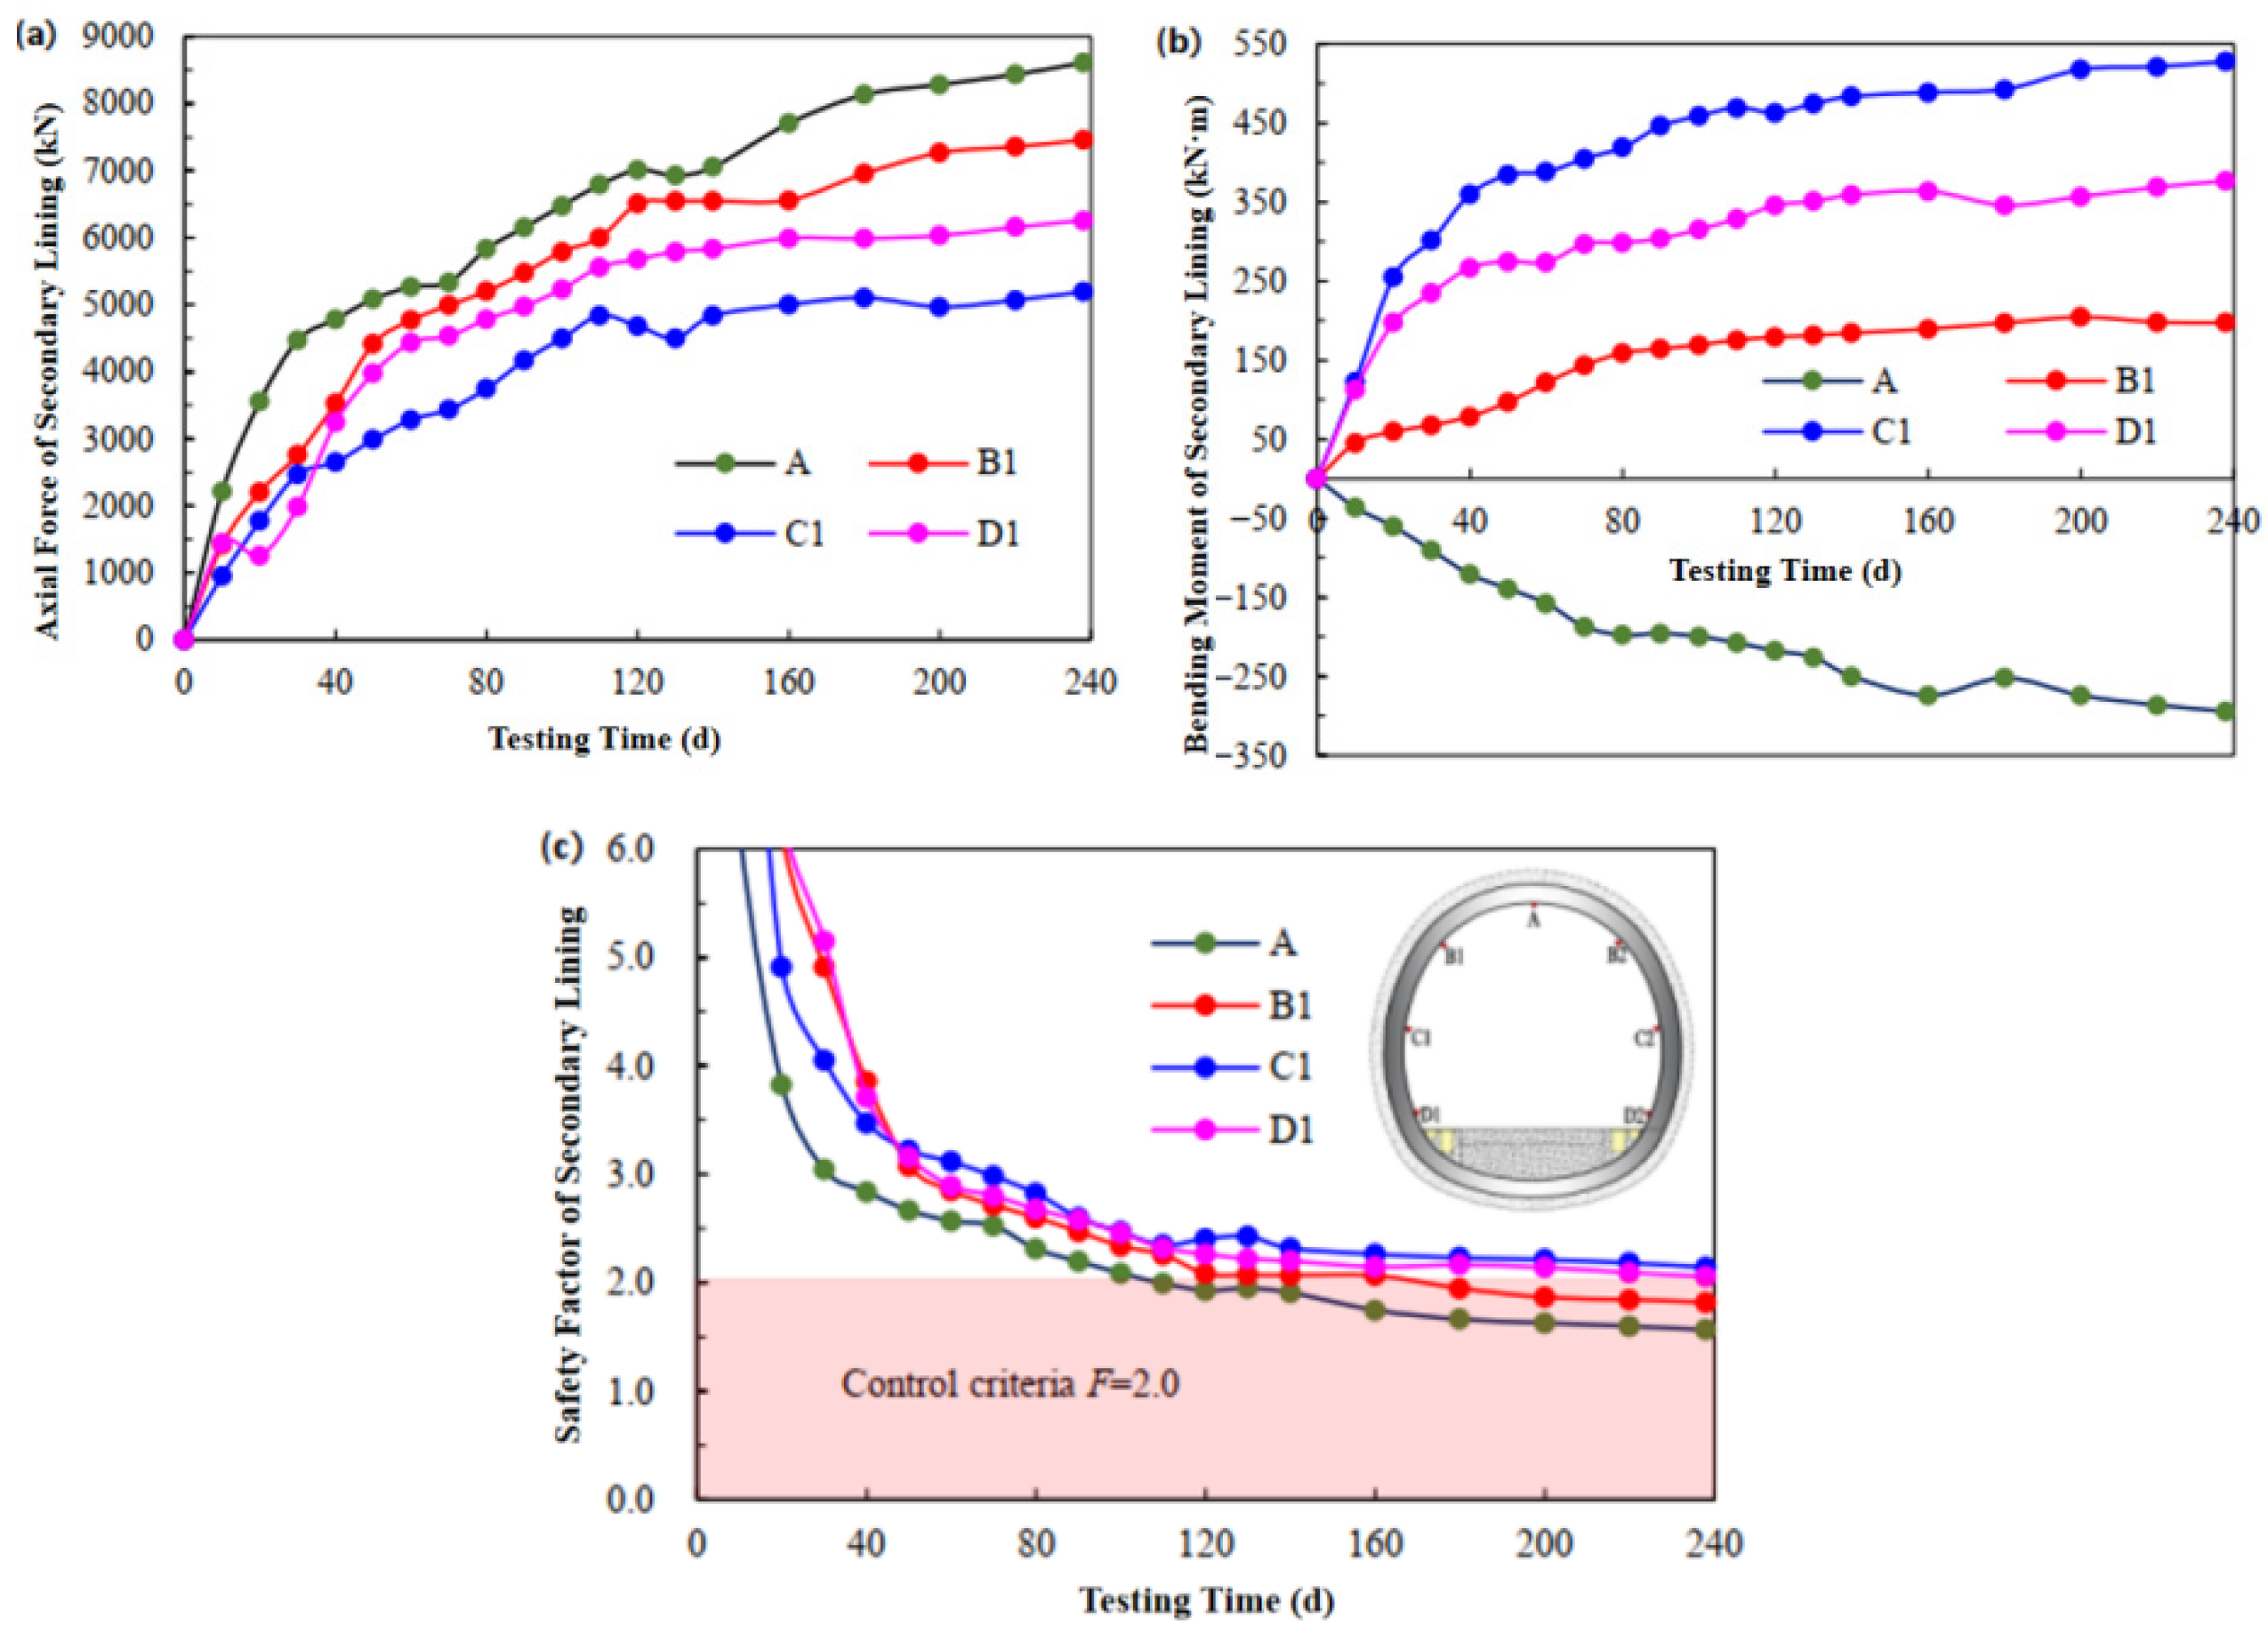
Figure 26.
Evolution law of internal forces in the secondary lining of Mao County Tunnel, Chengdu–Lanzhou Railway.
Figure 26.
Evolution law of internal forces in the secondary lining of Mao County Tunnel, Chengdu–Lanzhou Railway.
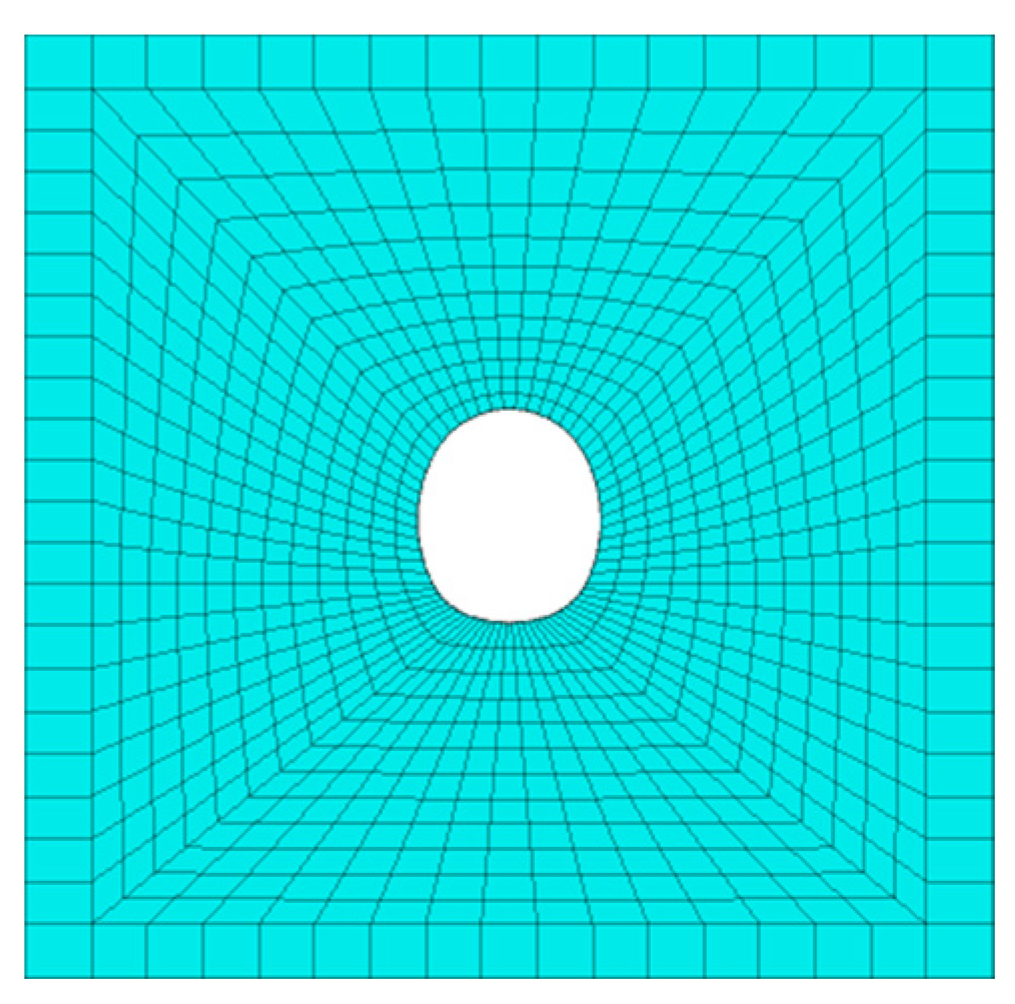
Figure 27.
Numerical calculation model.
Figure 27.
Numerical calculation model.
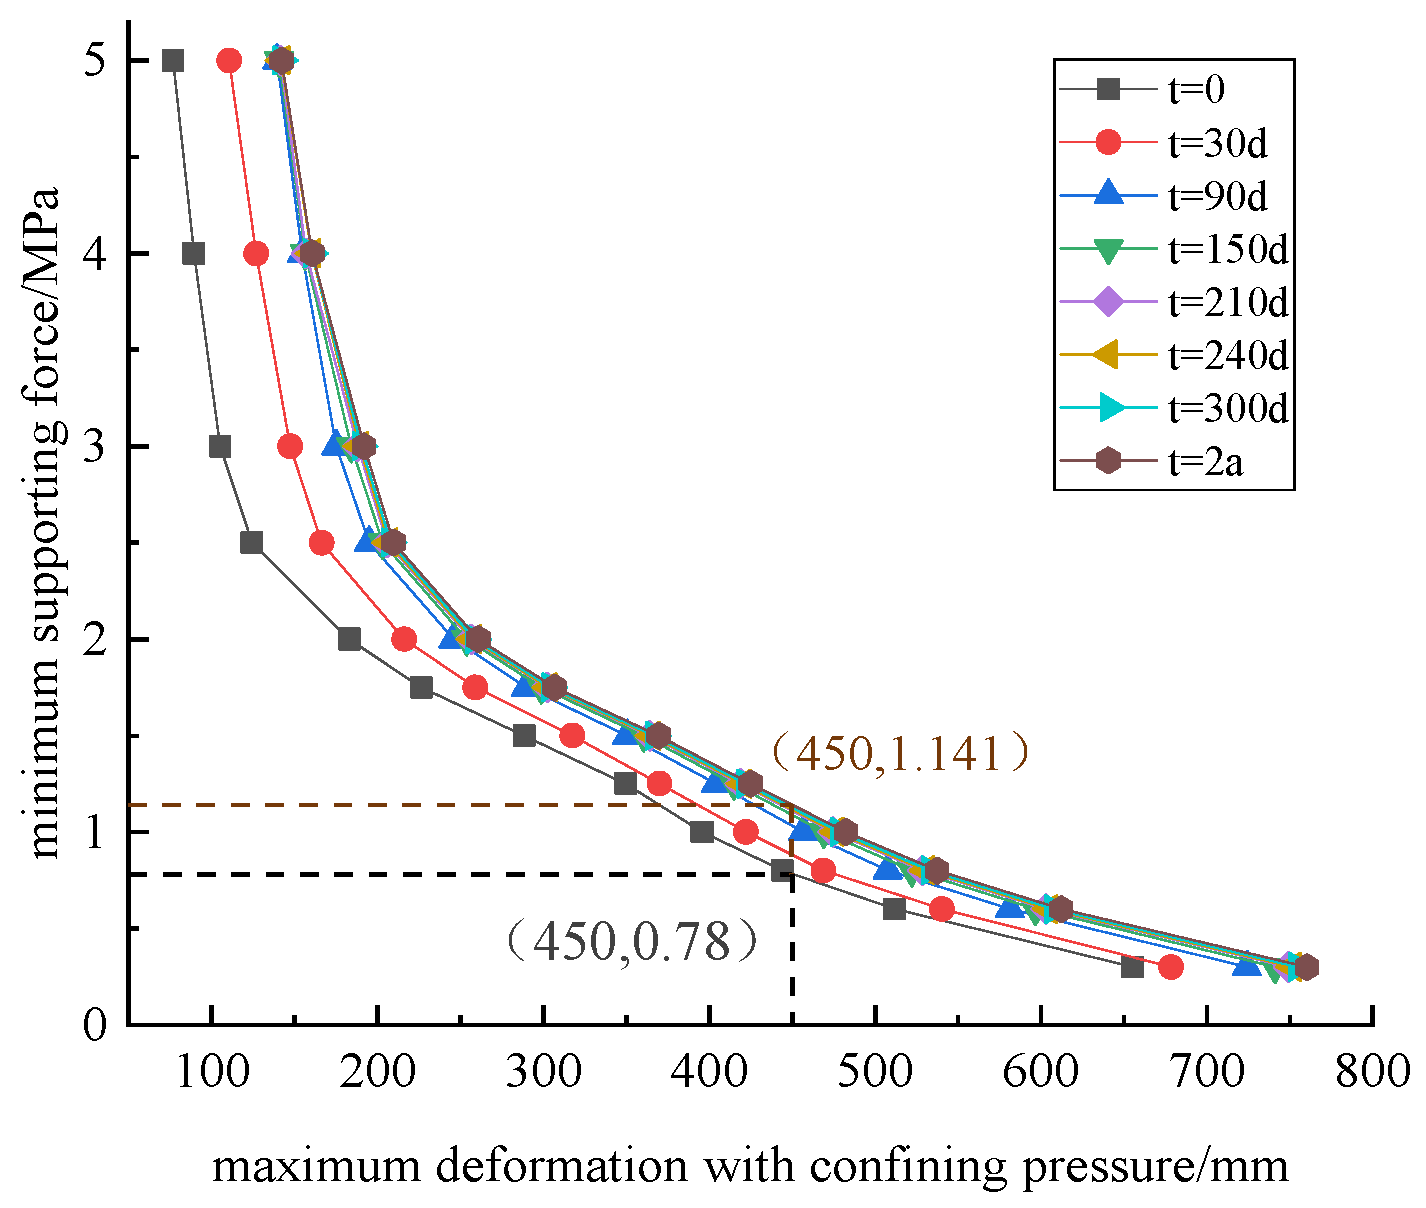
Figure 28.
Relationship curve between support force and maximum deformation of surrounding rock at different times in Mao County Tunnel, Chengdu-Lanzhou Railway.
Figure 28.
Relationship curve between support force and maximum deformation of surrounding rock at different times in Mao County Tunnel, Chengdu-Lanzhou Railway.
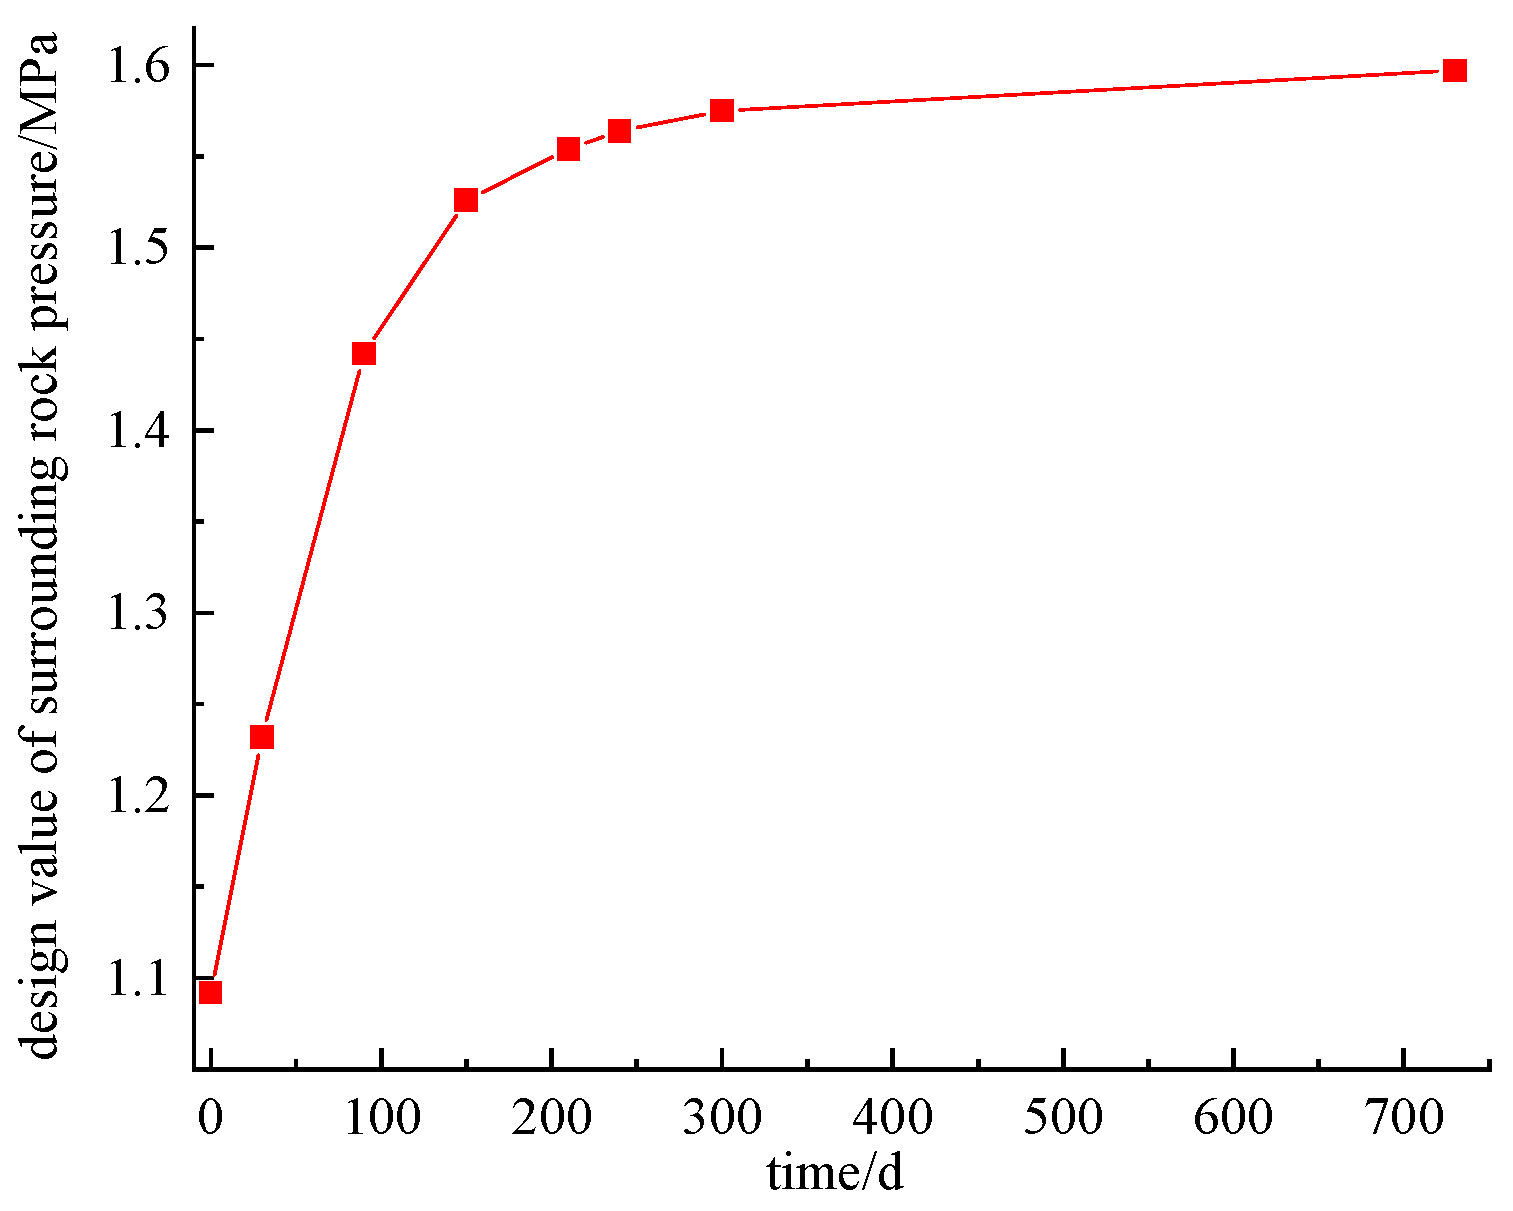
Figure 29.
Time-history curve of design value of surrounding rock pressure in Mao County Tunnel, Chengdu–Lanzhou Railway.
Figure 29.
Time-history curve of design value of surrounding rock pressure in Mao County Tunnel, Chengdu–Lanzhou Railway.
Figure 30.
Load calculation model of shotcrete.
Figure 30.
Load calculation model of shotcrete.
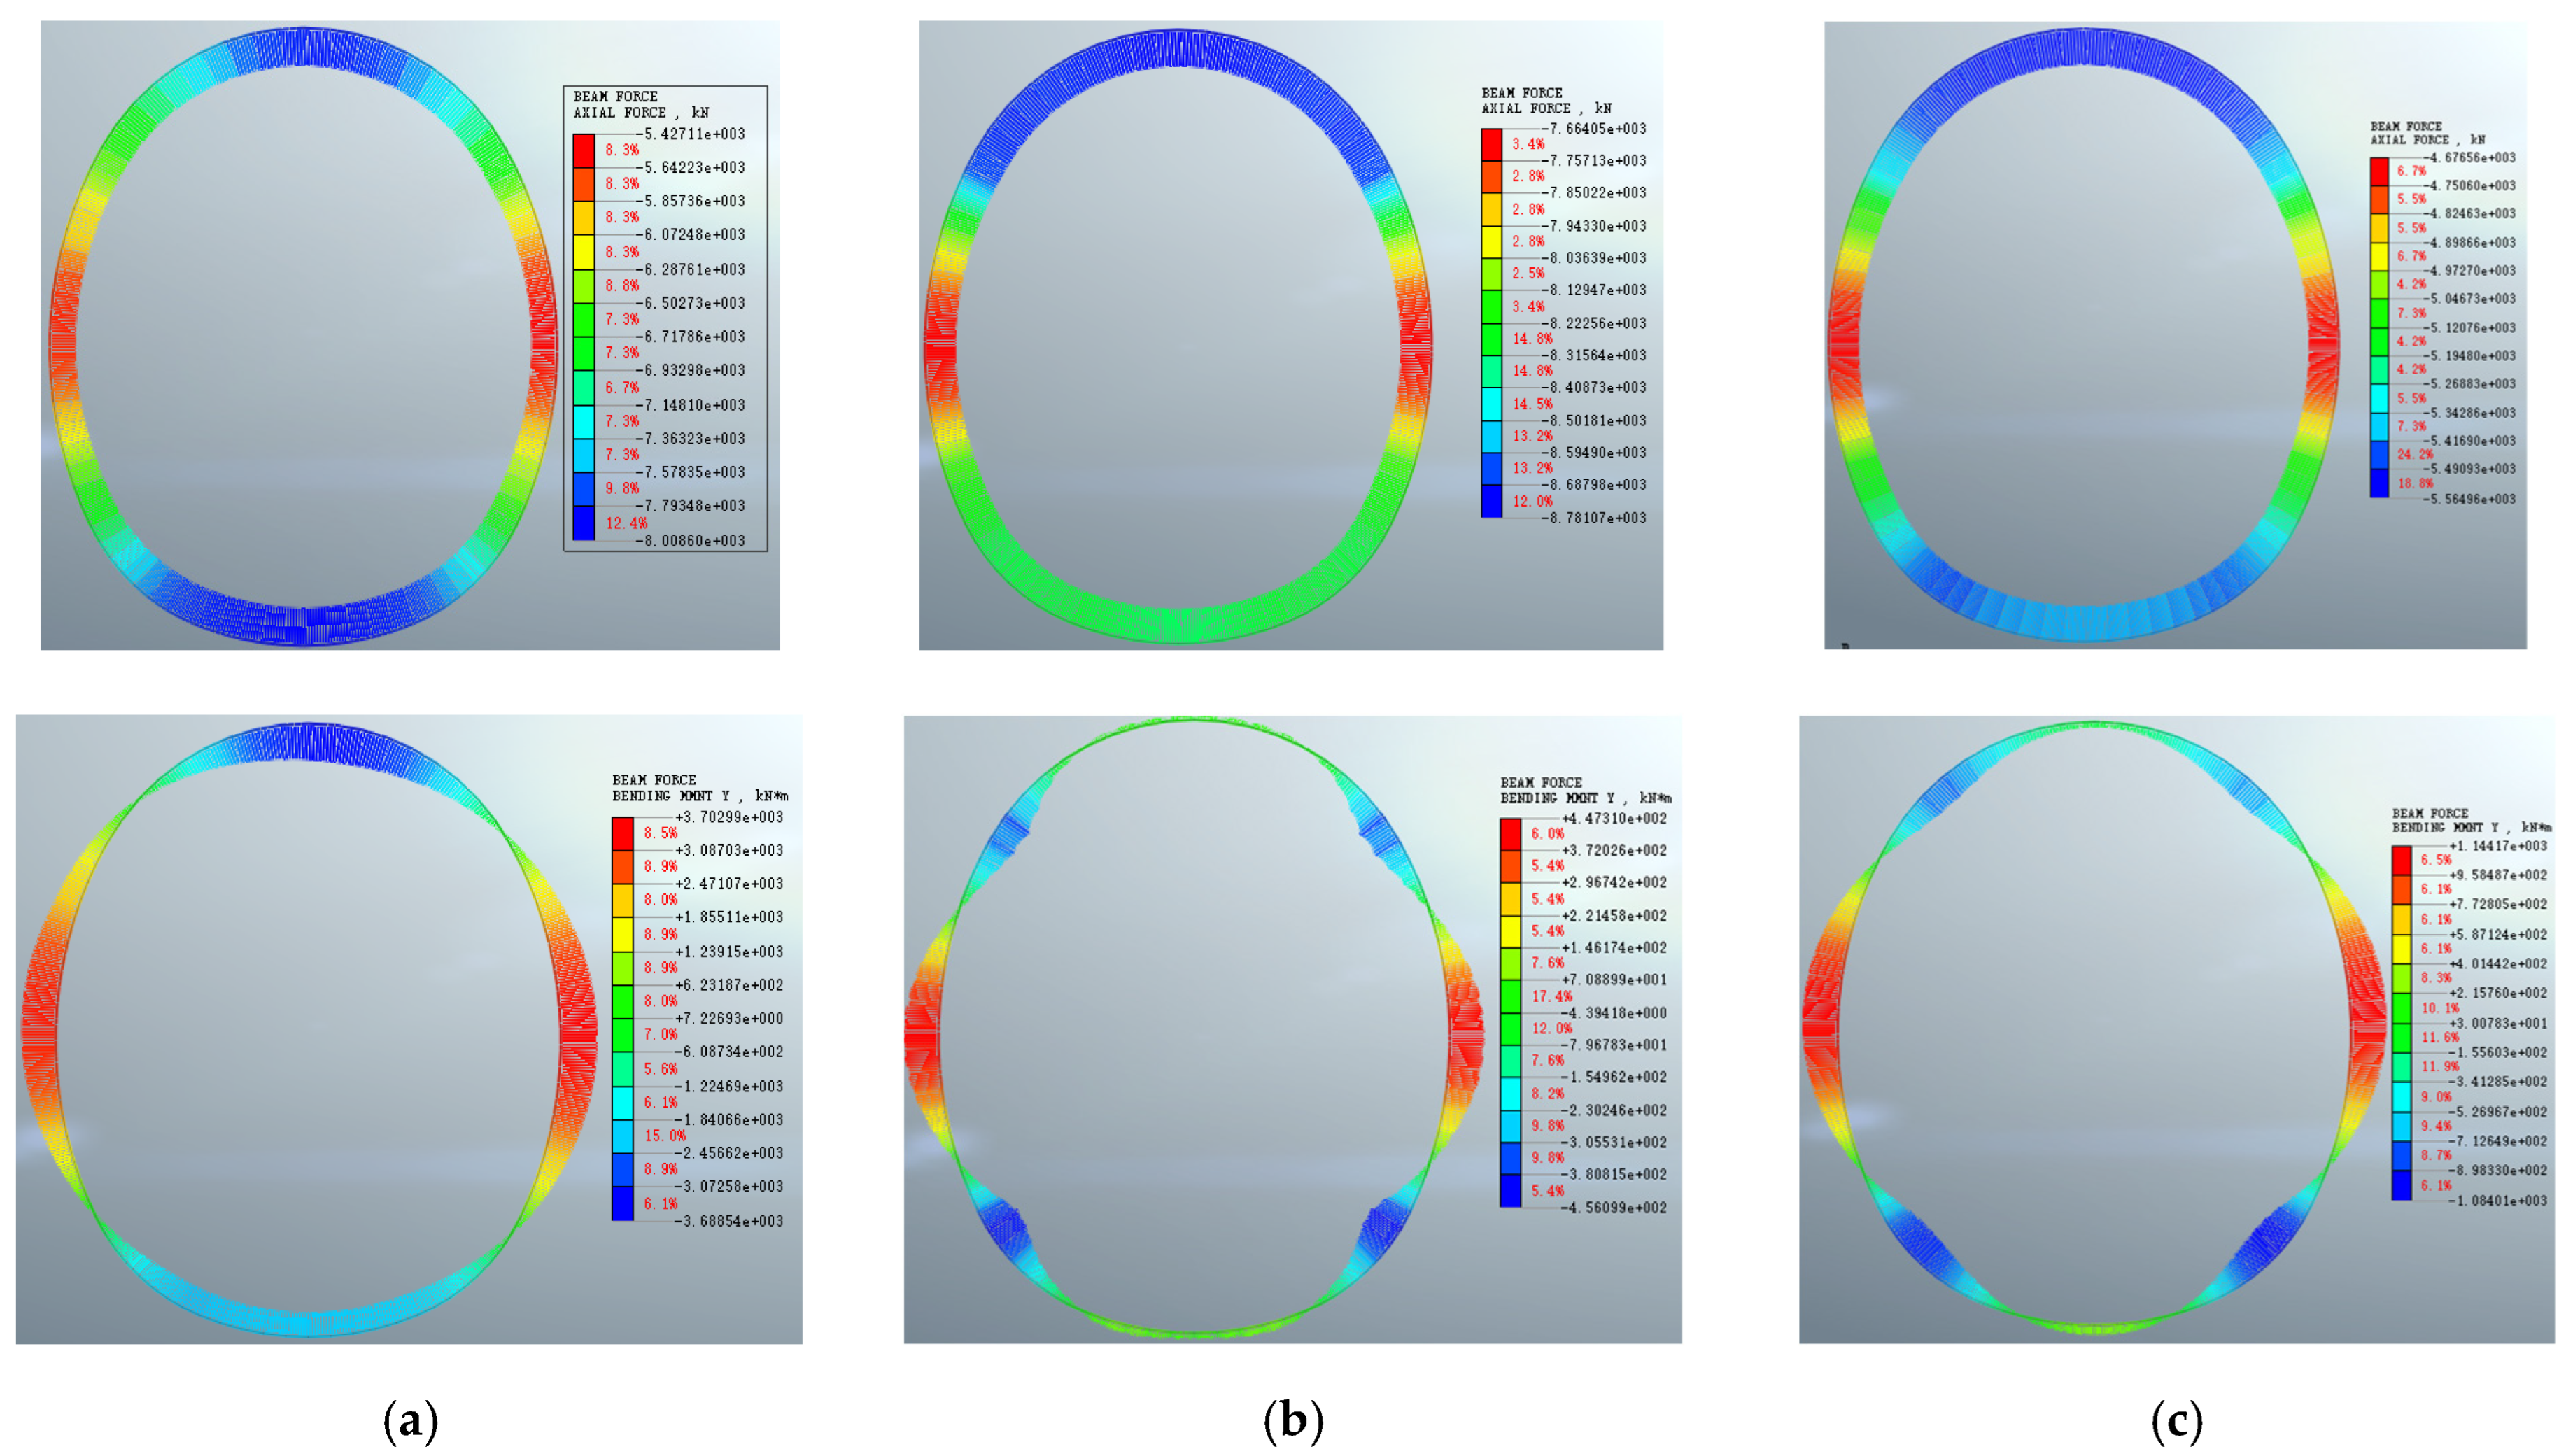
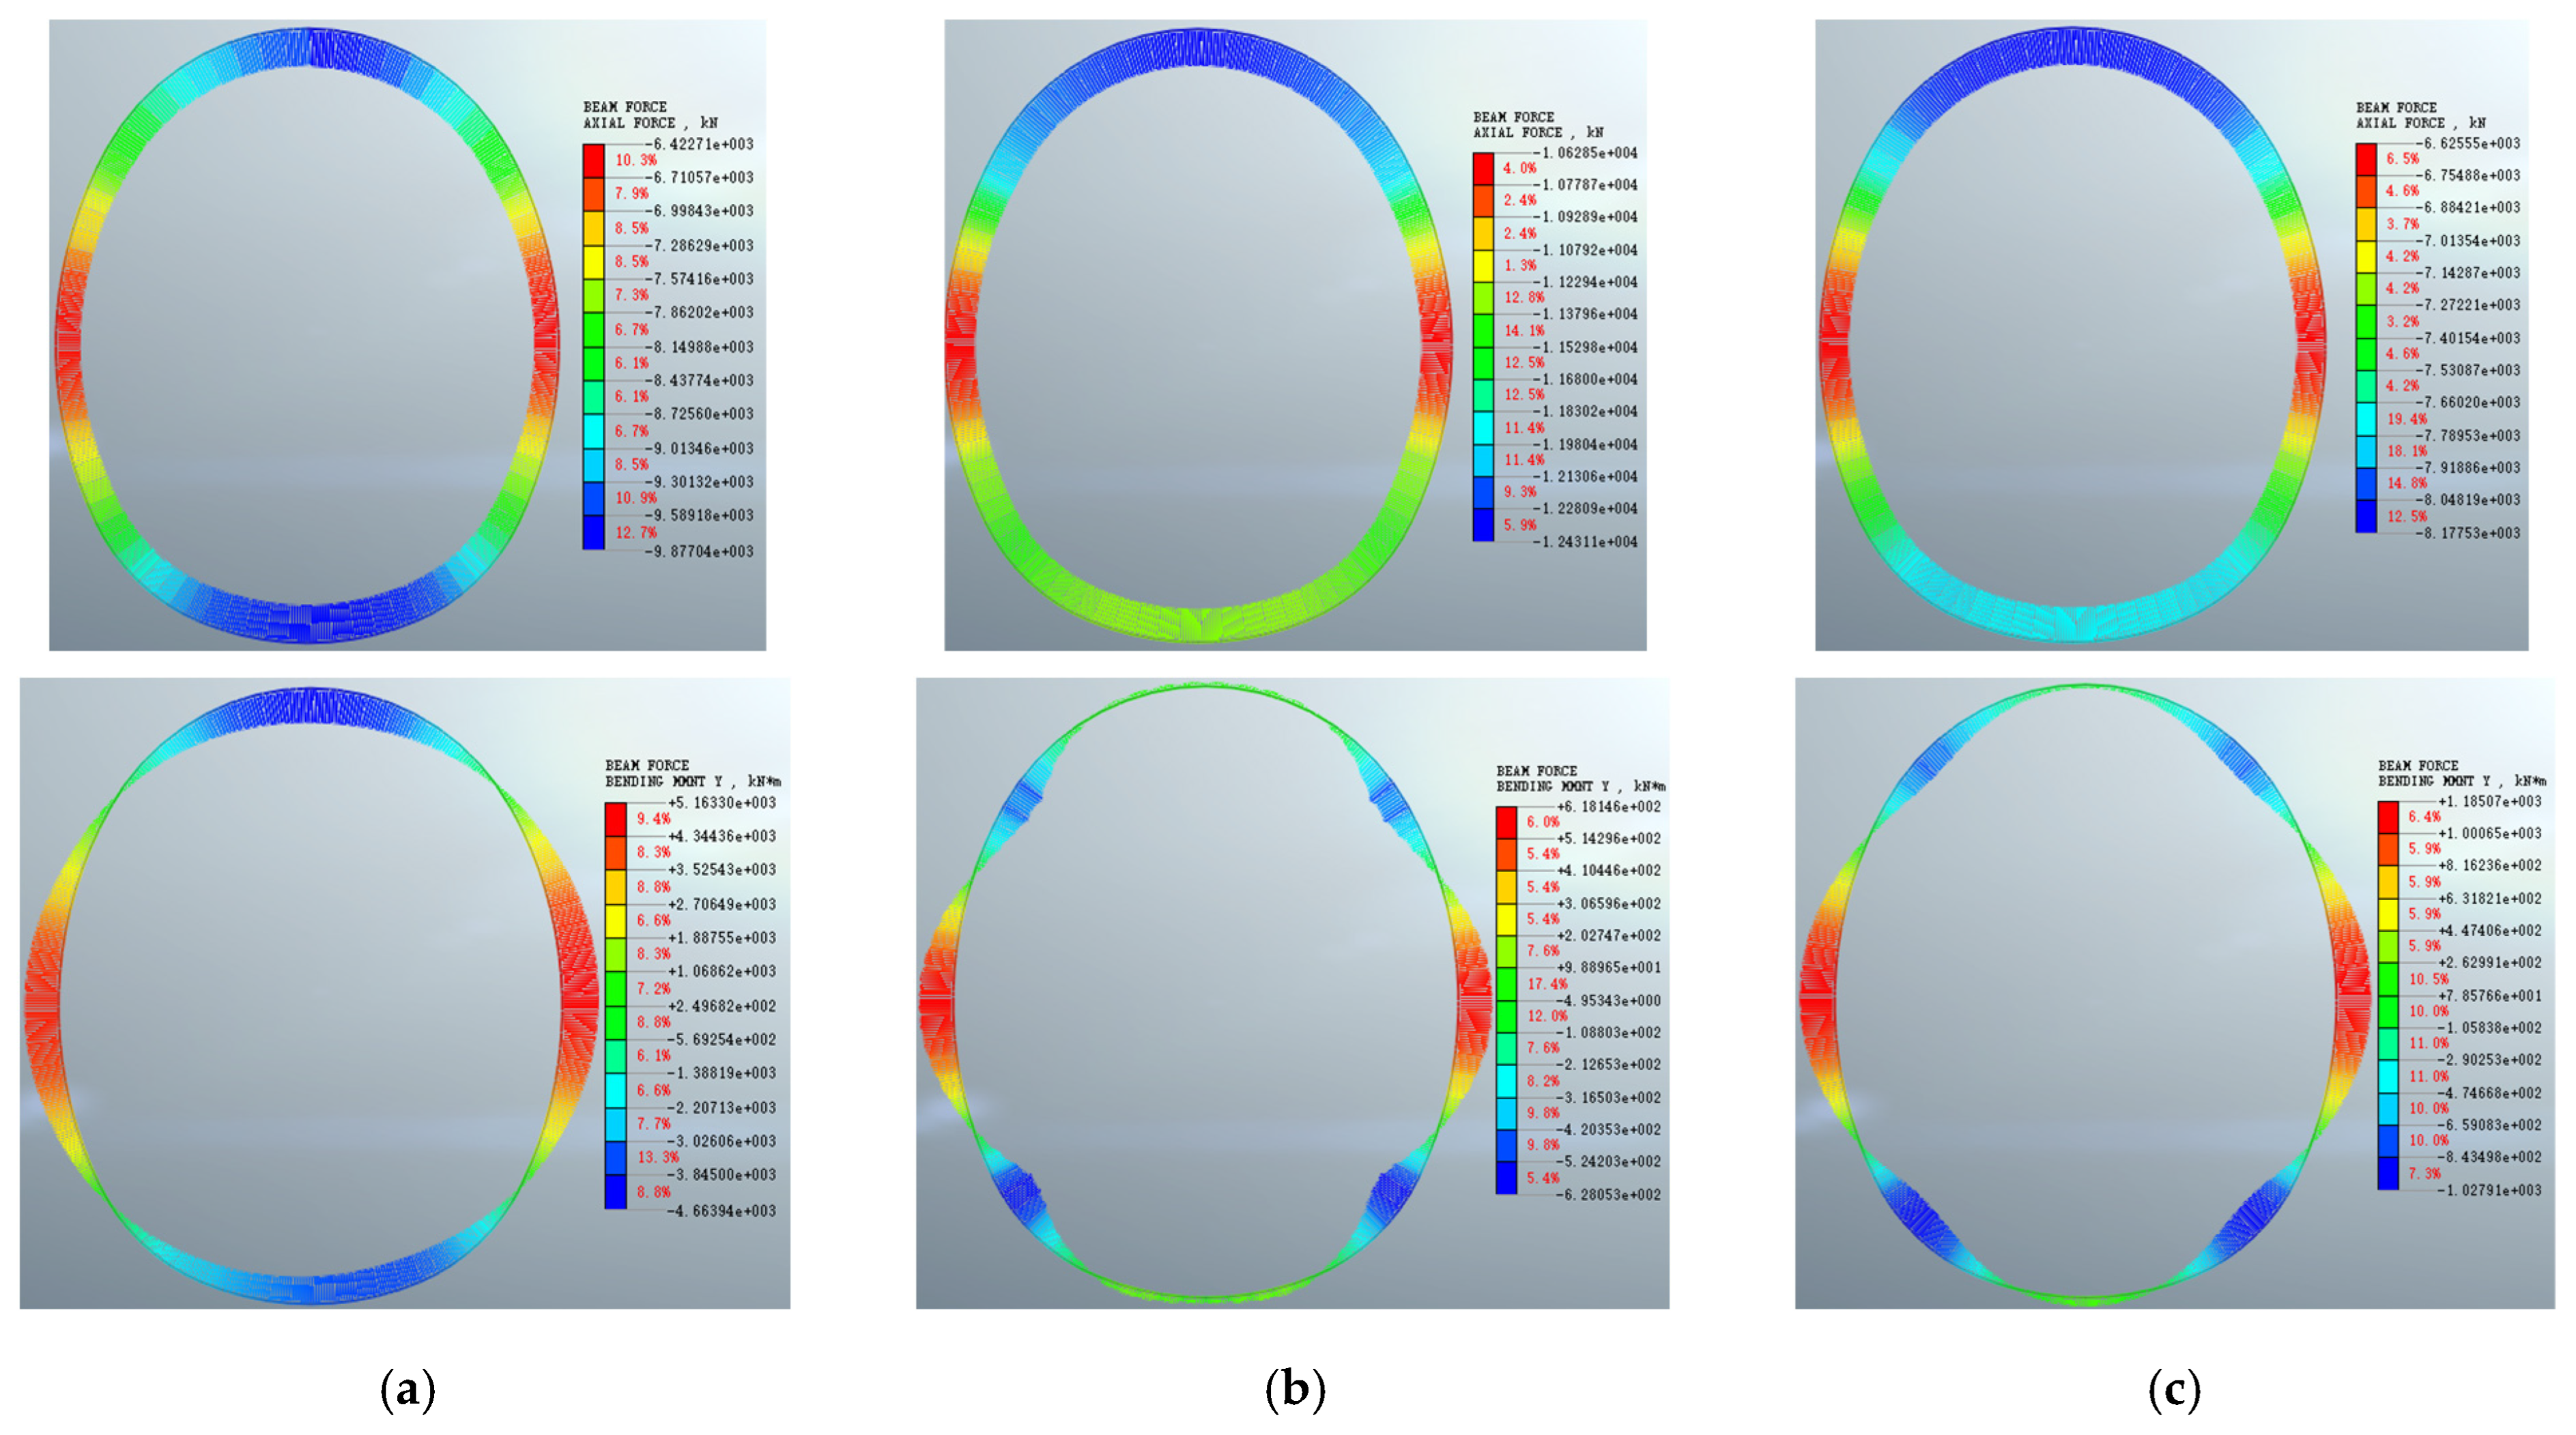
Figure 31.
Axial force and bending moment diagrams of each support structure layer at t = 30 d: (a) rock-anchor bearing arch; (b) shotcrete; (c) secondary lining.
Figure 31.
Axial force and bending moment diagrams of each support structure layer at t = 30 d: (a) rock-anchor bearing arch; (b) shotcrete; (c) secondary lining.
Figure 32.
Axial force and bending moment diagrams of each support structure layer at t = 240 d: (a) rock-anchor bearing arch; (b) shotcrete; (c) secondary lining.
Figure 32.
Axial force and bending moment diagrams of each support structure layer at t = 240 d: (a) rock-anchor bearing arch; (b) shotcrete; (c) secondary lining.
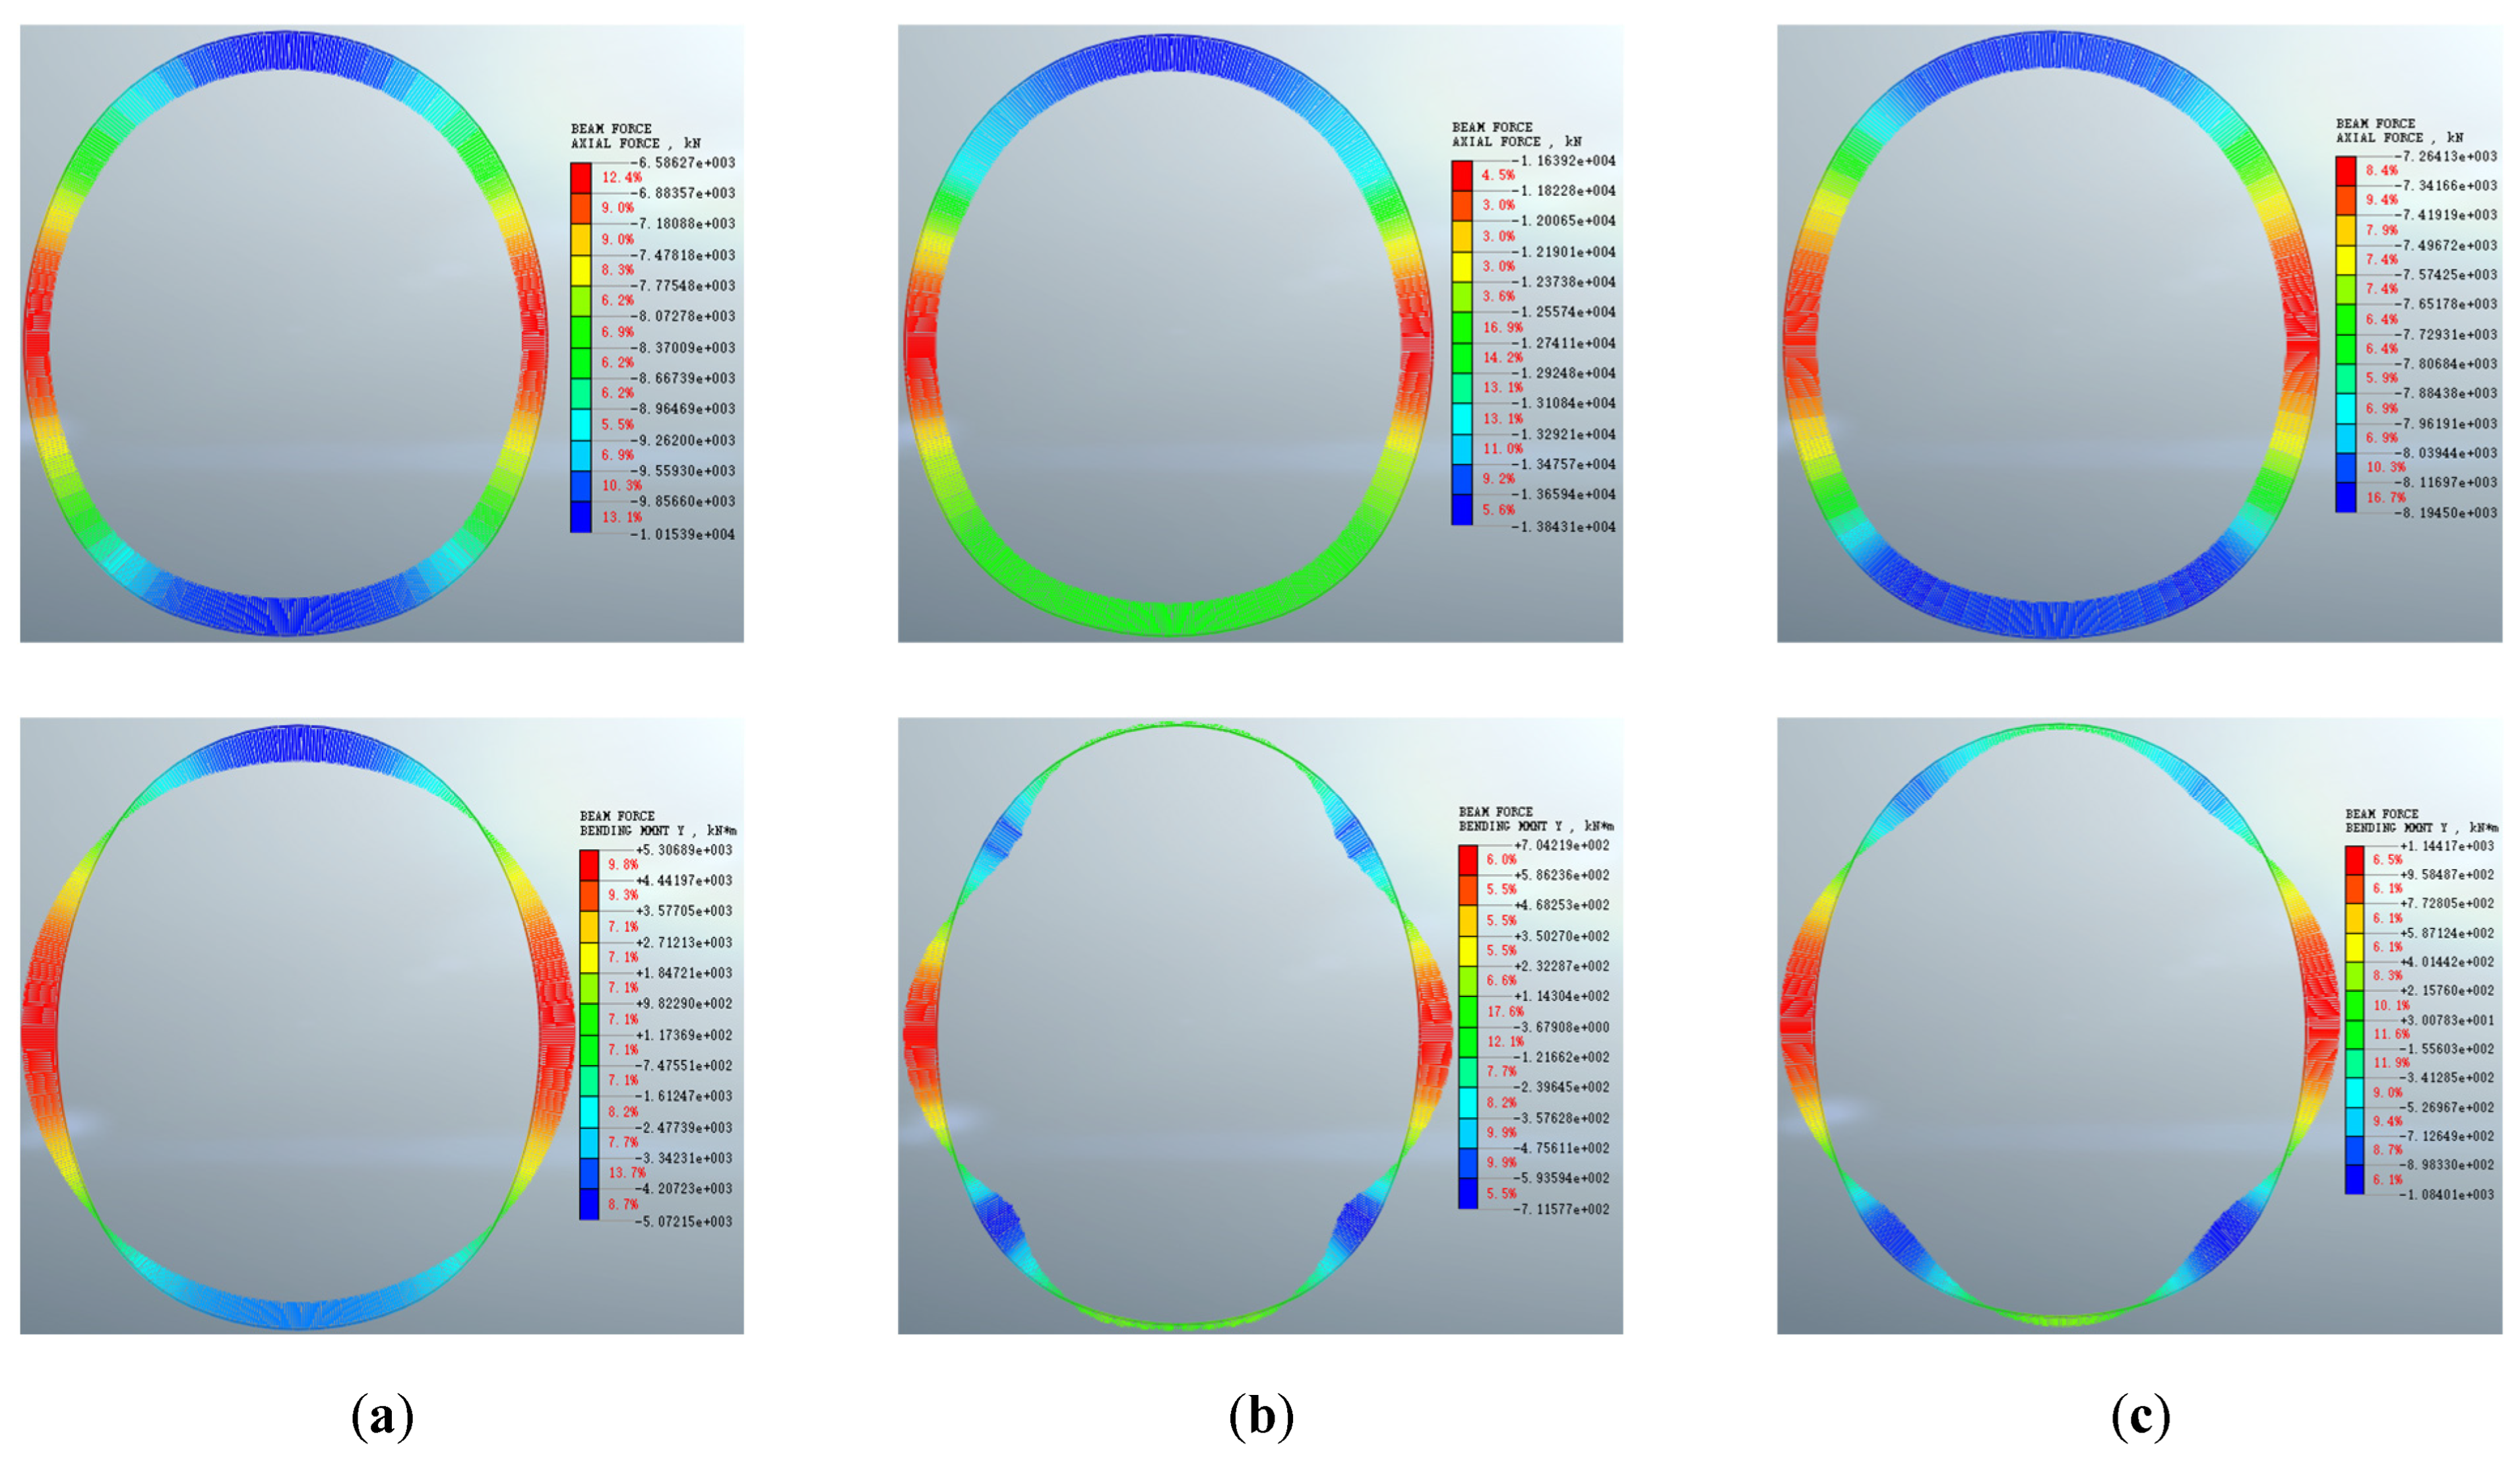
Figure 33.
Axial force and bending moment diagrams of each support structure layer at t = 730 d: (a) rock-anchor bearing arch; (b) shotcrete; (c) secondary lining.
Figure 33.
Axial force and bending moment diagrams of each support structure layer at t = 730 d: (a) rock-anchor bearing arch; (b) shotcrete; (c) secondary lining.
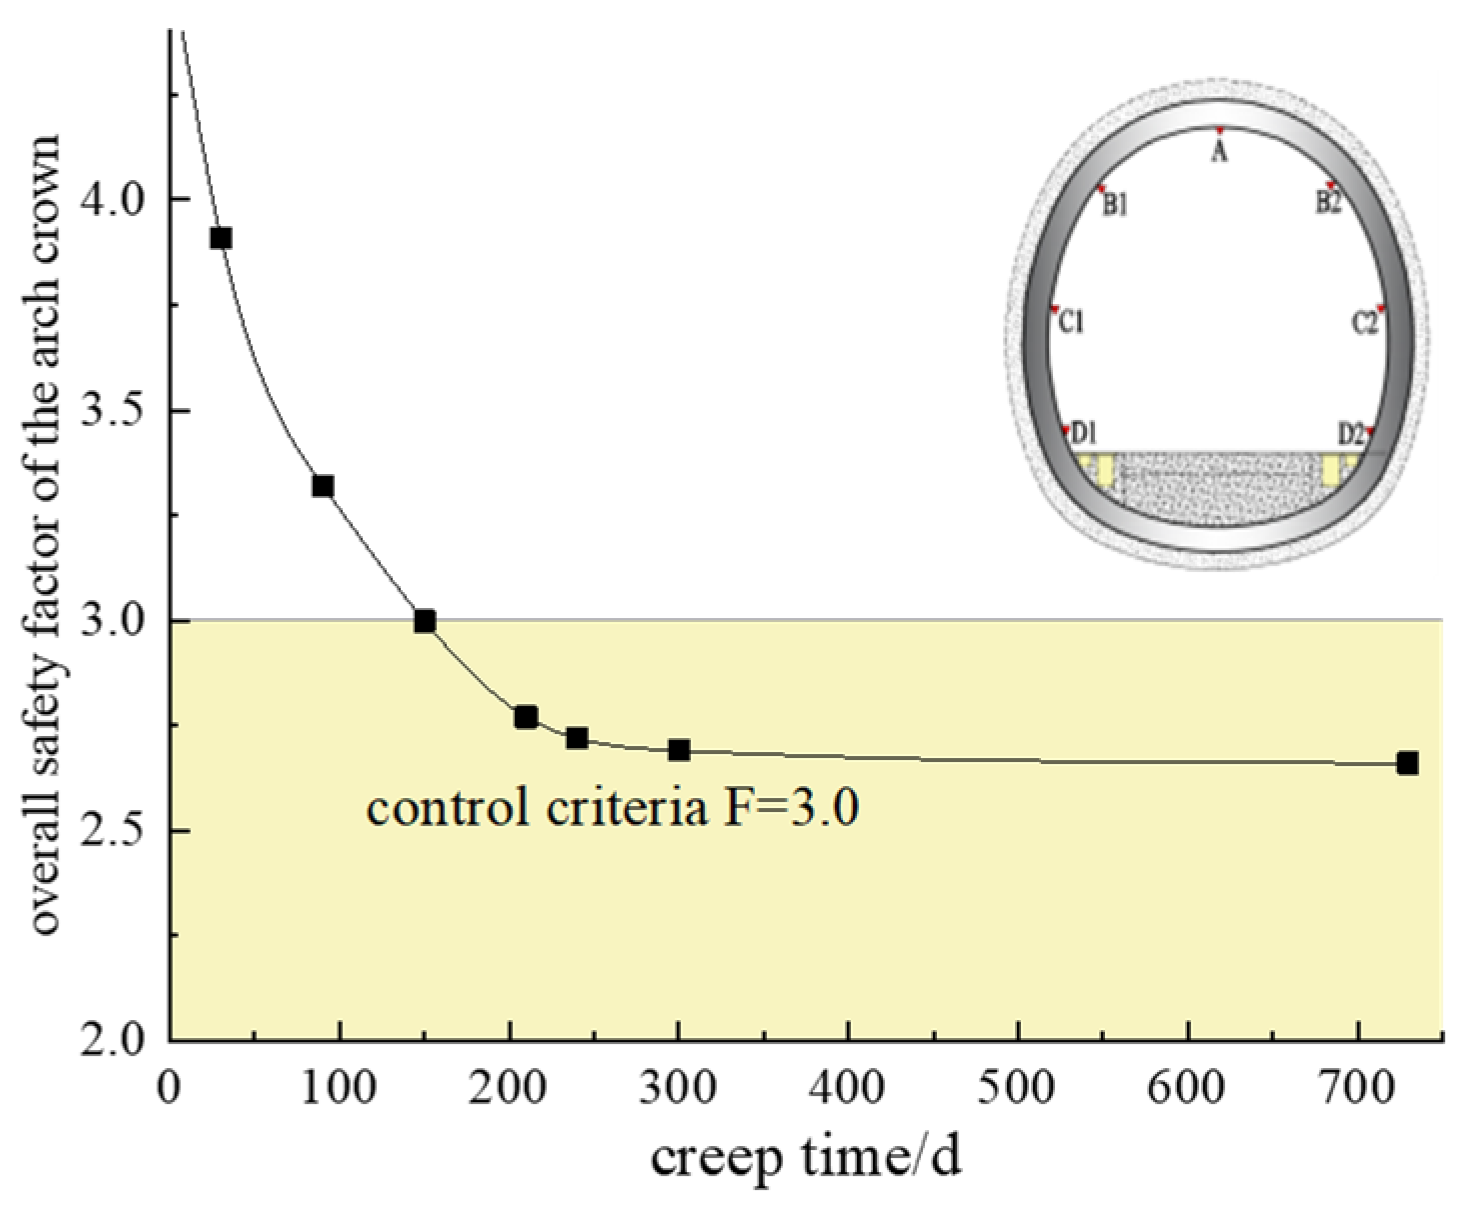
Figure 34.
Time-history evolution curve of the overall safety factor at the crown.
Figure 34.
Time-history evolution curve of the overall safety factor at the crown.
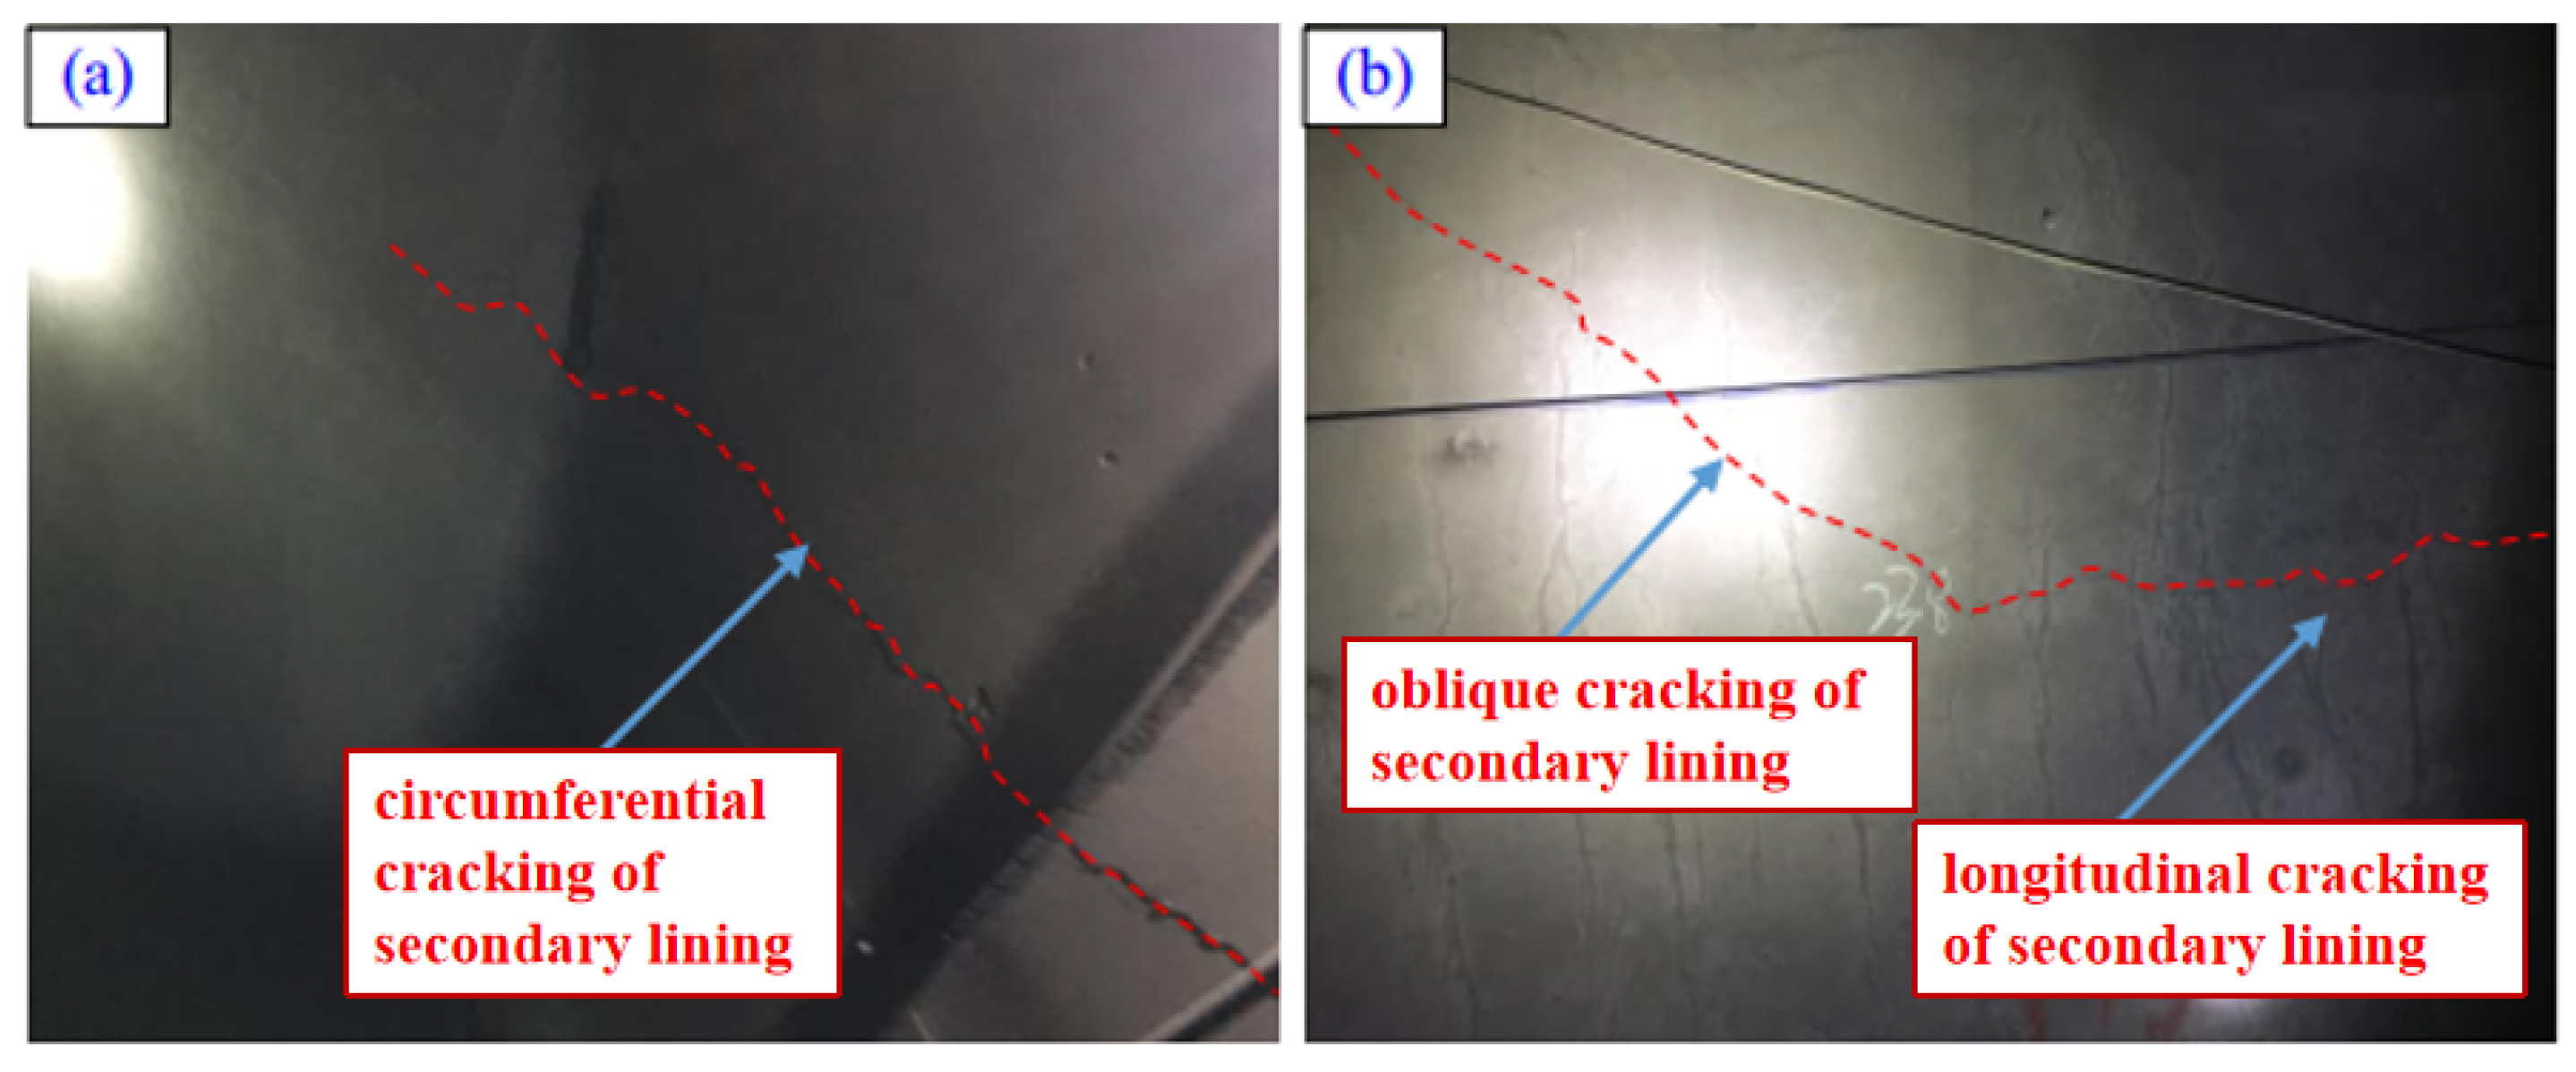
Figure 35.
Cracking phenomenon of secondary lining in Mao County Tunnel, Chengdu-Lanzhou.
Figure 35.
Cracking phenomenon of secondary lining in Mao County Tunnel, Chengdu-Lanzhou.
Table 1.
Comparison of surrounding rock pressure calculation methods.
Table 1.
Comparison of surrounding rock pressure calculation methods.
| NO. | Calculation Method | Influencing Factors | Applicable Types |
|---|
| 1 | Taisha Base Theory | | Loose Pressure |
| 2 | Prouty Theory | |
| 3 | Karko Formula | |
| 4 | Railway Tunnel Design Code | |
| 5 | Fenner Formula | | Plastic Deformation Pressure |
| 6 | Railway Compression-type Surrounding Rock Tunnel Technical Specification | B, S, H |
Table 2.
Clearance displacement control reference values for different deformation levels of surrounding rock (mm).
Table 2.
Clearance displacement control reference values for different deformation levels of surrounding rock (mm).
| Deformation Level | I | II | III |
|---|
| Small and Medium Span (B ≤ 12 m) | 300 | 500 | 700 |
| Large Span (B > 12 m) | 400 | 600 | 800 |
Table 3.
Tunnel arch surrounding rock pressure design value (kPa).
Table 3.
Tunnel arch surrounding rock pressure design value (kPa).
| Burial Depth Conditions | IV | V |
|---|
| 600 m | 279 | 1624 |
| 800 m | 588 | 2968 |
Table 4.
Surrounding rock calculation parameters for soft rock tunnel of Chengdu–Lanzhou Railway.
Table 4.
Surrounding rock calculation parameters for soft rock tunnel of Chengdu–Lanzhou Railway.
| Deformation Level | Unit Weight (kN/m3) | Elastic Modulus (GPa) | Poisson’s Ratio | Internal Friction Angle (°) | Cohesion (MPa) |
|---|
| Slight | 23 | 1.2 | 0.32 | 32 | 2.1 |
| Moderate | 23 | 0.9 | 0.25 | 28 | 1.2 |
| Severe | 23 | 0.5 | 0.21 | 25 | 0.8 |
Table 5.
Reserved deformation of soft rock tunnel in Chengdu–Lanzhou Railway (Unit: cm).
Table 5.
Reserved deformation of soft rock tunnel in Chengdu–Lanzhou Railway (Unit: cm).
| Deformation Level | Slight | Moderate | Severe | Extremely Severe |
|---|
| Single-track Tunnel | 10~20 | 25~30 | 35~45 | >45 |
| Double-track Tunnel | 20~30 | 25~40 | 40~60 | >60 |
Table 6.
Factors and levels for the orthogonal experiment.
Table 6.
Factors and levels for the orthogonal experiment.
| Level | Surrounding Rock Parameters (A) | Tunnel Burial Depth (B) | Lateral Pressure Coefficient (C) | Tunnel Cross-Section Type (D) |
|---|
| 1 | Grade IVa
(Lower 1/3 Fractile per Code) | 400 m | 1.2 | 160 km/h Single-Track |
| 2 | Grade IVb
(Lower 2/3 Fractile per Code) | 600 m | 1.5 | 200 km/h Single-Track |
| 3 | Grade Va
(Lower 1/3 Fractile per Code) | 800 m | 1.7 | 200 km/h Double-Track |
| 4 | Grade Vb
(Lower 2/3 Fractile per Code) | 1000 m | 2.0 | 350 km/h Double-Track |
Table 7.
Calculation results of the design value of surrounding rock pressure.
Table 7.
Calculation results of the design value of surrounding rock pressure.
| Test No. | Surrounding Rock Grade | Burial Depth (m) | Lateral Pressure Coefficient | Cross-Section Type | Design Value of Surrounding Rock Pressure (MPa) |
|---|
| 1 | IVa | 400 | 1.2 | 160 km/h, Single-track | 0.110 |
| 2 | IVa | 600 | 1.5 | 200 km/h, Single-track | 0.217 |
| 3 | IVa | 800 | 1.7 | 200 km/h, Double-track | 0.496 |
| 4 | IVa | 1000 | 2.0 | 350 km/h, Double-track | 0.542 |
| 5 | IVb | 400 | 1.5 | 200 km/h, Double-track | 0.389 |
| 6 | IVb | 600 | 1.2 | 350 km/h, Double-track | 0.480 |
| 7 | IVb | 800 | 2.0 | 160 km/h, Single-track | 0.649 |
| 8 | IVb | 1000 | 1.7 | 200 km/h, Single-track | 1.036 |
| 9 | Va | 400 | 1.7 | 350 km/h, Double-track | 0.994 |
| 10 | Va | 600 | 2.0 | 200 km/h, Double-track | 1.689 |
| 11 | Va | 800 | 1.2 | 200 km/h, Single-track | 1.159 |
| 12 | Va | 1000 | 1.5 | 160 km/h, Single-track | 1.771 |
| 13 | Vb | 400 | 2.0 | 200 km/h, Single-track | 1.358 |
| 14 | Vb | 600 | 1.7 | 160 km/h, Single-track | 1.401 |
| 15 | Vb | 800 | 1.5 | 350 km/h, Double-track | 2.918 |
| 16 | Vb | 1000 | 1.2 | 200 km/h, Double-track | 3.031 |
Table 8.
Sensitivity analysis results.
Table 8.
Sensitivity analysis results.
| Factor | Range (R) | F-Statistic | Sensitivity Ranking |
|---|
| Surrounding Rock Parameters (A) | 7.104 | 13.84 | 1 |
| Tunnel Burial Depth (B) | 3.180 | 5.66 | 2 |
| Tunnel Cross-Section Type (D) | 1.596 | 3.39 | 3 |
| Lateral Pressure Coefficient (C) | 1.258 | 1.86 | 4 |
Table 9.
Model creep parameters.
Table 9.
Model creep parameters.
| K | | | | | C | | |
|---|
| (GPa) | (GPa) | (GPa) | (GPa·h) | (GPa·h) | (MPa) | (°) | (MPa) |
|---|
| 1.89 | 3.32 | 0.38 | 744.2 | 1.06 | 0.6 | 27 | 0.8 |
Table 10.
Model strain softening parameters.
Table 10.
Model strain softening parameters.
Plastic Strain
| 0 | 0.005 | 0.01 | 0.15 | 0.2 |
|---|
| Cohesionc (MPa) | 0.6 | 0.54 | 0.46 | 0.3 | 0.15 |
| Friction Angle | | | | | |
| (°) | 27 | 26.6 | 25.9 | 24.5 | 24 |
Table 11.
Group 1 of creep parameters.
Table 11.
Group 1 of creep parameters.
| K | | | | | C | |
|---|
| (GPa) | (GPa) | (GPa) | (GPa·d) | (GPa·d) | (MPa) | (°) |
|---|
| 1.89 | 0.6 | 2.13 | 185185 | 3819 | 0.15 | 24.67 |
Table 12.
Group 2 of creep parameters.
Table 12.
Group 2 of creep parameters.
| K | | | | | C | |
|---|
| (GPa) | (GPa) | (GPa) | (GPa·d) | (GPa·d) | (MPa) | (°) |
|---|
| 1.89 | 0.9 | 1.5 | 1000 | 7800 | 0.15 | 24.67 |
Table 13.
Minimum support force corresponding to different time periods (MPa).
Table 13.
Minimum support force corresponding to different time periods (MPa).
| Time | t = 0 | t = 0.5 a | t = 1 a | t = 5 a | t = 10 a | t = 30 a | t = 60 a |
|---|
| Group 1 | 1.05 | 1.09 | 1.12 | 1.22 | 1.26 | 1.32 | 1.36 |
| Group 2 | 1.05 | 1.12 | 1.28 | 1.82 | 2.16 | 2.68 | 2.96 |
Table 14.
Creep parameters of the model.
Table 14.
Creep parameters of the model.
| | | | C | | | |
|---|
| (GPa) | (GPa) | (GPa·d) | (GPa·d) | (MPa) | (°) | (MPa) | (kN/m3) |
|---|
| 0.7187 | 1.4778 | 42,000 | 5,800,000 | 0.6 | 27 | 0.176 | 24.5 |
Table 15.
Strain softening parameters of the model.
Table 15.
Strain softening parameters of the model.
Plastic Strain
| 0 | 0.005 | 0.01 | 0.15 | 0.2 |
|---|
| Cohesionc (MPa) | 0.6 | 0.54 | 0.46 | 0.3 | 0.15 |
Friction Angle
(°) | 27 | 26.5 | 25.9 | 24.5 | 24 |
Table 16.
Design values of surrounding rock pressure at different creep times (MPa).
Table 16.
Design values of surrounding rock pressure at different creep times (MPa).
| Creep Time | t = 30 d | t = 90 d | t = 150 d | t = 210 d | t = 240 d | t = 300 d | t = 730 d |
|---|
| Anchor Rock Bearing Arch and Shotcrete Layer | Vertical Load | 1.232 | 1.442 | 1.526 | 1.554 | 1.564 | 1.575 | 1.597 |
| Horizontal Load | 1.478 | 1.73 | 1.831 | 1.865 | 1.877 | 1.89 | 1.917 |
| Secondary Lining | Vertical Load | 0.825 | 0.966 | 1.022 | 1.041 | 1.048 | 1.055 | 1.07 |
| Horizontal Load | 0.991 | 1.159 | 1.227 | 1.249 | 1.257 | 1.266 | 1.284 |
Table 17.
Calculation parameters of shotcrete and secondary lining.
Table 17.
Calculation parameters of shotcrete and secondary lining.
| Structure Type | Thickness (cm) | Concrete Grade | Elastic Modulus (GPa) | Poisson’s Ratio | Material Density (kg/m3) | Foundation Stiffness Coefficient (MPa/m) |
|---|
| Shotcrete | 28 | C25 | 30 | 0.2 | 2300 | 120 |
| Secondary Lining | 60 | C35 | 32.5 | 0.2 | 2400 | 120 |
Table 18.
Axial force and bending moment of support structures at different creep times.
Table 18.
Axial force and bending moment of support structures at different creep times.
| Creep Time | Rock-Anchor Bearing Arch | Shotcrete | Secondary Lining |
|---|
| Axial Force (kN) | Bending Moment (kN·m) | Axial Force (kN) | Bending Moment (kN·m) | Axial Force (kN) | Bending Moment (kN·m) |
|---|
| t = 30 d | 8008 | −3688.54 | 9881 | 11.71 | 5565 | −19.18 |
| t = 90 d | 9315 | −4373.36 | 10,887 | 3.33 | 6509 | −93.92 |
| t = 150 d | 9867 | −4646.28 | 11,409 | 4.85 | 7307 | −142.93 |
| t = 210 d | 9878 | −4934.72 | 11,615 | 8.75 | 8123 | −174.06 |
| t = 240 d | 9887 | −4963.94 | 12,431 | 19.89 | 8178 | −175.12 |
| t = 300 d | 9896 | −4985.49 | 13,106 | 30.56 | 8225 | −175.56 |
| t = 730 d | 10,153 | −5072.15 | 13,843 | 38.62 | 8353 | −177.25 |
Table 19.
Overall safety factor of support structures at different creep times.
Table 19.
Overall safety factor of support structures at different creep times.
| Creep Time | Rock-Anchor Bearing Arch | Shotcrete | Secondary Lining | Overall Safety Factor |
|---|
| t = 30 d | 0.81 | 0.67 | 2.8 | 3.91 |
| t = 90 d | 0.67 | 0.54 | 2.4 | 3.32 |
| t = 150 d | 0.511 | 0.515 | 2.135 | 2.998 |
| t = 210 d | 0.485 | 0.506 | 1.92 | 2.77 |
| t = 240 d | 0.481 | 0.473 | 1.907 | 2.72 |
| t = 300 d | 0.478 | 0.458 | 1.896 | 2.69 |
| t = 730 d | 0.476 | 0.446 | 1.876 | 2.66 |
