Synthetic Data Generation Methodology for Construction Machinery Assembly Optimization
Abstract
1. Introduction
1.1. General Background
1.2. Literature Review
1.3. Research Gap
1.4. Research Aim and Objectives
1.5. Novelty and Contribution
1.6. Structure of the Paper
2. Methods and Models
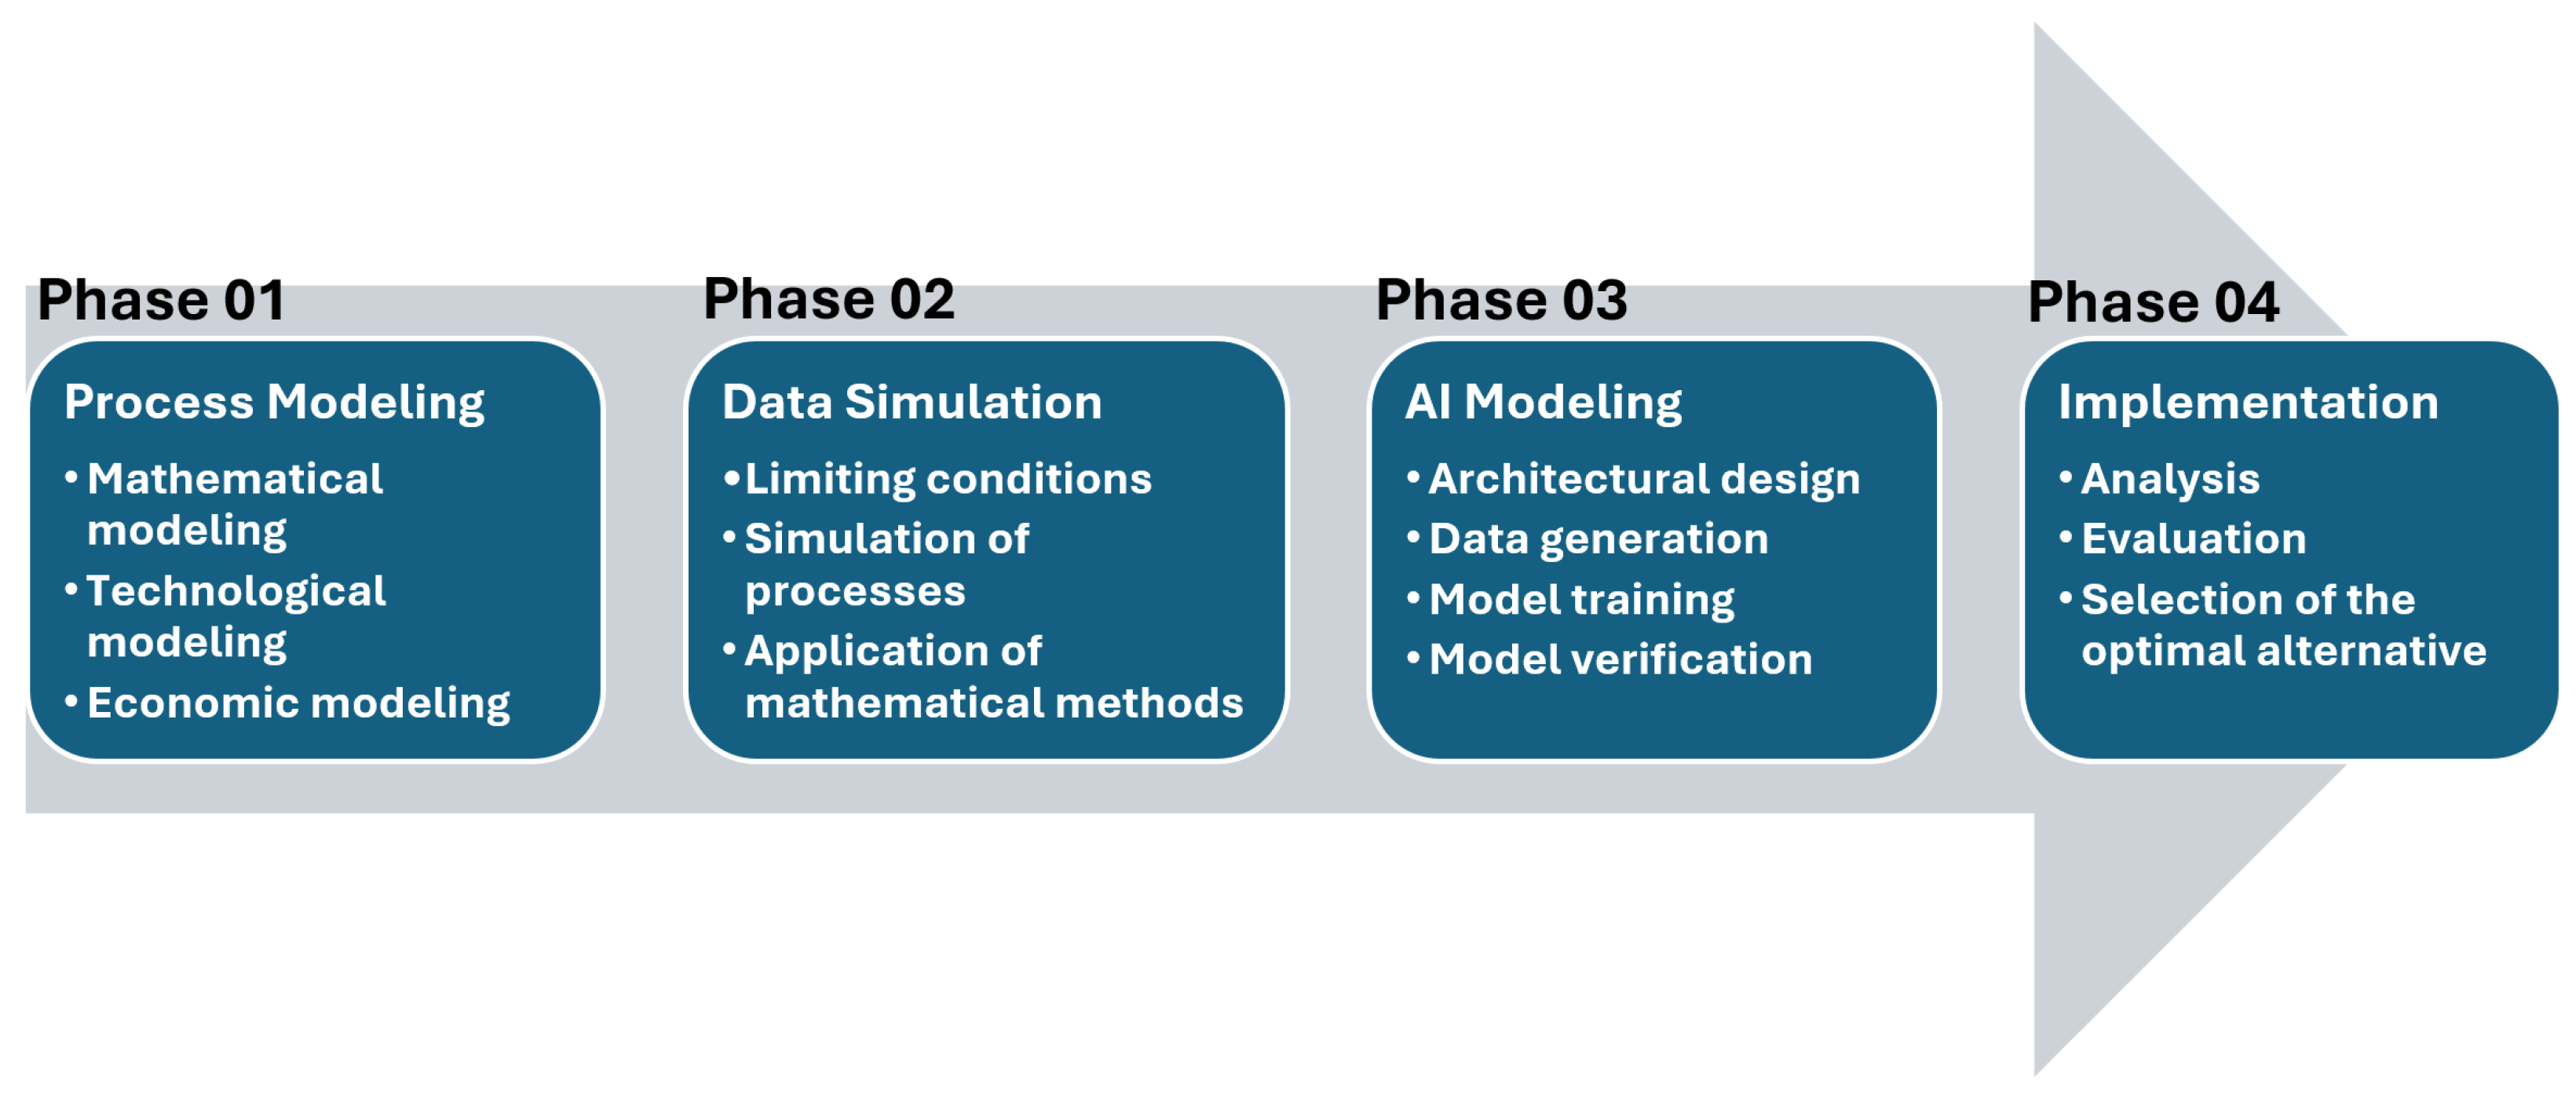
- Phase 01: The modeling of construction processes (mathematical, economic, and technological analysis of the problem, as well as the analysis of the social behavior of the production system).
- Phase 02: The simulation of synthetic data for AI training (the definition of limiting constraints, the application of mathematical methods such as queueing theory and the Monte Carlo method, and the simulation of processes).
- Phase 03: AI modeling (design of architecture and neural network, generation of synthetic data, training, and verification).
- Phase 04: The implementation of the AI model (analysis, evaluation of results, and selection of the optimal variant).
3. Generation of Synthetic Data for Model Optimization
- Task parameters: Task volume, start and completion dates, maximum available working area, shift length, variable costs, and machine productivity coefficients according to project complexity.
- Machine parameters (machine catalog): Average machine performance, average cycle time, maximum available number of units, minimum working area, variable cost, fixed cost, probability of failure, mean time to repair, average cost of failure removal, energy consumption, and CO2 emissions.
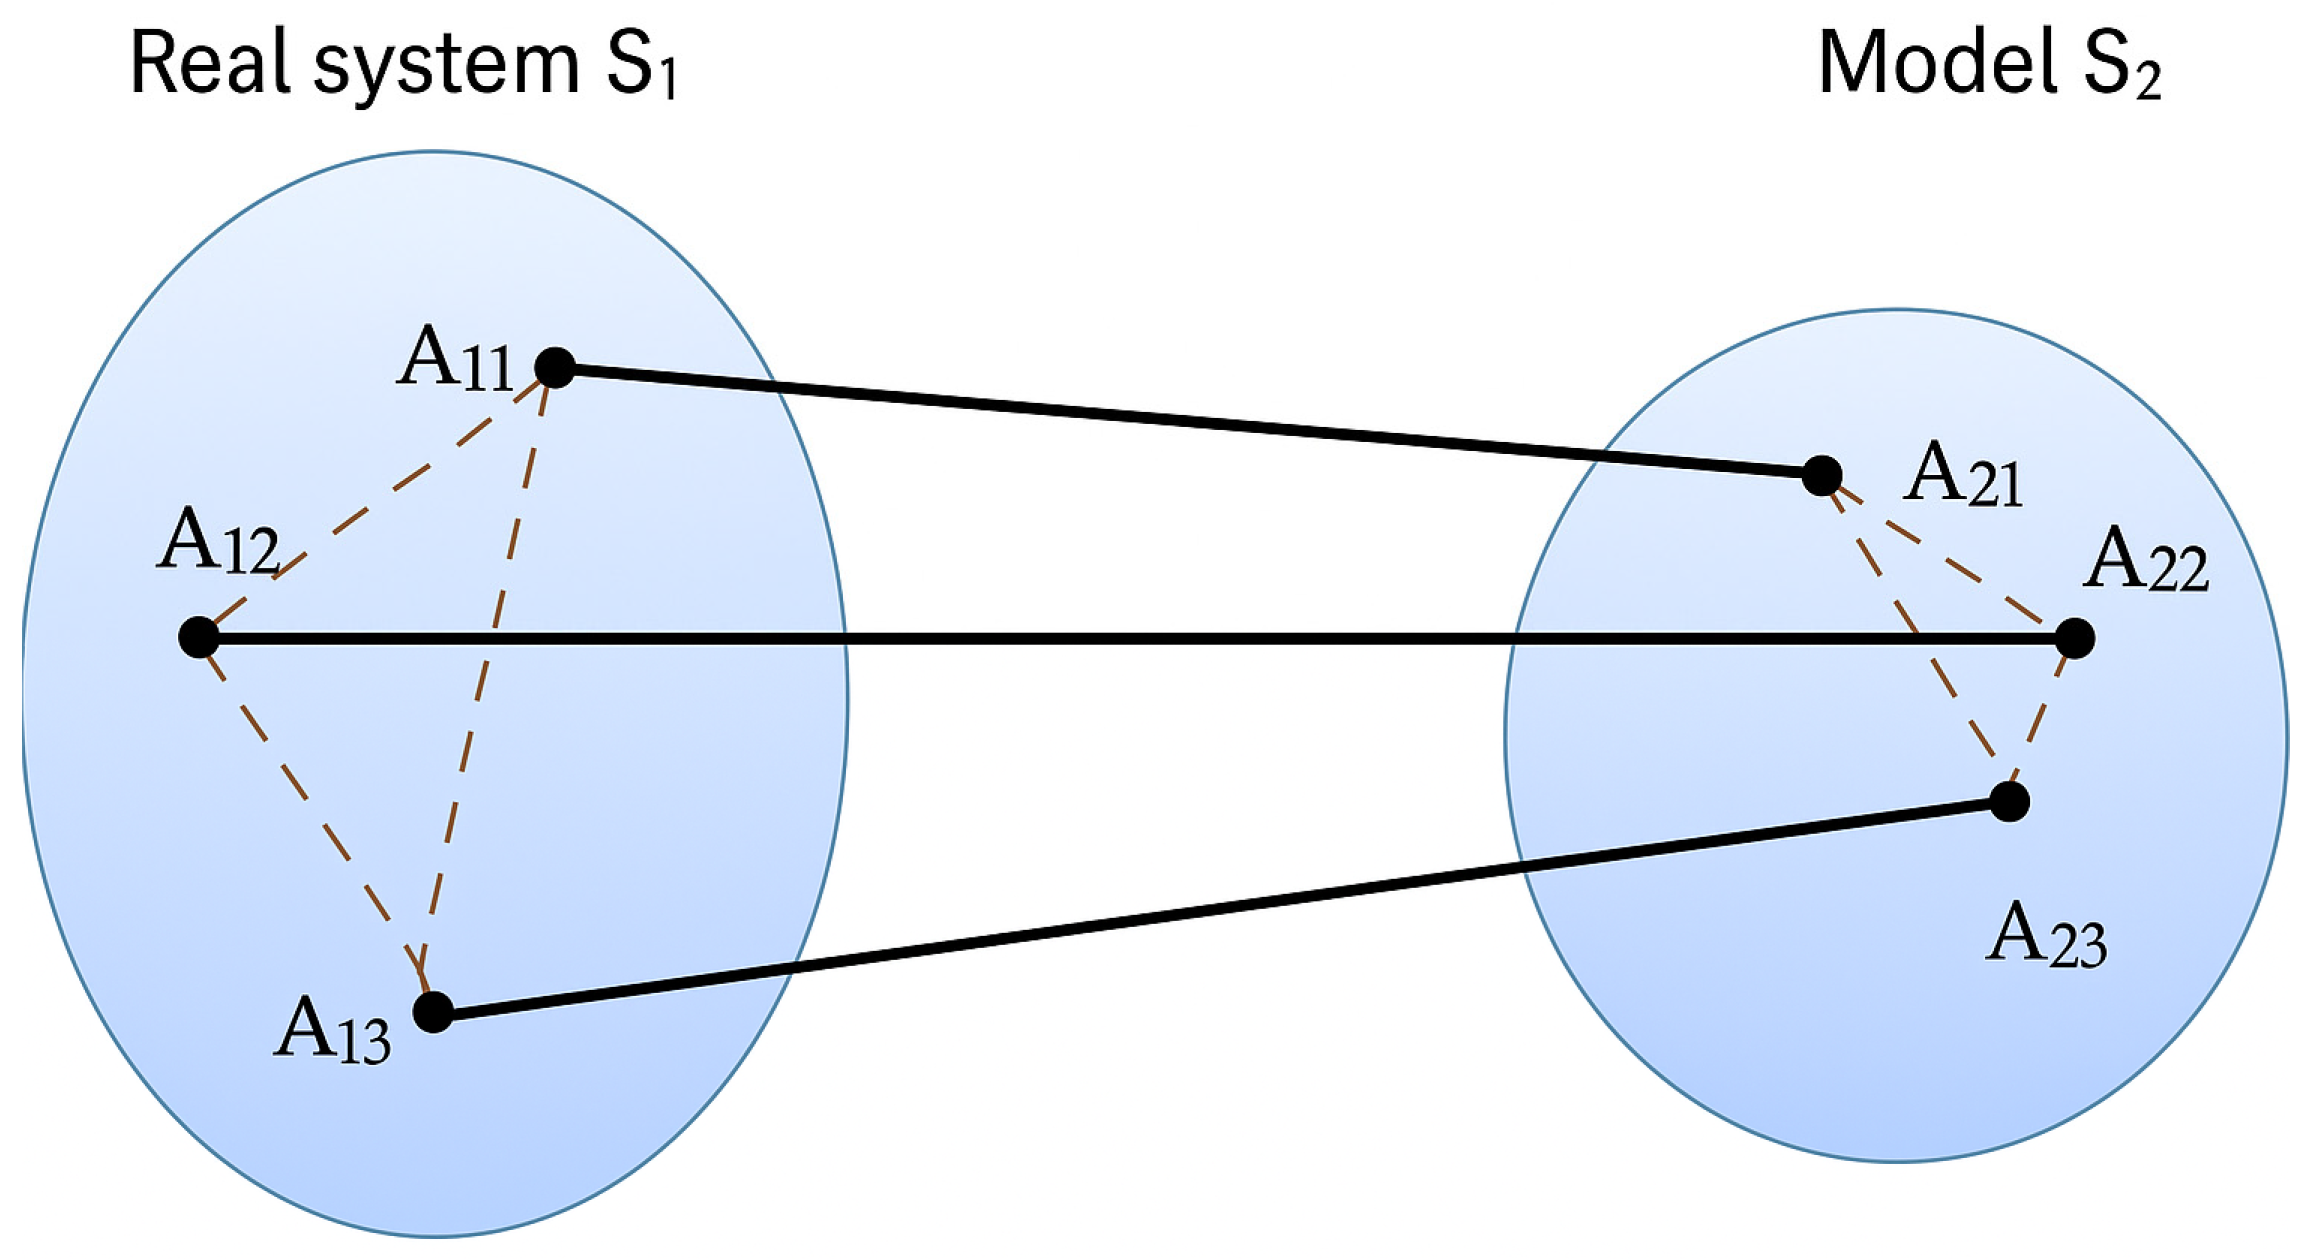
- Kendall’s classification of queueing systems (X/Y/c) for data generation [51].
- Stochastic parameters: Randomness of failures, randomness of weather conditions, randomness of traffic complications, randomness of emergency states, and randomness of human factors.
4. Verification and Validation of Synthetic Data
5. Conclusions
- High computational efficiency that is capable of generating tens of millions of records.
- The implementation of queueing theory and Monte Carlo simulations to model stochastic construction processes.
- Practical verification on 10 real construction projects, where the maximum deviation between synthetic and real data did not exceed 13%.
- Each large-scale project comprises between three and seven independent construction tasks. For each task, real-world data were independently collected and evaluated. In total, 49 comparisons were conducted, and the outcomes were aggregated and synthesized into ten consolidated project-level records.
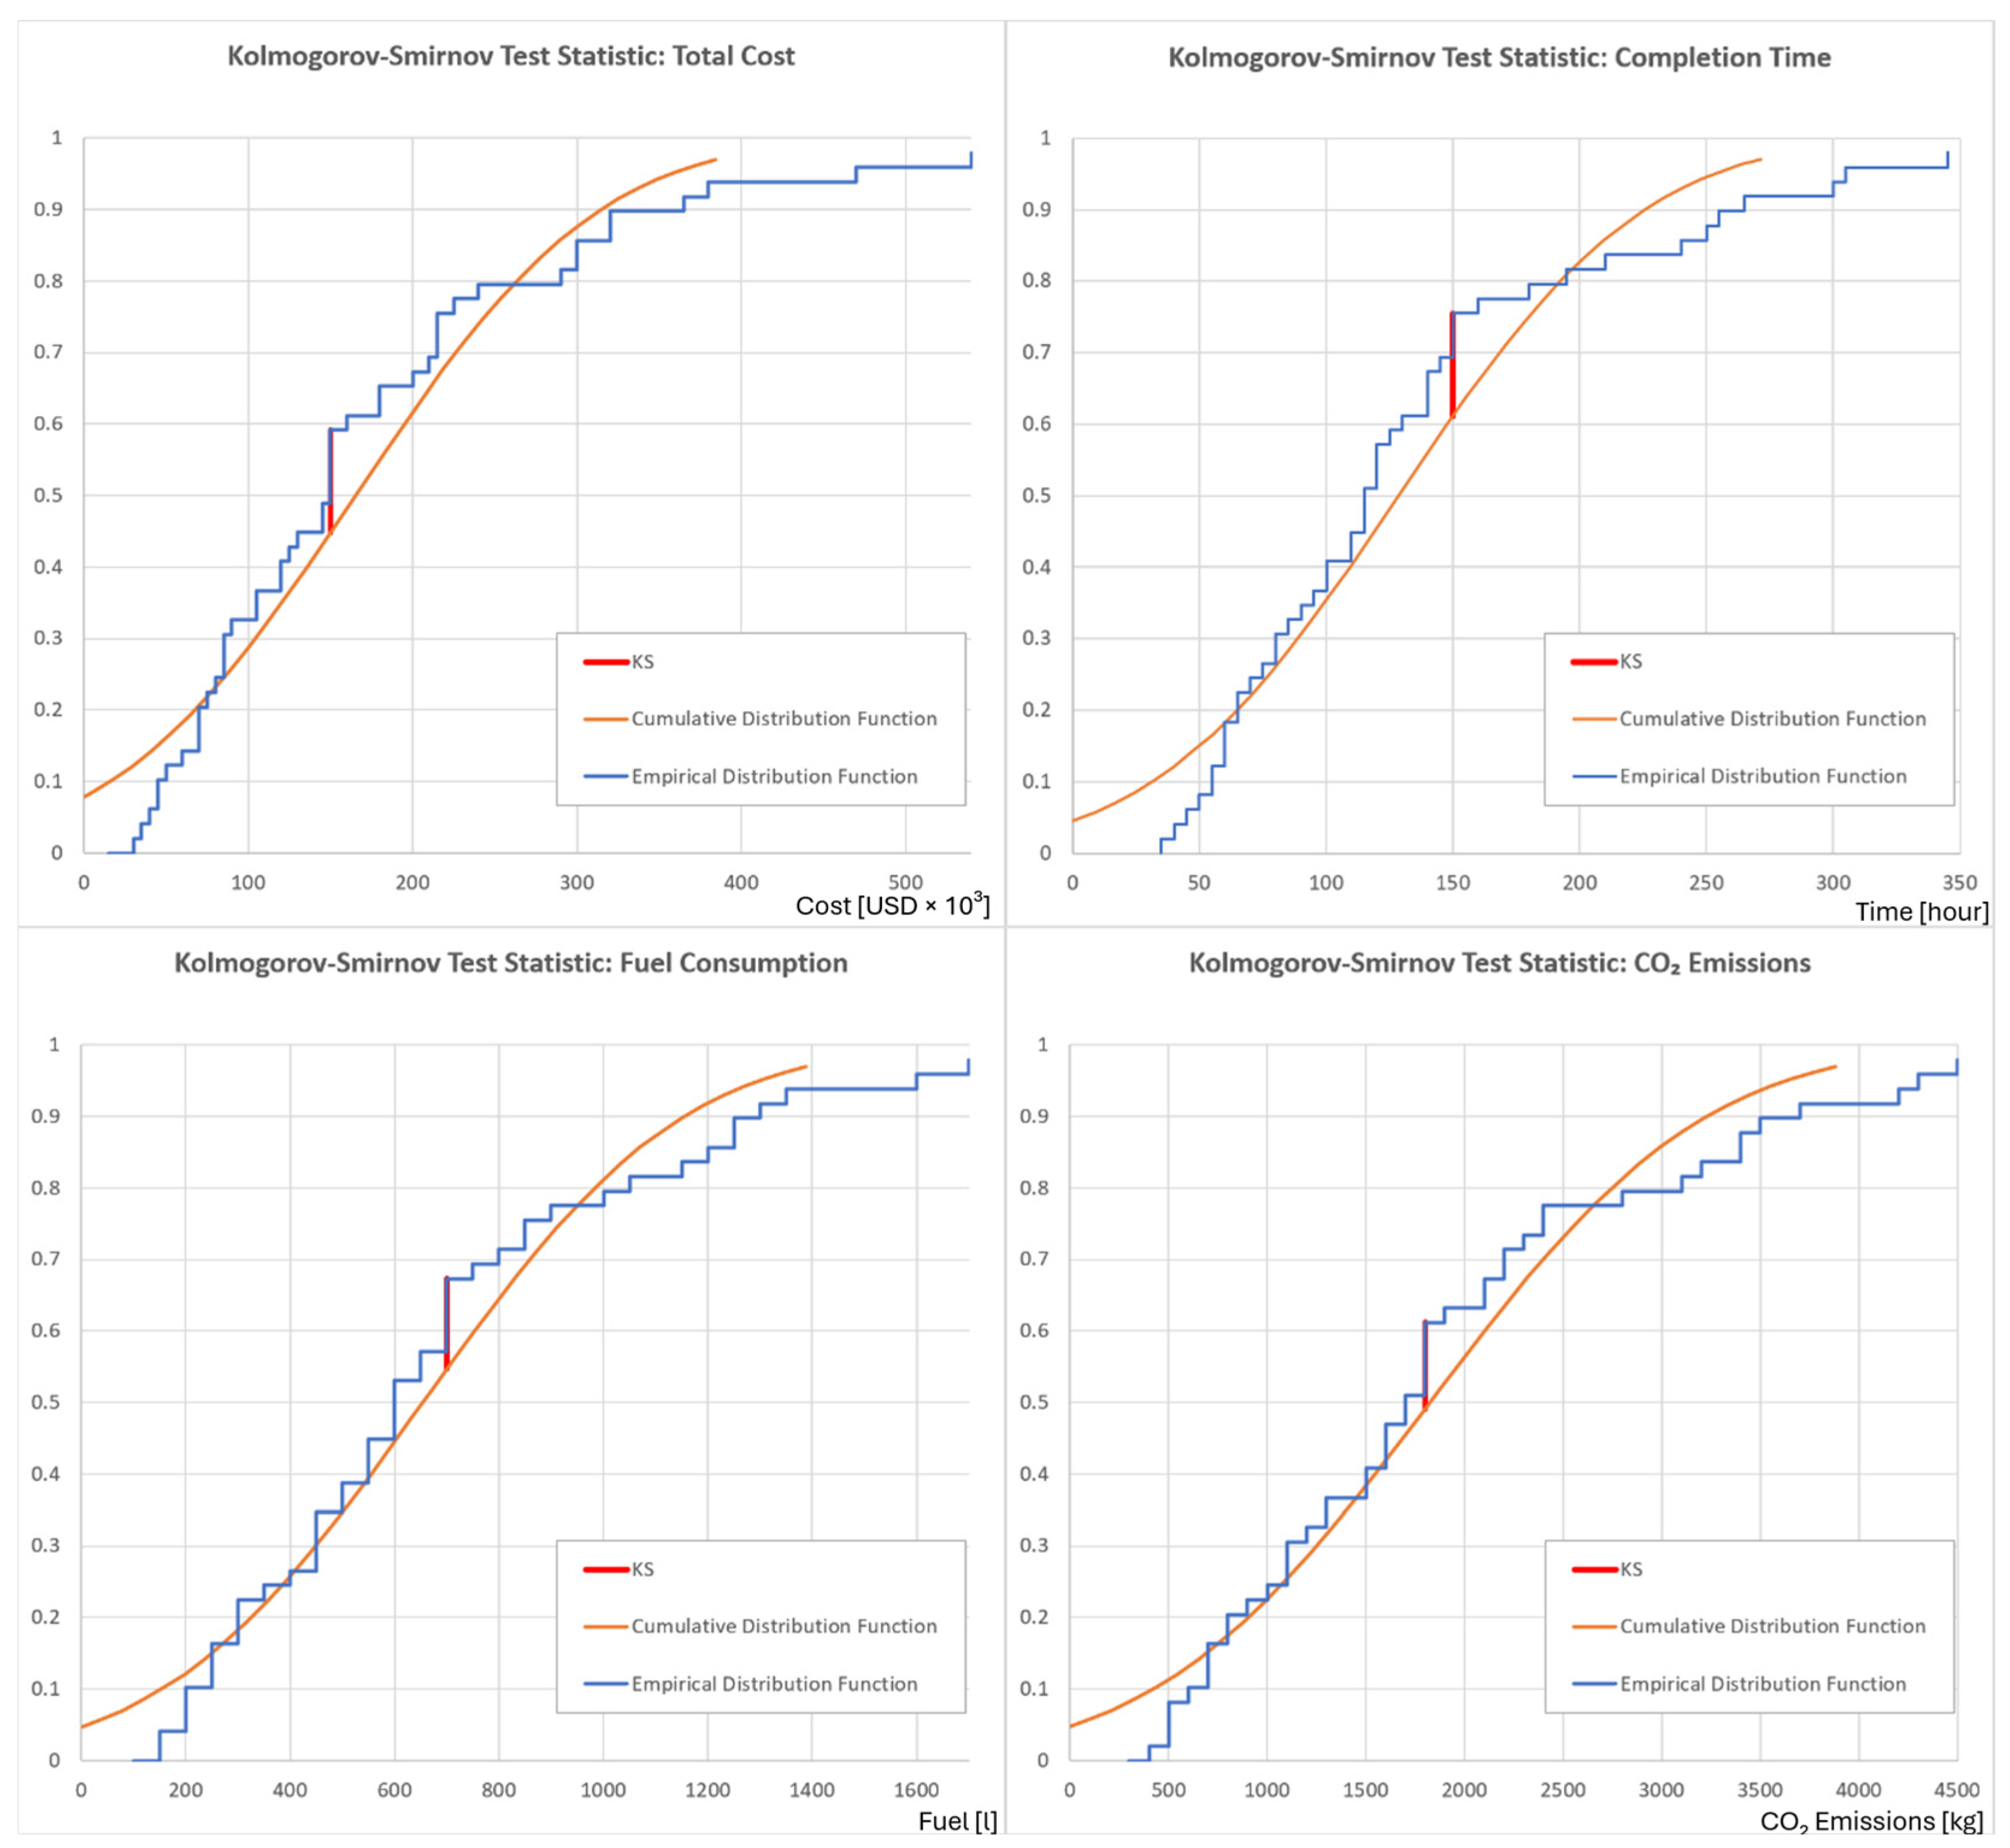
- Based on statistical verification using correlation analysis (R2, Pearson correlation), comparison of key statistical indicators (RMSE, F-test), and the Kolmogorov–Smirnov test, the generated synthetic data demonstrate good model performance for Total Cost (R2 = 0.96), CO2 Emissions (0.93), Fuel Consumption (0.90), and Completion Time (0.87). However, the model shows poor performance for the Number of Failures, as indicated by a low R2 value, weak correlation, lack of statistical significance, and non-normal residuals.
6. Discussion
6.1. Limitations
- The mathematical model relies on simplifications that may not fully capture the complexity of real construction processes.
- Verification has so far been limited to 10 construction projects (49 tasks), restricting the generalizability of the findings.
- The current set of optimization indicators, while comprehensive, may not fully cover all relevant factors in diverse construction contexts.
- The generator does not incorporate an economic model that accounts for the marginal cost associated with each additional resource. Consequently, the model operates without estimating these marginal costs, which does not fully represent real-world conditions and could be improved in future work.
6.2. Future Directions
- Refining the mathematical framework to better approximate actual technological processes and improve generation ability for metric Number of Failure.
- Expanding verification to a broader set of construction projects to demonstrate universality and robustness.
- Incorporating additional optimization criteria, including advanced environmental indicators and safety parameters.
- Validate the model results through cross-national comparisons to enhance external validity.
- Validate the model results through model-based testing (utility testing) and expert review.
- Examine and compare alternative algorithms for generating synthetic data in construction processes (e.g., Markov chains).
6.3. Implications and Significance
6.4. Legal and Ethical Positioning of Synthetic Data
Funding
Data Availability Statement
Conflicts of Interest
Abbreviations
| AI | Artificial intelligence |
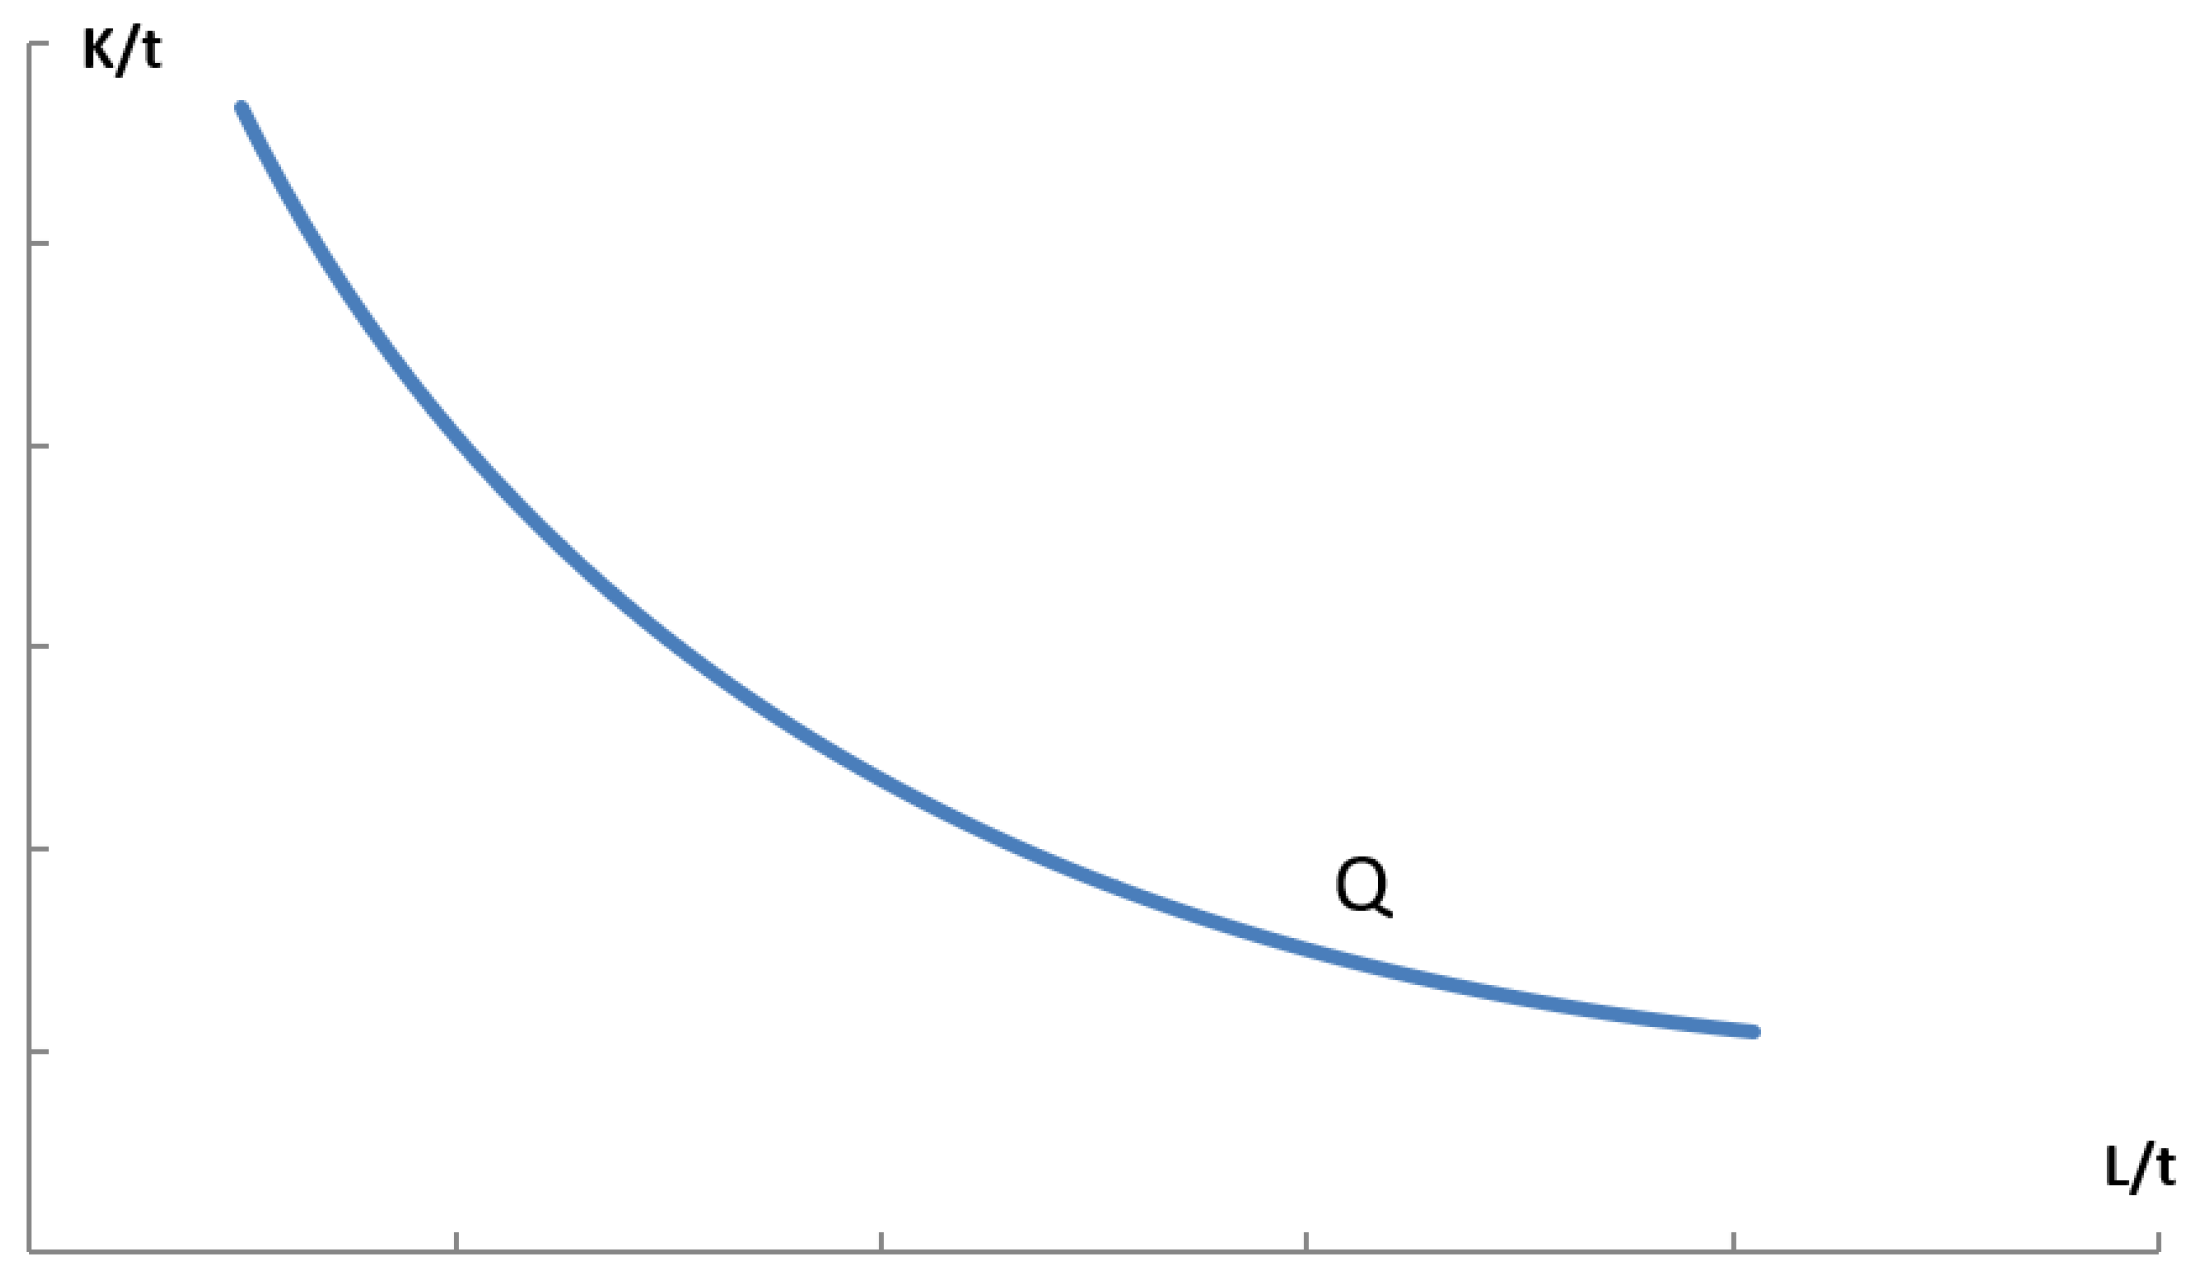
| MRTS | Marginal rate of technical substitution |
| MP | Marginal product |
| PHP | Personal home page |
| FIFO | FIFO principle (first in–first out) |
| RMSE | Root mean square error |
| F-test | Fisher’s test of variance |
| K–S test | Kolmogorov–Smirnov test |
| R2 | Coefficient of determination |
| CO2 | Carbon dioxide |
| GDPR | General Data Protection Regulation |
Appendix A
- Construction process: Excavation works and foundation pit.
- The total soil volume is therefore calculated as follows:
| Parameter | Value |
|---|---|
| Load capacity, m3 | 15 |
| Average travel time (travel loop 25 km), min | 40 |
| Average unloading time, min | 2 |
| Average loading time, min | 15 60/P |
| Fixed costs, CZK | 3000 |
| Variable costs, CZK/hour | 1000 |
| Probability of failure, %/day | 2 |
| Average repair time, min | 60 |
| Maximum number of dumpers | 15 |
| Parameter | Value |
|---|---|
| Bucket capacity, m3 | 2 |
| Average cycle time, min | 0.83 |
| Average productivity , m3/h | 100 |
| Fixed costs, CZK | 5000 |
| Variable costs, CZK/hour | 2000 |
| Probability of failure, %/day | 2 |
| Average repair time, min | 60 |
- Service intensity:
- Arrival intensity:
- System load factor:
| n | ρ | S (n·ρ) | V | L | M | I | N | TF [min] | TC [min] | T [min] | Q [m3] |
|---|---|---|---|---|---|---|---|---|---|---|---|
| 1 | 0.1440 | 1.144 | 0.8740 | 0.8740 | 0.1259 | 0.1259 | 0.0000 | 0.0000 | 48.11 | 36,083 | 998 |
| 2 | 0.2881 | 1.3296 | 0.8604 | 1.7208 | 0.2791 | 0.2479 | 0.0312 | 0.7628 | 48.87 | 18,327 | 1964 |
| 3 | 0.4321 | 1.5746 | 0.8444 | 2.5332 | 0.4667 | 0.3649 | 0.1018 | 1.6909 | 49.80 | 12,450 | 2892 |
| 4 | 0.5762 | 1.9073 | 0.8255 | 3.3022 | 0.6977 | 0.4757 | 0.2220 | 2.8278 | 50.94 | 9551 | 3769 |
| 5 | 0.7202 | 2.3738 | 0.8034 | 4.0174 | 0.9825 | 0.5787 | 0.4038 | 4.2271 | 52.34 | 7851 | 4586 |
| 6 | 0.8643 | 3.0518 | 0.7778 | 4.6670 | 1.3329 | 0.6723 | 0.6606 | 5.9525 | 54.06 | 6758 | 5327 |
| 7 | 1.0084 | 4.0775 | 0.7484 | 5.2391 | 1.7608 | 0.7547 | 1.0060 | 8.0750 | 56.19 | 6020 | 5980 |
| 8 | 1.1524 | 5.6993 | 0.7154 | 5.7235 | 2.2764 | 0.8245 | 1.4518 | 10.667 | 58.78 | 5510 | 6533 |
| 9 | 1.2965 | 8.3893 | 0.6793 | 6.1141 | 2.8858 | 0.8808 | 2.0050 | 13.790 | 61.90 | 5158 | 6979 |
| 10 | 1.4405 | 13.085 | 0.6411 | 6.4110 | 3.5889 | 0.9235 | 2.6653 | 17.482 | 65.59 | 4919 | 7318 |
| 11 | 1.5846 | 21.736 | 0.6020 | 6.6222 | 4.3777 | 0.9539 | 3.4237 | 21.741 | 69.85 | 4763 | 7559 |
| 12 | 1.7287 | 38.575 | 0.5634 | 6.7616 | 5.2383 | 0.9740 | 4.2643 | 26.520 | 74.63 | 4664 | 7718 |
| 13 | 1.8727 | 73.244 | 0.5266 | 6.8467 | 6.1532 | 0.9863 | 5.1668 | 31.734 | 79.84 | 4606 | 7815 |
| 14 | 2.0168 | 148.72 | 0.4924 | 6.8948 | 7.1051 | 0.9932 | 6.1118 | 37.276 | 85.39 | 4574 | 7870 |
| 15 | 2.1608 | 322.37 | 0.4613 | 6.9200 | 8.0799 | 0.9968 | 7.0830 | 43.042 | 91.15 | 4558 | 7899 |
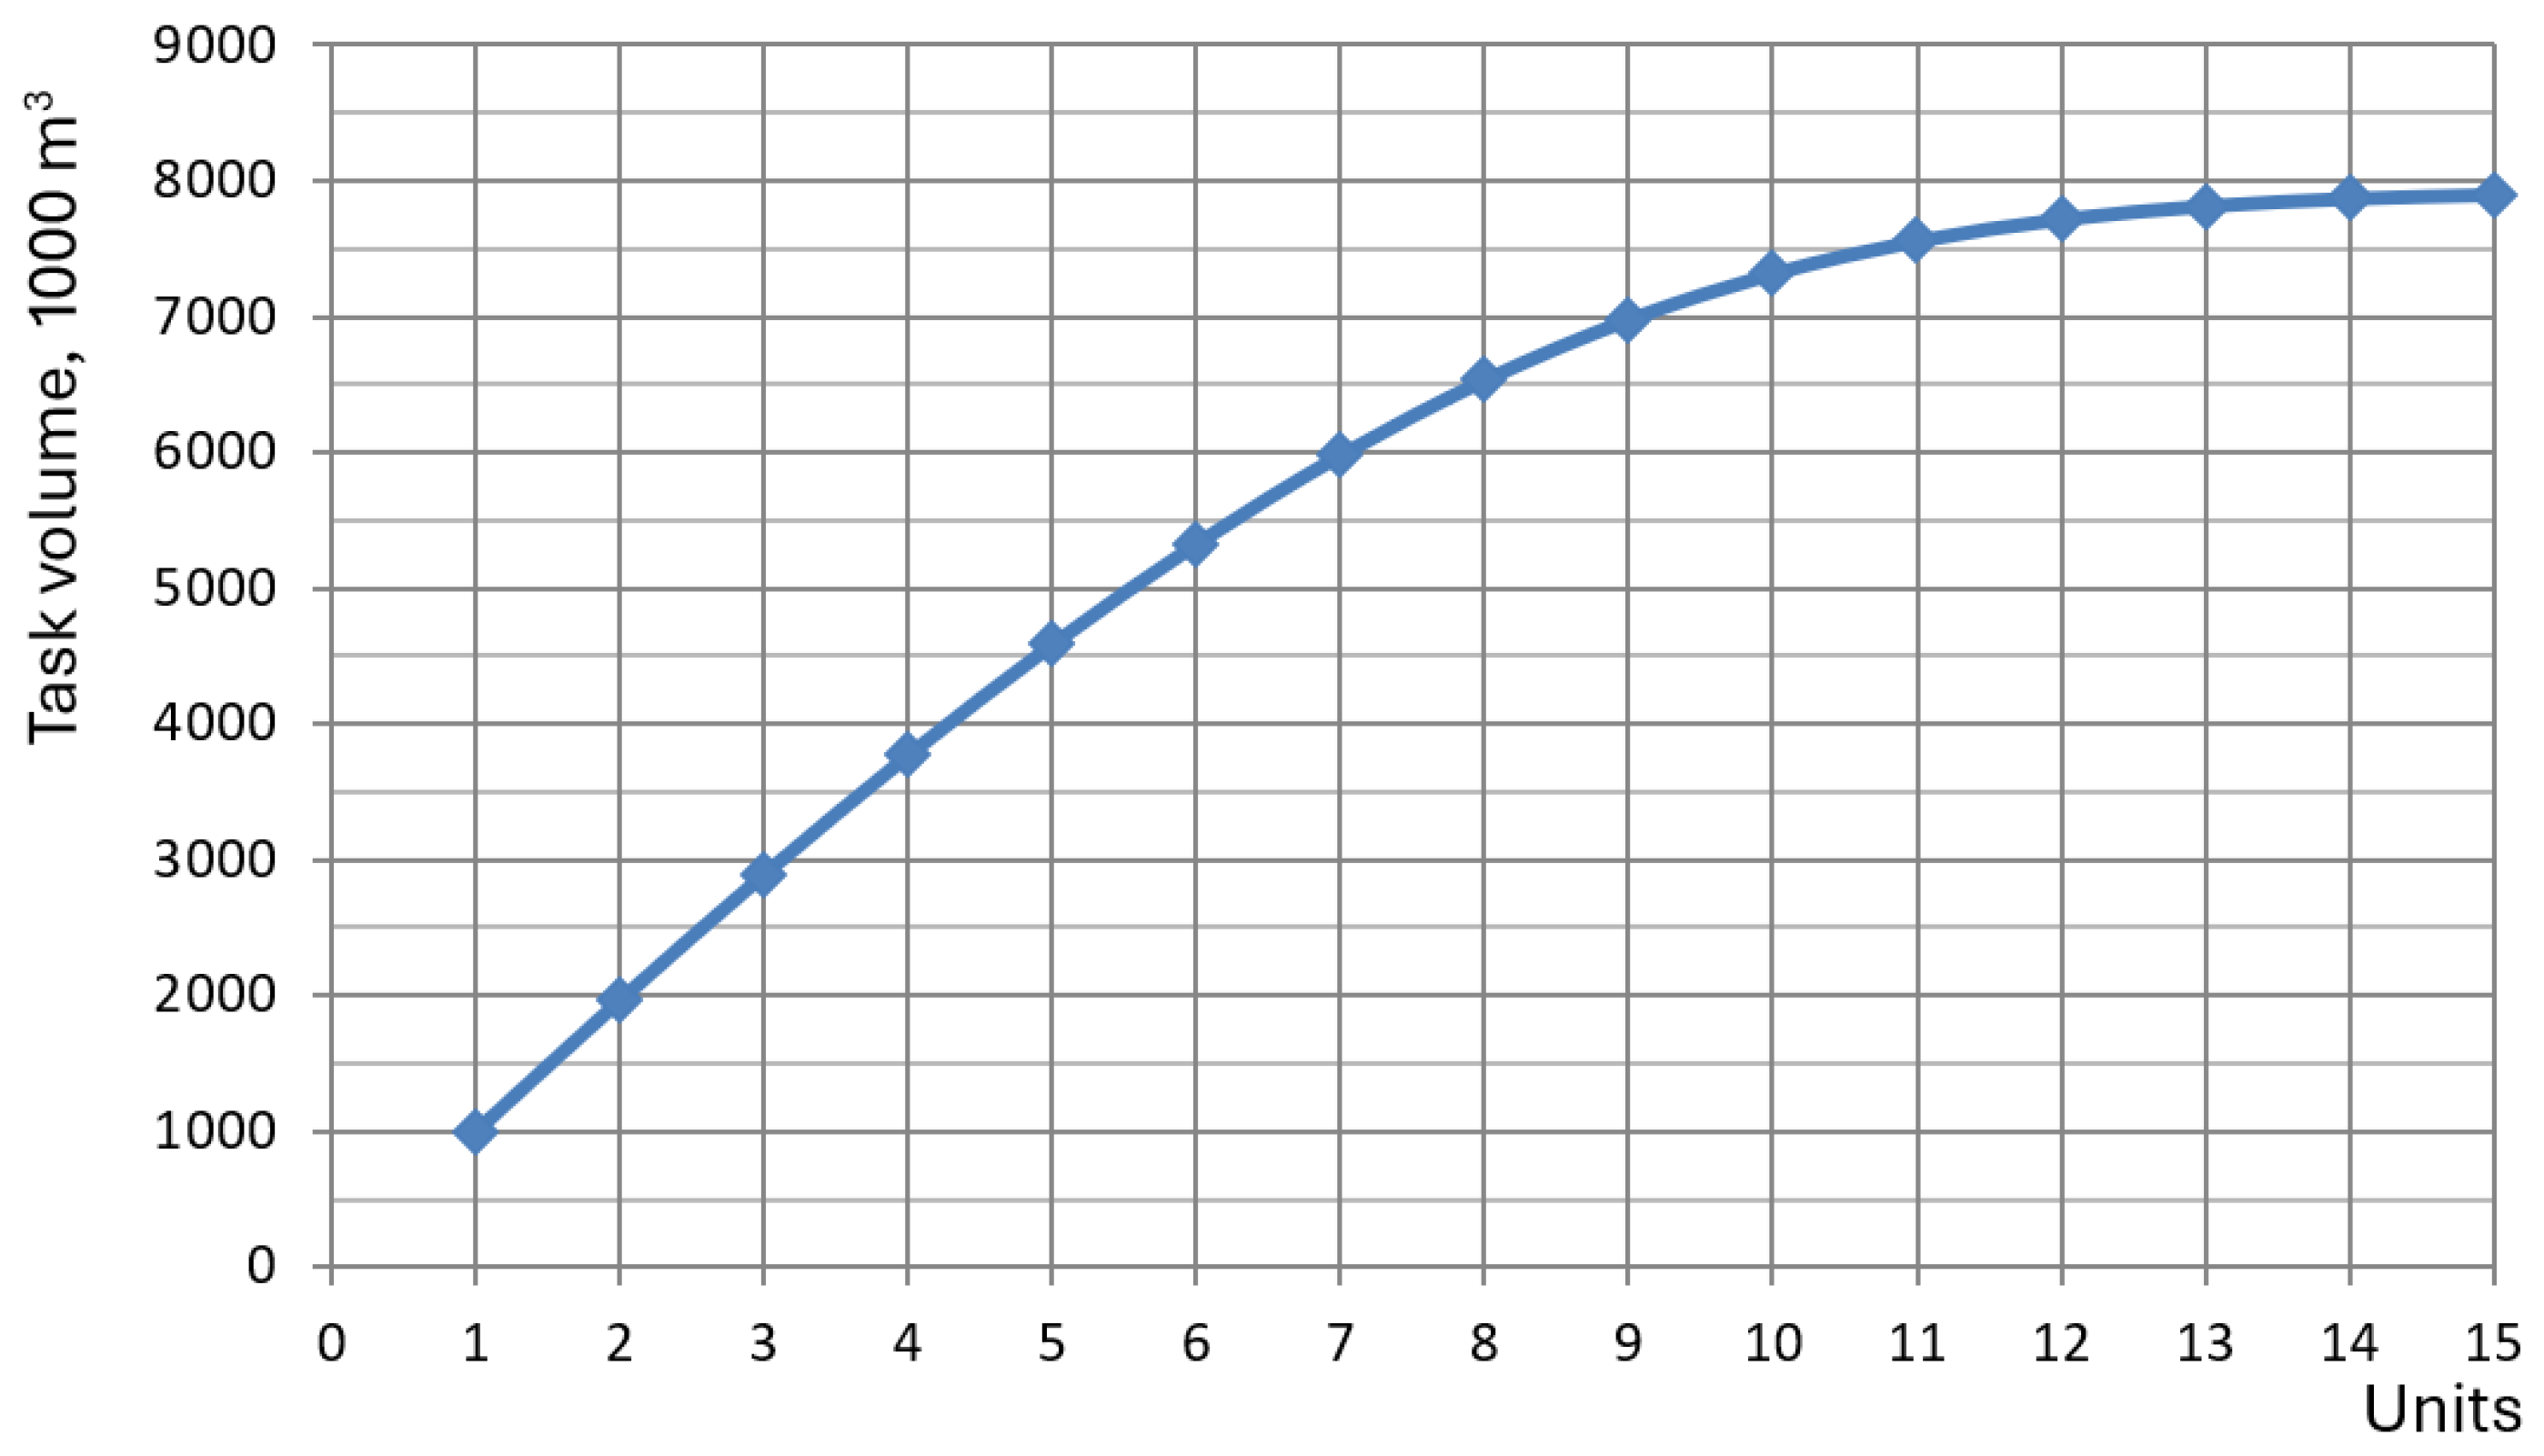
Appendix B
| START 1. IMPORTS import table/CSV library (e.g. pandas) 2. LOAD INPUT DATA task_table ← read CSV “data_input/task.csv” machines_table ← read CSV “data_input/machine.csv” 3. BUILD MACHINE VARIANTS //customer/transport machines: SET customer_table ← filter machines_table where group == customer //operator/loading machines: SET operator_table ← filter machines_table where group1 == operator 4. SIMULATION PARAMETERS SET task_bins, volume_min, volume_max SET travel_bins, travel_min, travel_max SET operator_min, operator_max SET customer_min, customer_max //count of total number of variants COMPUTE total_variants ← travel_bins * task_bins * (operator_max − operator_min + 1) * (customer_max − customer_min + 1) * ROW_COUNT(operator_table) * ROW_COUNT(customer_table) 5. PREPARE OUTPUT HEADER SET columns ← [“model”, “volume”, “travel_time”, “lambda”, “mu”, “rho”, “operator_id”, “operator_count”, “customer_id”, “customer_count”, “input_count”, “input_time”, “service_time”, “waiting_time”, “queue_avg”, “queue_max”, “total_time”, “total_cost”, “total_co2”, “total_fuel”, “total_failure”] OPEN CSV file “data_output/synthetic_data.csv” FOR writing WRITE columns AS first line (comma-separated) 6. MAIN GENERATION LOOP SET record_counter, default_model_id, default_unload_time_s FOR EACH operator_row IN operator_table: //extract machine parameters SET operator_db_id ← operator_row[“id”] SET operator_productivity ← operator_row[“work_output_unit_h”] SET operator_bucket ← operator_row[“units_count”] SET operator_cycle_sec ← operator_row[“work_cycle_sec”] SET operator_price_usd ← operator_row[“machine_price_usd”] //extract economic parameters FC—Fixed Cost, VC—Variable Cost SET operator_FC ← operator_row[“machine_FC”] SET operator_VC ← operator_row[“machine_VC”] //extract technical parameters Failure, Fuel consumption, CO2 production SET operator_failure_rate ← operator_row[“machine_ failure_rate”] SET operator_repair_rate ← operator_row[“machine_ failure_repair”] SET operator_fuel_h ← operator_row[“machine_ failure_fuel_h”] SET operator_co2_h ← operator_row[“machine_ failure_ co2_h”] END FOR FOR EACH customer_row IN customer_table: //extract machine parameters SET customer_db_id ← customer_row[“id”] SET customer_productivity ← customer_row[“work_output_unit_h”] SET customer_bucket ← customer_row[“units_count”] SET customer_cycle_sec ← customer_row[“work_cycle_sec”] SET customer_price_usd ← customer_row[“machine_price_usd”] //extract economic parameters FC—Fixed Cost, VC—Variable Cost SET customer_FC ← customer_row[“machine_FC”] SET customer_VC ← customer_row[“machine_VC”] //extract technical parameters Failure, Fuel consumption, CO2 production SET customer_failure_rate ← customer_row[“machine_ failure_rate”] SET customer_repair_rate ← customer_row[“machine_ failure_repair”] SET customer_fuel_h ← customer_row[“machine_ failure_fuel_h”] SET customer_co2_h ← customer_row[“machine_ failure_ co2_h”] END FOR //iterate over task volumes SET volume_step ← (volume_max − volume_min)/(task_bins − 1) FOR volume FROM volume_min TO volume_max STEP volume_step: //number of transport cycles needed to reach this volume SET input_count ← FLOOR( volume/load_capacity ) //iterate over travel times SET travel_step ← (travel_max − travel_min)/(travel_bins − 1) FOR travel_time FROM travel_min TO travel_max STEP travel_step: //iterate over operator fleet size FOR operator_count FROM operator_min TO operator_max: //iterate over customer fleet size FOR customer_count FROM customer_min TO customer_max: //Service intensity (mu): //how fast the “service” can process arriving loads SET mu ← (customer_bucket * 60)/operator_productivity //Arrival intensity (lambda): //arrivals are limited by transport + unload time SET lambda ← 1/(unload_time + travel_time) //System load factor SET rho ← lambda/mu //build output row (same order as columns) SET total_time = FUNCTION_TIME(row) SET total_cost = FUNCTION_COST(row) SET total_fuel = FUNCTION_FUEL(row) SET total_co2 = FUNCTION_CO2(row) SET total_failure = FUNCTION_FAILURE(row) SET row ← [default_model_id, volume, travel_time, lambda, mu, rho, operator_row_index, operator_count customer_row_index, customer_count, input_count, total_time, total_cost, total_fuel, total_co2, total_failure] WRITE row TO CSV END FOR END FOR END FOR END FOR 7. OPTIONAL POSTPROCESS //Data Governance Policy FUNCTION_DATA_GOVERNANCE(all row) END PROGRAM |
References
- OECD. OECD Compendium of Productivity Indicators 2025; OECD Publishing: Paris, France, 2025. [Google Scholar] [CrossRef]
- World Economic Forum. Shaping the Future of Construction: A Breakthrough in Mindset and Technology; World Economic Forum: Geneva, Switzerland, 2016; Available online: https://www3.weforum.org/docs/WEF_Shaping_the_Future_of_Construction_full_report__.pdf (accessed on 10 November 2025).
- Pal, U.K.; Zhang, C.; Haupt, T.C.; Li, H.; Su, L. The Evolution of Construction 5.0: Challenges and Opportunities for the Construction Industry. Buildings 2024, 14, 4010. [Google Scholar] [CrossRef]
- Samuelson, O.; Stehn, L. Digital Transformation in Construction—A Review. J. Inf. Technol. Constr. 2023, 28, 385–404. [Google Scholar] [CrossRef]
- McKinsey Global Institute. Reinventing Construction: A Route to Higher Productivity. February 2017. Available online: https://www.mckinsey.com/capabilities/operations/our-insights/reinventing-construction-through-a-productivity-revolution (accessed on 10 November 2025).
- Emmanuella, O.N.; Tari, Y.E.; Kingsley, O.O. The Importance of Interdisciplinary Collaboration for Successful Engineering Project Completions: A Strategic Framework. World J. Eng. Technol. Res. 2023, 2, 001–016. [Google Scholar] [CrossRef]
- You, Z.; Wu, C. A Framework for Data-Driven Informatization of the Construction Company. Adv. Eng. Inform. 2019, 39, 269–277. [Google Scholar] [CrossRef]
- Gumusburun Ayalp, G.; Arslan, F. Modeling Critical Rework Factors in the Construction Industry: Insights and Solutions. Buildings 2025, 15, 606. [Google Scholar] [CrossRef]
- RazaviAlavi, S.; AbouRizk, S. Site Layout and Construction Plan Optimization Using an Integrated Genetic Algorithm Simulation Framework. J. Comput. Civ. Eng. 2017, 31, 04017011. [Google Scholar] [CrossRef]
- Bahadori-Jahromi, A.; Room, S.; Paknahad, C.; Altekreeti, M.; Tariq, Z.; Tahayori, H. The Role of Artificial Intelligence and Machine Learning in Advancing Civil Engineering: A Comprehensive Review. Appl. Sci. 2025, 15, 10499. [Google Scholar] [CrossRef]
- Fabian, F.; Kluiber, Z. The Monte Carlo Method and Its Potential Applications/Metoda Monte Carlo a Možnosti Jejího Uplatnění, 1st ed.; Prospektrum: Prague, Czech Republic, 1998; ISBN 80-7175-058-1. [Google Scholar]
- Kendall, D.G. Stochastic Processes Occurring in the Theory of Queues and Their Analysis by the Method of the Imbedded Markov Chain. Ann. Math. Statist. 1953, 24, 338–354. [Google Scholar] [CrossRef]
- Hastings, W.K. Monte Carlo Sampling Methods Using Markov Chains and Their Applications. Biometrika 1970, 57, 97–109. [Google Scholar] [CrossRef]
- Luenberger, D.G. Linear and Nonlinear Programming, 2nd ed.; Addison-Wesley: Reading, MA, USA, 1996; ISBN 978-0201157949. [Google Scholar]
- Ackoff, R.L.; Sasieni, M.W. Fundamentals of Operations Research; John Wiley: London, UK, 1970; ISBN 978-0471003335. [Google Scholar]
- Jarský, Č. Towards a Mathematical Model of Construction Processes. Ph.D. Thesis, CTU in Prague, Prague, Czech Republic, 1981. [Google Scholar]
- Jarský, Č. Automation in the Planning and Management of Construction Projects, 1st ed.; CONTEC: Kralupy nad Vltavou, Czech Republic, 2000; ISBN 80-238-5384-8. [Google Scholar]
- Motyčka, V.; Gašparík, J.; Přibyl, O.; Štěrba, M.; Hořínková, D.; Kantová, R. Effective Use of Tower Cranes over Time in the Selected Construction Process. Buildings 2022, 12, 436. [Google Scholar] [CrossRef]
- Břoušek, M.; Vávra, I.; Zapletal, I. Civil Engineering Structures—Technology; Alfa Konti: Bratislava, Slovakia, 1995; ISBN 80-88739-14-4. [Google Scholar]
- Tažiková, A.; Struková, Z.; Kozlovská, M. An Analysis of Real Site Operation Time in Construction of Residential Buildings in Slovakia. Sustainability 2023, 15, 1529. [Google Scholar] [CrossRef]
- Puchov, G.; Chatiashvili, C. Models of Technological Processes; Technika: Moscow, Russia, 1974. [Google Scholar]
- Pontrjagin, L. Mathematical Theory of Optimal Processes; Nauka: Moscow, Russia, 1983. [Google Scholar]
- Zavadskas, E. Comprehensive Evaluation and Selection of Resource-Efficient Decisions in Construction; Mokslas: Vilnus, Lithuania, 1987. [Google Scholar]
- Jarský, Č.; Popenková, M.; Gašparík, J.; Šťastný, P. On Use of Construction Technology Designs for Expert Opinions. Sustainability 2022, 14, 5672. [Google Scholar] [CrossRef]
- Berezneva, T.; Grosmann, C. Application of Operations Research in Economics; Ekonomika: Moscow, Russia, 1977. [Google Scholar]
- Ignatjev, I.; Iljevskij, B. Modelling of Machine Systems; Mashinostroenie: Leningrad, Russia, 1986. [Google Scholar]
- Zavadskas, E. Systematic Evaluation of Construction Production Decisions; Stroizdat: Leningrad, Russia, 1991; ISBN 5-274-01169-1. [Google Scholar]
- Pervozvanskij, A. Mathematical Models in Production Management; Nauka: Moscow, Russia, 1975. [Google Scholar]
- Bakaev, A. Mathematical Methods in Planning; Naukova Dumka: Kiev, Ukraine, 1968. [Google Scholar]
- Motyčka, V. Optimization of the Tower Cranes Planning: Contribution to the Modelling of the Construction Site Production Area; VUTIUM: Brno, Czech Republic, 2007; ISBN 978-80-214-3400-4. [Google Scholar]
- Jarsky, C. On Mathematical Stochastic Modelling and Optimization of Construction Processes; Akadémiai Kiadó: Budapest, Hungary, 1984. [Google Scholar]
- Raghunathan, T.E. Synthetic Data. Annu. Rev. Stat. Appl. 2021, 8, 129–140. [Google Scholar] [CrossRef]
- Usmanov, V. On Mathematical Modeling and Optimization of Construction Processes. Ph.D. Thesis, CTU in Prague, Prague, Czech Republic, 2016. [Google Scholar]
- Hopocký, A.; Makýš, P.; Ďubek, M. Computational Basis of Completed Works for the Quantities of Budget Items. Czech J. Civ. Eng. 2024, 10, 84–90. [Google Scholar] [CrossRef]
- Kim, K.-M.; Kwak, J.W. PVS-GEN: Systematic Approach for Universal Synthetic Data Generation Involving Parameterization, Verification, and Segmentation. Sensors 2024, 24, 266. [Google Scholar] [CrossRef]
- Tsitsiashvili, G. Construction and Analysis of Queuing and Reliability Models Using Random Graphs. Mathematics 2021, 9, 2511. [Google Scholar] [CrossRef]
- Ebid, A.M.; Ammar, T.; Mahdi, I.; Hegazy, H. Evaluating the Planning Efficiency for Repetitive Construction Projects Using Monte Carlo Simulation Technique. Sci. Rep. 2025, 15, 27520. [Google Scholar] [CrossRef] [PubMed]
- Mostofi, F.; Behzat Tokdemir, O.; Toğan, V. Generating Synthetic Data with Variational Autoencoder to Address Class Imbalance of Graph Attention Network Prediction Model for Construction Management. Adv. Eng. Inform. 2024, 62, 102606. [Google Scholar] [CrossRef]
- Schuster, A.; Hagmanns, R.; Sonji, I.; Löcklin, A.; Petereit, J.; Ebert, C.; Weyrich, M. Synthetic Data Generation for the Con-tinuous Development and Testing of Autonomous Construction Machinery. Automatisierungstechnik 2023, 71, 953–968. [Google Scholar] [CrossRef]
- Xu, L.; Liu, H.; Xiao, B.; Luo, X.; Zhu, Z. Synthetic Simulated Data for Construction Automation: A Review. In Construction Research Congress 2024; American Society of Civil Engineers: Des Moines, IA, USA, 2024; pp. 527–536. [Google Scholar] [CrossRef]
- Zhang, H.; Yu, L. Site Layout Planning for Prefabricated Components Subject to Dynamic and Interactive Constraints. Autom. Constr. 2021, 126, 103693. [Google Scholar] [CrossRef]
- Kim, J.; Wang, I.; Yu, J. Experimental Study on Using Synthetic Images as a Portion of Training Dataset for Object Recognition in Construction Site. Buildings 2024, 14, 1454. [Google Scholar] [CrossRef]
- Neuhausen, M.; Herbers, P.; König, M. Using Synthetic Data to Improve and Evaluate the Tracking Performance of Construction Workers on Site. Appl. Sci. 2020, 10, 4948. [Google Scholar] [CrossRef]
- Sokolowski, J.A.; Banks, C.M. Modeling and Simulation Fundamentals: Theoretical Underpinnings and Practical Domains; Wiley: Hoboken, NJ, USA, 2010; ISBN 978-0-470-48674-0. [Google Scholar]
- Klvaňa, J. Modelling 20, 3rd ed.; Vydavatelství ČVUT: Prague, Czech Republic, 2005; ISBN 80-01-03263-9. [Google Scholar]
- Soukupová, J. Microeconomics, 3rd ed.; Management Press: Prague, Czech Republic, 2002; ISBN 80-7261-061-9. [Google Scholar]
- Jarský, Č. Construction Technology II: Preparation and Execution of Construction Projects; Akademické Nakladatelství CERM: Brno, Czech Republic, 2019; ISBN 978-80-7204-994-3. [Google Scholar]
- Rektorys, K. Overview of Applied Mathematics, 7th ed.; Prometheus: Prague, Czech Republic, 2000. [Google Scholar]
- PHP Documentation. Available online: https://www.php.net/download-docs.php (accessed on 13 October 2025).
- Synthetic Data Generation for AI-Driven Optimization of Construction Machinery Assemblies. Available online: https://github.com/UsmanovSla/GeneratorSyntheticData (accessed on 13 October 2025).
- Rovetto, C.; Cruz, E.; Nuñez, I.; Santana, K.; Smolarz, A.; Rangel, J.; Cano, E.E. Minimizing Intersection Waiting Time: Proposal of a Queue Network Model Using Kendall’s Notation in Panama City. Appl. Sci. 2023, 13, 10030. [Google Scholar] [CrossRef]
- Summary of Model Performance Metrics. Available online: http://www.robostav.cz/download/data/GeneratorSyntheticData_Validation.pdf (accessed on 4 November 2025).
- Czech Technical Standard 73 3050; Earth Works. General Requirements. Czech Standards Institute: Prague, Czech Republic, 1999.
- Komatsu: Manufacturer of Construction, Mining, Forestry, and Industrial Heavy Equipment. Available online: https://www.komatsu.com/en-us (accessed on 17 October 2025).
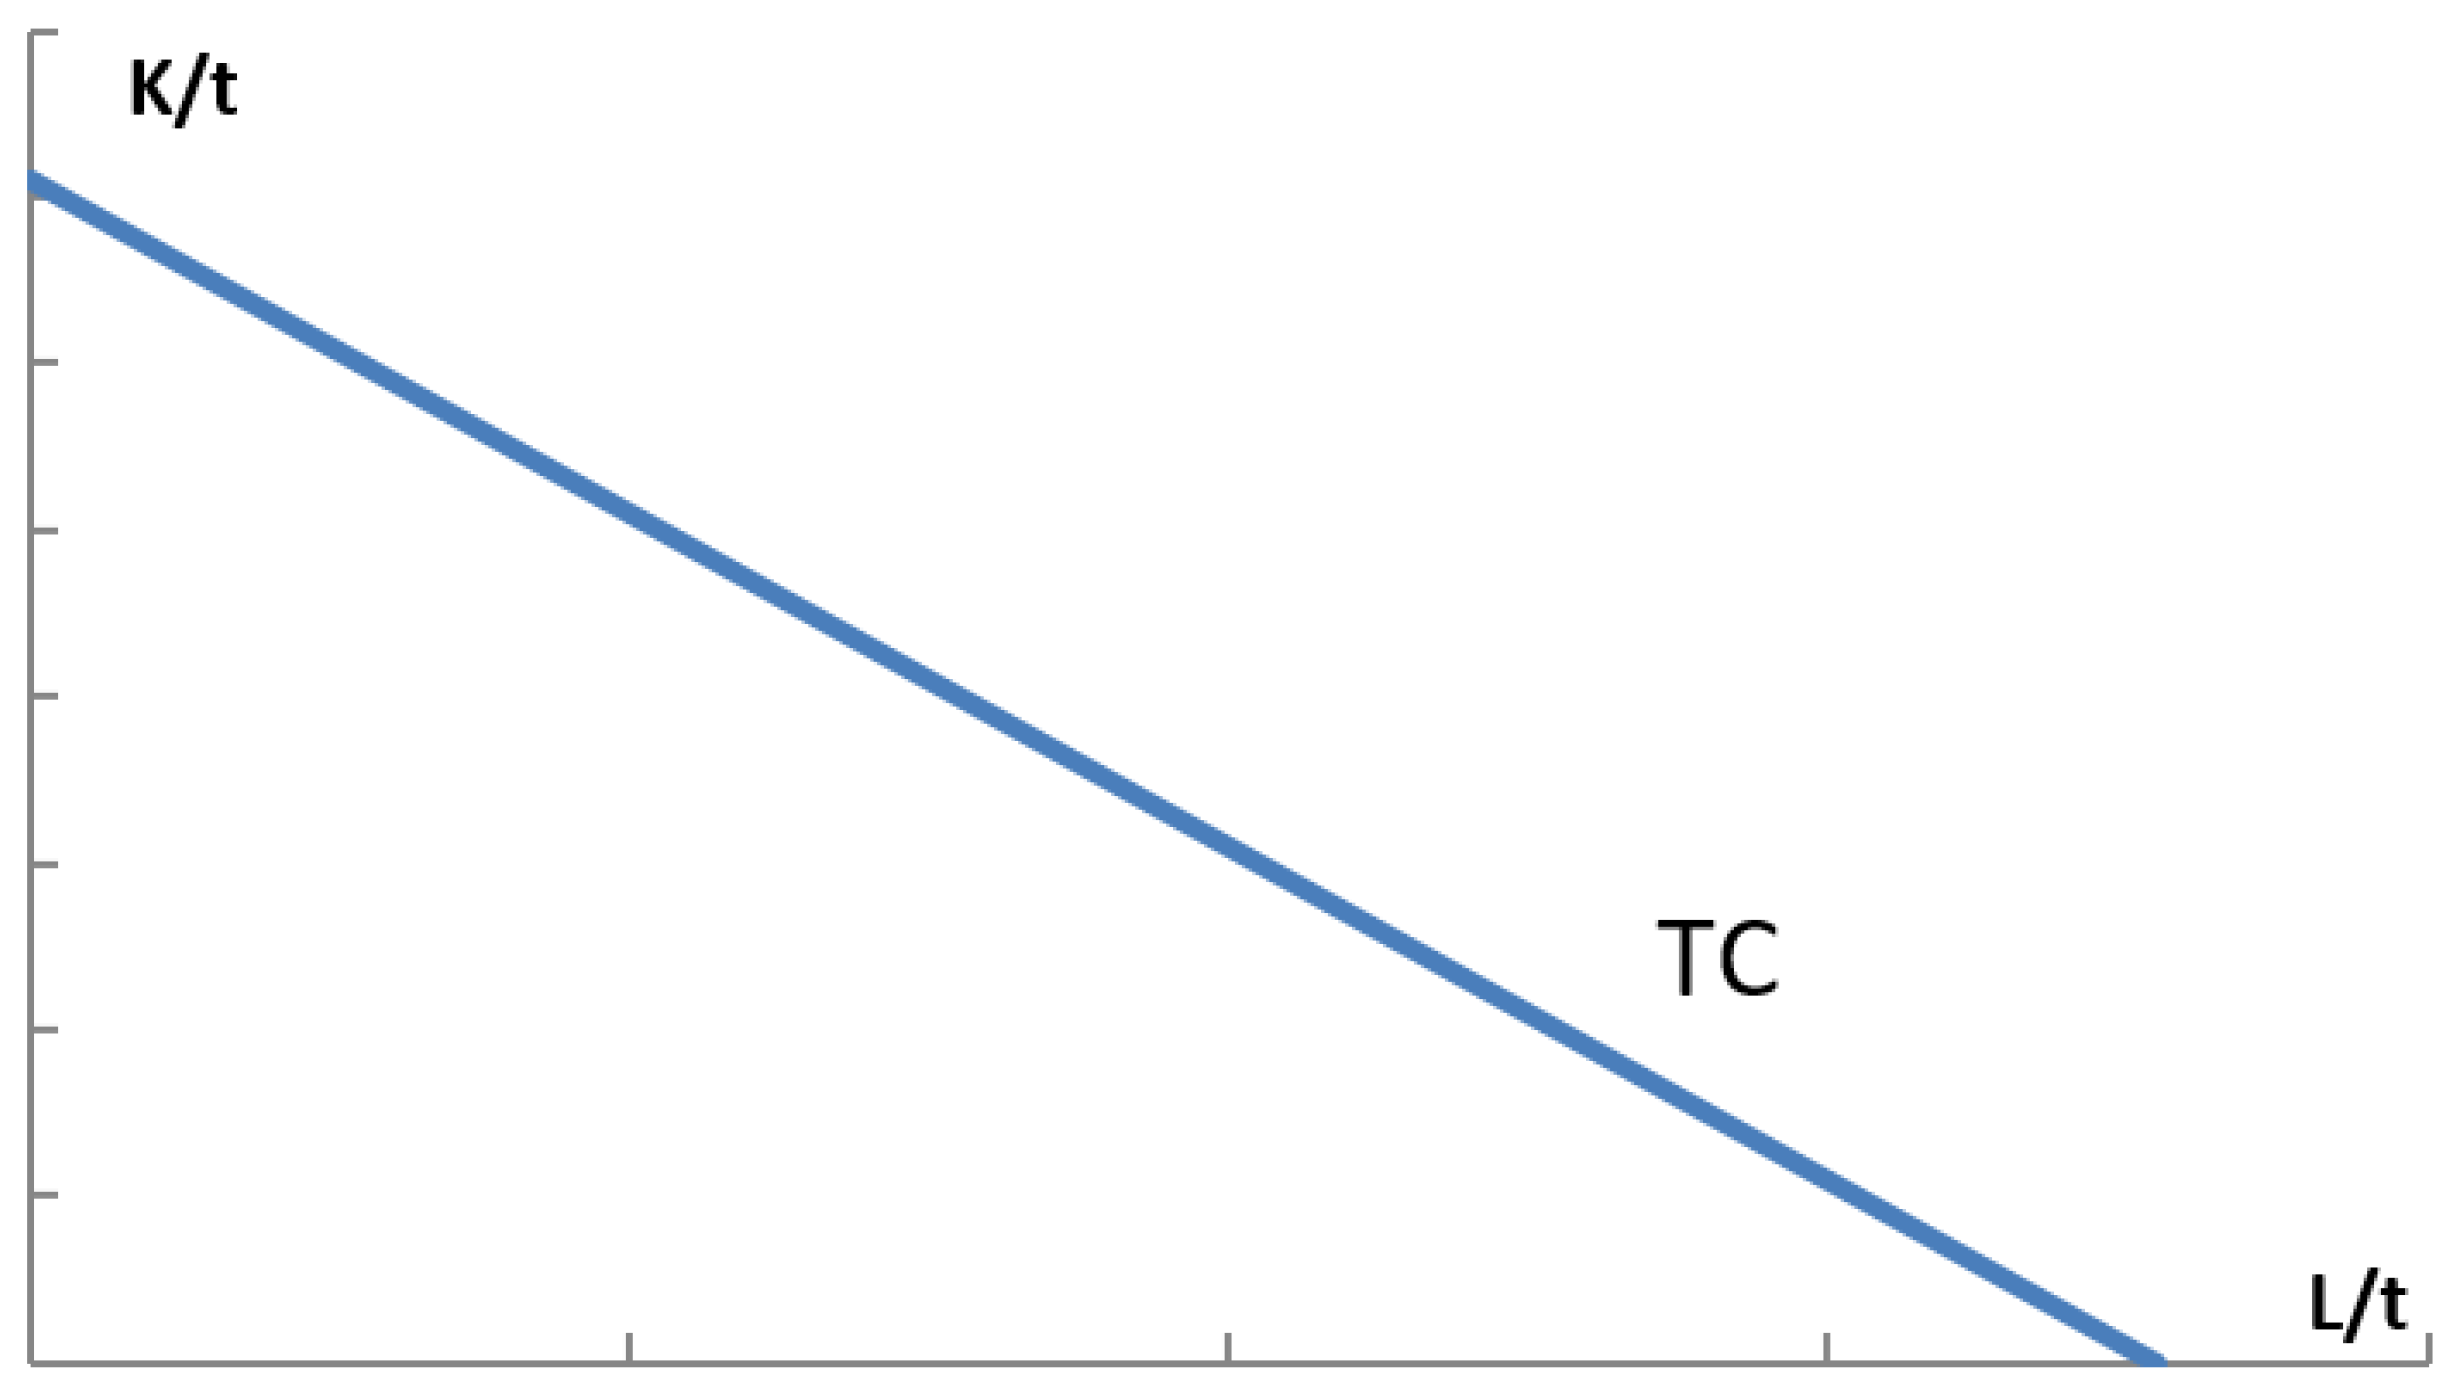
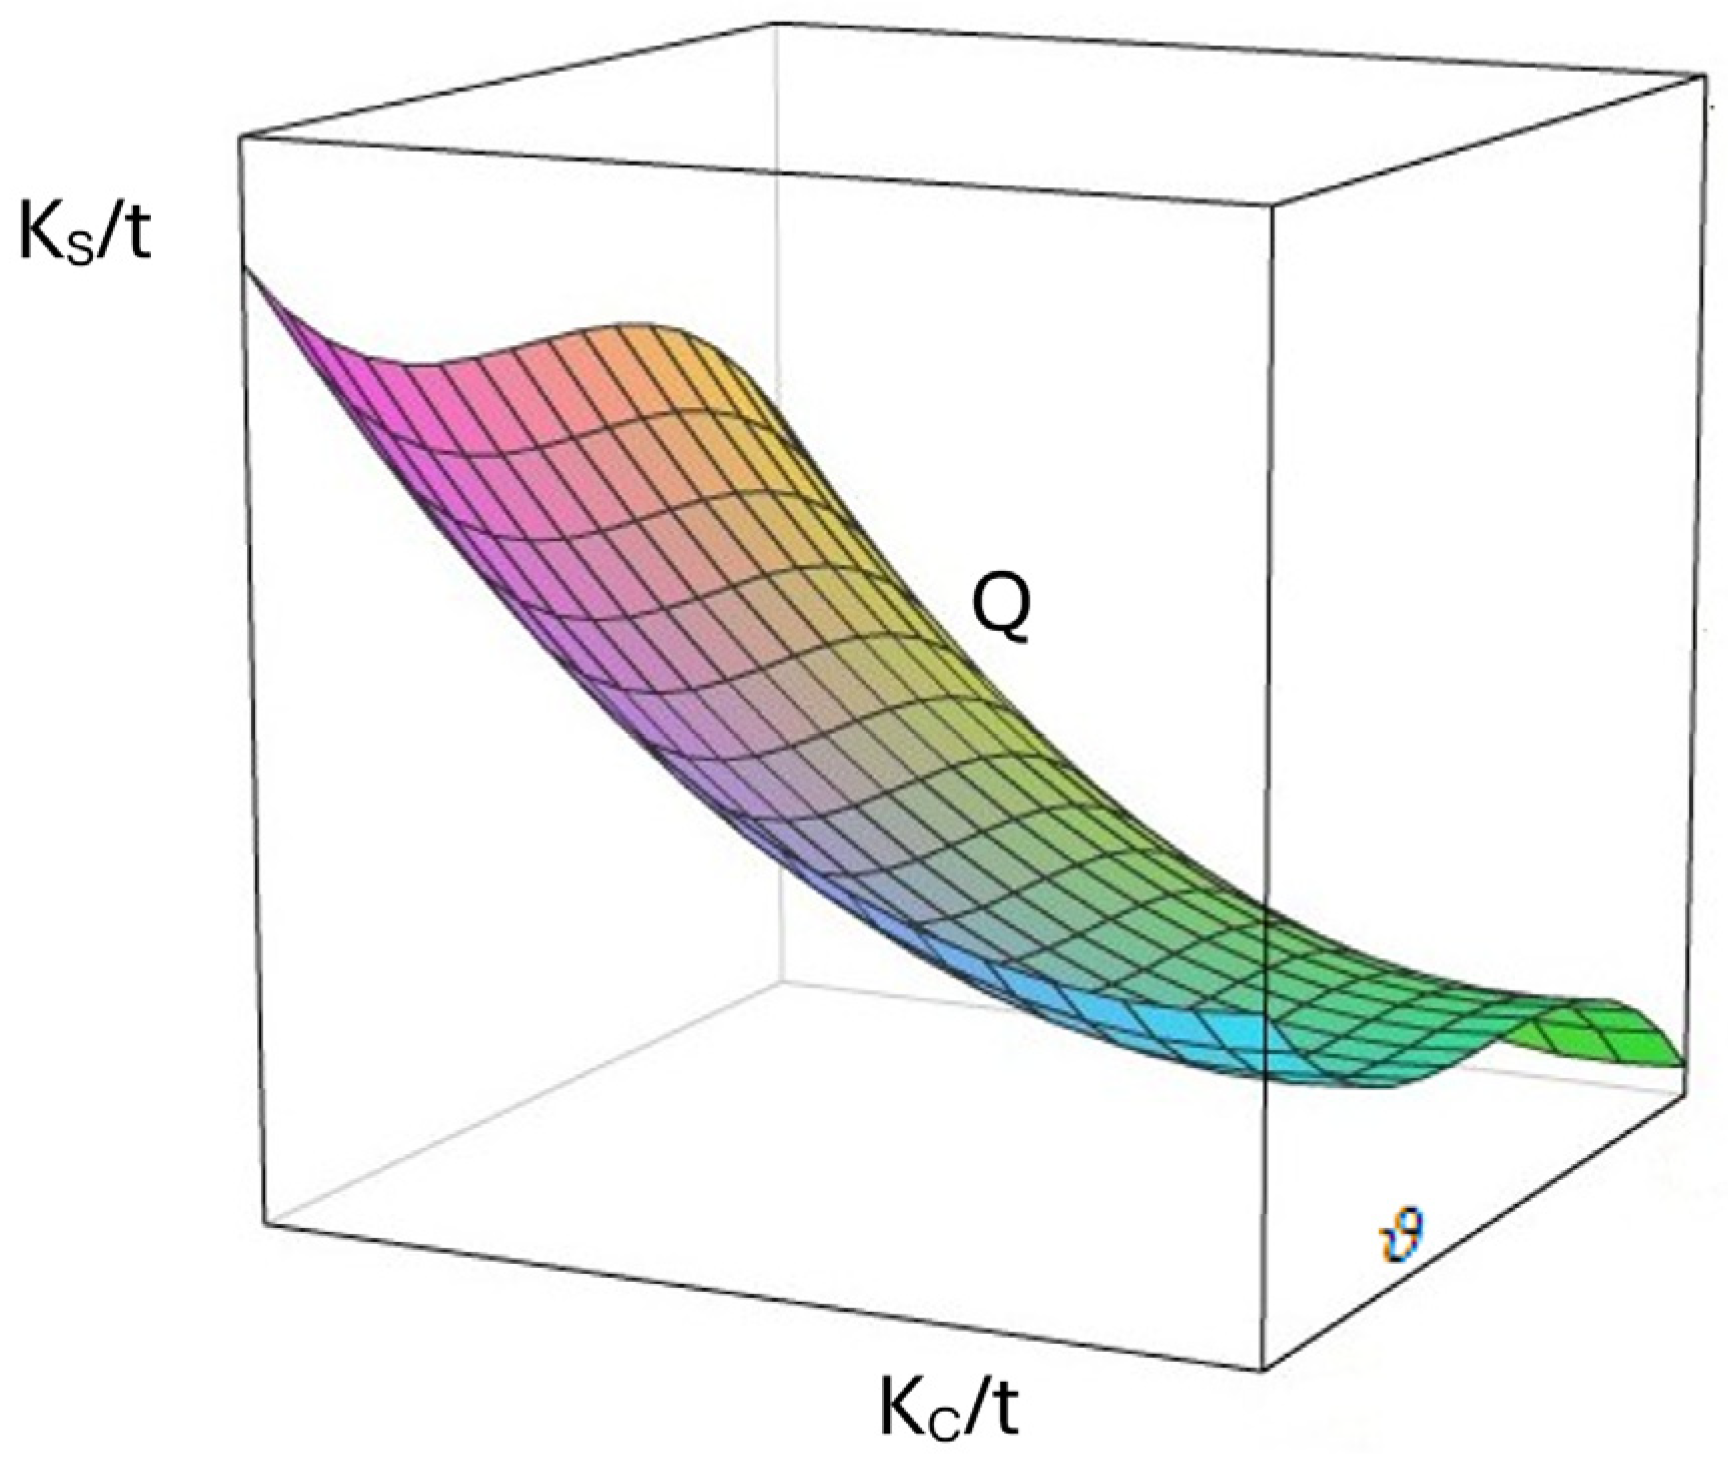


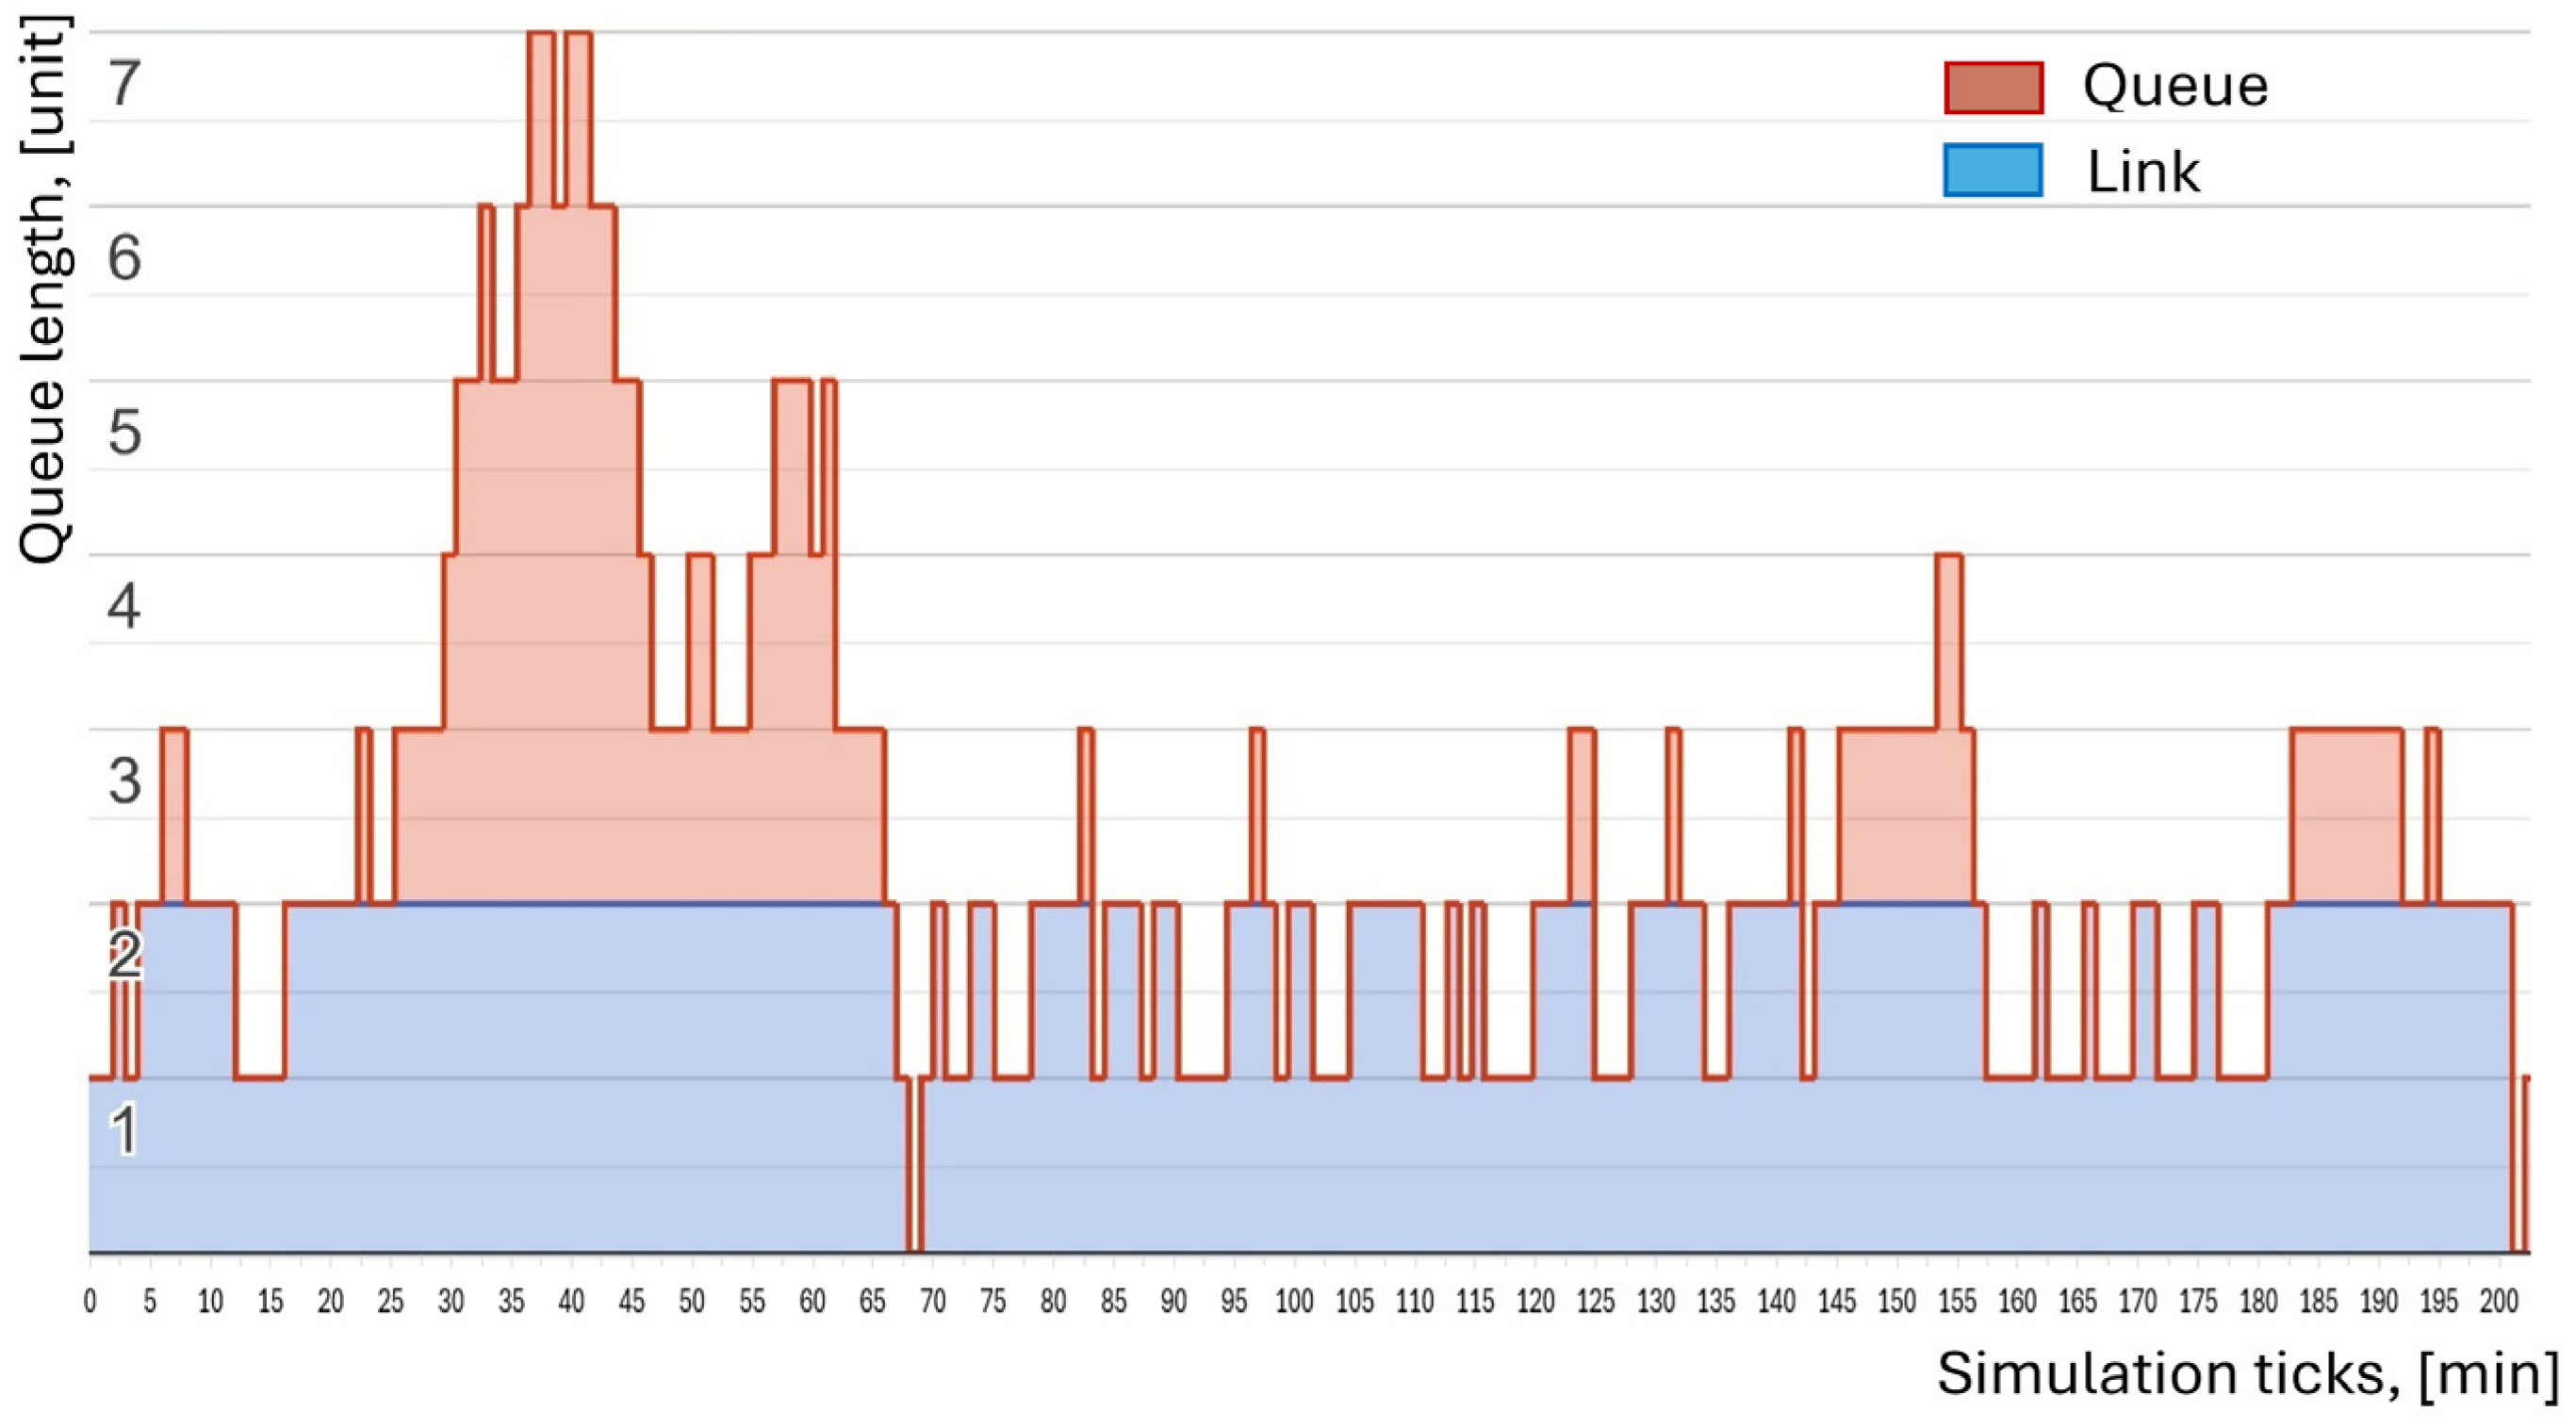
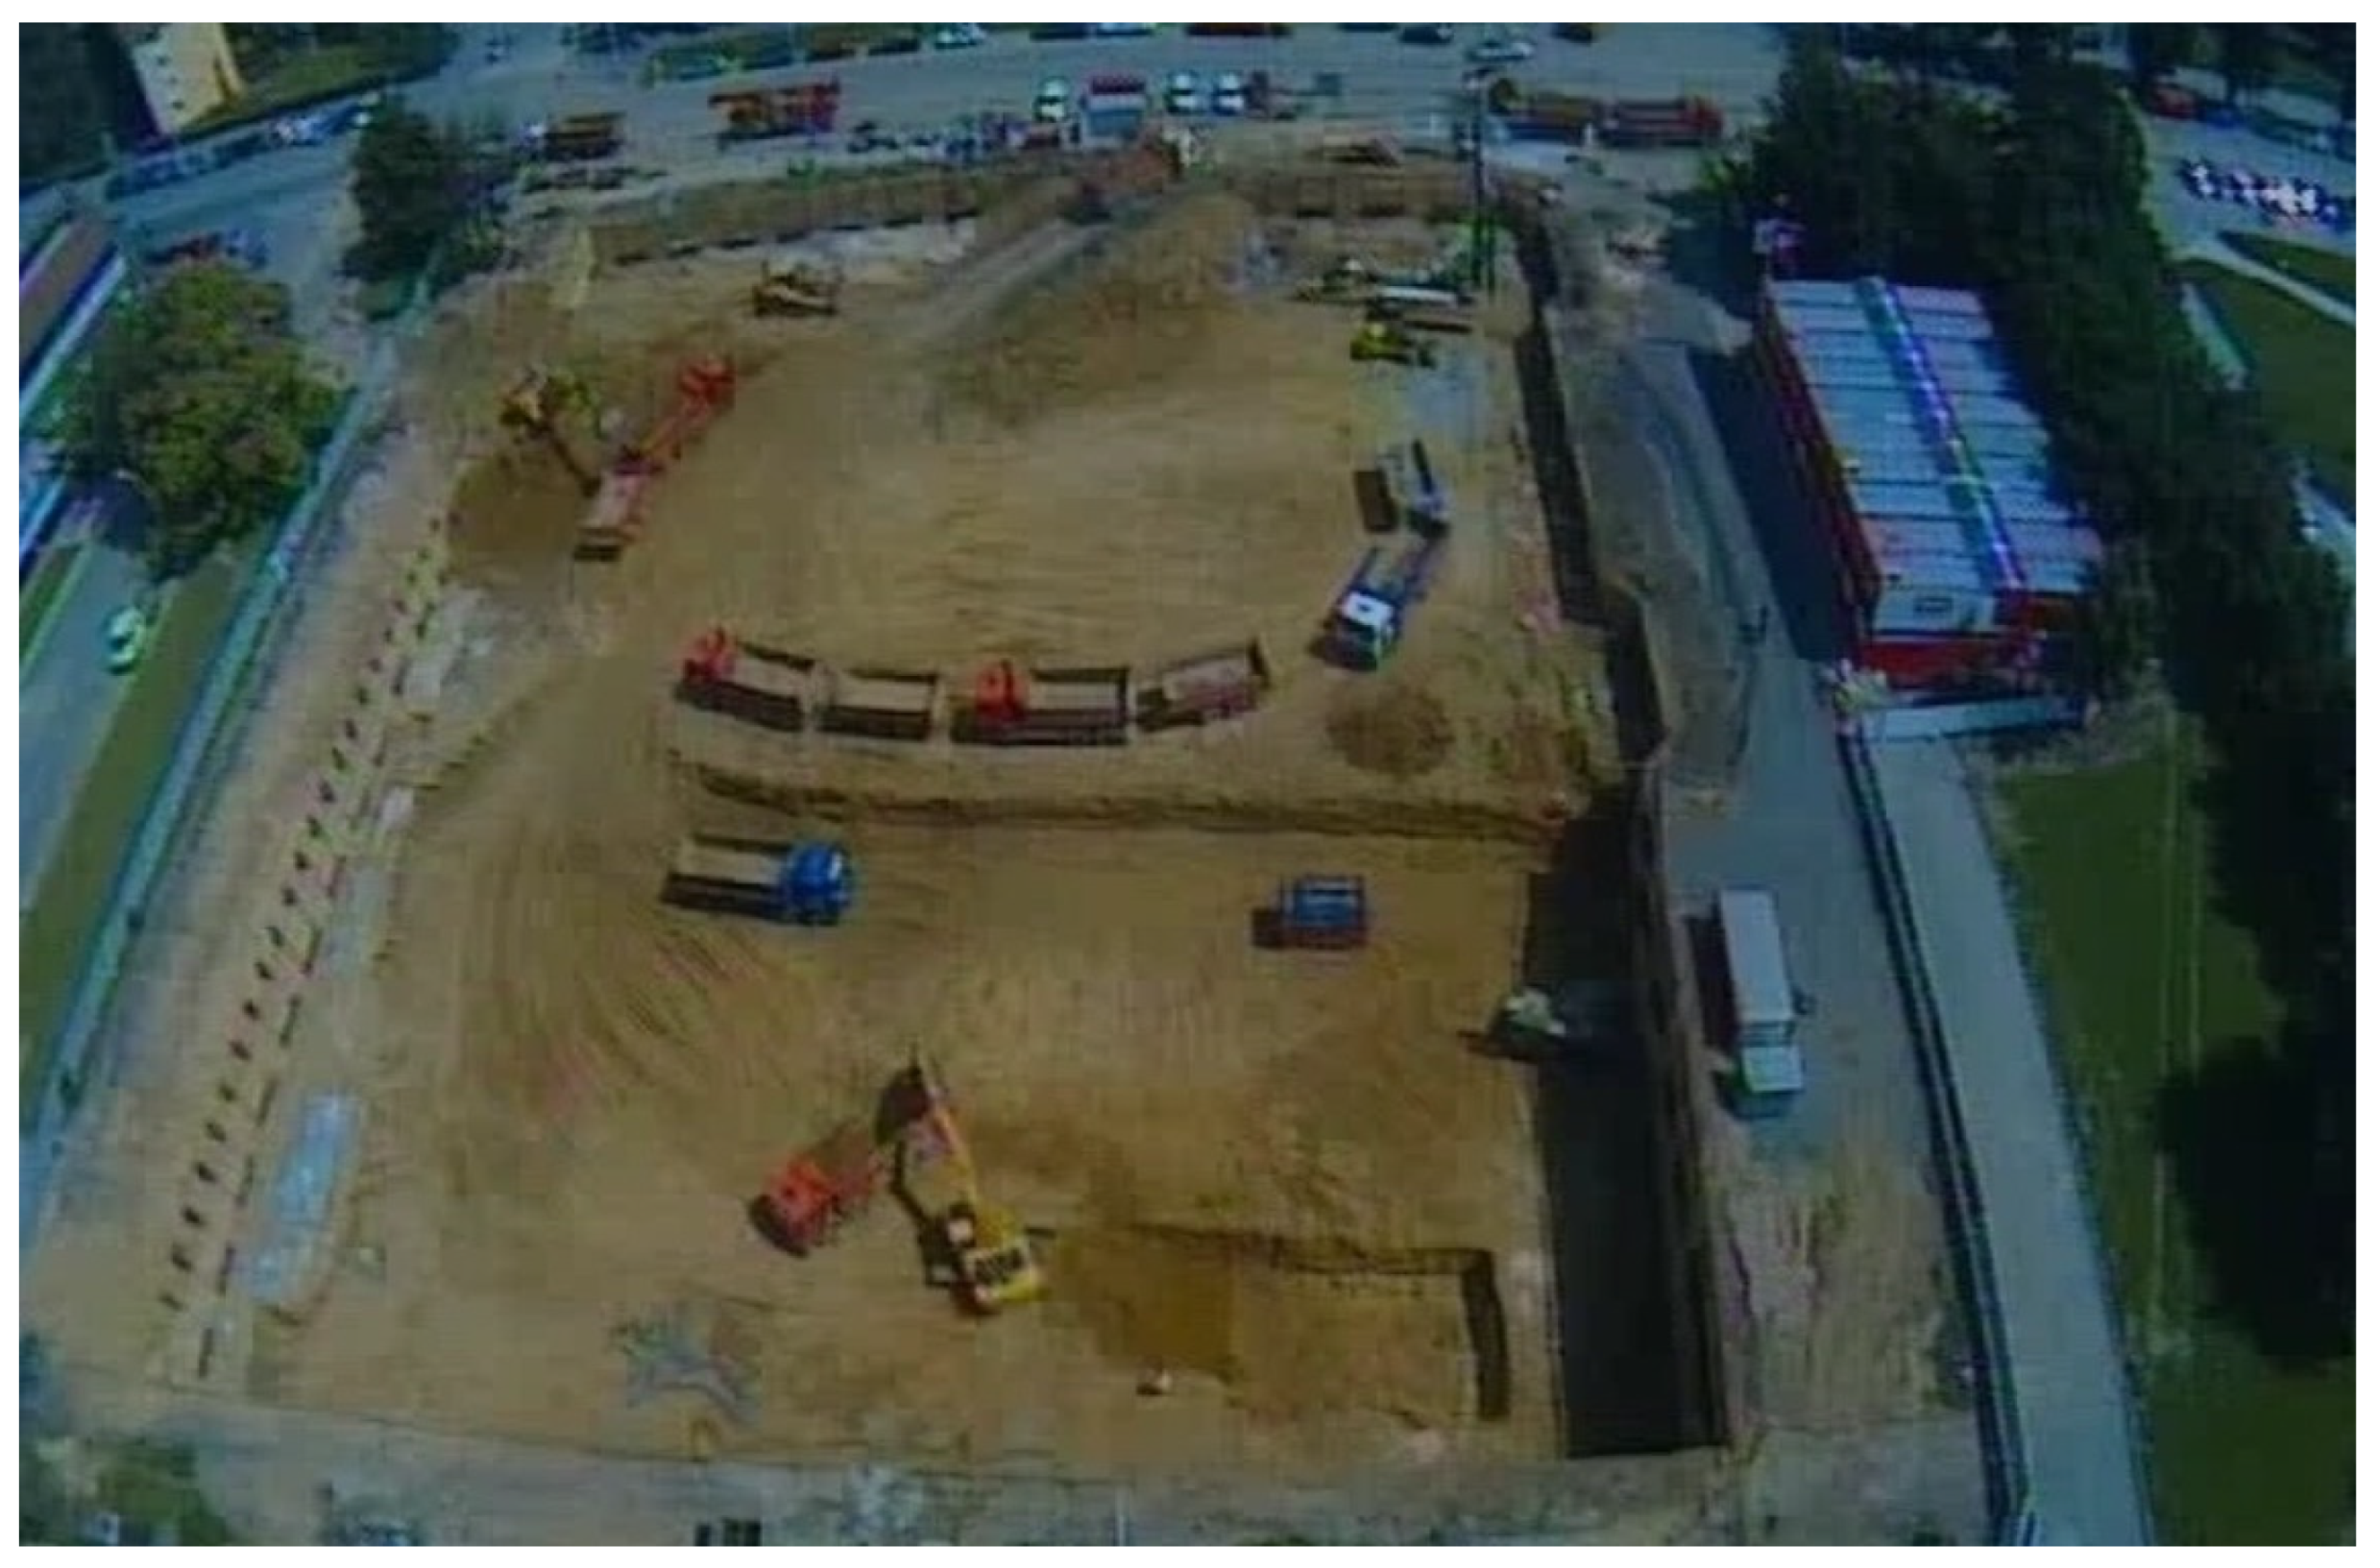
| N | Serving/Served | Units | Avg Input Time [min] | Avg Serving Time [min] | Avg Waiting Time [min] | Avg Queue | Max Queue | Total Time [min] |
|---|---|---|---|---|---|---|---|---|
| 1 | Caterpillar 300.9D/Tatra T815 4 × 4 | 4 + 38 | 1.458 | 2.600 | 0.002 | 0.001 | 1 | 36,490 |
| 2 | Caterpillar 300.9D/Tatra T815 4 × 4 | 3 + 38 | 1.503 | 2.780 | 0.031 | 0.001 | 1 | 38,363 |
| 3 | Caterpillar 300.9D/Tatra T815 4 × 4 | 4 + 37 | 1.477 | 2.676 | 0.000 | 0.001 | 0 | 36,940 |
| 4 | Caterpillar 300.9D/Tatra T815 4 × 4 | 3 + 37 | 1.514 | 2.732 | 0.020 | 0.001 | 2 | 38,638 |
| 5 | Caterpillar 300.9D/Tatra 163 Jamal | 3 + 20 | 2.417 | 3.833 | 0.008 | 0.003 | 1 | 34,574 |
| 6 | Caterpillar 300.9D/Tatra 163 Jamal | 2 + 20 | l | 3.843 | 0.731 | 0.310 | 4 | 44,126 |
| 7 | Caterpillar 300.9D/Tatra 163 Jamal | 3 + 19 | 2.440 | 3.659 | 0.009 | 0.004 | 2 | 34,987 |
| 8 | Caterpillar 300.9D/Tatra 163 Jamal | 2 + 19 | 2.429 | 3.712 | 0.858 | 0.354 | 8 | 46,878 |
| Timeline [min] | Input Time [min] | Input | Link 1 [min] | Link 2 [min] | Queue 1 [min] | Queue 2 [min] | Queue 3 [min] | Task Completion |
|---|---|---|---|---|---|---|---|---|
| 20 | 3 + 5 | 8 | 1 | 3 | 0.06% | |||
| 21 | 1 + 3 | 9 | 3 | 2 | 0.07% | |||
| 22 | 2 + 10 | 10 | 2 | 1 | 10 | 0.08% | ||
| 23 | 2 + 10 | 10 | 1 | 0 | 10 | 0.08% | ||
| 24 | 1 + 14 | 11 | 10 | 14 | 0.08% | |||
| 25 | 4 + 7 | 12 | 9 | 13 | 7 | 0.09% | ||
| 26 | 4 + 7 | 12 | 8 | 12 | 7 | 0.09% | ||
| 27 | 4 + 7 | 12 | 7 | 11 | 7 | 0.09% | ||
| 28 | 4 + 7 | 12 | 6 | 10 | 7 | 0.09% | ||
| 29 | 1 + 1 | 13 | 5 | 9 | 7 | 1 | 0.10% | |
| 30 | 2 + 3 | 14 | 4 | 8 | 7 | 1 | 3 | 0.11% |
| N | Serving/Served | Units | Total Cost [USD] | Completion Time [hour] | CO2 Emissions [kg] | Fuel Consumption [L] | Number of Failures |
|---|---|---|---|---|---|---|---|
| 1 | Caterpillar 300.9D/Tatra T815 4 × 4 | 4 + 38 | 1,188,524 | 609 | 6919 | 2582 | 17 |
| 2 | Caterpillar 300.9D/Tatra T815 4 × 4 | 3 + 38 | 1,220,089 | 640 | 8083 | 2643 | 16 |
| 3 | Caterpillar 300.9D/Tatra T815 4 × 4 | 4 + 37 | 1,174,232 | 616 | 6834 | 2550 | 17 |
| 4 | Caterpillar 300.9D/Tatra T815 4 × 4 | 3 + 37 | 1,198,489 | 644 | 7954 | 2595 | 16 |
| 5 | Caterpillar 300.9D/Tatra 163 Jamal | 3 + 20 | 904,012 | 577 | 8289 | 3093 | 14 |
| 6 | Caterpillar 300.9D/Tatra 163 Jamal | 2 + 20 | 1,115,922 | 736 | 11,336 | 3857 | 17 |
| 7 | Caterpillar 300.9D/Tatra 163 Jamal | 3 + 19 | 875,268 | 584 | 7997 | 2984 | 13 |
| 8 | Caterpillar 300.9D/Tatra 163 Jamal | 2 + 19 | 1,134,318 | 782 | 11,457 | 3902 | 17 |
| Project | Number of Tasks | Total Cost [USD × 103] | Completion Time [hour] | CO2 Emissions [kg] | Fuel Consumption [L] | Number of Failures | Deviation [%] |
|---|---|---|---|---|---|---|---|
| 1 | 3 | 1150/1090 | 820/900 | 12,200/13,500 | 4550/5750 | 11/13 | 12.1 |
| 2 | 6 | 980/1025 | 760/810 | 11,000/11,800 | 3950/4300 | 9/10 | 7.1 |
| 3 | 5 | 450/380 | 400/470 | 4200/5000 | 1500/1950 | 5/7 | 20.2 |
| 4 | 7 | 1300/1480 | 910/1050 | 14,000/16,200 | 5050/6350 | 14/10 | 19.9 |
| 5 | 4 | 800/820 | 700/750 | 9000/9800 | 3100/3500 | 8/9 | 8.0 |
| 6 | 3 | 250/235 | 300/340 | 3500/3900 | 1200/1350 | 4/5 | 11.9 |
| 7 | 5 | 900/840 | 760/880 | 10,800/12,300 | 3900/4600 | 10/12 | 13.0 |
| 8 | 6 | 1500/1620 | 950/1100 | 15,500/17,600 | 5500/6400 | 15/18 | 12.7 |
| 9 | 4 | 170/165 | 180/200 | 2000/2200 | 700/800 | 2/3 | 13.6 |
| 10 | 6 | 600/635 | 520/600 | 7200/8100 | 2600/3000 | 6/7 | 11.5 |
| 49 | 7.2% | 11.2% | 10.9% | 15.0% | 20.6% | 13.0% |
| Metric | Total Cost | Completion Time | CO2 Emissions | Fuel Consumption | Number of Failures |
|---|---|---|---|---|---|
| Observations | 49 | 49 | 49 | 49 | 49 |
| RMSE | 25.89224137 | 34.40455594 | 380.6546456 | 201.9042004 | 1.702339327 |
| R-squared | 0.959115609 | 0.866353155 | 0.932646442 | 0.900973609 | 0.14698364 |
| Pearson correlation | 0.979344479 | 0.930780938 | 0.965736217 | 0.949196296 | 0.383384455 |
| F-Test | 0.870728 < Fcrit | 0.8241 < Fcrit | 0.8562 < Fcrit | 0.6679 < Fcrit | 0.2881 > Fcrit |
| K–S Test | 0.14442 < K–Scrit | 0.14384 < K–Scrit | 0.12117 < K–Scrit | 0.12665 < K–Scrit | 0.21617 > K–Scrit |
Disclaimer/Publisher’s Note: The statements, opinions and data contained in all publications are solely those of the individual author(s) and contributor(s) and not of MDPI and/or the editor(s). MDPI and/or the editor(s) disclaim responsibility for any injury to people or property resulting from any ideas, methods, instructions or products referred to in the content. |
© 2025 by the author. Licensee MDPI, Basel, Switzerland. This article is an open access article distributed under the terms and conditions of the Creative Commons Attribution (CC BY) license (https://creativecommons.org/licenses/by/4.0/).
Share and Cite
Usmanov, V. Synthetic Data Generation Methodology for Construction Machinery Assembly Optimization. Buildings 2025, 15, 4176. https://doi.org/10.3390/buildings15224176
Usmanov V. Synthetic Data Generation Methodology for Construction Machinery Assembly Optimization. Buildings. 2025; 15(22):4176. https://doi.org/10.3390/buildings15224176
Chicago/Turabian StyleUsmanov, Vjačeslav. 2025. "Synthetic Data Generation Methodology for Construction Machinery Assembly Optimization" Buildings 15, no. 22: 4176. https://doi.org/10.3390/buildings15224176
APA StyleUsmanov, V. (2025). Synthetic Data Generation Methodology for Construction Machinery Assembly Optimization. Buildings, 15(22), 4176. https://doi.org/10.3390/buildings15224176


