1. Introduction
In modern architecture, large-span roof structures are increasingly favored for their ability to create expansive, column-free spaces, making them ideal for large public facilities such as stadiums, exhibition halls, and airport terminals. However, these structures present significant challenges due to their complex spatial geometry, numerous components, and intricate node configurations. During construction, the segmental lifting method is commonly used, and factors such as assembly errors, component tolerances, and welding quality can cause deviations from design specifications. These discrepancies may accumulate, leading to misalignments between adjacent segments, reduced assembly precision, and potential risks to structural safety and functionality [
1,
2,
3,
4,
5]. Therefore, accurate measurement and stringent quality control are essential to ensure construction precision and guide subsequent installation and maintenance.
Traditional measurement approaches, such as total stations, levels, and rangefinders, can effectively measure the spatial positions of roof elements and parameters such as elevation and flatness. For example, Yu et al. [
6] utilized total stations to monitor tunnel headroom displacements, while Peng et al. [
7] applied similar methods to track the installation accuracy of trusses and girders. However, these approaches are often constrained by accessibility and line-of-sight requirements, limiting their applicability in large, complex, or obstructed construction environments [
8].
With the advancement of measurement technologies, GPS-based positioning has emerged as a valuable alternative. Studies such as David et al. [
9] and Huang et al. [
10] demonstrated centimeter-level precision in monitoring structural displacements. Yet, high-precision GPS systems remain costly, and their accuracy is sensitive to environmental interference [
11]. Similarly, photogrammetry and laser scanning have gained prominence in the engineering domain. Photogrammetry enables high-resolution 3D reconstruction and visual monitoring [
12,
13,
14,
15], while laser scanning provides high accuracy and speed for complex structures [
16,
17,
18,
19]. Nevertheless, both methods face limitations—photogrammetry requires optimal lighting and surface textures, whereas laser scanning can be restricted by equipment cost and accessibility at higher elevations.
In this context, unmanned aerial vehicles (UAVs) have become a transformative tool for large-span roof monitoring due to their flexibility, non-contact nature, and ability to capture data over complex terrains. UAV photogrammetry integrates flight control, image processing, and GPS/IMU data to obtain dense point clouds for 3D reconstruction [
20]. Recent studies have leveraged UAVs in combination with BIM data, deep learning, and neural networks for structural inspection, deformation analysis, and crack detection [
21,
22,
23,
24]. These methods significantly enhance data acquisition efficiency while minimizing manual intervention.
Meanwhile, research on dynamic scene measurement and 3D reconstruction has rapidly evolved. Deep learning–based algorithms have achieved real-time, targetless displacement measurements [
25], high-precision dynamic object reconstruction [
26], and point cloud quality evaluation from multi-view data [
27,
28,
29,
30]. Sensor-fusion techniques, such as IMU–LiDAR integration, have further improved motion compensation accuracy for moving cameras [
31]. These developments provide a foundation for more robust and intelligent monitoring systems.
Despite these advances, the secondary analysis of image, video, or point cloud data remains a bottleneck. Current challenges include low data utilization, limited automation, and restricted applicability under complex construction conditions [
32,
33,
34,
35,
36,
37,
38,
39]. To address these limitations, this study proposes a UAV-based approach for secondary point cloud analysis in large-span roof construction. The point cloud features are processed using edge detection and the RANSAC algorithm to extract the central axes of roof components, which are then compared with design data to evaluate planar and elevation deviations [
40,
41]. Furthermore, a triangular mesh model is constructed to simulate roof panel installation and assess drainage performance. The proposed method enhances the efficiency and accuracy of geometric quality control and provides valuable guidance for the design and maintenance of large-span roof structures.
2. Oblique Photogrammetry and Point Cloud Data Processing
2.1. Study Objects
The research object selected for this study is situated in Futian District, Shenzhen City, Guangdong Province, China. The structure is a four-story, long-span building with dimensions of approximately 115 m in length, 77 m in width, and 37.4 m in height. The primary structural system consists of a steel frame supporting a spatial single-layer grid roof. The three-story area beneath the large-span roof serves as a multifunctional exchange hall, featuring a column-free space of approximately 2500 cubic meters. In this area, the diagonal intersection grid of the roof is not supported by frame columns, necessitating stringent control over the construction quality of this section to ensure both structural safety and functional performance. The rendering and plan of the research object are illustrated in
Figure 1.
2.2. Brief Description of the Process
Due to the large-scale and complex geometry of large-span roofs, traditional slope inspection methods, such as slope rulers and levels, are not only constrained by site conditions but also ineffective in capturing slope data from the upper sections of the roof. To enable real-time quality control during the assembly of the roof steel structure, this study employs a consumer-grade UAV for data collection. Given the presence of obstacles, such as safety nets and cranes, at the construction site, careful planning of the UAV flight path and tilt photography is essential to prevent interference with ongoing construction activities. As a result, a comprehensive workflow schedule must be developed in advance to integrate all phases of the process—from initial flight path planning and preparation to model construction, analysis, and calculations—ensuring the efficient execution of the roof inspection. The workflow diagram of the UAV scanning process is shown in
Figure 2.
2.3. Data Acquisition
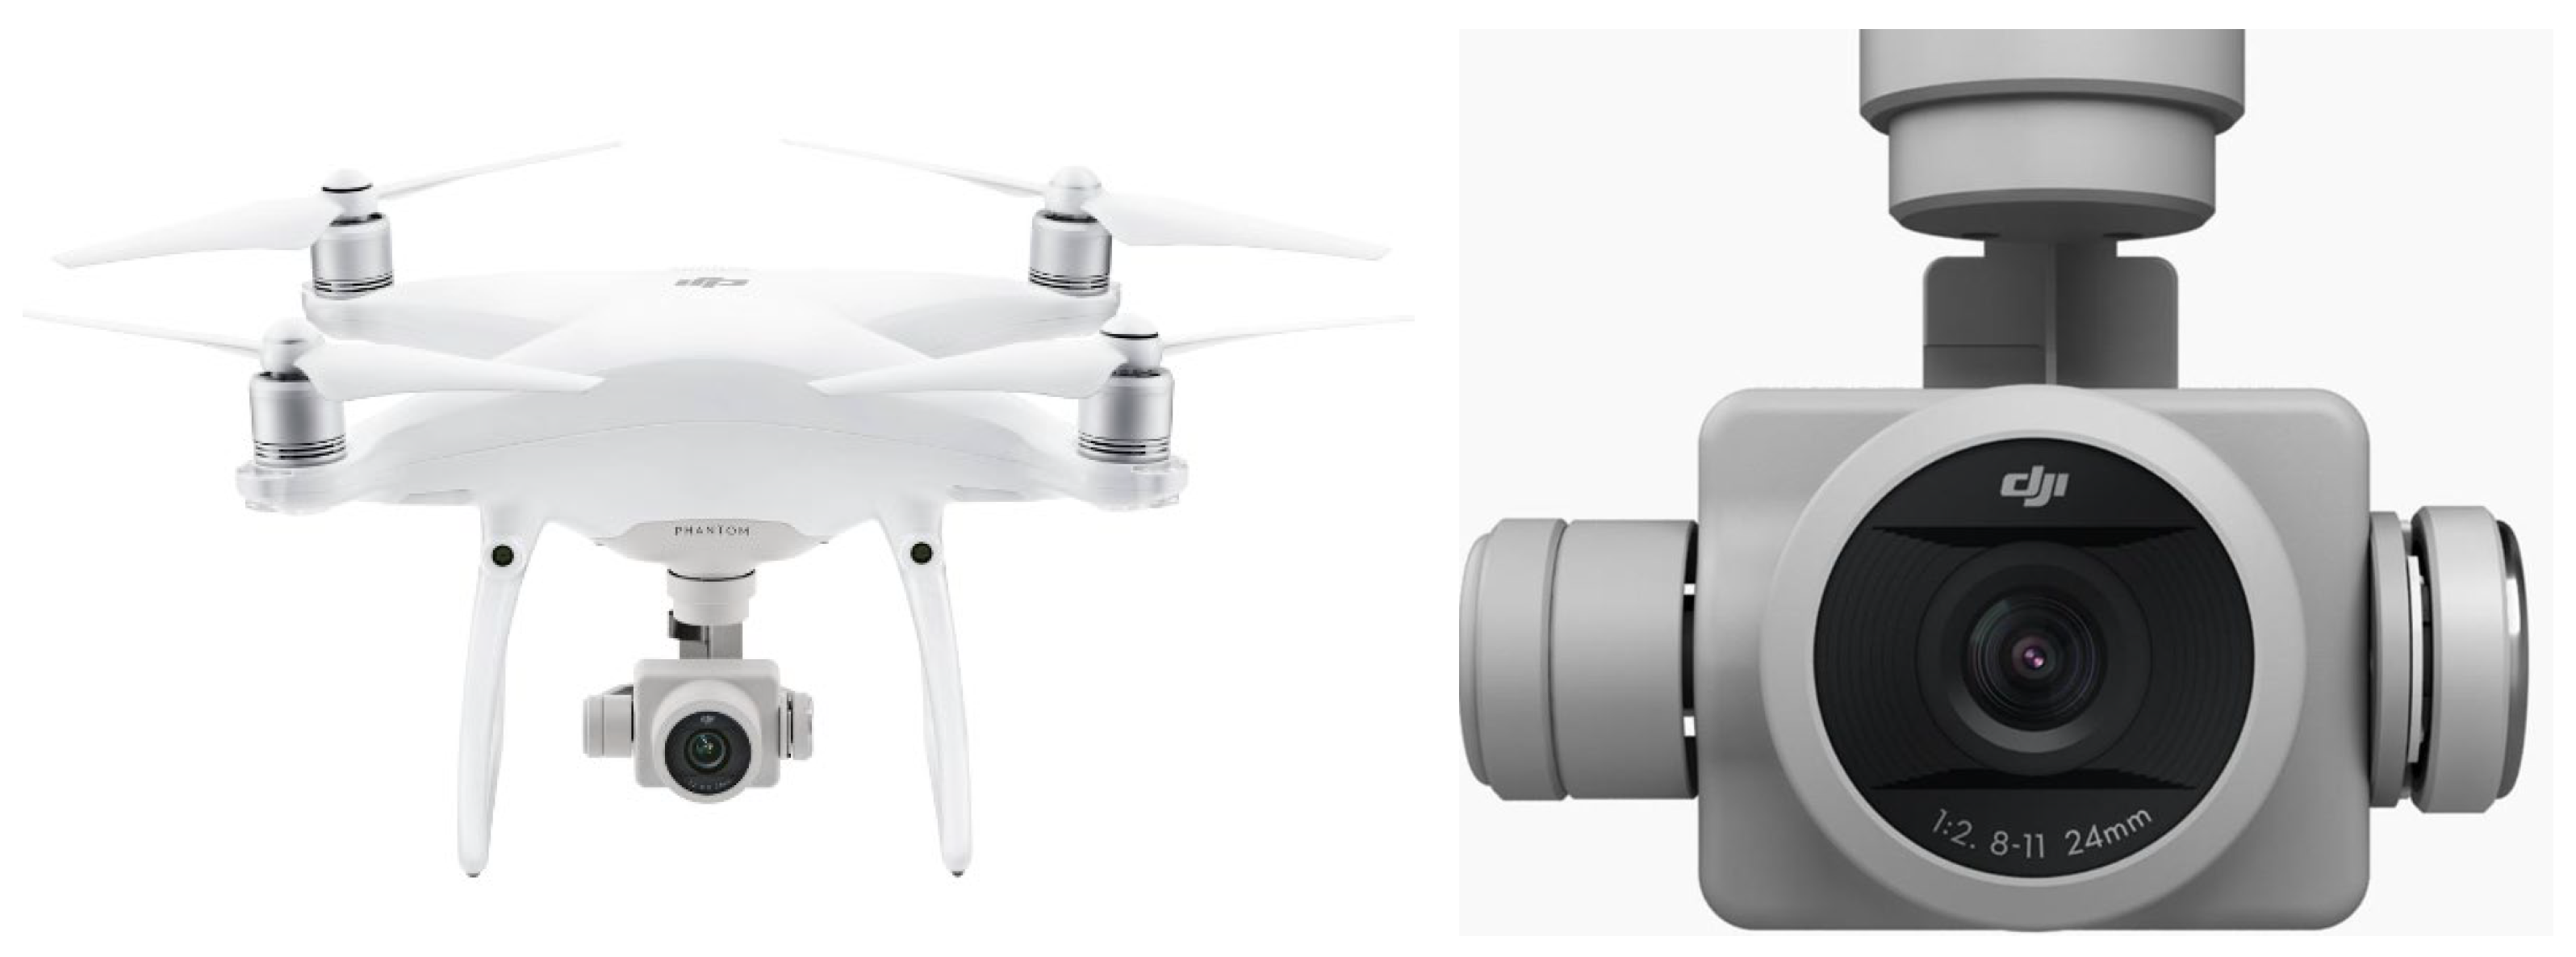
For data collection, a DJI Phantom 4 Advanced UAV (
Figure 3) was used. Weighing just 1368 g, the Phantom 4 Advanced is significantly lighter than other measurement devices, making it easy to transport and operate. With a maximum ascent speed of 6 m/s and the ability to withstand wind speeds up to 10 m/s, it ensures reliable performance and efficient measurements, even in challenging environments. The gimbal pitch angle was set to −60° to optimize coverage of the roof surface, and the flight altitude ranged from 25 m to 47 m. The flight plan included an 80% forward overlap and a 70% lateral overlap, optimizing data accuracy and coverage.
For additional UAV specifications, refer to
Table 1. Detailed designs of the UAV and camera are shown in
Figure 2.
In this study, all image processing tasks were performed using iTwin Capture Modeler 2023, which provided a fully automated workflow for aerial triangulation (Structure from Motion, SfM), dense image matching (Multi-View Stereo, MVS), mesh reconstruction, and texture mapping. The software supports two camera models for calibration: (1) the perspective model, based on the Brown distortion model, incorporating parameters such as focal length, sensor size, principal point, radial distortion coefficients, and tangential distortion coefficients; and (2) the fisheye model, designed to correct extreme distortion, utilizing a focal matrix and a dedicated distortion model.
For georeferencing, several strategies were employed: (1) GPS/IMU metadata extracted from image EXIF/XMP files, referenced either to the WGS84 ellipsoidal height or the EGM96 geoid; (2) Ground Control Points (GCPs), with a minimum of three GCPs identified in at least two images, and horizontal and vertical accuracy weights assigned to prioritize higher-accuracy GCPs in the optimization process; (3) high-precision geotagged images obtained from Post-Processed Kinematics (PPK) or Real-Time Kinematics (RTK) data were directly imported when available; and (4) a hybrid registration approach, allowing integration with external point cloud data to improve spatial alignment robustness.
The internal coordinate system adopts both Earth-Centered, Earth-Fixed (ECEF) and East-North-Up (ENU) representations, while the output can be exported in various formats, including WGS84, UTM, custom local systems, or other specified Spatial Reference Systems (SRSs).
2.4. Image Photography and Filtering for Noise Reduction
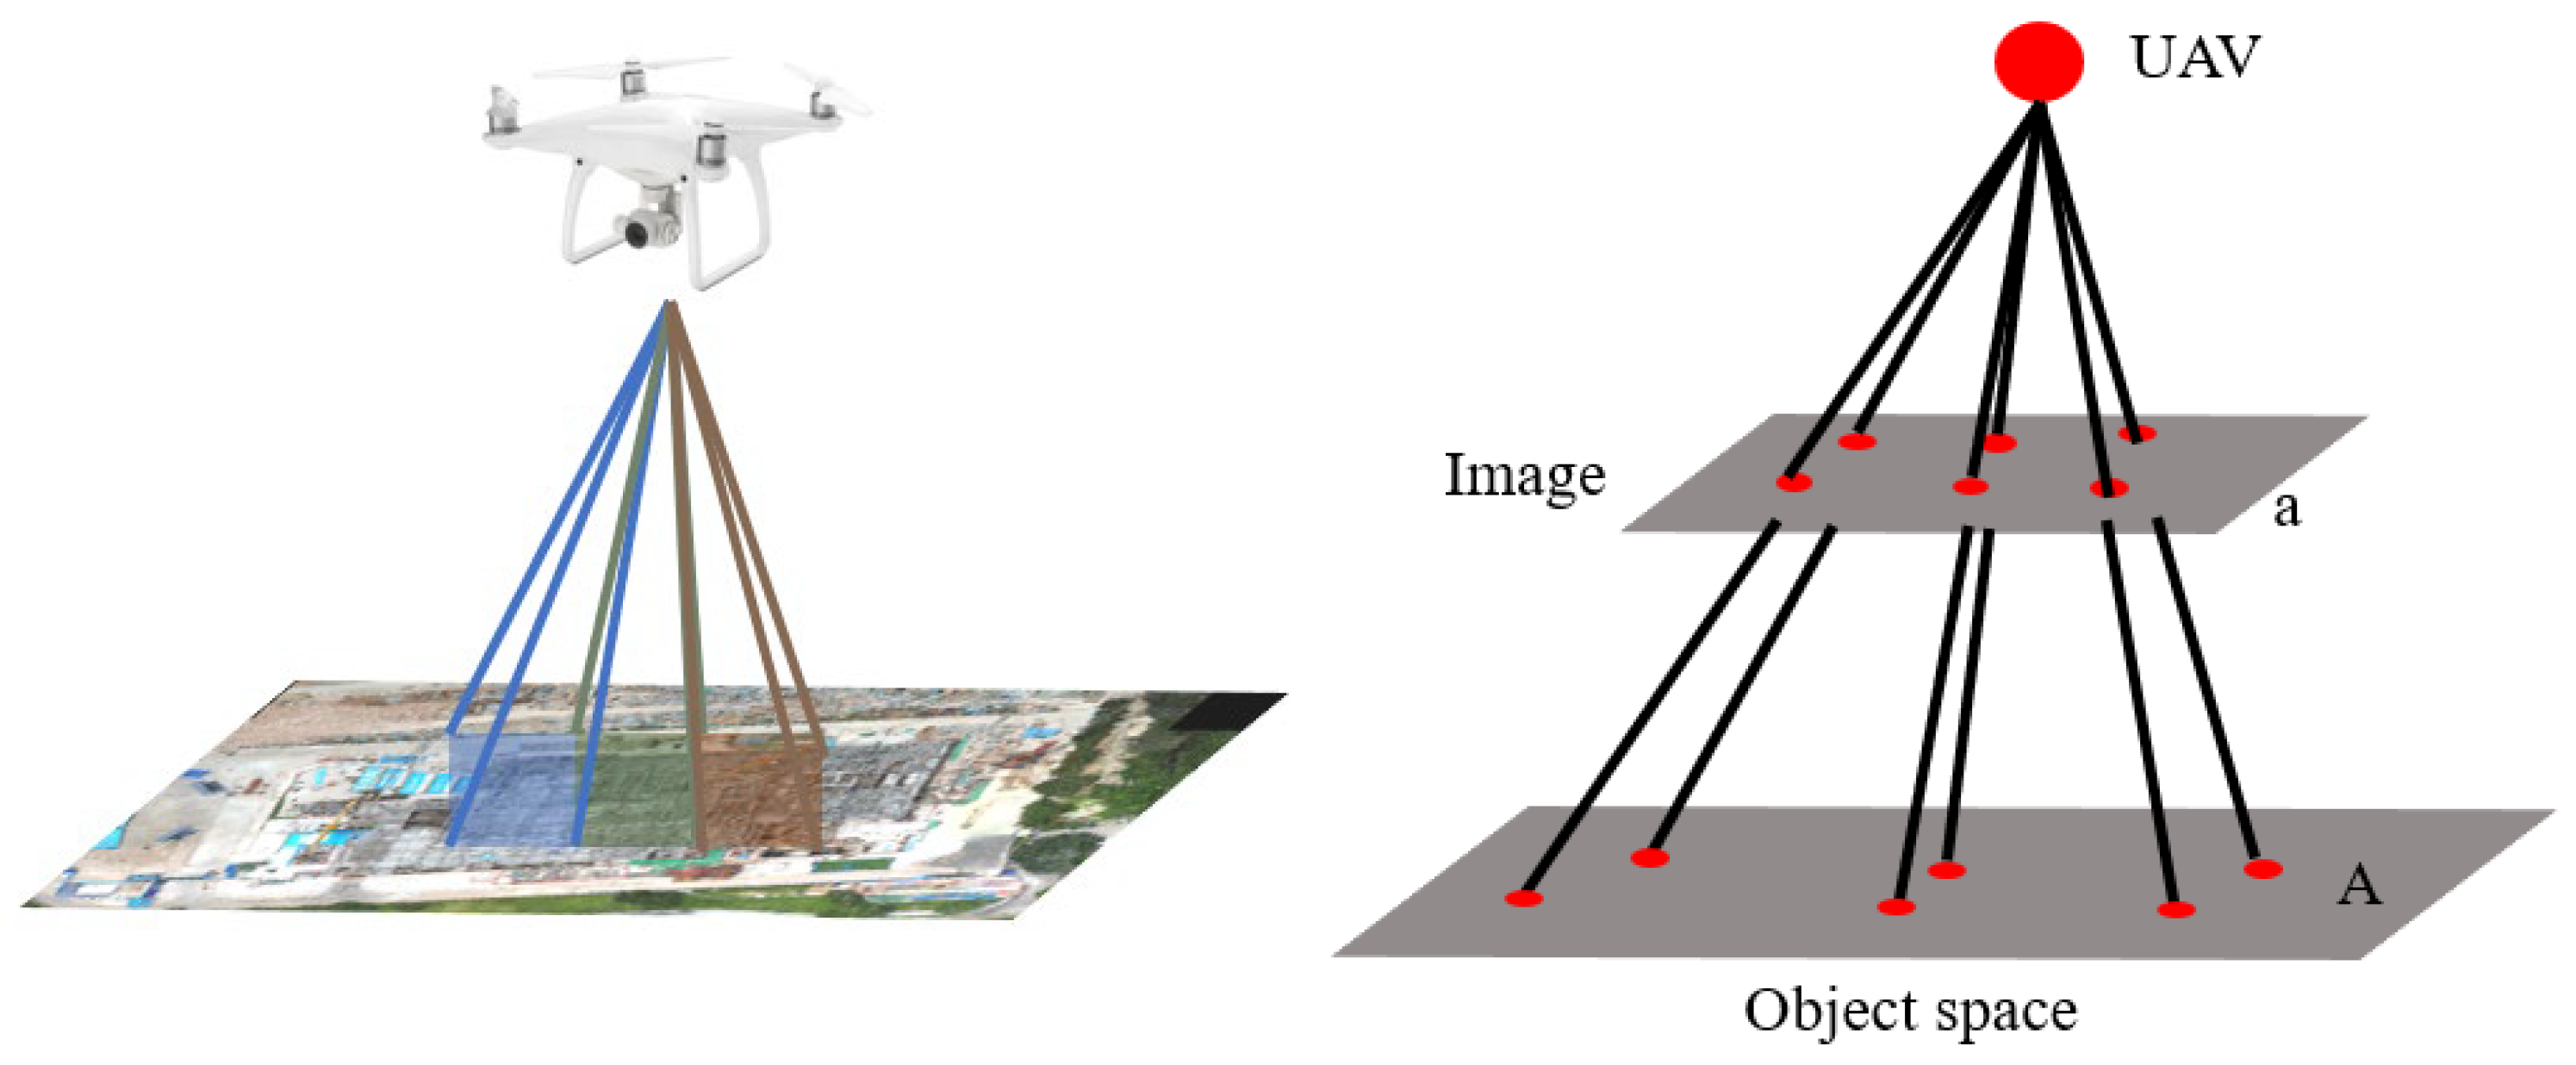
Aerial triangulation is a fundamental step in UAV-based 3D reconstruction, based on the photogrammetric collinearity equation. This principle states that the object point, imaging center, and image point are collinear, allowing for the precise determination of ground target positions and elevations [
42] (see
Figure 4). The methodology combines Multi-View Stereo (MVS) and Structure from Motion (SfM) techniques [
43,
44], leveraging their complementary strengths to improve reconstruction accuracy.
In this study, the Scale-Invariant Feature Transform (SIFT) algorithm [
45] is applied during the SfM stage to efficiently and robustly match feature points across multiple views. This process is refined through iterative Bundle Adjustment (BA), resulting in a sparse point cloud that represents the underlying structure (
Figure 5a). In the subsequent MVS stage, the incorporation of additional feature points and descriptors enhances point cloud density, producing a highly detailed and refined 3D model (
Figure 5b).
Together, these algorithms and processes form the core workflow for generating accurate point clouds and 3D models. By importing the UAV oblique photography data into iTwin Capture Modeler 2023, the desired results can be generated with a single click.
To briefly demonstrate this method, a simple rectangular box was scanned using a UAV (
Figure 6). Based on the structural characteristics of the box, oblique photography was performed. The UAV circled above the box at an angle of approximately −60°, ensuring a forward overlap ratio exceeding 80%. Nine images were captured from different angles (
Figure 6a), and the images along with UAV pose data were imported into Itwin Capture Modeler (v24.1.4.380) software for aerial triangulation (
Figure 6b) and match feature points across multiple perspectives, generating a point cloud model of the target object (
Figure 6c).
Owing to the inherent limitations of UAV equipment, noise and outliers are often introduced during the acquisition of structural point cloud data. These imperfections are unavoidable and require optimization and filtering of the raw data to improve the accuracy of subsequent calculations. In this study, a Statistical Outlier Removal (SOR) filter, one of the most commonly used methods for this purpose [
46], is applied. The SOR method involves the following steps:
Nearest Neighbor Search: For each point in the point cloud, the number of nearest neighbors is defined, and the search is performed using the K-Nearest Neighbors (KNNs) algorithm.
Average Distance Calculation: The average distance of each point to its nearest neighbors is computed.
Global Statistics Calculation: The mean and standard deviation of the average distances for all points in the point cloud are determined.
Outlier Detection and Removal: Assuming the calculated distances follow a Gaussian distribution, points whose average distances fall outside a predefined range (based on the mean and standard deviation) are identified as outliers and removed.
This method effectively reduces noise and outliers, improving the quality and reliability of the point cloud data for subsequent 3D reconstruction and analysis. By incorporating SOR into the data preprocessing pipeline, the proposed approach ensures enhanced accuracy and robustness in UAV-based structural modeling.
2.5. The Limitations of UAV Oblique Photography Technology
Although UAVs offer significant advantages for building inspection, their application remains subject to several constraints that can affect the accuracy and reliability of the results. Positioning accuracy depends heavily on the GPS system; in practical applications, centimeter-level errors may occur, especially when inspecting complex building structures, leading to noticeable data deviations. Weather conditions—such as strong winds, rain, or haze—can cause image blurring, data loss, or even flight safety risks. Lighting variations, including overexposure and shadows, also influence image quality and the precision of feature extraction. Environmental obstructions, such as dense frameworks or construction equipment, may block the UAV’s line of sight, resulting in incomplete data capture and blind spots that complicate subsequent processing. Battery life and payload capacity limit the range of a single flight, necessitating multiple sorties for large-scale inspections and increasing operational complexity and time costs. Moreover, regulatory and safety restrictions may limit UAV operations in densely populated areas or controlled airspace, requiring licensed operators with sufficient technical expertise. Finally, data processing presents an additional challenge: the large volume of point cloud data demands high-performance computing resources and advanced algorithms, which may cause computational bottlenecks in complex projects.
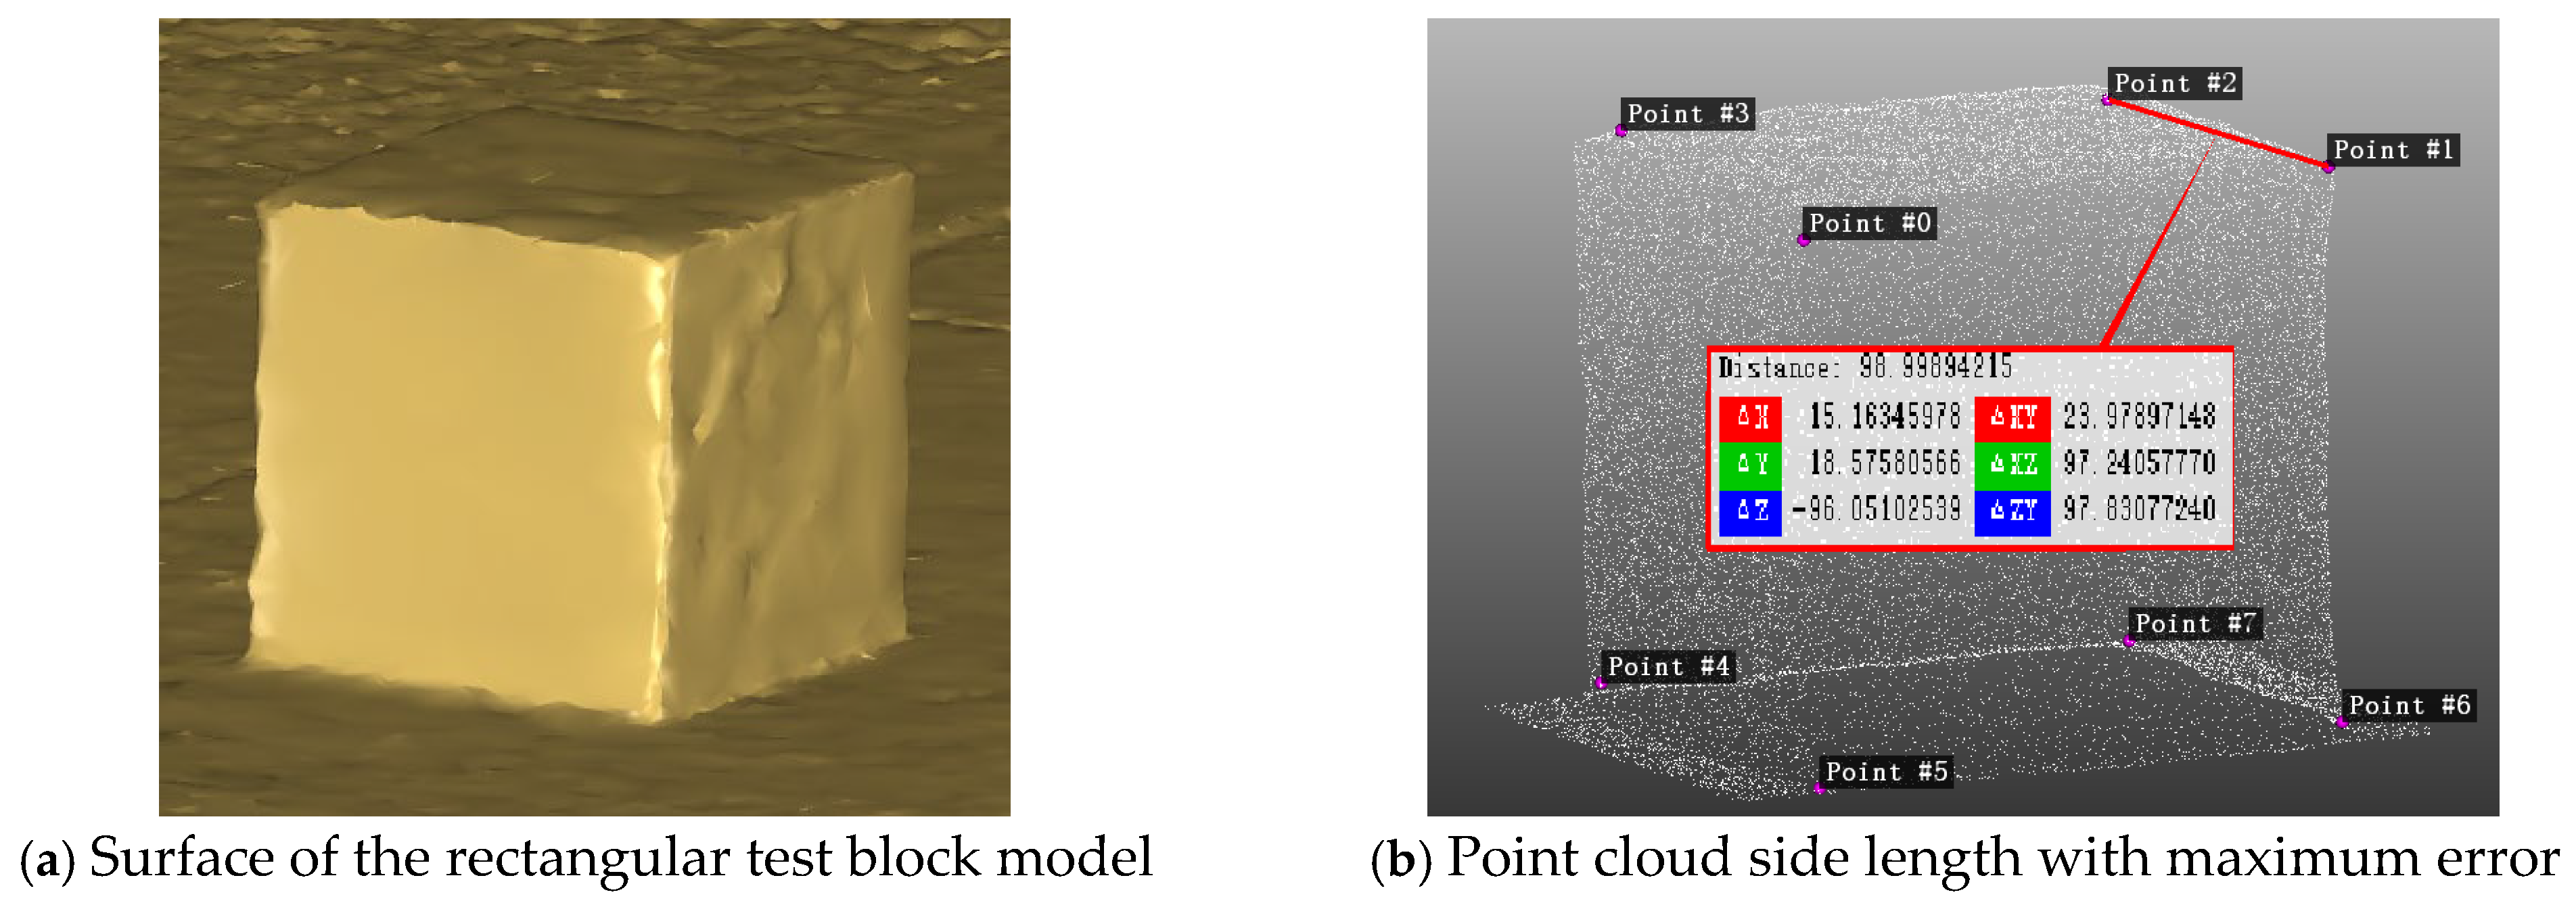
To evaluate the accuracy of the point cloud generated from UAV scanning, a rectangular test block (
Figure 6) was modeled and analyzed. The surface details of the reconstructed model are shown in
Figure 7a. The model was converted into a point cloud, and the edge lengths of the outer surface were measured (
Figure 7b). The side with the largest error measured 98.9989 mm, while its actual length was 99.81 mm, resulting in a maximum relative error of 0.82%. This verification demonstrates that the point cloud generated by the UAV-based method meets the accuracy requirements for subsequent structural analysis and geometric deviation evaluation.
2.6. Model Building and Feature Extraction
2.6.1. Building Visual Models
For the filtered and noise-reduced point cloud, the Delaunay triangulation algorithm is applied to partition the data points into a triangular mesh based on their spatial distribution, thereby constructing a Digital Surface Model (DSM) of the structure, as shown in
Figure 8a. Next, image texture mapping is performed on the DSM, integrating real-world textures onto the 3D model to enhance visual fidelity and realism [
47], as illustrated in
Figure 8b. This step not only improves the geometric representation of the structure but also bridges the gap between geometric accuracy and visual realism, ensuring a comprehensive and precise 3D reconstruction suitable for various practical applications.
2.6.2. Point Cloud Feature Processing and Axis Extraction
The DSM, constructed from extensive point cloud data, allows each triangulated segment to capture specific geometric properties of the structure. However, it often fails to efficiently represent the overall trend of structural members due to its inherent redundancy. To address this limitation, this study proposes a method for extracting the structural surface axis to characterize the angles of the components.
First, leveraging the characteristics of UAV-based aerial photogrammetry, distinct color blocks are assigned to point clouds corresponding to different measurement areas, as shown in
Figure 9a. This enables the selection of modular point clouds specific to the steel structure region from the overall point cloud, significantly reducing the data volume for subsequent processing. Next, principal component analysis (PCA) is applied to determine the minimum enclosing box of the steel structure point cloud, as illustrated in
Figure 9b. By adjusting the positions of the three principal component planes of the enclosing box, a refined point cloud containing only the roof steel structure is obtained (see
Figure 10a,b).
This approach not only enhances computational efficiency but also provides a more accurate representation of the structural surface axis, facilitating the characterization of component angles with greater precision.
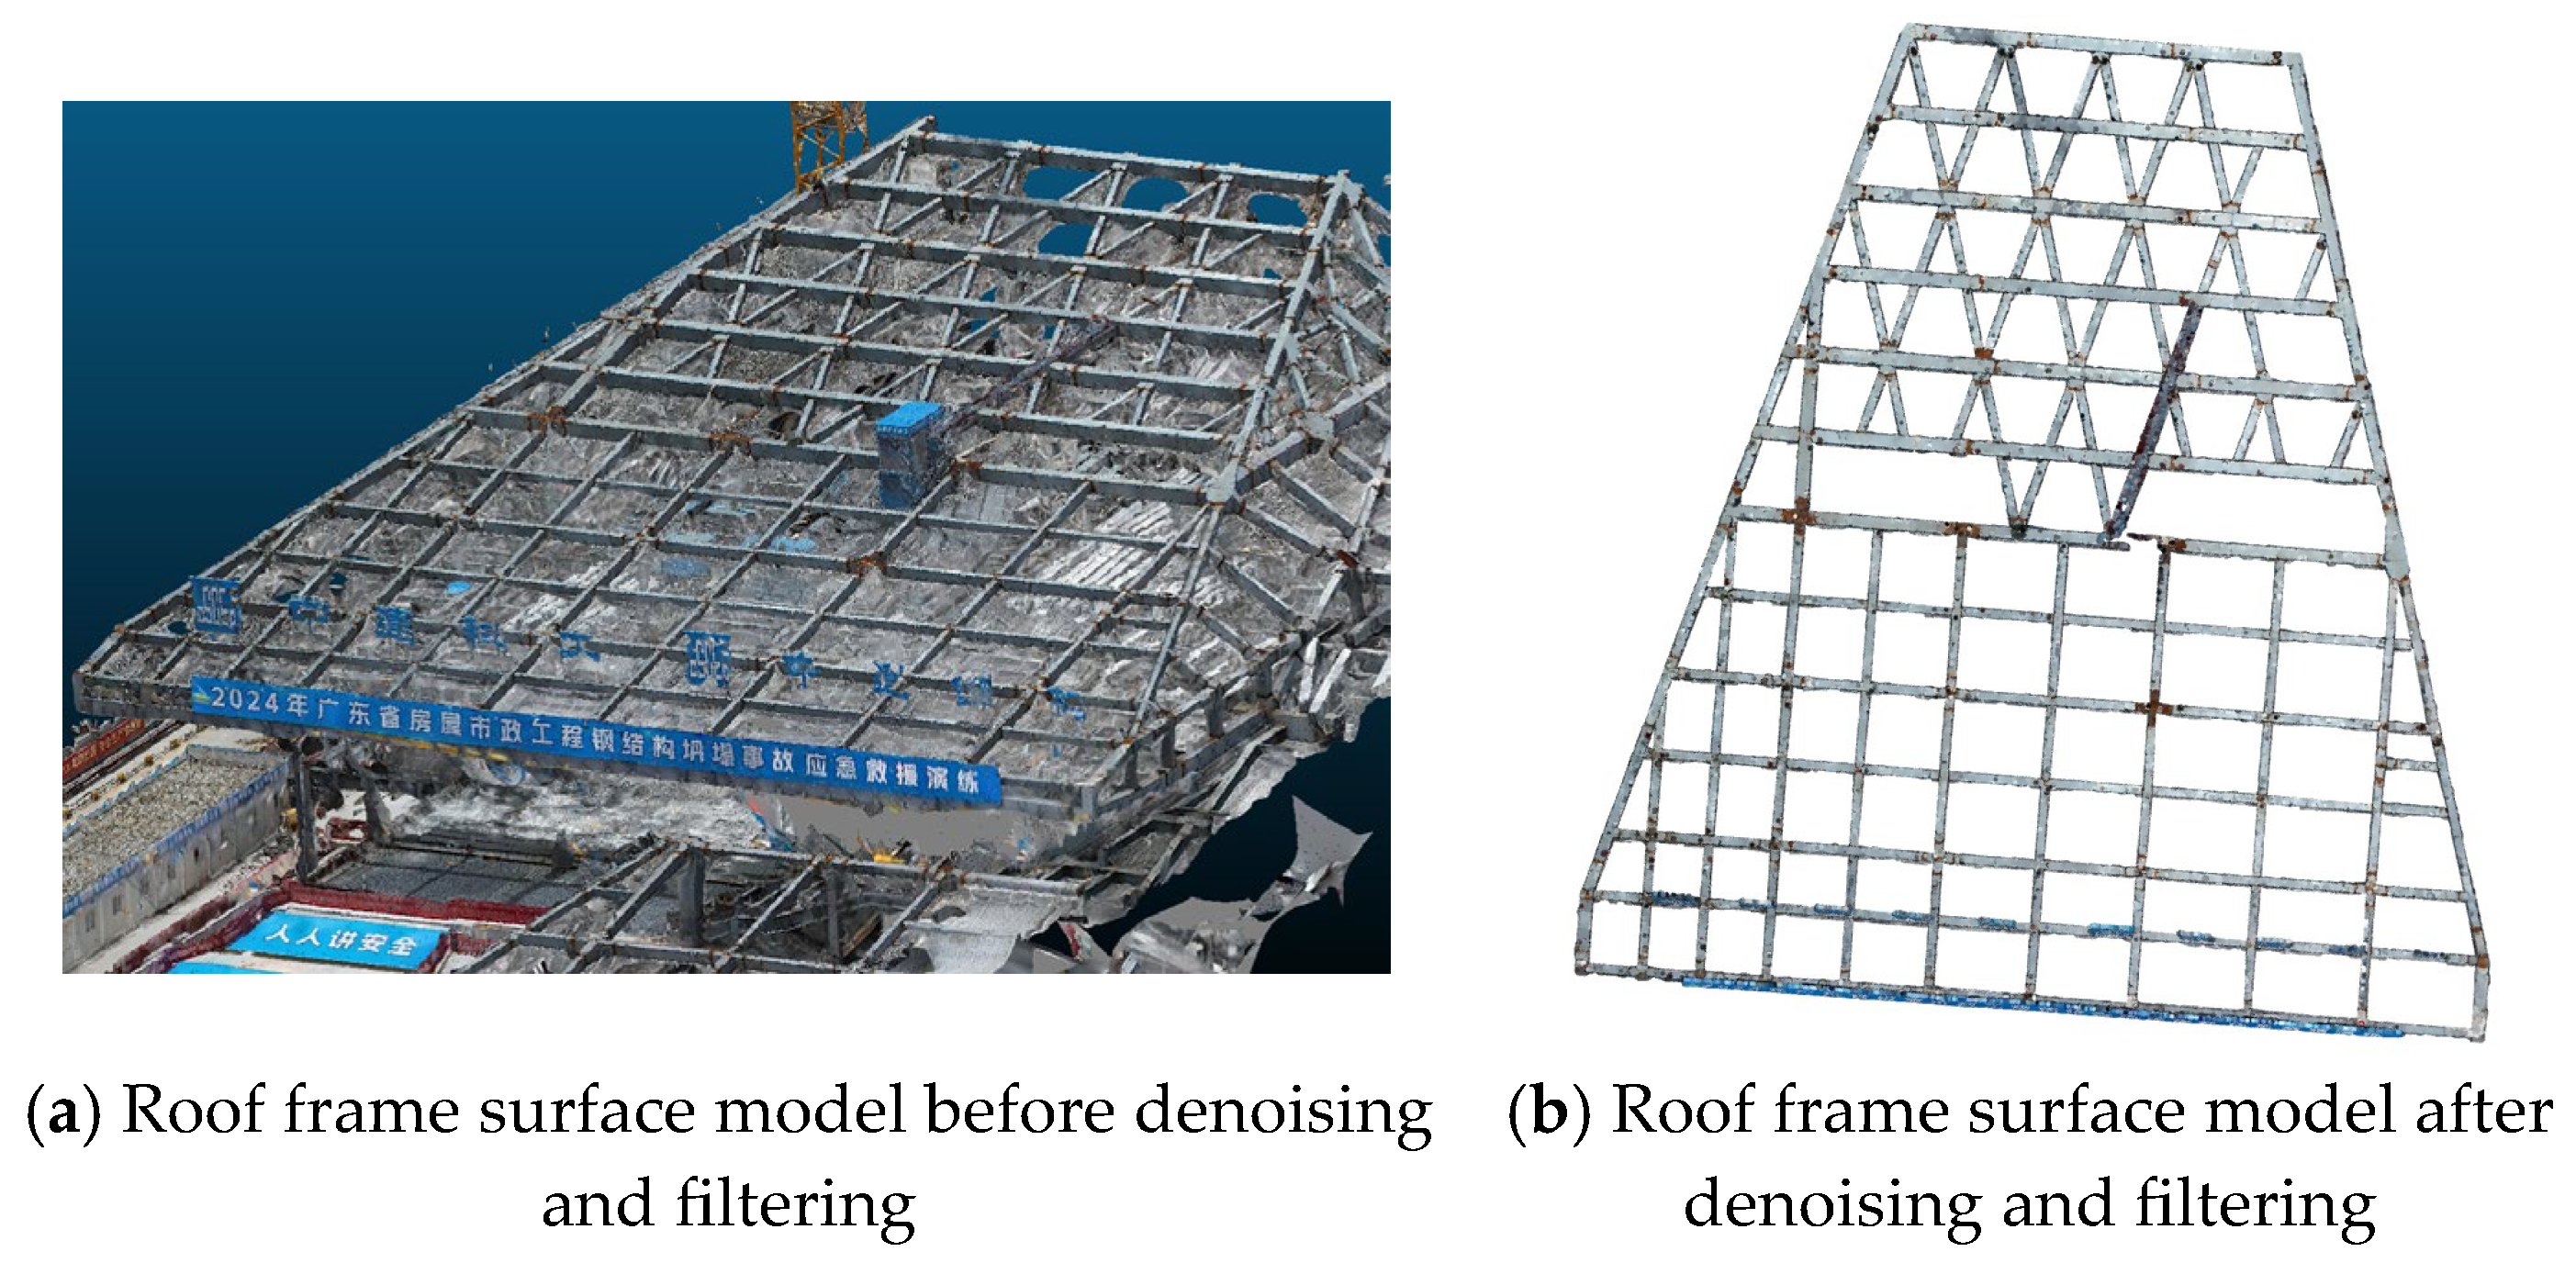
At the construction site, the roof’s upper surface is covered with a fall protection safety net to ensure personnel safety. However, the presence of the safety net significantly interferes with subsequent feature extraction, necessitating its removal. Due to the high density of the safety net point cloud and its direct contact with the roof surface, conventional noise reduction and filtering algorithms are ineffective. To address this issue, two scenarios are considered:
Scenario 1: Availability of a Roof Design Model
When a roof design model is available, it is sampled to generate a standard mesh point cloud. The UAV-acquired point cloud is then matched with the nearest neighbor points in the sampled model, resulting in a denoised steel structure point cloud.
Scenario 2: Absence of a Roof Design Model
In the absence of a roof design model, representative nodes and component point clouds are manually labeled. These labeled data are then combined with machine learning algorithms, such as the CANUPO classifier, to extract the clean point cloud of the roof steel structure. CANUPO is a machine learning-based point cloud classification algorithm, primarily used to extract specific categories of points from complex point cloud data.
Given the uniform cross-sectional characteristics of roof steel structure members, this study employs a machine learning approach. Individual members and nodes from the central region of the roof are selected as a small training dataset. The trained model is then applied to the overall structural point cloud to efficiently extract the steel structure point cloud (see
Figure 10c).
This method not only overcomes the limitations of conventional noise reduction techniques but also ensures accurate and efficient extraction of structural features, even in the presence of complex safety net interference, as shown in
Figure 11 and
Figure 12.
Due to the higher presence of noise and outlier interference in UAV scanning compared to terrestrial 3D laser scanning (TLS), it is essential to first apply the RANSAC (Random Sample Consensus) algorithm to fit a plane to the point cloud model of the roof’s steel surface. RANSAC [
48] is an iterative algorithm widely used to estimate model parameters from data containing outliers. It works by repeatedly calculating the plane model, counting the number of inlier points, and selecting the model with the highest number of inliers as the optimal plane. The model parameters are then re-estimated using these inliers to enhance accuracy.
The core advantage of RANSAC lies in its ability to automatically identify and exclude outliers, focusing on fitting the inliers. Although a sensitivity analysis was not performed in this study, the algorithm’s design ensures robust performance in complex data scenarios. Future work could consider further validating the stability of RANSAC under various parameter settings to optimize the results.
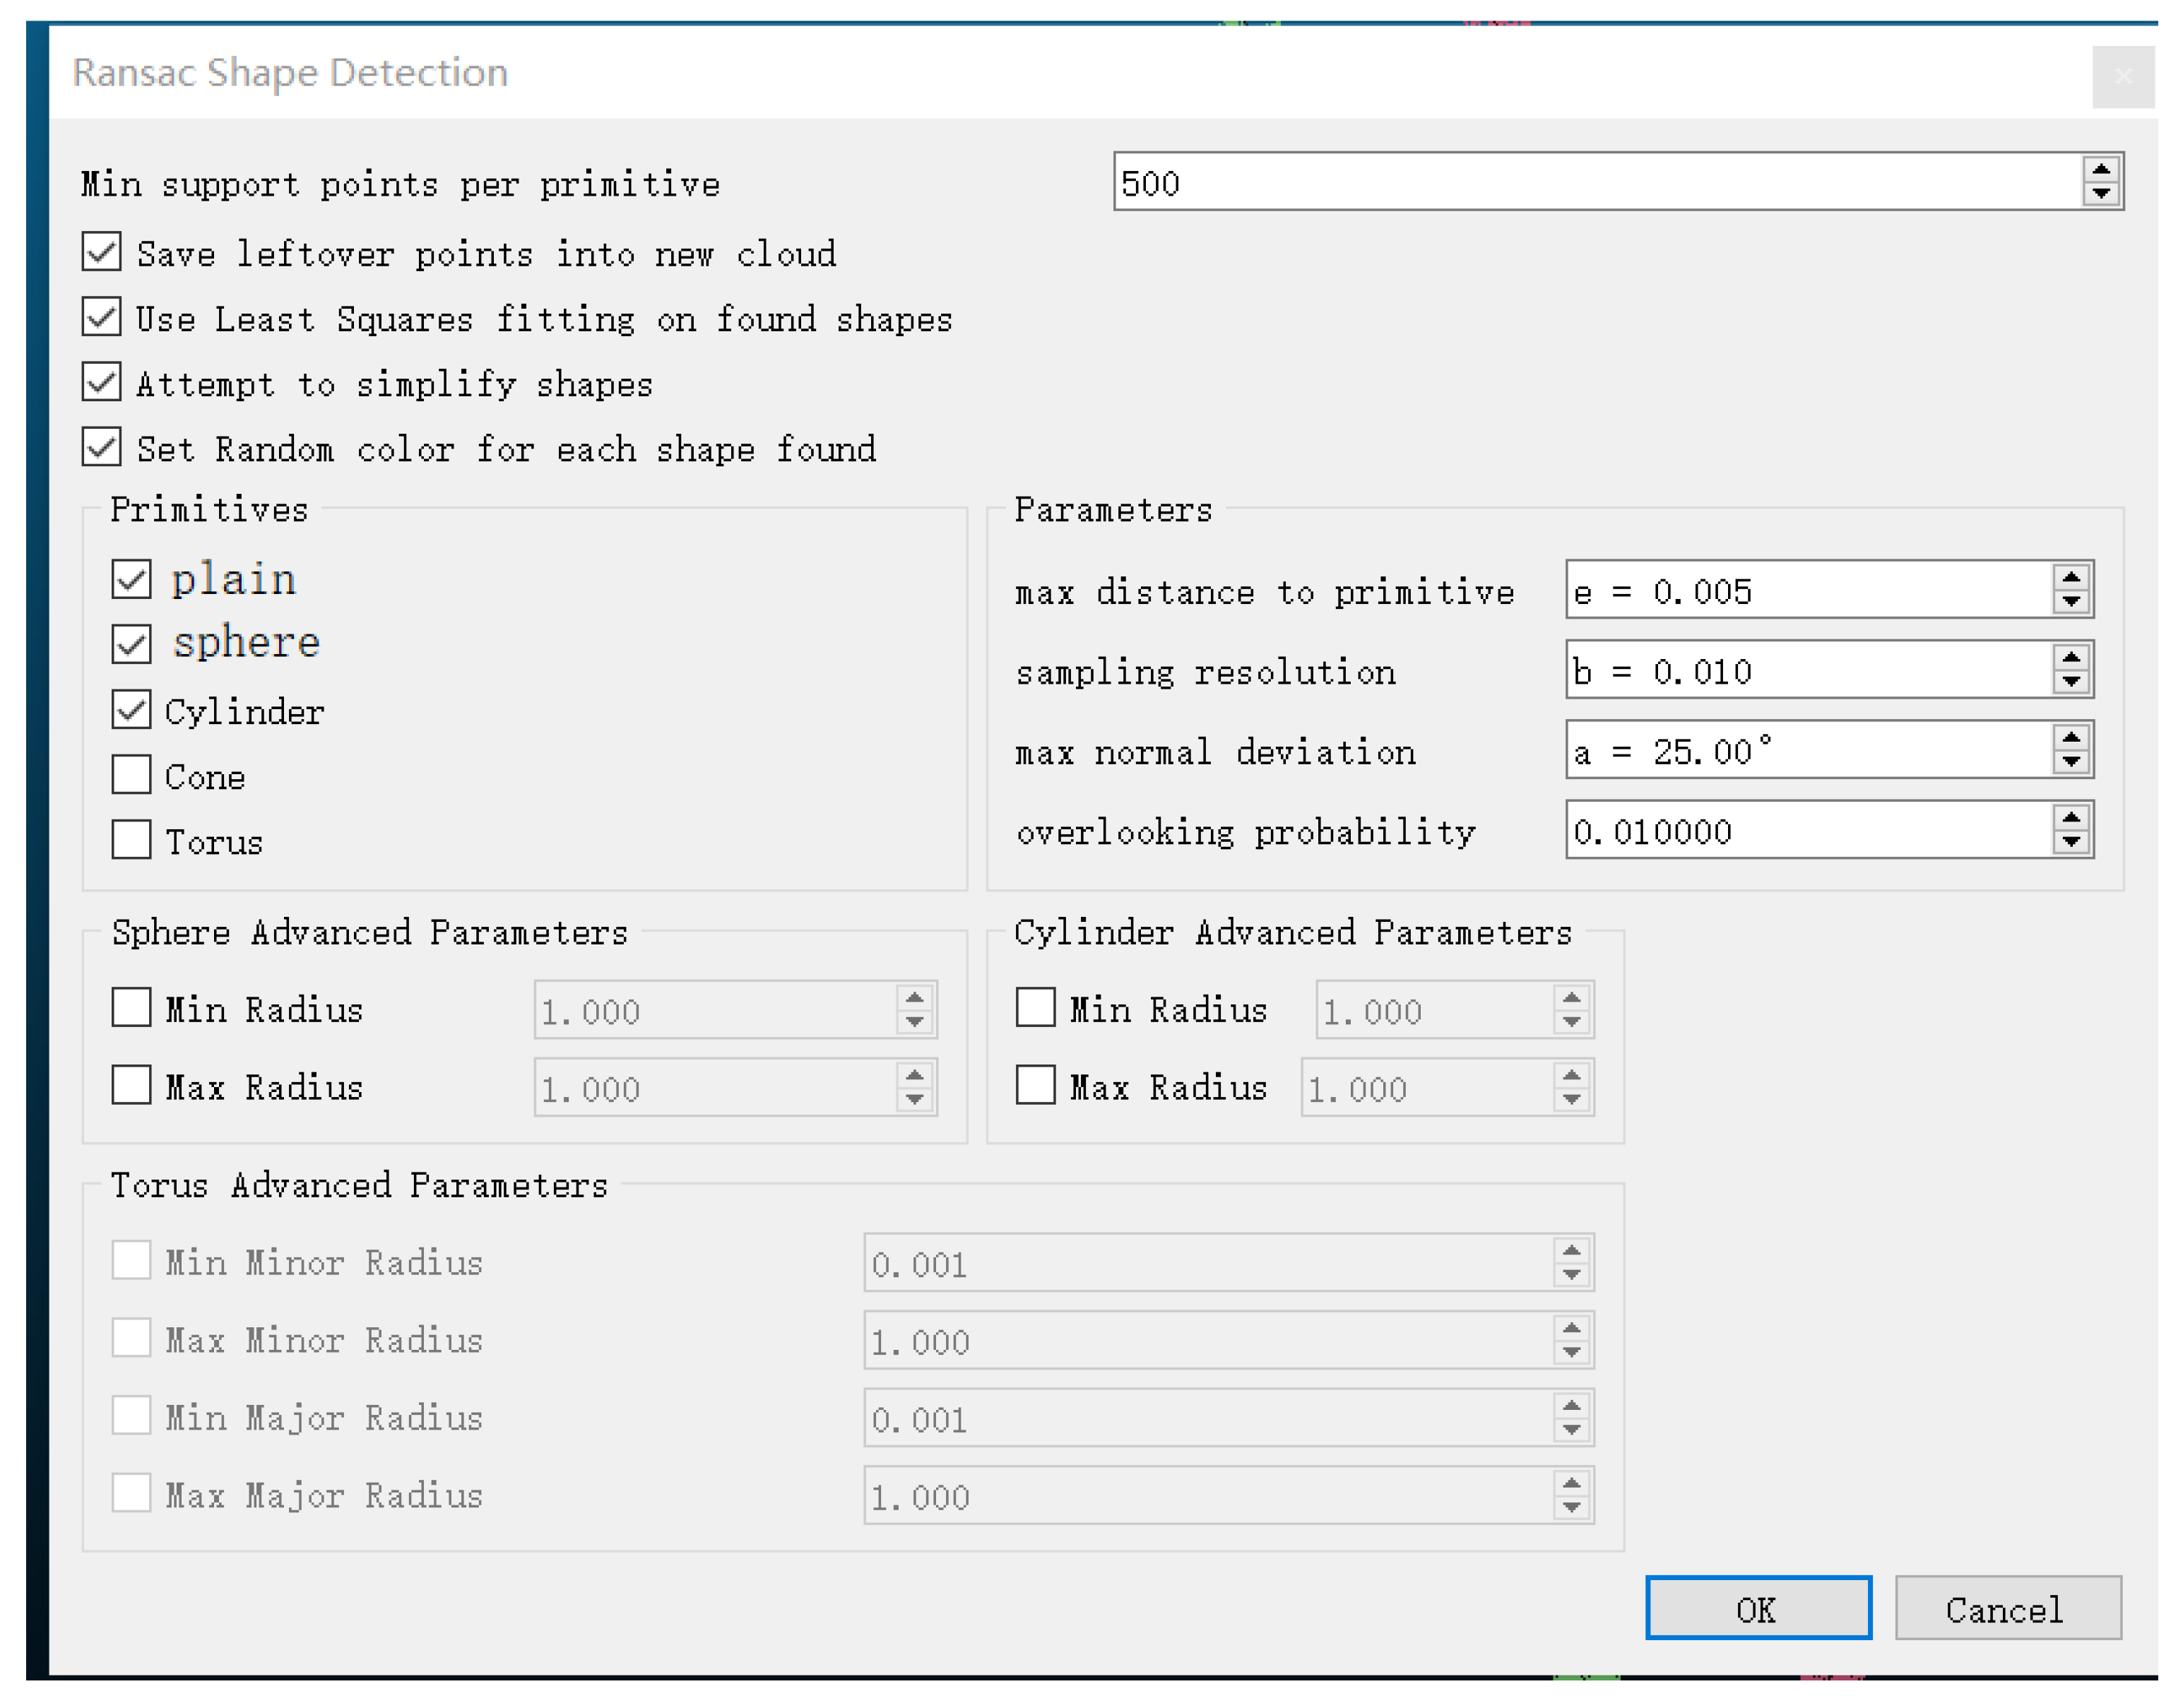
The specific parameter settings for the RANSAC algorithm are shown in
Figure 12. The calculation process was performed in the CloudCompare software (version 2.14).
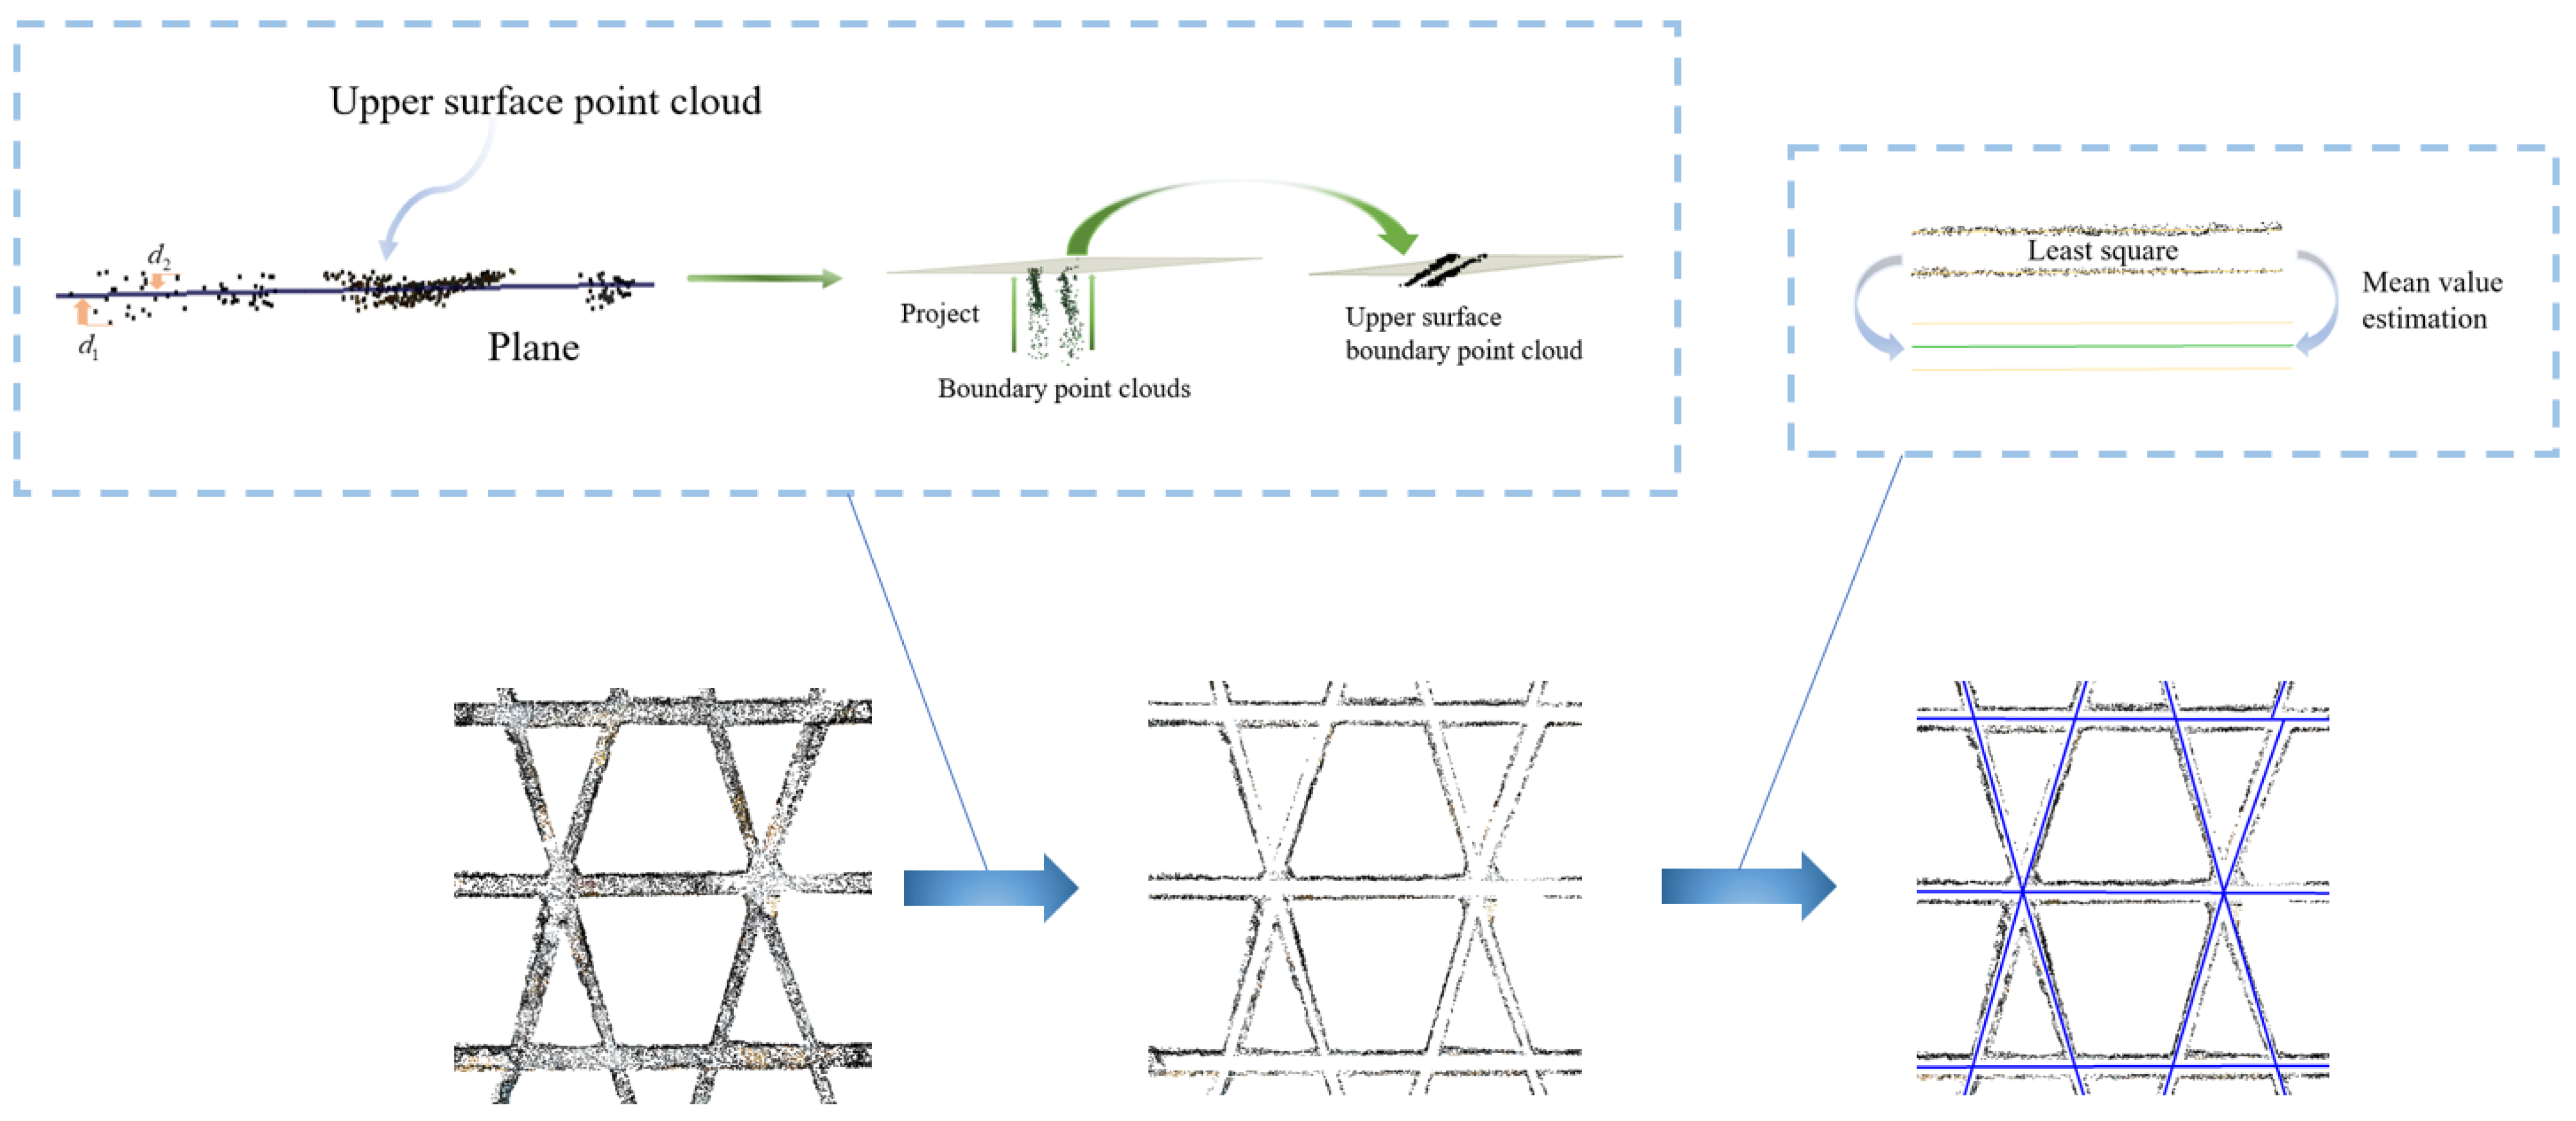
After extracting the upper surface plane of each component using the RANSAC algorithm, the plane boundaries are delineated. The outer points identified during plane fitting are projected onto the plane, and the edges of the upper surface are determined using the Angle Criterion. Subsequently, the center axis of the surface is derived based on the extracted edge features [
49], as shown in
Figure 13 and
Figure 14.
Through this process, the axis model of the roof’s upper steel surface is accurately computed. This method effectively mitigates the influence of noise and outliers inherent in UAV scanning and ensures a precise geometric representation of the structural components.
3. Results of the Analysis and Discussion
To determine the deviation between the as-built roof steel structure and the design, the surface center axes extracted from the point cloud features were compared with the roof steel structure layout in the design drawings. A semi-automatic structural model matching method was employed, consisting of the following steps. Only the initial stage—selection of control points—was performed manually, while all subsequent steps were fully automated. Specifically, several initial control points were manually selected in the transition areas between different roof forms to provide a preliminary transformation matrix. The Iterative Closest Point (ICP) algorithm [
50] was then applied to refine the registration by calculating the Euclidean distances between corresponding points in the two axial maps. A KD-Tree structure was used to search for nearest neighbors, and the least-squares method was iteratively applied to minimize matching errors. The ICP algorithm parameters were configured in CloudCompare software, as shown in
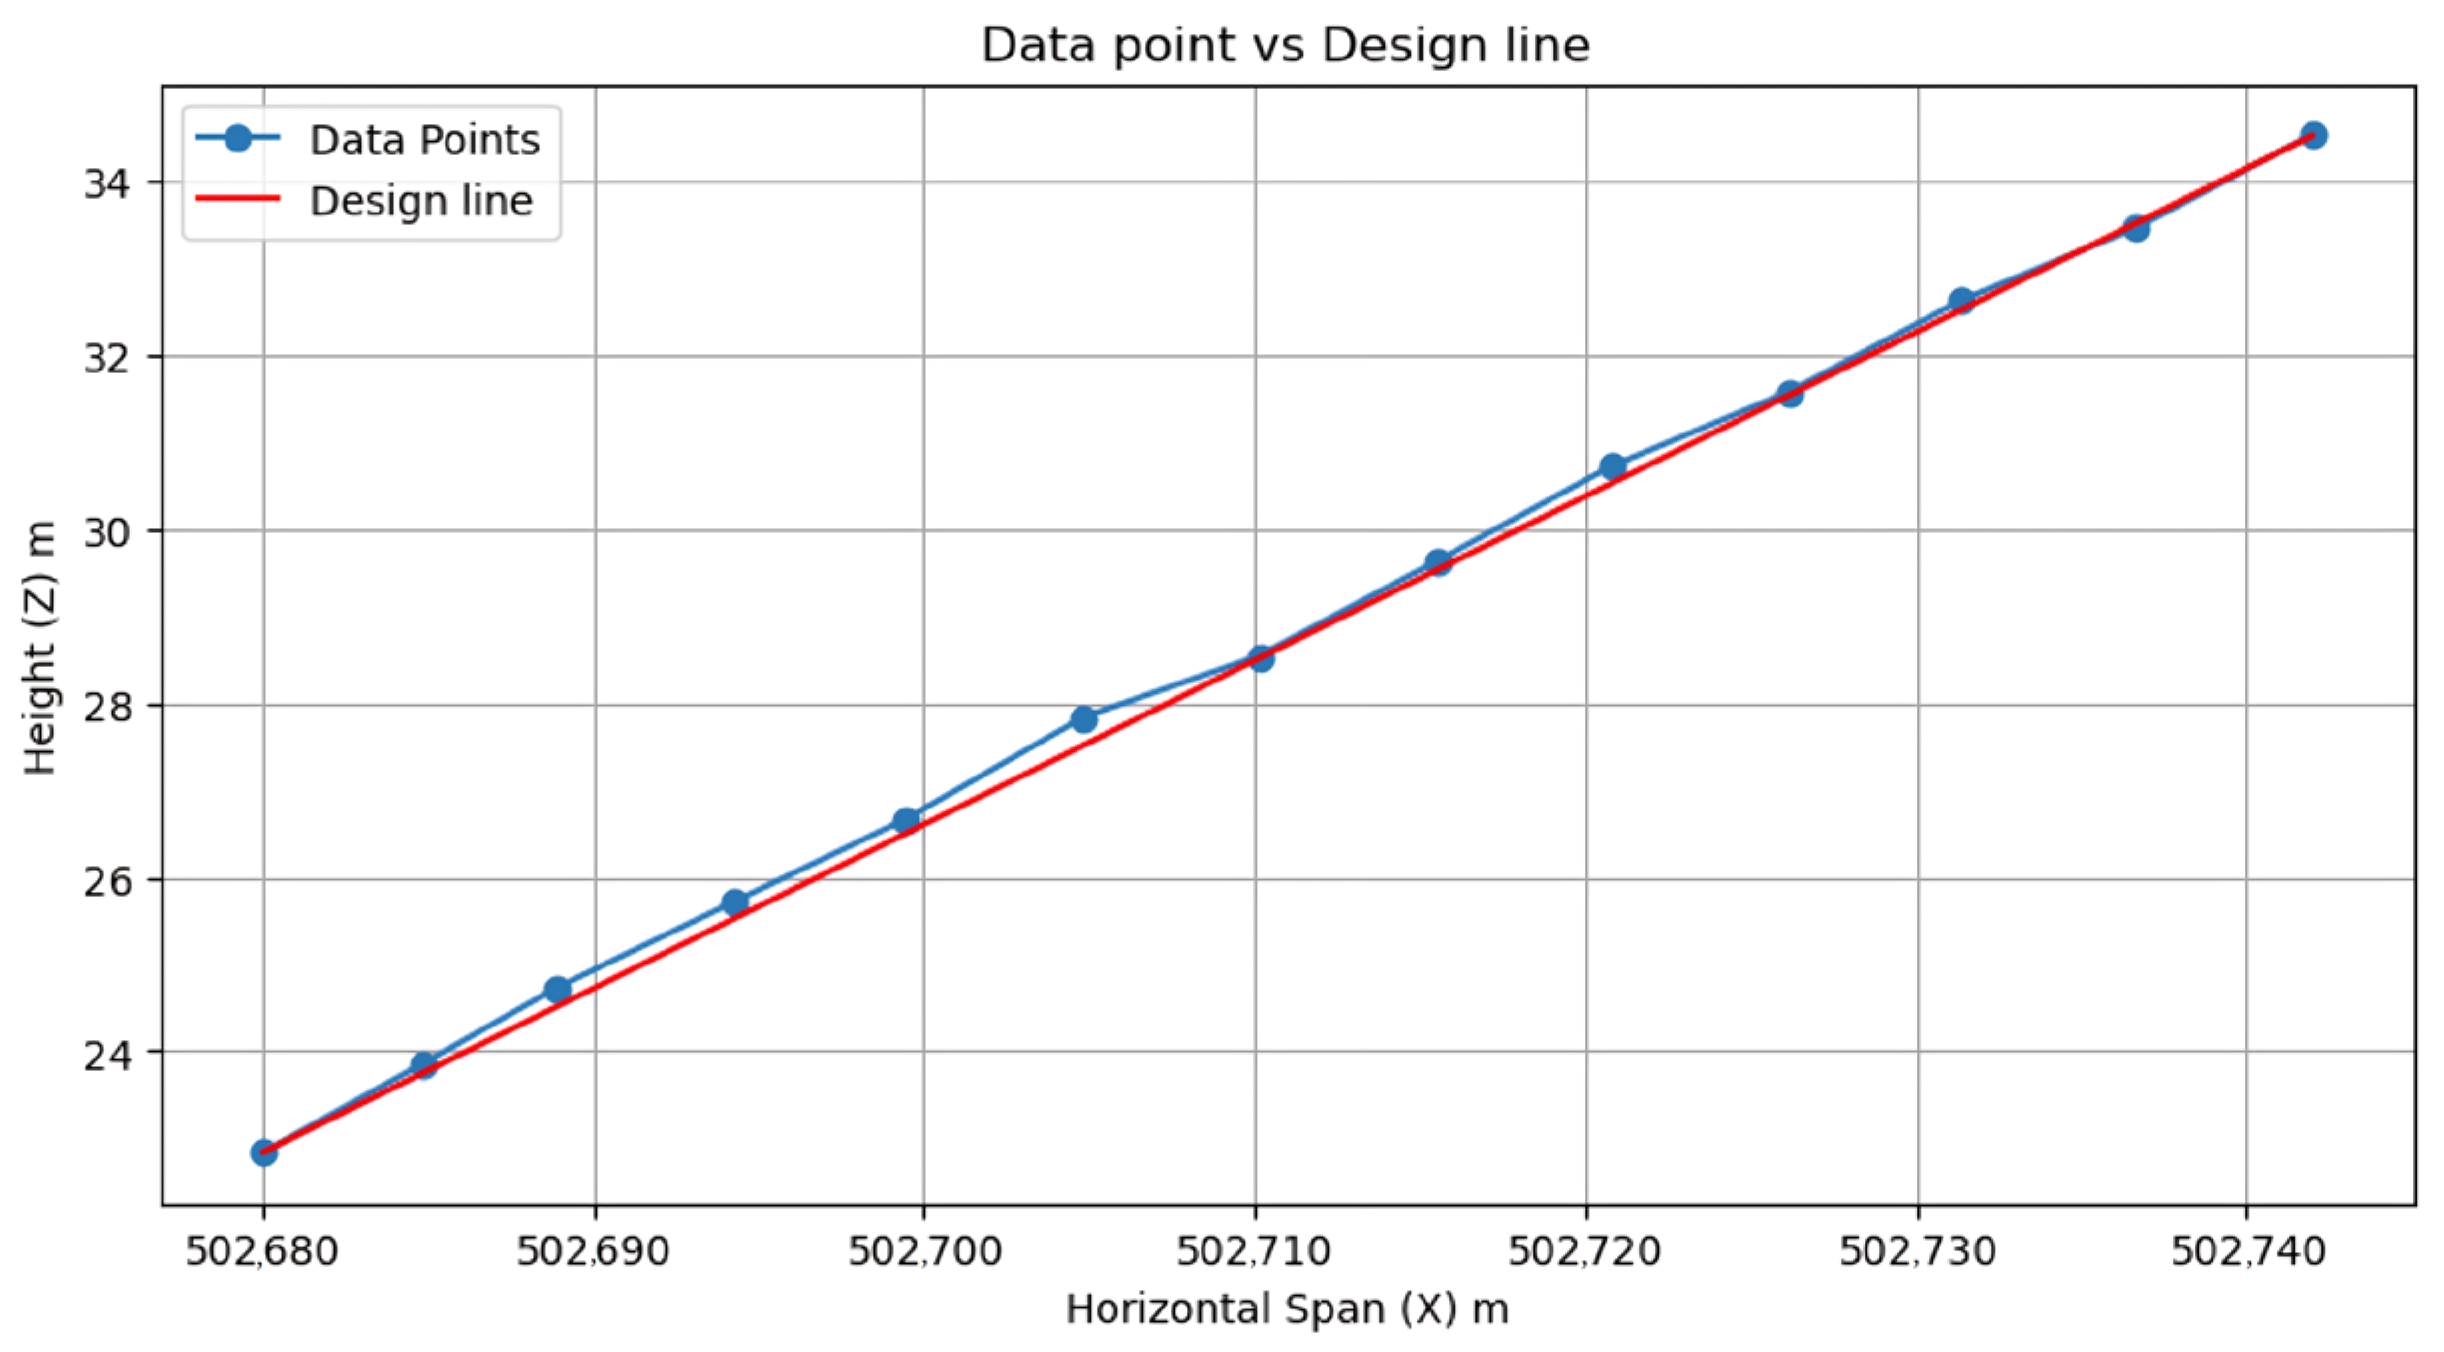
Figure 15, and the comparative analysis of the measured and design data is presented in
Figure 16.
Manual intervention accounted for approximately 15% of the total processing time, limited solely to the initial control point selection, with an average of 5–6 points selected per area. The subsequent point cloud registration and alignment were automatically executed in CloudCompare. The main control parameters were a maximum registration error of 0.012 m, a minimum overlap ratio of 20%, and a maximum target error of 0.01 m. Under these settings, the ICP-based automatic registration achieved a 100% convergence rate with an average residual below 0.008 m, demonstrating high matching accuracy and strong algorithmic robustness.
where
,
are the two point-sets to be aligned, respectively, n is the number of points in the point set,
is the distance between all corresponding points. The average distance, which is calculated by the above equation, is compared with the pre-set threshold T to determine whether to end the iterative computation.
By comparing the as-built steel structure layout with the design layout, deviations between construction and design were quantified to serve as a basis for construction quality management. The analysis of the collision comparison diagram revealed that most of the steel members were well aligned with the design, with significant deviations observed only in a few local areas, where the maximum planar deviation reached approximately 73 mm.
The above results represent the planar layout comparison. However, due to the sloped geometry of this large-span roof, it is also necessary to control the elevation of each node. In this study, the mean elevation of the intersection nodes along each axis was evaluated to represent the elevation of the upper surface of the structural components in each region, and was compared with the control elevations specified in the design drawings. The analysis indicates that the construction achieved finer elevation control at the beginning, middle, and end sections of the roof steel structure, corresponding to two different boundary forms. In most areas, the elevation deviation ranged between 5 and 50 mm, while slightly larger deviations were detected in the central and lower regions, with a maximum deviation of approximately 170 mm.
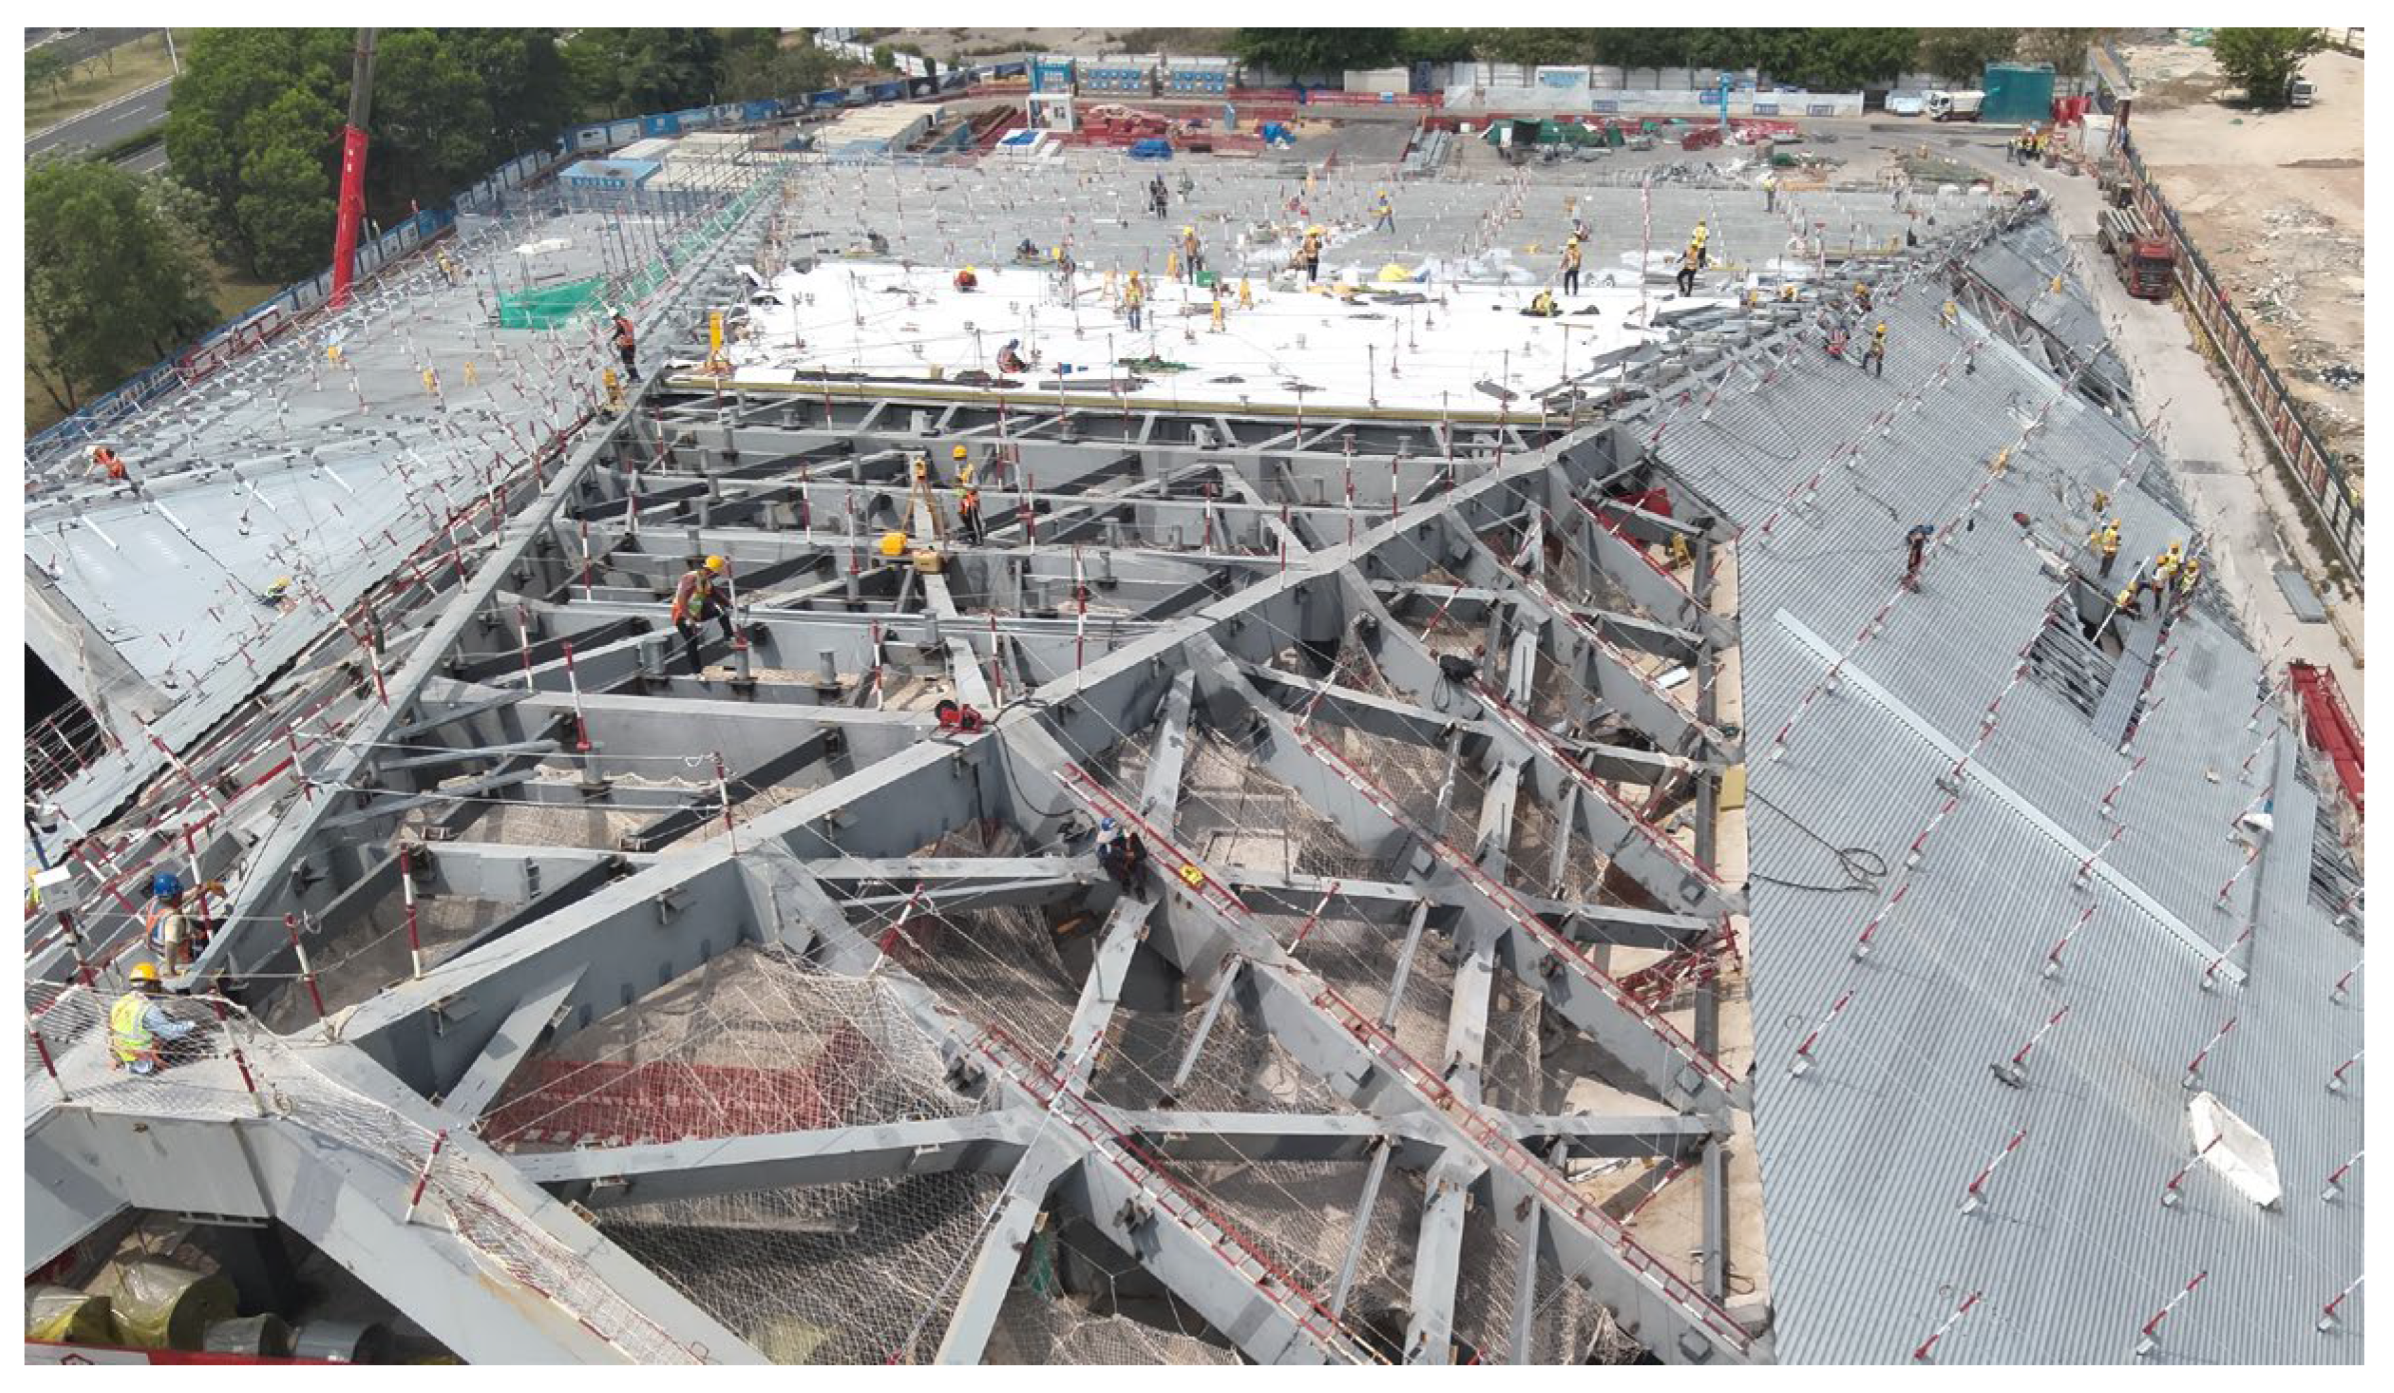
Field observations confirmed that construction activities, safety nets, and other on-site equipment in this region likely introduced interference during UAV data acquisition, resulting in reduced filtering and noise suppression accuracy, which in turn caused overestimation of the calculated elevations (see
Figure 17).
According to the Code for Acceptance of Construction Quality of Steel Structures (GB 50205-2020) [
51], for main steel structures with a height below 60 m, the allowable elevation deviation should be within ±H/1000 and not exceed ±30 mm, while the deviation of the support center from the positioning axis should not exceed 10 mm. In this project, the actual construction deviations were within ±5 mm, fully meeting the code requirements.
The roof truss system includes numerous safety nets and guardrails (see
Figure 17). Cylindrical protrusions frequently occur beneath the railings, and although these components were batch-removed through algorithmic filtering of the point cloud data, they remain a major source of local elevation deviation. Similar structural features were also present in the problematic area. Based on multiple verifications and on-site inspections, it is inferred that occasional strong winds during UAV data acquisition likely reduced the image-matching accuracy, leading to the observed elevation deviations, see
Figure 18.
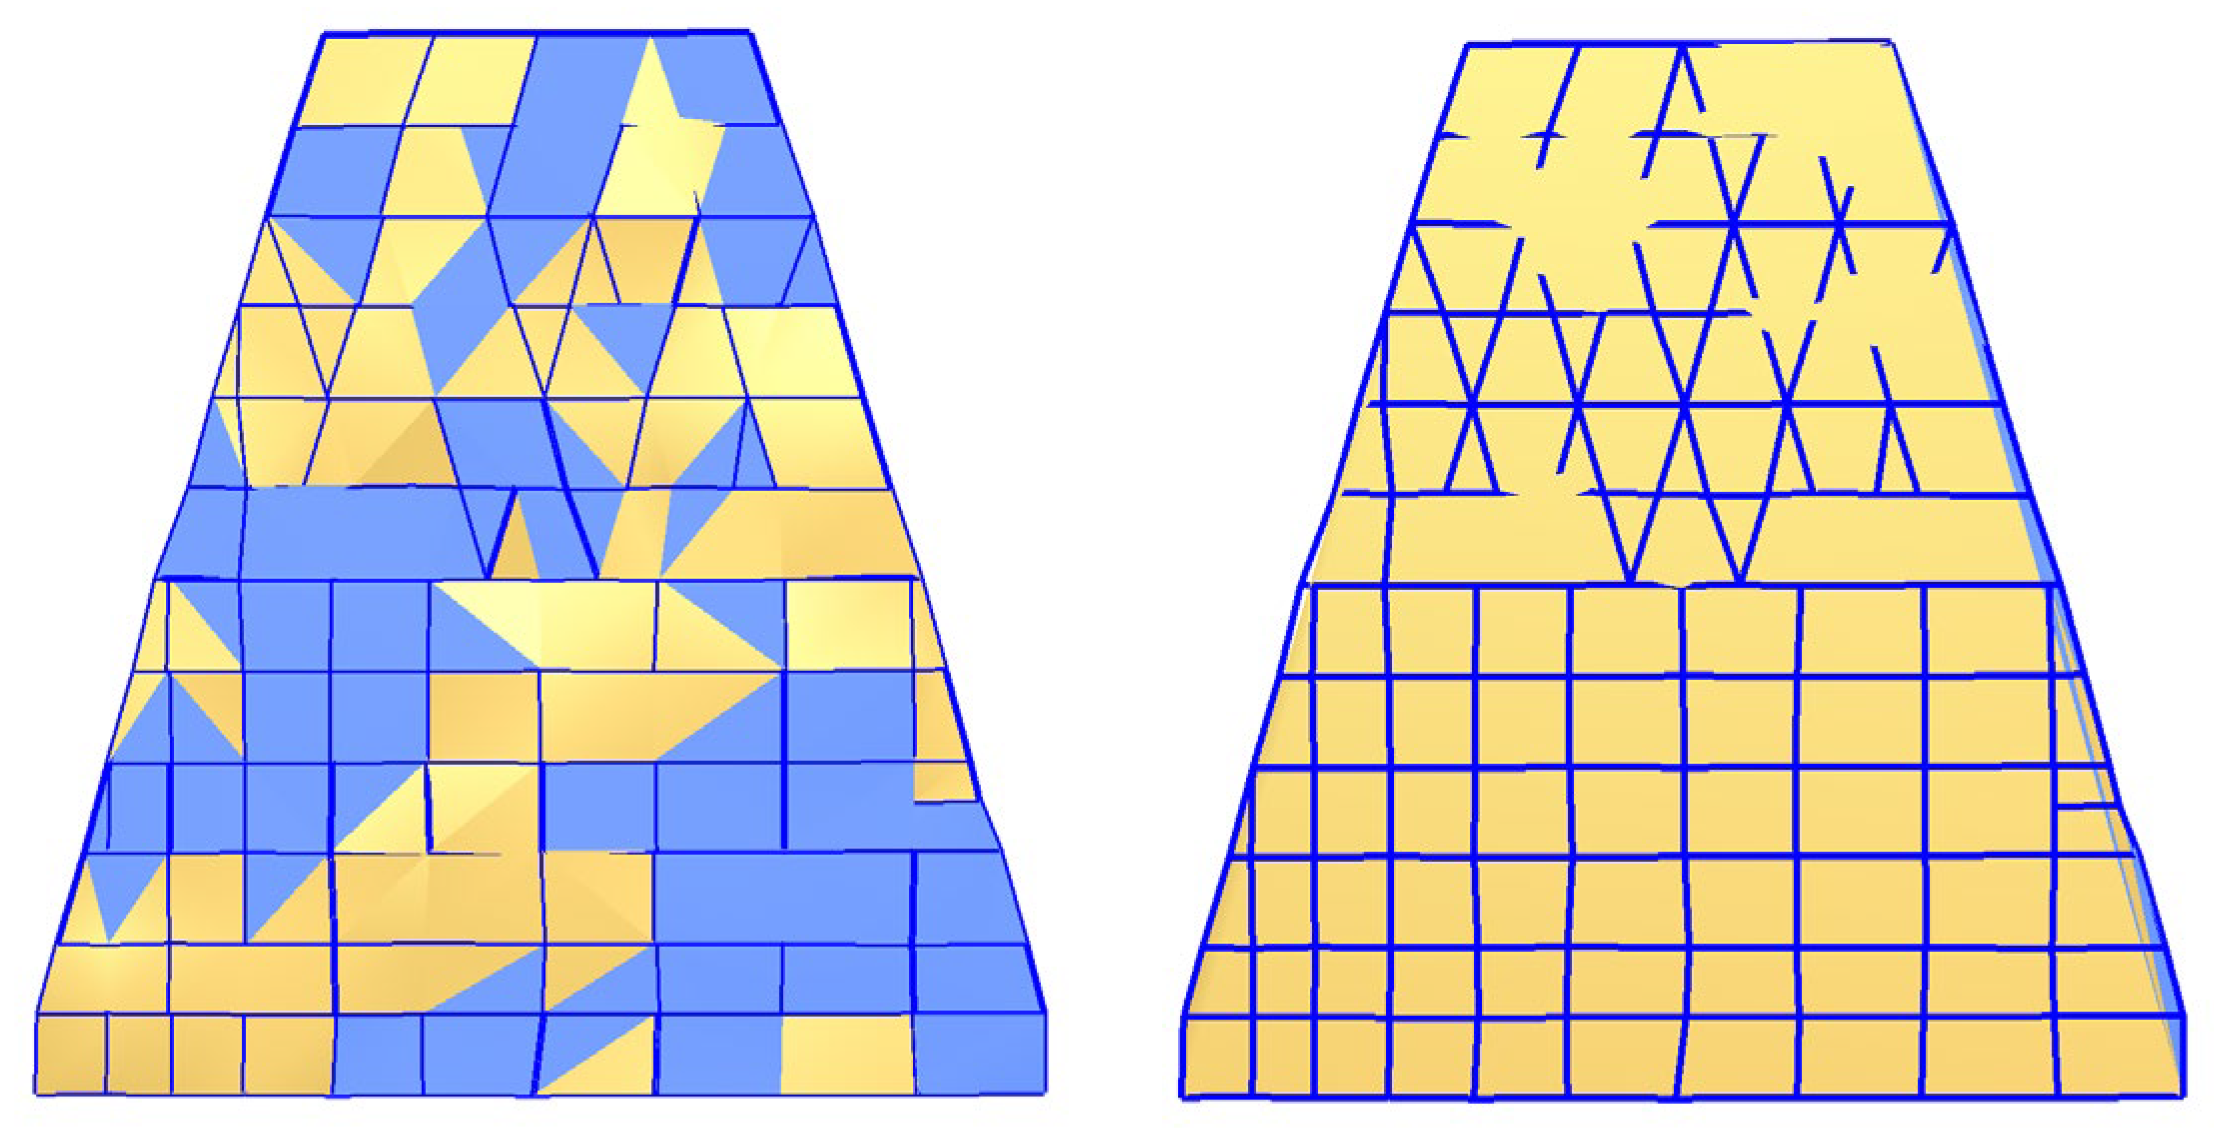
Since the calculation of the axis is based on the point cloud of the upper surfaces of the structural members, it can most effectively reflect the overall flatness of the roof steel structure. Therefore, the axis model can not only be compared with the layout and elevation specified in the design drawings but can also serve as a basis for refining subsequent design work. In this study, the axis model extracted from point cloud computation and that derived from the design drawings are simultaneously triangulated to simulate the installation process of metal roof panels. In the resulting grid model, different colors represent varying inclination directions: yellow indicates a smaller angle between meshes, corresponding to better flatness, while blue represents a larger angle between meshes, corresponding to poorer flatness, see
Figure 19.
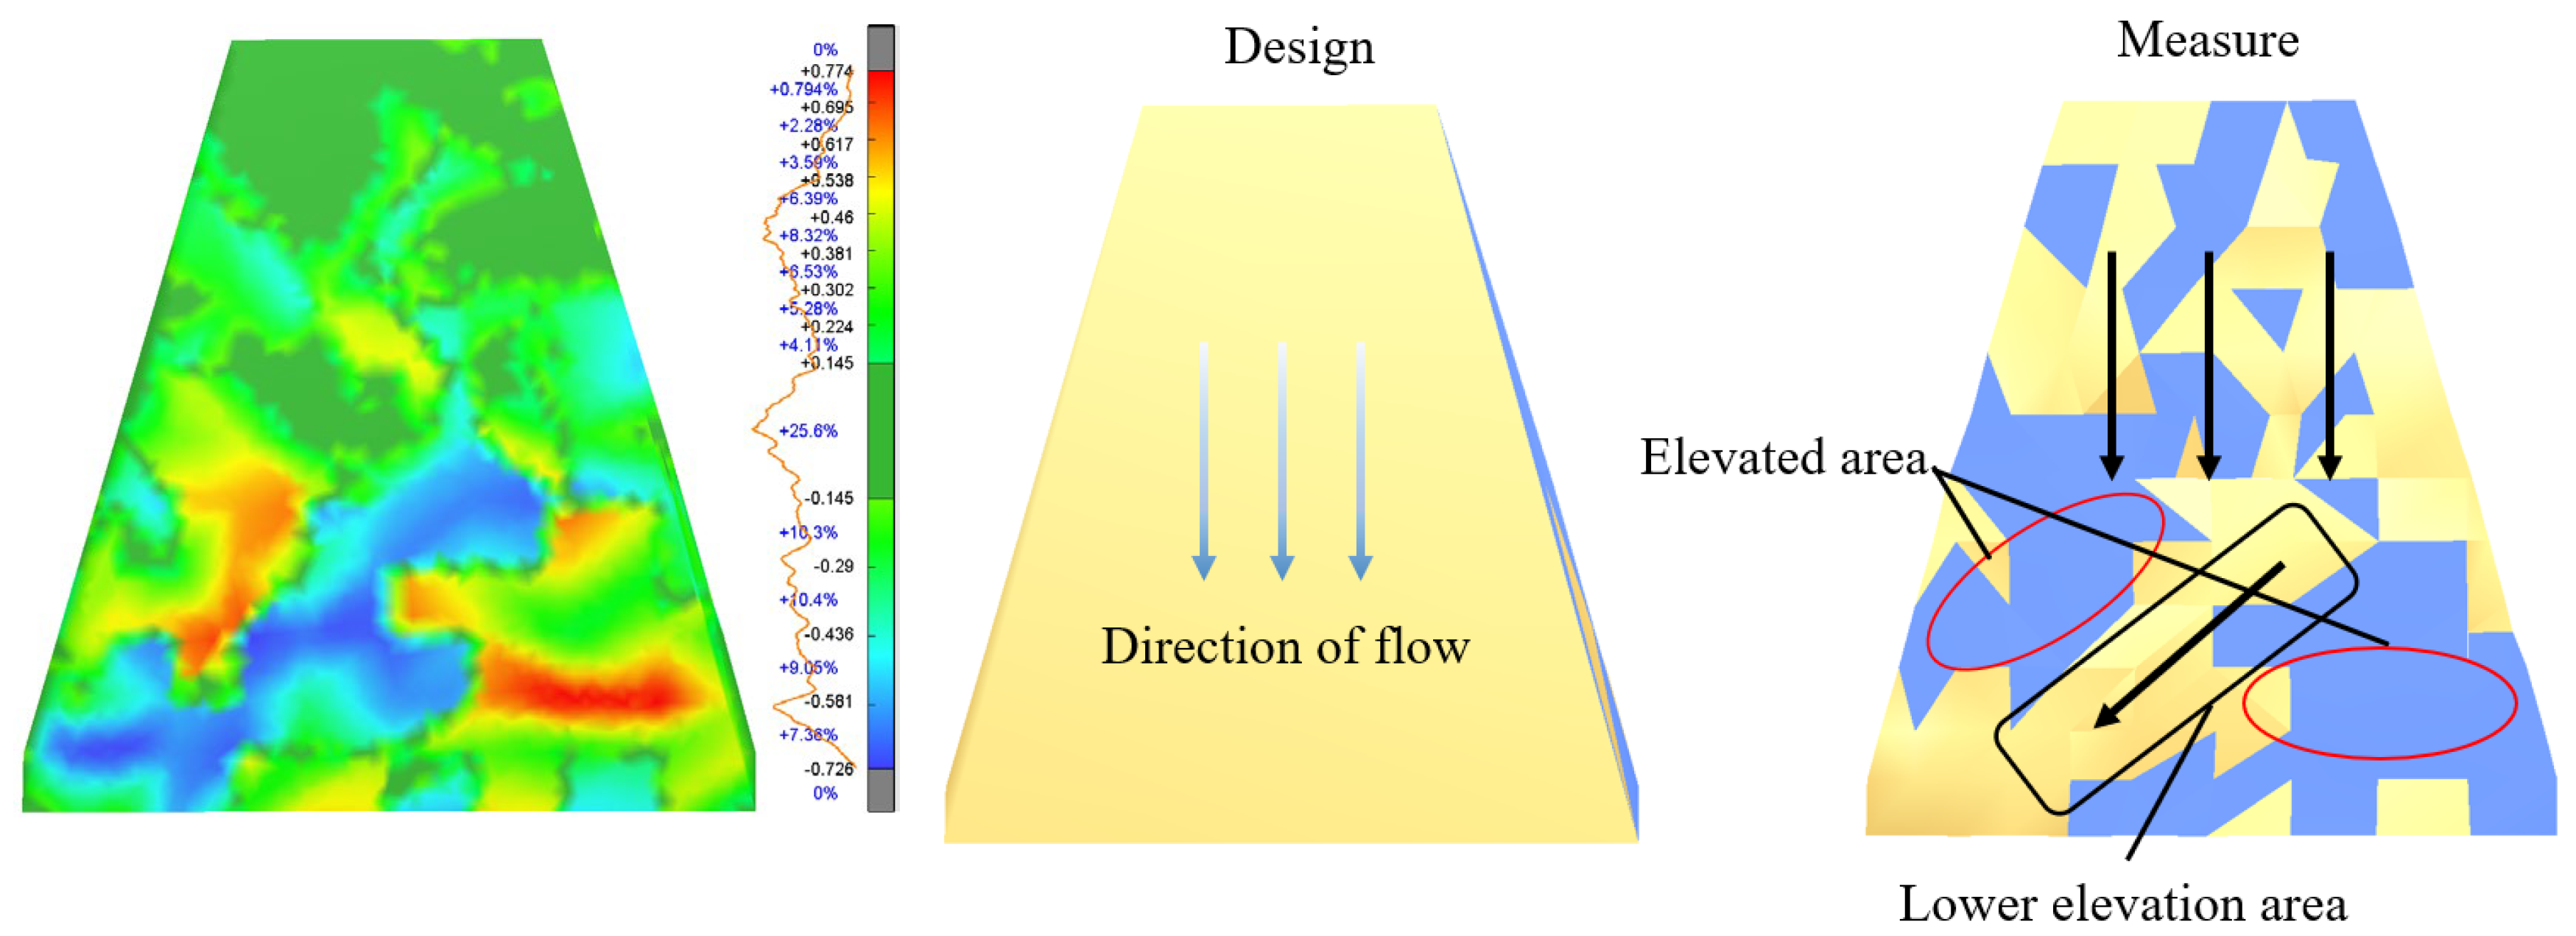
A mesh comparison analysis was conducted between the triangulated mesh model derived from UAV scanning and the corresponding design model. The results reveal elevation distribution differences between the two models, quantitatively describing flatness variations in the steel structure. As shown in
Figure 20, green areas indicate close alignment between the scanned and design models, while blue areas represent lower elevations and red areas indicate higher elevations in the scanned model.
The elevation deviations identified in the mesh analysis suggest that if metal roof panels were installed strictly according to the original design layout, unevenness would occur in the lower regions of the roof. This would not only compromise the structure’s esthetic appearance and surface flatness but also alter the intended architectural form. More critically, such elevation undulations could disrupt the ideal water flow pattern, leading to channelization—where runoff concentrates along one side of the roof (primarily the left side). This imbalanced drainage performance would reduce the overall efficiency and reliability of the roof’s drainage system, particularly under extreme rainfall. conditions.
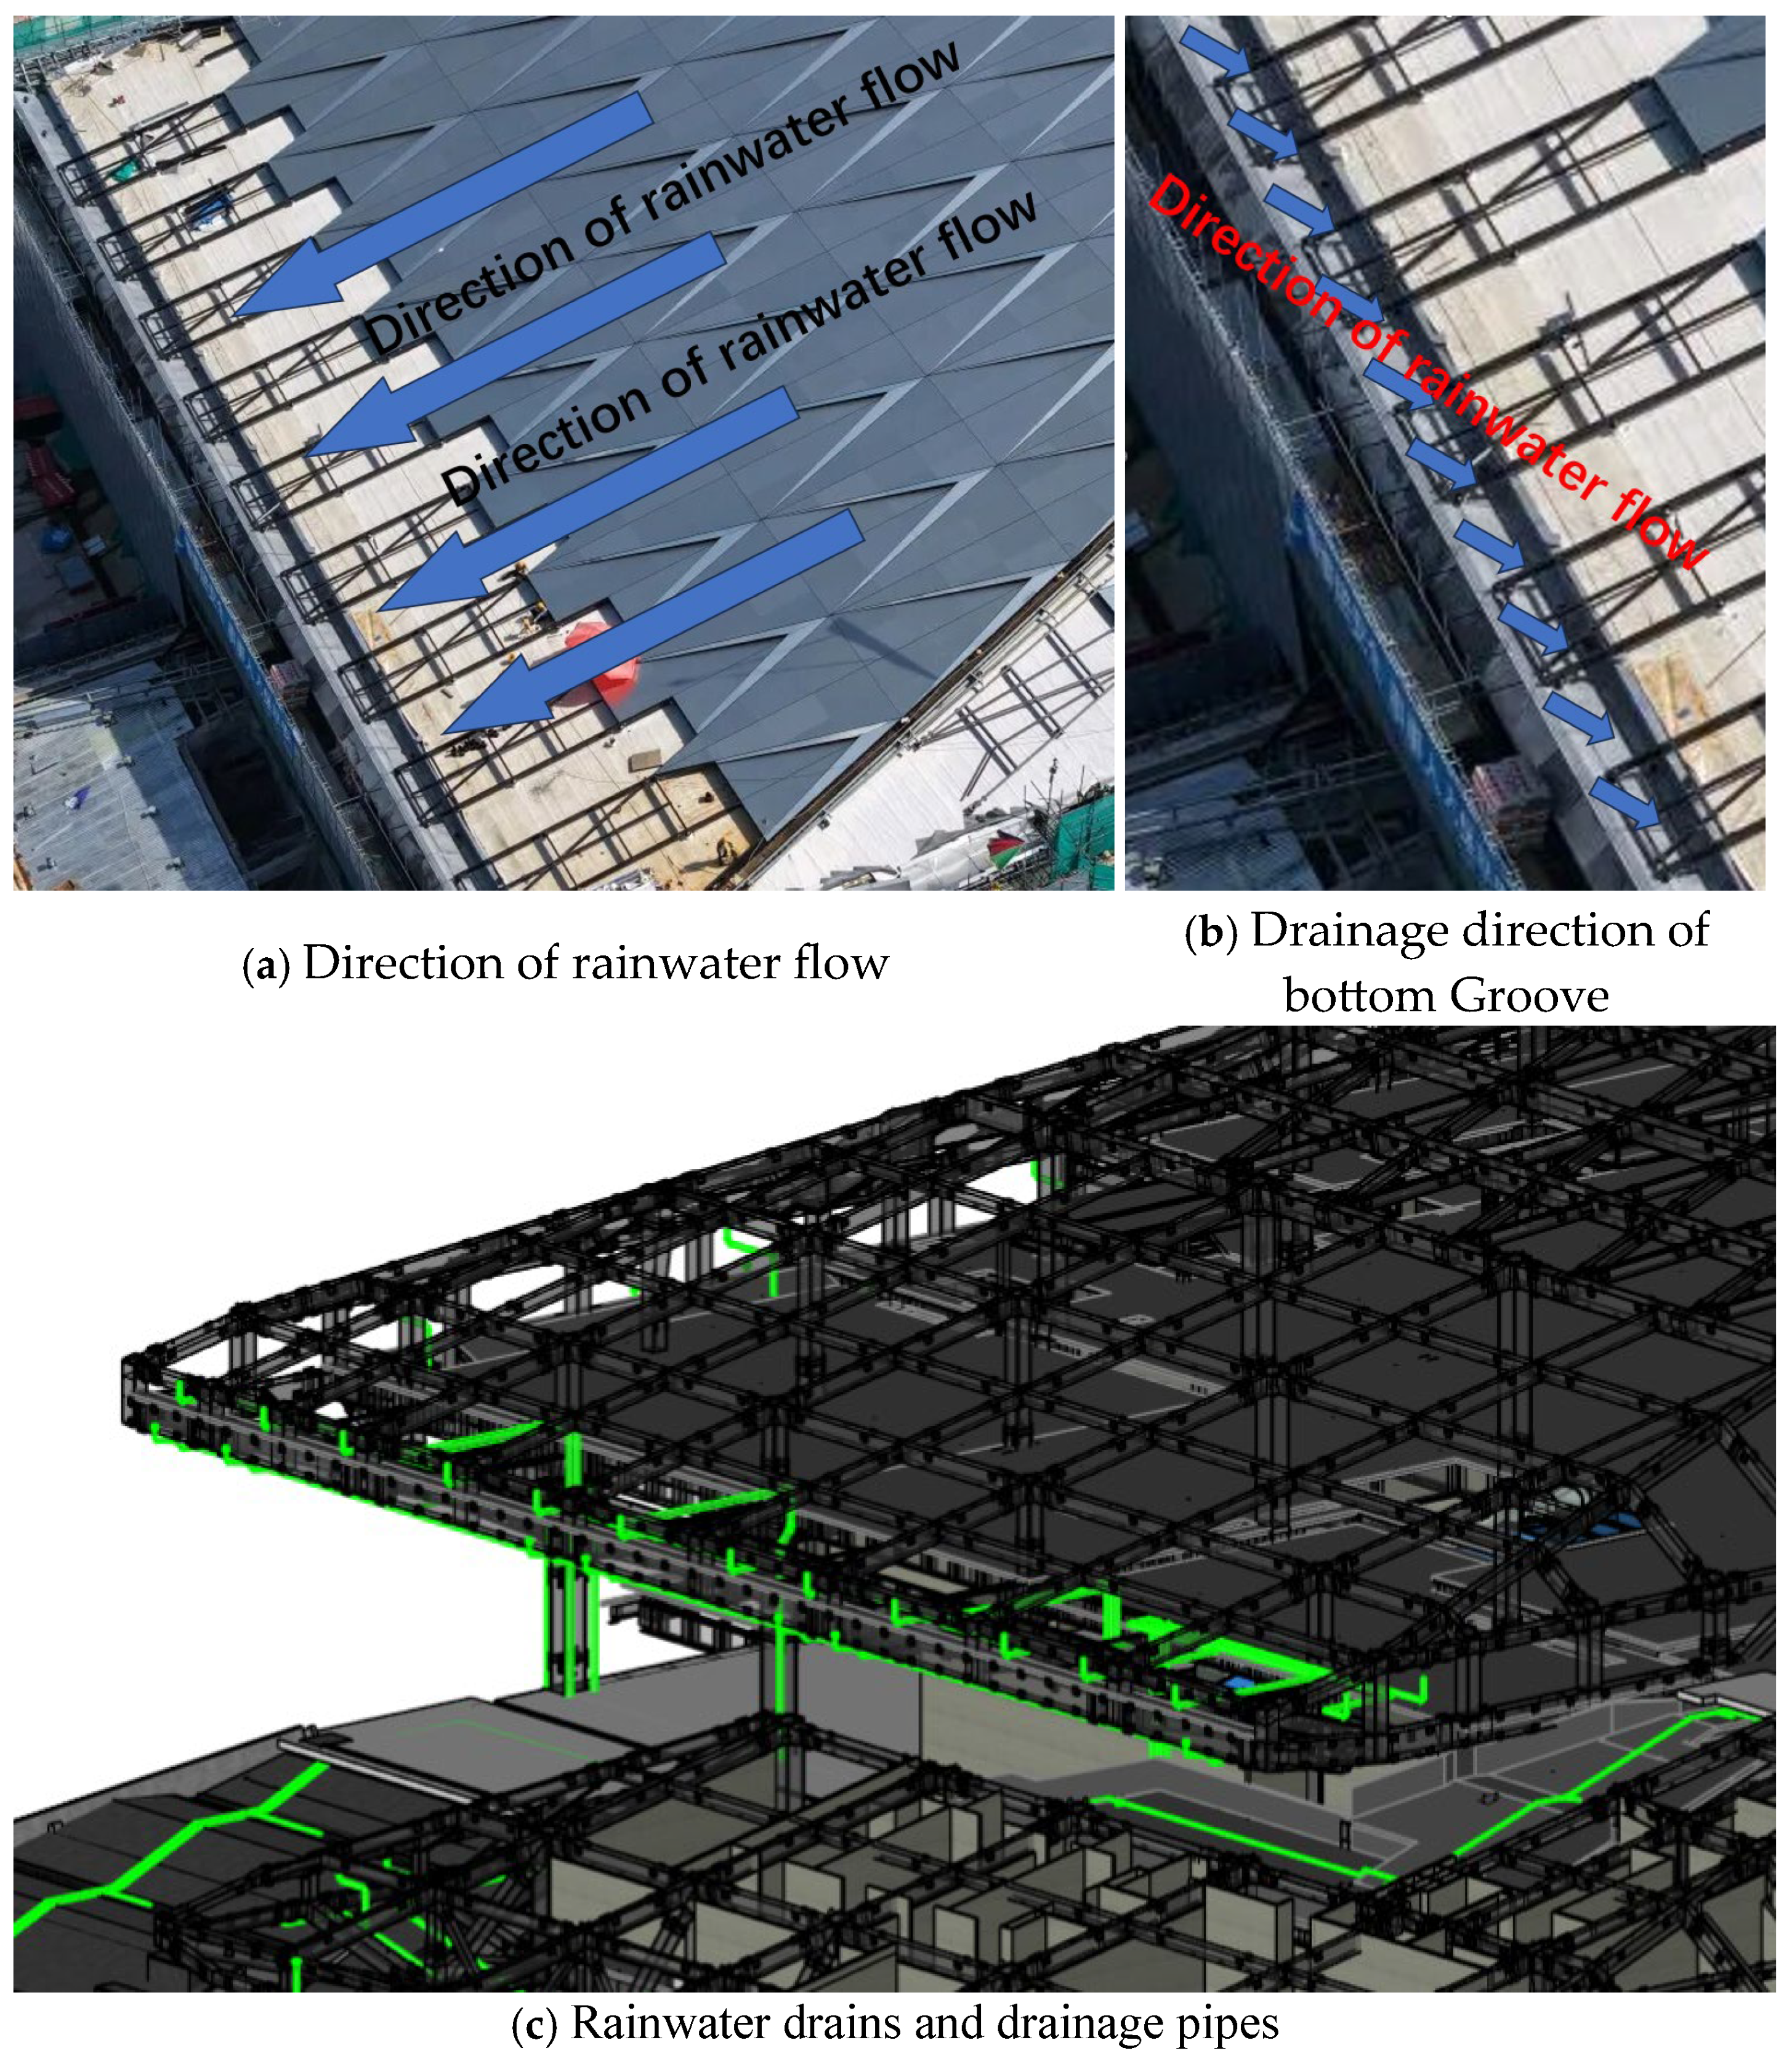
The roof slope is 10.5°, and the water flow direction follows gravity, descending from the top (
Figure 21a) to the bottom groove (
Figure 21b) at the lowest part of the roof truss. This groove is equipped with rainwater drains at regular intervals to discharge water to the ground (
Figure 21c). Due to the 10.5° roof slope, a 170 mm height difference would result in a concave surface if the roof panel length were less than 933 mm. However, since each roof panel on the roof exceeds 2 m in length, no concave surface forms even under a 170 mm height difference, ensuring zero ponding risk.
Nonetheless, uneven water runoff may occur, potentially leading to non-uniform drainage at the bottom groove’s rainwater drains. The design of these drains is based on the 100-year return period storm intensity in Shenzhen (622.62 L/s·hm2), with each drain capable of meeting the drainage demand for approximately 420 m2 of catchment area. Therefore, even under extreme engineering rainfall conditions, the roof remains free from ponding risks.
4. Conclusions
Aiming at the large scale, complex geometry, and high inspection difficulty of large-span roofs, this study investigates a UAV-based oblique photogrammetry approach for roof inspection and quality assessment. The main conclusions are as follows:
(1) Feasibility and applicability: UAV-based roof inspection technology, characterized by its high flexibility and non-contact measurement capability, effectively overcomes the spatial and accessibility limitations of conventional inspection methods. It is particularly suitable for the geometric quality inspection of large-span roof structures.
(2) Accuracy of geometric quality control: By applying feature extraction, edge detection, and the RANSAC algorithm to UAV-acquired 3D point clouds, a component axis model of the roof steel structure was obtained. Comparing the measured axis model with the design layout and elevation enables accurate assessment and effective control of the construction quality of the roof steel structure.
(3) Flatness and functional analysis: Based on the extracted axis model, a triangular mesh was generated to simulate the installation of metal roof panels. This allows for analysis of slope variations across different roof regions, enabling early identification of potential issues related to surface flatness and drainage during the detailed design stage.
Limitations and future work:
(1) The current workflow is primarily applicable to flat or simply curved roofs. For more complex geometries (e.g., double-curvature roofs), further refinement of data acquisition and processing methods will be required.
(2) The material properties of the roof surface may affect point cloud accuracy and analysis outcomes. Future studies should verify the applicability of this method to diverse materials such as metal, glass, and composite structures.
(3) The case study environment in this research was relatively simple. For more complex construction conditions (e.g., dense equipment or safety net obstructions), data collection strategies and filtering algorithms should be optimized.
(4) Although the method demonstrates strong potential for large-span roofs, additional validation is needed to assess its scalability and efficiency for ultra-large-scale structures, such as airport terminals or exhibition halls.


