Article

Investigation into the Impacts of Cover-and-Cut Top-Down Metro Station Construction on Adjacent Buildings: A Case Study

1
College of Construction Engineering, Jilin University, No. 2699 Qianjin Street, Changchun 130026, China
2
School of Transportation Science and Engineering, Jilin Jianzhu University, 5088 Xincheng Street, Changchun 130118, China
*
Author to whom correspondence should be addressed.
Buildings 2025, 15(22), 4149; https://doi.org/10.3390/buildings15224149
Submission received: 25 September 2025 / Revised: 5 November 2025 / Accepted: 10 November 2025 / Published: 18 November 2025
(This article belongs to the Section Building Structures)

Abstract

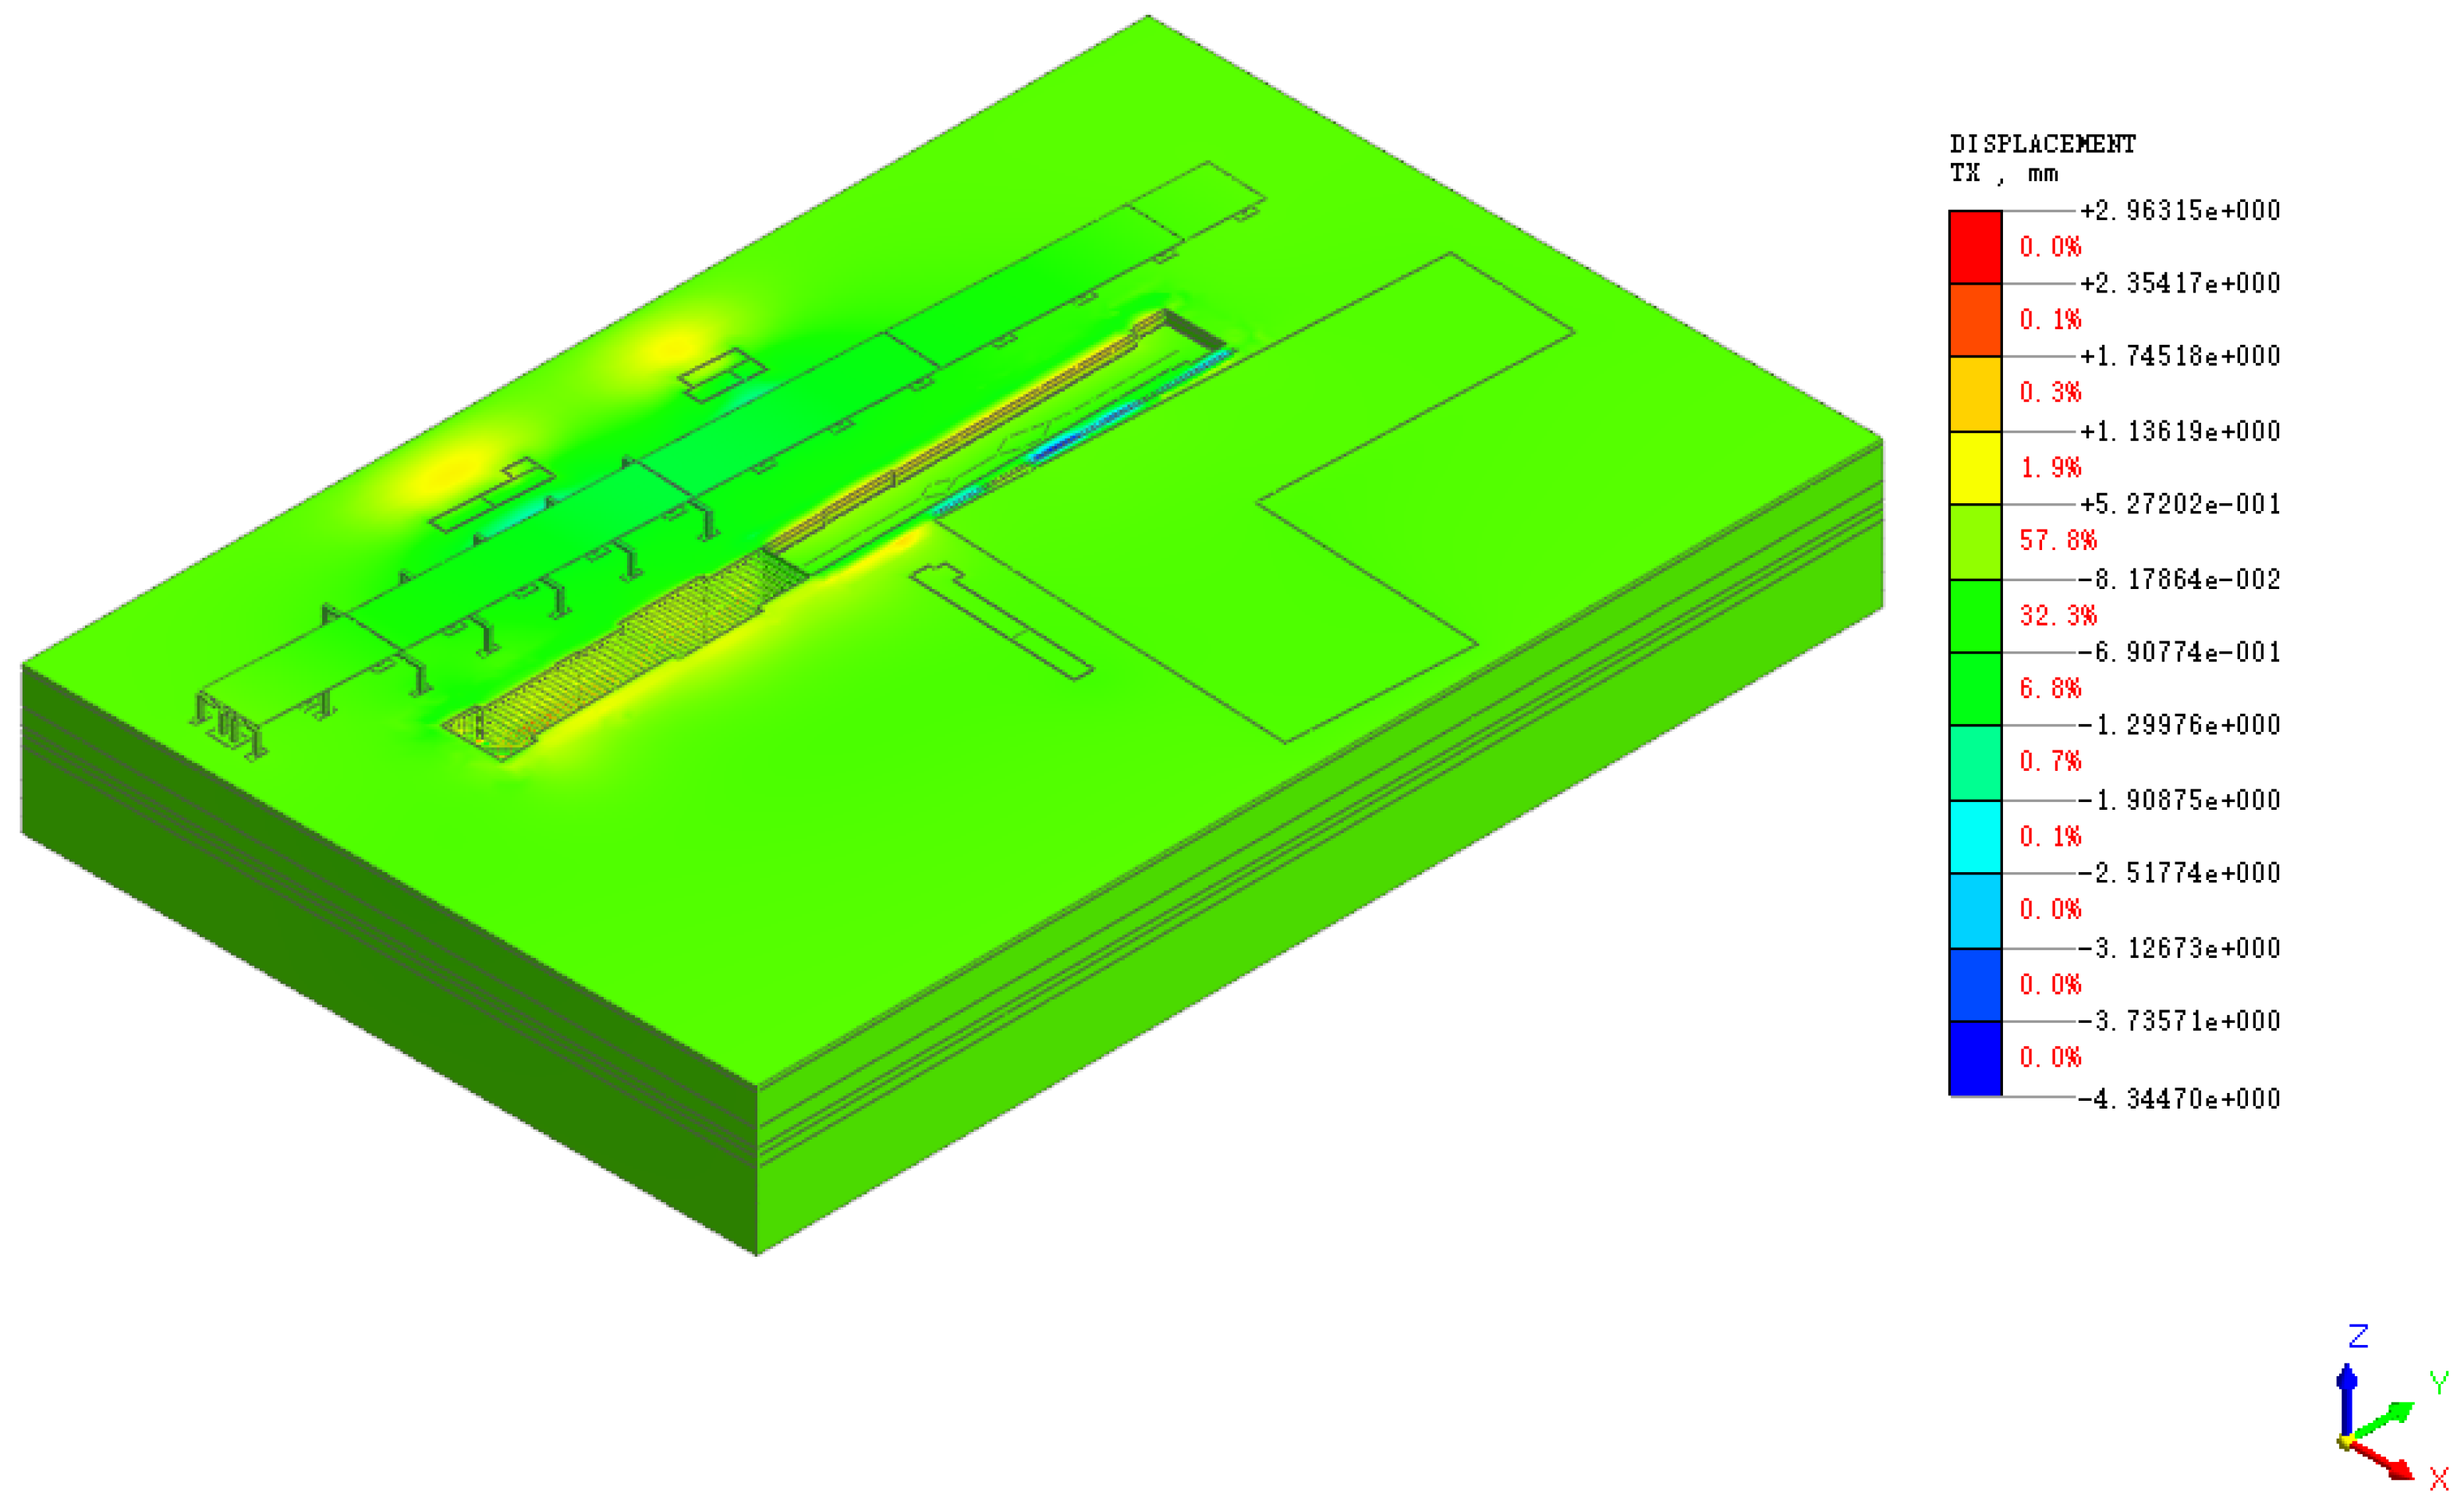
Based on the inspection results of existing structures, this study conducts a safety evaluation of buildings adjacent to a 17.2–23.2 m deep metro station. Stratum loss induced by the deformation of the foundation pit retaining structure leads to displacement and stress redistribution in the surrounding strata, which in turn triggers displacement and deformation of adjacent existing structures. Numerical models were established to quantitatively assess the impacts of cover-and-cut top-down construction on adjacent structures, predict surface settlements during construction through numerical simulation, and formulate control measures to prevent foundation pit safety accidents. This research focuses on the influence mechanism of each construction stage of the cover-and-cut top-down method in Changchun Metro on the settlement patterns of surrounding soil and adjacent buildings, and puts forward targeted recommendations regarding monitoring, construction practices, and emergency early warnings. During the excavation and support of the station’s main foundation pit, the maximum peripheral surface settlement reached −9.804 mm, with a maximum horizontal deformation of −4.345 mm. For adjacent buildings, the maximum structural settlement was −4.243 mm, horizontal deformation 0.929 mm, and inclination rate 0.0107‰—all deformation indices remained within safe thresholds. The findings provide empirical data and technical references for safety assessment and risk control of existing structures adjacent to deep foundation pit engineering.

1. Introduction

During foundation pit excavation, stratum disturbance is inevitable, which inevitably leads to ground settlement of varying degrees. Peck first proposed an empirical method for predicting surface settlement outside the excavation pit [1]. Boscard and Cording conducted research on the settlement response of buildings to excavation-induced ground movements, indicating that excavation induces disturbance in the surrounding strata and poses potential damage risks to adjacent structures [2]. Based on on-site engineering monitoring, this study discussed the correlations between construction activities, measured deformations/distortions, and damage to adjacent buildings, and proposed damage mitigation for adjacent structures through deformation control [3]. The mechanisms by which deep foundation pit construction affects adjacent buildings are highly complex. Numerous researchers in technical literature have studied the responses of adjacent buildings to ground settlements induced by foundation pit excavation and the influencing factors from various perspectives [4].
Deep foundation pit engineering is a complex engineering problem involving numerous factors, including engineering geological conditions, climatic conditions, construction methods, the current status of existing building structures, their relative positional relationships with newly constructed underground structures, and management standards. Many of these factors exhibit variability, making deep foundation pit excavation characterized by comprehensiveness and high-risk attributes [5]. Numerous researchers have studied the settlement and deformation of adjacent buildings from various perspectives. By fully considering the interaction between soil and building structures, scholars have derived theoretical calculation formulas for building settlement values [4,6]. An empirical equation developed via statistical analysis proposes an engineering method for predicting settlements of adjacent buildings in deep foundation pit excavation zones. Using this equation to predict settlements enables effective assessment of potential building damage, providing technical support for ensuring the safety of adjacent structures within the excavation influence range [7].
In the context of urbanization worldwide, underground engineering construction often occurs in complex urban environments characterized by dense surface buildings, crisscrossing underground pipelines beneath roads, and heavy traffic with limited detour options. Compared with traditional open-cut construction methods, the cover-and-cut top-down method offers significant advantages in addressing these challenges. Although numerous studies by scholars worldwide have extensively investigated the deformation characteristics of foundation pit excavations, yielding substantial achievements, these efforts have primarily focused on deep foundation pits in soft soil regions such as China’s coastal areas (e.g., Tianjin, Shanghai, and Fuzhou). In contrast, research on the deformation behavior of deep foundation pits in silty clay and weathered mudstone strata in Changchun remains relatively limited. This study focuses on deep foundation pit engineering of the Changchun Metro, aiming to predict and analyze the settlement patterns of surrounding soil and the impacts on adjacent buildings during each stage of cover-and-cut top-down construction. Specifically, it establishes quantitative indicators and criteria for determining deformation warning thresholds for adjacent buildings, enabling early warnings to mitigate potential hazards and accidents.

2. Construction Environment

A subway station is constructed in a busy urban section of Changchun City. The Changchun area is dominated by Quaternary sedimentary layers (with top-layer black soil, middle-layer gravelly sand and silty clay, and lower-layer dense silty clay), underlain by Cretaceous aquitard bedrock. The shallow phreatic water in this area requires prioritized dewatering, and the construction is prone to risks such as piping and sand boiling in sand layers, black soil deformation, and local undulation of the bedrock surface. Most areas in Changchun have low seismic intensity and good tectonic stability. This station is an underground two-storey island-type station. The depth of the main foundation pit ranges from approximately 17.2 m to 23.2 m. Due to the large depth of the foundation pit, the earth pressures acting on the retaining structure and the support system are relatively high. As a result, during the excavation process, the foundation pit experiences significant deformation and heaving, accompanied by substantial ground loss and large-scale surface settlement in the surrounding area. This situation is unfavorable for controlling the impact of foundation pit construction on the surrounding environment.
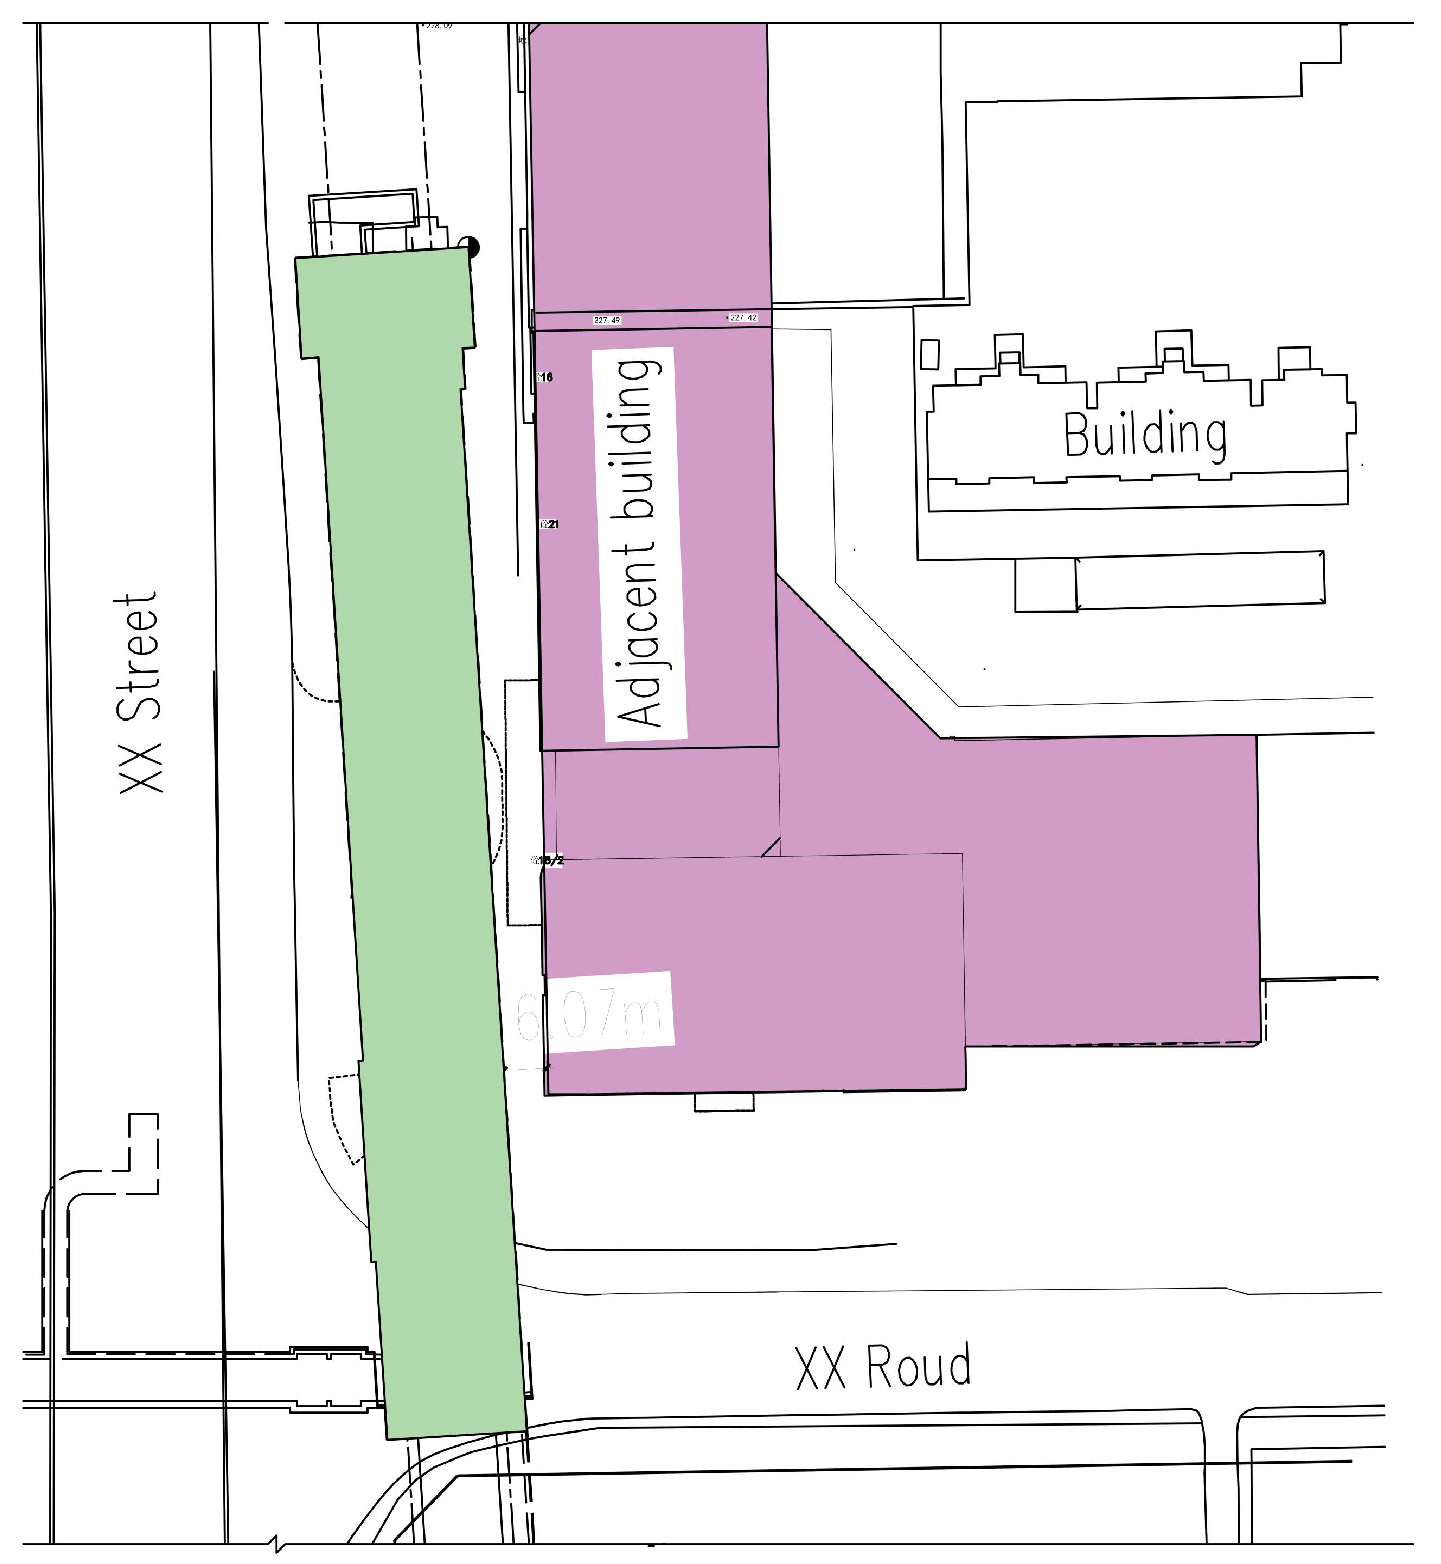
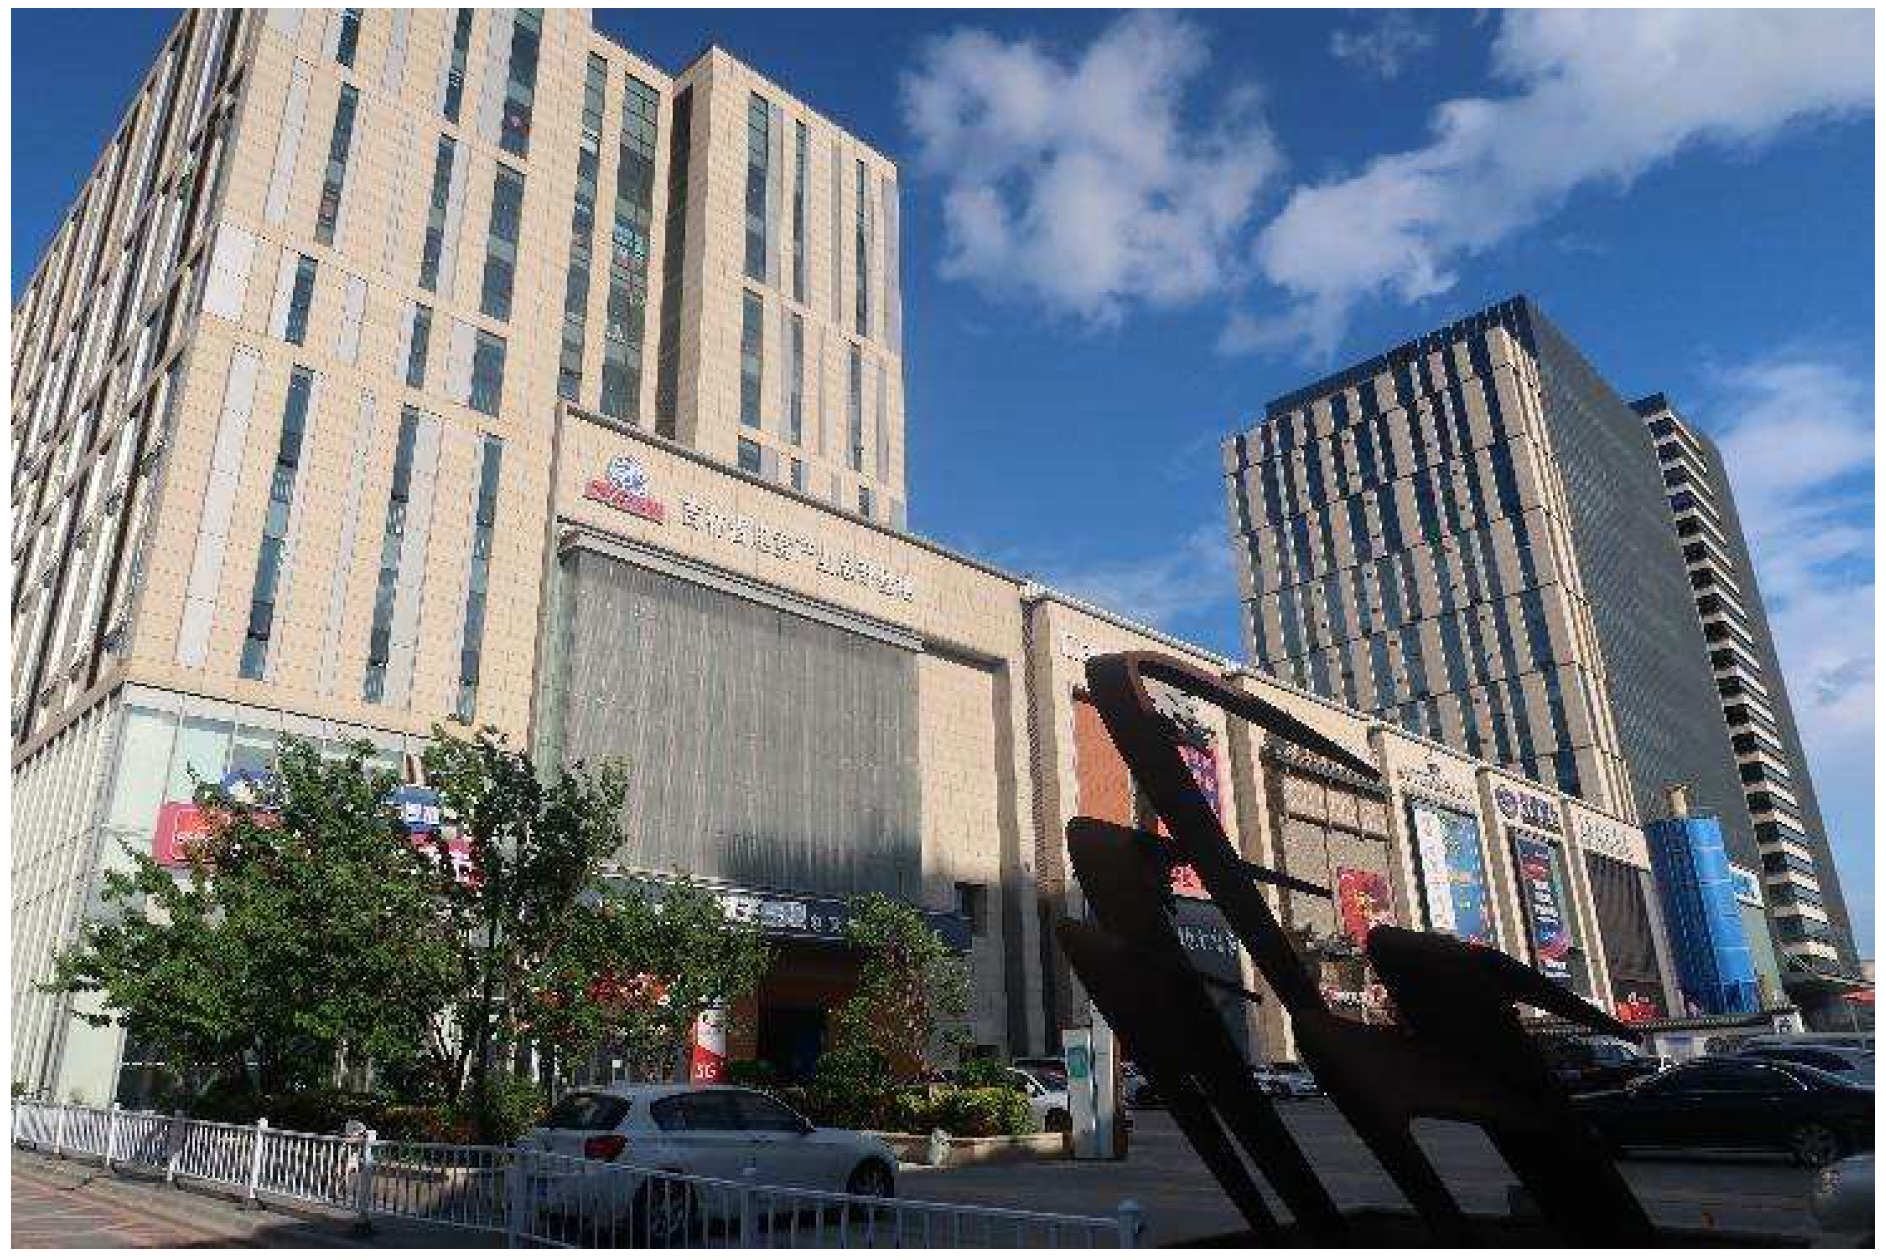
The space around the foundation pit is rather limited. The disturbance to the stratum caused by the excavation may pose a risk of excessive ground settlement. Among them, the adjacent building is located in the northeast quadrant of the station, between the center mileage and the large mileage of the station. It is a commercial building with 21 above-ground floors and 2 underground floors, and its foundation is a pile foundation. Adjacent buildings are shown in Figure 1.
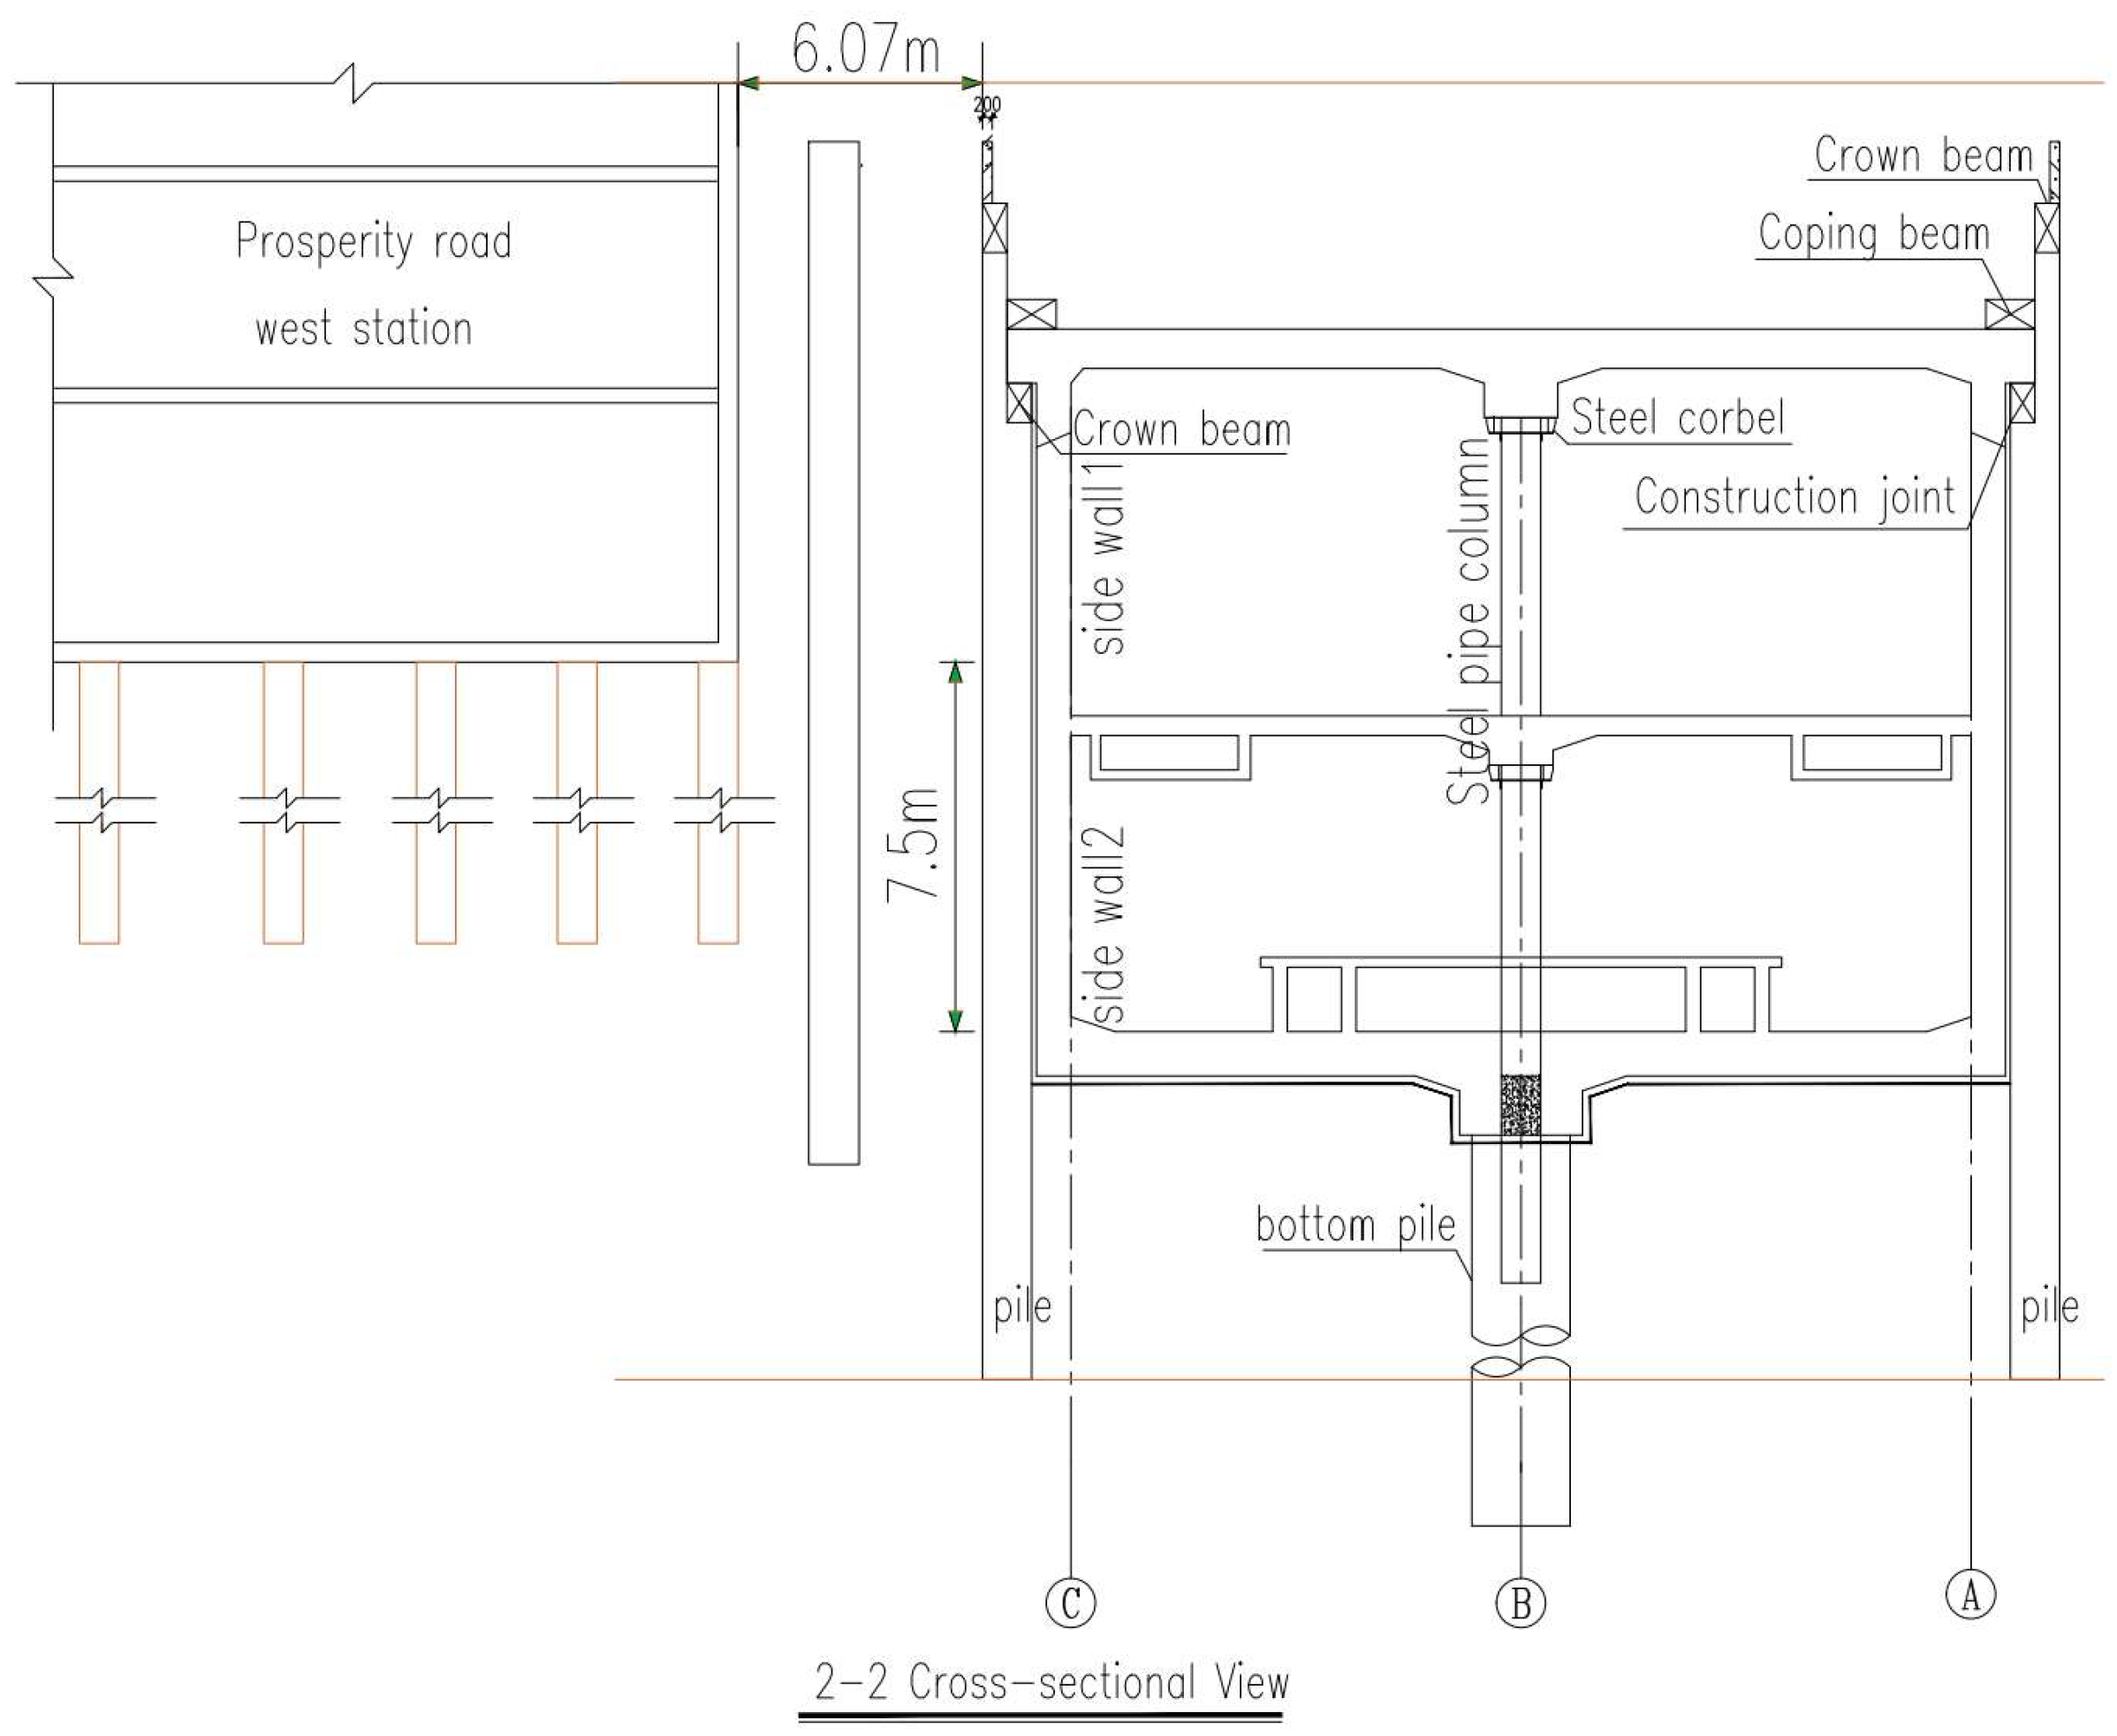
The shortest horizontal distance from the main body of the station is about 6.07 m, and the longest is about 9.49 m. Along the entire length of the building, the distance is less than the final excavation depth He (where He denotes the excavation depth of the foundation pit, He = 17.2−23.2 m). The vertical distance between the station structure foundation slab and the adjacent building foundation slab is approximately 7.5 m. The shortest distance to Exit 4 is about 14.12 m, with the foundation slab of Exit 4 at approximately the same elevation as that of the building. The relative positional relationships are shown in Figure 2 and Figure 3.
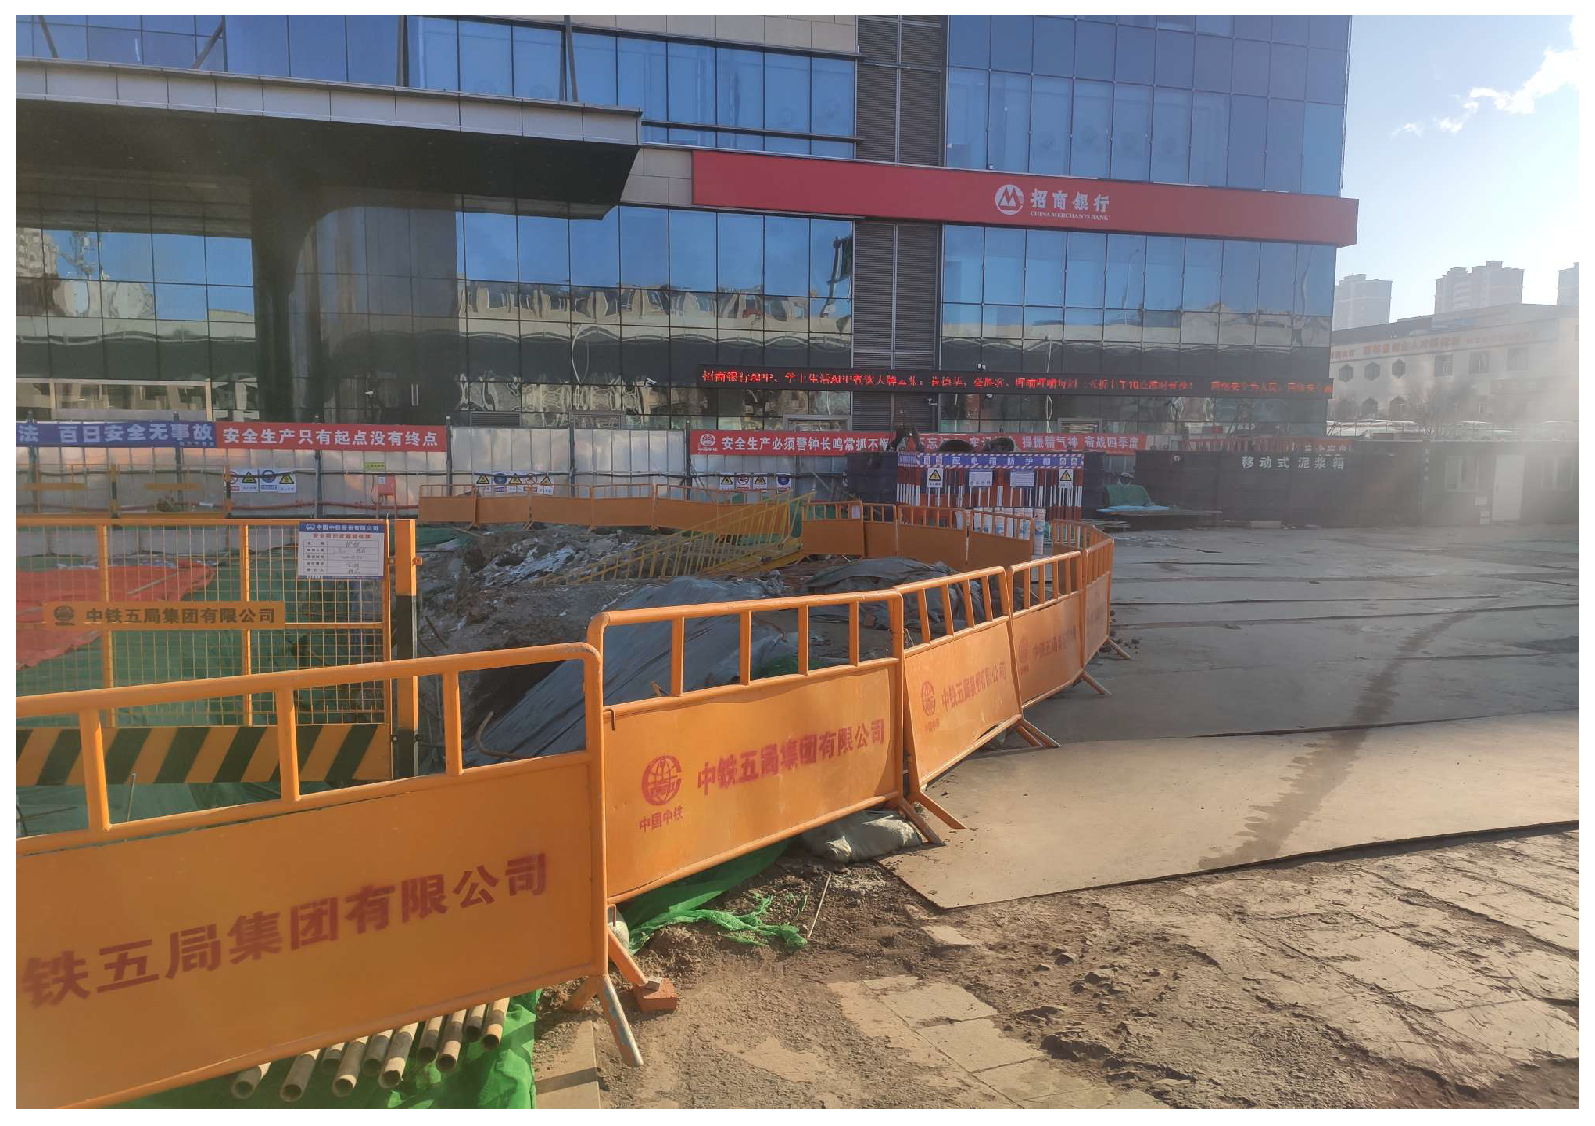
The on-site surrounding environment of the foundation pit is shown in Figure 4.
The building is in close proximity to the main foundation pit excavation site and lies within the ground settlement influence zone induced by deep foundation pit excavation [8]. During the foundation pit excavation and construction process, potential deformations of the foundation pit may lead to settlement, deformation, cracking, or even collapse of the building. Therefore, deformation control of the adjacent building during station construction poses a significant challenge for this project.

3. Structural Overview of Existing Adjacent Building

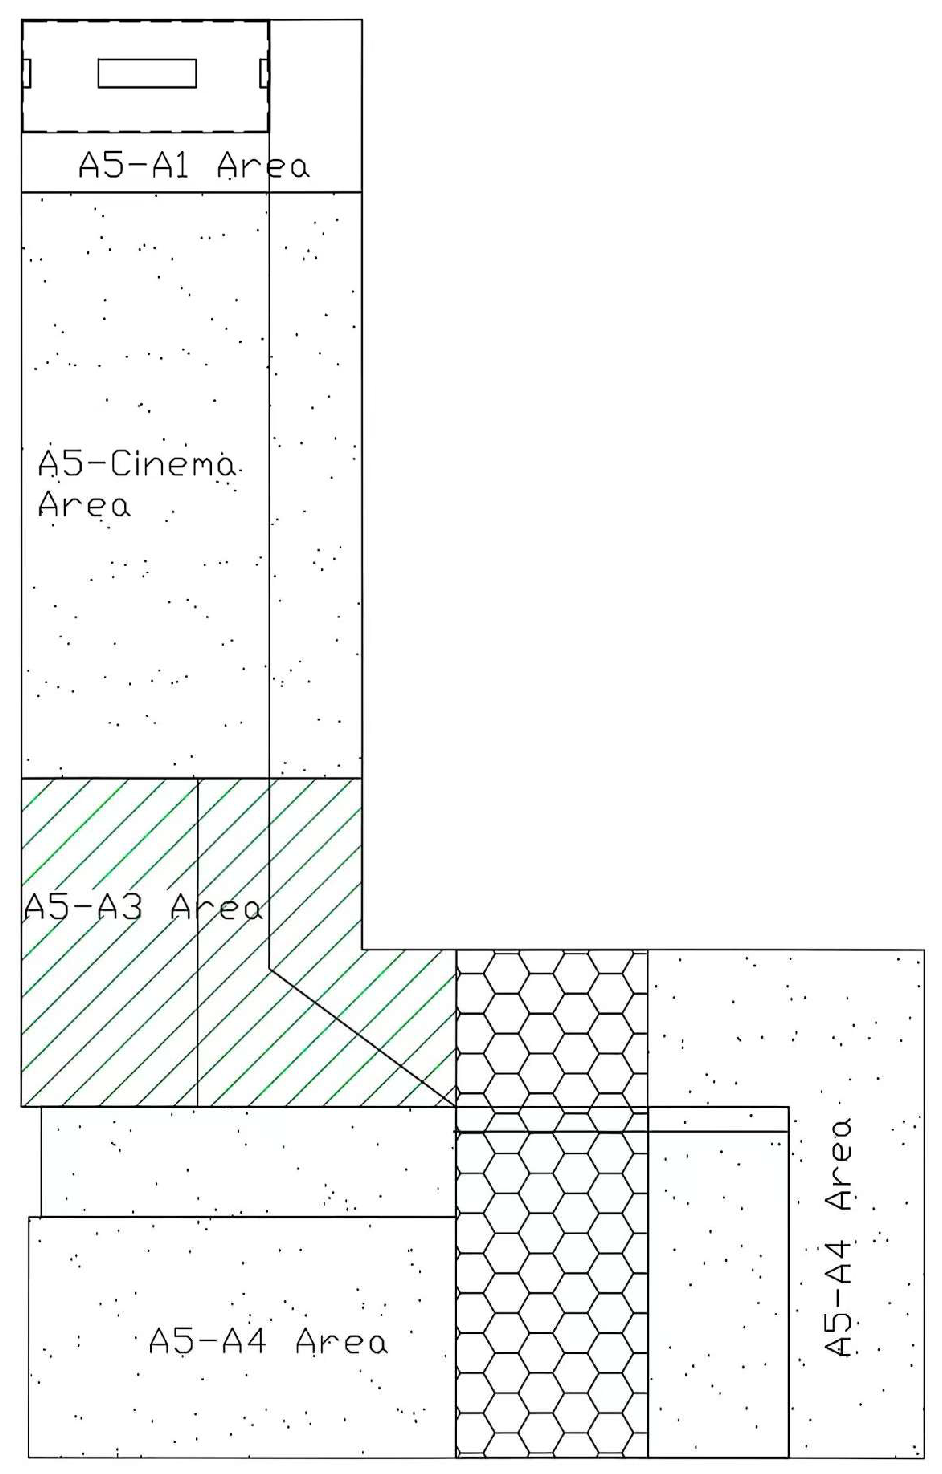
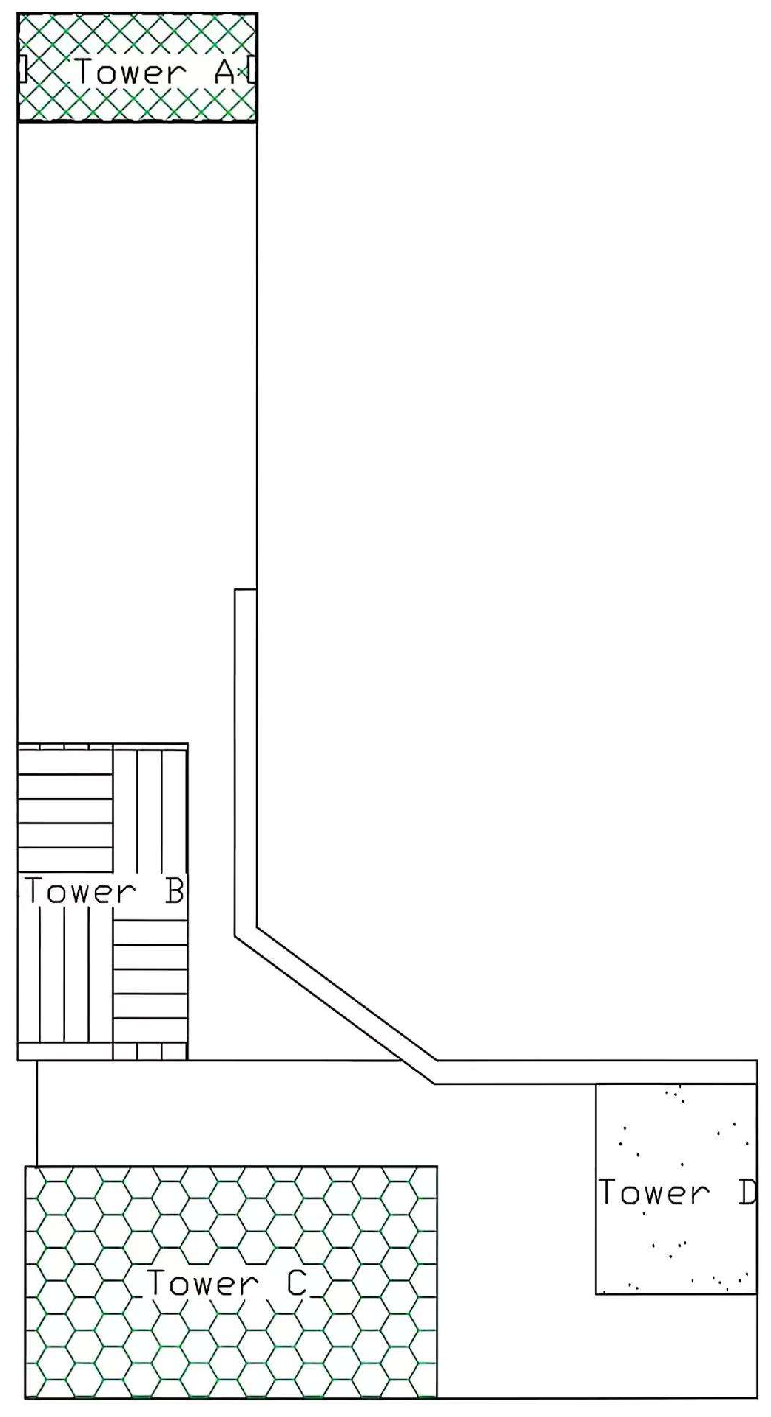
The adjacent building, a public structure located at the intersection of Qianjin Avenue and Fanrong Road, east of Fanrong Road West Station, was constructed in 2013. The building exhibits an overall L-shaped configuration, with the side adjacent to the subway measuring approximately 223.5 m in length. The main structural system of the adjacent building is a frame-shear wall structure, comprising a 4-story podium, a 2-story underground portion, and four towers. The podium is divided into six zones: Zone A1, Zone A2, Zone A3, Zone A4, Cinema Zone, and Supermarket Zone. A schematic diagram of the podium zoning is shown in Figure 5.
The four towers, designated as Tower A, Tower B, Tower C, and Tower D, are illustrated in Figure 6.

4. Engineering Geology and Hydrogeology Overview

The maximum depth of strata exposed during this investigation was 60.0 m. Based on drilling data and results of laboratory geotechnical tests, parameters of each soil layer are detailed in Table 1.
The planned Fanrong Road West Station belongs to Hydrogeological Unit I. During this investigation, one groundwater layer was detected, with the groundwater type identified as phreatic water (II). Specific details are listed in Table 2.
The historical highest water level at the site is shown in Table 3.

5. Inspection and Analysis of the Structural Status of Existing Adjacent Building

To comprehensively understand the actual status of the existing structure, an inspection and analysis of the structural status of existing adjacent buildings was conducted:
(1)
Detection of Concrete Compressive Strength of Structural Members
The rebound method was adopted for the sampling test of the concrete compressive strength of structural members. The rebound method testing was conducted in accordance with the relevant provisions of the technical specification for inspecting concrete compressive strength by rebound method (JGJ/T 23-2011) [9]. The test results of the concrete compressive strength of the sampled structural members all meet the design requirements.
(2)
Detection of Section Dimensions of Structural Components
A steel tape measure was adopted for the sampling test of the section dimensions of existing structural components. The testing operation was conducted in accordance with the relevant provisions of the technical standard for inspection of building structure (GB/T 50344-2019) [10]. The section dimensions of the sampled structural components all meet the design requirements.
(3)
Detection of Rebar Arrangement in Structural Components
An integrated rebar scanner was adopted for the sampling test of rebar arrangement. The testing operation was conducted in accordance with the relevant provisions of Technical Standard for Test of Reinforcing Steel Bar in Concrete (JGJ/T 152-2019) [11]. The rebar arrangement of the sampled structural components all meet the design requirements.
(4)
Inspection of Structural Appearance Quality
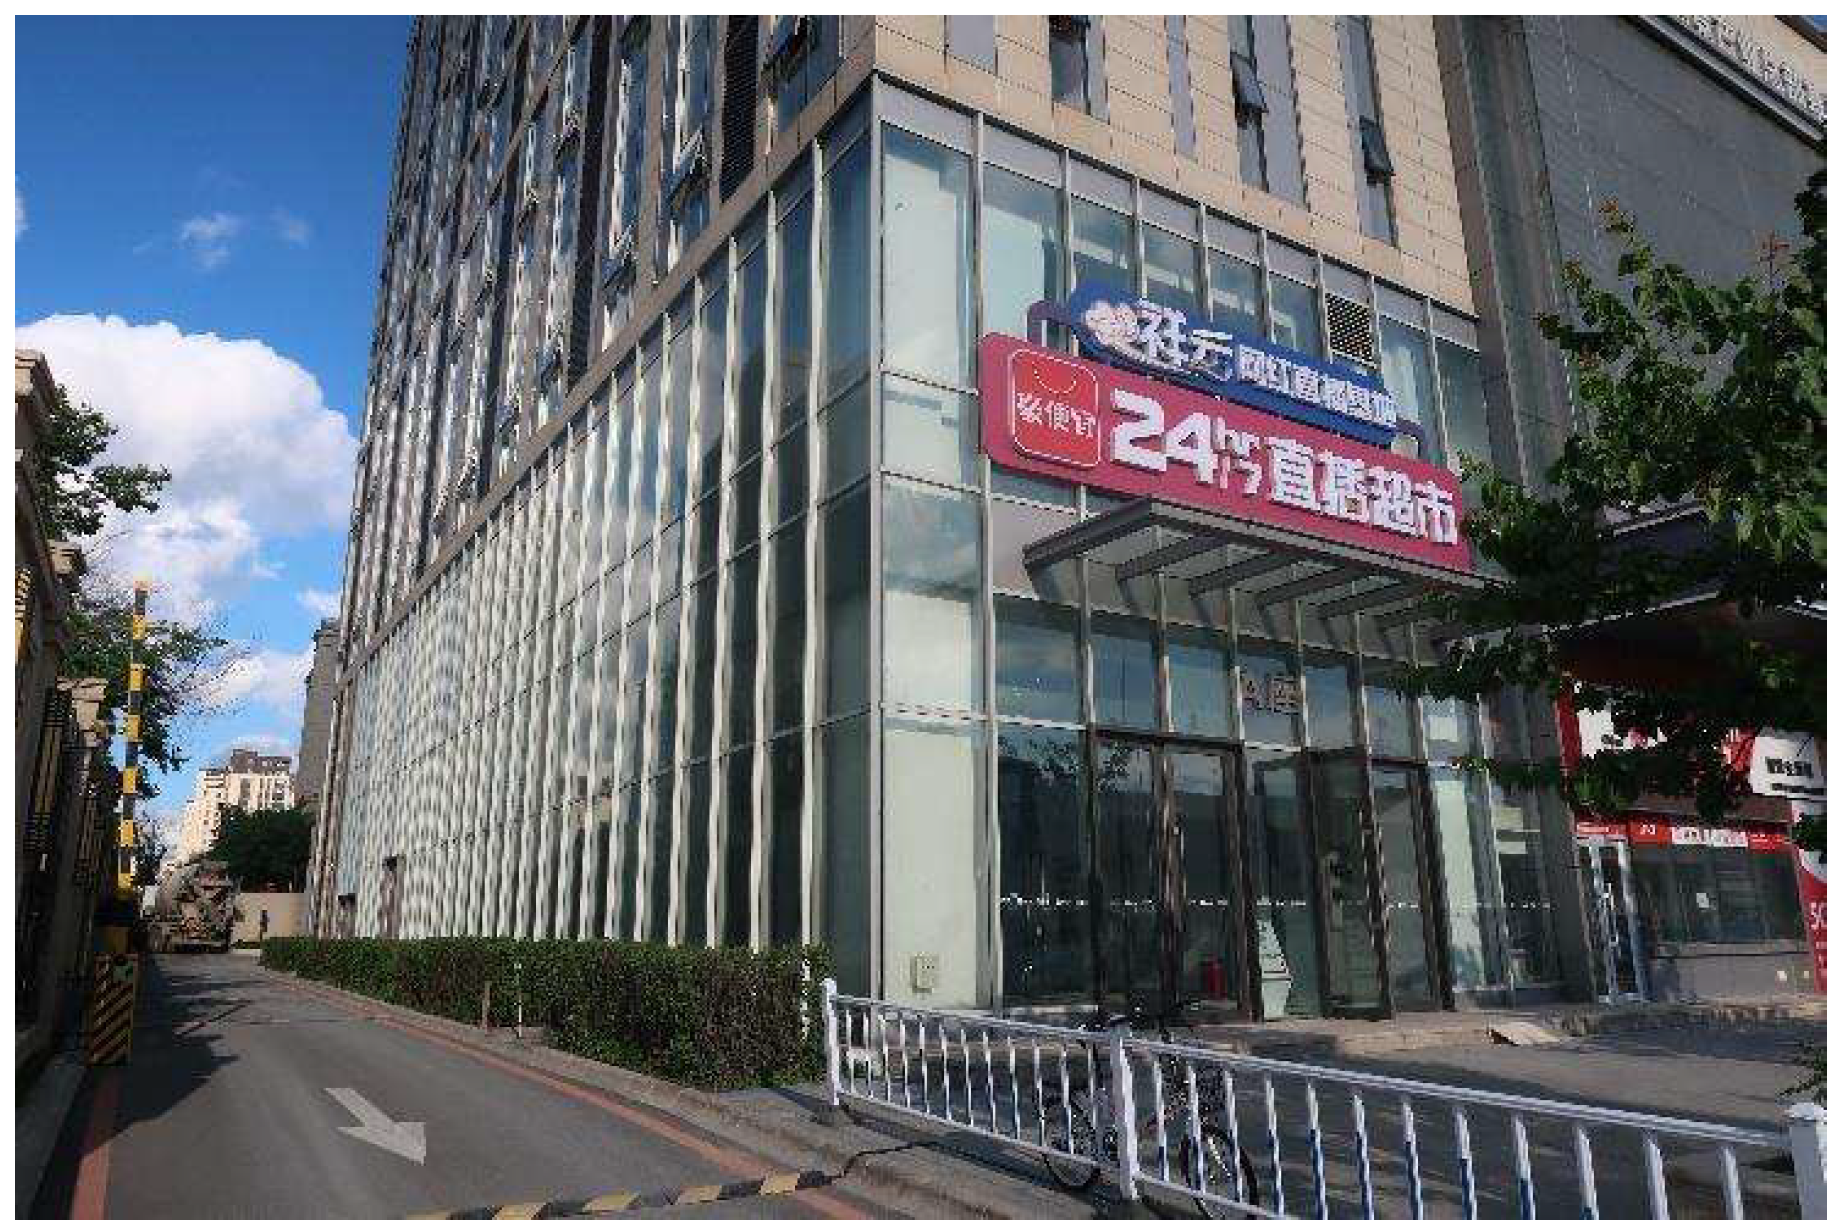
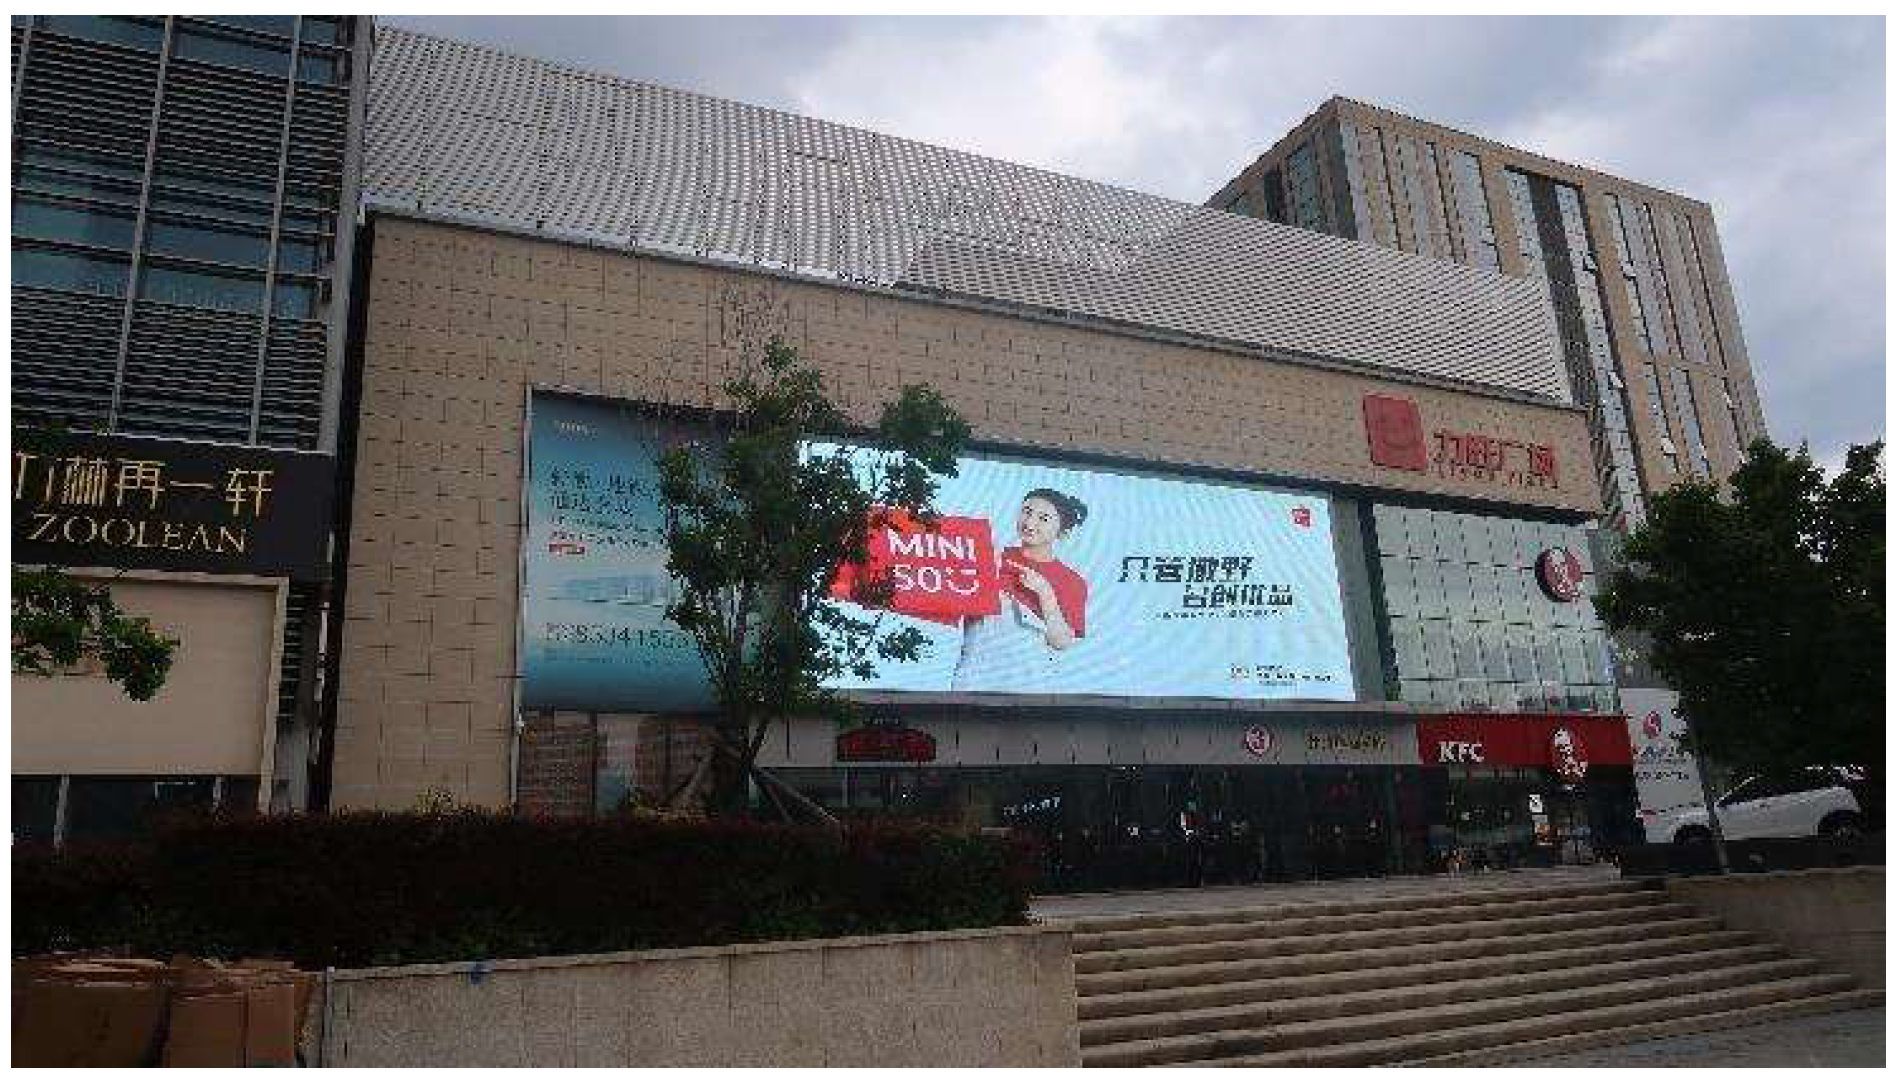
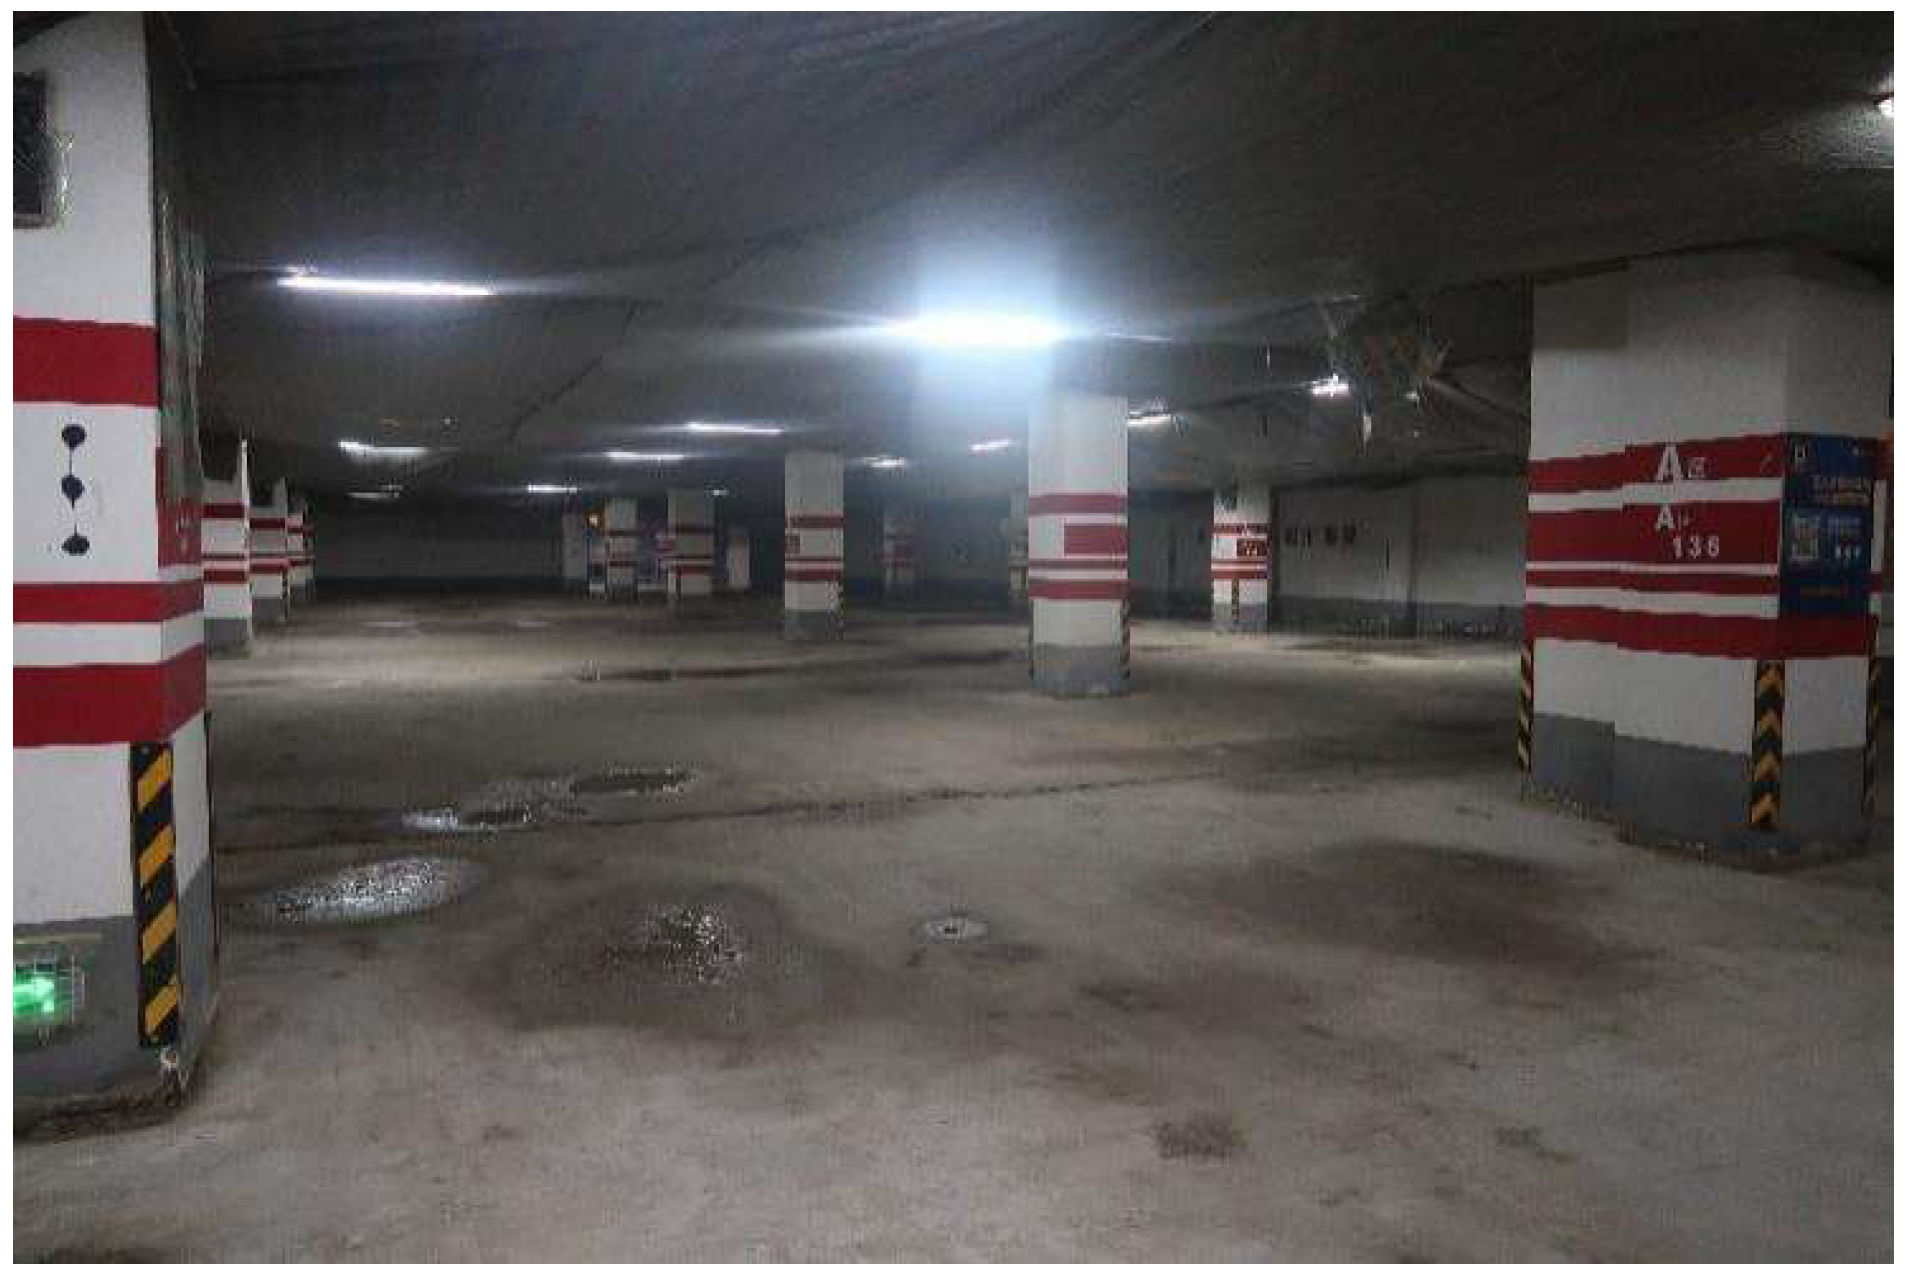
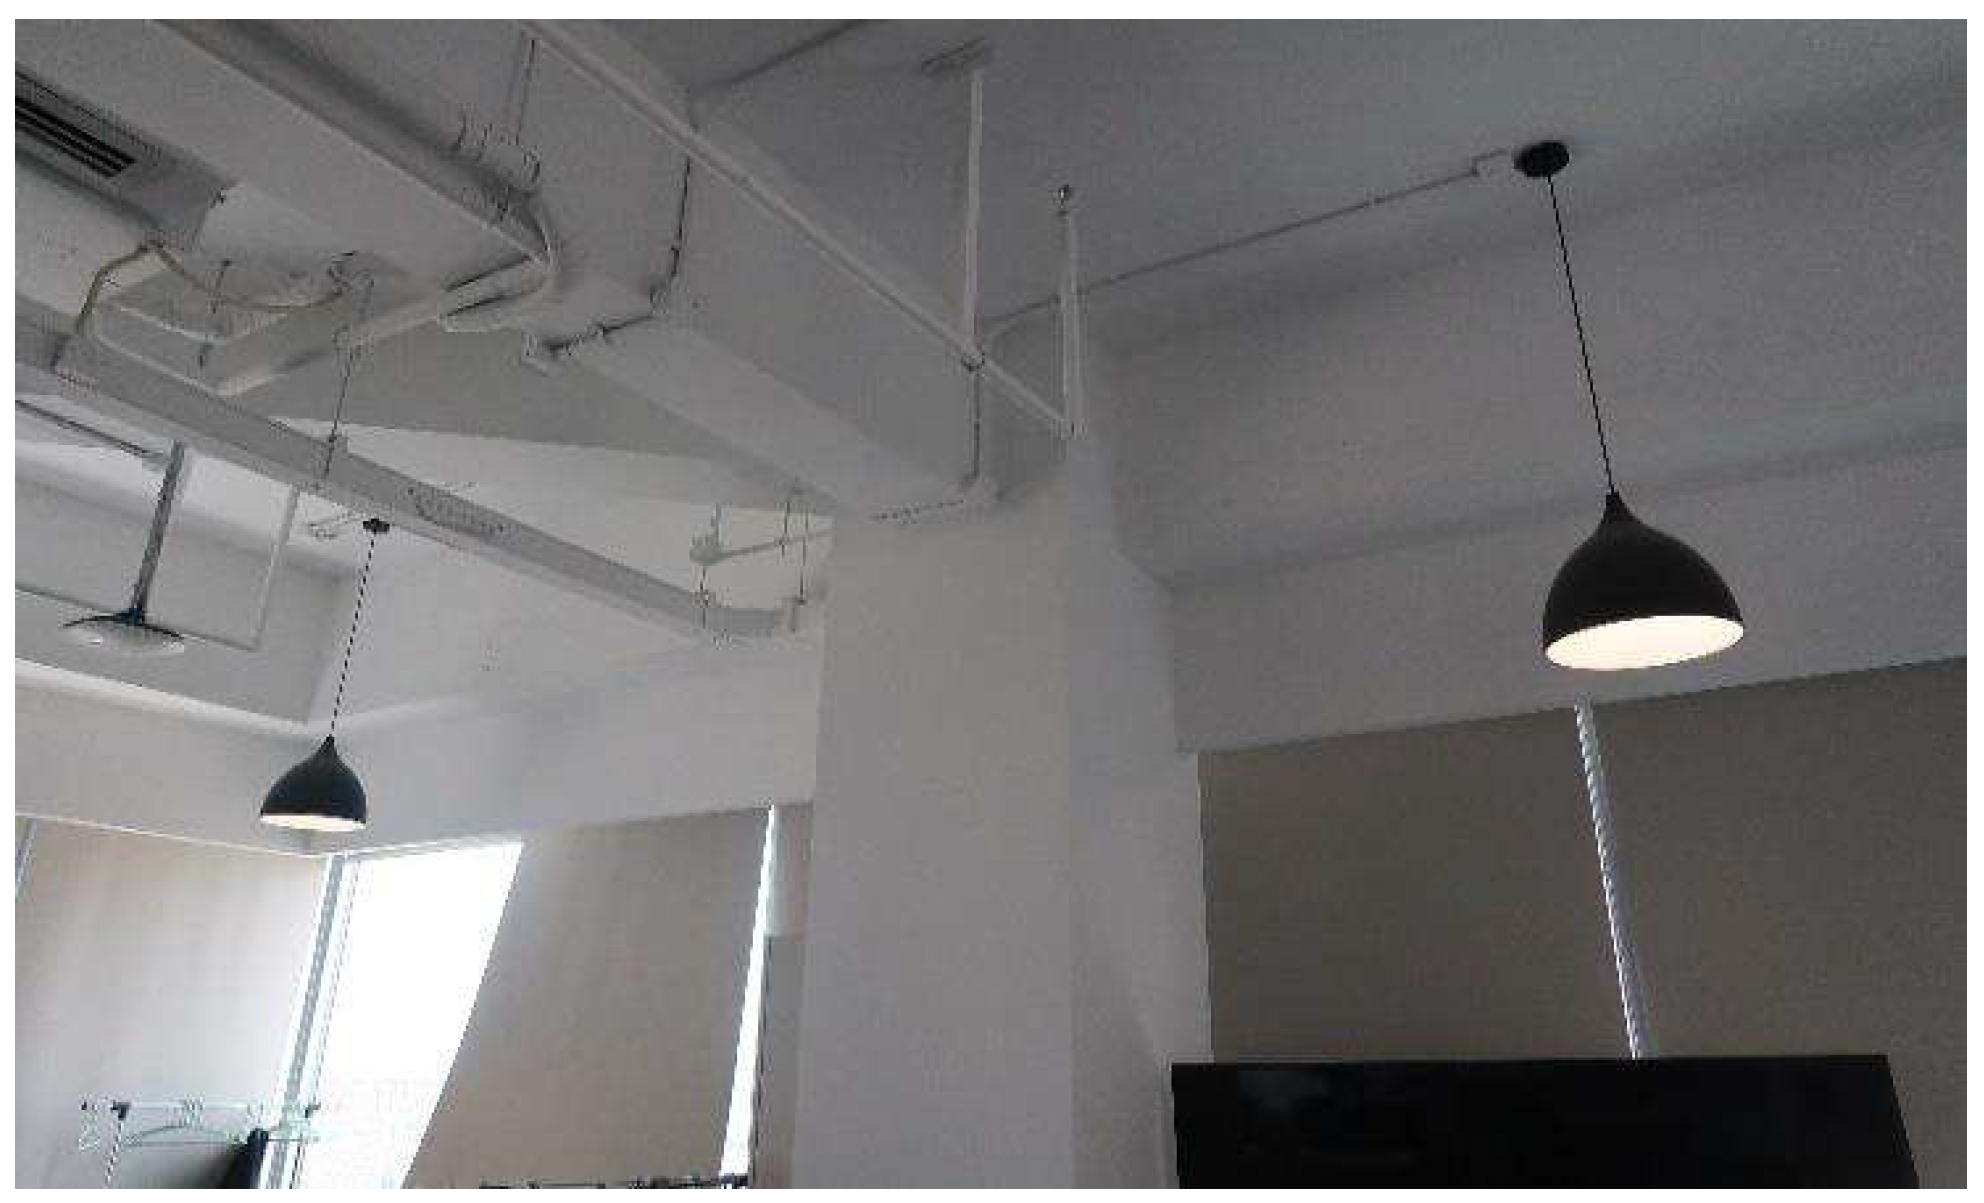
In the inspection of the superstructure, no structural cracks caused by unequal settlement of the foundation were found, indicating that the foundation works normally; no obvious damage, defects, or deformation were observed in the structural components; the enclosure components showed no obvious damage or defects, with good apparent quality. Photos of the on-site conditions are shown in Figure 7, Figure 8, Figure 9, Figure 10, Figure 11 and Figure 12.
(5)
Detection of Lateral Horizontal Displacement at Structural Apex
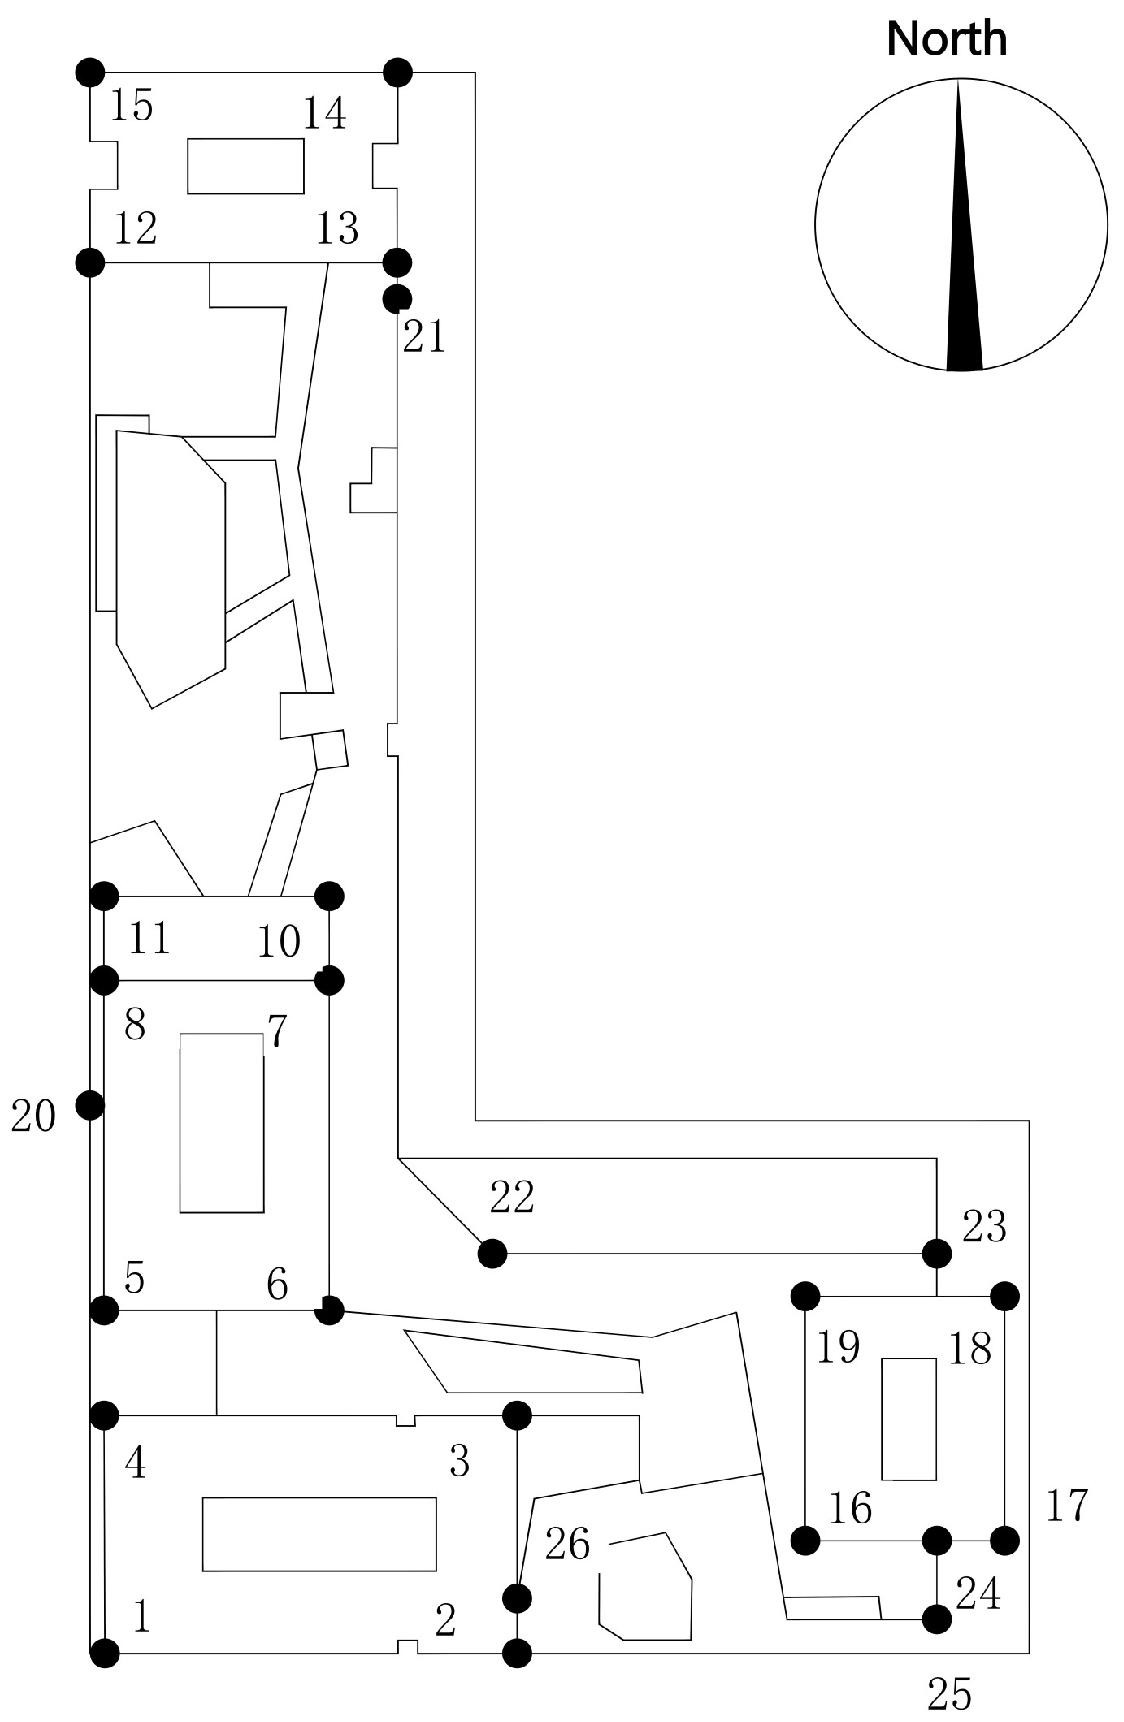
A total station was adopted to detect the lateral horizontal displacement (inclination) at the structural apex. The testing operation was conducted in accordance with the relevant provisions of the General Code for Engineering Survey (GB 50018-2021) [12]. The layout diagram of measurement points is shown in Figure 13.
The detection results of lateral horizontal displacement at each corner point of the structure all meet the requirements of Standard for Reliability Appraisal of Civil Buildings (GB 50292-2015) [13], and the structure has no overall lateral inclination.

6. Excavation

In the excavation of deep foundation pits for underground structures, the open-cut method and mining method are widely used [14]. In the technical literature, the open-cut method and mining method are conducted extensive studies on soil settlement induced [15]. The cover-and-cut top-down construction method [8], still in the exploratory and promotional stages, represents a specialized technique for constructing shallow underground structures. This method involves first constructing the top slab and vertical support structures of the underground structure within a shallow foundation pit above ground or the top slab, followed by excavating soil layer by layer from top to bottom and constructing the underground structure incrementally under the protection of the supporting system. Compared with the traditional open-cut construction method, the cover-and-cut top-down approach addresses critical challenges in underground engineering projects located in bustling urban areas, such as dense surface buildings surrounding construction sites, crisscrossing underground pipelines beneath roads, heavy traffic with limited rerouting options, and stringent environmental requirements for controlling noise, dust pollution, and other construction-related nuisances during the construction period. The cover-and-cut top-down method demonstrates significant advantages in resolving these issues, leading to its widespread application and promotion in underground engineering projects such as metro construction. By addressing practical engineering challenges and traffic management difficulties, this method has simultaneously achieved notable economic and social benefits.

7. Analysis of Effects of Metro Construction on Existing Structures

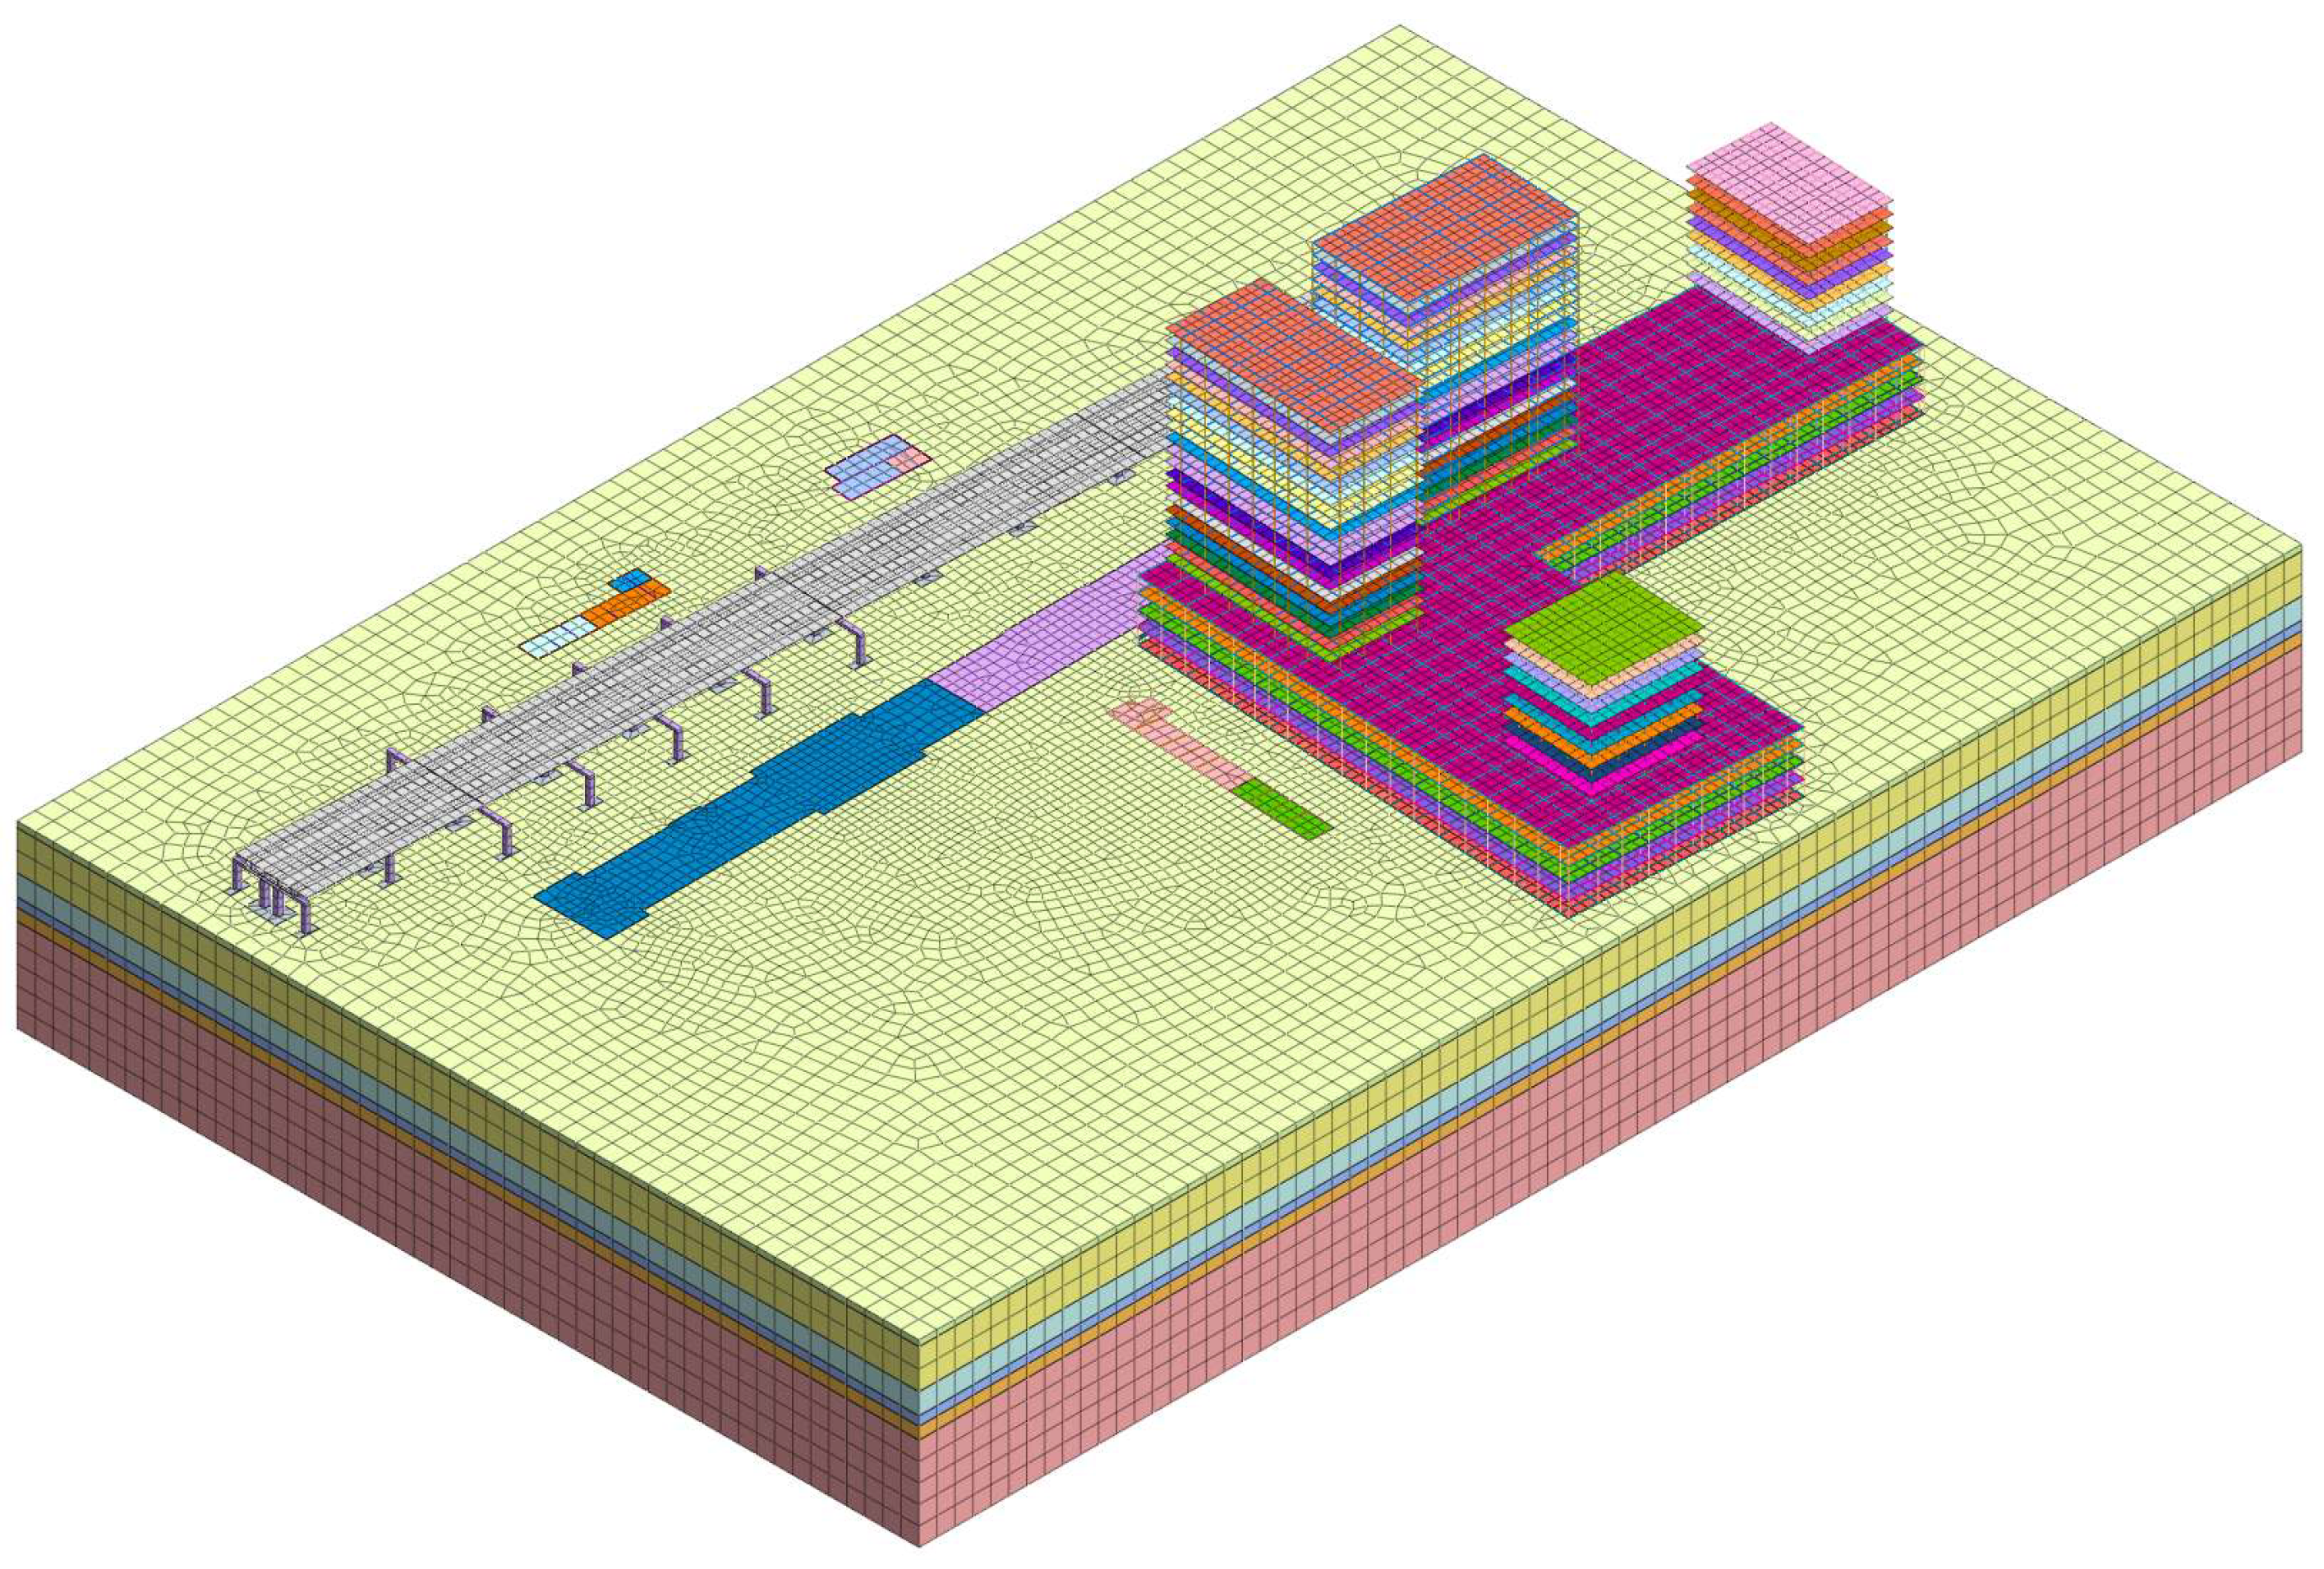
The safety risk assessment for adjacent buildings during deep excavation essentially involves determining the variation patterns of soil layers to establish deformation control indices for the soil. The numerical simulation in this study was conducted using the large-scale finite element software Midas GTS NX 2025 [16]. Based on Saint-Venant’s principle and practical requirements, a calculation model of the station foundation pit and existing structures was established in accordance with the design drawings of the subway station and existing structures. Among them, the surrounding soil was simulated with 3D solid elements; the foundation pit support structure, station roof slab, middle slab, bottom slab, side walls, and secondary lining of the entrance/exit were simulated with 2D plate elements; the station beams and columns were simulated with 1D beam elements; the plates of existing buildings were simulated with 2D plate elements; the beams, columns, and pile foundations of existing buildings were simulated with 1D line elements.
For bored cast-in-place piles, they are closely arranged and connected with waling beams and capping beams as an integrated whole. Additionally, the model focuses on the deformation relationship between the support structure, existing tunnel structure, and the soil between them during foundation pit excavation. Therefore, the interaction between piles and the soil between piles can be ignored, and the piles can be considered as a whole. Thus, a 2D plate element with equivalent thickness is adopted for simulation. The equivalent thickness of the plate element is determined by the equal stiffness method. Specifically, the pile wall is equivalent to a “diaphragm wall” of a certain thickness in accordance with the principle of equal flexural stiffness. To ensure calculation convergence, the contact relationship between the equivalent diaphragm wall and the soil is not considered [17]. The calculation formula is as follows:
1 12 ( D + t ) h 3 = 1 64 π D 4 h = 0.838 D 1 1 + t T 3
h = 0.838 D 1 1 + t T 3
where, D denotes the pile diameter of bored cast-in-place piles, t denotes the pile spacing, and h denotes the equivalent thickness.
The modified Mohr-Coulomb model [18] was adopted for the soil constitutive relation, while the linear elastic model was used for all structural elements. The calculation model is shown in Figure 14.
The model employs fixed displacement boundaries, with the upper boundary set as a free surface, the normal displacements of the four peripheral faces constrained, and the vertical displacement of the lower boundary restricted. Detailed construction sequences are listed in Table 4.
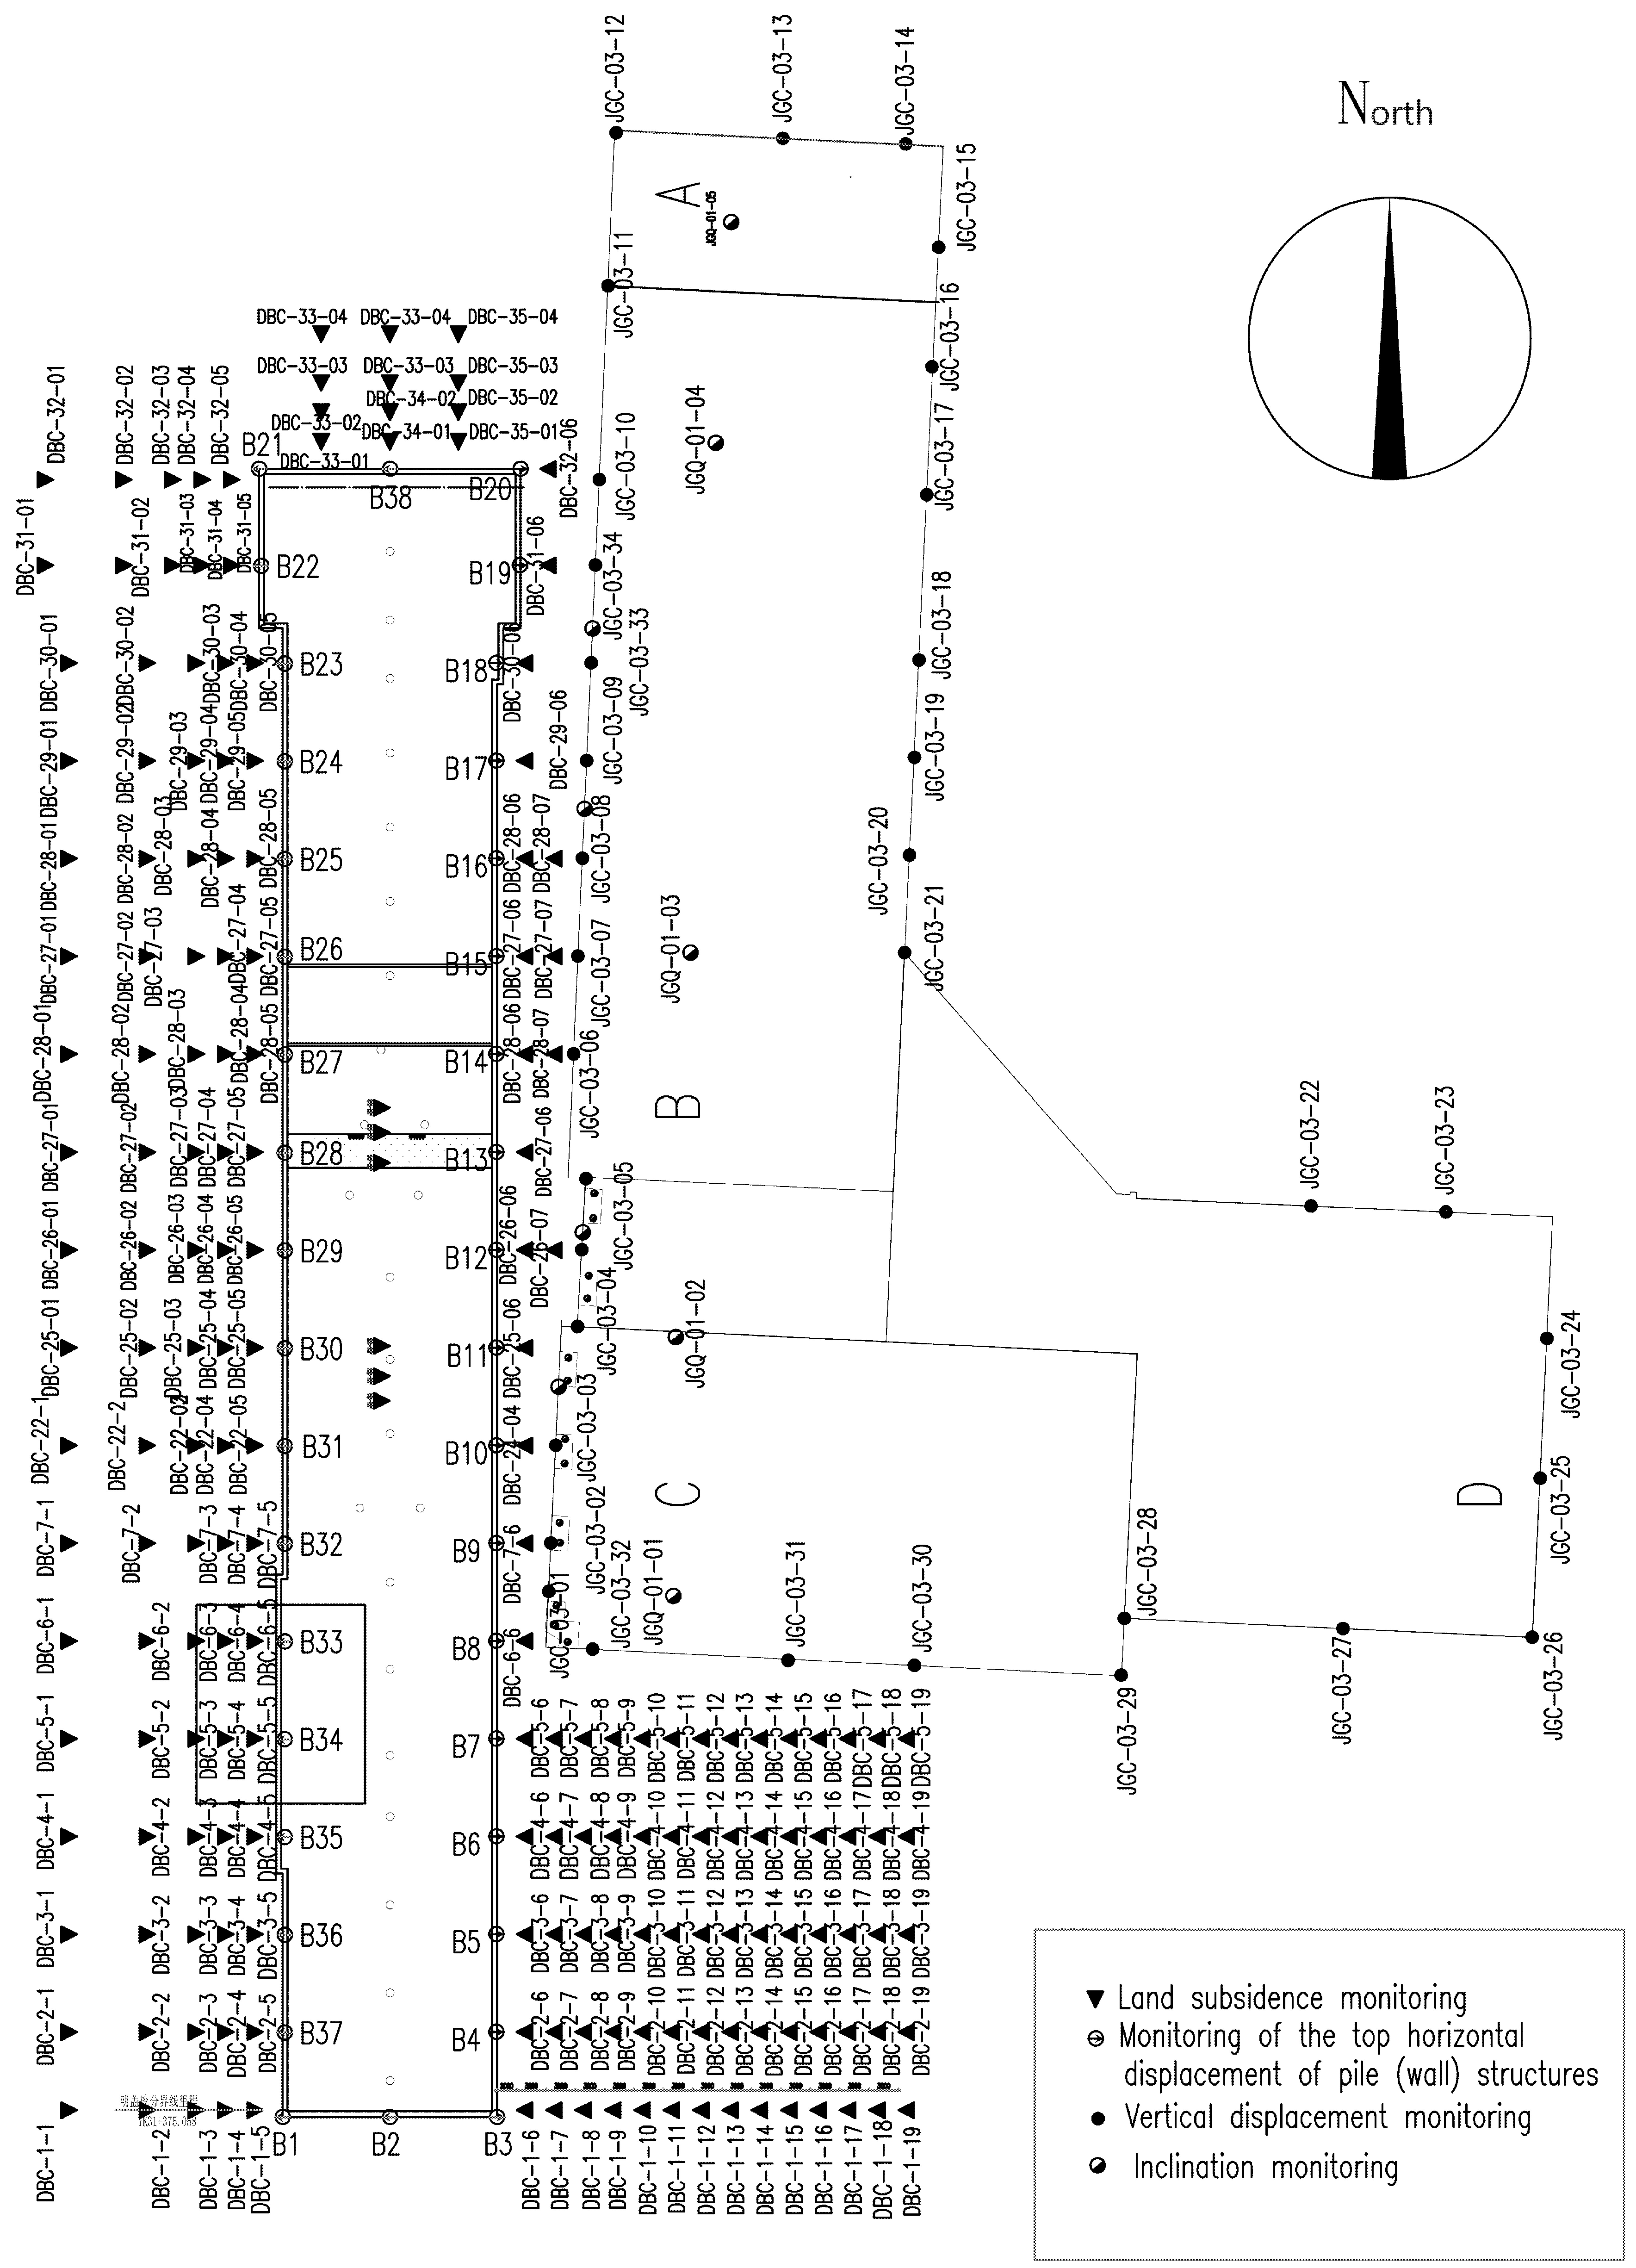
On the premise of satisfying the safety assessment requirements for both the engineering structure and the surrounding environment, the layout positions and quantities of monitoring points within the influence zone of the foundation pit project are determined as shown in Figure 15.

8. Study and Analysis of Horizontal Displacement Patterns of Retaining Piles Under Various Working Conditions

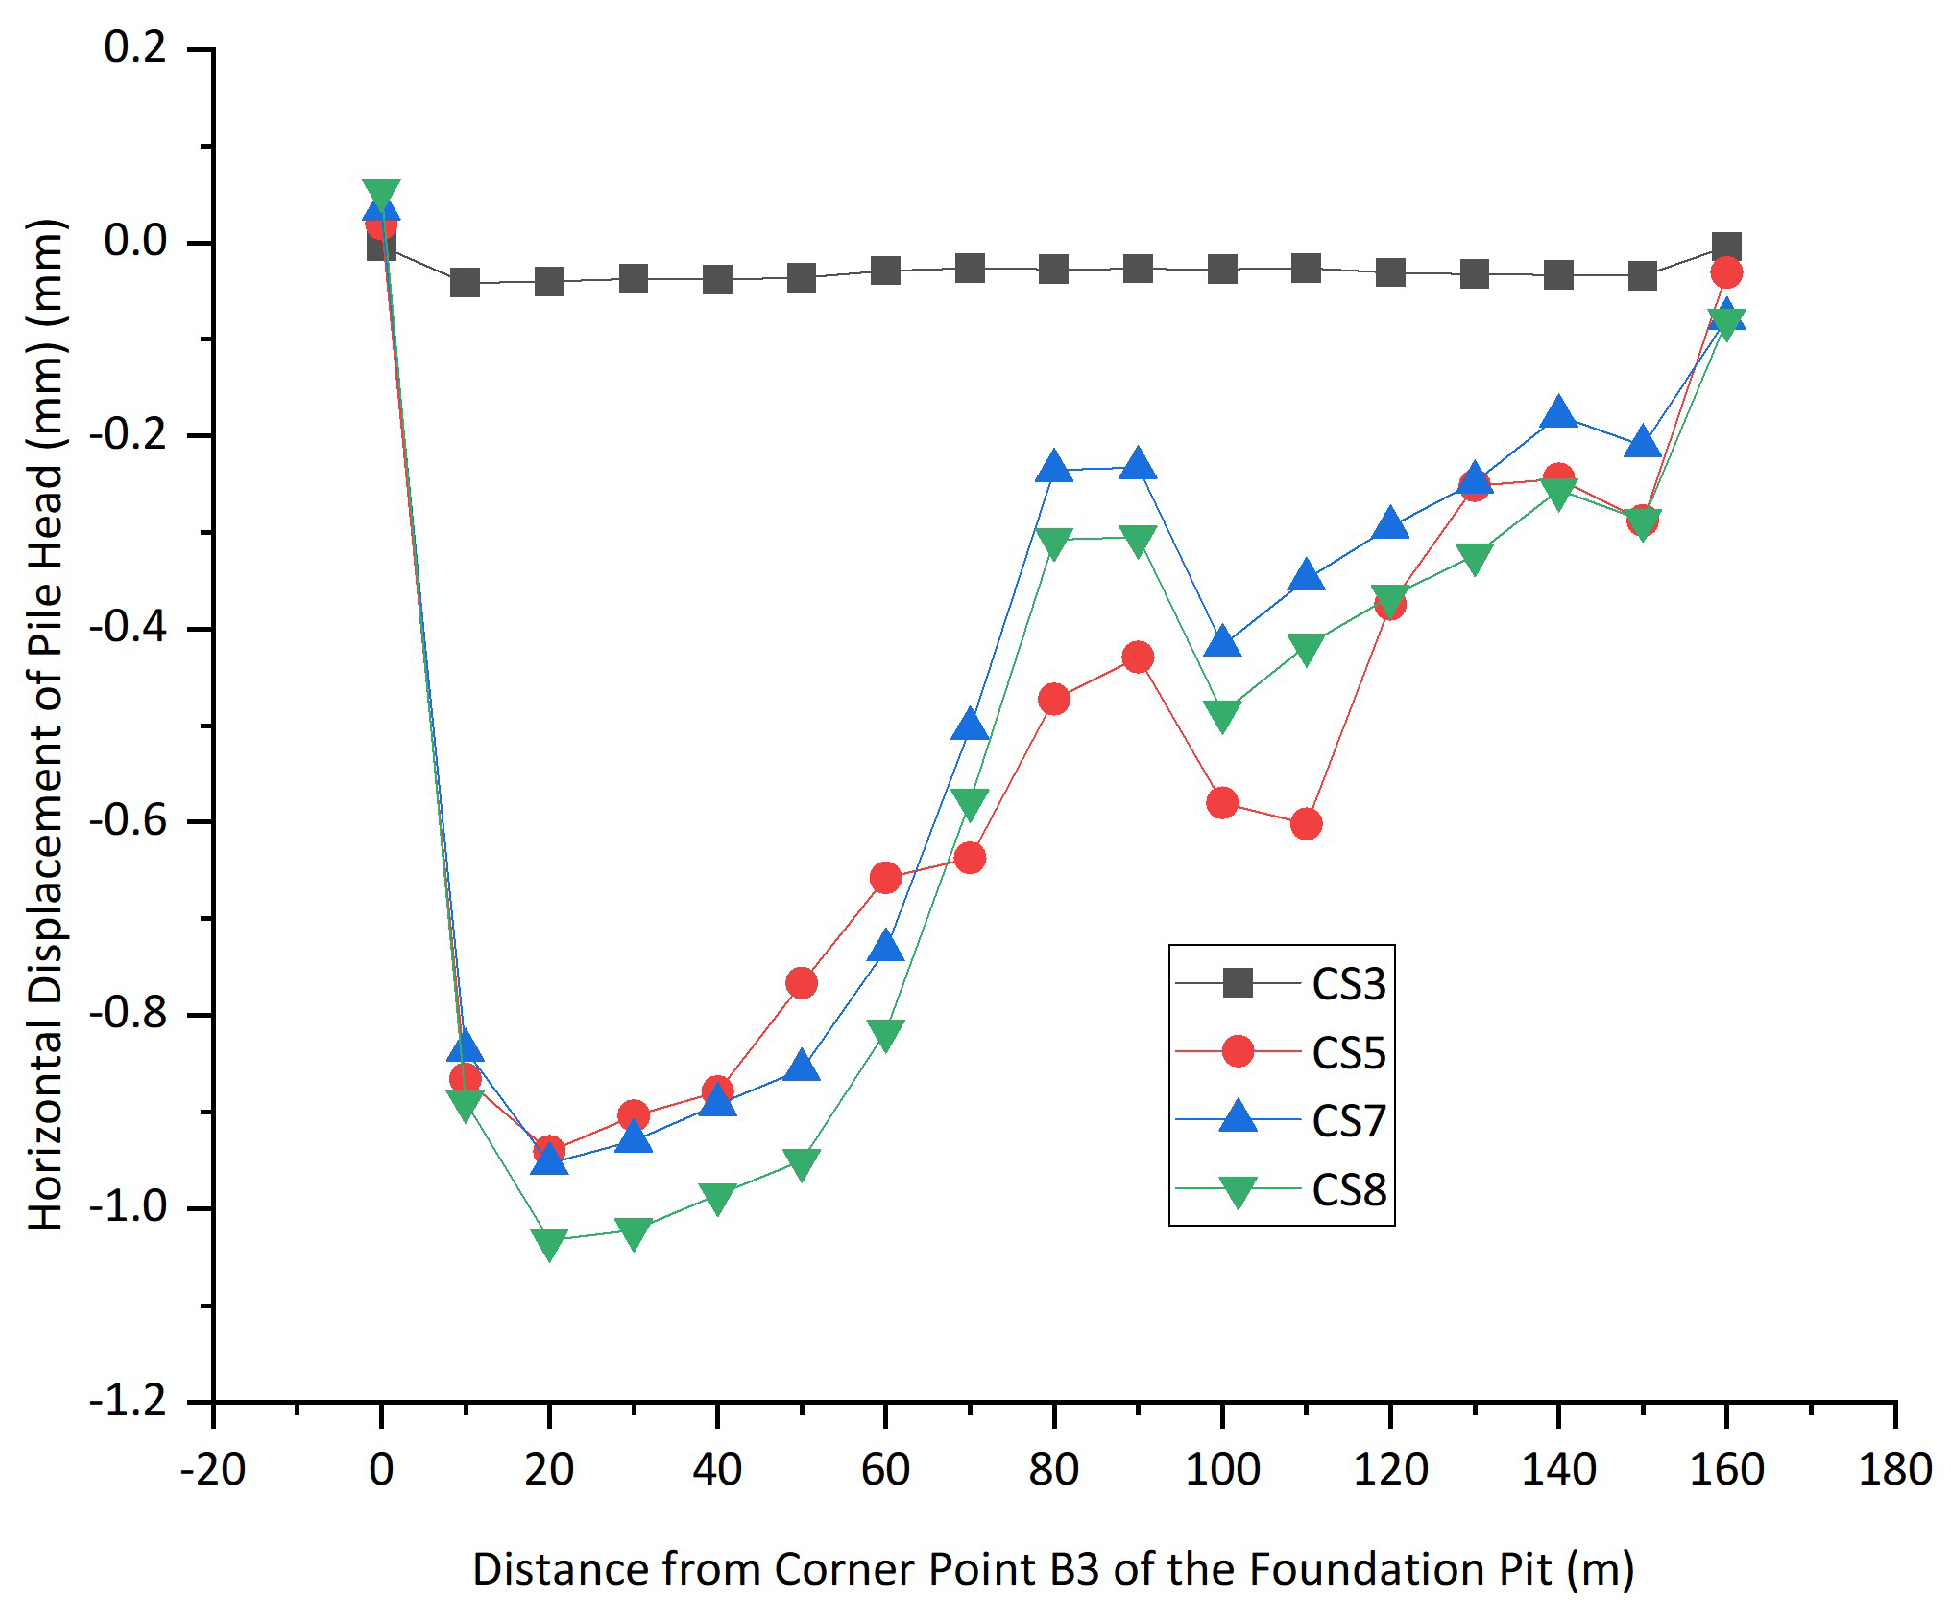
The initial parameters of the model (such as cohesion and internal friction angle, and so on) were determined based on drilling data and the results of laboratory geotechnical tests. The horizontal displacements of the retaining structure pile heads under various working conditions were extracted from the model. The node positions are shown in Figure 15. For the short side of the foundation pit, nodes at the corners and midpoint (B1, B2, B3, B20, B21, B38) were extracted. Along the long side, nodes were extracted at 10 m intervals (B4–B19, B22–B37). Figure 16 presents the horizontal displacements of pile heads adjacent to the building.
As shown in Figure 16, during the cover-and-cut top-down construction process, the horizontal displacement of the retaining structure pile heads on the side adjacent to the building increases gradually with soil excavation. This occurs because after soil unloading inside the pit, the horizontal resistance provided to the retaining wall decreases, while the earth pressure outside the pit remains constant, causing the wall to incline toward the pit. An inflection point appears at a distance of 20 m from B3; within the range of 20 m to 60 m, the horizontal displacement of the pile heads decreases gradually but increases progressively as the construction proceeds. Within the range of adjacent buildings (distance from B3 greater than 60 m), the horizontal displacement exhibits a pattern of linear decrease—stabilization—increase—decrease. The smallest horizontal displacements occur at the corner points of the foundation pit (B3, B20), decreasing gradually along the longitudinal direction of the pit until reaching the midpoints (B11, B12) along its length. Except for B3, the direction of horizontal displacement is uniformly toward the inner side of the foundation pit, with consistent deformation patterns across all working conditions. The overall horizontal displacements are relatively small, The maximum horizontal displacement is 1.03 mm, with a value relative to the foundation pit depth of 0.004%, which meets the specifications of the current national standard technical standard for monitoring measurement of urban rail transit engineering [19] that the horizontal displacement at the top of the support structure (wall) relative to the foundation pit depth shall be within 0.1–0.15%. The maximum horizontal displacement occurs in the construction stage CS8.
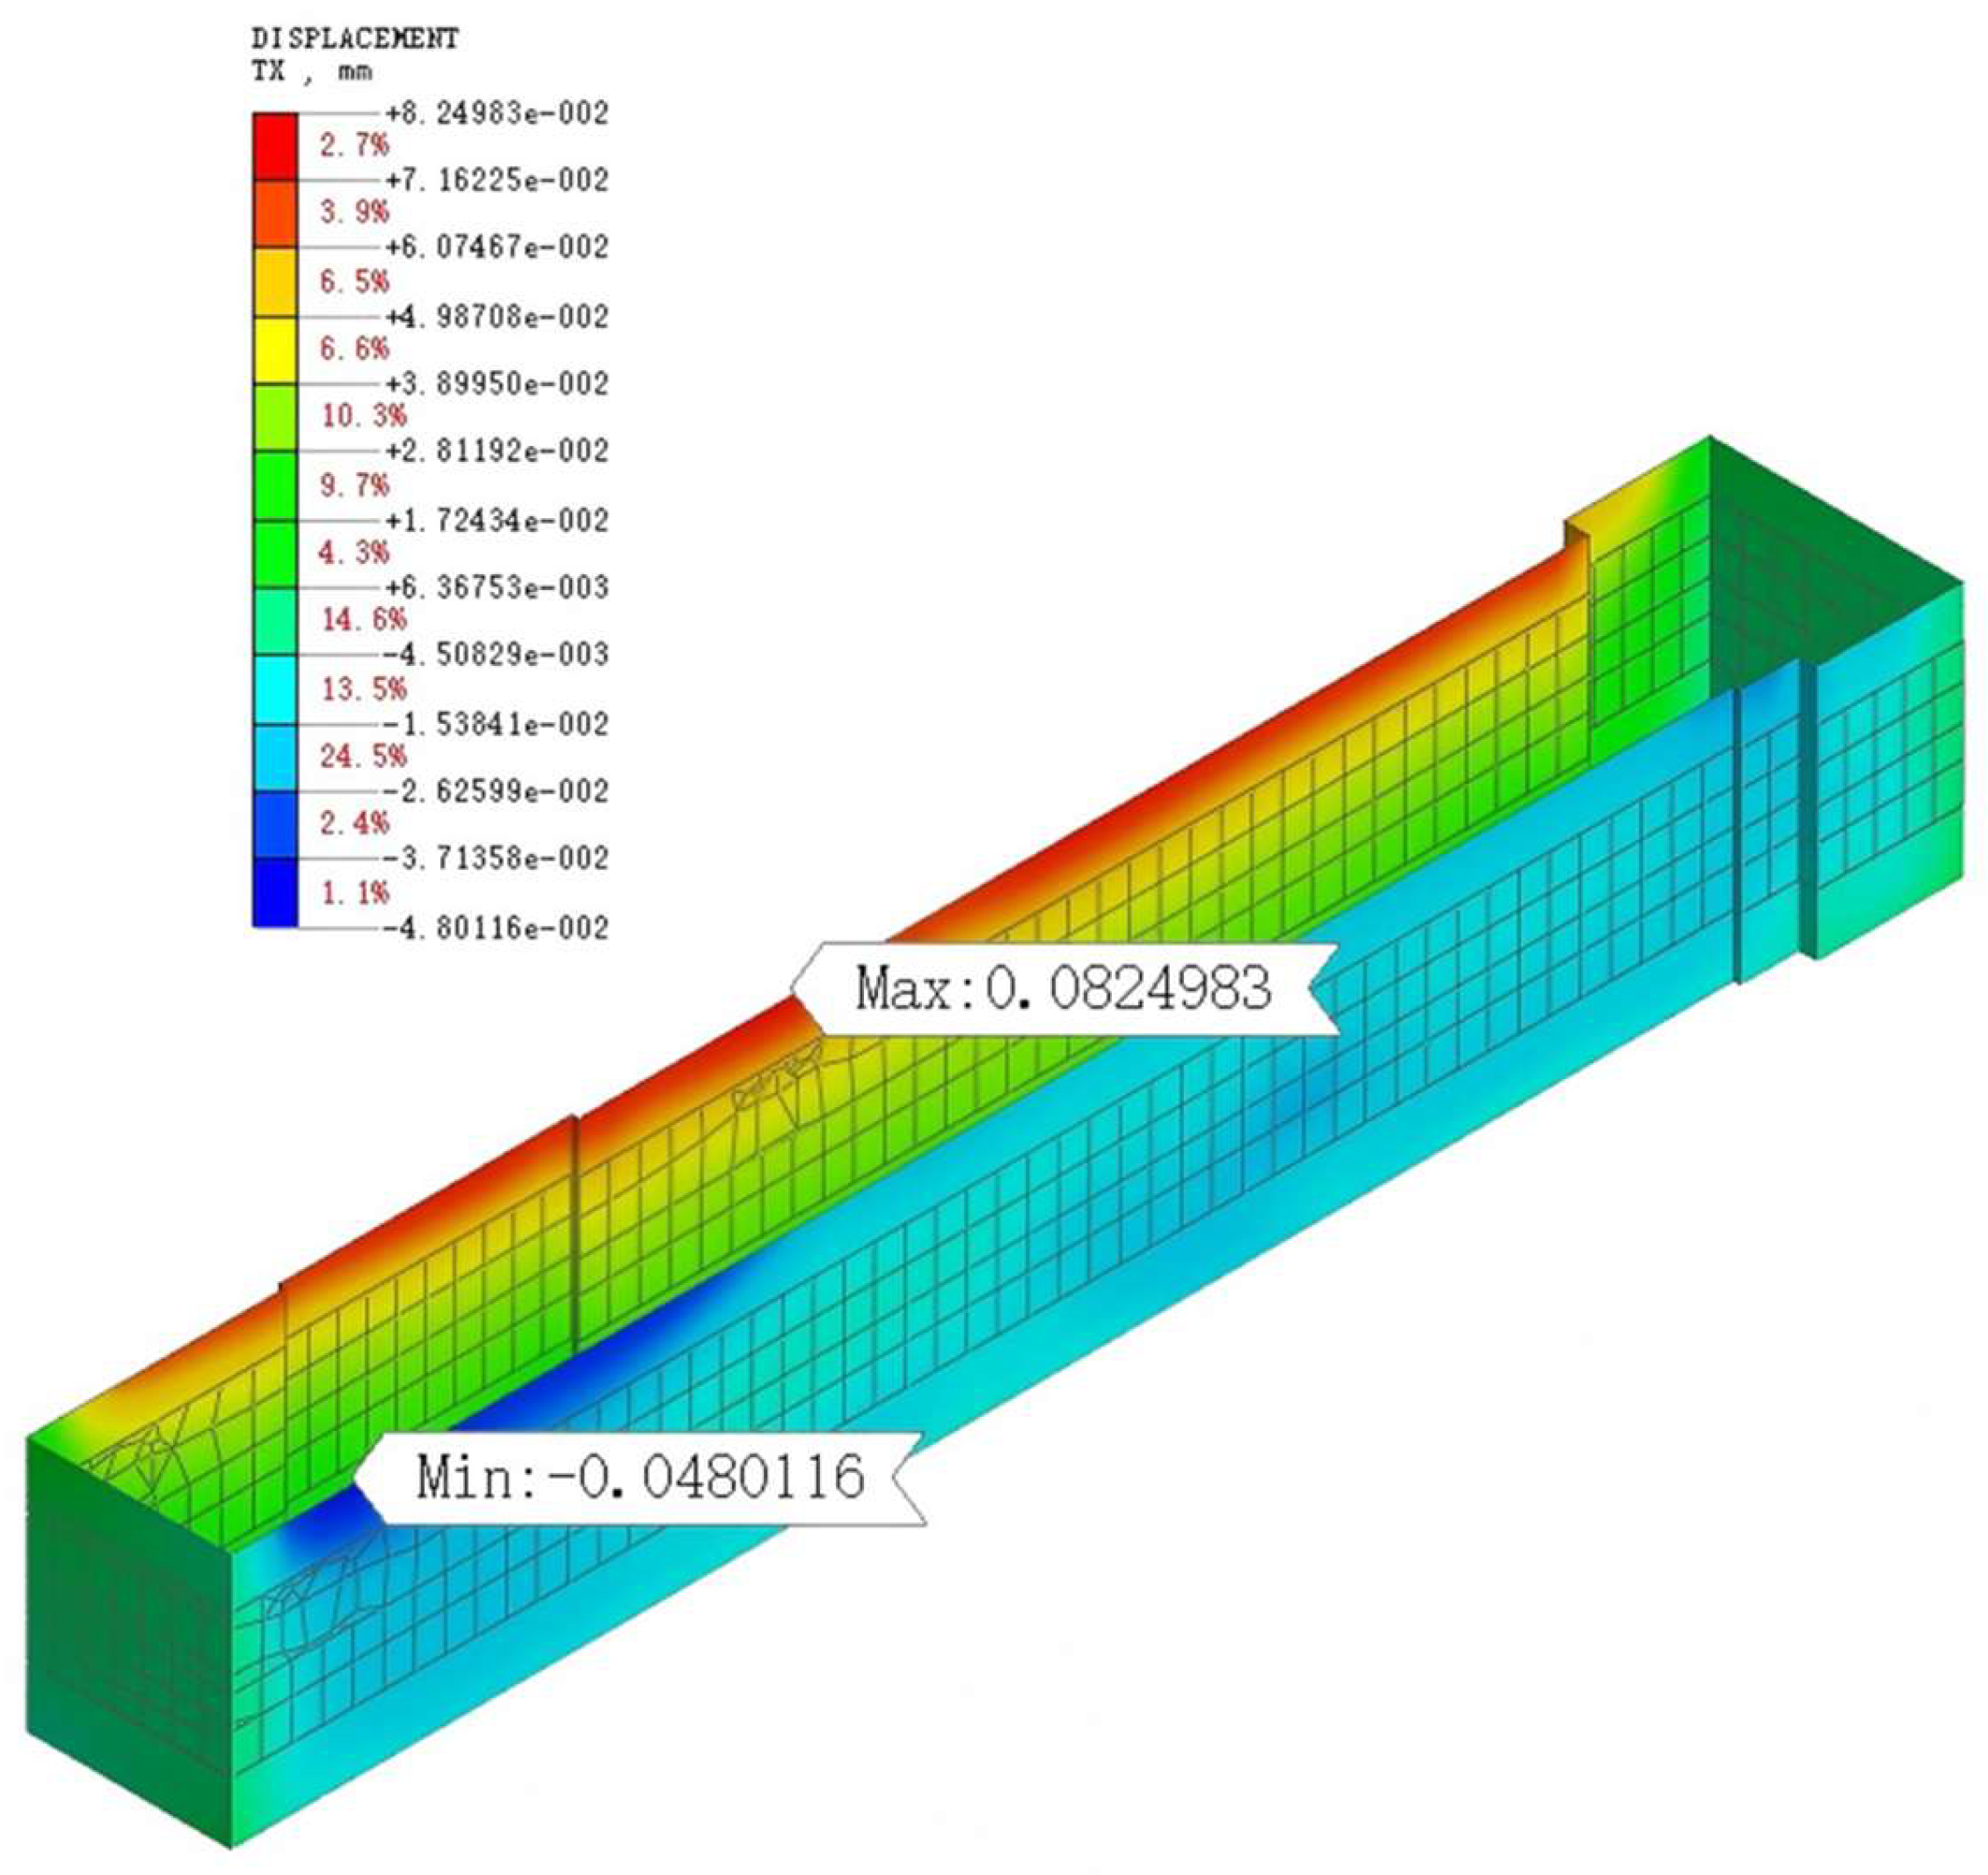
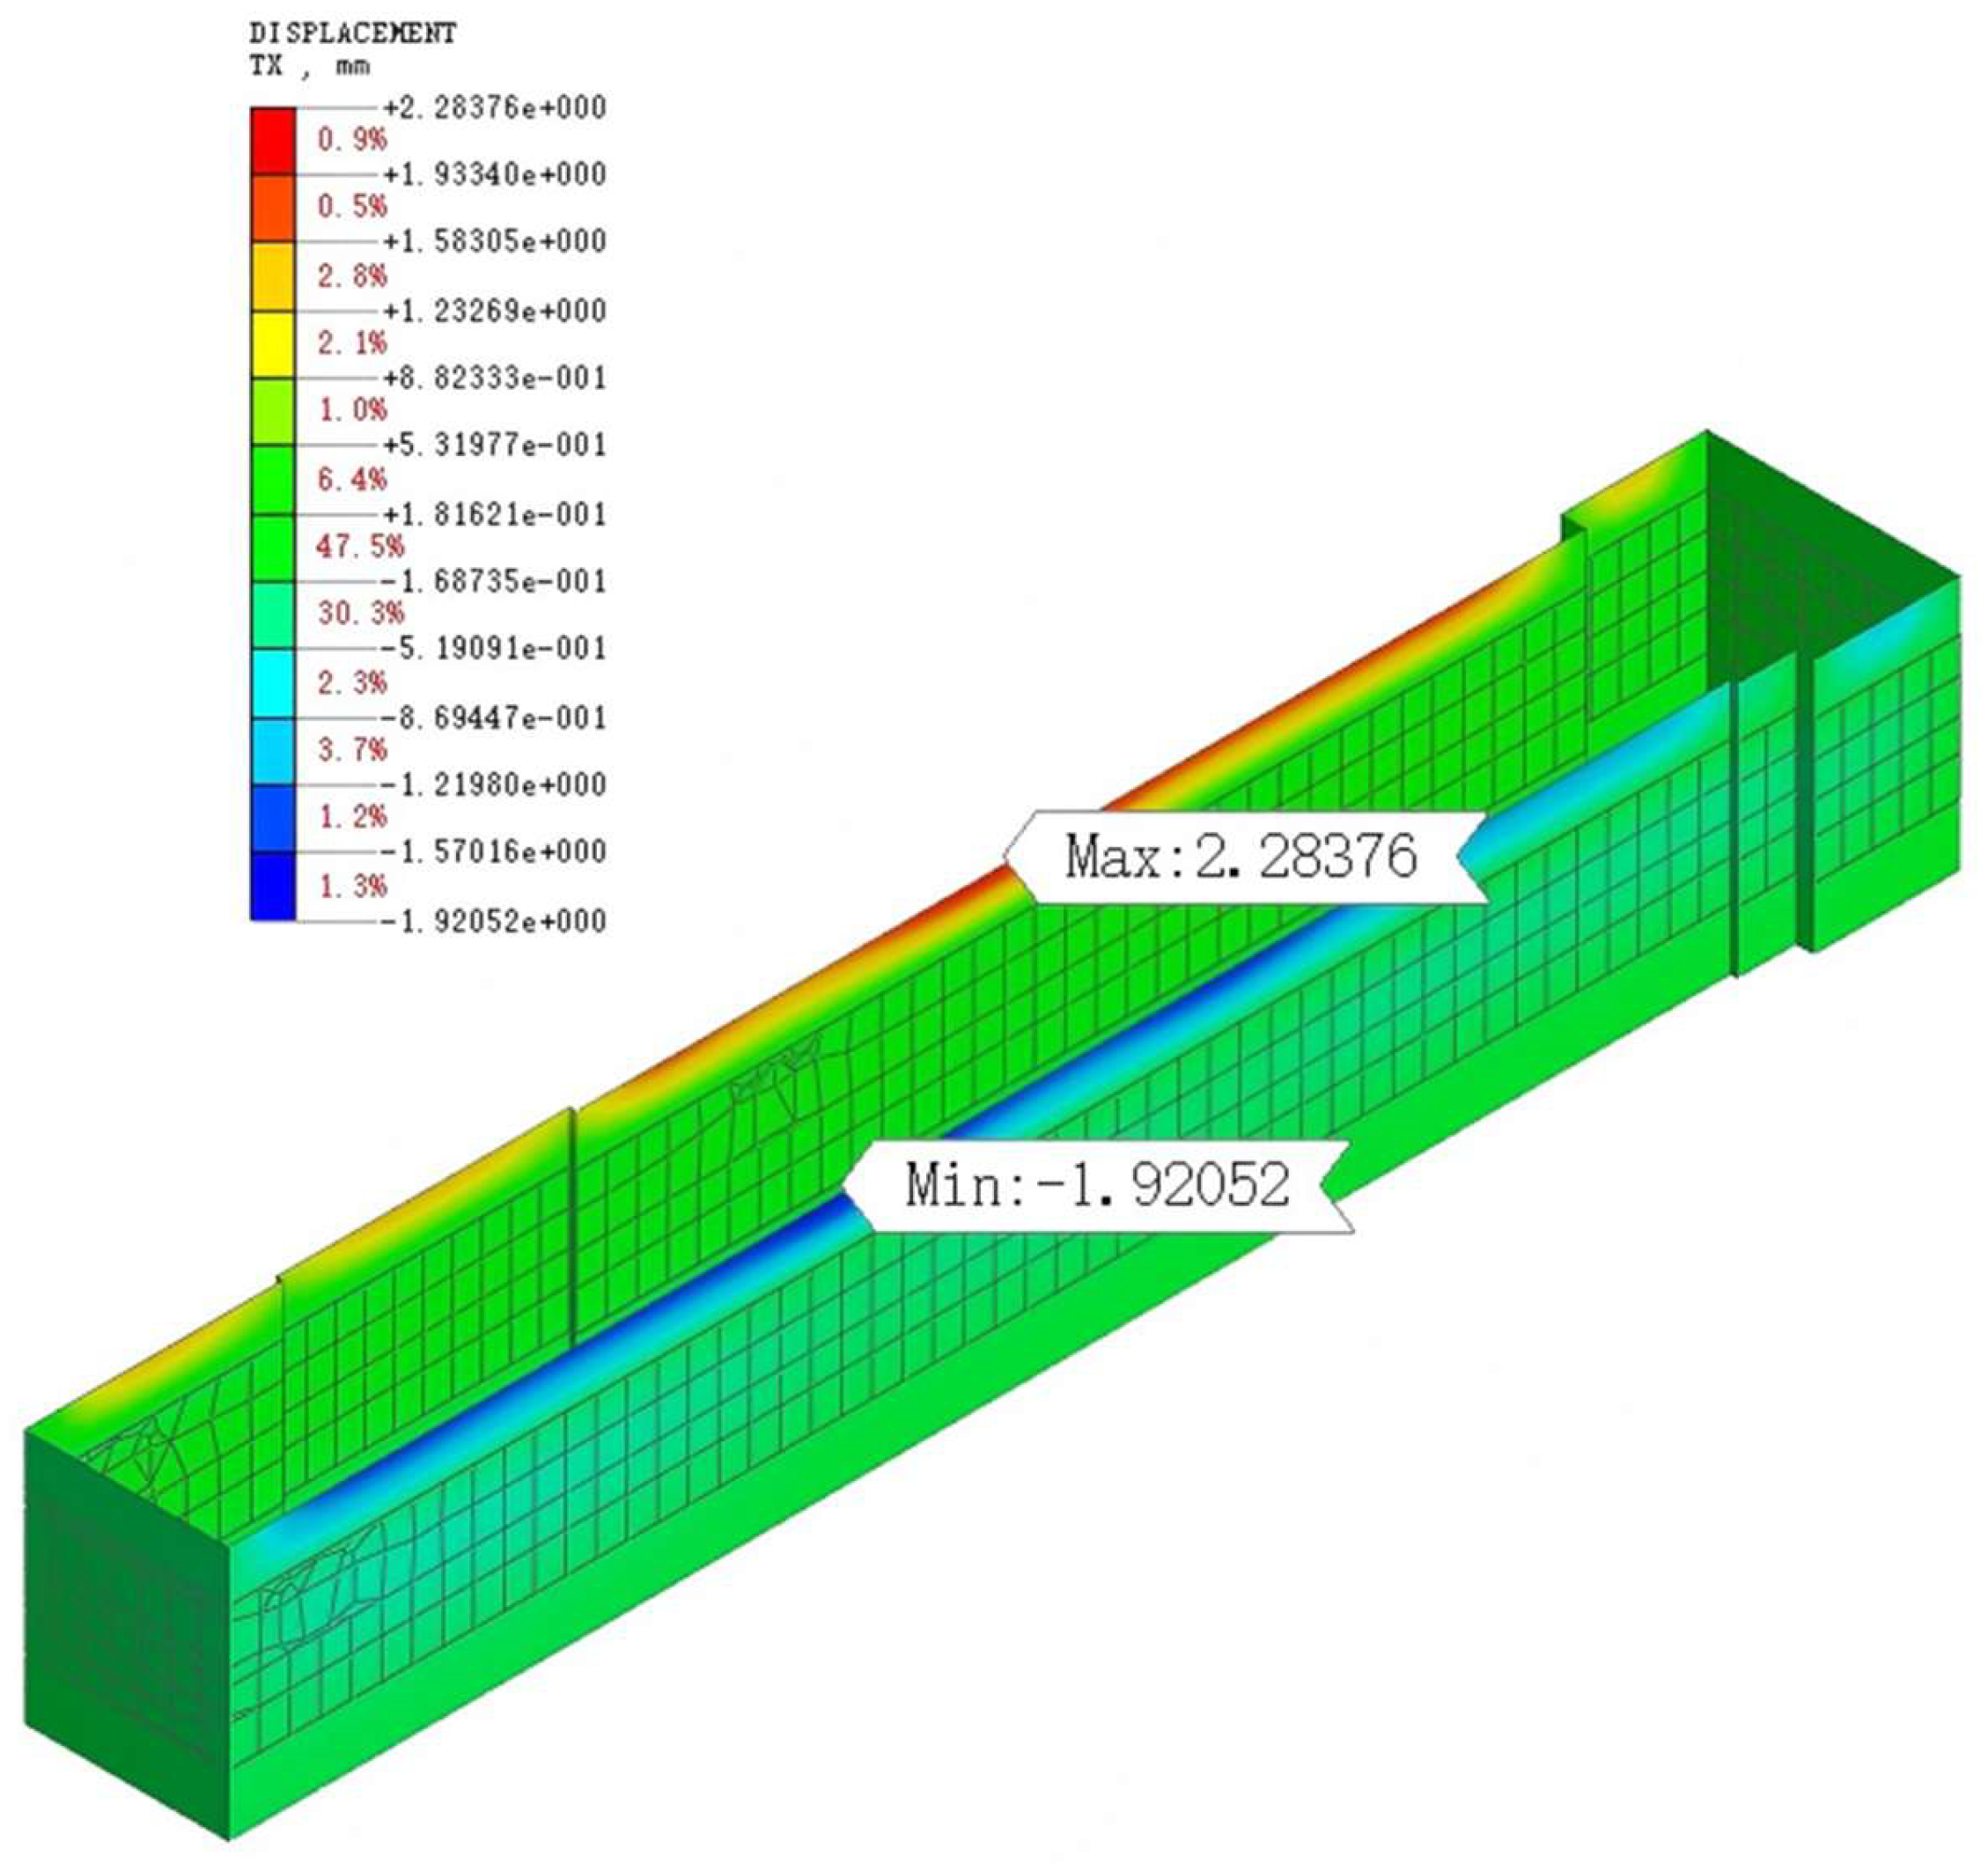
The maximum horizontal displacements of retaining piles at nodes B1 to B38 and their corresponding excavation depths are extracted, as shown in Figure 17, Figure 18, Figure 19, Figure 20 and Figure 21.
As indicated by the simulation results, the maximum horizontal displacement of the retaining piles occurs at CS8, at the depth of the foundation pit bottom. This demonstrates that the top-down construction method, which uses floor slabs as horizontal supports, can provide horizontal constraints for the retaining structure, reduce its lateral displacement, avoid adverse impacts on surrounding buildings and underground pipelines caused by excessive deformation, and significantly improve the horizontal stiffness and stability of the retaining structure.
Compared with similar geotechnical conditions in the same region, for a deep foundation pit project with combined top-down and bottom-up construction in Changchun, the horizontal displacement of the retaining structure during top-down construction reached a maximum value of −2.75 mm, which occurred at the 5th basement floor during the cut-and-cover construction [20]. The horizontal displacement of the retaining structure exhibited similar variation laws and comparable extreme values.

9. Study on Settlement Patterns of Surrounding Soil

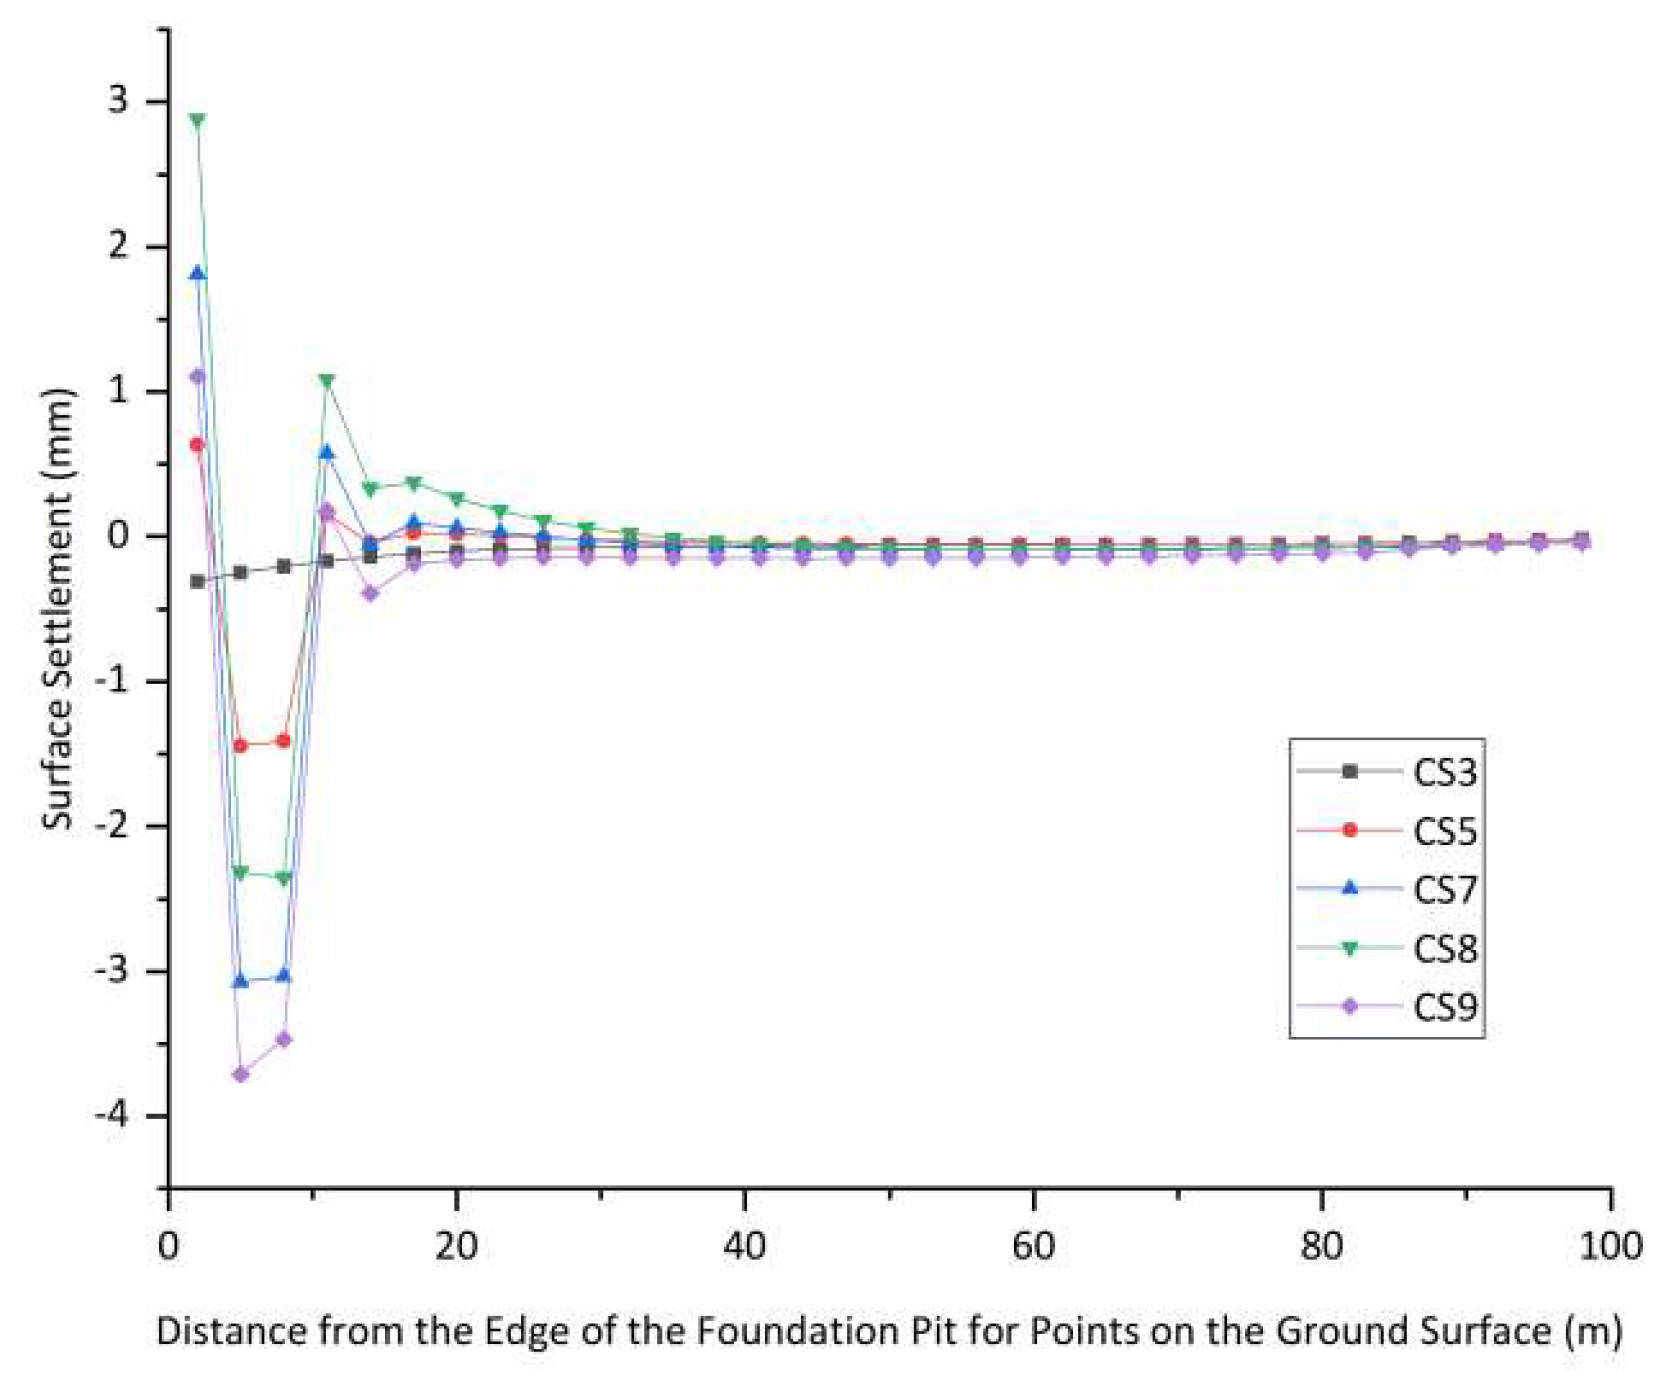
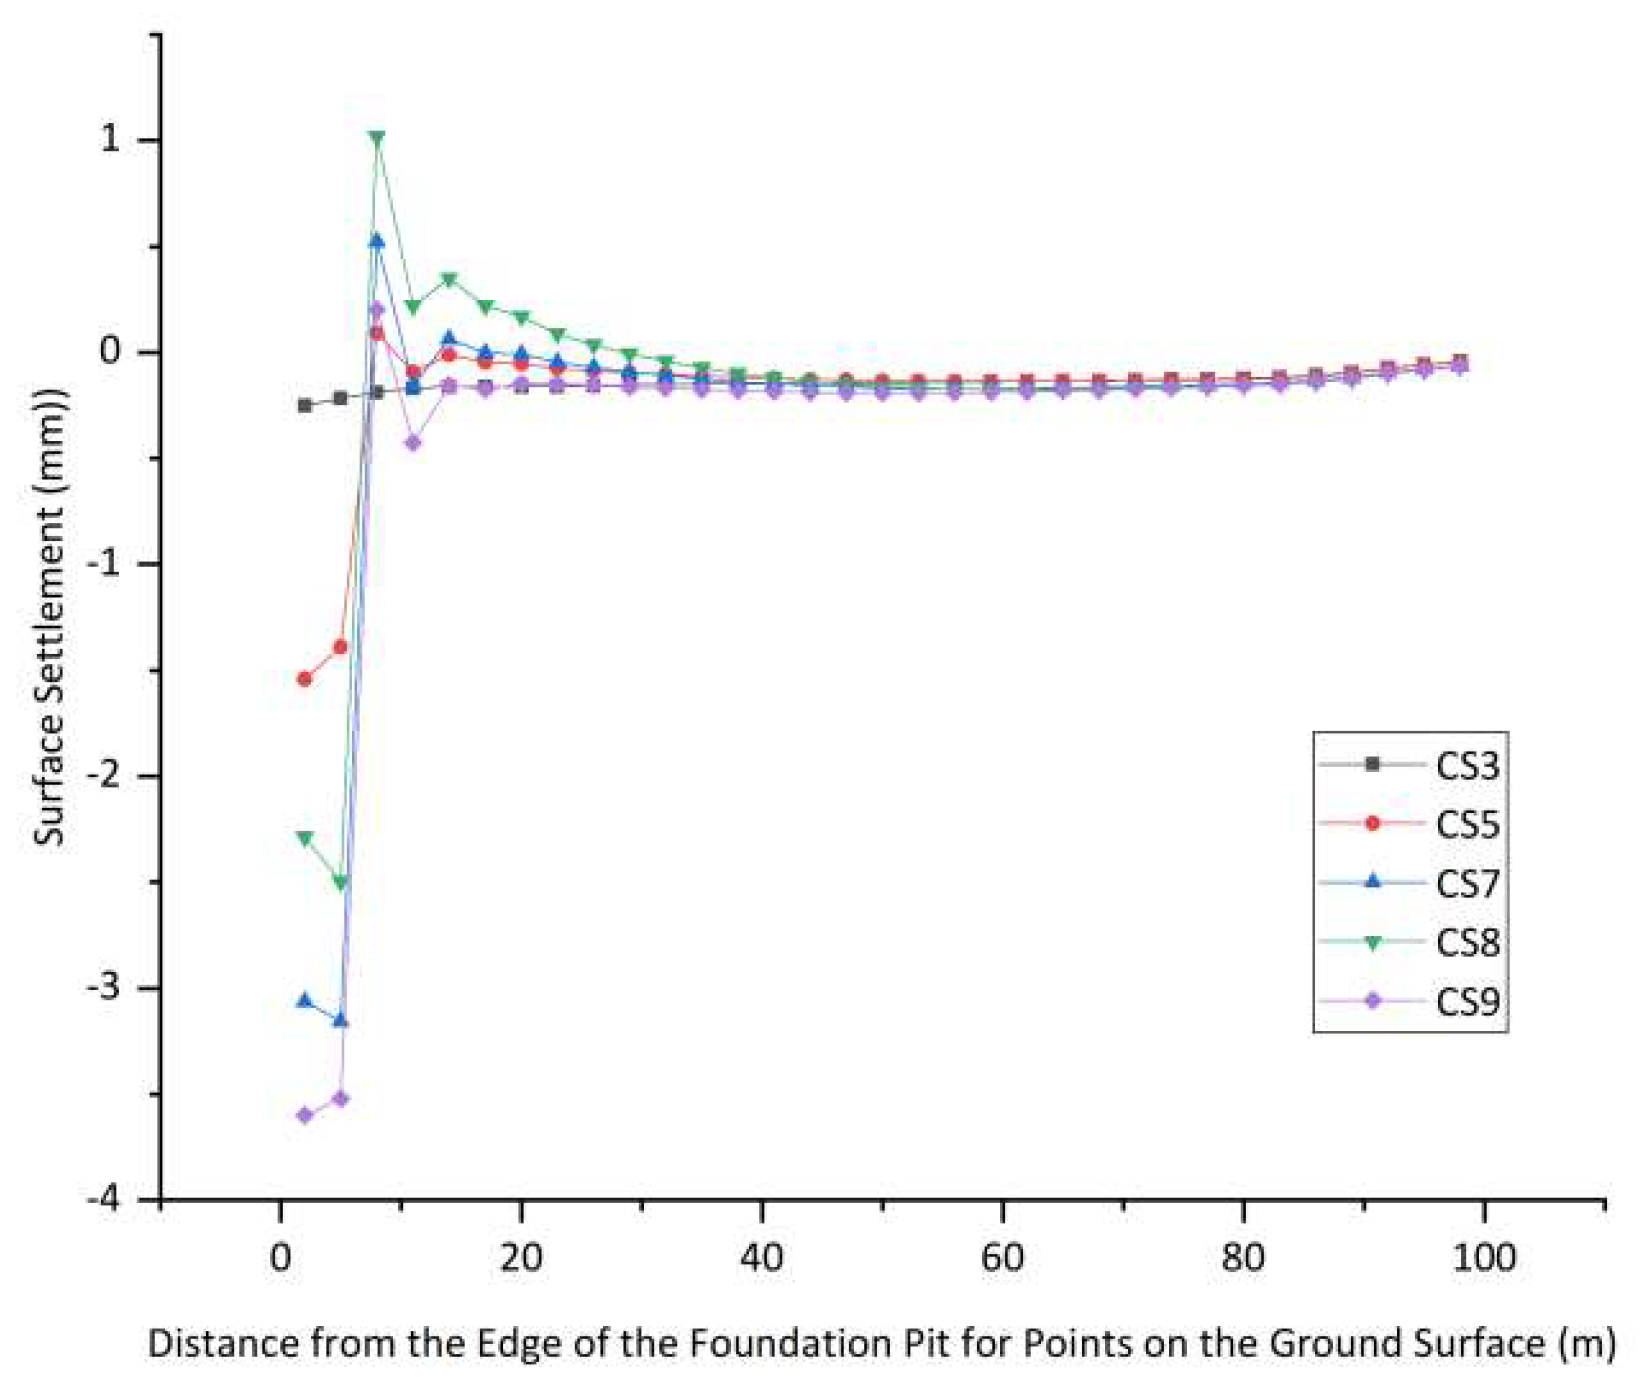
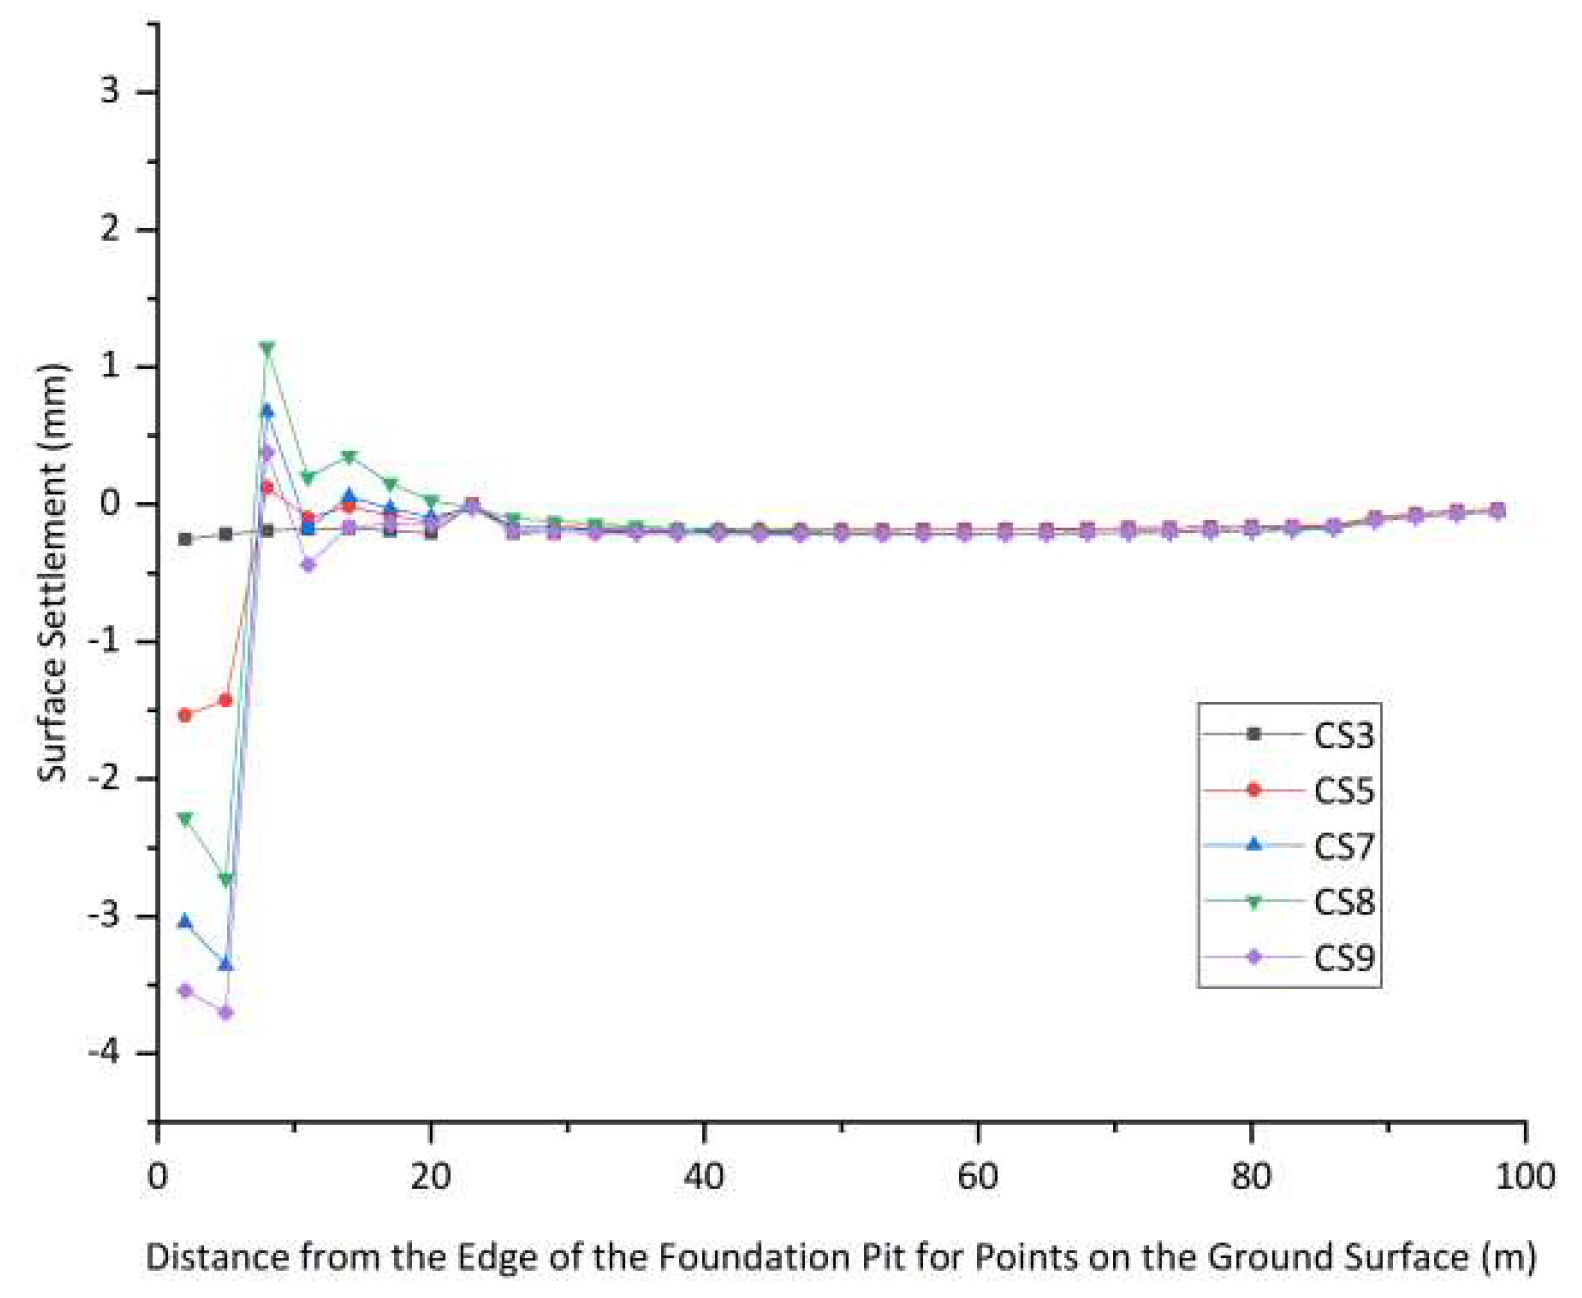
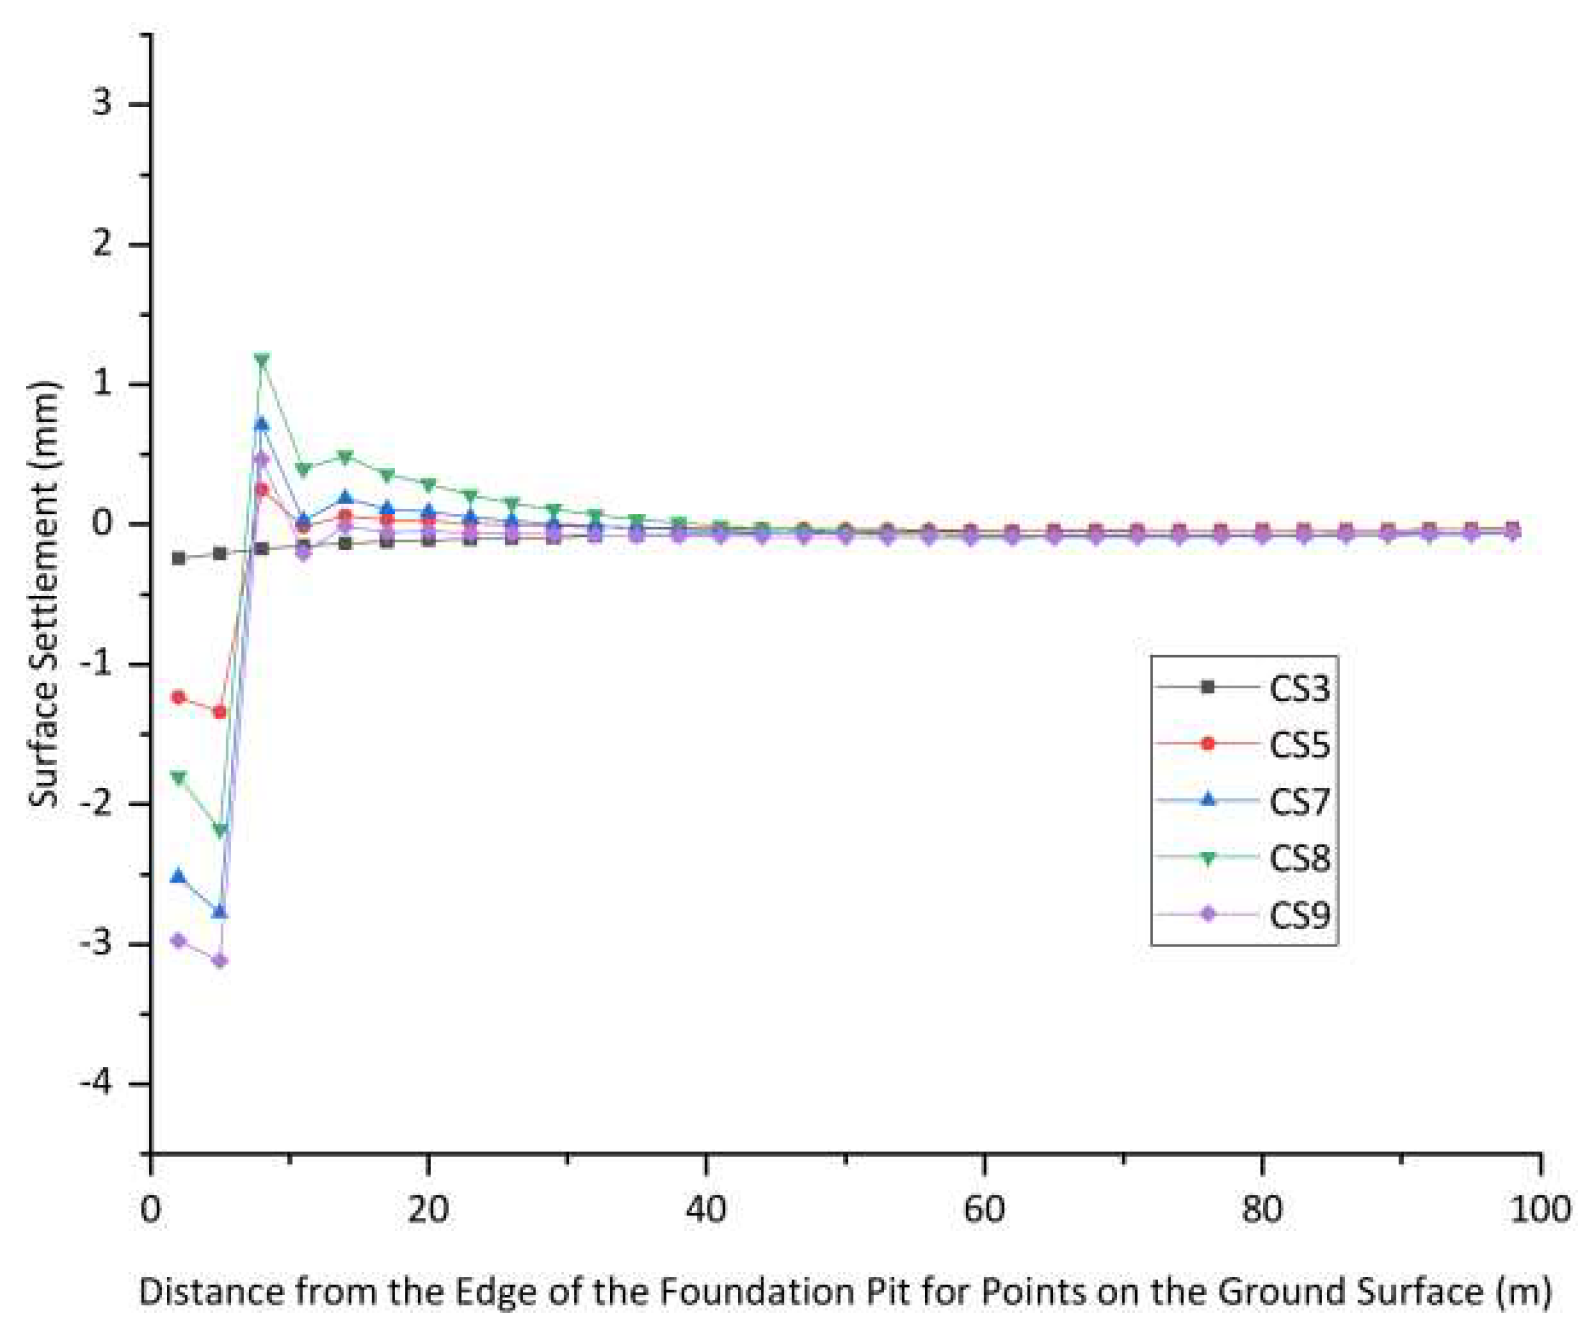
Surface settlement results within 100 m from the edge of the retaining structure in the numerical simulation results on the right side of nodes B4 to B7 are extracted, and surface settlement curves under various working conditions are plotted, as shown in Figure 22, Figure 23, Figure 24 and Figure 25.
As shown in Figure 22, Figure 23, Figure 24 and Figure 25, the surface settlement patterns at the right-side nodes B4 to B7 exhibit consistent trends: surface settlement values gradually increase with the progressive excavation of the foundation pit, reaching their maximum when the excavation reaches the bottom slab. Within a distance of 8 m (approximately 0.34 He) from the foundation pit, significant surface settlement occurs, where the deformation of the retaining wall causes substantial disturbance to the adjacent soil. The interconnection between lateral soil displacement and vertical settlement leads to rapid development of surface settlement, with the settlement curves exhibiting a steeper slope. In the range of 8–29 m (approximately 0.34–1.25 He), surface settlement changes relatively gently with distance, and the slope of the settlement curves gradually decreases. As the distance from the retaining wall further increases, the influence of excavation on the soil diminishes, resulting in reduced stress changes and a gradual attenuation of surface settlement; the settlement curves converge, and areas beyond 40 m (approximately 1.73 He) are nearly unaffected by foundation pit excavation.
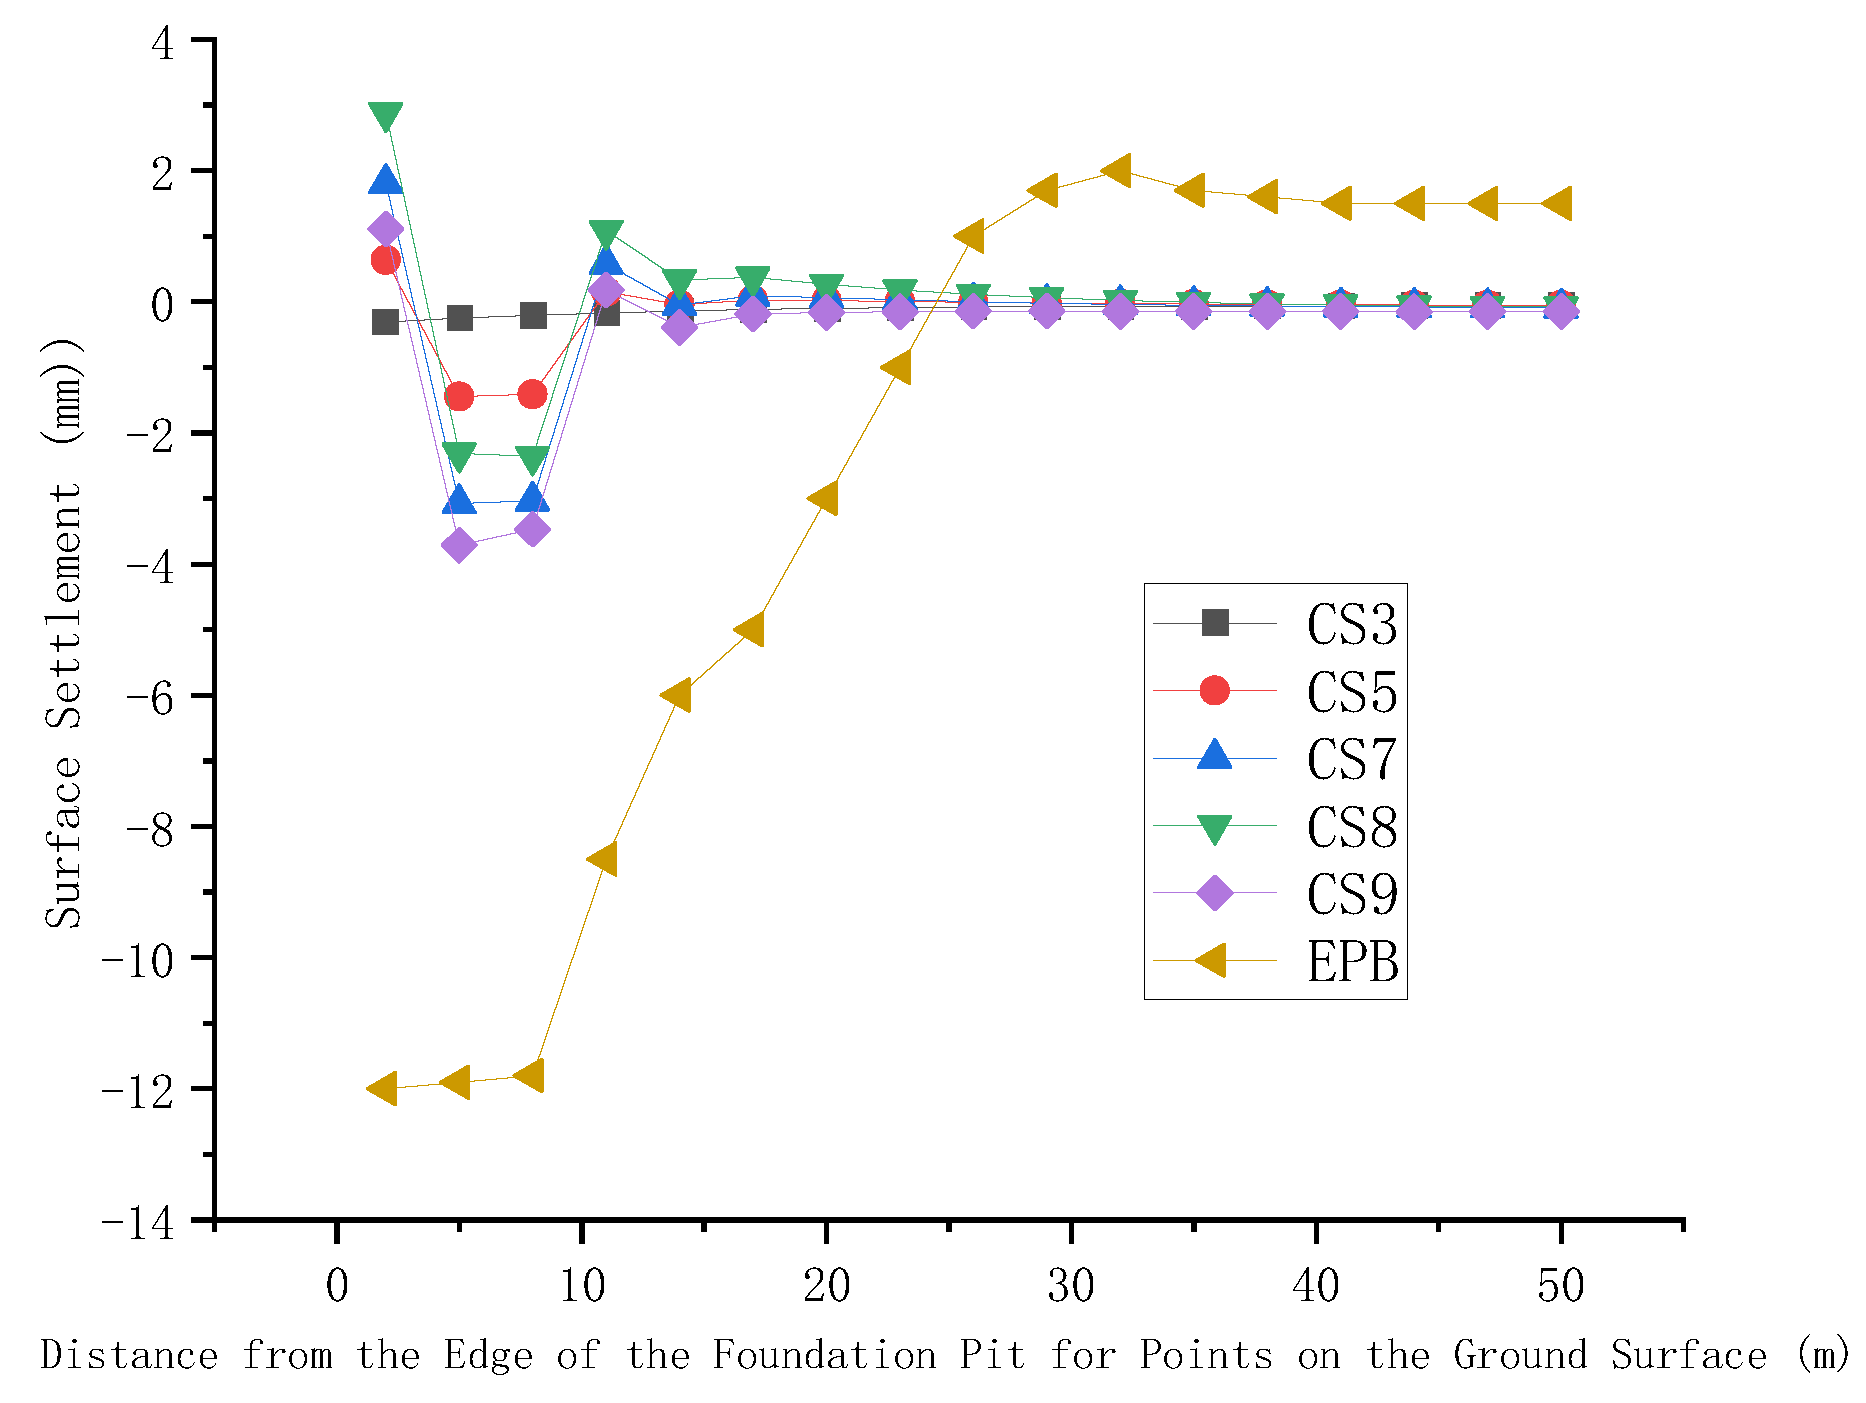
The surface settlement curve within 50 m to the right of B4 is extracted and compared with that of a twin metro tunnel excavation project in Changchun (As shown in Figure 26), which was also constructed using a 6.4 m-diameter Earth Pressure Balance (EPB) shield [21]. The maximum settlement of the EPB shield method (previous studies) is −12 mm, and its settlement magnitude is larger than that of the cover-and-cut top-down construction method. The main settlement influence zones have a similar range, and the overall pattern is comparable. Due to the strong constraint of the support system, the top-down construction method controls the surface settlement within a small range. This difference essentially stems from the distinct principle of the construction method.
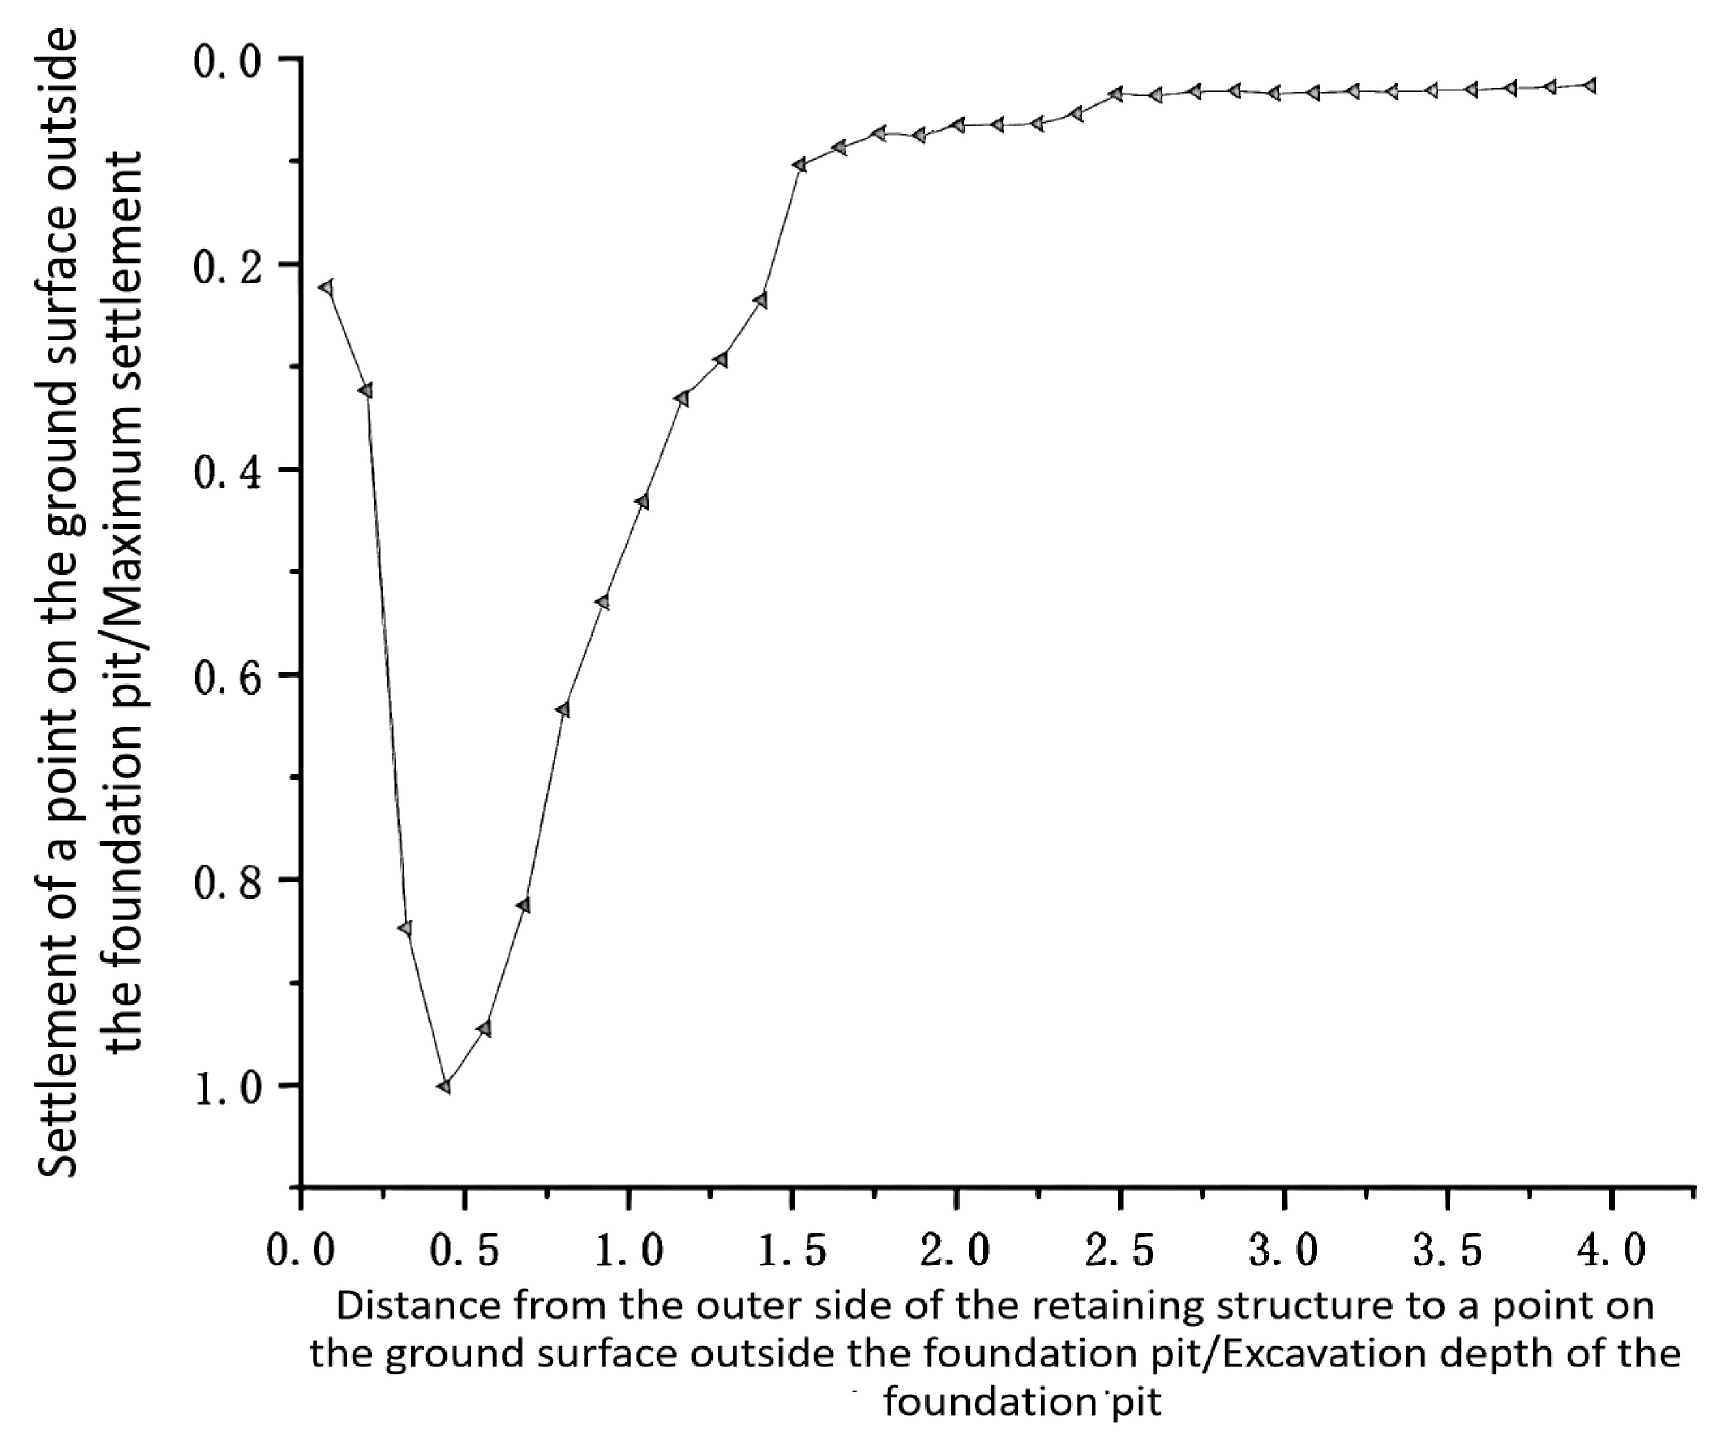
The results under the working condition of top-down construction to the bottom slab are extracted to determine the influence range of the top-down construction method on the soil settlement on the right side of the retaining structure, as shown in Figure 27.
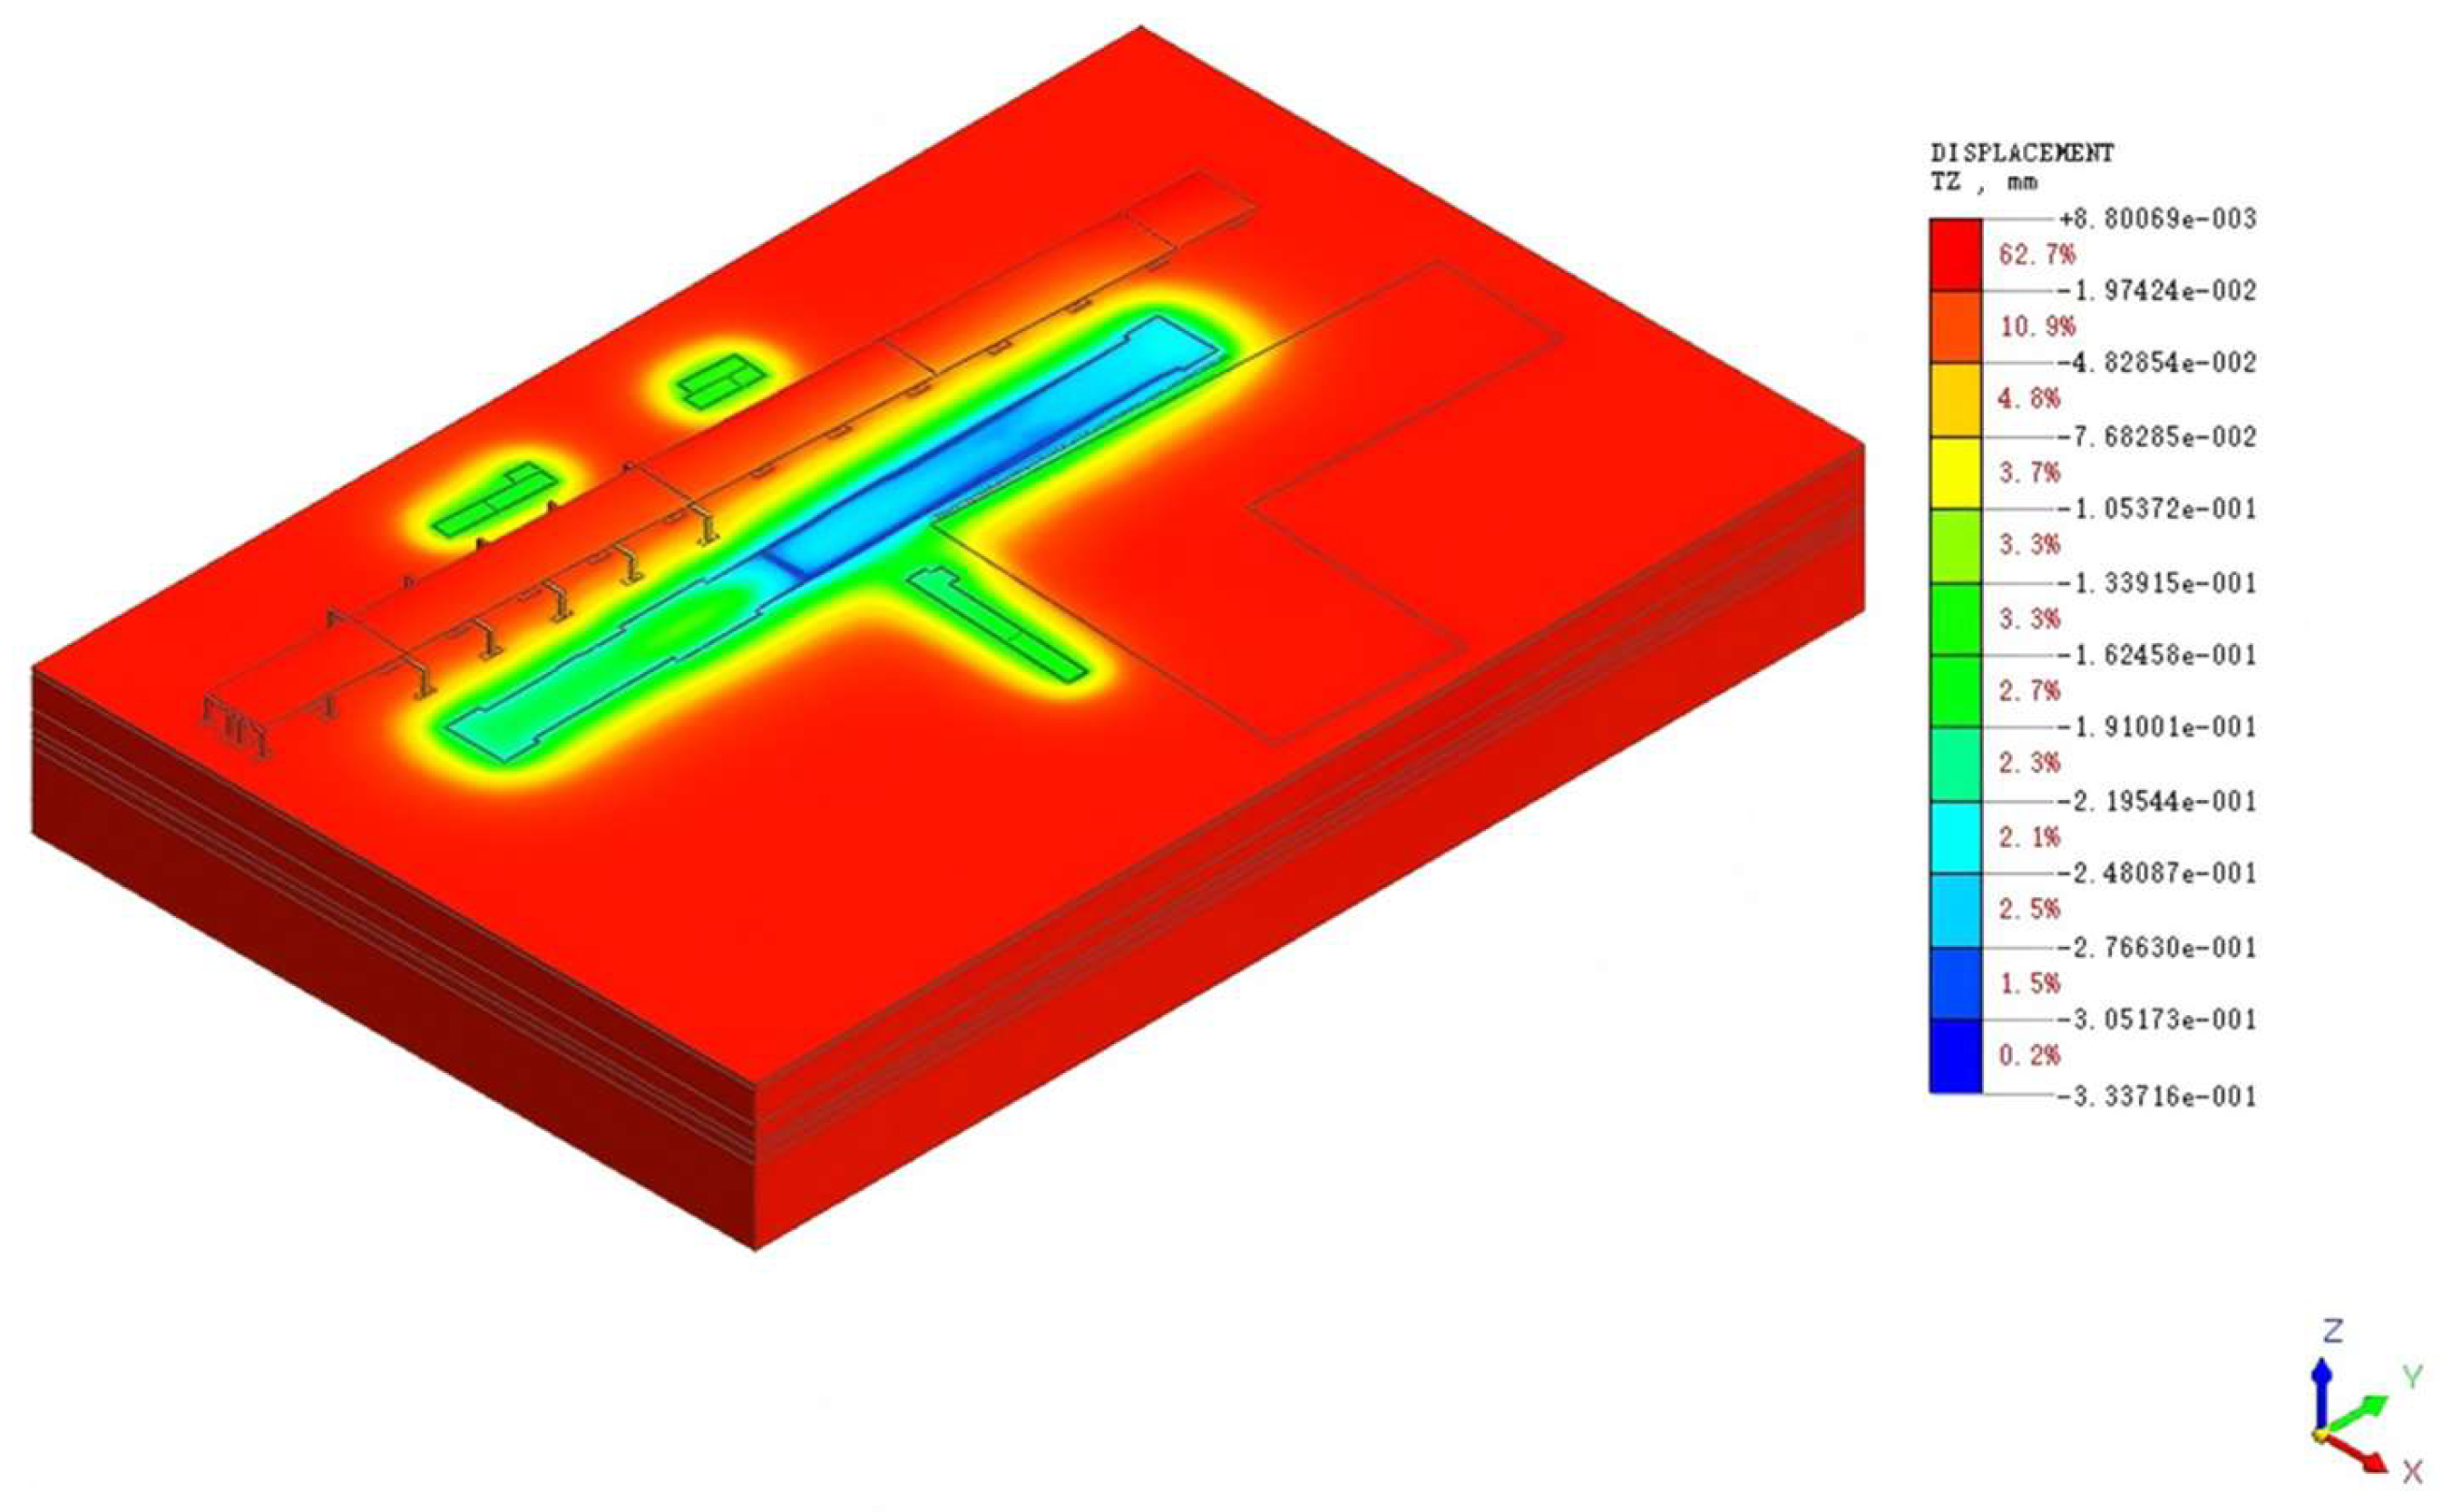
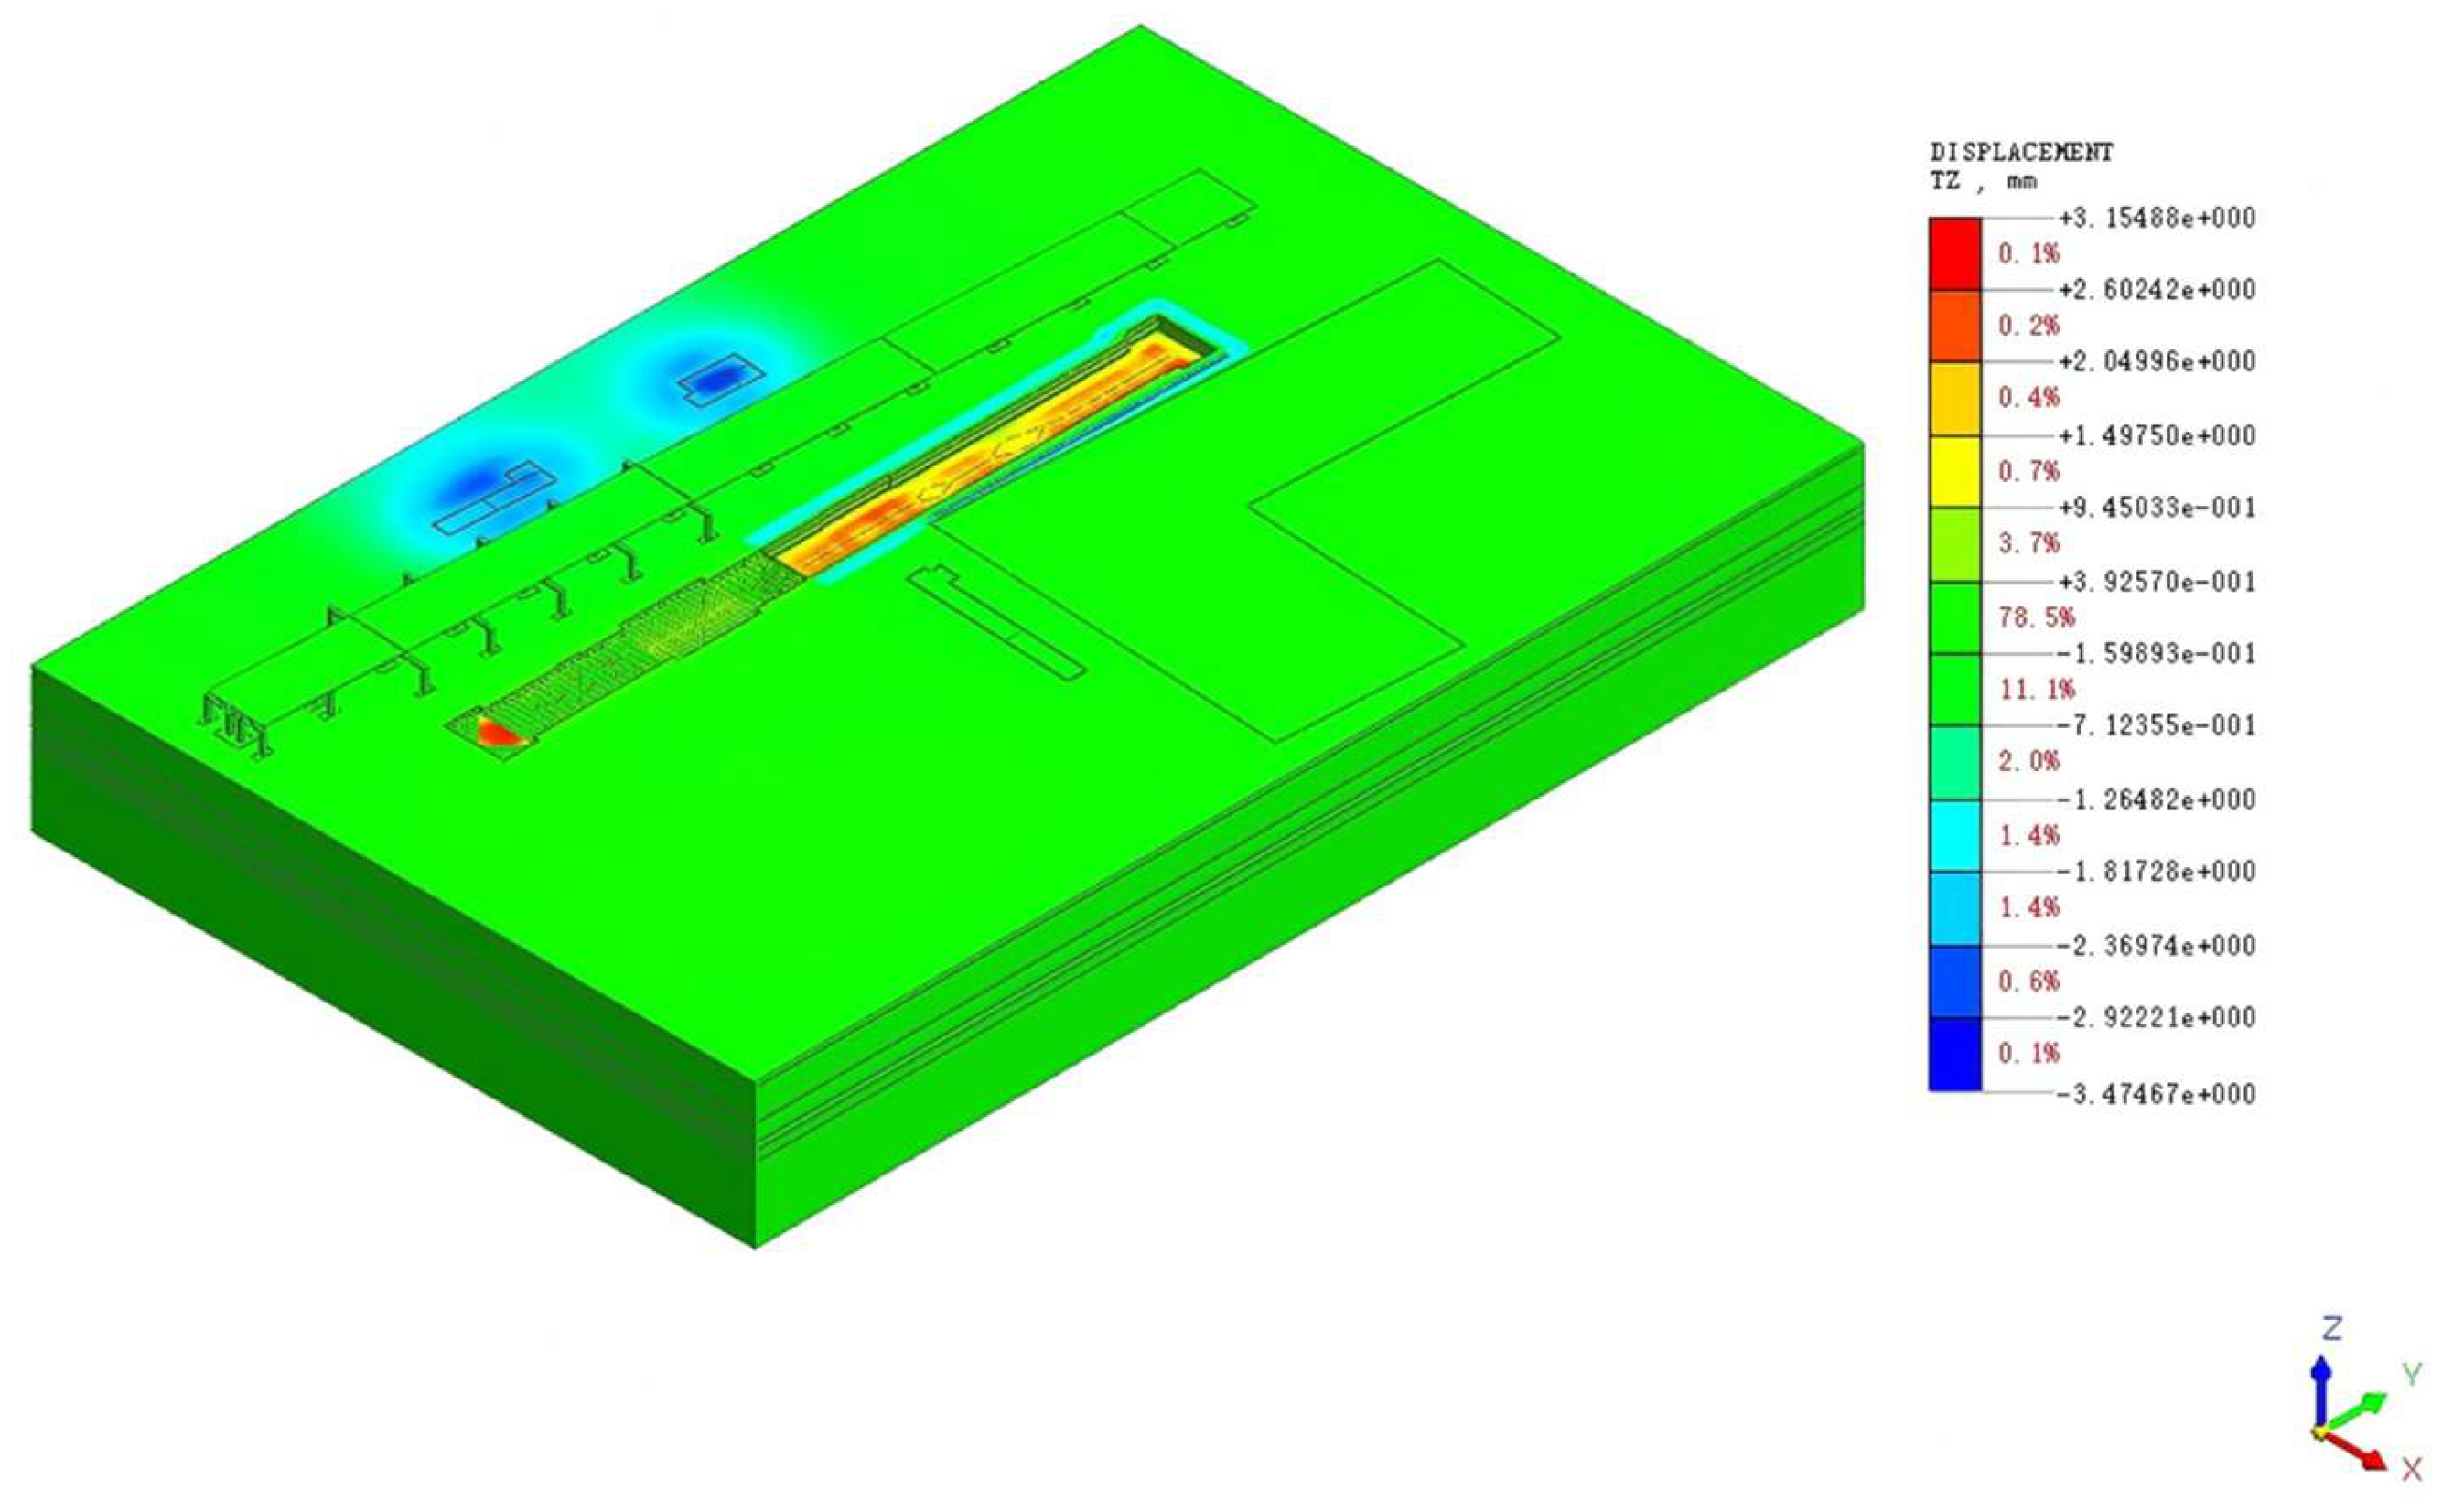
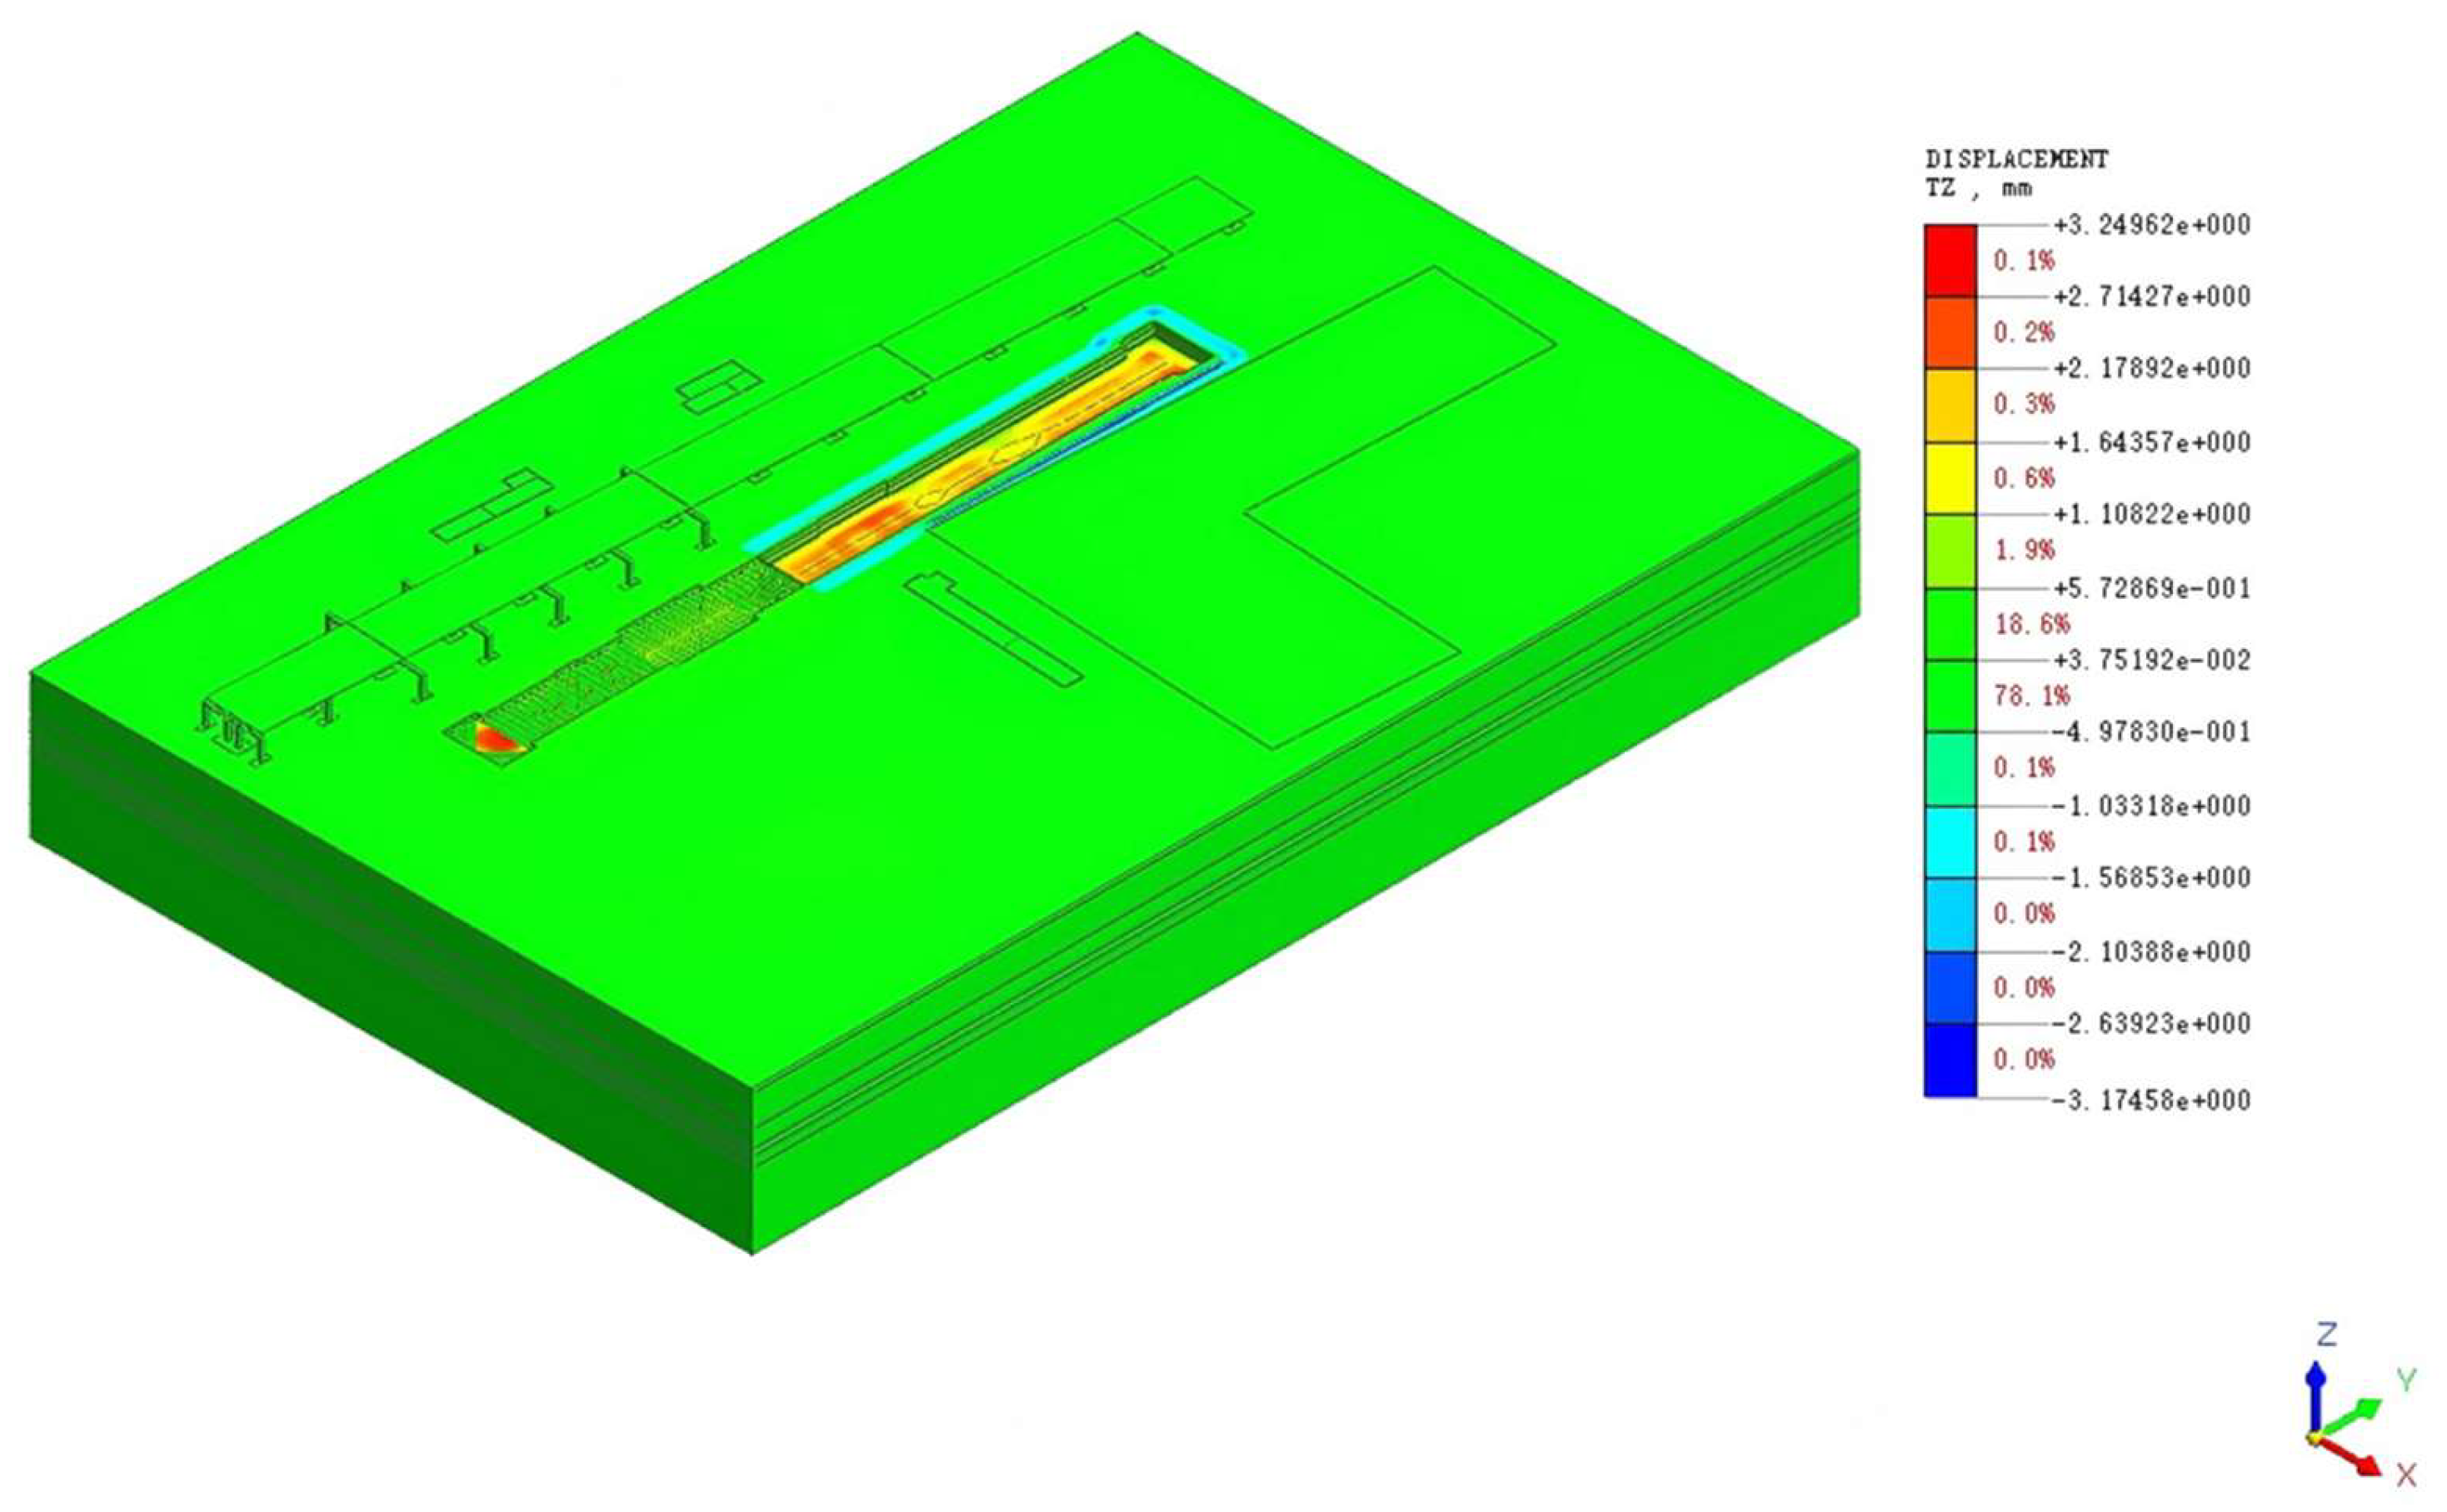
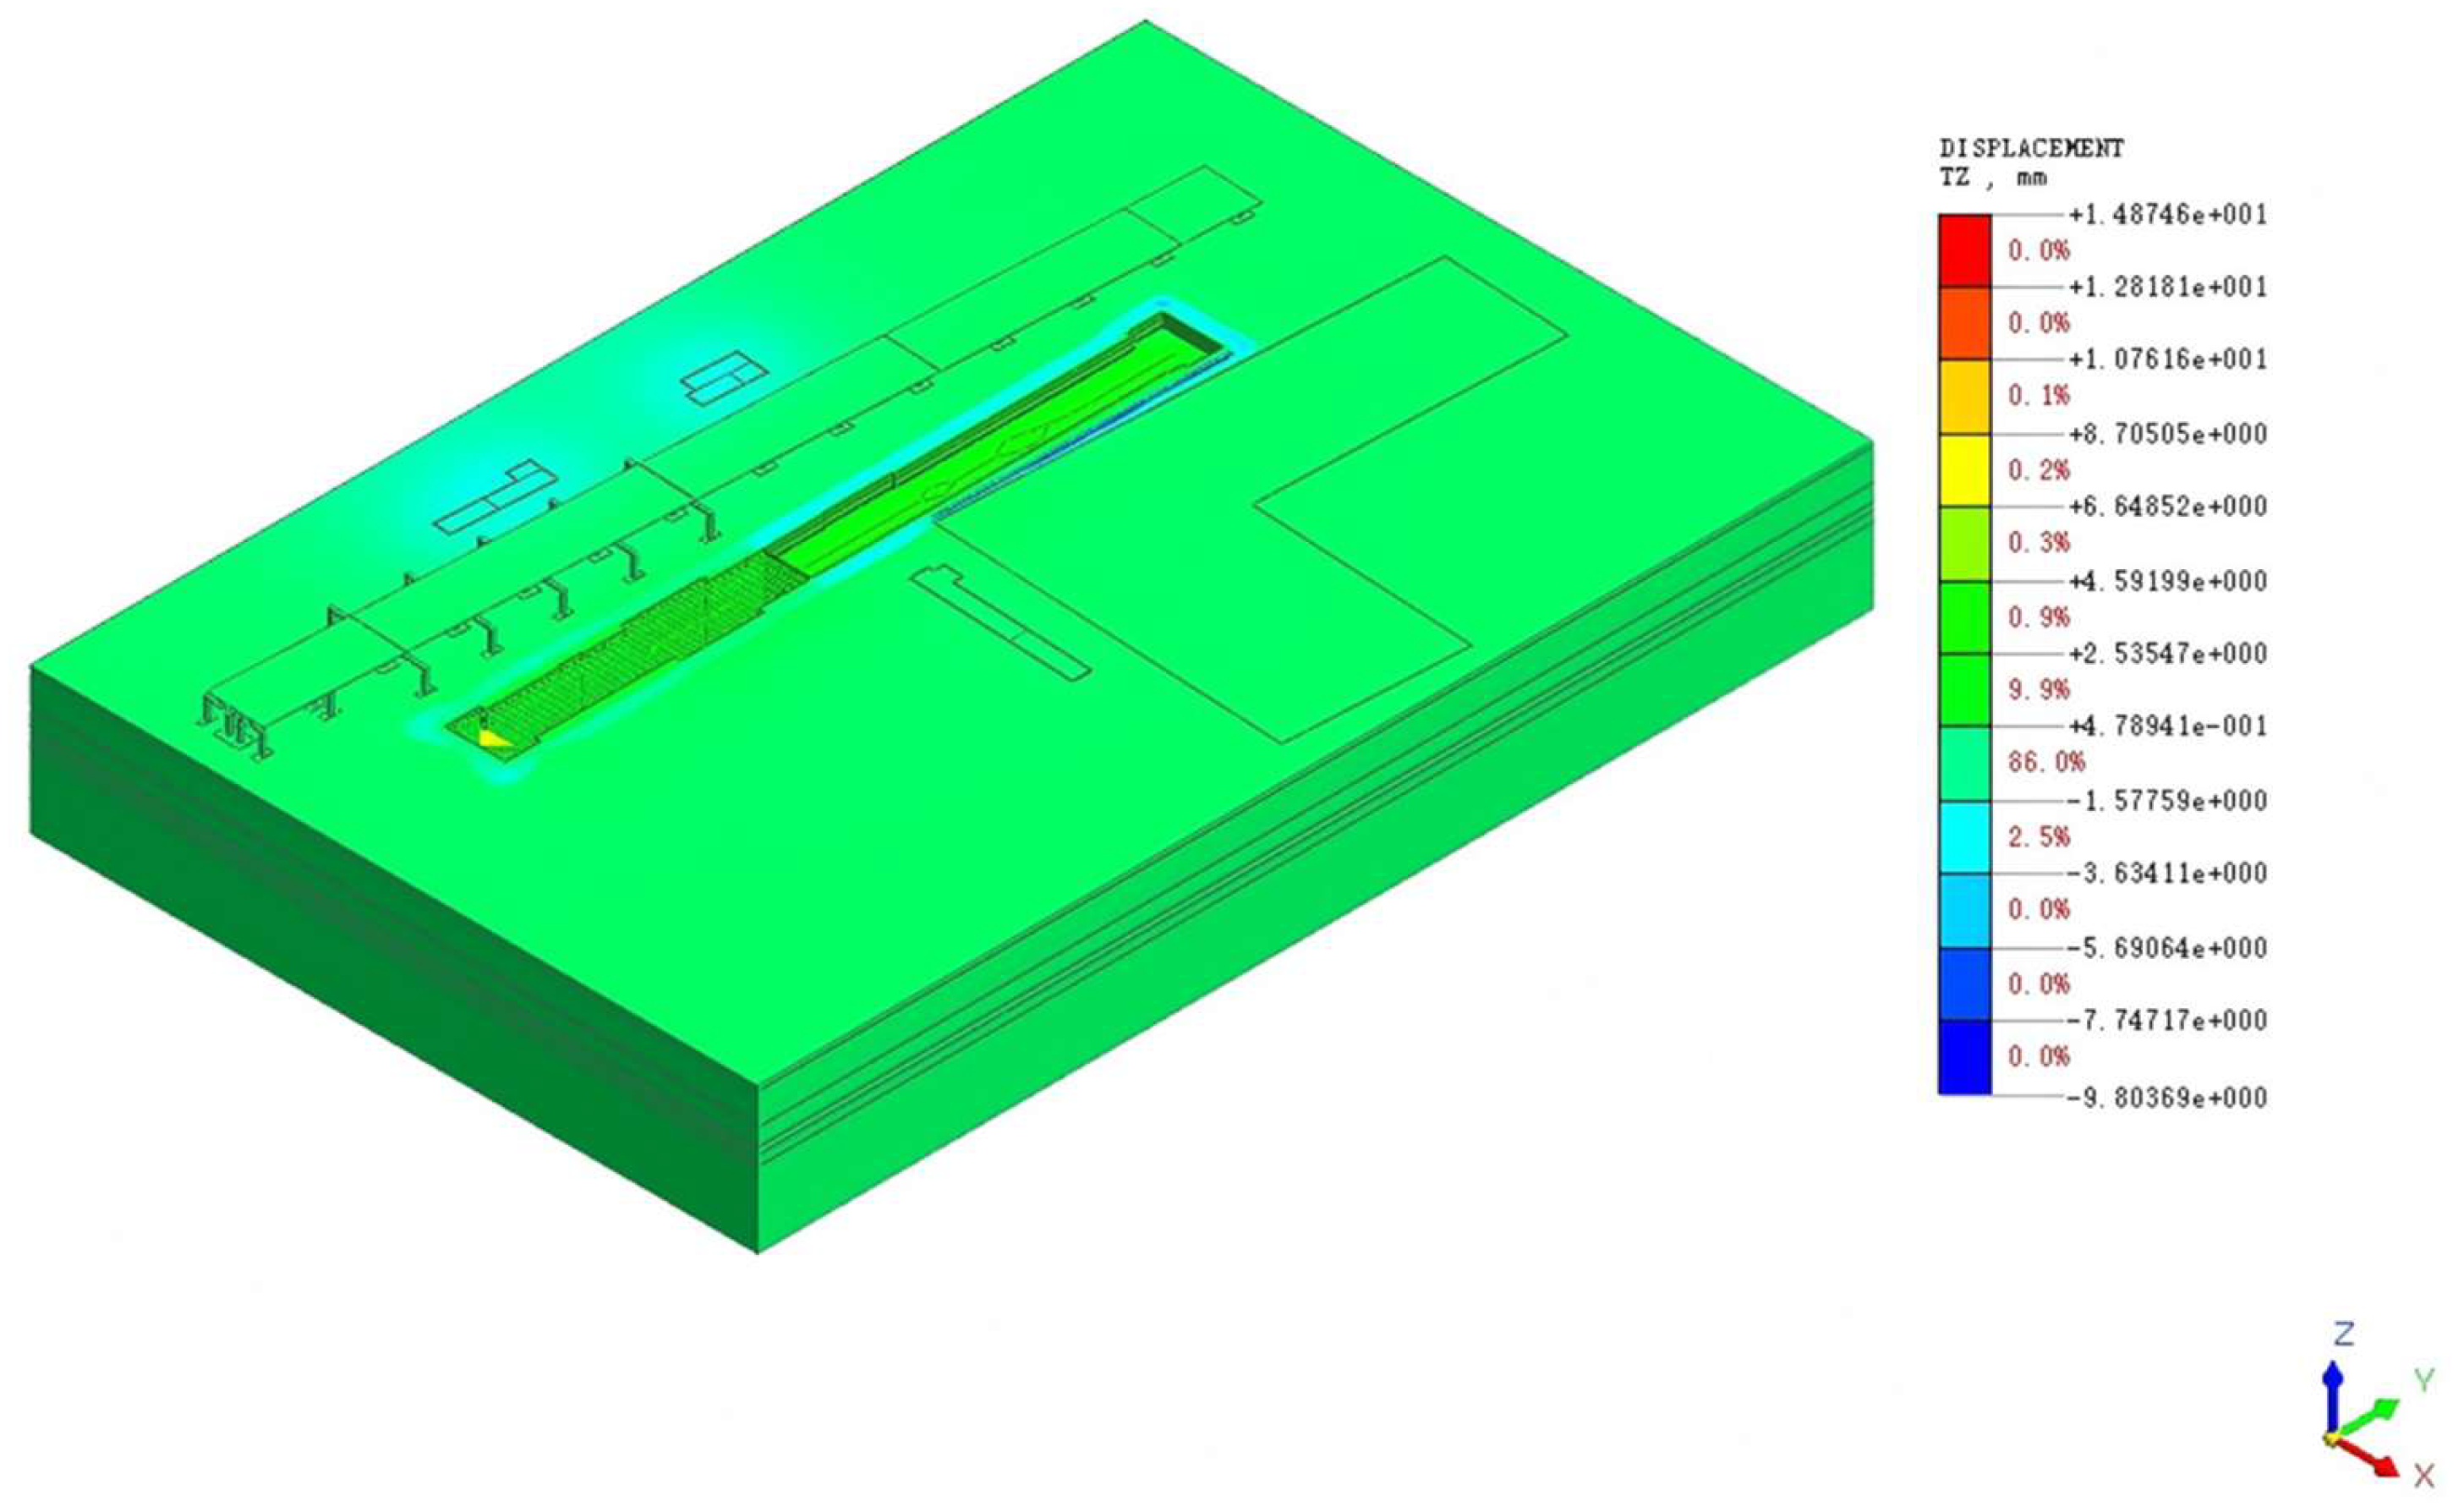
As shown in Figure 27, the surface settlement curves generally exhibit a “V”-shaped distribution, with a morphology similar to the settlement prediction curves for open-excavation foundation pits specified in the Technical Code for Excavation Engineering in Shanghai [22]. The overall settlement trend increases gradually with the increase in distance from the foundation pit edge up to a maximum value at 0.45 He, after which it gradually decreases. Areas within twice the excavation depth from the foundation pit edge are significantly affected, defined as the primary influence zone. According to the curve trend, beyond three times the excavation depth, the curves gradually converge, and the surface settlement approaches zero. Therefore, the region within 2–3 times the excavation depth is classified as the secondary influence zone for surface settlement. Surface Settlement Contour Maps under each construction process are extracted, as shown in Figure 28, Figure 29, Figure 30, Figure 31 and Figure 32, for stratum deformation analysis.
As can be seen from the cloud map, after the completion of dewatering construction outside the foundation pit, the maximum surface settlement around the foundation pit reaches −3.475 mm. With the excavation and support of the main station foundation pit and subsequent structure construction, surface settlement around the foundation pit gradually increases, with the maximum settlement of −9.804 mm occurring at the CS7 construction step. The overall settlement distribution exhibits a pattern where settlement values are largest near the retaining structure and gradually decrease with distance. All maximum settlement values occur within the primary influence zone, and the settlement on the side adjacent to buildings is higher than that on the side without buildings.

10. Study on the Patterns of Horizontal Displacement in the Surrounding Soil

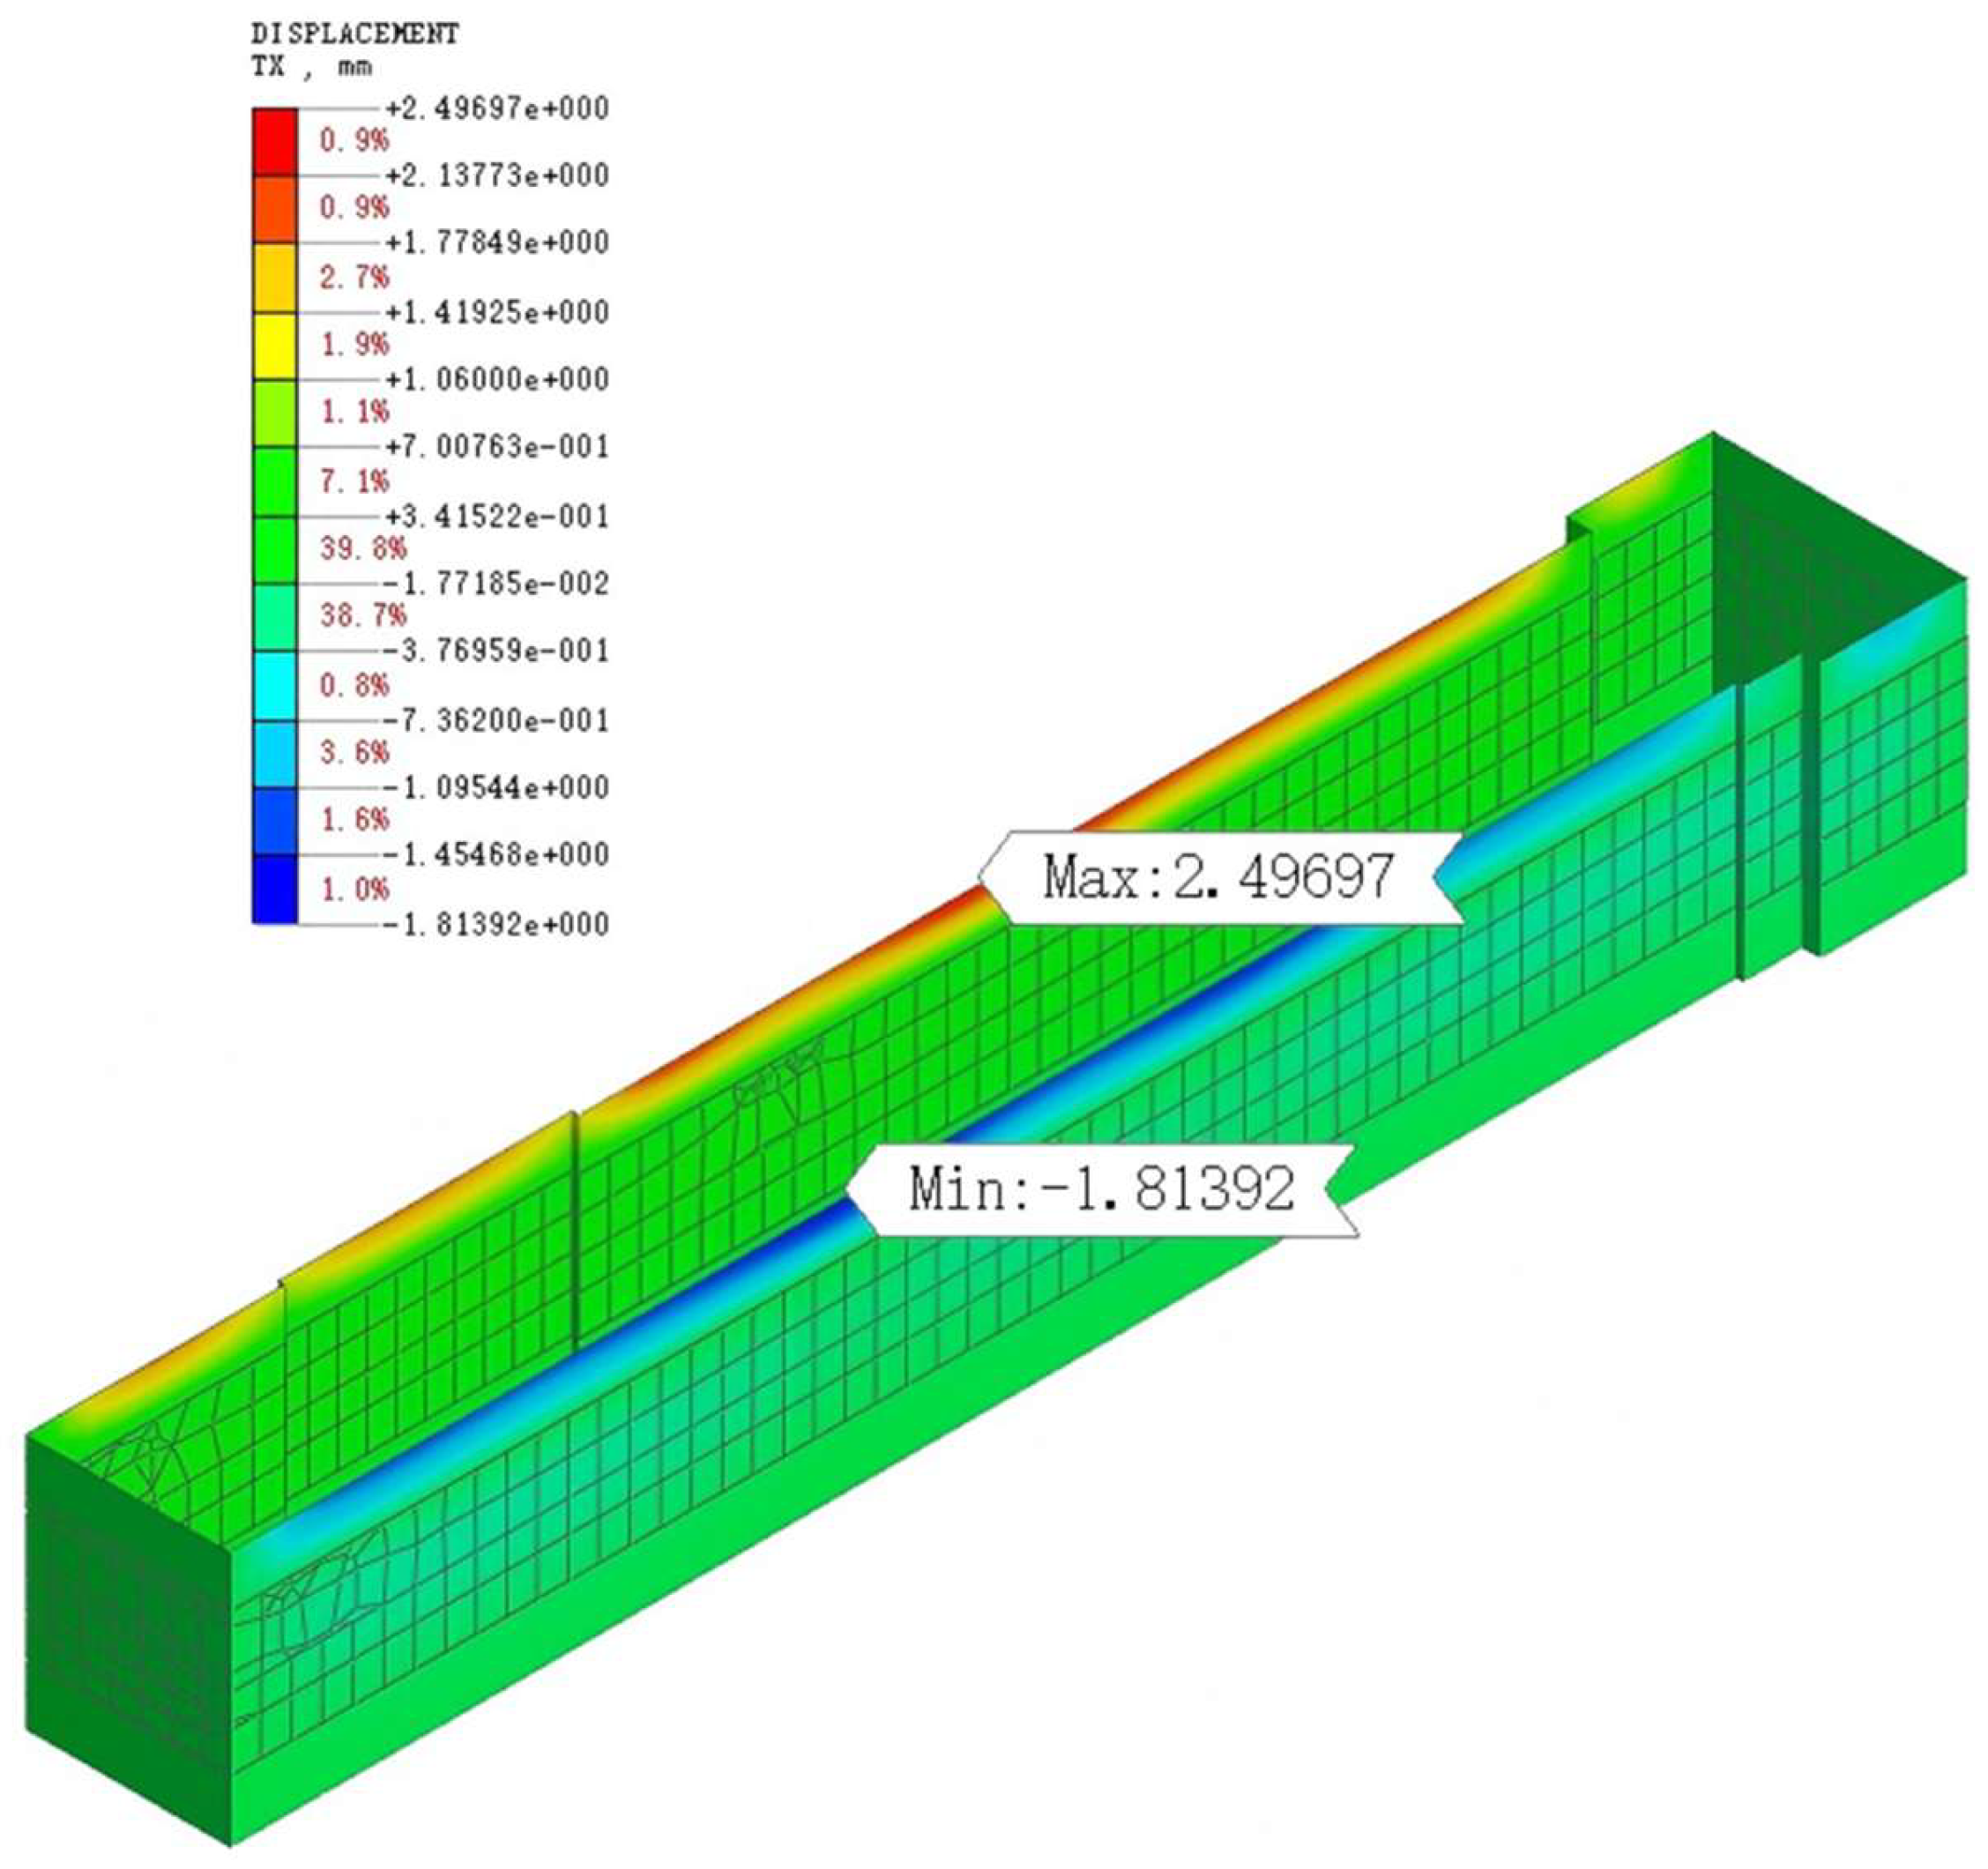
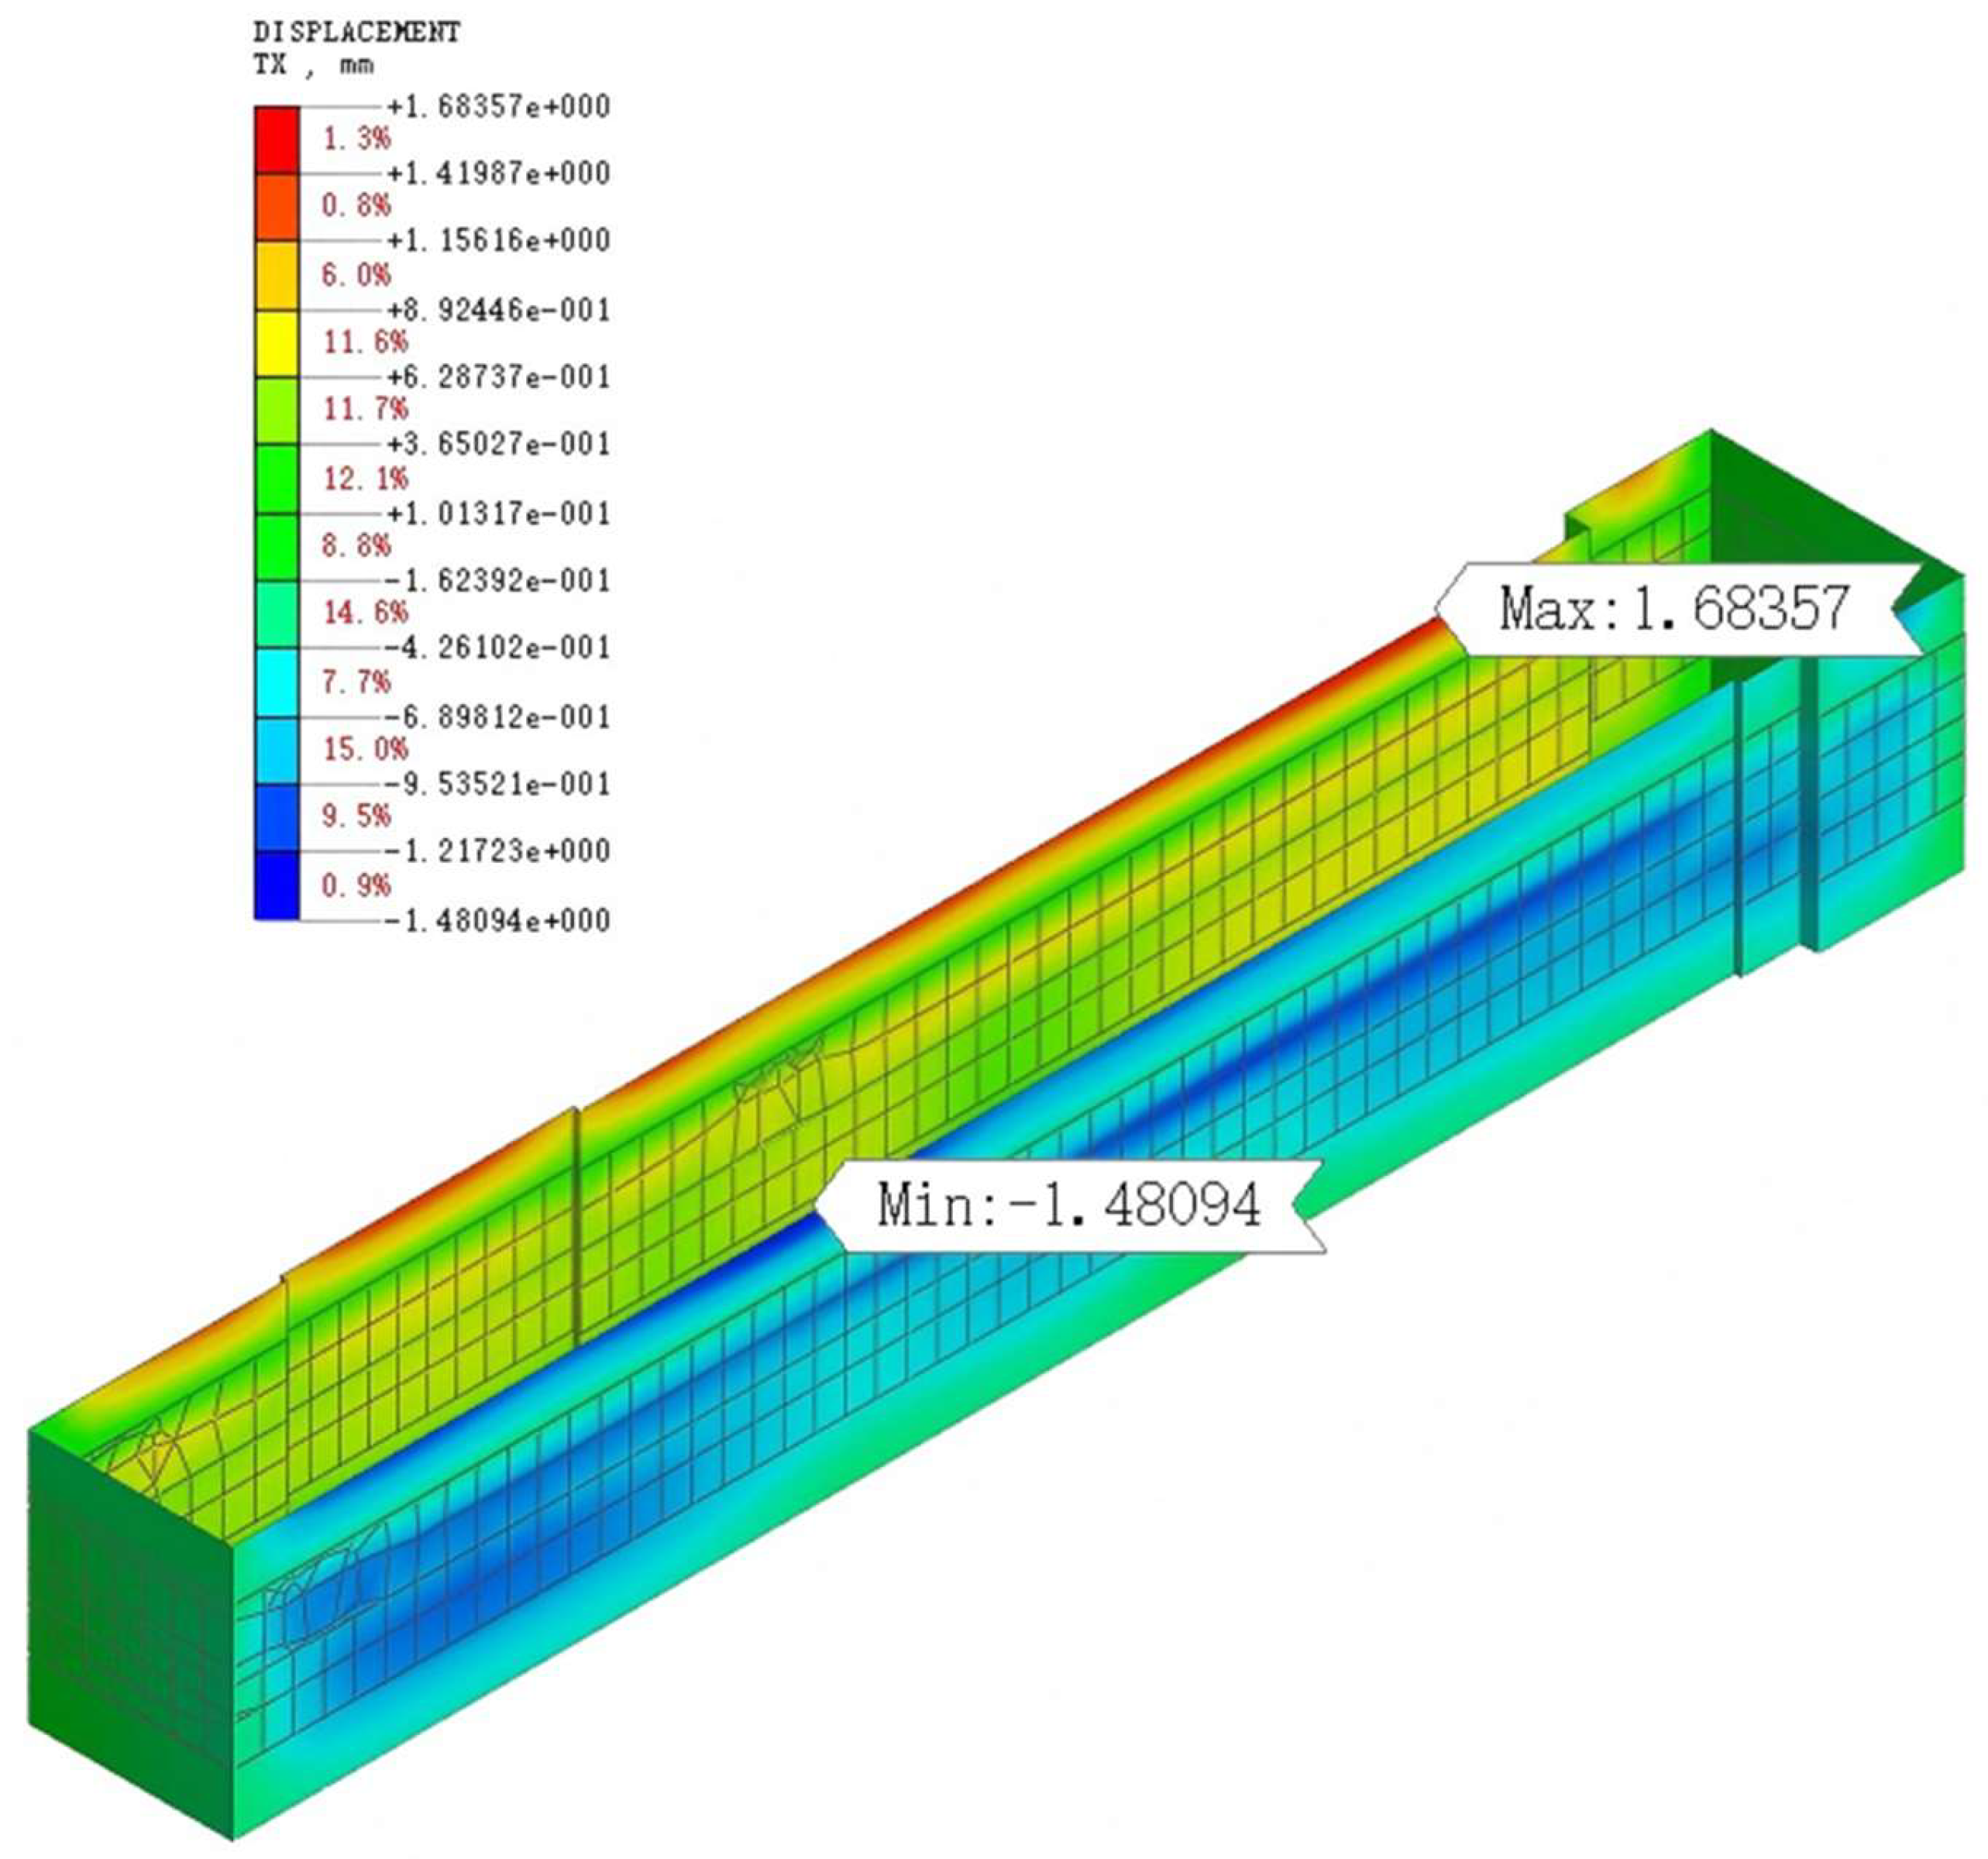
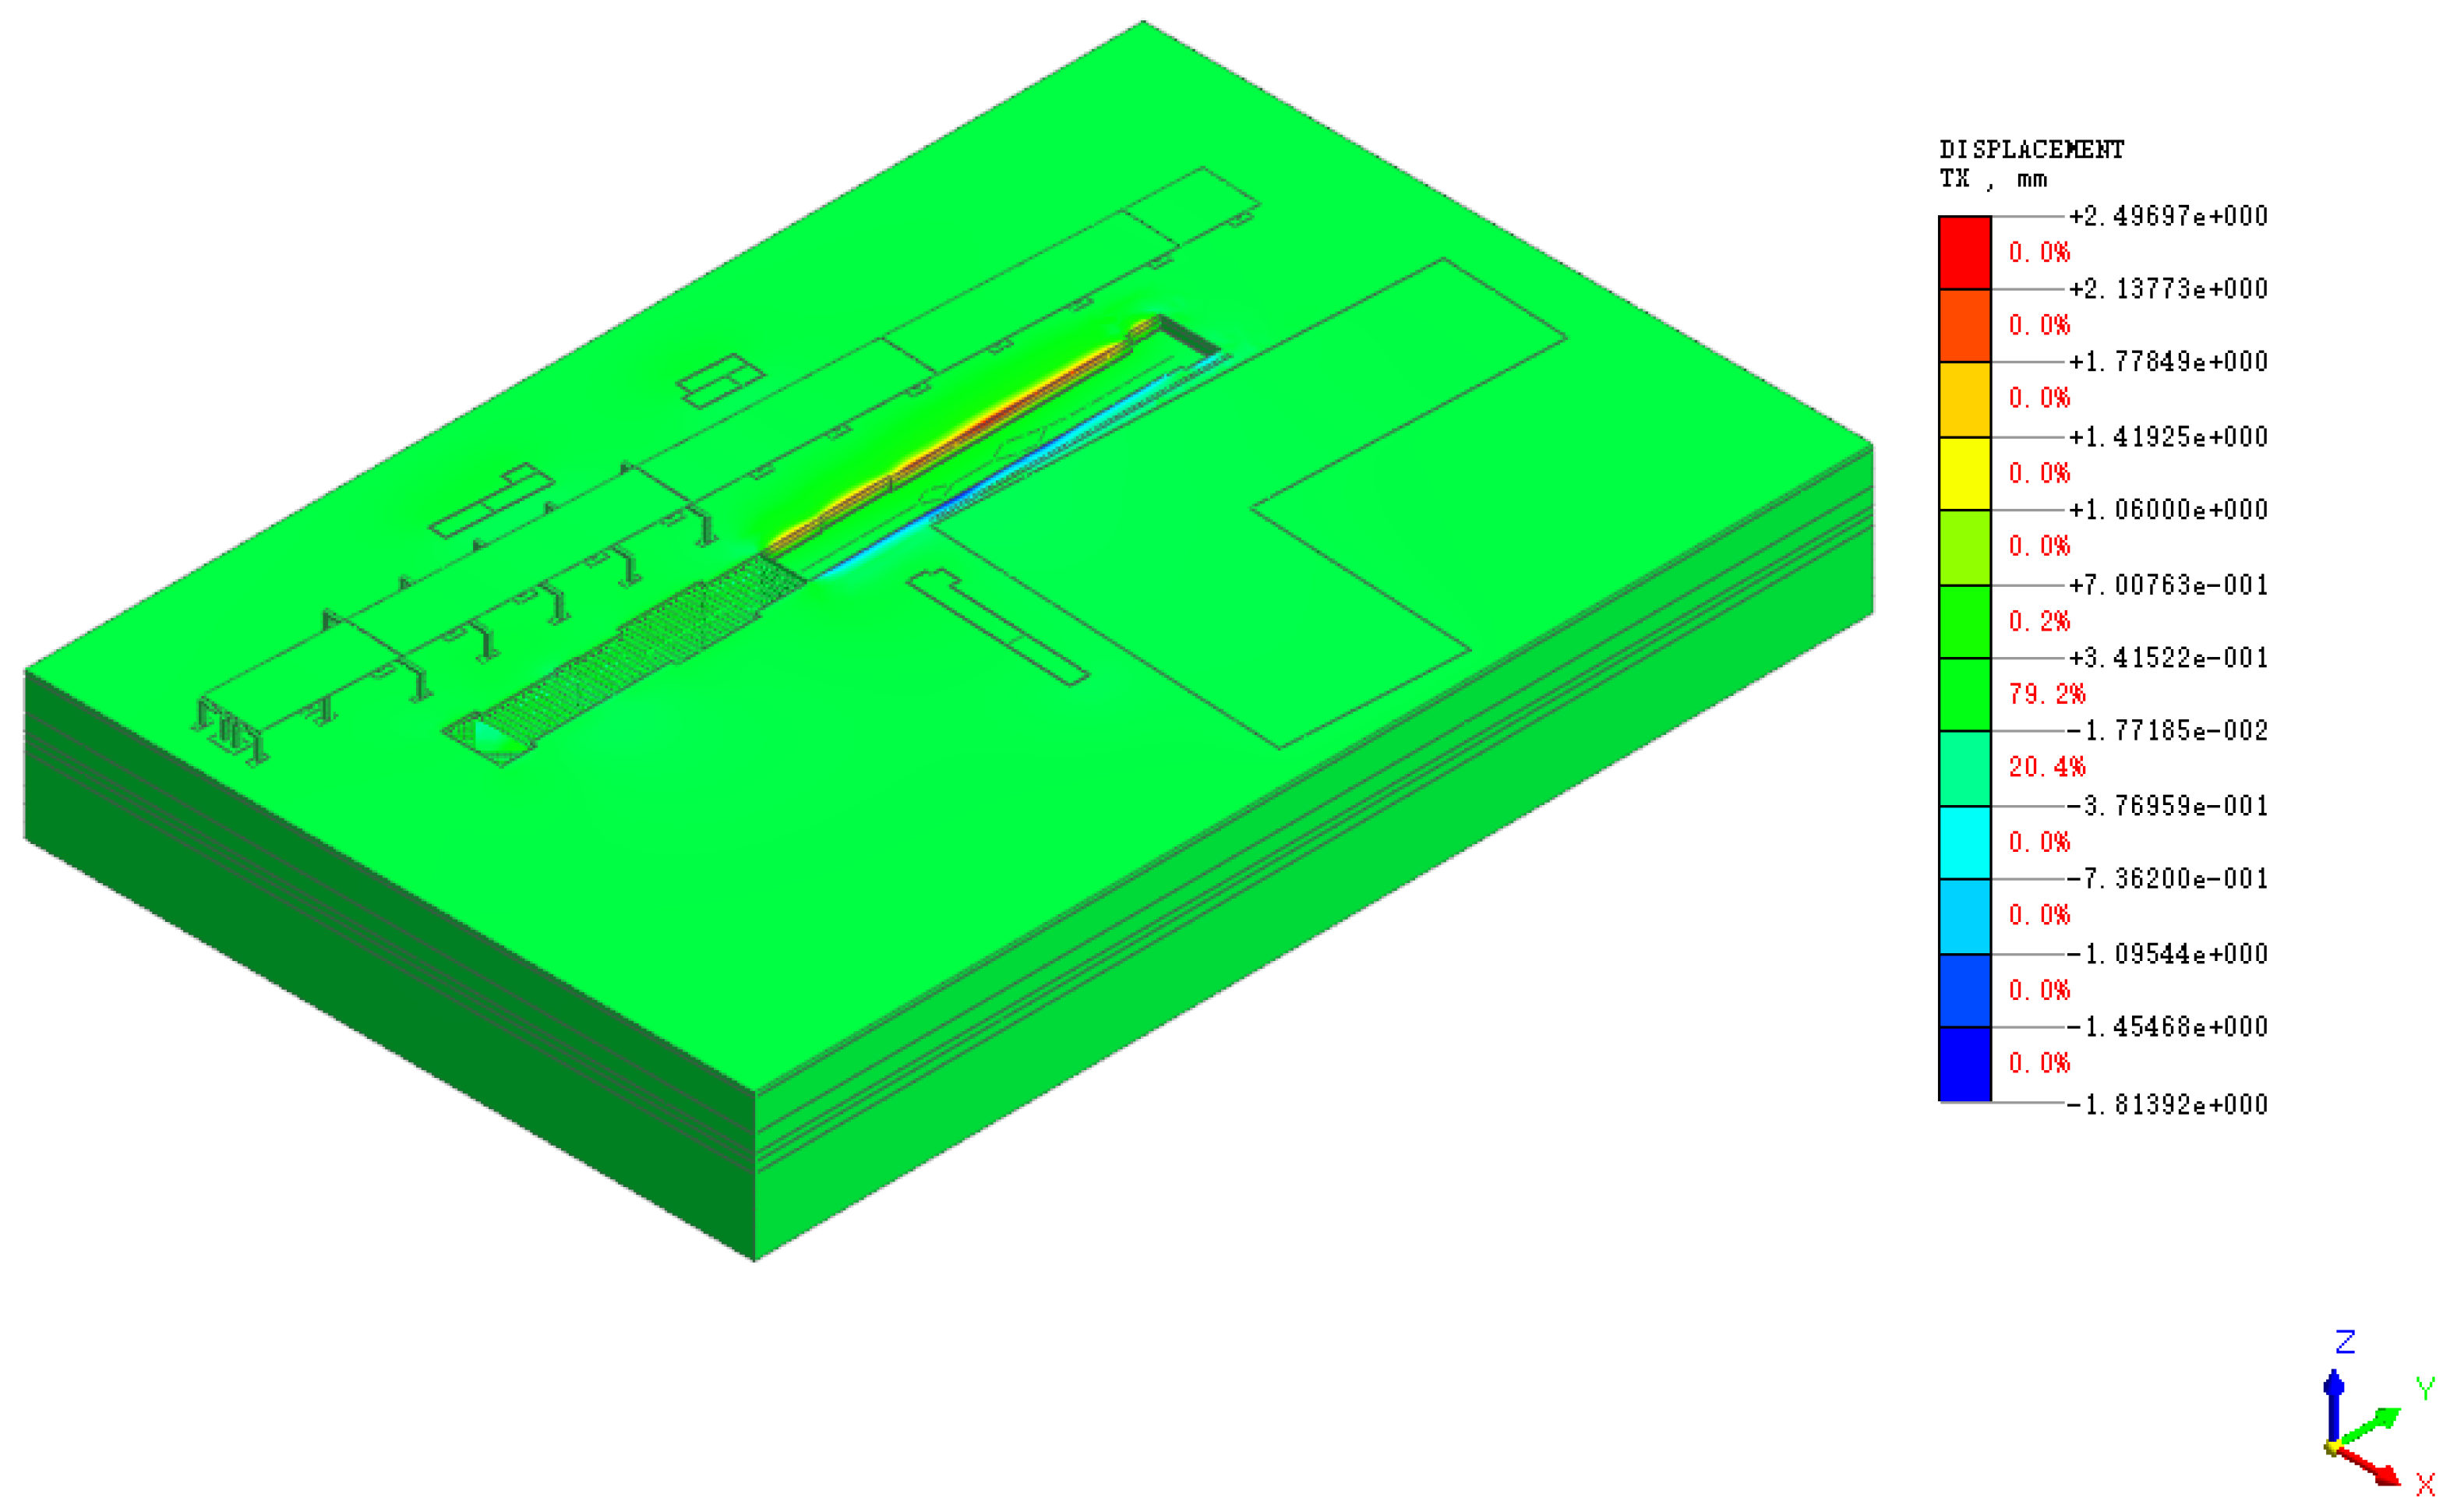
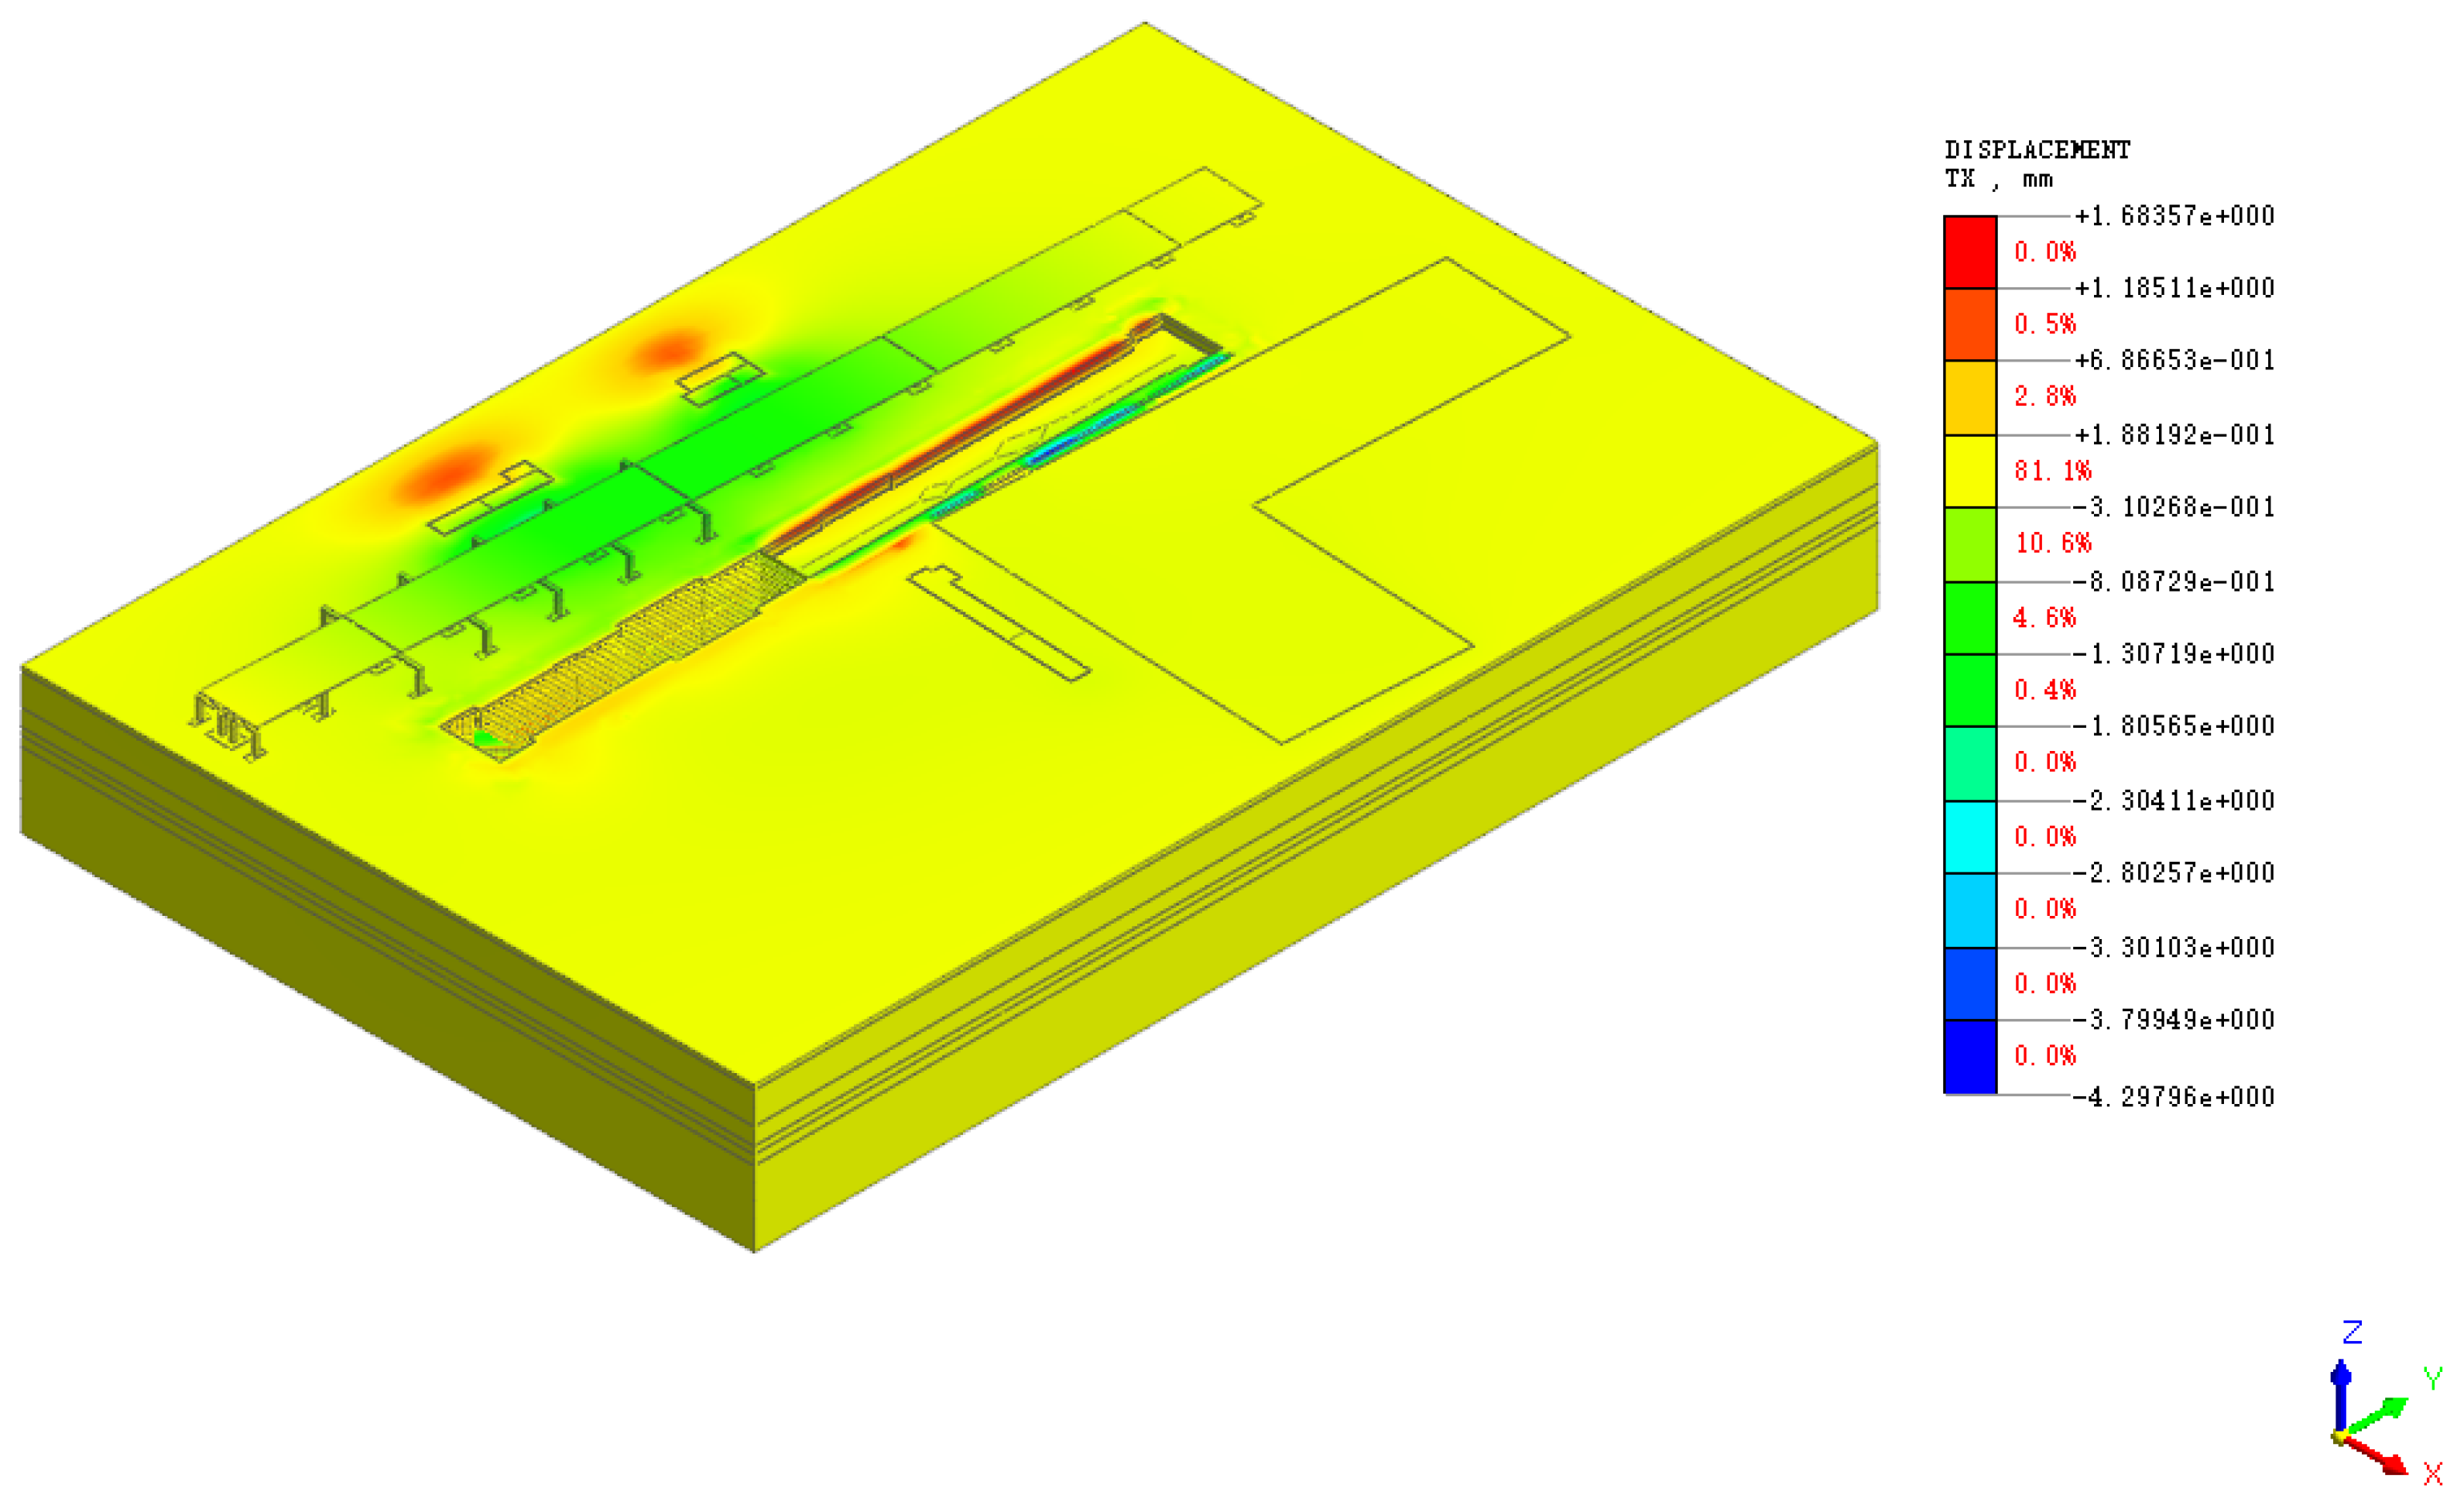
Horizontal deformation contour maps in the X-direction of the ground surface under each construction process are extracted, as shown in Figure 33, Figure 34, Figure 35, Figure 36 and Figure 37, for stratum horizontal deformation analysis in the X-direction.
As shown in Figure 33, the X-direction horizontal deformation of the ground surface was relatively small during the construction of the retaining structure. This is because the construction of the retaining structure caused relatively minor disturbance to the surrounding soil, and its rigidity directly restricted the lateral displacement of the soil, reducing the soil layer displacement.
As shown in Figure 34, during dewatering, the X-direction horizontal deformation of the ground surface increased rapidly, from −0.131 mm to −2.024 mm. On one hand, this was due to the increase in horizontal displacement caused by the decline of the groundwater level and the increase in soil effective stress; on the other hand, dewatering led to the decrease in soil water content, the reduction of the cohesion of silty clay, and the decrease in shear strength.
As shown in Figure 35, with the construction of the roof slab, the horizontal supports, retaining structure, and pipe piles formed a rigid framework, and the horizontal displacement decreased slightly.
As shown in Figure 36 and Figure 37, with the continuation of excavation, the unloading of deep soil led to a significant release of lateral stress, resulting in a large increment of soil displacement. The maximum X-direction horizontal displacement of −4.345 mm occurred in the construction process CS8. It can be seen from the cloud maps that the horizontal deformations in CS7 and CS8 were both large, but the deformation rate decreased. This is because when the middle plate and basement plate were constructed, as horizontal rigid supports embedded into the retaining structure, the overall structural stiffness was significantly improved, restricting the development of subsequent deformation and slowing down the deformation rate.

11. Study on the Impact of Each Construction Process on Adjacent Buildings

During the cover-and-cut top-down process, disturbances to the surrounding soil, such as stratum deformation and stress redistribution, may cause tilting, settlement, or structural damage to adjacent building structures. As shown in the plan view of relative position relationships (Figure 2), all buildings are located within the main influence zone.
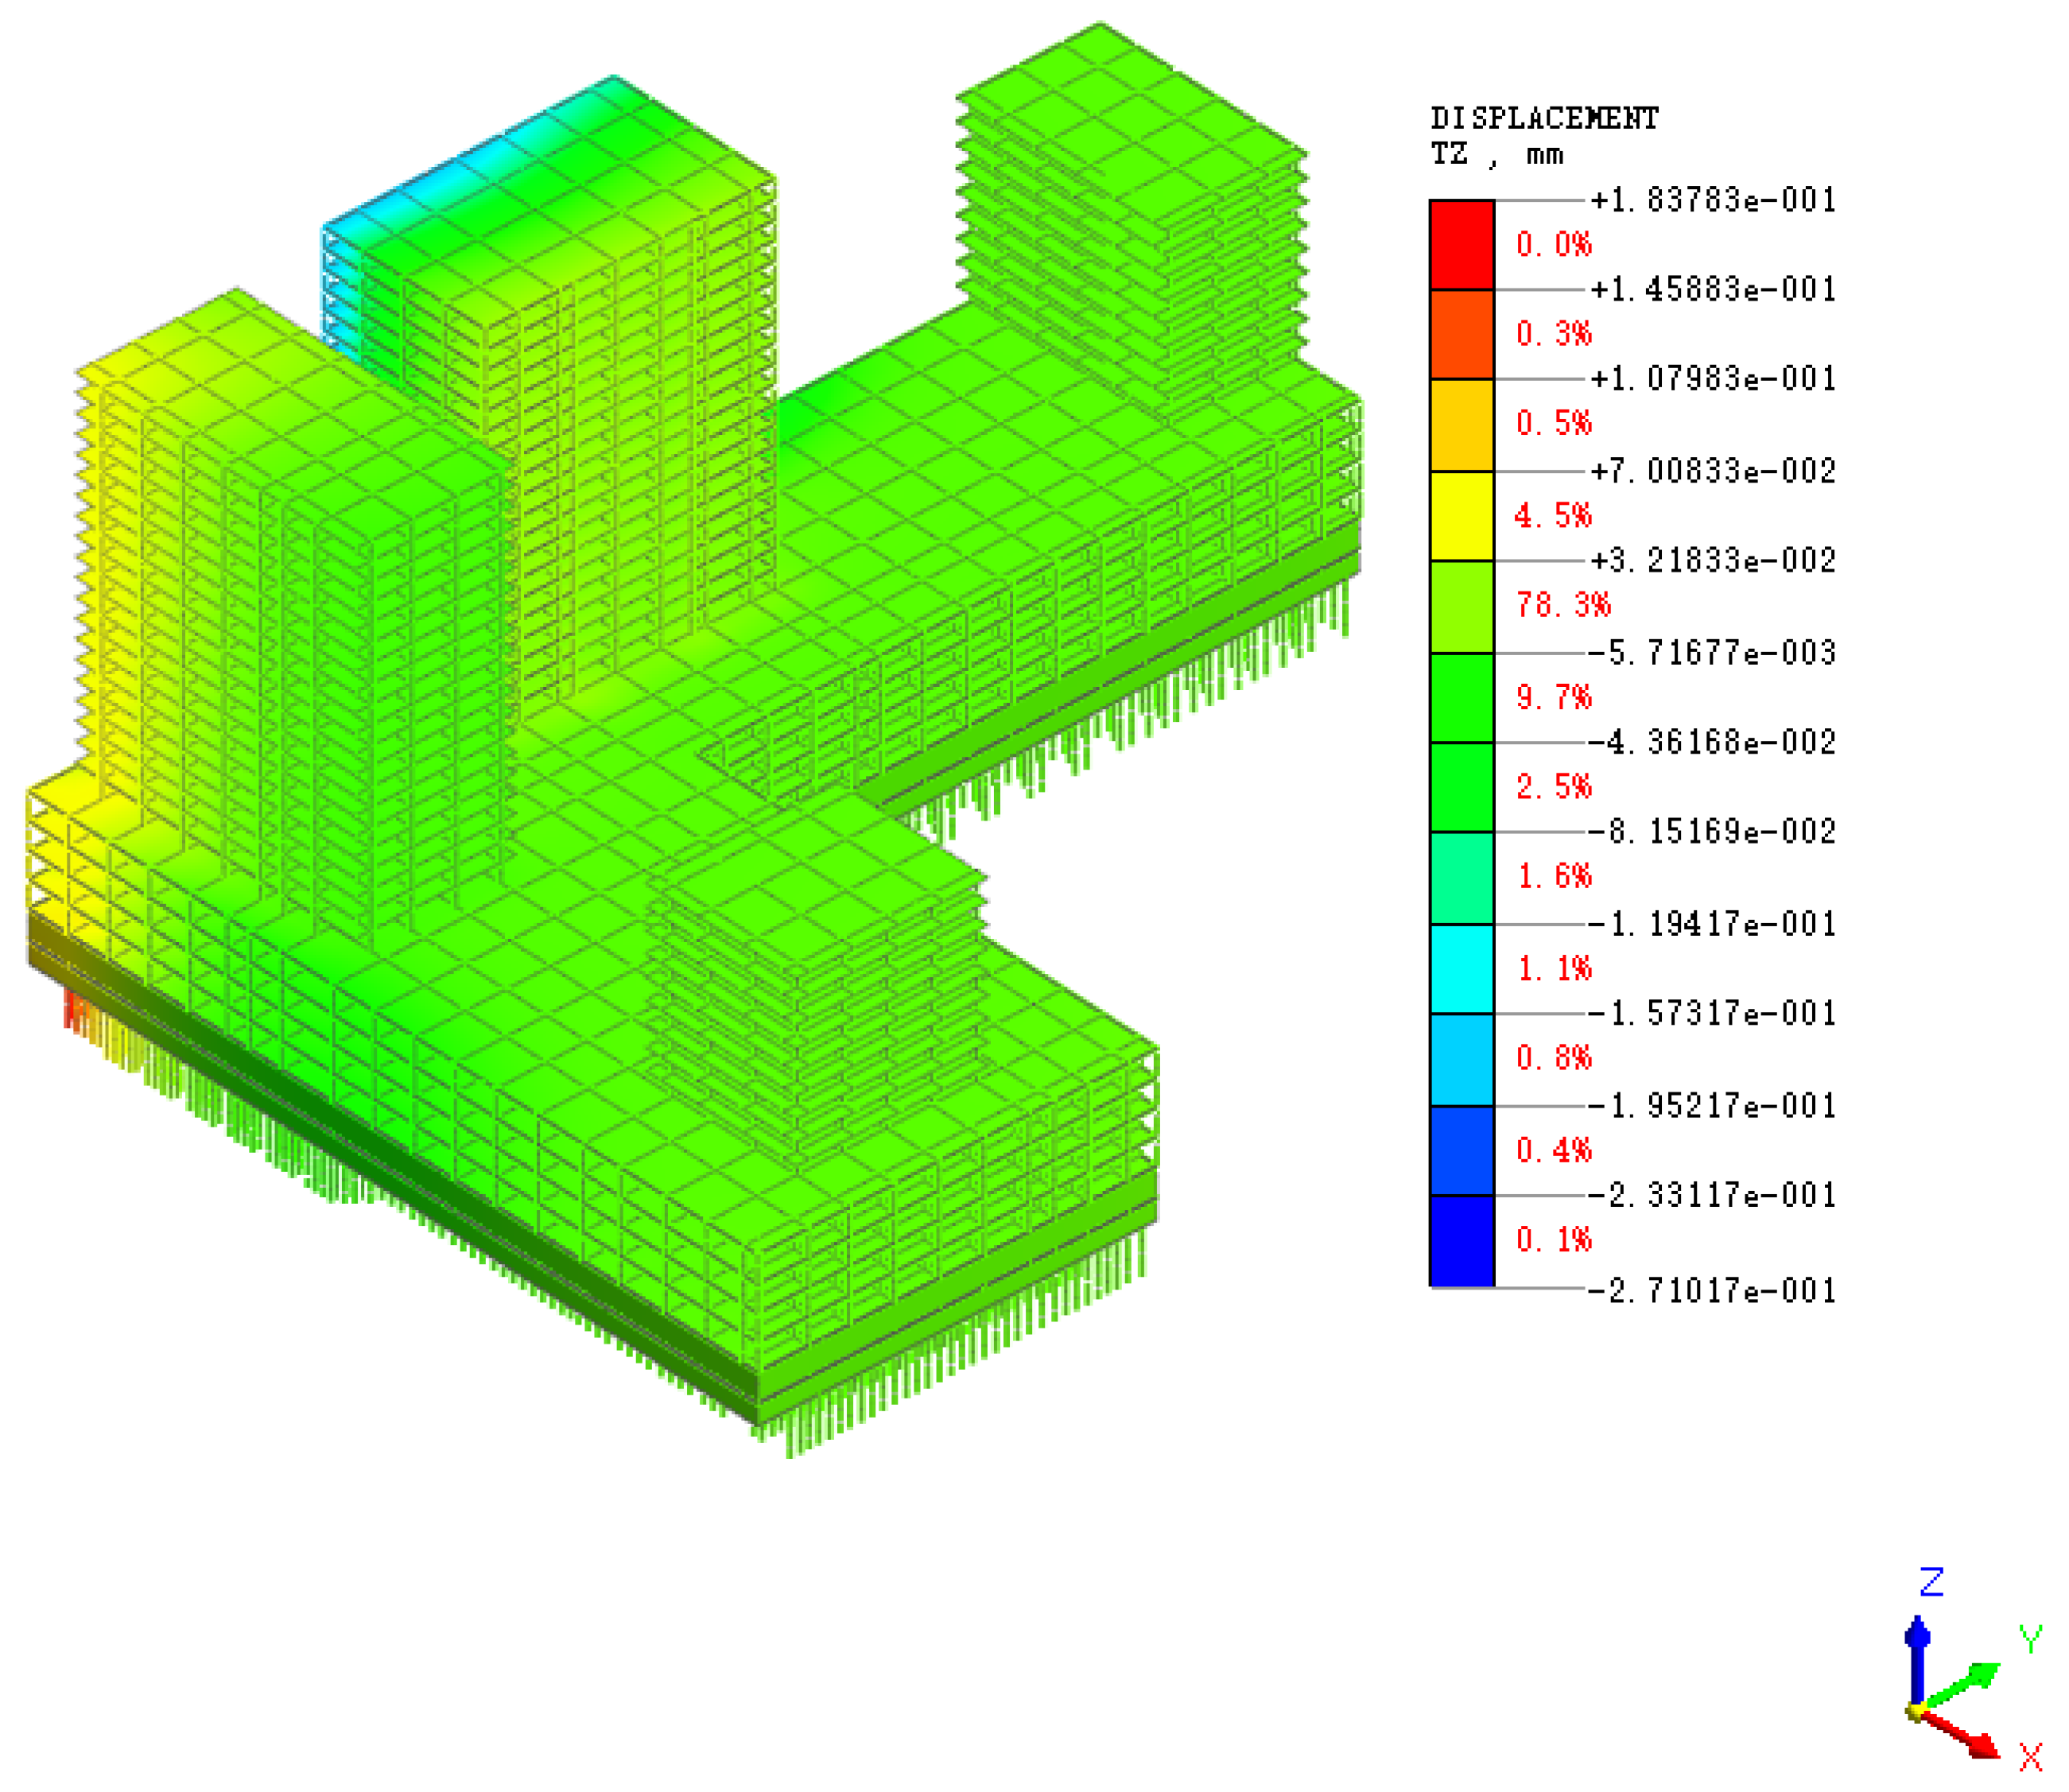
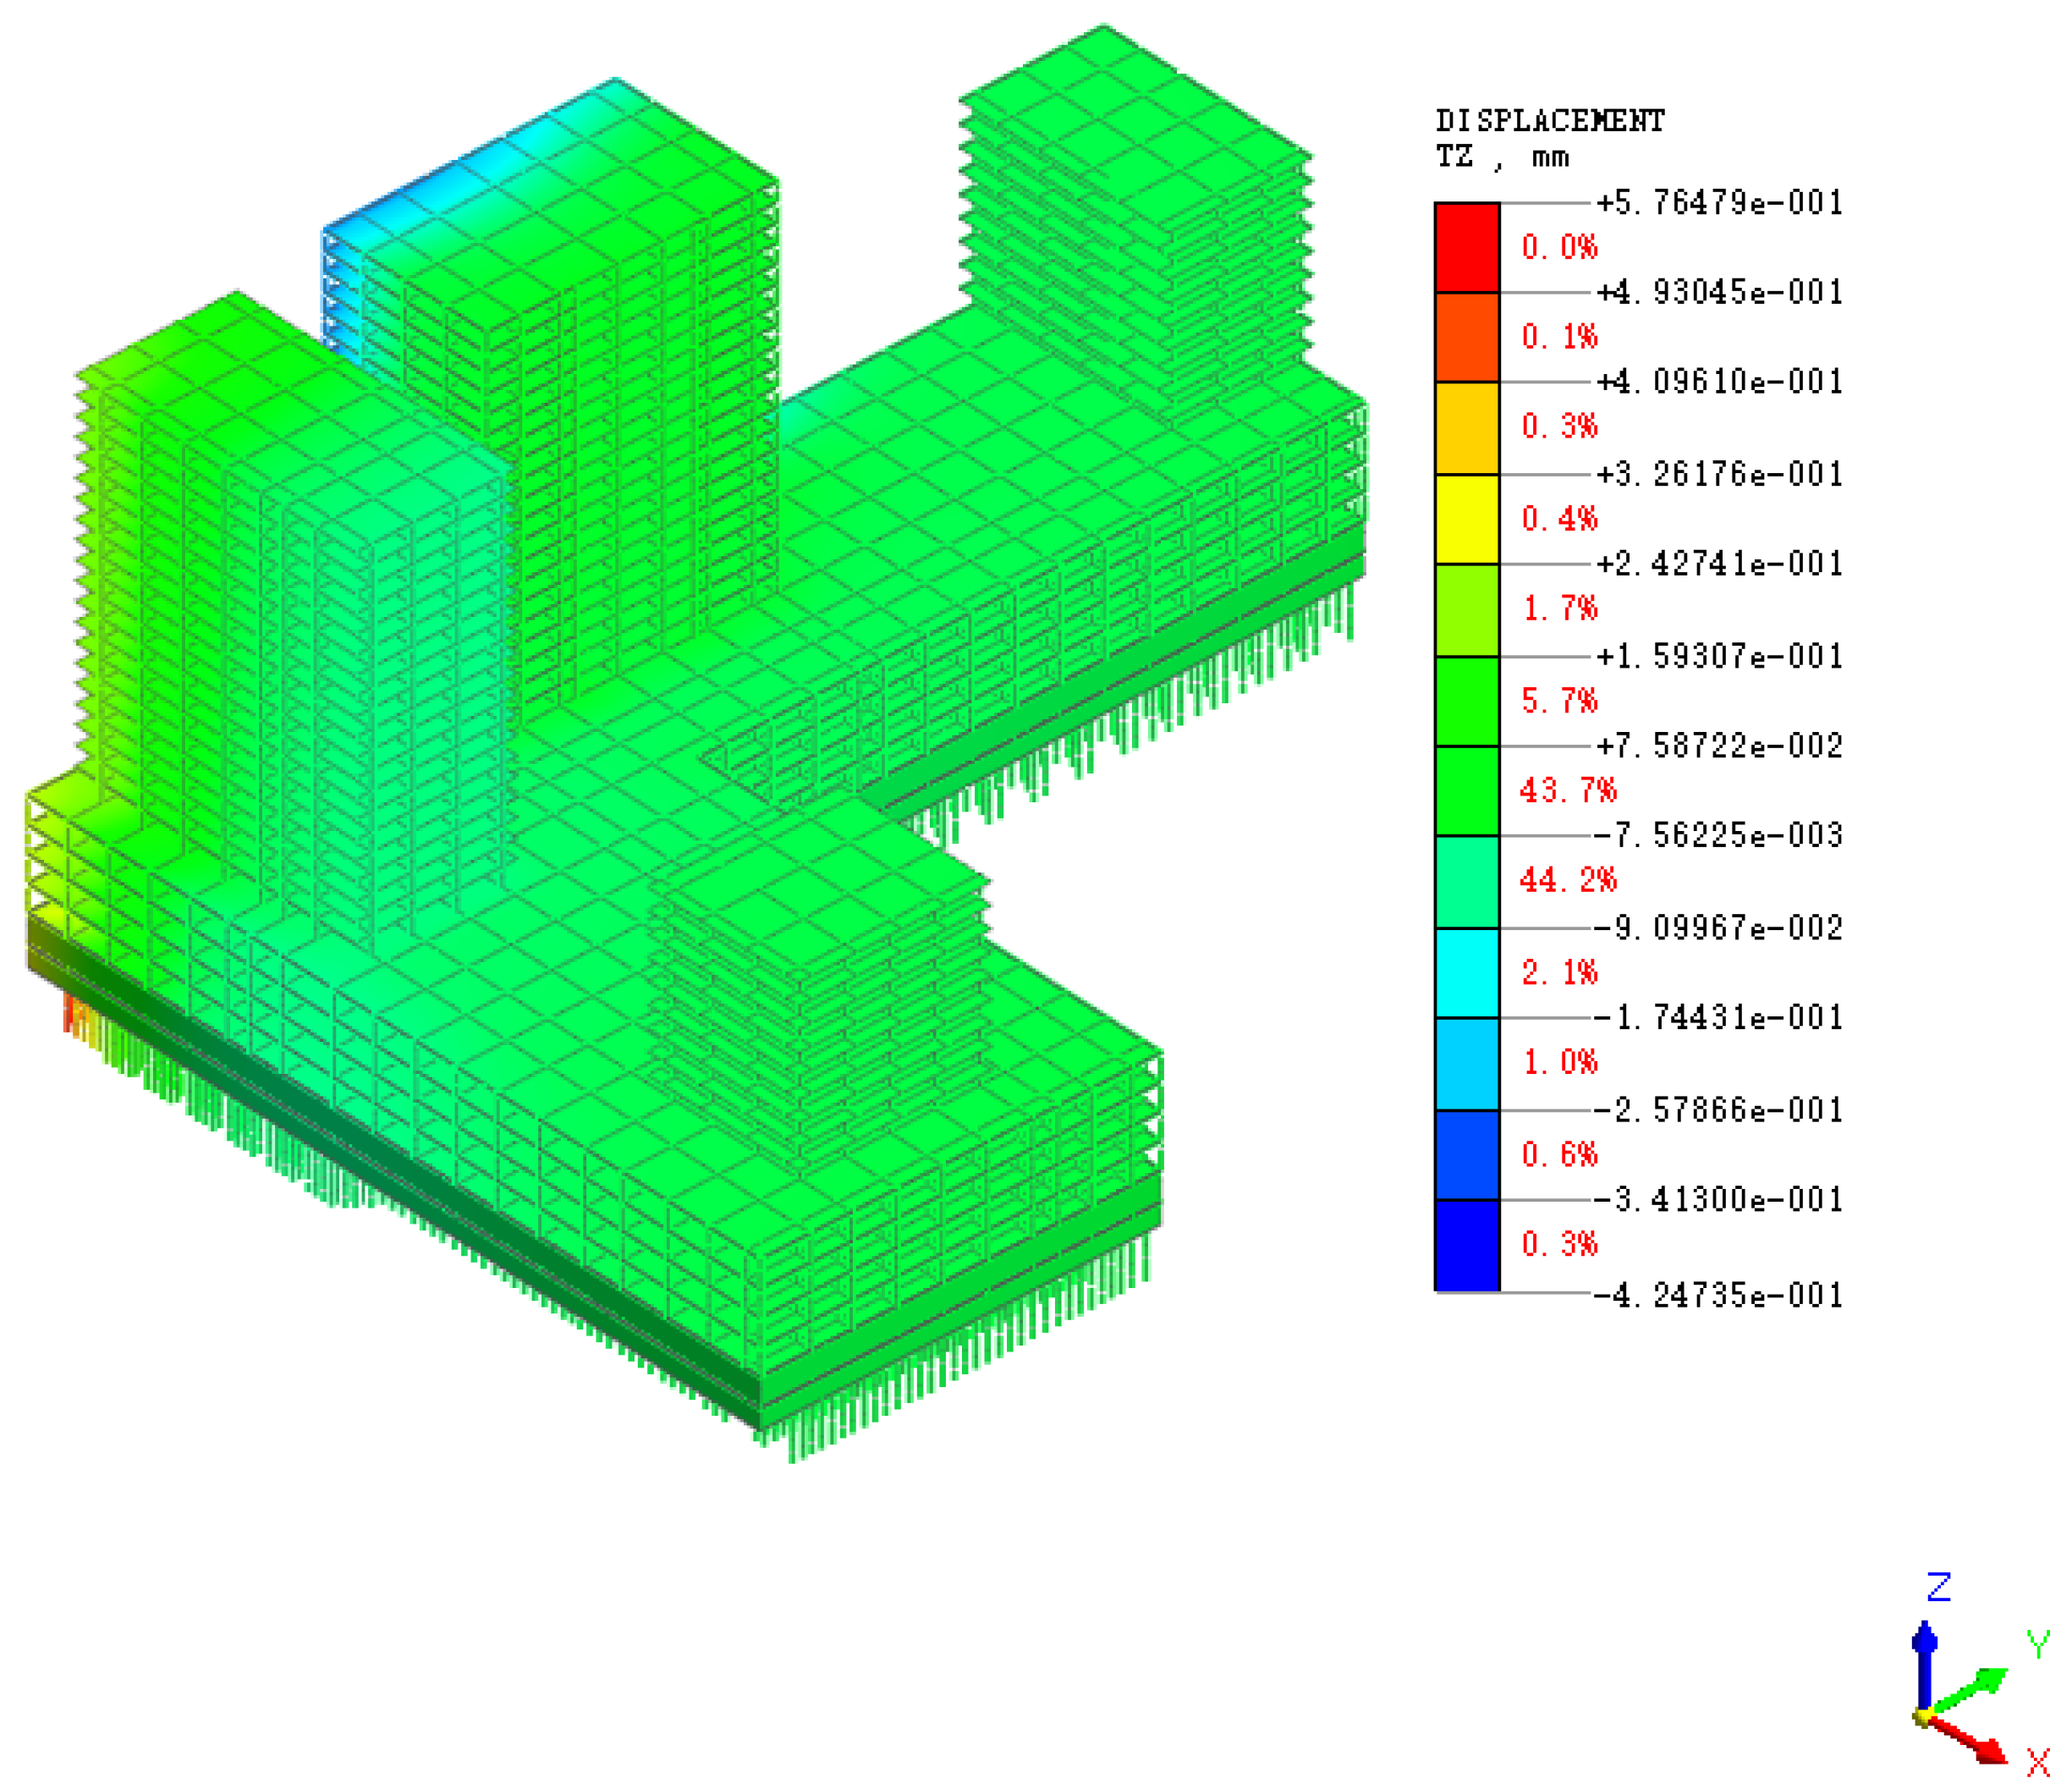
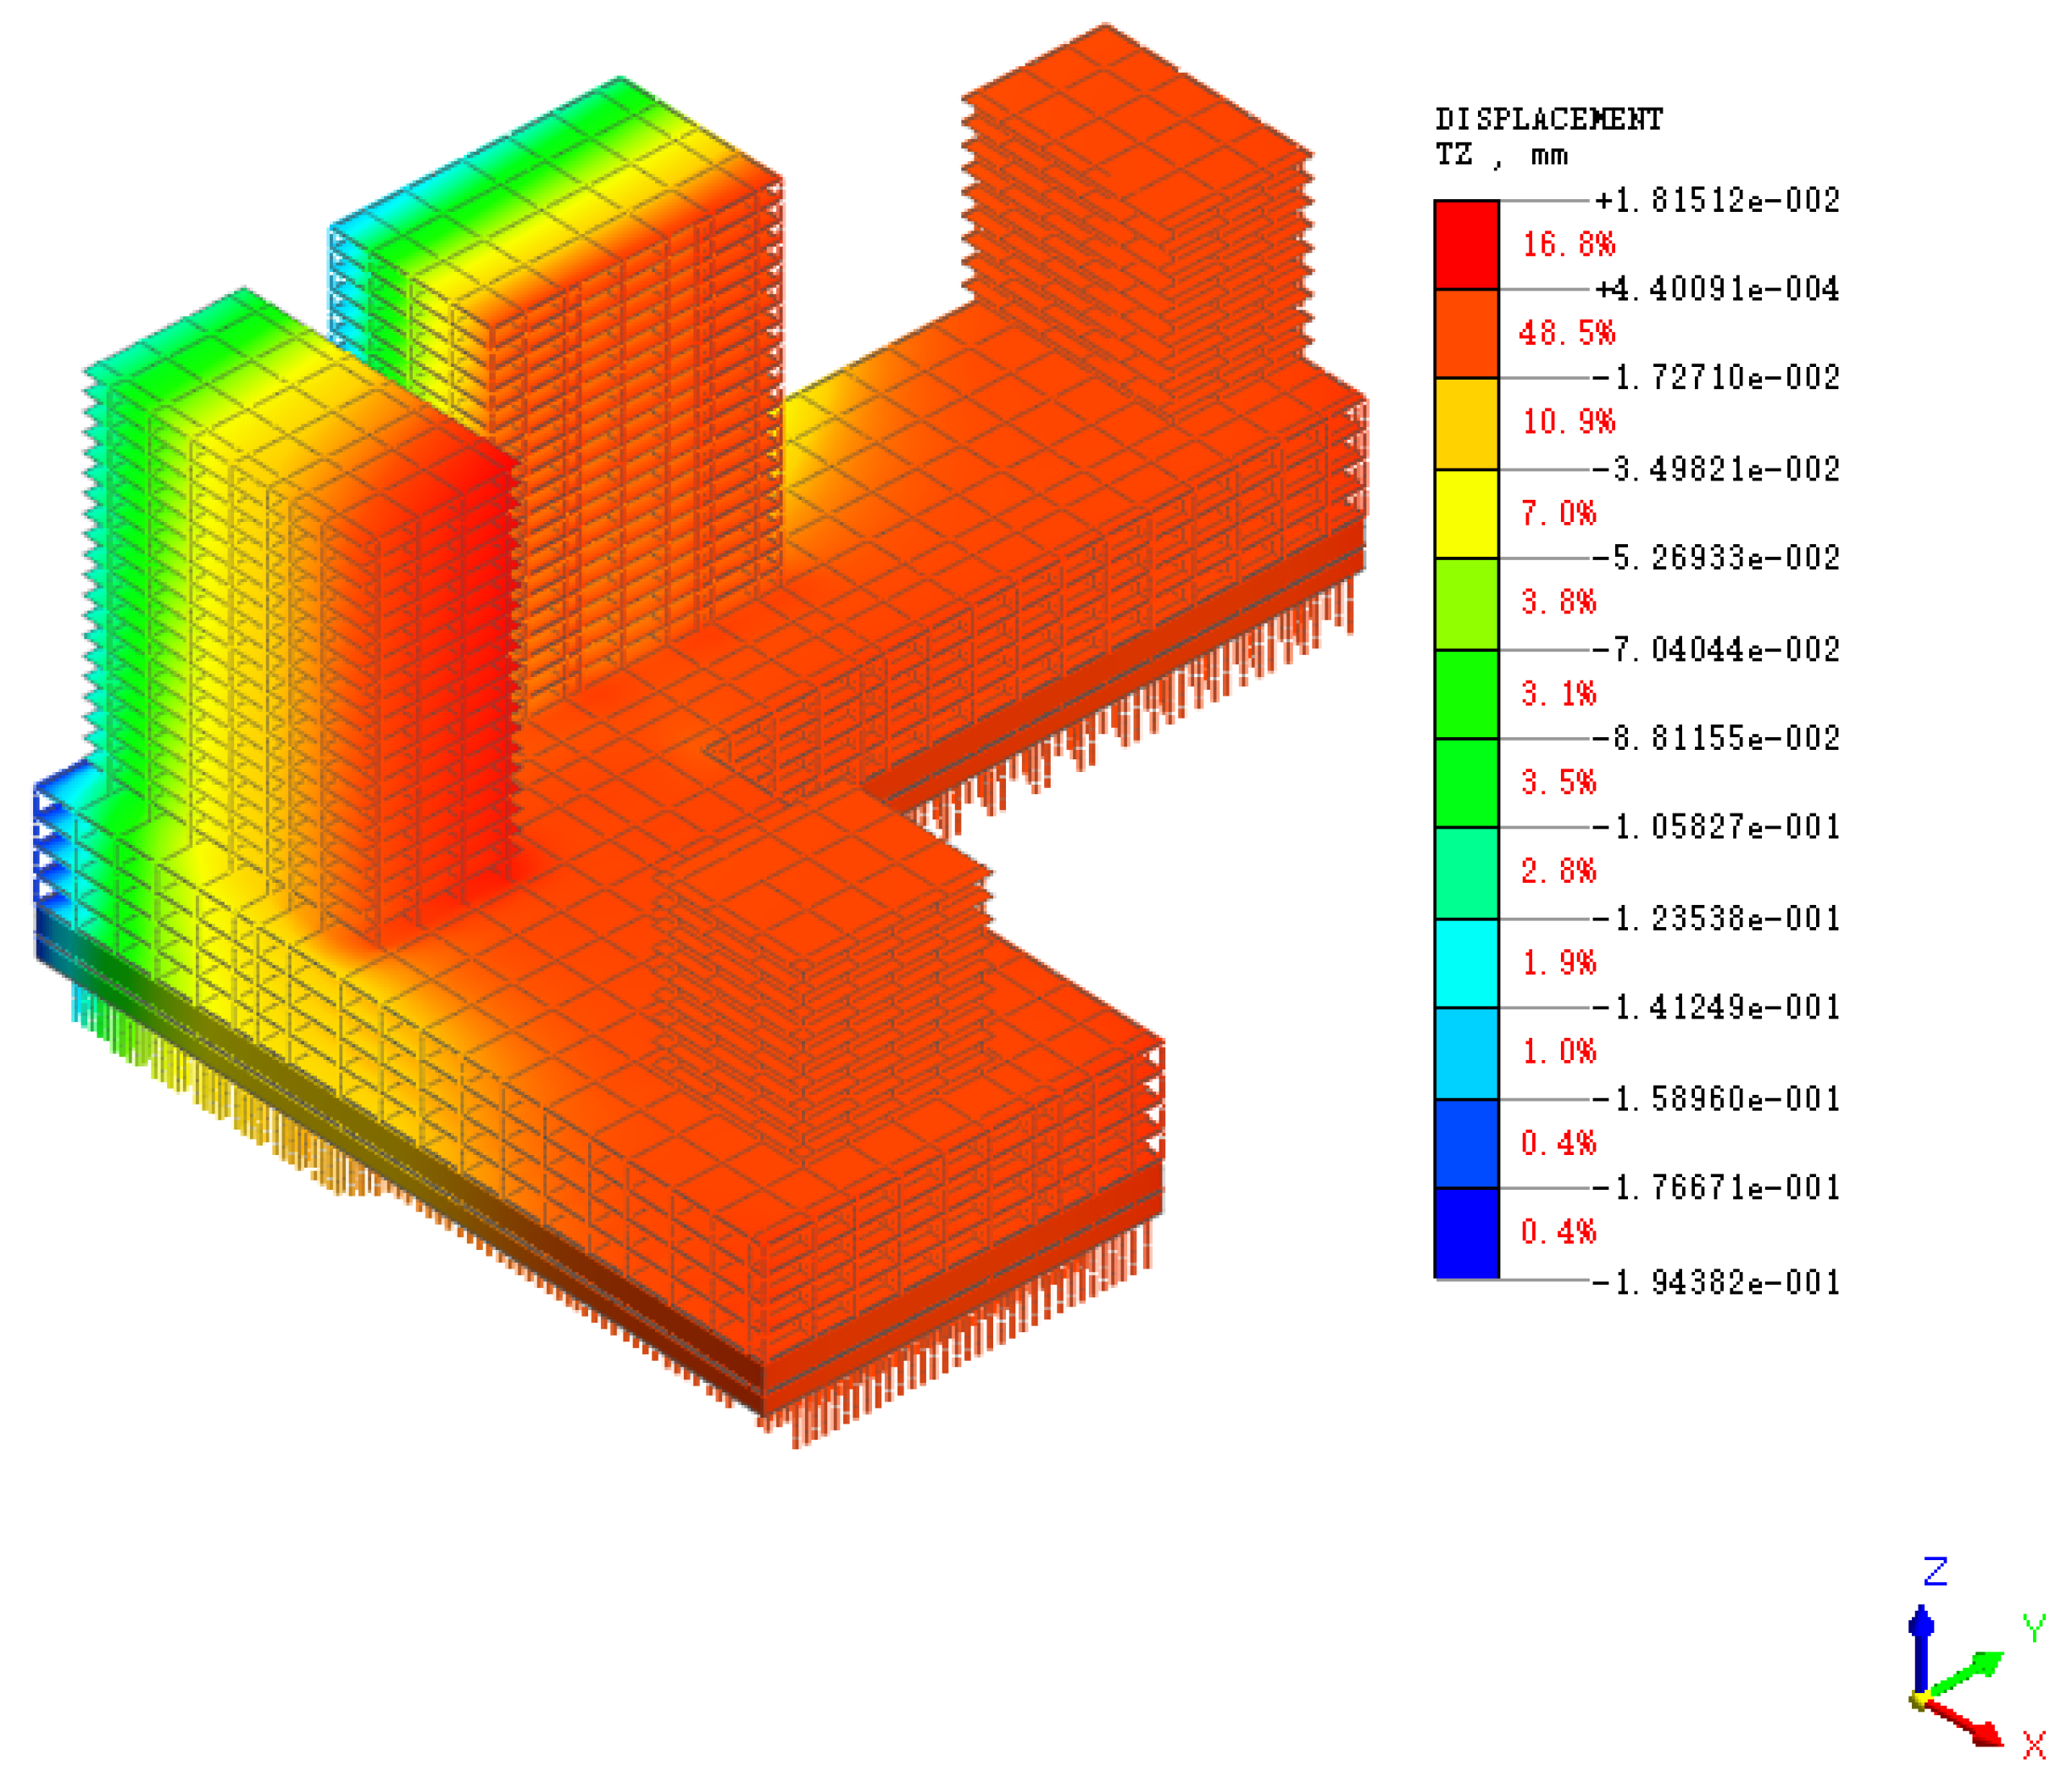
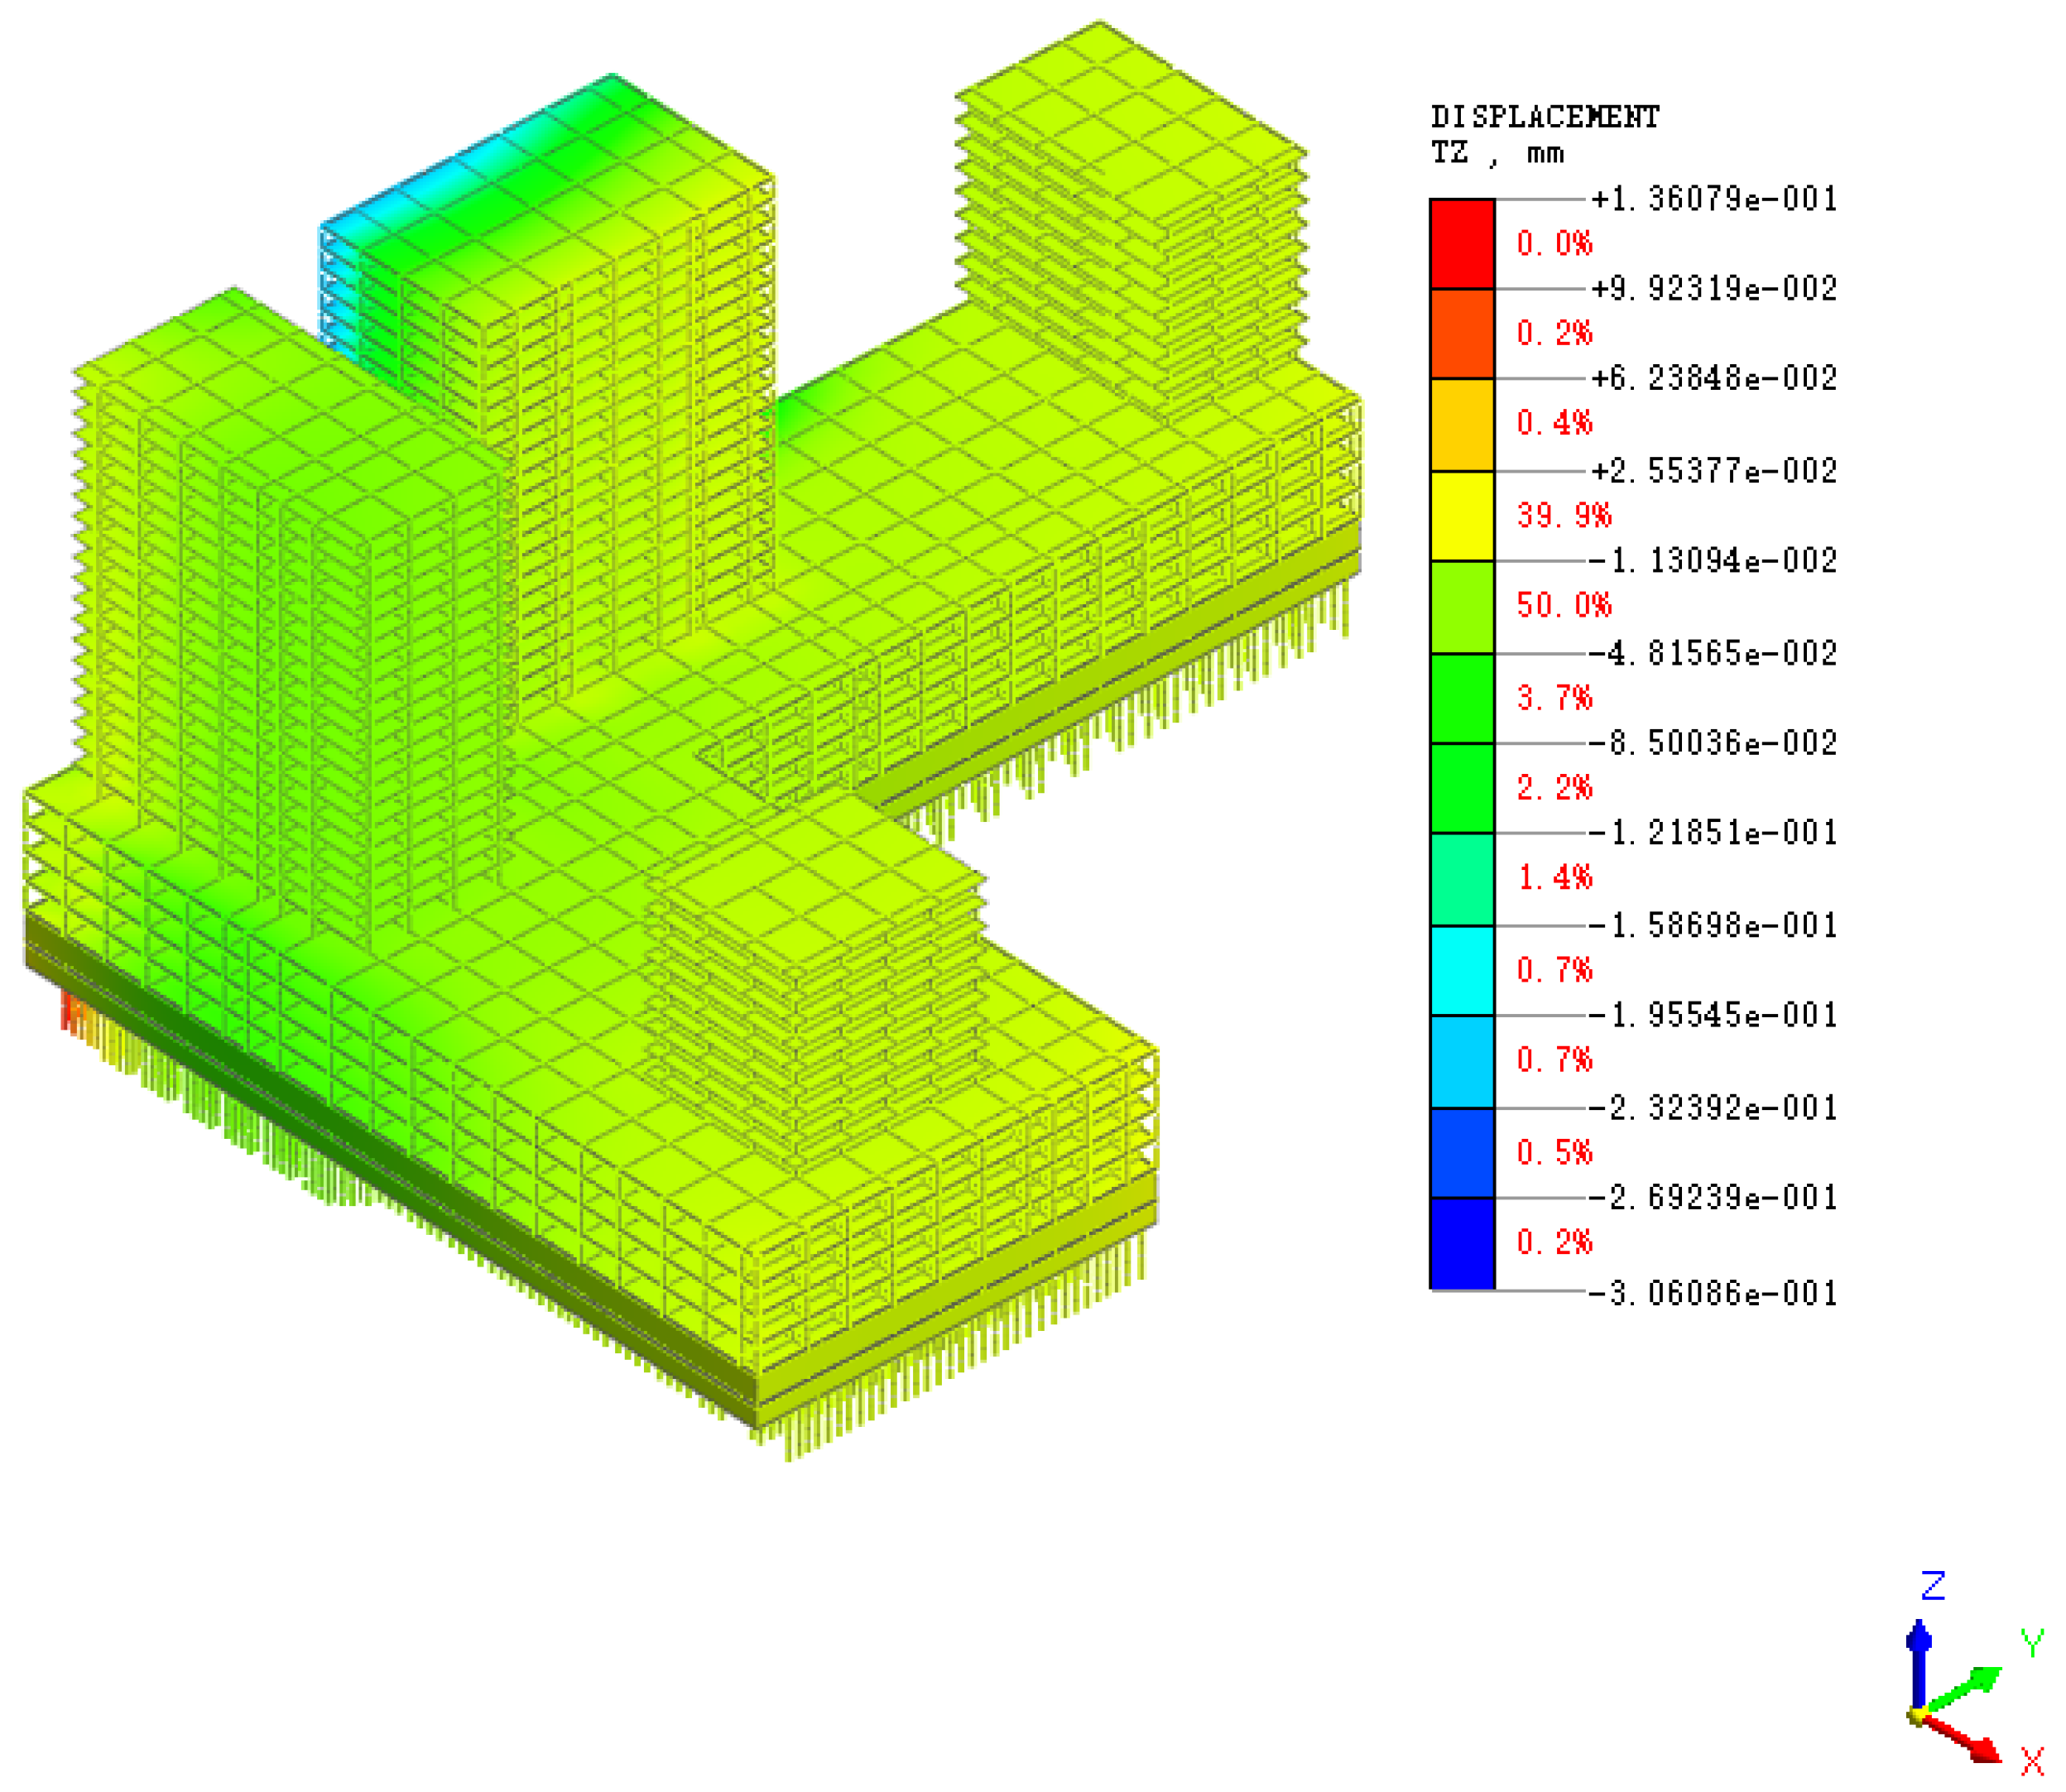
Cloud maps of vertical deformation of adjacent buildings under each construction process are derived, as shown in Figure 38, Figure 39, Figure 40, Figure 41 and Figure 42.
As indicated by the cloud maps, the maximum settlement of adjacent building structures reached −0.306 mm after dewatering construction was completed.
As shown in Figure 40, Figure 41 and Figure 42, during the foundation pit excavation and support process of the main station structure, the settlement of adjacent building structures gradually increased, with the maximum settlement reaching −4.243 mm.
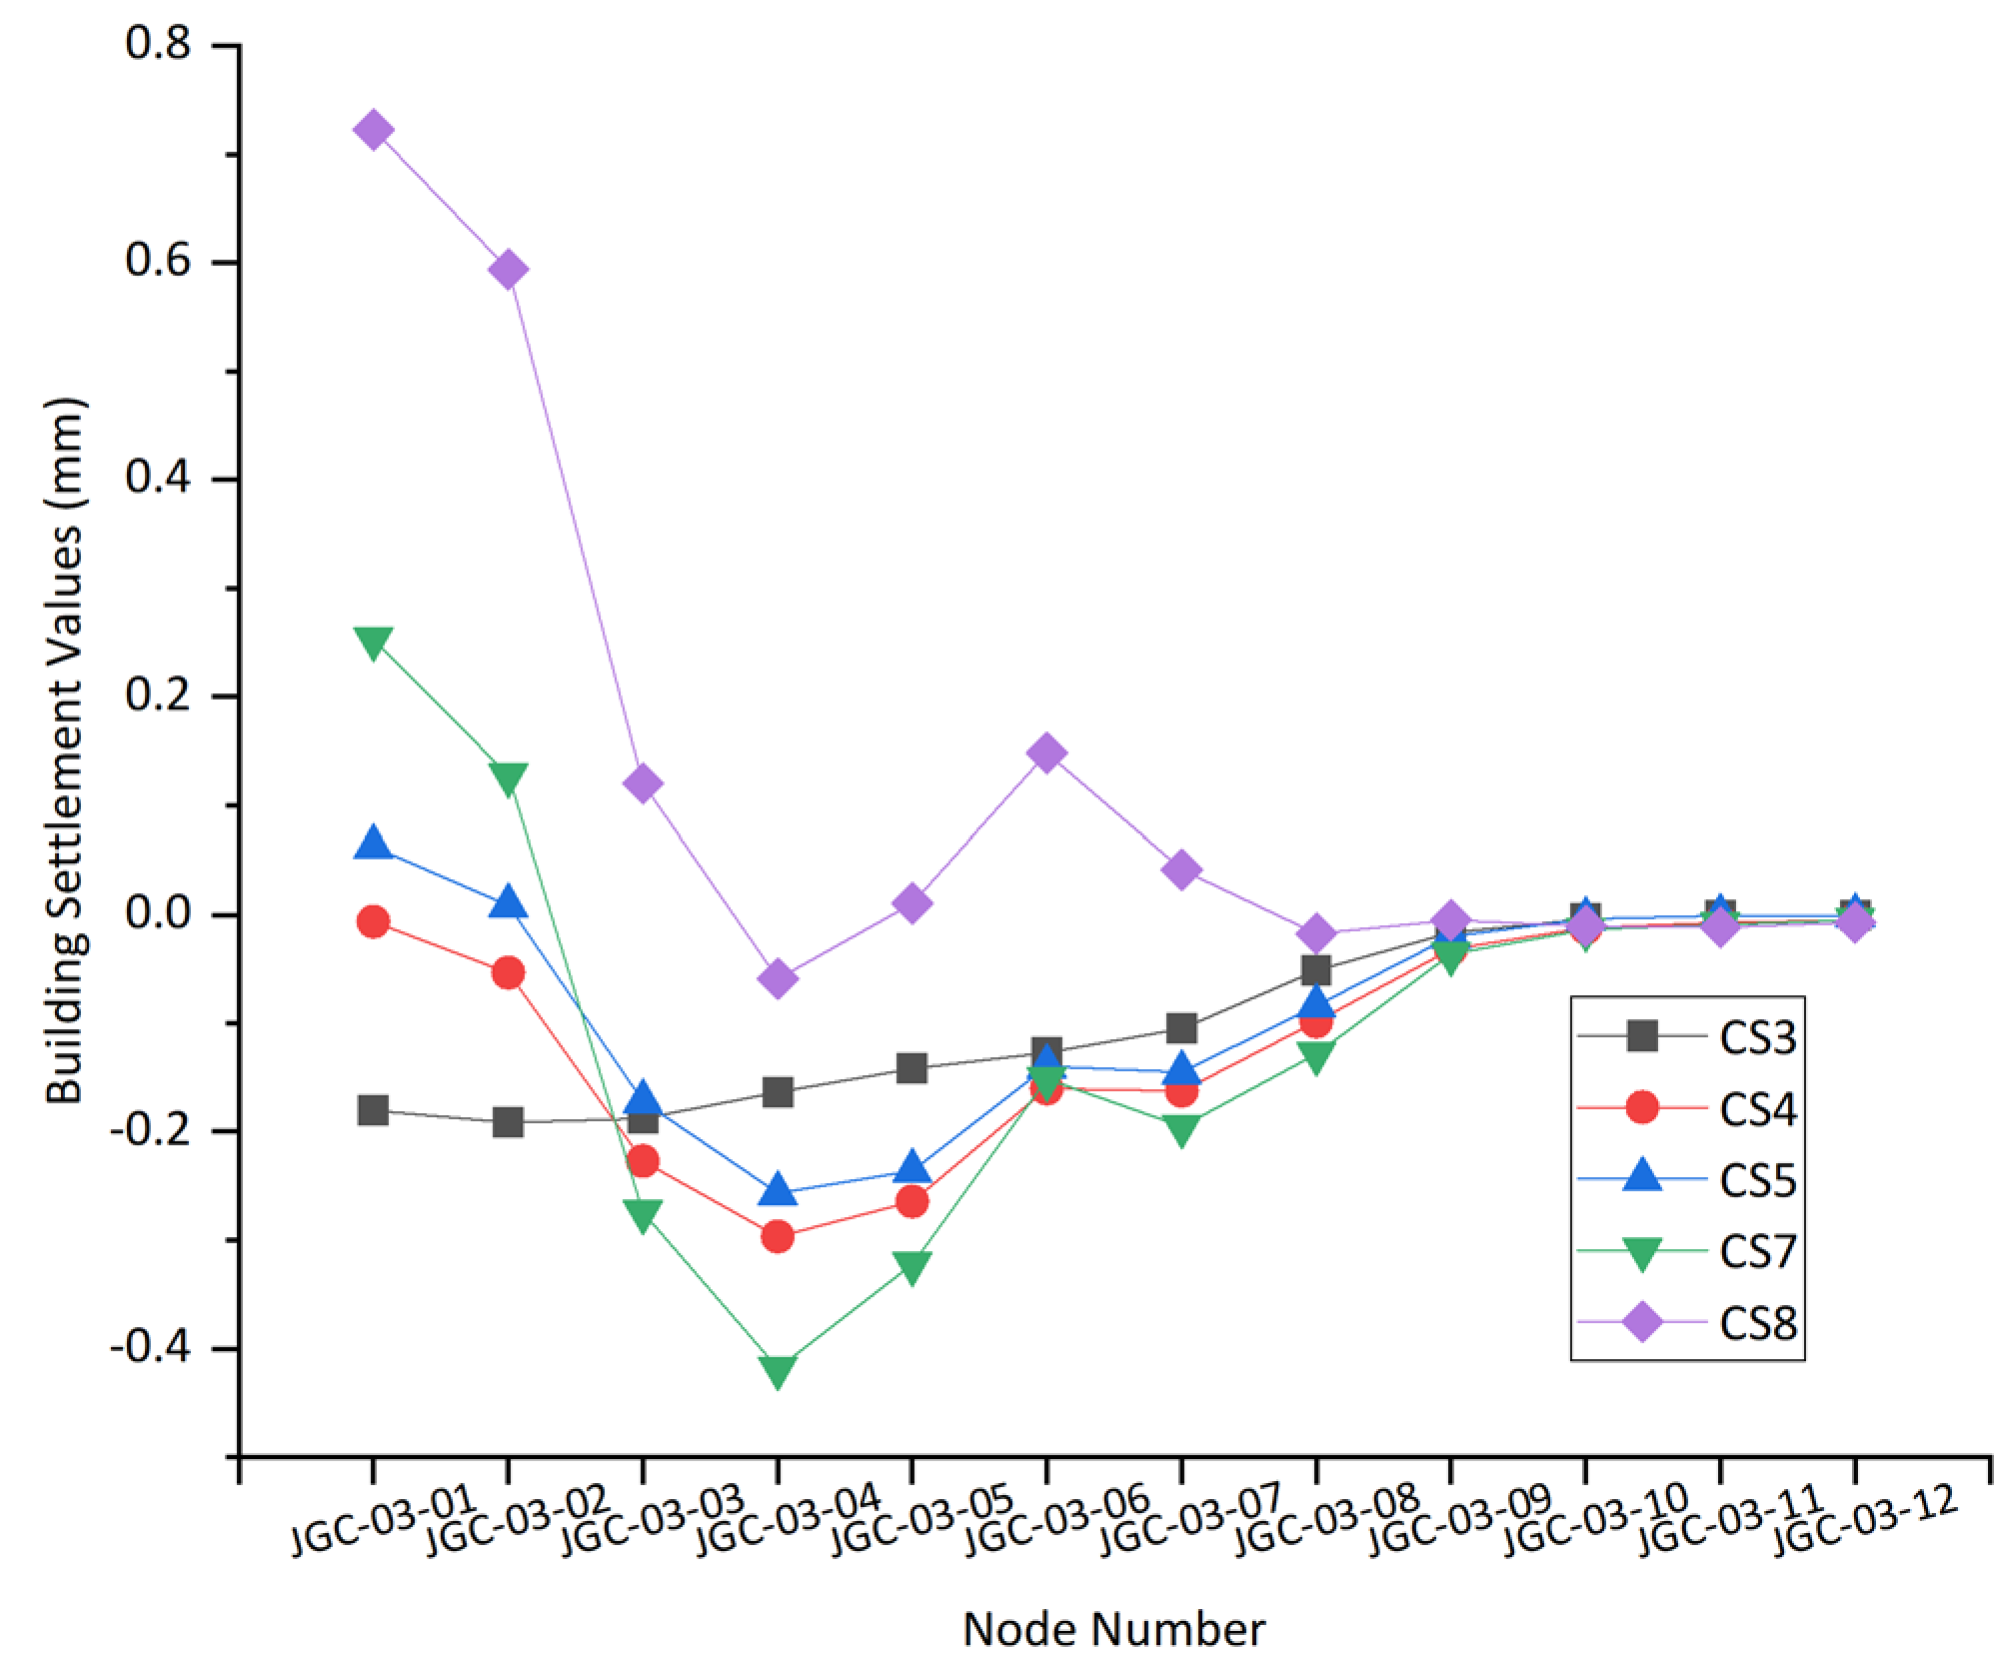
Vertical deformation values of nodes JGC-03-01 to JGC-03-31 in the finite element numerical model (Figure 15 for the monitoring point layout diagram) are extracted, and settlement curves of adjacent buildings during foundation pit excavation are plotted to further analyze the impact of cover-and-cut top-down metro engineering on the vertical deformation of adjacent buildings.
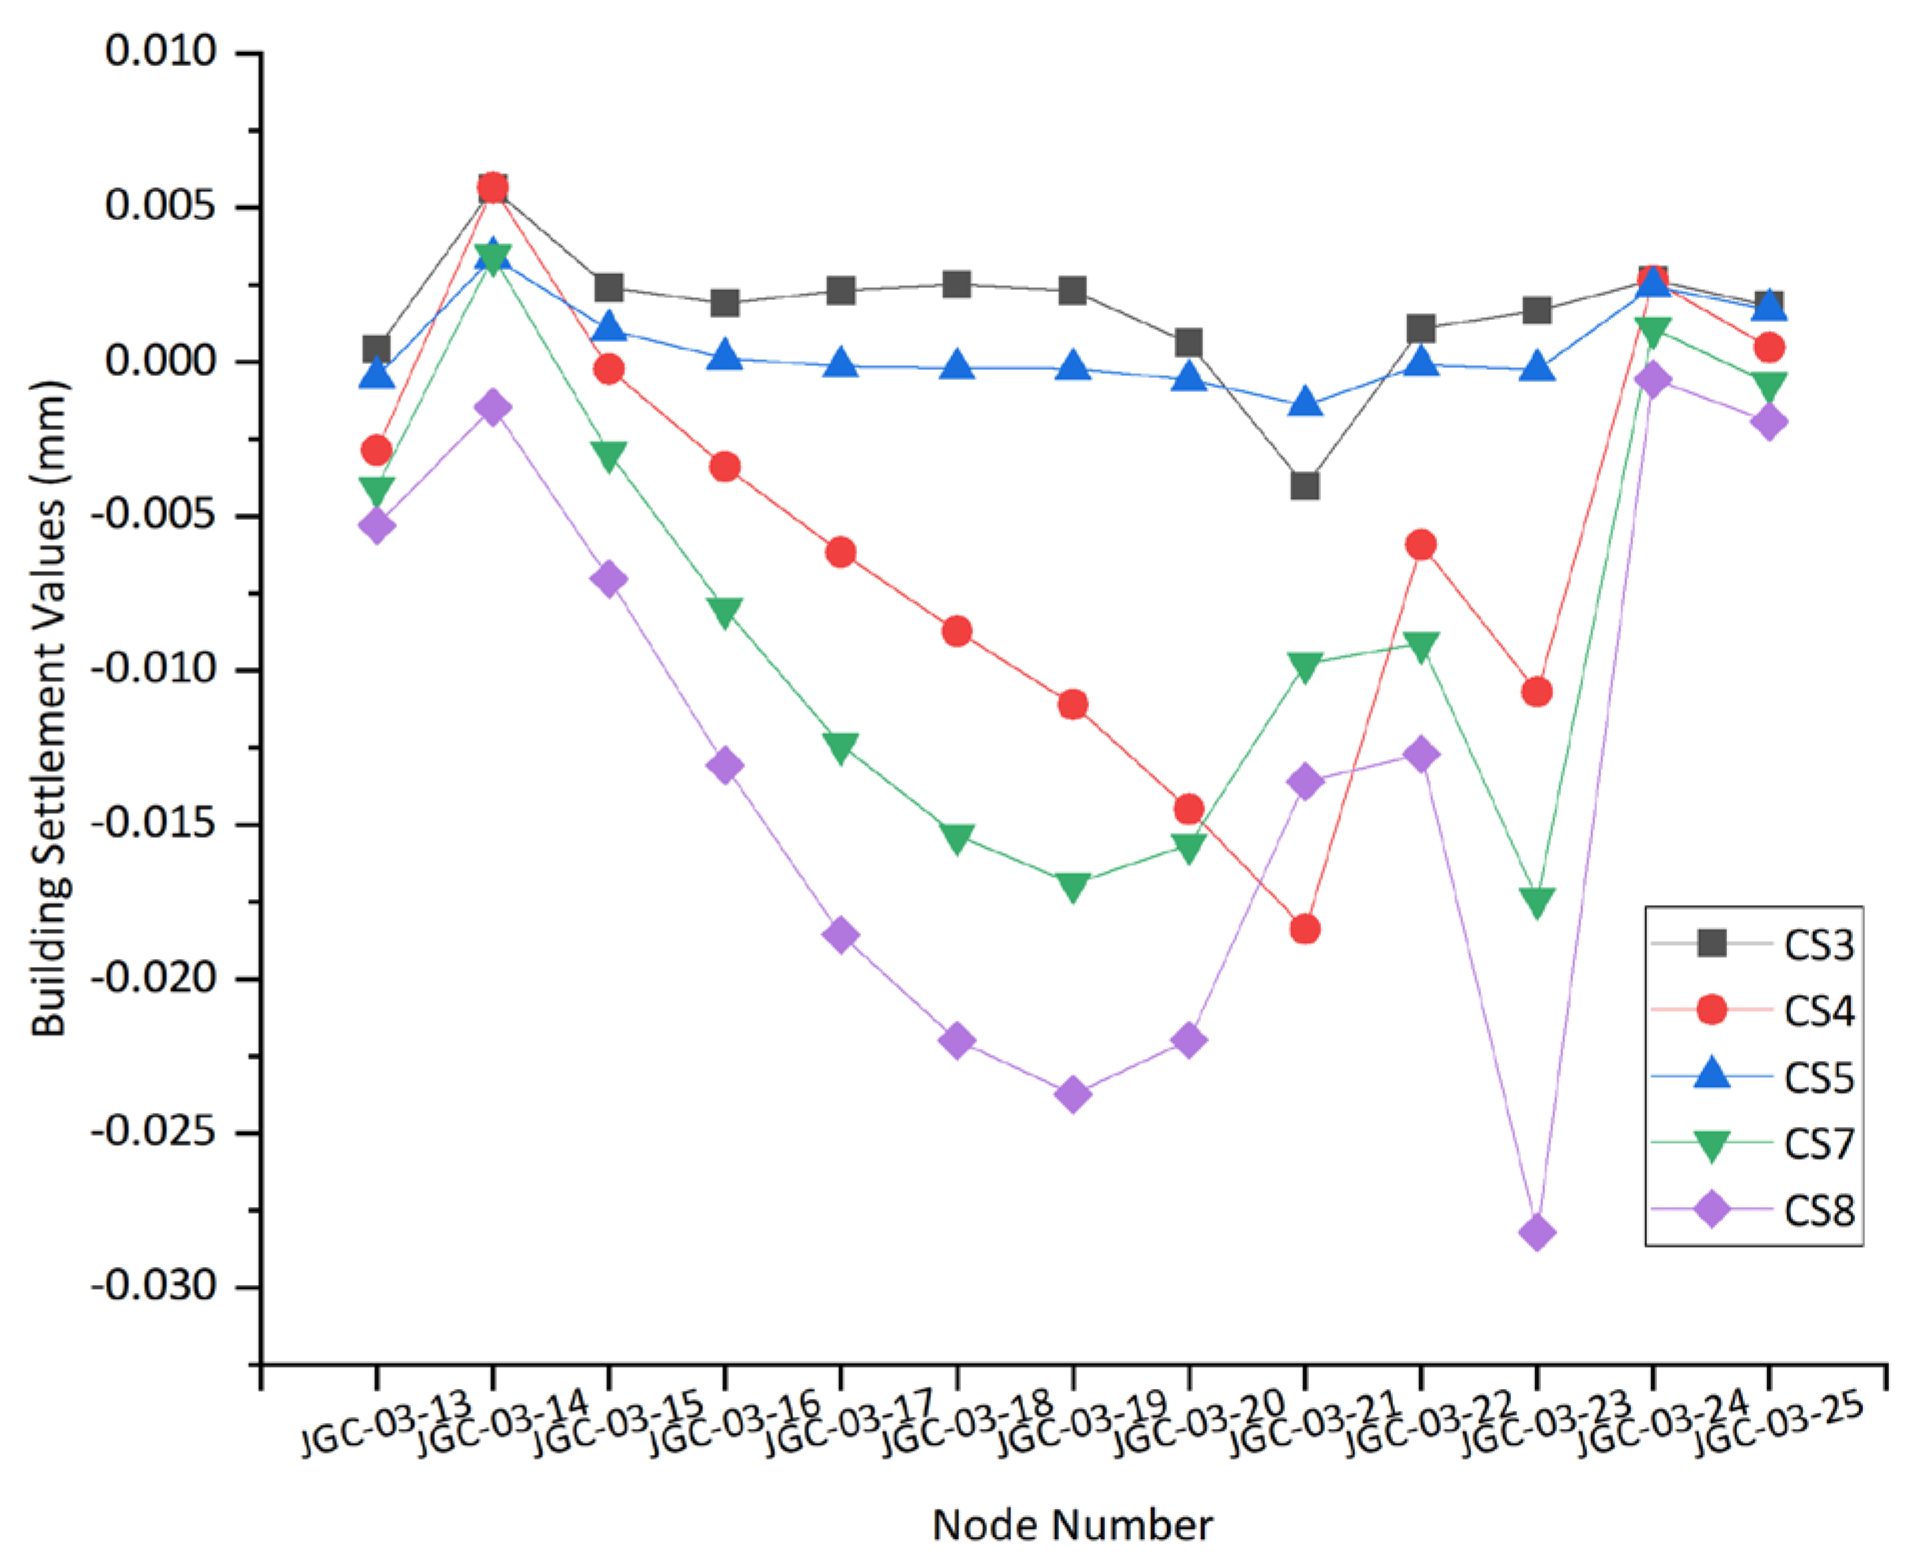
Figure 43, Figure 44 and Figure 45 show the settlement development of adjacent buildings throughout the construction process.
Figure 43 presents the settlement curves of each node on the west side of the building along the foundation pit direction. This side is adjacent to the foundation pit edge (within a 10-m range), and the distance from the foundation pit increases gradually from south to north. As shown in Figure 43, during the support structure construction period, the settlement of the building gradually decreases with the increase in distance from the foundation pit edge. The maximum settlement occurs in the stage of excavation to the basement plate and basement plate construction in the cover-cut section, with a settlement value of −0.18 mm. The settlement curves of each point are relatively gentle at this stage. With the excavation of the foundation pit and the construction of the roof slab, the settlement curve of the building shows a parabola-like pattern of first uplifting, then declining, and then uplifting again. The uplifting phenomenon results from the lateral stratum movement caused by the casting of side walls. The maximum uplifting value occurs at node JGC-03-01 (the node closest to the foundation pit) in the CS8 stage, with a settlement value of 0.72 mm. The maximum settlement value occurs at node JGC-03-04 (approximately 8 m away from the foundation pit) in the CS7 stage, with a settlement value of −0.42 mm. No obvious large settlement occurs in the building, indicating good integrity.
As shown in Figure 44, the settlement value of the building decreases with the increase in distance from the foundation pit. The range within 2 He (JGC-03-32 to JGC-03-30) is the main settlement influence zone, the range within 2–3 He (JGC-03-29, JGC-03-28) is the secondary settlement influence zone, and areas beyond 3 He (JGC-03-27, JGC-03-26) are almost unaffected.
As shown in Figure 45, Nodes (JGC-03-13 to JGC-03-25) are all located in the secondary influence zone or beyond, with relatively small settlement values, which is consistent with the development law of ground surface settlement.
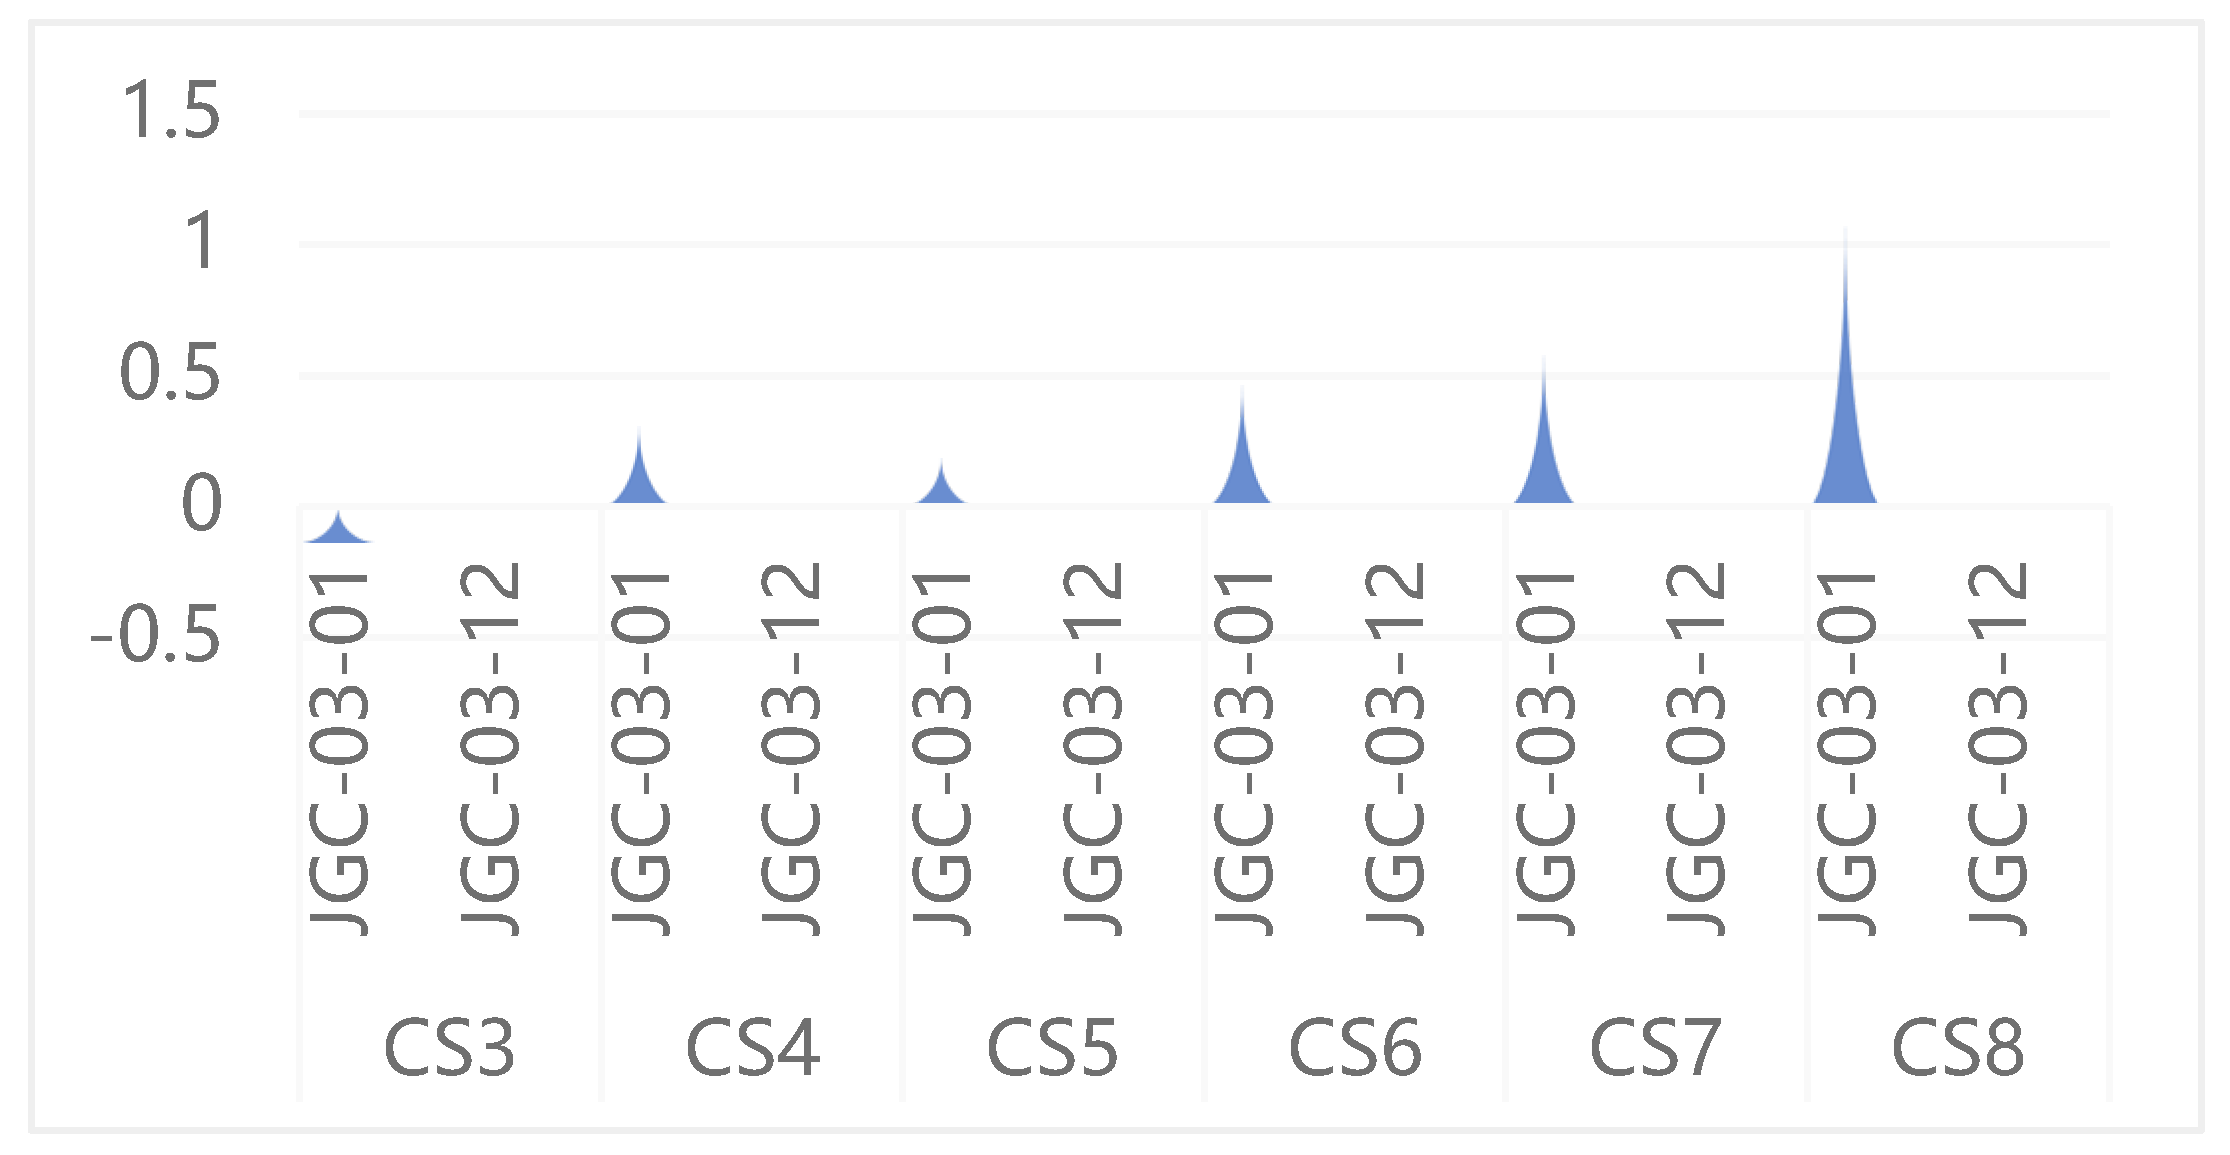
Statistics of foundation settlement values at the four corners of the building under each construction condition in the model are shown in Figure 46.
The foundations closer to the foundation pit are more directly affected by construction, with settlement values greater than those of foundations farther from the foundation pit. This settlement discrepancy caused by the distance from the foundation pit results in building tilting. Under CS8 construction conditions, the building foundation near the foundation pit in the east-west direction heaves, while the foundation in the direction away from the foundation pit settles. The differential settlement causes the building to tilt along the east-west direction with a tilt rate of 0.0107‰. In the north-south direction, the northern building foundation settles and the southern foundation heaves, with a tilt rate of 0.0069‰. Under CS7 construction conditions, the building foundation near the foundation pit in the east-west direction heaves, while the foundation in the direction away from the foundation pit settles. The differential settlement causes the building to tilt along the east-west direction with a tilt rate of 0.0058 ‰. In the north-south direction, the northern building foundation settles and the southern foundation heaves, with a tilt rate of 0.0037 ‰. The Code for Design of Building Foundations (GB 50007-2011) specifies a maximum allowable inclination rate of 3‰ [23], and all measured inclination rates comply with the requirements of this code.
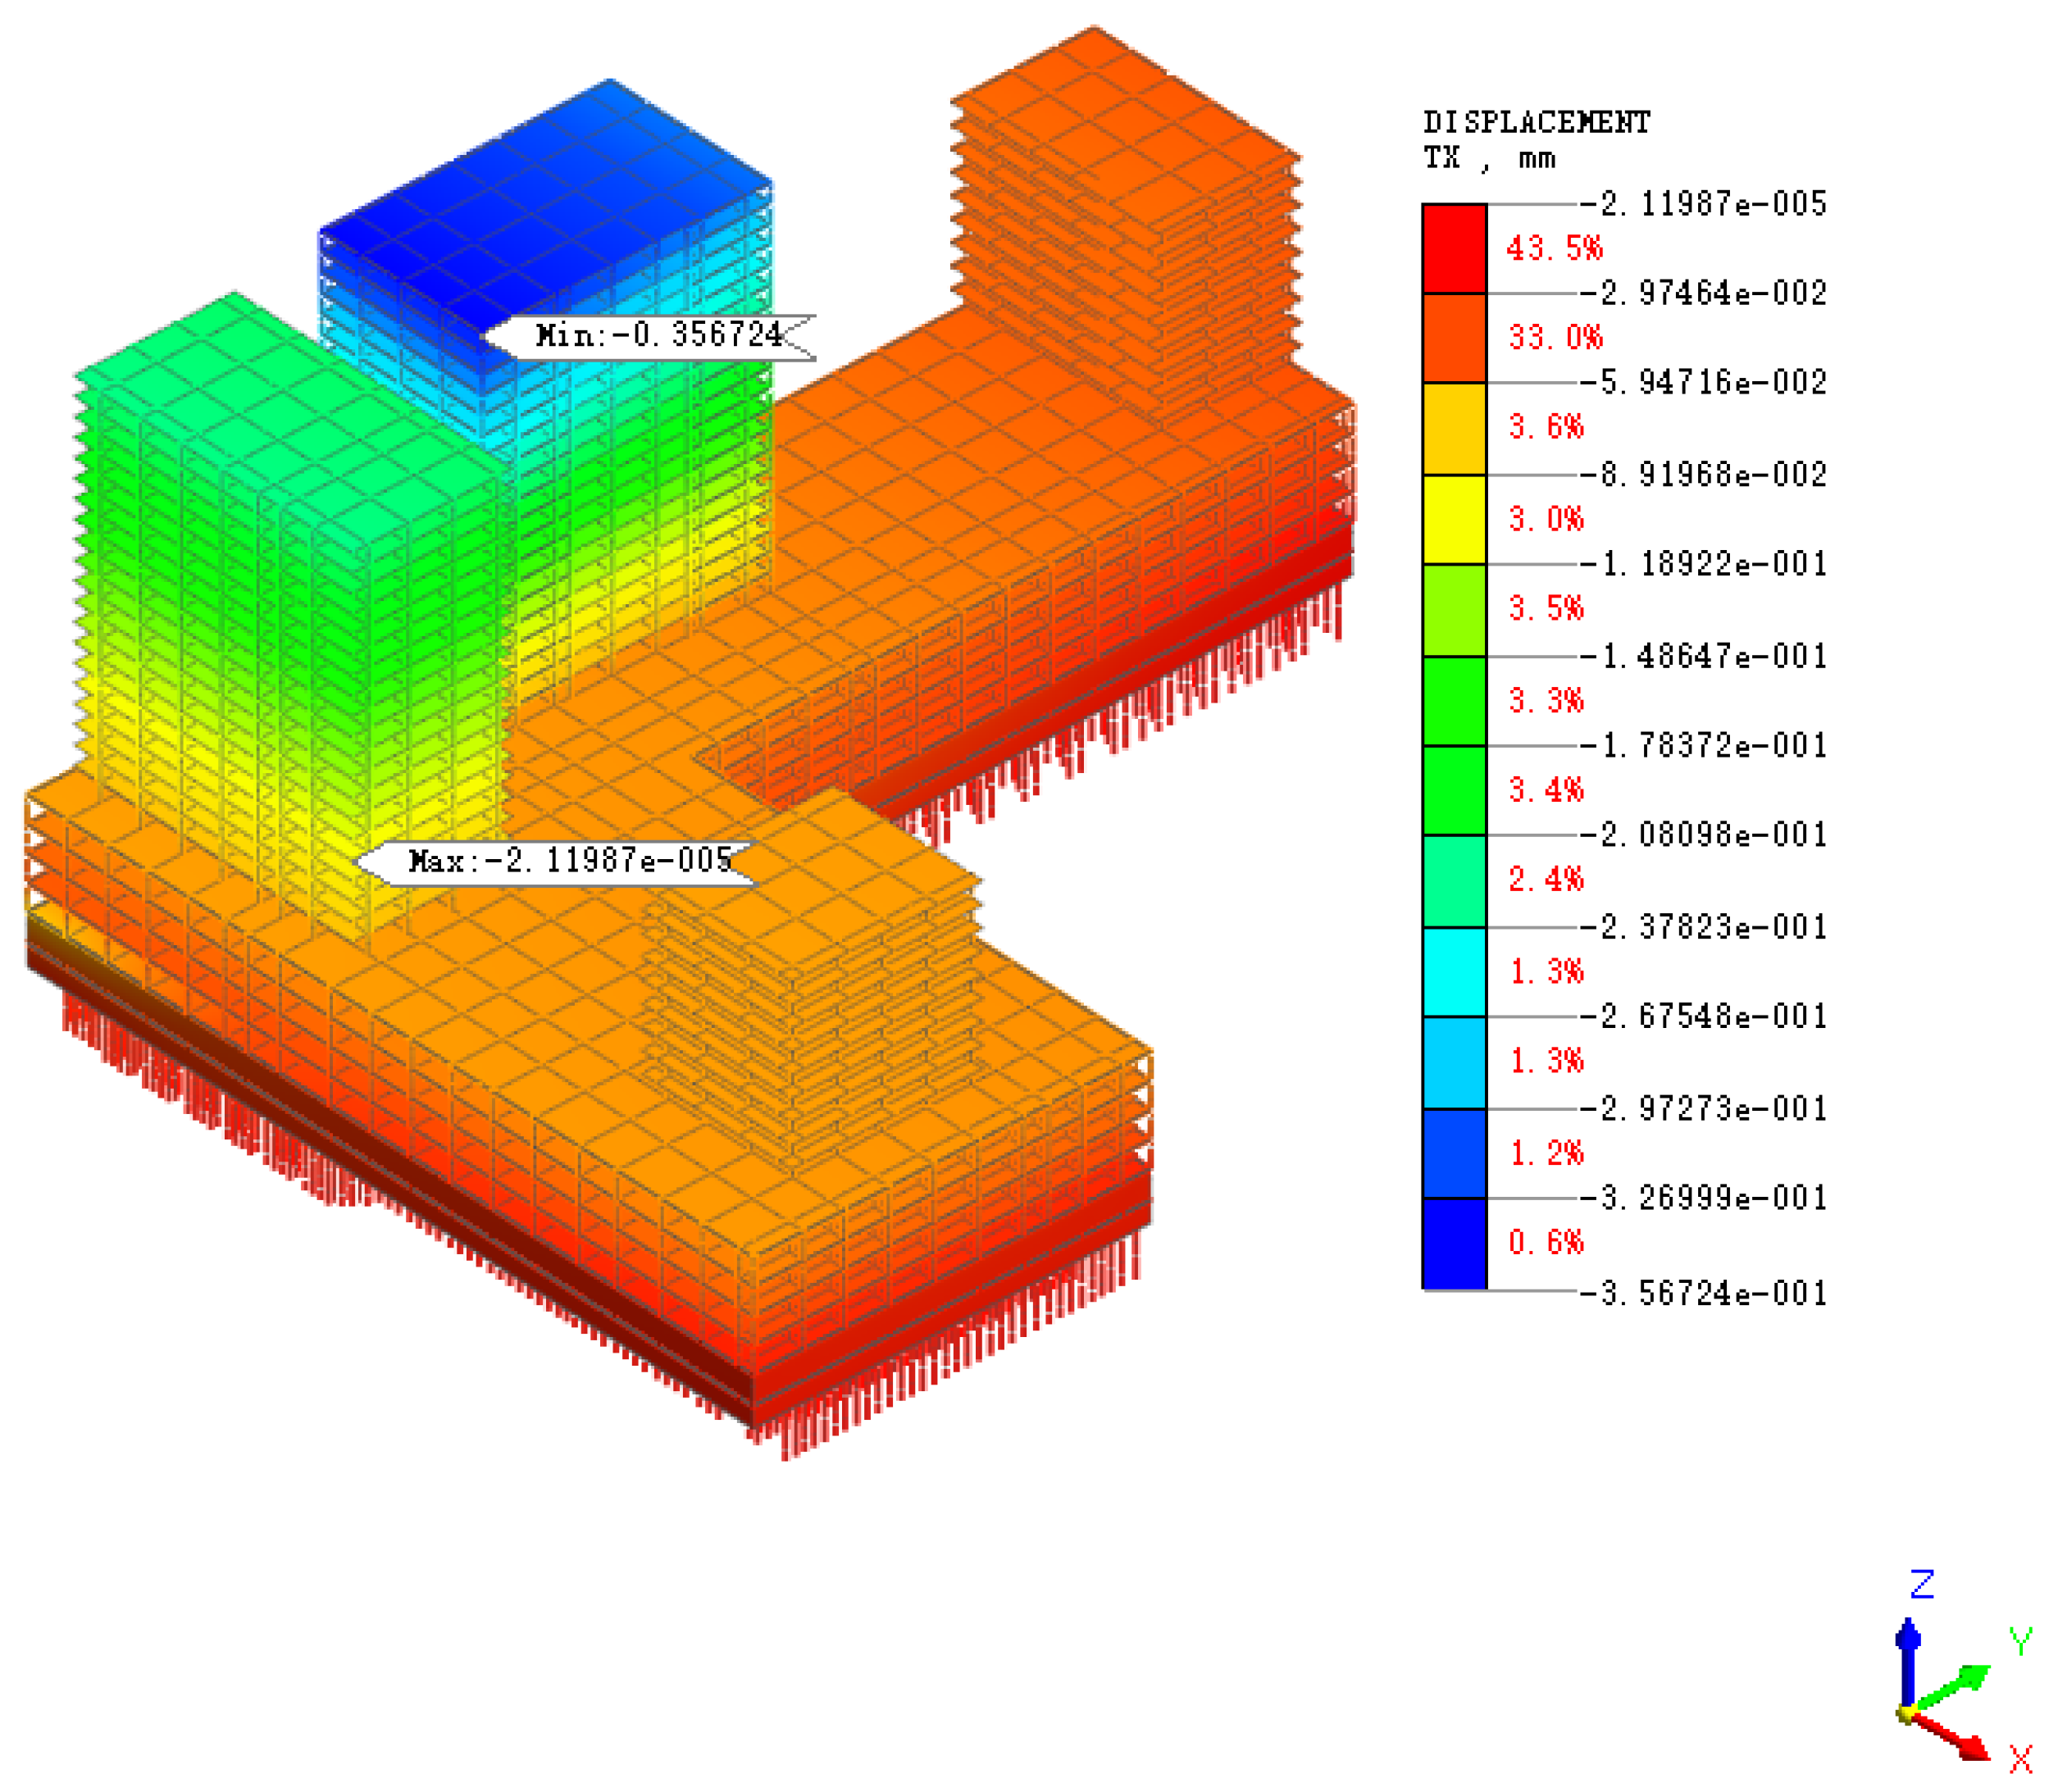
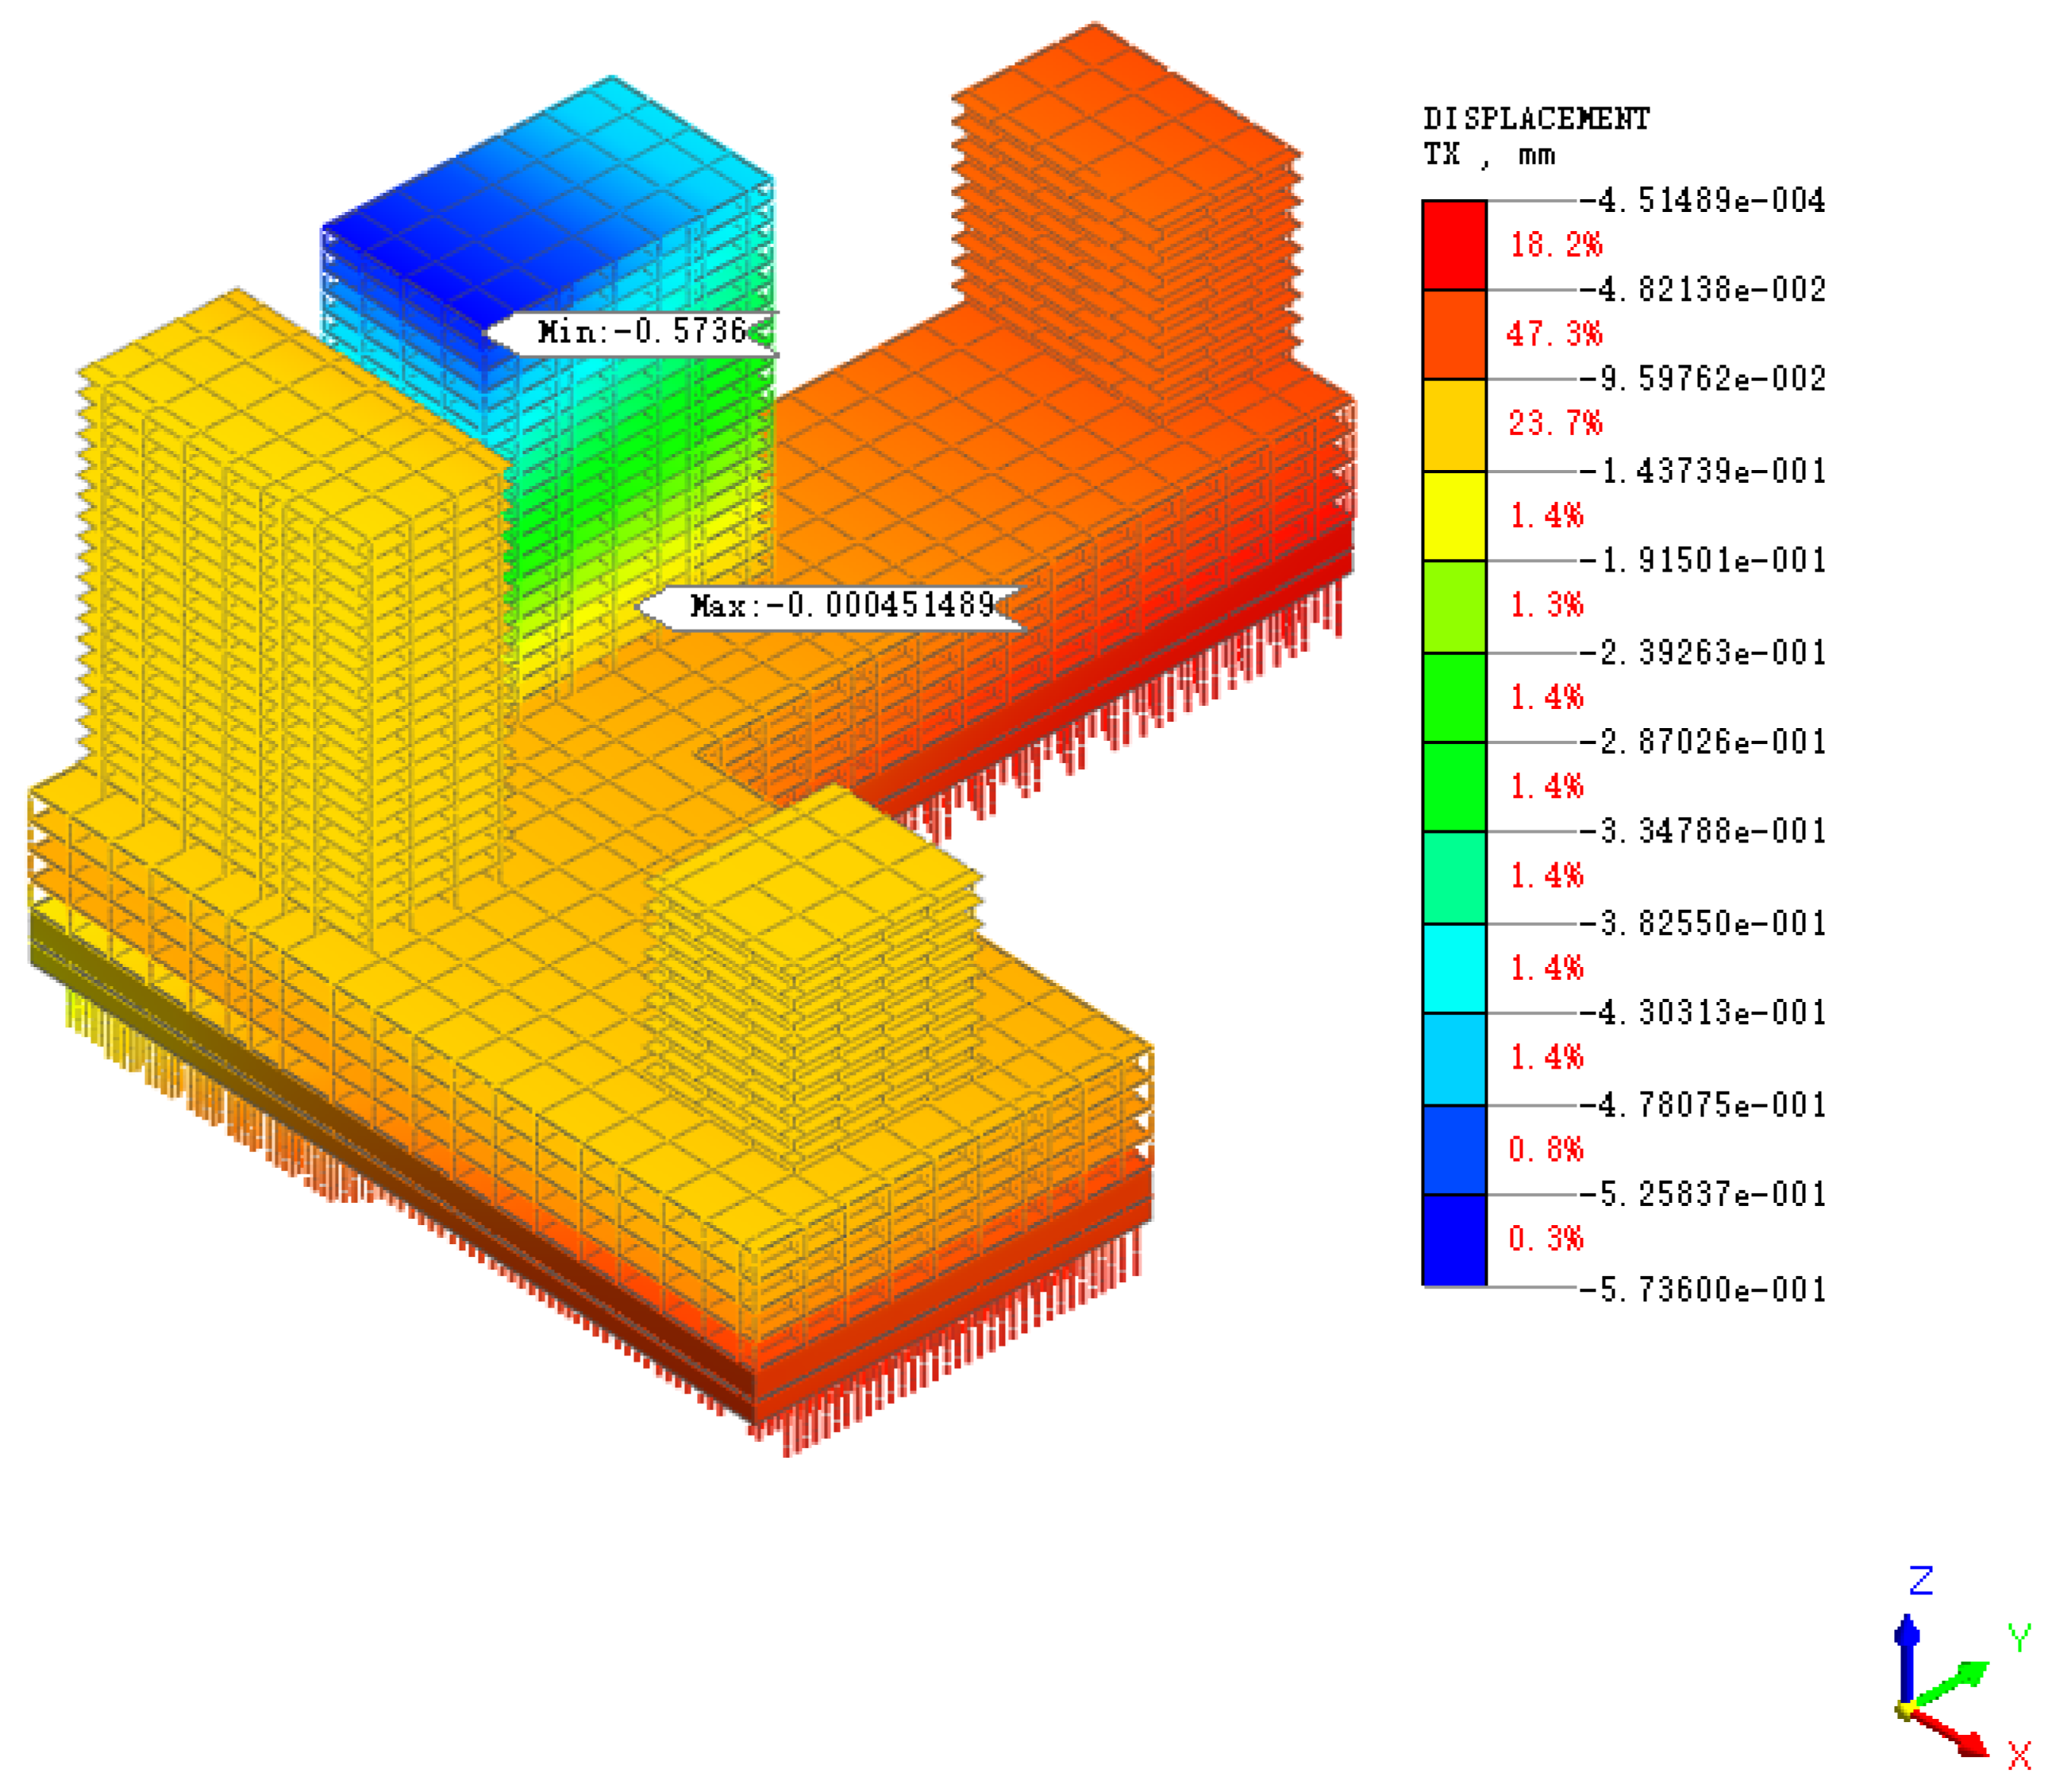
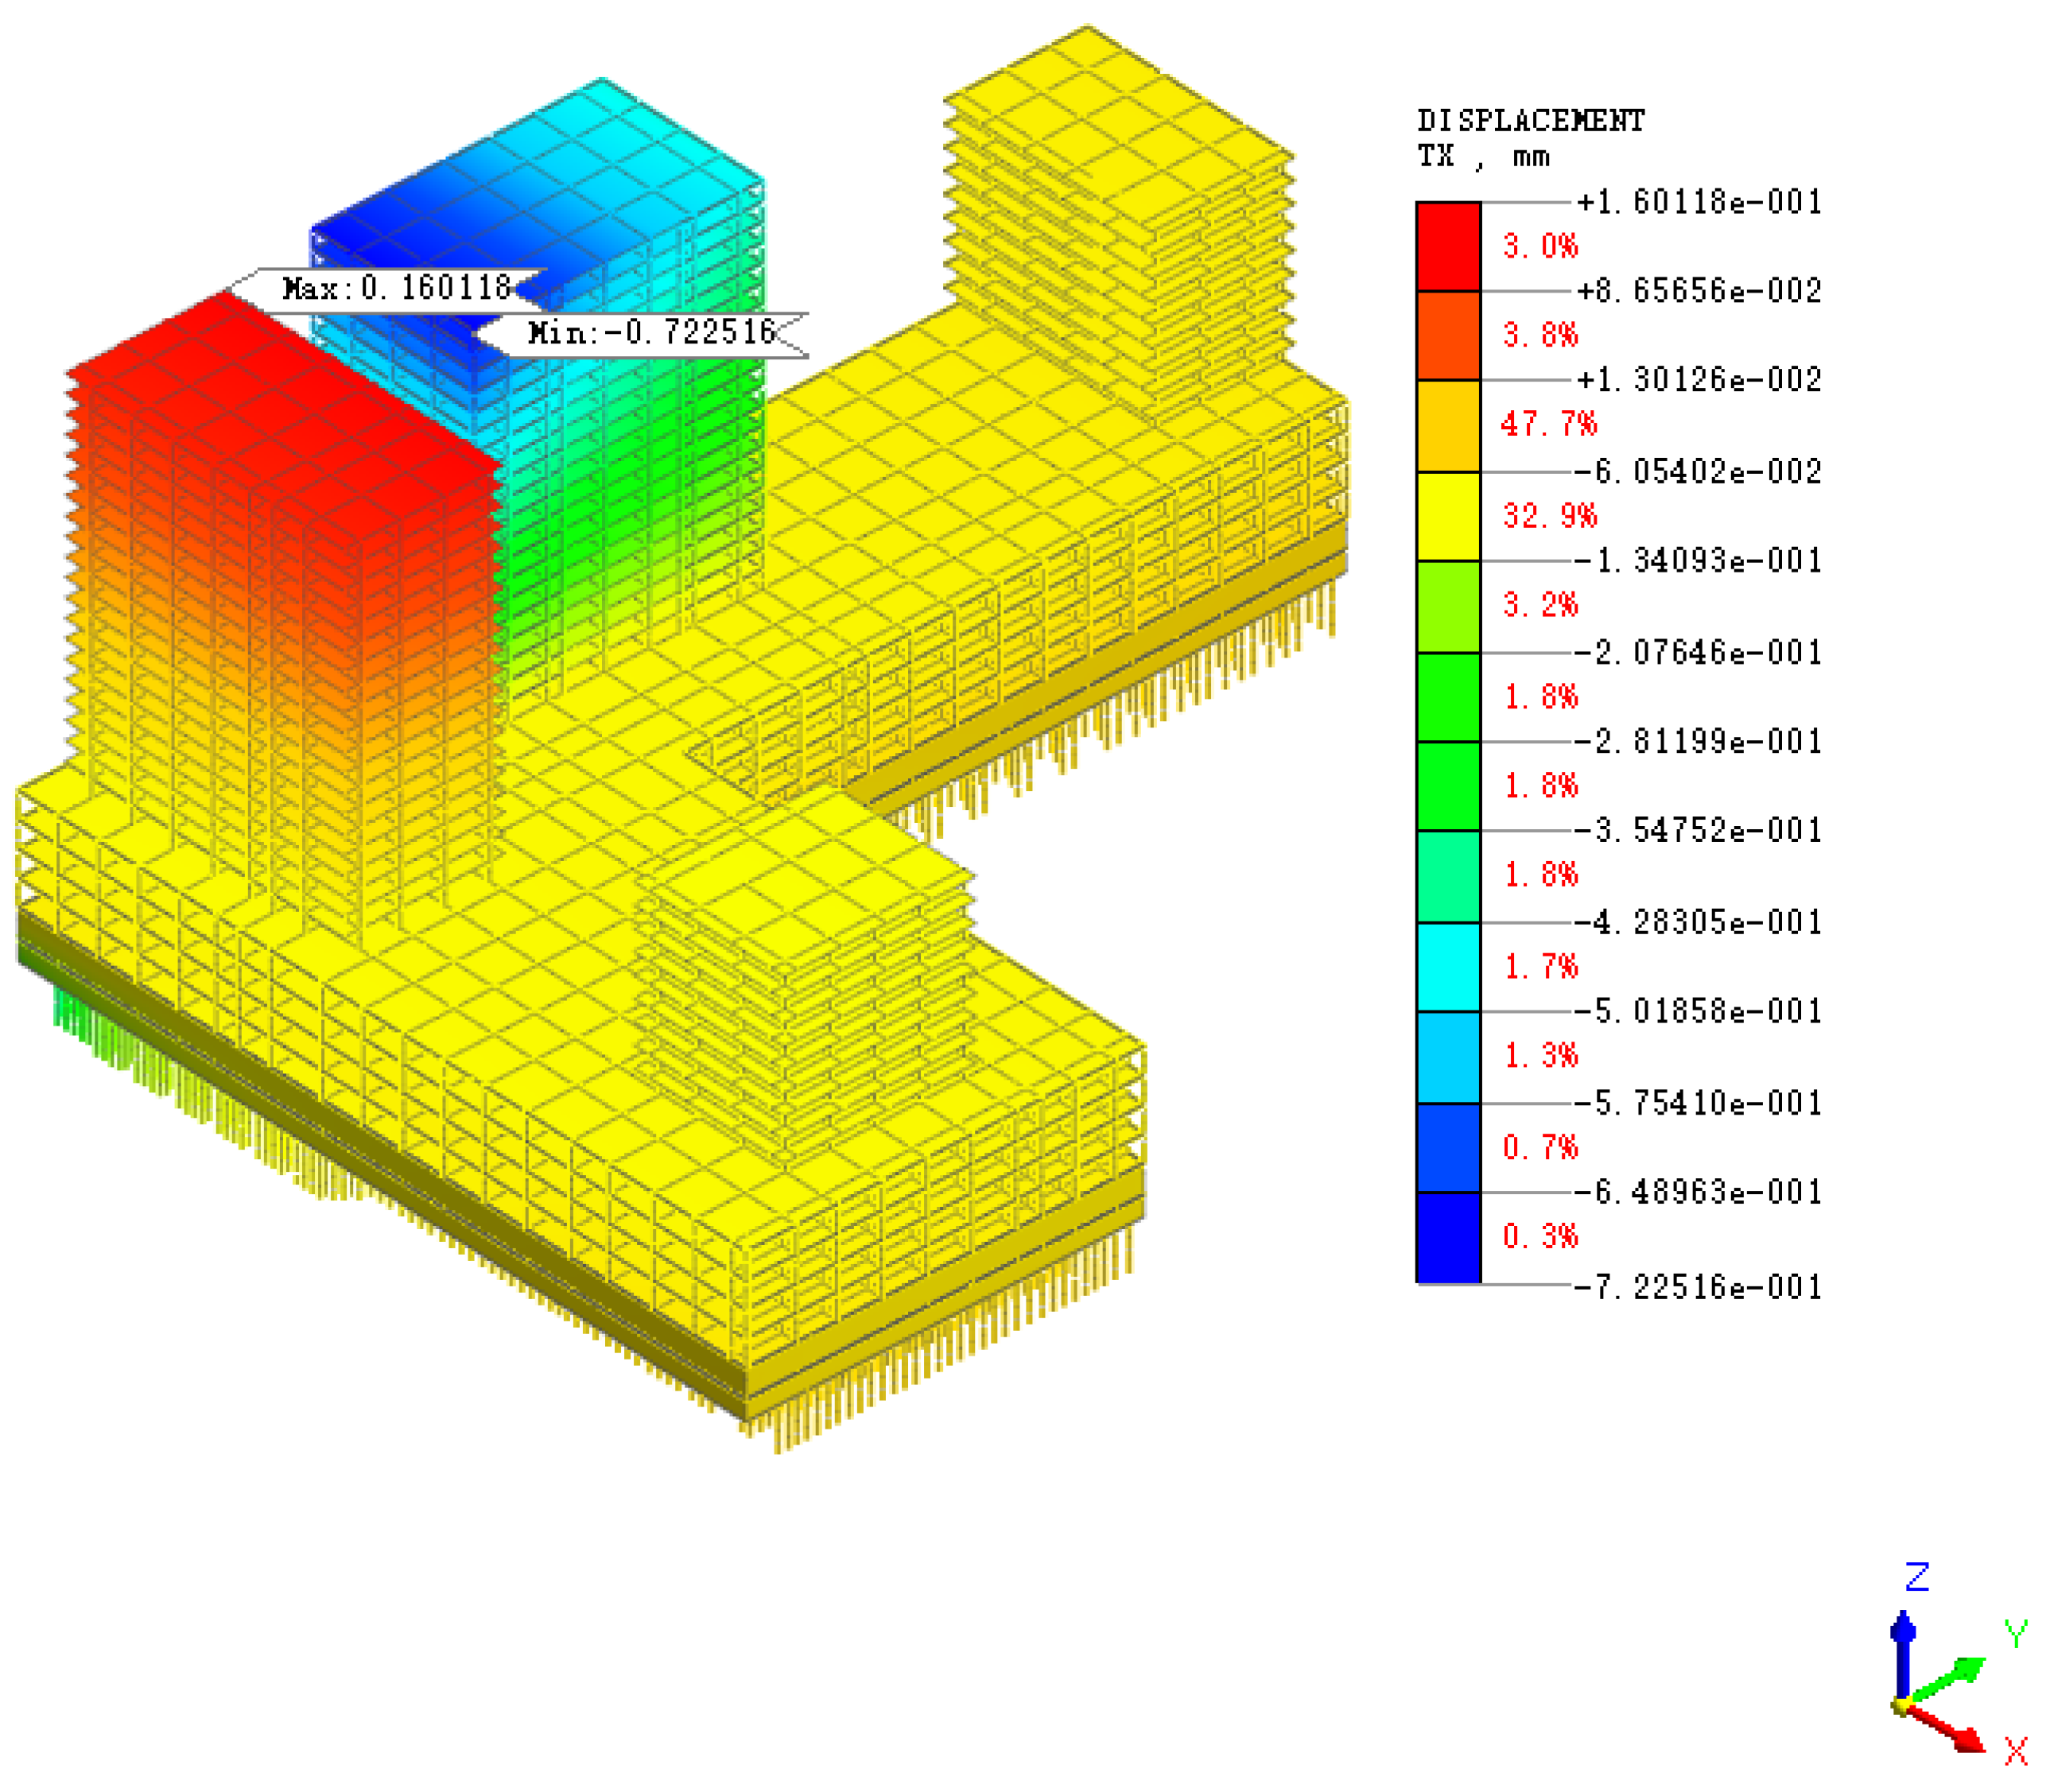
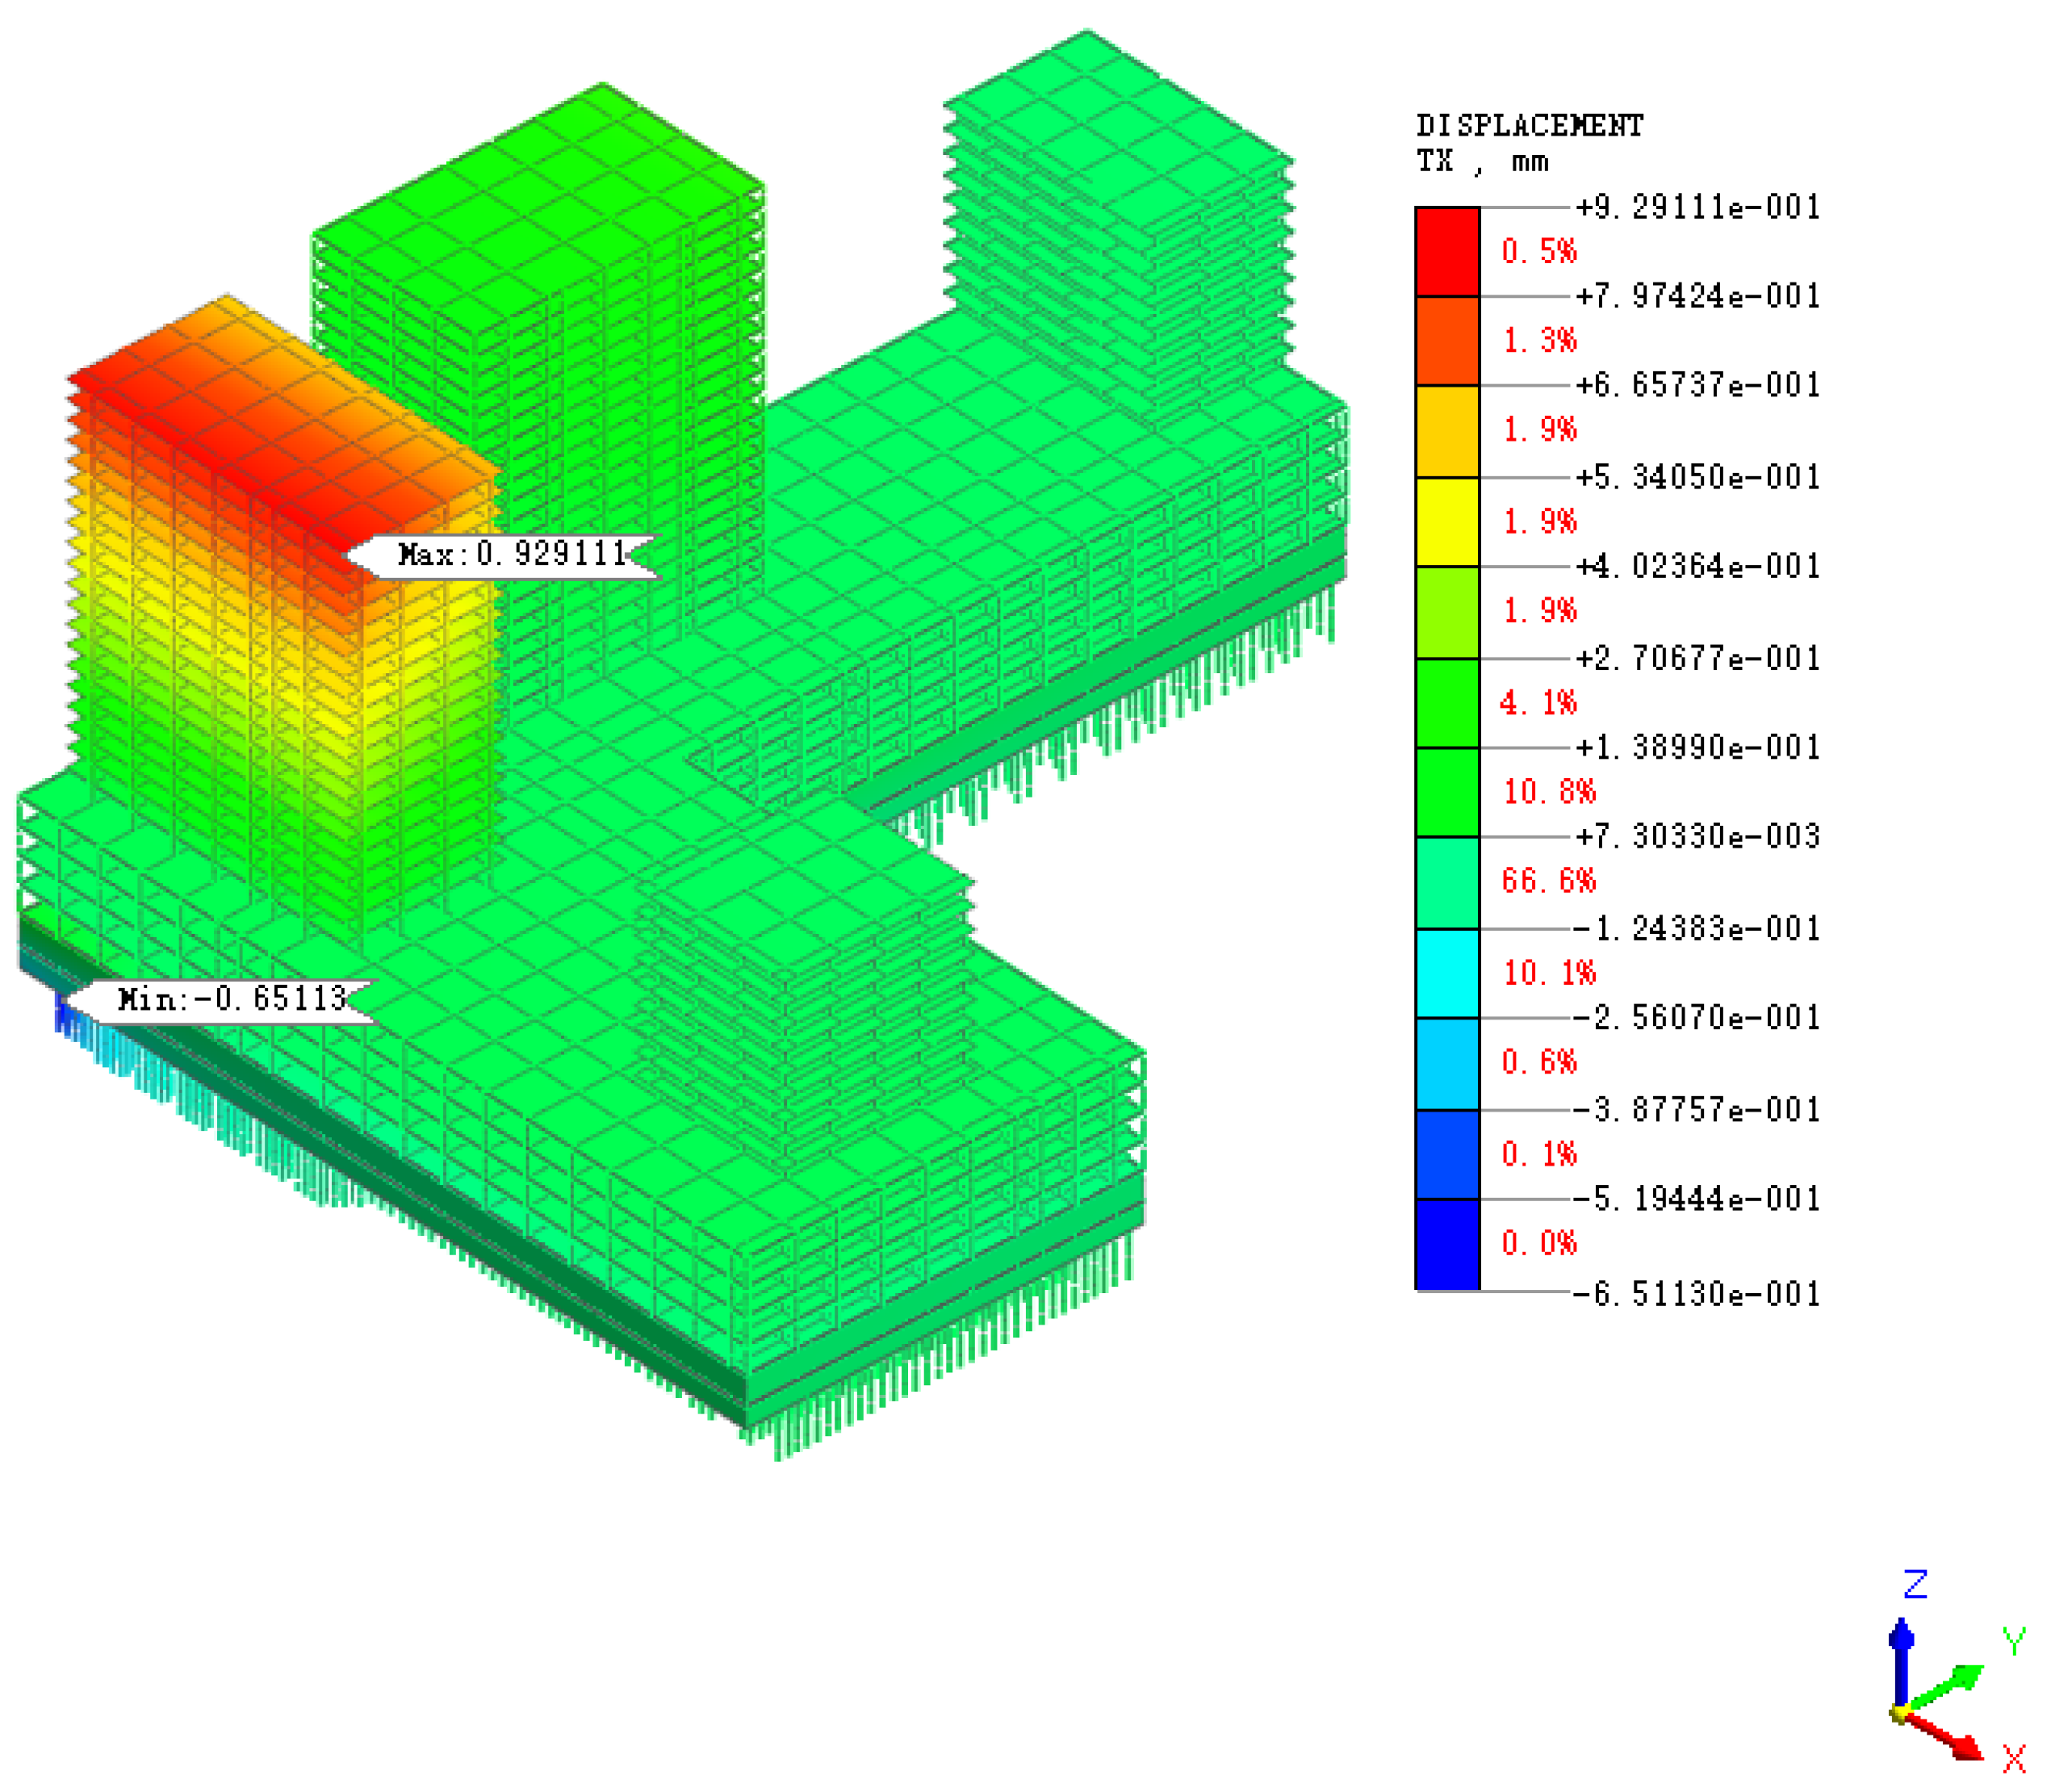
Horizontal deformation cloud maps (in X-direction) of adjacent buildings under each construction process are extracted, as shown in Figure 47, Figure 48, Figure 49, Figure 50 and Figure 51.
The cloud map results show that during the CS3 retaining pile construction stage, the adjacent building undergoes a certain amount of horizontal deformation due to disturbance of the surrounding soil, with an overall trend of moving toward the inside of the foundation pit. The deformation magnitude gradually increases along the height direction, with the maximum horizontal deformation of −0.357 mm occurring at the roof of Building B. The horizontal deformation at the building’s ground floor is relatively small, which is attributed to the relatively close contact between the ground floor and the foundation soil. The foundation soil exerts a certain embedment effect on the ground floor, imposing constraints on horizontal deformation.
As the earthwork is excavated in layers from top to bottom, the equilibrium of earth pressure around the foundation pit is disrupted, and the horizontal deformation gradually increases. During construction sequences CS4–CS7, the maximum horizontal deformation occurs at the roof of Building B, with a value of −0.723 mm.
In sequence CS8, the maximum horizontal deformation occurs at the roof of Building C, with a value of 0.929 mm.
As can be seen from the results in Figure 47, Figure 48, Figure 49, Figure 50 and Figure 51, the horizontal deformation rate of the adjacent building structure exhibits a specific pattern with changes in building height. During construction, the horizontal deformation at the building’s base increases rapidly during the dewatering stage, after which the deformation rate slows down. All horizontal displacements are directed toward the inside of the foundation pit. With increasing floor height, both the horizontal deformation magnitude and deformation rate increase. With the construction of the middle slab and basement slab of the metro station, the two relatively taller towers (Buildings B and C) begin to exhibit horizontal deformation directed away from the inside of the foundation pit. This indicates that the construction of the station slabs provides horizontal constraints to the support structure, reducing the deformation of the support structure toward the inside of the foundation pit, thereby altering the combined action of the surrounding soil and the tower foundations.
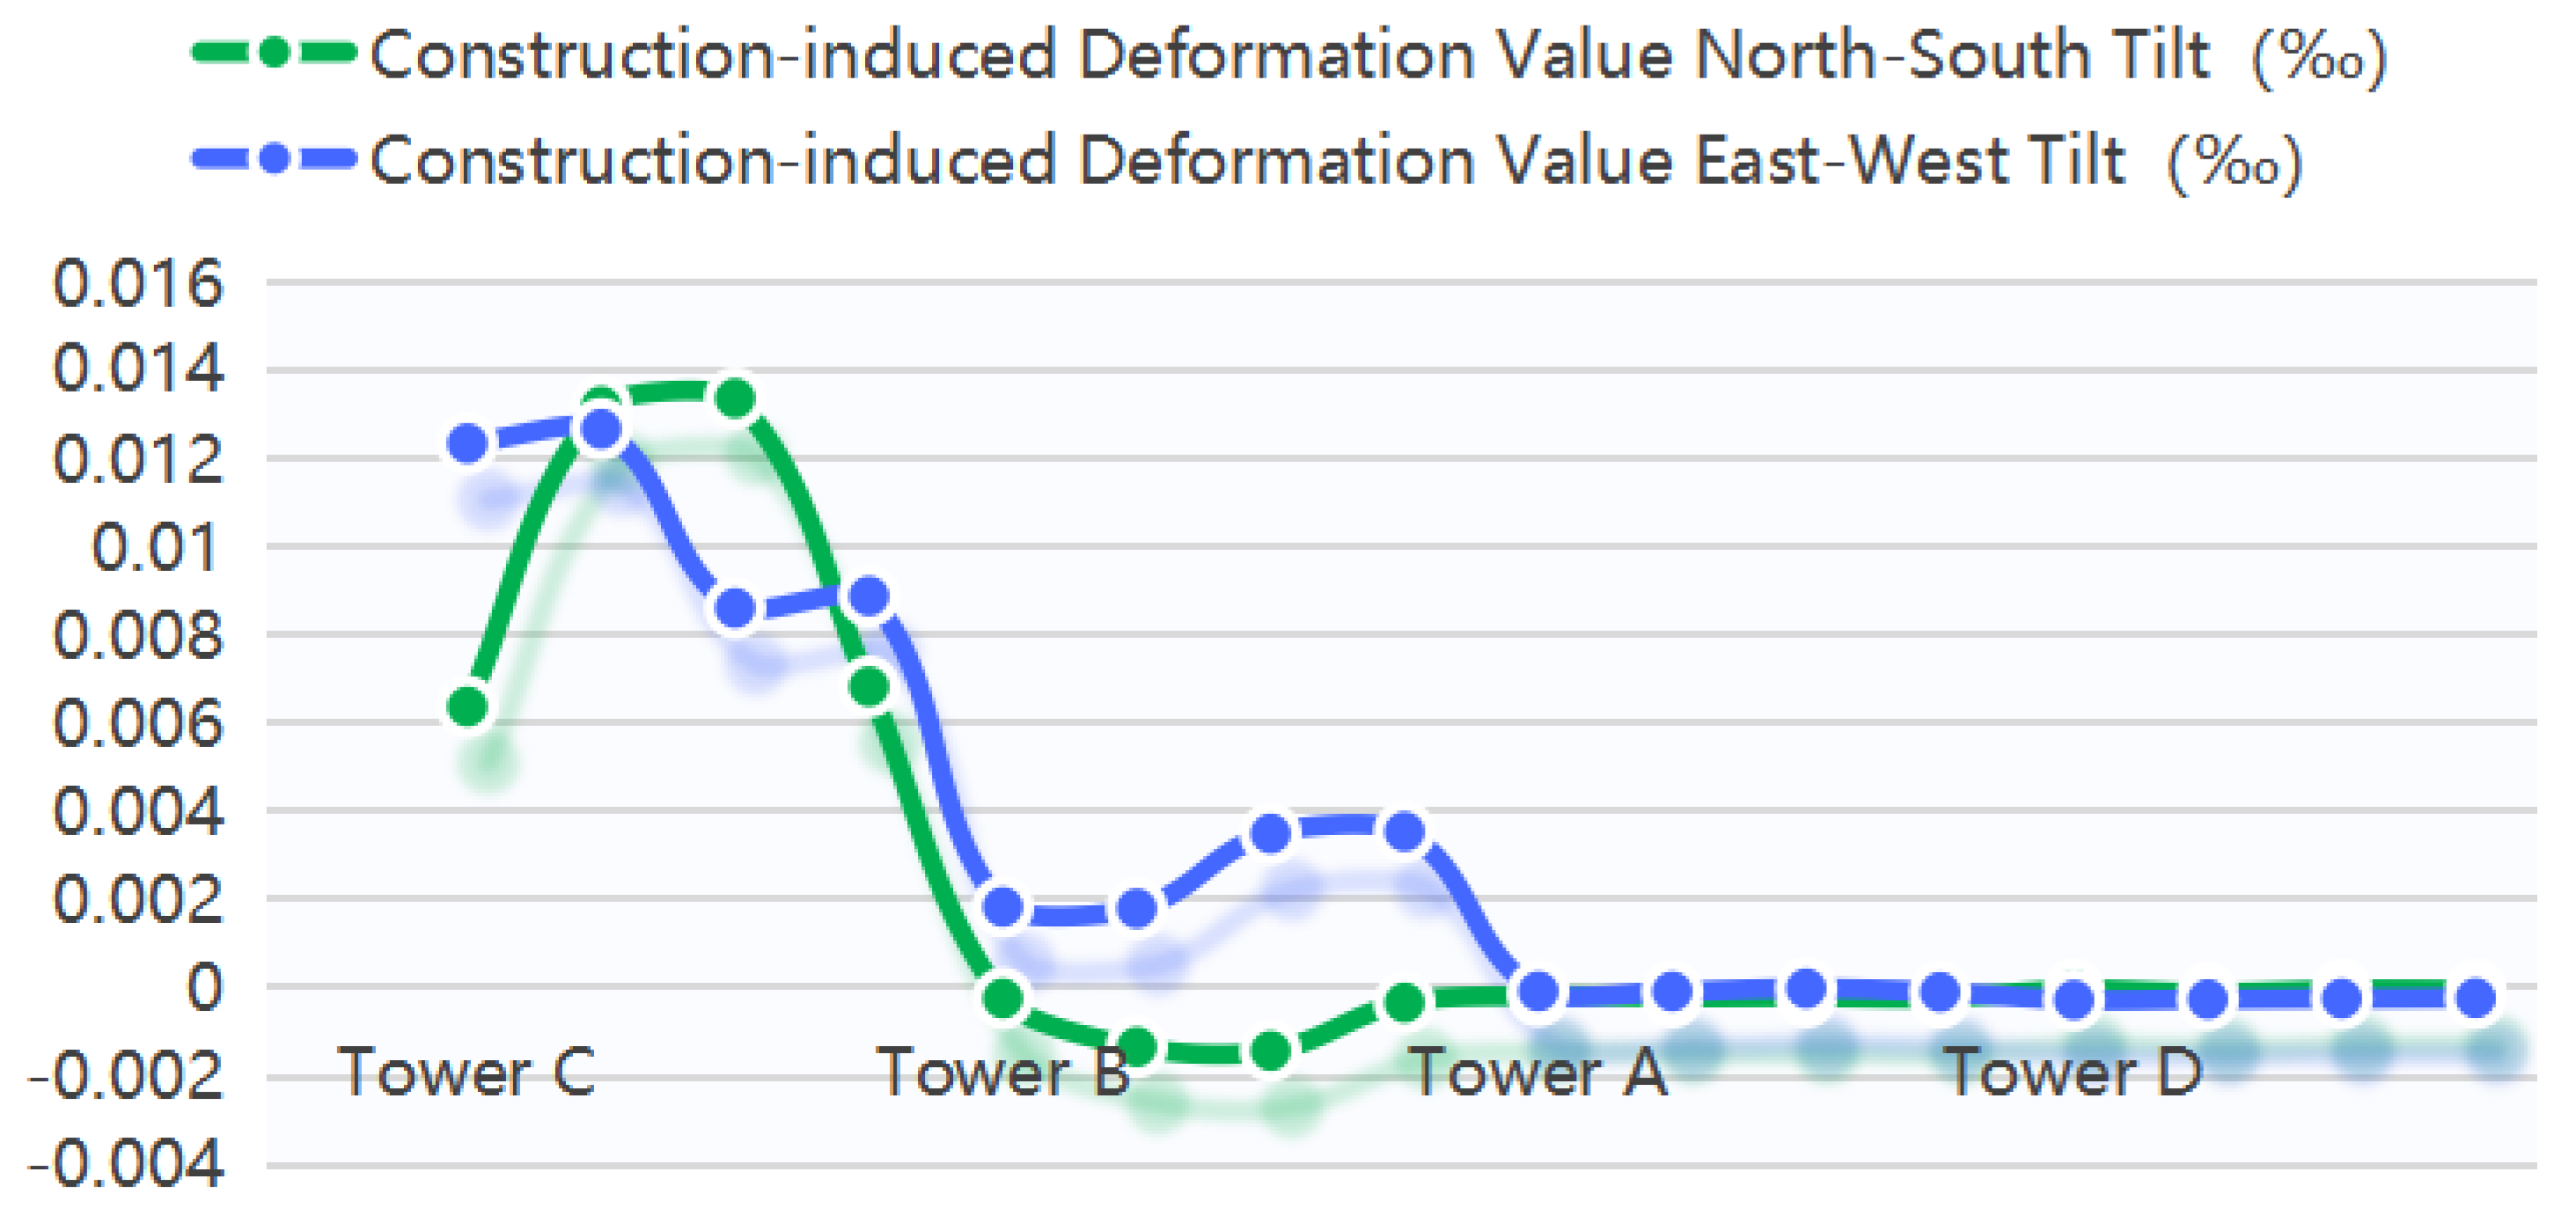
Extracted the horizontal deformation values of key nodes at construction sequence CS8, with node distribution shown in Figure 15; the construction-induced deformation values are listed in Figure 52.
Construction-induced tilt occurs at the roof of Building C, with a larger north-south tilt rate of 0.0134‰. Based on the relative position between the foundation pit and the buildings, the maximum tilt rate occurs on the side along the foundation pit direction and at Building C, which has the highest building height among the towers. Results show that the farther a tower is from the foundation pit, the smaller its tilt rate. Overall, the cover-and-cut top-down method has minimal impact on the tilt rate of adjacent buildings, with all values within the limitation range.

12. Results

According to on-site monitoring and appraisal, the overall current status of existing adjacent building structures is good. Based on the status monitoring and appraisal results of the existing structures, this study conducts three-dimensional numerical simulations using Midas GTS NX [24] to systematically analyze the horizontal displacement of the support structure, settlement of surrounding soil, horizontal displacement of surrounding soil, vertical deformation of adjacent buildings, horizontal deformation patterns of adjacent buildings, and building tilting under various construction conditions of the cover-and-cut top-down method for metro projects. The main research achievements are summarized as follows:
  • The horizontal displacement of the support structure gradually increases with soil excavation under each construction condition, with the displacement direction all toward the inner side of the foundation pit. The overall horizontal displacement is small [25], and the displacement curve shows a “stepped” pattern. Along the excavation depth direction, it generally exhibits a trend of first increasing, then decreasing, and then increasing again, with the maximum horizontal displacement occurring at CS8;
  • The ground surface settlement curve is roughly “V-shaped” in distribution, with a steeper slope within the range of 0.34 He, followed by a gradual decrease, and the area beyond 1.73 He is almost unaffected by excavation, which is highly consistent with the influence range of ground surface settlement;
  • The overall horizontal displacement of the ground surface increases with the increase in excavation depth, with a higher deformation rate during dewatering, followed by a decrease in deformation rate. The horizontal displacement of the ground surface perpendicular to the foundation pit is generally consistent with that along the foundation pit direction, but the horizontal displacement perpendicular to the foundation pit is greater than that along the foundation pit direction;
  • With the progression of construction sequences, the settlement curve of adjacent buildings exhibits a parabola-like form with initial uplift followed by subsidence. The settlement magnitude of buildings decreases with increasing distance from the foundation pit, and the main influence zone of building settlement coincides with that of ground surface settlement;
  • The cover-and-cut top-down method has minimal impact on the tilt rate of adjacent buildings, with all values within the allowable limits. The tilt rates comply with the relevant provisions in the Code for Design of Building Foundation (GB50007-2011) [23], which stipulates that the overall tilt rate of multi-story and high-rise buildings shall not exceed 2.5‰.
Based on the summarized deformation laws of top-down construction, the following innovative and actionable recommendations are proposed for engineering practice and design optimization:
1.
Dynamically adjust the stiffness of supporting systems and depth-dependent displacement characteristics. In the pre-bottom slab stage, strengthen the stiffness of the middle section of retaining structures to suppress the initial displacement growth. In the post-bottom slab stage, reduce redundant stiffness in the lower section of retaining structures (where displacement tends to decrease) to balance structural safety and construction economy.
2.
Based on the predicted deformation values of the existing structures and considering a certain safety margin, the control indicators for the existing structures are determined by integrating the following factors: the predicted values from three-dimensional finite element calculation and simulation; the deformation control requirements for buildings specified in the technical standard for monitoring measurement of urban rail transit engineering (DB22/T 5020-2019) [19] and the Code for Design of Building Foundations (GB 50007-2011) [23]; the allowable deformation values corresponding to the ultimate limit state (ULS) and serviceability limit state (SLS); a certain safety factor incorporated based on the predicted deformation values; and experience from other similar projects. The suggested control values are presented in Table 5.
3.
Divide the construction area into three zones based on the settlement influence scope and implement targeted measures. In the core influence zone (≤0.34 He), the hydraulic gradient is controlled to reduce soil consolidation settlement and constrain lateral soil displacement. In the transition zone (0.34 He–1.73 He), conventional supports are combined with waterproof curtains, and deformation monitoring data are linked to dewatering intensity. In the unaffected zone (>1.73 He), protection measures are simplified to optimize construction efficiency.
4.
Based on the quantified influence scope, a zoned synergistic mechanism that integrates real-time monitoring data with design parameters is established.

Author Contributions

Conceptualization, X.Z.; Methodology, X.Z.; Software, X.S.; Validation, D.Z.; Formal Analysis, X.Z.; Investigation, X.G.; Resources, D.Z.; Data Curation, Y.Z.; Writing—Original Draft, X.Z.; Writing—Review and Editing, D.Z.; Visualization, S.W.; Supervision, D.Z.; Project Administration, D.Z. All authors have read and agreed to the published version of the manuscript.

Funding

This research received no external funding.

Data Availability Statement

The data presented in this study are available on request from the corresponding author. The data are not publicly available due to [The engineering project data have not been authorized for public release].

Acknowledgments

The authors thank John Doe for technical assistance.

Conflicts of Interest

The authors declare no conflict of interest.

References

  1. Ralph, B.P. Deep excavation and tunneling in soft ground. In Proceedings of the 7th International Conference on Soil Mechanics and Foundation Engineering, State-of-the-Art-Volume, Mexico City, Mexico, 25–29 August 1969; pp. 225–290. [Google Scholar]
  2. Ou, C.-Y. Building response and ground movements induced by a deepexcavation. Geotechnique 2000, 50, 209–220. [Google Scholar] [CrossRef]
  3. Finno, R.J. Response of Building Adjacent to Stiff Excavation Support System in Soft Clay. J. Perform. Constr. Facil. 2001, 16, 10–20. [Google Scholar] [CrossRef]
  4. Son, M.; Cording, E.J. Responses of Buildings with Different Structural Types to Excavation-Induced Ground Settlements. J. Geotech. Geoenvironmental Eng. 2011, 137, 323–333. [Google Scholar] [CrossRef]
  5. Mair, R.J.; Bracegirdle, A. Subsurface settlement profiles above tunnels in clays. Gkotechnique 1993, 43, 315–320. [Google Scholar] [CrossRef]
  6. Bryson, L.S.; Kotheimer, M.J. Cracking in Walls of a Building Adjacent to a Deep Excavation. J. Perform. Constr. Facil. 2011, 25, 491–503. [Google Scholar] [CrossRef]
  7. Konnov, N.N.A. Settlement prediction for protected buildings nearby deep. In Proceedings of the Materials Science and Engineering, Moscow, Russia, 25–27 April 2018; Volume 365. [Google Scholar]
  8. Tan, Y.; Huang, R.; Kang, Z.; Bin, W. Covered Semi-Top-Down Excavation of Subway Station Surrounded by Closely Spaced Buildings in Downtown Shanghai: Building Response. J. Perform. Constr. Facil. 2016, 30, 04016040. [Google Scholar] [CrossRef]
  9. JGJ/T 23-2011; Technical Specification for Inspecting of Concrete Compressive Strength by Rebound Method. China Architecture & Building Press: Beijing, China, 2011.
  10. GB/T 50344-2019; Technical Standard for Inspection of Building Structure. China Architecture & Building Press: Beijing, China, 2019.
  11. JGJ/T 152-2019; Technical Standard for Test of Reinforcing Steel Bar in Concrete. China Architecture & Building Press: Beijing, China, 2019.
  12. GB 50018-2021; General Code for Engineering Survey. China Architecture & Building Press: Beijing, China, 2021.
  13. GB 50292-2015; Standard Forappraisal of Reliability of Civil Buildings. China Architecture & Building Press: Beijing, China, 2015.
  14. Finno, R.J.; Voss Jr, F.T.; Rossow, E.; Blackburn, J.T. Evaluating Damage Potential in Buildings Affected by Excavations. J. Geotech. Geoenvironmental Eng. 2005, 131, 1199–1210. [Google Scholar] [CrossRef]
  15. Whittle, A.J.; Corral, G.; Jen, L.C.; Rawnsley, R.P. Prediction and Performance of Deep Excavations for Courthouse Station, Boston. J. Geotech. Geoenvironmental Eng. 2015, 141, 04014123. [Google Scholar] [CrossRef]
  16. Ahmad, M.; Ray, R. Modelling of the Torsional Simple Shear Test with Randomized Tresca Model Properties in Midas GTS NX. Geotech. Geol. Eng. 2023, 41, 1937–1946. [Google Scholar] [CrossRef]
  17. Dong Heping, D.J.; Xiaolei, W. Numerical analysis of secant pile supporting deep foundation pit based on ABAQUS. J. Lanzhou Univ. Technol. 2024, 50, 121–128. [Google Scholar]
  18. Abbo, A.J.; Lyamin, A.V.; Sloan, S.W.; Hambleton, J.P. A C2 continuous approximation to the Mohr–Coulomb yield surface. Int. J. Solids Struct. 2011, 48, 3001–3010. [Google Scholar] [CrossRef]
  19. DB22/T 5020-2019; Technical Standard for Monitoring Measurement of Urban Rail Transit Engineering. Jilin Provincial Department of Housing and Urban Rural Development: Jilin, China, 2019.
  20. Wang, Y. Supporting Design and Numerical Simulation Analysis of A Deep Foundation Pit with Combined Method in Changchun. Master’s Thesis, Changchun Institute of Technology, Changchun, China, 2023. [Google Scholar]
  21. He, W.; Kong, X.; Tang, L.; Chen, W.; Hu, W.; Chen, G. A Preliminary Study on Mitigation Techniques for 3D Deformation of Adjacent Buildings Induced by Tunnelling in Water-Rich Strata: A Case. Symmetry 2024, 16, 1339. [Google Scholar] [CrossRef]
  22. DG/TJ 08-61-2018; Technical Code for Excavation Engineering. Tongji University Press: Shanghai, China, 2018.
  23. GB 50007-2011; Code for Design of Building Foundations. China Architecture & Building Press: Beijing, China, 2011.
  24. Wang, H.T. Numerical Simulation Technology and Engineering Applications of MIDAS GTS NX, 2nd ed.; Dalian University of Technology Press: Dalian, China, 2020. [Google Scholar]
  25. JGJ 120-2012; Technical Specification for Retaining and Protection of Building Foundation Excavations. China Architecture & Building Press: Beijing, China, 2012.
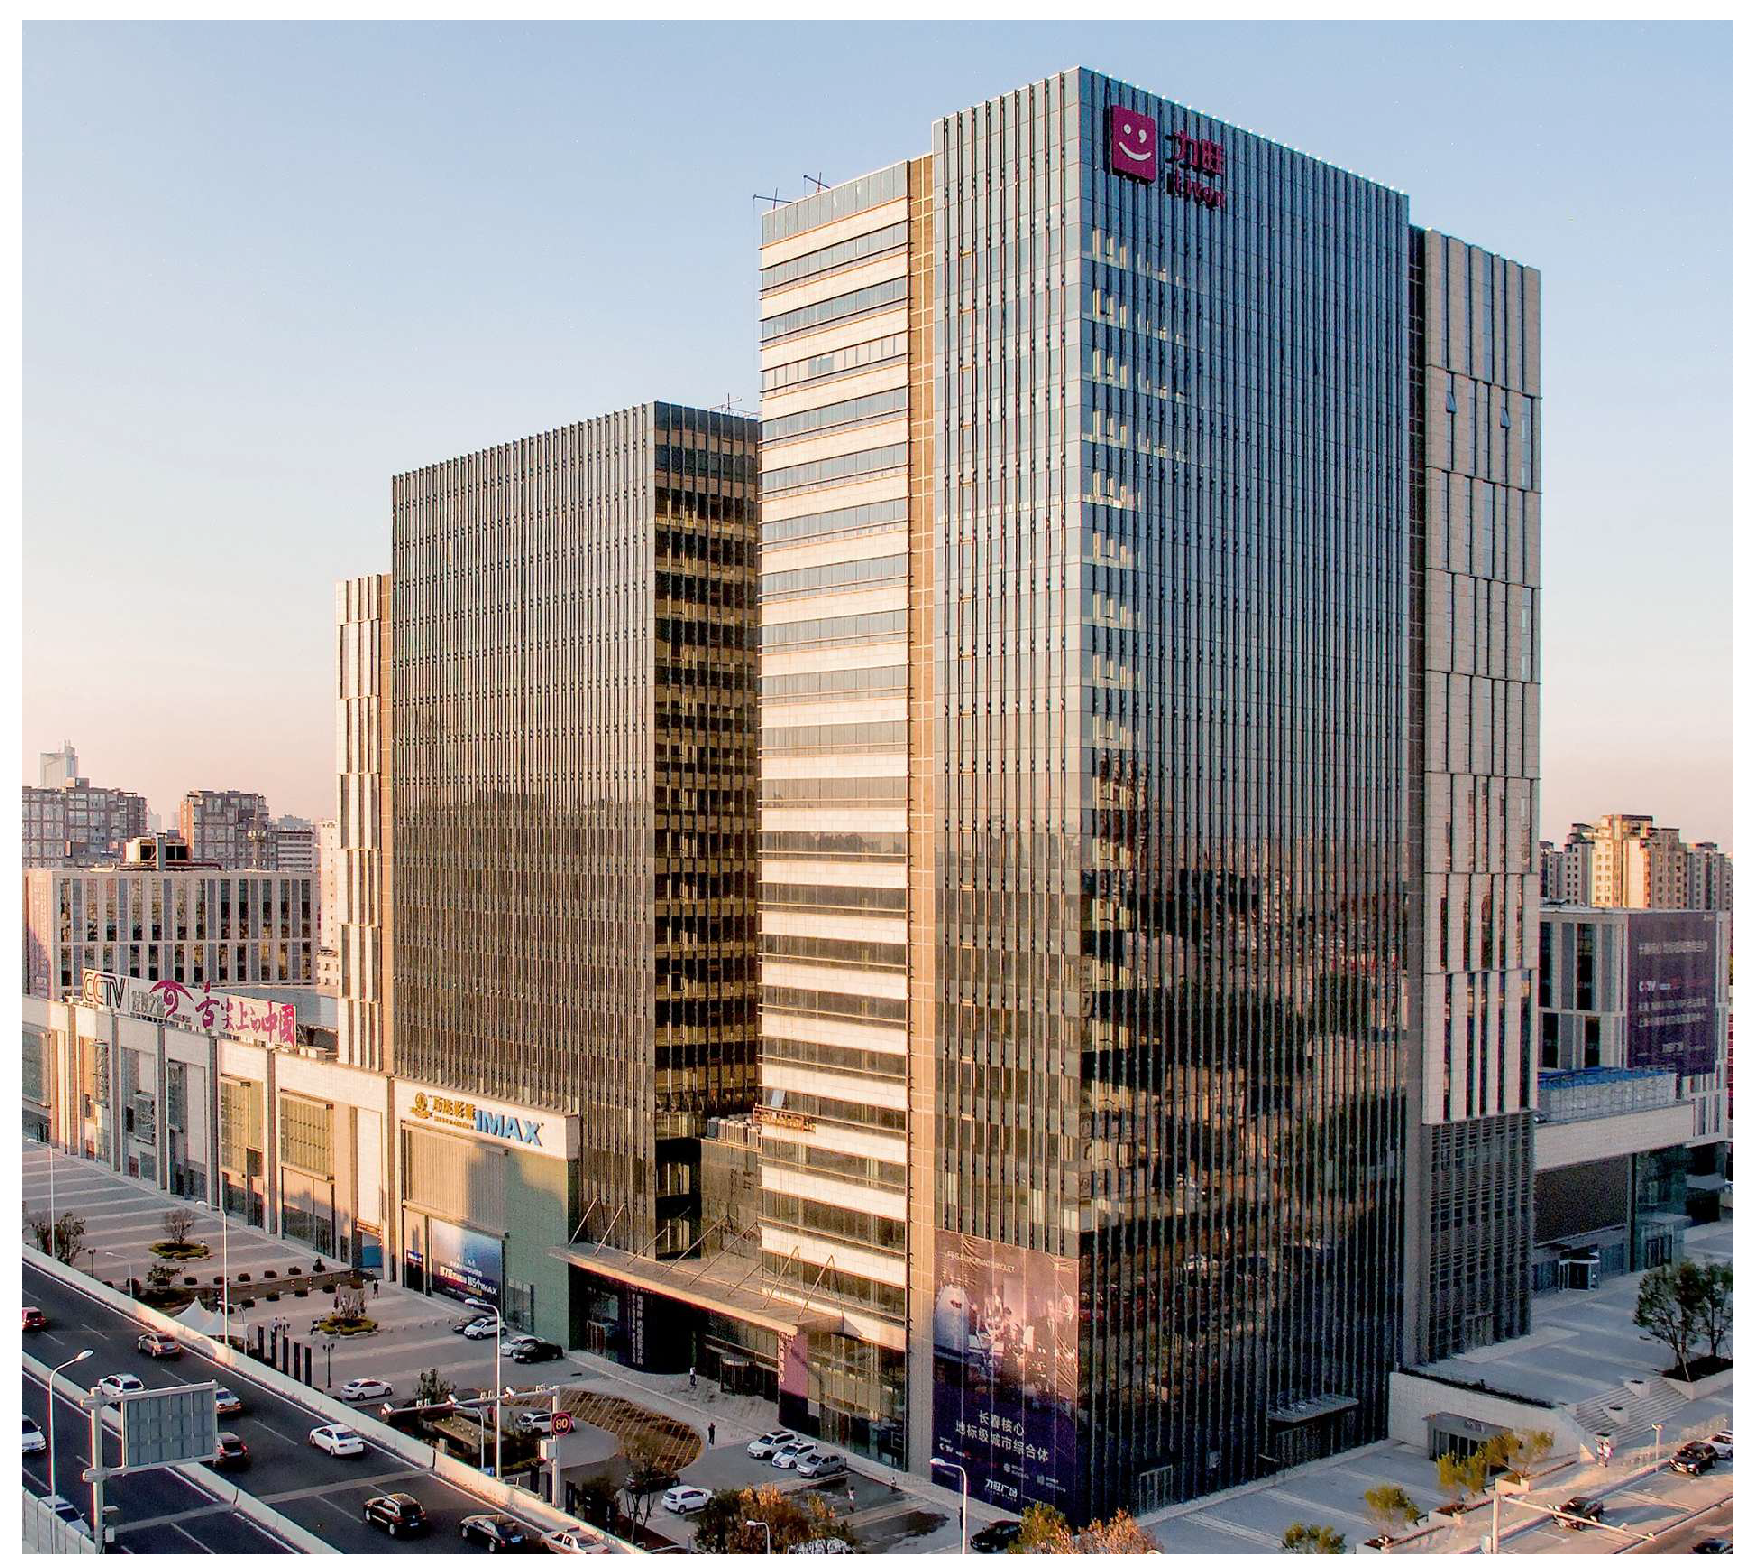
Figure 1. Photo of adjacent buildings.
Buildings 15 04149 g001
Figure 2. Plan View of relative positions.
Buildings 15 04149 g002
Figure 3. Relative position relationship.
Buildings 15 04149 g003
Figure 4. The on-site surrounding environment of the foundation pit.
Buildings 15 04149 g004
Figure 5. Schematic diagram of podium zoning.
Buildings 15 04149 g005
Figure 6. Schematic diagram of towers.
Buildings 15 04149 g006
Figure 7. West exterior view.
Buildings 15 04149 g007
Figure 8. North exterior view.
Buildings 15 04149 g008
Figure 9. South exterior view.
Buildings 15 04149 g009
Figure 10. Level 2 exterior view.
Buildings 15 04149 g010
Figure 11. Level 1 Exterior View.
Buildings 15 04149 g011
Figure 12. Internal conditions of the standard floor.
Buildings 15 04149 g012
Figure 13. Layout of measurement points.
Buildings 15 04149 g013
Figure 14. Three-dimensional soil-structure model.
Buildings 15 04149 g014
Figure 15. Layout plan of monitoring points.
Buildings 15 04149 g015
Figure 16. Horizontal displacements of pile heads on the side adjacent to the building under various working conditions.
Buildings 15 04149 g016
Figure 17. Horizontal displacement diagram of CS3.
Buildings 15 04149 g017
Figure 18. Horizontal displacement diagram of CS4.
Buildings 15 04149 g018
Figure 19. Horizontal displacement diagram of CS5.
Buildings 15 04149 g019
Figure 20. Horizontal displacement diagram of CS7.
Buildings 15 04149 g020
Figure 21. Horizontal displacement diagram of CS8.
Buildings 15 04149 g021
Figure 22. Surface settlement curves of Node B4.
Buildings 15 04149 g022
Figure 23. Surface settlement curves of Node B5.
Buildings 15 04149 g023
Figure 24. Surface settlement curves of Node B6.
Buildings 15 04149 g024
Figure 25. Surface settlement curves of Node B7.
Buildings 15 04149 g025
Figure 26. Comparative diagram of settlement curves.
Buildings 15 04149 g026
Figure 27. Influence range diagram of surface settlement at B7.
Buildings 15 04149 g027
Figure 28. Surface settlement contour map of CS3.
Buildings 15 04149 g028
Figure 29. Surface settlement contour map of CS4.
Buildings 15 04149 g029
Figure 30. Surface settlement contour map of CS5.
Buildings 15 04149 g030
Figure 31. Surface settlement contour map of CS7.
Buildings 15 04149 g031
Figure 32. Surface settlement contour map of CS8.
Buildings 15 04149 g032
Figure 33. Cloud map of X-direction horizontal deformation of the ground surface during CS3.
Buildings 15 04149 g033
Figure 34. Cloud map of X-direction horizontal deformation of the ground surface during CS4.
Buildings 15 04149 g034
Figure 35. Cloud map of X-direction horizontal deformation of the ground surface during CS5.
Buildings 15 04149 g035
Figure 36. Cloud map of X-direction horizontal deformation of the ground surface during CS7.
Buildings 15 04149 g036
Figure 37. Cloud map of X-direction horizontal deformation of the ground surface during CS8.
Buildings 15 04149 g037
Figure 38. Cloud map of vertical deformation of adjacent buildings during CS3.
Buildings 15 04149 g038
Figure 39. Cloud map of vertical deformation of adjacent buildings during CS4.
Buildings 15 04149 g039
Figure 40. Cloud map of vertical deformation of adjacent buildings during CS5.
Buildings 15 04149 g040
Figure 41. Cloud map of vertical deformation of adjacent buildings during CS7.
Buildings 15 04149 g041
Figure 42. Cloud map of vertical deformation of adjacent buildings during CS8.
Buildings 15 04149 g042
Figure 43. Building settlement curves of each monitoring point along the foundation pit direction.
Buildings 15 04149 g043
Figure 44. Building settlement curves of each monitoring point along the vertical direction of the foundation pit.
Buildings 15 04149 g044
Figure 45. Building settlement curves of remaining monitoring points.
Buildings 15 04149 g045
Figure 46. Foundation settlement under various processes.
Buildings 15 04149 g046
Figure 47. Horizontal deformation cloud map of the building in the X-direction during CS3.
Buildings 15 04149 g047
Figure 48. Horizontal deformation cloud map of the building in the X-direction during CS4.
Buildings 15 04149 g048
Figure 49. Horizontal deformation cloud map of the building in the X-direction during CS5.
Buildings 15 04149 g049
Figure 50. Horizontal deformation cloud map of the building in the X-direction during CS7.
Buildings 15 04149 g050
Figure 51. Horizontal deformation cloud map of the building in the X-direction during CS8.
Buildings 15 04149 g051
Figure 52. Tilt deformation values: positive values denote northward and eastward directions.
Buildings 15 04149 g052
Table 1. Parameters of soil layers.
Soil
Layer Name
Soil Layer
Thickness (m)
Average Water Content (%)Natural Density (g/cm3)Specific GravityVoid RatioCompression Modulus (MPa)Internal Friction Angle
(°)
Cohesion
Miscellaneous Fill Layer ①10.70~3.0
Silty Clay Layer ②29.50~16.6026.41.972.720.7516.021427
Silty Clay Layer ②30.80~9.0024.51.992.740.7129.881431
Clay Layer ②51.10~4.0024.61.992.740.71813.971433
Soil Layer Nameϒ (kN/m3)Liquid Limit (%)Plastic Limit (%)Liquidity
Index
Plasticity
Index
Ψ (°)Es
Silty Clay Layer ②218.933.319.20.7414.3184.04
Silty Clay Layer ②318.733.219.10.9413.9192.89
Clay Layer ②519.537.522.20.1518.42014.35
The subscripts and circled numbers in the table have no specific meaning and are only used to distinguish different soil layer names.
Table 2. Characteristics of groundwater.
Hydrogeological UnitGroundwater ClassificationStable Water LevelObservation TimeAquifer
Burial Depth (m)Elevation (m)
IUnconfined Groundwater (Two)2.00~3.50224.28~229.532020.5~2020.8Clayey Soil, Weathered Rock
Table 3. Annual maximum water levels table.
Time of Water Level MeasurementMaximum Groundwater Level Conditions
1956Burial Depth of 1 to 3 Meters Below Ground Surface
recent 3–5 yearsBurial Depth of 2 to 5 Meters Below Ground Surface
current investigationmaximum water level elevation: 229.53 m
Table 4. Construction Sequence Table.
Simulated Construction Stage Description
CS1Generate the initial stress field, construct the building structure, and eliminate the initial displacement field
CS2Reset displacement
CS3Construction of retaining structure
CS4Dewatering construction
CS5Excavation of the cover excavation section to the roof level and construction of the roof slab
CS6Backfilling
CS7Excavation of the cover excavation section to the middle plate level and construction of the middle plate
CS8Excavation of the cover excavation section to the middle plate level and construction of the bottom plate
CS9Water level restoration
Table 5. Suggested control values.
Existing StructuresItemSuggested Control Values
Adjacent buildingsvertical displacement5.0 mm
overall inclination0.20%
deformation rate1 mm/d
Ground surface settlement20.0 mm
Ground surface horizontal displacement20.0 mm
Horizontal displacement of retaining piles18.0 mm
Disclaimer/Publisher’s Note: The statements, opinions and data contained in all publications are solely those of the individual author(s) and contributor(s) and not of MDPI and/or the editor(s). MDPI and/or the editor(s) disclaim responsibility for any injury to people or property resulting from any ideas, methods, instructions or products referred to in the content.