Abstract
Shading system design is a complex, multi-objective optimization problem that requires balancing interdependent economic, environmental, social, energy, architectural, and daylighting factors, while also integrating decision-makers’ preferences and user satisfaction. This study aims to develop and validate a hybrid decision-support framework that addresses both quantitative and qualitative data under uncertainty to improve shading system performance. This paper proposes a novel framework that integrates fuzzy logic with multi-criteria decision-making (MCDM) methods. The Fuzzy Analytic Hierarchy Process (Fuzzy-AHP) is employed for criteria prioritization, whereas the Fuzzy Quality Function Deployment (Fuzzy-QFD) translates customer needs into technical requirements. Two evolutionary algorithms, the Single-Objective Genetic Algorithm (SOGA) and the Non-Dominated Sorting Genetic Algorithm II (NSGA-II), were implemented and compared. The framework was validated through its application to an existing educational building in Mansoura, Egypt, evaluating both fixed and dynamic shading solutions. The results indicate that the proposed framework effectively translates customer requirements into design criteria and accurately identifies optimal shading solutions, with SOGA outperforming NSGA-II in optimization performance, while dynamic shading systems significantly enhance glare control and visual comfort, thereby confirming the framework’s efficiency in managing interdependent objectives under uncertain conditions. Overall, the framework provides a robust and systematic methodology for incorporating customer satisfaction into shading design and advancing sustainable building performance.
1. Introduction
With the rapid advancement of technology, expectations and requirements for building façade performance have grown significantly. As these demands increase, the process of selecting and designing façade components and systems has become increasingly complex. Shading systems are essential elements of building façades, significantly influencing thermal performance, energy consumption, and indoor comfort [1]. The impacts of climate change and global warming have resulted in higher external temperatures, thereby driving an increased demand for air conditioning in existing buildings. This surge in demand necessitates the integration of efficient Heating, Ventilation, and Air Conditioning (HVAC) systems to maintain adequate thermal comfort, which consequently leads to higher energy consumption [2].
This challenge is especially significant in regions with hot climates. Hot climates, such as that of Egypt, are likely to complicate the sustainability goal, as the cooling load typically dominates year-round energy use, and design decisions such as orientation, glazing ratios, and façade treatments can greatly affect overall energy efficiency [3,4]. In Egypt, educational institutions are adopting policies to promote sustainable energy practices within the campus environment, in response to their rapid growth, with more than 60,000 pre-university schools and over 100 higher education institutions serving millions of students [5]. This growth is intensifying resource demands, particularly for lighting, ventilation, heating, and cooling. The educational environment strongly influences students’ academic performance, behavior, and overall well-being, making supportive and inclusive campuses essential [6,7]. Therefore, recent studies emphasize not only aligning university conditions with student expectations but also integrating elements such as sun-shading devices [8]. Because of the long duration of use and fluctuations in seasonal schedules, buildings at higher education institutions require precise management of their indoor temperatures to maintain air quality, as well as thermal and visual comfort [9]. The mixed-mode nature of classrooms, offices, laboratories, and social spaces, along with large internal heat gains from people, equipment, and artificial lighting, results in higher education buildings consuming almost four times as much energy per user as comparable residential buildings [10,11]. Poor design can result in increased energy consumption and/or discomfort, which in turn may influence health and academic performance. These realities highlight that sustainable campus design cannot be evaluated solely through technical performance measures; broader qualitative dimensions of the built environment must also be considered.
Given these multifaceted challenges, sustainability in educational buildings extends beyond numerical targets. Sole reliance on quantitative metrics such as energy savings and cost overlooks essential qualitative aspects such as aesthetics, privacy, and ambiance, which introduce uncertainty and are difficult to quantify. Furthermore, interrelated design objectives complicate decision-making, requiring architects to balance technical performance with occupant expectations. To address these complexities, effective decision-support systems are essential. Their primary objective is to identify shading solutions that meet both technical and non-technical requirements while achieving an optimal balance between conflicting criteria and accounting for uncertainty. The emergence of smart buildings demands the integration of advanced management systems that enhance energy performance while ensuring optimal comfort for occupants and meeting their needs.
The remaining sections of the paper are structured as follows: Section 2 presents the literature review, Section 3 outlines the proposed methodology, Section 4 describes the considered case study and its current state, Section 5 provides a comprehensive overview of the findings along with a detailed analysis, and Section 6 summarizes the key insights and concluding remarks.
2. Literature Review
Solar shading systems are an effective means of lowering cooling energy demand while enhancing daylight conditions in indoor environments [12]. These systems, which include external, internal, and between-glass configurations, can be either fixed or operable to adapt to varying solar conditions [13,14]. The criteria most commonly employed in recent shading research can be grouped into three main categories: environmental performance (including visual comfort, energy efficiency, and thermal comfort) [15,16], economic valuation [17], and aesthetic value [18]. For instance, Al Saadi et al. [19] applied multi-objective optimization (MOO) using genetic algorithms in MATLAB to minimize energy consumption and life-cycle cost for a fixed shading system. Samadi et al. [20] optimized a kinetic shading system in Grasshopper using Galapagos, focusing solely on maximizing Useful Daylight Illuminance (UDI). Noorzai et al. [21] used Octopus in Grasshopper to optimize fixed vertical shading devices integrated with photovoltaics, targeting energy savings and improved thermal and visual comfort. Khani et al. [15] applied MOO to optimize classroom layouts with fixed shading, aiming to reduce energy use and enhance comfort. Similarly, Wang et al. [16] employed a multi-objective genetic algorithm (MOGA) to optimize fixed shading based on outdoor light, thermal comfort, UDI, energy use, and visual perception in a project in Northwest China. Chen et al. [22] developed an adaptive façade design using a parametric platform that integrated simulation, clustering, artificial neural network (ANN) regression, and Octopus to optimize four objectives: UDI, quality of view (QV), building solar radiation (BSR), and photovoltaic generation (PVG). When paired with building automation technologies, such systems offer considerable potential for energy savings [23]. Additionally, smart shading solutions contribute to improved occupant comfort by supporting optimal thermal and visual conditions [24,25].
While shading systems provide recognized energy benefits, their design and selection involve complex trade-offs among energy efficiency, cost, aesthetics, and structural feasibility [26]. The process is further shaped by the views of stakeholders and occupants [27]. In response to increasing demands for healthier indoor environments, a human-centered approach is gaining growing importance, incorporating occupant-related criteria into building investment decisions and moving beyond conventional techno-economic evaluations [1].
Multi-criteria decision-making (MCDM) provides a structured framework for evaluating and prioritizing diverse design criteria, enabling designers to make informed decisions that align with project goals [12]. Consequently, the assessment and identification of the optimal choice for building and shading design involve several variables within the decision-making process [27]. MCDM can prioritize objectives (criteria) and clearly identify the best design [28]. Several studies have used parametric simulations combined with MCDM methods to select optimal shading designs. Yamin Garretón et al. [29] used a ternary plot to compare nine shading fabrics. Kangazian et al. [26] analyzed 155 shading designs across different orientations in cold-desert climates, selecting optimal designs using Multi-Attribute Utility Theory (MAUT). Le et al. [30] applied the Analytic Hierarchy Process (AHP) and the Technique for Order Preference by Similarity to Ideal Solution (TOPSIS) to choose the best adaptive façade design from 7680 options based on EUI, PPD, UDI, and VF. Stamatakis et al. [31] evaluated 13 PV-integrated shading systems using the Preference Ranking Organization Method for Enrichment Evaluation (PROMETHEE), considering energy, comfort, and visual factors. Pinto et al. [1] assessed 12 shading alternatives with EnergyPlus simulations and PROMETHEE II, factoring in energy, environmental, economic, and social criteria. Romani et al. [17] used polynomial regression and compared three MCDM techniques to evaluate economic and comfort metrics. However, these approaches often rely on a fixed set of design options and are limited by high computational demands. To address this, more comprehensive methods incorporating continuous design variables and MOO are needed [12]. Li et al. [32] combined parametric simulation with multi-objective optimization using SPEA-II and MCDM methods, including TOPSIS and a hybrid weighting approach. This methodology was employed to identify optimal solutions by considering energy efficiency, daylight performance, and quality of view. However, the optimization was conducted within simulation software, which is typically computationally expensive. Gaber et al. [12] integrated parametric modeling and metamodeling techniques using various machine-learning regression algorithms (ANN, Support Vector Machine (SVM), Decision Tree (DT), Ensemble, and Gaussian Process Regression (GPR)) for multi-objective optimization with NSGA-II. They applied MCDM methods (AHP-TOPSIS and Entropy-TOPSIS) through a user-friendly tool to assist in the design of fixed shading systems during the initial design phases. Gaber et al. [18] employed a MOGA to support the design and comparison of perforated shading systems and vertical fins. They also applied the Analytic Network Process (ANP) to systematically weight the different performance criteria, ensuring a balanced evaluation of the design options.
As summarized in Table 1, recent studies have applied various methods to the design of shading systems.

Table 1.
The sustainable design criteria and MCDM methods that were used in previous studies.
Research Gaps and Aim of the Paper
- Limited Consideration of Customer Satisfaction: Customer needs and preferences are rarely integrated into the shading system design process. These preferences often involve qualitative, non-technical aspects and uncertainties that cannot be easily quantified. Addressing these uncertainties is crucial to ensuring a comprehensive and user-centered design approach. Incorporating these qualitative requirements into the design and selection process requires a collaborative approach between the architect and the client. It is insufficient to rely solely on technical analysis or industry standards; the designer must also consider the emotional impact and sensory experience that the design evokes.
- Interdependencies Between Design Criteria: The interrelations among design objectives or criteria can significantly impact the final weighting of each criterion in the optimization process. However, most studies overlook this factor, failing to incorporate relative weights that accurately reflect these interdependencies.
- Focus on Fixed Shading Systems: Existing hybrid approaches predominantly focus on fixed shading systems, neglecting dynamic shading solutions. However, dynamic systems offer greater adaptability and efficiency but are more complex to design and computationally intensive. A comprehensive evaluation of hybrid approaches should include both fixed and dynamic systems to ensure their generalizability.
- Comparison of Multi-Objective Optimization (MOO) Approaches: There are two primary MOO-based optimization strategies: (i) approaches that use MCDM solely for weighting, often utilizing genetic algorithms (GA), and (ii) approaches that rely entirely on MCDM for both weighting and final design selection, mainly using NSGA-II. A comparative analysis of these two methodologies is essential to provide deeper insights into their effectiveness and applicability in shading system design.
Considering these research gaps, the main contributions of this paper are summarized as follows:
- The proposed approach effectively integrates customer requirements, captures the interdependencies among design criteria, and manages uncertainty in the shading system design process using fuzzy logic. It further enables the customization of customer input weights based on building type, supporting the creation of context-specific solutions for both fixed and dynamic shading systems.
- An efficient implementation of the Quality Function Deployment (QFD) methodology is introduced to translate customer needs into quantifiable performance measures. The use of the House of Quality (HOQ) matrix ensures a structured and reliable representation of customer priorities within the design process.
- A comparative analysis is conducted between two key optimization algorithms−the Single-Objective Genetic Algorithm (SOGA) and NSGA-II within the proposed framework. This analysis provides practical guidance for selecting suitable optimization methods in future integrated shading design studies.
3. Methodology
Figure 1 provides an overview of the proposed methodology. Customers first define their requirements in terms of specific factors and rank them based on their preferences following discussions with experts. Experts then evaluate and rank these customer requirements (CRs) using the fuzzy AHP method. Next, the performance measures (PMs) and design variables are determined, and a parametric model is developed based on the case study. After ranking the CRs, fuzzy weights are assigned and incorporated into the Quality Function Deployment (QFD) process, which establishes the relationship between CRs and PMs. In QFD, experts construct two matrices: one to define the interdependencies among PMs and another to link PMs with CRs. QFD then generates fuzzy weights for PMs, which are used in the subsequent design selection stage. Before proceeding with design selection, data from parametric simulations are processed using MATLAB (version 2022b) to develop machine-learning regression models for each PM. These regression models, along with the fuzzy weights of the PMs, are used in two different optimization approaches: NSGA-II with TOPSIS and SOGA. In the NSGA-II approach, an optimal set of solutions is generated, from which the best shading system design is identified using the TOPSIS method. In contrast, the SOGA approach directly determines the optimal design using the fuzzy PM weights and regression models, eliminating the need for the TOPSIS method. A detailed discussion of each stage of the proposed methodology is provided in the following sections.
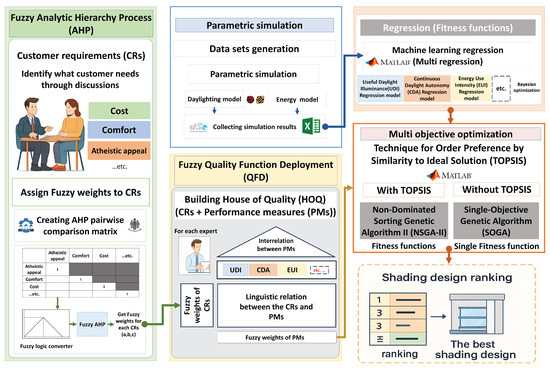
Figure 1.
A flowchart for executing the proposed method.
3.1. Fuzzy Sets
Fuzzy set theory provides a mathematical basis for dealing with uncertainty and vagueness in decision-making by converting qualitative linguistic judgments into quantitative data. Among the various fuzzy number representations, Triangular Fuzzy Numbers (TFNs) are widely used owing to their simplicity and computational efficiency [39].
A fuzzy set defined on a universe of discourse Y is expressed as
where denotes the membership function. The value represents the degree of membership of element y in , where 0, 1, and intermediate values correspond to non-membership, full membership, and partial membership, respectively.
For a TFN , the membership function is given by
Here, , , and denote the lower, middle, and upper bounds, respectively.
Comprehensive discussions of fuzzy set theory and fuzzy arithmetic can be found in Chakraverty et al. [40]. In this study, TFNs are later used to represent expert judgments and criteria weights within the fuzzy-AHP and fuzzy-QFD frameworks.
3.2. Fuzzy-AHP
The Fuzzy-AHP is employed to determine the relative importance of customer requirements (CRs) under uncertainty in expert judgments. By integrating fuzzy set theory with the classical AHP, linguistic comparisons are converted into TFNs, yielding more realistic and tolerant weights for subjective criteria.
- Step 1:
- Formulation of the pairwise comparison matrix.
Through consultations with domain experts, customers identify and rank the CRs using Saaty’s 1–9 scale. The resulting judgment matrix is expressed as
where n is the number of CRs.
- Step 2:
- Fuzzification of judgments.
Each crisp value in is converted into a TFN according to the scale in Table 2, generating a fuzzy judgment matrix .

Table 2.
Conversion scale from Saaty’s 1–9 scale to triangular fuzzy numbers.
- Step 3:
- Computation of fuzzy weights.
For each (), the column product and geometric mean are calculated as
The normalized fuzzy weight vector is .
- Step 4:
- Consistency verification.
The consistency of the middle matrix is checked using
The judgments are considered acceptable when .
- Step 5:
- Adjustment and aggregation.
Adjustment factors are computed as
and the final adjusted fuzzy weight vector is
The above process is repeated for all experts, and the mean fuzzy weights are then aggregated to obtain the collective priority vector for the CRs. More details on Fuzzy-AHP can be found in Huang et al. [41].
In summary, Fuzzy-AHP provides a robust weighting scheme that captures expert uncertainty and serves as the basis for the subsequent multi-criteria decision-making analysis.
3.3. Fuzzy-QFD
The Fuzzy-QFD method integrates the fuzzy-weighted CRs obtained from Fuzzy-AHP with the technical performance measures (PMs) to translate customer expectations into measurable engineering characteristics. This approach enables a systematic prioritization of PMs while effectively capturing both the inherent uncertainty in human judgments and the interdependencies among the PMs.
- Step 1:
- Construction of the Fuzzy House of Quality (HOQ).
Each expert develops a fuzzy House of Quality, as illustrated in Figure 2, consisting of two matrices: (i) , which represents the relationships between CRs (the “WHATs”) and PMs (the “HOWs”); and (ii) , which expresses the interdependencies among PMs in the roof of the HOQ. Linguistic assessments such as *Weak*, *Moderate*, or *Strong* are converted into triangular fuzzy numbers according to Table 3.
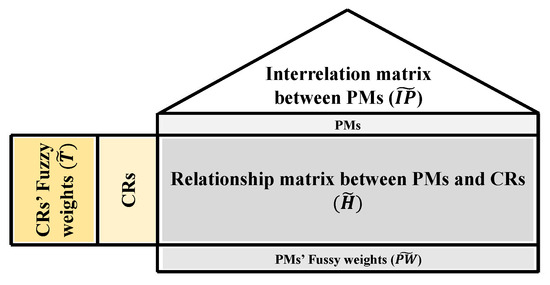
Figure 2.
Fuzzy House of Quality (HOQ) illustrating relationships between customer requirements and performance measures.

Table 3.
Conversion of linguistic evaluations into triangular fuzzy numbers.
- Step 2:
- Derivation of the relative importance of performance measures.
Using the fuzzy weights of CRs obtained from Fuzzy-AHP (), the relative importance of each PM, denoted by , is calculated as
where q is the number of PMs.
- Step 3:
- Incorporation of interdependencies among performance measures.
To account for the mutual influence among PMs, the final fuzzy weights are computed as
The results are then normalized to ensure that .
The aggregated fuzzy weights reflect the overall contribution of each performance measure to customer satisfaction. These weights are subsequently used in the optimization and decision-making stages to guide the evaluation of design alternatives. More details on Fuzzy-QFD can be found in Omar et al. [42].
3.4. Machine Learning
Machine learning is used to build regression models for the optimization process, based on datasets generated from the selected case studies (Section 4). These models are developed using an auto-regressive approach [12]. Four regression algorithms−Ensemble Learning (ENS), Decision Tree (DT), Artificial Neural Network (ANN), and Support Vector Machine (SVM)—are optimized sequentially using Bayesian optimization. The dataset is divided into 15% for testing and 85% for training and validation, with 10-fold cross-validation applied to prevent overfitting. Model performance is evaluated using the Mean Squared Error (MSE) and the coefficient of determination () [12].
where represents the predicted illuminance at time i, denotes the observed or simulated illuminance at time i, is the mean illuminance, and k is the number of data points evaluated.
3.5. Optimization
As previously mentioned, two optimization schemes are employed and compared. The first scheme utilizes NSGA-II [12,34], which requires the application of a multi-criteria decision-making (MCDM) method—specifically, the Technique for Order Preference by Similarity to Ideal Solution (TOPSIS)—to select the optimal design. In contrast, the second scheme employs SOGA [37], which does not rely on an MCDM method for decision-making. A detailed explanation of both schemes is provided below.
3.5.1. NSGA-II
Once the regression models are developed, establishing the relationship between design parameters and PMs, they are converted into mathematical functions. These functions serve as objective (fitness) functions within MATLAB and are used as input for the NSGA-II optimization process. The mathematical formulation of the optimization problem is presented below.
where, represents the ith regression function, is a vector of the design variables , , n is the number of design variables, g is the sign of the optimization function which is 1 for minimizing function and −1 for maximizing function, and m is the number of objectives or the number of PMs.
Solving this optimization problem results in a set of optimal solutions that form the Pareto front. To determine the final design, an MCDM selection method TOPSIS must be used.
3.5.2. Single-Objective Genetic Algorithm (SOGA)
In this case, the regression-based performance models are aggregated into a single weighted fitness function for optimization. Although the original problem involves multiple objectives, the assignment of weights—determined through Fuzzy-AHP and Fuzzy-QFD (see Section 3.2 and Section 3.3)—transforms the formulation into a single-objective optimization problem. This scalarization approach enables the evaluation of different performance criteria within one unified framework.
The optimization problem can be mathematically expressed as
where, denotes the normalized weight assigned to each objective.
The single-objective genetic algorithm (SOGA) searches for the optimal combination of design variables that minimizes the weighted fitness function. The resulting solution corresponds to the best trade-off among all considered objectives under the specified weighting scheme. Unlike NSGA-II, this approach yields a unique optimal design without the need for an additional MCDM step. The integration of Fuzzy-AHP and Fuzzy-QFD provides an objective mechanism for deriving the weighting factors, ensuring that the optimization reflects user preferences and the relative importance of performance criteria.
3.6. Technique for Order of Preference by Similarity to Ideal Solution (TOPSIS)
TOPSIS is applied to rank the Pareto-optimal shading designs obtained from the NSGA-II algorithm. This method identifies the solution closest to the positive ideal and farthest from the negative ideal, using normalized and weighted performance measures (PMs) derived from the Fuzzy-QFD results as mentioned earlier.
- Step 1:
- Formation of the decision matrix.
The decision matrix is constructed using the PM values of all Pareto-optimal solutions. Because the PM weights obtained from the Fuzzy-QFD are represented as TFNs, they are first defuzzified into crisp values and normalized to obtain , as follows:
Here, q is the number of criteria (PMs).
- Step 2:
- Normalization of the decision matrix.
To eliminate the influence of differing scales, each PM is normalized using linear scale transformation. Benefit (high-is-good) criteria use Equation (12), while cost (low-is-good) criteria use Equation (13):
This min–max normalization method ensures that all indicators range between 0 and 1 for fair comparison.
- Step 3:
- Weighted normalization.
Each normalized criterion is multiplied by its corresponding normalized weight to obtain the weighted decision matrix :
- Step 4:
- Determination of ideal and anti-ideal solutions.
The positive ideal () and negative ideal () solutions are defined as
where A is the number of alternative designs.
- Step 5:
- Calculation of separation measures.
The Euclidean distances of each alternative from and are computed as
- Step 6:
- Relative closeness and ranking.
The relative closeness coefficient for each design is calculated by
where higher values indicate better overall performance. The solutions are then ranked in descending order of , and the design with the highest value is identified as the optimal shading configuration.
In summary, TOPSIS integrates the normalized PMs and their corresponding fuzzy-derived weights to provide a transparent and reproducible ranking of Pareto-optimal shading systems. More details on TOPSIS can be found in [43].
3.7. Fixed Shading Approach
For fixed shading systems, the shading design is first simulated, and datasets are collected based on the selected performance metrics (PMs) and design variables. These datasets are then used to train multiple regression algorithms, generating regression models for each PM. The weights for the PMs are determined using the Fuzzy-AHP and Fuzzy-QFD methods. In the optimization process, these regression models and their corresponding weights are utilized in two different approaches:
- SOGA: The weighted sum of the regression functions is used as the objective function, allowing SOGA to directly determine the optimal shading design. The single optimum obtained through SOGA represents the solution corresponding to the selected set of objective weights, reflecting a specific balance among the CRs.
- NSGA-II: The regression models are used as multiple objective functions in NSGA-II, generating a Pareto-optimal set of solutions. Unlike SOGA, NSGA-II reveals the trade-offs among conflicting performance metrics by producing a spectrum of non-dominated solutions. The best design is then selected using the TOPSIS method.
The final shading design, once identified, is implemented as a fixed system that remains in operation throughout the year for the analyzed building. The shading designs generated by each optimization approach are compared to determine which method delivers the best overall performance.
3.8. Dynamic Shading Approach
The same approach used for fixed shading systems will also be applied here, focusing on the optimization approach that achieved the best performance, but with an additional step to account for monthly variations throughout the year. After conducting simulations for the entire year, the fixed parameters of the shading system are identified. Then, the optimization approach is applied separately for each month to determine the optimal value of the variable shading parameter, thereby ensuring adaptability to changing environmental conditions.
4. Case Study
The case study is centered around an educational building, specifically an engineering facility at Mansoura University in Egypt (see Figure 3), situated in a hot arid climate region. The building spans five stories and covers an area of approximately , comprising 32 classrooms, 6 lecture halls, 11 laboratories, 16 bathrooms, and 4 storerooms, collectively supporting diverse academic and practical functions.
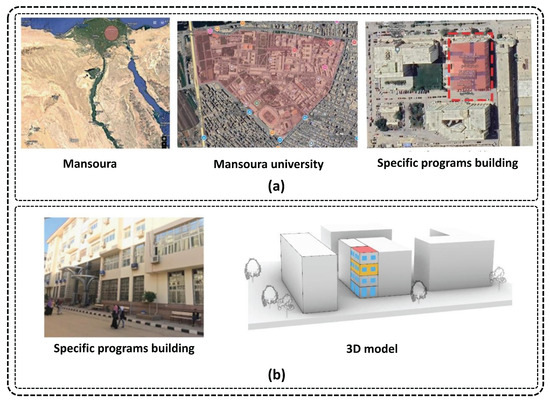
Figure 3.
The considered case study: (a) location; (b) the 3D model in Grasshopper.
For detailed analysis, a single classroom oriented towards the southwest on the fourth floor was deliberately selected. This particular classroom experiences significant exposure to solar radiation, making it an ideal and critical scenario for rigorously evaluating the shading system’s performance. Focusing on one classroom rather than the entire building allows for an in-depth, controlled analysis, providing clear insights into the effectiveness of the shading system in improving thermal and visual comfort as well as overall energy efficiency.
4.1. Assessment of the Building Current State Performance
The classroom is shown in Figure 4. Currently, the classroom does not have any formal shading system installed. Instead, a temporary solution consisting of paper sheets adhered to the window glass is used to reduce sunlight exposure. To evaluate the current daylight conditions in the classroom, a detailed analysis was conducted, including both measurements and a questionnaire survey. The evaluation methodology combines quantitative measurements and qualitative occupant feedback to gain a comprehensive understanding of the daylighting conditions in the classroom. Illuminance levels were systematically measured across the entire classroom area using a calibrated illuminance meter to capture the spatial variation of natural light under current conditions. In parallel, a structured survey was conducted to collect subjective responses from occupants regarding the quality of daylight in the space. The survey included questions targeting key factors such as visual comfort, glare, and overall satisfaction with the daylighting environment. This dual approach provides valuable insights into how the absence of an effective shading system influences user perception and comfort. The data gathered serve as a benchmark for post-intervention analysis, enabling a clear evaluation of the effectiveness of any implemented shading solutions.
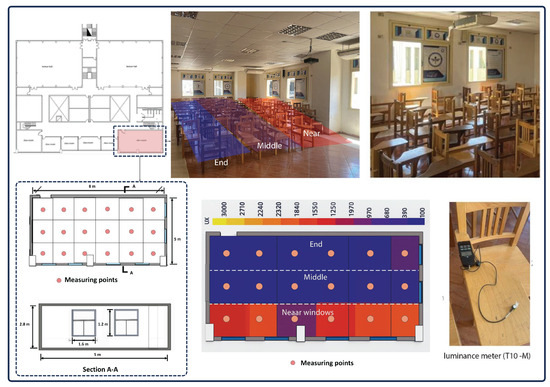
Figure 4.
The considered classroom and the measurements.
The measurements for this study were conducted during two distinct periods: winter (February) and summer 21–22 (June) 2024, from 1:00 p.m. to 2:30 p.m. in Egypt, a period close to solar noon. This time was deliberately chosen because it corresponds to when the sun is at its highest point in the sky, resulting in maximum solar radiation and natural light intensity. Measuring during this peak sunlight period is crucial for capturing the most extreme daylight conditions, thereby allowing a comprehensive evaluation of the shading system’s effectiveness, natural lighting levels, and thermal comfort in the classroom. Furthermore, this time frame aligns with the period of high energy demand in buildings, making it an ideal moment to assess lighting and cooling requirements. The classroom was divided into 18 equal measurement points for data collection using a calibrated illuminance meter (T10-M) (Konica Minolta T-10M Illuminance Meter, Konica Minolta Inc., Tokyo, Japan), as shown in Figure 4. The measurements were taken at a height of 0.75 m above the floor, which corresponds to the height of the desks and provides a relevant reference plane for evaluating students’ visual experience. As shown in Figure 4, the illuminance levels on the west side of the room (near the windows) during summer were consistently between 950 lux and 1000 lux, leading to glare. This excessive brightness creates an uncomfortable environment for students (glare, eye strain, and inconsistent visual comfort), making it difficult to read, work, or relax. The data collected during these periods are essential for understanding how natural light impacts occupant comfort and for guiding the design of more effective shading strategies.
All daylight measurements were conducted using a factory-calibrated Konica Minolta T–10MA illuminance meter (accuracy ±2%, ±1 digit) verified in accordance with CIE S 023 [44]. Measurements were performed under clear sunny conditions to ensure consistent daylight availability. Each of the 18 grid points was measured three consecutive times, and the mean value was used to minimize random variation, showing deviations within ±2%.
The combined measurement uncertainty , accounting for instrument accuracy (2%), repeatability (2%), and environmental effects ( under clear-sky conditions) [45], was calculated using the root–sum–square (RSS) method [46]:
Hence, the combined standard uncertainty is approximately ±3%, corresponding to a 95% confidence level ().
The survey aimed to gather information from teachers and students regarding lighting levels and shading patterns in offices and classrooms. The survey addressed key elements of light quality, its effects on comfort and productivity, and potential improvements. Prior to participation, respondents were informed about the study’s objective and provided their consent through an online questionnaire. Participation was anonymous and voluntary, and the survey remained open for one week. The questions posed were as follows:
- How many hours do you spend in the classroom daily?
- How do you rate the level of natural lighting in the classroom?
- Does the current lighting cause any discomfort, such as eye strain or headaches?
- Which type of lighting is primarily used in the classroom: natural or artificial?
- Is the current lighting sufficient for reading and writing clearly?
- What is your opinion on the paper stuck on the glass?
- What problems, if any, do you experience due to the paper on the glass?
- Would you prefer an alternative to the current paper covering?
- Do you think adding new shading systems would improve your comfort and academic performance?
The responses, analyzed and summarized in Figure 5, provide valuable insights into the existing lighting conditions and their effects. The occupant feedback survey included eleven participants (six students and five faculty members) from engineering disciplines who regularly occupied the tested classroom for at least two hours per day. Participation was voluntary and anonymous, with informed consent provided through an online form. Although the sample size is limited, it provides useful qualitative insights from users familiar with the space.
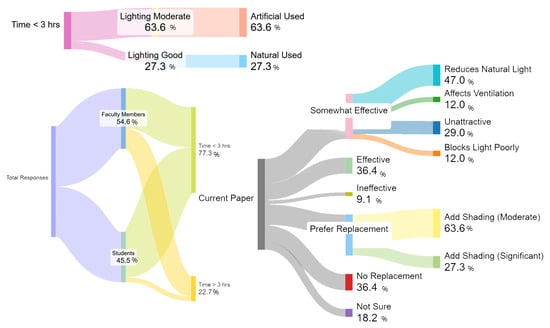
Figure 5.
Analysis of the questionnaire results.
A significant number of respondents indicated experiencing discomfort, such as headaches and eye strain, due to the current lighting conditions. Preferences for lighting varied: some preferred natural light, others artificial lighting, while many favored a combination of both. However, the practice of sticking paper on the glass to control light was widely criticized. Participants noted that it excessively blocked daylight, increased reliance on artificial lighting, and, in some cases, negatively affected ventilation and aesthetics. Most participants (81.8%) reported spending less than three hours daily in the classroom, while 63.6% rated natural lighting as moderate, indicating limited daylight quality. Although 72.7% experienced no visual discomfort, 18.2% reported eye strain and 9.1% headaches, suggesting minor issues of glare and uneven light distribution. Artificial lighting dominated (72.7%), reflecting a strong dependence on electric illumination. Regarding task lighting, 54.5% found it sufficient, whereas 45.5% rated it moderate. The temporary shading (paper on glass) was considered somewhat effective by 54.5% of respondents, though it reduced daylight (47%) and appeared unattractive (29%). Nearly half of the participants favored replacing the current shading, and over 90% expected new systems to enhance comfort, indicating strong support for adopting a more integrated, visually appealing, and energy-efficient daylight control solution.
Many respondents expressed a preference for replacing the current paper covers with more adaptable shading solutions that could balance natural and artificial light while also improving ventilation. Overall, the findings highlight the need for more flexible and effective lighting and shading systems to enhance comfort, productivity, and overall well-being in these educational spaces.
4.2. Customer Requirements
The customer requirements (CRs) represent the key factors that building owners use to assess the impact of a shading system’s design or any other design element. Since building owners are not typically familiar with the technical performance criteria they usually use criteria that can be easy described. The CRs are defined based on a structured questionnaires and discussions with experts to ensure they reflect customer priorities in a clear and understandable way. In the context of this study, the term “customer” refers to a combination of building stakeholders who are directly affected by or involved in decisions related to shading systems. These include building owners (university administration), facility managers, and primary users of the space such as students and teachers. This inclusive definition ensures that both operational and experiential aspects are reflected in the selected requirements. The selected CRs include the following: Visual Comfort (VC), which reflects adequate natural lighting and glare control; Cost (CO), which considers affordability and long-term financial feasibility; Outside Aesthetic Appeal (OAA), which evaluates how the shading system enhances the building’s exterior; Energy Consumption (EC), which reflects the system’s impact on reducing heating and cooling demands; Privacy (PRV), which describes how well the system protects occupants from external visibility; Indoor Aesthetic Appeal (IAA), which describes how effectively the shading system integrates with the interior design; and Compliance with Standards (CWS), which verifies that the design meets regulatory and industry requirements. These factors were chosen because they directly influence the overall satisfaction of building owners, balancing functional performance with aesthetic and financial considerations. To assess the relative importance of the Customer Requirements (CRs), the experts developed pairwise comparison matrices using the Analytic Hierarchy Process (AHP). A panel of experts was assembled, consisting of specialists in the design and development of shading and lighting systems, architectural scholars with relevant experience, and practising professional designers. The analysis of the experts’ evaluations is summarized in Figure 6.

Figure 6.
The Analysis of the Experts involved in the design process.
4.3. Baseline Model Settings
The parametric model of the test room, its adjacent spaces, and surrounding elements was precisely constructed using the Grasshopper parametric design platform, as shown in Figure 3b. The test room has a total area of 40 m2, with dimensions of 5 m in width and 8 m in length. It is oriented towards the southwest, and its boundary conditions were defined based on actual site conditions. This model was then converted into an energy and daylight simulation model using the Ladybug and Honeybee plug-ins (version 1.8), along with EnergyPlus (version 23.2.0), OpenStudio (version 3.7.0), and Radiance/Daysim (5.4a).
For daylight analysis, the building model was assigned Radiance material properties with specific reflectance and transmittance values (Table 4). The analysis grid consisted of 255 points, spaced at 0.25 m × 0.25 m, positioned at a height of 0.75 m above the floor. This height is consistent with that used in the physical measurements to ensure alignment between simulated and real-world evaluation conditions. The target illuminance level for switching off electric lighting was set at 300 lux, in accordance with LEED (v4.1) daylight measurement guidelines [47]. The dynamic shading control operated in coordination with the daylight-linked lighting system. Two dimming control sensors were positioned at the center of the classroom to regulate artificial lighting. When the daylight illuminance at the workplane exceeded or dropped below 300 lux, the light shelves automatically adjusted their tilt angle to maintain the target illuminance level in conjunction with the artificial lighting system. This interaction ensured stable workplane illumination around the 300 lux setpoint while minimizing electric lighting demand. LEED has been widely adopted in various projects across Egypt as a trusted standard for assessing different shading systems, owing to its international recognition, well-defined criteria, and strong appeal to global investors [47].

Table 4.
The assumptions of the simulated case study.
For energy simulation, the model was assigned EnergyPlus material properties, with thermal characteristics specified in Table 4. An ideal air load system was implemented to manage cooling and heating setpoints during occupied and unoccupied periods, while demand-controlled ventilation was kept off. The Honeybee building simulation used the default OpenStudio occupancy schedule. To define energy model inputs, real-world data was collected from a university classroom in an educational building in Egypt. This data, stored in a CSV file, was categorized under the building’s default program (College::Classroom). The operational hours were set from 8:00 a.m. to 6:00 p.m., Sunday through Thursday, following the standard university schedule in Egypt. The heating set point temperature was set at 22 °C, while the cooling set point was 26 °C.
The dataset was generated using the Latin Hypercube Sampling (LHS) method [48], which ensures a statistically distributed set of random samples for each design variable. The simulations were performed on a desktop computer equipped with an Intel Core i7-13620H CPU (2.40 GHz) and 64 GB RAM. In addition to simulation, the optimization was carried out separately in MATLAB using SOGA and NSGA-II based on the trained regression models rather than direct simulation coupling.
4.4. Shading Strategies
To address the shortcomings of the existing window design and to mitigate the issues in the classroom, four shading strategies are used and compared. The corresponding design variables for each case are detailed in Table 5. The shading systems include: fins (Case 1), perforated shade screen (PSS) + interior fixed light shelves (Case 2), PSS (Case 3), and PSS + interior dynamic light shelves (Case 4), where the interior shelf angle is treated as a dynamic parameter that varies monthly to adapt to the changing solar altitude and daylighting needs. This adjustment aims to enhance daylight penetration during winter and reduce excessive solar gains during summer, offering improved annual daylight and thermal balance. The configurations of the four shading systems are illustrated in Figure 7.

Table 5.
Design variables and their corresponding ranges for the considered shading strategies.
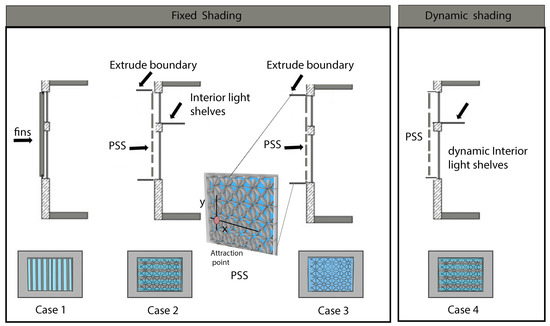
Figure 7.
The proposed shading strategies.
For the dynamic configuration (Case 4), the control variable was defined as the tilt angle of the interior light shelf, with a continuous operating range of −45° to +45°. The control process was fully automated, with the shelf angle adjusted algorithmically each month based on daylight simulation feedback, without any manual user intervention. Month-to-month transitions were modeled as discrete updates occurring at the beginning of each simulation month, ensuring that each month reflected the optimal configuration for its characteristic solar altitude and daylight conditions.
The tilt angle of the interior light shelves was optimized separately for each month using the selected optimization approach, reflecting the automated dynamic control concept described aboveq. This mechanism allowed the system to maintain optimal daylight distribution and energy performance throughout the year in coordination with the 300-lux lighting control system.
4.5. Performance Measures
Six performance measures were considered to evaluate the effectiveness of the shading strategies:
- Useful Daylight Illuminance (UDI)—Represents the percentage of time daylight levels fall within specific lighting ranges: 0–100 lux (insufficient), 100–2000 lux (optimal), and over 2000 lux (excessive). Daylight levels between 100 and 2000 lux are considered adequate for natural lighting. Therefore, in this study, UDI values within this range are used to assess daylight performance [49].
- Spatial Daylight Autonomy (SDA)—is a daylight performance metric that quantifies the percentage of floor area in a space that meets or exceeds a specified illuminance level (e.g., 300 lux) [47,49].
- Spatial Glare Autonomy (SGA)—Represents the percentage of test points that meet the defined minimum fraction of glare-free conditions during daylight hours over an entire year. A higher SGA value indicates improved visual comfort for occupants, as it corresponds to a lower occurrence of annual glare [50].
- Annual Sun Exposure (ASE)—his metric evaluates the proportion of floor space that experiences direct sunlight illuminance exceeding the allowable threshold during daily operational hours over the course of a year.at least 1000 lux of direct sunlight for more than a specified number of hours (typically 250 h) per year [47,51].
- Energy Use Intensity (EUI)—Defined as the annual energy consumption per square meter of the building, measured in kilowatt-hours per square meter (kWh/yr). This study considers various components of energy use, including the annual equipment load (), artificial lighting load (), heating load (), and cooling load () [52]. These factors collectively determine the overall energy performance of the building.
- Thermal Comfort Percentage (COMF)—Thermal comfort is considered based on the percentage of thermal comfort within the space, which is determined using the Predicted Mean Vote (PMV) and Predicted Percentage of Dissatisfied (PPD) indices. These indices evaluate the comfort level of the occupants, and in the results, the thermal comfort percentage reflects the extent of comfort experienced by the occupants based on these factors [53].
These metrics provide a comprehensive assessment of daylight performance, glare control, energy efficiency, and thermal comfort in the classroom environment. UDI, SDA, SGA, and COMF were maximized to enhance daylight quality and comfort, whereas ASE and EUI were minimized to reduce glare and energy consumption. This formulation ensured consistency in the objective direction across both SOGA and NSGA-II optimizations.
5. Results and Discussion
5.1. Fuzzy Weighting of CRs Using Fuzzy AHP
Figure 8a illustrates the Consistency Ratios (CR) of the six experts based on their AHP pairwise comparison matrices. The six experts were selected based on their experience in daylighting design and architectural optimization. The number of experts involved in MCDM studies may vary depending on the scope, complexity, and level of expertise required [54]. Although there is no universal consensus on the ideal number, previous studies have shown that using 5 to 10 experts often yields reliable results [55,56,57]. All CR values are well below the commonly accepted threshold of 0.1, indicating a high level of consistency and reliability in the experts’ judgments. These pairwise comparison matrices serve as the foundation for the Analytical Hierarchy Process (AHP) evaluation. Figure 8b displays the fuzzy weights assigned to the seven customer requirements (CRs). Each requirement is represented by a triangular fuzzy number, obtained by aggregating the inputs from all experts. This fuzzy representation captures the uncertainty and variability in expert opinions, ensuring a more robust and comprehensive assessment.
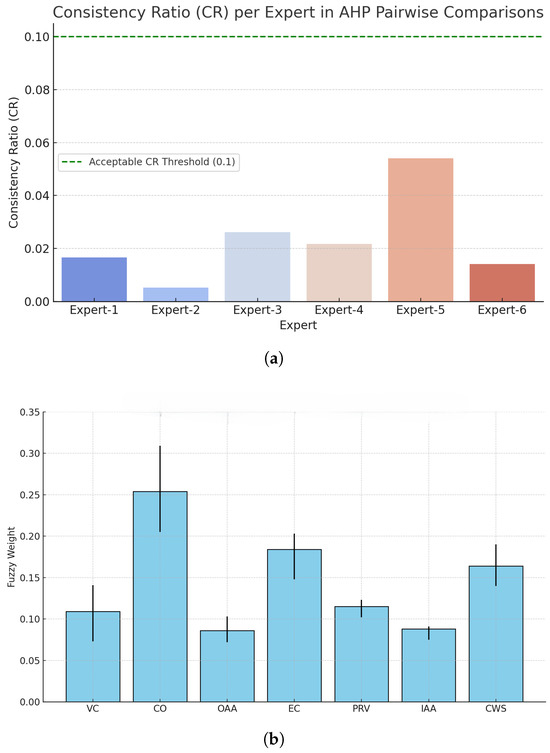
Figure 8.
Fuzzy weighting of CRs using Fuzzy AHP. (a) The Consistency Ratios (CR) of the six experts. (b) Fuzzy weights assigned to the seven customer requirements.
CO holds the highest priority, confirming that affordability is the dominant consideration among decision-makers. This is particularly logical in retrofit or budget-constrained projects, where financial efficiency is paramount. EC and CWS are the next most influential CRs. This highlight the growing emphasis on sustainability and regulatory alignment, especially in the context of green building certifications or climate-sensitive designs. PRV and VC follow, suggesting moderate concern for glare control, view access, and natural lighting—all key aspects in occupant satisfaction. IAA and OAA have the lowest fuzzy weights. This suggests that while aesthetics are not ignored, they are not prioritized as strongly as functional or economic aspects in the shading system design in educational buildings.
The analysis of fuzzy weights serves as the foundation for linking customer expectations with technical responses. These CR weights will be integrated into the House of Quality (HOQ) to prioritize technical design efforts (e.g., performance metrics such as UDI, ASE, COMF, etc.) based on how strongly each metric contributes to satisfying the most valued CRs.
5.2. Weighting PMs Using Fuzzy QFD
As described in Section 3.3, to clarify the integration between CRs and PMs, the Fuzzy QFD method was used as a bridging tool. Experts rated the strength of influence each PM has on satisfying specific CRs within the House of Quality (HOQ) matrix. This structured mapping ensures that even though the optimization process operates directly on PMs, these metrics are weighted in a way that reflects customer values. Hence, the optimization results inherently address the customer requirements by prioritizing solutions that align with the most critical user needs.
Each expert provided their evaluation through a HOQ form, which is composed of two key sections: the central matrix and the roof matrix. The central part of the HOQ maps the relationships between each CR and PM, using expert-assigned linguistic ratings to indicate the strength of each relationship. Meanwhile, the roof of the HOQ captures the inter-dependencies among the PMs, allowing experts to indicate how strongly each performance metric influences the others. Figure 9a presents the consolidated HOQ, showing the full CR–PM relationship mapping evaluated by all experts.
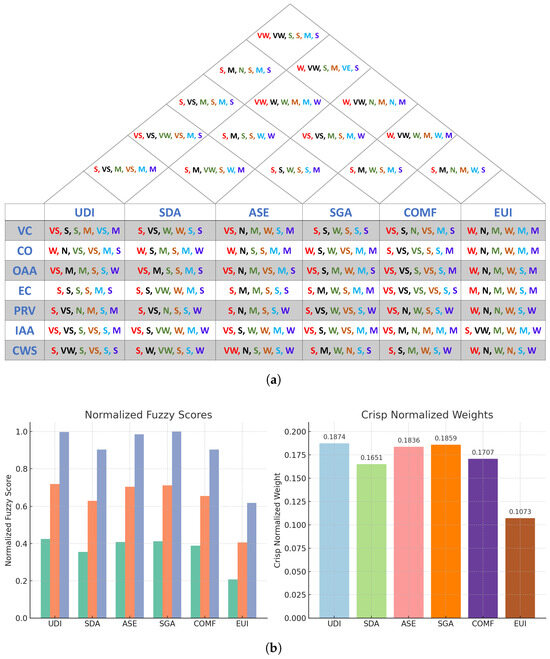
Figure 9.
Weighting PMs using Fuzzy QFD. (a) HOQ for the experts’ opinions of the considered case study; each color represents an expert. (b) Fuzzy weights of PMS; for each metric, the three bars represent the triangular fuzzy number: lower value (left), modal value (middle), and upper value (right).
These expert ratings were converted into fuzzy numbers based on the linguistic scale, and the evaluations were aggregated to extract the fuzzy weights for each PM (Figure 9b). These fuzzy weights quantify the importance of each performance metric in fulfilling customer requirements.
The resulting crisp weights were then directly utilized in the SOGA to guide the optimization process. Additionally, these weights were applied in the TOPSIS method to rank and identify the most suitable design following execution of the NSGA-II algorithm. Thus, customer requirements were fully embedded into the performance-driven design workflow through the QFD-based weighting mechanism.
5.3. Regression
For four different design scenarios, 4000 simulations were conducted per case using the Grasshopper plug-in Design Space Exploration (DSE). An initial test using 2000 samples was conducted to evaluate the performance of the regression models. However, the resulting Mean Squared Error (MSE) values were relatively high, and the coefficients were lower than expected, indicating that the dataset size was insufficient to capture the complex relationships among the 12 design variables. To improve model accuracy, the number of samples was increased to 4000, which yielded significantly better predictive performance across all evaluated metrics. The total simulation time required to generate these datasets varied by system complexity: approximately 2 days for the Fins system, 3 days for the PSS system, and 5 days for the PSS + Light Shelves configuration. Although these durations appear long, they were necessary to produce high-quality regression data capable of representing the nonlinear parameter interactions accurately.
All regression models were trained using Bayesian optimization to tune their key hyperparameters. The optimization procedure automatically adjusted model-specific parameters to minimize MSE. The key hyperparameters, search ranges, and fixed optimization settings are summarized in Table 6. These configurations define the upper and lower bounds for each regression model considered in this study, including ANN, SVM, DT, and Ensemble approaches. The Bayesian optimization process was executed with a maximum of 200 function evaluations under parallel computing mode to accelerate convergence.

Table 6.
Key hyperparameters and Bayesian optimization ranges for the considered regression models, and fixed optimization settings.
The MSE and values of the regression models for all evaluated shading systems are presented in Figure 10. As shown in the figure, the obtained models demonstrate low MSE and high across all performance metrics (PMs), confirming their accuracy and reliability. These regression models were then employed as regression estimators during the optimization process, enabling SOGA and NSGA-II to efficiently explore large design spaces.
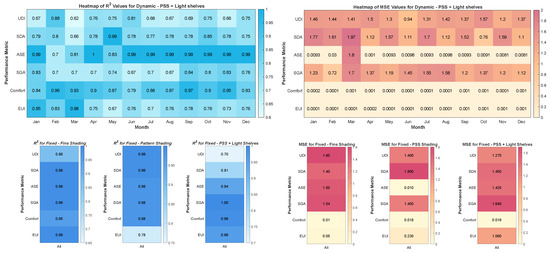
Figure 10.
MSE and of the regression models.
5.4. Comparison of Optimization Approaches
After applying the NSGA-II algorithm, the optimal shading design solutions that form the Pareto front are identified. These solutions represent the best trade-offs among the competing objectives. The resulting Pareto front solutions are illustrated in Figure 11. Selecting the best design from these solutions is not straightforward. It requires the use of the TOPSIS method to identify the most suitable option, which can be seen as a drawback when compared to the SOGA approach, where the optimal design is inherently determined during the optimization process.
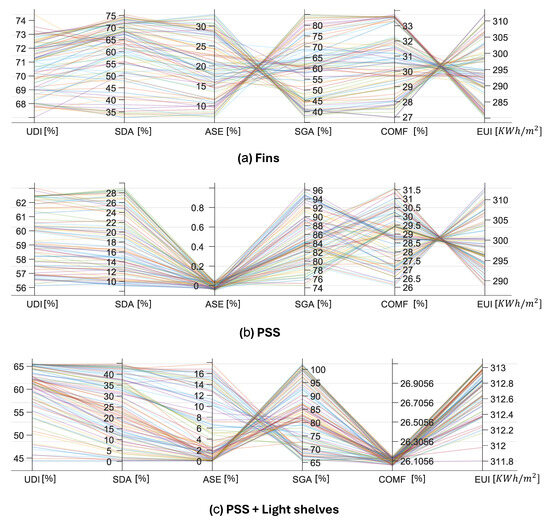
Figure 11.
The obtained optimum designs that achieve the Pareto front for the considered shading systems using NSGA-II. Note: Each line represents one feasible solution across daylighting, comfort, and energy metrics. Higher UDI, SDA, SGA, and COMF values and lower ASE and EUI values indicate better overall performance. Each color corresponds to a different optimum design.
To ensure a fair comparison, both optimization algorithms were executed under an equivalent computational budget. Each algorithm was configured with a population size of 200, while the number of generations was adjusted according to the number of design variables in each shading configuration. Specifically, 600 generations were used for the Fins system (6 variables), 700 generations for the PSS system (7 variables), and 1200 generations for the combined PSS with Light Shelves system (12 variables). This resulted in a total of 120,000, 140,000, and 240,000 function evaluations (population × generations), respectively. This consistent evaluation strategy ensured a transparent and equitable comparison between SOGA and NSGA-II.
For both algorithms, the crossover fraction was set to 0.8. The mutation operator was defined as mutationadaptfeasible, which dynamically adapts the mutation step size and direction according to the feasibility of the current population. This mechanism ensures that new offspring remain within the design constraints while maintaining diversity throughout the search. The stopping criterion for both algorithms was defined using a function tolerance of , meaning that the optimization terminated automatically when the average change in the best objective function value over successive generations fell below this threshold. The total computational runtime was approximately 1.5 h for the SOGA and 4 h for the NSGA-II optimization, highlighting the higher computational demand of NSGA-II despite using identical population and generation settings.
The number of solutions comprising the Pareto front varied by shading system. Specifically, 77 optimal solutions were identified for both the Fins and PSS configurations, while the PSS + Light Shelves configuration yielded 85 optimal designs.
The design parameters of the optimal solutions obtained through decision-making (TOPSIS for NSGA-II and direct selection for SOGA) are shown in Table 7, Table 8 and Table 9.

Table 7.
Optimal Design Parameters—Fins System.

Table 8.
Optimal Design Parameters—Patterned Shading System (PSS).

Table 9.
Optimal Design Parameters—PSS + Light Shelves.
Table 10 and Table 11 present the values of all key performance metrics (UDI, SDA, ASE, SGA, COMF, and EUI) for each shading configuration and the baseline. The results include both NSGA-II and SOGA optimization outcomes together with the degree of satisfaction of LEED v4.1 daylight and glare-control requirements. According to LEED v4.1 (EQ Credit: Daylight), full daylight compliance requires that at least 55% of the regularly occupied floor area achieve an SDA300,50% ≥ 55% and no more than 10% exceed an ASE1000,250 ≤ 10% [47]. These tables complement the visual comparison in Figure 12 that provides the optimal shading design improvements for each case study, identified using both NSGA-II and SOGA optimization algorithms. These optimized solutions were evaluated and compared against the building’s existing performance metrics (PMs).

Table 10.
NSGA-II results: performance metrics and degree of satisfaction with LEED v4.1 requirements.

Table 11.
SOGA results: performance metrics and degree of satisfaction with LEED v4.1 requirements.
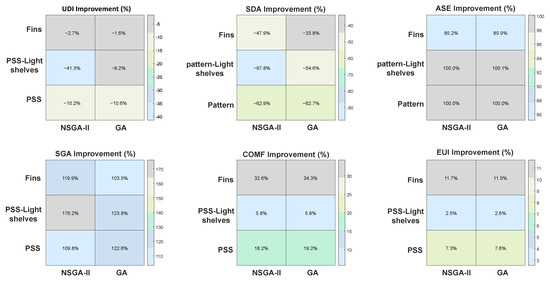
Figure 12.
PMs Improvements relative to the baseline for Each Optimized Shading Design.
As shown in Table 10, the NSGA-II identified solution substantially reduced ASE below the LEED v4.1 threshold (≤10%), particularly for the PSS and PSS + Light Shelves systems, which achieved complete glare elimination (ASE = 0%). However, daylight sufficiency (SDA ≥ 55%) decreased for most optimized designs, revealing the trade-off between glare reduction and daylight access. The Fins system maintained a relatively balanced performance, achieving partial LEED compliance. Table 11 shows consistent ASE improvement trends but slightly higher SDA values than NSGA-II, reflecting the single-objective algorithm’s stronger emphasis on daylight retention. In both cases, the baseline model failed to meet LEED glare criteria, while all optimized designs achieved partial compliance. The term “Partially compliant” refers to cases that satisfy the glare-control criterion (ASE ≤ 10%) but fall short of the daylight-autonomy requirement (SDA < 55%).
As illustrated in Figure 12, both optimization approaches yielded comparable results with respect to ASE, EUI, and COMF. However, for the goal of obtaining a single, best-compromise solution directly from the optimization process, SOGA proved to be more efficient and effective in this specific case. While NSGA-II demonstrated enhanced performance in configurations incorporating fins and patterned light shelves, SOGA designs consistently outperformed NSGA-II in daylighting metrics such as UDI and SDA. In addition to its numerical advantages, SOGA offered a significant methodological benefit: it eliminated the need for a separate multi-criteria decision-making (MCDM) step (e.g., TOPSIS) for final design selection, thereby simplifying the optimization workflow.
A comprehensive examination of the performance metrics presented in Figure 12 highlights that SOGA consistently delivered a more balanced and stable optimization outcome than NSGA-II. The SOGA approach effectively preserved daylight availability and visual comfort, showing better improvements in UDI and SDA than NSGA-II while achieving good improvements in SGA and COMF. This indicates that SOGA search strategy, converged more reliably toward practical design configurations with efficient trade-offs between daylight quality, thermal comfort, and energy performance. NSGA-II, on the other hand, generated a richer Pareto front, but its results showed greater variability across configurations, particularly for complex composite designs such as the pattern-light-shelf system, where the algorithm tended to over-optimize certain objectives at the expense of others. Both algorithms achieved notable glare mitigation and comparable energy savings, confirming the effectiveness of their optimization mechanisms in enhancing shading performance. However, the clearer convergence behavior and steadier performance of SOGA emphasize its advantage for practical implementation, providing an efficient balance between performance and computational simplicity, whereas NSGA-II, requires additional post-analysis (additional MCDM method) to identify a balanced final design.
The radar comparison in Figure 13 further supports these findings. SOGA dominates NSGA-II in most key performance categories—specifically UDI, SDA, and workflow simplicity−while maintaining similar ASE and EUI outcomes. This suggests that the single-objective weighted-sum formulation used in SOGA provides a more direct convergence path toward the best compromise solution without requiring additional post-processing through TOPSIS. Conversely, NSGA-II, while valuable for visualizing trade-offs, demands more selection effort. The radar chart clearly demonstrates that SOGA provides a balanced performance advantage and a simpler design workflow.
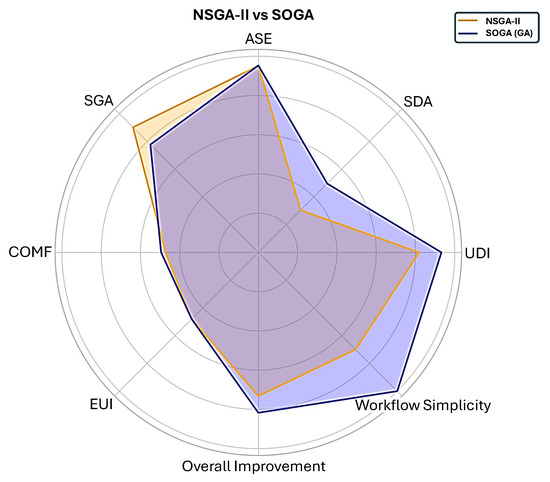
Figure 13.
Comparison of NSGA-II vs. SOGA: Performance and Workflow Simplicity.
Given SOGA’s superior performance in the fixed shading scenarios, it was subsequently selected as the preferred optimization method for identifying the optimal monthly tilt angles of the interior light shelves in the dynamic shading system (Case 4). In this configuration, each month’s optimal angle was derived independently, representing an adaptive strategy that responds to seasonal variations in solar position and indoor daylight demand.
5.5. Sensitivities Analysis
A sensitivity analysis is conducted to assess the robustness of the proposed framework against variations in the relative importance of the CRs. The weight of each CR is independently varied across the full AHP scale, from a minimum of 1/9 to a maximum of 9, while maintaining the other weights constant. This process produced seven scenarios, each corresponding to the prioritization of a single CR. To examine the influence of these weight variations, the most complex configuration—the combined PSS with Light Shelves system—was selected as the test case. The resulting optimal design parameters for all seven scenarios are illustrated in Figure 14, where the twelve design variables are compared across the seven cases. Each subplot demonstrates how the optimized design adapts according to changes in CRs weights.
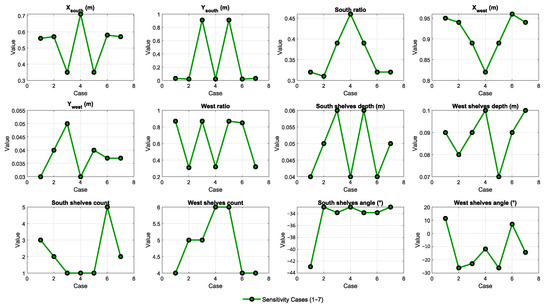
Figure 14.
Results of the sensitivity analysis.
The results reveal that certain parameters (e.g., Xsouth, Ysouth, and shelf counts) exhibit moderate variability under weight perturbations, whereas others (e.g., ratios and shelf angles) remain relatively stable. This indicates that the proposed hybrid framework maintains solution consistency while still being responsive to subjective shifts in CRs. Such adaptability confirms the framework’s capability to integrate both quantitative performance metrics and qualitative user preferences without compromising stability.
5.6. Monthly Comparative Analysis of Dynamic and Fixed Shading Systems
This section presents the monthly improvement results relative to the baseline of the four considered shading strategies, highlighting their performance across various metrics as illustrated in Figure 15 presents the improvement results of the considered four shading strategies. In terms of Energy Use Intensity (EUI), the Dynamic shading strategy achieved the highest energy performance improvement, reducing EUI by 18.1%. The Fins system followed with an 11.5% reduction, while the Pattern system recorded a 7.6% decrease. The Pattern with Light Shelves demonstrated the smallest energy savings, with a 2.6% reduction compared to the current state.
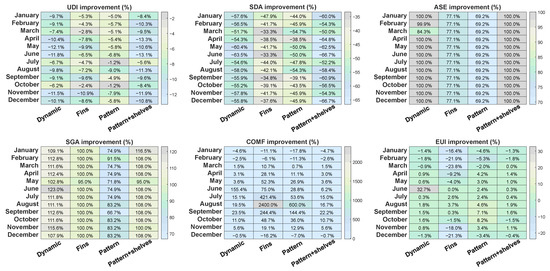
Figure 15.
PM improvements relative to the baseline throughout the year for both fixed and dynamic shading systems.
Thermal Comfort (COMF) analysis revealed that the Fins system delivered the greatest improvement, achieving a 34.3% enhancement. The Pattern system improved thermal comfort by 19.2%, while the Dynamic system recorded a 17.8% improvement. The Pattern with Light Shelves offered the smallest comfort gain, with an increase of only 5.8%.
In terms of UDI, all shading strategies demonstrated values above 60%, indicating good levels of useful daylight. The Fins system achieved the highest UDI at 68.17%, followed closely by the Pattern with Light Shelves at 63.60% and the Dynamic system at 63.04%. The Pattern design exhibited the lowest UDI at 61.94%. However, when observing monthly UDI improvements relative to the baseline, the systems generally showed negative improvements across the year, ranging between −2% and −13%, particularly during months with higher sun angles like May, June, and July. The greatest UDI reduction was observed for the Dynamic system during May (−12.1%).
For SDA, which measures the extent of annual daylight sufficiency, none of the shading systems met the LEED v4.1 O+M minimum requirement of 55%. The Fins system recorded the highest SDA at 49.65%, close to the threshold, whereas the Dynamic system, Pattern, and Pattern with Light Shelves achieved SDA values of 32.01%, 27.95%, and 34.03%, respectively. On a monthly basis, SDA improvement was also consistently negative across all shading types, with the Dynamic and Pattern with Light Shelves systems seeing the largest declines during June (−63.5% and −66.7%, respectively).
For (ASE), which indicates the extent of potential glare, all systems effectively managed sunlight exposure within LEED requirements (ASE less than 10%). Both Pattern and Pattern with Light Shelves achieved 0% ASE throughout the year, showing 100% improvement over the baseline every month. The Dynamic system maintained very low ASE values as well, with 99–100% improvement, while the Fins shading, although slightly less effective, still exhibited notable ASE control, maintaining 77.1% improvement across all months.
In terms of (SGA), which is critical for thermal comfort and energy efficiency, the Pattern with Light Shelves outperformed all other systems, reaching an annual SGA of 83.91%, slightly higher than the Pattern system (83.49%) and the Dynamic system (79.87%). The Fins system lagged at 76.30%. Monthly SGA improvements showed significant increases across the year, exceeding 100% for most systems and months. Notably, the Dynamic system reached an SGA improvement of 123% during June, the highest among all months.
Overall, while Pattern-based solutions prioritized glare control and solar management, dynamic shading achieved the most balanced performance across energy, comfort, and daylight metrics, making it the most effective strategy. Monthly analysis also reveals that dynamic shading systems adapt better to seasonal variations, preventing excessive energy use during transitional seasons (spring and autumn) while maintaining thermal comfort. Static systems, although simpler, exhibited less flexibility, leading to over performance in winter (excess heat gain) and under performance during peak summer months.
6. Conclusions
This paper presents a comprehensive and resilient framework for designing both fixed and dynamic shading systems, addressing all critical stages of the design process. At the core of the approach is the effective incorporation of customer requirements through Quality Function Deployment (QFD), utilizing House of Quality (HOQ) forms. Special attention is given to managing uncertainties, particularly those related to diverse user preferences, and to capturing the intricate interdependencies among various design objectives. Setting itself apart from earlier studies, this framework integrates direct occupant feedback to enhance user-centered outcomes and decision-making. The evaluation of shading strategies using two optimization algorithms—SOGA and NSGA-II—was conducted under equal computational budgets (same population sizes, generations, and function evaluations). While both methods produced valuable solutions, SOGA was more efficient and effective for the specific goal of obtaining a single, best-compromise solution. Monthly analysis of four shading strategies in a hot climate demonstrated that dynamic shading offered the most balanced performance, reducing Energy Use Intensity (EUI) by up to 18.1% during peak summer and sustaining improvements between 12% and 18% throughout the year. The Fins system achieved the highest thermal comfort gains, with up to 34.3% improvement in summer, while the Pattern and Pattern with Light Shelves systems excelled in glare control, achieving a complete 100% reduction in Annual Sunlight Exposure (ASE) and fully meeting LEED visual comfort criteria. Additionally, these systems led in Spatial Glare Autonomy (SGA), with Pattern + Light Shelves reaching a peak performance of 83.9%. The sensitivity analysis confirms that the proposed hybrid framework is both sensitive and robust—capable of reflecting subjective preference changes without producing erratic or unrealistic design outputs. Despite the promising results, this study did not explicitly consider implementation-related costs and automation feasibility. Future work will address this limitation by incorporating automation and control energy costs into the analysis and explore simplified control schedules to improve practicality. The generation of accurate regression datasets required considerable simulation time, highlighting the need to enhance computational efficiency. Subsequent research will therefore focus on optimizing the simulation and optimization workflow to reduce runtime and improve overall processing speed. Furthermore, while the current sensitivity analysis focused on CR-weight variations, future studies will extend the robustness evaluation to different weather conditions and glazing types, as the present results are limited to a single climatic context, glazing specification, and building usage profile. Expanding the framework to multiple EPW files and fenestration configurations will further assess its generalizability and applicability across diverse contexts.
Author Contributions
Writing—review & editing, B.G., C.Z., X.H., M.O. and G.L.; Writing—original draft, B.G. and M.O.; Visualization, B.G. and M.O.; Validation, B.G. and M.O.; Methodology, B.G. and M.O.; Investigation, B.G. and X.H.; Formal analysis, B.G.; Data curation, B.G.; Conceptualization, B.G. and M.O.; Supervision, C.Z. and X.H.; Project administration, C.Z. and G.L.; Funding acquisition, C.Z. and G.L.; Resources, X.H.; Software, B.G. and M.O. All authors have read and agreed to the published version of the manuscript.
Funding
This research has been funded by the National Natural Science Foundation of China (No. 51778168 and No. 52278054).
Institutional Review Board Statement
The study was conducted in accordance with the Declaration of Helsinki and approved by the Medical Ethics Committee of Harbin Institute of Technology (HIT) (Approval No. HIT-2025086, approved in October 2025).
Informed Consent Statement
Informed consent was obtained electronically from all participants prior to completing the questionnaire. Participation was voluntary, and all responses were collected anonymously.
Data Availability Statement
The data and source code are available from the corresponding author upon reasonable request.
Acknowledgments
We would like to express our sincere gratitude to Khaled Janada for his valuable assistance in developing a software that facilitated the application of the fuzzy-QFD.
Conflicts of Interest
The authors declare no conflicts of interest.
Abbreviations
The following abbreviations are used in this manuscript:
| AHP | Analytic Hierarchy Process |
| ANN | Artificial Neural Network |
| ANP | Analytic Network Process |
| ASE | Annual Sun Exposure |
| BSR | Building Solar Radiation |
| CDA | Continuous Daylight Autonomy |
| COMF | Thermal Comfort |
| CO | Cost |
| CRs | Customer Requirements |
| CWS | Compliance With Standards |
| DA | Daylight Autonomy |
| DF | Daylight Factor |
| DT | Decision Tree |
| DSE | Design Space Exploration |
| EC | Energy Consumption |
| ENS | Ensemble Learning |
| EUI | Energy Use Intensity |
| GA | Genetic Algorithm |
| GPR | Gaussian Process Regression |
| HBAs | Heritage-Based Approach |
| HEN | Heating Energy Needs |
| HOQ | House of Quality |
| HVAC | Heating, Ventilation, and Air Conditioning |
| IAA | Indoor Aesthetic Appeal |
| LEED | Leadership in Energy and Environmental Design |
| LHS | Latin Hypercube Sampling |
| MAUT | Multi-Attribute Utility Theory |
| MCDM | Multi-Criteria Decision Making |
| MOGA | Multi-Objective Genetic Algorithm |
| MOO | Multi-Objective Optimization |
| MSE | Mean Squared Error |
| NSGA-II | Non-Dominated Sorting Genetic Algorithm II |
| OAA | Outside Aesthetic Appeal |
| PMs | Performance Measures |
| PMV | Predicted Mean Vote |
| PPD | Predicted Percentage of Dissatisfied |
| PROMETHEE | Preference Ranking Organization Method for Enrichment Evaluation |
| PRV | Privacy |
| PSS | Perforated Shading Screen |
| PV | Photovoltaic |
| PVG | Photovoltaic Generation |
| QFD | Quality Function Deployment |
| QV | Quality of View |
| R2 | Coefficient of Determination |
| SDA | Spatial Daylight Autonomy |
| SGA | Spatial Glare Autonomy |
| SINDy | Sparse Identification of Nonlinear Dynamics |
| SOGA | Single-Objective Genetic Algorithm |
| SPEA-II | Strength Pareto Evolutionary Algorithm II |
| SR | Solar Radiation |
| SVM | Support Vector Machine |
| TFN | Triangular Fuzzy Numbers |
| THC | Thermal Comfort |
| TOPSIS | Technique for Order Preference by Similarity to Ideal Solution |
| UDI | Useful Daylight Illuminance |
| VC | Visual Comfort |
| VF | View Factor |
| WWR | Window-to-Wall Ratio |
References
- Pinto, M.C.; Crespi, G.; Dell’Anna, F.; Becchio, C. Combining energy dynamic simulation and multi-criteria analysis for supporting investment decisions on smart shading devices in office buildings. Appl. Energy 2023, 332, 120470. [Google Scholar] [CrossRef]
- Yuan, J.; Jiao, Z.; Xiao, X.; Emura, K.; Farnham, C. Impact of future climate change on energy consumption in residential buildings: A case study for representative cities in Japan. Energy Rep. 2024, 11, 1675–1692. [Google Scholar] [CrossRef]
- Song, Y.; Liu, J.; Zhang, W. Design Parameters Affecting Energy Consumption of University Educational Buildings in Hot Summer and Cold Winter Area of China. Buildings 2024, 14, 1697. [Google Scholar] [CrossRef]
- Safwat, H.; Elsayed, M.A.; Alghrieb, M.; El-Mahallawi, I. Direct evaporative cooling for sustainability and environmental conservation. Innov. Infrastruct. Solut. 2024, 9, 256. [Google Scholar] [CrossRef]
- Anber, M.F. Thermal Retrofitting of Primary School Buildings in Egypt Optimizing Energy Efficiency and Thermal Comfort. Int. Des. J. 2022, 12, 325–337. [Google Scholar]
- Rajan, S.R.; Al Nuaimi, A.; Furlan, R. Qatar university campus: Built form, culture and livability. Am. J. Sociol. Res. 2016, 6, 99–110. [Google Scholar]
- Ekornes, S. The impact of perceived psychosocial environment and academic emotions on higher education students’ intentions to drop out. High. Educ. Res. Dev. 2022, 41, 1044–1059. [Google Scholar] [CrossRef]
- Mushtaha, E.; Alsyouf, I.; Hamad, R.; Elmualim, A.; Maksoud, A.; Yahia, M.W. Developing design guidelines for university campus in hot climate using Quality Function Deployment (QFD): The case of the University of Sharjah, UAE. Archit. Eng. Des. Manag. 2022, 18, 593–613. [Google Scholar] [CrossRef]
- Safwat, H.; Abdel-Rehim, A.A.; El-Mahallawi, I.; Hussein, A.A.; Amer, A.M.; Elshazly, E.; Elshamy, A.I. Guidelines for data collection on energy performance of higher-education buildings in Egypt: A case study. HBRC J. 2024, 20, 615–642. [Google Scholar] [CrossRef]
- Song, B.; Park, K. Validation of ASTER surface temperature data with in situ measurements to evaluate heat islands in complex urban areas. Adv. Meteorol. 2014, 2014, 620410. [Google Scholar] [CrossRef]
- Elshamy, A.I.; Moussa, R.R.; Alghrieb, M.; Elshazly, E.; El-Mahallawi, I.; Safwat, H. Thermal Performance Variations of Office Spaces in Educational Buildings Resulting from Façade Orientation: An Egyptian Case Study. Buildings 2025, 15, 3437. [Google Scholar] [CrossRef]
- Gaber, B.; Zhan, C.; Han, X.; Omar, M.; Li, G. A novel decision support system for designing fixed shading systems in the early design stage: A case study in Egypt. J. Build. Eng. 2024, 96, 110453. [Google Scholar] [CrossRef]
- Bellia, L.; Marino, C.; Minichiello, F.; Pedace, A. An Overview on Solar Shading Systems for Buildings. Energy Procedia 2014, 62, 309–317. [Google Scholar] [CrossRef]
- Kirimtat, A.; Manioğlu, G. A simulation-based performance evaluation of new generation dynamic shading devices with multi-objective optimization. J. Build. Eng. 2024, 90, 109322. [Google Scholar] [CrossRef]
- Khani, A.; Khakzand, M.; Faizi, M. Multi-objective optimization for energy consumption, visual and thermal comfort performance of educational building (case study: Qeshm Island, Iran). Sustain. Energy Technol. Assessments 2022, 54, 102872. [Google Scholar] [CrossRef]
- Wang, S.; Zhang, Q.; Liu, P.; Liang, R.; Fu, Z. A Parameterized Design Method for Building a Shading System Based on Climate Adaptability. Atmosphere 2022, 13, 1244. [Google Scholar] [CrossRef]
- Romani, Z.; Draoui, A.; Allard, F. Metamodeling and multicriteria analysis for sustainable and passive residential building refurbishment: A case study of French housing stock. Build. Simul. 2022, 15, 453–472. [Google Scholar] [CrossRef]
- Gaber, B.; Zhan, C.; Han, X.; Omar, M.; Li, G. Enhancing daylight and energy efficiency in hot climate regions with a perforated shading system using a hybrid approach considering different case studies. Buildings 2025, 15, 988. [Google Scholar] [CrossRef]
- Al-Saadi, S.N.; Al-Jabri, K.S. Optimization of envelope design for housing in hot climates using a genetic algorithm (GA) computational approach. J. Build. Eng. 2020, 32, 101712. [Google Scholar] [CrossRef]
- Samadi, S.; Noorzai, E.; Beltrán, L.O.; Abbasi, S. A computational approach for achieving optimum daylight inside buildings through automated kinetic shading systems. Front. Archit. Res. 2020, 9, 335–349. [Google Scholar] [CrossRef]
- Noorzai, E.; Bakmohammadi, P.; Garmaroudi, M.A. Optimizing daylight, energy and occupant comfort performance of classrooms with photovoltaic integrated vertical shading devices. Archit. Eng. Des. Manag. 2023, 19, 394–418. [Google Scholar] [CrossRef]
- Chen, P.; Tang, H. A Framework for Adaptive Façade Optimization Design Based on Building Envelope Performance Characteristics. Buildings 2024, 14, 2646. [Google Scholar] [CrossRef]
- Bustamante, W.; Uribe, D.; Vera, S.; Molina, G. An integrated thermal and lighting simulation tool to support the design process of complex fenestration systems for office buildings. Appl. Energy 2017, 198, 36–48. [Google Scholar] [CrossRef]
- de Loyola Ramos Garcia, D.; Ruttkay Pereira, F.O. Method application and analyses of visual and thermal-energy performance prediction in offices buildings with internal shading devices. Build. Environ. 2021, 198, 107912. [Google Scholar] [CrossRef]
- Wu, H.; Zhang, T. Optimal design of complex dynamic shadings: Towards sustainable built environment. Sustain. Cities Soc. 2022, 86, 104109. [Google Scholar] [CrossRef]
- Kangazian, A.; Emadian Razavi, S.Z. Multi-criteria evaluation of daylight control systems of office buildings considering daylighting, glare and energy consumption. Sol. Energy 2023, 263, 111928. [Google Scholar] [CrossRef]
- Jafari, A.; Valentin, V. Selection of optimization objectives for decision-making in building energy retrofits. Build. Environ. 2018, 130, 94–103. [Google Scholar] [CrossRef]
- Bianchi, S.; Andriotis, C.; Klein, T.; Overend, M. Multi-criteria design methods in façade engineering: State-of-the-art and future trends. Build. Environ. 2024, 250, 111184. [Google Scholar] [CrossRef]
- Yamín Garretón, J.; Villalba, A.M.; Rodriguez, R.G.; Pattini, A. Roller blinds characterization assessing discomfort glare, view outside and useful daylight illuminance with the sun in the field of view. Sol. Energy 2021, 213, 91–101. [Google Scholar] [CrossRef]
- Le, D.M.; Park, D.Y.; Baek, J.; Karunyasopon, P.; Chang, S. Multi-criteria decision making for adaptive façade optimal design in varied climates: Energy, daylight, occupants’ comfort, and outdoor view analysis. Build. Environ. 2022, 223, 109479. [Google Scholar] [CrossRef]
- Stamatakis, A.; Mandalaki, M.; Tsoutsos, T. Multi-criteria analysis for PV integrated in shading devices for Mediterranean region. Energy Build. 2016, 117, 128–137. [Google Scholar] [CrossRef]
- Li, L.; Qi, Z.; Ma, Q.; Gao, W.; Wei, X. Evolving multi-objective optimization framework for early-stage building design: Improving energy efficiency, daylighting, view quality, and thermal comfort. Build. Simul. 2024, 17, 2097–2123. [Google Scholar] [CrossRef]
- Rafati, N.; Hazbei, M.; Eicker, U. Louver configuration comparison in three Canadian cities utilizing NSGA-II. Build. Environ. 2023, 229, 109939. [Google Scholar] [CrossRef]
- Wen, S.; Hu, X.; Hua, G.; Xue, P.; Lai, D. Comparing the performance of four shading strategies based on a multi-objective genetic algorithm: A case study in a university library. J. Build. Eng. 2023, 63, 105532. [Google Scholar] [CrossRef]
- Han, Z.; Li, X.; Sun, J.; Wang, M.; Liu, G. An interactive multi-criteria decision-making method for building performance design. Energy Build. 2023, 282, 112793. [Google Scholar] [CrossRef]
- Seyed Shafavi, S.N.; Nikkhah Dehnavi, A.; Zomorodian, Z.S.; Tahsildoost, M.; Korsavi, S.S.; Mohaghegh, S. Façade design of side-lit spaces for different climates and surroundings by machine learning and NSGAIII. Build. Environ. 2023, 245, 110851. [Google Scholar] [CrossRef]
- Gaber, B.; Zhan, C.; Han, X.; Omar, M.; Li, G. Employing ANN for daylight and energy prediction of hot climate office buildings: A case study of new Cairo, Egypt. Archit. Eng. Des. Manag. 2024, 20, 1752–1776. [Google Scholar] [CrossRef]
- Zhang, W.; Ma, Z.; Qiu, H.; Pan, Y.; Shi, Y.; Zhang, L. Machine learning-boosted multi-objective optimization of integrated shading systems: Enhancing daylight availability, glare protection, and energy savings. Build. Environ. 2025, 280, 113124. [Google Scholar] [CrossRef]
- Wang, F. Preference degree of triangular fuzzy numbers and its application to multi-attribute group decision making. Expert Syst. Appl. 2021, 178, 114982. [Google Scholar] [CrossRef]
- Chakraverty, S.; Sahoo, D.M.; Mahato, N.R. Concepts of Soft Computing, 2019th ed.; Springer: Singapore, 2019. [Google Scholar]
- Huang, J.; Zhang, T.; Wang, X.; Liao, Z. TOPSIS based on the triangular fuzzy function and its application in construction scheme optimization. In Proceedings of the 2013 10th International Conference on Fuzzy Systems and Knowledge Discovery (FSKD), Shenyang, China, 23–25 July 2013; IEEE: Piscataway, NJ, USA, 2013. [Google Scholar]
- Omar, M.; Janada, K.; Soltan, H. FAQT: A precise system for welding process selection. Int. J. Fuzzy Syst. 2022, 24, 1605–1618. [Google Scholar] [CrossRef]
- Chakraborty, S. TOPSIS and Modified TOPSIS: A comparative analysis. Decis. Anal. J. 2022, 2, 100021. [Google Scholar] [CrossRef]
- ISO/CIE 19476:2014; Characterisation of the Performance of Illuminance Meters and Luminance Meters. CIE—International Commission on Illumination: Vienna, Austria, 2014.
- Tregenza, P. Uncertainty in daylight calculations. Light. Res. Technol. 2017, 49, 829–844. [Google Scholar] [CrossRef]
- Serea, E.; Donciu, C.; Temneanu, M.C. Complexities of Lighting Measurement and Calculation. Metrology 2025, 5, 61. [Google Scholar] [CrossRef]
- LEED Rating System|U.S. Green Building Council. Available online: https://www.usgbc.org/leed (accessed on 11 May 2025).
- McKay, M.D.; Beckman, R.J.; Conover, W.J. A comparison of three methods for selecting values of input variables in the analysis of output from a computer code. Technometrics 1979, 21, 239. [Google Scholar] [PubMed]
- Nabil, A.; Mardaljevic, J. Useful daylight illuminances: A replacement for daylight factors. Energy Build. 2006, 38, 905–913. [Google Scholar] [CrossRef]
- Jones, N.L. Fast climate-based glare analysis and spatial mapping. In Proceedings of the Building Simulation Conference Proceedings, IBPSA, Loughborough, UK, 21–22 September 2020. [Google Scholar]
- Pilechiha, P.; Mahdavinejad, M.; Pour Rahimian, F.; Carnemolla, P.; Seyedzadeh, S. Multi-objective optimisation framework for designing office windows: Quality of view, daylight and energy efficiency. Appl. Energy 2020, 261, 114356. [Google Scholar] [CrossRef]
- Konis, K.; Gamas, A.; Kensek, K. Passive performance and building form: An optimization framework for early-stage design support. Sol. Energy 2016, 125, 161–179. [Google Scholar] [CrossRef]
- Fanger, P. Thermal Comfort: Analysis and Applications in Environmental Engineering; Danish Technical Press: Copenhagen, Denmark, 1970; p. 244. [Google Scholar]
- Nikjow, M.A.; Liang, L.; Xijing, Q.; Sonar, H. Risk analysis of belt and road infrastructure projects using integrated ISM-MICMAC approach. J. Model. Manag. 2022, 17, 1410–1431. [Google Scholar] [CrossRef]
- Ullah, I.; Zheng, J.; Ullah, S.; Bhattarai, K.; Almujibah, H.; Alawad, H. Unraveling the Complex Barriers to and Policies for Shared Autonomous Vehicles: A Strategic Analysis for Sustainable Urban Mobility. Systems 2024, 12, 558. [Google Scholar] [CrossRef]
- Bux, H.; Zhang, Z.; Ahmad, N. Promoting sustainability through corporate social responsibility implementation in the manufacturing industry: An empirical analysis of barriers using the ISM-MICMAC approach. Corp. Soc. Responsib. Environ. Manag. 2020, 27, 1729–1748. [Google Scholar] [CrossRef]
- Iqbal, M.; Ma, J.; Ahmad, N.; Hussain, K.; Usmani, M.S.; Ahmad, M. Sustainable construction through energy management practices in developing economies: An analysis of barriers in the construction sector. Environ. Sci. Pollut. Res. 2021, 28, 34793–34823. [Google Scholar] [CrossRef]
Disclaimer/Publisher’s Note: The statements, opinions and data contained in all publications are solely those of the individual author(s) and contributor(s) and not of MDPI and/or the editor(s). MDPI and/or the editor(s) disclaim responsibility for any injury to people or property resulting from any ideas, methods, instructions or products referred to in the content. |
© 2025 by the authors. Licensee MDPI, Basel, Switzerland. This article is an open access article distributed under the terms and conditions of the Creative Commons Attribution (CC BY) license (https://creativecommons.org/licenses/by/4.0/).