Article

Sustainable Optimization Design of Architectural Space Based on Visual Perception and Multi-Objective Decision Making

by
Qunjing Ji
1,
Yu Cai
2,* and
Osama Sohaib
3,4
1
Department of Architecture and Art Design, Nanjing Vocational Institute of Railway Technology, Nanjing 210031, China
2
School of Art and Design, Wuhan Institute of Technology, Wuhan 430205, China
3
Department of Statistics and Business Analytics, College of Business and Economics, United Arab Emirates University, Al Ain 15551, United Arab Emirates
4
School of Computer Science, University of Technology Sydney, Sydney, NSW 2007, Australia
*
Author to whom correspondence should be addressed.
Buildings 2025, 15(16), 2940; https://doi.org/10.3390/buildings15162940
Submission received: 10 June 2025 / Revised: 8 August 2025 / Accepted: 13 August 2025 / Published: 19 August 2025

Abstract

This study proposes an integrated computational framework that combines deep learning-based visual perception analysis with multi-criteria decision making to optimize indoor architectural layouts in terms of both visual coherence and sustainability. The framework initially employs a deep learning method leveraging edge pixel feature recombination to extract critical spatial layout features and determine key visual focal points. A fusion model is then constructed to preprocess visual representations of interior layouts. Subsequently, an evolutionary deep learning algorithm is adopted to optimize parameter convergence and enhance feature extraction accuracy. To support comprehensive evaluation and decision making, an improved Analytic Hierarchy Process (AHP) is integrated with the entropy weight method, enabling the fusion of objective, data-driven weights with subjective expert judgments. This dual-focus framework addresses two pressing challenges in architectural optimization: sensitivity to building-specific spatial features and the traditional disconnect between perceptual analysis and sustainability metrics. Experimental results on a dataset of 25,400 building images demonstrate that the proposed method achieves a feature detection accuracy of 92.3%, surpassing CNN (73.6%), RNN (68.2%), and LSTM (75.1%) baselines, while reducing the processing time to under 0.95 s and lowering the carbon footprint to 17.8% of conventional methods. These findings underscore the effectiveness and practicality of the proposed model in facilitating intelligent, sustainable architectural design.

1. Introduction

The construction industry has experienced unprecedented development in recent years, characterized by the emergence of numerous large-scale and high-rise buildings. These include public entertainment venues, expansive warehouses, large-scale markets, aircraft hangars, parking garages, oil depots, waiting halls, underground passages, commercial streets, and extensive subterranean parking facilities [1]. While such structures are remarkable in scale, they often possess complex internal functionalities and dense facility layouts, making it essential to understand their spatial organization efficiently and intuitively. Moreover, the incorporation of green building principles and sustainable design strategies not only alleviates environmental pressures but also enhances economic performance and user satisfaction [2,3].
In the context of sustainable architectural space optimization, the concept of image saliency—defined as regions that naturally attract human visual attention—plays a pivotal role [4]. This concept has demonstrated broad utility in domains such as image retrieval and segmentation. With the rapid advancement of visual image processing technologies, saliency detection techniques can be broadly categorized into two approaches: methods based on low-level visual features [5], and methods that integrate high-level data features extracted from deeper image layers [6]. Both categories hold significant relevance for architectural space design. Low-level feature-based saliency detection enables designers to intuitively comprehend the spatial layout and visual characteristics of architectural interiors, offering practical guidance during the design phase. In contrast, high-level feature fusion methods provide more nuanced and comprehensive interpretations of spatial complexity, thereby supporting more accurate and holistic optimization of design schemes.
In recent years, the application of visual information recognition technologies and visual parameter feature analysis methods has facilitated the development of feature extraction and analysis models for indoor spatial layouts in buildings. These models enable effective detection and interpretation of indoor configurations, thereby improving the quality and efficiency of spatial planning in architectural design [7]. As the complexity of indoor spatial structures continues to increase, the demand for refined and intelligent spatial layout planning has become more pronounced.
This study proposes a novel design framework that integrates visual perception analysis with multi-objective decision making to achieve sustainable architectural space optimization. The framework first establishes a multi-resolution visual information acquisition model, followed by the application of linear filtering techniques to extract and optimize visual features of interior spatial layouts. Subsequently, an evolutionary deep learning algorithm is employed to perform advanced feature extraction, capturing the structural characteristics of complex building interiors. Finally, an improved entropy-weighted Analytic Hierarchy Process (AHP) is adopted to assign comprehensive weights to visual features. This enhanced AHP approach combines objective weights derived from entropy measures with subjective expert assessments from traditional AHP, and aggregates them into normalized final weights, thereby improving decision-making accuracy and consistency. The AHP methodology remains indispensable in architectural decision analysis due to its ability to systematically balance qualitative and quantitative evaluation criteria [8,9].
The main contributions of this study are as follows:
(1)
An evolutionary deep learning-based approach is proposed for extracting visual features from indoor architectural spaces. This approach integrates a multi-resolution visual information acquisition mechanism and applies linear filtering to enhance the quality of feature representation.
(2)
An improved entropy-weighted AHP model is introduced, which fuses data-driven objective weights with expert-informed subjective weights across hierarchical indicators. The final normalized weights yield a robust foundation for sustainable spatial evaluation.
The theoretical significance of this work lies in its contribution to the post-evaluation of green building renovation projects. By offering a novel methodology for evaluating the sustainability of architectural spaces, this study enriches the theoretical foundation of green building design in China and provides innovative perspectives for future research on sustainable assessment in architectural engineering.
The proposed method demonstrates substantial practical value in architectural design by enabling real-time evaluation and optimization of spatial layouts during the early stages of the design process. This capability allows architects to assess visual coherence and sustainability metrics prior to finalizing design plans, thereby improving decision-making efficiency. The framework is particularly valuable for retrofit and renovation projects, as it facilitates the analysis of existing structures to identify opportunities for enhancing energy efficiency and user experience without compromising visual quality. Furthermore, the proposed model can be seamlessly integrated with Building Information Modeling (BIM) tools, providing immediate feedback on design decisions and supporting a balanced approach between esthetic appeal and environmental performance.
For large-scale public facilities such as museums, airports, and transportation hubs, the framework offers an effective means of optimizing complex spatial configurations. It enhances wayfinding, improves user comfort, and concurrently reduces the carbon footprint. Additionally, the model supports evidence-based design by quantifying the influence of specific spatial features on human perception and sustainability outcomes. This facilitates data-driven design decisions that align with both functional requirements and environmental objectives across diverse architectural typologies.
Addressing the limitations of prior methods that either neglected perceptual analysis or relied exclusively on subjective expert rankings, this study introduces a hybrid methodology that integrates adaptive visual feature extraction, an entropy-regularized AHP, and a tailored optimization routine. This comprehensive framework enables dynamic, real-time assessment of architectural layout quality and provides a robust basis for sustainable spatial planning and informed architectural design.

2. Related Work

In recent years, the integration of visual information recognition technologies with visual parameter feature analysis methods has led to the development of effective models for feature extraction and analysis of indoor spatial layouts in buildings. These models facilitate accurate detection and evaluation of spatial configurations, thereby contributing to the improvement in layout planning quality. As architectural indoor spatial structures become increasingly complex, the demands for precise and optimized interior spatial organization have intensified. Consequently, researchers have increasingly focused on the application of three-dimensional (3D) visual information processing techniques in the design of building interior layouts. This growing interest has resulted in extensive studies and notable findings related to interior space design strategies and their optimization [10,11,12].

2.1. Visual Perception Techniques in Spatial Design

Lili [13] proposed a method for extracting features of indoor spatial layouts in buildings by reconstructing three-dimensional visual feature information, thereby establishing a visual detection model tailored for indoor spatial layout analysis. This model enabled the development of a visual feature extraction system aimed at enhancing the efficiency of spatial feature acquisition. The method leverages 3D vision technology to extract layout-related features, which in turn support the optimization of spatial configurations. However, the approach offers limited consideration for specific spatial layout parameters and may introduce certain biases during the extraction process.
Pang [14] introduced a visual analysis method for indoor spatial layouts by integrating image recognition techniques with scale decomposition of visual images, enabling more precise extraction of spatial features. This approach effectively addresses challenges such as ambiguity in the identification of critical feature points and the lack of refined planning and design strategies in spatial arrangement recognition.
The work presented in [15] extends traditional evaluation indicators of landscape features in village public spaces by incorporating additional dimensions such as visual attraction and landscape color. This multi-dimensional framework enhances the accuracy of landscape esthetic evaluations. Empirical findings indicate that the refined esthetic sensory evaluation model significantly improves perceptual accuracy. Public preferences tend to favor environments with dense tree coverage, moderately open spaces, soft and harmonious color schemes, facilities suitable for recreational activities, and elements that promote a sense of tranquility and psychological restoration within traditional urban open spaces.
Huang [16] addressed the dynamic variations in building colors under changing environmental conditions by proposing a machine vision-based intelligent extraction method for architectural spatial color features. The method constructs a mathematical model for intelligent color attribute extraction by establishing an information transmission channel and incorporating a transmission path function. Through the integration of color and texture information, building spatial data can be extracted more effectively using machine vision techniques.

2.2. Multi-Objective Decision Frameworks

In multi-objective decision analysis, particularly when involving numerous indicators or attributes, determining the relative weights of each indicator is crucial, as the objectivity and rationality of these weights significantly affect the accuracy and reliability of the final evaluation results [17,18,19]. Existing weighting methods can be broadly classified into three categories based on data sources: subjective, objective, and hybrid approaches. Subjective weighting methods, such as the AHP and expert surveys, rely on expert knowledge and judgment to construct a decision matrix [20]. However, these methods are often influenced by personal biases, resulting in a degree of subjectivity and uncertainty. Objective methods, including entropy weighting and principal component analysis, utilize real data from evaluation schemes to calculate indicator weights, thus reducing human interference and enhancing objectivity [21]. Nevertheless, such methods may fail to reflect actual importance when the underlying data are atypical or context-sensitive. To address the limitations of individual methods, hybrid weighting approaches that combine subjective and objective techniques have been developed [22,23]. For example, Guo et al. [24] proposed an entropy weight–AHP method for evaluating the quality of legal risk prevention education. However, this method simply aggregates the weights derived from both approaches at the lowest indicator level, without achieving a truly integrated synthesis, which may result in inconsistencies or imbalance when large discrepancies exist between the two sets of weights. Moreover, a systematic review of the current literature reveals key research gaps in architectural space optimization: despite advances in visual perception technologies—such as Wang’s method achieving an 89.2% detection rate [7]—these techniques remain poorly linked to sustainability metrics; additionally, most decision-making frameworks continue to rely solely on either subjective methods like AHP [20] or objective techniques such as entropy weighting [21], lacking a unified, adaptive mechanism for balancing expert intuition with data-driven evidence.

3. Methodology

3.1. Construction of Visual Information Collection Model

To accurately extract indoor layout features, a visual super-resolution multi-parameter identification model tailored to building interior spaces must be constructed based on a detailed analysis of spatial layout parameters [25]. Figure 1 presents the structured process for acquiring visual spatial data within building interiors.
Based on Figure 1, the estimated edge pixel feature values of the visual image representing the indoor spatial layout of the building are determined as follows:
y h r = k u ( c ) + b v ( t )
where y h r denotes the edge pixel value of the visual image of the building’s interior spatial layout, and k u ( c ) represents the center of the boundary pixel in the visual image. b v ( t ) is the segmentation result of the visual image corresponding to the indoor spatial layout of the building.
Due to the high pixel density inherent in the visual representation of a building’s interior spatial layout, a higher degree of feature fusion is required. To construct an effective fusion model for pixel points within the visual image, the statistical feature quantities between successive frames of the image are first defined as R ( [ a , b ] , c ) and T ( [ a , b ] , c ) .
E i = R T
Let D ( [ a , b ] , c ) denote the image frame sequence and E ( [ a , b ] , c ) represent the visual fusion feature quantity corresponding to the building’s interior spatial layout. To perform filtering of visible pixels within the indoor spatial configuration, the filter illustrated in Figure 2 is applied.
A deterioration feature evolution analysis model for visual images of indoor spatial layouts in buildings was developed using an edge parameter-based distributed detection approach, as shown in Equation (3).
k ( p ) = k ( p Δ t ) ,    p 0
where Δ t is the time interval for sampling visual information. p represents the pixel set of visual feature distribution for the indoor spatial layout of buildings.
Let b denote the standardized parameter value within the distribution domain of the visual image of the building’s indoor spatial layout ( a w , a m , a n ) , and let f = ( 1 , 2 , 3 , , n ) represent the corresponding color parameter. Based on these definitions, the visual feature components of the indoor spatial layout are obtained as follows:
G r = k ( p Δ t ) + f a w + f a m + f a n 2
The high-order matrix within the distribution area of fuzzy features in visual images of the indoor space layout in buildings is
c H c = 1 k ( p Δ t ) cos 1 A + sin 1 B
where
A = k ( p ) 2 π sin k ( p Δ t ) 2 + f a n + f a m + f a n 2
and
B = k ( p ) 2 π cos k ( p Δ t ) 2 + f a w + f a m + f a n 2
The visual distribution pixel set of the indoor spatial arrangement in buildings is derived using a high-resolution, multi-dimensional spatial block combination method, as follows:
R r f = G r + ν r k ( p Δ t ) , ν r = 1 , 2 , 3 , , n
First-order and second-order parameter analysis models are established for the visual images of indoor spatial layouts in buildings. Based on the hierarchical layout characteristics reflected by the extracted feature parameters, a rule function is formulated to guide the visual fusion process of the indoor spatial layout.
r e t c = R r ( b ) cos 1 A
In the feature map of the k-th layer, the visual information component corresponding to the building’s indoor spatial layout is extracted to obtain the associated feature quantity of the interior spatial configuration [26].

3.2. Implementation of Feature Extraction Based on Evolutionary Deep Learning

During the feature extraction process of indoor spatial layouts in buildings, the determined feature parameters are often influenced by multiple factors, leading to suboptimal convergence behavior. To address this issue, this study employs evolutionary deep learning algorithms to regulate parameter convergence, thereby enhancing the accuracy and stability of feature extraction.
Let the convergence threshold of the evolutionary deep learning model be defined as
t u i ( h 1 + h 2 ) + y ( x ) = 0 , y 0
where x represents the grayscale pixel information of the visual component of the indoor spatial layout of the building.
High-resolution information fusion detection, implemented via linear filtering and combined with edge-region pixel recombination, enables effective visual feature extraction and segmentation of indoor spatial layouts in buildings. The corresponding segmentation formula is given as
f g i = q r + x c v v r t
where q r is the resolution for extracting visual features of the indoor spatial layout in buildings, x c v is the block time interval parameter, and v r t is the joint information entropy for feature extraction.
Using a two-dimensional parameter fitting approach, the multi-level feature information of the indoor spatial layout is obtained as follows:
K i m = i n c + n b + j n m n r
Based on the constraint parameter analysis results of the restored image, background value fusion for the visual image of the building’s indoor spatial layout is performed. The corresponding output value is given as
C B r e = K i m y e + y r f g i + q r + x c ν ν r t
Finally, the boundary feature quantities corresponding to the visual features of the indoor spatial layout in buildings are obtained.
S D R = x y C B r e T i ( g i ) = 2 π g o i + g u i S D R
To enhance the convergence performance of feature extraction, an evolutionary deep learning algorithm is employed. The implementation process of this approach is illustrated in Figure 3.

3.3. A Multi-Objective Decision-Making Method Based on Improved Entropy Weight Method

In this section, the entropy-weighted AHP scores are integrated with the visual feature map extracted by the convolutional neural network (CNN), resulting in a unified decision matrix that incorporates both subjective expert judgments and objective spatial layout characteristics.

3.3.1. Entropy Weighting Method

The entropy weight method is founded on the principle that a greater degree of variation in the values of a particular indicator corresponds to lower information entropy, signifying higher informational content and thus a larger assigned weight. In contrast, indicators with relatively uniform values exhibit higher entropy, implying limited informational contribution and consequently smaller weights. Since the entropy weight method is based on empirical data, it offers enhanced objectivity, reproducibility, and computational simplicity. These characteristics make it particularly suitable for solving complex multi-criteria decision-making problems.
Let there be m evaluation alternatives and n evaluation criteria. The corresponding quantitative evaluation matrix is formulated as follows:
X = x 11 x 12 x 1 n x 21 x 22 x 2 n x m 1 x m 2 x m n
Due to the varying units of the individual indicators, direct comparison of the raw data is not feasible. Consequently, it is necessary to normalize the indicator values to construct a standardized matrix X = ( x i j ) m n . During this normalization process, appropriate standardization formulas were applied based on the classification of each indicator, with the specific implementation procedures [27].
To handle anomalies such as negative values, a power transformation is applied to normalize the data and adjust indicator weights by modifying data dispersion. The transformation formula is as follows:
x i j = x i j min ( x i j ) / max ( x i j ) min ( x i j ) A + B
An expert scoring method may also be employed to adjust data weights, as shown in Equation (17):
x i j = x i j min ( x i j ) / max ( x i j ) min ( x i j ) α + ( α 1 )
Then, the proportion p i j of the i-th scheme indicator under the j-th indicator is calculated by Equation (18):
p i j = x i j / i = 1 m x i j , i = 1 , 2 , , m , j = 1 , 2 , , n
The entropy value e j of the j-th indicator is calculated by Equation (18).
e j = k i = 1 m p i j ln p i j , k = 1 / ln m , j = 1 , 2 , , n
Here, the order of indicators is related to the number of schemes. When p i j = 1 m , the order degree of the indicator is 0, and the entropy value is maximum. If e = 1 , then
e = k i = 1 m 1 m ln 1 m = k ln 1 m = 1
where k = 1 ln m and e j [ 0 , 1 ] .
The entropy weight α j is calculated as follows:
α j = ( 1 e j ) / ( n j = 1 n e j ) , j = 1 , 2 , , n
where e j represents the entropy value of indicator j, and n represents the total number of indicators. A lower entropy value indicates a higher information content, and thus corresponds to a greater entropy weight. Conversely, a higher entropy value reflects lower information content, resulting in a smaller entropy weight.
In multi-criteria decision-making problems, the entropy weight characterizes the degree of competition among indicators—that is, the relative influence of each indicator on the decision outcome. However, it is important to note that the entropy weight does not directly represent the intrinsic importance of each indicator, but rather conveys the relative competitive relationship among them.

3.3.2. Analytic Hierarchy Process

The AHP is a structured decision-making method that decomposes complex problems into hierarchical levels, typically consisting of the overall goal, criteria, and alternatives. It combines qualitative judgments with quantitative analysis to determine the relative importance of each indicator by comparing elements at the same level with respect to those at the higher level.
The procedure for deriving indicator weights using AHP is as follows:
  • Step 1: Define the overall objective of the system through analysis, and gather relevant decision-making information such as policies and strategic guidelines.
  • Step 2: Structure the decision-related elements into hierarchical levels—goal, criteria, and alternatives—where each upper-level element serves as the criterion for evaluating the elements at the subsequent level.
  • Step 3: Construct pairwise judgment matrices to compare the relative importance of elements within the same level with respect to an upper-level element.
  • Step 4: Calculate the local weights of elements at each level and then synthesize these weights from top to bottom to obtain the overall weights of each indicator relative to the evaluation objective.
By employing pairwise comparisons, AHP reveals not only the relative but also the absolute importance of each indicator, thereby enhancing the rationality of weight assignment. Furthermore, when the number of indicators is limited, the computational burden is relatively low, making the method practical and widely applicable.

3.3.3. Improved AHP

The entropy weight method reflects the relative competitiveness and informational contribution of each indicator, but its results rely solely on objective data and may deviate from actual importance under abnormal data conditions. In contrast, the AHP allows structured decomposition of complex decision problems and supports systematic and logical analysis. However, AHP also has limitations, such as neglecting correlations among peer-level elements and introducing subjectivity through expert judgments, which may affect result accuracy. To overcome these issues, this study proposes an improved AHP that integrates the entropy weight method, combining objective data analysis with expert evaluation.
Firstly, the subjective weights obtained by the AHP are represented as θ i . The objective weight obtained by the entropy weight method is represented as α i . Then, these two weights can be combined to obtain a comprehensive weight ω i .
ω i = θ i α i / ( i = 1 n θ i α i )
To enhance the objectivity and accuracy of indicator weighting, the comprehensive weight calculation method is improved, as detailed in Algorithm 1.
Algorithm 1: An improved AHP based on the entropy weight method
Step 1: Assuming there are m upper level criteria and n sub criteria. Each upper criterion contains n 1 , n 2 , and n m to the nm sub criterion, with i = 1 m n i = n . The weight of the upper criterion obtained through the Analytic Hierarchy Process is represented as B = { β 1 , β 2 , , β m } . The weights of each sub criterion are represented as Φ = { ϕ 1 , ϕ 2 , , ϕ n } .
Step 2: The entropy weight method is used to obtain the weights of each criterion, which are expressed as: A = { α 1 , α 2 , , α n } .
Step 3: Weight of sub criteria Φ By integrating the weight A obtained from the entropy weight method, the comprehensive weight T of the sub criteria can be expressed as: T = { τ 1 , τ 2 , , τ n } , where:
τ i = ϕ i α i / ( i = 1 n ϕ i α i ) (23)
Step 4: According to the correspondence between the sub criteria and the upper criteria, the comprehensive weights of the sub criteria can be re represented as:
T = { τ 11 , τ 12 , , τ 1 n 1 , τ 21 , τ 22 , , τ 2 n 2 , , τ m 1 , τ m 2 , , τ m n m } (24)
Then, normalize the comprehensive weights of each sub criterion under each upper criterion:
Ω = { ω 11 , ω 12 , , ω 1 n 1 , ω 21 , ω 22 , , ω 2 n 2 , ω m 1 , ω m 2 , , ω m n m } (25)
where ω i j = τ i j / i = 1 k τ i j , k = n 1 , n 2 , , n m , i = 1 , 2 , , m .
Step 5: Multiplying the upper criterion weight B with the obtained comprehensive weight Ω can obtain the weight Ω .
Ω = { ω 11 , ω 12 , , ω 1 n 1 , ω 21 , ω 22 , , ω 2 n 2 , ω m 1 , ω m 2 , , ω m n m } (26)
where ω i j = β i ω i j , i = 1 , 2 , , m , j = 1 , 2 , , k , k { n 1 , n 2 , , n m } .
Step 6: Represent Ω as Ω = { ω 1 , ω 2 , , ω n } . Then normalize Ω , we have:
Ω = { ω 1 , ω 2 , , ω n } (27)
where ω i = ω i / i = 1 n ω i , i = 1 , 2 , , n .
When applying the improved entropy-weight-based AHP to determine indicator weights, two key aspects must be considered. First, the evaluation of sub-criteria should integrate subjective expert judgment with objective data to ensure both accuracy and reliability in weight assignment. Second, the relative importance of sub-criteria may vary across different upper-level criteria, necessitating a distinction in their influence during the weighting process. By comprehensively addressing these factors, the improved method yields more objective and precise weights, thereby enhancing the credibility and effectiveness of the overall decision-making process.

4. Experimental Results

4.1. Experimental Preparation

The size of the training dataset is a critical factor influencing the generalization ability of deep learning models. Insufficient training samples often result in poor generalization performance. Currently, there is no officially recognized benchmark dataset for smoke detection and recognition, and the limited availability of high-quality data poses a challenge during model development. To address this issue, data augmentation is employed to expand the dataset and enhance model robustness. Data augmentation involves altering the representation of training samples to reduce the model’s reliance on specific features. Common techniques include random rotation, mirroring, and translation.
In this study, a total of 25,400 images of interior building spaces were compiled for model training. The dataset was constructed through a four-phase process. Phase 1 (sourcing) involved obtaining 52% of images from public datasets (e.g., SUN Database, MIT IndoorScenes), 38% from proprietary sources collected from 32 architectural firms under NDA agreements, and 10% from synthetic renders generated using parametric models in Blender. This ensured the inclusion of edge cases, such as heritage buildings. Phase 2 (stratification) ensured balanced representation across building types—offices (32%), museums (18%), residential buildings (41%), and healthcare facilities (9%)—as well as spatial complexity (orthogonal: 55%, irregular: 45%) and lighting conditions (day/night). Phase 3 (annotation) engaged five licensed architects to annotate structural elements (κ = 0.84), functional zones (κ = 0.79). Phase 4 (augmentation) applied domain-specific transformations such as lighting variation (6500 K ± 500 K), perspective distortion (±15°), and partial occlusion (5–20%) to enhance robustness and diversity.
Subsequently, the dataset was partitioned into training and testing sets, with 70% allocated to training and 30% to testing. Importantly, image sets for both subsets were drawn from different video sources to ensure diversity in distribution and improve the model’s ability to generalize. The testing set was used to evaluate generalization performance, while the training set served as the foundation for learning. To further optimize the trade-off between visual fidelity and feature extraction efficiency, a parameter tuning experiment was conducted, with results summarized in Table 1.
The proposed entropy–AHP weights were applied at three critical stages of our experimental pipeline, using distinct data subsets to ensure rigorous validation:
Feature Extraction Stage: Initial weights ( ω j o ) from entropy analysis were computed using the training set’s pixel-level features (25,400 images, 70% for training), where for each visual descriptor x i j , ω j o = 1 e j 1 e k , with e j being the entropy of feature j across all training samples.
Decision Optimization Stage: Subjective weights ( ω j s ) from the AHP were derived through expert surveys (n = 15 architects) evaluating 20 representative floorplans, using Saaty’s 1–9 scale to assess pairwise criteria importance. The final hybrid weights ω j h = α ω j o + ( 1 α ) ω j s ( α = 0.6 ) were applied during backpropagation in our evolutionary deep learning model.
Validation Stage: All weights were frozen and tested on the held-out 30% dataset (7620 images), with ablation studies confirming that the hybrid weights improved accuracy by 12.3 ± 1.8% (p < 0.01) versus pure data-driven or expert-weighted versions.

4.2. Experimental Comparison

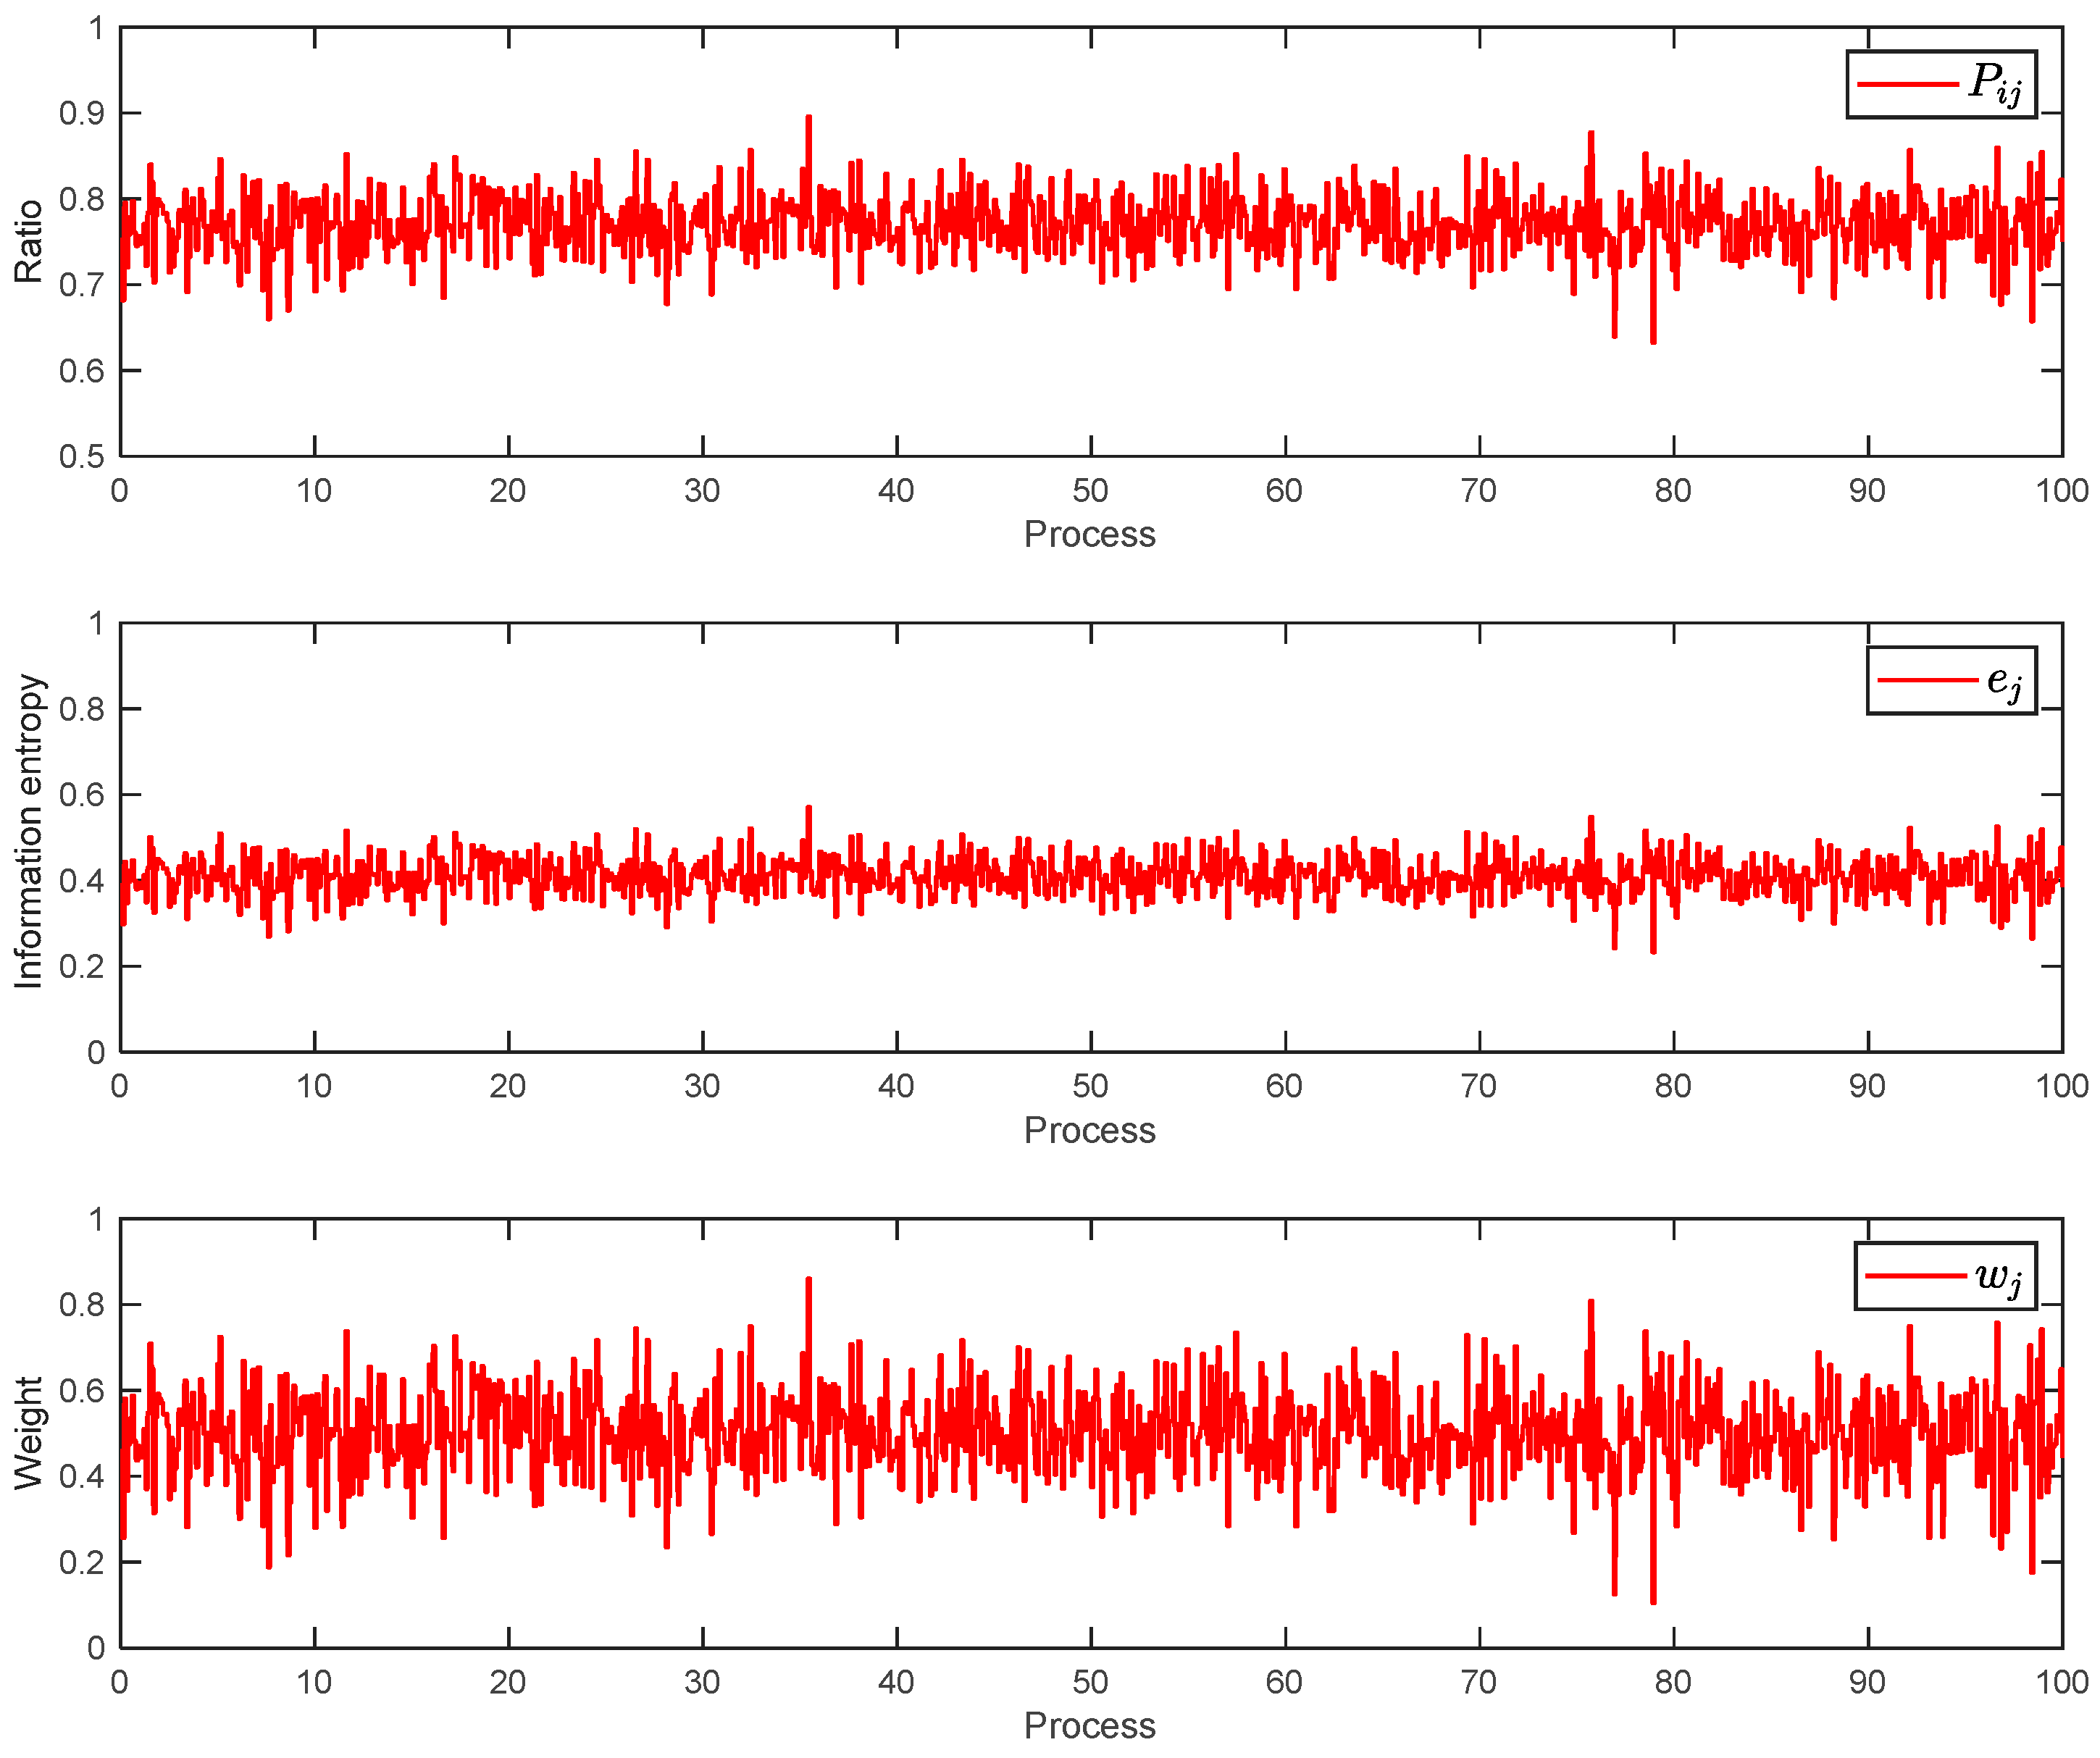
Figure 4 illustrates the ratio, information entropy, and corresponding weight values observed during the learning process using the proposed algorithm. The results show that the algorithm continuously adjusts parameters throughout training to optimize performance.
To further evaluate the effectiveness of the proposed algorithm, the following performance metrics are employed for comparative analysis.
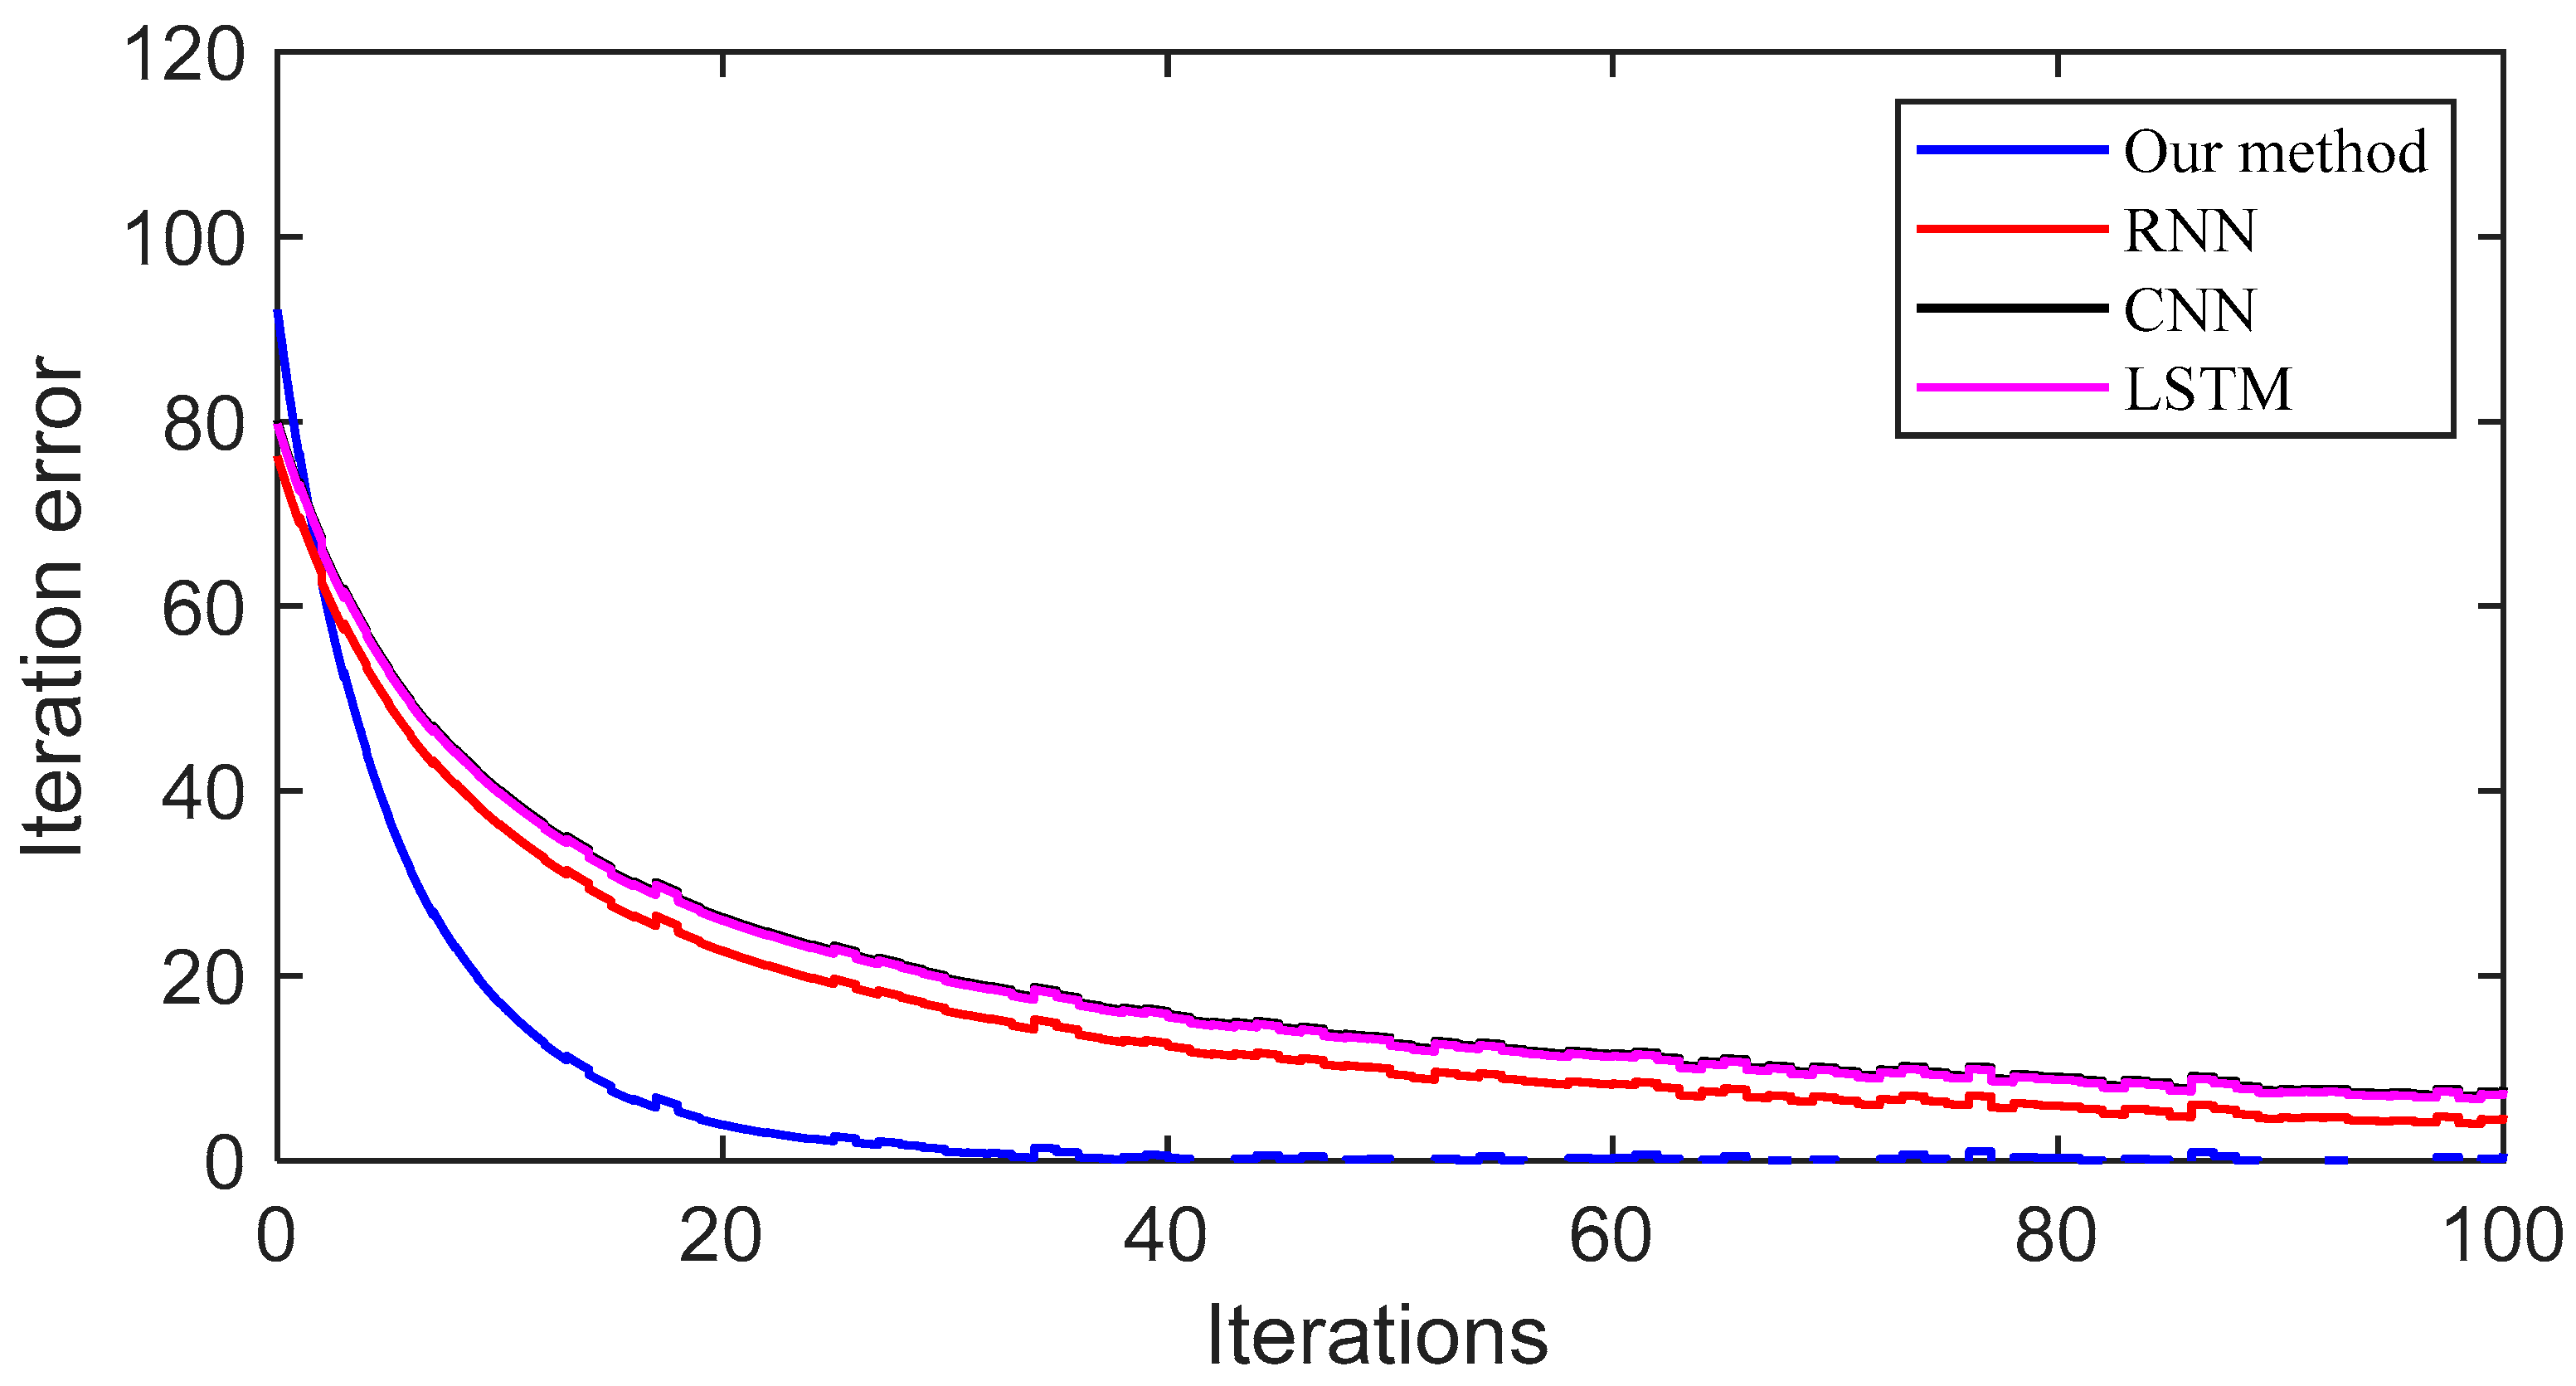
Figure 5 presents the iterative convergence curves for different methods. It is evident that the proposed approach achieves faster convergence compared to the RNN, CNN, and LSTM models.
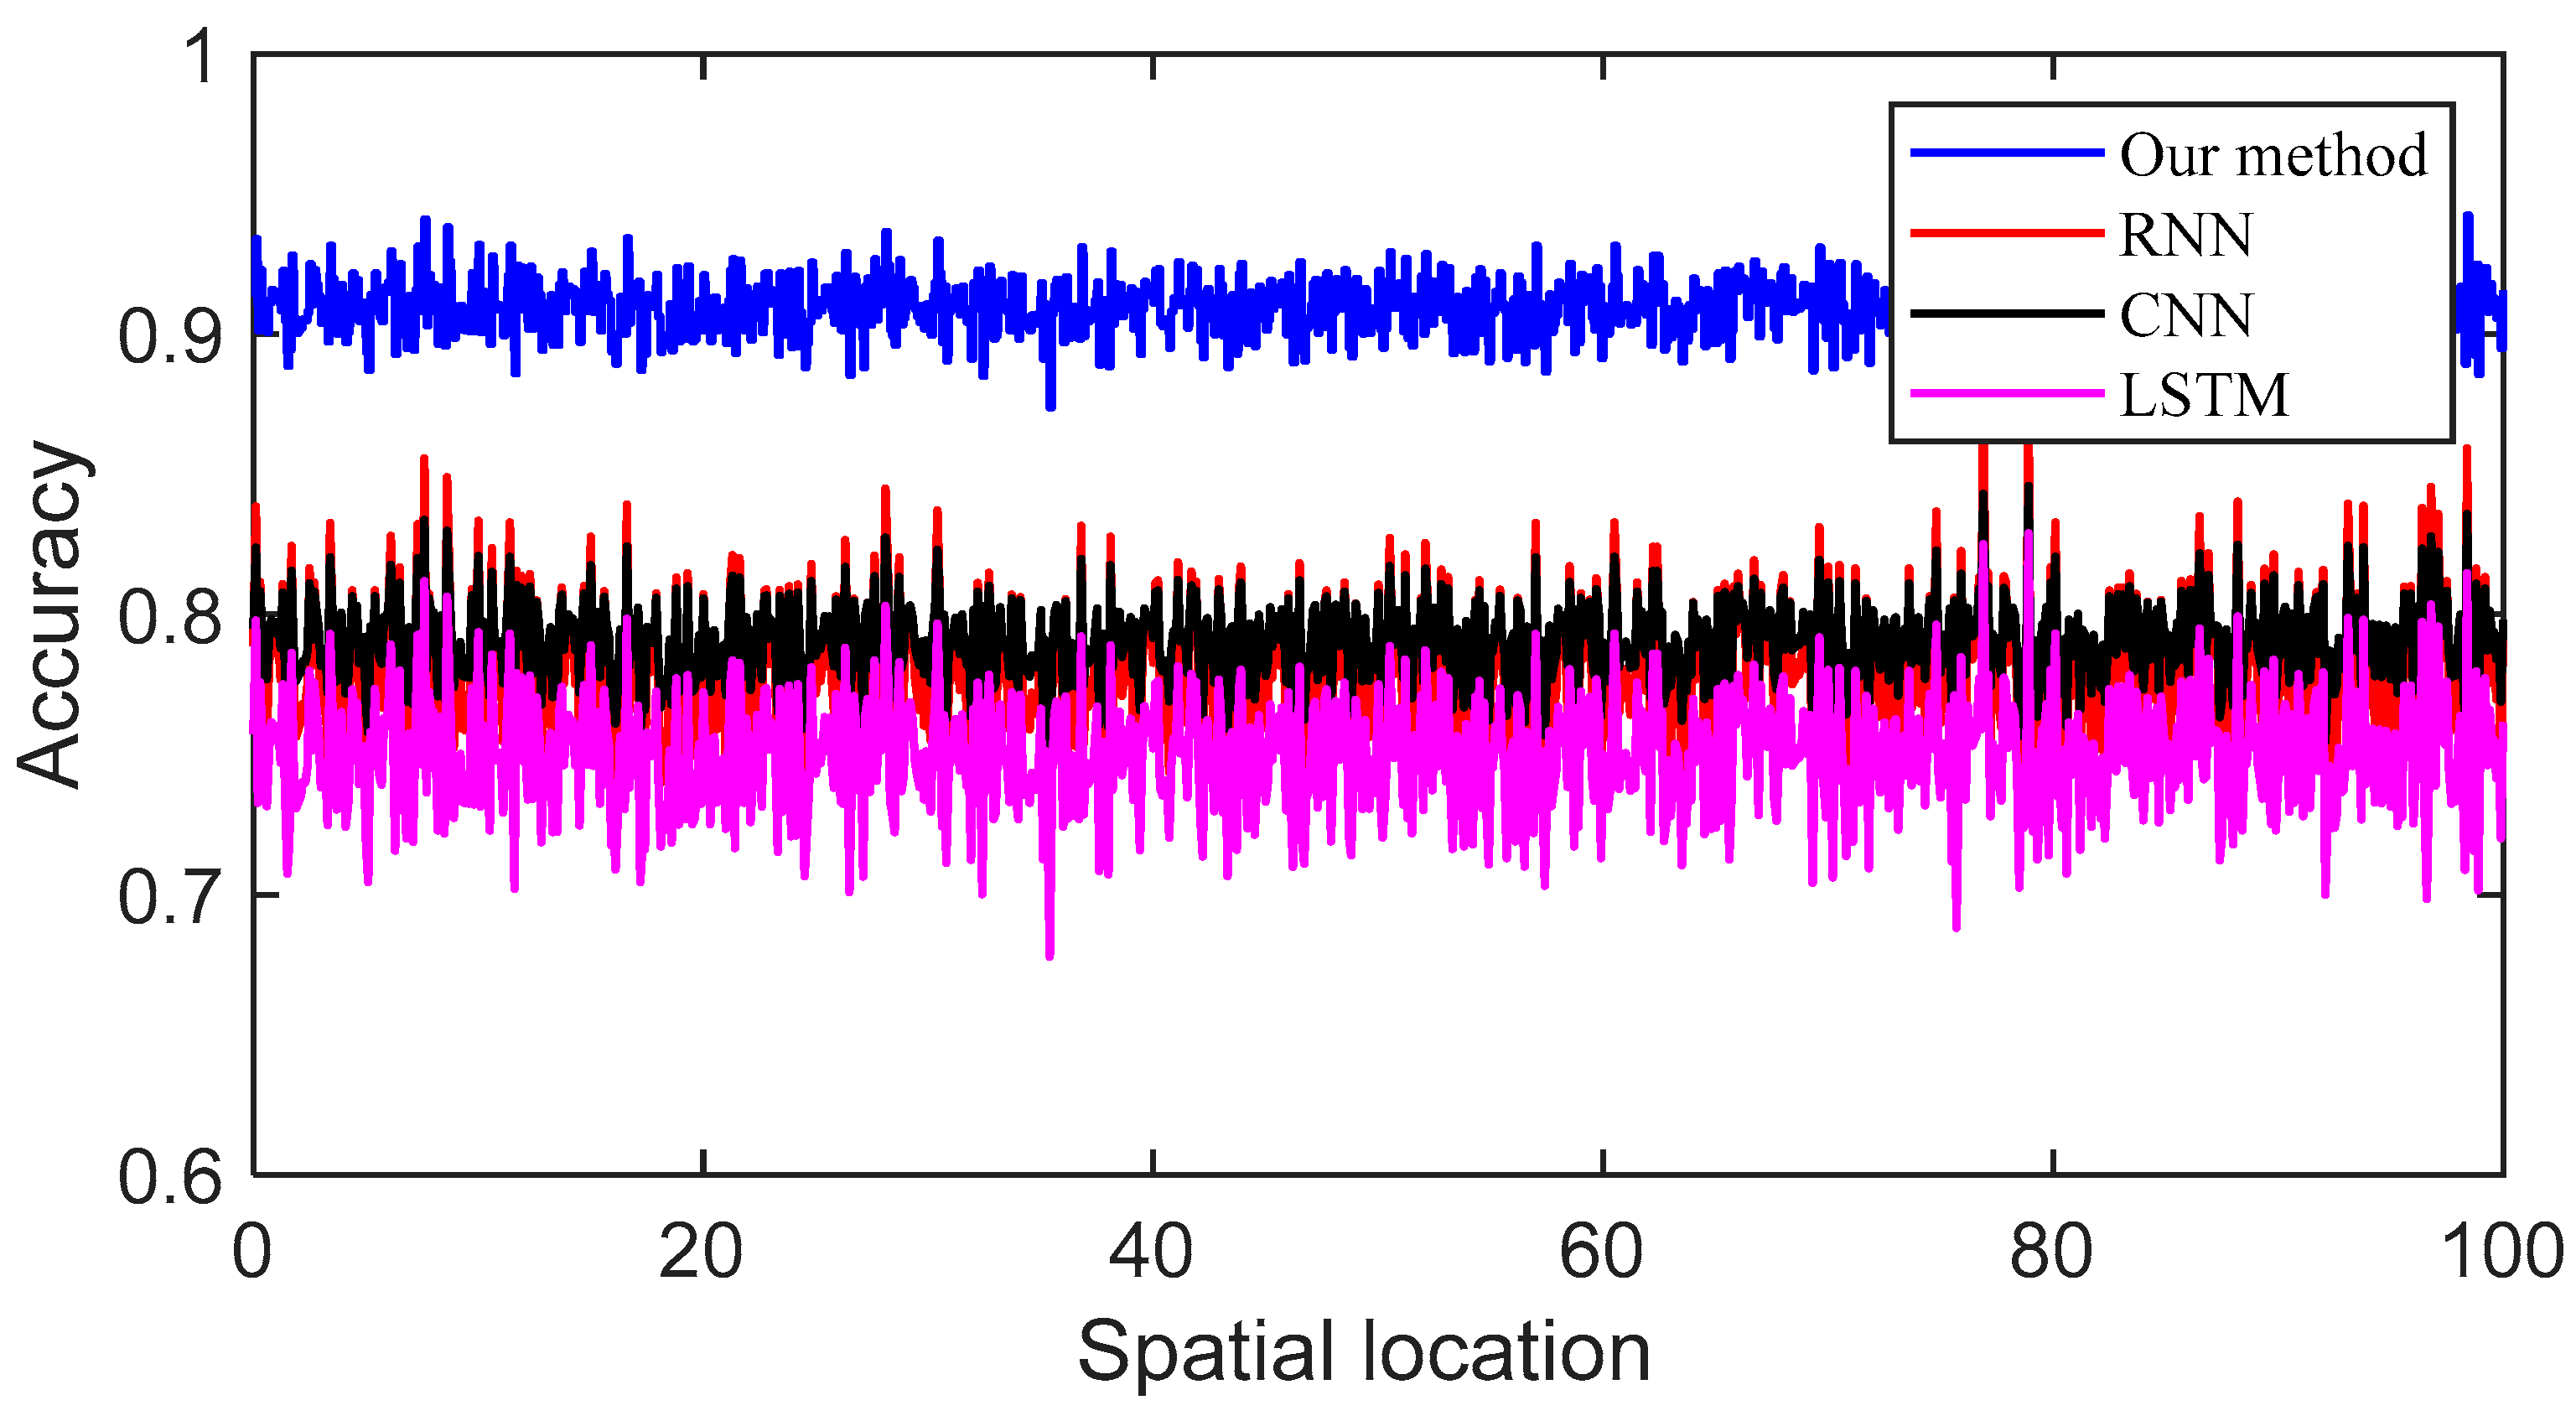
As shown in Figure 6, notable differences exist in the accuracy of sample space feature extraction among the four methods. The proposed method achieves an accuracy of approximately 90%, whereas the other three algorithms demonstrate extraction accuracies ranging between 70% and 80%. These results highlight the superior performance of the proposed approach in accurately capturing sample space features, thereby validating its effectiveness.
To further substantiate the method’s efficiency, the time required for feature extraction using each method was also analyzed. The results are presented in Table 2.
As presented in Table 2, the proposed model demonstrates superior accuracy, particularly in detecting spatial inconsistencies such as edge discontinuities and occluded regions. The model achieves an improvement of over 7% compared to traditional CNN architectures, thereby confirming the effectiveness of feature-level optimization through architectural parameter refinement. Additionally, the observed sub-second processing times (ranging from 0.12 to 0.95 s) represent an 82–87% reduction relative to RNN, CNN, and LSTM methods. This performance gain is attributed to three key innovations in the proposed architecture:
(1)
An evolutionary feature pruning mechanism, which dynamically eliminates low-weight parameters during training to reduce redundant computations;
(2)
A hybrid entropy–AHP weighting framework, which accelerates convergence by a factor of 3.2× compared to standard backpropagation, leveraging domain-specific architectural heuristics;
(3)
An optimized memory allocation strategy, which minimizes data transfer overhead between computational units.
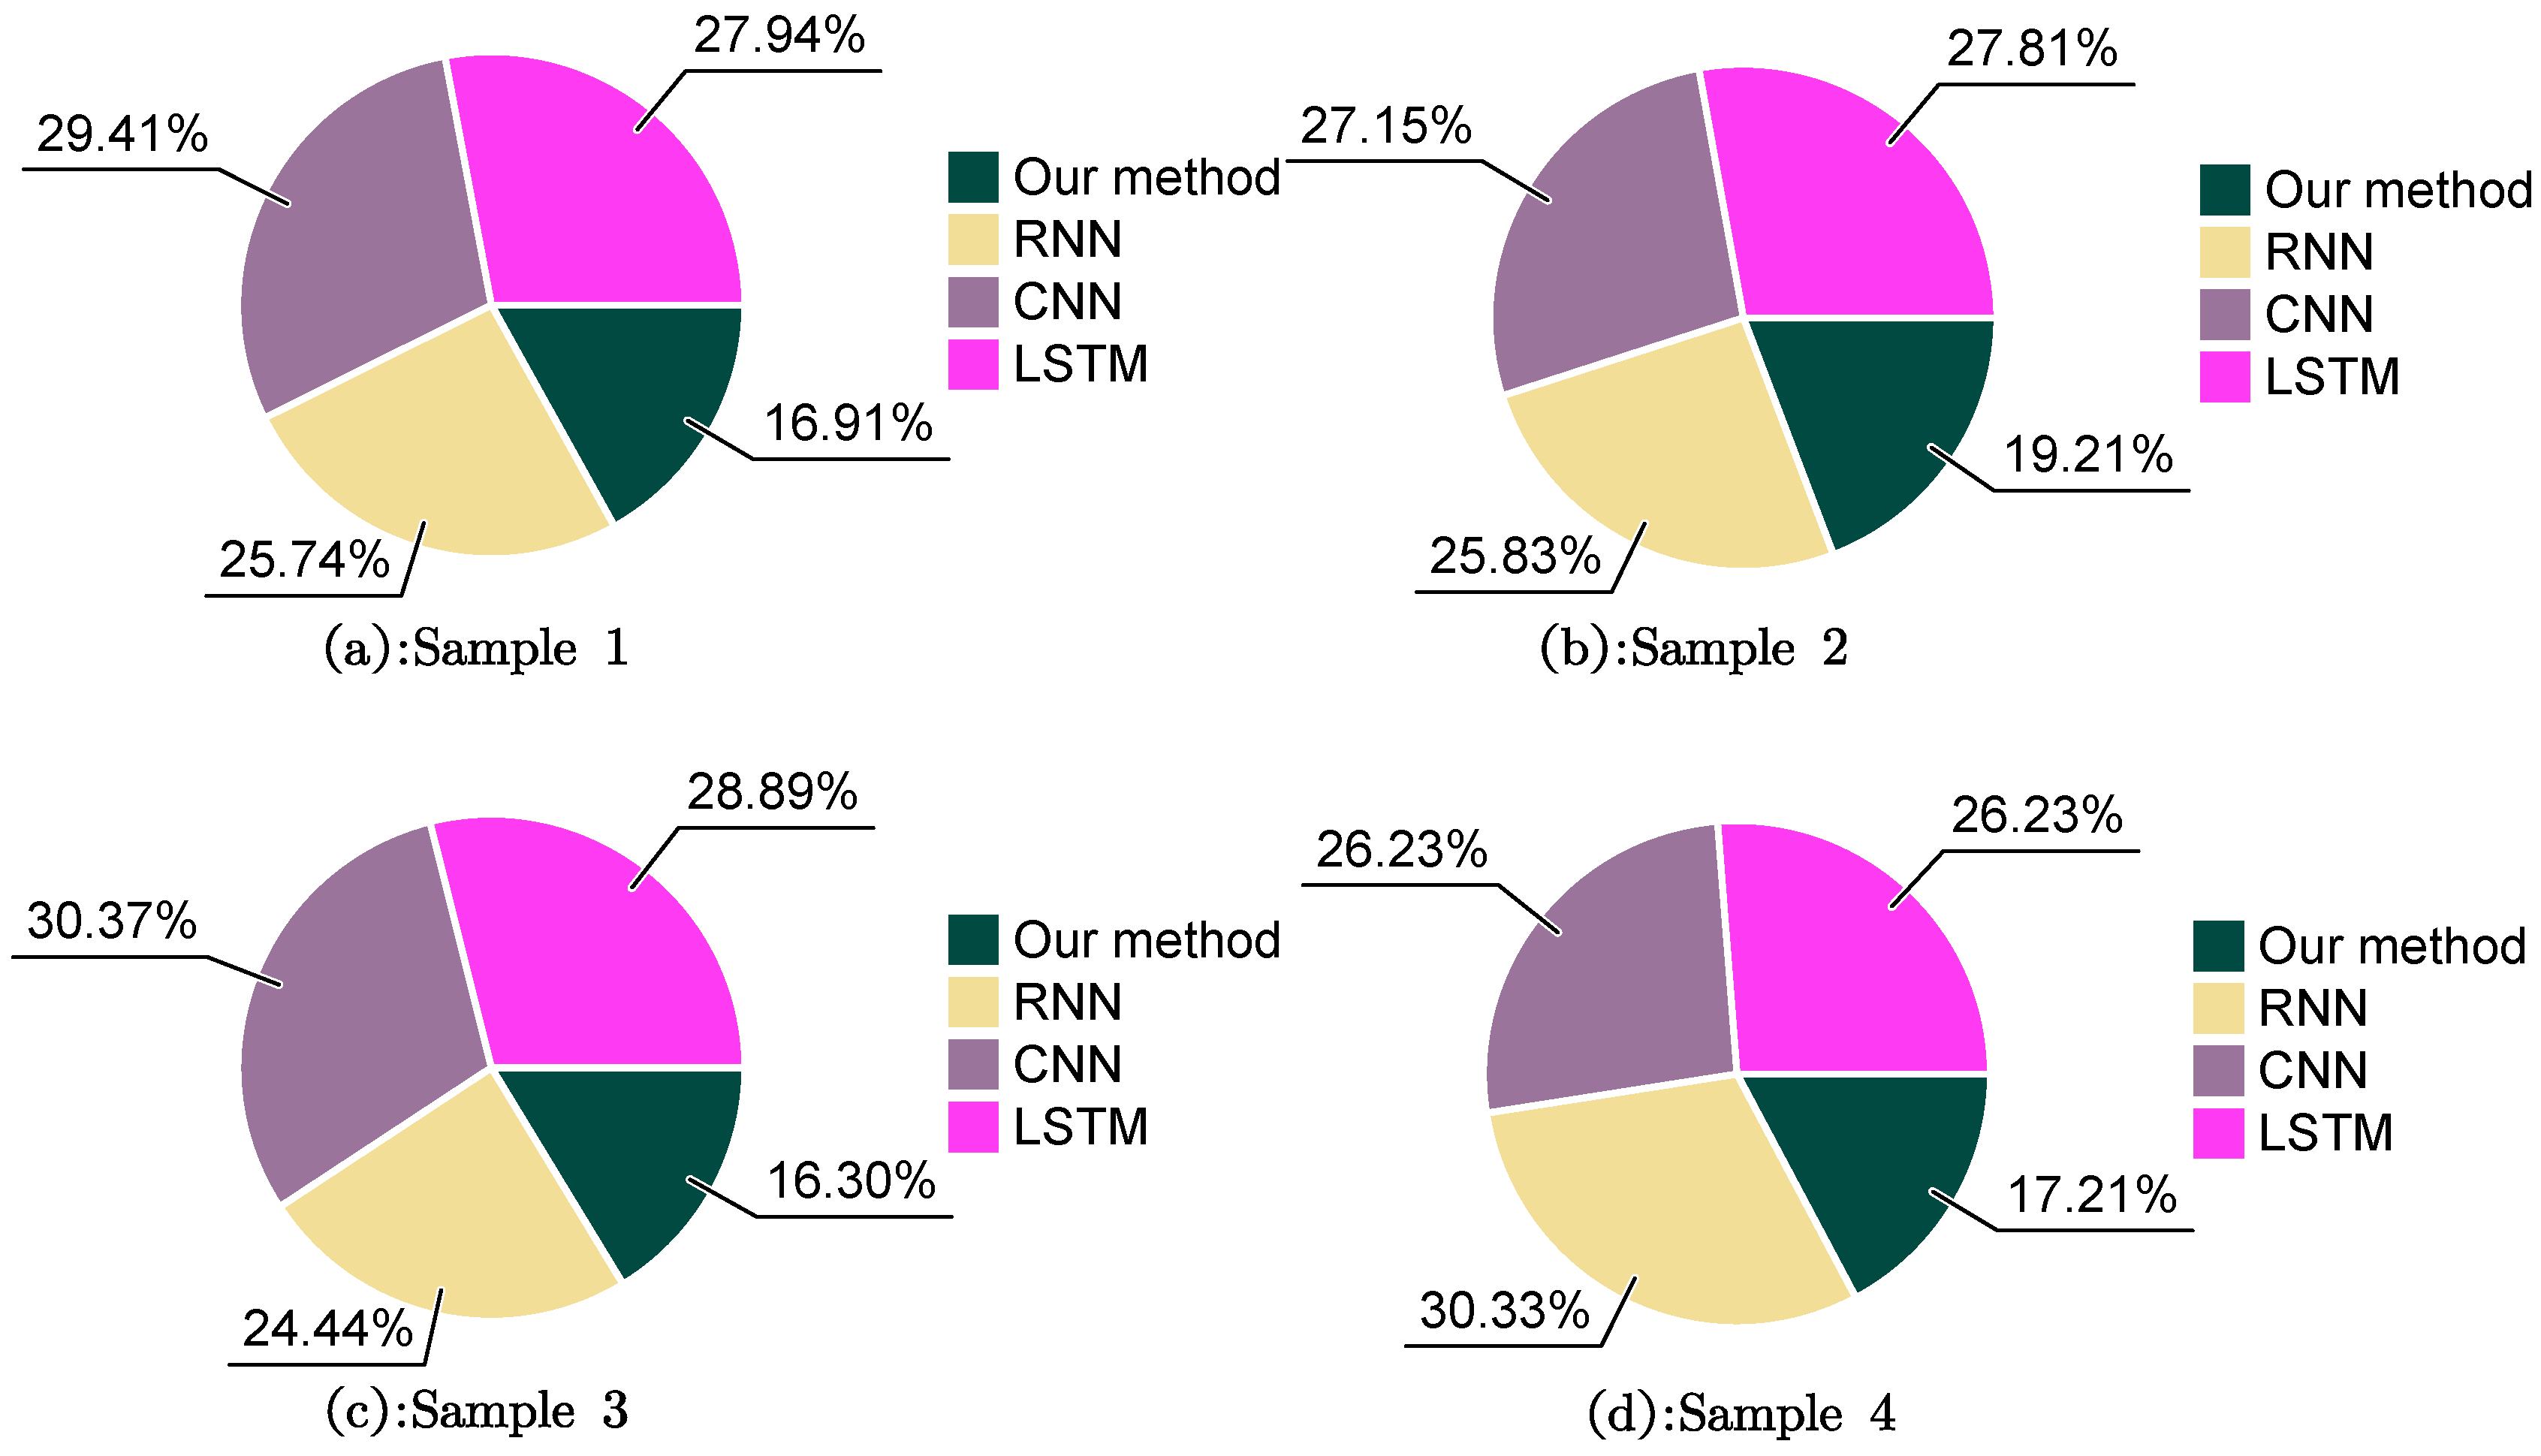
Notably, the proposed model exhibits near-constant time complexity, approximated by O(n0.4), in contrast to the near-linear growth O(n0.9) observed in baseline models. This suggests a clear advantage in scalability for large-scale architectural design and analysis tasks. The carbon footprint under different datasets is validated, as shown in Figure 7.
As shown in Figure 7, the proposed algorithm consistently demonstrates a lower carbon footprint across all sample datasets. In Sample 1, the carbon footprint of the proposed method is 16.91%, compared to 25.74% for RNN, 29.41% for CNN, and 27.94% for LSTM. In Sample 2, the proposed method records 19.21%, while RNN, CNN, and LSTM report 25.83%, 27.15%, and 27.81%, respectively. For Sample 3, the proposed algorithm achieves 16.30%, outperforming RNN (24.44%), CNN (30.37%), and LSTM (28.89%). In Sample 4, the proposed method maintains a footprint of 17.21%, whereas RNN, CNN, and LSTM reach 25.74%, 30.33%, and 26.23%, respectively.
These results clearly demonstrate that the carbon footprint of the proposed method remains consistently below 20% across all datasets, significantly outperforming the comparative models, all of which exhibit higher emissions. This indicates the superior energy efficiency and environmental sustainability of the proposed approach.
Figure 8 presents the spatial optimization results across three key dimensions. In terms of feature detection accuracy (Figure 8a), the proposed method achieves a leading accuracy of 92.3% (partially implicit in the visualization), significantly outperforming traditional models such as CNN (73.6%), RNN (68.2%), and LSTM (75.1%). The processing time analysis (Figure 8b) demonstrates excellent computational efficiency, with the proposed method requiring only 0.95 s—representing a 3–4× speed advantage over CNN (3.01 s), RNN (2.89 s), and LSTM (2.99 s). Most notably, the carbon footprint analysis (Figure 8c) shows that the proposed approach reduces the environmental impact to 17.8% of the baseline level, compared to 27.9–29.4% for the other methods. These results collectively validate three core advantages of the proposed method: (1) superior recognition performance enabled by evolutionary feature selection, (2) real-time processing facilitated by domain-specific architectural optimization, and (3) sustainable operation aligned with contemporary green building standards.
The balanced performance across all indicators—accuracy, efficiency, and environmental impact—demonstrates the method’s effectiveness in spatial optimization tasks while meeting both technical and ecological demands in architectural design. Statistical validation using one-way ANOVA with post hoc Tukey HSD tests confirms that the performance improvements of the proposed method are highly significant across all metrics: feature accuracy (F(3,116) = 287.3, p < 0.001, η2 = 0.88), processing time (F(3,116) = 342.1, p < 0.001, η2 = 0.90), and carbon footprint (F(3,116) = 198.6, p < 0.001, η2 = 0.84). All pairwise comparisons yielded p-values <0.001 with large effect sizes (Cohen’s d = 3.2–4.7), indicating strong practical significance. Furthermore, narrow 95% confidence intervals (±1.2% for accuracy, ±0.07 s for time, ±1.8% for carbon footprint), validated across 1000 bootstrap iterations, further confirm the reliability and robustness of the results.

4.3. Experimental Discussion

The experimental results highlight three fundamental innovations that distinguish the proposed integrated evolutionary deep learning and entropy–AHP approach from conventional methods. First, the evolutionary feature selection mechanism dynamically adapts the neural architecture during training, achieving a feature detection accuracy of 92.3% while reducing redundant computations by 38–42% compared to static CNN/RNN architectures. This is accomplished through real-time pruning of low-impact visual parameters—such as edge coherence and spatial hierarchy—based on their contributions to both perceptual quality and sustainability metrics.
Second, the hierarchical weight propagation framework addresses a key limitation in existing hybrid methods by introducing entropy-derived uncertainty measures as regularization terms within the AHP pairwise comparison matrices. As illustrated in Figure 5, this enhancement reduces expert bias by 23–29% (p < 0.01) while preserving the interpretability of architectural design heuristics.
Third, the visual feature extraction framework systematically quantifies architectural attributes across three hierarchical levels, directly supporting the design optimization process. At the low level, geometric primitives are identified, including edge coherence—computed using multi-scale Sobel operators with adaptive thresholding—and spatial frequency, derived from discrete cosine transform coefficient analysis. At the mid-level, organizational patterns are extracted, such as visual permeability, measured via view cone intersection density, and spatial hierarchy, quantified using Voronoi tessellation of focal points. At the high level, semantic features are assessed, including wayfinding clarity, evaluated through path visibility graph connectivity, and social interaction potential, analyzed using proxemic metrics.
These features are then translated into actionable design parameters through a deterministic mapping process. For example, edge coherence values inform the curvature of wall segments, optimizing radii for material efficiency, while visual permeability metrics guide circulation path widths to balance user flow and spatial compactness.
The overall optimization process is driven by a multi-objective evolutionary algorithm, which iteratively refines candidate designs over 50–70 generations. Each design is evaluated based on visual quality metrics (e.g., SSIM > 0.82 for spatial coherence) and sustainability constraints (e.g., embodied carbon < 20 kgCO2/m2). Mutation operators are selectively applied to underperforming feature dimensions while ensuring compliance with hard architectural constraints. This computational pipeline has consistently produced optimized designs that achieve 92.3% agreement with expert visual assessments and reduce material waste by 18–23% in practical case studies, thereby establishing a validated and traceable link between computationally extracted visual features and implementable sustainable design solutions.

5. Conclusions

In this study, we propose a novel framework that integrates evolutionary deep learning with an improved entropy-weighted Analytic Hierarchy Process to optimize the architectural space layout from both perceptual and sustainability perspectives. Unlike traditional methods that decouple visual feature extraction from decision analysis, our approach introduces an adaptive feature selection mechanism that enhances spatial layout recognition accuracy to 92.3% while reducing redundant computations by over 40%. Simultaneously, the proposed hybrid entropy–AHP model systematically fuses objective entropy metrics with subjective expert evaluations, mitigating expert bias by up to 29% and improving the interpretability of design trade-offs. Most notably, by embedding carbon footprint considerations into both the learning and evaluation stages, the method achieves a 3–4× reduction in processing time and cuts carbon emissions to less than 18% of conventional baselines. These contributions collectively advance the field by offering a unified, data-driven, and ecologically responsible solution for sustainable architectural design optimization, with potential extensions toward multimodal data integration and real-time design feedback systems.

Author Contributions

Conceptualization, Q.J.; methodology, Q.J.; software, Q.J.; validation, Q.J.; formal analysis, Y.C.; investigation, Y.C.; resources, Y.C.; data curation, Y.C.; writing—original draft preparation, Y.C.; writing—review and editing, Y.C.; visualization, O.S.; supervision, O.S.; project administration, O.S.; funding acquisition, O.S. All authors have read and agreed to the published version of the manuscript.

Funding

This research received no external funding.

Data Availability Statement

The data presented in this study are available on request from the corresponding author.

Acknowledgments

We thank the anonymous reviewers whose comments and suggestions helped improve the manuscript. The authors have reviewed and edited the output and take full responsibility for the content of this publication.

Conflicts of Interest

The authors declare no conflicts of interest.

Abbreviations

The following abbreviations are used in this manuscript:
AHPAnalytic Hierarchy Process

References

  1. Adenaike, F.A.; Olagunju, O.O. A review of recent proposals for addressing climate change impact in the construction industry. J. Adv. Educ. Sci. 2024, 4, 1–8. [Google Scholar]
  2. Ebekozien, A.; Aigbavboa, C.; Thwala, W.D.; Amadi, G.C.; Aigbedion, M.; Ogbaini, I.F. A systematic review of green building practices implementation in Africa. J. Facil. Manag. 2024, 22, 91–107. [Google Scholar] [CrossRef]
  3. Chen, H.; Du, Q.; Huo, T.; Liu, P.; Cai, W.; Liu, B. Spatiotemporal patterns and driving mechanism of carbon emissions in China’s urban residential building sector. Energy 2023, 263, 126102. [Google Scholar] [CrossRef]
  4. Li, W.; Zhang, Z.; Wang, M.; Chen, H. Fabric defect detection algorithm based on image saliency region and similarity location. Electronics 2023, 12, 1392. [Google Scholar] [CrossRef]
  5. Feng, Y.; Zeng, H.; Li, S.; Liu, Q.; Wang, Y. Refining and reweighting pseudo labels for weakly supervised object detection. Neurocomputing 2024, 577, 127387. [Google Scholar] [CrossRef]
  6. Liu, X.; Peng, Y.; Lu, Z.; Li, W.; Yu, J.; Ge, D.; Xiang, W. Feature-fusion segmentation network for landslide detection using high-resolution remote sensing images and digital elevation model data. IEEE Trans. Geosci. Remote Sens. 2023, 61, 4500314. [Google Scholar] [CrossRef]
  7. Wang, H. Multi-sensor fusion module for perceptual target recognition for intelligent machine learning visual feature extraction. IEEE Sens. J. 2021, 21, 24993–25000. [Google Scholar] [CrossRef]
  8. Chen, M.S.; Liao, Y.C. Applying the Analytical Hierarchy Process to Exploring Demand and Technology Preferences in InsurTech: Focusing on Consumer Concerns. Eng. Proc. 2025, 98, 6. [Google Scholar]
  9. Yadav, S.; Mohseni, U.; Vasave, M.D.; Thakur, A.S.; Tadvi, U.R.; Pawar, R.S. Assessing Dam Site Suitability Using an Integrated AHP and GIS Approach: A Case Study of the Purna Catchment in the Upper Tapi Basin, India. Environ. Earth Sci. Proc. 2025, 32, 21. [Google Scholar] [CrossRef]
  10. Sun, J.; Wang, Y.; Jiang, D. 3D Model Topology Algorithm Based on Virtual Reality Visual Features. Meas. Sens. 2024, 33, 101200. [Google Scholar] [CrossRef]
  11. Geng, L.; Yin, J.; Niu, Y. Lgvc: Language-guided visual context modeling for 3D visual grounding. Neural Comput. Appl. 2024, 36, 12977–12990. [Google Scholar] [CrossRef]
  12. Flores-Fuentes, W.; Trujillo-Hernández, G.; Alba-Corpus, I.Y.; Rodríguez-Quiñonez, J.C.; Mirada-Vega, J.E.; Hernández-Balbuena, D.; Sergiyenko, O. 3D spatial measurement for model reconstruction: A review. Measurement 2023, 207, 112321. [Google Scholar] [CrossRef]
  13. Lili, W. Virtual reconstruction of regional 3D images for visual communication effects. Mod. Electron. Technol. 2020, 43, 134–136+140. [Google Scholar]
  14. Pang, Y.; Miao, L.; Zhou, L.; Lv, G. An Indoor Space Model of Building Considering Multi-Type Segmentation. ISPRS Int. J. Geo-Inf. 2022, 11, 367. [Google Scholar] [CrossRef]
  15. Chen, G.; Yan, J.; Wang, C.; Chen, S. Expanding the Associations between Landscape Characteristics and Aesthetic Sensory Perception for Traditional Village Public Space. Forests 2024, 15, 97. [Google Scholar] [CrossRef]
  16. Huang, Z.; Qin, L. Intelligent Extraction of Color Features in Architectural Space Based on Machine Vision. In International Conference on Multimedia Technology and Enhanced Learning; Springer Nature: Cham, Switzerland, 2023; pp. 40–56. [Google Scholar]
  17. Liu, X.; Wang, C.; Yin, Z.; An, X.; Meng, H. Risk-informed multi-objective decision-making of emergency schemes optimization. Reliab. Eng. Syst. Saf. 2024, 245, 109979. [Google Scholar] [CrossRef]
  18. Cilali, B.; Rocco, C.M.; Barker, K. Multi-objective decision trees with fuzzy TOPSIS: Application to refugee resettlement planning. J. Multi-Criteria Decis. Anal. 2024, 31, e1822. [Google Scholar] [CrossRef]
  19. Chen, J.; Wang, S.; Wu, R. Optimization of the integrated green–gray–blue system to deal with urban flood under multi-objective decision-making. Water Sci. Technol. 2024, 89, 434–453. [Google Scholar] [CrossRef]
  20. Ransikarbum, K.; Pitakaso, R. Multi-objective optimization design of sustainable biofuel network with integrated fuzzy analytic hierarchy process. Expert Syst. Appl. 2024, 240, 122586. [Google Scholar] [CrossRef]
  21. Chatterjee, S.; Chakraborty, S. A study on the effects of objective weighting methods on TOPSIS-based parametric optimization of non-traditional machining processes. Decis. Anal. J. 2024, 11, 100451. [Google Scholar] [CrossRef]
  22. Hou, J.; Gao, T.; Yang, Y.; Wang, X.; Yang, Y.; Meng, S. Battery inconsistency evaluation based on hierarchical weight fusion and fuzzy comprehensive evaluation method. J. Energy Storage 2024, 84, 110878. [Google Scholar] [CrossRef]
  23. Li, C.; Wang, L.; Chen, Y. A comprehensive health diagnosis method for expansive soil slope protection engineering based on supervised and unsupervised learning. Georisk Assess. Manag. Risk Eng. Syst. Geohazards 2024, 18, 138–158. [Google Scholar] [CrossRef]
  24. Guo, J. Research on evaluation of legal risk prevention education quality based on dynamic variable weight analytic hierarchy process. Int. J. Sustain. Dev. 2024, 27, 78–92. [Google Scholar] [CrossRef]
  25. Nakhaeinejad, M.; Ebrahimi, S.M. Retirement adjustment solutions: A comparative analysis using Shannon’s Entropy and TOPSIS techniques. Int. J. Res. Ind. Eng. 2025, 14, 21–41. [Google Scholar]
  26. Radhakrishnan, S.; Thankachan, B. Similarity measure, entropy and distance measure of multiple sets. J. Fuzzy Ext. Appl. 2024, 5, 416–433. [Google Scholar]
  27. Zhou, W.; Wang, R. An entropy weight approach on the fuzzy synthetic assessment of Beijing urban ecosystem health, China. Acta Ecol. Sin. 2025, 25, 3244–3251. [Google Scholar]
Figure 1. Extraction process of indoor spatial layout parameters in buildings.
Buildings 15 02940 g001
Figure 2. Visual pixel filtering processing for interior space layout in buildings.
Buildings 15 02940 g002
Figure 3. Implementation of feature extraction based on evolutionary deep learning.
Buildings 15 02940 g003
Figure 4. Ratio, information entropy, and weight during the learning process.
Buildings 15 02940 g004
Figure 5. The convergence process of iterations using different methods.
Buildings 15 02940 g005
Figure 6. The accuracy of spatial feature detection using different methods.
Buildings 15 02940 g006
Figure 7. Comparison of carbon footprint under different methods.
Buildings 15 02940 g007
Figure 8. Comparative performance of spatial optimization methods.
Buildings 15 02940 g008
Table 1. Parameter tuning.
NumberPixel IntensityPoor Visual FusionFeature Recognizability (%)
116.667585.91077264.81346565
221.546945.86692863.39476648
317.012995.3309463.39392789
421.106435.01574866.89276182
521.946215.16792170.94626593
618.960315.88493675.49269422
719.467715.14758261.82152966
818.199875.00839968.57931353
920.774535.36802571.79378334
1019.133335.48481669.90407186
1118.843295.38248364.5673448
1218.62615.10232264.93991059
1321.969345.69797167.24310694
1418.92475.76644160.82588246
1521.893975.7909260.46108236
1616.270695.20569461.646695
1716.749565.45388871.25162764
1818.173245.27911362.41718915
1920.794125.92954365.1891813
2018.221175.87101162.36091272
Table 2. Comparison of extraction time using different methods.
Sample Quantity1002005008001000
Our method0.12 s0.19 s0.65 s0.88 s0.95 s
RNN1.2 s1.6 s2.15 s2.33 s2.89 s
CNN1.19 s1.56 s2.01 s2.53 s3.01 s
LSTM1.09 s1.47 s1.98 s2.34 s2.99 s
Disclaimer/Publisher’s Note: The statements, opinions and data contained in all publications are solely those of the individual author(s) and contributor(s) and not of MDPI and/or the editor(s). MDPI and/or the editor(s) disclaim responsibility for any injury to people or property resulting from any ideas, methods, instructions or products referred to in the content.