1. Introduction
Underground utility tunnels are integrated structures that house various engineering pipelines, such as electricity, gas, and heating systems, underground for centralized management. Their construction facilitates the rational use of underground space resources and aligns with the concept of sustainable development. Thus, the development of underground utility tunnels represents a significant public welfare project in China.
Ground fissures, a typical geohazard in Xi’an, substantially impact urban construction. Extensive research has been conducted on the structural deformation mechanisms of subway tunnels affected by ground fissure activity. Scholars such as Peng Jianbing [
1,
2], Zhang Dan [
3], Yuan Liqun [
4], Meng Zhenjiang [
5], Yang Longwei [
6], and Huang Qiangbing [
7] employed physical model tests, while Yang Zhao [
8], Huang Qiangbing [
9], Mei Yuan [
10], and Gou Yuxuan [
11] utilized numerical simulations to investigate the deformation and failure mechanisms of subway tunnels under the influence of Xi’an ground fissures. The current research highlights three primary changes: (1) ground fissure activity alters the stress distribution in tunnel structures; (2) tunnels exhibit dislocation deformation; and (3) voids form at the base of the structure. These findings provide valuable references for studying the impact of ground fissures on similar utility tunnels. However, due to structural differences between subway tunnels and utility tunnels, the challenges posed by ground fissures in Xi’an’s utility tunnel construction have become increasingly apparent. Consequently, many scholars have shifted their focus to research on underground utility tunnels.
Canto-Perello [
12] analyzed the necessity of utility tunnels in urban development. Li [
13], Chen [
14], and Hu Zhiping [
15] established physical models of utility tunnels intersecting with ground fissures to analyze the mechanical behavior at different intersection angles. Deng Botuan et al. [
16] calculated the range of voids beneath utility tunnels affected by ground fissures based on elastoplastic theory. Scholars such as Yan Yufeng [
17,
18], Zhang Yutong [
19], Xu Qiang [
20], and Wang Qiyao [
21] developed finite element models of utility tunnels intersecting with ground fissures under various project contexts, analyzing the mechanical response of utility tunnels under different dislocation magnitudes. Liu Wen [
22] and Liu Yang [
23] have each delved into the construction technologies applicable to irregularly shaped utility tunnels within specific geological contexts.
However, current research primarily focuses on typical rectangular cross-section utility tunnels. With evolving design requirements, flat-deck section utility tunnels have become increasingly prevalent. The mechanical characteristics of utility tunnels with different cross sections under ground fissure activity vary significantly.
Therefore, this paper employs numerical simulation to analyze the mechanical behavior of a flat-deck section utility tunnel under ground fissure activity, based on a specific underground utility tunnel project. The findings aim to provide references for the design and construction of utility tunnels.
2. Characteristics of Construction Technology for Irregular Utility Tunnels
2.1. Structural Features of Irregular Utility Tunnels
The cross sections of utility tunnels can be categorized based on morphological characteristics, the number of compartments, and functional positioning. Morphologically, they are primarily classified as rectangular, circular, or horseshoe shaped. Based on compartment count, they are divided into single-cell, double-cell, and multi-cell types. Special functional designs include flat-deck sections and variable cross-section types. Among these, the single-cell rectangular, standard double-cell rectangular, and flat-deck sections are the predominant forms used beneath urban roads [
24].
The single-cell rectangular section consists of a single enclosed space, typically constructed using the cut-and-cover method. Its structural behavior is dominated by a rigidly connected frame on all four sides. External earth pressure and overburden loads are transferred through the sidewalls and roof slab to the base slab. The rigid connections at the corners are prone to stress concentrations, exhibiting high shear stress and bending moments. In rectangular sections, the mid-span of the sidewalls experiences significant horizontal bending moments, while the roof slab concentrates bending moments at its center. The base slab requires specific checks against buoyancy. Square sections generally demonstrate more-uniform stress distribution than elongated rectangular ones.
The standard double-cell rectangular section incorporates a central partition wall, creating a “double-frame parallel” structural system. This design is suitable for scenarios requiring safety isolation between different utility pipelines. The central partition wall serves both separation and load-bearing functions. Under loading, the outer sidewalls resist lateral earth pressure, while the central partition must withstand horizontal loads from both compartments and potential asymmetric horizontal forces. The support provided by the partition wall reduces the effective span of both the roof and base slabs, leading to significantly lower mid-span bending moments than in single-cell sections. However, attention must be paid to local compressive stresses at the junctions between the partition wall and the roof/base slabs. Furthermore, the symmetry of loading in the two compartments considerably influences the bending moments in the partition wall.
The flat-deck section, characterized by its “oblate rectangular” shape where the height is considerably less than the width, often incorporates transverse rib beams. It is particularly suitable for shallow-buried tunnels or scenarios accommodating large-diameter horizontal pipelines. Its structural core is a “long-span flat frame”. Loads on the roof slab are transferred to the sidewalls via transverse rib beams or a thickened roof slab. The low height of the sidewalls leads to their primary function being “vertical compression”. Similarly, the large span of the base slab necessitates reinforced reinforcement or rib beams to resist mid-span bending moments. A key design focus is mitigating horizontal bending in the roof and base slabs to prevent excessive deflection (sagging) or uplift (hogging). A schematic of the flat-deck utility tunnel cross section is illustrated in
Figure 1.
2.2. Construction Process Flow for Special-Shaped Utility Tunnel Structures
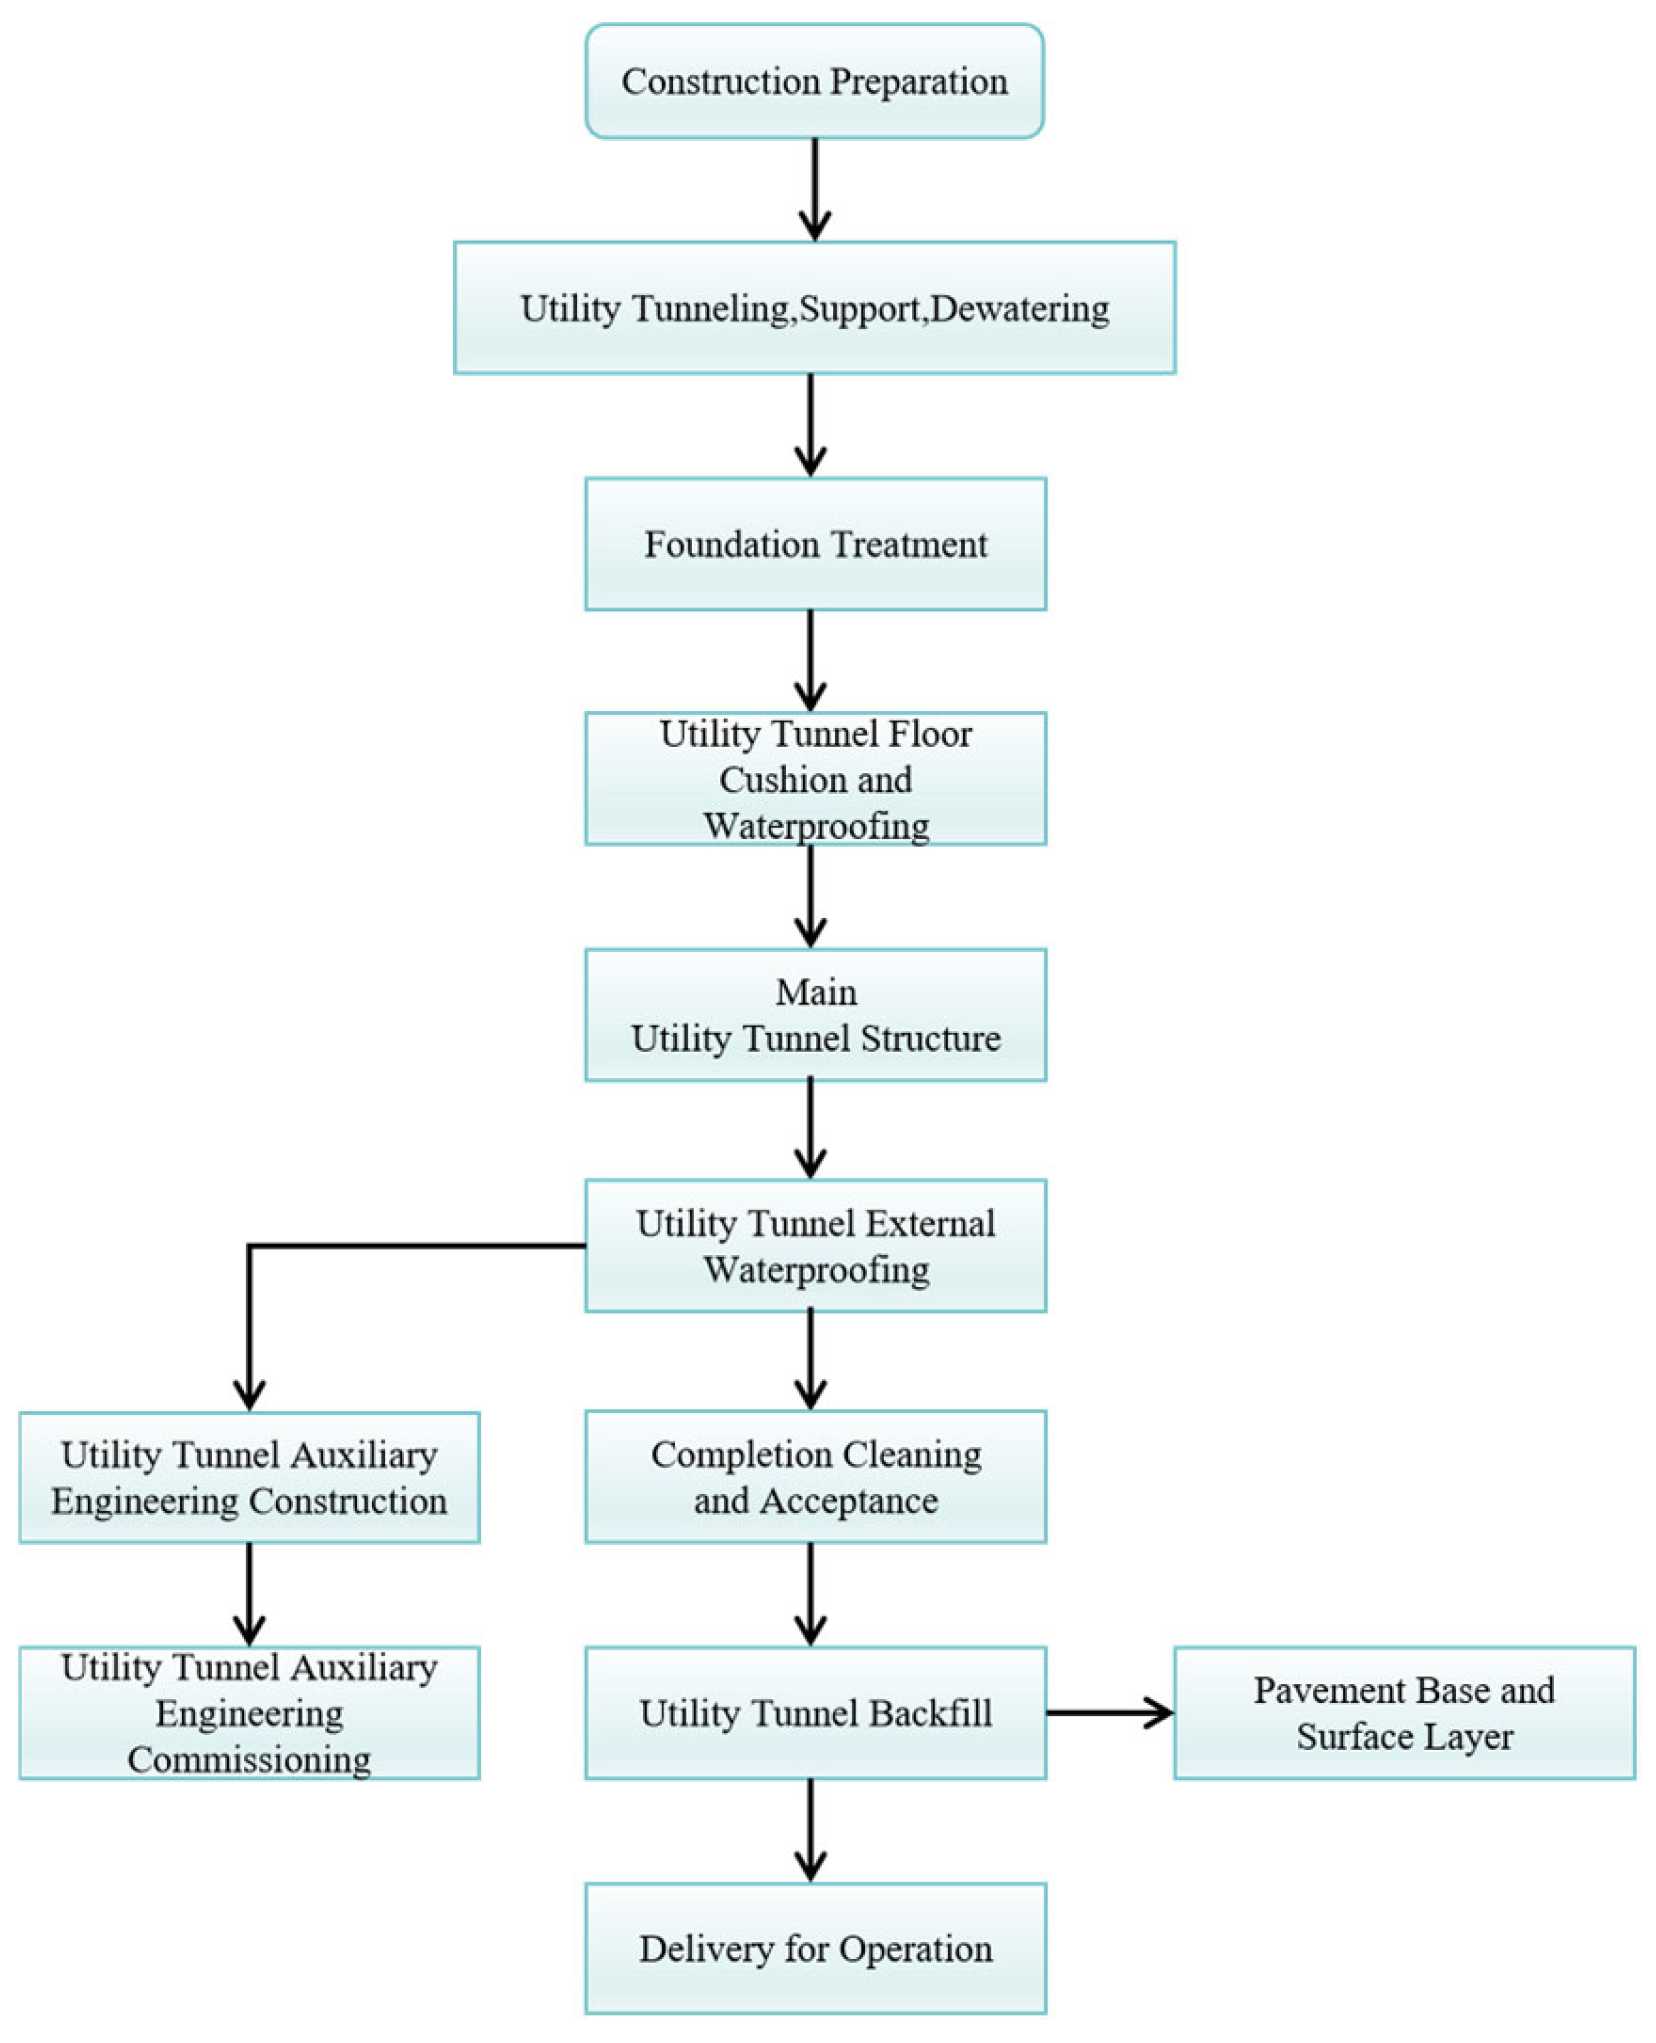
In areas with active ground fissures, the construction of special-shaped utility tunnels (this study takes the flat-deck cross section as the research object) requires a holistic consideration of two core elements—cross-section adaptability and geological risk prevention and control—due to their complex structural morphology and unique geological environment. The utility tunnel construction process flow chart is shown in
Figure 2.
2.2.1. Construction Preparation
As the foundational stage for quality control in the construction of special-shaped utility tunnels, the construction preparation phase requires focused implementation of three core tasks: detailed geological survey, optimization of the construction scheme, and selection of materials and equipment. This provides technical assurance for the orderly execution of subsequent construction activities.
Detailed Geological Survey: Special survey operations must be conducted in areas traversed by ground fissures. Combined detection techniques using borehole CT and ground-penetrating radar should be employed to accurately determine the orientation of the fissures, dislocation rate, and the physical and mechanical indices of the surrounding soil. Particular attention must be paid to clarifying the distribution of soil layers between the hanging wall and footwall of the fissures, providing precise geological data support for the design of foundation pit support and structural stress analysis. Concurrently, based on the survey results, a predictive model for ground fissure activity should be established to estimate the maximum potential dislocation during construction, based on which dynamic adjustment plans are formulated.
Optimization of Construction Scheme: The optimization should focus on the construction difficulties of the special-shaped cross section and the prevention and control of risks associated with ground fissures. Building Information Modeling technology should be used to create a three-dimensional parametric model of the utility tunnel. Construction simulations should be performed for the junction between the large and small compartments in the flat-deck cross section to optimize the layout of the formwork support system. Considering the stress concentration phenomenon at the junction, a combined support scheme of “primary and secondary walers and full framing” is designed. This ensures the stiffness of the formwork system meets the pouring requirements of the special-shaped cross section. Furthermore, considering the risk of ground fissure dislocation, the principle of “segmental construction, skip pouring” is explicitly stated in the construction scheme. The utility tunnel is divided into several construction units along its axis, with a pouring interval of no less than 7 days between adjacent units to prevent structural cracking caused by the combined effects of concrete shrinkage and ground fissure disturbance.
2.2.2. Foundation Pit Support
The support for the utility tunnel foundation pit in areas with active ground fissures must resist both soil pressure and the dislocation action of the fissures. A composite support system of “pile-anchor support + waterproof curtain” is adopted. The specific process encompasses three key steps: support structure construction, dewatering operations, and foundation pit excavation, ensuring slope stability during excavation and preventing foundation pit instability accidents induced by ground fissure dislocation.
Support structure construction commences with the installation of a waterproof curtain using the triple-axis mixing pile method, forming a continuous barrier around the excavation. The permeability coefficient of the curtain is controlled below 1 × 10⁻⁶ cm/s to minimize groundwater drawdown-induced soil disturbance and associated fissure dislocation. Following curtain completion, bored cast-in-place piles are installed and topped with a reinforced concrete capping beam to improve the structural integrity of the support system. In sections intersected by ground fissures, high-pressure jet grouting piles are additionally applied outside the cast-in-place piles to create a secondary waterproof reinforcement zone. Stress sensors are embedded in the piles to monitor real-time stress variations caused by fissure activity.
For dewatering, a combined system of deep wells around the excavation and wellpoints inside is employed to lower the groundwater level to 1.5 m below the base. An automated water level monitoring system is utilized to prevent rapid drawdown that could induce soil consolidation and fissure reactivation. Settlement monitoring points are established within the zone of influence. If cumulative settlement exceeds 5 mm at any point, dewatering rates are adjusted, and recharge measures are implemented to stabilize external groundwater levels.
Excavation proceeds using the “layer-by-layer, timely support” method. Anchor rod installation for each layer is completed within 24 h after excavation. Cement grout with a water–cement ratio of 0.5 is injected at a controlled pressure of 1.2–1.5 MPa to ensure effective soil–anchor bonding. A total station continuously monitors slope displacement at frequencies of every 4 h during active excavation and every 12 h post-excavation per layer. Excavation is suspended if the horizontal displacement rate exceeds 2 mm/d, with corrective measures such as top unloading or temporary bracing applied to prevent collapse.
2.2.3. Main Utility Tunnel Structure Construction
The main structure construction is the core link in building the special-shaped utility tunnel. Key control must be exercised over four critical processes: formwork installation, rebar binding, concrete pouring, and construction of the posterior pour strip. Special technical measures are particularly required for the junction between the large and small compartments in the flat-deck cross section to mitigate risks associated with superimposed construction-induced stress and ground fissure dislocation [
25].
Formwork Installation: The principle of “overall positioning first, local fine-tuning later” must be strictly followed. Firstly, based on the formwork positioning coordinates generated by the BIM model, a laser locator is used to control deviations in formwork axis and elevation within ±3 mm. Subsequently, the formwork at the junction of the large and small compartments is reinforced: steel pipe diagonal bracings are added outside the junction. One end of the bracing is welded to the primary waler of the formwork, and the other end is connected to the embedded parts of the foundation pit support piles, forming a stable triangular support system to prevent formwork deformation during pouring. After formwork installation, a total station is used for review and acceptance, ensuring the geometric dimensions of the special-shaped cross section meet design requirements. Simultaneously, the sealing at formwork joints is checked to avoid grout leakage.
Rebar Binding: Rebar binding proceeds in the sequence of “first base slab, then wall panels, finally roof slab.” The base slab reinforcement adopts a “double-layer bidirectional” layout. Reinforcement in the wall and roof slabs requires strengthening at the junction of the large and small compartments, specifically by adding reinforcement mesh at the junction. The mesh is connected to the main reinforcement by binding, ensuring the anchorage length at the junction meets design requirements. During rebar binding, positions for installing stress sensors and displacement monitoring points must be reserved. After sensor installation, debugging is conducted to ensure normal data collection.
Concrete Pouring: A “layered pouring, sloping surface progression” method is adopted. The pouring sequence is as follows: base slab first, then wall panels, finally roof slab. The pouring thickness for each layer is controlled within 300 mm, and the interval between layers should not exceed the initial setting time of the concrete. For the junction between the large and small compartments in the flat-deck cross section, a “secondary vibration” process is used: the first vibration uses internal vibrators to ensure concrete compaction; the second vibration, performed before the initial set using surface vibrators, eliminates cracks caused by concrete shrinkage. During pouring, formwork deformation must be monitored in real-time. If formwork displacement exceeds 3 mm, pouring must stop immediately, and adjustments to the support system must be made before resuming [
26].
Posterior Pour Strip Construction: Strict control over pouring timing and material performance is essential. In this project, posterior pour strips are set along the tunnel axis at the junction of the large and small compartments. Pouring of the posterior pour strip is delayed by 14 days compared with the main structure construction. Before pouring, debris and laitance within the strip must be removed and cleaned with a high-pressure water jet, followed by the application of a cement-based permeable crystalline waterproof coating. Pouring of the posterior pour strip concrete adopts a scheme of “small aggregate size and layered pouring.” After thorough vibration, geotextile is laid for water-spray curing. Stress changes at the posterior pour strip location are monitored during the curing period to prevent additional stress generated by concrete expansion.
3. Experimental Design
3.1. Modeling Design
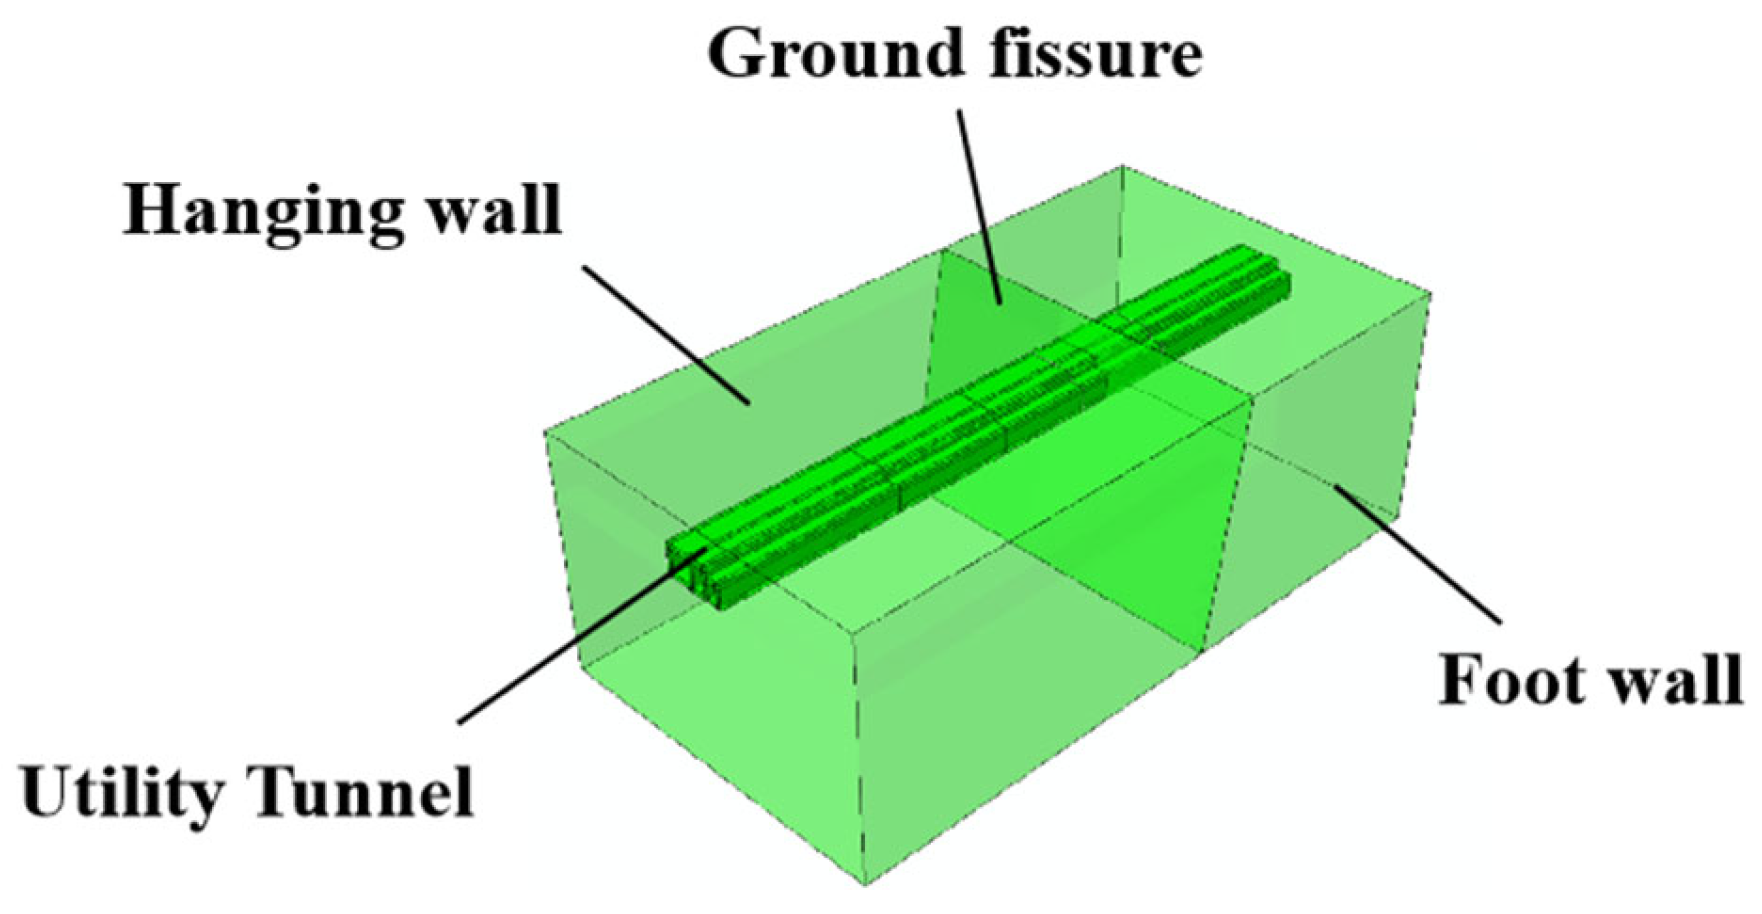
Two working conditions were considered in this study, corresponding to two numerical models: Model 1 and Model 2, representing the utility tunnel intersecting with the ground fissure at an oblique angle and an orthogonal angle, respectively. A schematic illustration of the finite element model is presented in
Figure 3. In the analysis, the soil was modeled using solid elements, while the utility tunnel was simulated with shell elements. This modeling strategy effectively reduced model complexity and computational time without compromising computational accuracy. The type of solid element is selected as the C3D8R element, where “C” stands for solid element, “3D” for 3-dimensional element, “8” for 8 nodes per element, and “R” for reduced integration. The type of shell element is selected as the S4R element, where “S” stands for shell element category, “4” for 4 nodes per element, and “R” for reduced integration. The size of the soil model is set to 100 × 60 × 40, and the Mohr–Coulomb criterion is adopted as the failure criterion for the soil and tunnel support. The number of elements is shown in
Table 1.
3.2. Material and Contact Properties
The simulation involved modeling frictional contact between the soil masses of the hanging wall and the footwall of the ground fissure, as well as frictional contact at the interface between the soil and the utility tunnel structure [
27,
28]. The parameters for the numerical analysis of stratigraphic layers are summarized in
Table 2, and the values of friction coefficients are given in
Table 3.
3.3. Boundary Conditions and Working Condition Setup
The boundary conditions of the model were established as follows: the ground surface was set as a free boundary; the base of the footwall soil mass was assigned a fixed boundary; the lateral sides of the model were constrained in their normal directions; and the boundaries of the hanging wall soil mass were prescribed as corresponding displacement boundaries [
12]. The model boundaries were placed at a location more than five times the tunnel width away, so as to mitigate the impact of reaction stress waves caused by boundary constraints on the key results around the tunnel. This paper attempts to use the model change function in Abaqus to simulate the phased pouring and curing interval. The following steps are analyzed: Step 1 (Initial): Geostatic stress balance. Step 2 (Construction): The elements of each tunnel segment are “activated” in sequence to simulate phased pouring. At this point, the self-weight of the new segment is applied. Final Step (Application with Fault): After all segments are activated and the structure bears the full self-weight, fault displacement is applied.
Since ground fissure displacement is mostly a slow and continuous geological movement, the load application rate of this model is set to uniformly apply the preset total vertical displacement of 50 mm within a fixed analysis time. The loading step size is configured such that, within a total loading time of 1000 s, the initial time increment is specified as 1 s, with a maximum increment of 50 s, allowing the model to adaptively adjust the loading. Additionally, the NLGEOM option is selected in the ABAQUS analysis step.
To analyze the mechanical behavior of the utility tunnel under varying dislocation magnitudes of the ground fissure, a series of downward vertical displacements (0 cm, 10 cm, 20 cm, 30 cm, 40 cm, and 50 cm) were applied to all nodes at the base of the hanging wall in the model.
For the flat-deck section utility tunnel analyzed in this study, four specific measurement points were selected for result extraction: (1) Position 1 at the top of the partition wall; (2) Position 2 at the top of the partition wall; (3) Position 1 at the bottom of the partition wall; and (4) Position 2 at the bottom of the partition wall. The specific locations and spatial relationships of these points are illustrated in
Figure 1. The analysis working conditions are summarized in
Table 4.
4. Structural Mechanical Properties and Coupled Analysis
4.1. Soil and Utility Tunnel Deformation
4.1.1. Oblique Intersection Condition
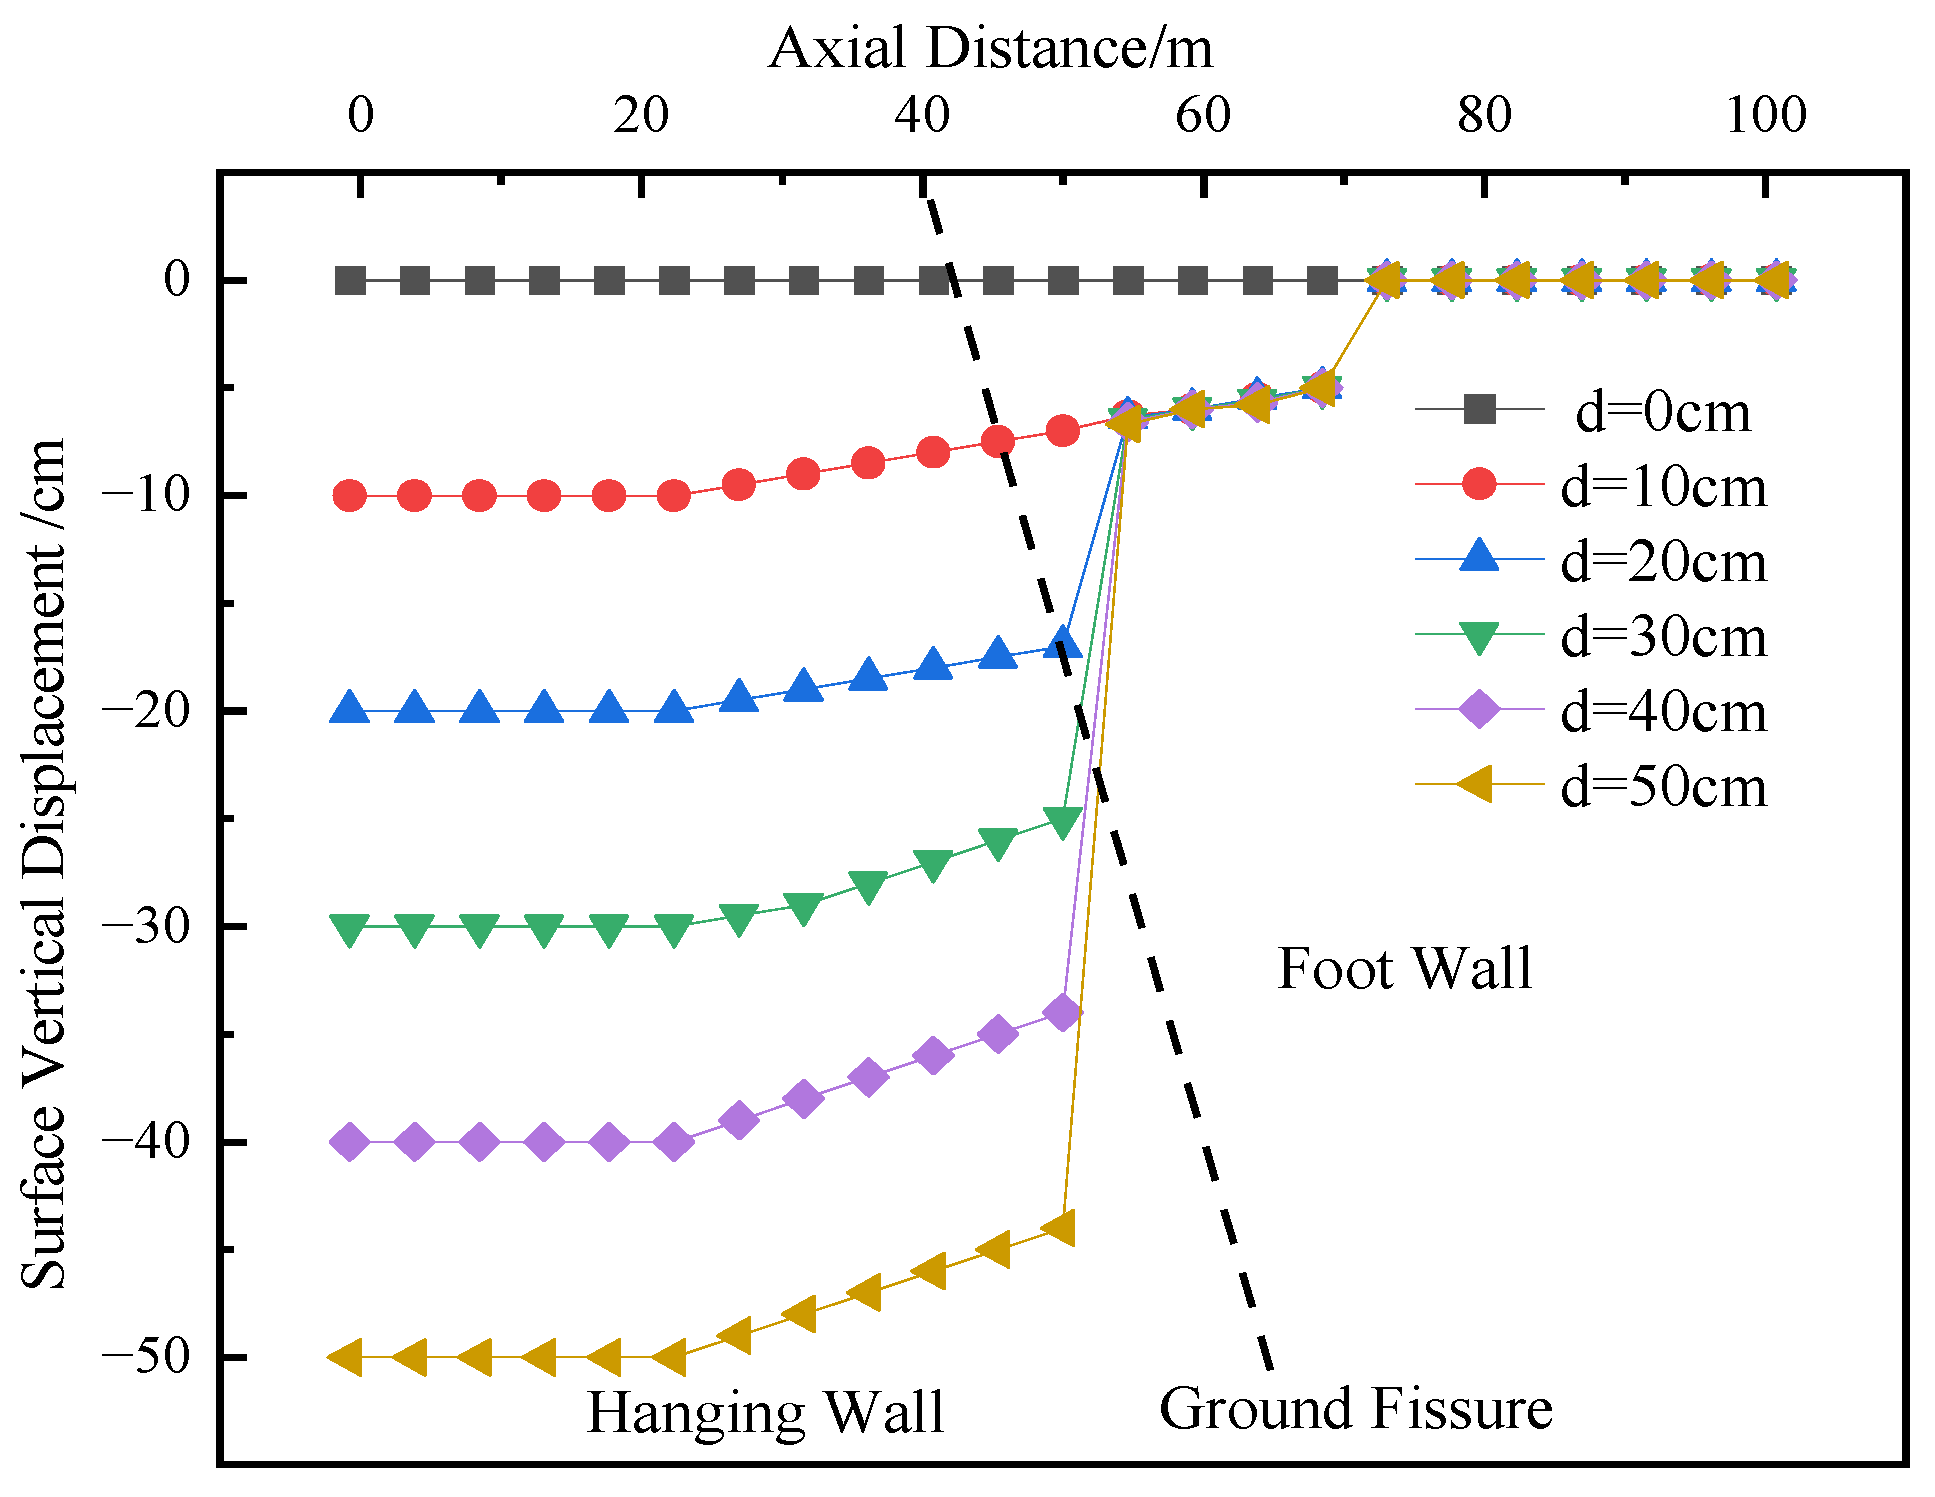
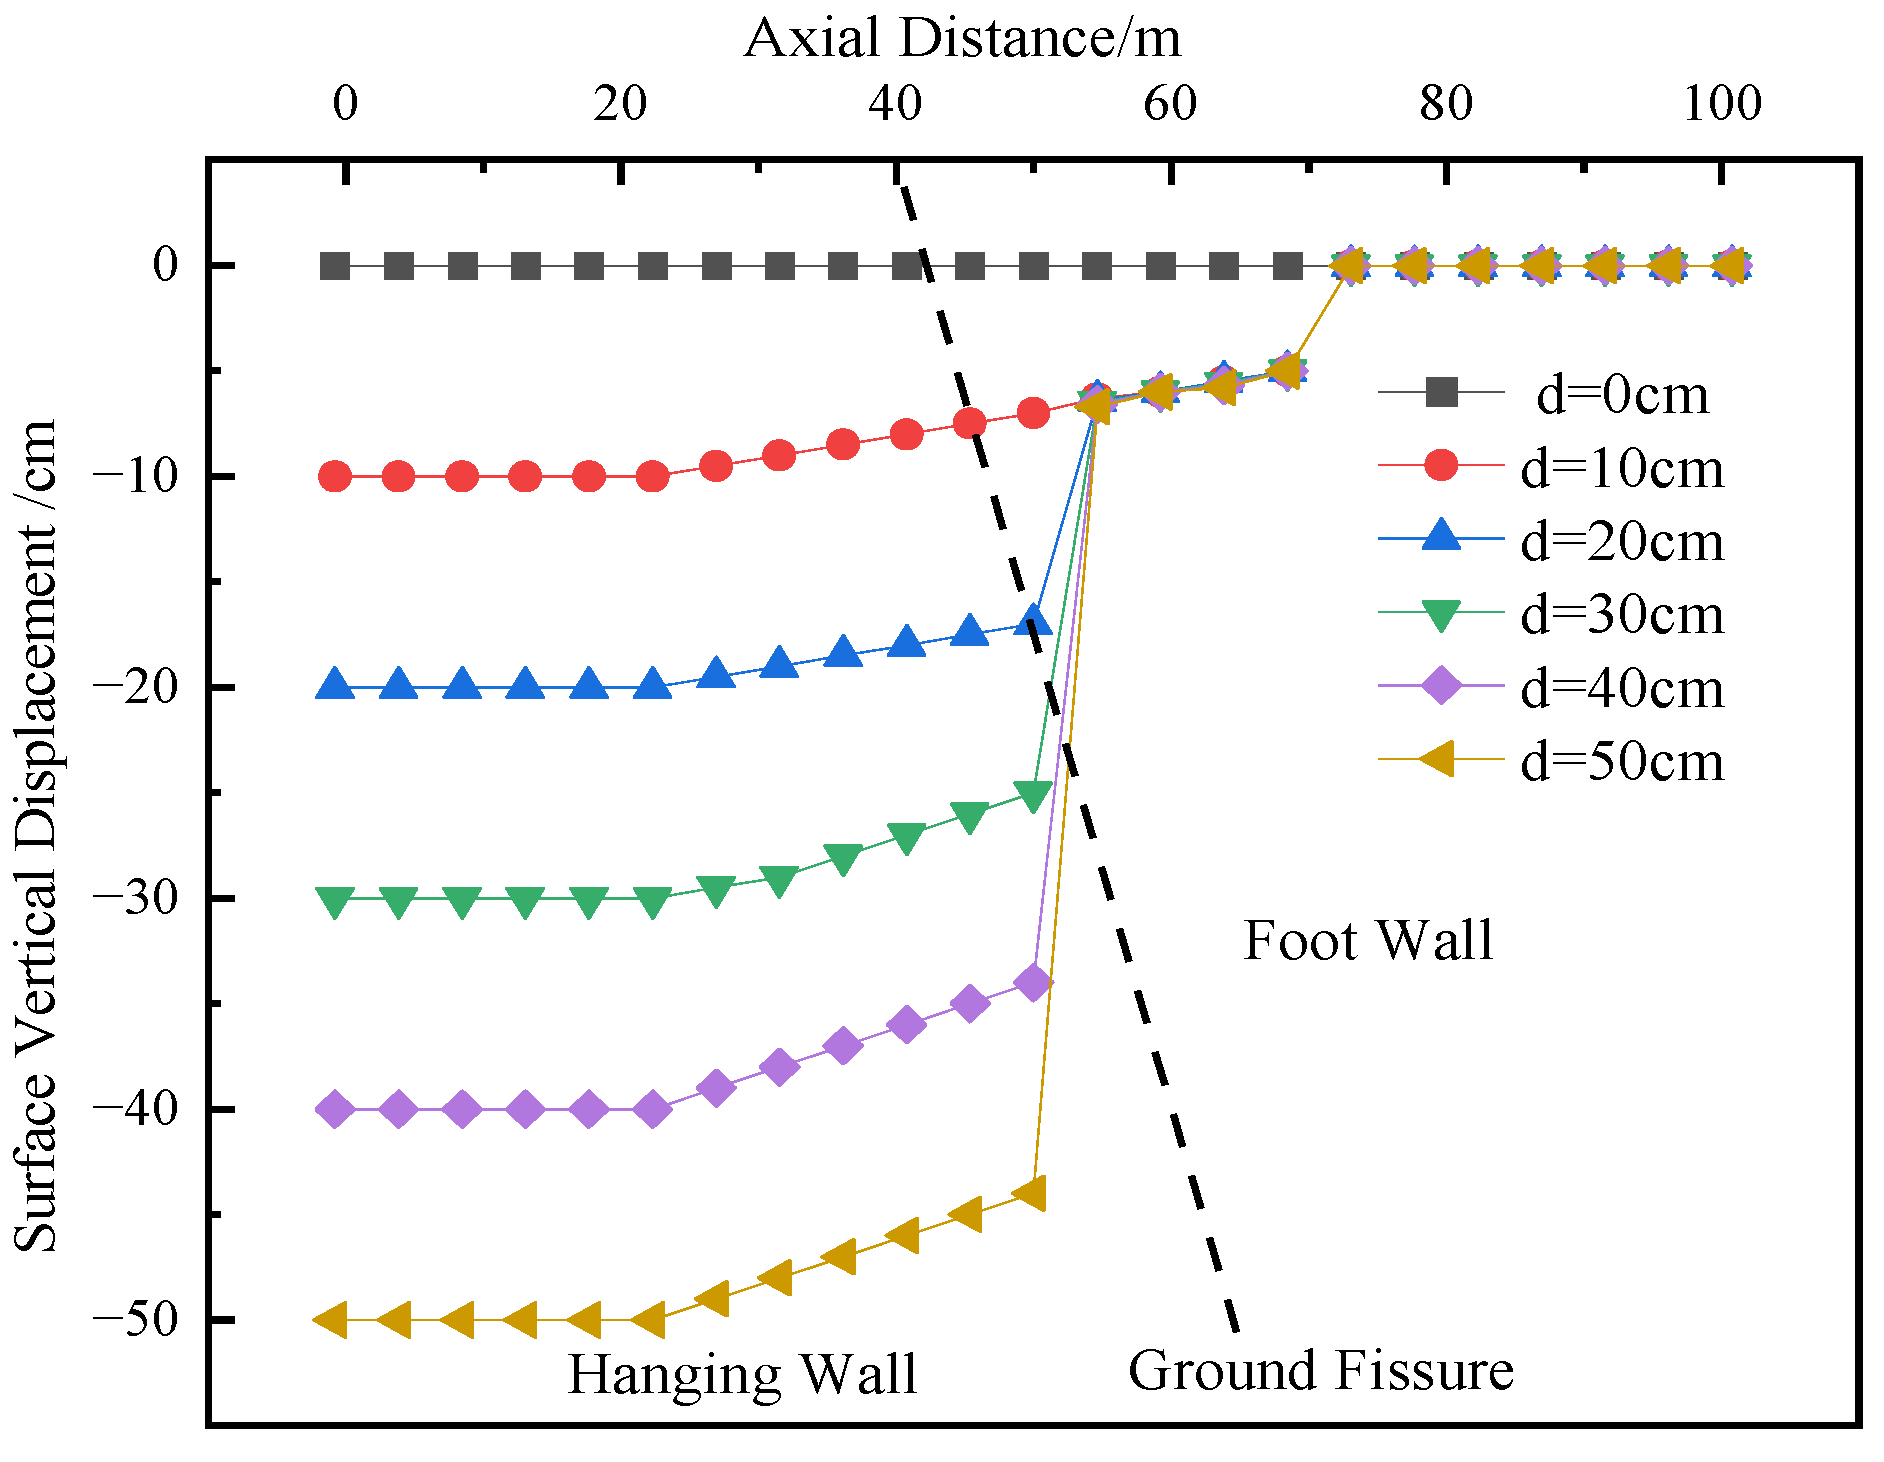
Figure 4 illustrates the ground settlement curves under different dislocation magnitudes of the ground fissure. As shown in
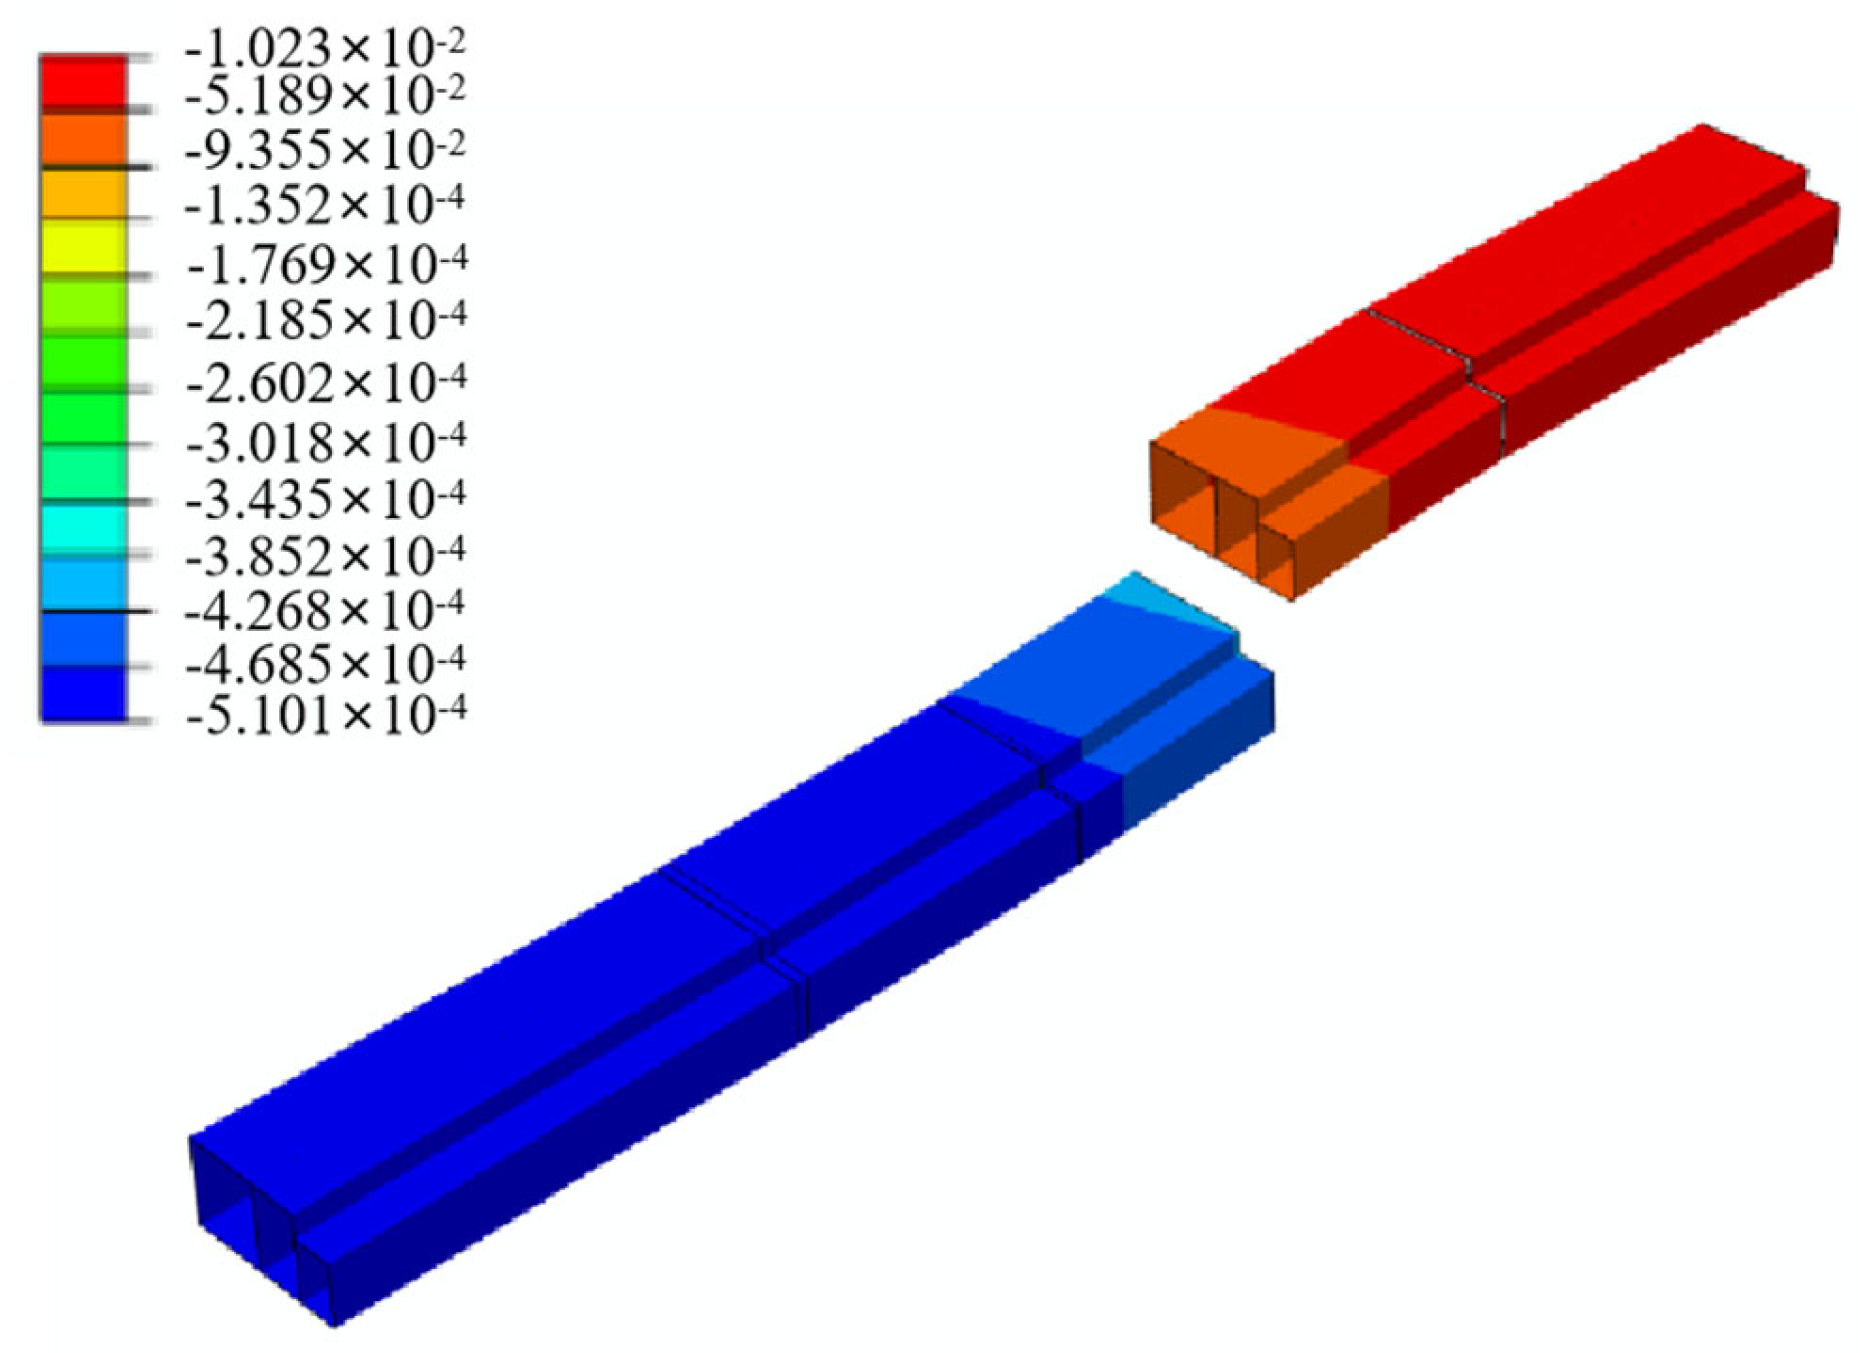
Figure 5 and
Figure 6, as the dislocation magnitude of the ground fissure increases from 0 cm to 50 cm, the vertical displacement and settlement of the soil surrounding the utility tunnel also increase, exhibiting an “S”-shaped curve. The differential settlement is more pronounced in the soil on the hanging wall side of the tunnel closer to the ground fissure.
A comparative analysis of
Figure 5 and
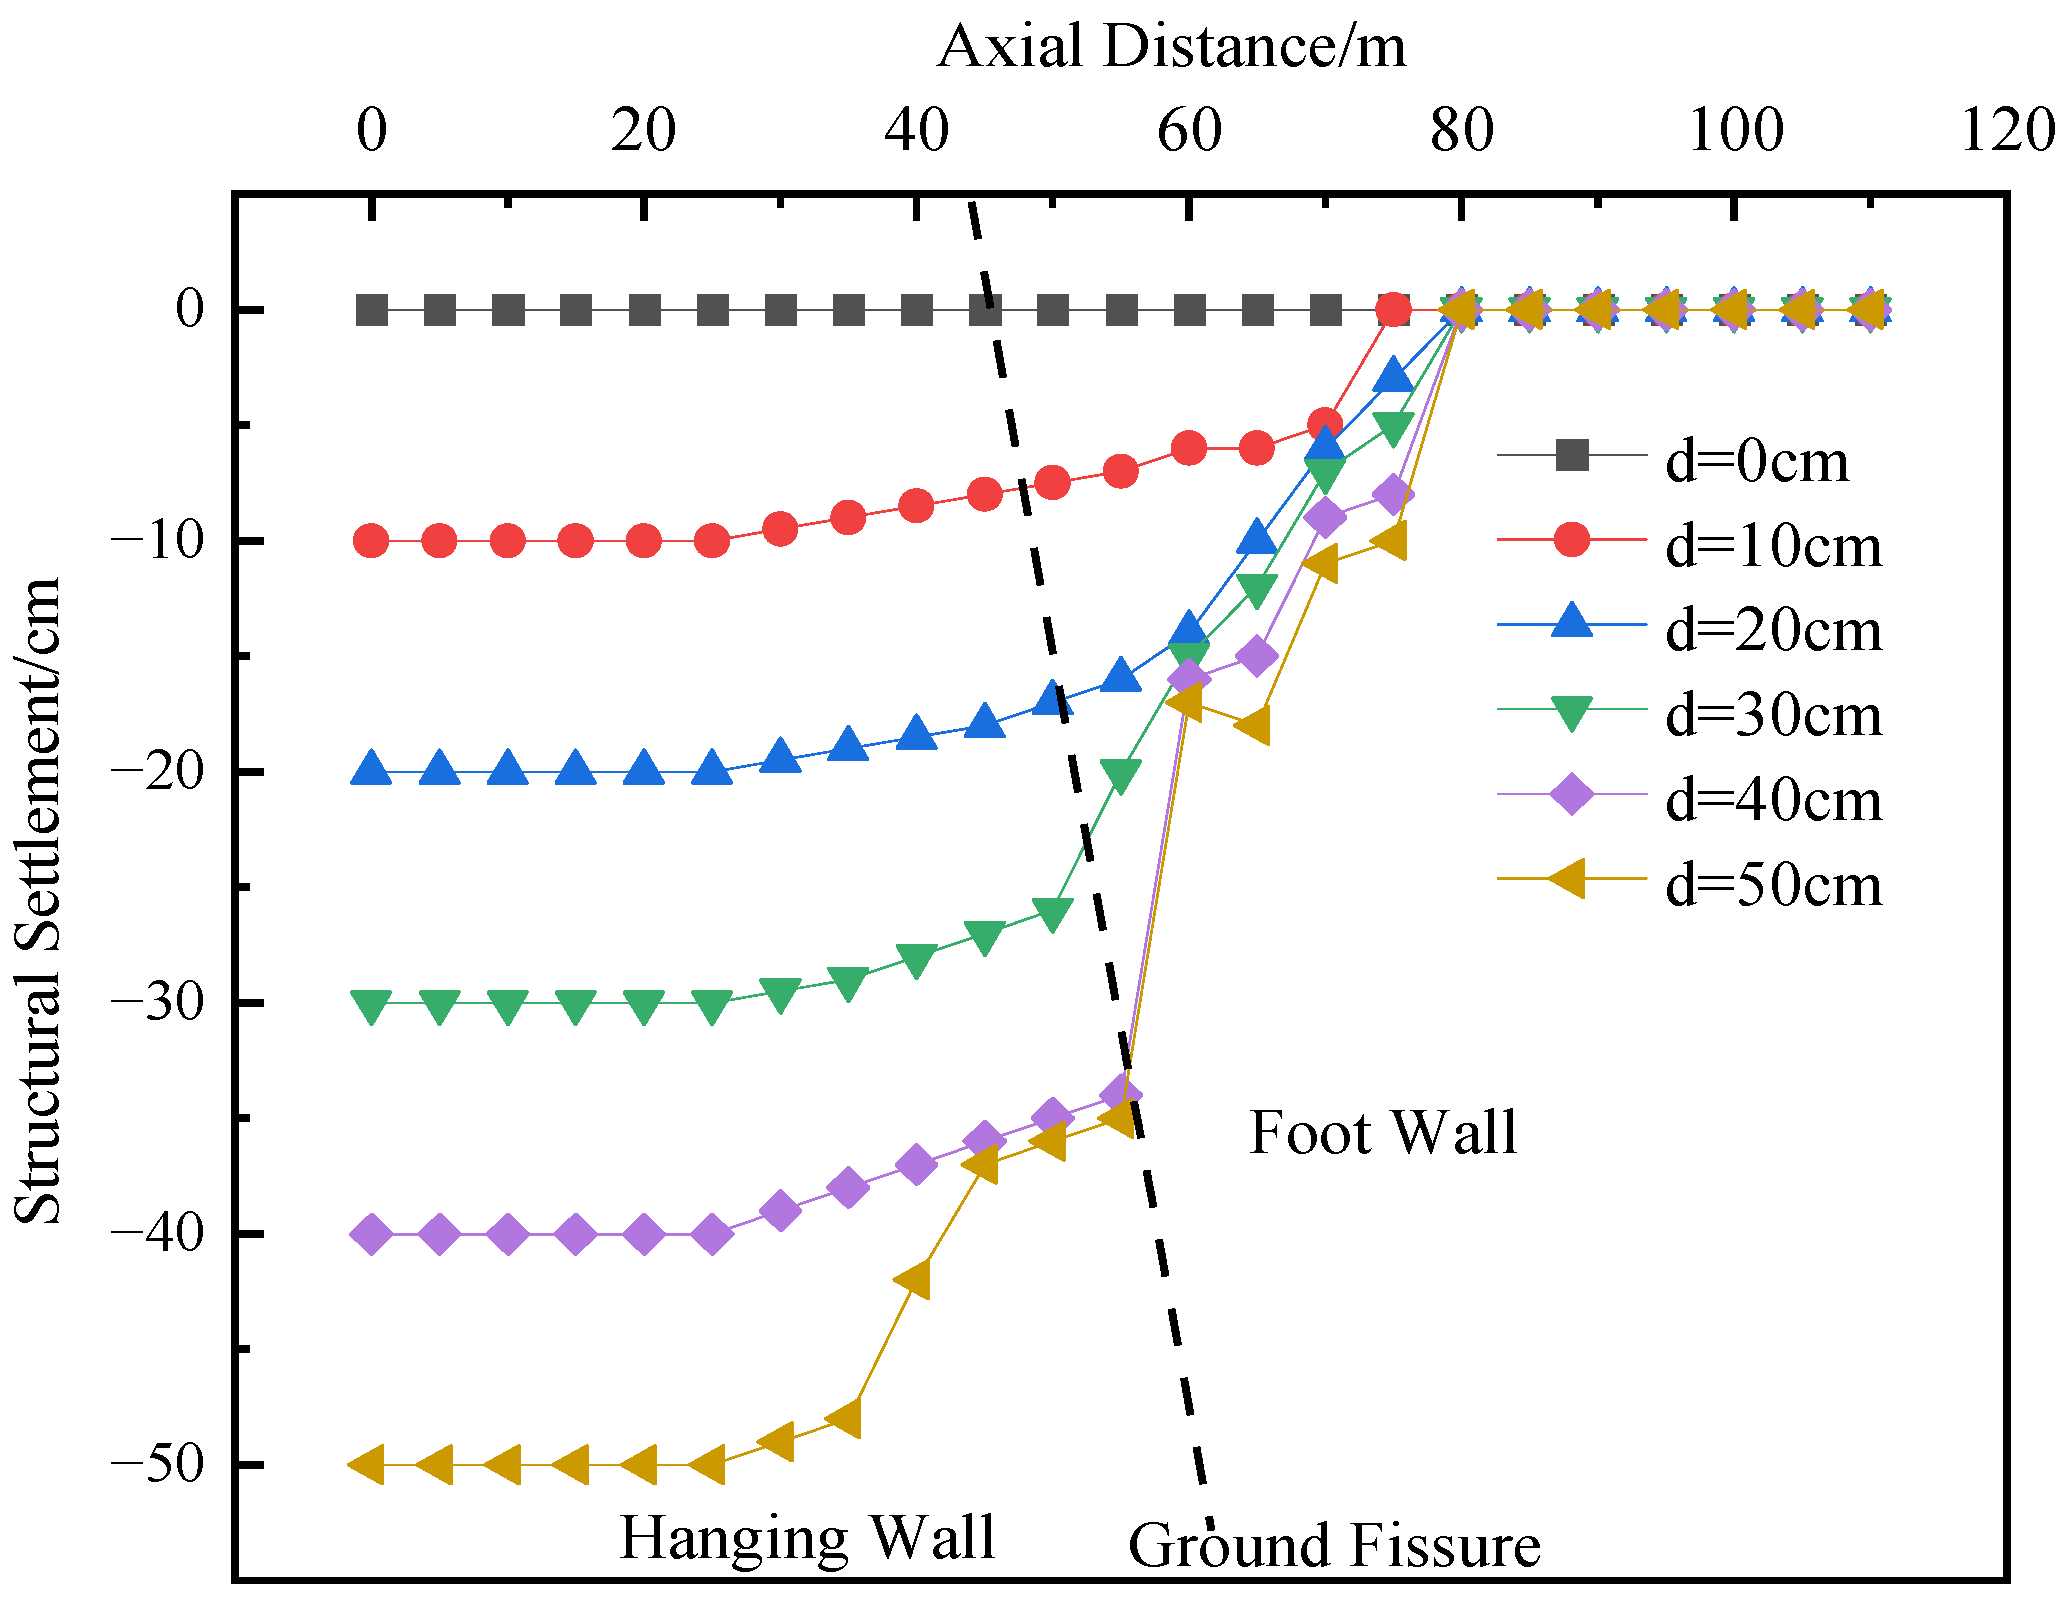
Figure 6 indicates that, for the compartmentalized utility tunnel structure, the vertical deformation also increases with the growing dislocation magnitude of the ground fissure. The dislocation deformation trend at the position of the partition wall between the two compartments at different horizontal levels (Measuring Point 2) is essentially identical to that at the position of the partition wall between the two compartments on the same horizontal level (Measuring Point 1), showing no significant discrepancy. Analysis of
Figure 7 reveals that, when the dislocation magnitude of the ground fissure increases to 20 cm, relative dislocation displacement begins to occur in the tunnel structures on both sides of the fissure. When the dislocation magnitude reaches 50 cm, the measured dislocation of the tunnel is approximately 34.9 cm. The structural deformation becomes more evident on the hanging wall side of the tunnel closer to the ground fissure. Consequently, prioritized monitoring is required for the section of the compartmentalized utility tunnel on the hanging wall near the ground fissure. An early warning should be issued promptly when the dislocation magnitude reaches 20 cm, and corresponding mitigation measures should be implemented.
4.1.2. Orthogonal Condition
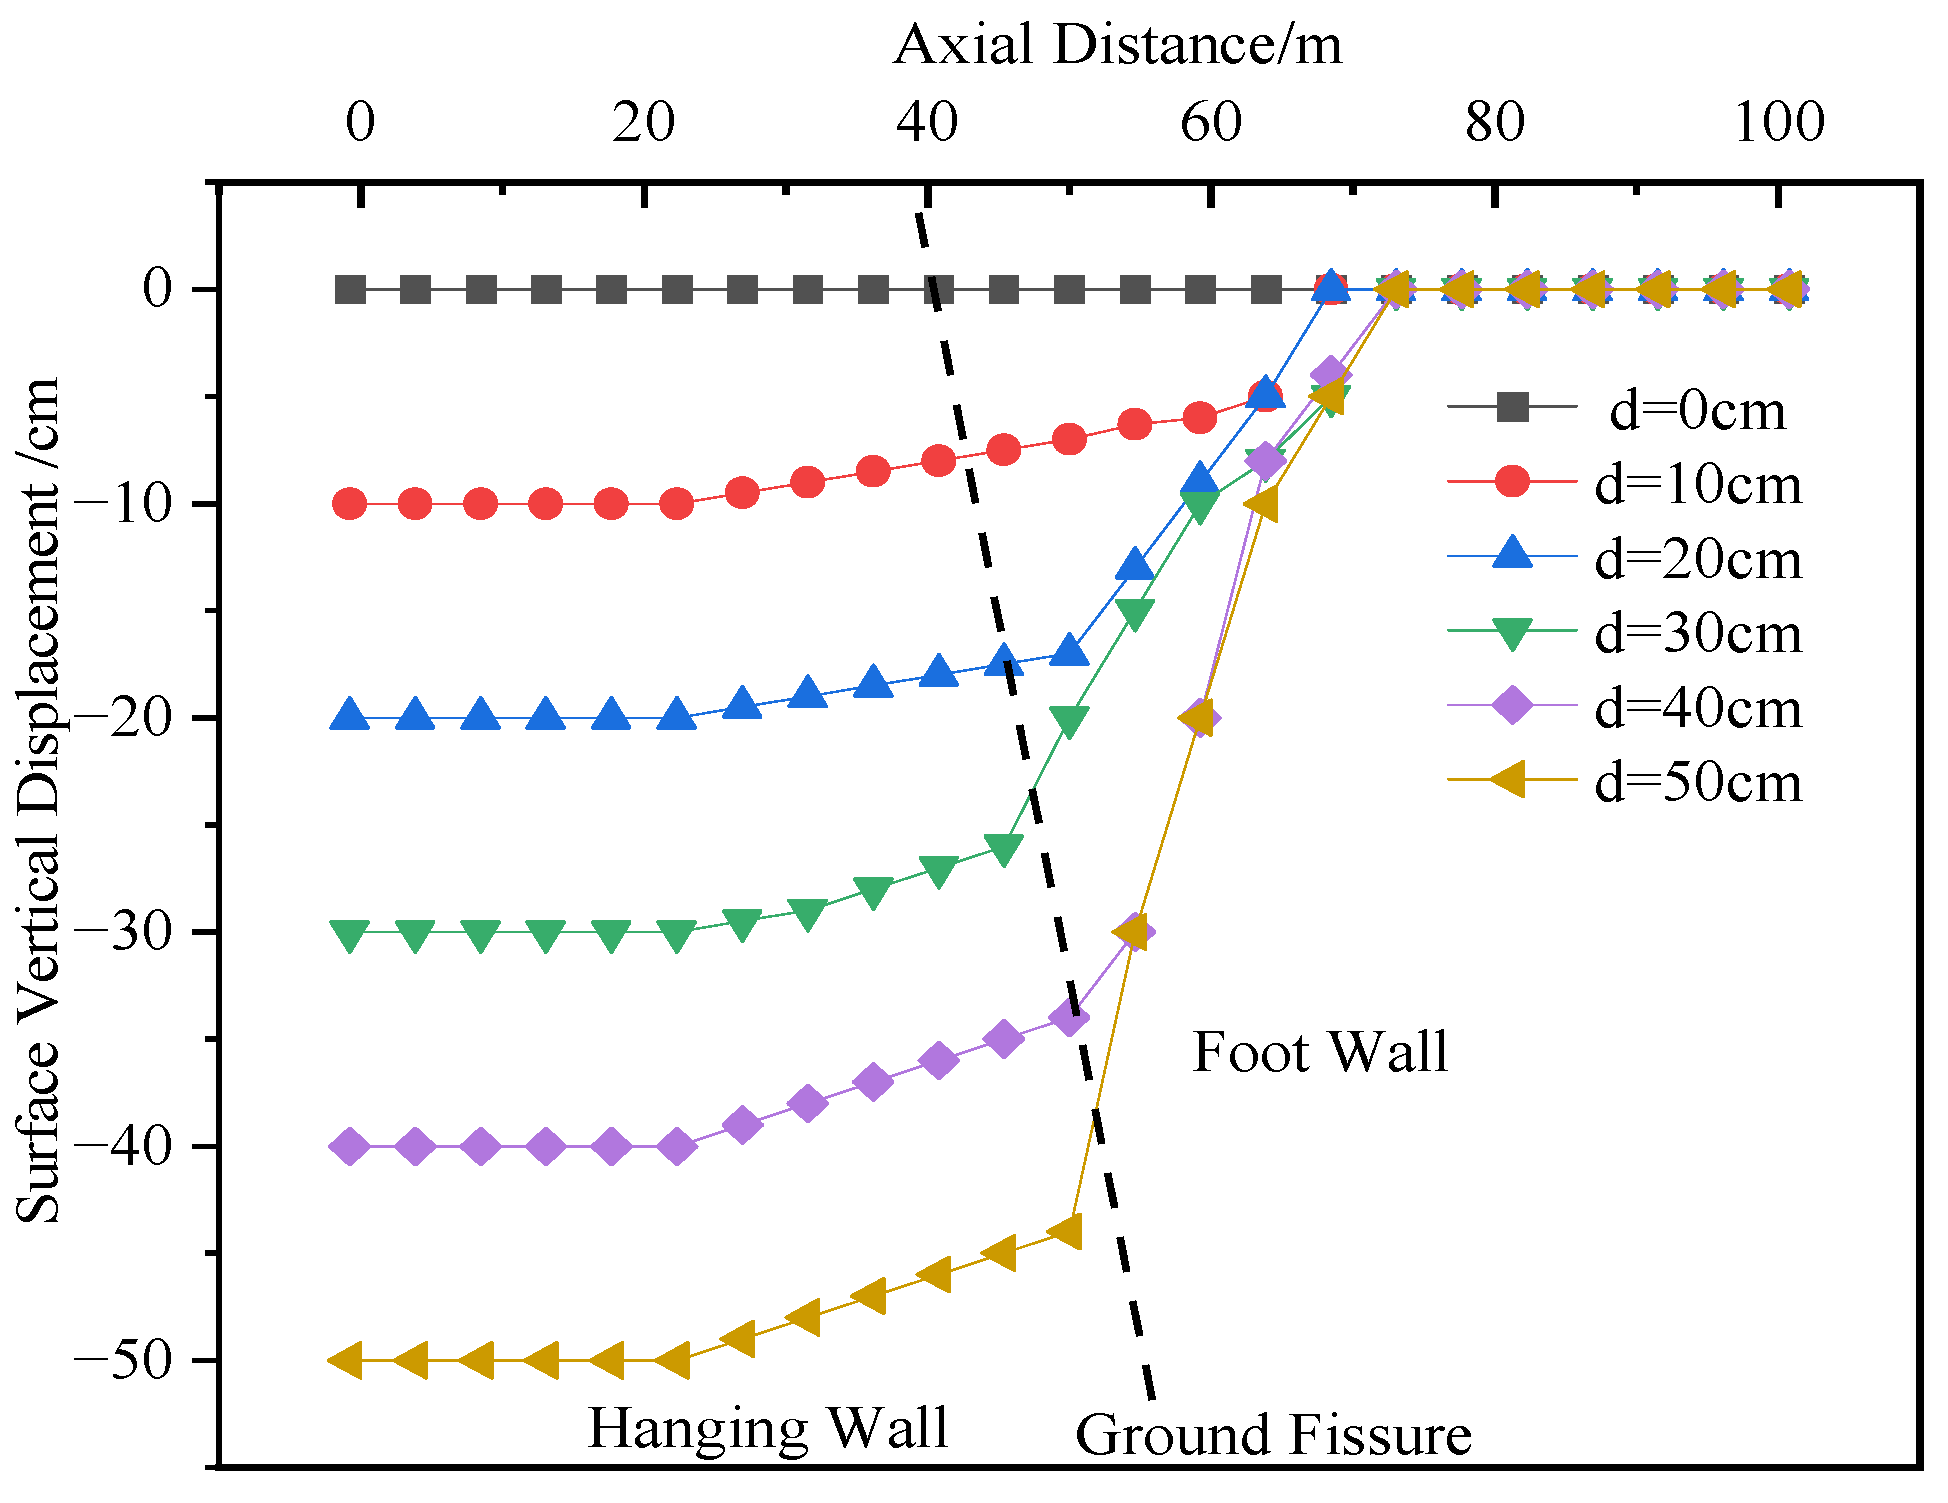
As can be seen from
Figure 8, the settlement deformation trend of the soil surrounding the utility tunnel under the orthogonal condition is essentially consistent with that under the oblique condition. In both cases, the vertical displacement and settlement of the soil increase as the dislocation magnitude of the ground fissure grows from 0 cm to 50 cm.
A comparative analysis of
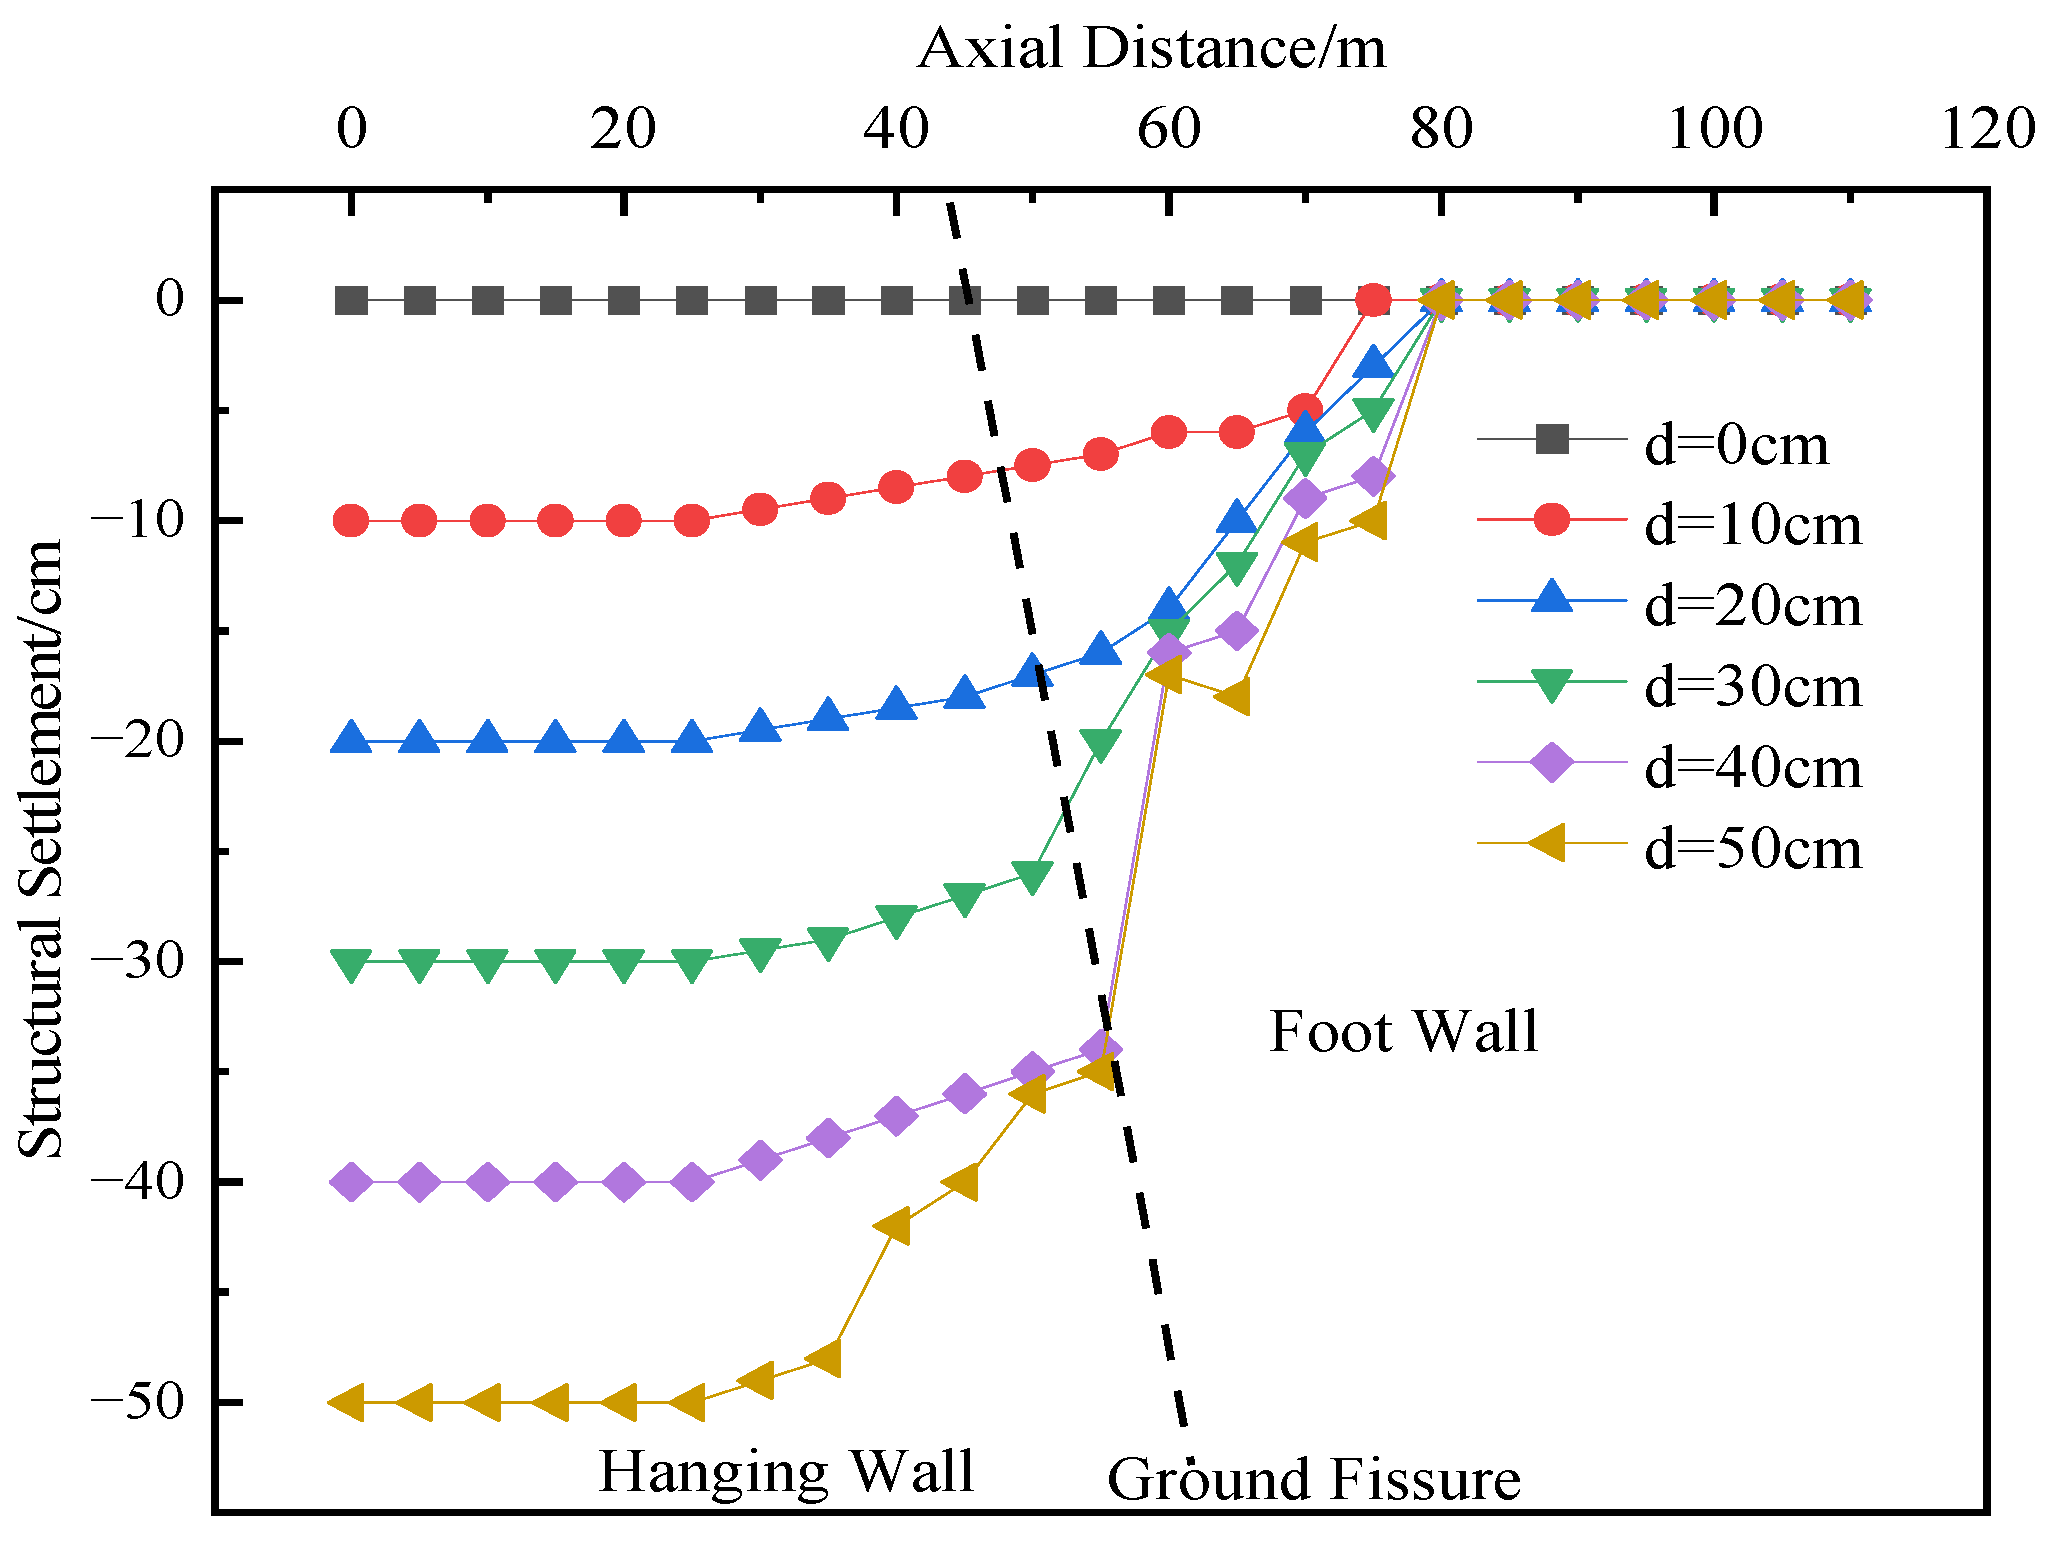
Figure 9 and
Figure 10 indicates that, for the compartmentalized utility tunnel structure, the structural deformation also increases with the increasing dislocation magnitude of the ground fissure. The trend of dislocation deformation at the position of the partition wall between the two compartments at different horizontal levels (Measuring Point 2) is basically the same as that at the position of the partition wall on the same horizontal level (Measuring Point 1), showing no significant difference. Similar to the oblique condition, dislocation displacement of the utility tunnel begins to occur when the dislocation magnitude reaches 20 cm. However, compared with the oblique condition, the dislocation of the tunnel is only 27.0 cm when the dislocation magnitude reaches 50 cm under the orthogonal condition. The analysis suggests that this is because a larger intersection angle leads to a greater distance from the deformation joint, resulting in higher tensile stress.
4.2. Structural Stress of the Utility Tunnel
4.2.1. Oblique Intersection Condition
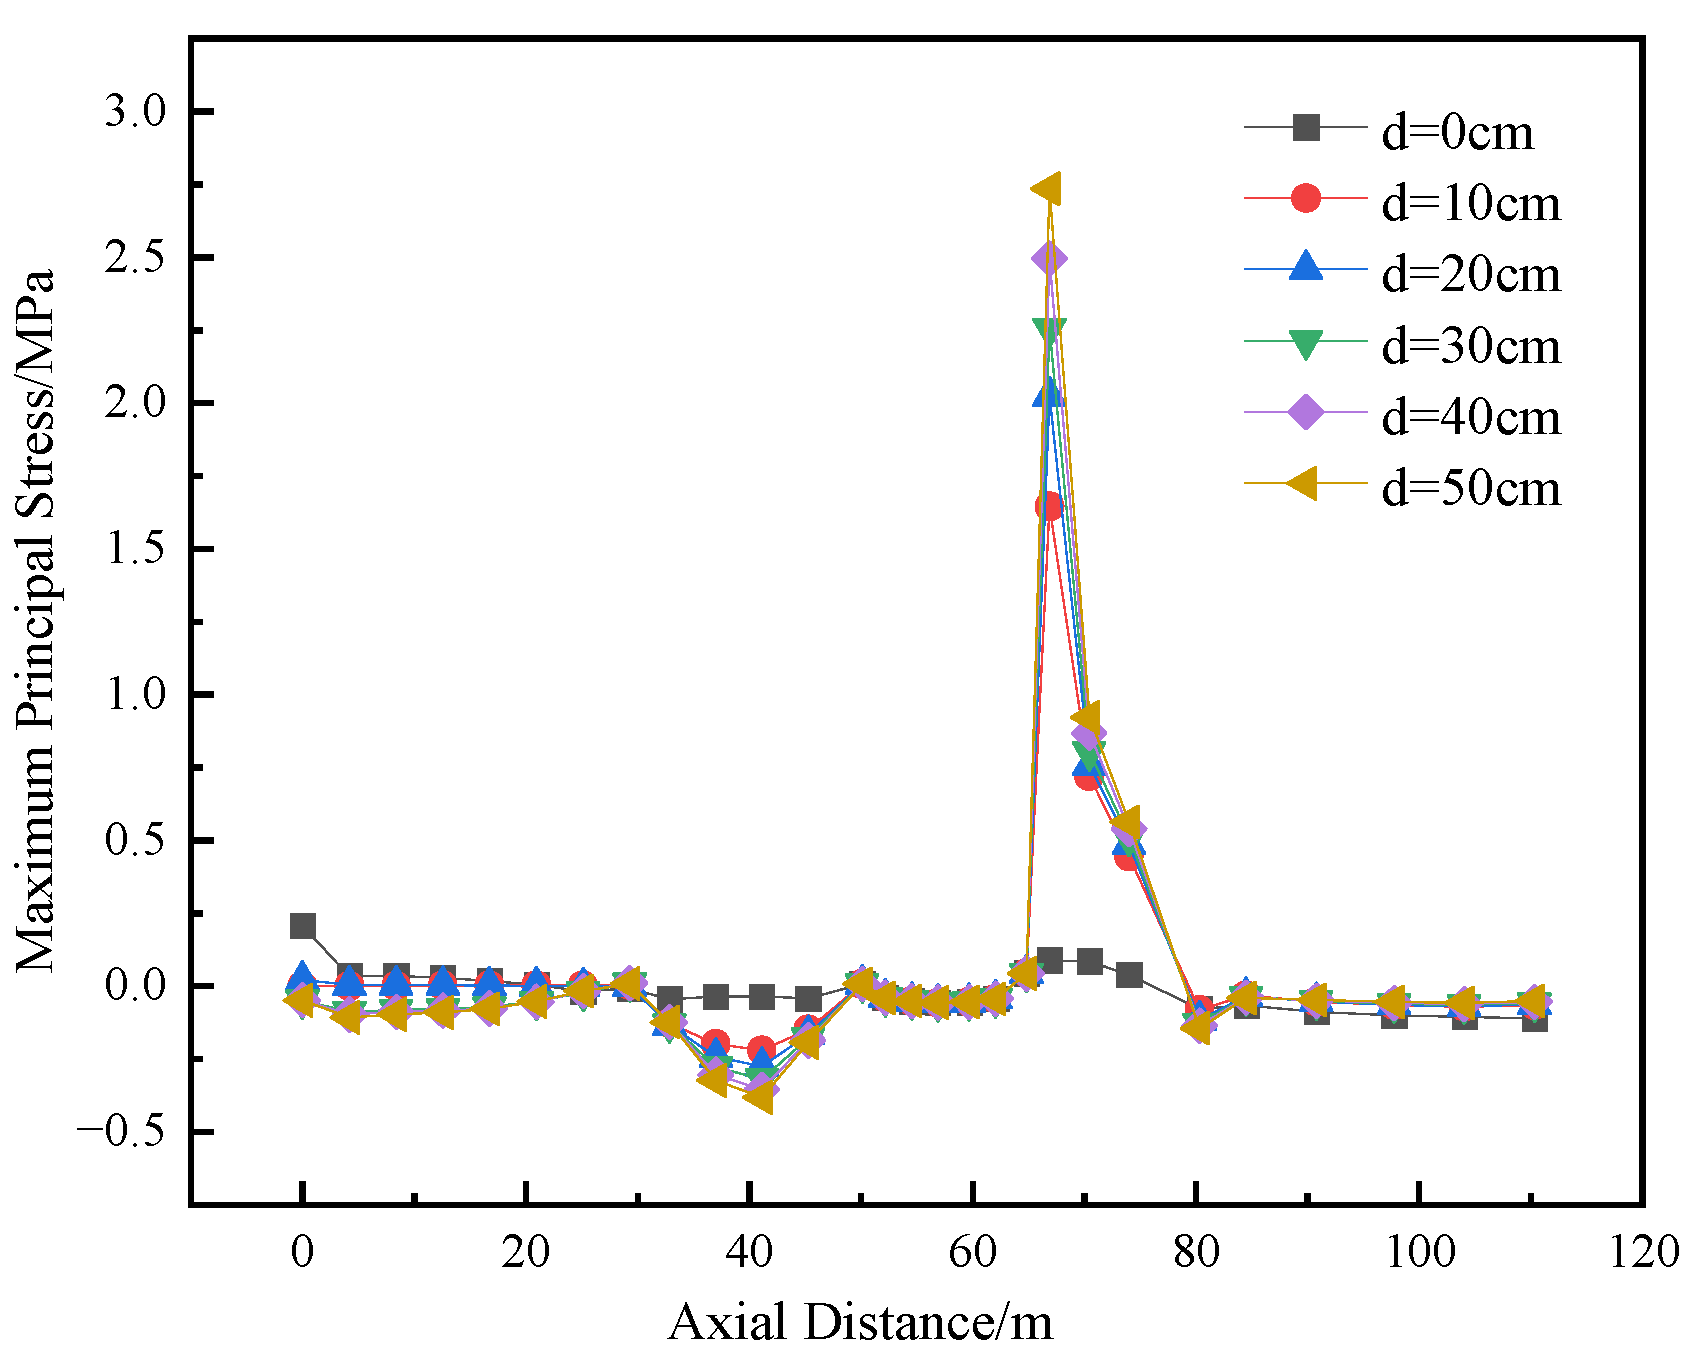
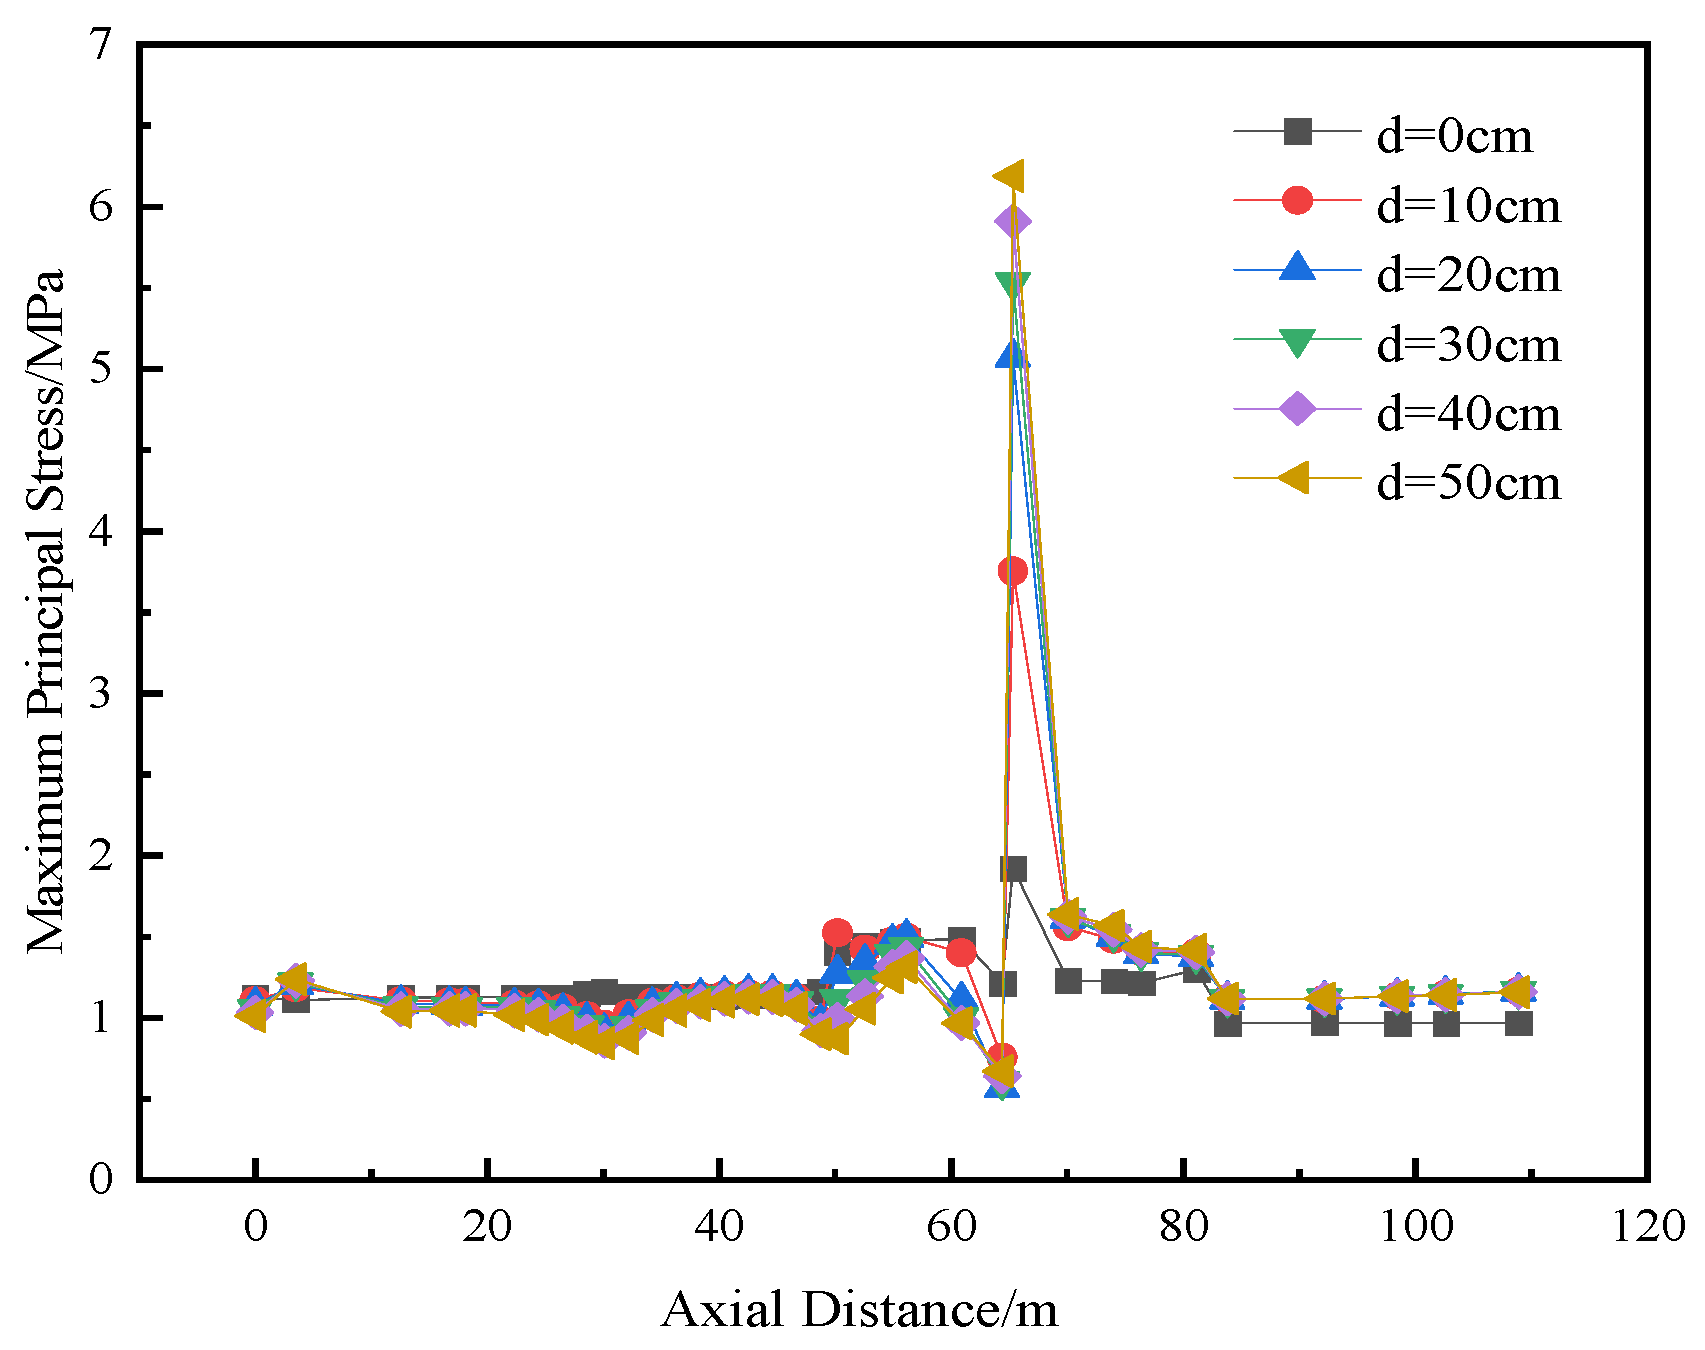
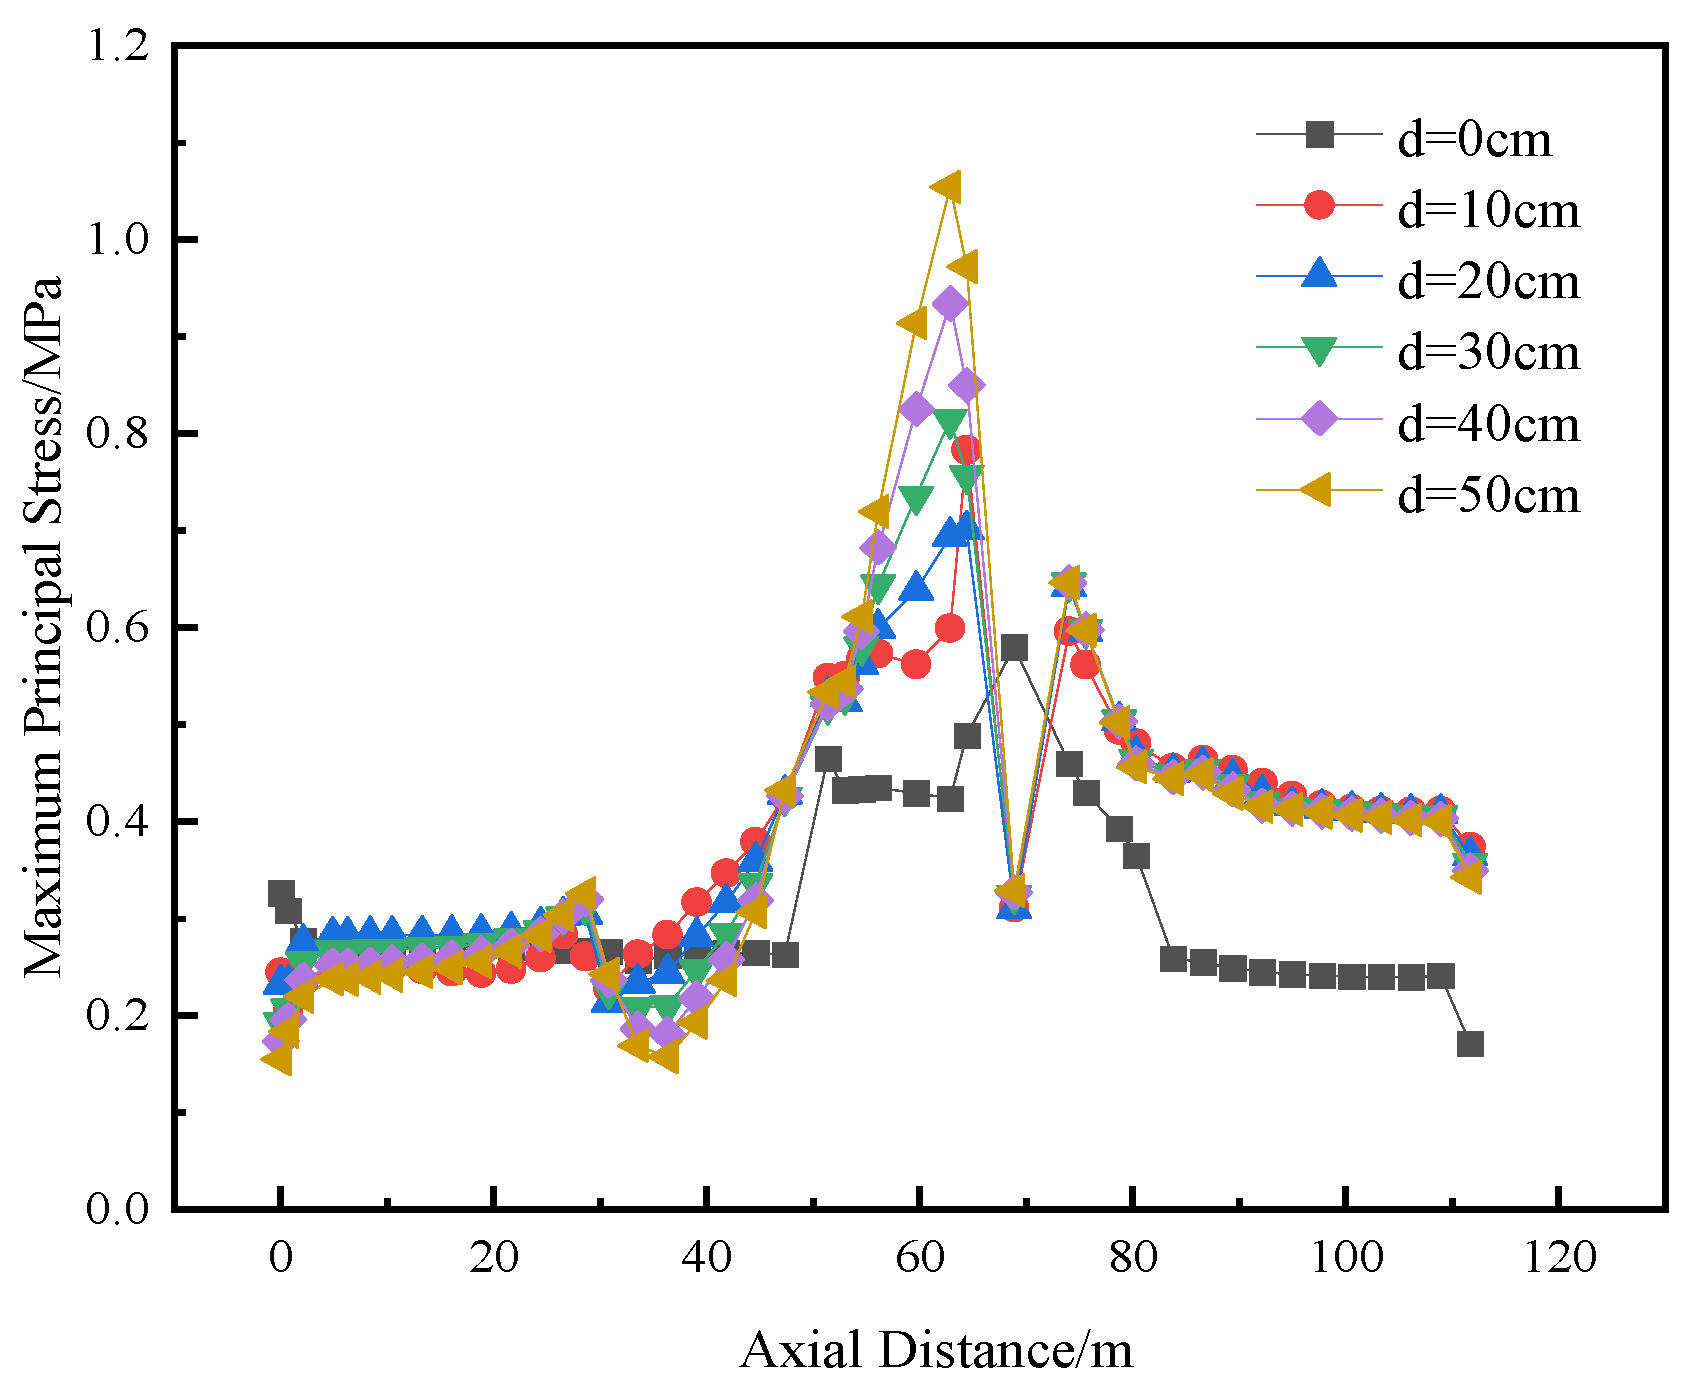
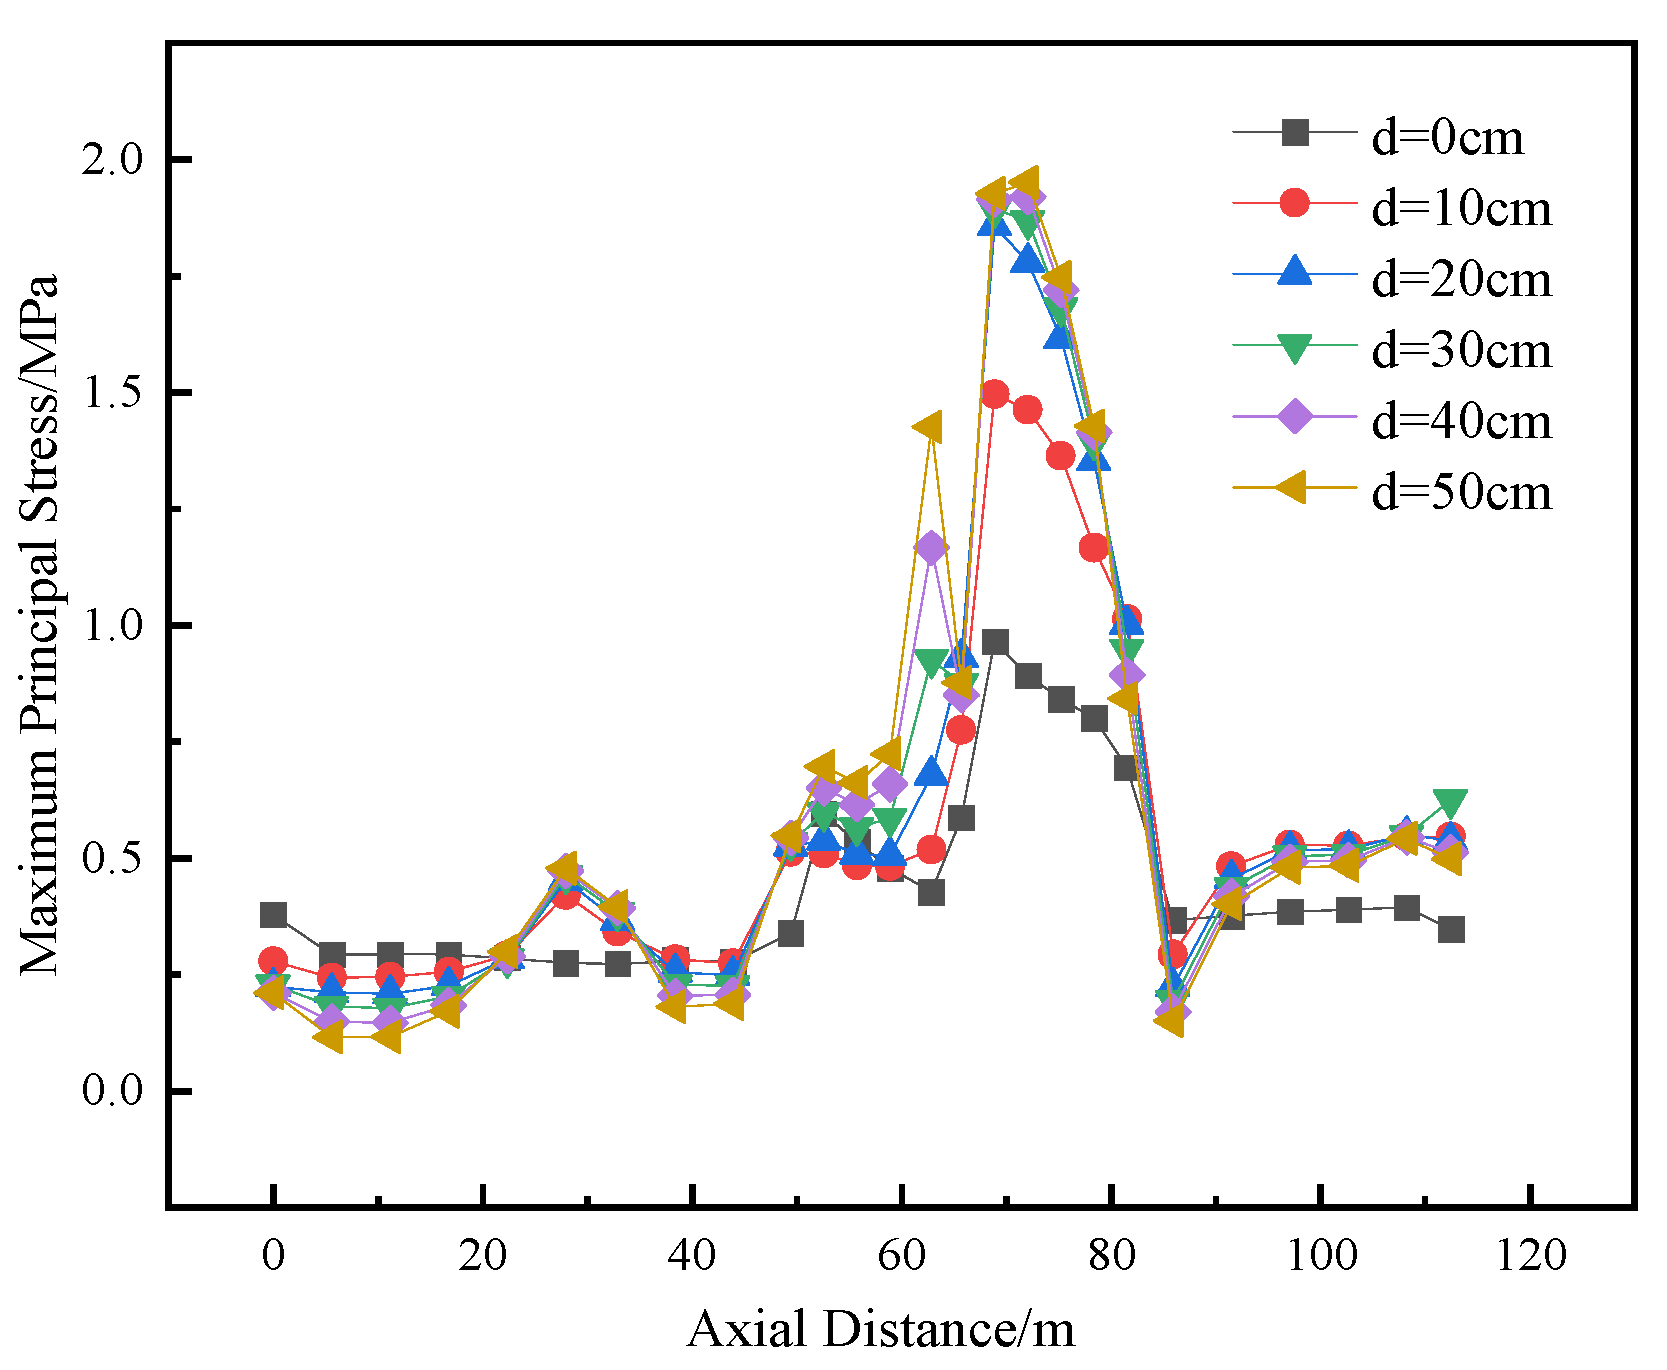
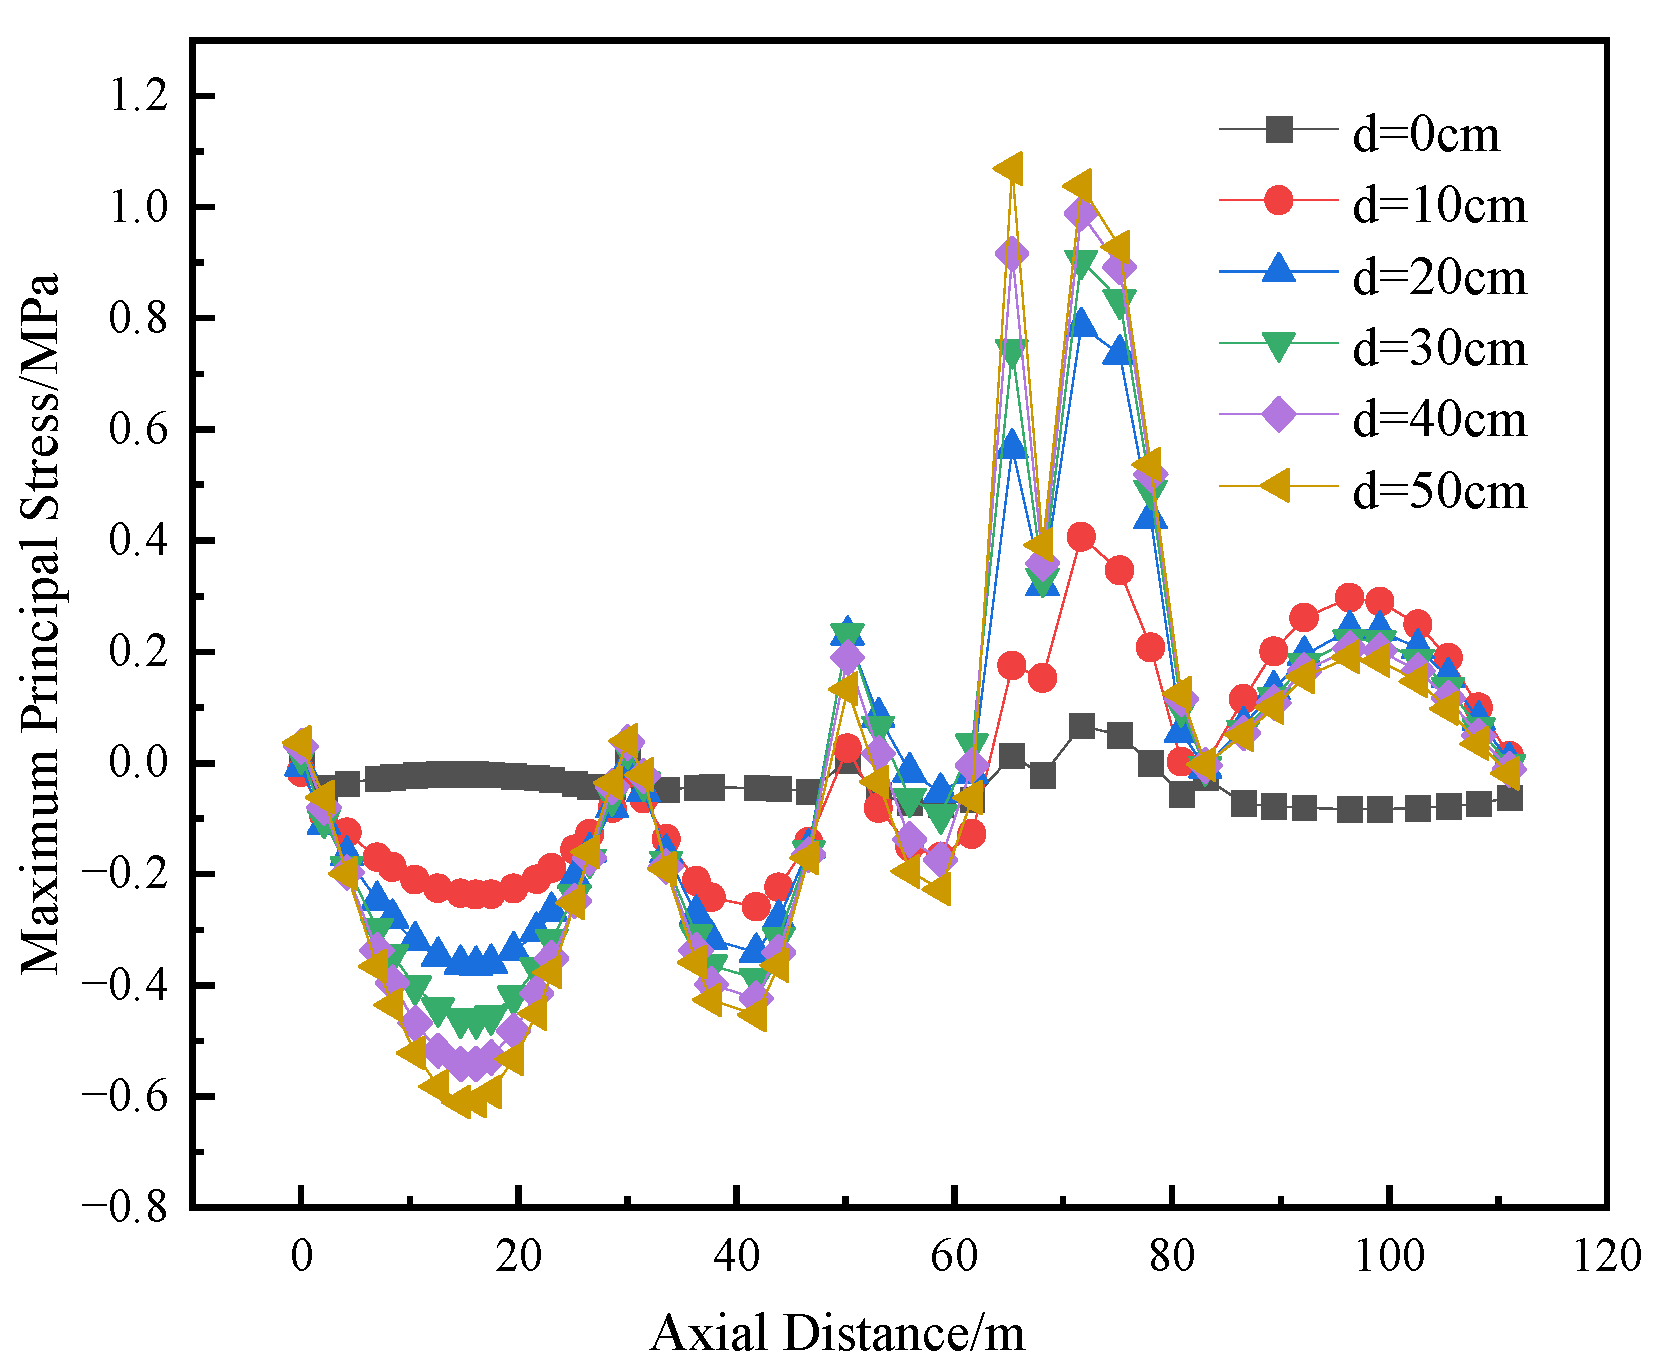
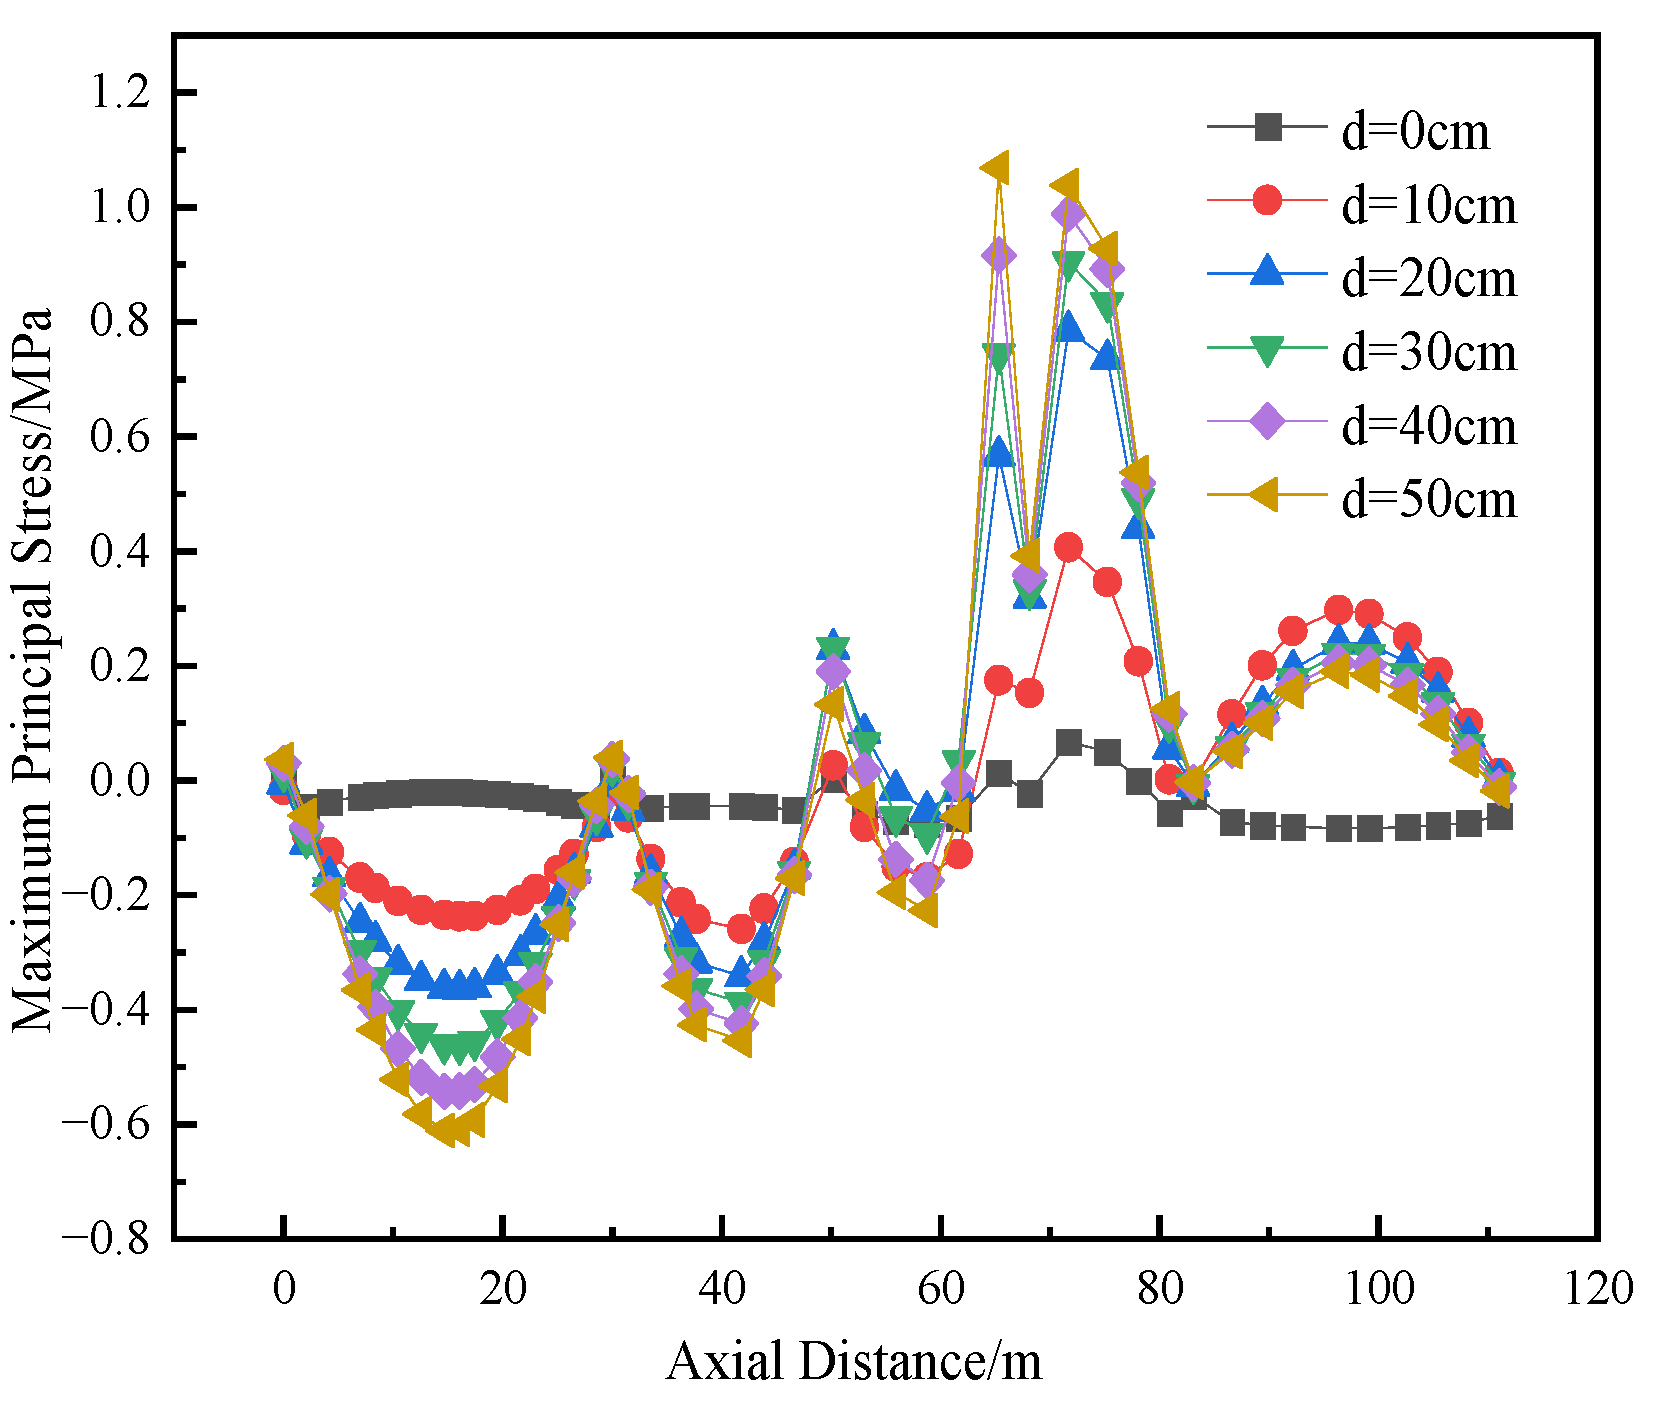
The maximum principal stress is a key stress component that directly reflects the degree of maximum tensile effect on a component under complex stress states. When this stress exceeds the tensile strength, micro-defects inside the material will expand rapidly, eventually leading to the formation of macroscopic cracks. This is fully consistent with the physical mechanism of cracking. Therefore, in this paper, the condition that the maximum principal stress is greater than the tensile strength is adopted as the criterion to identify the regions that are highly likely to initiate cracking under applied loads.
Figure 11,
Figure 12,
Figure 13 and
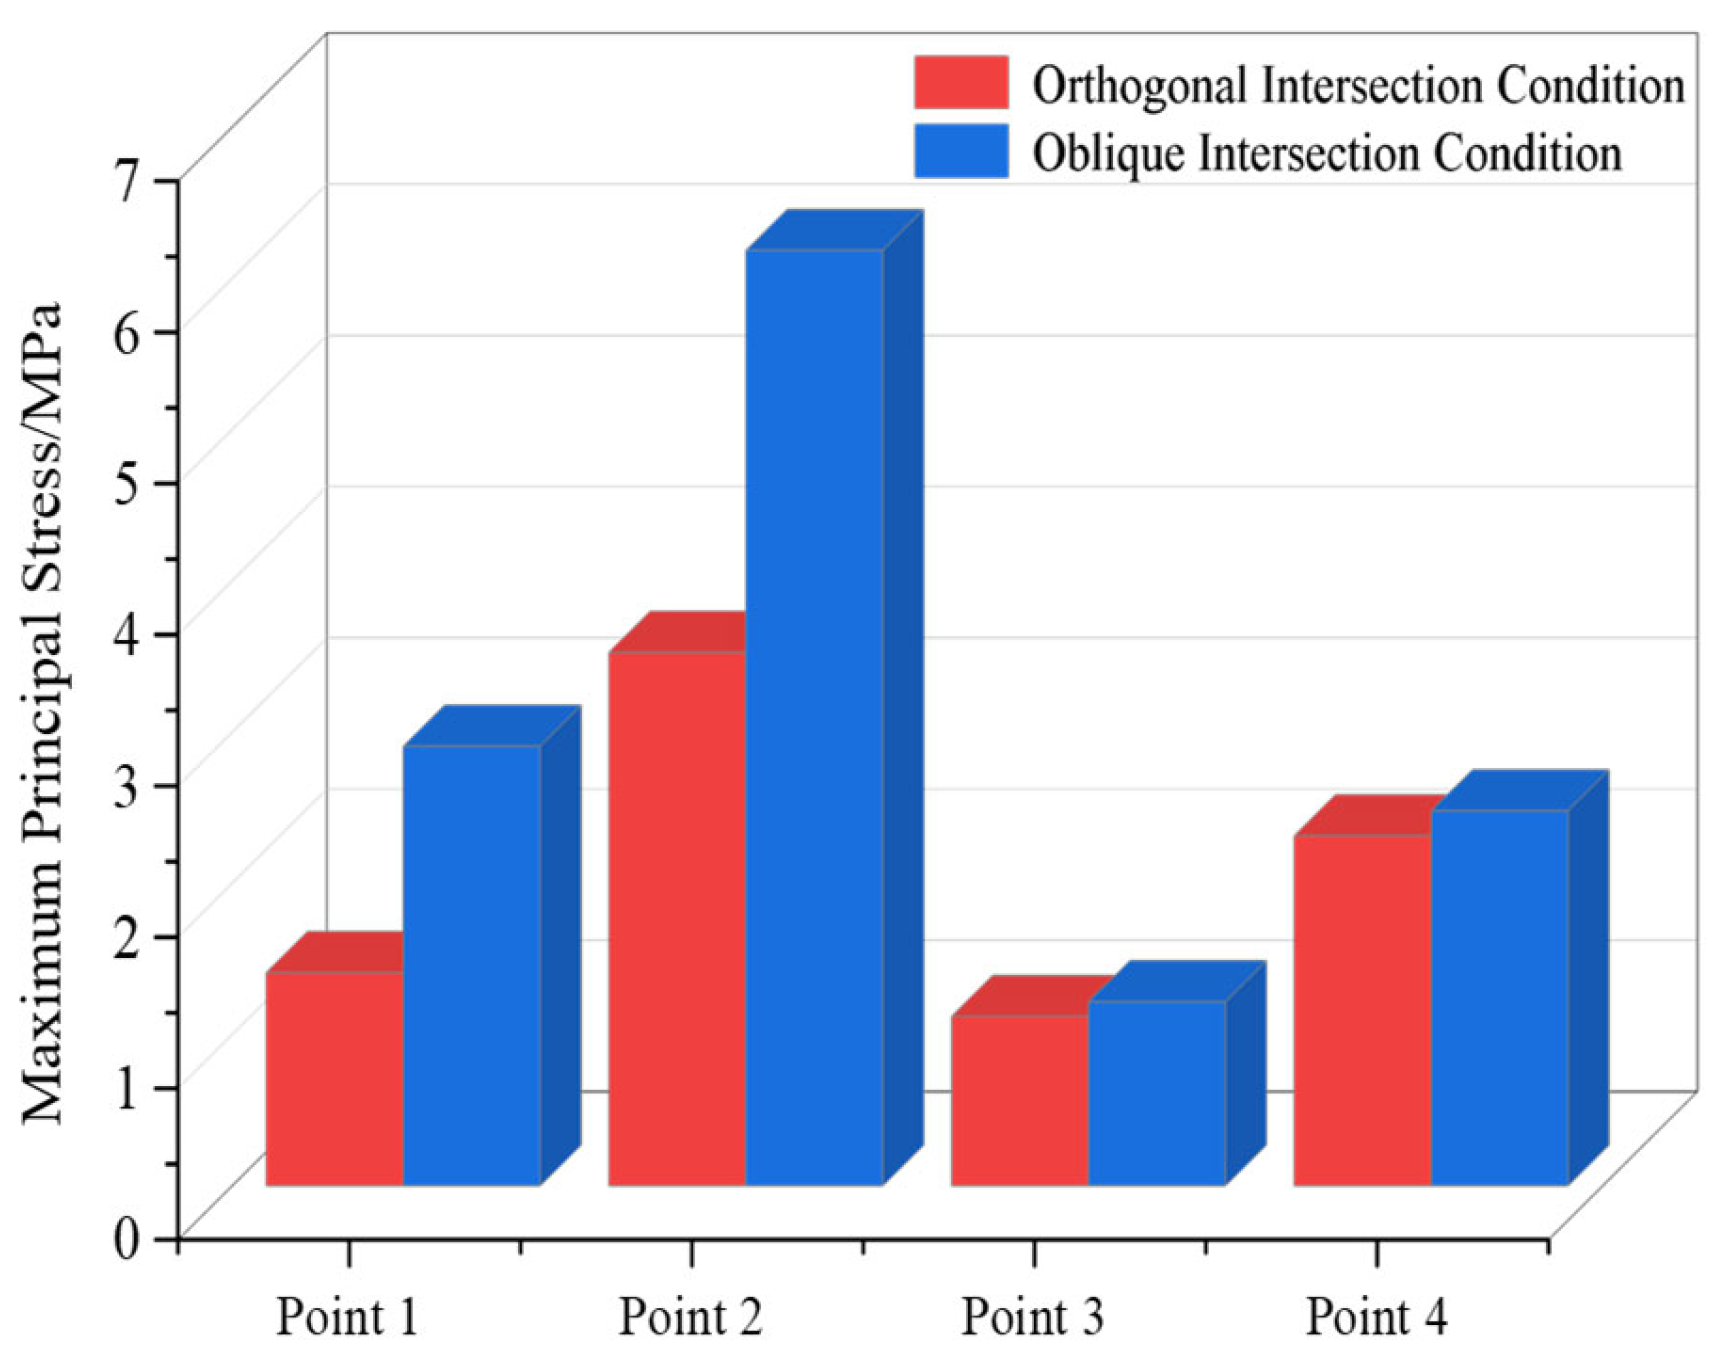
Figure 14 show the variation curves of the maximum principal stress at four different locations on the top and bottom of the compartmentalized utility tunnel with increasing dislocation magnitude of the ground fissure. Analysis indicates that, under the oblique condition, the stresses in both the top and bottom slabs initially increase and then decrease, reaching their maximum values at all measuring points near the ground fissure when the dislocation magnitude reaches 50 cm. The maximum principal stresses at Measuring Points 1 to 4 are 2.910 MPa, 6.189 MPa, 1.220 MPa, and 2.483 MPa, respectively, all of which are greater than zero. The stresses at Measuring Points 1, 2, and 4 exceed the axial tensile strength of C40 concrete, 2.39 MPa. It is thus concluded that, when the dislocation magnitude reaches 50 cm, cracking occurs in the concrete at the partition wall on the top surface and at the junction of the two compartments at different levels on the bottom surface of the tunnel.
From
Figure 12, it is observed that, at the junction of the two compartments at different levels (Measuring Point 2), the stress value exceeds the axial tensile strength of C40 concrete (2.39 MPa) when the dislocation magnitude exceeds 20 cm. Therefore, during structural design, segmented joint measures should be implemented in advance at this location. Additionally, real-time monitoring at this measuring point is recommended during construction. Early warning measures should be promptly activated when the dislocation magnitude exceeds 20 cm.
4.2.2. Orthogonal Intersection Condition
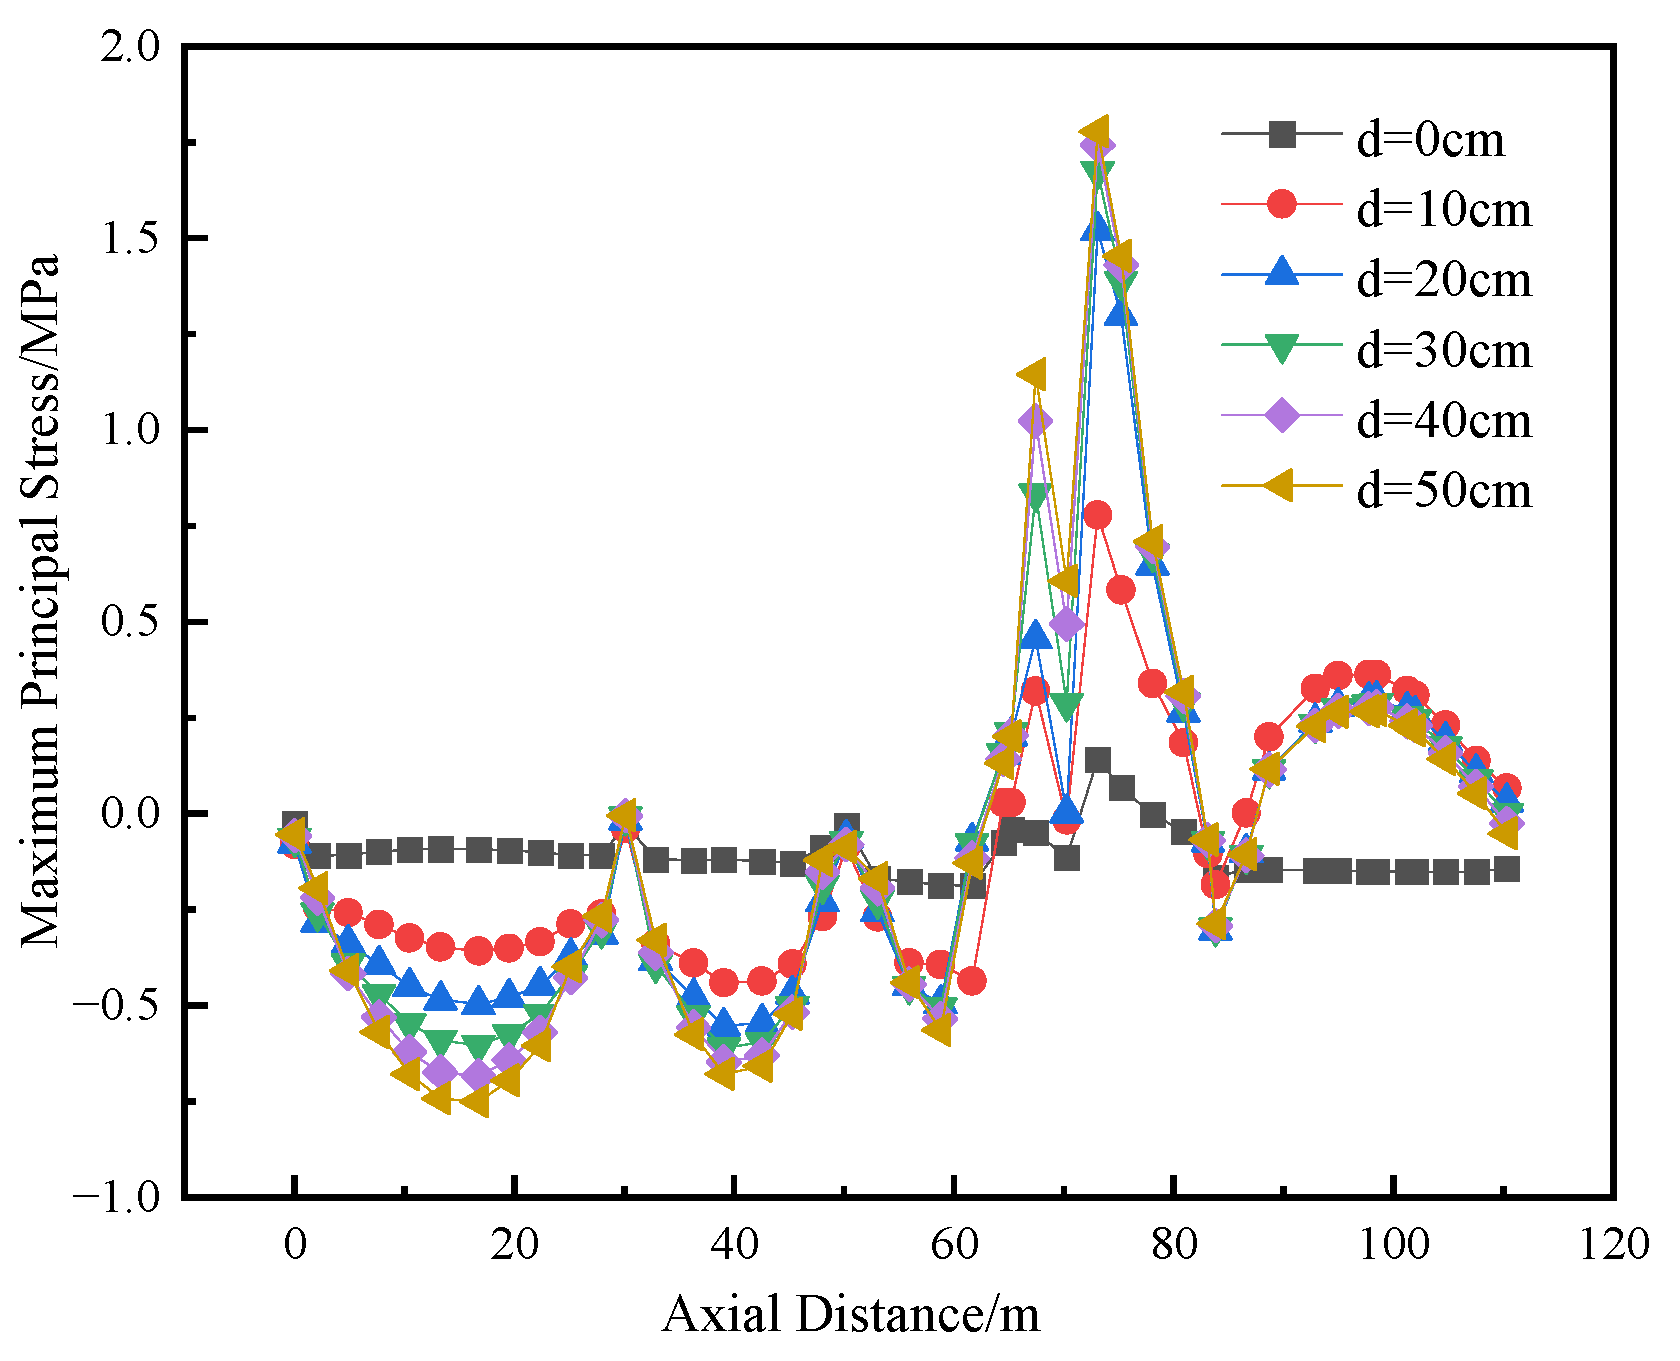
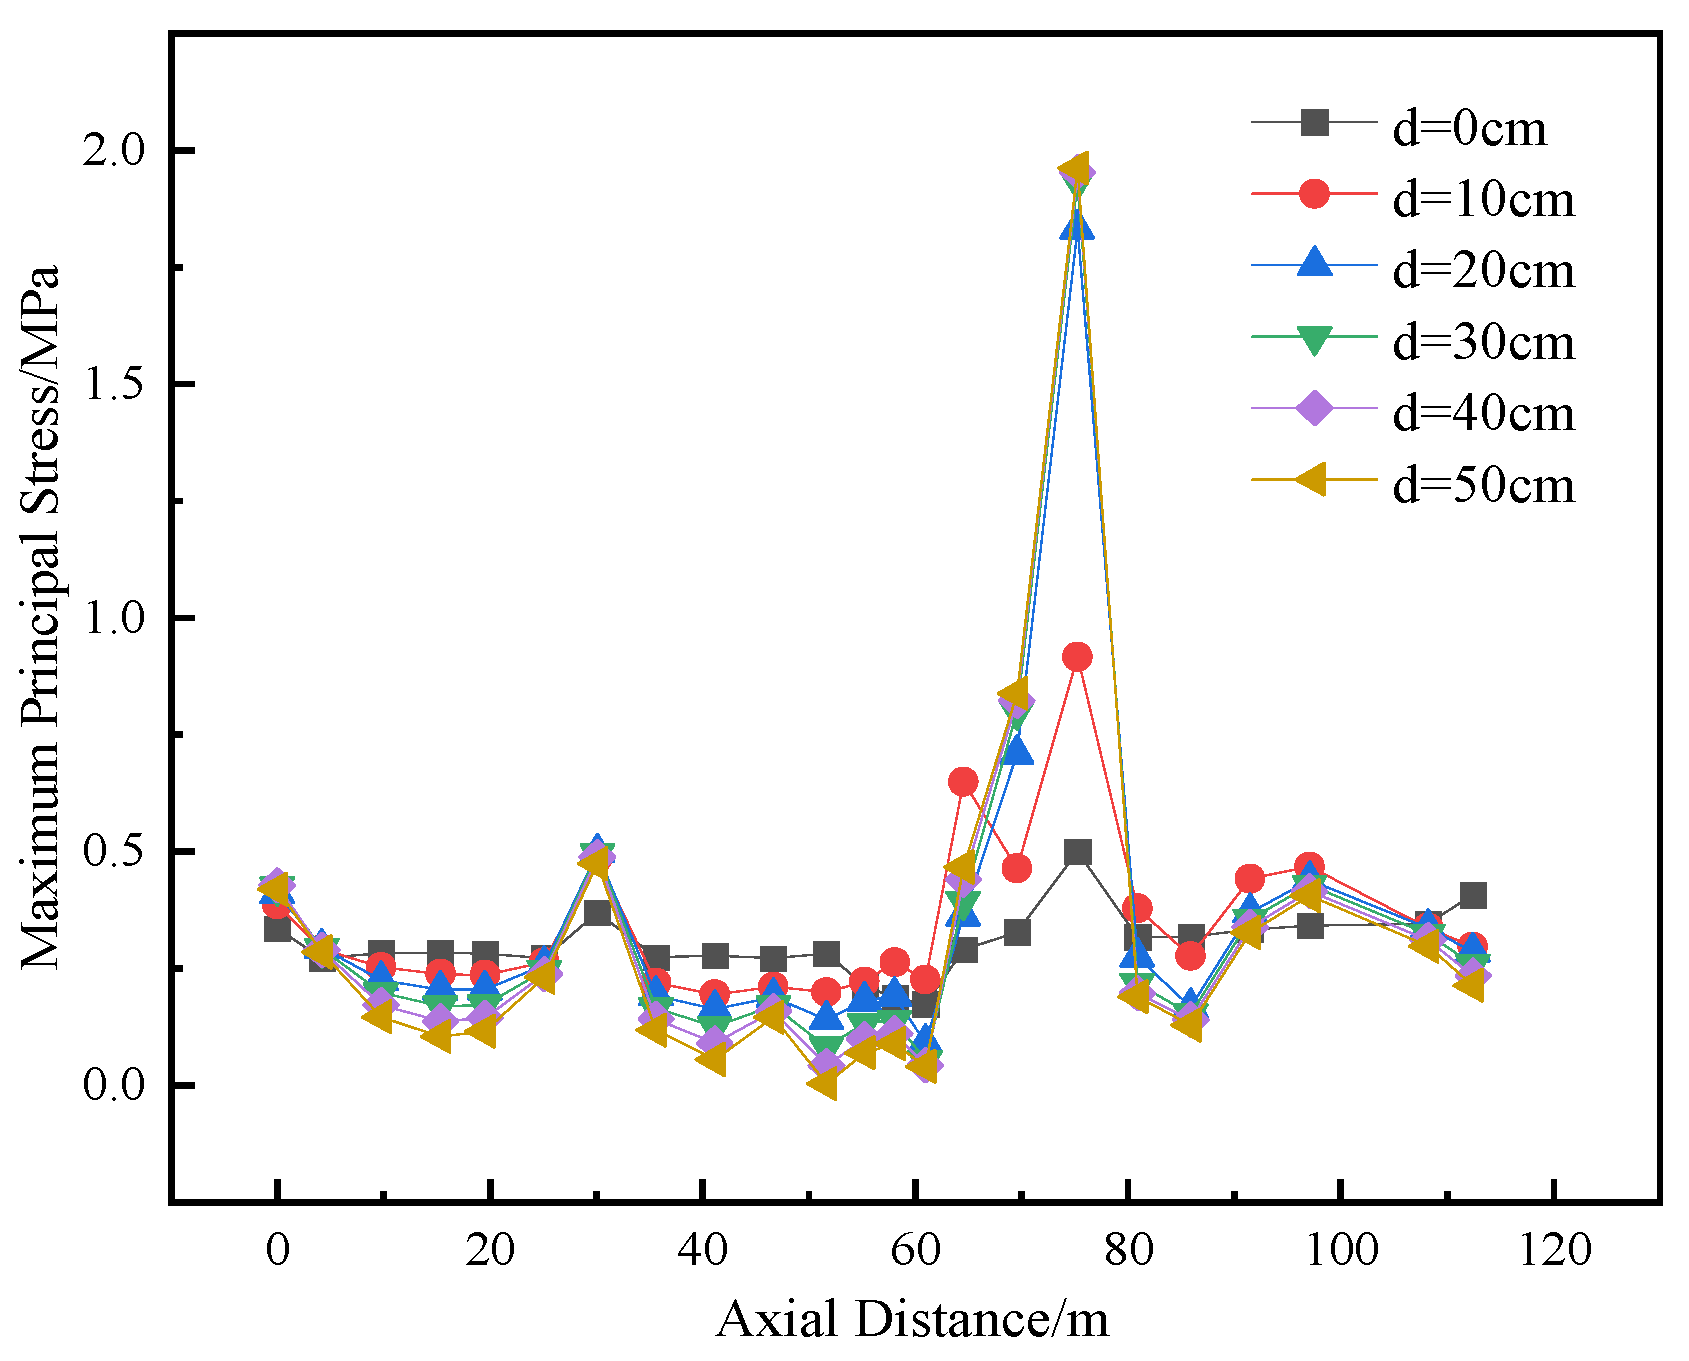
Figure 15,
Figure 16,
Figure 17 and
Figure 18 show the variation curves of the maximum principal stress at four different locations on the top and bottom of the compartmentalized utility tunnel with increasing dislocation magnitude of the ground fissure. The maximum principal stresses at Measuring Points 1 to 4 are 1.414 MPa, 3.531 MPa, 1.124 MPa, and 2.318 MPa, respectively. Comparative analysis indicates that the maximum principal stress curves at these four locations change to varying degrees as the dislocation magnitude increases.
As seen in
Figure 16, when the dislocation magnitude exceeds 40 cm, the stress value at the junction of the two compartments at different horizontal levels (Measuring Point 2) exceeds the axial tensile strength of C40 concrete (2.39 MPa). Therefore, segmented joints should be preemptively designed at this location during the structural design phase. Additionally, real-time monitoring at this measuring point is essential during construction. Early warning measures must be implemented promptly once the dislocation magnitude surpasses 40 cm.
4.2.3. Comparative Analysis
A comparative analysis of the stresses in the compartmentalized utility tunnel cross section is shown in
Figure 19. The tensile stresses under the oblique intersection condition are generally greater than those under the orthogonal condition. This is because a smaller intersection angle between the ground fissure and the utility tunnel induces greater torsional deformation in the horizontal direction. Under both the oblique and orthogonal conditions, the tensile stress at Measuring Point 2 of the compartmentalized cross section is higher than that at Measuring Points 1, 3, and 4. Measuring Point 2 is located at the junction of the two compartments at different horizontal levels. It can therefore be concluded that, compared with a conventional rectangular cross section, the compartmentalized cross section generates higher tensile stresses at the junction where the compartment levels change. Furthermore, the highest tensile stress occurs at this junction under the oblique intersection condition. Consequently, during both construction and operation, special emphasis should be placed on increasing the monitoring frequency at the junction where the compartment levels change in the compartmentalized cross section under oblique intersection conditions.
4.3. Comparison of Stress and Deformation Characteristics of Three Types of Tunnel Cross Sections
Due to the multi-compartment and multi-level nature of utility tunnel cross sections compared with subway tunnels, their mechanical behavior is relatively complex. Therefore, this study compares the mechanical characteristics of rectangular single-compartment, conventional double-compartment rectangular, and compartmentalized cross-section tunnels under both orthogonal and oblique intersection conditions with ground fissures. The similarities and differences among the three are analyzed and summarized in
Table 5.
The comparison reveals that utility tunnels with different cross-section types exhibit similar failure characteristics when intersected by ground fissures. During ground fissure dislocation, the top of the hanging wall and the bottom of the footwall are subjected to tension, with the mechanical responses of the hanging wall and footwall being opposite. In the double-compartment rectangular tunnel, the central partition enhances the shear resistance and stiffness of the structure, thereby reducing its deformation capacity. However, the largest tensile stress occurs at the junction of the two compartments at different levels in the compartmentalized cross section. Thus, this area requires particular attention.
5. Conclusions
This study investigates the failure mechanism of utility tunnels under the influence of ground fissure activity, aiming to reveal the response patterns of the tunnel and surrounding soil under different intersection conditions and to provide a basis for engineering failure prevention design. Through numerical simulation and theoretical analysis, the following conclusions are drawn:
(1) Under both orthogonal and oblique intersection conditions with ground fissures, the soil on the hanging wall side of the utility tunnel exhibits significant differential settlement, with a higher settlement gradient near the fissure and an overall settlement trend in areas farther away. Comparison shows that the relative structural dislocation of the tunnel under orthogonal conditions is smaller than that under oblique conditions.
(2) The tensile stress in the compartmentalized cross section under oblique conditions is generally higher than that under orthogonal conditions. This is because a smaller intersection angle exacerbates the torsional deformation of the structure in the horizontal plane, leading to a more pronounced stress concentration.
(3) Compared with conventional rectangular cross sections, the compartmentalized cross section shows peak tensile stress at the nodes where compartment dimensions change, identifying these as structural weak points. It is recommended to enhance deformation and stress monitoring at these locations during both construction and operational phases.
In future engineering practice, this study can guide the site selection and structural design of utility tunnels crossing ground fissure zones, including reasonable control of the intersection angle between the tunnel and fissures, optimization of compartment node details, and other measures to ensure the structural integrity and operational safety of utility tunnels.
Author Contributions
Y.Z.: Writing—original draft, Conceptualization, Methodology, Supervision. X.W.: Data curation, Formal analysis. F.Y.: Methodology, Supervision, Visualization. L.W.: Methodology, Supervision, Visualization. N.X.: Validation, Visualization, Investigation. All authors have read and agreed to the published version of the manuscript.
Funding
This research was funded by Shaanxi Provincial Key Research and Development Program grant [2024SF-YBXM-624] Shaanxi Provincial Department of Education Local Service Special Scientific Research Program Project [22JC046] and Scientific Research Project of Shaanxi Provincial Department of Transportation [23-95K].
Data Availability Statement
The original contributions presented in this study are included in the article. Further inquiries can be directed to the corresponding authors.
Conflicts of Interest
Author Feilong Yan was employed by the company Shaanxi Provincial Traffic Environmental Monitoring Center Station Co., Ltd. The remaining authors declare that the research was conducted in the absence of any commercial or financial relationships that could be construed as a potential conflict of interest.
References
- Peng, J.B.; Huang, Q.B.; Hu, Z.P.; Wang, M.X.; Li, T.; Men, Y.M.; Fan, W. A proposed solution to the ground fissure encountered in urban metro construction in Xi’an, China. Tunn. Undergr. Space Technol. 2017, 61, 12–15. [Google Scholar] [CrossRef]
- Peng, J.B.; Chen, L.W.; Huang, Q.B.; Men, Y.M.; Fan, W.; Yan, J.K. Physical simulation of ground fissures triggered by underground fault activity. Eng. Geol. 2013, 155, 19–30. [Google Scholar] [CrossRef]
- Zhang, D.; Hu, Z.; Lu, G.; Wang, R.; Ren, X. Experimental Study on Deformation Mechanism of a Utility Tunnel in a Ground Fissure Area. Adv. Mater. Sci. Eng. 2020, 2020, 6758978. [Google Scholar] [CrossRef]
- Yuan, L.Q.; Liu, N.N.; Yang, M. Soil pressure analysis of subway tunnel across ground fissures under the train load. In Proceedings of the International Conference on Civil, Structure and Environmental Engineering, Guangzhou, China, 12–13 March 2016. [Google Scholar]
- Meng, Z.J.; Peng, J.B.; Huang, Q.B.; Deng, Y.H. Damage characteristics and structural crack resistance design of subway tunnel intersecting ground fissures. J. Chang’an Univ. (Nat. Sci. Ed.) 2016, 36, 88–97. [Google Scholar]
- Yang, L.W.; Yang, M.; Men, Y.M. Experimental study on dynamic interaction model of ground fissure-tunnel-surrounding rock. China Earthq. Eng. J. 2019, 41, 710–716. [Google Scholar]
- Huang, Q.B.; Guo, R.; Zhang, N. Study on anti-cracking fortification of Xi’an Metro Line Lintong crossing ground fissures and fault zones. Mod. Tunn. Technol. 2018, 55, 144–151. [Google Scholar]
- Yang, Z.; Huang, Q.B.; Wang, L.X.; Wang, Y.L. Analysis of shield construction settlement of subway tunnel in Xi’an ground fissure site. Railw. Stand. Des. 2021, 65, 95–103. [Google Scholar]
- Huang, Q.B.; Jiang, Z.K.; Deng, Y.H. Study on optimization of segmented length of subway tunnel structure crossing ground fissures. Hydrogeol. Eng. Geol. 2019, 46, 109–117. [Google Scholar]
- Mei, Y.; Zhang, Y.T.; Yuan, Y.L.; Ma, H.Y.; Zhang, L.; Zhao, J.B. Study on Mechanical Response and Early Warning Criteria of Utility Tunnel Crossing Ground Fissures. J. Saf. Environ. 2020, 20, 1295–1304. [Google Scholar]
- Gou, Y.X.; Huang, Q.B.; Wang, L.X. Study on structural behavior and adaptability of shield tunnel in ground fissure environment. Railw. Stand. Des. 2020, 64, 1–9. [Google Scholar]
- Canto-Perello, J.; Curiel-Esparza, J.; Calvo, V. Strategic decision support system for utility tunnel’s planning applying A’WOT method. Tunn. Undergr. Space Technol. 2016, 55, 146–152. [Google Scholar] [CrossRef]
- Li, J.; Yue, Q.X.; Chen, J. Dynamic response of utility tunnel during the passage of Rayleigh waves. Earthq. Sci. 2010, 23, 13–24. [Google Scholar] [CrossRef]
- Chen, J.; Jiang, L.; Li, J.; Shi, X. Numerical simulation of shaking table test on utility tunnel under non-uniform earthquake excitation. Tunn. Undergr. Space Technol. 2012, 30, 205–216. [Google Scholar] [CrossRef]
- Hu, Z.P.; Zhang, D.; Zhang, Y.G. Laboratory model test study on deformation and failure mechanism of underground utility tunnel structure obliquely crossing active ground fissures. Chin. J. Rock Mech. Eng. 2019, 38, 2550–2560. [Google Scholar]
- Deng, B.T.; Tian, J.T.; Su, S.Q.; Li, X.; Li, P.; Li, X. Calculation method for the void range at the bottom of utility tunnel structure under the action of ground fissures. J. Xi’an Univ. Archit. Technol. (Nat. Sci. Ed.) 2021, 53, 173–177+185. [Google Scholar]
- Yan, Y.F.; Huang, Q.B.; Yang, X.J.; Wang, P. Study on deformation and mechanical characteristics of underground utility tunnel crossing ground fissures. J. Eng. Geol. 2018, 26, 1203–1210. [Google Scholar]
- Yan, Y.F. Study on Structural Behavior of Urban Underground Utility Tunnel in Ground Fissure Environment. Master’s Thesis, Chang’an University, Xi’an, China, 2019. [Google Scholar]
- Zhang, Y.T. Study on Structural Deformation Law and Safety Early Warning Method of Utility Tunnel Under the Active Environment of Xi’an Ground Fissures. Ph.D. Thesis, Xi’an University of Architecture and Technology, Xi’an, China, 2020. [Google Scholar]
- Xu, Q.; Bai, C.Y.; Li, W.Y.; Zhang, Y.; Zhang, Z.Y. Response analysis of deformation and internal force of underground utility tunnel crossing active ground fissures. J. Eng. Geol. 2021, 29, 1632–1639. [Google Scholar]
- Wang, Q.Y.; Lu, G.G.; Zhang, Y.G.; Hu, Z.P.; Wang, S.Q. Study on deformation and mechanical characteristics of utility tunnel crossing ground fissures at large angle. J. Xi’an Univ. Archit. Technol. (Nat. Sci. Ed.) 2019, 51, 825–832. [Google Scholar]
- Liu, W.; Huang, W.; Zhai, S. Study on Joint Types of Segmental Prefabricated Utility Tunnels. Concrete 2023, 11, 210–214+221. [Google Scholar]
- Liu, Y.; Pi, Y. Stability and Support Technology of Large Cross-Section Irregular Foundation Pit in Utility Tunnel. Eng. Constr. 2022, 36, 354–357. [Google Scholar]
- Wang, X.Y.; Chen, C. Vibration Table Test of Prefabricated L-Shaped Column Concrete Structure. Buildings 2025, 15, 2329. [Google Scholar] [CrossRef]
- Zhou, D.; Mei, Y.; Ke, X.; Liu, Z.; Xu, W. Study on the structural behavior and reinforcement design of openings in subway station floor slabs. J. Build. Eng. 2024, 98, 110994. [Google Scholar] [CrossRef]
- Wang, X.; Wang, B.; Yuan, Y.; Yang, T.; Dong, G.; Shi, C. Study on the Effect of EICP Combined with Nano-SiO2 and Soil Stabilizer on Improving Loess Sur-face Strength. Buildings 2025, 15, 1998. [Google Scholar] [CrossRef]
- Fan, S.; Song, Z.; Xu, T.; Wang, K.; Zhang, Y. Tunnel deformation and stress response under the bilateral foundation pit construction: A case study. Arch. Civ. Mech. Eng. 2021, 21, 109. [Google Scholar] [CrossRef]
- Tian, X.; Song, Z.; Wang, H.; Zhang, Y.; Wang, J. Evolution characteristics of the surrounding rock pressure and construction techniques: A case study from Taoshuping tunnel. Tunn. Undergr. Space Technol. 2022, 125, 104522. [Google Scholar] [CrossRef]
- Zhang, Y.H.; Li, F.T.; Yang, R.M. Numerical simulation and analysis of double-cell rectangular utility tunnel orthogonally cross-ing ground fissures. J. Civ. Eng. Manag. 2020, 37, 136–144. [Google Scholar]
Figure 1.
Section diagram of a trigger section engineering environment integrated utility tunnel. Note: Points 1–4 in the figure represent the four monitoring points for post-construction monitoring.
Figure 1.
Section diagram of a trigger section engineering environment integrated utility tunnel. Note: Points 1–4 in the figure represent the four monitoring points for post-construction monitoring.
Figure 2.
Utility tunnel construction process flow chart.
Figure 2.
Utility tunnel construction process flow chart.
Figure 3.
Schematic diagram of the model.
Figure 3.
Schematic diagram of the model.
Figure 4.
Vertical displacement of surface curve of underground utility tunnel obliquely crossed to the ground fissure (inclination 66°).
Figure 4.
Vertical displacement of surface curve of underground utility tunnel obliquely crossed to the ground fissure (inclination 66°).
Figure 5.
Structural deformation cloud map of underground utility tunnel obliquely crossed to the ground fissure (inclination 66°).
Figure 5.
Structural deformation cloud map of underground utility tunnel obliquely crossed to the ground fissure (inclination 66°).
Figure 6.
Structural deformation curve of underground utility tunnel obliquely crossed to the ground fissure (Measuring Point 1).
Figure 6.
Structural deformation curve of underground utility tunnel obliquely crossed to the ground fissure (Measuring Point 1).
Figure 7.
Structural deformation curve of underground utility tunnel obliquely crossed to the ground fissure (Measuring Point 2).
Figure 7.
Structural deformation curve of underground utility tunnel obliquely crossed to the ground fissure (Measuring Point 2).
Figure 8.
Vertical displacement of surface curve of underground utility tunnel orthogonally crossed to the ground fissure.
Figure 8.
Vertical displacement of surface curve of underground utility tunnel orthogonally crossed to the ground fissure.
Figure 9.
Structural deformation curve of underground utility tunnel orthogonally crossed to the ground fissure (Measuring Point 1).
Figure 9.
Structural deformation curve of underground utility tunnel orthogonally crossed to the ground fissure (Measuring Point 1).
Figure 10.
Structural deformation curve of underground utility tunnel orthogonally crossed to the ground fissure (Measuring Point 2).
Figure 10.
Structural deformation curve of underground utility tunnel orthogonally crossed to the ground fissure (Measuring Point 2).
Figure 11.
Maximum principal stress curve of underground utility tunnel obliquely crossed to the ground fissure (Measuring Point 1).
Figure 11.
Maximum principal stress curve of underground utility tunnel obliquely crossed to the ground fissure (Measuring Point 1).
Figure 12.
Maximum principal stress curve of underground utility tunnel obliquely crossed to the ground fissure (Measuring Point 2).
Figure 12.
Maximum principal stress curve of underground utility tunnel obliquely crossed to the ground fissure (Measuring Point 2).
Figure 13.
Maximum principal stress curve of underground utility tunnel obliquely crossed to the ground fissure (Measuring Point 3).
Figure 13.
Maximum principal stress curve of underground utility tunnel obliquely crossed to the ground fissure (Measuring Point 3).
Figure 14.
Maximum principal stress curve of underground utility tunnel obliquely crossed to the ground fissure (Measuring Point 4).
Figure 14.
Maximum principal stress curve of underground utility tunnel obliquely crossed to the ground fissure (Measuring Point 4).
Figure 15.
Maximum principal stress curve of underground utility tunnel orthogonal crossed to the ground fissure (Measuring Point 1).
Figure 15.
Maximum principal stress curve of underground utility tunnel orthogonal crossed to the ground fissure (Measuring Point 1).
Figure 16.
Maximum principal stress curve of underground utility tunnel orthogonal crossed to the ground fissure (Measuring Point 2).
Figure 16.
Maximum principal stress curve of underground utility tunnel orthogonal crossed to the ground fissure (Measuring Point 2).
Figure 17.
Maximum principal stress curve of underground utility tunnel orthogonal crossed to the ground fissure (Measuring Point 3).
Figure 17.
Maximum principal stress curve of underground utility tunnel orthogonal crossed to the ground fissure (Measuring Point 3).
Figure 18.
Maximum principal stress curve of underground utility tunnel orthogonal crossed to the ground fissure (Measuring Point 4).
Figure 18.
Maximum principal stress curve of underground utility tunnel orthogonal crossed to the ground fissure (Measuring Point 4).
Figure 19.
Road stress analysis and calculation results.
Figure 19.
Road stress analysis and calculation results.
Table 1.
Finite element mesh information of the model.
Table 1.
Finite element mesh information of the model.
| Model Number | Number of Elements | Number of Nodes |
|---|
| 1 | 62,607 | 68,764 |
| 2 | 77,541 | 83,416 |
Table 2.
Specific parameters of numerical simulation.
Table 2.
Specific parameters of numerical simulation.
| Soil Layer Name | H (m) | w/% | e0 | c/kPa | φ/° | | fak/kPa | Es/MPa |
|---|
| Miscellaneous fill | 2.0 m | - | - | 10 | 15 | 18 | 100 | 4.0 |
| Loess | 6.0 m | 19.8 | 1.15 | 21.5 | 20.0 | 16.5 | 120 | 10.0 |
| Paleosols | 3.6 m | 20.76 | 0.98 | 29.5 | 23.0 | 17.5 | 150 | 10.0 |
| Old loess | 15.0 m | 22.18 | 0.93 | 31.5 | 21.5 | 16.0 | 160 | 7.0 |
| Silty clay | 4.0 m | 26.84 | 0.81 | 39.0 | 26.0 | 19.5 | 180 | 8.2 |
| Underground utility tunnel | - | - | - | 2.5 | 47 | 25 | - | - |
Table 3.
Coefficient of friction.
Table 3.
Coefficient of friction.
| | Hanging Wall | Foot Wall | Underground Utility Tunnel |
|---|
| Hanging wall | - | 0.3 | 0.7 |
| Foot wall | 0.3 | - | 0.7 |
| Underground utility tunnel | 0.7 | 0.7 | - |
Table 4.
Analysis condition.
Table 4.
Analysis condition.
| No. | Ground Fissure Displacement/cm | Crossing Angle/(°) | No. | Ground Fissure Displacement/cm | Crossing Angle/(°) |
|---|
| 1-1 | 0 | 66° | 4-1 | 30 | 66° |
| 1-2 | 90° | 4-2 | 90° |
| 2-1 | 10 | 66° | 5-1 | 40 | 66° |
| 2-2 | 90° | 5-2 | 90° |
| 3-1 | 20 | 66° | 6-1 | 50 | 66° |
| 3-2 | 90° | 6-2 | 90° |
Table 5.
Comparison of stress and deformation characteristics of three sections of utility tunnel.
Table 5.
Comparison of stress and deformation characteristics of three sections of utility tunnel.
| Cross-Section Type | Stress and Deformation Characteristics |
|---|
| Single-Cell Rectangular Section | When subjected to ground fissure dislocation, the hanging wall section experiences compression at the top and tension at the bottom, while the footwall section exhibits tension at the top and compression at the bottom [11]. |
| Standard Double-Cell Rectangular Section | Under ground fissure activity, the hanging wall section is subjected to compression at the top and tension at the bottom, whereas the footwall section experiences tension at the top and compression at the bottom. Regardless of whether the utility tunnel intersects with the ground fissure orthogonally or obliquely, the maximum stress values consistently occur at the partition wall location on the top surface of the footwall and at the partition wall location on the bottom surface of the hanging wall [29]. |
| Flat-Deck Section | Under the oblique intersection condition, the stresses in both the roof and base slabs of the utility tunnel exhibited an initial increase followed by a decrease, with all stress values remaining positive (i.e., tensile). In contrast, under the orthogonal intersection condition, the stress variation trend was less pronounced; however, the maximum stress values consistently occurred at the location of the ground fissure. Notably, the flat-deck section generated notably higher tensile stresses at the junctions where the horizontal planes of different compartments change. |
| Disclaimer/Publisher’s Note: The statements, opinions and data contained in all publications are solely those of the individual author(s) and contributor(s) and not of MDPI and/or the editor(s). MDPI and/or the editor(s) disclaim responsibility for any injury to people or property resulting from any ideas, methods, instructions or products referred to in the content. |
© 2025 by the authors. Licensee MDPI, Basel, Switzerland. This article is an open access article distributed under the terms and conditions of the Creative Commons Attribution (CC BY) license (https://creativecommons.org/licenses/by/4.0/).

