Abstract
This study investigated a strengthening strategy for reinforced concrete (RC) T-beams in the negative-moment region using polymer cement mortar (PCM) systems. Monotonic loading tests were conducted on beams retrofitted with PCM, incorporating steel reinforcements of either 13 mm or 16 mm in diameter. The flexural performance of the strengthened specimens was assessed under three-point bending, with a focus on load–deflection behavior, crack patterns, and failure modes. Key structural parameters governing the structural response were analyzed. The findings indicated that incorporating PCM markedly improved the flexural capacity of RC T-beams, with increases in the ultimate load of 55% and 99% for the two reinforcement configurations. Although the beam strengthened with 16 mm steel bars exhibited reduced ductility, its energy absorption was 29% higher compared to its 13 mm counterpart. A three-dimensional nonlinear finite element model was also developed in ABAQUS 6.14, and its predictions closely matched the experimental observations.
1. Introduction
Concrete remains the predominant material in global construction due to its advantageous properties, including cost-effectiveness, formwork adaptability, long-term durability, and inherent fire resistance [1,2]. Nevertheless, these benefits do not render concrete structures immune to deterioration. Over time, reinforced concrete (RC) elements, such as beams, are vulnerable to degradation caused by continuous exposure to environmental stressors such as moisture ingress, thermal fluctuations, chemical attacks, and mechanical loading. These factors gradually impair the concrete’s mechanical and physical properties, and ultimately compromise its load-bearing capacity and structural integrity [3,4,5]. If left unaddressed, this deterioration can lead to premature failure, raising concerns over safety, serviceability, and escalating maintenance costs, especially in aging infrastructure. To mitigate these risks, the implementation of effective strengthening and retrofitting strategies is essential in order to extend service life, restore performance, and ensure compliance with developing design and safety standards [6,7,8,9,10].
In response to these challenges, a wide range of strengthening methodologies has been developed and applied over the past few decades. Conventional approaches include section enlargement through concrete or steel jacketing [11,12,13,14], the addition of exoskeleton frame systems [15,16], and both bonded and unbonded prestressing techniques [17,18,19,20]. More recently, the scope of retrofitting technologies has expanded to include advanced materials and systems such as fabric-reinforced cementitious matrices (FRCMs) [21] and ultra-high-performance concrete (UHPC) applications [22,23,24,25]. While each method offers distinct advantages, practical implementation is often constrained by technical, economic, or logistical limitations. For instance, section enlargement can increase dead loads and reduce usable space, which may affect adjacent architectural or mechanical systems. Exoskeleton frames involve complex installation procedures, high labor costs, and difficulties in coordination with existing facades, particularly in urban environments. FRCMs may suffer from inadequate bonding to aged or irregular substrates, and demand meticulous surface preparation. Similarly, UHPC faces limitations related to high material costs, specialized placement requirements, and compatibility concerns when applied to conventional concrete without proper interface treatment.
Furthermore, given the widespread concerns regarding the long-term efficacy of epoxy-based fiber-reinforced polymer (FRP) systems, extensive research has been devoted to both validating their strengthening effectiveness and critically examining their practical limitations. FRP systems have been extensively employed owing to their exceptional tensile strength, resistance to corrosion, low weight, and ease of installation with minimal alteration to structural geometry. These systems primarily function by enhancing tensile capacity or providing confinement to RC elements, leading to improved structural performance under various loading conditions [26,27,28,29,30,31,32,33,34]. However, despite these promising results, FRP-based techniques are not without inherent drawbacks. Chief among them is the reliance on epoxy adhesives, which are known for inadequate fire performance, high smoke production, and rapid degradation of mechanical properties at elevated temperatures. In addition, ultraviolet exposure can deteriorate the matrix, while thermal mismatch between epoxy and concrete may lead to debonding, particularly under fluctuating temperature or moisture conditions [35,36,37,38,39].
In light of the limitations associated with the abovementioned systems, attention has increasingly shifted toward alternative cementitious composites that offer greater material compatibility. Of these, high-strength polymer cement mortar (PCM) has gained particular attention as a viable solution for structural rehabilitation and strengthening. Its favorable characteristics, including improved workability, bond strength, freeze–thaw resistance, low permeability, controlled shrinkage, and enhanced durability, make it particularly suitable for retrofitting applications [40,41,42,43,44,45,46]. These performance advantages stem primarily from the incorporation of functional polymer modifiers, which impart properties that are unattainable with ordinary cement mortar or concrete alone [47,48,49,50,51,52,53,54,55].
PCM is distinguished by its hybrid composition, in which polymer admixtures are combined with conventional cementitious matrices, and exhibits superior adhesion to concrete substrates, making it ideal for applications where the integrity of bonding is critical [56,57,58,59]. The polymer content also facilitates the formation of a cohesive internal structure during curing, especially under dry conditions, leading to improved interfacial performance, dimensional stability, and environmental resistance [60,61]. One widely adopted use of PCM involves the strengthening of RC structures such as pavement slabs, bridge decks, and dams, which involves anchoring reinforcement beneath the structural element and applying a PCM overlay via spraying or troweling techniques [62,63,64]. Experimental studies have consistently shown that such overlays enhance flexural strength and stiffness [65], reduce deformation and stress concentrations [66], and significantly improve fatigue resistance under repeated loading conditions [62].
Despite extensive research on the application of PCM in structural strengthening, investigations focusing on the negative moment area of RC T-beams, and particularly those employing steel-reinforced PCM overlays, remain limited. The negative-moment region is of critical structural importance, as it commonly occurs at beam–column connections or over continuous supports, where the flange is subjected to tension and the web to compression. These areas are prone to early cracking, stiffness degradation, and loss of ductility under service and seismic loading, which can significantly compromise the integrity of the overall structural system. As highlighted by Jumaat et al. [67], this region experiences a complex interaction between bending and shear forces, where peak tensile stresses develop in the slab portion, as illustrated in Figure 1.
Given these demanding conditions, effective strengthening of the negative-moment region is essential to ensure continuity of load transfer, enhanced seismic resilience, and prevention of progressive cracking at critical joint zones. Despite its importance, however, few comprehensive studies have combined experimental and numerical approaches to evaluate such strengthening systems. To address this gap and build upon the work of Nugroho et al. [68], the present study involves an experimental and numerical analysis of the flexural behavior of RC T-beams strengthened with steel-reinforced PCM overlays in the negative-moment region, with priority given to structural performance over material durability. This study highlights not only the structural relevance of this region but also the novelty of employing a high-strength PCM layer with embedded steel reinforcement as a practical retrofit strategy that enhances tensile resistance while moderately increasing the overall sectional depth of the beam.
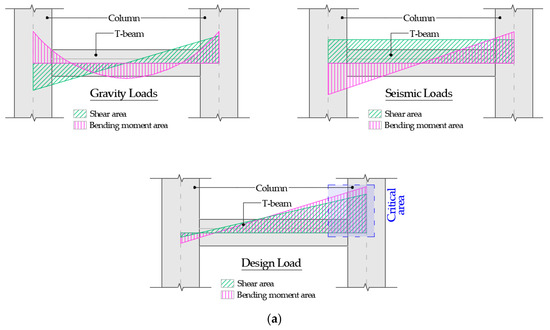
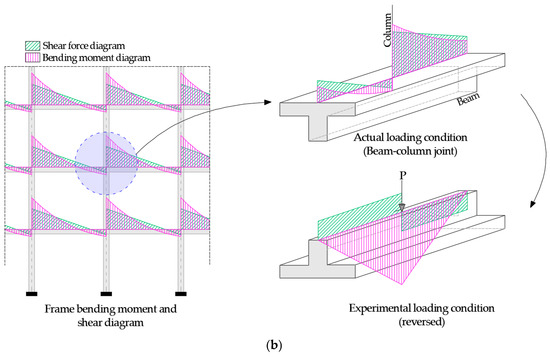
Figure 1.
The illustration of the negative-moment region, adapted from Tudjono et al. [69]: (a) internal forces at the beam-column joint; (b) experimental modification.
The experiments utilized a three-point bending configuration to assess the flexural response of two strengthened RC T-beams and one unstrengthened control specimen, following the procedure of Tudjono et al. [69]. This setup was designed to replicate compressive response in the web and tensile demand in the flange, characteristic of the negative-moment region. Two reinforcement systems using 13 mm and 16 mm diameter bars embedded within the PCM overlay were examined through a detailed assessment of load–deflection behavior, strength, stiffness, ductility, energy absorption, and strain distribution. In conjunction with physical testing, a finite element (FE) model was built and evaluated against the experimental outcomes to validate its predictive capability.
2. Experimental Program
2.1. Materials
2.1.1. Normal-Strength Concrete (NSC) and High-Strength PCM
The RC beam specimens were fabricated using NSC, aiming for a 28-day compressive strength of 25 MPa, supplied by a local ready-mix plant. To verify the actual strength of the concrete, standard cylindrical samples (150 × 300 mm) were collected directly from the delivery truck during casting and prepared in accordance with ASTM C39/C39M-21 [70]. For each batch, three cylinders were fabricated and cured under environmental conditions identical to those of the test specimens. Compressive strength tests were conducted after 28 days of curing utilizing a 100-ton universal testing machine (UTM) supplied by Shimadzu Corporation, Tokyo, Japan, at National Cheng Kung University (NCKU), Taiwan, as depicted in Figure 2a.
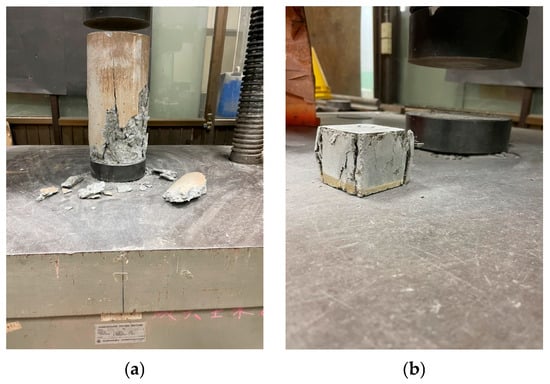
Figure 2.
Photographs of the compressive tests: (a) NSC; (b) PCM.
High-strength PCM, manufactured by UBE Industries, Ltd., Tokyo, Japan [59,71], was employed for the strengthening overlays. The selection of a higher-strength material was made to ensure adequate tensile resistance, superior bond performance, and crack control when applied as a thin overlay to an existing RC substrate. Compared with NSC, this material provides enhanced interface adhesion, reduced shrinkage, and improved load transfer efficiency, key factors in achieving strong composite action between the overlay and the original beam. The design decision corresponded with the study’s objective of prioritizing structural performance over material durability, and allowed the investigation to focus on flexural behavior improvement rather than long-term degradation effects.
To investigate the compressive performance of the PCM, cubic specimens measuring 50 mm per side were prepared in accordance with ASTM C109/C109M-20 [72] during the casting of each retrofitted beam. These cubes were cured under identical conditions as the strengthened specimens and were tested after 28 days using a 100-ton UTM at NCKU, as displayed in Figure 2b. Before testing, the specimens’ ends were ground or capped with plaster to ensure uniform load distribution. Table 1 summarizes the mean compressive strengths of both NSC and PCM.

Table 1.
Mechanical properties of NSC and PCM.
2.1.2. Reinforcing Steel Bars
The reinforcement layout for the RC beam specimens included three different sizes for the bars: #3 (Ø10), #4 (D13) and #5 (D16). To determine their actual tensile properties, uniaxial tension tests were conducted at NCKU using a 50-ton UTM, manufactured by Shimadzu Corporation, Tokyo, Japan, in accordance with ASTM A370-18 [73]. Each test involved a constant-rate loading protocol, which was applied until fracture, using the setup shown in Figure 3.
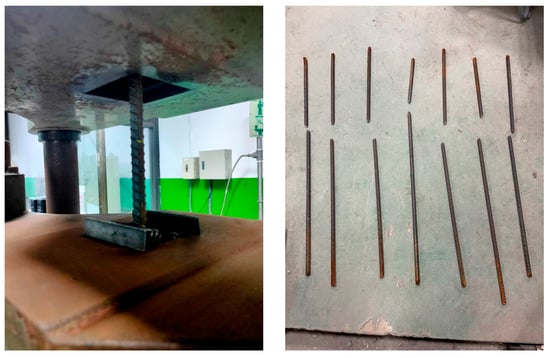
Figure 3.
Photographs of the tensile tests of reinforcing steel rebars.
For each type of bar, three specimens measuring 600 mm in length were tested to ensure representative and consistent results. During testing, the load and elongation were continuously recorded to capture both the elastic and plastic behavior of the steel bars. The stress–strain responses obtained in this way confirmed that all reinforcing bars exhibited typical ductile behavior, with distinct yield and strain-hardening phases. The average yield and tensile strengths derived from these tests are summarized in Table 2.

Table 2.
Mechanical properties of steel reinforcements.
2.2. Test Specimens
2.2.1. Design Scheme
This study involved the fabrication of three full-scale RC T-beam specimens, which were designed to examine the flexural performance of steel-reinforced PCM overlays applied in the negative moment zone. The specimens’ geometry was selected to represent typical dimensions of the floor beams used in building construction, while also accommodating the constraints of laboratory-scale testing. Each specimen measured 3300 mm in overall span and a T-shaped cross-section composed of a 600 mm wide flange with a 120 mm thickness, a 150 mm wide web, and an overall depth of 300 mm. The selected flange width followed conventional design provisions, which prescribe that the effective flange width be taken as the smallest among one-quarter of the span (L/4), the center-to-center distance of adjacent beams, or the actual slab width [74]. For a 3300 mm length, the L/4 criterion yields 825 mm, hence the adopted value of 600 mm for the flange width both practical and representative of real-world T-beam arrangements.
The internal reinforcement comprised two deformed steel bars, 16 mm in diameter (D16), positioned longitudinally in both the compression and tension zones of the web. The flange was reinforced with eight plain round bars, 10 mm in diameter (Ø10), distributed at 175 mm spacing. The choice of plain bars for the flange was intentional, and was made to minimize mechanical interlock at the interface and to better represent the relatively smooth surface conditions typically encountered in slab–beam connections of existing structures. This configuration also facilitated controlled cracking and relatively uniform strain development along the flange reinforcement during testing, with minimal local stress concentrations, and ensured that the measured strain response reflected the overall flexural behavior rather than localized bond effects. To prevent premature shear failure, Ø10 stirrups were provided as transverse reinforcement along the entire span, also spaced at 175 mm. A 20 mm concrete cover was applied over the stirrups to meet the durability requirements. Figure 4a presents a schematic overview of the specimen design and reinforcement configuration.
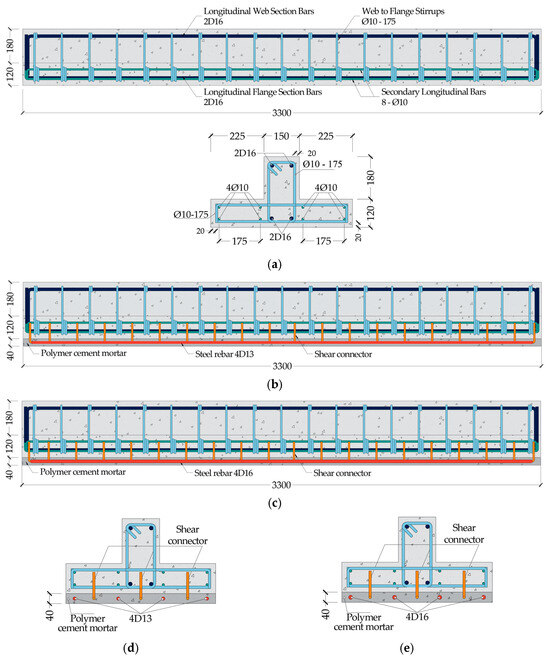
Figure 4.
Schematic diagrams of test specimens (units: mm): (a) reinforcement details; (b) strengthened specimen of SB-M-13; (c) strengthened specimen of SB-M-16; (d) SB-M-13 section detail; (e) SB-M-16 section detail.
In this experimental program, one beam was designated as the unstrengthened control specimen (UB), which served as a baseline to demonstrate the behavior of an existing RC T-beam prior to retrofitting. The other two beams were enhanced by applying PCM overlays to the negative-moment region. Strengthening was achieved by casting a PCM layer, 40 mm in thickness, along the full length of the tensile flange surface; this value for the thickness was consistent with effective retrofit ranges documented in previous research [75,76,77,78,79,80,81,82]. To explore the effect of reinforcement size within the PCM overlay, two distinct configurations were adopted: one that incorporated deformed bars 13 mm in diameter (SB-M-13) and the other 16 mm bars (SB-M-16). The reinforcement layout and detailed geometry of the strengthened beams are depicted in Figure 4b–e.
2.2.2. Specimen Preparation
Fabrication of the RC T-beams commenced with the assembly of steel reinforcement cages, which were carefully placed into T-section molds to facilitate efficient casting. Spacer blocks were used to maintain consistent concrete cover in accordance with design specifications. To simulate retrofit conditions that were representative of in-service structures, the strengthening procedure was initiated after a 28-day curing period, thus ensuring that the beams had reached their intended design strength. Prior to application of PCM, the tensile flange surface was mechanically textured with a chipping hammer to promote effective bonding and to increase the mechanical interlock between the overlay and the substrate.
Mechanical shear connectors were employed to provide effective composite action between the PCM overlay and the NSC substrate, facilitating the transfer of shear forces at the interface and enabling the two materials to act integrally under external loading conditions [83]. The nominal shear strength of each connector was determined in accordance with the AASHTO LRFD design specifications [84]. Based on the anticipated tensile demand developed in the PCM layer and its embedded reinforcement, the required number of shear connectors was first determined for a single shear span, extending from the mid-span loading point to the support where interface shear transfer occurred. The total number of connectors was then doubled, to account for the two identical shear spans along the beam. This approach ensured balanced shear transfer on both sides of the specimen, and provided sufficient anchorage to prevent premature delamination. The connectors were uniformly arranged along the flange length at 175 mm intervals to maintain consistent load transfer and effective composite action.
To minimize interference with the existing internal reinforcement and to diminish the risk of concrete damage during installation, 10 mm diameter steel bars were adopted as shear connectors. This value for the diameter was selected both for practical constructability reasons and as a design parameter when calculating the total number of connectors. In principle, using a larger or smaller connector diameter would alter the shear transfer capacity of each connector, consequently changing the total number required to satisfy the design demand. The selected 10 mm bars provided an appropriate balance between sufficient shear resistance, ease of placement, and compatibility with the thin PCM overlay. Each connector was bent at a 90-degree angle at the embedded end to enhance mechanical anchorage and ensure sufficient load transfer within the limited overlay thickness. To mitigate the risk of pull-out failure, the embedment length was determined based on the anchorage provisions outlined in ACI 318 [74], which require a minimum depth of 10 times the bar diameter, or 100 mm, consistent with typical practice for RC detailing.
Figure 5 illustrates the placement and detailing of the shear connectors embedded in the retrofitted beam flange. To facilitate installation, holes 12 mm in diameter were precisely drilled along the flange to accommodate the connector bars. Prior to casting the PCM overlay, both the concrete surface and drilled holes were meticulously cleaned using wire brushing and compressed air to ensure optimal bond conditions. The shear connectors were then anchored in place using HIT-RE 500 V3, a high-performance injection epoxy specifically formulated for post-installation reinforcement applications in concrete. The installation process adhered to the specifications provided in the HILTI technical manual, ensuring compliance with industry best practices for structural anchorage systems.

Figure 5.
Application of shear connectors (units: mm): (a) placement of shear connectors on strengthened beams; (b) detail of a shear connector.
Following surface preparation and installation of the shear connectors, steel reinforcement was carefully arranged within the designated overlay zone. A concrete bonding agent was applied to the prepared substrate to enhance adhesion between the existing concrete and the PCM layer. The PCM was then cast onto the tensile flange surface of the beams, ensuring full integration with the underlying structure. Following this placement, the overlay was subjected to wet curing conditions and allowed to age for 28 days to acquire the appropriate mechanical properties. Figure 6 illustrates the complete sequence of the strengthening procedure.
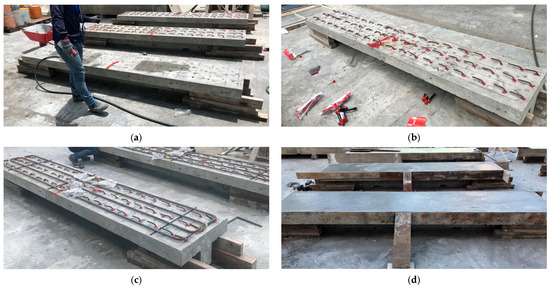
Figure 6.
Strengthening procedure: (a) interface preparation; (b) installation of the shear connector; (c) arrangement of the reinforcement layer; (d) PCM casting.
2.3. Test Setup and Instrumentation
A reversed-bending setup was employed to replicate the negative (hogging) moment behavior of RC T-beams, a condition characterized by compressive stresses in the web flange and tensile stresses concentrated within the flange. This was achieved by inverting the beam so that the flange faced downward and the web was in compression, thereby reproducing the stress state that typically occurs above supports in continuous beams. Subsequently, each specimen was subjected to a flexural test under a center-loaded configuration spanning 2300 mm, as shown in Figure 7.
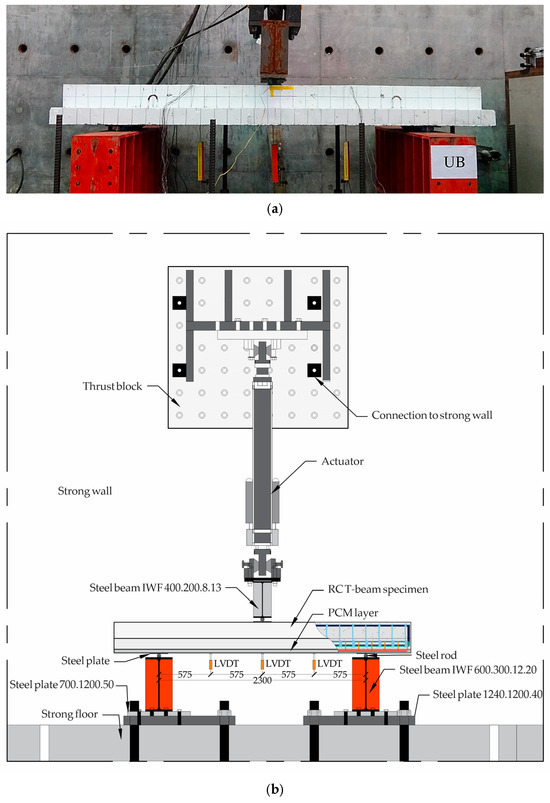
Figure 7.
Graphical illustration of the loading arrangement and boundary conditions adopted for beam testing: (a) photograph of the specimen undergoing testing; (b) details of the components and instrumentation (units: mm).
Although flexural test under dual loading points is typically employed to create a uniform-moment region, a single-point loading configuration was intentionally chosen in this study to concentrate the maximum negative bending moment and accompanying shear force at the mid-span, thereby more accurately reflecting the combined flexural–shear demand observed near interior supports of continuous RC beams. The boundary conditions were established using pinned and roller supports to permit levels of rotation and horizontal restraint that were similar to realistic end conditions while ensuring accurate load transfer through the test frame. Despite the PCM overlay extending slightly beyond the support boundaries, an intentional simplification differing from real-world practice, this arrangement ensured adequate anchorage for the reinforcing steel integrated into the overlay and effectively mitigated premature debonding. Consequently, the selected setup reproduced the essential hogging-moment behavior and allowed for a focused evaluation of the strengthening mechanism in the negative-moment region.
The loading procedure was performed using a servo-controlled hydraulic actuator with a capacity of 500 kN, operated in displacement control mode at a steady rate of 0.4 mm/s until failure occurred. Beam deflection was measured with linear variable differential transformers (LVDTs), and the applied loads were monitored through a calibrated load cell. Strain gauges were affixed to D16 longitudinal bars embedded in the NSC to record strain in the tensile reinforcement, designated TS-1, TS-2, and TS-3. In the strengthened specimens, an additional strain gauge (TS-M) was installed at mid-span on the longitudinal bar embedded within the PCM overlay to capture strain behavior specific to the composite layer. The positioning of all steel strain gauges is shown in Figure 8.
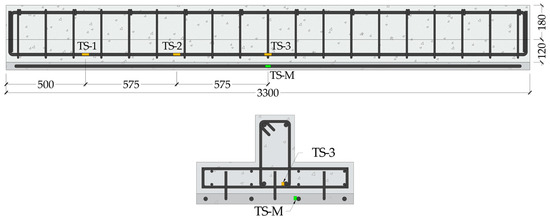
Figure 8.
Layout of strain gauge locations along the longitudinal reinforcing bars (units: mm).
3. FE Modeling
A nonlinear static analysis was performed to model the flexural behavior of the tested RC T-beams under monotonic loading. This analysis incorporated the nonlinearity of the material, represented by the constitutive models for concrete, steel, and PCM, as well as geometric nonlinearity in order to capture large-displacement effects at higher load levels. The modeling framework, including the geometry, boundary conditions, and material representation, was developed to accurately replicate the experimental setting.
3.1. Model Geometry and Element Description
To enable numerical replication of the structural behavior of the specimens, FE simulations were performed using the commercial platform ABAQUS 6.14 [85]. The model was developed to mirror the experimentally tested specimens in terms of material properties, geometry, and support conditions. Due to the symmetry and uniformity inherent in the setup, only one-quarter of the beam was represented in the numerical model, as illustrated in Figure 9. This reduced-scale representation meant that symmetrical boundary conditions could be imposed along two orthogonal planes, thereby streamlining the computational process. By limiting the model to a symmetric quarter domain, the number of elements was significantly reduced, yielding substantial gains in computational efficiency without compromising the accuracy of the global response predictions. The symmetry enforcement strategy involved constraining displacements normal to the respective planes of symmetry.
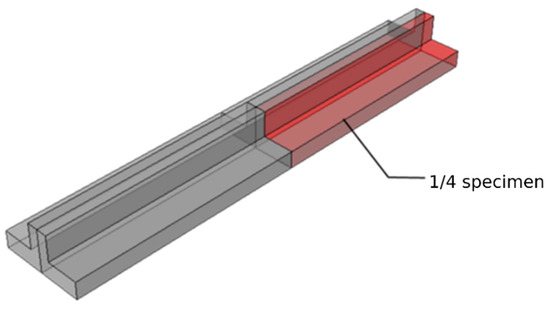
Figure 9.
Schematic representation of one-quarter of the test specimen.
Figure 10 illustrates the overall geometry and FE mesh configuration of the model. Three-dimensional eight-node reduced-integration solid elements (C3D8R) were employed to replicate the nonlinear behavior of both the concrete and PCM. Each node possessed translational degrees of freedom along the global x-, y-, and z-axes, allowing the element to effectively simulate complex material responses, including cracking in orthogonal directions under tension and crushing under compression. In addition to capturing the fracture and crushing behavior, this element formulation accommodates plastic deformation and time-dependent effects such as creep, making it well-suited to the simulation of cementitious materials.
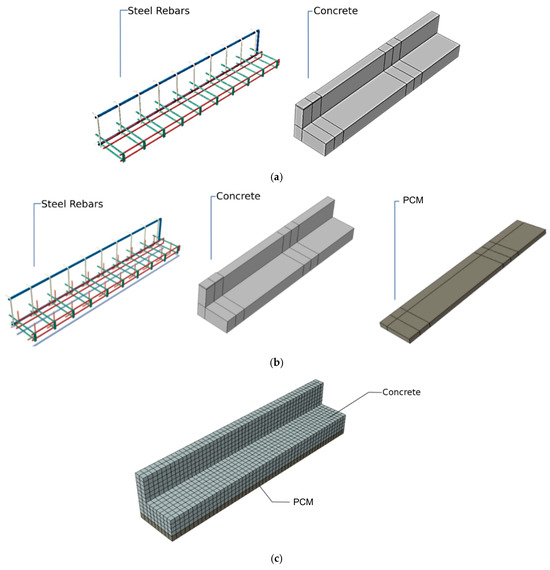
Figure 10.
Geometry of the FE model: (a) unstrengthened beam; (b) strengthened beam; (c) FE mesh configuration.
The steel reinforcement was computed by employing two-node linear truss elements (T3D2), which allow for axial deformation along all three global directions. This modeling choice was made because the reinforcement in the tested beams primarily carries axial tension and compression, whereas the bending and shear effects are negligible due to its confinement within the surrounding concrete. The truss formulation efficiently captures the axial load transfer mechanism and strain compatibility with the concrete elements while maintaining computational simplicity. The steel material was assumed to behave isotropically in tension and compression, consistent with typical FEM practice for RC modeling where the reinforcement response is dominated by axial deformation. A consistent mesh was generated for both the concrete and PCM regions, adopting an element size of 32 mm to provide an effective compromise between computing efficiency and simulation accuracy. The reinforcing bars were discretized with a compatible nodal distribution to maintain stable interaction and accurate load transfer through the embedded element constraint. A mesh sensitivity analysis confirmed that this resolution produced mesh-independent results and reliably captured the structural behavior of the beams.
3.2. Boundary Conditions and Contact Interactions
The boundary conditions were defined to simulate the support configuration used in the experimental setup. The pinned end was modeled by restraining translational movement in both the x- and y-axes, while the roller support allowed translation along the x-axis but restricted displacement in the y-direction. The applied load was simulated as a concentrated vertical displacement imposed at the mid-span loading point, corresponding to the actuator position throughout the test. This displacement-controlled loading method allowed the model to reproduce the gradual monotonic loading process observed experimentally and to capture the complete load–deflection response up to failure. These boundary conditions are graphically represented in Figure 11.
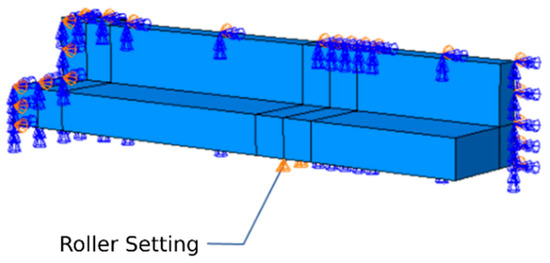
Figure 11.
Boundary conditions.
To replicate the bond between the existing concrete substrate and the PCM overlay, the ABAQUS tie constraint was applied using the software’s default parameter settings. This method enforces full displacement compatibility at the interface, representing an idealized condition of perfect adhesion. Likewise, the interaction between the reinforcement and the surrounding concrete was simulated by embedding the truss elements within the solid elements, to ensure complete displacement compatibility. This embedded constraint associates the translational degrees of freedom of the reinforcement nodes with those of the adjacent parent concrete mesh, as described by Liu et al. [86].
Previous studies of textile-reinforced mortar systems have underscored the crucial influence of the matrix–substrate interaction, debonding mechanisms, and the variability of the interfacial mechanical behavior in governing structural performance [87]. This work, however, created the numerical simulation assuming perfect bond interaction between (i) the concrete and the reinforcement and (ii) the PCM overlay and the substrate, without specifically simulating interfacial slip or debonding effects. This assumption was considered to be acceptable based on experimental observations, which indicated that the PCM overlay remained well bonded to the RC substrate throughout most of the loading process. Only minor localized separation was detected near cracks in the strengthened specimens, without any large-scale delamination that could affect global flexural behavior. Hence, the adoption of a perfect bond assumption provided a reasonable simplification for replicating the overall structural response observed experimentally. A more detailed discussion of the experimentally observed interface condition and modes of failure is presented later in Section 4.1.
3.3. Material Constitutive Model
The mechanical response of the steel reinforcement was characterized utilizing an idealized bilinear elastoplastic stress–strain model. A material density of 7850 kg/m3, a 200 GPa elastic modulus, and a Poisson’s ratio of 0.30 were assigned. The yield and ultimate strengths summarized in Table 2 and the corresponding ultimate strain values were all derived from the experimental test results. The average values for the ultimate strain were 0.1299 for #3 (Ø10), 0.0858 for #4 (D13), and 0.0933 for #5 (D16), and were adopted in the computational framework to characterize the ductile response of the reinforcing bars.
The uniaxial compressive response of concrete was simulated using the nonlinear stress–strain formulation developed by Hsu and Hsu [88], as given in Equations (1)–(3). The model, grounded in experimentally validated parameters, effectively captures the complete response curve, encompassing both the pre-peak (ascending) and post-peak (descending) phases. A primary feature of this formulation is its ability to incorporate the confining effects of transverse reinforcement, such as shear stirrups, making it well-suited to the capture of localized crushing and strength gains in shear-critical RC regions of RC members.
In the above expressions, represents the compressive stress associated with a certain concrete strain , while is a dimensionless parameter that defines the curvature of the stress–strain relationship. The term indicates the concrete’s peak compressive strength, occurring at strain . For clarity, all stress values are reported in kips per square inch (ksi), with 1 MPa approximately equal to 0.145 ksi.
Within this modeling framework, Poisson’s ratio was determined as 0.2. Moreover, the elastic modulus was established as per ACI 318-19 [74], incorporating an empirical modification based on the Taiwanese concrete code [89] to account for the material’s geographical characteristics. The equation for calculating the modulus of elasticity is provided in Equation (4).
The concrete damage plasticity (CDP) model, an advanced constitutive framework that is widely utilized within the ABAQUS platform for simulating RC structures [85], was employed to represent the nonlinear and inelastic behavior of concrete. The CDP model, originally developed by Lubliner et al. [90] and subsequently enhanced by several researchers [91,92,93], integrates both plasticity and damage mechanics into a unified formulation. It captures failure in tension and compression through isotropic hardening plasticity combined with scalar damage variables, which represent stiffness degradation due to microcracking. This dual mechanism enables the model to provide a realistic reflection of the progressive deterioration and complex load–deformation response of concrete under multi-axial stress states. The stress–strain relationships adopted for the simulation were derived from the experimentally measured average compressive strength of 28.69 MPa, as illustrated in Figure 12a,c.
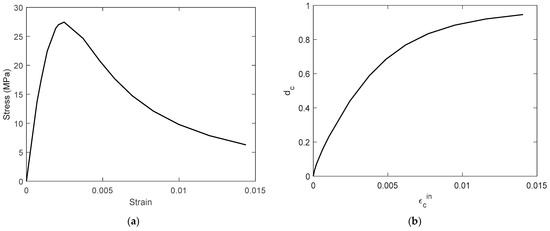
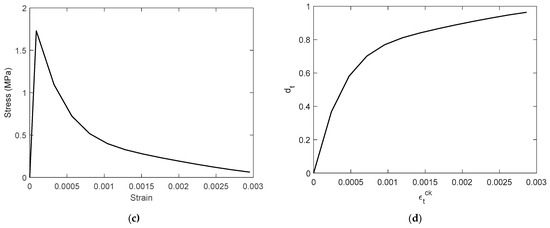
Figure 12.
The constitutive model for concrete: (a) stress–strain relationship in uniaxial compression; (b) compressive damage parameter; (c) stress–strain relationship in uniaxial tension; (d) tensile damage parameter.
Within the constitutive formulation adopted here, concrete deterioration is governed by two dominant damage mechanisms: cracking under tensile stress and crushing under compressive stress [94]. These failure modes are represented through scalar damage parameters, for tension and or compression, the values of which vary continuously from zero (undamaged) to one (fully degraded). To quantify these degradation levels, the damage evaluation methodology outlined in Equation (5) was employed in this investigation, a model previously established and validated for RC applications by Wei et al. [95].
The coefficients and denote the ratios of plastic strain to inelastic compressive strain and the tensile cracking strain, respectively. Consistent with established guidelines, a value of 0.60 was adopted for compression and 0.90 for tension, following the recommendations by Wei et al. [94,95]. Figure 12b,d illustrate the progression of the compressive and tensile damage in the concrete domain, which show the unique degradation patterns linked to each respective failure mechanism.
As well as the constitutive stress–strain relationships, the CDP model also requires a set of plasticity parameters to be specified. These include the dilation angle (), flow potential eccentricity (e), the ratio of biaxial to uniaxial compressive strength (), the deviatoric surface shape factor (), and a viscosity parameter. For , e, and , default or literature-recommended values were employed in the analysis, whereas the viscosity parameter was calibrated with reference to an established study [96]. A comprehensive summary of the adopted values is provided in Table 3.

Table 3.
CDP parameters of plasticity.
4. Results and Discussion
4.1. Load–Deflection Behavior and Failure Mode
Figure 13 illustrates the mid-span load–deflection behavior of the reference specimen (UB) together with the results for the specimens strengthened with high-strength PCM and reinforced using steel rebars (SB-M-13 and SB-M-16). All beams initially demonstrated linear elastic behavior until the emergence of the first visible cracks and the onset of steel yielding.
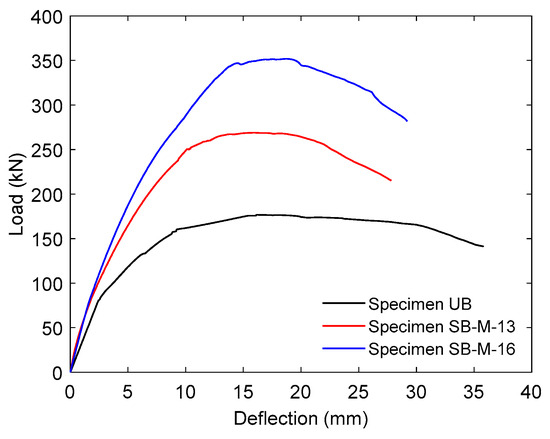
Figure 13.
Load–deflection behavior of evaluated RC T-beams subjected to monotonic loading.
Beyond the peak flexural capacity, the response transitioned into a deflection-hardening phase, followed by a gradual decline in load resistance, culminating in failure, defined here as 80% of the maximum load attained. The incorporation of a steel-reinforced PCM overlay in the tension region markedly enhanced the beams’ load-bearing performance. Table 4 presents a detailed comparison of the main load–deflection parameters, including the cracking load (Pcr) and its associated deflection (Δcr), yield load (Py) and deflection (Δy), peak load (Ppeak) with its deflection (Δpeak), and the failure deflection (Δf) associated with the post-peak degradation phase.

Table 4.
Summary of characteristic load and deflection values obtained from testing.
As previously stated by Nugroho et al. [68], the unstrengthened beam (UB) underwent initial flexural cracking at mid-span at a load of 34.42 kN. As loading continued, the primary crack expanded and extended downward through the flange, which was accompanied by the emergence of additional flexural cracks, although no shear cracks were observed during the test. The tensile reinforcement yielded at 168.52 kN, marked by a noticeable plateau in the load–deflection response. The ultimate load-bearing capacity peaked at 176.66 kN, beyond which the beam failed due to propagation of the dominant mid-span crack into the compression zone. Figure 14a shows that failure was governed by a ductile flexural mechanism, culminating in concrete crushing within the compression region in the final stage.
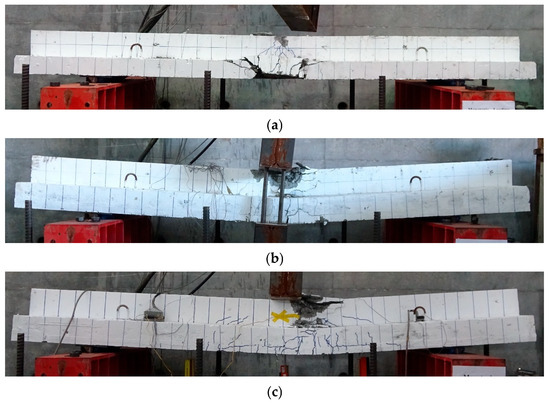
Figure 14.
Documented failure modes of all tested RC T-beams; (a) specimen UB [68]; (b) specimen SB-M-13; (c) specimen SB-M-16.
The incorporation of high-strength PCM layers reinforced with steel bars markedly improved the structural performance of the retrofitted beams, especially for yield strength, initial crack resistance, and overall flexural capacity. This enhancement is primarily attributed to the improved tensile performance introduced by the strengthening system. The 40 mm overlay not only increased the effective section modulus but also facilitated a more uniform tensile stress distribution across the critical negative-moment region. Moreover, the inherent compressive strength of the high-strength PCM served to delay the onset of cracking, thereby improving both pre- and post-cracking behavior. Experimental evidence further substantiates these observations: initial flexural cracking occurred at mid-span loads of 86.04 kN and 91.51 kN for specimens SB-M-13 and SB-M-16, respectively, indicating an initial crack resistance approximately 2.50 to 2.66 times superior to that of the unstrengthened control beam. With progressive loading, multiple flexural cracks developed within the PCM overlay and propagated as fine cracks into the underlying RC section. Yielding of the embedded reinforcement within the PCM layer was observed at 253.99 kN for SB-M-13 and 328.23 kN for SB-M16, demonstrating the significant impact of the rebar diameter and overlay configuration on the enhancement of flexural capacity.
At elevated load stages, a pronounced cracking sound marked the progressive expansion of the dominant flexural crack within the high-strength PCM layer. This acoustic response signaled the onset of debonding between steel fibers and the cementitious matrix, an energy-dissipating mechanism that effectively delayed the formation of localized macrocracks. As a result, the retrofitted beams exhibited improved damage tolerance and continued to sustain additional loading beyond initial cracking. The maximum load capacities recorded were 268.91 kN for SB-M-13 and 351.81 kN for SB-M-16, representing substantial increases of 52.22% and 99.14%, respectively, relative to the control beam (UB). These findings emphasize the dual role of the 40 mm high-strength PCM overlay in mitigating crack propagation and significantly improving the flexural performance of RC T-beams, particularly when combined with larger-diameter steel reinforcement.
It is worth noting that in this experimental program, the PCM overlay was intentionally extended slightly beyond the support region. This design ensured sufficient anchorage length for the embedded reinforcement and minimized premature debonding along the interface, thereby promoting full development of composite action between the PCM overlay and the RC substrate. While this configuration was advantageous for clearly observing the intrinsic strengthening mechanism under controlled conditions, it may have produced a more uniform stress transfer than would typically occur in practical applications, where the negative-moment region is usually confined within the support area. Consequently, the experimental results may indicate a slightly higher strengthening efficiency compared with field implementations. Nevertheless, the findings remain valid for demonstrating the fundamental strengthening behavior and the potential of steel-reinforced PCM overlays as an effective retrofit solution when proper anchorage and interface detailing are provided.
As illustrated in Figure 13, the strengthened beams exhibited a less defined yielding plateau compared to the UB. This behavioral shift should not be interpreted as a diminished strengthening effect of the high-strength PCM layer; instead, it highlights the increased initial stiffness and earlier engagement of the retrofitted section. The integration of high-strength PCM with embedded steel bars improved the elastic stiffness and expedited the transition into the inelastic phase, resulting in a steeper post-yield slope. This improved stiffness response reflects the composite action between the RC substrate and the PCM overlay, which redistributed the tensile stresses more effectively during flexural loading.
Both retrofitted beams demonstrated analogous failure characteristics. Upon reaching their respective maximum load capacities, slight cracking developed within the high-strength PCM layer, leading to localized separation in a few regions. This was followed by concrete crushing in the compression zone at mid-span, as depicted in Figure 14b,c. The observed behavioral similarity can be ascribed to the consistent strengthening scheme that was implemented, namely a 40 mm PCM overlay applied continuously across the negative-moment region. Despite the variation in diameters of the embedded steel reinforcement between SB-M-13 and SB-M-16, all other factors, including the shear connector spacing, interface preparation, and boundary conditions, were identical.
One important finding was that no large-scale delamination or interface failure was observed during testing. Debonding between the PCM and the NSC substrate was minimal, and was confined to small areas adjacent to localized cracking, without affecting the overall flexural response. The PCM overlay remained well bonded to the substrate until the final crushing of the compression zone, confirming that the composite section behaved integrally throughout most of the loading process. These experimental observations substantiate the modeling assumption of perfect bonding between the concrete substrate and the PCM overlay, as adopted in the FE model, and affirm that the observed failure mechanism was governed primarily by flexural crushing rather than interface separation.
4.2. Deflection
Figure 15 presents the deflection profiles along the span of each beam at various loading stages prior to the unstrengthened specimen (UB) reaching its peak capacity. The integration of high-strength PCM overlays reinforced with steel bars notably reduced the mid-span deflections across all evaluated load levels. At a load of 50 kN, under which all beams exhibited elastic behavior, the reductions in deflection for SB-M-13 and SB-M-16 were recorded as 37.35% and 42.60%, respectively, relative to the UB specimen.
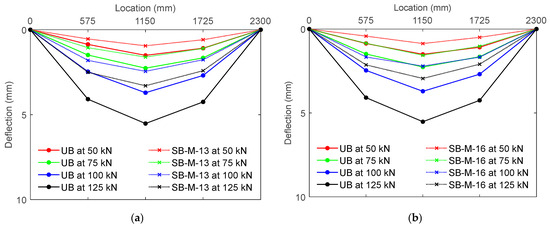
Figure 15.
Deflection profiles for the tested beams under varying load levels: (a) UB versus SB-M-13; (b) UB versus SB-M-16.
Upon increasing the applied load to 125 kN, pronounced deviation from linearity was observed in UB, indicating the onset of inelastic behavior, while both strengthened beams continued to demonstrate linear–elastic responses. An interesting observation was that during this intermediate range, the deflection curves of SB-M-13 and SB-M-16 were nearly identical, suggesting that differences in the reinforcement ratio within the high-strength PCM layer had a minimal effect on stiffness, though their influence on the ultimate flexural capacity remained evident.
4.3. Stiffness
The reduction in deflection observed in the strengthened beams can be directly attributed to enhancements in both the initial stiffness and effective stiffness, reflecting improvements in the beams’ elastic and overall flexural behavior. In this study, initial stiffness was defined as the slope of the load–deflection curve from the origin to the load corresponding to the initial apparent flexural crack, which characterized the beam’s resistance to deformation prior to cracking. Figure 16 illustrates that the strengthened beams demonstrated substantial gains in this parameter. The initial stiffness increased from 33.20 kN/mm for UB to 44.67 kN/mm and 46.72 kN/mm for SB-M-13 and SB-M-16, representing improvements of 34.55% and 40.74%, respectively. These increases highlight the role of the high-strength PCM layer in limiting early-stage deflections and delaying the onset of damage, especially in the negative moment area.
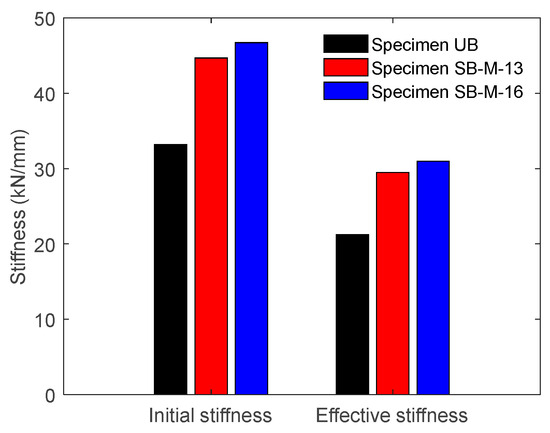
Figure 16.
Comparison of initial and effective stiffness for all tested beam specimens.
To evaluate the overall flexural rigidity beyond the elastic range, the effective stiffness was computed using the equivalent elasto-plastic approach, characterized as the slope of a bilinear idealization connecting the origin to the yield point on the load–deflection curve. The strengthened beams again showed notable enhancements, with SB-M-13 and SB-M-16 achieving values of 29.47 and 30.96 kN/mm, translating to increases of 38.89% and 45.92% compared to the UB specimen (21.22 kN/mm).
Although SB-M-16 included larger-diameter steel bars and a higher tensile reinforcement ratio, the marginal difference in stiffness compared to SB-M-13 suggests that the dominant contributor to the improvement in stiffness was the composite action provided by the high-strength PCM overlay, rather than the reinforcement ratio alone [97].
4.4. Ductility
Ductility is a critical parameter that characterizes the ability of a beam to sustain inelastic deformations beyond the yield point, thus reflecting its deformation capacity prior to failure. This study assessed ductility using the ductility index (μ), which defines as the ratio of the deflection at failure and the deflection at the onset of tensile reinforcement yielding. These values were determined using strain gauge data from the mid-span tensile reinforcement (TS-3), as shown in Figure 8.
As summarized in Table 3, a ductility index of 2.82 was recorded for the control specimen (UB). In comparison, the strengthened beams SB-M-13 and SB-M-16 had slightly lower ductility values of 2.59 and 2.34, respectively. When expressed as a ratio relative to UB, the ductility of SB-M-13 and SB-M-16 was reduced to 0.92 and 0.83. This reduction is due to the implementation of the high-strength PCM overlay with embedded steel rebars; although this enhances tensile strength and flexural stiffness, it also leads to a lower neutral axis and a more brittle post-yield behavior. Notably, the increase in the tensile reinforcement ratio from SB-M-13 to SB-M-16 further contributed to the decline in ductility, as reflected by the loss of yield plateau (Figure 13) and earlier onset of concrete crushing, consistent with the failure patterns depicted in Figure 14. These findings correspond with prior investigations [44,57], which have reported that enhanced tensile strength and increased reinforcement ratio tend to shift failure modes toward a more brittle flexural response, thus reducing overall ductility.
4.5. Energy Absorption
Energy absorption or toughness serves as an essential indicator of a structural element’s capacity to absorb energy throughout both the elastic and inelastic phases before failure occurs. Defined as the region beneath the load–deflection curve, this parameter provides an integrated measure of a beam’s capacity to withstand progressive cracking and collapse under applied loads. The present investigation evaluated toughness at four distinct stages of the flexural response: first crack (Ecr), yield (Ey), peak (Epeak), and failure (Ef), in order to offer a more detailed assessment of the beams’ energy dissipation behavior. As shown in Figure 17, the proposed strengthening strategy consistently raised the energy dissipation across all loading phases.
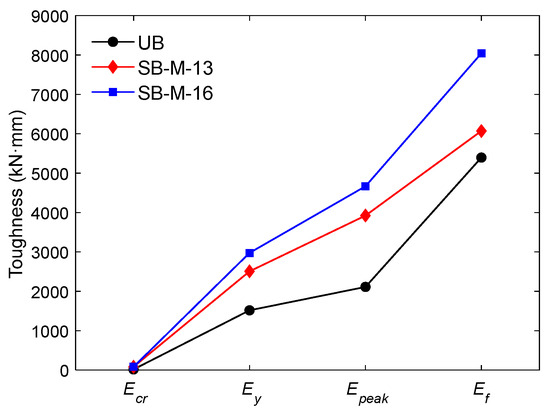
Figure 17.
Evolution of the toughness of examined beams at different loading stages.
The inclusion of high-strength PCM reinforced with steel bars substantially enhanced the toughness performance of the strengthened beams. At the first crack, both SB-M-13 and SB-M-16 absorbed 4.8 times more energy than UB, underscoring the effectiveness of the high-strength PCM overlay. Furthermore, at the yield stage, SB-M-13 exhibited an energy absorption capacity 1.65 times greater than that of UB, while SB-M-16 achieved a 1.96-fold increase, reflecting the influence of higher reinforcement content. This trend continued at peak load, where both retrofitted beams displayed improved energy absorption. Despite a modest reduction in ductility, the total toughness (Ef) remained substantially higher, with SB-M-13 and SB-M-16 attaining increases of 1.12 and 1.45 times, respectively, in comparison to the control specimen. The enhancements, which were particularly evident for SB-M-16, highlight the positive contribution of a higher steel ratio, which, combined with delayed crack propagation, increased stiffness, and improved load resistance, led to the superior toughness performance imparted by the high-strength PCM overlay.
4.6. Strain Behavior
The tensile strain in the steel reinforcement was expressed in normalized form, calculated as the ratio of the observed strain during loading to the yield strain of the bar. The yield strain (εy) for D13 reinforcement was 2151 µε, whereas it was 2322 µε for D16 bar. A normalized strain of unity signifies that yielding has occurred, as indicated by the vertical reference line in the plots. Although the beams were tested in a simply supported configuration, each specimen took the form of an inverted T-beam in which the flange, normally in compression under positive bending, was placed in tension. This arrangement effectively replicates the tensile demand experienced in the negative-moment region of continuous RC members. Consequently, strain gauges were positioned along the lower flange, corresponding to the tensile zone of the idealized negative-moment region in real structural applications. For both strengthened specimens, i.e., SB-M-13 and SB-M-16, all strain gauges operated as intended, enabling a comprehensive strain profile to be recorded across the mid-span section. This allowed a direct comparison with UB to assess the influence of the strengthening strategy. The strain behavior of the reinforcement embedded in the high-strength PCM overlay offers valuable insight into the composite section’s contribution to the beam’s overall tensile performance.
Figure 18 demonstrates the relationship between normalized tensile steel strain and applied load. The results show a steady increase in longitudinal reinforcement strain toward the mid-span, as anticipated in a three-point bending configuration. Near the support at TS-1, all beams remain well below yield (peaks: UB 0.19εy, SB-M-13 0.15εy, SB-M-16 0.13εy), despite the much higher loads in the strengthened beams, indicating only minor tensile demand in this region. At TS-2, the contrast becomes clearer. For the control beam, the value rose to roughly 0.73 of yield, while the values for the strengthened beams stayed low, at about 0.21εy for SB-M-13 and 0.28εy for SB-M-16. In comparison to the control specimen, the strengthened beam demonstrated an enhanced effective flexural depth owing to the addition of the high-strength PCM overlay, which substantially improved the section’s stiffness. This improvement in rigidity diminished the tensile demand on the original longitudinal bar, leading to lower tensile strains at multiple locations, as shown in Figure 18a–c. At TS-3, UB yielded at about 169 kN and climbed to roughly 2.50 times the yield strain, confirming the under-reinforcement of the section and reflecting the distinct yield plateau in the load–deflection response. In contrast, SB-M-13 reached yield but with a limited maximum strain of 1.16εy, and SB-M-16 remained below yield, with a peak at nearly 0.39εy.
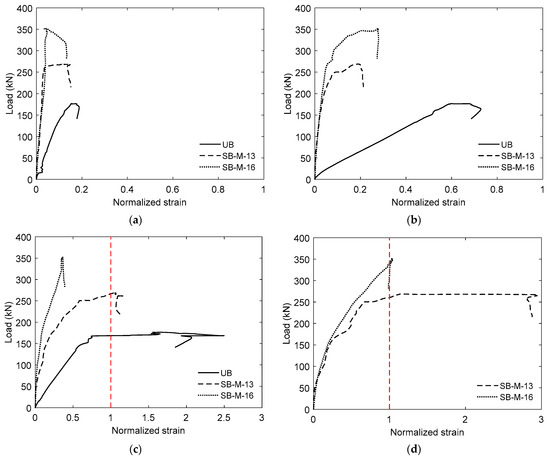
Figure 18.
Normalized tensile strain responses of longitudinal steel reinforcements: (a) TS-1; (b) TS-2; (c) TS-3; (d) TS-M.
The influence of this reinforcement is further illustrated in Figure 18d, which compares the tensile strains in the longitudinal reinforcements placed within the high-strength PCM (TS-M) for both SB-M-13 and SB-M-16. Positioned close to the extreme tension fiber, these bars experienced the highest tensile demand, and the evolution of their pre-yield strain showed similar trends in both specimens, an indication of consistent and effective force transfer between the original RC section and the strengthening layer. For SB-M-13, the embedded longitudinal bars yielded at about 261 kN and then grew to roughly 2.94 times the yield strain. The findings align with those of Yin et al. [97], who showed that yielding of reinforcement embedded in a high-strength PCM overlay indicated effective composite action between the steel and surrounding matrix, enabling reliable force transfer and a ductile post-yield response. For SB-M-16, the embedded reinforcement yielded shortly before the beam reached 97% of Ppeak, but the post-yield strain growth was modest, with a maximum of 1.04εy. This indicates that although the larger-diameter bar enhanced the stiffness and strength, its contribution to the post-yield deformation capacity was comparatively limited.
4.7. Comparison of Experimental and Numerical Results
Figure 19 compares the experimental and FE-derived load–deflection responses for all tested specimens, and shows the model’s ability to reproduce the principal stages of structural behavior.
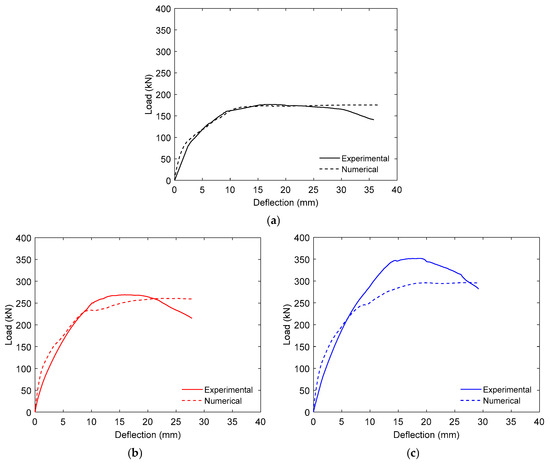
Figure 19.
Comparison of experimental and numerical outcomes: (a) specimen UB; (b) specimen SB-M-13; (c) specimen SB-M-16.
For the UB and SB-M-13 specimens, the FE curves closely matched the experimental results, meaning that they effectively captured the initial elastic stiffness, cracking initiation, post-cracking stiffness, and ultimate load. Minor discrepancies appeared in the post-peak region, where the numerical predictions exhibited a slightly steeper decline than the experimental curves. For SB-M-16, which differed from SB-M-13 only in the use of larger-diameter longitudinal steel bars, the FE model still replicated the overall response but tended to slightly underpredict both the post-cracking stiffness and peak load. This variance suggests that the calibration of the model is more sensitive to changes in the reinforcement diameter than to other parameters.
The analyses were terminated once the prescribed mid-span displacement reached a target value that was similar to the experimentally measured ultimate deflection, thereby allowing the post-peak response to be captured numerically. Convergence was monitored at each increment, and the analysis was automatically terminated upon non-convergence of the solution. In general, the predicted load–deflection trajectories for all specimens closely matched with the experimental profiles, thus confirming the model’s robustness in simulating the flexural performance of the tested specimens.
The quantitative comparison in Table 5 further supports this conclusion. The values for the ratio of numerical-to-experimental ultimate loads varied between 0.84 and 0.99, with an average value of 0.93, a standard deviation of 0.08, and a coefficient of variation of 8.73%. These results indicate that the FE model consistently produced peak load closely aligned with test measurements, although with a slight tendency to underestimate strength, particularly for SB-M-16. The model assumed a perfect bond between the PCM overlay and the concrete substrate, as well as between the steel bars and the parent concrete. While this simplification facilitates numerical stability and efficient computation, it may neglect the effects of local slip or minor interface degradation. Consequently, the model may slightly underestimate localized deformation while still capturing the overall flexural behavior with satisfactory accuracy. Despite this limitation, the robust correlation between the experimental and numerical responses confirms that a perfect bond assumption remains reasonable when simulating the global flexural performance of RC T-beams strengthened with steel-reinforced high-strength PCM overlays.

Table 5.
Comparison of experimental and numerical results for ultimate load.
From the compressive damage contours in Figure 20, distinct differences can be seen between UB and the specimens retrofitted with steel-reinforced high-strength PCM layers. In the UB specimen, severe damage is concentrated near the loading point and the extreme compression fiber at mid-span, as indicated by the large red zone extending into the upper web. This pattern reflects the higher compressive strains recorded experimentally, confirming the section’s limited ability to restrain localized crushing under high loads.
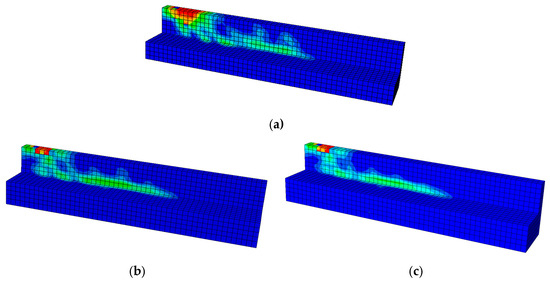
Figure 20.
Comparison of compressive damage contours: (a) UB; (b) SB-M-13; (c) SB-M-16. Color variations denote the extent of compressive damage, with red signifying substantial damage and blue meaning low or no damage. The black lines illustrate the FE mesh employed for structural discretization.
In contrast, the strengthened specimens SB-M-13 and SB-M-16 display markedly reduced damage intensity in the compression zone. The high-strength PCM overlay, combined with longitudinal steel reinforcement, effectively redistributed compressive stresses along the span, limiting the depth and severity of crushing. SB-M-13 exhibits smaller red zones and a more gradual color transition, indicating improved stress dispersion. SB-M-16 shows a similar trend but with a slightly greater reduction in localized damage, suggesting that the higher steel bar diameter further enhanced the confinement and stiffness of the section. Overall, these contours confirm the beneficial interaction between the PCM overlay and the embedded reinforcement in terms of mitigating compressive damage and promoting a more uniform stress distribution across the compression zone.
Furthermore, the tensile damage contours in Figure 21 reveal clear differences in crack development between the unstrengthened and strengthened beams. In the UB specimen, extensive red zones dominate the tensile region along the flange and web, indicating widespread severe cracking that extends toward the loading point and mid-span. This distribution reflects the limited tensile capacity of the section, where cracks propagate rapidly once the concrete’s tensile strength is exceeded. In addition, tensile damage is observed along the top edge near the supports for all beams, corresponding to localized tensile stresses generated by bearing and shear transfer between the beam and the supports. Top-edge cracking of this type is typical in three-point bending tests, and arises from stress concentrations and splitting within the compression zone adjacent to the supports.
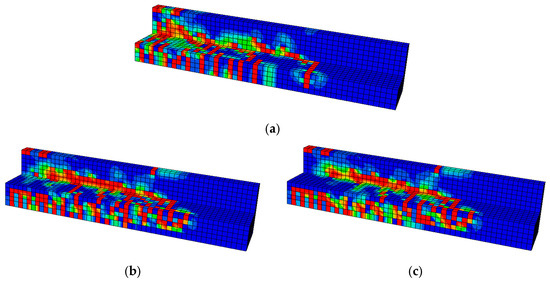
Figure 21.
Comparison of tensile damage contours: (a) UB; (b) SB-M-13; (c) SB-M-16. Color gradients indicate the degree of tensile damage, with red regions signifying severe cracking and blue regions denoting undamaged sections. The black lines represent the FE mesh utilized for model discretization.
For the strengthened specimens SB-M-13 and SB-M-16, the extent and intensity of tensile damage along the span are markedly reduced compared to the UB specimen. In these beams, additional tensile damage appears at the top mid-span, directly beneath the central loading point, reflecting localized splitting and transverse tensile stresses in the compression zone induced by the concentrated load. This phenomenon was not observed in the control beam, probably because severe flexural cracking in the tensile zone dominated the response and masked localized effects at the top. In SB-M-13, the high-strength PCM layer combined with the 13 mm diameter longitudinal steel bars limited crack propagation, with red zones becoming more localized near the loading and support points. SB-M-16 exhibits an even more contained pattern, as the larger-diameter reinforcement enhanced the tensile resistance and promoted a more uniform stress distribution. Overall, the reduced tensile damage in the strengthened beams highlights the effective composite action between the PCM overlay and the embedded steel reinforcement in regard to controlling crack initiation and propagation under flexural loading.
5. Conclusions
This study has examined the flexural performance of RC T-beams in the negative-moment region after retrofitting with an additional 40 mm high-strength PCM overlay, with longitudinal steel reinforcements of two diameters (13 and 16 mm). Monotonic three-point bending tests, supported by nonlinear FE simulations, were conducted to evaluate the load–deflection behavior, ductility, stiffness, energy absorption, and strain development. The primary conclusions are listed below:
- The incorporation of a 40 mm high-strength PCM overlay, reinforced with longitudinal steel bars, markedly improved load capacity. Crack initiation loads increased by a factor of 2.50 for SB-M-13 and 2.66 for SB-M-16 compared to UB. Yield loads rose by 50.72% and 94.77%, while ultimate loads increased by 52.22% and 99.14%, respectively.
- Initial stiffness improved by 34.55% (SB-M-13) and 40.74% (SB-M-16), while the effective stiffness, based on the equivalent elasto-plastic approach, increased by 38.89% and 45.92%, respectively. These enhancements are attributed to strong composite action between the RC substrate and the PCM overlay.
- Ductility was reduced to 0.92 (SB-M-13) and 0.83 (SB-M-16) of the UB value, due to higher tensile reinforcement ratios. Despite this reduction, the yield-stage toughness increased by factors of 1.65 and 1.96, and overall toughness by 1.12 and 1.49, respectively.
- The reinforcement embedded in the PCM overlay exhibited high tensile strain capacity, confirming the effectiveness of the composite action. For specimen SB-M-13, the tensile strain in the PCM layer reached 2.94εy. For specimen SB-M-16, yielding occurred just before 97% of Ppeak, with high stiffness but limited post-yield strain growth.
- The FE simulation accurately mirrored the experimental load–deflection behavior and ultimate capacities, with numerical-to-experimental ultimate load ratios between 0.84 and 0.99 and a coefficient of variation of 3.50%. Although a perfect bond assumption was implemented between the PCM overlay and the concrete substrate, which may lead to a slight underestimation of local slip effects, the overall agreement with test results supports the reliability of the model in terms of representing the global flexural performance of the strengthened beams.
- This study is constrained by the quantity of specimens tested and by the assumption of an idealized bond in the numerical model. Nevertheless, the combination of experimental observations with calibrated FE simulations enhances the reliability and interpretive strength of the findings.
- Future study should focus on broadening the specimen matrix and systematically examining the influence of the PCM overlay thickness, reinforcement configuration, and interface conditions, in order to establish a broader understanding of their effects on structural performance. Additional studies under cyclic loading are also recommended, along with advanced numerical models that incorporate the bond–slip behavior between the concrete substrate and the PCM overlay to more accurately capture the interface performance.
Author Contributions
Conceptualization, Y.H. and F.-P.H.; methodology, Y.H., F.-P.H. and C.-C.L.; software, H.-T.H., L.N., B.A.H. and P.-W.W.; validation, F.-P.H., C.-C.L., P.-W.W. and Y.-Y.C.; formal analysis, Y.H., F.-P.H., H.-T.H. and Y.-Y.C.; investigation, Y.H., L.N. and Y.-Y.C.; resources, F.-P.H., H.-T.H., C.-C.L. and P.-W.W.; data curation, L.N., Y.-Y.C. and B.A.H.; writing—original draft preparation, Y.H., L.N. and Y.-Y.C.; writing—review and editing, Y.H., L.N., C.-C.L., P.-W.W. and B.A.H.; visualization, Y.H. and L.N.; supervision, F.-P.H. and H.-T.H.; project administration, F.-P.H. and H.-T.H.; funding acquisition, F.-P.H. and H.-T.H. All authors have read and agreed to the published version of the manuscript.
Funding
This study was supported by the National Center for Research on Earthquake Engineering (NCREE), Taiwan, awarded to the second author (F.-P.H.), and by the National Science and Technology Council (NSTC), Taiwan, under Grant No. 112-2625-M-006-016, granted to the third author (H.-T.H.).
Data Availability Statement
The models and data generated or analyzed in this research are available from the corresponding authors upon a reasonable request.
Acknowledgments
The authors express their sincere appreciation to Ming-Hang Wu of National Cheng Kung University (NCKU), Taiwan, for his invaluable assistance and technical support throughout this research.
Conflicts of Interest
The authors declare no conflicts of interest.
Abbreviations
The manuscript employs following abbreviations:
| RC | Reinforced concrete |
| FRCMs | Fabric-reinforced cementitious matrices |
| UHPC | Ultra-high-performance concrete |
| FRP | Fiber-reinforced polymer |
| PCM | Polymer cement mortar |
| FE | Finite element |
| NSC | Normal-strength concrete |
| UTM | Universal testing machine |
| LVDTs | Linear variable differential transformers |
| CDP | Concrete damage plasticity |
References
- Ferdosian, I.; Camoes, A. Mechanical performance and post-cracking behavior of self-compacting steel-fiber reinforced eco-efficient ultra-high performance concrete. Cem. Concr. Compos. 2021, 121, 104050. [Google Scholar] [CrossRef]
- Li, W.; Huang, X.; Liu, X.; Wen, T.; Jing, C.; Li, L. Flexural performance of reinforced concrete beams strengthened with a novel high-strength and high-toughness epoxy mortar thin layer. Appl. Sci. 2024, 14, 3999. [Google Scholar] [CrossRef]
- Hobbs, D.W. Concrete deterioration: Causes, diagnosis, and minimising risk. Int. Mater. Rev. 2001, 46, 117–144. [Google Scholar] [CrossRef]
- Yang, B.; Hu, X.; Li, A.; Zhao, T.; Sun, Y.Q.; Fu, H. Degradation mechanism of cast-in-situ concrete under long-term sulfate saline soil attack. Constr. Build. Mater. 2025, 478, 141401. [Google Scholar] [CrossRef]
- Wang, J.-H.; Cai, G.; Wu, Q. Basic mechanical behaviours and deterioration mechanism of RC beams under chloride-sulphate environment. Constr. Build. Mater. 2018, 160, 450–461. [Google Scholar] [CrossRef]
- Li, R.; Aboutaha, R.S. Analytical Investigation of CFRP- and Steel Plate-Strengthened RC Beams with Partially Unbonded Reinforcement. Buildings 2025, 15, 3665. [Google Scholar] [CrossRef]
- Elsanadedy, H.M.; Almusallam, T.H.; Abbas, H.; Al-Salloum, Y.A. Innovative Retrofitting for Disaster Resilience: Optimizing Steel Plate Grade and Scheme in RC Non-Seismic Frames to Prevent Progressive Collapse. Buildings 2025, 15, 3325. [Google Scholar] [CrossRef]
- Zhu, C.; Du, C.; Qi, Y.; Jiang, Z.; Zhang, Z.; Yang, J.; Li, Y.; Cheng, J. Flexural Performance of RC Beams Strengthened with High-Strength Steel Wire Mesh and UHPC. Buildings 2025, 15, 589. [Google Scholar] [CrossRef]
- Saeed, F.H.; Hejazi, F. A Comprehensive Review of Retrofitted Reinforced Concrete Members Utilizing Ultra-High-Performance Fiber-Reinforced Concrete. Materials 2025, 18, 945. [Google Scholar] [CrossRef]
- Alkhateeb, M.Y.; Hejazi, F. Strengthening Reinforced Concrete Beams through Integration of CFRP Bars, Mechanical Anchorage System, and Concrete Jacketing. Materials 2024, 17, 2794. [Google Scholar] [CrossRef]
- Zaiter, A.; Lau, T.L. Review on strengthening reinforced concrete columns using reinforced concrete jackets. IOP Conf. Ser. Earth Environ. Sci. 2020, 614, 012063. [Google Scholar] [CrossRef]
- Sengottian, K.; Jagadeesan, K. Retrofitting of column with RC jacketing an experimental behavior. J. Theor. Appl. Inf. Technol. 2013, 56, 349–354. [Google Scholar]
- Thermou, G.E.; Pantazopoulou, S.J.; Elnashai, A.S. Flexural behavior of brittle RC members rehabilitated with concrete jacketing. J. Struct. Eng. 2007, 133, 1373–1384. [Google Scholar] [CrossRef]
- Villar-Salinas, S.; Guzmán, A.; Carrillo, J. Performance evaluation of structures with reinforced concrete columns retrofitted with steel jacketing. J. Build. Eng. 2021, 33, 101510. [Google Scholar] [CrossRef]
- Hsiao, F.-P.; Weng, P.-W.; Li, Y.-A.; Kawamoto, T.; Lin, Y.-C.; Haryanto, Y. Study on retrofitting of existing reinforced concrete buildings with the exoskeleton design-U-frame method. Compos. Struct. 2023, 324, 117562. [Google Scholar] [CrossRef]
- Prota, A.; Tartaglia, R.; Di Lorenzo, G.; Landolfo, R. Seismic strengthening of isolated RC framed structures through orthogonal steel exoskeleton: Bidirectional non-linear analyses. Eng. Struct. 2024, 302, 117496. [Google Scholar] [CrossRef]
- Kim, S.Y.; Yang, K.H.; Byun, H.Y.; Ashour, A.F. Tests of reinforced concrete beams strengthened with wire rope units. Eng. Struct. 2007, 29, 2711–2722. [Google Scholar] [CrossRef]
- Schranz, B.; Michels, J.; Czaderski, C.; Motavalli, M.; Vogel, T.; Shahverdi, M. Strengthening and prestressing of bridge decks with ribbed iron-based shape memory alloy bars. Eng. Struct. 2021, 241, 112467. [Google Scholar] [CrossRef]
- Zhang, Z.; Qin, Y.; Long, G.; Ran, Y.; Guan, Y.; Wang, Y.; Sun, R.; Qian, Y. Design Theory and Experimental Study of Strengthening Reinforced Concrete Beams Using Prestressed Carbon Fiber Sheets. Buildings 2025, 15, 3126. [Google Scholar] [CrossRef]
- Haryanto, Y.; Sudibyo, G.H.; Nugroho, L.; Hu, H.-T.; Han, A.L.; Hsiao, F.-P.; Widyaningrum, A.; Susetyo, Y. Flexural performance of negative moment region bonded SWR-strengthened RC T-beams at different prestressing levels. Adv. Struct. Eng. 2024, 27, 2338–2358. [Google Scholar] [CrossRef]
- Koutas, L.N.; Tetta, Z.; Bournas, D.A.; Triantafillou, T.C. Strengthening of concrete structures with textile reinforced mortars: State-of-the-art review. J. Compos. Constr. 2019, 23, 03118001. [Google Scholar] [CrossRef]
- Hung, C.-C.; El-Tawil, S.; Chao, S.-H. A review of developments and challenges for UHPC in structural engineering: Behavior, analysis, and design. J. Struct. Eng. 2021, 147, 03121001. [Google Scholar] [CrossRef]
- Huangz, W.; Yen, C.-H.; Hung, C.-C. Flexural and shear strengthening of lightly reinforced concrete beams using CFRP bars and UHPC overlays. Case Stud. Constr. Mater. 2025, 22, e04666. [Google Scholar] [CrossRef]
- Hung, C.-C.; Lin, C.-C.; Do, T.D.D. Seismic rehabilitation of RC frames with innovative precast U-shaped UHPC jackets: Experimental evaluation and computational simulation. Eng. Struct. 2024, 318, 118746. [Google Scholar] [CrossRef]
- Hung, C.-C.; Agrawal, S.; Hsiao, H.-J. Rehabilitation of seismically-damaged RC beam–column joints with UHPC and high-strength steel mesh reinforcement. J. Build. Eng. 2024, 84, 108667. [Google Scholar] [CrossRef]
- De Lorenzis, L.; Tepfers, R. Comparative study of models on confinement of concrete cylinders with fiber-reinforced polymer composites. J. Compos. Constr. 2003, 7, 219–237. [Google Scholar] [CrossRef]
- Haryanto, Y.; Hsiao, F.-P.; Hu, H.-T.; Han, A.L.; Chua, A.W.; Salim, F.; Nugroho, L. Structural behavior of negative moment region NSM-CFRP strengthened RC T-beams with various embedment depth under monotonic and cyclic loading. Compos. Struct. 2022, 301, 116214. [Google Scholar] [CrossRef]
- Nugroho, L.; Haryanto, Y.; Hu, H.-T.; Hsiao, F.-P.; Han, A.L.; Lin, C.-C.; Weng, P.-W.; Widiastuti, E.P. NSM-CFRP rods with varied embedment depths for strengthening RC T-beams in the negative moment region: Investigation on high cyclic response. Compos. Struct. 2024, 331, 117891. [Google Scholar] [CrossRef]
- Abdel-Jaber, M.; Al-Nsour, R.; Ashteyat, A. Analyzing Flexural Integrity Enhancement in Continuous Reinforced Concrete Beams Using NSM-BFRP Ropes: Experimental and Numerical Approach. CivilEng 2025, 6, 58. [Google Scholar] [CrossRef]
- Ashteyat, A.; Obaidat, A.T.; Al-Khreisat, A.; Abdel-Jaber, M. Flexural and Shear Strengthening of High-Strength Concrete Beams Using near Surface Basalt Fiber Bars. Infrastructures 2025, 10, 1. [Google Scholar] [CrossRef]
- Nugroho, L.; Haryanto, Y.; Hu, H.-T.; Hsiao, F.-P.; Pamudji, G.; Setiadji, B.H.; Hsu, C.-N.; Weng, P.-W.; Lin, C.-C. Prestressed concrete T-beams strengthened with near-surface mounted carbon-fiber-reinforced polymer rods under monotonic loading: A finite element analysis. Eng 2025, 6, 36. [Google Scholar] [CrossRef]
- Haryanto, Y.; Wariyatno, N.G.; Hsiao, F.-P.; Hu, H.-T.; Han, A.L.; Nugroho, L.; Hartono, H. RC T-beams with flexural strengthening in the negative moment region under different configurations of NSM CFRP rods. Eng. Fail. Anal. 2025, 173, 109458. [Google Scholar] [CrossRef]
- Haryanto, Y.; Sudibyo, G.H.; Hu, H.-T.; Hsiao, F.-P.; Nugroho, L.; Saputro, D.N.; Suryanto, H.R.; Haryanto, A.E.C. Parametric Study of the Physical Responses of NSM CFRP-Strengthened RC T-Beams in the Negative Moment Region. CivilEng 2025, 6, 56. [Google Scholar] [CrossRef]
- Tworzewski, P.; Bacharz, K. Flexural Strengthening of Reinforced Concrete Beams Using Near-Surface Mounted (NSM) Carbon Fiber-Reinforced Polymer (CFRP) Strips with Additional Anchorage. Materials 2025, 18, 2579. [Google Scholar] [CrossRef]
- Siddika, A.; Al Mamun, M.A.; Alyousef, R.; Amran, Y.H.M. Strengthening of reinforced concrete beams by using fiber-reinforced polymer composites: A review. J. Build. Eng. 2019, 25, 100798. [Google Scholar] [CrossRef]
- Afifi, M.Z.; Mohamed, H.M.; Benmokrane, B. Theoretical stress–strain model for circular concrete columns confined by GFRP spirals and hoops. Eng. Struct. 2015, 102, 202–213. [Google Scholar] [CrossRef]
- Liao, J.; Zeng, J.-J.; Zhuge, Y.; Ma, G.; Zhang, L. FRP-confined concrete columns with a stress reduction-recovery behavior: A state-of-the-art review, design recommendations and model assessments. Compos. Struct. 2023, 321, 117313. [Google Scholar] [CrossRef]
- Amran, Y.H.M.; Alyousef, A.; Rashid, R.S.M.; Hisham, A.; Hung, C.-C. Properties and applications of FRP in strengthening RC structures: A review. Structures 2018, 16, 208–238. [Google Scholar] [CrossRef]
- Mizan, M.H.; Matsumoto, K. Polymer cement mortar strengthened RC beams with/without silica fume as repair material. Constr. Build. Mater. 2023, 409, 134046. [Google Scholar] [CrossRef]
- Yu, L.; Fan, Q.; Meng, D.; Meng, X.; Xu, B. Application and Mechanism Study on Optimal Design of Cement-Based Building Materials Based on Polymer Binder. Buildings 2025, 15, 3192. [Google Scholar] [CrossRef]
- Al-Zahrani, M.M.; Maslehuddin, M.; Al-Dulaijan, S.U.; Ibrahim, M. Mechanical properties and durability characteristics of polymer and cement-based repair materials. Cem. Concr. Compos. 2003, 25, 527–537. [Google Scholar] [CrossRef]
- Chung, D.D.L. Use of polymers for cement-based structural materials. J. Mater. Sci. 2004, 39, 2973–2978. [Google Scholar] [CrossRef]
- Yang, Z.X.; Shi, X.M.; Creighton, A.T.; Peterson, M.M. Effect of styrene-butadiene rubber latex on the chloride permeability and microstructure of Portland cement mortar. Constr. Build. Mater. 2009, 23, 2283–2290. [Google Scholar] [CrossRef]
- Park, D.C.; Ahn, J.C.; Oh, S.G.; Song, H.C.; Noguchi, T. Drying effect of polymer-modified cement for patch-repaired mortar on constraint stress. Constr. Build. Mater. 2009, 23, 434–447. [Google Scholar] [CrossRef]
- Wang, R.; Wang, P.M. Function of styrene-acrylic ester copolymer latex in cement mortar. Mater. Struct. 2010, 43, 443–451. [Google Scholar] [CrossRef]
- Khan, K.A.; Ahmad, I.; Alam, M. Effect of ethylene vinyl acetate (EVA) on the setting time of cement at different temperatures as well as on the mechanical strength of concrete. Arab. J. Sci. Eng. 2019, 44, 4075–4084. [Google Scholar] [CrossRef]
- Liu, J.; Wang, D. Influence of steel slag–silica fume composite mineral admixture on the properties of concrete. Powder Technol. 2017, 320, 230–238. [Google Scholar] [CrossRef]
- Choi, S.J.; Bae, S.H.; Lee, J.I.; Bang, E.J.; Ko, H.M. Strength, carbonation resistance, and chloride-ion penetrability of cement mortars containing catechol-functionalized chitosan polymer. Materials 2021, 14, 6395. [Google Scholar] [CrossRef]
- Jo, B.W.; Park, S.K.; Park, J.C. Mechanical properties of polymer concrete made with recycled PET and recycled concrete aggregates. Constr. Build. Mater. 2015, 195, 2191–2198. [Google Scholar] [CrossRef]
- Jafari, K.; Tabatabaeian, M.; Joshaghani, A.; Ozbakkaloglu, T. Optimizing the mixture design of polymer concrete: An experimental investigation. Constr. Build. Mater. 2018, 167, 185–196. [Google Scholar] [CrossRef]
- Ferdous, W.; Manalo, A.; Wong, H.S.; Abousnina, R.; AlAjarmeh, O.S.; Zhuge, Y.; Schubel, P. Optimal design for epoxy polymer concrete based on mechanical properties and durability aspects. Constr. Build. Mater. 2020, 232, 117229. [Google Scholar] [CrossRef]
- Choi, S.-J.; Bae, S.-H.; Lee, J.-I.; Bang, E.J.; Choi, H.Y.; Ko, H.M. Effect of bio-inspired polymer types on engineering characteristics of cement composites. Polymers 2022, 14, 1808. [Google Scholar] [CrossRef] [PubMed]
- Warzer, S.; Kawan, G.; Ahmed, M. Regression analysis and Vipulanandan model to quantify the effect of polymers on the plastic and hardened properties with the tensile bonding strength of the cement mortar. Results Mater. 2019, 1, 100011. [Google Scholar] [CrossRef]
- Ahmed, S.M.; Wael, M.; Warzer, S.Q.; Kawan, G.; Rawaz, K. Microstructure tests, flow, and mechanical behavior of polymerized cement mortar. Ain Shams Eng. J. 2023, 14, 101922. [Google Scholar]
- Ahmed, S.; Serwan, R.; Wael, M.; Kawan, G.; Warzer, S. Various simulation techniques to predict the compressive strength of cement-based mortar modified with micro-sand at different water-to-cement ratios and curing ages. Arab. J. Geosci. 2021, 14, 411. [Google Scholar]
- Rashid, K.; Wang, Y.; Ueda, T. Influence of continuous and cyclic temperature durations on the performance of polymer cement mortar and its composite with concrete. Compos. Struct. 2019, 215, 214–225. [Google Scholar] [CrossRef]
- Lanzoni, L.; Soragni, M.; Tarantino, A.M.; Viviani, M. Concrete beams stiffened by polymer-based mortar layers: Experimental investigation and modeling. Constr. Build. Mater. 2016, 105, 321–335. [Google Scholar] [CrossRef]
- Zhou, J.; Wang, X.; Liu, X.; Tao, J.; Wu, Z. Investigation on the shear behavior of RC beams strengthened with BFRP grids and PCM. Eng. Struct. 2025, 322, 119173. [Google Scholar] [CrossRef]
- Yuan, P.; Zhang, B.; Yang, Y.; Jiang, T.; Li, J.; Qiu, J.; He, H. Application of polymer cement repair mortar in underground engineering: A review. Case Stud. Constr. Mater. 2023, 19, e02555. [Google Scholar] [CrossRef]
- Hassan, K.E.; Robery, P.C.; Al-Alawi, L. Effect of hot-dry curing environment on the intrinsic properties of repair materials. Cem. Concr. Compos. 2000, 22, 453–458. [Google Scholar] [CrossRef]
- Hassan, K.E.; Brooks, J.J.; Al-Alawi, L. Compatibility of repair mortars with concrete in hot-dry environment. Cem. Concr. Compos. 2001, 23, 93–101. [Google Scholar] [CrossRef]
- Satoh, K.; Hizukuri, M.; Hida, K.; Hikichi, K. Strengthening effect of strengthened RC slab of highway bridge using polymer cement mortar shot bottom side thickening method. Proc. Jpn. Concr. Inst. 2000, 22, 517–522. [Google Scholar]
- Mirza, J.; Mirza, M.S.; Lapointe, R. Laboratory and field performance of polymer-modified cement-based repair mortars in cold climates. Constr. Build. Mater. 2002, 16, 365–374. [Google Scholar] [CrossRef]
- Espeche, A.D.; Leon, J. Estimation of bond strength envelopes for old-to-new concrete interfaces based on a cylinder splitting test. Constr. Build. Mater. 2011, 25, 1222–1235. [Google Scholar] [CrossRef]
- Zhang, D.; Ueda, T.; Furuuchi, H. Concrete cover separation failure of overlay-strengthened reinforced concrete beams. Constr. Build. Mater. 2012, 26, 735–745. [Google Scholar] [CrossRef]
- Benjeddou, O.; Ouezdou, M.B.; Bedday, A. Damaged RC beams repaired by bonding of CFRP laminates. Constr. Build. Mater. 2007, 21, 1301–1310. [Google Scholar] [CrossRef]
- Jumaat, M.Z.; Rahman, M.M.; Alam, M.A. Flexural strengthening of RC continuous T beam using CFRP laminate: A review. Int. J. Phys. Sci. 2010, 5, 619–625. [Google Scholar]
- Nugroho, L.; Haryanto, Y.; Hsiao, F.-P.; Hu, H.-T.; Weng, P.-W.; Lin, C.-C.; Kristiawan, S.A.; Sangadji, S. Effectiveness of UHPC reinforced with steel rebars for flexural strengthening of RC T-beams in an idealized negative moment region. Structures 2025, 80, 109728. [Google Scholar] [CrossRef]
- Tudjono, S.; Han, A.L.; Gan, B.S. An integrated system for enhancing flexural members’ capacity via combinations of the fiber reinforced plastic use, retrofitting, and surface treatment techniques. Int. J. Technol. 2018, 9, 5–15. [Google Scholar] [CrossRef]
- ASTM C39/C39M-21; Standard Test Method for Compressive Strength of Cylindrical Concrete Specimens. ASTM International: West Conshohocken, PA, USA, 2021.
- Kakihara, T.; Kawamoto, T.; Inai, E.; Minami, K. Seismic retrofit for existing low-strength concrete buildings using framed steel brace system concentrically jointed with post-installed anchors. Concr. J. 2013, 51, 883–889. (In Japanese) [Google Scholar] [CrossRef]
- ASTM C109/C109M-20; Standard Test Method for Compressive Strength of Hydraulic Cement Mortars (Using 2-in. or [50-mm] Cube Specimens). ASTM International: West Conshohocken, PA, USA, 2020.
- ASTM A370-18; Standard Test Methods and Definitions for Mechanical Testing of Steel Products. ASTM International: West Conshohocken, PA, USA, 2018.
- ACI Committee 318; Building Code Requirements for Structural Concrete and Commentary (ACI 318-19). American Concrete Institute: Farmington Hills, MI, USA, 2019.
- Zhu, Y.; Zhang, Y.; Hussein, H.H.; Chen, G. Flexural strengthening of reinforced concrete beams or slabs using ultra-high performance concrete (UHPC): A state-of-the-art review. Eng. Struct. 2020, 205, 110035. [Google Scholar] [CrossRef]
- Paschalis, S.A.; Lampropoulos, A.P.; Tsioulou, O.T. Experimental and numerical study of the performance of ultra-high performance fiber reinforced concrete for the flexural strengthening of full-scale reinforced concrete members. Constr. Build. Mater. 2018, 186, 351–366. [Google Scholar] [CrossRef]
- Zhang, Y.; Zhu, Y.; Yeseta, M.; Meng, D.; Shao, X.; Dang, Q.; Chen, G. Flexural behaviors and capacity prediction on damaged reinforced concrete (RC) bridge deck strengthened by ultra-high performance concrete (UHPC) layer. Constr. Build. Mater. 2019, 215, 347–359. [Google Scholar] [CrossRef]
- Tanarslan, H.M.; Alver, N.; Jahangiri, R.; Yalçınkaya, Ç.; Yazıcı, H. Flexural strengthening of RC beams using UHPFRC laminates: Bonding techniques and rebar addition. Constr. Build. Mater. 2017, 155, 45–55. [Google Scholar] [CrossRef]
- Habel, K.; Denarié, E.; Brühwiler, E. Experimental investigation of composite ultra-high-performance fiber-reinforced concrete and conventional concrete members. ACI Struct. J. 2007, 104, 93–101. [Google Scholar]
- Brühwiler, E.; Bastien-Masse, M.; Mühlberg, H.; Houriet, B.; Fleury, B.; Cuennet, S.; Schär, P.; Boudry, F.; Maurer, M. Strengthening the Chillon viaducts deck slabs with reinforced UHPFRC. In Proceedings of the IABSE Conference, Structural Engineering: Providing Solutions to Global Challenges, Geneva, Switzerland, 23–25 September 2015; pp. 1171–1178. [Google Scholar]
- Zhang, Y.; Chai, Y.H. Numerical analysis of bridge deck rehabilitation by ultra-high-performance concrete (UHPC) overlay. Structures 2021, 33, 4791–4802. [Google Scholar] [CrossRef]
- Moy, C.K.S.; Revanna, N. Experimental and DIC Study of Reinforced Concrete Beams Strengthened by Basalt and Carbon Textile Reinforced Mortars in Flexure. Buildings 2023, 13, 1765. [Google Scholar] [CrossRef]
- Wang, J.Y.; Guo, J.-Y.; Jia, L.-J.; Chen, S.-M.; Dong, Y. Push-out tests of demountable headed stud shear connectors in steel-UHPC composite structures. Compos. Struct. 2017, 170, 69–79. [Google Scholar] [CrossRef]
- AASHTO. AASHTO LRFD Bridge Design Specifications; American Association of State Highway and Transportation Officials: Washington, DC, USA, 2012. [Google Scholar]
- Dassault Systèmes. ABAQUS/Standard User’s Manual, Version 6.14; Dassault Systèmes: Providence, RI, USA, 2017.
- Liu, X.; Bradford, M.A.; Ataei, A. Flexural performance of innovative sustainable composite steel–concrete beams. Eng. Struct. 2017, 130, 282–296. [Google Scholar] [CrossRef]
- Mazzuca, P.; Micieli, A.; Campolongo, F.; Ombres, L. Influence of thermal exposure scenarios on the residual mechanical properties of a cement-based composite system. Const. Build. Mater. 2025, 466, 140304. [Google Scholar] [CrossRef]
- Hsu, L.S.; Hsu, C.-T.T. Complete stress–strain behaviour of high-strength concrete under compression. Mag. Concr. Res. 1994, 46, 301–312. [Google Scholar] [CrossRef]
- Construction Agency. General Rules for Revision of Design Code for Concrete Structures; Ministry of Interior: Taipei, Taiwan, 2019.
- Lubliner, J.; Oliver, J.; Oller, S.; Oñate, E. A plastic-damage model for concrete. Int. J. Solids Struct. 1989, 25, 299–326. [Google Scholar] [CrossRef]
- Xiao, H.; Zhang, K.; Du, J. Numerical simulation analysis of uniaxial compression damage of reinforced concrete column based on ABAQUS. Highlights Sci. Eng. Technol. 2023, 51, 113–118. [Google Scholar] [CrossRef]
- Guo, L.; Mao, R.; Liu, Z.; Li, S.; Wu, G.; Wang, Z. Dynamic large deflection response of RC beams under low-speed impact loading. Shock Vib. 2020, 2020, 8812890. [Google Scholar] [CrossRef]
- Lee, S.-H.; Abolmaali, A.; Shin, K.-J.; Lee, H.-D. ABAQUS modeling for post-tensioned reinforced concrete beams. J. Build. Eng. 2020, 30, 101273. [Google Scholar] [CrossRef]
- Hafezolghorani, M.; Hejazi, F.; Vaghei, R.; Jaafar, M.S.B.; Karimzade, K. Simplified damage plasticity model for concrete. Struct. Eng. Int. 2017, 27, 68–78. [Google Scholar] [CrossRef]
- Wei, L.; Ming, X.; Zhongfan, C. Parameter calibration and verification of ABAQUS concrete damage plastic model. Ind. Build. 2014, 44, 167–171. [Google Scholar]
- Demir, A.; Ozturk, H.; Edip, K.; Stojmanovska, M.; Bogdanovic, A. Effect of viscosity parameter on the numerical simulation of reinforced concrete deep beam behavior. Online J. Sci. Technol. 2018, 8, 50–56. [Google Scholar]
- Yin, H.; Teo, W.; Shirai, K. Experimental investigation on the behaviour of reinforced concrete slabs strengthened with ultra-high performance concrete. Constr. Build. Mater. 2017, 155, 463–474. [Google Scholar] [CrossRef]
Disclaimer/Publisher’s Note: The statements, opinions and data contained in all publications are solely those of the individual author(s) and contributor(s) and not of MDPI and/or the editor(s). MDPI and/or the editor(s) disclaim responsibility for any injury to people or property resulting from any ideas, methods, instructions or products referred to in the content. |
© 2025 by the authors. Licensee MDPI, Basel, Switzerland. This article is an open access article distributed under the terms and conditions of the Creative Commons Attribution (CC BY) license (https://creativecommons.org/licenses/by/4.0/).