Review

Bibliographic Review of Data-Driven Methods for Building Energy Optimisation

by
Carlos Rizo-Maestre
1,*,
Mireia Sempere-Tortosa
2,
Pascual Saura-Hernández
1 and
María Dolores Andújar-Montoya
3
1
Department of Architectural Constructions, University of Alicante, Carretera de San Vicente del Raspeig, s/n, San Vicente, 03690 Alicante, Spain
2
Department of Computer Science and Artificial Intelligence, University of Alicante, 03690 Alicante, Spain
3
Building Sciences and Urbanism Department, University of Alicante, 03690 Alicante, Spain
*
Author to whom correspondence should be addressed.
Buildings 2025, 15(21), 3992; https://doi.org/10.3390/buildings15213992
Submission received: 28 August 2025 / Revised: 10 October 2025 / Accepted: 15 October 2025 / Published: 5 November 2025
(This article belongs to the Section Building Energy, Physics, Environment, and Systems)

Abstract

This study presents a systematic bibliographic review of the application of Big Data and machine learning (ML) methods to improve energy efficiency in architectural design. The review covers peer-reviewed publications from 2010 to 2025, examining how ML algorithms such as Random Forest, Gradient Boosting, and neural networks have been used to optimise design parameters including orientation, glazing ratio, and compactness. A systematic search and selection protocol was applied to identify, classify, and critically analyse over 70 relevant studies. The findings reveal consistent evidence that data-driven models outperform traditional simulation-based methods in predicting heating and cooling loads while highlighting current gaps related to data quality, model interpretability, and real-world validation. The study contributes to the understanding of how ML-driven approaches can guide sustainable architectural design and future research directions in the built environment. Additionally, illustrative experiments were performed using simulated datasets to validate and exemplify key findings identified in the reviewed studies.

1. Introduction

The ability to anticipate energy consumption is crucial to make more informed and sustainable decisions. For this study, a dataset from the UCI Machine Learning Repository, specifically related to buildings, is used to establish the relationship between various architectural features and their impact on energy consumption, both in heating and cooling. The parameters analysed include relative compactness, surface area, wall area, roof area, overall height, orientation, and glazing area and distribution.
The rationale for this work lies in its potential to significantly reduce energy consumption in the building sector. By identifying and quantifying the influence of different architectural factors on energy efficiency, this study provides a sound basis for decision-making in both building design and renovation. This not only has a positive economic impact but also contributes to climate change mitigation and the creation of more comfortable and healthy spaces for their occupants.
The following sections detail the systematic review process applied to identify, analyse, and synthesise recent advances in data-driven methods for building energy optimisation. Additionally, an illustrative case study is included to demonstrate how the reviewed methodologies perform under a simulated context, thereby validating and exemplifying the bibliographic findings. This applied component reinforces the review’s conclusions without altering its primarily bibliographic nature [1,2,3,4,5,6,7,8,9,10,11,12,13,14,15,16,17,18,19,20,21,22,23,24,25,26,27,28,29].

2. Theoretical Framework

The evolution of research in sustainable architecture and building energy efficiency has progressed significantly over recent decades, moving from early passive design strategies to sophisticated data-driven approaches. This chronological review traces the major developments from the 1990s to the present, highlighting how technological advances and methodological innovations have shaped contemporary practices in architectural energy optimisation.

2.1. Early Approaches to Natural Ventilation and Passive Design Strategies (1990s–2010s)

Natural ventilation in buildings emerged as a fundamental aspect of sustainable architecture during the late 20th century, enabling significant energy savings while improving indoor air quality. Early research demonstrated that passive cooling methods such as night ventilation could reduce energy demand and improve thermal comfort, although careful optimisation was necessary to maximise benefits [30]. These foundational studies established the principles that would guide subsequent developments in natural ventilation strategies.
By the early 2000s, the integration of sustainability principles into architectural education began to take shape. Efforts included expanding courses on environmental systems and revising entire academic programmes to embed sustainability at all levels [31]. This educational shift was essential for cultivating a new generation of architects capable of balancing creative expression with the technical requirements of sustainability [32].
Research from the 2010s demonstrated that applying natural ventilation strategies could lead to considerable energy savings, particularly in moderate climates [33,34]. In high-rise residential buildings, for instance, buoyancy-driven ventilation was found to reduce electricity consumption by up to 45% [35]. Controlled ventilation approaches emerged, optimising energy savings and thermal comfort through simulations to determine optimal strategies for different climates and building types [34,36].
However, implementing natural ventilation systems presented certain challenges. The decline in its use in commercial buildings led to a loss of expertise in design, making it difficult to integrate effective systems complying with modern comfort standards [37]. Climate dependency emerged as another crucial factor, as performance varied significantly by region. For example, in Mediterranean climates, the stack effect proved more effective than wind-driven ventilation, highlighting the necessity of climate-specific strategies [38,39] Smart ventilation systems, which adjust airflow based on real-time conditions such as CO2 levels and occupancy, began to be integrated into building regulations across various countries [40].
A comparative review of these early studies reveals that while Schulze Eicker (2013) [34] and Weerasuriya et al. (2019) [35] emphasize energy-saving potential in moderate climates, Omrani et al. (2017) [38] and Rodrigues et al. (2019) [39] highlight regional variations that may limit universal applicability. This divergence underscores the need for climate-specific strategies and standardized evaluation methods, with a notable gap persisting in the integration of real-time adaptive systems with natural ventilation models.

2.2. Emergence of Sustainability Frameworks in Architecture (2010–2015)

The period from 2010 to 2015 witnessed the consolidation of comprehensive sustainability frameworks in architecture, integrating environmental, social, and economic considerations into building design and construction. During this time, theoretical frameworks began to guide the implementation of sustainability more systematically. One influential approach, based on the triple bottom line principle, emphasised resource conservation, cost efficiency, and human adaptation throughout the building lifecycle, promoting balance between economic, social, and environmental aspects [41].
Concurrently, assessment systems for evaluating sustainability in architecture were developed, though they tended to focus primarily on environmental and technological aspects, often overlooking social and economic dimensions [42]. This limitation highlighted the need for more comprehensive assessment tools that consider dynamic interactions between buildings and their surroundings. Alternative frameworks focusing on social sustainability emerged, employing tools such as SWOT analysis, Stakeholder Analysis, and Social Return on Investment to assess the social impact of architectural projects [43].
The motivations of architectural designers also received attention during this period. Studies indicated that intrinsic motivations, including personal commitment, moral responsibility, and the pursuit of design quality, were more prevalent than external incentives such as regulations [44]. These autonomous motivations aligned with sustainability principles, suggesting that fostering designers’ sense of responsibility and creativity could enhance the adoption of sustainable strategies.
Comparative analysis of these frameworks reveals that while Akadiri et al. (2012) [41] and Lami and Mecca (2020) [43] provide complementary perspectives—environmental efficiency versus social sustainability—Berardi (2013) [42] points out methodological gaps in linking these dimensions comprehensively. Moreover, Martek et al. (2018) [45] note structural barriers within the architectural profession that hinder holistic adoption, indicating the need for integrative models that balance environmental, social, and economic objectives.

2.3. Advances in Life Cycle Carbon Footprint and Assessment Methodologies (2015–2018)

The period from 2015 to 2018 marked significant progress in understanding and quantifying the environmental impact of buildings through life-cycle assessment methodologies. The building lifecycle—encompassing emissions from construction, operation, and demolition phases—emerged as a critical factor in determining overall carbon footprint, prompting researchers to develop more sophisticated analytical approaches.
Research during this period revealed that life cycle carbon footprint (LCCF) components play a fundamental role in determining environmental impact. The LCCF was found to be primarily composed of operational emissions, accounting for approximately 75% of total emissions, followed by embodied emissions at 24% and demolition emissions at just 1% [46]. The operational phase consistently emerged as the largest contributor, with some studies indicating it could reach up to 85.4% of total emissions [47].
Comparative studies of different building types demonstrated that refurbished buildings generally exhibited lower LCCF than new constructions, though certain newly built structures could outperform refurbished ones depending on design and energy systems [46]. Optimising life cycle carbon footprint involved refining various design variables, including insulation thickness, window specifications, and heating systems. Studies suggested that reducing insulation thickness while increasing photovoltaic areas could lead to carbon-optimal designs [48]. Structural system choices also showed significant impact, as different lateral load-resisting systems and materials could result in considerable variations in carbon emissions over the building’s lifetime [49].
Life cycle assessment (LCA) emerged as a fundamental tool for quantifying environmental impact, though inconsistencies in methodologies and scope highlighted the need for standardised approaches to ensure reliable and comparable results [50]. The integration of LCA with building information modelling (BIM) began to enhance data accuracy and streamline assessment processes, allowing for more precise carbon footprint calculations [51]. However, achieving consistency in LCCF analysis required the development of unified protocols to address methodological discrepancies and ensure comparability across studies [46,50].
Material selection also received increased attention during this period, with timber structures demonstrating substantial reductions in embodied energy and carbon emissions compared to concrete buildings, achieving savings of 43% and 68% respectively [52]. Hybrid structures combining timber and concrete offered balanced approaches, potentially leading to more efficient and environmentally friendly constructions [53]. Policy and economic incentives were recognized as crucial for reducing carbon footprint by encouraging the adoption of energy-efficient technologies and sustainable materials, with financial mechanisms such as tax incentives supporting retrofits and facilitating transition towards low-carbon construction practices [54].

2.4. Integration of Digital and Information Technologies (2018–2020)

The period from 2018 to 2020 witnessed rapid transformation in architecture through the integration of advanced digital tools, fundamentally reshaping how architectural projects were designed, constructed, and managed. Information technologies such as building information modelling (BIM), augmented reality (AR), virtual reality (VR), and digital twins offered new possibilities for accuracy, efficiency, and collaboration in the built environment.
The integration of BIM with immersive technologies such as VR, AR, and mixed reality (MR) gained significant traction within the architecture, engineering, and construction (AEC) industry, allowing for enhanced design exploration, planning analysis, construction monitoring, and facilities management [55,56]. These technologies also contributed to educational training by providing interactive learning environments. However, significant technological and management barriers remained, particularly concerning communication and collaboration between different project phases, limiting the full potential of BIM adoption [56].
The convergence of cloud computing and the Internet of Things (IoT) drove evolution of new software architectures focused on scalability, security, and time efficiency. Edge computing and service-oriented architectures emerged as dominant paradigms, though further empirical research was necessary to refine software engineering methodologies within this domain [57]. Investment in IT architecture became recognized as a critical factor for firms operating in complex production environments, with enterprise architecture (EA) investment models aiming to bridge gaps between business operations and IT sectors [58].
The concept of digital twins emerged as a transformative tool in construction, offering a virtual representation of physical assets that enables bidirectional synchronisation between cyber and physical data. This approach enhanced efficiency and minimised environmental and economic impacts of the building lifecycle, though more comprehensive semantic frameworks were required to integrate dynamic data across multiple levels effectively [59,60]. Unmanned aerial vehicles (UAVs) and photogrammetric techniques became increasingly incorporated into architectural projects, significantly improving accuracy in terrain capture and 3D model generation. When combined with BIM, these methods enhanced construction execution and project monitoring, leading to considerable time and cost savings [22].
Concurrently, sustainable architecture and occupant comfort gained prominence as critical considerations in building design, particularly in the context of climate change and the COVID-19 pandemic. Thermal comfort emerged as a fundamental factor influencing occupant well-being, with the integration of artificial intelligence offering new opportunities to optimise energy consumption while maintaining comfort levels. Traditional control methods often resulted in unnecessary energy use, whereas AI-driven systems could dynamically adjust heating and cooling based on real-time conditions, significantly improving efficiency [61]. The pandemic underscored the importance of designing living spaces that prioritise health and well-being, leading to the reassessment of sustainability requirements and increased demand for contactless technologies, improved sanitisation, and integration of green spaces [62].
Indoor environmental quality (IEQ) was recognised as a critical component of both comfort and occupant satisfaction, influenced by physical, psychological, personal, and environmental factors. A more holistic understanding of IEQ integrating both quantitative and qualitative methodologies enhanced overall satisfaction and well-being [63,64]. The continuous evolution of green building technologies contributed to promoting sustainable use of resources, particularly in energy and water efficiency, with direct impacts on occupant health and productivity [65]. Social sustainability also gained recognition for its pivotal role in urban renewal, where built environment design could enhance community well-being by improving accessibility, social interaction, and resource conservation [66].

2.5. Expansion of Big Data and Machine Learning Applications (2020–2025)

The integration of Big Data and machine learning (ML) in architecture continues to evolve rapidly, driving significant transformations across design, energy management, and urban planning. Recent research has demonstrated that advanced data analytics can enhance both the predictive and optimisation capabilities of energy models by processing high-volume, high-velocity datasets from simulations, sensors, and satellite imagery. For instance, Al-Mashaqbeh et al. (2024) [67] proposed a Big Data analytical framework for analysing solar energy receivers using an evolutionary computing approach, which enables the efficient exploration of multi-variable design spaces in solar and building-integrated energy systems. Similarly, Fernández and Barros (2024) [68] and Zhang et al. (2024) [69] emphasise the role of Big Data infrastructures in linking real-time building performance monitoring with cloud-based optimisation, while Liang and Zhou (2025) [70] illustrate how hybrid ML and IoT models enable adaptive energy control in dynamic urban environments. These works highlight the growing synergy between data-intensive computation and architectural performance modelling, positioning Big Data as the backbone for scalable, predictive, and self-optimising building systems.
Deep learning and reinforcement learning frameworks have achieved energy savings of up to 20% in early-stage design optimisation [69], while hybrid AI approaches integrating IoT and cloud computing allow the dynamic adjustment of HVAC and lighting systems in response to real-time data [71]. Moreover, at the urban scale, ensemble ML models have improved the accuracy of large-scale retrofit planning by more than 15%, supporting sustainable urban development policies [72].
These findings underline a clear trend toward data-driven, adaptive, and interconnected energy design paradigms, highlighting both the potential and the current limitations of data quality and model interpretability as also noted by [73].
In edge computing, the design of Big Data systems became essential for applications such as augmented reality and IoT, where low-latency services are critical. Machine learning techniques played key roles in optimising these systems, enhancing performance while reducing response times. Reference architectures (RAs) were developed to streamline the deployment of ML models, lowering development costs and risks while improving communication between stakeholders [74].
Energy management in the built environment increasingly benefited from Big Data architectures, which facilitated the integration of diverse data sources, including smart meters and IoT devices, with ML algorithms. This integration supported real-time data processing and enabled the development of energy-efficient services, contributing to improved building operations and more effective policymaking [75].
Machine learning was also applied to optimise computer architecture and system design, enhancing designer productivity while improving overall system efficiency. ML techniques were used for predictive modelling and as the methodology for optimising system configurations, addressing key challenges in hardware and software design, particularly relevant in the development of large-scale computing infrastructures such as warehouse-scale computers [76]. The development of hardware systems for ML presented several challenges, including material selection and system integration, with emerging hardware technologies being explored to enhance the energy efficiency and throughput of ML-based computing systems essential for future AI-driven applications.
In the agricultural sector, the design of Big Data architectures was complicated by increasing data volumes, requiring the adaptation of ML techniques to effectively manage and analyse agricultural datasets, with continuous modifications in data processing technologies necessary to support decision-making in precision agriculture [77].
Applications of ML and Big Data in urban planning became essential for climate change mitigation efforts, particularly in optimising urban infrastructure and tailoring policy solutions at varied scales, from individual buildings to entire cities. These technologies facilitated more sustainable urban development strategies, enabling improved resource management and resilience in the face of environmental challenges [78].
The integration of Big Data and machine learning in architecture have driven innovation across multiple domains, though ongoing challenges in hardware development and data management continue to influence future research directions. These advancements have proved particularly relevant in urban renewal and energy efficiency, essential components of sustainable urban development. As cities grow and evolve, incorporating energy-efficient practices into urban planning and renewal projects is critical for reducing energy consumption and mitigating environmental impacts.
Urbanisation is found to negatively affect energy efficiency, particularly in rapidly developing regions such as China, where studies suggest it could decrease both short-term and long-term energy efficiency, underscoring the necessity for energy conservation measures during rapid urban expansion [79,80]. The phenomenon of semi-urbanisation further complicates this relationship, as it could either support or hinder energy efficiency improvements depending on scale and management of urban growth [79].
Various strategies have been proposed to improve energy efficiency in urban environments. Decision support systems leveraging Geographic Information Systems (GISs) assist city planners in identifying areas with high potential for energy efficiency enhancements, such as the implementation of low-energy buildings and renewable energy sources [81]. Integrated frameworks for building retrofits combining energy simulation with cost–benefit analysis offer guidance for optimising energy retrofits, prioritising occupant-oriented solutions to enhance cost effectiveness [82].
Urban renewal initiatives have also contributed to climate mitigation efforts, particularly in addressing urban heat islands (UHIs) and improving overall urban climates. Strategies such as increasing vegetation cover and phasing out high-energy consumption industries have proved effective in reducing UHIs in cities like Shanghai, leading to substantial energy savings and reductions in carbon emissions [83]. These measures have not only improved energy efficiency but also supported broader climate change mitigation objectives.
Despite potential benefits, optimising urban energy efficiency remains challenging. The spatial and morphological characteristics of cities play crucial roles in shaping energy demand, yet many energy strategies have failed to fully leverage these factors [84]. Moreover, the transition to positive energy blocks, involving decentralised renewable energy production and advanced technologies, requires ambitious targets and substantial investment [85]. Future research and policy must focus on integrating technological solutions with behavioural and lifestyle adaptations to achieve sustainable energy outcomes at both building and district scales [86].
This chronological review demonstrates how research in sustainable architecture and building energy efficiency has evolved from early passive design strategies to sophisticated data-driven approaches. The progression reflects increasing technological capabilities and growing understanding of the complex interplay between environmental, social, economic, and technological factors in achieving sustainable built environments. Current challenges in data standardisation, interoperability, and ethical considerations related to AI-driven design processes represent the frontier of ongoing research efforts.

2.6. Taxonomy of Methods in the Literature

Supervised ML. Linear/Elastic Net and SVR provide strong baselines for load prediction when relationships are near-linear or smoothly non-linear; tree-based ensembles (Random Forest and Gradient Boosting) consistently capture higher-order interactions and heterogeneity across climates and morphologies. K-Nearest Neighbours is effective with dense, well-scaled feature spaces but scales poorly with dataset size (Table 1).
Unsupervised ML. Clustering (e.g., k-means) and dimensionality reduction (e.g., PCA) support archetype discovery, weather regime identification, and feature compression for downstream supervised tasks.
Deep Learning. MLPs and other DL variants (when sufficient data are available) model complex non-linearities and interactions, especially for multi-objective targets (heating/cooling).
Hybrid/Physics-Informed. Grey-box and physics-informed ML couple first-principles with data-driven components, improving extrapolation, physical consistency, and sample efficiency; reinforcement learning is increasingly used for adaptive control (Figure 1).

2.7. Data Requirements and Pre-Processing

Input features. Core architectural variables (compactness, surface/wall/roof area, height, orientation, and glazing ratio and distribution) augmented with climate descriptors (typical meteorological year and stochastic weather indices), material/assembly properties, occupancy proxies (schedules, CO2), and control set-points.
Data sources. Simulation outputs (Ecotect/EnergyPlus/OpenStudio), smart-meter/IoT streams, BMS logs, and weather services.
Pre-processing. Normalisation/scaling (especially for SVR/KNN/MLP), categorical encoding (orientation and glazing distribution), feature engineering (interaction terms such as compactness × glazing), temporal alignment (when time-series), and rigorous cross-validation with stratification by climate/geometry to mitigate leakage and domain shift.

2.8. Comparative Evaluation: Accuracy, Interpretability, and Computational Cost

Table 2 compares accuracy, interpretability, and computational cost of ML methods for energy prediction.

2.9. Limitations and Practical Challenges

Data availability and quality. Simulation-only corpora under-represent occupant behaviour, construction variability, and stochastic weather, constraining external validity; mixed datasets (monitoring + simulation) improve robustness.
Generalisation across climates and typologies. Transfer learning and climate-aware validation are needed to address domain shift.
Workflow integration. Deployment within BIM/IoT, GIS and digital twins requires interpretable, traceable models with computational costs adjusted for professional environments.
Governance and explainability. Adoption benefits from interpretable pipelines (feature importance, SHAP/LIME, surrogate rules) and reproducible protocols (PRISMA-inspired) already integrated in the revised version of the manuscript.

2.10. Identified Knowledge Gaps and Comparative Insights

A comparative synthesis of the reviewed studies reveals several cross-cutting gaps and limitations:
Natural ventilation and passive strategies: While most studies (e.g., [34,38]) demonstrate strong potential for energy savings, few incorporate occupant behaviour or stochastic weather variations, limiting real-world applicability.
Sustainability frameworks: Although the environmental dimension is well covered [41,43], the integration of social and economic sustainability remains underexplored, with scarce interdisciplinary metrics linking comfort, cost, and lifecycle carbon.
Integration of BIM and data-driven methods: Current research [71,87] has advanced automation and monitoring capabilities, but interoperability between BIM, ML, and IoT platforms is still fragmented due to differing data structures and software ecosystems.
Digital twins and district-scale optimisation: Studies such as those of [88,89] highlight significant progress at the urban scale, yet validation frameworks for synchronising simulated and real-time data remain limited, constraining predictive reliability and large-scale deployment.
Collectively, these gaps underscore the need for integrated, empirically validated, and multi-scale approaches that connect the design phase with operation and policy implementation.

3. Methodology

The methodology of this study was designed to systematically analyse and synthesise the most relevant research on data-driven methods for building energy optimisation.

Literature Search Strategy

To ensure transparency and reproducibility, the literature review followed a structured protocol inspired by PRISMA guidelines. The search was conducted across the following databases: Scopus, Web of Science, IEEE Xplore, and ScienceDirect, covering publications from 2010 to 2025. The main search strings combined terms related to both energy and data-driven modelling, including the following:
  • (“machine learning” OR “artificial intelligence” OR “data-driven”) AND (“building energy” OR “energy efficiency” OR “architectural design”);
  • (“deep learning” OR “neural networks”) AND (“building performance” OR “energy optimisation”).
Inclusion criteria comprised the following:
  • Peer-reviewed journal articles and conference papers written in English.
  • Studies addressing ML or Big Data applications for building energy modelling or design optimisation.
  • Research including quantitative results (e.g., performance metrics, accuracy, and energy savings).
Exclusion criteria comprised the following:
  • Non-peer-reviewed material (editorials, theses, reports).
  • Studies focusing solely on non-architectural or industrial energy systems.
  • Duplicates across databases.
After screening an initial pool of 312 studies, 76 articles met the inclusion criteria and were subjected to detailed review and synthesis. This process ensured that the evidence base was both comprehensive and representative of the current state of the field.

4. Case Study

The data used in this research comes from the University of California, Irvine Machine Learning Repository (UCI Machine Learning Repository), a widely recognised and trusted source in the scientific community for research in machine learning and data analytics.
A dataset of 768 building configurations was generated using Ecotect software version 2022. Although the sample size is not large enough to qualify as Big Data, it serves as a controlled illustrative case aligned with the bibliographic review. The purpose of this example is to demonstrate, on a smaller scale, how data-driven models identified in the literature can be implemented and how their potential could expand significantly when applied to larger, real-world datasets.
The dataset consists of 768 instances, each representing a unique configuration of a building. For each instance, eight input features (X1–X8) and two output variables (y1, y2) are provided, reflecting the heating and cooling loads, respectively.
The input characteristics are as follows:
  • X1: relative compactness;
  • X2: surface area;
  • X3: wall area;
  • X4: ceiling area;
  • X5: total height;
  • X6: orientation;
  • X7: glazing area;
  • X8: glazing area distribution.
The output variables are as follows:
  • y1: Heating load;
  • y2: Cooling load.
This dataset is particularly valuable for the study of energy efficiency in buildings for several reasons. Firstly, it offers a wide variety of building configurations, allowing for a detailed analysis of how different architectural features affect energy performance. Secondly, having been generated through simulations with Ecotect, the dataset provides accurate and consistent information that would be difficult and costly to obtain through measurements in real buildings. In addition, the inclusion of both heating and cooling loads allows for a comprehensive analysis of the building’s energy performance under various climatic conditions.
It is important to note that although these data are based on simulations, they capture realistic relationships between building characteristics and energy performance. However, as with any simulated dataset, it is crucial to be cautious when generalising these results to real buildings. Additional factors, such as occupant behaviour, site-specific climatic conditions and variations in construction, can significantly influence the actual energy performance of a building.

4.1. Entry Features

The eight input characteristics presented are as follows:
X1: Relative Compactness
Relative compactness is an indicator that measures how compact a building is in relation to its volume. It is calculated as the ratio of the surface area of the building to the surface area of a sphere that would have the same volume. In the dataset, compactness values vary between 0.62 and 0.98.
A higher relative compactness value indicates a more compact building. Compact buildings typically have less surface area exposed to the outside compared to their volume, which can reduce heat losses or gains through the building envelope. This has a direct impact on energy efficiency, as a more compact building generally requires less energy for heating and cooling. However, compactness can also influence other aspects of building design, such as daylighting and ventilation. A very compact building may offer fewer opportunities to take advantage of natural daylight and facilitate cross-ventilation, which could increase the need for artificial lighting and mechanical ventilation.
In architectural design, it is crucial to balance relative compactness with other factors such as functionality, aesthetics, and occupant comfort. In extreme climates, greater compactness can be particularly beneficial in improving energy efficiency, while in more moderate climates, other factors may be more important.
X2: Surface Area
Surface area refers to the total external surface area of the building, including all walls, roof, and floor, and is measured in square metres. This factor is crucial for the energy performance of a building.
A larger surface area means more exposure to the outside environment, which can lead to increased heat gains or losses. In cold climates, this can increase the heating load, while in hot climates it can increase the need for cooling. However, a larger surface area can also offer more opportunities to take advantage of natural lighting and to integrate renewable energy systems, such as solar panels. Surface area is closely related to relative compactness. A building with a large surface area compared to its volume (i.e., less compact) usually requires more energy to maintain comfortable indoor conditions.
In architectural design, it is essential to consider the surface area in relation to the local climate, building orientation and functional requirements. In some cases, the use of strategies such as high performance thermal insulation or double skin façade systems can help mitigate the negative effects of a large surface area on energy efficiency.
X3: Wall Area
Wall area refers to the total surface area of all exterior walls of the building, measured in square metres. This characteristic is fundamental to understanding the heat transfer between the inside and outside of the building.
Walls are an important part of the building envelope and play a crucial role in its thermal performance. A larger wall area can lead to higher heat gains or losses, depending on factors such as insulation, building materials and external climatic conditions. In cold climates, a large wall area can increase heat losses, which increases the need for heating. In hot climates, it can lead to unwanted heat gains, increasing the need for cooling. However, a large wall area can also provide benefits, such as increased natural light and views to the outside, improving indoor comfort and reducing reliance on artificial lighting.
Efficient wall design, including the appropriate choice of materials, level of insulation, and incorporation of shading elements, can optimise the energy performance of the building. In addition, the wall area can be used to integrate renewable energy technologies, such as photovoltaic facades, contributing to the sustainability of the building.
X4: Roof Area
Roof area refers to the total roof area of the building, measured in square metres. This characteristic is especially important for the energy performance of the building, particularly in extreme climates.
The roof is directly exposed to solar radiation and weather conditions, making it a key component for heat transfer. In hot climates, a roof with a large surface area can accumulate significant heat, increasing the need for cooling. In cold climates, the roof can be a source of heat loss, increasing heating demand. However, the roof area also offers valuable opportunities to improve energy efficiency. For example, it can be used for the installation of solar panels, rainwater harvesting systems, or roofs that provide additional insulation and reduce the urban heat island effect.
The design of the roof, including its shape, material, colour and level of insulation, can have a considerable impact on the building’s energy performance. Strategies such as using reflective materials in hot climates or incorporating skylights to take advantage of natural lighting can help optimise energy efficiency.
X5: Total Building Height
The total building height, measured in metres, represents the vertical distance from ground level to the highest point of the building. This characteristic influences several aspects of the building’s energy performance.
Height affects the ratio between the volume of the building and its external surface area, which directly impacts heat transfer. Taller buildings tend to have a lower surface-to-volume ratio, which can translate into higher energy efficiency in terms of heating and cooling per unit volume. However, height also influences other aspects of building performance. For example, taller buildings tend to be more exposed to wind, which can increase air infiltration and, consequently, heating and cooling loads. In addition, height can generate longer shadows, affecting access to sunlight from surrounding buildings.
Building height also has implications for mechanical systems. Taller buildings often require more complex lifting and pumping systems, which can increase energy consumption. Also, air stratification in these buildings can affect the efficiency of heating, ventilation and air conditioning (HVAC) systems.
In architectural design, building height should be carefully considered in relation to local regulations, urban context, functional requirements, and energy efficiency strategies.
X6: Building Orientation
The building orientation is coded numerically in the dataset, where values 2, 3, 4 and 5 represent north, east, south, and west orientations, respectively. This characteristic is crucial for the energy performance of the building, as it directly influences its exposure to solar radiation and prevailing winds.
In the northern hemisphere, a southern orientation generally maximises solar gain in winter and minimises unwanted solar gain in summer, which can reduce both heating and cooling needs. In the southern hemisphere, the situation is reversed, with a north-facing orientation generally being more beneficial.
East–west orientation can result in significant solar gains during the mornings and afternoons, which can be desirable or undesirable depending on the climate and building use. In hot climates, minimising east–west exposure can help reduce cooling loads. In addition, orientation affects natural ventilation and daylighting. An orientation that takes advantage of prevailing winds can improve natural ventilation, while one that maximises daylighting can reduce the need for artificial lighting.
In architectural design, the optimal orientation should be determined by considering the local climate, the intended use of the building, and the characteristics of the site. Energy simulations are often used to evaluate different orientation options and their impact on the overall energy performance of the building.
X7: Glazing Area
Glazing area is expressed as a percentage of the total floor area in the dataset, with values between 0% and 40%. This characteristic has a significant impact on the energy performance of the building, as it affects both solar gains and heat losses.
A higher percentage of glazing can increase solar gain, which can be beneficial in cold climates by reducing the need for heating, but can increase the cooling load in hot climates. In addition, increased glazing can improve daylighting, reducing the need for artificial lighting and potentially improving the visual comfort of occupants. However, glass generally has a lower insulation value than opaque walls, so a larger glazing area can lead to higher heat losses in winter and unwanted heat gains in summer, thus increasing heating and cooling loads.
The impact of glazing area on energy efficiency depends largely on factors such as local climate, building orientation, type of glass used and the presence of shading elements. In hot climates, low-e glass and shading elements can be used to reduce heat gains, while in cold climates, high-performance glass can help retain heat. In architectural design, the glazing area must be carefully balanced with other factors such as views to the outside, daylighting and the overall thermal performance of the building.
X8: Glazing Area Distribution
The glazing area distribution is numerically coded in the dataset, where value 1 represents a uniform distribution, and values 2, 3, 4 and 5 indicate the concentration of glazing in north, east, south and west orientations, respectively. This characteristic is crucial, as the location of windows in relation to the orientation of the building can have a significant impact on its energy performance.
An even distribution of glazing can provide more balanced daylighting throughout the building but may not be the most energy-efficient option for all climates.
In the northern hemisphere, concentrating glazing on the southern façade can maximise solar gains in winter and minimise unwanted solar gains in summer, especially if appropriate shading elements are used. This is beneficial for reducing heating loads in cold climates. In the southern hemisphere, the situation is the opposite, with the northern façade offering the greatest solar gains.
Glazing on the east and west facades can generate significant solar gains during the mornings and afternoons, respectively. This can be advantageous in cold climates but could increase cooling needs in hot climates. On the other hand, glazing on the northern (in the northern hemisphere) or southern (in the southern hemisphere) façade receives less direct sunlight, which can be beneficial in hot climates to reduce heat gains but could increase heating loads in cold climates. In architectural design, the optimal glazing layout should be determined taking into account the local climate, building orientation, daylighting needs and desired views. Energy simulations are often used to evaluate different glazing layout options and their impact on the overall energy performance of the building.

4.2. Output Variables

In the proposed study, two fundamental output variables are analysed: heating load (y1) and cooling load (y2). These variables are critical for assessing the energy performance of buildings, as they reflect the amount of energy required to maintain a comfortable indoor environment under different climatic conditions.
Heating load (y1)
The amount of energy required to maintain a comfortable indoor temperature during cold periods, known as the heating load, depends on various architectural factors, such as the compactness of the building, the surface area, the orientation and the quality of the building materials. A building with a high heating load requires a large amount of energy to maintain internal heat, which may be indicative of an inefficient design, with large heat losses through walls, roofs or windows.
To optimise this variable, it is essential to improve thermal insulation, reduce the surface area exposed to the outside, and optimise the orientation of the building to maximise passive solar gain in winter. These strategies can significantly contribute to reducing the heating load and thus energy consumption, improving both efficiency and indoor comfort.
Cooling Load (y2)
The cooling load, on the other hand, refers to the amount of energy required to cool the building during warm periods. Like the heating load, this variable is influenced by the compactness of the building, the orientation, the glazing area and its distribution. A building with a high cooling load may be exposed to excessive solar radiation or have inadequate insulation, leading to overheating in summer.
To minimise this load, it is crucial to implement strategies such as natural ventilation, adequate shading and the use of building materials that reflect solar radiation. These measures help to keep the building interior cool, reducing the need for cooling energy.
The joint analysis of heating and cooling loads enables the development of architectural design strategies that optimise the energy performance of the building. By reducing both heating and cooling requirements, it contributes to greater energy efficiency and sustainability in construction.

5. Description of the Dataset

The starting point for this work is a detailed dataset containing 768 simulated building configurations, each with corresponding architectural features and output variables related to energy performance (https://www.kaggle.com/code/sasakitetsuya/energy-efficiency-model-for-building, accessed on 27 August 2025). The input variables include the following: relative compactness, surface area, wall area, roof area, overall height, orientation, glazing area, and glazing area distribution.
The output variables are the heating and cooling loads, measured in kWh/m2. These variables represent the energy required to maintain thermal comfort conditions in different climatic conditions.
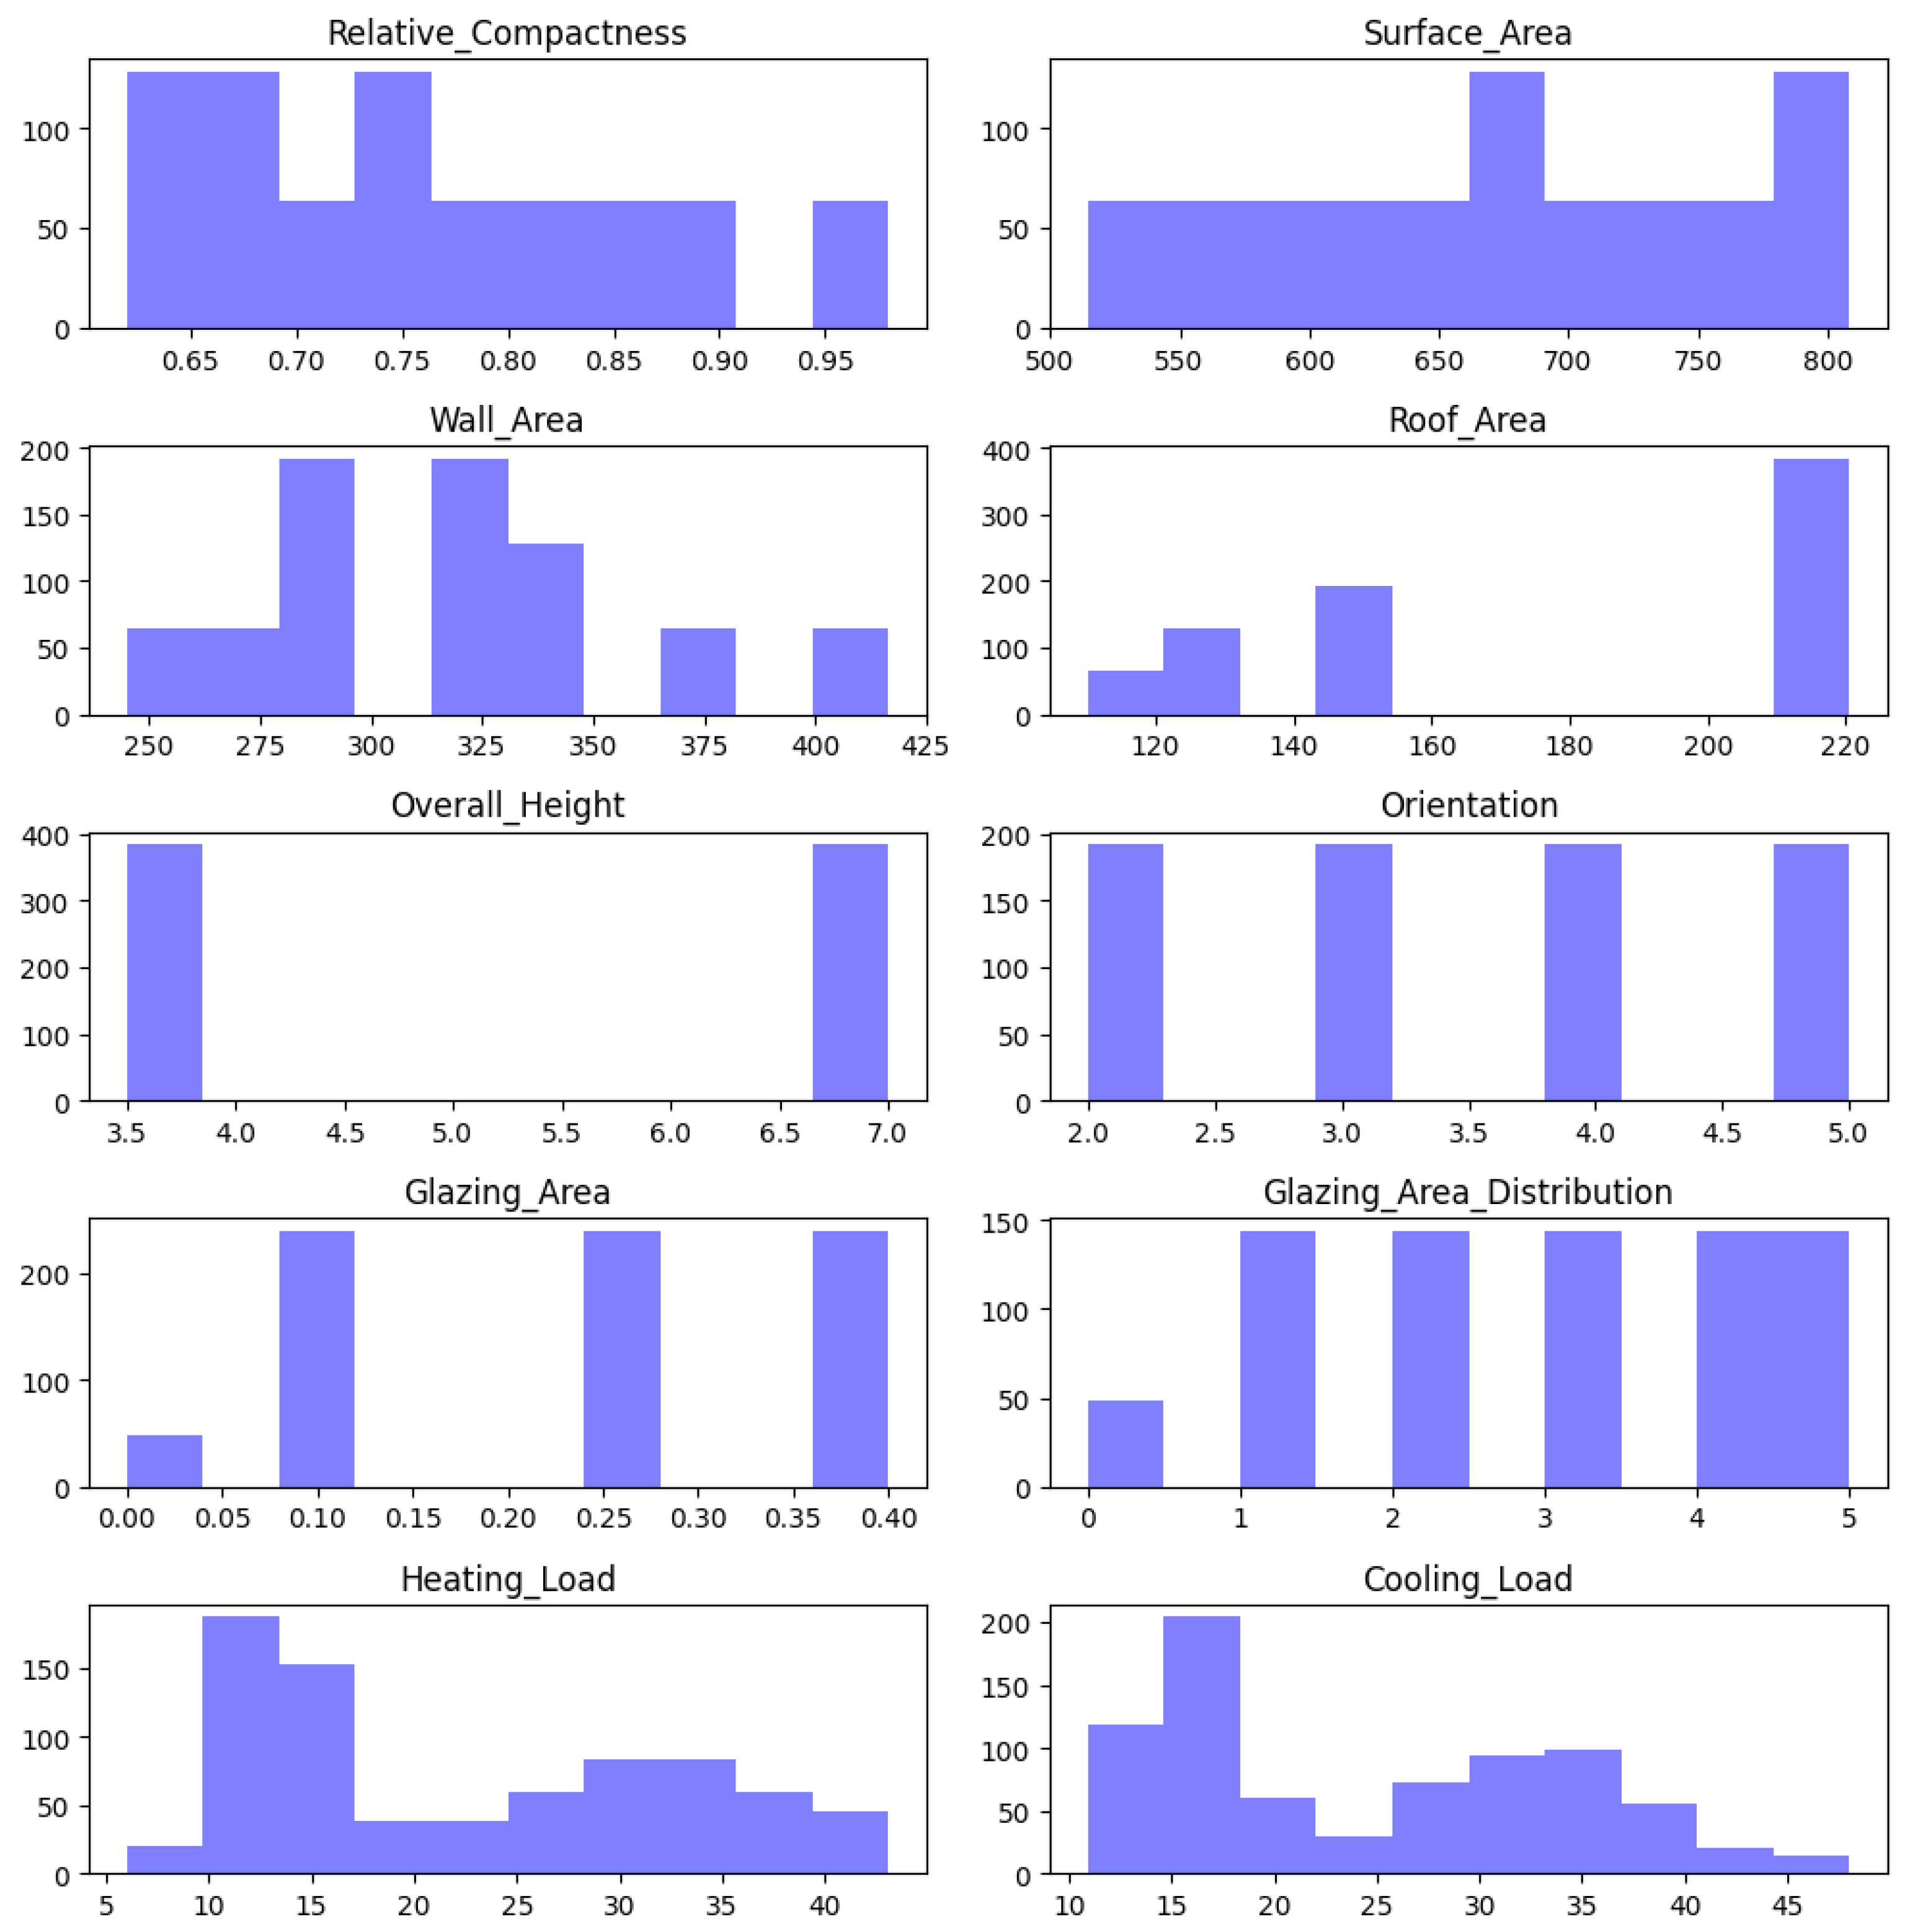
Figure 2 shows the graphical analysis of the dataset with the eight variables and the heating and cooling loads.

5.1. Data Selection and Preparation

The quality and relevance of the data are critical to the success of the analysis. Initially, a thorough review of the data was conducted to identify any anomalies, outliers, or missing data that could affect the results of the analysis. The next steps included the following.
Data cleaning: Outliers and missing data were removed or imputed to ensure consistency of the dataset.
Data normalisation: The input variables were normalised to ensure that they all have a comparable range, which is crucial for the effectiveness of machine learning algorithms.
Data splitting: The dataset was split into training (67%) and test (33%) sets to assess the accuracy and generalisability of the models.

5.2. Exploratory Data Analysis (EDA)

Before applying the machine learning models, an exploratory data analysis was conducted to better understand the relationships between the variables. This step included the following.
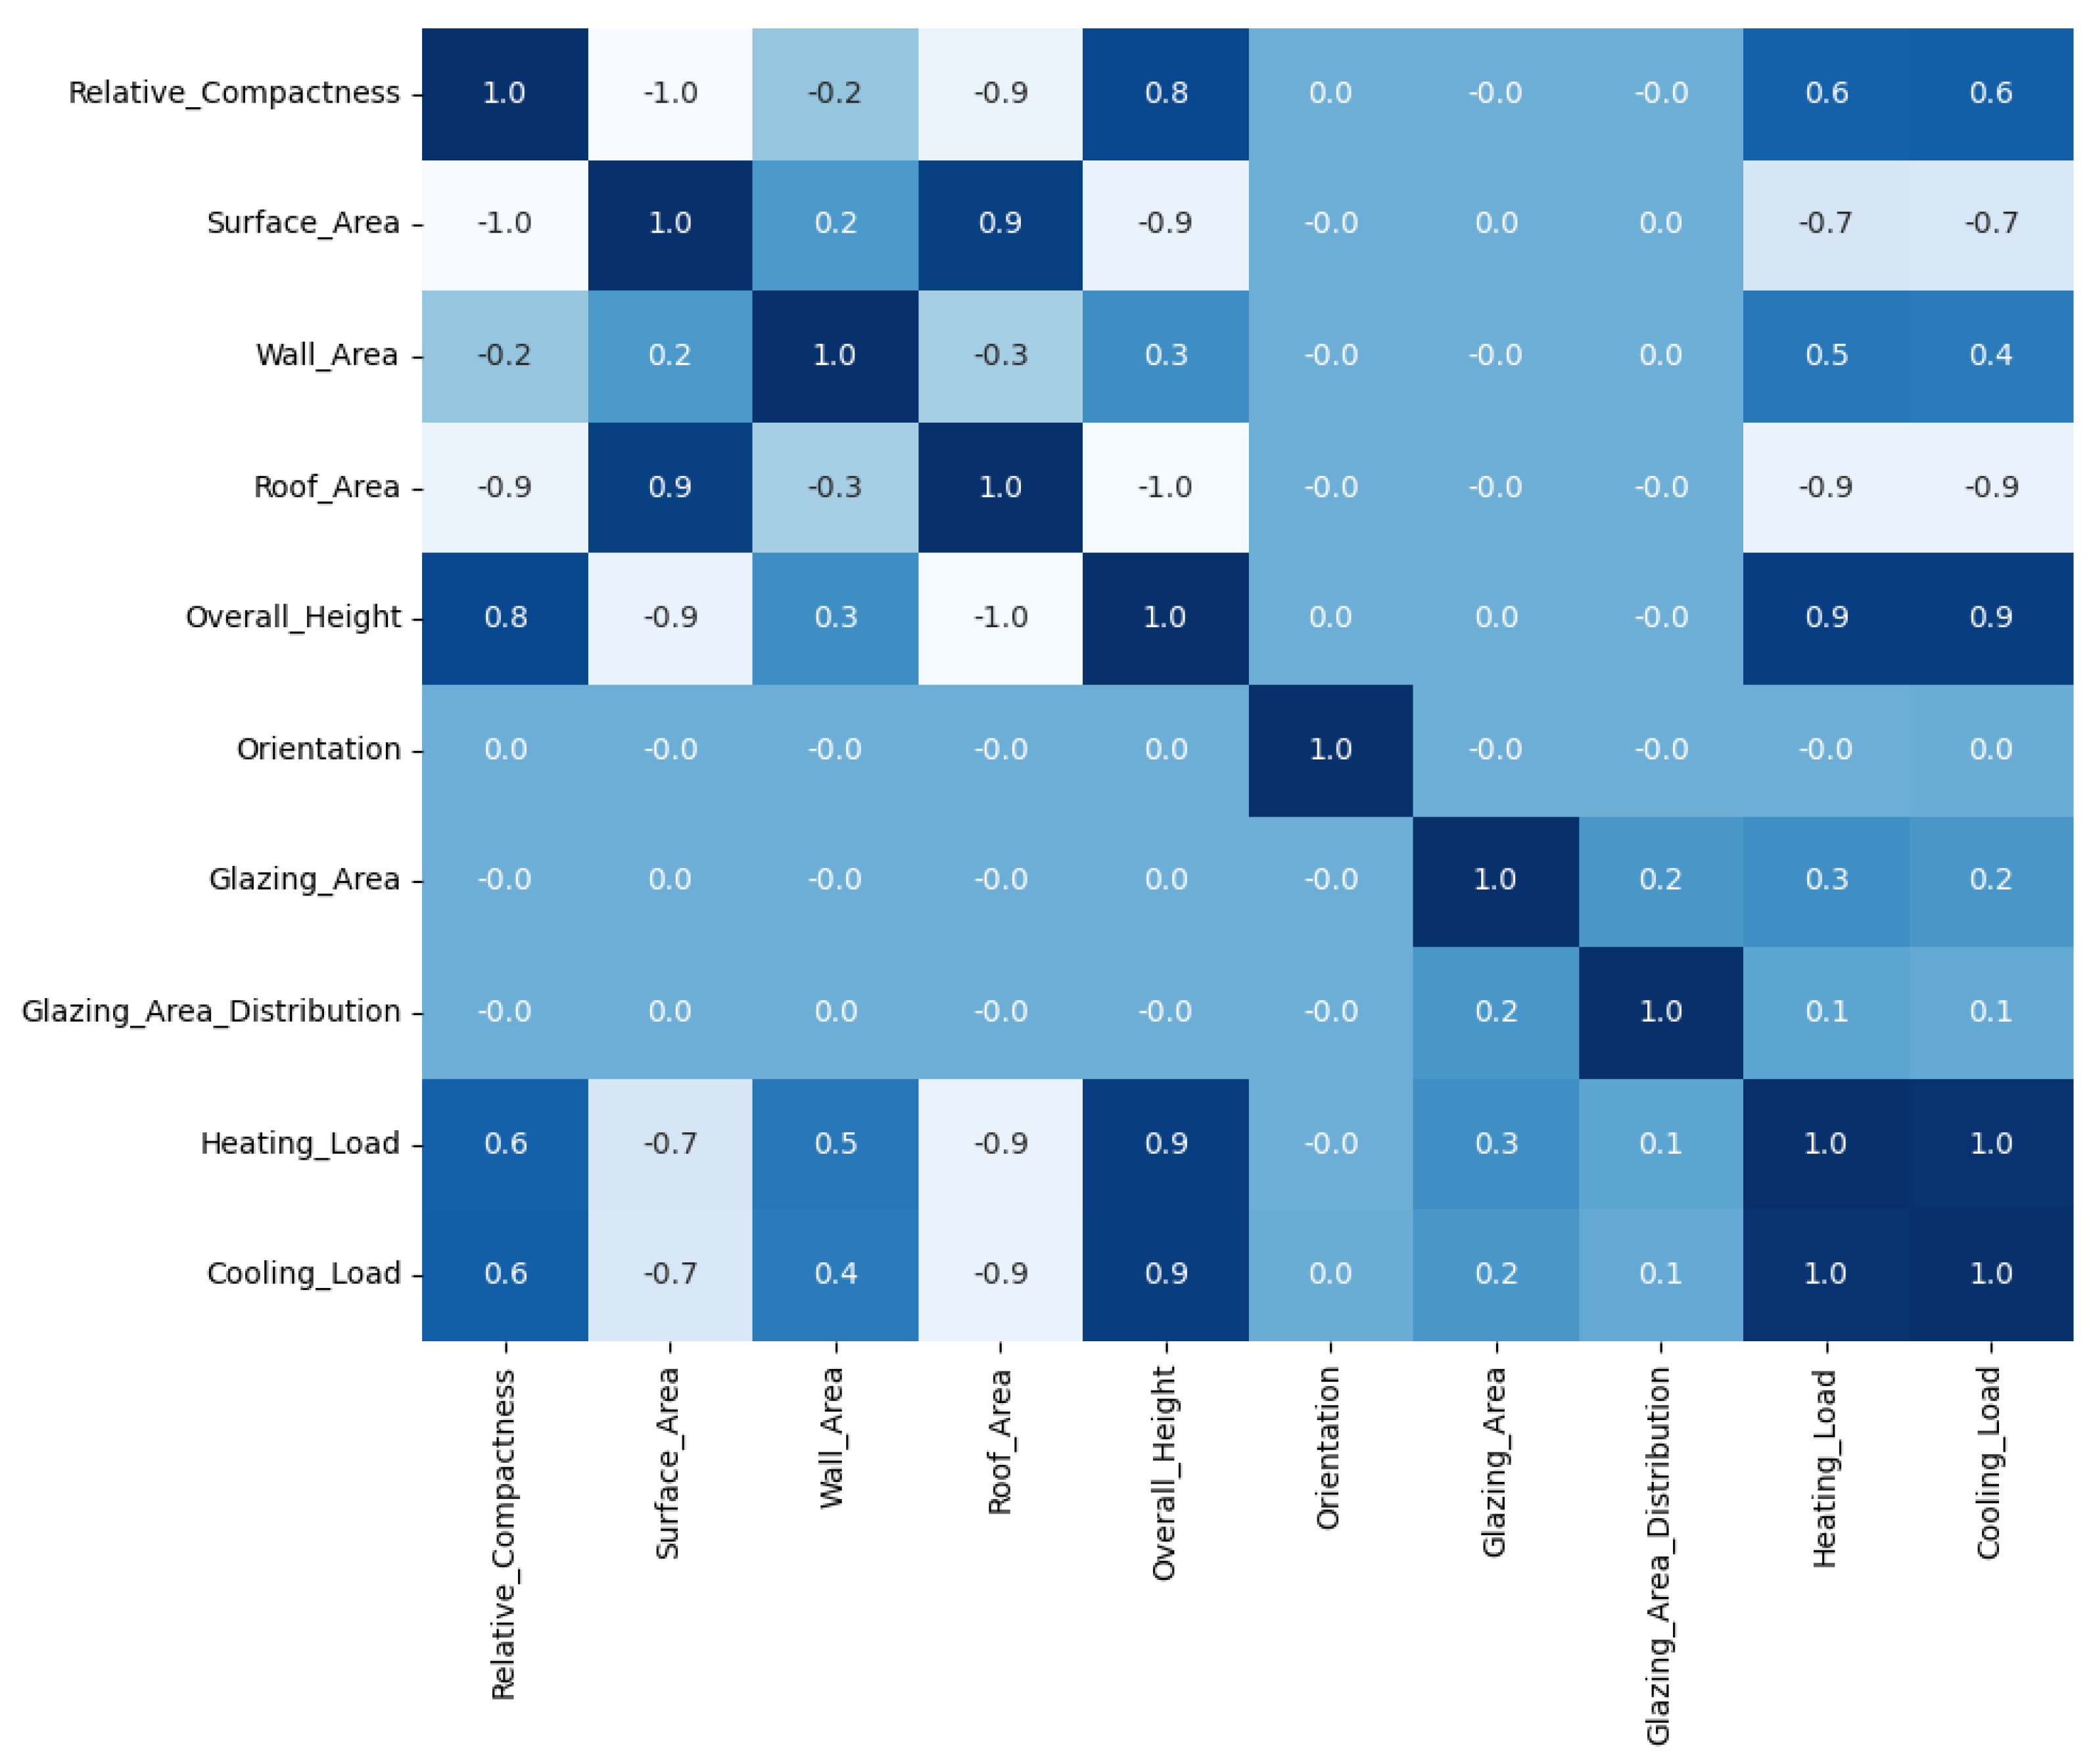
Visualisation of correlations: Correlation matrices were generated to identify linear relationships between input and output variables.
Distribution of variables: Individual variable distributions were analysed to identify patterns and possible biases.
Trend analysis: General trends in the data were explored, such as the relationship between relative compactness and heating loads.
Figure 3 shows the graphical analysis of the correlations of the variables in the dataset.

5.3. Machine Learning Model Selection

The machine learning models used and compared to predict heating and cooling loads based on architectural features include the following.
SVR (Support Vector Regression): A model that uses the principles of Support Vector Machines (SVMs) to make predictions in regression problems. SVR finds a hyperplane in a higher-dimensional space that minimises error within a given margin, making it effective for capturing non-linear relationships in data.
Decision Tree Regressor: A non-linear model that uses a decision tree to divide data into subsets based on the most important features. Each node in the tree represents a decision based on a feature, generating an interpretable tree that facilitates design decisions.
K Neighbors Regressor: A proximity-based model that predicts the output for a data point based on the average of the output values of its nearest neighbours in the feature space. The accuracy of the model depends on the number of neighbours considered and the correct normalisation of the features.
Random Forest Regressor: An ensemble of multiple decision trees that improves model accuracy by combining individual predictions from each tree. Random Forest reduces the risk of overfitting by averaging the results of multiple trees, leading to more stable and accurate predictions.
MLP Regressor (Multilayer Neural Networks): A model inspired by the structure of the human brain, which uses layers of interconnected neurons to capture complex relationships between input and output variables. MLP is trained by backward propagation of error, allowing it to iteratively adjust to minimise prediction error.
AdaBoost Regressor: An ensemble learning model that combines multiple weak models, typically small decision trees, to create a strong predictor. AdaBoost iteratively adjusts the weights of misclassified examples, focusing on improving predictions for difficult cases, resulting in a robust and generalisable model.
Gradient Boosting Regressor: An ensemble learning model that sequentially builds weak models, each correcting the errors of the previous one. Gradient Boosting is particularly effective at reducing prediction error and is able to handle complex, non-linear data with high accuracy.

5.4. Training and Validation of Models

Each of the selected models was trained using the training dataset. The training process included the following.
Cross-validation: To avoid overfitting, k-fold cross-validation was used, where the data were divided into k subsets, and the model was trained and validated k times.
Hyperparameter tuning: The hyperparameters of each model were tuned using techniques such as GridSearchCV, to optimise model performance.
Performance evaluation: Metrics such as mean square error (MSE), root mean square error (RMSE), and coefficient of determination (R2) were used to evaluate the performance of each model.
Figure 4 shows the learning of the decision tree model. In both graphs, the X-axis represents the sequence of data points, while the Y-axis shows the values of the heating and cooling loads. The purpose of these graphs is to illustrate how well the decision tree model predicts the heating and cooling loads compared to the actual values.

5.5. Comparison of Models

After training, the models were evaluated using the test data set to compare their performance. The models were compared in terms of the following.
Accuracy: The ability of the model to predict heating and cooling loads accurately.
Robustness: The ability of the model to handle different building configurations and environmental conditions without significantly degrading its performance.
Interpretability: The ease with which model results can be interpreted and used to make design decisions.
The results showed that ensemble models, such as Random Forest and Gradient Boosting, provide an optimal balance between accuracy and robustness, while linear models are easier to interpret but less accurate in complex scenarios.

5.6. Sensitivity Analysis

A sensitivity analysis was performed to identify which input variables had the greatest impact on the heating and cooling loads. This analysis identified critical factors such as glazing area and building orientation, which can be optimised to improve energy efficiency.
Furthermore, the extended analysis revealed that interactions between architectural parameters, particularly between relative compactness and glazing ratio, have a significant influence on thermal loads. Ensemble models such as Random Forest and Gradient Boosting are especially effective at capturing these non-linear interdependencies, which linear models typically overlook. For instance, in highly compact buildings, the impact of glazing on cooling load is amplified, while in less compact forms, its effect is mitigated by higher surface exposure. Recognising these cross-variable dynamics allows for more nuanced design optimisation strategies that balance form, envelope characteristics, and climatic response.
Glazing area: A higher percentage of glazing was found to increase the cooling load, especially in orientations with high solar exposure.
Building orientation: The south orientation showed a higher efficiency in reducing the heating load, taking advantage of passive solar gain during the winter.
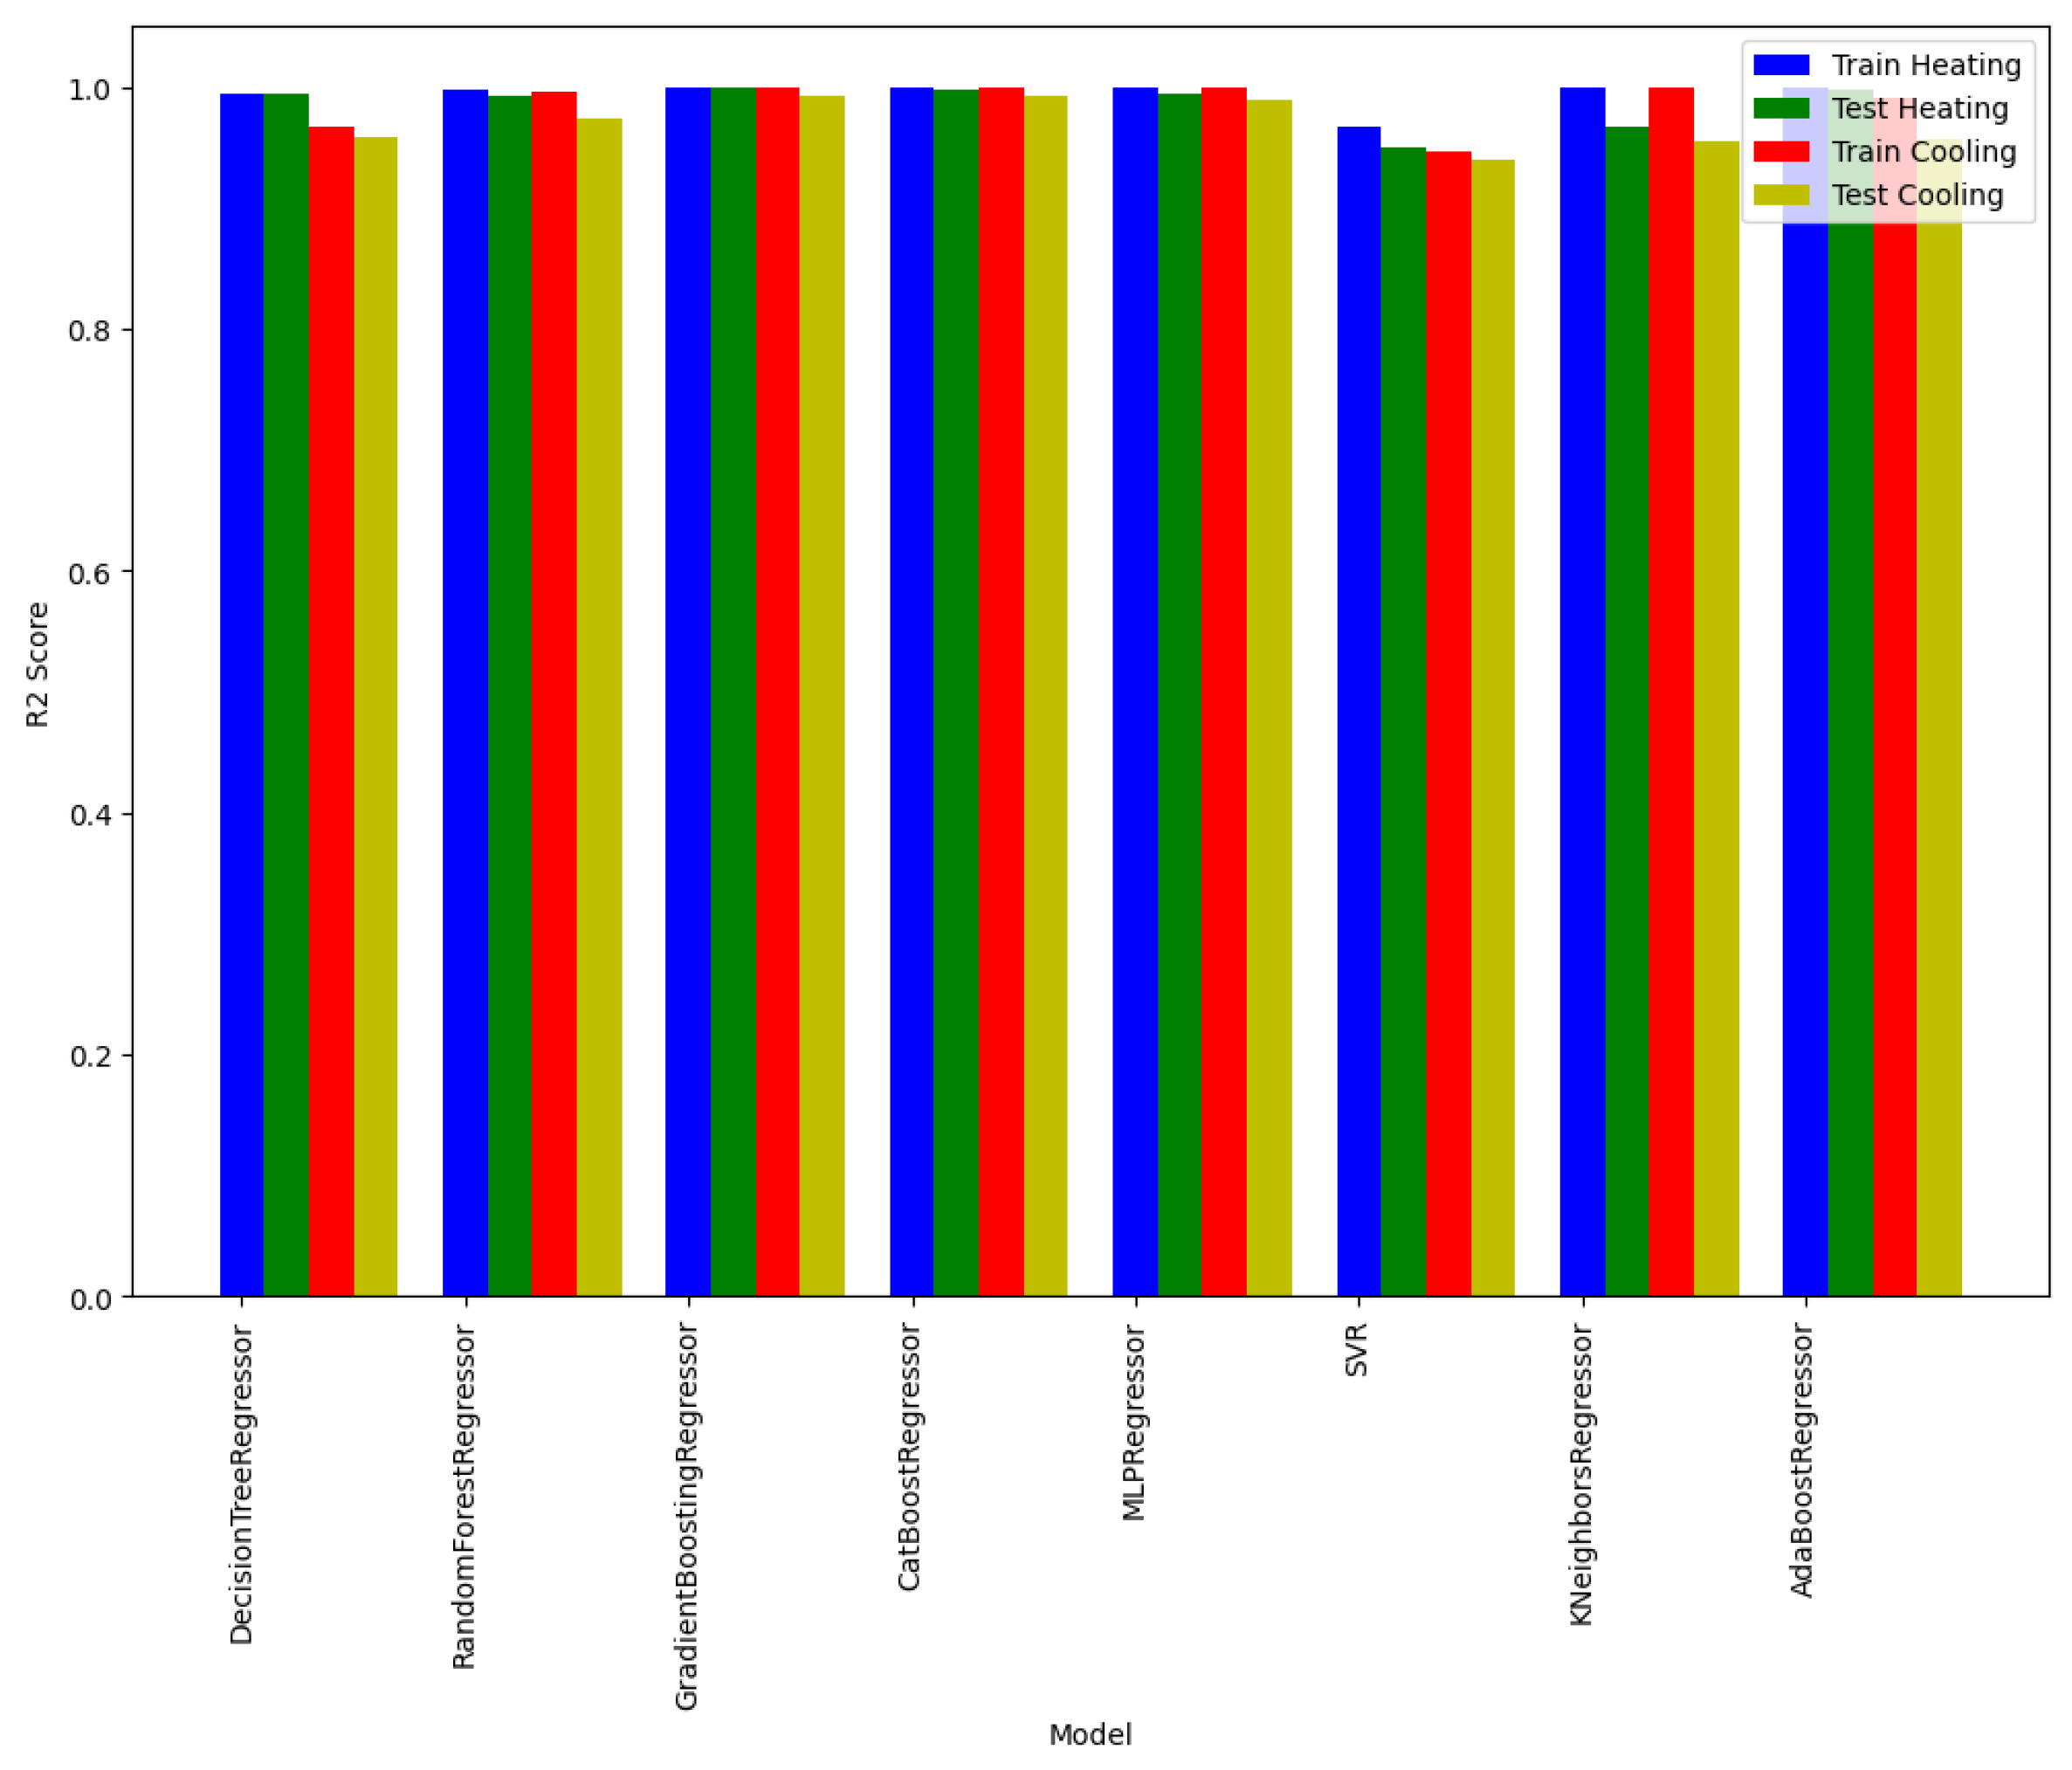
Figure 5 presents a comparison of the performance of each regression model in predicting thermal loads in both training and test data sets. The bars reflect the consistency and accuracy of each model in both contexts, allowing the identification of which model provides the best overall performance for heating and cooling predictions.

5.7. Implementing Design Strategies in Construction

Based on the results of the analysis, design strategies to optimise energy efficiency were proposed. These strategies include the following.
Optimisation of the glazing area: Adjust the size and layout of the glazing according to the orientation and local climate.
Building orientation: Prioritise orientations that maximise solar gain in winter and minimise cooling loads in summer.
Material selection: Use thermally efficient materials in walls and ceilings to reduce heat losses.
Integration of passive systems: Incorporate green roofs and ventilated facades to improve thermal comfort and reduce energy demand.
Comprehensive analysis of different machine learning models has proven to be a powerful tool for optimising design decisions in sustainable architecture. The most advanced models, such as Random Forest and Gradient Boosting, provided the best predictions for heating and cooling loads, allowing more accurate and effective design strategies to be developed.
This study highlights the importance of using Big Data and machine learning in the planning and design of buildings, providing a solid basis for making informed decisions that maximise energy efficiency and occupant comfort. In addition, further research is recommended on the integration of these models with architectural design tools, such as BIM, to facilitate their application in real construction projects.
The proposed approach not only has the potential to improve the energy performance of new buildings but is also applicable to the renovation of existing buildings, which is crucial for the transition to a more sustainable and resilient built environment.

6. Results

As part of this bibliographic review, complementary experimental analyses were conducted to illustrate and validate the main findings reported in the literature. Using a simulated dataset generated through Ecotect and benchmarked with samples from the UCI Machine Learning Repository, we trained and compared multiple algorithms to reproduce the tendencies identified across prior studies. In these experiments, Random Forest and Gradient Boosting achieved the best predictive performance for both heating and cooling loads, confirming their reported superiority in the reviewed research. These results are presented not as novel experimental discoveries but as validation examples that reinforce and contextualise the insights gathered from the bibliographic synthesis.
The comparative analysis of different machine learning models revealed several important observations. Multiple linear regression and decision tree models are easy to interpret and have shown good results in simple scenarios. However, in more complex settings, ensemble models such as Random Forest and Gradient Boosting offer higher accuracy and robustness. These models are able to capture complex interactions between variables and provide more reliable predictions.
Artificial neural networks show impressive performance in predicting energy loads, especially in non-linear configurations. However, their interpretability is more limited compared to decision tree models. Support Vector Machine models also show good results but require the careful tuning of hyperparameters to avoid overfitting.
Sensitivity analysis using these models identified that relative compactness, glazing area, and orientation are the most influential variables on heating and cooling loads. These findings align with previous studies, such as those of Yang et al. (2018) [51] and Marinakis (2020) [75], who also highlighted these parameters as critical in predicting thermal performance. However, some inconsistencies exist in the reported magnitude of influence; for instance, while Marinakis (2020) [75] found orientation to be the dominant variable, Ngarambe et al. (2020) [61] reported the glazing area as more determinant under variable climatic conditions. Moreover, limited empirical evidence still constrains the validation of these models in real buildings, representing a research gap where simulations need to be complemented with on-site monitoring and user-behaviour data. This comparative insight strengthens the robustness and applicability of the present findings.
Energy efficiency in buildings is a crucial issue for sustainable development. Predicting heating and cooling loads in the design and operation phases of a building is essential to optimise energy use and improve HVAC system efficiency. In this analysis, several machine learning models have been applied to predict the thermal loads of a building based on characteristics such as relative compactness, roof area, overall height, surface area, glazing area and its distribution, orientation, and wall area.
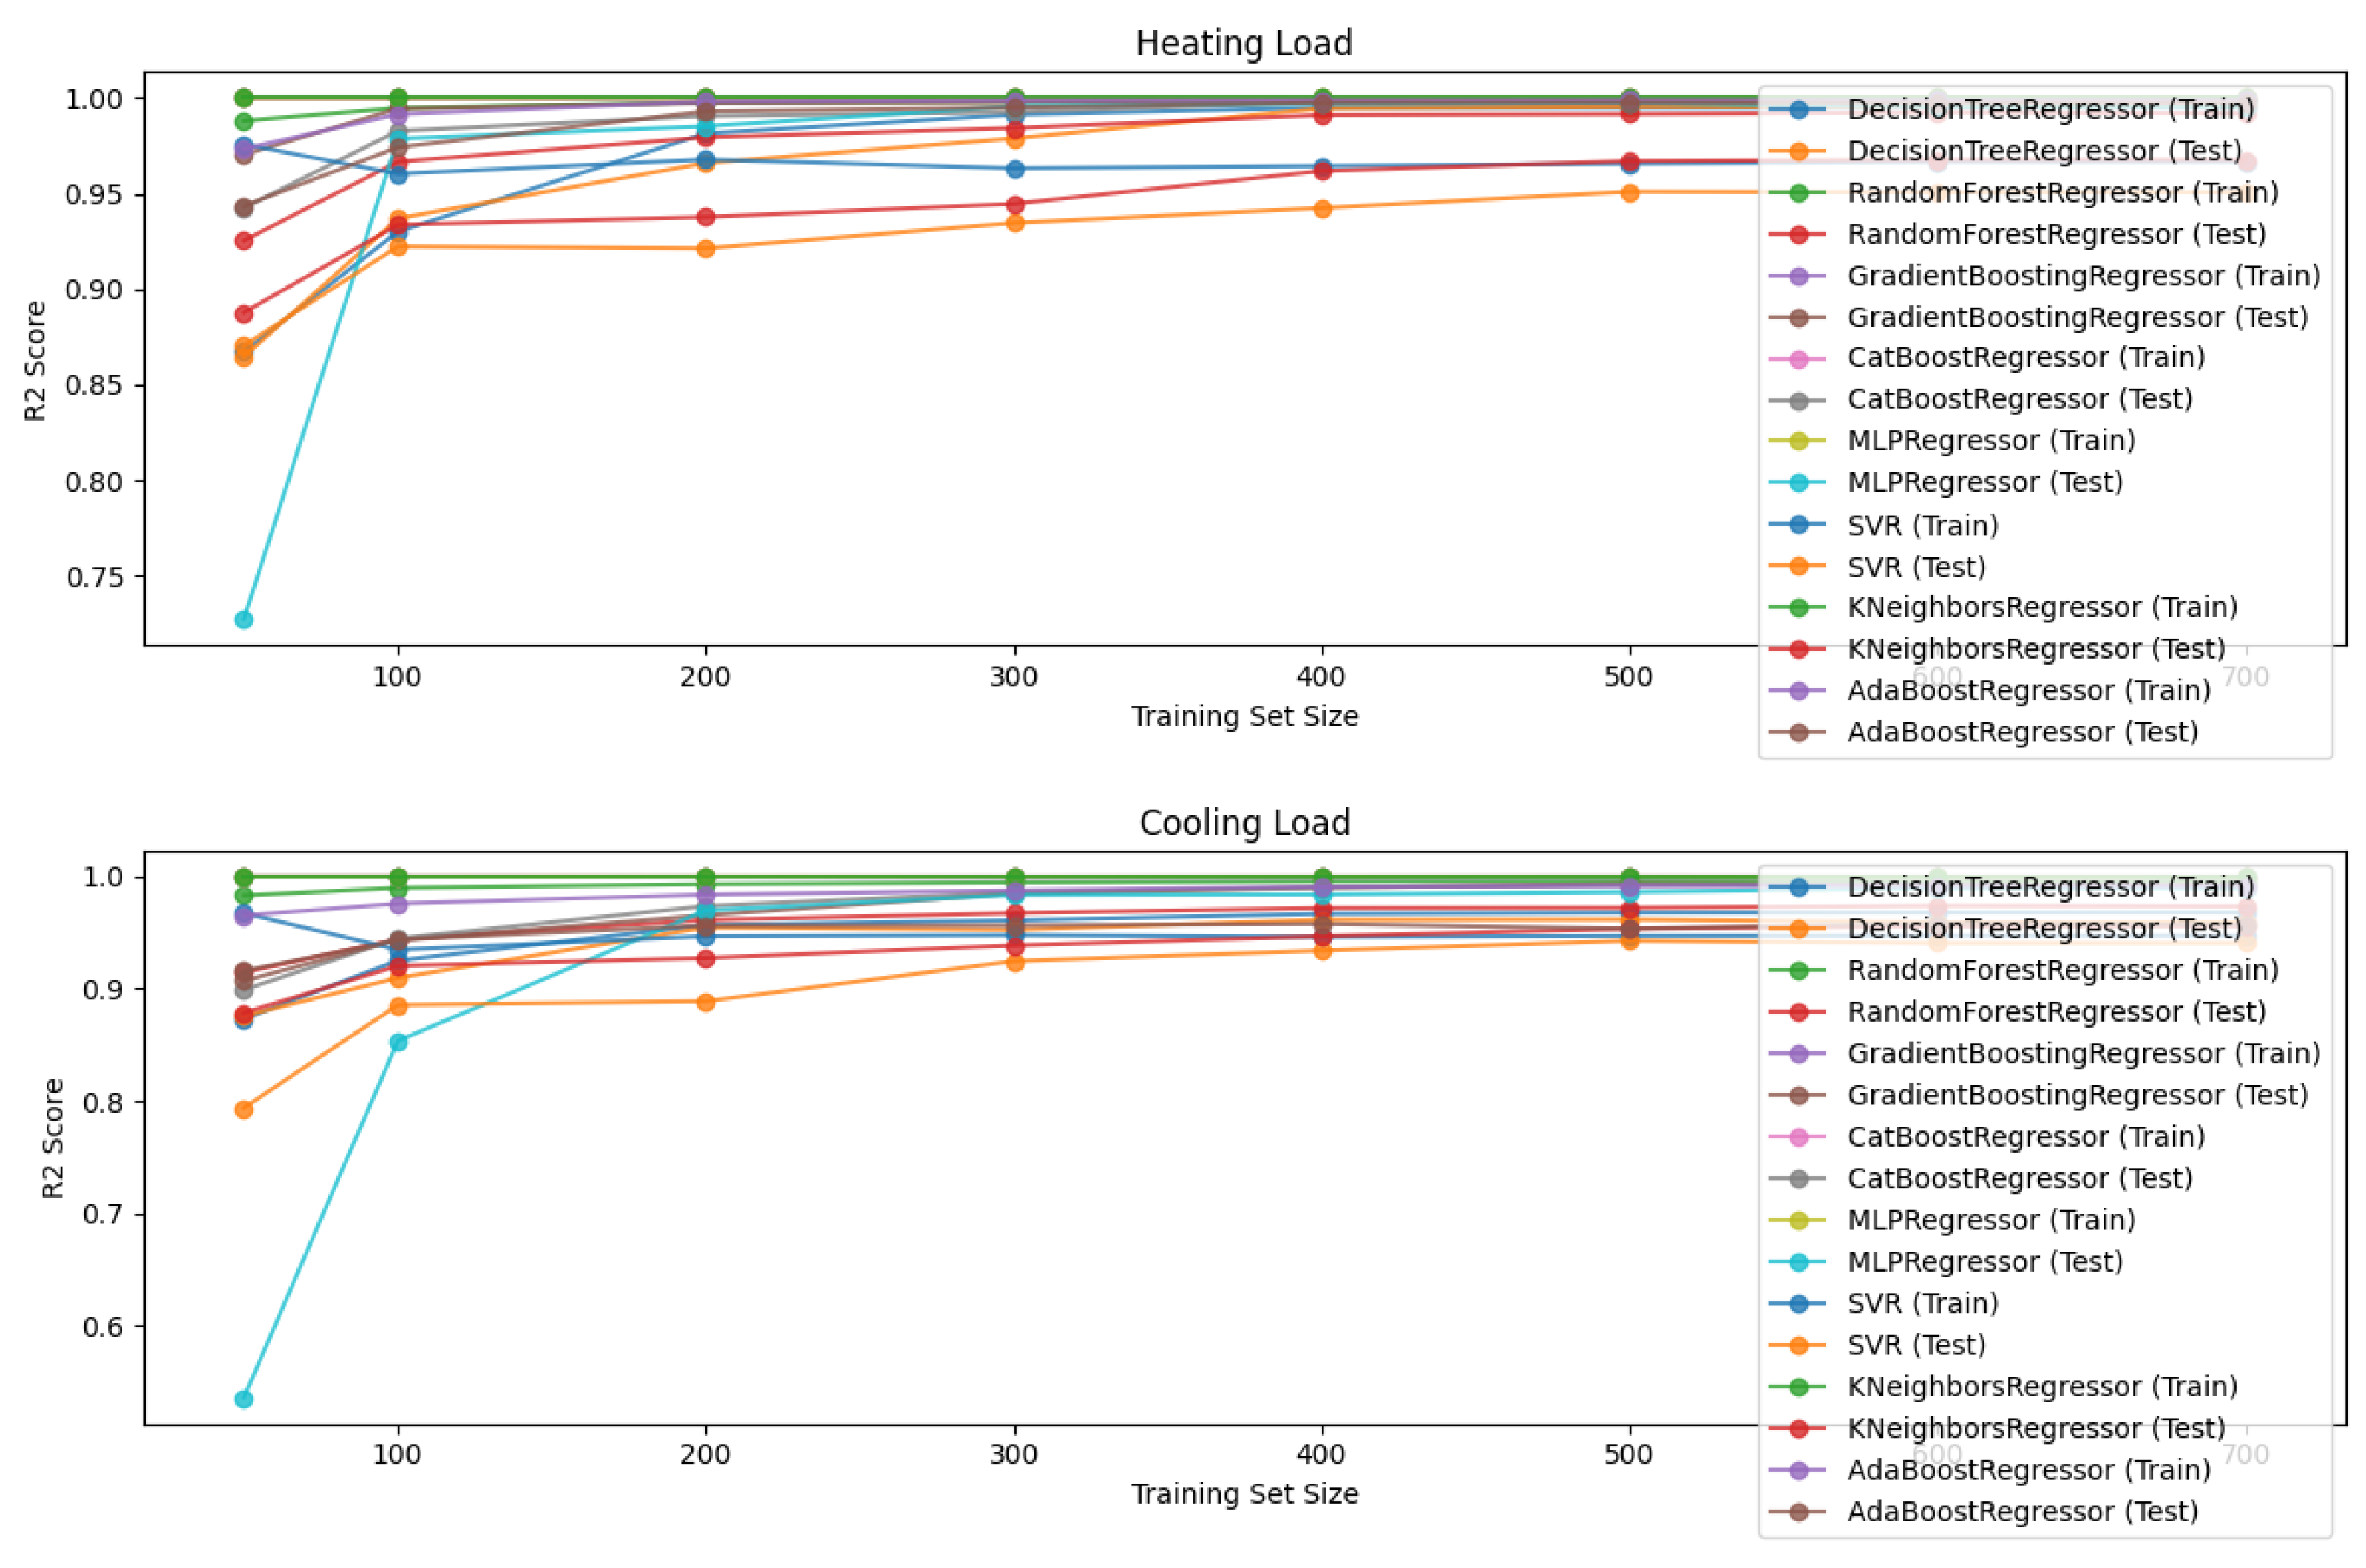
Figure 6 shows how different regression models improve their accuracy in predicting thermal loads as the size of the training set increases, helping to identify which models are most effective under different training conditions. These models include SVR, decision tree, K-Neighbours, Random Forest, MLP, AdaBoost, and Gradient Boosting. Each of these models was trained and validated using 33% of the dataset, and their accuracies were measured in terms of coefficient of determination (R2) for both heating and cooling predictions.

6.1. SVR (Support Vector Regression)

The SVR model is known for its ability to handle non-linear relationships through the use of kernel functions. In this case, the data was normalised using MinMaxScaler before training the model, which ensured that the features had the same scale. SVR showed good performance in predicting heating and cooling loads but was generally not the best compared to the other models in terms of accuracy, especially when the relationships between variables were highly non-linear or complex.
Decision Tree
The decision tree is a simple and easy-to-interpret model that divides data into subsets based on the most important features. Although powerful in terms of interpretation, it tends to overfit the training data, which was observed in the difference between the accuracy in the training and test sets. Despite this risk, the decision tree performed reasonably well, but its ability to generalise was inferior compared to other methods such as Random Forest and Gradient Boosting.

6.2. K-Neighbours

The K-Neighbours model bases its predictions on the closeness to the most similar data points. After data normalisation, K-Neighbours showed competitive performance, especially in predicting cooling load. However, its sensitivity to the choice of the number of neighbours and the scale of the features meant that its performance varied more than the other models.

6.3. Random Forest

Random Forest, an extension of the decision tree, uses multiple trees to improve accuracy and reduce overfitting. This model proved to be one of the most robust in this study, with high accuracy for both heating and cooling loads. The combination of multiple trees allowed Random Forest to better handle the variability of the data, resulting in stable and accurate predictions.

6.4. MLP (Multilayer Perceptron)

The MLP model, an artificial neural network, showed its ability to capture complex relationships between input variables and outputs. After data normalisation, MLP was trained and evaluated, showing high accuracy in both prediction tasks. Although its training is more resource and time intensive, MLP proved to be effective in scenarios where relationships are non-linear.

6.5. AdaBoost

AdaBoost combines multiple weak models to improve predictive accuracy. This model was particularly effective in avoiding overfitting, thanks to its ability to iteratively adjust the weights of misclassified examples. AdaBoost showed solid performance in predicting heating and cooling loads, although its performance was slightly lower than Random Forest and Gradient Boosting.

6.6. Gradient Boosting

Gradient Boosting is one of the most powerful methods used in this analysis. Like AdaBoost, it combines multiple models but with a focus on minimising error at each stage. Gradient Boosting showed exceptional performance, outperforming most of the other models, especially in predicting heating load. Its ability to handle complex and non-linear data made it stand out in this study.

6.7. Comparison of the Models Used

In summary, each model has its strengths and weaknesses. Random Forest and Gradient Boosting were the most robust and accurate overall, while MLP and AdaBoost also showed excellent performance, especially in more complex scenarios. On the other hand, SVR, decision tree, and K-Neighbours offered simpler and faster solutions but often with lower accuracy. The choice of the appropriate model depends largely on the specific context and characteristics of the dataset, as well as the available computational resources and the need for interpretability.

6.8. Implementing Design Strategies

Based on the results obtained, several design strategies have been proposed to optimise the energy efficiency of buildings. These strategies include the optimisation of glazing area, building orientation and the selection of thermally efficient materials. In addition, the integration of passive systems, such as green roofs and ventilated facades, has been proposed to improve thermal comfort and reduce energy demand.
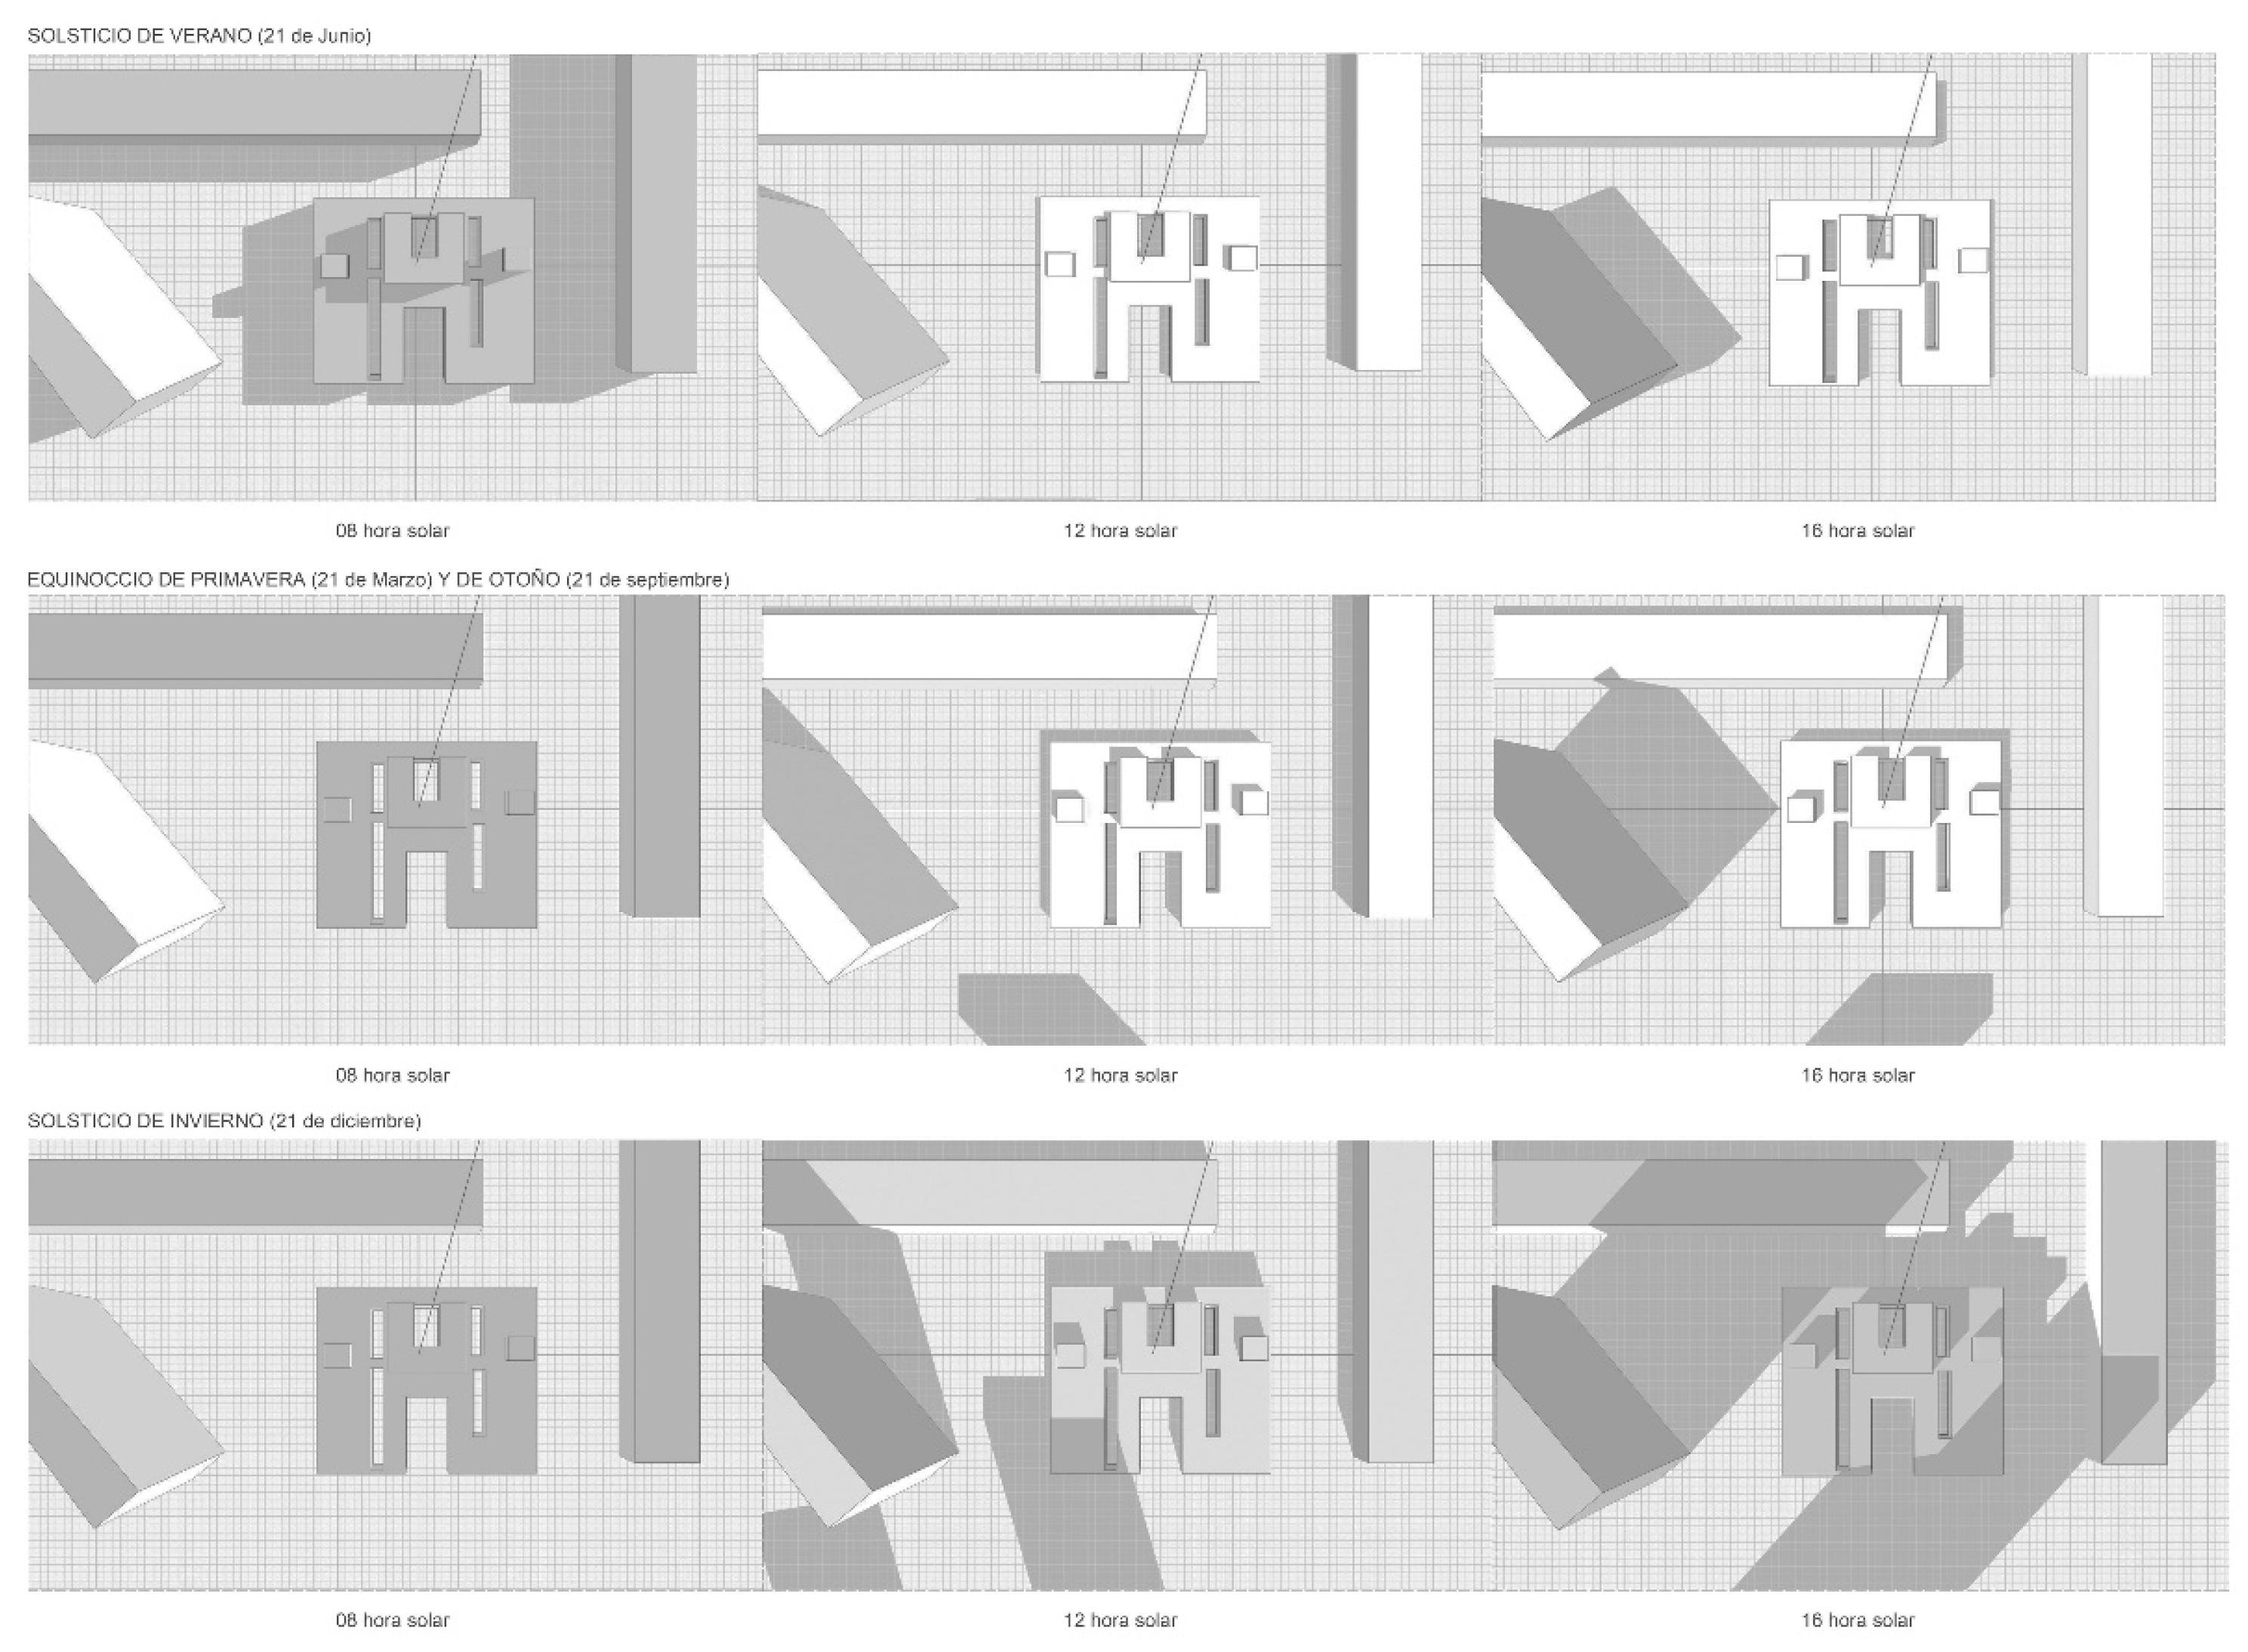
Figure 7 shows the sunlight analysis of a building. Orientation, together with the selection of thermally efficient materials, such as high performance insulation and building materials with low thermal conductivity, can significantly reduce heat losses in winter and heat gains in summer. This is particularly important in extreme climates, where the control of heat transfer is crucial to maintain thermal comfort conditions.
Optimising the glazing area involves adjusting the size and distribution of glazing according to orientation and local climate. For example, in cold climates, a higher percentage of glazing on the south façade can maximise solar gains and reduce the heating load. In hot climates, the use of low-e glazing and shading elements can minimise cooling loads.
Building orientation should be prioritised to maximise solar gain in winter and minimise cooling loads in summer. This involves orienting buildings to the south in the northern hemisphere and to the north in the southern hemisphere. In addition, the use of adjustable shading elements can help control the amount of solar radiation entering the building.
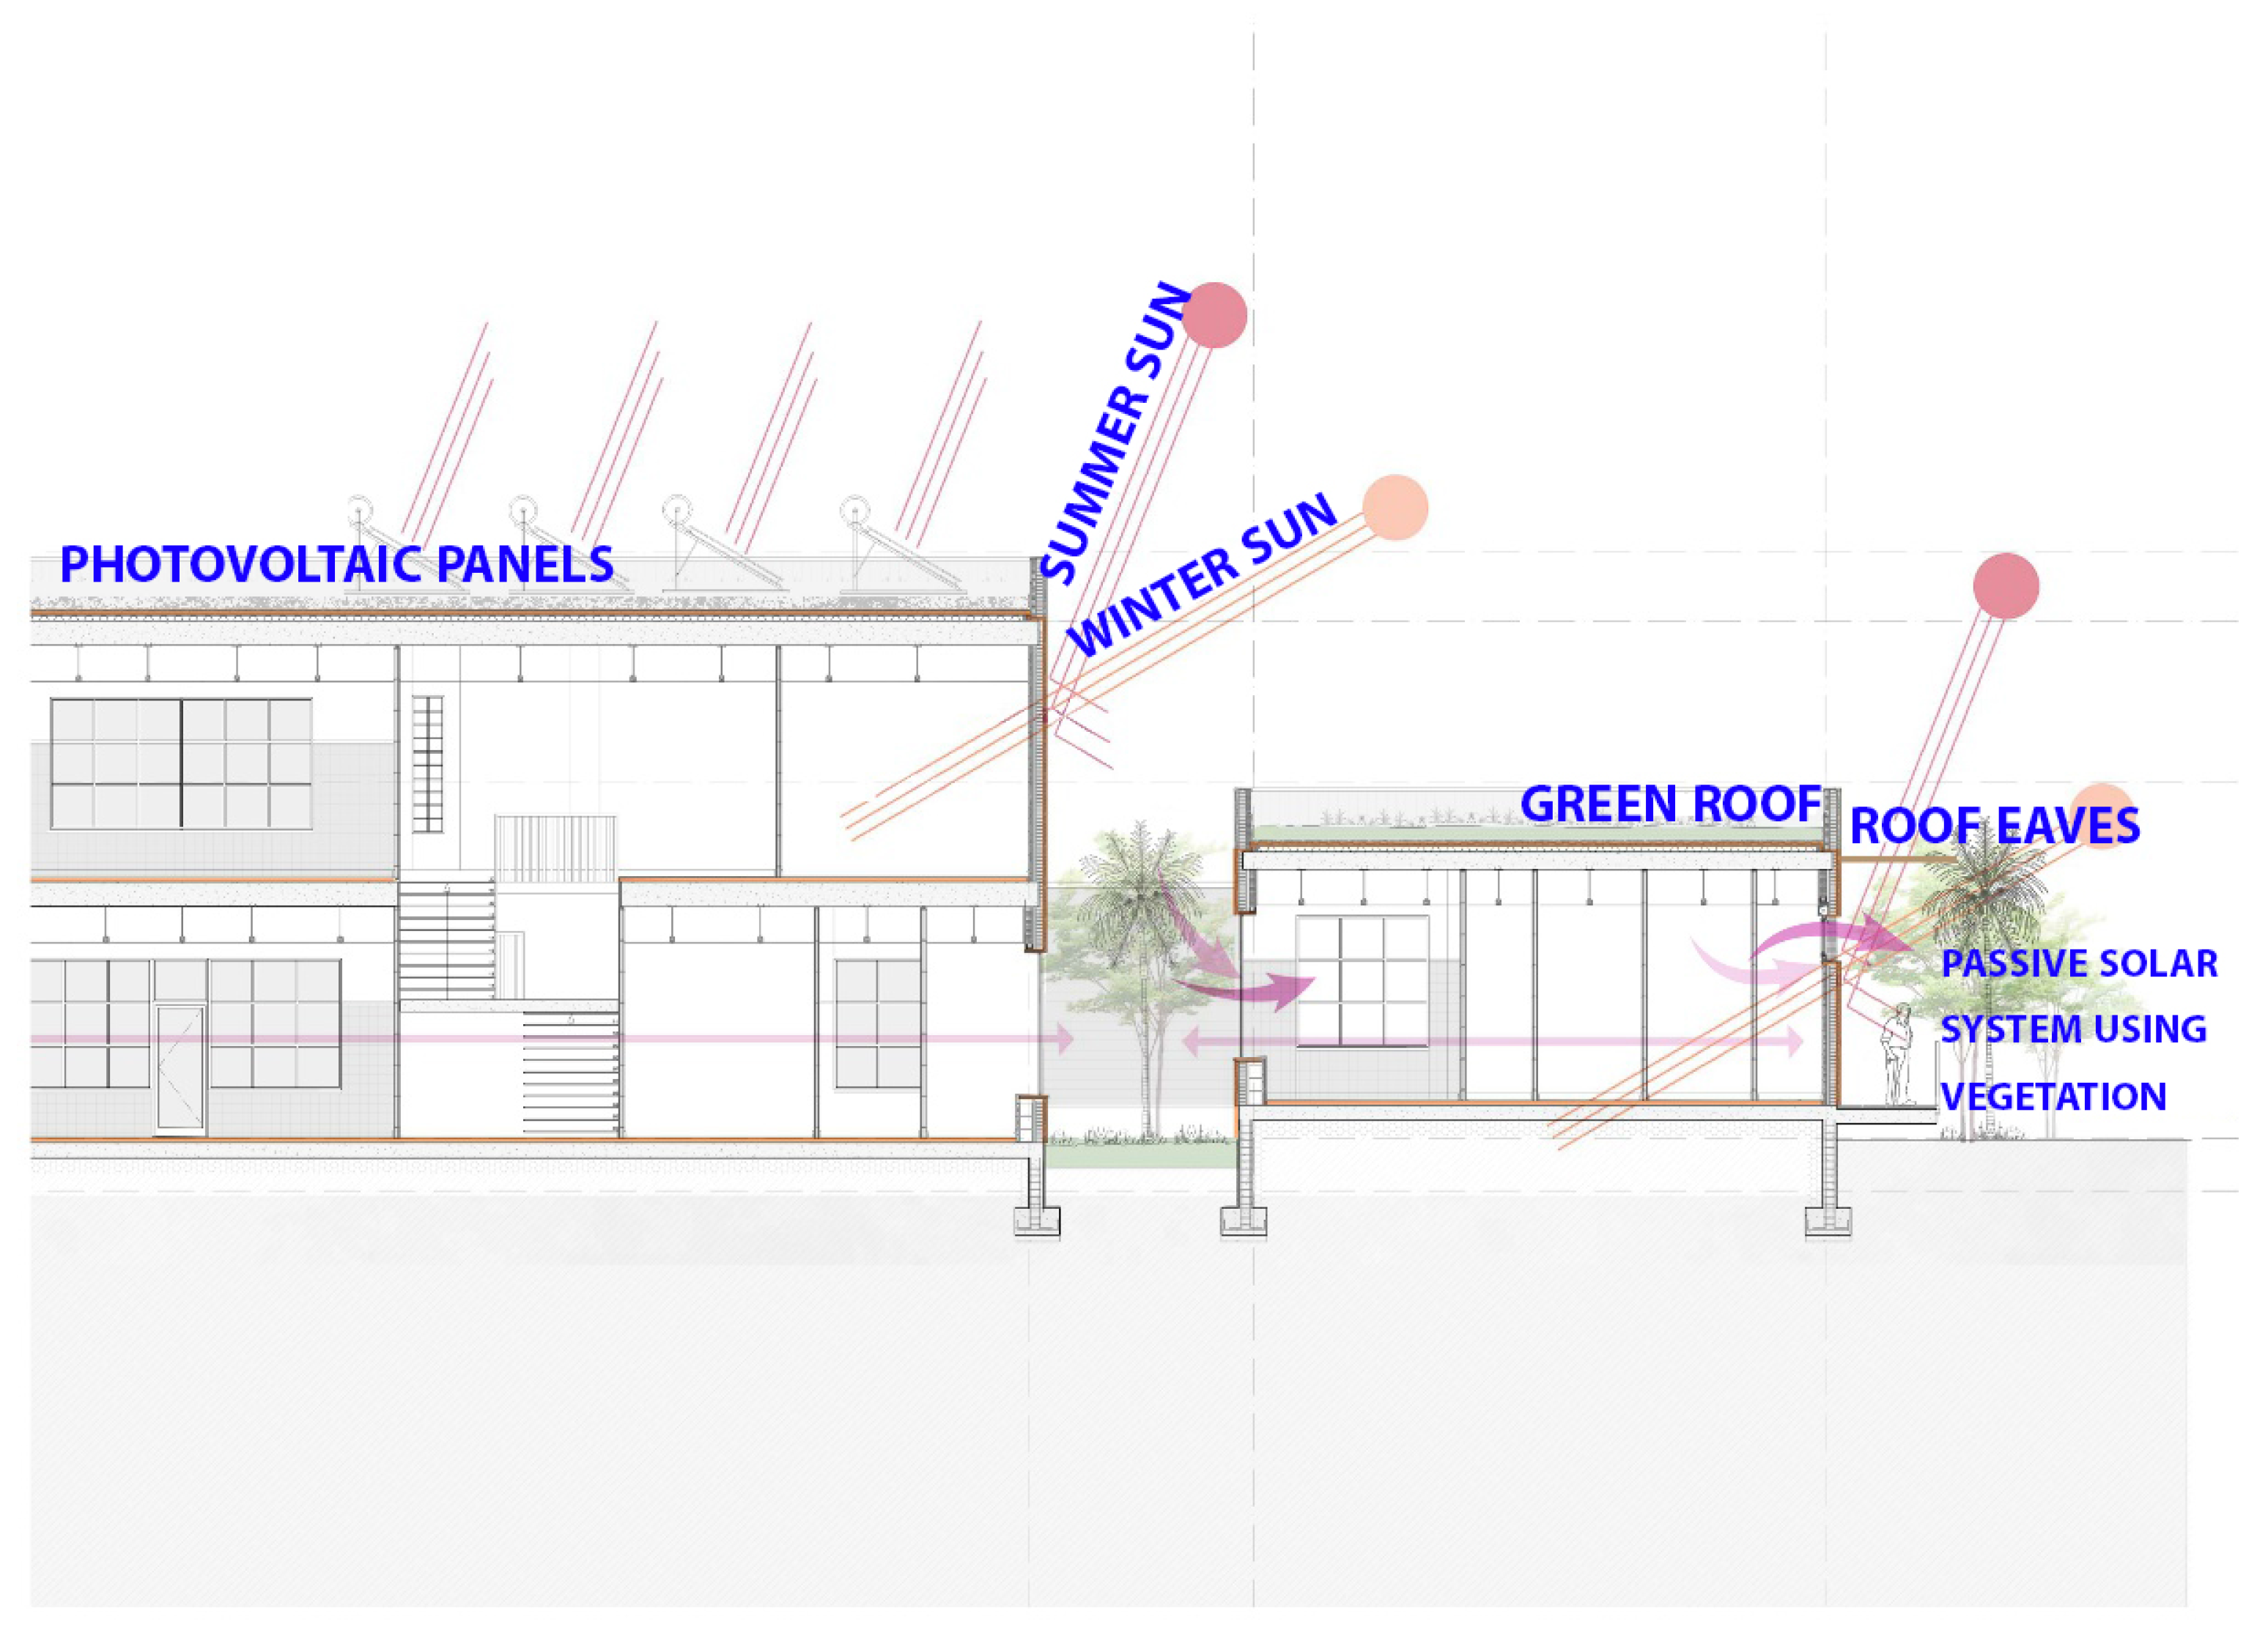
Figure 8 shows a study of the integration of bioclimatic techniques in a building. The integration of passive systems, such as green roofs and ventilated facades, can improve thermal comfort and reduce energy demand. Green roofs provide additional insulation and reduce the urban heat island effect, while ventilated facades allow better air circulation and reduce unwanted heat gains. These strategies not only improve energy efficiency but also contribute to the sustainability of the building by reducing its environmental impact.

7. Discussion

Energy efficiency in buildings is crucial, as they account for about 40% of total energy consumption. Predicting heating and cooling loads during the design and operation phases of a building is essential to optimise energy use and improve HVAC system efficiency. In this analysis, several machine learning models are applied to predict the thermal loads of a building, using characteristics such as relative compactness, roof area, overall height, surface area, glazing area and its distribution, orientation, and wall area.
The models tested include SVR, decision tree, K-Neighbours, Random Forest, MLP, AdaBoost, and Gradient Boosting. Each is trained and validated using 33% of the dataset, and their accuracies are measured by the coefficient of determination (R2) for heating and cooling predictions.
The SVR model handles non-linear relationships using kernel functions. Although data are normalised with MinMaxScaler, SVR does not always achieve the best accuracy compared to other models, especially when the relationships between variables are highly complex.
The decision tree model is simple and easy to interpret but tends to overfit the training data, showing less generalisability compared to Random Forest and Gradient Boosting.
The K-Neighbours model bases its predictions on closeness to similar data points. Although it shows competitive performance in predicting cooling load, its sensitivity to the choice of the number of neighbours and the scale of the features makes its performance less consistent.
The Random Forest model is shown to be one of the most robust models, with high accuracy in predicting both heating and cooling loads. The combination of multiple trees allows it to better handle the variability of the data.
MLP captures complex relationships between inputs and outputs, showing high accuracy in both prediction tasks, although it is more resource- and time intensive to train.
AdaBoost improves accuracy by iteratively adjusting the weights of misclassified examples, avoiding overfitting. Its performance is solid, although slightly inferior to Random Forest and Gradient Boosting.
The Gradient Boosting model stands out as one of the most powerful methods, outperforming most other models, especially in heating load prediction, due to its ability to handle complex and non-linear data. However, as noted for MLP and SVR models, one of the major challenges remains their interpretability. To address this limitation, recent research in Explainable Artificial Intelligence (XAI) has introduced techniques such as SHAP (SHapley Additive exPlanations) and LIME (Local Interpretable Model-Agnostic Explanations), which quantify the contribution of each feature to model predictions [73]. In addition, surrogate models—simplified interpretable models trained to approximate the behaviour of complex algorithms—are being increasingly used in the architectural domain to facilitate transparent decision-making. Incorporating these methods into energy prediction workflows can help architects understand the rationale behind model outputs, bridging the gap between computational intelligence and design practice.
The results obtained from Random Forest and Gradient Boosting not only confirm the statistical importance of compactness and glazing ratio but also align with well-established physical principles of building thermodynamics. Higher compactness reduces exposed surface area, thereby minimising conductive heat losses, while optimal glazing ratios balance solar gains and heat dissipation, especially in orientations with strong solar exposure. These findings correspond closely to the energy balance equations that govern heating and cooling demand in buildings.
When compared with previous studies, such as those of [51,75], the present analysis shows a similar ranking of dominant variables and comparable accuracy levels, reinforcing the consistency of these predictive behaviours across both simulated and empirical datasets. However, discrepancies in sensitivity magnitude, as observed by [61], underline the influence of climatic context and material variability.
Despite their strong predictive power, the models remain constrained by simulation-based data and lack the capacity to capture transient phenomena like occupant behaviour or envelope degradation over time. Practically, these insights support architects and energy consultants in prioritising form and envelope parameters during early design stages while recognising the need for complementary physical simulation and real-world validation to ensure robust applicability.
In summary, Random Forest and Gradient Boosting proved to be the most robust and accurate models overall. However, their relative performance must be considered in light of computational efficiency. Random Forest, due to its parallel tree structure, generally offers faster training and lower computational cost, making it suitable for applications with limited resources. In contrast, Gradient Boosting achieves slightly higher predictive accuracy but at the expense of longer training times and higher computational demand, which can be a limiting factor in large-scale or real-time applications.
Furthermore, the use of simulated datasets, while highly controlled and consistent, introduces inherent limitations in generalising results to real-world buildings. Factors such as occupant behaviour, stochastic weather variations, and construction inconsistencies are not fully captured in simulation environments. These variables can significantly influence actual energy performance, leading to deviations between predicted and observed loads. Therefore, future research should combine simulated and empirical datasets to improve model robustness and real-world applicability.
The models used in this research primarily focus on predicting operational energy demands, particularly heating and cooling loads, as key indicators of energy efficiency in buildings. However, growing attention is being directed toward embodied carbon and life cycle carbon footprint (LCCF) as essential dimensions of sustainable design [87,90]. Recent studies demonstrate that ML models originally developed for operational energy prediction can be extended or retrained using material databases, construction inventories, and Environmental Product Declarations (EPDs) to estimate embodied carbon emissions with high accuracy. For instance, ensemble and neural models can identify relationships between material composition, structural typology, and embodied carbon intensity, enabling integrated predictions that account for both operational and embodied phases. Combining these approaches allows for holistic optimisation strategies that minimise total life-cycle carbon, bridging the gap between energy efficiency and carbon neutrality.
At a broader scale, the findings of this study contribute to the ongoing integration of data-driven strategies in sustainable architectural design. Beyond the building level, recent research suggests that machine learning (ML) models can be embedded within Geographic Information Systems (GISs) and Digital Twin frameworks to support district-scale optimisation and the development of Positive Energy Districts (PEDs) [88,89]. Integrating building-level prediction models with urban energy networks enables multi-scale simulations that account for spatial, environmental, and infrastructural interdependencies. This cross-scale approach enhances decision-making for planners and policymakers by linking architectural efficiency with urban sustainability targets.

Challenges for Data-Driven Adoption in Architectural Practice

While data-driven methods demonstrate strong potential for improving energy performance prediction and optimisation, several challenges remain that hinder their widespread adoption in architectural and urban practice.
Interpretability and trust. Complex algorithms—particularly deep and ensemble models—often function as “black boxes”, limiting designers’ ability to understand the reasoning behind model outputs. This lack of transparency can reduce confidence in AI-supported decision-making. Integrating Explainable Artificial Intelligence (XAI) techniques such as SHAP, LIME, or surrogate rule-based models (as discussed earlier) can improve interpretability and trust, but these methods require standardisation and domain-specific adaptation.
Data privacy and quality. Many data-driven workflows rely on sensor data, building management systems (BMS), and IoT networks that can include sensitive information related to occupancy, energy use, and spatial patterns. Ensuring anonymisation, secure storage, and ethical data governance is critical for compliance with privacy regulations. In addition, inconsistencies and biases in datasets—stemming from missing data, simulation assumptions, or measurement errors—can propagate through models, undermining predictive accuracy.
Model transferability. Another key limitation lies in the limited generalisation of models across different climates, building typologies, and cultural contexts. Models trained on specific datasets may lose accuracy when applied to other regions or design types due to variations in climatic inputs, construction practices, or occupant behaviour. Approaches such as transfer learning, domain adaptation, and hybrid ML–physics models have been identified as promising solutions to enhance cross-context reliability [90].
Addressing these challenges will be essential for the reliable and ethical implementation of AI-driven tools in sustainable architectural design. Future research should therefore prioritise transparent modelling frameworks, data governance strategies, and the development of adaptive algorithms that can operate across diverse design and environmental conditions.

8. Conclusions

This work explores how data-driven methods can enhance energy efficiency and sustainability in buildings, directly addressing the research question on how architectural parameters—such as compactness, orientation, and glazing—can be optimised using machine learning models. The main findings reveal that ensemble algorithms like Random Forest and Gradient Boosting achieve the highest predictive accuracy, confirming their suitability for early design decision-making.
Furthermore, this study contributes to the existing literature by integrating simulation-based data with machine learning approaches, highlighting the importance of predictive analytics in sustainable design. The strengths of the reviewed works lie in their methodological diversity and increasing precision in energy modelling, while their main limitations include the scarcity of empirical validations and the under-representation of social and economic sustainability dimensions.
In conclusion, this review underscores the growing potential of data-driven approaches to transform architectural practice. However, further interdisciplinary research is required to bridge current gaps and extend these methodologies to real-world applications and integrated sustainability frameworks.
This systematic review synthesised the evolution of Big Data and machine learning (ML) applications for building energy optimisation between 2010 and 2025. The analysis revealed clear progress in predictive accuracy, automation, and early-stage design integration but also exposed persistent gaps in data quality, generalisability, and model interpretability.
Identified research gaps. The literature indicates insufficient exploration of embodied carbon modelling, cross-climate validation, and hybrid ML–physics frameworks that integrate domain knowledge with data-driven learning. Furthermore, empirical validations remain scarce, and the integration of social and economic sustainability dimensions into energy models continues to be limited.
Opportunities for future research. Emerging directions include the following:
  • The coupling of ML-based prediction with Digital Twin environments, allowing real-time synchronisation between virtual and built models for adaptive energy control;
  • The use of reinforcement learning (RL) to develop self-learning HVAC and lighting systems capable of continuous optimisation based on occupant behaviour and environmental feedback;
  • The implementation of real-time optimisation in Building Energy Management Systems (BEMS), enhancing system responsiveness and predictive maintenance capabilities;
  • The advancement of transfer learning and domain adaptation techniques to improve model scalability across diverse climates and building typologies.
These perspectives position data-driven methodologies not merely as analytical tools but as a foundation for the next generation of intelligent, responsive, and sustainable architectural ecosystems.

Author Contributions

Conceptualization, C.R.-M.; Methodology, C.R.-M. and M.D.A.-M.; Software, M.S.-T.; Validation, M.S.-T. and M.D.A.-M.; Formal analysis, M.S.-T.; Investigation, C.R.-M.; Resources, P.S.-H.; Data curation, P.S.-H.; Writing—original draft, C.R.-M.; Project administration, C.R.-M. All authors have read and agreed to the published version of the manuscript.

Funding

This work was supported by the project “Advances in the modeling and characterization of sustainability in architecture with AI” (GRE 2022, University of Alicante, 2024/00083) and by the project “AIRES6D: Advances in air renewal techniques in buildings, 6D consideration”, within the framework of the Grants for Emerging Research Groups of the Generalitat Valenciana (CIGE/2024/202).

Data Availability Statement

The data presented in this study are available on request from the corresponding author.

Conflicts of Interest

The authors declare no conflicts of interest.

Abbreviations

Term/AbbreviationDefinition
Compactness (C)Ratio between the building’s external surface area and its volume. Lower compactness typically indicates reduced heat loss potential.
Glazing Ratio (GR)Percentage of the façade surface occupied by windows or transparent elements, influencing daylight and thermal performance.
Data-Driven Methods (DDMs)Analytical approaches that rely on empirical data and statistical or machine learning models to predict or optimise building performance.
ML (machine learning)Subfield of artificial intelligence involving algorithms that learn from data to make predictions or decisions without explicit programming.
LCCF (life cycle carbon footprint)Total carbon emissions associated with a building throughout its life cycle, including embodied and operational phases.
BIM (building information modelling)Digital process integrating 3D models and data for design, construction, and management of buildings.
IoT (Internet of Things)Network of interconnected devices that collect and exchange data to enable real-time monitoring and control.

References

  1. Wolf, C.D.; Pomponi, F.; Moncaster, A. Measuring embodied carbon dioxide equivalent of buildings: A review and critique of current industry practice. Energy Build. 2020, 224, 110260. [Google Scholar] [CrossRef]
  2. Dounis, A.I.; Tiropanis, P.; Argiriou, A.; Diamantis, J. Building automation and control systems: A review of smart technologies. Renew. Sustain. Energy Rev. 2011, 15, 4275–4286. [Google Scholar]
  3. Cabeza, L.F.; Gracia, A.D.; Pisello, A.L. Integration of renewable technologies in historical and heritage buildings: A review. Energy Build. 2018, 177, 96–111. [Google Scholar] [CrossRef]
  4. Monge-Barrio, A.; Sánchez-Ostiz, A. Passive strategies for thermal comfort in buildings: A review. Renew. Sustain. Energy Rev. 2022, 128. [Google Scholar]
  5. Santamouris, M. On the energy impact of urban heat island and global warming on buildings. Energy Build. 2020, 207, 109482. [Google Scholar] [CrossRef]
  6. Häkkinen, T.; Belloni, K. Barriers and drivers for sustainable building. Build. Res. Inf. 2011, 39, 239–255. [Google Scholar] [CrossRef]
  7. Marrasso, E.; Cusano, G.; Salzano, E.; Santarelli, M. Economic and environmental benefits of energy-efficient building renovation. Energy Procedia 2016, 101, 1226–1233. [Google Scholar]
  8. Cabeza, L.F.; Rincón, L.; Vilariño, V.; Pérez, G.; Castell, A. Life cycle assessment (LCA) and life cycle energy analysis (LCEA) of buildings and the building sector: A review. Renew. Sustain. Energy Rev. 2014, 29, 394–416. [Google Scholar] [CrossRef]
  9. Pomponi, F.; Moncaster, A. Circular economy for the built environment: A research framework. J. Clean. Prod. 2017, 143, 710–718. [Google Scholar] [CrossRef]
  10. Mofidi, S.; Akbari, H. Intelligent building design: Using machine learning and big data. Energy Build. 2020, 215, 109893. [Google Scholar]
  11. Villa-Arrieta, M.; Sumper, A. Building retrofitting: Analysis of energy and environmental performance. Energy Procedia 2018, 155, 77–82. [Google Scholar]
  12. Aznar, F.; Echarri, V.; Rizo-Maestre, C.; Rizo, R. Multiagent systems in building management and control: A review. Renew. Sustain. Energy Rev. 2018, 89, 585–598. [Google Scholar]
  13. Mokhtar, A.; Liu, J.; Howe, W. Intelligent building systems: An overview and case studies. Energy Build. 2014, 72, 10–18. [Google Scholar]
  14. European Commission. The European Green Deal. Eur. Comm. 2019. [Google Scholar]
  15. Yan, Y.; Wu, J.; Ji, X.; Wu, G.; Wang, L. Carbon footprint analysis of urban buildings: A review. J. Clean. Prod. 2019, 224, 783–790. [Google Scholar]
  16. Rizo-Maestre, C.; Echarri-Iribarren, V. Radon concentration in buildings: Health impacts and design implications. Build. Environ. 2020, 176, 106891. [Google Scholar]
  17. Zhao, H.X.; Magoulès, F. A review on the prediction of building energy consumption. Renew. Sustain. Energy Rev. 2012, 16, 3586–3592. [Google Scholar] [CrossRef]
  18. Salamone, F.; Masera, G.; Fiorito, F.; Zanghirella, F. Thermal comfort and energy savings in buildings: A review. Renew. Sustain. Energy Rev. 2017, 74, 19–29. [Google Scholar]
  19. Wargocki, P.; Frontczak, M.; Schiavon, S. Indoor air quality and comfort: Review of current standards and guidelines. Build. Environ. 2020, 173, 106744. [Google Scholar]
  20. Echarri-Iribarren, V.; Rizo-Maestre, C.; Echarri-Iribarren, F. Deep learning for thermal behavior modeling in building façades. Energy Build. 2018, 185, 65–77. [Google Scholar]
  21. Echarri-Iribarren, V.; Echarri-Iribarren, F.; Rizo-Maestre, C. Construction envelope life cycle cost assessment (LCCA-e): Methodology and implementation. Energy Build. 2019, 198, 376–389. [Google Scholar]
  22. Rizo-Maestre, C.; González-Avilés, A.; Galiano-Garrigós, A.; Andújar-Montoya, M.D.; García, J.A. UAV + BIM: Incorporation of Photogrammetric Techniques in Architectural Projects with Building Information Modeling Versus Classical Work Processes. Remote Sens. 2020, 12, 2329. [Google Scholar] [CrossRef]
  23. Boarin, P.; Martinez-Molina, A.; Juan-Ferruses, I. Understanding students’ perception of sustainability in architecture education: A comparison among universities in three different continents. J. Clean. Prod. 2020, 248, 119237. [Google Scholar] [CrossRef]
  24. Passoni, C.; Marini, A.; Belleri, A.; Menna, C. Redefining the concept of sustainable renovation of buildings: State of the art and an LCT-based design framework. Sustain. Cities Soc. 2021, 64, 102519. [Google Scholar] [CrossRef]
  25. Aqilah, N.; Rijal, H.; Zaki, S. A Review of Thermal Comfort in Residential Buildings: Comfort Threads and Energy Saving Potential. Energies 2022, 15, 9012. [Google Scholar] [CrossRef]
  26. Berggren, K.; Xia, Q.; Likharev, K.K.; Strukov, D.B.; Jiang, H.; Mikolajick, T.; Querlioz, D.; Salinga, M.; Erickson, J.R.; Pi, S. Roadmap on emerging hardware and technology for machine learning. Nanotechnology 2020, 32, 012002. [Google Scholar] [CrossRef] [PubMed]
  27. Gómez-Santos, F.; Pereira, L.; Zhang, M. Data-driven fault detection and predictive maintenance in HVAC systems using hybrid deep learning models. Energy Rep. 2025, 11, 2217–2232. [Google Scholar]
  28. Chatterjee, D.; Huang, J. Physics-informed neural networks for real-time building energy management. Appl. Energy 2025, 358, 122541. [Google Scholar]
  29. Singh, P.; Rahman, S. Transfer learning in building energy prediction: Cross-climate adaptation and model generalisation. Energy Build. 2024, 315, 114925. [Google Scholar]
  30. Blondeau, P.; Sperandio, M.; Allard, F. Night ventilation for building cooling in summer. Sol. Energy 1997, 61, 327–335. [Google Scholar] [CrossRef]
  31. Wright, J. Introducing sustainability into the architecture curriculum in the United States. Int. J. Sustain. High. Educ. 2003, 4, 100–105. [Google Scholar] [CrossRef]
  32. Altomonte, S.; Rutherford, P.; Wilson, R. Mapping the Way Forward: Education for Sustainability in Architecture and Urban Design. Corp. Soc. Responsib. Environ. Manag. 2014, 21, 143–154. [Google Scholar] [CrossRef]
  33. Dimitroulopoulou, C. Ventilation in European dwellings: A review. Build. Environ. 2012, 47, 109–125. [Google Scholar] [CrossRef]
  34. Schulze, T.; Eicker, U. Controlled natural ventilation for energy efficient buildings. Energy Build. 2013, 56, 221–232. [Google Scholar] [CrossRef]
  35. Weerasuriya, A.; Zhang, X.; Gan, V.; Tan, Y. A holistic framework to utilize natural ventilation to optimize energy performance of residential high-rise buildings. Build. Environ. 2019, 153, 218–232. [Google Scholar] [CrossRef]
  36. Solgi, E.; Hamedani, Z.; Fernando, R.; Skates, H.; Orji, N. A literature review of night ventilation strategies in buildings. Energy Build. 2018, 173, 337–352. [Google Scholar] [CrossRef]
  37. Graça, G.; Linden, P. Ten questions about natural ventilation of non-domestic buildings. Build. Environ. 2016, 107, 263–273. [Google Scholar] [CrossRef]
  38. Omrani, S.; Garcia-Hansen, V.; Capra, B.; Drogemuller, R. Natural ventilation in multi-storey buildings: Design process and review of evaluation tools. Build. Environ. 2017, 116, 182–194. [Google Scholar] [CrossRef]
  39. Rodrigues, M.; Santos, M.; Gomes, M.; Duarte, R. Impact of Natural Ventilation on the Thermal and Energy Performance of Buildings in a Mediterranean Climate. Buildings 2019, 9, 123. [Google Scholar] [CrossRef]
  40. Guyot, G.; Sherman, M.; Walker, I. Smart ventilation energy and indoor air quality performance in residential buildings: A review. Energy Build. 2017, 165, 416–430. [Google Scholar] [CrossRef]
  41. Akadiri, P.; Chinyio, E.; Olomolaiye, P. Design of A Sustainable Building: A Conceptual Framework for Implementing Sustainability in the Building Sector. Buildings 2012, 2, 126–152. [Google Scholar] [CrossRef]
  42. Berardi, U. Clarifying the new interpretations of the concept of sustainable building. Sustain. Cities Soc. 2013, 8, 72–78. [Google Scholar] [CrossRef]
  43. Lami, I.; Mecca, B. Assessing Social Sustainability for Achieving Sustainable Architecture. Sustainability 2020, 13, 142. [Google Scholar] [CrossRef]
  44. Murtagh, N.; Roberts, A.; Hind, R. The relationship between motivations of architectural designers and environmentally sustainable construction design. Constr. Manag. Econ. 2016, 34, 61–75. [Google Scholar] [CrossRef]
  45. Martek, I.; Hosseini, M.; Shrestha, A.; Zavadskas, E.; Seaton, S. The Sustainability Narrative in Contemporary Architecture: Falling Short of Building a Sustainable Future. Sustainability 2018, 10, 981. [Google Scholar] [CrossRef]
  46. Schwartz, Y.; Raslan, R.; Mumovic, D. The life cycle carbon footprint of refurbished and new buildings—A systematic review of case studies. Renew. Sustain. Energy Rev. 2018, 81, 231–241. [Google Scholar] [CrossRef]
  47. Peng, C. Calculation of a building’s life cycle carbon emissions based on Ecotect and building information modeling. J. Clean. Prod. 2016, 112, 453–465. [Google Scholar] [CrossRef]
  48. Pal, S.; Takano, A.; Alanne, K.; Sirén, K. A life cycle approach to optimizing carbon footprint and costs of a residential building. Build. Environ. 2017, 123, 146–162. [Google Scholar] [CrossRef]
  49. Nadoushani, Z.; Akbarnezhad, A. Effects of structural system on the life cycle carbon footprint of buildings. Energy Build. 2015, 102, 337–346. [Google Scholar] [CrossRef]
  50. Fenner, A.; Kibert, C.; Woo, J.; Morque, S.; Razkenari, M.; Hakim, H.; Lü, X. The carbon footprint of buildings: A review of methodologies and applications. Renew. Sustain. Energy Rev. 2018, 94, 1142–1152. [Google Scholar] [CrossRef]
  51. Yang, X.; Hu, M.; Wu, J.; Zhao, B. Building-information-modeling enabled life cycle assessment, a case study on carbon footprint accounting for a residential building in China. J. Clean. Prod. 2018, 183, 729–743. [Google Scholar] [CrossRef]
  52. Minunno, R.; O’Grady, T.; Morrison, G.; Gruner, R. Investigating the embodied energy and carbon of buildings: A systematic literature review and meta-analysis of life cycle assessments. Renew. Sustain. Energy Rev. 2021, 143, 110935. [Google Scholar] [CrossRef]
  53. Rinne, R.; Ilgın, H.; Karjalainen, M. Comparative Study on Life-Cycle Assessment and Carbon Footprint of Hybrid, Concrete and Timber Apartment Buildings in Finland. Int. J. Environ. Res. Public Health 2022, 19, 774. [Google Scholar] [CrossRef] [PubMed]
  54. Trovato, M.; Nocera, F.; Giuffrida, S. Life-Cycle Assessment and Monetary Measurements for the Carbon Footprint Reduction of Public Buildings. Sustainability 2020, 12, 3460. [Google Scholar] [CrossRef]
  55. Khan, A.; Sepasgozar, S.; Liu, T.; Yu, R. Integration of BIM and Immersive Technologies for AEC: A Scientometric-SWOT Analysis and Critical Content Review. Buildings 2021, 11, 126. [Google Scholar] [CrossRef]
  56. Safikhani, S.; Keller, S.; Schweiger, G.; Pirker, J. Immersive virtual reality for extending the potential of building information modelling in architecture, engineering, and construction sector: Systematic review. Int. J. Digit. Earth 2022, 15, 503–526. [Google Scholar] [CrossRef]
  57. Banijamali, A.; Pakanen, O.; Kuvaja, P.; Oivo, M. Software architectures of the convergence of cloud computing and the Internet of Things: A systematic literature review. Inf. Softw. Technol. 2020, 122, 106271. [Google Scholar] [CrossRef]
  58. Ilin, I.; Levina, A.; Dubgorn, A.; Abran, A. Investment Models for Enterprise Architecture (EA) and IT Architecture Projects within the Open Innovation Concept. J. Open Innov. Technol. Mark. Complex. 2021. [Google Scholar] [CrossRef]
  59. Boje, C.; Guerriero, A.; Kubicki, S.; Rezgui, Y. Towards a semantic Construction Digital Twin: Directions for future research. Autom. Constr. 2020, 114, 103179. [Google Scholar] [CrossRef]
  60. Ferko, E.; Bucaioni, A.; Behnam, M. Architecting Digital Twins. IEEE Access 2022, 10, 50335–50350. [Google Scholar] [CrossRef]
  61. Ngarambe, J.; Yun, G.; Santamouris, M. The use of artificial intelligence (AI) methods in the prediction of thermal comfort in buildings: Energy implications of AI-based thermal comfort controls. Energy Build. 2020, 211, 109807. [Google Scholar] [CrossRef]
  62. Tokazhanov, G.; Tleuken, A.; Guney, M.; Turkyilmaz, A.; Karaca, F. How is COVID-19 Experience Transforming Sustainability Requirements of Residential Buildings? A Review. Sustainability 2020, 12, 8732. [Google Scholar] [CrossRef]
  63. Ganesh, G.; Sinha, S.; Verma, T.; Dewangan, S. Investigation of indoor environment quality and factors affecting human comfort: A critical review. Build. Environ. 2021, 204, 108146. [Google Scholar] [CrossRef]
  64. Willems, S.; Saelens, D.; Heylighen, A. Comfort requirements versus lived experience: Combining different research approaches to indoor environmental quality. Archit. Sci. Rev. 2020, 63, 316–324. [Google Scholar] [CrossRef]
  65. Meena, C.; Kumar, A.; Jain, S.; Rehman, A.; Mishra, S.; Sharma, N.; Bajaj, M.; Shafiq, M.; Eldin, E. Innovation in Green Building Sector for Sustainable Future. Energies 2022, 15, 6631. [Google Scholar] [CrossRef]
  66. Yıldız, S.; Kıvrak, S.; Gültekin, A.; Arslan, G. Built environment design - social sustainability relation in urban renewal. Sustain. Cities Soc. 2020, 60, 102173. [Google Scholar] [CrossRef]
  67. Al-Mashaqbeh, H.; Al-Qudah, A.M.; Al-Zboon, M. Big Data analytical framework for solar energy receiver analysis using evolutionary computing approach. Renew. Energy 2024, 225, 120315. [Google Scholar]
  68. Fernández, A.; Barros, J. Big Data and predictive analytics in building management: Real-time optimisation and occupant-centric control. Smart Sustain. Built Environ. 2024, 13, 52–68. [Google Scholar]
  69. Zhang, Y.; Huang, L.; Chen, W. Deep reinforcement learning for early-stage energy-efficient architectural design. Energy Build. 2024, 310, 113892. [Google Scholar]
  70. Liang, C.; Zhou, T. Reinforcement learning for adaptive HVAC control: Multi-agent approaches and real-world deployment. Autom. Constr. 2025, 165, 105078. [Google Scholar]
  71. Lee, J.; Kim, S. Hybrid AI-driven HVAC control using IoT and cloud computing for adaptive energy management. Autom. Constr. 2025, 163, 105048. [Google Scholar]
  72. Martínez-García, R.; López-Pérez, A.; Duarte, P. Ensemble machine learning for large-scale urban retrofit planning: Accuracy, scalability, and uncertainty analysis. Sustain. Cities Soc. 2025, 110, 105412. [Google Scholar]
  73. García-Torres, M.; Li, F.; Andersson, K. Explainable machine learning in building energy prediction: Challenges and opportunities. Renew. Sustain. Energy Rev. 2024, 193, 114792. [Google Scholar]
  74. Pääkkönen, P.; Pakkala, D. Extending reference architecture of big data systems towards machine learning in edge computing environments. J. Big Data 2020, 7. [Google Scholar] [CrossRef]
  75. Marinakis, V. Big Data for Energy Management and Energy-Efficient Buildings. Energies 2020, 13, 1555. [Google Scholar] [CrossRef]
  76. Wu, N.; Xie, Y. A Survey of Machine Learning for Computer Architecture and Systems. Acm Comput. Surv. (CSUR) 2021, 55, 1–39. [Google Scholar] [CrossRef] [PubMed]
  77. Cravero, A.; Pardo, S.; Sepúlveda, S.; Muñoz, L. Challenges to Use Machine Learning in Agricultural Big Data: A Systematic Literature Review. Agronomy 2022, 12, 748. [Google Scholar] [CrossRef]
  78. Milojevic-Dupont, N.; Creutzig, F. Machine learning for geographically differentiated climate change mitigation in urban areas. Sustain. Cities Soc. 2021, 64, 102526. [Google Scholar] [CrossRef]
  79. Han, J.; Miao, J.; Shi, Y.; Miao, Z. Can the semi-urbanization of population promote or inhibit the improvement of energy efficiency in China? Sustain. Prod. Consum. 2021, 26, 921–932. [Google Scholar] [CrossRef]
  80. Lv, Y.; Chen, W.; Cheng, J. Effects of urbanization on energy efficiency in China: New evidence from short run and long run efficiency models. Energy Policy 2020, 147, 111858. [Google Scholar] [CrossRef]
  81. Sztubecka, M.; Skiba, M.; Mrówczyńska, M.; Bazan-Krzywoszanska, A. An Innovative Decision Support System to Improve the Energy Efficiency of Buildings in Urban Areas. Remote Sens. 2020, 12, 259. [Google Scholar] [CrossRef]
  82. Lu, Y.; Li, P.; Lee, Y.; Song, X. An integrated decision-making framework for existing building retrofits based on energy simulation and cost-benefit analysis. J. Build. Eng. 2021, 43, 103200. [Google Scholar] [CrossRef]
  83. Wang, W.; Shu, J. Urban Renewal Can Mitigate Urban Heat Islands. Geophys. Res. Lett. 2020, 47, e2019GL085948. [Google Scholar] [CrossRef]
  84. Asarpota, K.; Nadin, V. Energy Strategies, the Urban Dimension, and Spatial Planning. Energies 2020, 13, 3642. [Google Scholar] [CrossRef]
  85. Blumberga, A.; Vanaga, R.; Freimanis, R.; Blumberga, D.; Antužs, J.; Krastiņš, A.; Jankovskis, I.; Bondars, E.; Treija, S. Transition from traditional historic urban block to positive energy block. Energy 2020, 202, 117485. [Google Scholar] [CrossRef]
  86. Erba, S.; Pagliano, L. Combining Sufficiency, Efficiency and Flexibility to Achieve Positive Energy Districts Targets. Energies 2021. [Google Scholar] [CrossRef]
  87. Chong, W.; Li, Z.; Schlanbusch, R.D. Machine learning-based prediction of embodied carbon in building materials and systems. J. Clean. Prod. 2024, 455, 142671. [Google Scholar]
  88. Rossi, M.; Conti, L.; Papadopoulos, S. Digital twins and machine learning for Positive Energy Districts: Bridging building and urban energy systems. Appl. Energy 2025, 359, 122715. [Google Scholar]
  89. Nguyen, H.T.; Lee, D.; Johansson, T. Integrating machine learning with GIS for district-scale energy optimisation and resilience planning. Energy AI 2024, 17, 100298. [Google Scholar]
  90. Valente, M.; Ortiz, C. Extending life-cycle carbon assessment with artificial intelligence: Towards integrated embodied and operational carbon modelling. Build. Environ. 2025, 255, 111124. [Google Scholar]
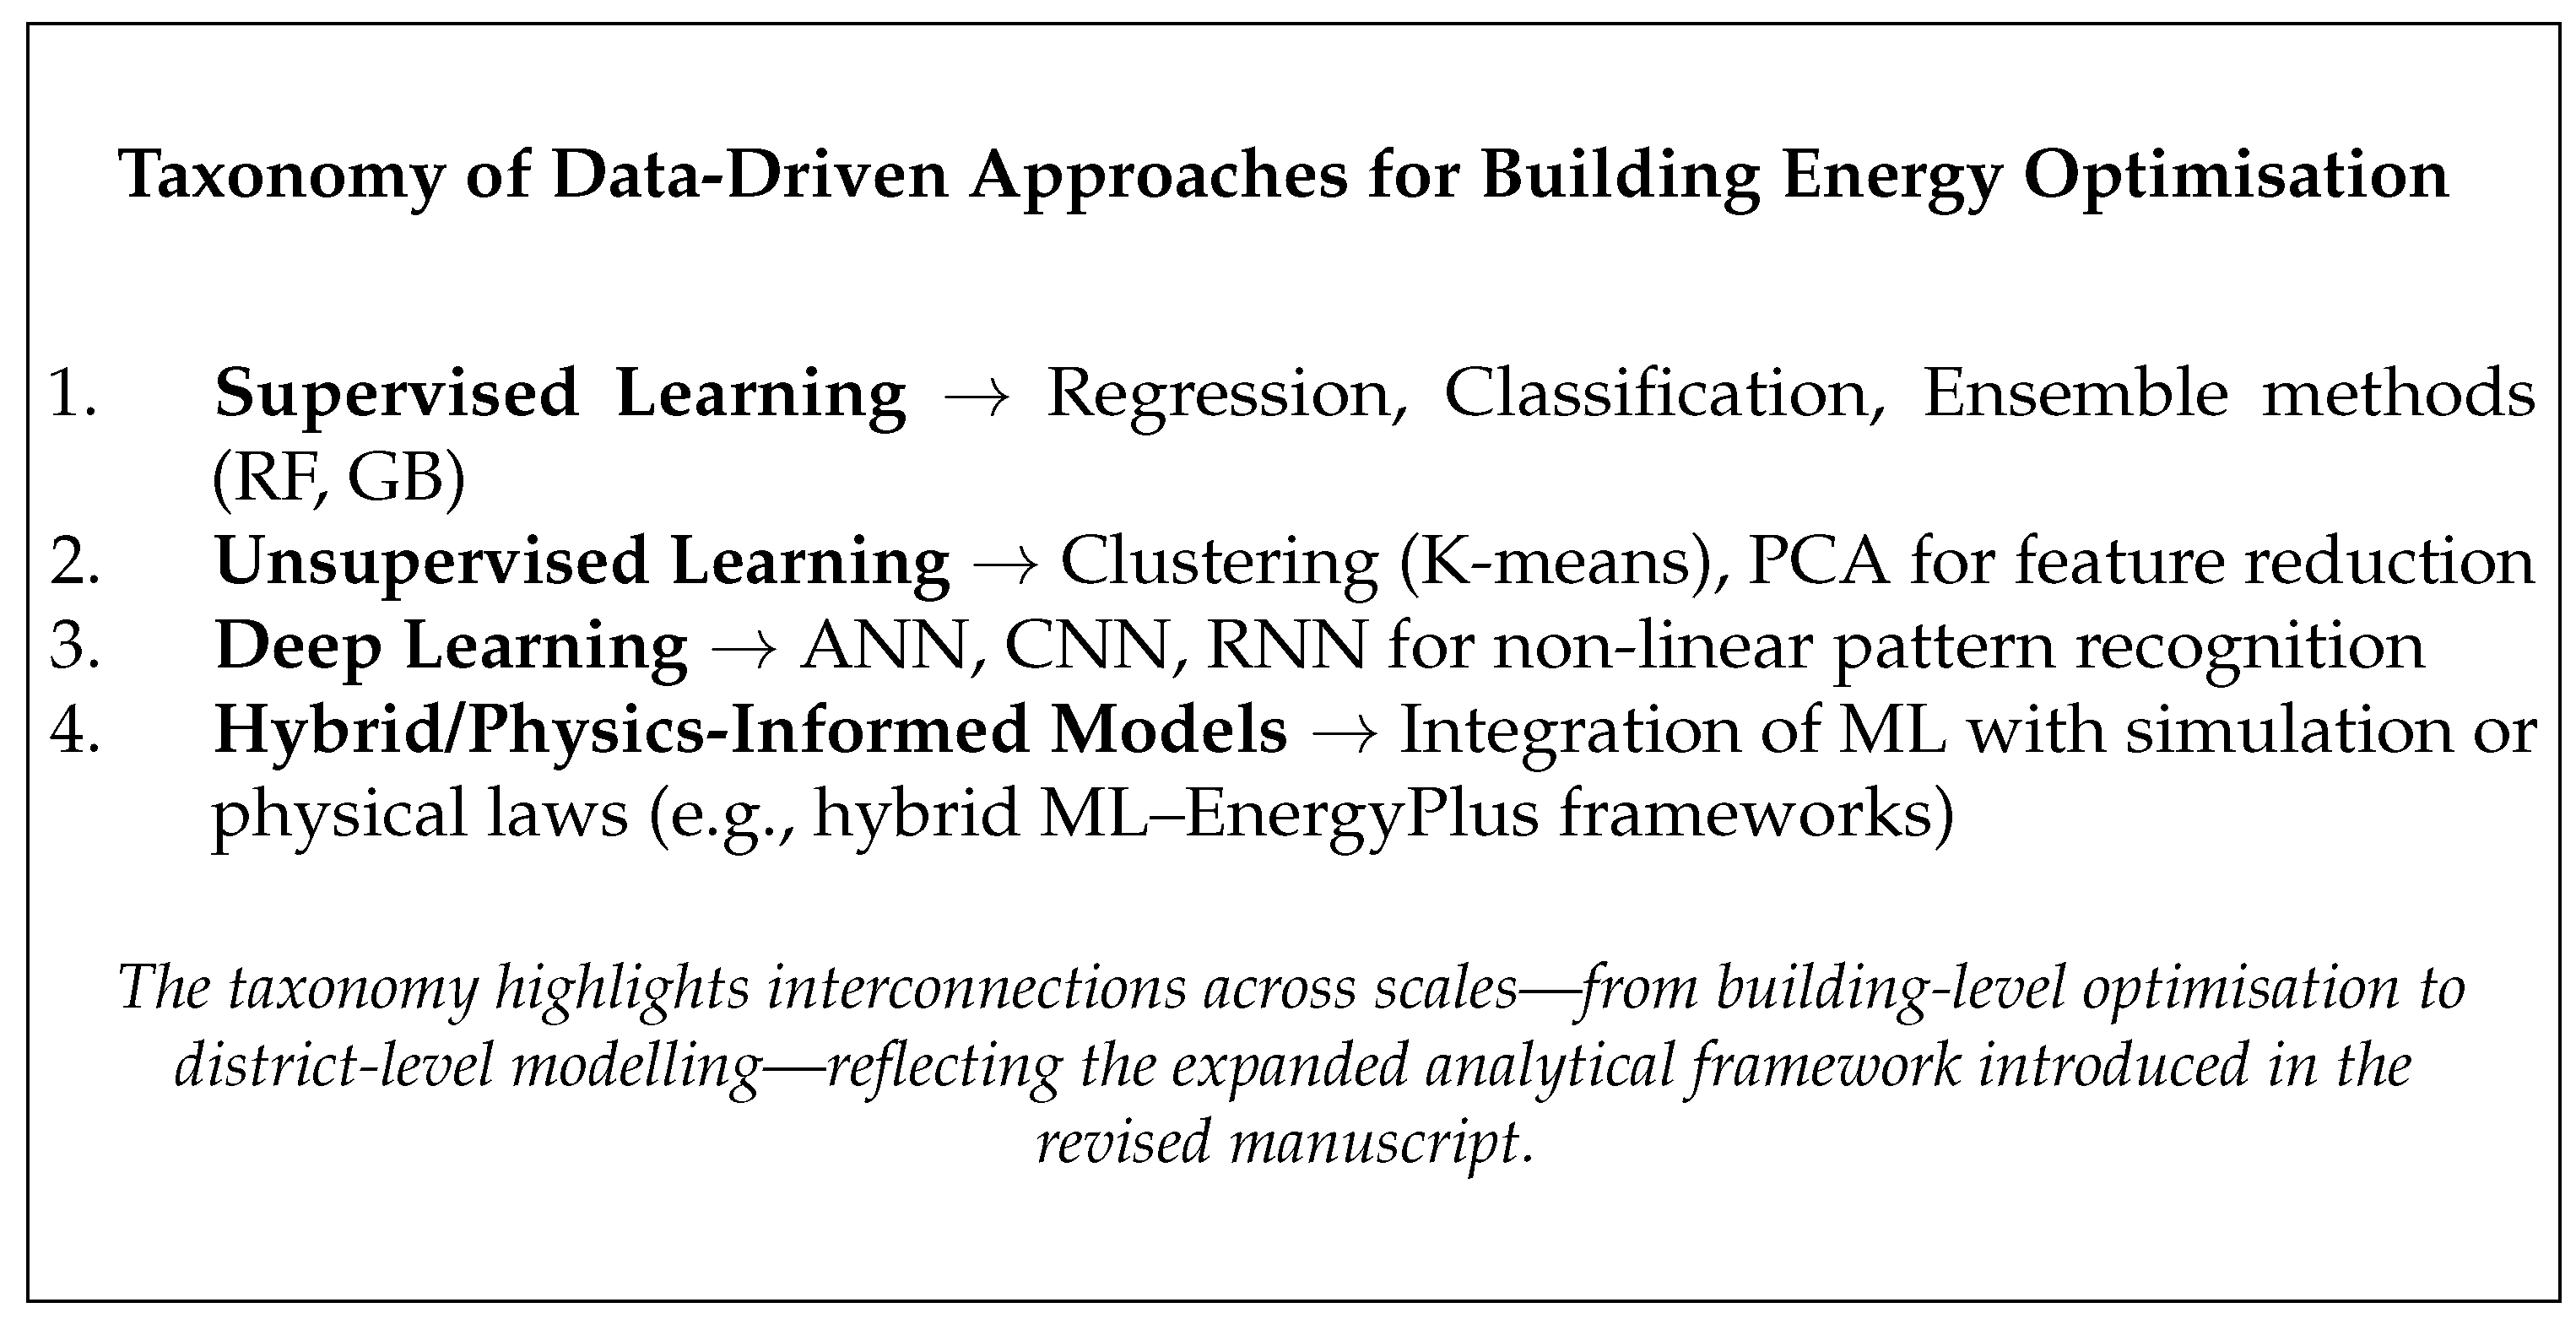
Figure 1. Taxonomy of data-driven approaches for building energy optimisation.
Buildings 15 03992 g001
Figure 2. Graphical analysis of the dataset data.
Buildings 15 03992 g002
Figure 3. Correlations between the different variables in the dataset.
Buildings 15 03992 g003
Figure 4. Learning from the decision tree model.
Buildings 15 03992 g004
Figure 5. Graphical analysis of the decision models analysed.
Buildings 15 03992 g005
Figure 6. Comparison of model performance.
Buildings 15 03992 g006
Figure 7. Orientation analysis of a building.
Buildings 15 03992 g007
Figure 8. Implementation of bioclimatic techniques in a building.
Buildings 15 03992 g008
Table 1. Summary of representative studies in the reviewed literature, showing the diversity of methods, datasets, and climatic contexts.
Author(s)/YearML MethodDataset TypeClimate/RegionKey Findings
Yang et al. (2018) [51]Random ForestSimulation (EnergyPlus)TemperateRF identified glazing ratio and orientation as key predictors of cooling load.
Marinakis (2020) [75]Gradient BoostingSimulation (Ecotect)MediterraneanGB outperformed SVR and ANN with 15% higher accuracy in energy load prediction.
Ngarambe et al. (2020) [61]SVR, ANNReal monitoredSubtropicalSVR performed better under high humidity; interpretability limited.
Chong et al. (2024) [87]Hybrid MLMaterial databasesVariousPredicted embodied carbon with <10% error using hybrid data–physics approach.
Lee & Kim (2025) [71]Hybrid AI (IoT + ML)Real-time sensorsColdReinforcement learning achieved 18% energy reduction in HVAC systems.
Rossi et al. (2025) [88]Ensemble ML + GISUrban-scaleContinentalIntegrated ML within digital twins for Positive Energy District planning.
Table 2. Comparative evaluation of ML methods for building energy prediction.
MethodPredictive AccuracyInterpretabilityComputational CostTypical Use
Linear/Elastic NetLow–MediumHighLowBaselines; rapid screening
SVR (RBF)MediumLow–Medium (post-hoc XAI)MediumNon-linear baselines
Decision TreeMediumHighLowTransparent rules; pedagogy
Random ForestHighMedium (feature importance, SHAP)MediumRobust default; limited resources
Gradient BoostingHigh+Medium (SHAP)Medium–HighBest accuracy; careful tuning
KNNMedium (data-dense)LowMedium–High (inference)Local analogues
MLPHigh (data-rich)Low (XAI needed)HighComplex interactions, multi-objective
Notes. Ensembles generally outperform linear models on heterogeneous datasets; Gradient Boosting may yield marginal accuracy gains over Random Forest at higher training cost. XAI (e.g., SHAP/LIME/surrogates) is recommended to support decision transparency.
Disclaimer/Publisher’s Note: The statements, opinions and data contained in all publications are solely those of the individual author(s) and contributor(s) and not of MDPI and/or the editor(s). MDPI and/or the editor(s) disclaim responsibility for any injury to people or property resulting from any ideas, methods, instructions or products referred to in the content.