Article

Microscopic Numerical Simulation of Compressive Performance of Steel-Recycled PET Hybrid Fiber Recycled Concrete

1
School of Civil Engineering, Tianjin Chengjian University, Tianjin 300384, China
2
College of Water Conservancy and Hydropower Engineering, Hohai University, Nanjing 210098, China
3
Department of Building Structures and Structural Mechanics, Faculty of Civil Engineering and Environmental Sciences, Bialystok University of Technology, 15-351 Bialystok, Poland
*
Author to whom correspondence should be addressed.
Buildings 2025, 15(21), 3893; https://doi.org/10.3390/buildings15213893
Submission received: 5 August 2025 / Revised: 1 October 2025 / Accepted: 21 October 2025 / Published: 28 October 2025

Abstract

Numerical simulations, unlike experimental studies, eliminate material and setup costs while significantly reducing testing time. In this study, a random distribution program for steel-recycled polyethylene terephthalate hybrid fiber recycled concrete (SRPRAC) was developed in Python (3.11), enabling direct generation in Abaqus. Mesoscopic simulation parameters were calibrated through debugging and sensitivity analysis. The simulations examined the compressive failure mode of SRPRAC and the influence of different factors. Results indicate that larger recycled coarse aggregate particle sizes intensify tensile and compressive damage in the interfacial transition zone between the coarse aggregate and mortar. Loading rate strongly affects outcomes, while smaller mesh sizes yield more stable results. Stronger boundary constraints at the top and bottom surfaces lead to higher peak stress, peak strain, and residual stress. Failure was mainly distributed within the specimen, forming a distinct X-shaped damage zone. Increasing fiber content reduced the equivalent plastic strain area above the compressive failure threshold, though the effect diminished beyond 1% total fiber volume. During initial loading, steel fibers carried higher tensile stresses, whereas recycled polyethylene terephthalate fibers (rPETF) contributed less. After peak load, tensile stress in rPETF increased significantly, complementing the gradual stress increase in steel fibers. The mesoscopic model effectively captured the stress–strain damage behavior of SRPRAC under compression.

1. Introduction

Many countries and regions face the challenge of disposing of abandoned concrete structures. Recycling concrete waste into recycled coarse aggregates (RCAs) for use in the reconstruction or reinforcement of nearby concrete buildings can reduce the demand for natural coarse aggregates (NCAs) and lower costs. However, because recycled coarse aggregates retain old mortar on their surfaces, the mechanical and durability properties of recycled aggregate concrete (RAC) are often inferior to those of natural aggregate concrete (NAC) with the same mix proportions. Incorporating fibers into RAC is a common approach to enhancing its mechanical performance.
Plastic fibers can effectively improve the toughness and impact resistance of concrete, but their contribution to strength is relatively limited. Steel fibers (SFs) significantly enhance the strength of concrete; however, they are less advantageous than plastic fibers in terms of corrosion resistance and cost-effectiveness. Combining fibers of different materials and geometric scales allows the complementary benefits of each type to be fully utilized, resulting in improved strengthening, toughening, and multi-level, stepwise crack prevention [1,2]. With the growing awareness of environmental protection and the widespread use of plastic products, recycling waste plastics has become a global priority. In the construction industry, recycled plastics are commonly applied in cement-based materials either as granules used as aggregates or as fibers serving as additives. The combined use of recycled plastics and recycled aggregate concrete (RAC) offers a promising pathway for enhancing the recycling and utilization of both waste concrete and plastics. In this study, waste polyethylene terephthalate (PET) bottles were processed into recycled PET fibers (rPETFs). These fibers (Figure 1a), together with steel fibers (SFs; Figure 1b), were incorporated into RAC to produce steel–rPET hybrid fiber recycled concrete (SRPRAC). The crack-bridging effect of the fibers enhances both the strength and toughness of RAC [3,4]. However, research on the properties of SRPRAC remains limited in scope and depth [5,6].
The incorporation of SF and rPETF can improve the crack resistance and toughness of RAC, compensate for the strength loss associated with RCA, and provide scientific support for achieving high-performance RAC. However, the enhancement mechanisms of SF and rPETF, as well as the failure mechanisms of SRPRAC under compressive loading, are not yet fully understood. Investigating the failure mechanisms of SRPRAC from a microscopic perspective can help clarify the reinforcing effects of SF and rPETF, optimize mix design, and provide a data foundation for engineering applications. Moreover, SRPRAC technology contributes to mitigating the accumulation of construction and plastic waste, thereby reducing environmental impacts. The findings presented in this paper offer technical support for the effective utilization of both construction and plastic waste.
Research on SRPRAC has so far focused mainly on macroscopic mechanical experiments [7,8]. Such studies assume material homogeneity and neglect the heterogeneity of individual components [9,10], which limits their ability to reveal the interaction mechanisms between fibers and the matrix [11]. Therefore, it is also essential to investigate SRPRAC at the microscopic scale [12].
Microscale numerical simulations can intuitively capture the material failure process at low cost and with high efficiency. They do not require extensive experimental facilities or materials, significantly reducing time and expenses. Micro-level simulations of SRPRAC not only provide the stress–strain relationship of the material but also reveal the stress state of SF and rPETF inside the matrix, along with the evolution from damage initiation to failure in the interfacial transition zone (ITZ) between coarse aggregate and mortar [13,14]. This helps clarify the graded crack resistance and reinforcement mechanisms of SF and rPETF, offering guidance for fiber size optimization and mix design.
Numerous studies have reported on microscale simulations of the compressive and tensile behavior of RAC [12,13]. Peng et al. [15] simulated RAC under uniaxial compression, identifying failure mechanisms, crack formation, and propagation patterns, and observed stress concentrations in the ITZ [16]. Xu et al. [17] and Qi et al. [18] performed microscale simulations of individual fibers in NAC and RAC, analyzing the effects of fiber content, matrix strength, aggregate distribution, and interfacial bonding. Zhang et al. [19] also examined the strengthening and toughening effects of fibers on NAC and RAC. Jayasuriya et al. [20] established a stochastic mesoscopic modeling of concrete systems containing RCA using Monte Carlo methods. The models were validated against an extensive database of RAC mixture design proportions, providing insights into the relationship between material properties and structural performance. Meng et al. [21] studied the effect of micro-structural uncertainties of RAC on its global stochastic elastic properties via finite pixel-element Monte Carlo simulation. It is indicated that the effect of mesoscopic randomness on global variability of elastic properties is considerable. Ren et al. [22] used numerical mesoscale models to analyze the influence of aggregate quality and shape on the mechanical response and fracture behavior of RAC. It is indicated that stiffer aggregates decrease the tensile (by up to 29%) and compressive strength of RAC (by up to 7%). Aggregate shape moderately influences these properties by up to 10% and 8%. The modulus of elasticity of RAC is considerably influenced by the stiffness of the aggregates (15%). Both stiffer and elongated aggregates tend to cause micro-cracking in the interface and premature failure of concrete.
However, the mechanisms of fiber crack resistance and the load-bearing capacity of SRPRAC, based on three-dimensional microscopic simulations with random aggregate and fiber distributions, remain at an exploratory stage. In this study, a microscopic SRPRAC model with randomly generated coarse aggregates and fibers was developed. Compression tests on SRPRAC cubes were simulated using Abaqus and compared with laboratory results. Furthermore, the role of SF and rPETF in improving RAC properties, the effect of aged cement slurry coatings on RCA, and the influence of different RCA replacement rates and fiber mix ratios were investigated, providing technical support for the design and engineering application of SRPRAC.

2. Establishment and Verification of Microscopic Numerical Model

2.1. Generation of Random Coarse Aggregate and Interface Transition Zone

The size of the finite element model is the same as the specimen size used in the press test, which is 100 mm × 100 mm × 100 mm. The maximum coarse aggregate particle size in the finite element model is 20 mm, and the minimum is 5 mm. According to W.B. Fuller’s grading theory [23], the coarse aggregate particles in concrete should be ordered according to their size to achieve the highest density and minimum porosity.
Sun et al. [24] analyzed the influence of coarse aggregate shape (spherical and polygonal) on the compressive strength of RAC using Abaqus software. The simulation results showed that the compressive strength of spherical coarse aggregate concrete was slightly lower than that of polygonal coarse aggregate concrete (with a difference of about 1.36 MPa) and concluded that the appearance of coarse aggregate had little effect on the compressive strength of concrete. The simulation results of Ye et al. [25] indicate that the shape of coarse aggregates (circular and polygonal) has little effect on the strength of concrete, but the calculation time of the circular aggregate model is about twice that of the polygonal aggregate model. Deng et al. [26] simulated the effect of coarse aggregate shape (circular and polygonal) on ITZ damage, also using Abaqus software, and found that the shape of coarse aggregate had an impact on the compressive damage coefficient and tensile damage coefficient of ITZ within 1%. Therefore, considering the accuracy of the calculations, the calculation time, and the modeling difficulty, a spherical shape of coarse aggregate was selected for the planned numerical simulations.
J.C. Walraven and H.W. Reinhard [27,28] transformed Fuller’s formula into a three-dimensional grading curve (Equation (1)) to maximize the probability that the particle diameter D will be less than D0 at any point in the cross-section of the sample:
P c D < D 0 = P k 1.065 D 0 D max 1 / 2 0.053 D 0 D max 4 0.0012 D 0 D max 6 0.0045 D 0 D max 8 + 0.0025 D 0 D max 10
where D0—sieve diameter (mm), Dmax—maximum aggregate particle size (mm), and Pk—percentage of aggregate volume to the total volume of the specimen (%) (Pk is generally taken as 75%).
According to Equation (1), the quantity of coarse aggregates with different particle sizes within the cross-section of the specimen can be determined. The problem of random distribution of coarse aggregates is solved using the Monte Carlo method, and in this paper, random numbers are used as a tool to replace random variables in the process [29]. A random distribution program for aggregates was written in Python language and imported into Abaqus software (ABAQUS 2020).
Previous studies have shown that the thickness of the ITZ between mortar and coarse aggregate ranges from 0.02 mm to 0.05 mm [29], while the thickness of residual mortar in RAC varies between 0.3 mm and 1.5 mm [30]. However, using the actual thickness values in finite element models leads to difficulties in mesh generation and excessive computation time. Research reported in [31] indicates that when the ITZ thickness is within 100–800 μm, its influence on the macroscopic mechanical response of concrete is negligible. Therefore, following the approach adopted in [32], the ITZ thickness between natural coarse aggregate (NCA) and new mortar in this study was set to 0.5 mm, while that between recycled coarse aggregate (RCA) and new mortar was set to 2.4 mm.
The mortar component was modeled in Abaqus by applying the “cutting geometry” tool to remove the designated volume within the cube after establishing the initial cubic geometry. This procedure reserved the required space for coarse aggregate and ITZ. Finally, all phases of the composite material were assembled to form the complete geometric model.

2.2. Generation and Deployment of Two Types of Fibers

In the generated geometric model, SF and rPETF are modeled with truss elements. They are then embedded into the mortar. This method is concise and efficient, and has been adopted by most scholars [12,32]. In order to generate randomly distributed mixed fibers with separately assigned material properties, an interference detection algorithm was developed in Python language, which was then imported into Abaqus software. The interference detection algorithm between fibers and coarse aggregates adopts the principle that the distance between the center of the sphere and the fibers in three-dimensional space is greater than the radius of the coarse aggregate sphere.

2.3. Selection of Constitutive Models

When concrete specimens undergo compression failure, it is rare for coarse aggregate failure to occur. Referring to relevant literature [32], the coarse aggregate in the numerical model adopts a linear elastic model. The concrete damaged plasticity model (CDP) built into Abaqus software is used as the constitutive model for mortar.
According to Zhou et al. [33], the strength of mortar is about 0.7–0.9 times the strength of concrete with the same mix proportion. Similarly, the elastic modulus of mortar is about 0.6–0.9 times that of concrete with the same mix proportion.
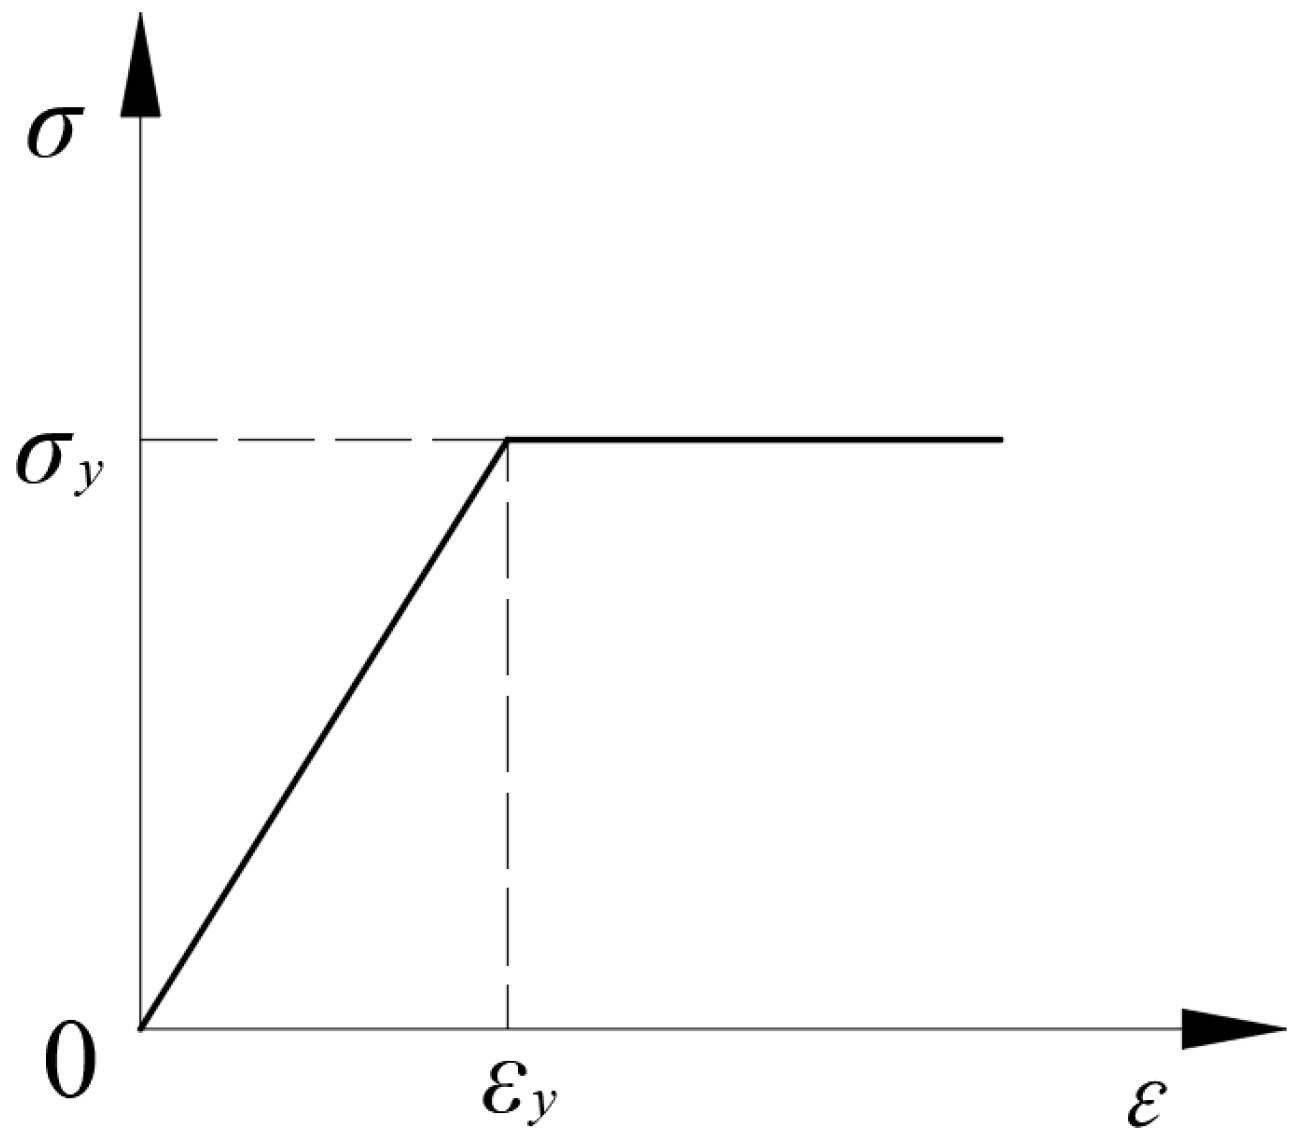
Due to the similar material properties of ITZ to mortar, the CDP model is used in the developed finite element model for all ITZ volumes. Based on relevant research results [34,35], ITZ is regarded as a weakened mortar layer, and its properties are reflected using a reduction coefficient method (the reduction coefficient is usually assumed to be between 0.3 and 0.8) [34,35]. The parameter values adopted in this article are based on the research results mentioned above. For SF and rPETF, an ideal elastoplastic constitutive relationship is assumed (the ideal elastoplastic stress–strain curve is shown in Figure 2).
The stress–strain relationship of the CDP model during the elastic stress stage is shown in Equation (2).
σ = E 0 ε 0 e l
where σ is the tensile stress (or compressive stress) (MPa), E0 is the initial elastic modulus (MPa), and ε 0 e l is the tensile strain (or compressive strain) corresponding to the initial elastic modulus.
As shown in Figure 3, the CDP model [36,37] assumes that concrete enters a nonlinear stage after reaching the initial yield strength σc0. In this phase, the concrete first hardens to the peak stress σcu and then enters the softening stage. Under uniaxial tension, concrete directly enters the softening phase after reaching the tensile yield strength, until it cracks and is damaged. The material parameters that need to be input when using the CDP model mainly include the initial elastic modulus E0, Poisson’s ratio μ, the compressive strength ratio of biaxial to uniaxial fb0/fc0, the expansion angle ψ, the eccentricity e, the influence parameters of concrete yield form Kc and the viscosity coefficient w.
Equation (3) represents the relationship between compressive plastic strain ε ˜ c p l and compressive inelastic strain ε ˜ c i n , while Equation (4) represents the relationship between tensile plastic strain ε ˜ t p l and tensile cracking strain ε ˜ t c k :
ε ˜ c p l = ε ˜ c i n d c 1 d c σ c E 0
ε ˜ t p l = ε ˜ t c k d t 1 d t σ t E 0
The CDP model introduces damage coefficients into the constitutive model, and its stress–strain relationship is expressed as follows:
σ = 1 d σ ¯
σ ¯ = E 0 ε ε p
where d is the tensile damage coefficient dt (or compressive damage coefficient dc), ranging from 0 (no damage) to 1 (complete damage), and σ ¯ is the equivalent stress tensor (MPa), ε is the total strain tensor, and ε p is the plastic strain.
The expression of the yield criterion used in the CDP model is as follows:
F σ ¯ , ε ˜ p l = 1 1 α q ¯ 3 α p ¯ + θ ε ˜ p l σ ¯ max γ σ ¯ max σ ¯ c ε ˜ c p l 0 ,
p ¯ = 1 3 σ ¯ 1 + σ ¯ 2 + σ ¯ 3 ,
q ¯ = 1 2 σ ¯ 1 σ ¯ 2 2 + σ ¯ 2 σ ¯ 3 2 + σ ¯ 1 σ ¯ 3 2 ,
α = f b 0 / f c 0 1 2 f b 0 / f c 0 1 ,
θ ε ˜ p l = σ ¯ c ε ˜ c p l σ ¯ t ε ˜ t p l 1 α 1 + α ,
γ = 3 1 K c 2 K c 1 .
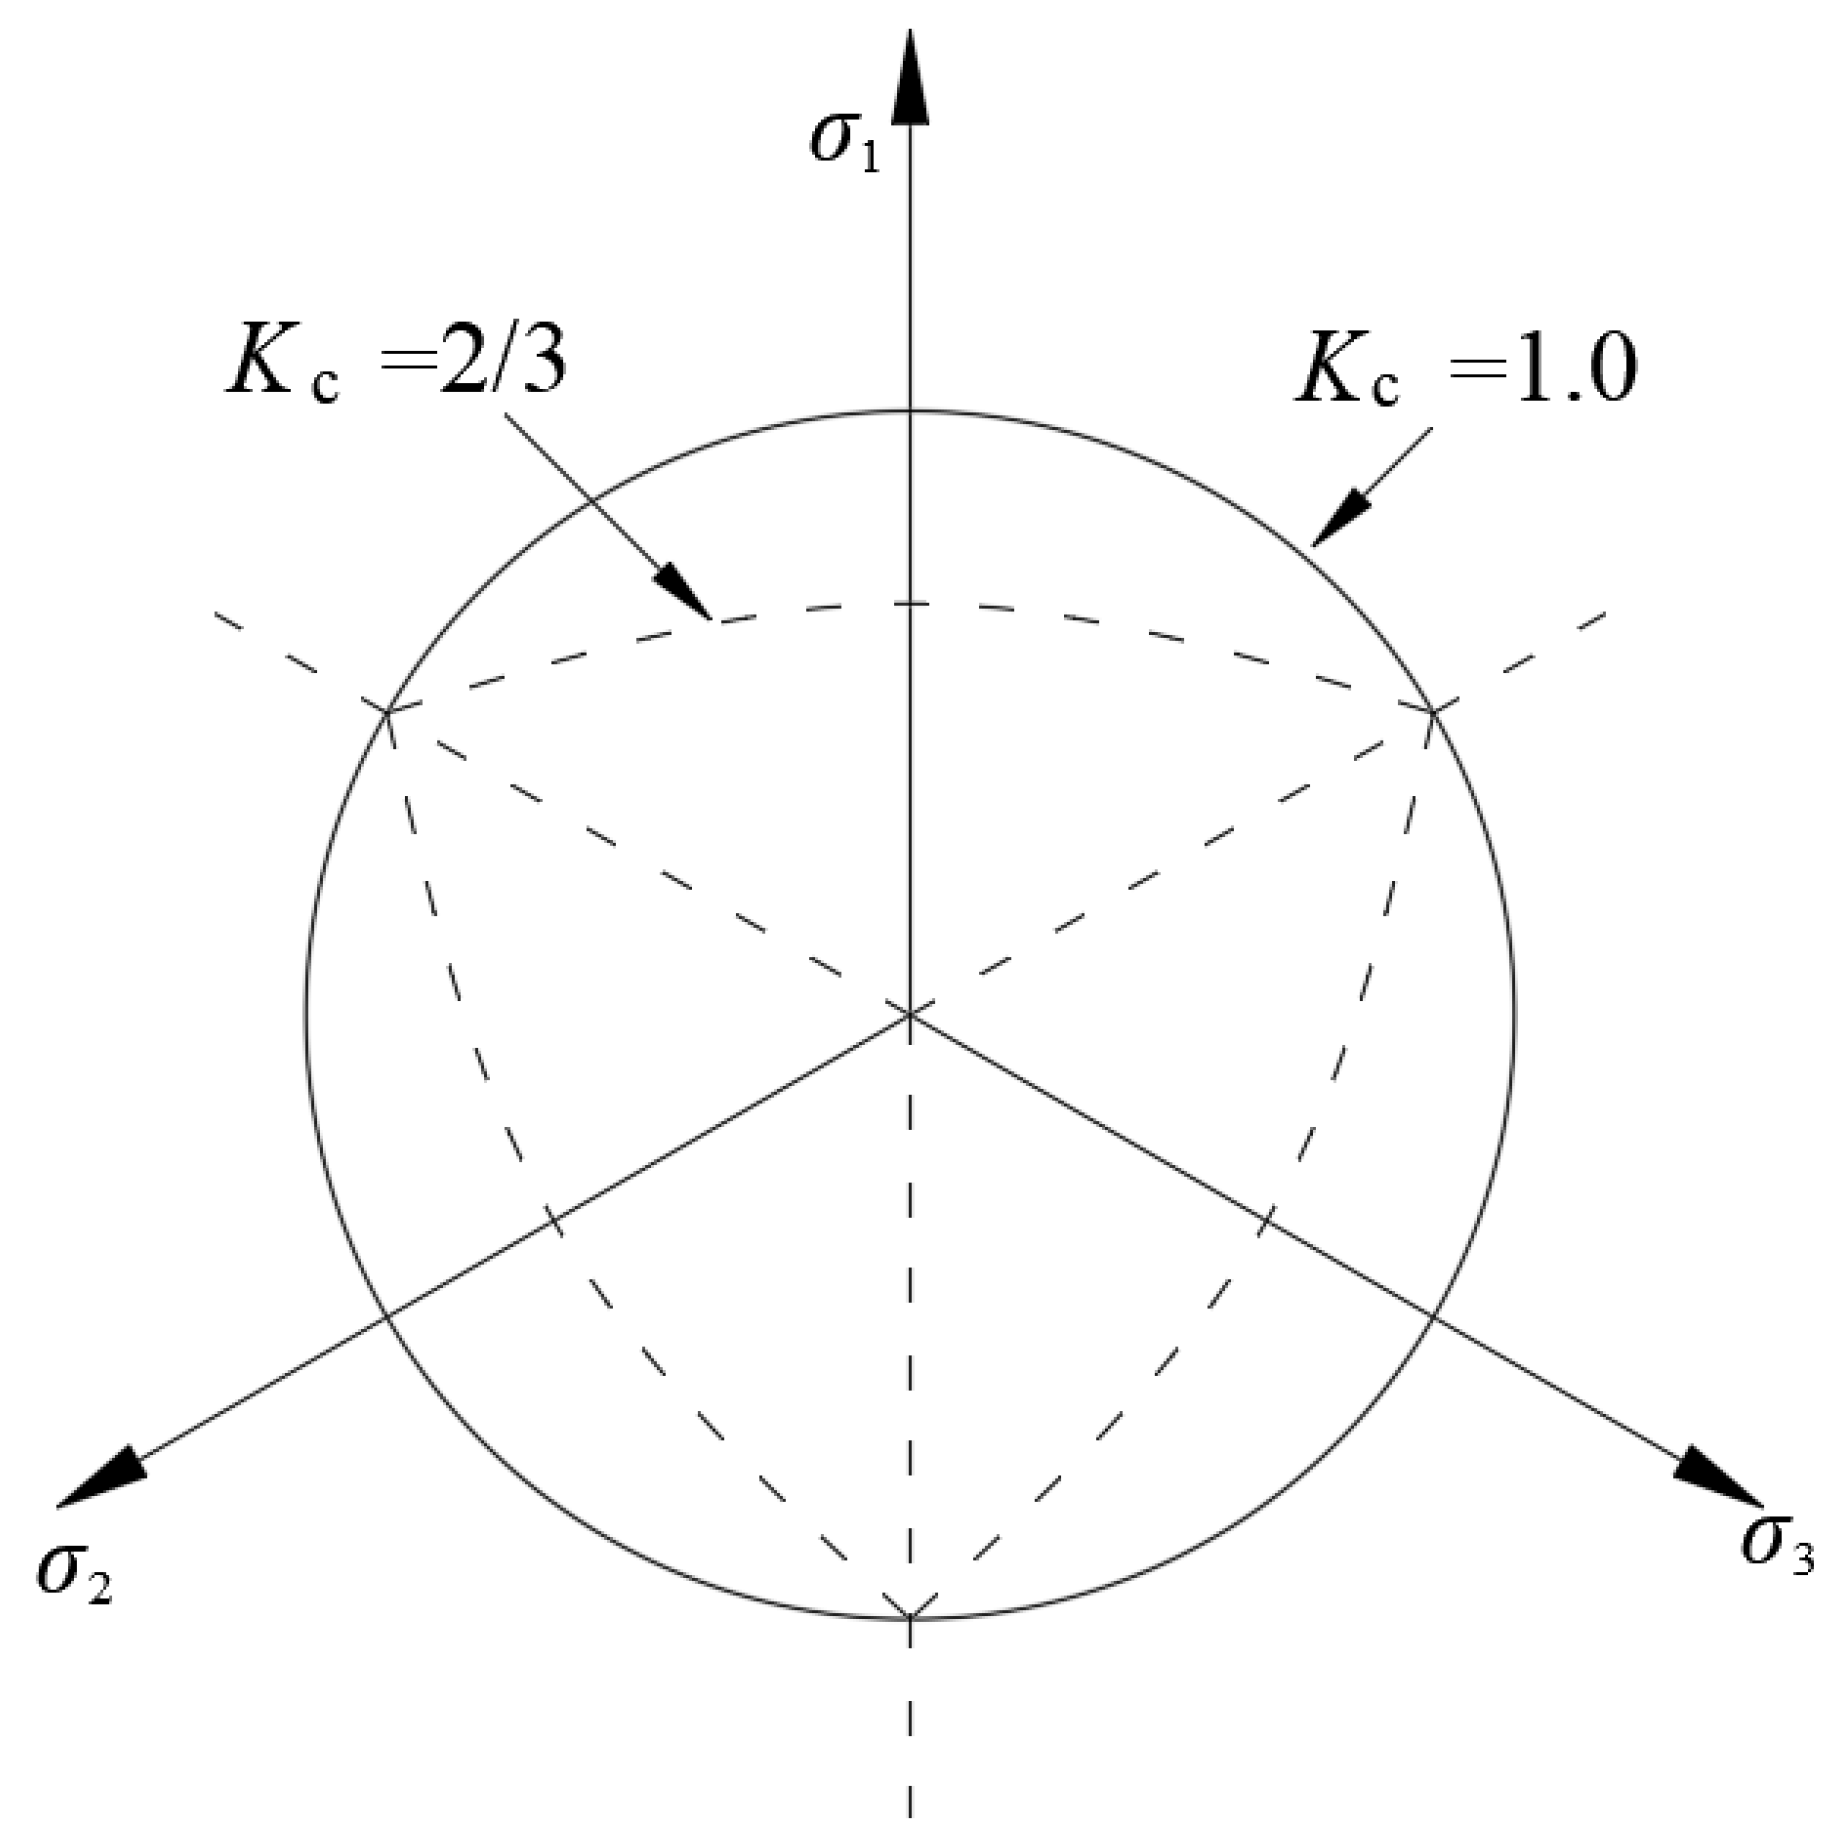
Among them, p ¯ is the equivalent body stress (MPa), q ¯ is the von Mises equivalent stress (MPa), α is the coefficient related to the ratio of compressive strength, fb0 and fc0 are the biaxial compressive strength and uniaxial compressive strength of concrete (MPa), respectively. fb0/fc0 is usually taken as 1.16. θ ε ˜ p l is an infinite constant number, which is determined by the equivalent tensile cohesive σ ¯ t and equivalent compressive cohesive σ ¯ c corresponding to the equivalent plastic tensile strain ε ˜ t p l and equivalent compressive strain ε ˜ c p l , as well as the coefficient α, Kc is the ratio of the von Mises equivalent stress q ¯ T M on the tensile meridian plane to the von Mises equivalent stress q ¯ C M on the compressive meridian plane, as shown in Figure 4. The shape of the yield surface varies with Kc, which ranges from 0.5 to 1.0 and is generally taken as 2/3.
The CDP model uses the non-orthogonal flow rule to determine the flow direction of the material in the plastic stage, and the expression of the flow rule is shown in Equation (13).
ε ˙ p l = λ ˙ G σ ¯ σ ¯
Among them, G is the plastic potential function. The expression for G is as follows:
G = e σ ¯ t 0 tan ψ 2 + q ¯ 2 p ¯ tan ψ
In the Equation, e is the eccentricity, with a default value of 0.1, and ψ is the expansion angle of the meridian plane measured under high confining pressure (°).

2.4. Grid Division and Boundary Condition Setting

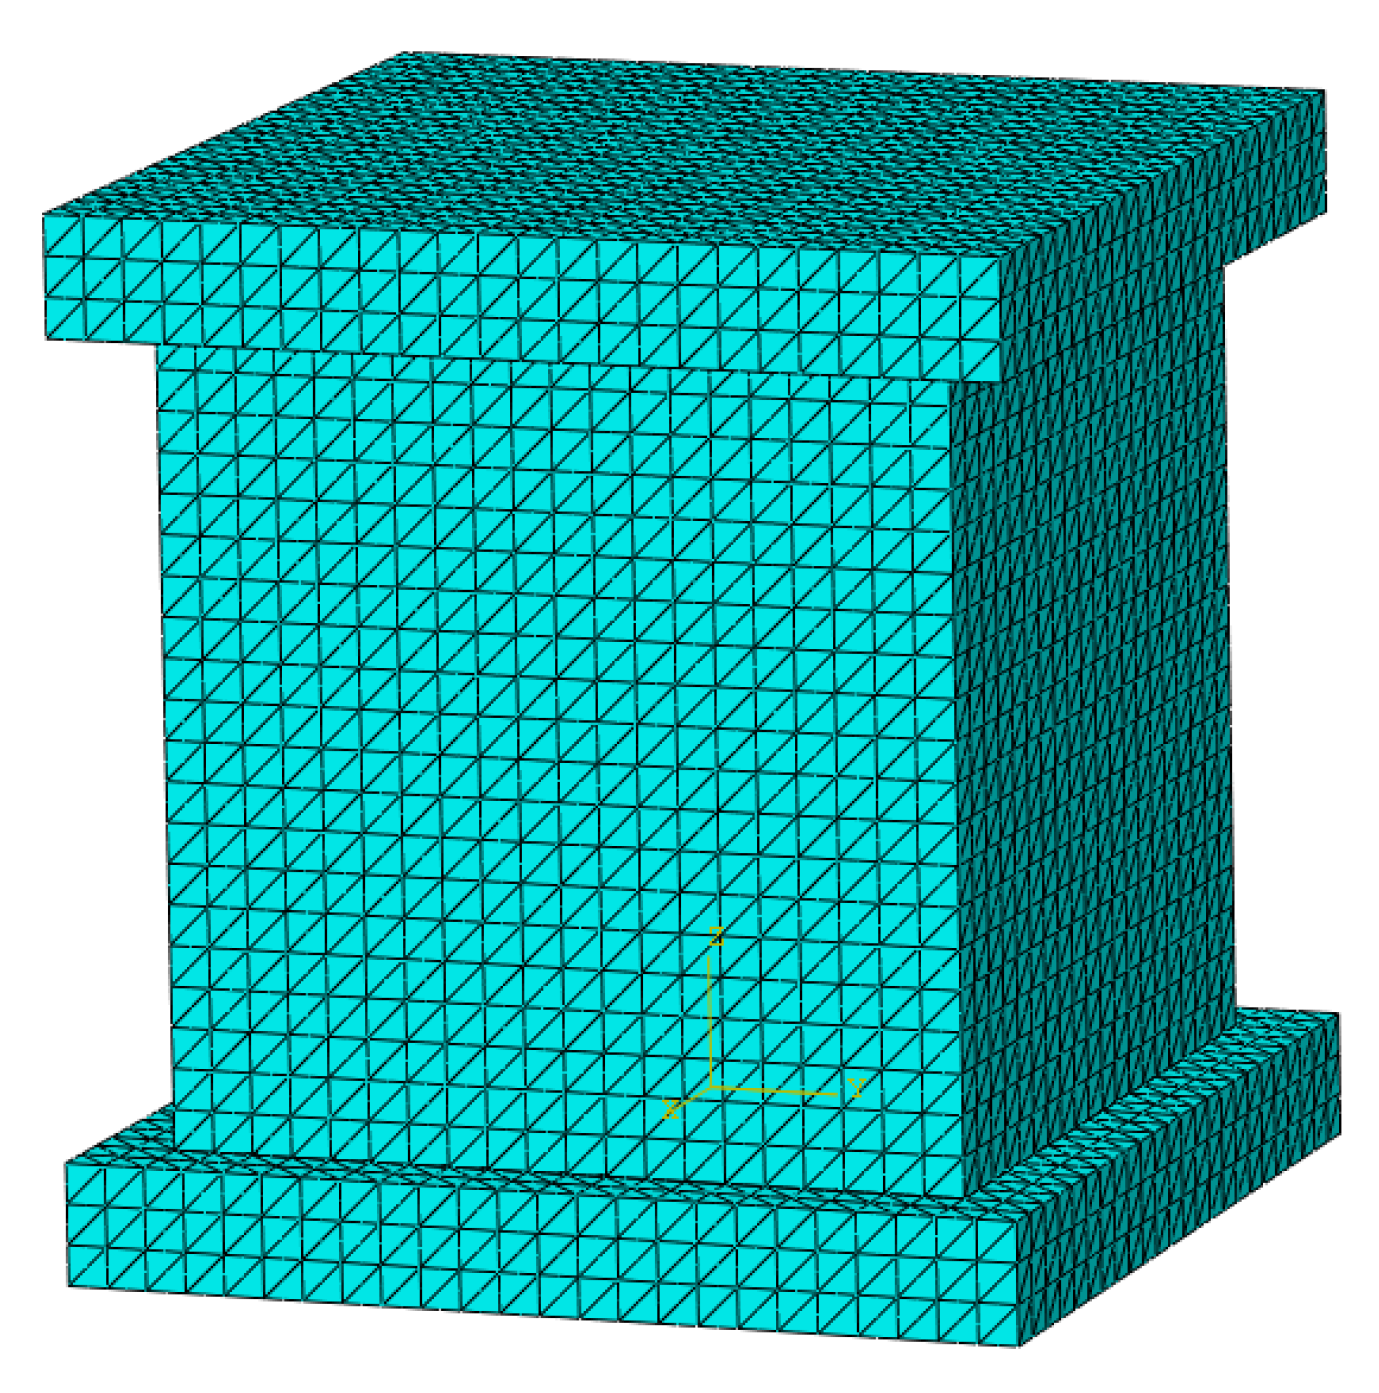
Mortar, RCA, NCA, and ITZ all use C3D4 elements (3-dimensional, 4-node tetrahedral elements), while SF and rPETF both use T3D2 elements (3-dimensional, 2-node truss elements). The mesh division results for model No. R50S0.5P0.5 (RCA substitution rate is 50%, and the volume fraction of SF and rETF is both 0.5%) is shown in Figure 5. The final finite element model consists of about 711,000 nodes and 272,000 elements.
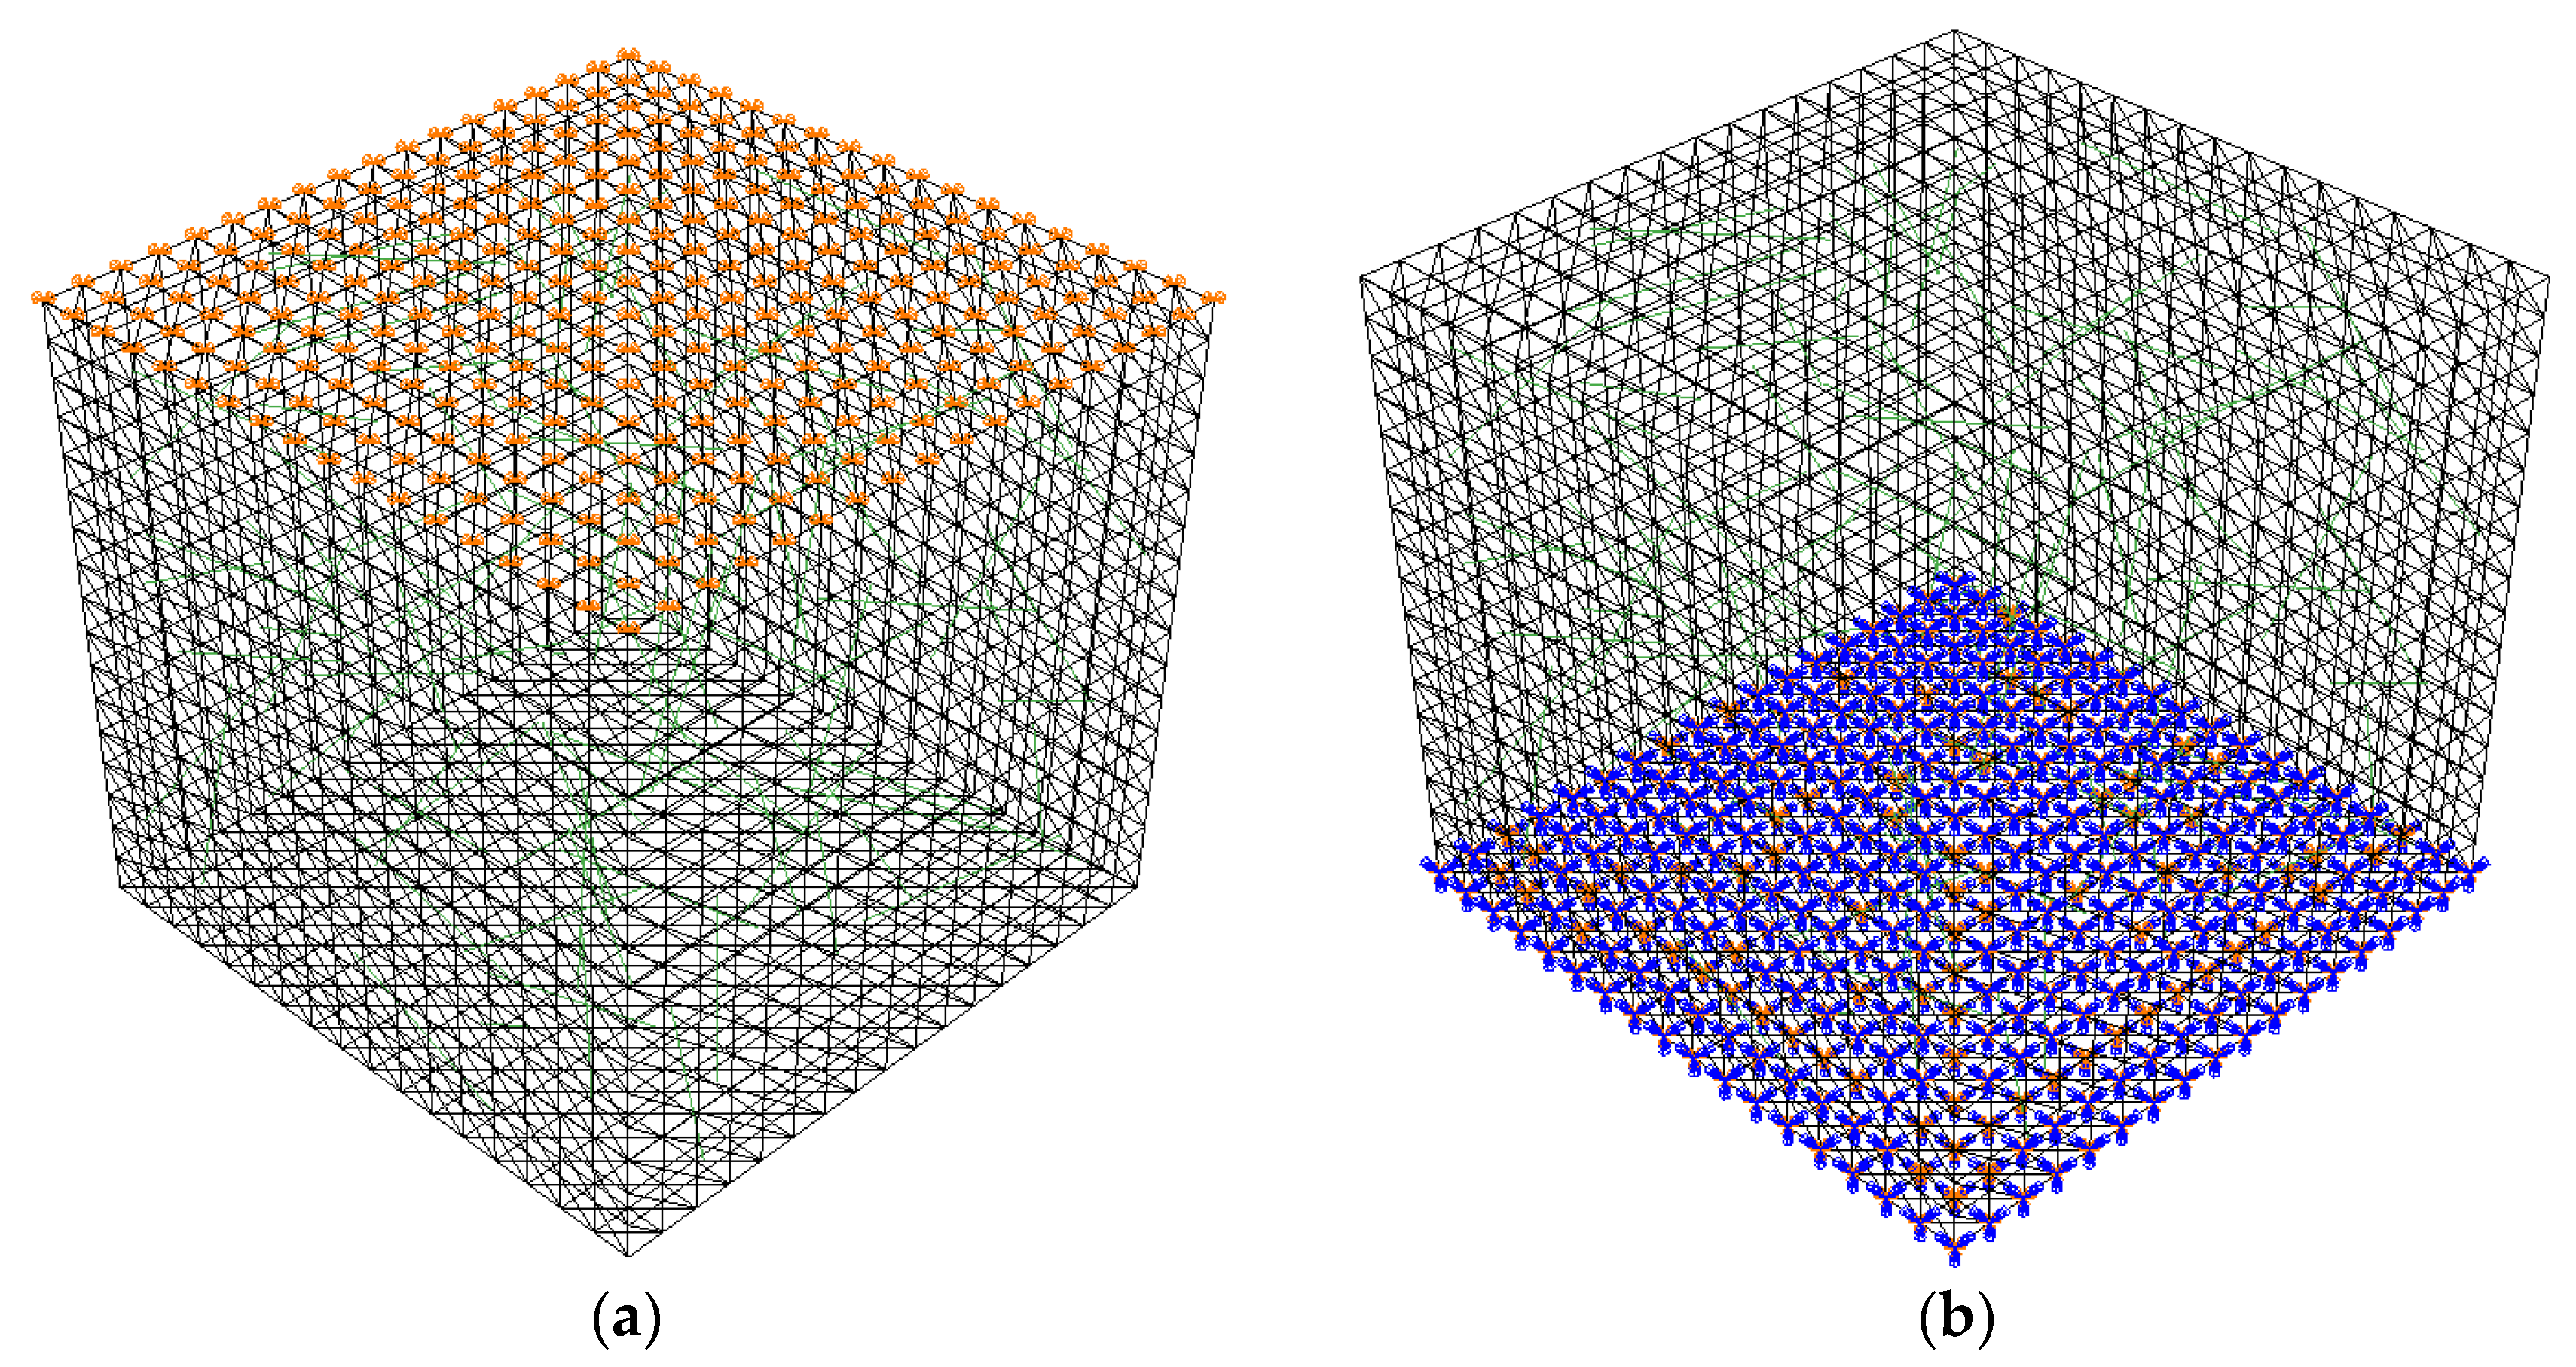
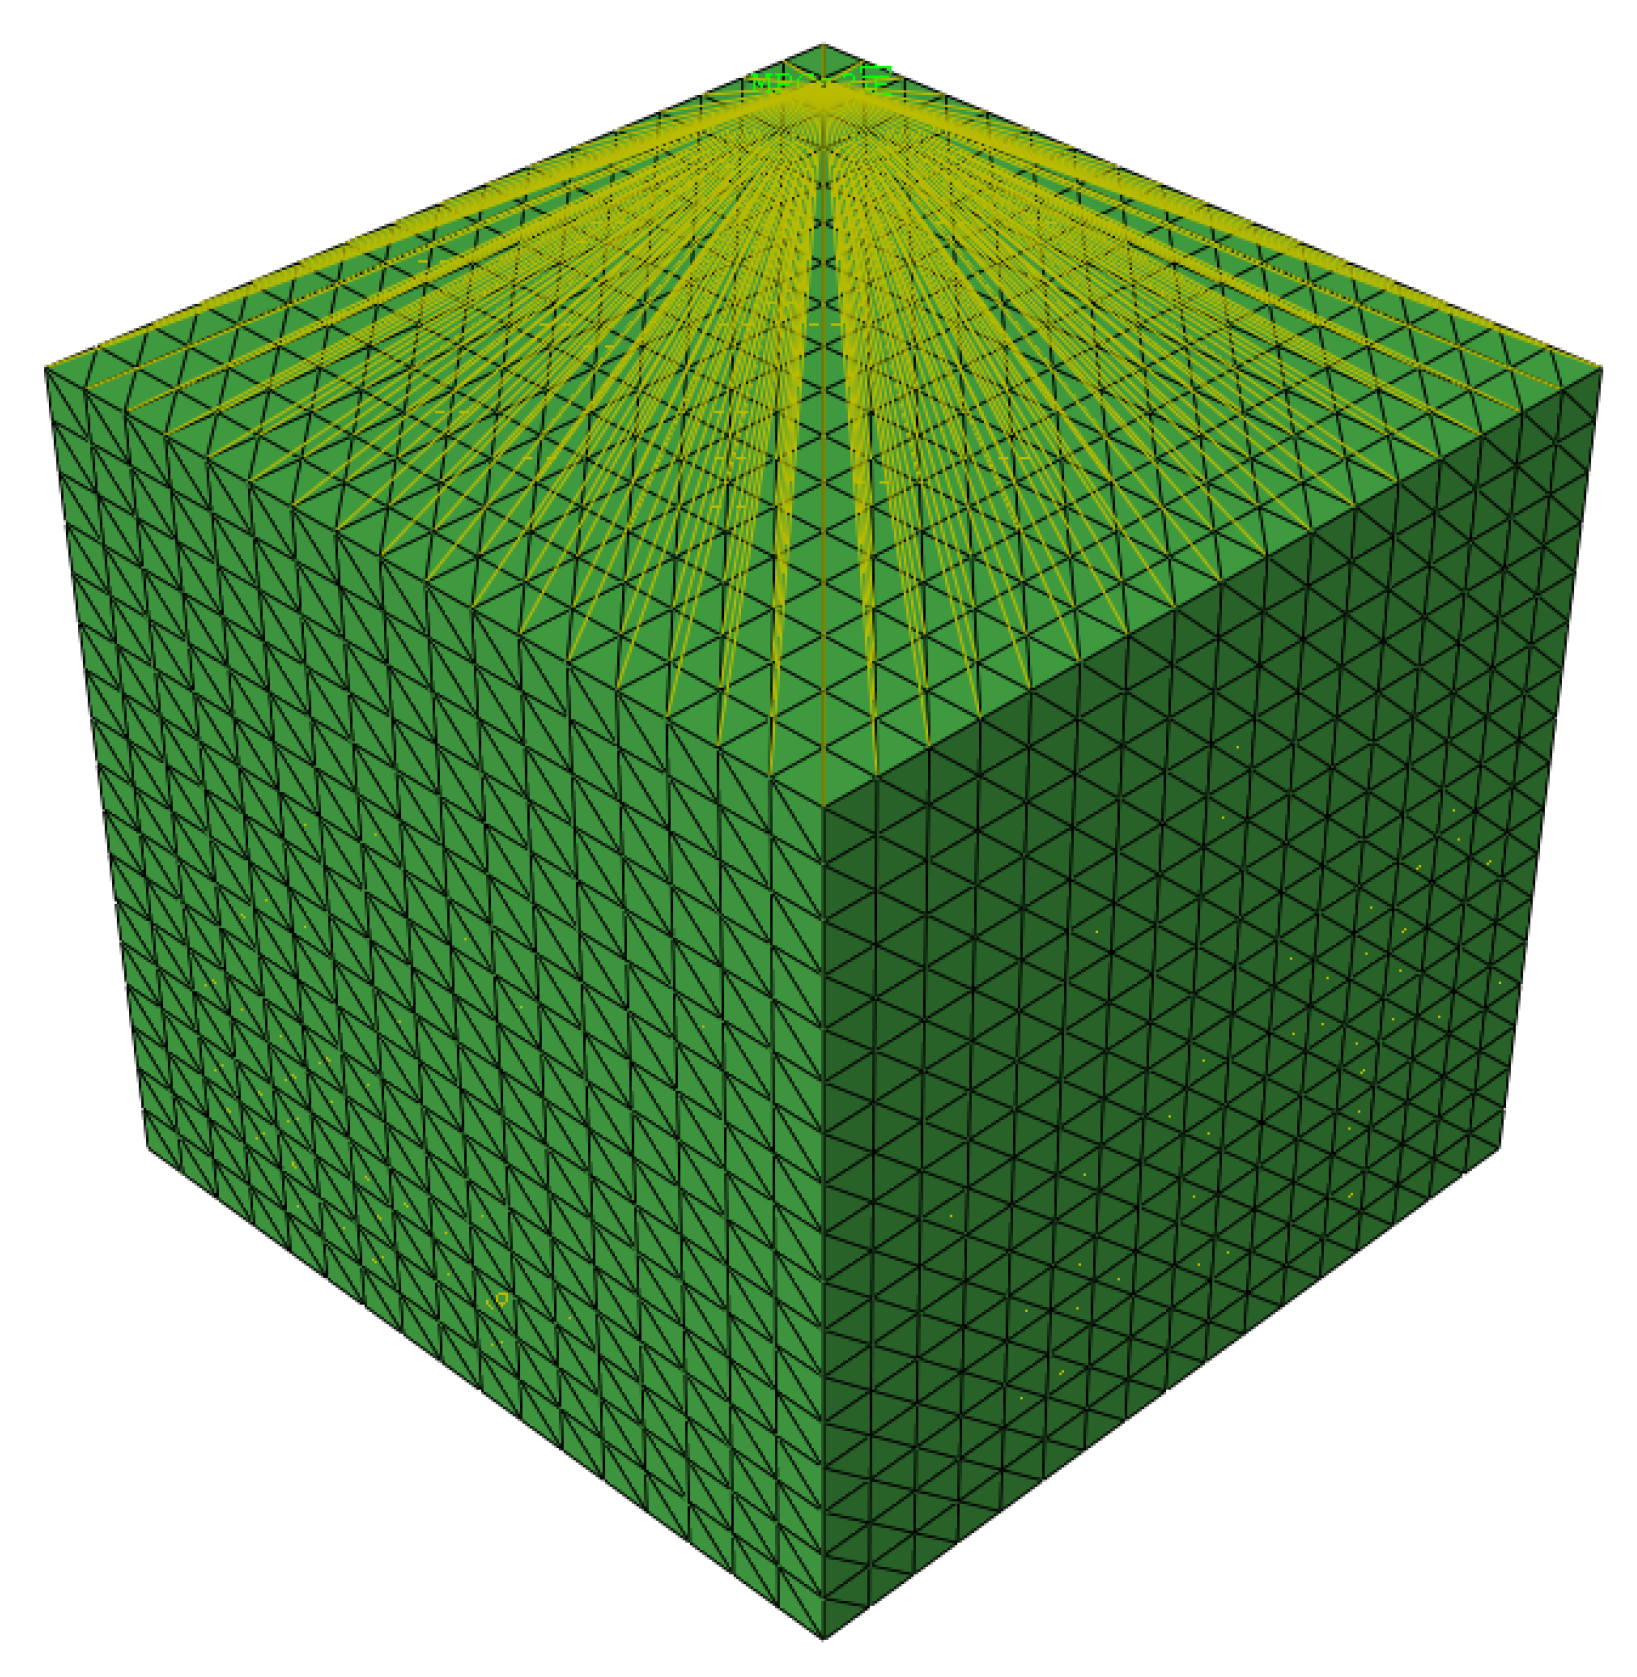
Considering coefficients such as convergence and calculation time consumption, the boundary conditions of the finite element model adopt fixed boundaries. The bottom of the model is set as a fixed end constraint, and a vertical downward displacement load is applied to the top of the model by setting a reference point to simulate the uniaxial compression load of the specimen. The schematic diagram of applying constraints is shown in Figure 6. The schematic diagram of applying a vertical displacement load is shown in Figure 7.

2.5. Parameter Tuning

In order to tune the parameters of the finite element model, cubic specimens No. R50S0.5P0.5 SRPRAC with a side length of 100 mm were made. The proportions of the concrete mix components are shown in Table 1. The physical and mechanical properties of the SF and the rPETF are derived from the material specifications provided by the manufacturer. The physical and mechanical parameters of the SF and the rPETF are shown in Table 2. After 28 days of curing under standard conditions (The temperature is 20 ± 2 °C and the relative humidity is greater than 95%), compression tests were conducted with a vertical loading rate of 0.001 mm/s. The average result from testing three samples was taken as the test value.
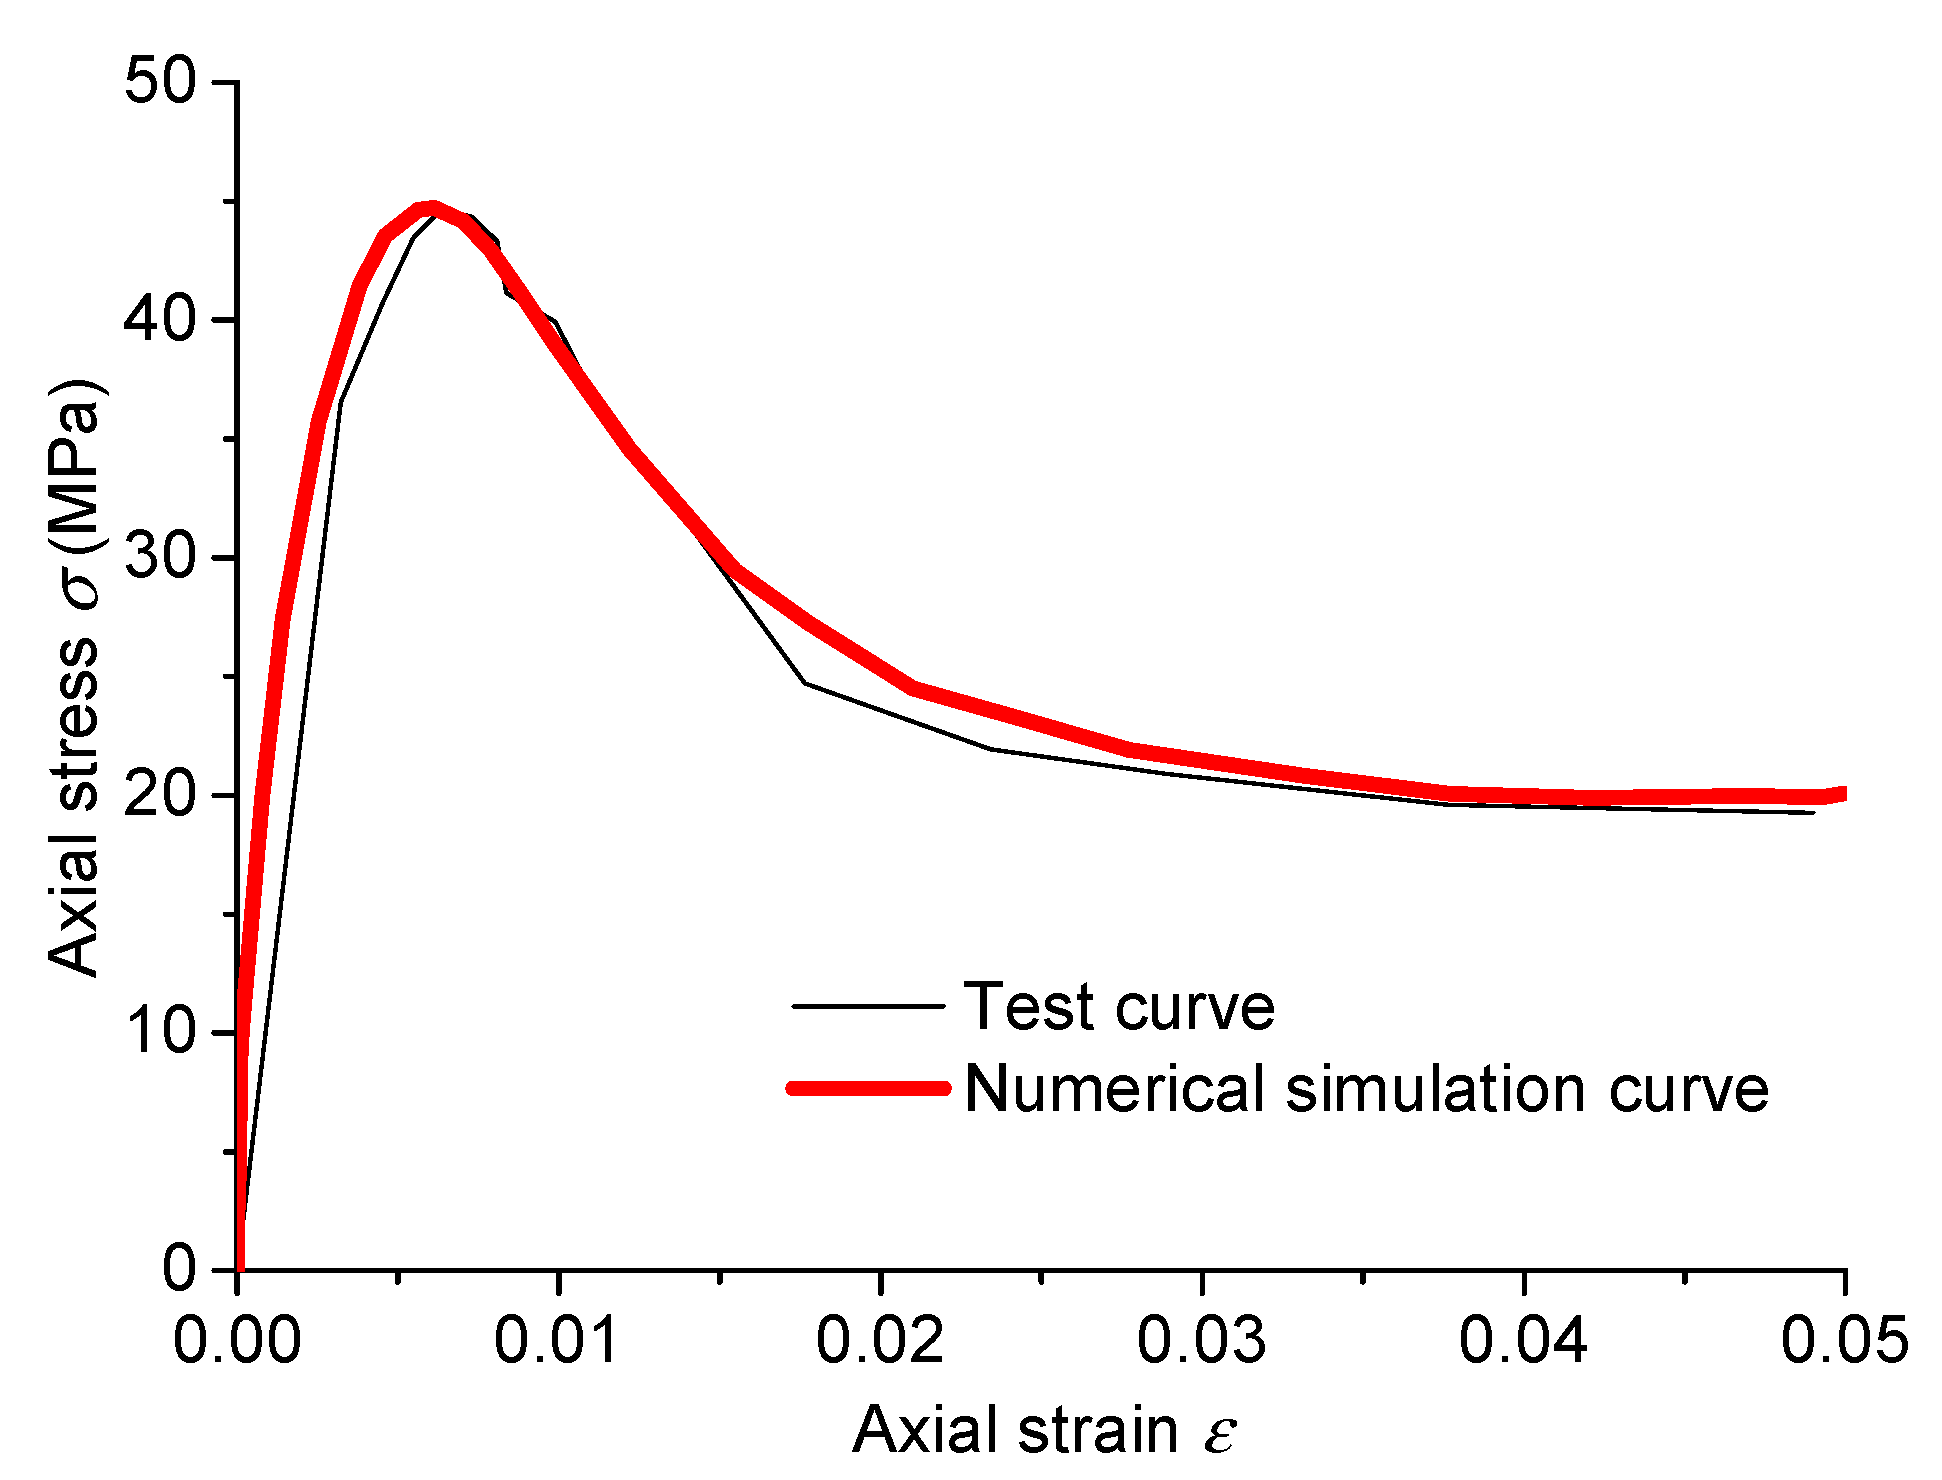
The model was solved using an Explicit solver. The numerical simulation assumed vertical displacement loading of 5 mm applied to the top surface of the HFRAC cubic specimen (100 mm × 100 mm × 100 mm) at a rate of 0.001 mm/s. To ensure the reliability and accuracy of the mesoscopic parameters, Du et al. [38,39] calibrated the microscopic parameters of concrete components based on constitutive curves obtained from compressive strength tests. Following the parameter values and calibration methods of Liang et al. [12,38,39,40,41], in this study, the microscopic parameters were iteratively adjusted so that the peak stress, peak strain, and residual stress from the finite element simulation of specimen R50S0.5P0.5 matched as closely as possible the corresponding average values from compression tests. After multiple iterations, the final calibrated microscopic parameters are presented in Table 3 and Table 4. A comparison between the calculated and experimental stress–strain curves for specimen R50S0.5P0.5 under compression is shown in Figure 8.

2.6. Model Validation

Microscopic numerical models were established using the described methods (fiber content and RCA replacement levels are listed in Table 5), and compression simulations were performed. Corresponding cubic specimens were also prepared following the same procedure and tested under compression.
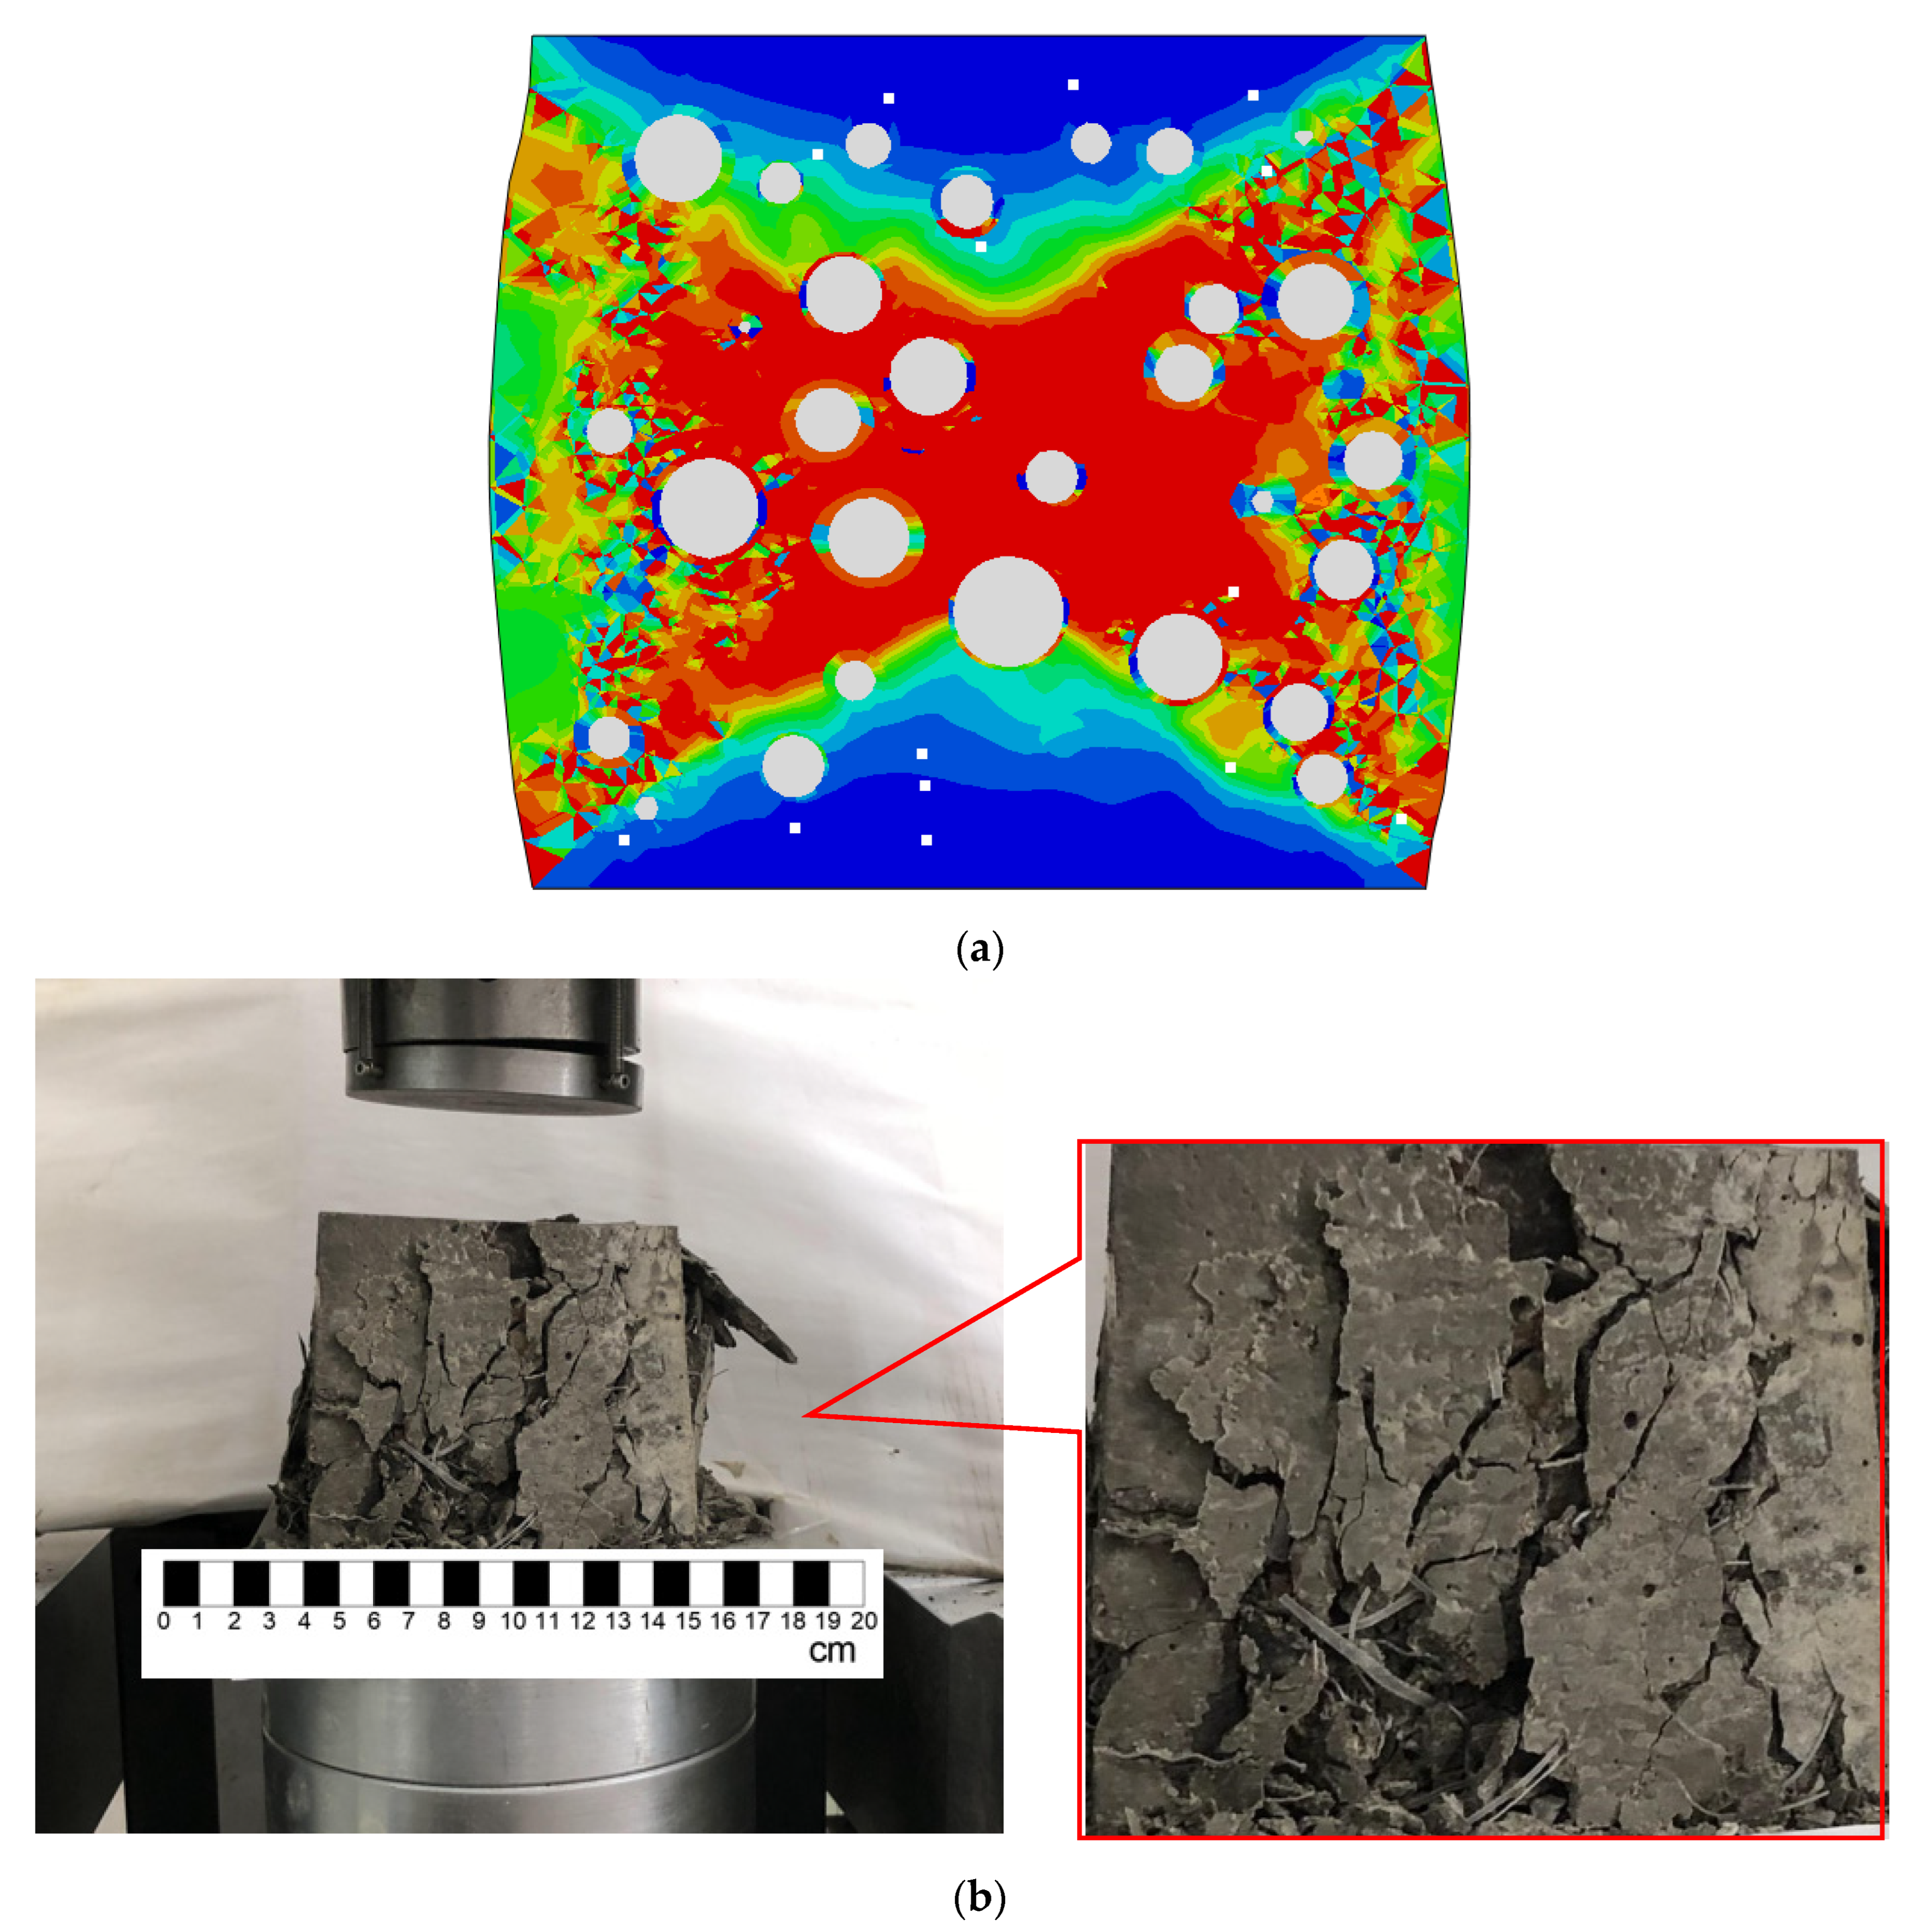
Using the finite element simulation results of R50S1P1 as an example, the failure surface of the compressed SRPRAC cube exhibited cross-oblique cracking, consistent with the results of the uniaxial static compression test (Figure 9).
The numerical simulation results were compared with the experimental data. The stress–strain curves obtained from uniaxial compression tests are presented in Figure 10. It can be observed that the stress–strain curve of the SRPRAC microscopic numerical model closely matches the shape and trend of the curve obtained from static compression tests, confirming the reliability of the numerical model. Therefore, it can be concluded that the microscopic model accurately reflects the peak stress and strain of SRPRAC under compression.
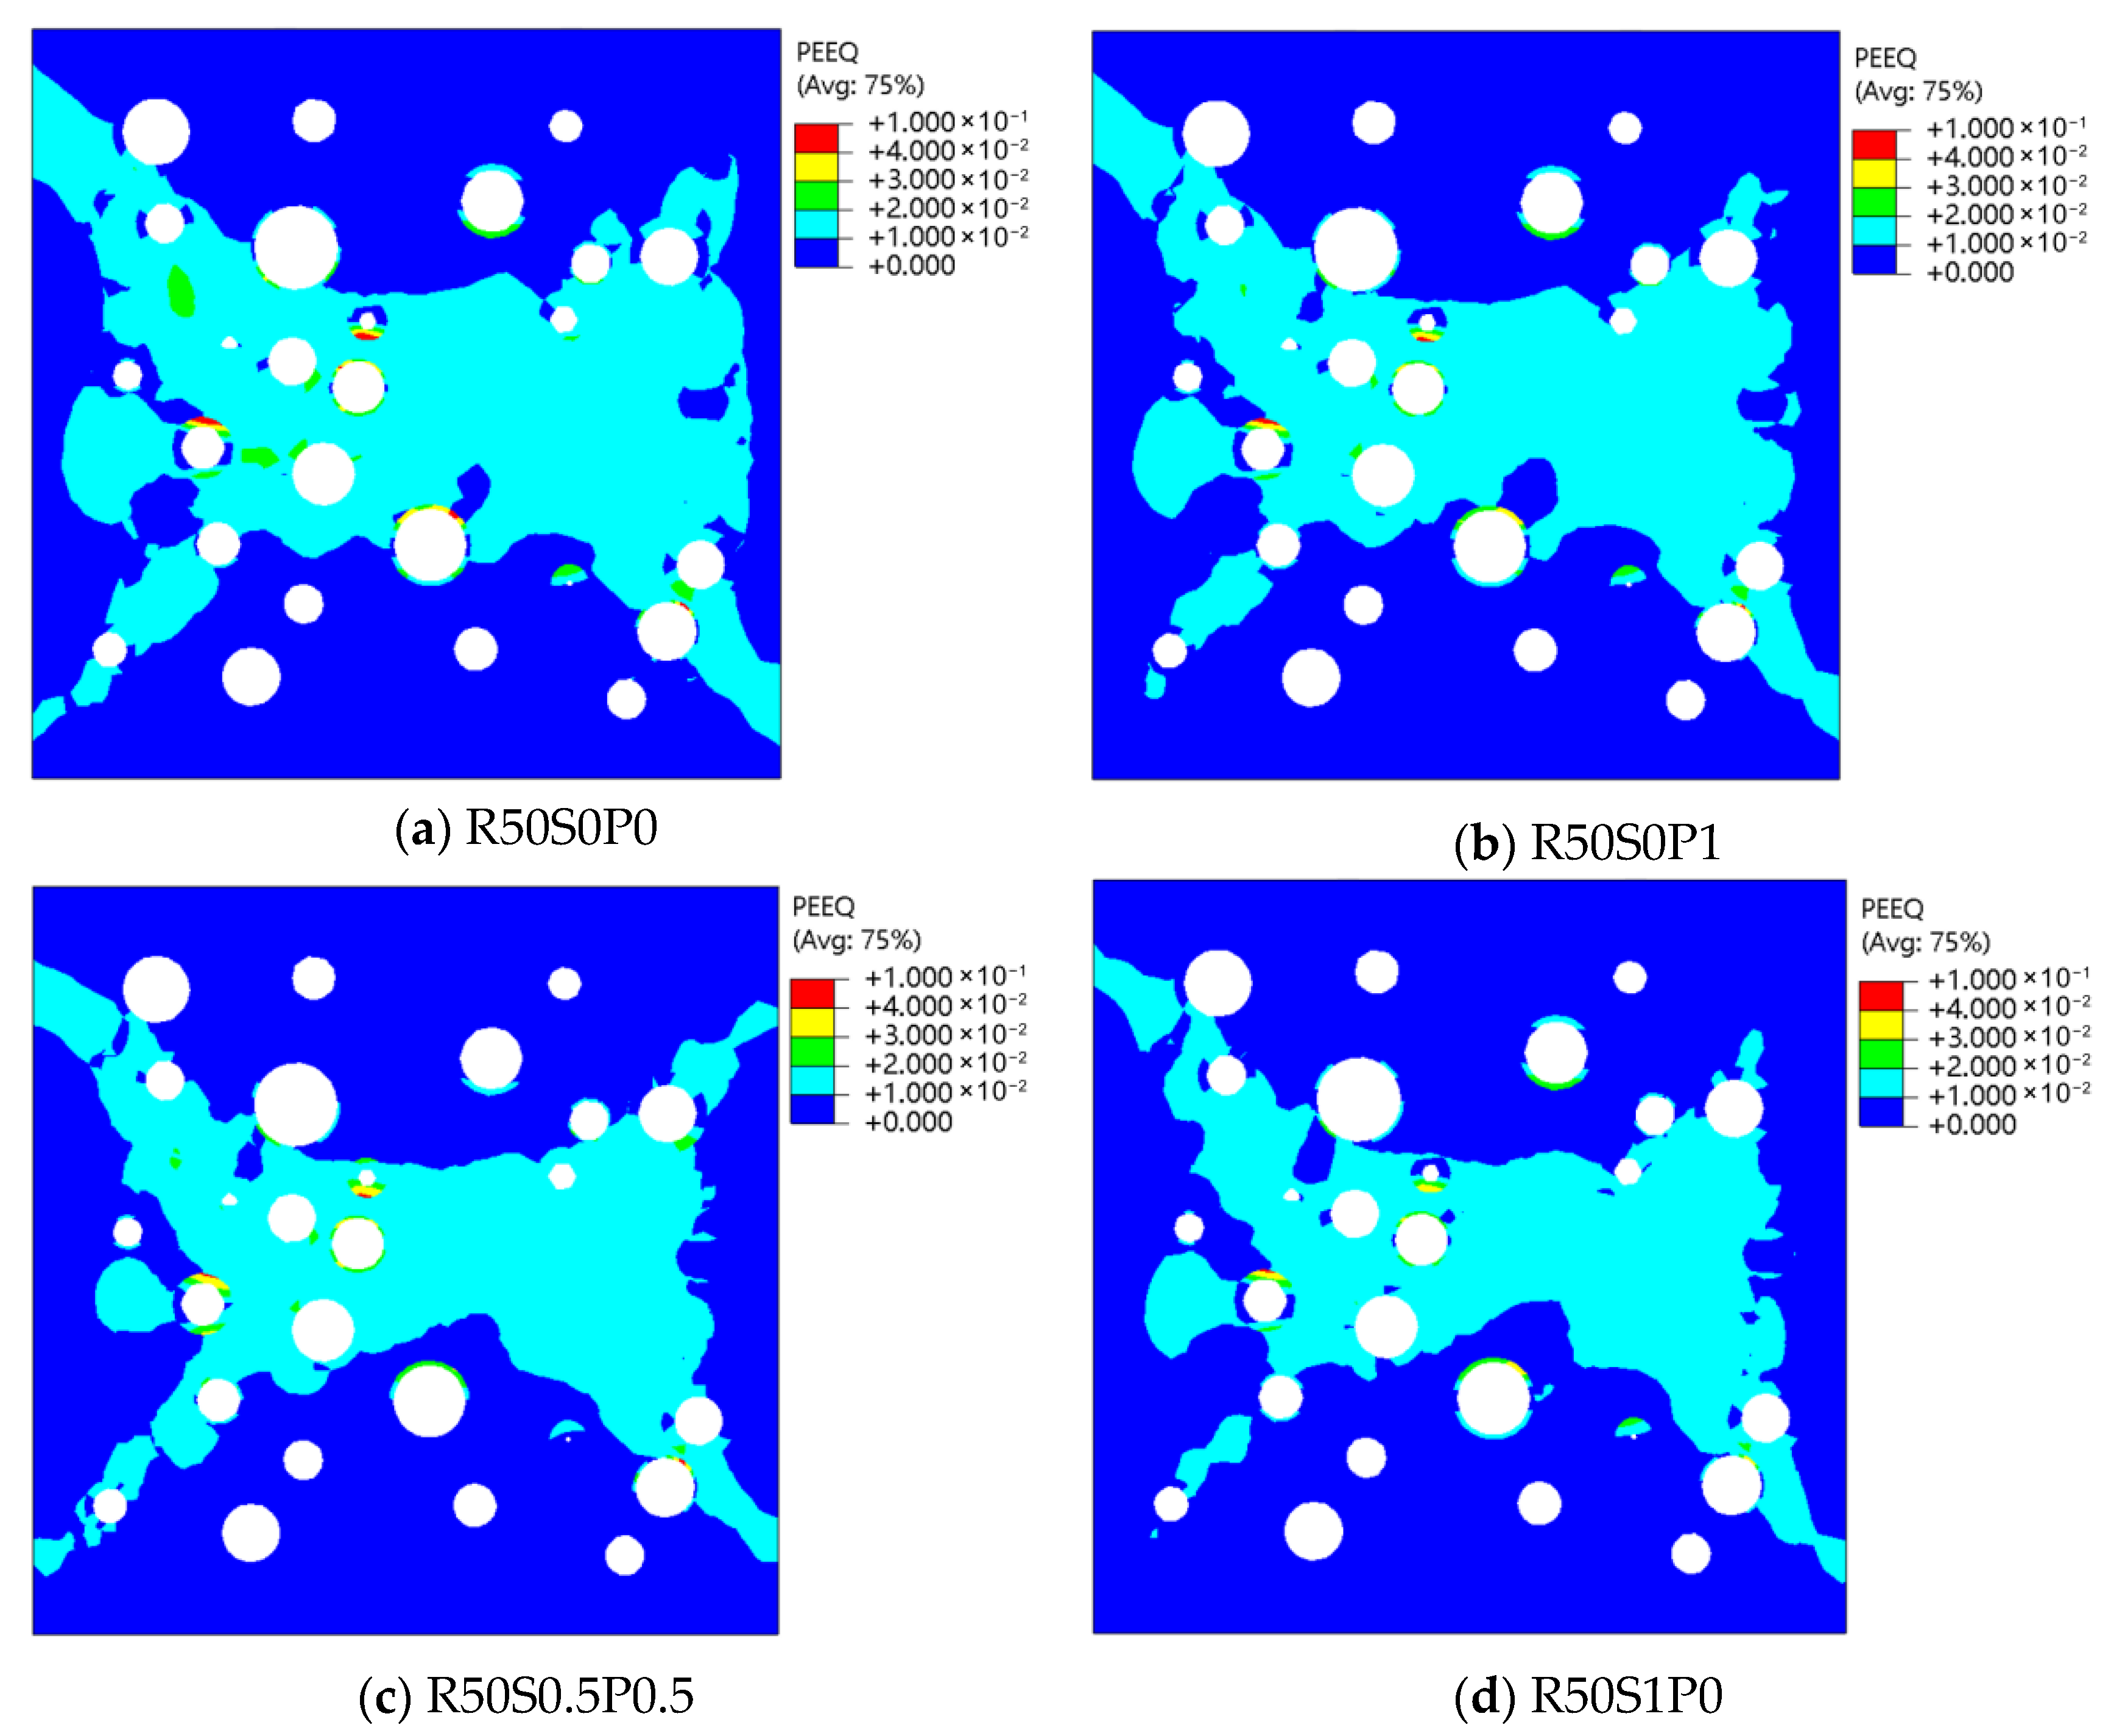
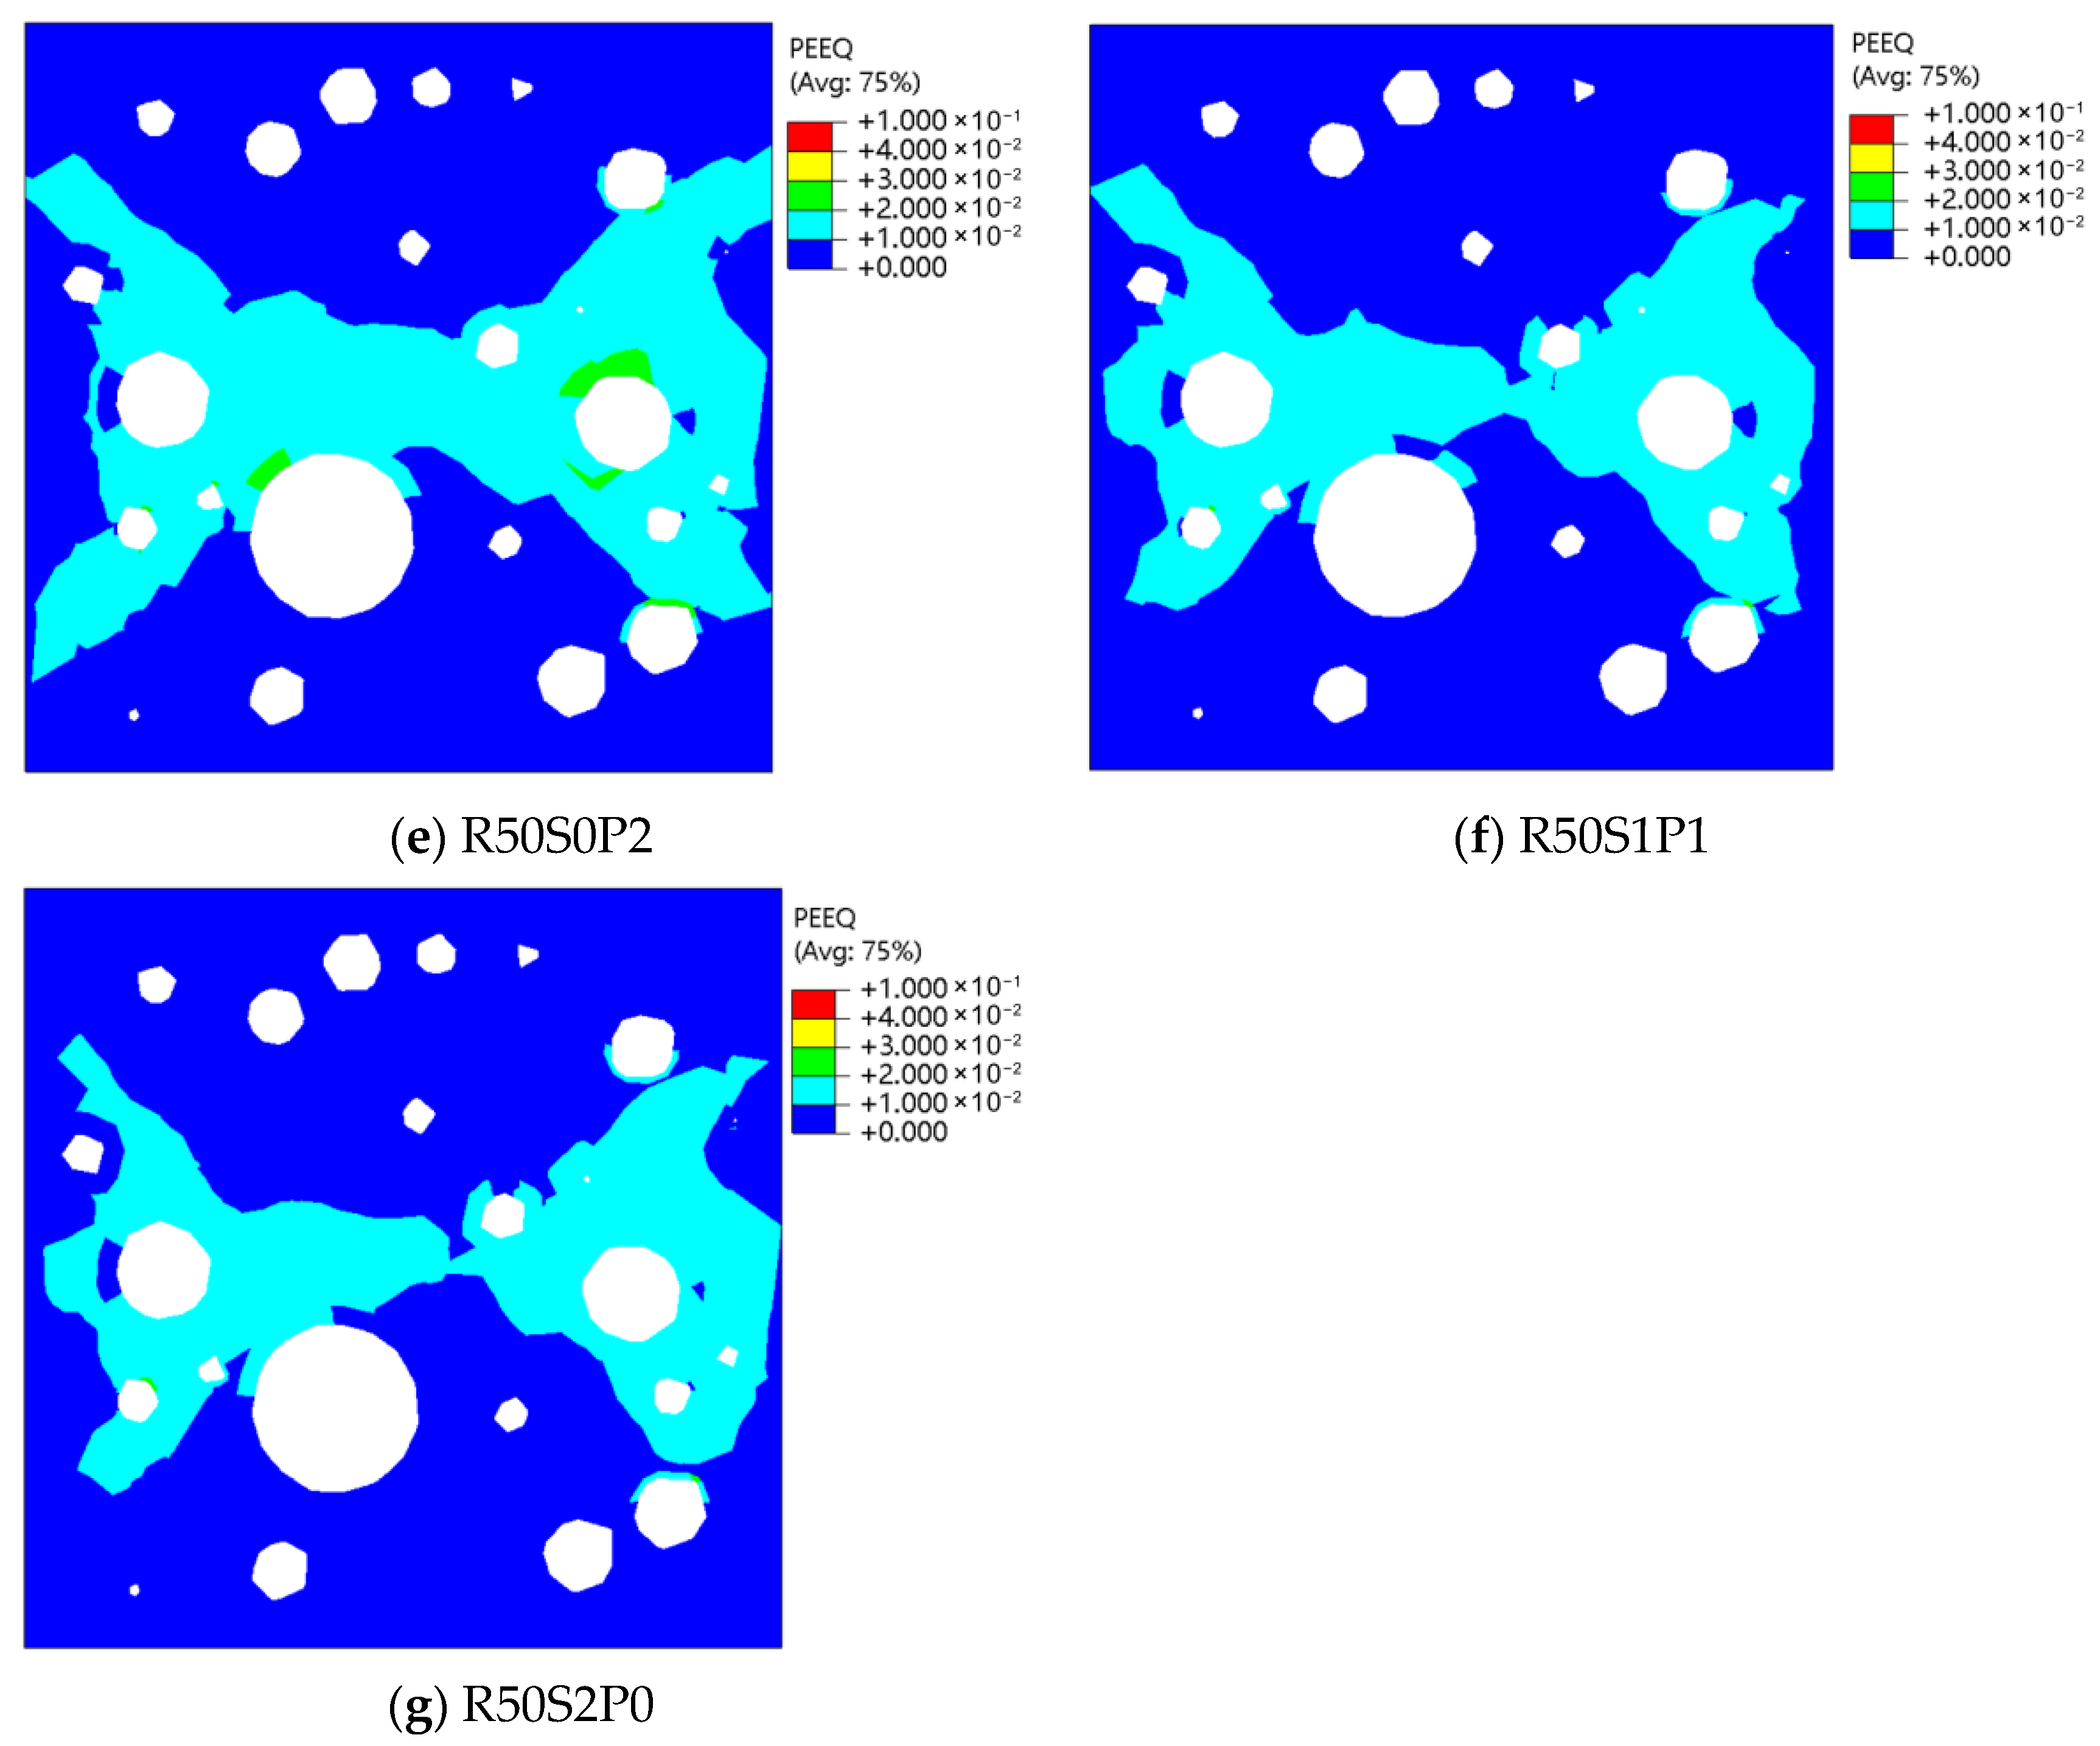
To investigate the effect of different fiber dosage combinations on the mechanical properties of RAC, mesoscopic numerical models were established for each combination (Table 5), and vertical compression simulations were performed using the same modeling and simulation procedures as described previously. Equivalent plastic strain (PEEQ) was selected as the indicator of material damage, since higher PEEQ values represent greater plastic deformation. According to relevant studies, the compressive failure threshold of concrete can be set at PEEQ = 0.01 [42].
The PEEQ nephograms of the mid-sections at peak load are shown in Figure 11. In all cases, regions exceeding the threshold formed an X-shaped pattern, consistent with the failure mode observed in uniaxial compression tests. As total fiber content increased, the area of regions exceeding the threshold decreased, as summarized in Table 6. The reduction in PEEQ area was generally proportional to the total fiber content, and specimens with higher SF proportions exhibited smaller damaged areas, indicating that SF contributes more significantly than rPETF to crack resistance. However, Table 6 also shows that the difference in area ratios between fiber combinations at 2.0% total fiber content is not markedly greater than at 1.0%. This suggests that increasing fiber content beyond a certain level does not necessarily improve performance, a finding consistent with the uniaxial compression test results reported in this study.

3. Parameter Sensitivity Analysis and Analysis of Simulated Results

3.1. Parameter Sensitivity Analysis

3.1.1. Sensitivity Analysis with Different Mesh Sizes

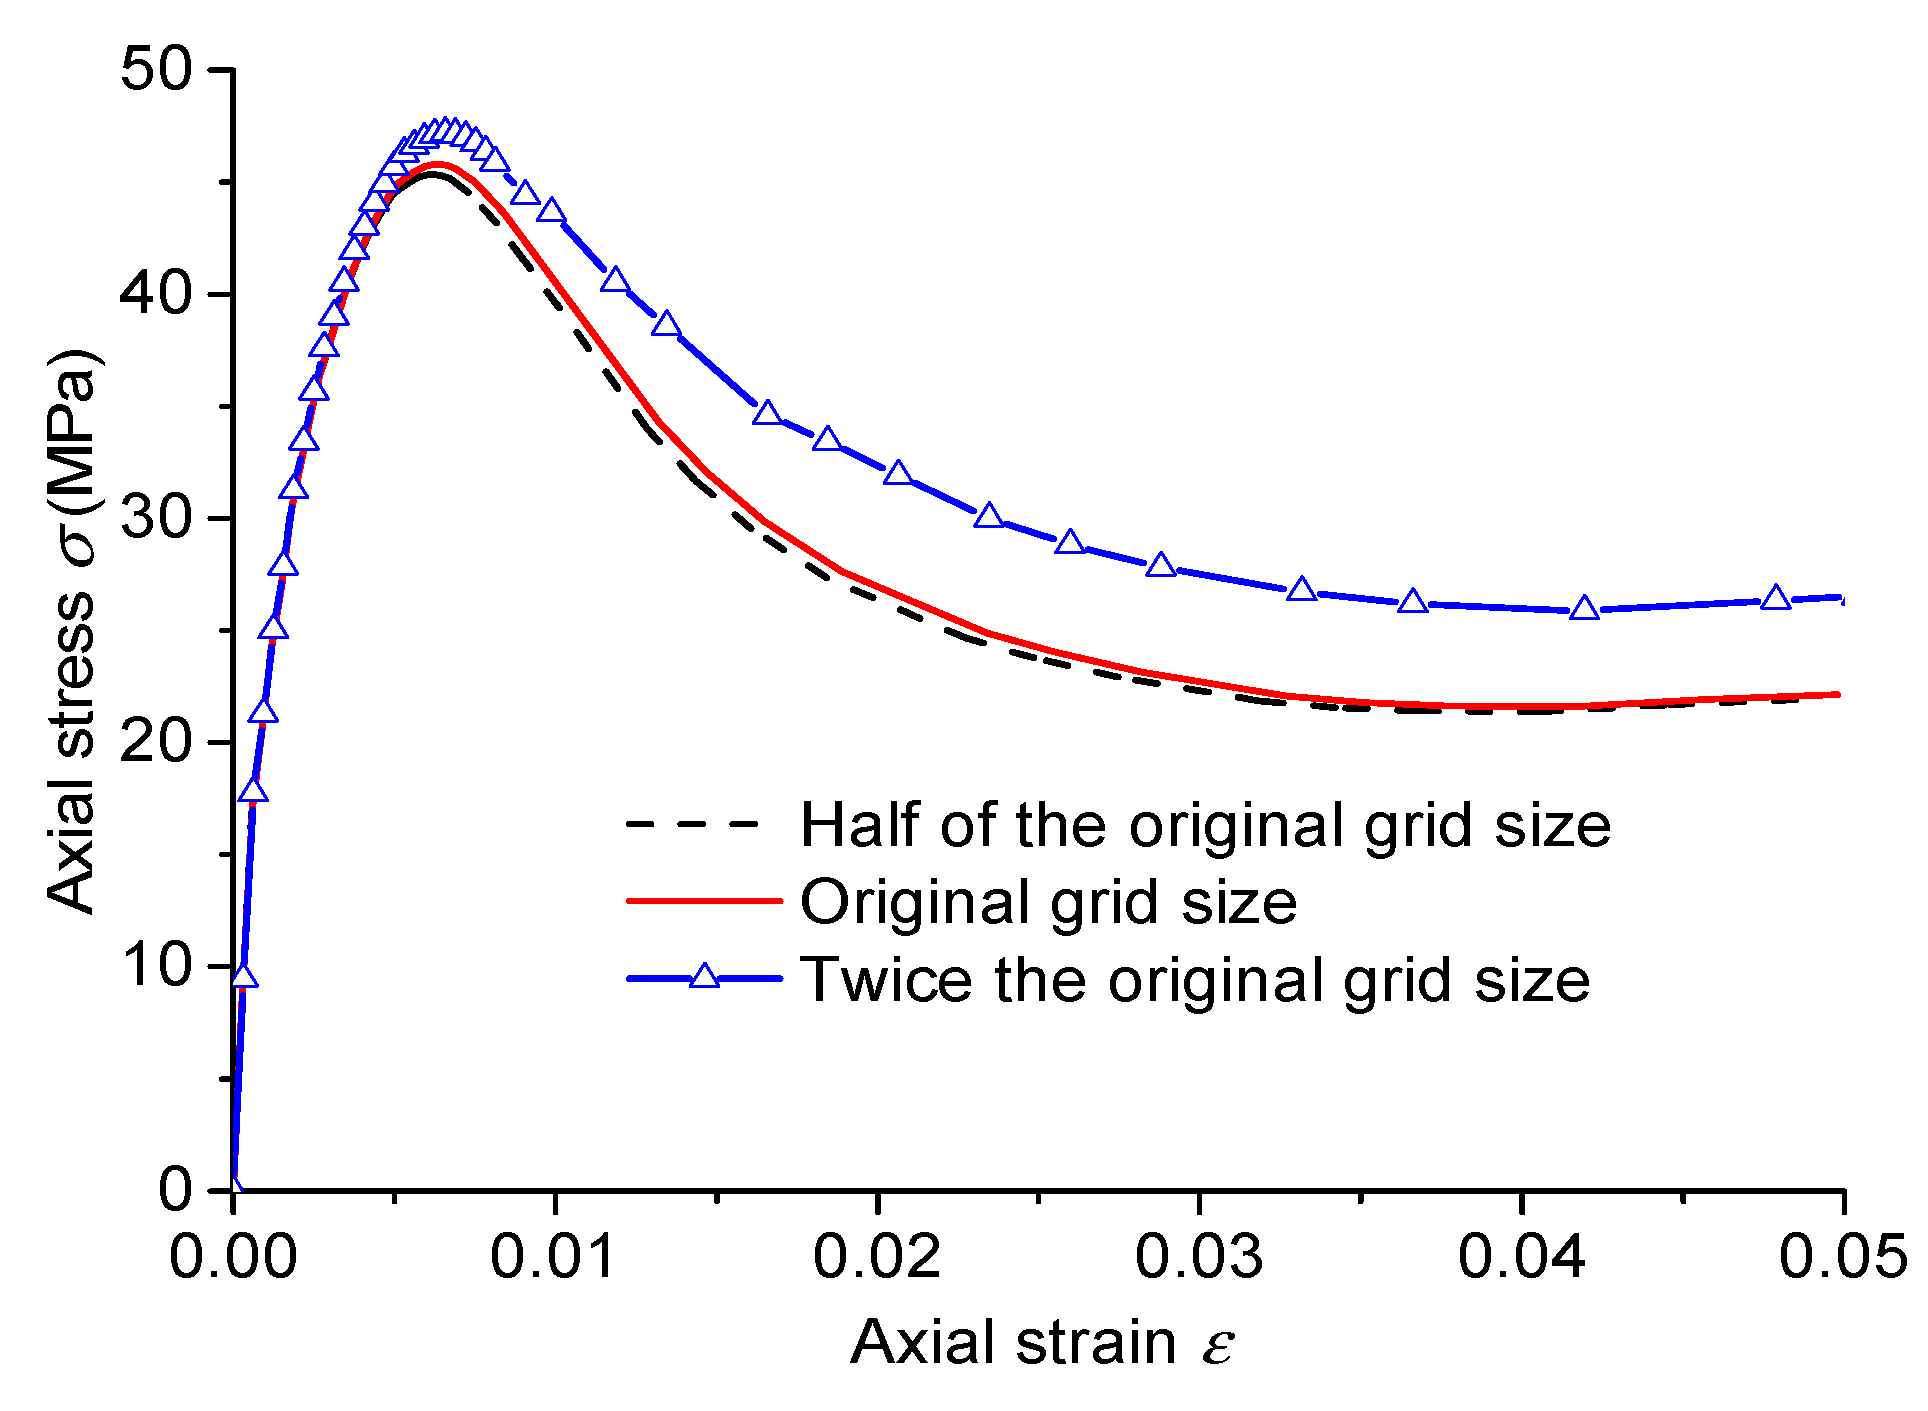
To examine the influence of mesh size on simulation results, finite element models of specimen R50S1P1 were established with three mesh sizes: half of the original, the original, and twice the original. The corresponding compressive stress–strain curves are shown in Figure 12, and the extracted peak stress, peak strain, and residual stress values are listed in Table 7. As shown, decreasing the mesh size leads to more stable results. With the original mesh size, the ascending portion of the stress–strain curve is similar to those of the other two mesh sizes, while the descending portion exhibits noticeable differences, particularly in terms of higher residual stress. Table 7 also indicates that finer meshes significantly increase computation time. Therefore, mesh size selection must balance accuracy with computational efficiency.

3.1.2. Sensitivity Analysis with Different Loading Rates

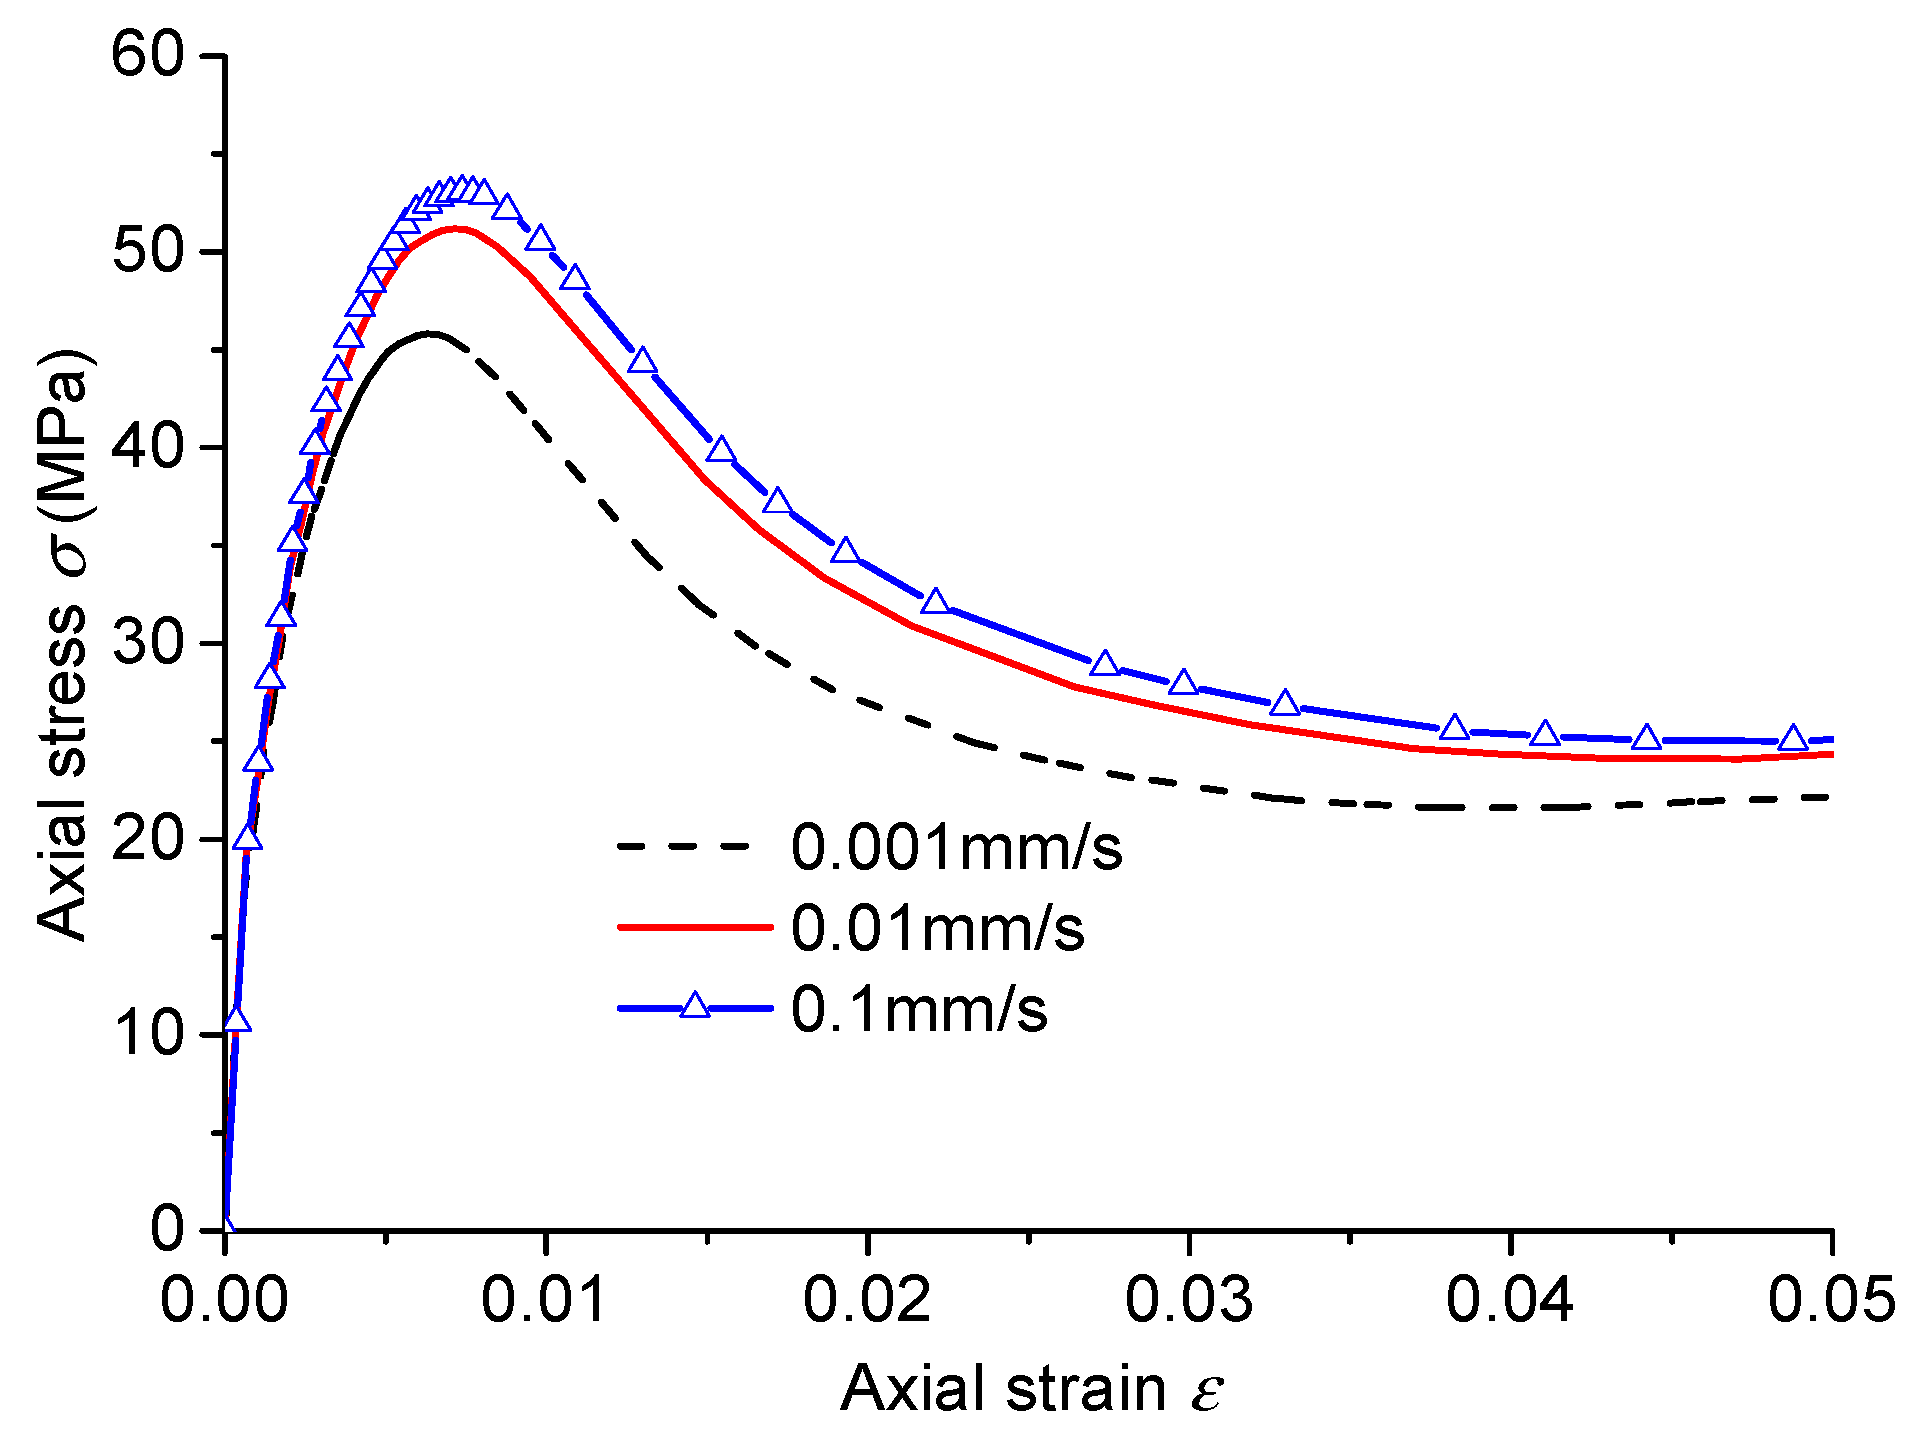
To investigate the effect of loading rate on simulation results, finite element models of specimen R50S1P1 were established with three loading rates: 0.001 mm/s, 0.01 mm/s, and 0.1 mm/s. The resulting stress–strain curves are presented in Figure 13, and the corresponding stress and strain values are summarized in Table 8. As shown, the loading rate has a pronounced influence on the results. With increasing loading rate, peak stress, peak strain, and residual stress all rise accordingly. Compared with quasi-static loading (0.001 mm/s), peak stress increases by 11.7–15.8%, peak strain by 13.0–17.0%, and residual stress by 9.0–12.2% at loading rates of 0.01 mm/s and 0.1 mm/s.

3.1.3. Sensitivity Analysis with Different Boundary Conditions

To analyze the effect of different boundary conditions on the finite element simulation, models of specimen R50S1P1 were established with two boundary conditions: (Type I) full degrees of freedom constraints applied to the top and bottom surfaces, and (Type II) steel plate constraints on the top and bottom surfaces. In the latter case, the influence of different penalty friction coefficients (PFC) on the simulation results was also considered. The steel plates measured 120 mm × 120 mm × 15 mm, with an elastic modulus of 200 GPa and a Poisson’s ratio of 0.2. A schematic of the steel plate constraint conditions is shown in Figure 14.
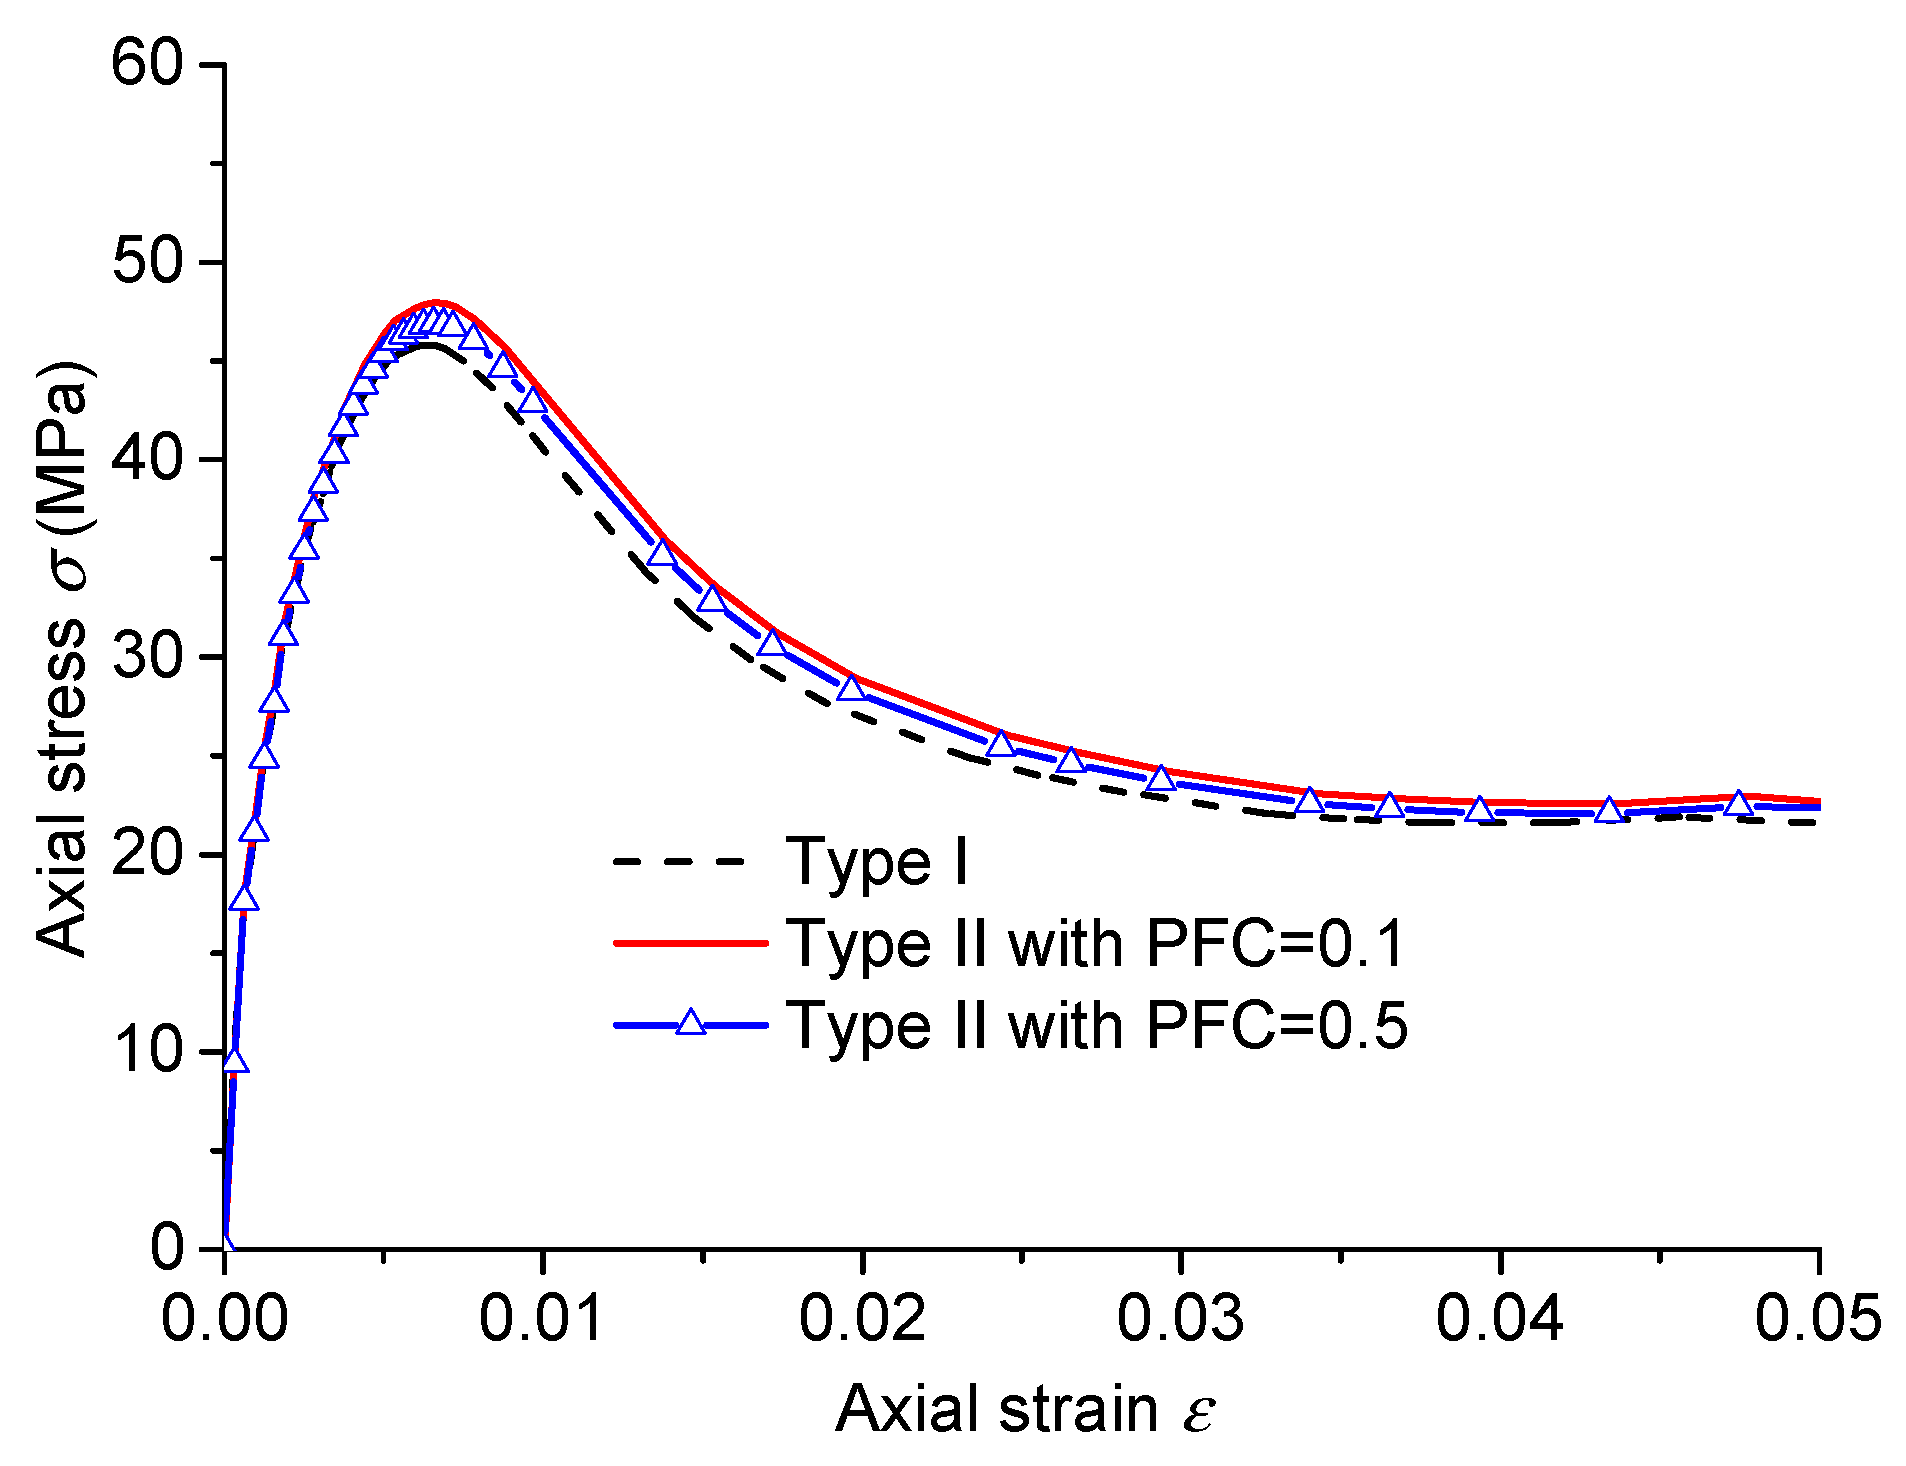
For the loading plate constraints, the contact properties between the plate and the specimen were defined as normal hard contact with tangential penalty friction. The effect of different penalty friction coefficients (PFC = 0.1 and 0.5) was then examined. The resulting stress–strain curves are shown in Figure 15, and the corresponding stress and strain values are summarized in Table 9. The results indicate that peak stress, peak strain, and residual stress obtained with the Type II boundary are all higher than those from the Type I boundary. Moreover, values calculated with PFC = 0.5 are slightly lower than those with PFC = 0.1. Compared with the Type I boundary, the increases obtained under Type II conditions are 2.3–4.7% for peak stress, 4.1–4.8% for peak strain, and 3.2–3.7% for residual stress. These results show that boundary conditions affect the simulation outcomes: stronger bottom constraints produce higher stress and strain values. However, the differences remain within 5%, indicating that the Type I boundary is sufficient for engineering applications. In addition, Type II modeling requires considerably more computation time. Therefore, considering accuracy, efficiency, and ease of modeling, the Type I boundary was selected as the preferred condition for finite element simulations.

3.2. Analysis of Simulated Results

3.2.1. Stress Distribution Law

Von Mises stress, derived from the strain energy density theory, is commonly used to evaluate the failure risk of materials under complex stress states. Its expression is given in Equation (9). The equivalent Mises stress nephogram of specimen R50S1P1 was extracted, with tensile stress defined as positive and compressive stress as negative. Figure 16 presents the equivalent von Mises stress distribution at the mid-section of the R50S1P1 cube under compression at different loading stages. At the initial loading stage, the stress distribution is relatively uniform. At peak load, stresses inside the specimen are much higher than at the edges, with coarse aggregate carrying higher stress than mortar. At the end of loading, the stress distribution forms two opposing cones, consistent with the stress patterns observed in compression tests of concrete cubes.

3.2.2. Evolution Law of Specimen Damage

The evolution law of damage refers to the entire process of internal damage in materials from initiation to ultimate failure, manifested as mechanical behaviors such as stiffness degradation and strength decrease. Material performance changes are usually quantified by damage variables (such as 0 indicating no damage and 1 indicating complete failure).
Compression damage coefficient:
d c = 1 β c ε ˜ c i n E 0 σ c 1 β c ε ˜ c i n E 0
where dc is the compressive damage coefficient, ε ˜ c i n represents the inelastic compressive strain, βc is the proportion of plastic strain in the inelastic compressive strain, E0 is the initial elastic modulus (MPa), and σc is the compressive stress (MPa).
Tensile damage coefficient:
d t = 1 β t ε ˜ t i n E 0 σ t 1 β t ε ˜ t i n E 0
In the formula, dt is the tensile damage coefficient, ε ˜ t i n is the inelastic tensile strain, βt is the proportion of plastic strain in the inelastic tensile strain, and σt is the tensile stress (MPa).
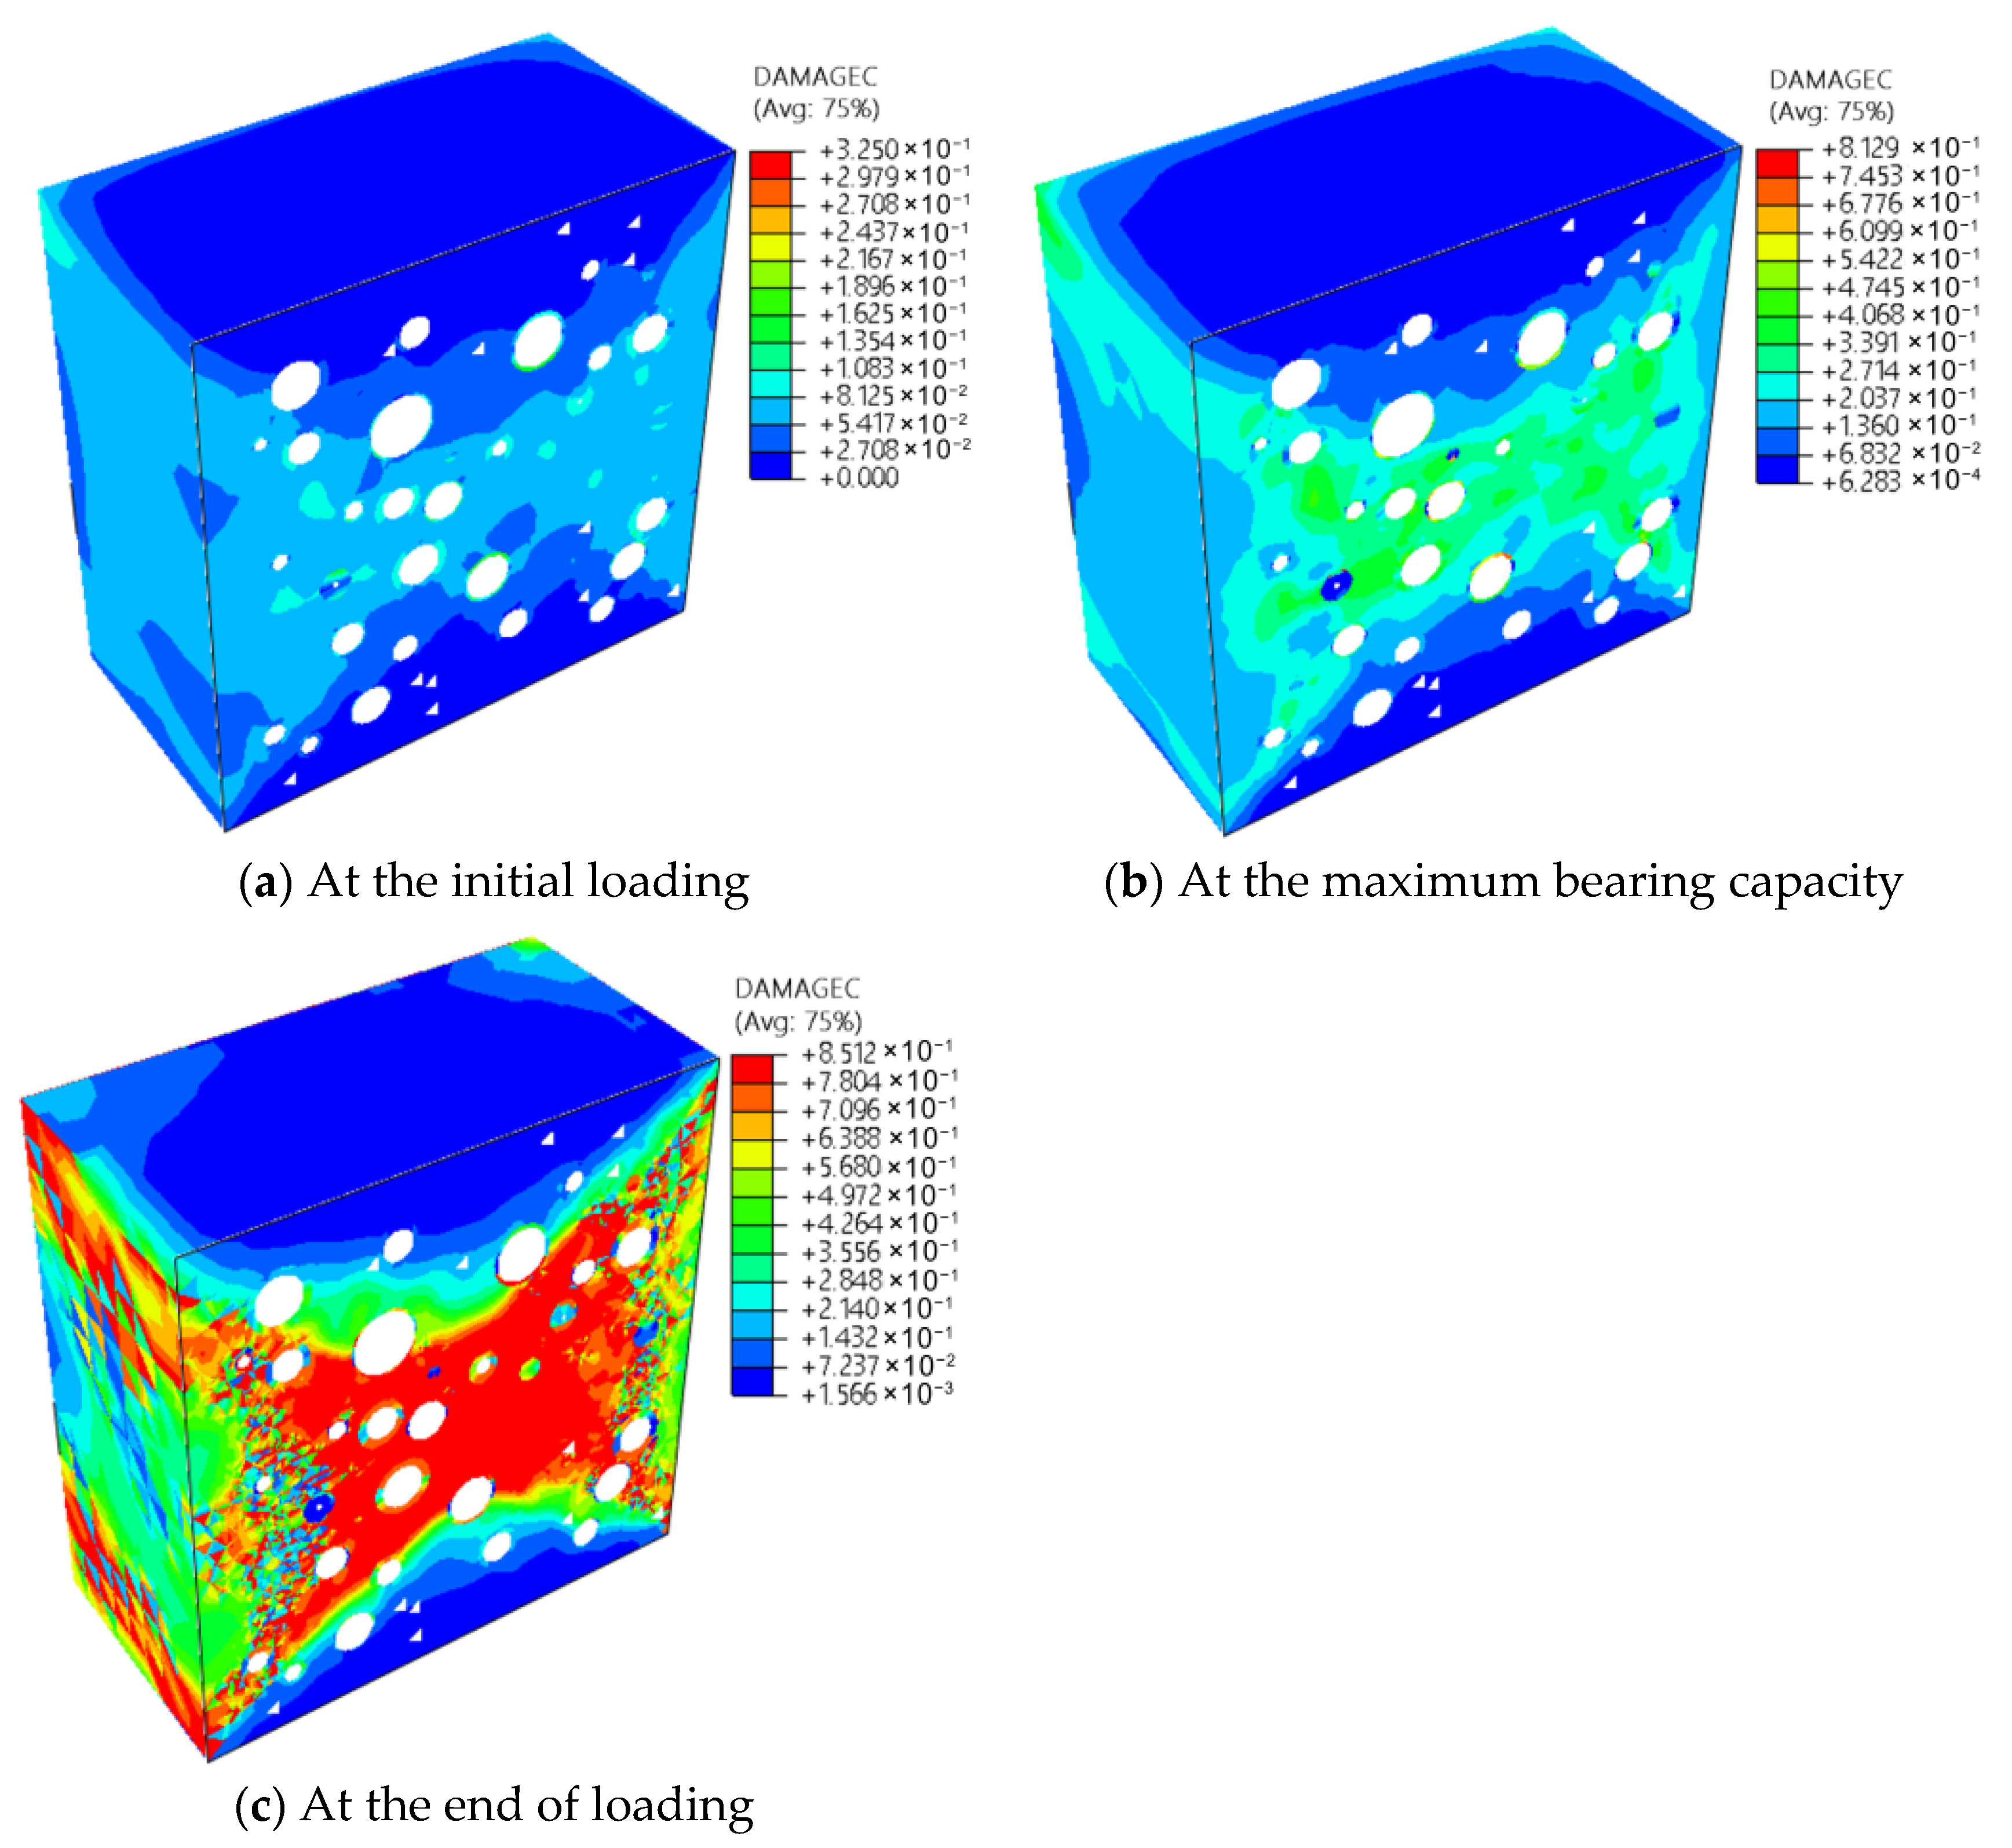
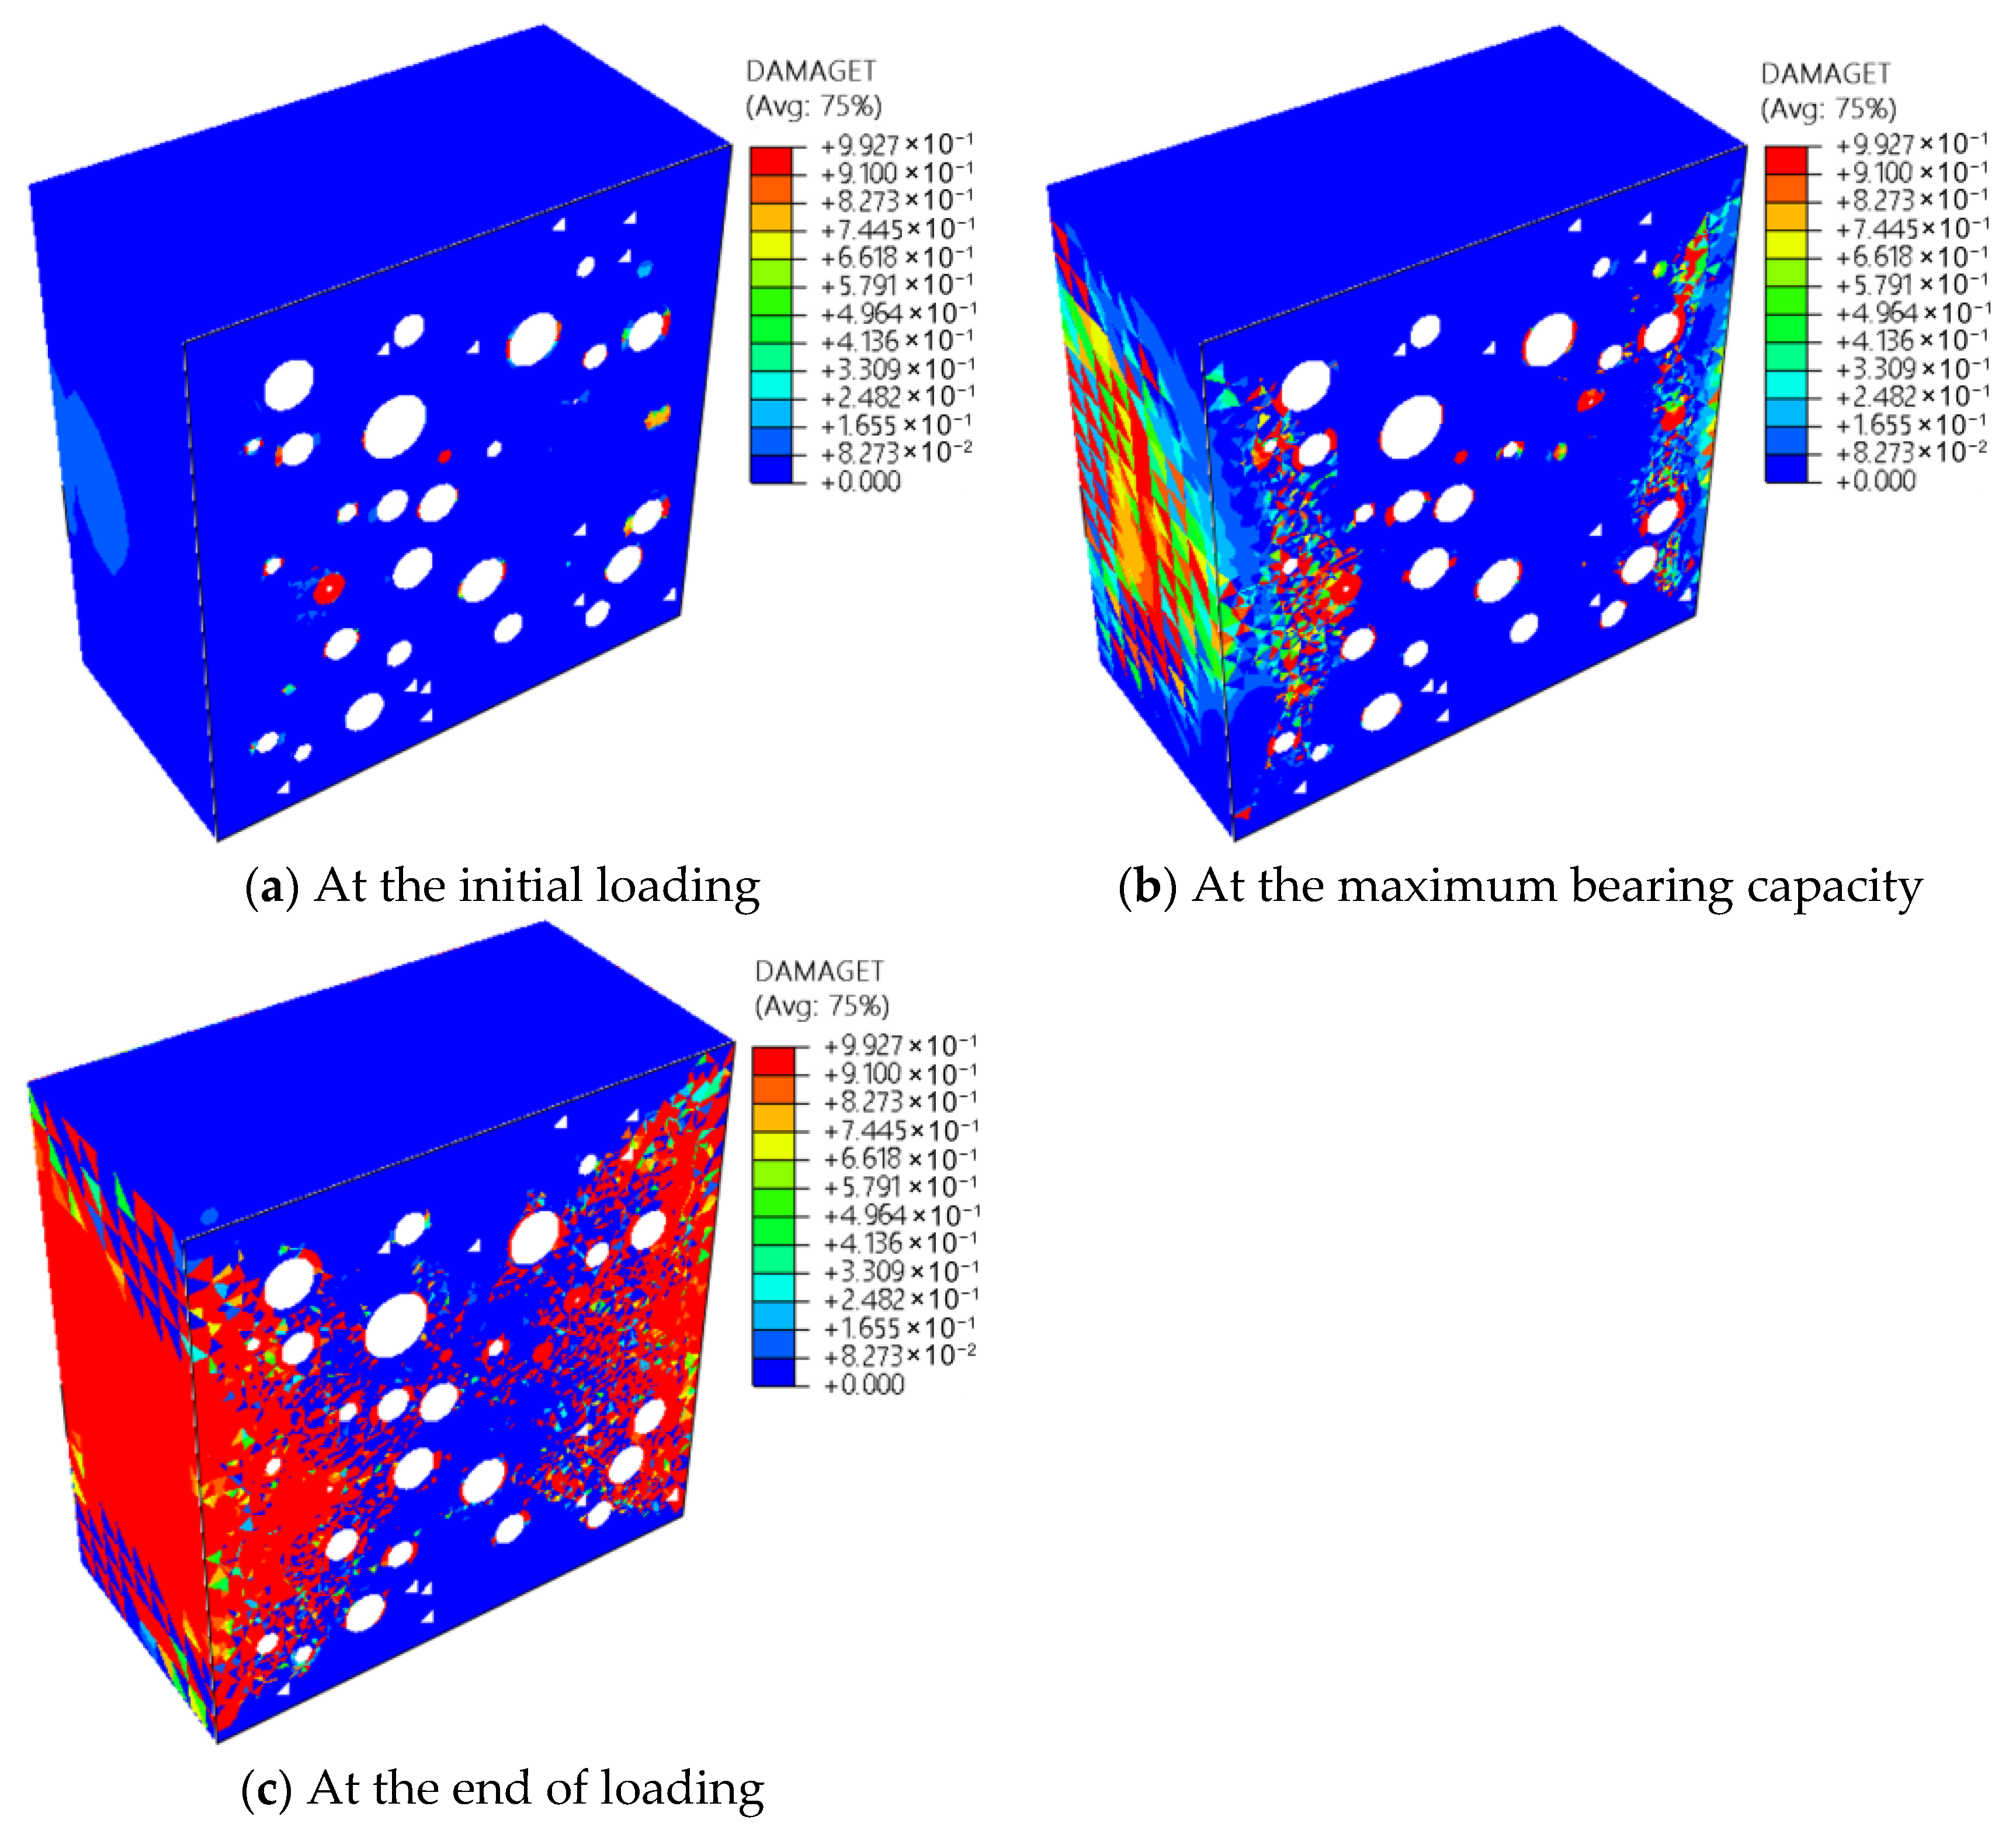
The evolution of the nephograms of compressive and tensile damage of the specimen is shown in Figure 17 and Figure 18. From these figures, it can be seen that when the specimen is subjected to vertical compressive load, both compressive damage and tensile damage occur earliest in the ITZ, mainly because the ITZ is the weak zone. Afterwards, compressive damage and tensile damage extended to the mortar area and gradually penetrated to form a damage penetration zone, which continued to develop until the specimen failed, with maximum damage values of 0.813 and 0.992, respectively. Comparing Figure 17 and Figure 18, it is found that the compressive damage at the end of loading is mainly located inside the specimen and forms a clear X-shaped damage zone, while the tensile damage is mainly distributed around the specimen, and no continuous damage zone is formed in the central area of the specimen.

3.2.3. Evolution Law of ITZ Damage

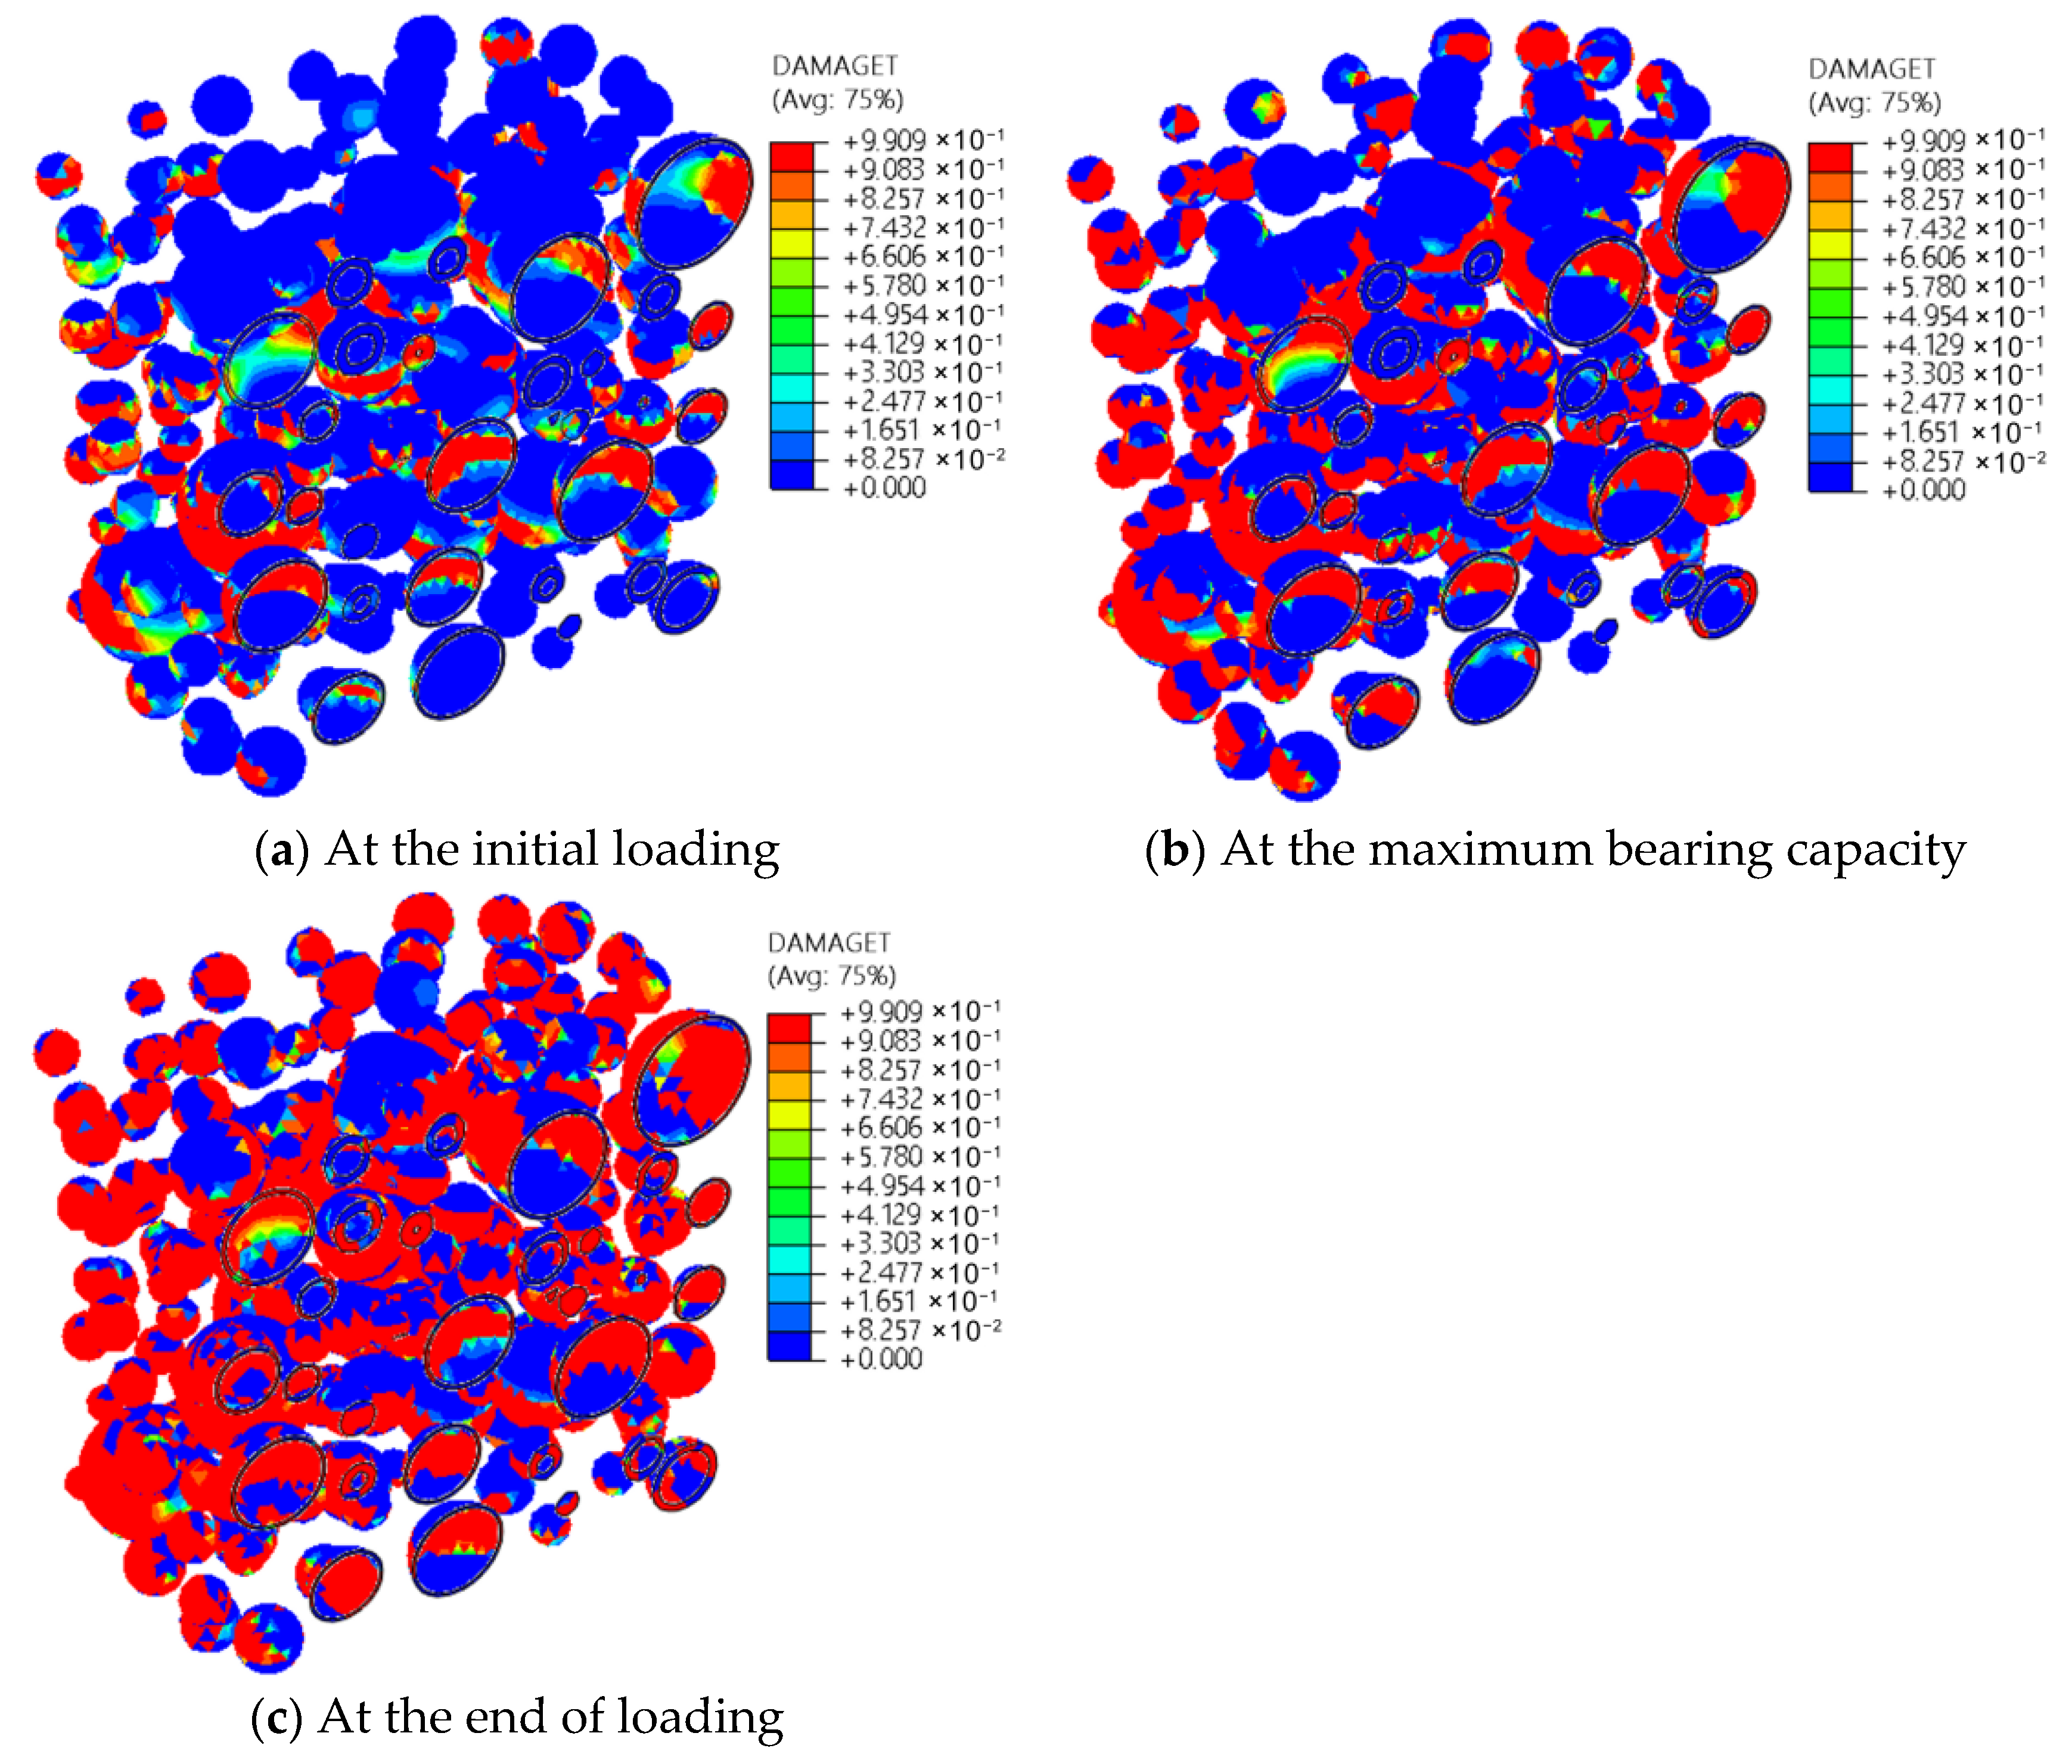
The compression and tension damage nephograms of the ITZ are shown in Figure 19 and Figure 20, respectively. As seen, under compression, the ITZ damage first appears at the top and bottom of the spherical aggregate, while tensile damage initiates on the sides of the coarse aggregate. The larger the RCA particle size, the more severe both compressive and tensile ITZ damage becomes. For aggregates of equal size, ITZ damage between RCA and mortar is more pronounced than that between NCA and mortar. With progressive displacement loading, the ITZ around aggregates of different sizes gradually develops compressive and tensile damage, which then extends from localized regions to the ITZ throughout the specimen. At advanced stages, extensive areas of severe ITZ damage appear (highlighted in red in the nephograms). Ultimately, both compression and tension damage nephograms show widespread failure zones, indicating macroscopic failure of the material and loss of load-bearing capacity.

3.2.4. Force Characteristics of Fibers

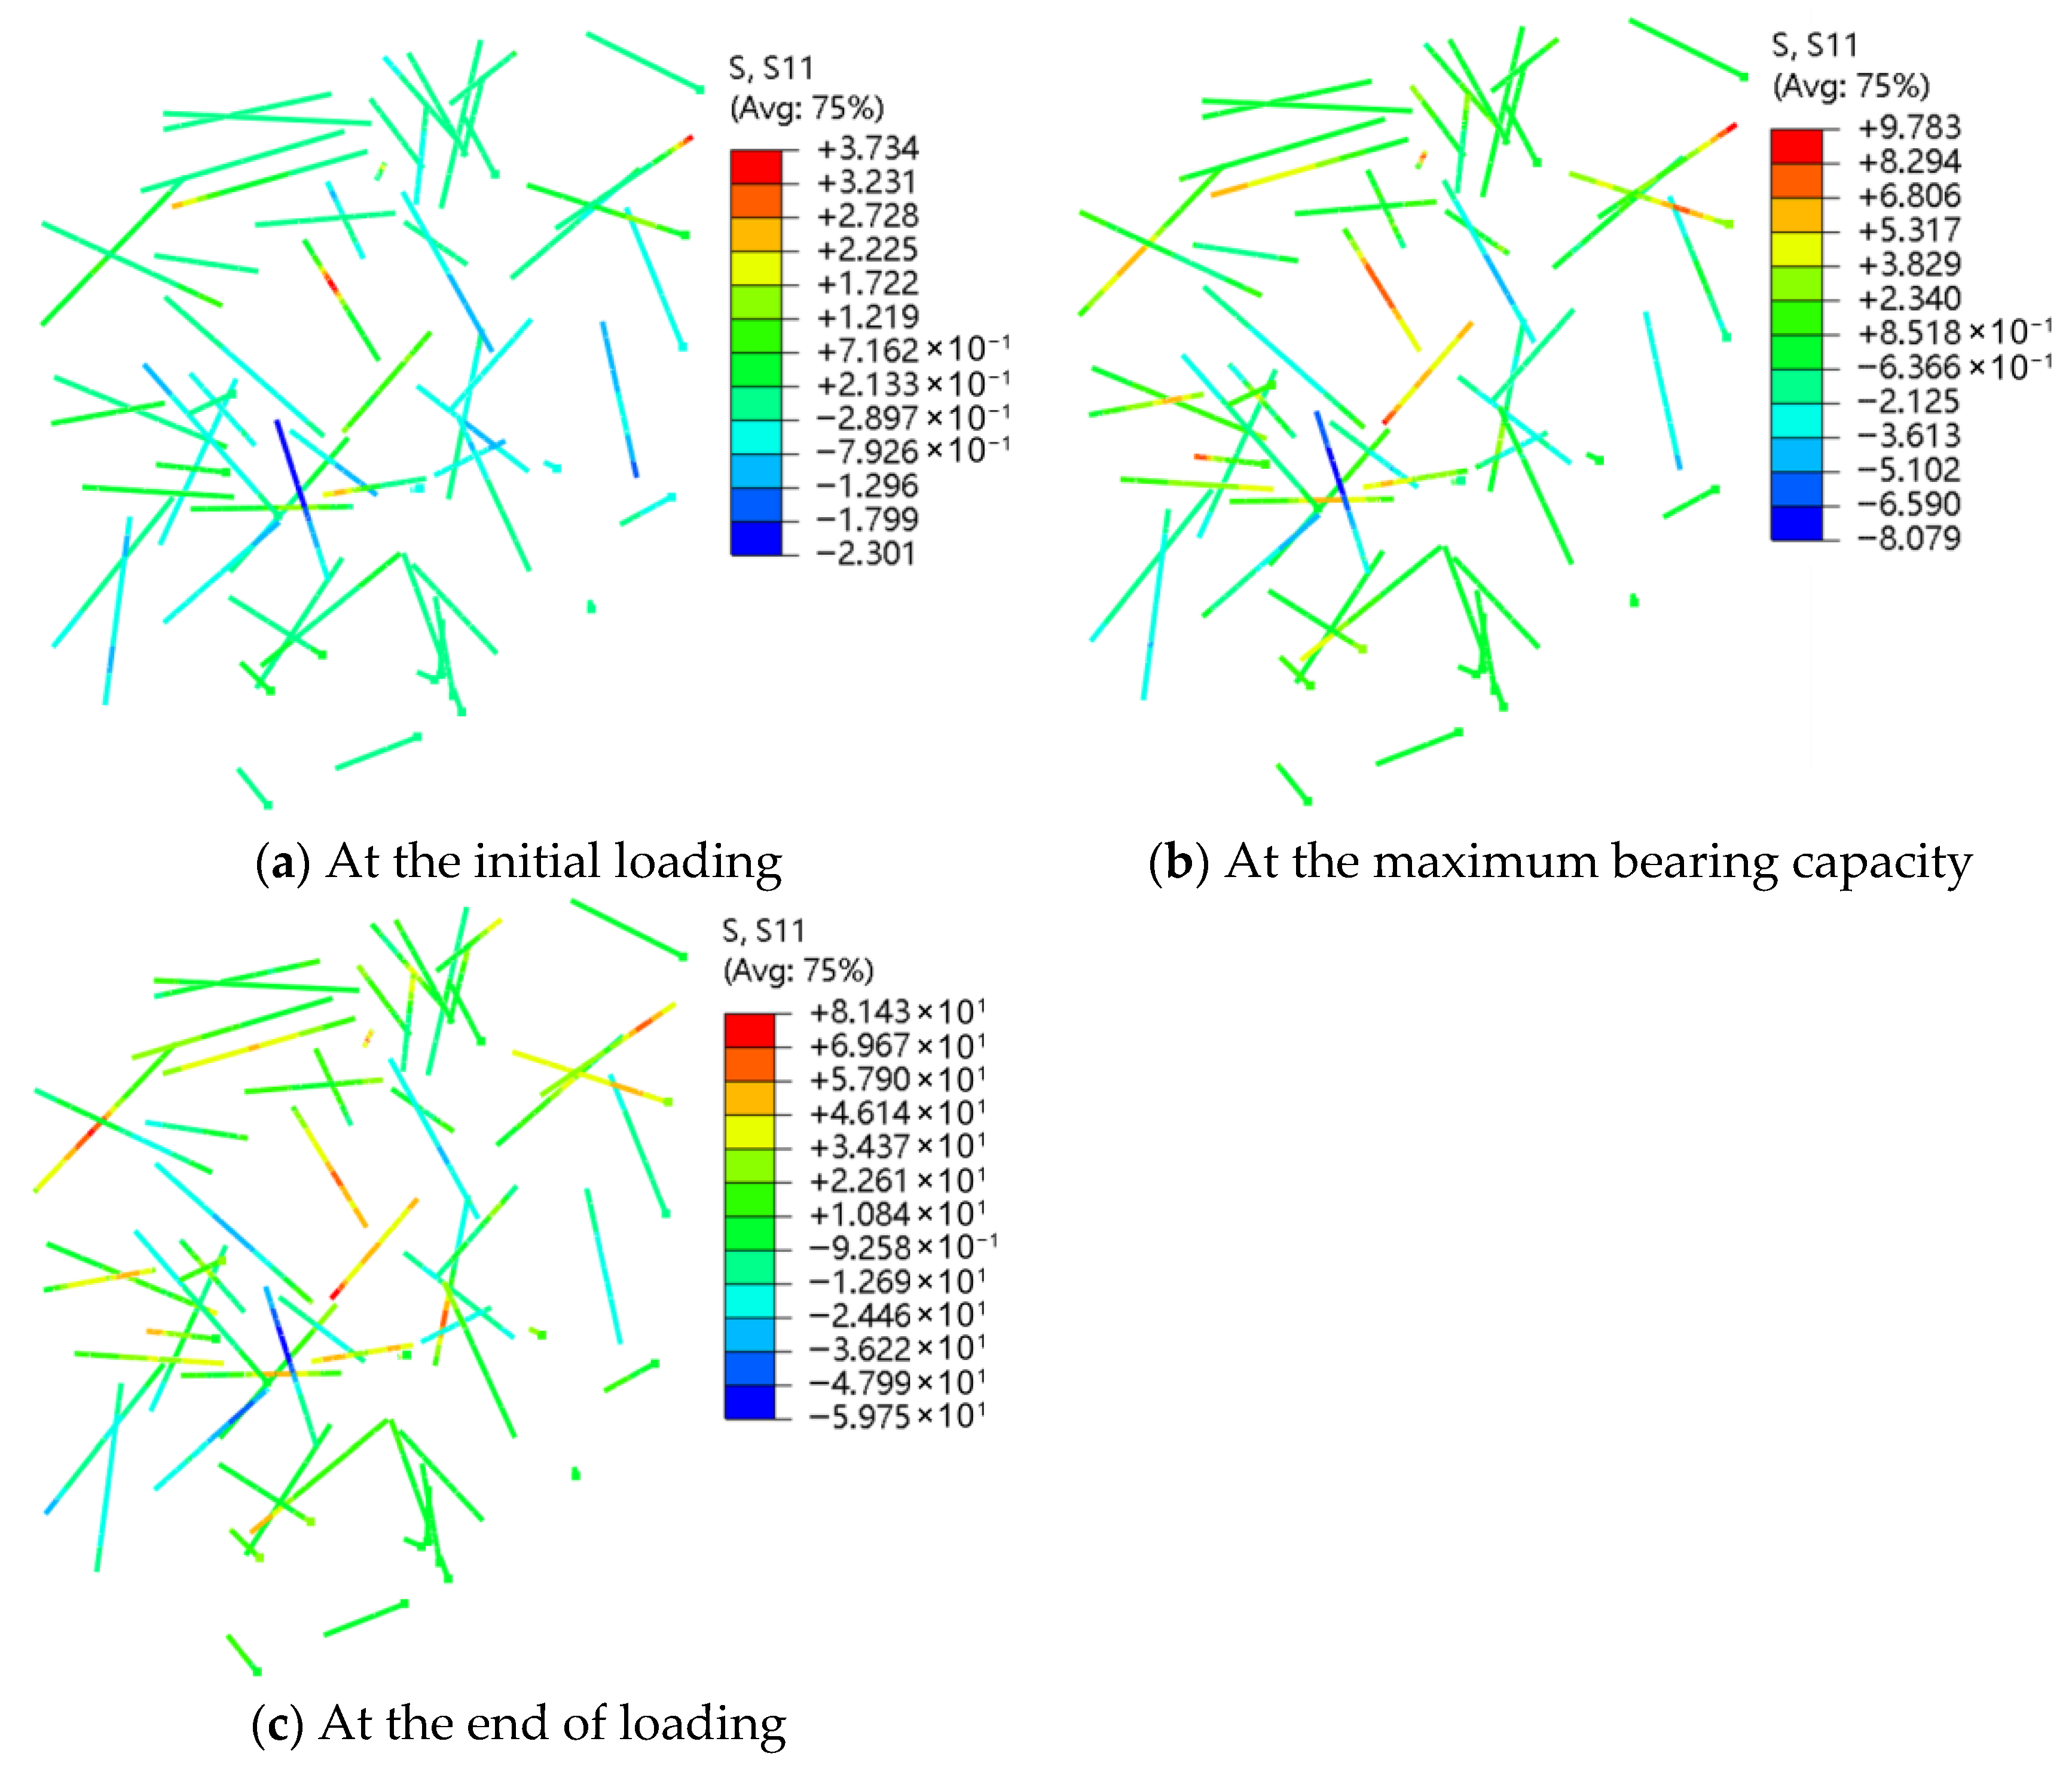
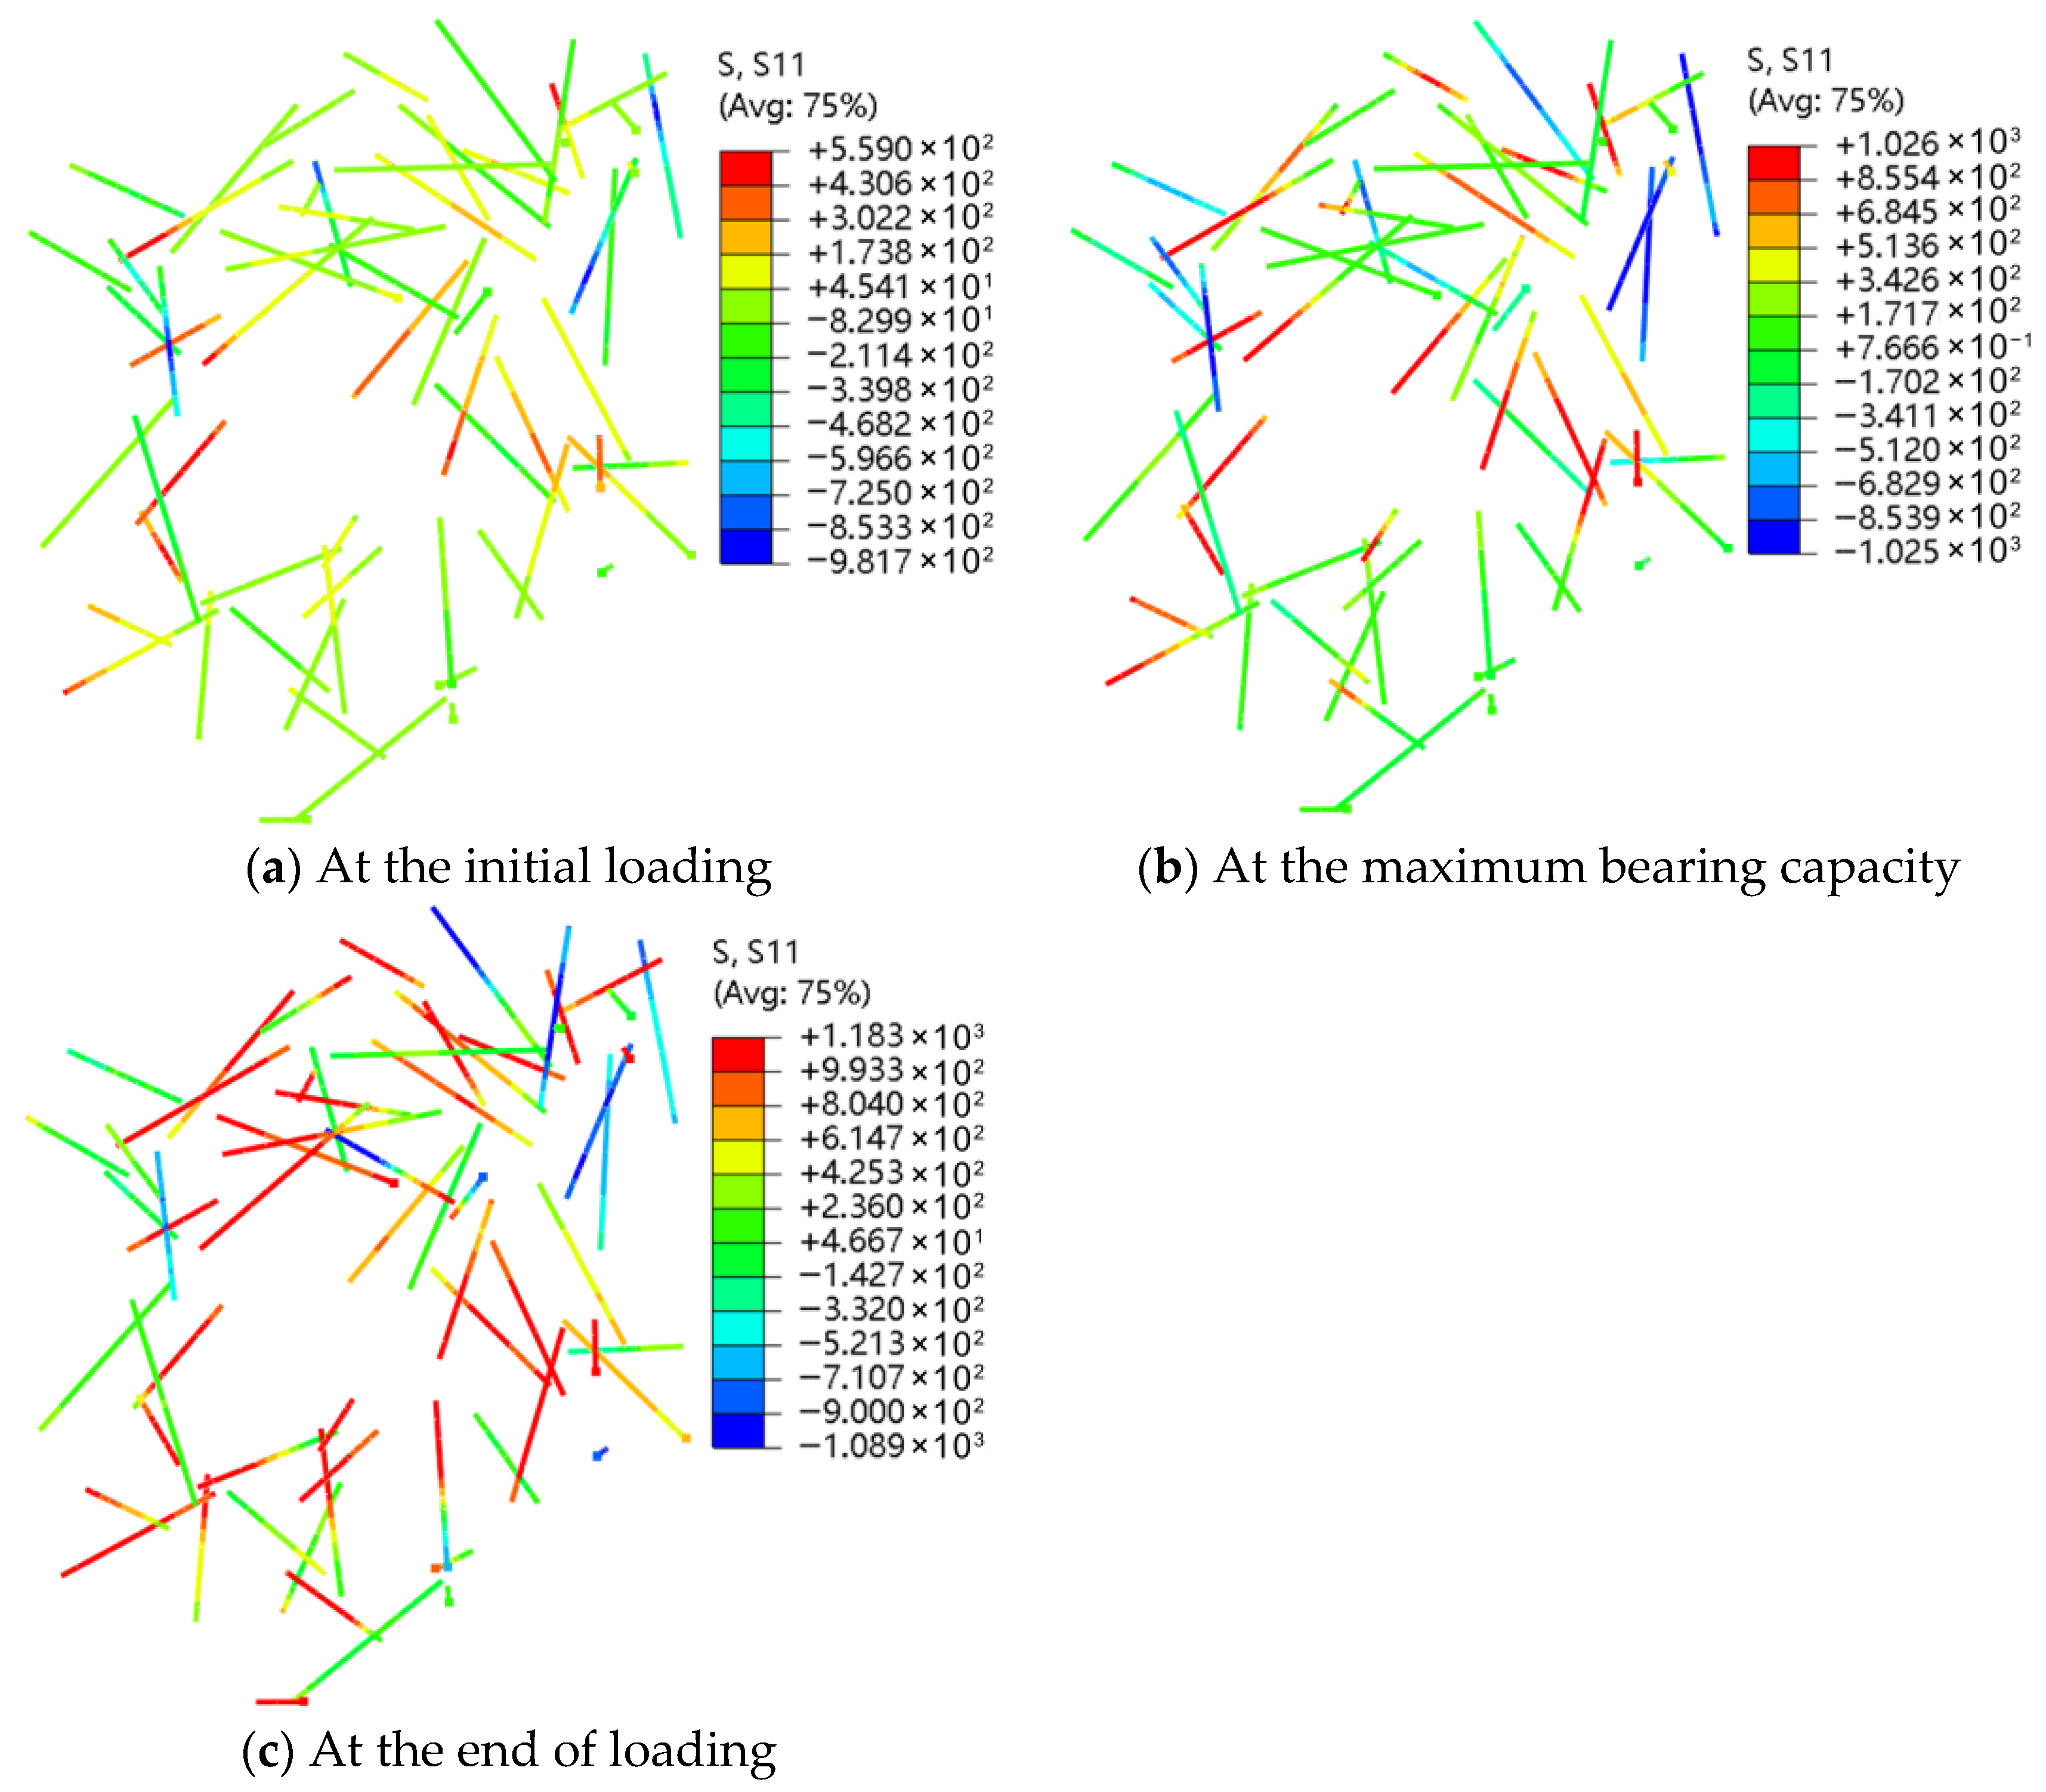
In Abaqus, the axial force of fibers is represented by S11 (positive for tension and negative for compression). The stress nephograms of rPETF and SF are shown in Figure 21 and Figure 22. As seen, both fiber types experience tensile and compressive stresses. During the initial loading stage, most fibers are under compression, with only a few in tension. At peak load, the number of tensile fibers increases significantly, while compressive fibers decrease. After loading is complete, most fibers are in tension, which is critical since tensile fibers contribute to reinforcement and crack resistance in RAC; therefore, the following analysis focuses on fibers in tension.
At early loading, the maximum tensile stress of rPETF is relatively small (~3.7 MPa), whereas that of SF is much higher (~559 MPa). With increasing vertical load, both tensile and compressive stresses rise. At peak capacity, rPETF reaches ~9.8 MPa, and SF ~1026 MPa, with rPETF showing a larger relative increase. After peak load, as specimen capacity decreases, tensile stresses in both fiber types continue to rise, reaching ~81.4 MPa for rPETF and ~1183 MPa for SF at final loading. Although SF carries much higher absolute stress, its post-peak stress increase is modest compared with rPETF. This is attributed to the higher modulus of SF, which allows it to efficiently bear and distribute tensile stress at low plastic strain, mitigating stress concentration. In contrast, rPETF, being a low-modulus fiber, is less effective at early stages but plays a more pronounced role in the post-peak phase.
Overall, both SF and rPETF continue to bear and redistribute tensile stress after peak load, thereby enhancing the post-peak strength, suppressing crack propagation, and improving the ductility of RAC.

4. Conclusions

In this study, the Fuller gradation curve and the Monte Carlo method were employed to determine the distribution of coarse aggregates, while a fiber interference detection algorithm was used to achieve the random distribution of SF and rPETF. A mesoscopic SRPRAC model was developed using Python and Abaqus and was applied to analyze the compressive failure mode of SRPRAC as well as the effects of multiple influencing factors. The main conclusions are as follows:
(1)
The simulation results show that smaller mesh sizes yield more stable and accurate results, though with longer computation times. The loading rate has a pronounced effect: higher rates increase peak stress, peak strain, and residual stress. Stronger top and bottom surface constraints also lead to higher calculated values of these parameters.
(2)
Under vertical compression, the first form of compressive and tensile damage occurs in the ITZ, subsequently spreading into the mortar. At final loading, compressive damage is mainly concentrated inside the specimen, forming a distinct X-shaped damage zone, while tensile damage develops around the specimen perimeter.
(3)
Larger RCA particle sizes result in more severe ITZ damage. For engineering practice, smaller RCA particles should be used, or larger RCAs should be crushed to finer fractions to enhance RAC strength.
(4)
With increasing fiber content, the area of PEEQ regions above the threshold decreases, though this trend slows beyond 1.0% total fiber content. Initially, SF bears higher tensile stress, while rPETF stress is low. After peak load, SF stress increases gradually, whereas rPETF stress rises sharply.
(5)
The proposed mesoscopic model reliably reflects stress, strain, and damage evolution in SRPRAC and can serve as a tool for parameter optimization.
Overall, the results confirm that the ITZ between RCA and mortar is the weakest region in RAC. Both individual and combined additions of rPETF and SF enhance compressive strength, crack resistance, and residual strength, consistent with experimental results. These findings provide practical guidance for the use of rPETF- and SF-modified RAC. Further work should investigate the optimal dimensions of the fibers and their bonding–sliding behavior under stress.

Author Contributions

Methodology, K.R.C.; software, S.G. and Q.L.; formal analysis, Q.L. and K.R.C.; investigation, S.G.; resources, K.R.C.; data curation, S.G., Q.L. and J.K.; writing—original draft preparation, J.K. All authors have read and agreed to the published version of the manuscript.

Funding

This research was funded by the Scientific Research Project of Tianjin Municipal Education Commission (No. 2022KJ018) and the Tianjin Technology Innovation Guidance Special Fund (No. 23YDTPJC00110).

Institutional Review Board Statement

Not applicable.

Informed Consent Statement

Not applicable.

Data Availability Statement

Some or all data, models, or code that support the findings of this study are available from the corresponding author upon reasonable request.

Conflicts of Interest

The authors declare no conflicts of interest.

Abbreviations

RCArecycled coarse aggregate
NCAnatural coarse aggregate
RACrecycled aggregate concrete
NACnatural aggregate concrete
ITZinterfacial transition zone
PETpolyethylene terephthalate
rPETFrecycled PET fibers
SFsteel fibers
SRPRACsteel-recycled polyethylene terephthalate hybrid fiber recycled concrete

References

  1. Gao, D.; Zhang, L.; Nokken, M. Compressive behavior of steel fiber reinforced recycled coarse aggregate concrete designed with equivalent cubic compressive strength. Constr. Build. Mater. 2017, 141, 235–244. [Google Scholar] [CrossRef]
  2. Sun, L.; Hao, Q.; Zhao, J.; Wu, D.; Yang, F. Stress strain behavior of hybrid steel-PVA fiber reinforced cementitious composites under uniaxial compression. Constr. Build. Mater. 2018, 188, 349–360. [Google Scholar] [CrossRef]
  3. Akca, K.R.; Cakir, O.; Ipek, M. Properties of polypropylene fiber reinforced concrete using recycled aggregates. Constr. Build. Mater. 2015, 98, 620–630. [Google Scholar] [CrossRef]
  4. Ajamu, S.O.; Ige, J.A.; Oyinkanola, T.M. Effect of waste (PET) bottle fibers on the properties of concrete. Int. J. Res. Eng. Technol. 2018, 6, 1–8. [Google Scholar]
  5. Kassa, R.B.; Kanali, C.; Ambassah, N. Flexural performance evaluation of polyethylene terephthalate fibre reinforced concrete with fly ash as a partial cement replacement. Int. J. Eng. Res. Technol. 2019, 12, 1417–1422. [Google Scholar]
  6. Soe, K.T.; Zhang, Y.X.; Zhang, L.C. Material properties of a new hybrid fibre-reinforced engineered cementitious composite. Constr. Build. Mater. 2013, 43, 399–407. [Google Scholar] [CrossRef]
  7. Maalej, M.; Quek, S.T.; Ahmed, S.F.U. Review of potential structural applications of hybrid fiber engineered cementitious composites. Constr. Build. Mater. 2012, 36, 216–227. [Google Scholar] [CrossRef]
  8. Ahmed, S.F.U.; Maalej, M.; Paramasivam, P. Flexural responses of hybrid steel-polyethylene fiber reinforced cement composites containing high volume fly ash. Constr. Build. Mater. 2007, 21, 1088–1097. [Google Scholar] [CrossRef]
  9. Carneiroa, J.A.; Limaa, P.R.L.; Leite, M.B.; Filho, R.D.T. Compressive stress-strain behavior of steel fiber reinforced-recycled aggregate concrete. Cem. Concr. Compos. 2014, 46, 65–72. [Google Scholar] [CrossRef]
  10. Debora, M.C.; Albert, D.L.F.; Sergio, H.P.C. Fatigue of cracked high performance fiber reinforced concrete subjected to bending. Constr. Build. Mater. 2019, 220, 444–455. [Google Scholar] [CrossRef]
  11. Selvi, M.T.; Thandavamoorthy, T.S. Mechanical and durability properties of steel and polypropylene fibre reinforced concrete. Int. J. Earth Sci. Eng. 2014, 7, 696–703. [Google Scholar]
  12. Liang, X.W.; Wu, C. Meso-scale modelling of steel fibre reinforced concrete with high strength. Constr. Build. Mater. 2018, 165, 187–198. [Google Scholar] [CrossRef]
  13. Yao, Y.; Zhang, H.; Zhang, X.; Ren, F.; Li, Y.; Yang, Z. Experimental, analytical and numerical studies of interfacial bonding properties between silane-coated steel fibres and mortar. Buildings 2021, 11, 398. [Google Scholar] [CrossRef]
  14. Guo, S.L.; Zheng, D.J.; Zhao, L.H.; Lu, Q.; Liu, X.K. Mechanical test and constitutive model of recycled plastic fiber reinforced recycled concrete. Constr. Build. Mater. 2022, 348, 128578. [Google Scholar] [CrossRef]
  15. Peng, Y.; Chu, H.; Pu, J. Numerical simulation of recycled concrete using convex aggregate model and base force element method. Adv. Mater. Sci. Eng. 2016, 2016, 5075109. [Google Scholar] [CrossRef]
  16. Xiao, J.; Li, W.; Corr, D.J. Effects of interfacial transition zones on the stress–strain behavior of modeled recycled aggregate concrete. Cem. Concr. Res. 2013, 52, 82–99. [Google Scholar] [CrossRef]
  17. Xu, Y.; Geng, F.; Luan, H.; Chen, J.; Yang, H.; Gao, P. Three-dimensional mesoscopic DEM modeling and compressive behavior of macroporous recycled concrete. Buildings 2025, 15, 2655. [Google Scholar] [CrossRef]
  18. Qi, L.; Yu, B.; Yu, M.; Zhang, M. Simulation-based analysis of micro-damage to recycled concrete-containing brick coarse aggregates. Buildings 2023, 13, 2297. [Google Scholar] [CrossRef]
  19. Zhang, L.; Li, X.; Li, C.; Zhao, J.; Cheng, S. Mechanical properties of fully recycled aggregate concrete reinforced with steel fiber and polypropylene fiber. Materials 2024, 17, 1156. [Google Scholar] [CrossRef]
  20. Jayasuriya, A.; Bandelt, M.; Adamsm, P. Stochastic mesoscopic modeling of concrete systems containing recycled concrete aggregates using monte carlo methods. ACI Mater. J. 2022, 119, 3–18. [Google Scholar] [CrossRef]
  21. Meng, Q.P.; Wu, Y.Q.; Xiao, J.Z. The effect of micro-structural uncertainties of recycled aggregate concrete on its global stochastic properties via finite pixel-element Monte Carlo simulation. Front. Struct. Civ. Eng. 2018, 12, 16. [Google Scholar] [CrossRef]
  22. Ren, Q.F.; Pacheco, J.; de Brito, J. Mesoscale modeling of recycled aggregate concrete: A parametric analysis of the quality and shape of aggregate. Struct. Concr. 2025, 26, 1636–1653. [Google Scholar] [CrossRef]
  23. Lu, Y.; Song, Z.H.; Tu, Z.G. Analysis of dynamic response of concrete using a mesoscale model in Corporating 3D effects. Int. J. Prot. Struct. 2010, 1, 197–218. [Google Scholar] [CrossRef]
  24. Sun, M.Z.; Zhu, J.P. 3d concave-convex aggregate modeling based on python-abaqus and influence analysis of different shapes of aggregates. Sci. Technol. Eng. 2024, 24, 10022–10031. [Google Scholar]
  25. Ye, Y.; Yu, H.; Luo, W.; Lu, Q. Analysis of impact of different modeling techniques on concrete mesoscopic simulation. J. Three Gorges Univ. (Nat. Sci. Ed.) 2016, 38, 33–36. [Google Scholar]
  26. Deng, C. Microscopic Numerical Simulation Analysis of Recycled Concrete. Master’s Thesis, Huazhong University of Science and Technology, Wuhan, China, 2020. [Google Scholar]
  27. Walraven, J.C.; Reinhard, H.W. Theory and experiments on the mechanics behavior of cracks in plane and reinforced concrete subject to shear loading. Heron 1991, 26, 26–33. [Google Scholar]
  28. Hong, C.; Ji, W. Scalable data-driven micromechanics model trained with pairwise fiber data for composite materials with randomly distributed fibers. Eng. Comput. 2024, 41, 801–814. [Google Scholar] [CrossRef]
  29. Yin, D.; Zhang, M.; Xiong, B.; Zhang, S. Study on the physical and mechanical properties of concrete interfacial transition zones (ITZ) with consideration of positional effects. Constr. Build. Mater. 2025, 486, 141985. [Google Scholar] [CrossRef]
  30. Zhang, Y.C.; Chen, X.Y.; Liu, A.X.; Zhou, J. Properties characterization of interfacial transition zone of recycled concrete for reducing the resource waste and environmental pollution. IOP Conf. Ser. Earth Environ. Sci. 2021, 804, 022097. [Google Scholar] [CrossRef]
  31. Zheng, J.C.; Zhu, L.; Peng, G.; Song, Z.L. Numerical simulation of concrete axial tensile performance based on mesomechanics. Eng. J. Wuhan Univ. 2013, 46, 188–193. [Google Scholar]
  32. Yi, Y.; Xiao, Y.X.; Yu, K. Establishment and numerical simulation of mesoscopic models of concrete with arbitrary polygonal aggregates. J. Shandong Univ. (Eng. Sci.) 2025, 55, 97–107. [Google Scholar]
  33. Zhou, J.H.; Wang, X.T.; Guo, Y.Q.; Kang, T.B. Finite element analysis on the compressive strength of recycled concrete. Concrete 2017, 10, 699–720. [Google Scholar]
  34. Zhang, H.R.; Zhao, Y.X.; Meng, T.; Shah, S.P. The modification effects of a nano-silica slurry on microstructure, strength, and strain development of recycled aggregate concrete applied in an enlarged structural test. Constr. Build. Mater. 2015, 95, 721–735. [Google Scholar] [CrossRef]
  35. Xu, L.; Deng, F.; Chi, Y. Nano-mechanical behavior of the interfacial transition zone between steel-polypropylene fiber and cement paste. Constr. Build. Mater. 2017, 145, 619–638. [Google Scholar] [CrossRef]
  36. Jankowiak, T.; Lodygowski, T. Identification of parameters of concrete damage plasticity constitutive model. Found. Civ. Environ. Eng. 2005, 6, 53–69. [Google Scholar]
  37. Kmiecik, P.; Kaminski, M. Modelling of reinforced concrete structures and composite structures with concrete strength degradation taken into consideration. Arch. Civ. Mech. Eng. 2011, 11, 623–636. [Google Scholar] [CrossRef]
  38. Du, P. Study on Meso-Scale Numerical Simulation and Influence Factors of Recycled Concrete. Master’s Thesis, Dalian University of Technology, Dalian, China, 2023. [Google Scholar]
  39. Yao, Z.L.; Duan, D.X. Numerical simulation of recycled concrete under uniaxial compression based on random aggregate model. J. Xi’an Univ. Technol. 2018, 34, 475–480. [Google Scholar]
  40. Maruthachalam, D.; Muthukumar, J. Mechanical Performance of Recycled PET Fiber Reinforced Concrete with Low Volume Fraction. Int. J. Struct. Civ. Eng. Res. 2013, 2, 101–108. [Google Scholar]
  41. Liu, W.; Xu, M.; Chen, Z.F. Parameters calibration and verification of concrete damage plasticity model of abaqus. Ind. Build. 2014, 44, 167–171. [Google Scholar]
  42. Guan, X.; Niu, D.T.; Wang, J.B.; Jiang, L. Study on freeze-thaw damage constitutive model of concrete considering plastic strain and damage threshold. J. Disaster Prev. Mitig. Eng. 2015, 35, 777–784. [Google Scholar]
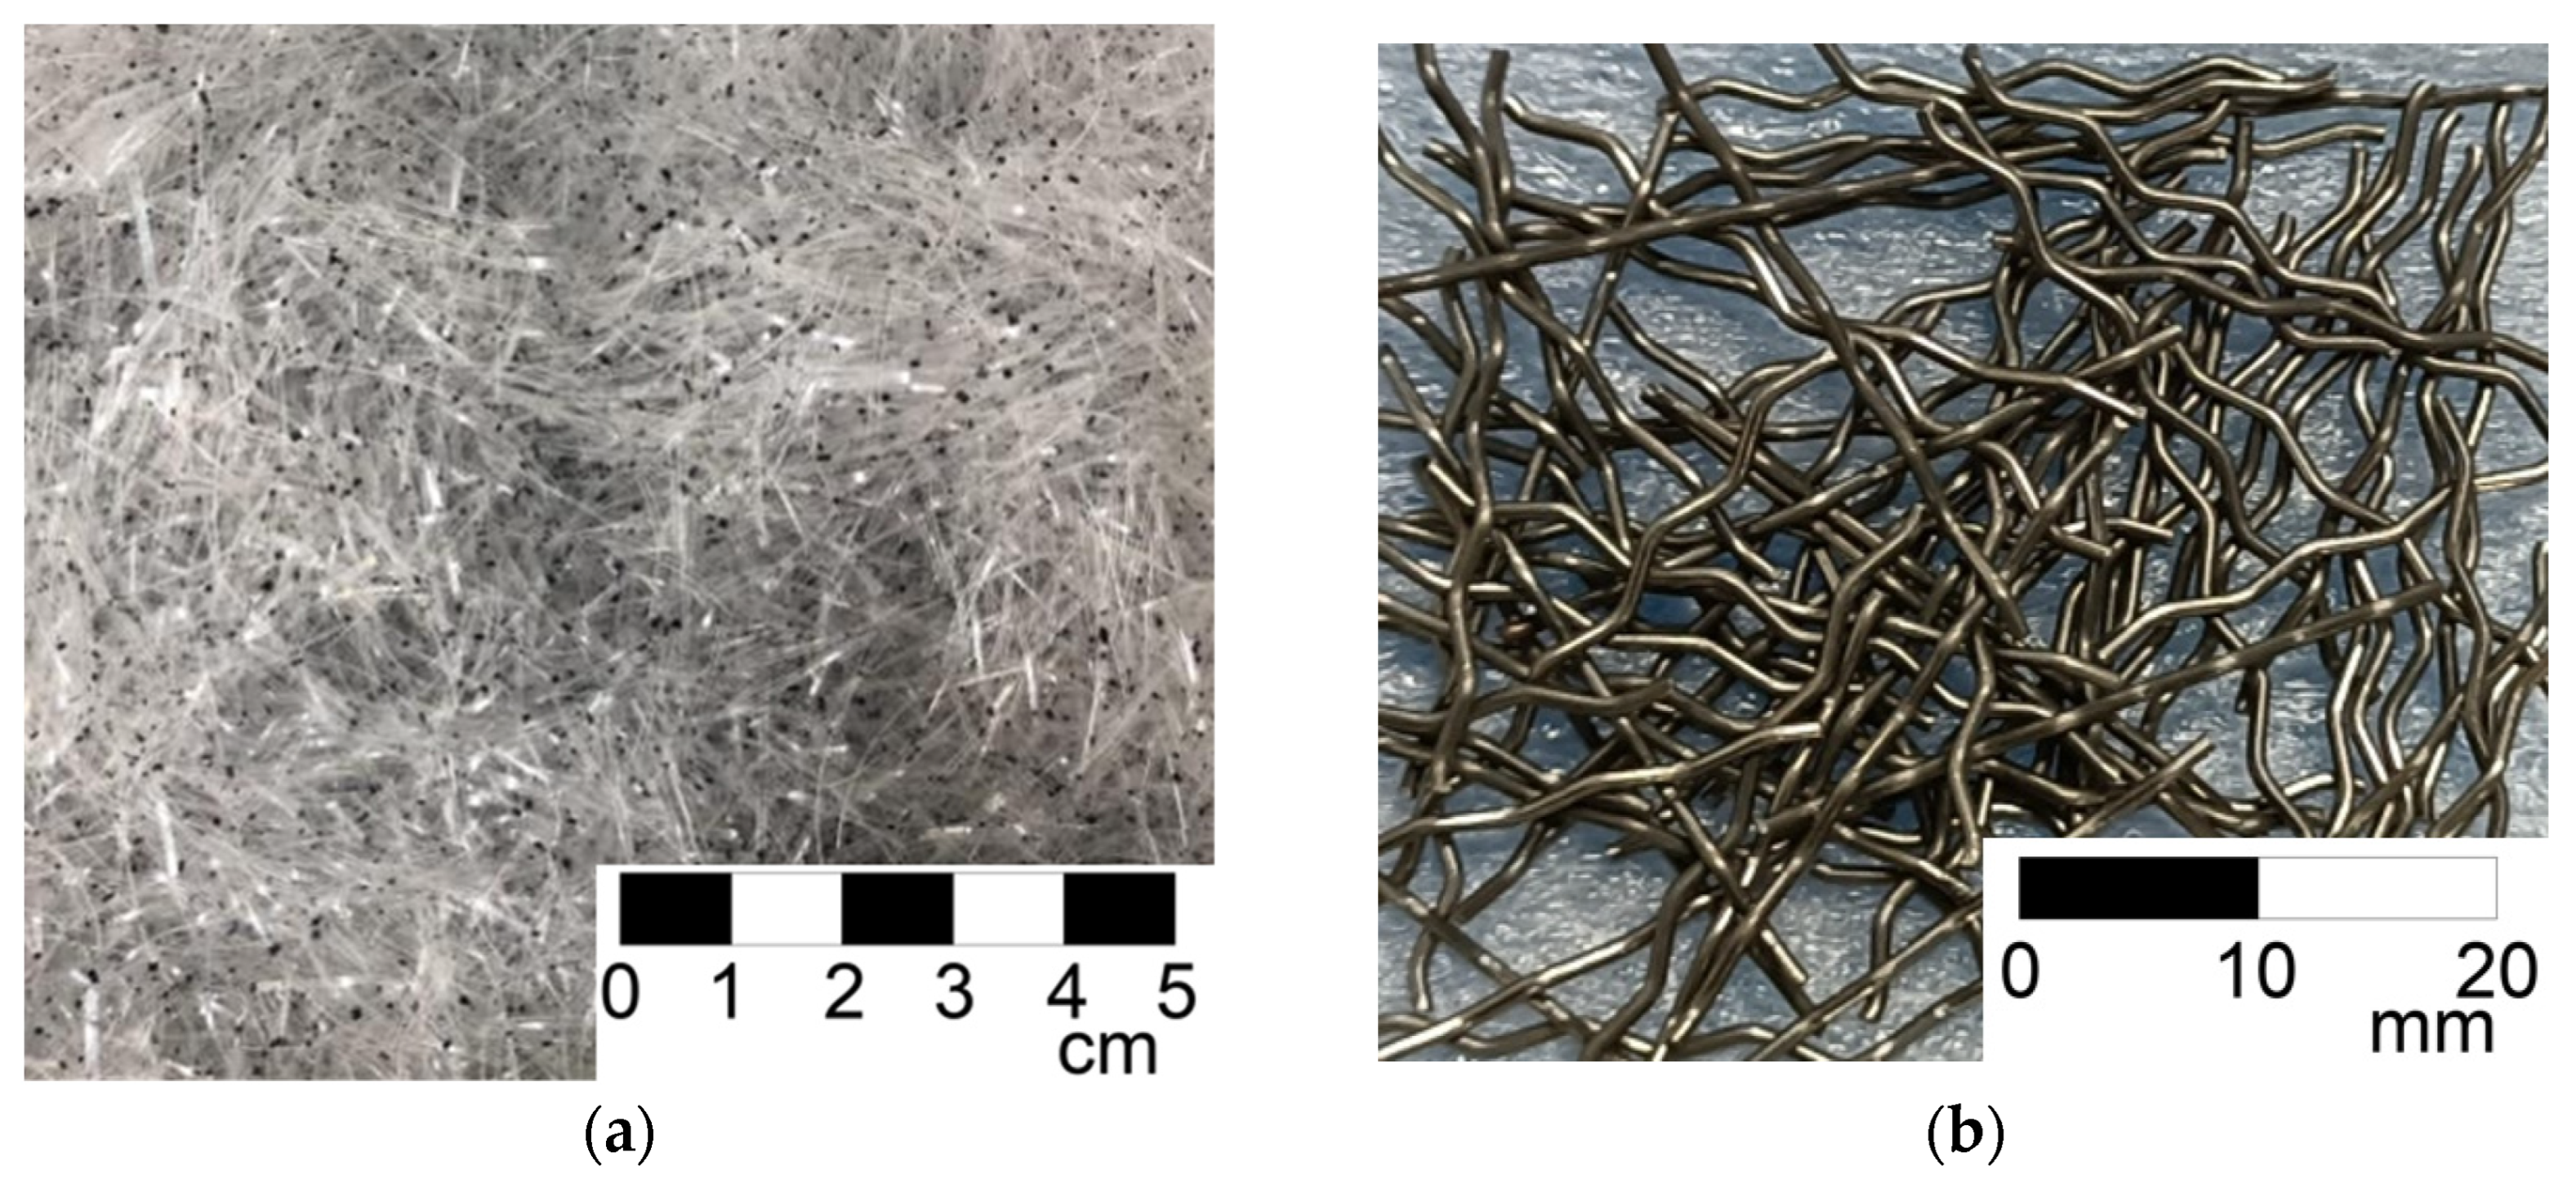
Figure 1. Tested Fibers: (a) rPET fibers; (b) steel fibers.
Buildings 15 03893 g001
Figure 2. Ideal elastoplastic stress–strain curve.
Buildings 15 03893 g002
Figure 3. Schematic diagram of stress–strain under uniaxial tension and compression: (a) under compression; (b) under tension.
Buildings 15 03893 g003
Figure 4. Schematic diagram of the yield surface of the CDP model on a partial plane.
Buildings 15 03893 g004
Figure 5. Finite element mesh partitioning diagram: (a) coarse aggregate mesh partitioning; (b) fiber mesh partitioning; (c) ITZ grid division; (d) mortar grid division.
Buildings 15 03893 g005
Figure 6. Schematic diagram of applying constraints: (a) top constraint; (b) bottom constraint.
Buildings 15 03893 g006
Figure 7. Schematic diagram of applying vertical displacement load.
Buildings 15 03893 g007
Figure 8. Comparison of stress–strain curve for concrete specimen and numerical simulation (No. R50S0.5P0.5).
Buildings 15 03893 g008
Figure 9. The compressive failure mode of the specimen (No. R50S1P1): (a) finite element simulation results diagram; (b) experimental result diagram. Note: The white square in (a) represents the cross-section of the fiber, and the white circle in (a) represents the cross-section of the coarse aggregate.
Buildings 15 03893 g009
Figure 10. Comparison of stress–strain curve for concrete specimen and numerical simulation (others): (a) test & simulation No. R50S0P0; (b) No. R50S0P1; (c) No. R50S1P0; (d) No. R50S0P2; (e) No. R50S1P1; (f) No. R50S2P0.2.7. The influence of fiber content on equivalent plastic strain.
Buildings 15 03893 g010
Figure 11. Equivalent plastic strain nephogram. Note: The white area in the figure represents the cross-section of the coarse aggregate.
Buildings 15 03893 g011aBuildings 15 03893 g011b
Figure 12. The influence of grid size on stress–strain curve.
Buildings 15 03893 g012
Figure 13. The influence of loading rates on stress–strain curve.
Buildings 15 03893 g013
Figure 14. Schematic diagram of steel plate constraint conditions.
Buildings 15 03893 g014
Figure 15. The influence of different boundary conditions on stress–strain curve.
Buildings 15 03893 g015
Figure 16. Von Mises stress nephogram of the specimen: (a) at the initial loading; (b) at the maximum bearing capacity; (c) at the end of loading.
Buildings 15 03893 g016
Figure 17. Compression damage nephogram of the specimen: (a) at the initial loading; (b) at the maximum bearing capacity; (c) at the end of loading.
Buildings 15 03893 g017
Figure 18. Tensile damage nephogram of the specimen: (a) at the initial loading; (b) at the maximum bearing capacity; (c) at the end of loading.
Buildings 15 03893 g018
Figure 19. Compression damage nephogram of ITZ: (a) at the initial loading; (b) at the maximum bearing capacity; (c) at the end of loading.
Buildings 15 03893 g019
Figure 20. Tensile damage nephogram of ITZ: (a) at the initial loading; (b) at the maximum bearing capacity; (c) at the end of loading.
Buildings 15 03893 g020
Figure 21. Stress nephogram of rPETF (MPa): (a) at the initial loading; (b) at the maximum bearing capacity; (c) at the end of loading.
Buildings 15 03893 g021
Figure 22. Stress nephogram of SF (MPa): (a) at the initial loading; (b) at the maximum bearing capacity; (c) at the end of loading.
Buildings 15 03893 g022
Table 1. Summary of components of concrete sample series No. R50S0.5P0.5.
No.SF
(kg)
rPETF
(kg)
Cement
(P.O.42.5) (kg)
NCA
(kg)
RCA
(kg)
Natural Sand
(kg)
Water
(kg)
Water Reducer
(kg)
R50S0.5P0.539.37453.55875875872244.5
Note: R50S0.5P0.5 indicates that the RCA substitution rate is 50%, the content of SF is 0.5%, and the content of rPETF is 0.5%.
Table 2. Table of physical and mechanical parameters of fibers.
TypeLength
(mm)
Equivalent Diameter
(mm)
Density
(kg/m3)
E
(GPa)
Poisson’s RatioTensile Strength
(MPa)
Compressive Strength
(MPa)
rPETF360.8214004.30.358989
SF360.7578502100.312001200
Note: The cross-section of steel fibers is circular. The cross-section length of rPETF is 1.5 mm and the cross-section width of rPETF is 0.35 mm. The equivalent diameter of rPETF is obtained by converting the cross-sectional area into a circular shape of equal area.
Table 3. Material Parameter Table.
Material NameE (GPa)Poisson’s RatioDensity
(kg/m3)
Tensile Strength
(MPa)
Compressive Strength
(MPa)
Mortar350.224002.834.8
NCA800.162200//
RCA500.162100//
NCAITZ280.222002.527.9
RCAITZ210.221002.120.9
Note: NCAITZ is the ITZ between NCA and new mortar; RCAITZ is the ITZ between RCA and new mortar.
Table 4. Table of parameters for CDP model.
Material Nameψefb0/fc0Kcw
Mortar380.11.160.6671 × 10−5
NACITZ330.11.160.6671 × 10−5
RCAITZ300.11.160.6671 × 10−5
Table 5. Fiber content and RCA replacement table.
TypeTotal Fiber Content (%)Steel Fibers Content (%)rPET Fibers Content (%)RCA Replacement Rate (%)
R50S0P000050
R50S0P110150
R50S0.5P0.510.50.550
R50S1P011050
R50S0P220250
R50S1P121150
R50S2P022050
Table 6. PEEQ area ratio greater than 0.01 in the cross-section.
TypeTotal Fiber Content (%)SF
Content (%)
rPETF Content (%)Area Ratio
R50S0P00.00.00.01.000
R50S0P11.00.01.00.837
R50S0.5P0.51.00.50.50.750
R50S1P01.01.00.00.691
R50S0P22.00.02.00.832
R50S1P12.01.01.00.673
R50S2P02.02.00.00.666
Table 7. The influence of grid size on computational results.
TypePeak StrainPeak Stress (MPa)Residual Stress (MPa)Time Consumption Multiple
Half of the original grid size0.0063245.923.07.5
Original grid size0.0064946.323.31.0
Twice the original grid size0.0065747.226.50.8
Table 8. The influence of loading rates on computational results.
TypePeak StrainPeak Stress
(MPa)
Residual Stress (MPa)
0.0010.006345.822.1
0.010.0071251.224.1
0.10.0073753.124.8
Table 9. The influence of different boundary conditions on computational results.
TypePeak StrainPeak Stress (MPa)Residual Stress
(MPa)
Time Consumption Multiple
Type I0.006345.821.61.0
Type II with PFC = 0.10.006648.022.411.3
Type II with PFC = 0.50.006646.922.37.3
Disclaimer/Publisher’s Note: The statements, opinions and data contained in all publications are solely those of the individual author(s) and contributor(s) and not of MDPI and/or the editor(s). MDPI and/or the editor(s) disclaim responsibility for any injury to people or property resulting from any ideas, methods, instructions or products referred to in the content.