Article

Predicting the Properties of Polypropylene Fiber Recycled Aggregate Concrete Using Response Surface Methodology and Machine Learning

by
Hany A. Dahish
1,2 and
Mohammed K. Alkharisi
1,*
1
Department of Civil Engineering, College of Engineering, Qassim University, Buraidah 52571, Saudi Arabia
2
Civil Engineering Department, Faculty of Engineering, Fayoum University, Fayoum 63514, Egypt
*
Author to whom correspondence should be addressed.
Buildings 2025, 15(20), 3709; https://doi.org/10.3390/buildings15203709
Submission received: 3 September 2025 / Revised: 8 October 2025 / Accepted: 13 October 2025 / Published: 15 October 2025
(This article belongs to the Section Building Structures)

Abstract

The use of recycled coarse aggregate (RCA) concrete and polypropylene fibers (PPFs) presents a sustainable alternative in concrete production. However, the non-linear and interactive effects of RCA and PPF on both fresh and hardened properties are not yet fully quantified. This study employs Response Surface Methodology (RSM) and the Random Forest (RF) algorithm with K-fold cross-validation to predict the combined effect of using recycled coarse aggregate (RCA) as a partial replacement for natural coarse aggregate and polypropylene fiber (PPF) on the engineering properties of RCA-PPF concrete, addressing the critical need for a robust, data-driven modeling framework. A dataset of 144 tested samples obtained from literature was utilized to develop and validate the prediction models. Three input variables were considered in developing the proposed prediction models, namely, RCA, PPF, and curing age (Age). The examined responses were compressive strength (CS), tensile strength (TS), ultrasonic pulse velocity (UPV), and water absorption (WA). To assess the developed models, statistical metrics were calculated, and analysis of variance (ANOVA) was employed. Afterwards, the responses were optimized using optimization in RSM. The optimal results of responses by maximizing TS, CS, and UPV and minimizing WA were achieved at a PPF of 3% by volume of concrete and an RCA of approximately 100% replacing natural coarse aggregate, highlighting optimal reuse of recycled aggregate, with an AGE of 83.6 days. The RF model demonstrated superior performance, significantly outperforming the RSM model. Feature importance analysis via SHAP values was employed to identify the most effective parameters on the predictions. The results confirm that ML techniques provide a powerful and accurate tool for optimizing sustainable concrete mixes.

1. Introduction

The demolition and replacement of structures is driven by various factors, including functional obsolescence, structural deterioration, changes in land use, and the need for modern infrastructure that meets updated safety and environmental standards [1]. While this cycle of urban renewal is often necessary, it generates enormous quantities of construction and demolition waste, presenting a significant environmental challenge. From a sustainability perspective, the utilization of recycled concrete aggregate (RCA) derived from this waste stream offers a transformative solution. Incorporating RCA into new concrete production reduces the demand for virgin natural aggregates, thereby conserving non-renewable resources, minimizing landfill use, and enhancing the sustainability of the building industry [2,3]. Beyond environmental benefits, it also promotes a circular economy in the construction sector, turning waste into a valuable resource and creating a more sustainable model for future development.
However, the widespread adoption of recycled aggregate (RA) is hindered by several technical limitations. The inherent adhered mortar on recycled coarse aggregate (RCA) concrete typically results in a more porous and absorbent material, leading to concrete with higher water demand, reduced workability, and often compromised mechanical properties, including lower compressive and tensile strength, as well as increased drying shrinkage and creep compared to conventional concrete [4,5]. Furthermore, potential contamination from other construction and demolition waste constituents and variability in the quality of the source material pose significant challenges for quality control and standardization, limiting its use primarily to non-structural applications without proper processing or mix design modifications.
Significant research has been dedicated to improving the inferior mechanical and durability properties of concrete incorporating recycled aggregate (RA), focusing primarily on enhancing the aggregate itself and optimizing the concrete matrix. A widely studied method is the pre-treatment of RA to remove the porous adhered mortar, employing techniques such as mechanical grinding, thermal shock, acid washing, and pre-soaking in water or chemical solutions to strengthen the aggregate–paste interface and reduce water absorption [6,7]. Furthermore, the use of pozzolanic mineral admixtures like silica fume and fly ash is well-established; these materials not only reduce the water-cement ratio but also their fine particles mitigate the ITZ’s weakness through pore-filling and secondary hydration reactions, significantly improving strength and resistance to chloride penetration and carbonation [8,9].
Polypropylene fibers (PPFs) are commonly utilized to enhance post-cracking behavior, flexural strength, impact resistance, energy absorption, and toughness of concrete [10,11]. Glass, carbon-based, steel, and polymer fibers are just a few of the many types of fibers used in concrete. Many concrete applications benefit from the use of PPF due to its many desirable properties [12]. Incorporating PPF has shown promise in mitigating the drawbacks of reduced mechanical and durability properties of RCA concrete, as PPF improves tensile strength and controls crack propagation.
Previous research used a variety of statistical approaches to predict concrete characteristics including RSM and RF [13,14]. The response surface methodology (RSM) uses mathematical and statistical approaches to assess the impacts of several independent variables, making it easier to examine interactions between parameters and construct accurate models for representing the response. Many studies used RSM for optimizing, developing models, and organizing experiments [15,16,17,18]. Several investigations were conducted utilizing RSM to predict and optimize the properties of concrete containing waste materials [19,20,21]. Notably, these models performed better than expected in predicting concrete characteristics.
Machine learning (ML) techniques employ statistical methods to identify complex correlations, patterns, and trends within historical data, enabling data-driven predictions and decisions [22]. Recently, the application of ML in concrete technology has advanced significantly, with studies demonstrating high accuracy in predicting various properties. For instance, Khan et al. [23] successfully employed Extreme Gradient Boosting (XGBoost) to predict the compressive and tensile strengths of concrete containing RCA, while Manan et al. [24] utilized artificial neural network (ANN) to model compressive strength, tensile strength, and modulus of elasticity of concrete containing RCA. Furthermore, Yuan et al. [25] compared several ensemble methods for predicting the mechanical properties of sustainable concrete, finding Random Forest to be among the most robust.
While these studies demonstrate the potential of ML in concrete science, a significant gap exists in the concurrent prediction of multiple properties for concrete containing both recycled coarse aggregate (RCA) and polypropylene fibers (PPFs). Existing models often focus on individual properties or simpler mixtures, neglecting the complex, non-linear interactions between these two components and their collective impact on fresh and hardened properties. Therefore, a robust modeling framework capable of accurately predicting the properties of this complex sustainable concrete, while also quantifying the influence of its constituent materials, is urgently needed to facilitate its mix design and adoption.
These studies, among others, confirm the viability of ML approaches for tackling complex, non-linear relationships in composite materials like concrete. Table 1 illustrates an overview of studies focused on predicting the properties of concrete, particularly those containing RCA and PPF. This study builds upon this foundation by applying a suite of advanced models, including those mentioned above, to the specific case of concrete with both recycled aggregate and polypropylene fibers—a combination that has received less attention in the ML literature. The Random Forest (RF) algorithm, a powerful ensemble learning method was utilized for developing prediction models for engineering properties of RCA-concrete containing PPF. Hyperparameter optimization was used and k-fold cross validation to reduce overfitting issues. SHAP analysis was employed to interpret the model predictions and quantify the interactive influence of RCA and PPF on each property. This study also uses RSM to predict and optimize the engineering properties of RCA-concrete incorporating PPF. The Central Composite Design (CCD) technique in RSM was used, along with random forest algorithm, to simulate the impact of various ratios of RCA as a substitution for natural coarse aggregate (NCA) up to 100%, and PPF up to 3% by volume of concrete as an additive in concrete, with a focus on TS, CS, UPV, and WA. To assess the models’ performance, analysis of variance (ANOVA) was employed. Numerical optimization is employed to optimize the parameters of the RCA-concrete with PPF. The predictive accuracy of the ML model was compared to the traditional RSM model.
Although there has been substantial research into the use of RCA and PPF in concrete, no study has attempted to simulate the combined effects of RCA and PPF on various concrete properties. As a result, ML was used in this study alongside RSM to determine the optimal approach for representing the impacts of RCA and PPF on the CS, TS, UPV, and WA of RCA-PPF concrete, as well as to construct relevant predictive models.

2. Experimental Data and Methods

Figure 1 presents the methodology utilized for developing the prediction models for the concrete properties of concrete containing RCA and PPF.

2.1. Experimental Dataset

All experimental datasets used in this study for model training and validation were derived from the comprehensive experimental work of Alharthai et al. [1], which investigated the effects of using 50%, 75%, and 100% recycled coarse aggregate (RCA) as a partial replacement of natural coarse aggregate by weight and 1%, 2%, and 3% polypropylene fiber per volume of concrete on the properties of concrete. The complete dataset consists of 144 unique mixture designs and their corresponding experimentally measured properties. The input variables for the developed models were concrete curing age (AGE), recycled coarse aggregate ratio (RCA) as a partial replacement for natural coarse aggregate by weight, and PPF ratio by volume of concrete. The output variables predicted were Compressive Strength (CS) in MPa, Tensile Strength (TS) in MPa, ultrasonic pulse velocity (UPV) in m/s, and Water Absorption (WA) in %.
The novel contribution of this paper lies in the development and validation of computational models based on this data. The dataset comprises 144 data points. Table 2 shows the data description. The dataset shows considerable variation, as indicated by the descriptive statistics. The input parameters include the polypropylene fiber (PPF) content (ranging from 0% to 3%) by volume of concrete, the percentage of recycled coarse aggregate (RCA) replacing natural aggregate (varying from 0% to 100%) by weight, and the concrete curing age (from 14 to 90 days). These variables were used to predict four key output parameters indicative of concrete performance: compressive strength (CS: 17.6–44.8 MPa), tensile strength (TS: 2.2–4.1 MPa), ultrasonic pulse velocity (UPV: 2244.7–5179.6 m/s), and water absorption (WA: 4.49–12.08%). The statistical description (Table 2) reveals that the input and output variables exhibit substantial variability, as indicated by their standard deviations. The mean values reveal a central tendency around 1.5% polypropylene fibers (PPF) by volume of concrete, 56.25% recycled concrete aggregate (RCA), a curing age of 44 days, a compressive strength of 28.5 MPa, a tensile strength of 2.96 MPa, an ultrasonic pulse velocity of 3633.7 m/s, and a water absorption of 8.1%. The standard deviations are substantial relative to their means, particularly for RCA (37.37%) and curing age (33.37 days), indicating high variability in these parameters. Furthermore, the skewness and kurtosis values for all parameters are close to zero, suggesting that the data for each variable is approximately normally distributed, which is a favorable characteristic for robust machine learning modeling.

2.2. Processing of Data for Use

To get the dataset ready for the models that were going to be suggested, the preprocessing phase was performed. The most crucial steps were collecting data, cleaning, outlier removal, normalization, and format consistency. Data consistency and structure suitable for model integration were further ensured due to the small sample size and model requirements. Model robustness was enhanced by performing feature scaling with min-max normalization and eliminating outliers using the interquartile range (IQR) technique. To handle numerical characteristics, normalize or standardize them, and deal with any possible outliers, it is necessary to analyze the data description. Insights like this ensure that future research will use legitimate methods and provide accurate results by laying the framework for effective data manipulation.
An integral part of data governance, data cleansing deals with the prevalent problem of contaminated or abnormal data, which may create erroneous analytical results. Despite the small size of the dataset used in this study, data cleaning is essential for making machine learning models more accurate and reliable.

2.2.1. Outlier Removal

To find outliers, we employed the interquartile range (IQR) technique, which is a trusted non-parametric way to find outliers in datasets that aren’t regularly distributed or skewed. The IQR method offers greater dependability when dealing with heterogeneous experimental data, as it is less affected by extreme outcomes, in contrast to approaches based on mean and standard deviation. The mathematical expression for IQR is illustrated in Equation (1):
I Q R = Q 3 Q 1
where Q1 and Q3 represent the first and third quartiles, respectively.
The outliers are defined as data points that fall below or above. No outliers were detected for PPF, RCA, or AGE, which is expected as these are controlled input variables with limited, discrete values. For CS, all data points (min = 17.6, max = 44.8) lie well within the bounds. No outliers were detected. For TS, all data points (min = 2.2, max = 4.1) lie within the bounds. No outliers were detected. For UPV, the minimum value of 2244.7 is significantly lower than the rest of the dataset and is close to the lower bound. It can be considered a potential low outlier. This point corresponds to the mix with 100% RCA and 0% PPF at 14 days. For WA, the maximum value of 12.075 is very high. While it is below the calculated upper bound, it is isolated at the extreme high end of the distribution. This point corresponds to the mix with 100% RCA and 0% PPF at 14 days (the same mix as the UPV outlier). The two potential outliers (UPV = 2244.7 and WA = 12.075) are not necessarily erroneous data points. They come from the same concrete mix: 100% RCA and 0% PPF, tested at 14 days. It is scientifically plausible that this specific mix would have the poorest performance (lowest UPV, indicating more voids, and highest water absorption). Therefore, these points likely represent the true, extreme effect of the input variables rather than measurement errors.

2.2.2. Feature Scaling

To achieve the best performance possible from machine learning models, feature normalization is required. This is because, in many circumstances, obtaining model convergence requires dealing with features of comparable scales. The use of min-max scaling in this study was successful in standardizing feature magnitudes, resulting in higher convergence rates and overall model performance. Improper normalization may result in biases in learning. Equation (2) expresses the mathematical concept of characteristic normalization.
X i = X i X m i n X m a x X m i n     ( i = 1,2 , , n )
where the minimum and maximum feature values are X m i n and X m a x .
The dataset was partitioned into a training set and a testing set at ratio of 80:20 to ensure a robust evaluation of the model’s predictive performance on unseen data. Anaconda-based Python (version 3.12) [34] is utilized to develop the RF model.

2.3. Correlation Coefficients

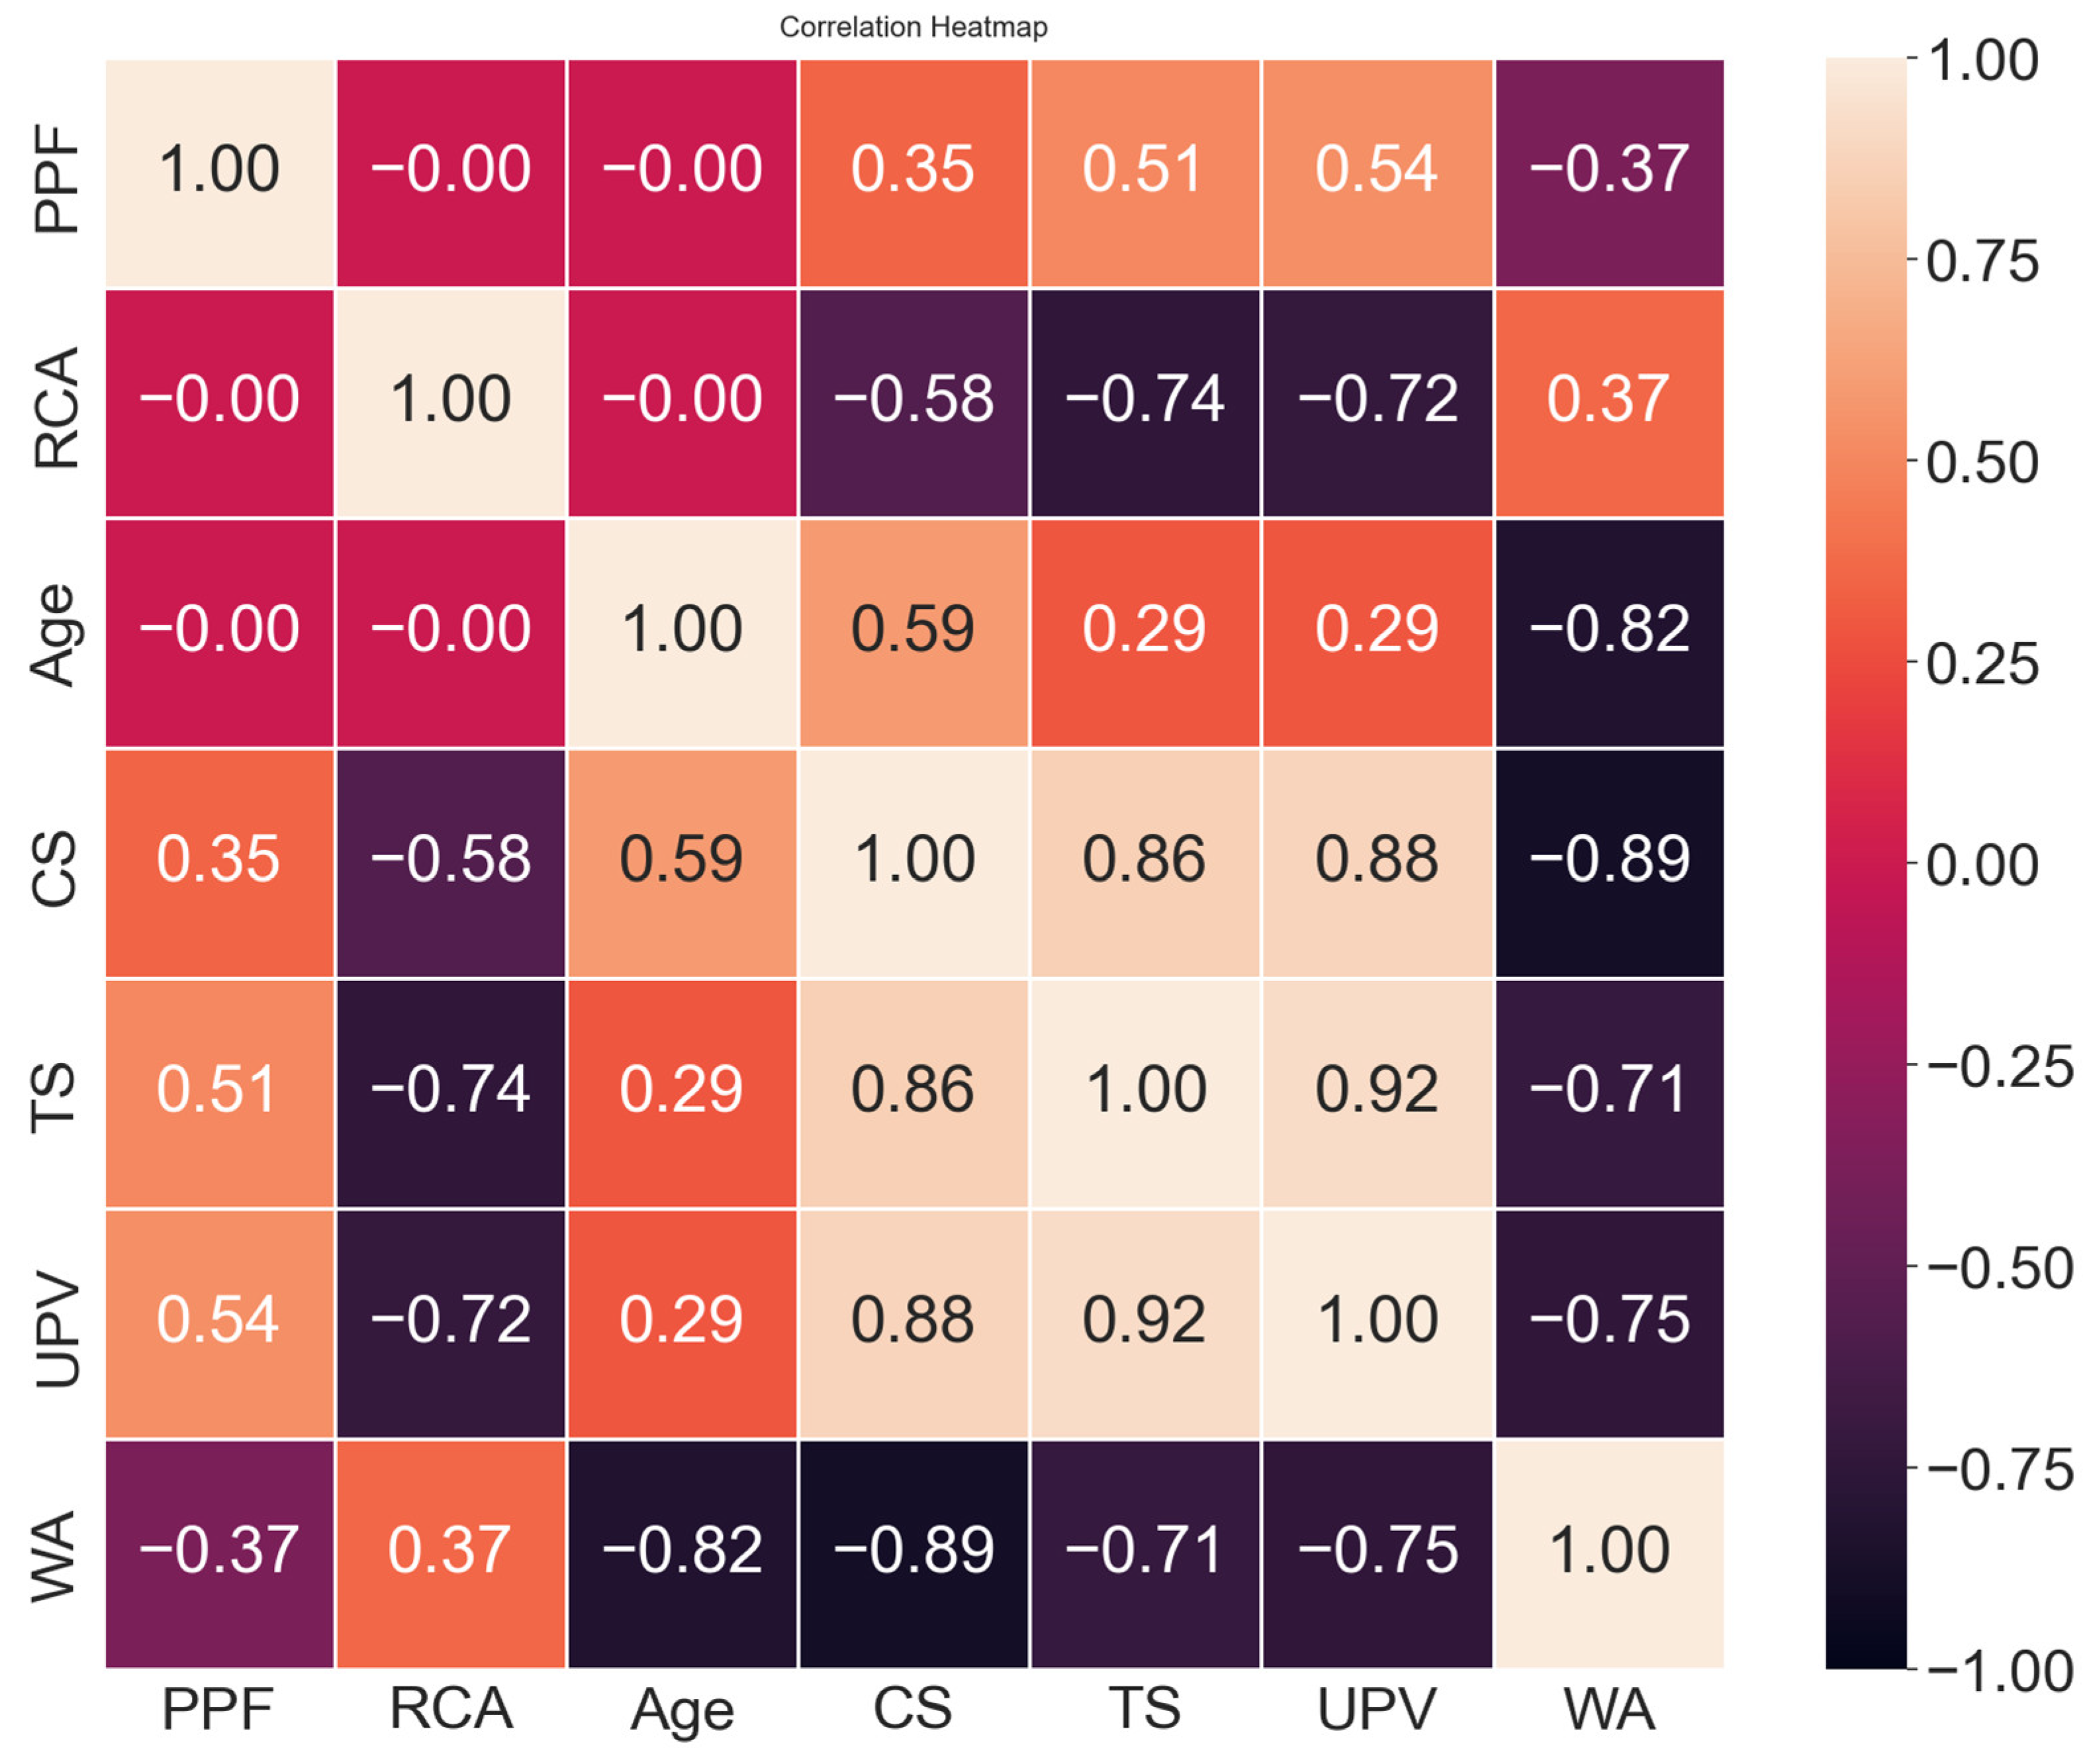
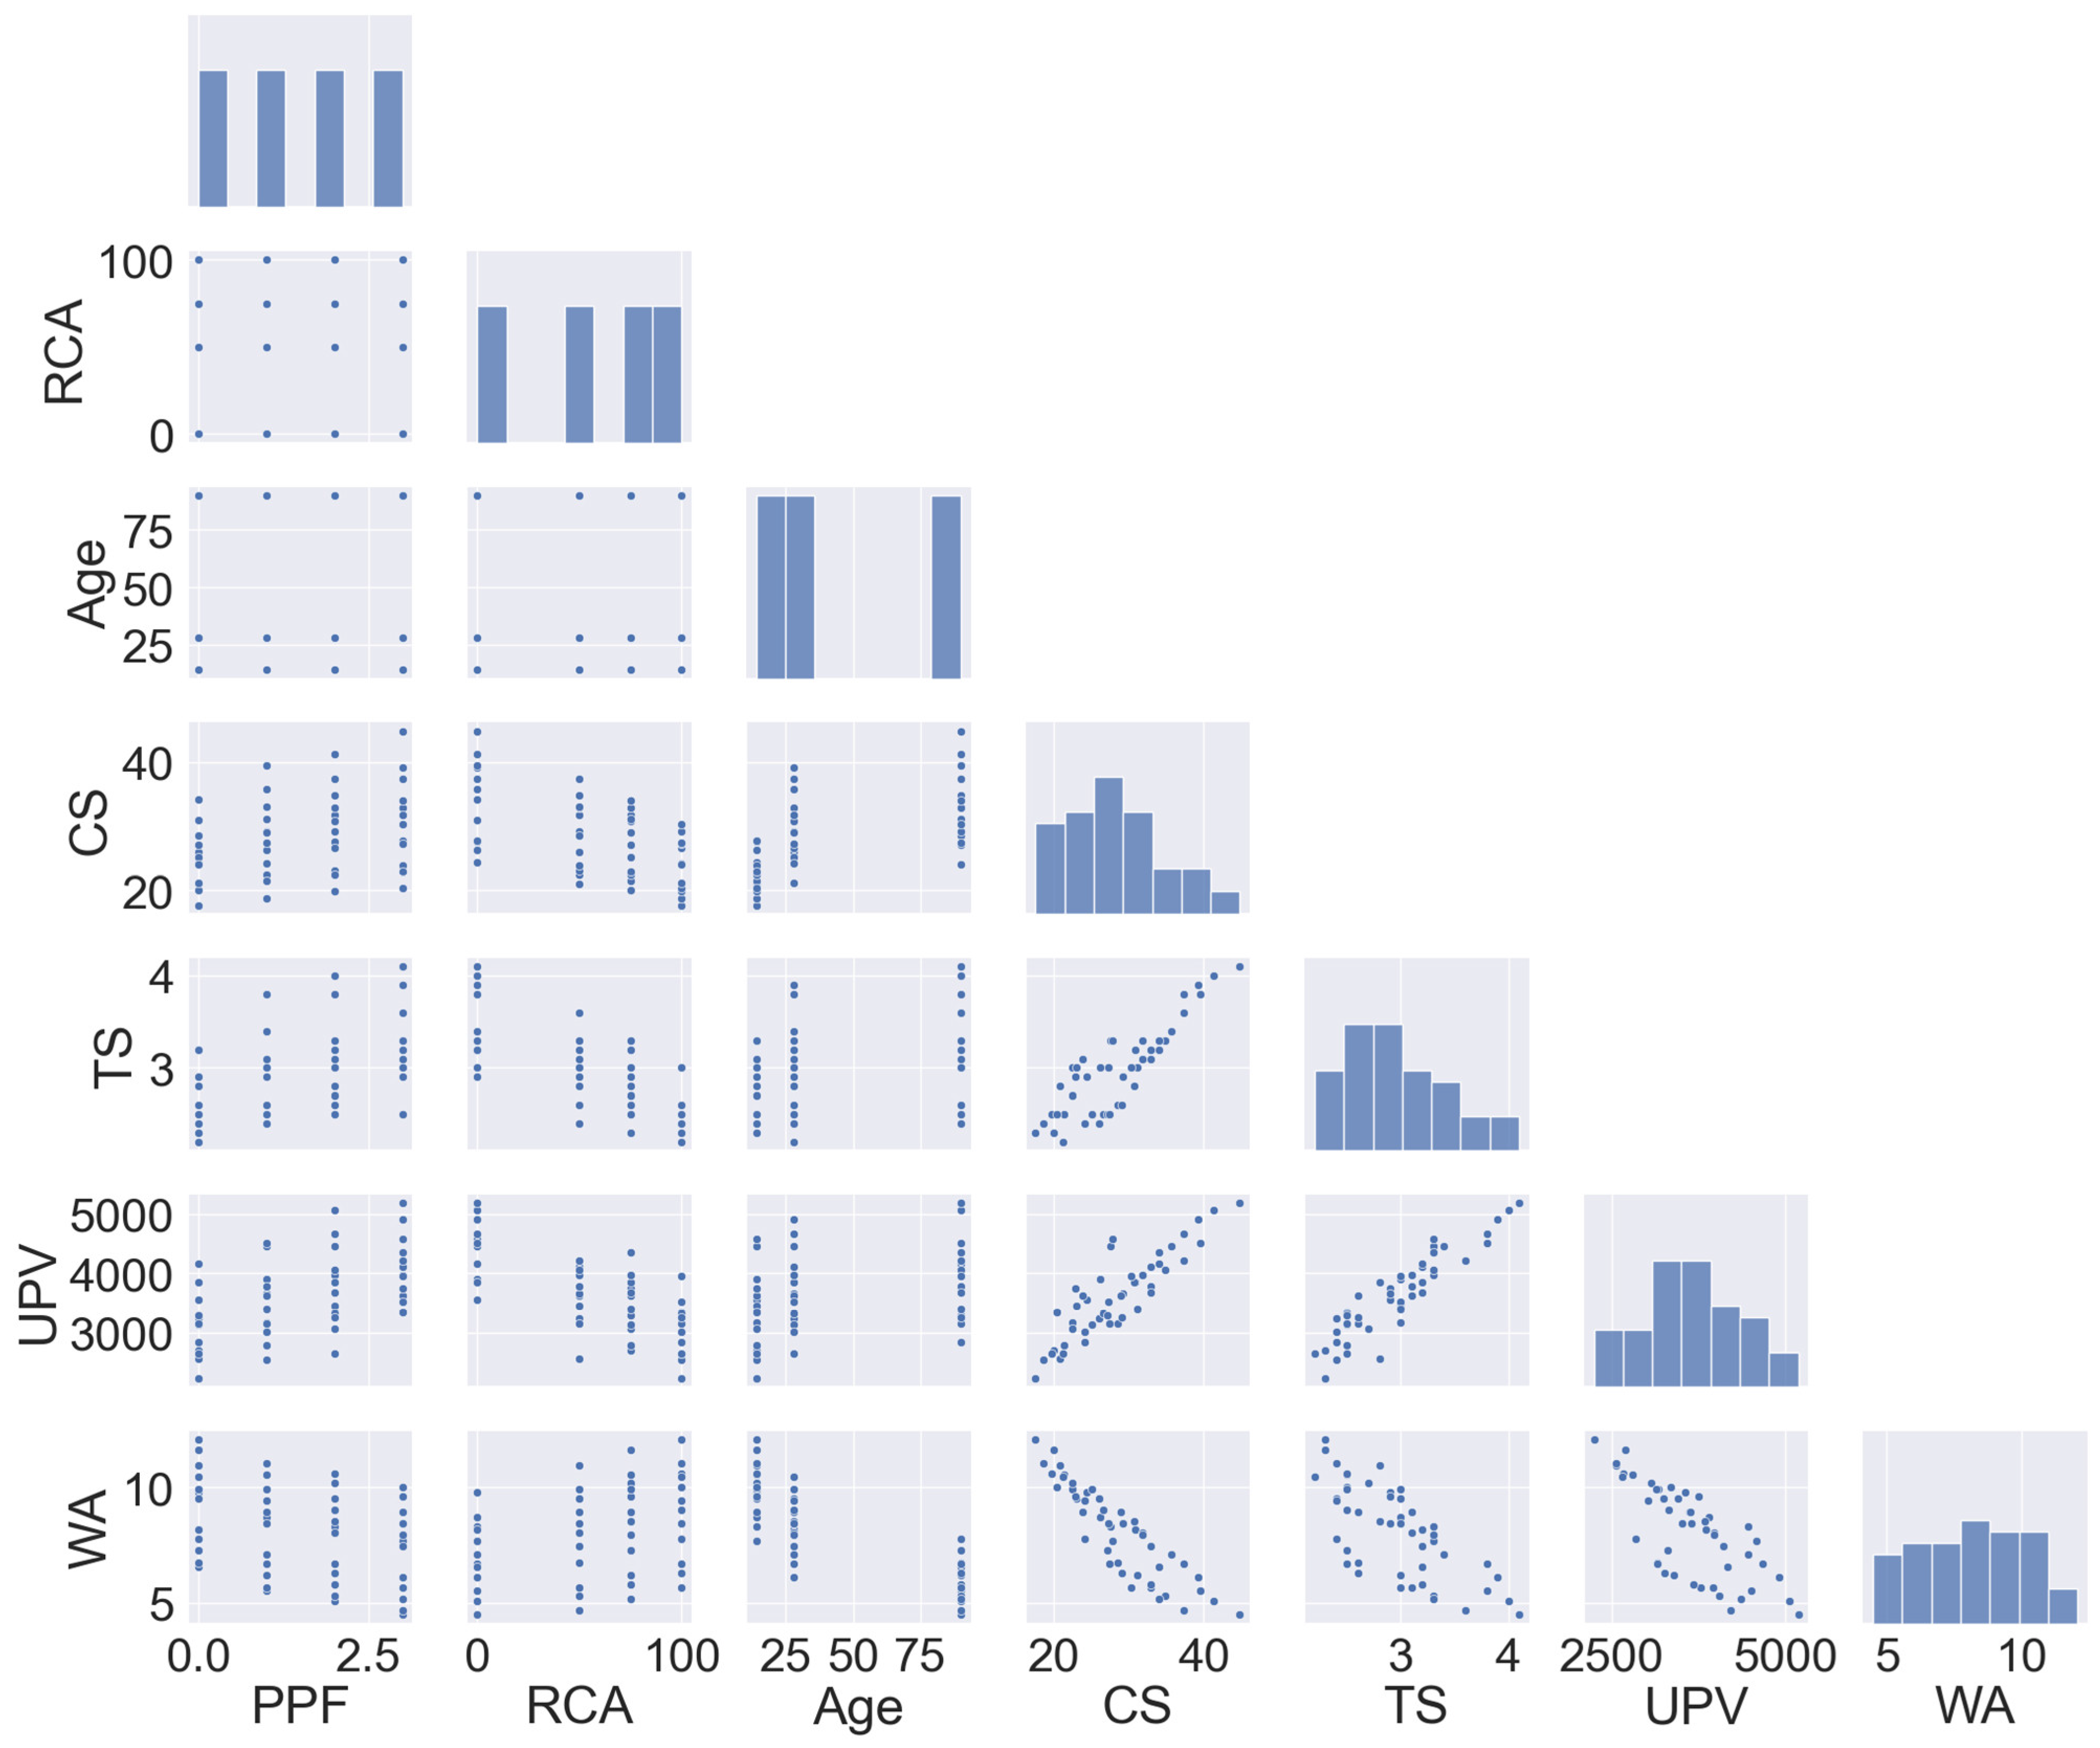
The correlation coefficients and correlation graphs (Figure 2) between the input parameters, RCA, PPF, and AGE, and the four output parameters (CS, TS, UPV, and WA) for data preprocessing shows the correlation between the parameters and helps in detecting potential multicollinearity. Linear relationships between model input and output variables can be evaluated using correlation maps. Scatterplots indicate whether each variable is favorably, negatively, or uncorrelated.
This information is useful for understanding the relationship between the two variables and how changes to one affect the other. The range of values of R is from −1 to 1. The RCA has a negative correlation with CS, TS, and UPV, as indicated by R values of −0.58, −0.74, and −0.72. There is a positive correlation between RCA and WA, as evidenced by the R value of 0.37. The PPF has a positive correlation with CS, TS, and UPV, as evidenced by R values of 0.35, 0.51, and 0.54. The correlation between PPF and WA is negative, with an R value of −0.37. The AGE exhibits a positive correlation with CS, TS, and UPV, but a negative correlation with WA. Figure 3 shows a matrix plot of the input-output interactions. The output variables are CS, TS, UPV, and WA, and the graphs show scatterplots of their respective input-output interactions. The matrix’s diagonals display histograms of the dataset’s frequency distributions for the input and output variables.

2.4. Response Surface Methodology (RSM)

RSM uses sophisticated mathematical and statistical methods to create, assess, refine, and enhance optimization procedures. Response and variable-objective RSM is an effective multi-objective optimization technique. The RSM framework is compatible with user-defined models, historical data, and central composites. Model selection is based on data type and variable count. Models are built and analyses run on a pre-made experiment matrix with the help of the user-defined method [35]. Utilizing Design-Expert (Version 13), CCD was put into action. Of all the RSM design approaches used in construction, CCD is the most common and easiest to understand [36]. Independent variables are linked to answers by linear or higher-degree polynomials. The generalized RSM equations are best expressed by the multiple-degree polynomials shown in Equation (3) [37,38].
R e s p o n s e = ω o + i = 1 k ω i X i + i = 1 k ω i i X j 2 + i < j ω i j X i X j + e r r o r
The current study employed ANOVA to look at the real data and determine which components had the greatest impact of the input variables (RCA, PPF, and AGE) on the responses (CS, TS, UPV, and WA). For the statistical study, the Design Expert 13 software was used. To find out how different input factors affected the output predictions, a model analysis was performed on the replies.

2.5. Machine Learning (ML) Techniques

The engineering properties of concrete containing RCA and PPF were predicted using a machine learning (ML) approach, and accurate ML prediction models were created utilizing the RF algorithm [39].

2.5.1. Random Forest (RF)

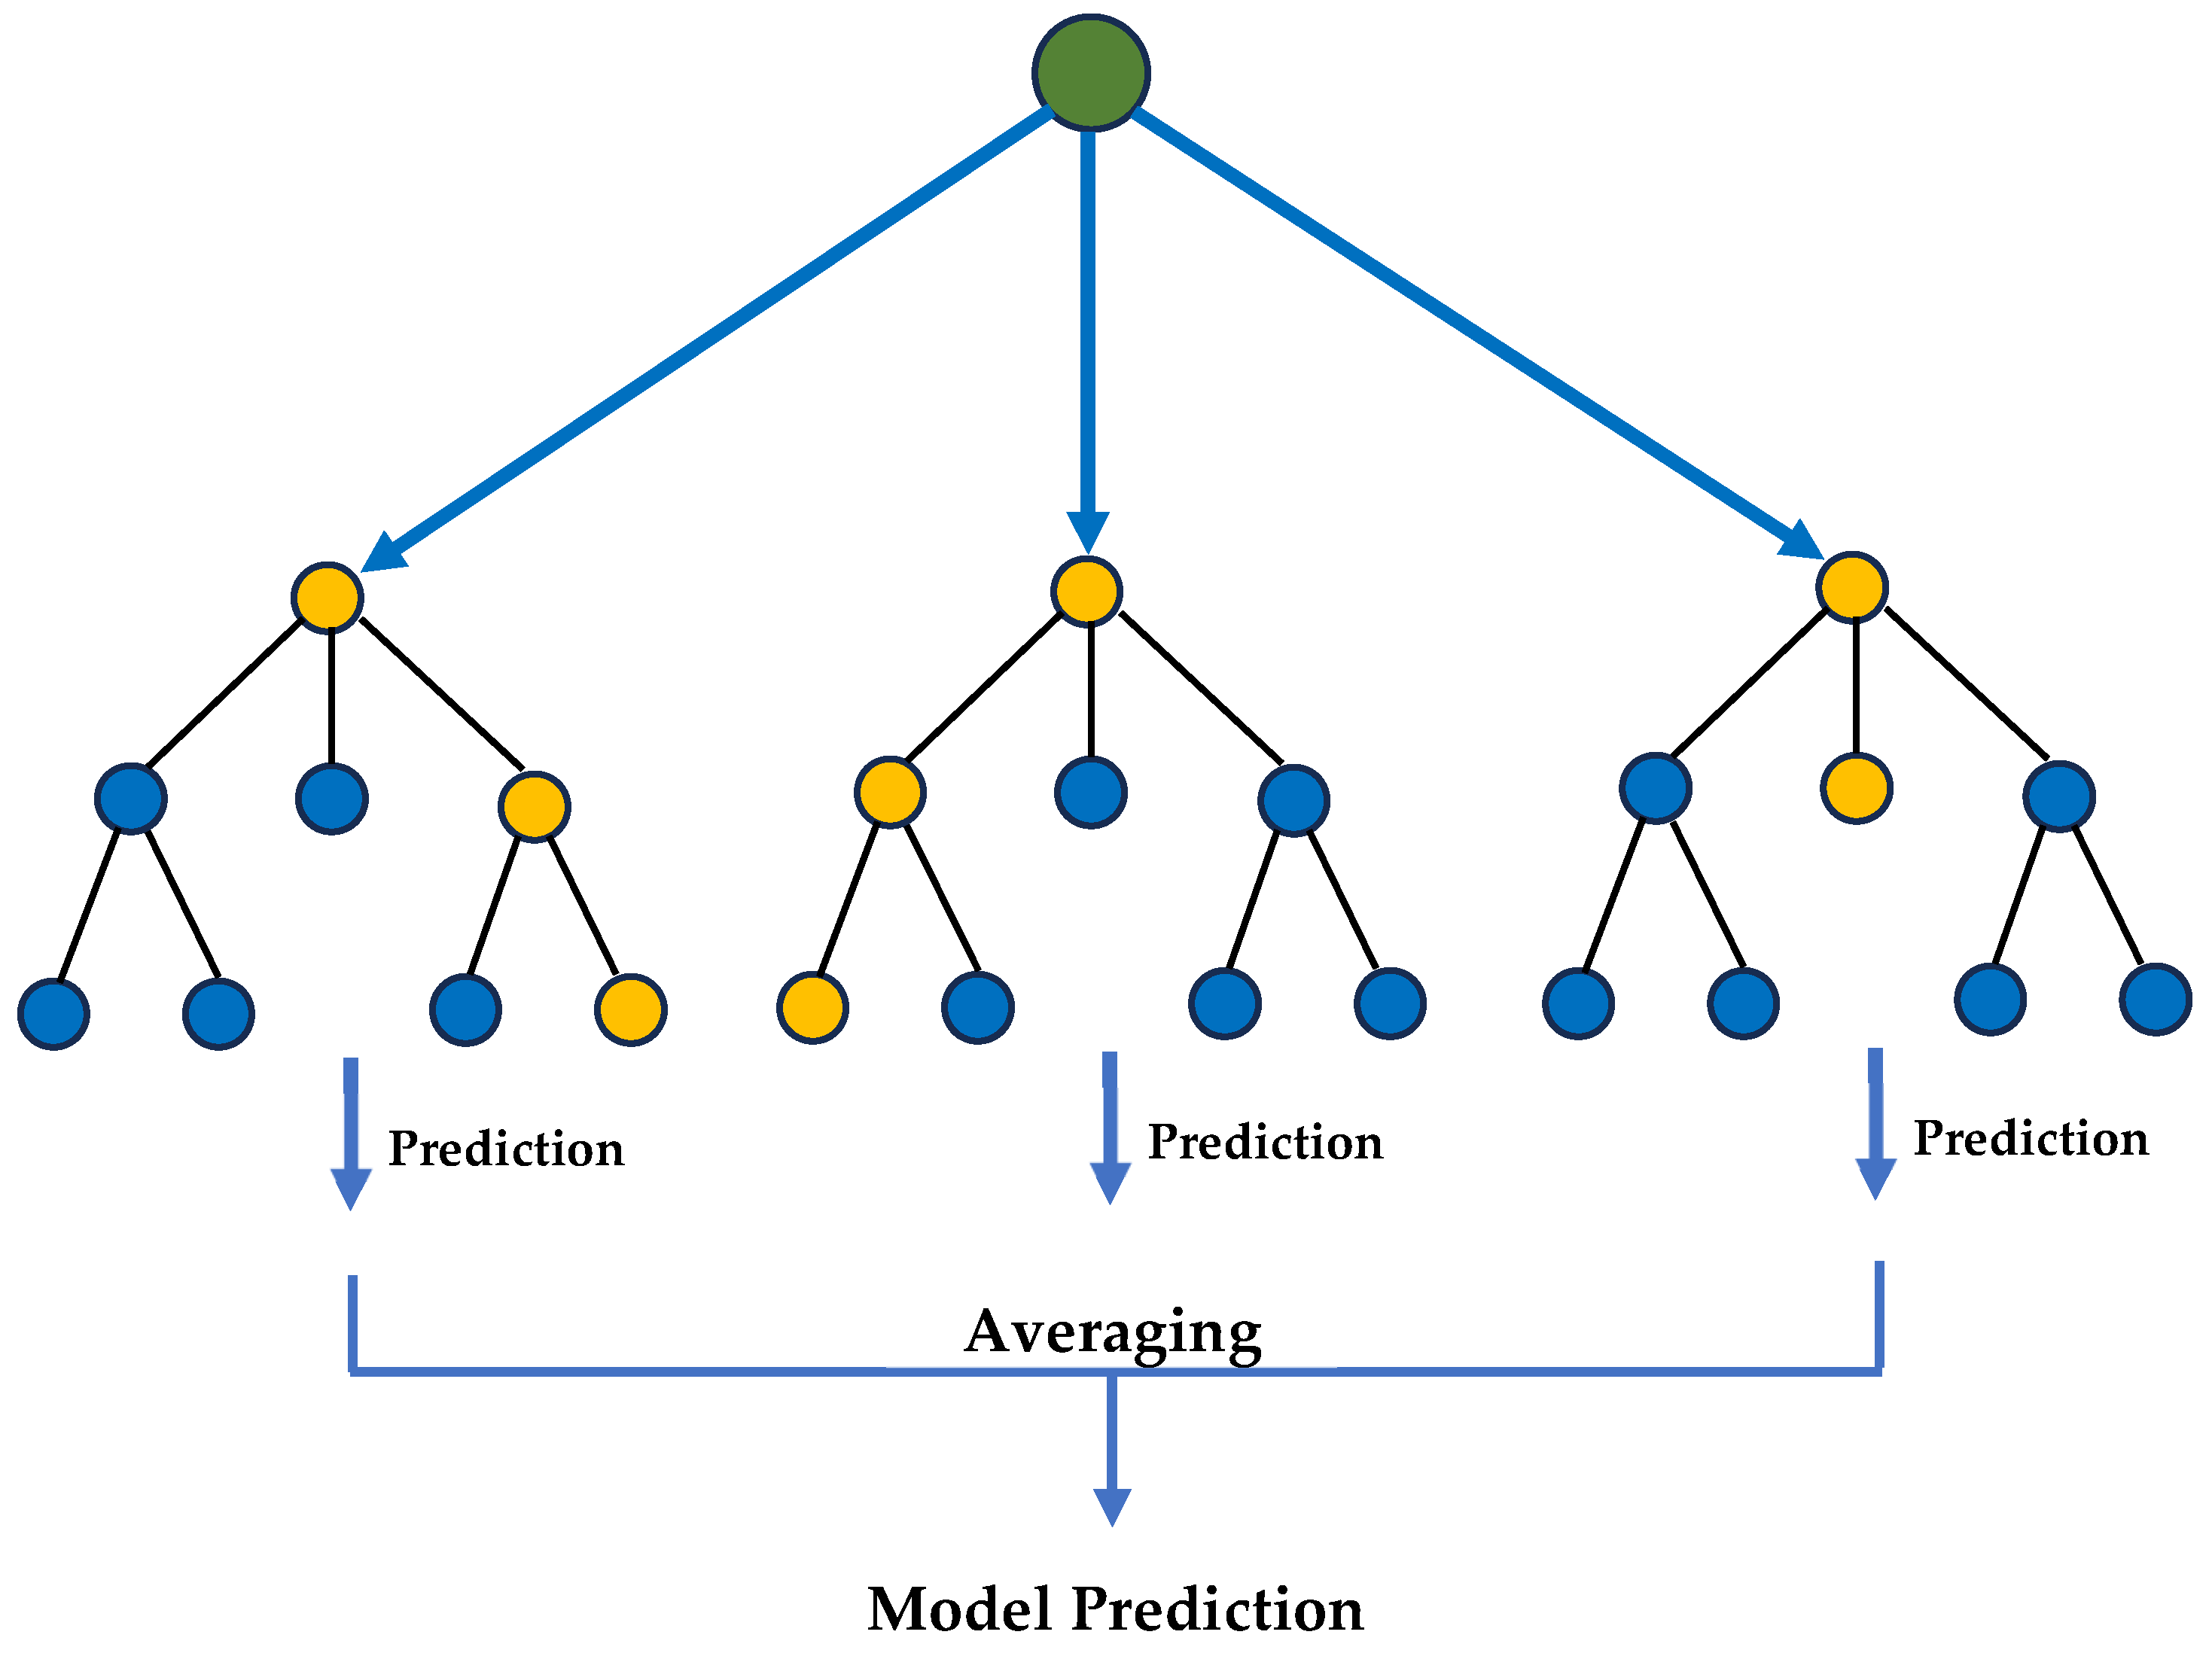
Random Forest, an ensemble learning technique, functions by creating several decision trees during the training process. Each tree is constructed using a random selection of data and a random selection of features, a method that fosters diversity and mitigates overfitting. For a final prediction, the algorithm combines the outputs of all individual trees: through averaging for regression as shown in Figure 4. According to Equation (4), the random forest prediction algorithm is as follows.
R e s p o n s e = m o d e   ( k 1 , k 2 , . , k n )
where k i represents the individual tree prediction, and mode was the average prediction.
The Random Forest (RF) algorithm was selected for this study due to several advantages it offers for predicting the properties of complex composite materials like concrete with RCA and PPF. RF handles non-linearity and complex interactions. RF is an ensemble method that excels at capturing these intricate, non-linear interactions without requiring prior assumptions about the data distribution, unlike many traditional statistical models. Bagging technique in RF builds multiple trees on random subsets of the data, makes it highly robust to overfitting and reduces the variance and influence of outliers, leading to more stable and reliable predictions. The ability of RF to provide a ranked feature importance. Additionally, RF has a strong track record of high predictive accuracy in various material science and civil engineering applications, particularly for predicting concrete properties. Its performance is often comparable to or better than that of other complex algorithms like Support Vector Machines or neural networks, while typically requiring less intensive hyperparameter tuning.

2.5.2. Efficiency of the Model

Two statistical measures, R2 and MAPE, were used to assess the created models’ prediction in this study. These metrics are used to assess the efficacy of models in a wide variety of applications, such as machine learning and regression analysis. These metrics point to a reliable and accurate model, which impacts the decision-making in engineering field.
Regression analysis relies heavily on the coefficient of determination, R2. It provides more useful information than predicting errors because it assesses the model’s explanatory power. The mathematical formula for R2 is given by Equation (5). A model’s average prediction error can be measured by its mean absolute percentage error (MAPE). Engineers and decision-makers can better grasp the potential discrepancy between predictions and reality when they use percentage errors. MAPE makes it easy to compare prediction models. When multiple algorithms in an ML application provide different results, MAPE can determine which model is the most accurate predictor. The mathematical expression for MAPE is shown in Equation (6). Better prediction accuracy is indicated by a low MAPE number.
R 2 = i = 1 n ( x i x ¯ ) ( y i y ¯ ) ( i = 1 n ( x i x ¯ ) 2 ) ( i = 1 n ( y i y ¯ ) 2 ) 2
M A P E = 1 n i = 1 n x i y i x i
where the actual and predicted data are x i and y i , the average of actual data and predictions are x ¯ and y ¯ , and the number of instances is n.

3. Results

3.1. Response Surface Methodology Results

3.1.1. Analysis of Variance (ANOVA)

The ANOVA results in (Table A1) demonstrate that the developed regression models for all four concrete properties—Compressive Strength (CS), Tensile Strength (TS), Ultrasonic Pulse Velocity (UPV), and Water Absorption (WA)—are statistically significant, as indicated by their exceptionally low p-values (<0.0001) for the models. For each response, the individual linear effects of the input factors (A: PPF, B: RCA, and C: Age) are also highly significant (p < 0.0001), confirming that Polypropylene Fiber content, Recycled Coarse Aggregate content, and curing Age are all critical determinants of the concrete’s performance. Specifically, for CS, all factors and their interactions (AB, AC, BC) and quadratic terms (A2, C2) are significant, highlighting a complex, non-linear relationship. For TS, UPV, and WA, the significant models include a combination of linear, interaction, and quadratic terms, with Age (C) being the most dominant factor for WA, and RCA (B) showing a very strong influence on UPV.
The fit statistics presented in Table 3 validate the high predictive power and reliability of the developed models. All models exhibit excellent coefficients of determination, with R2 values exceeding 0.92 and reaching 0.9943 for the Water Absorption (WA) model, indicating that the models explain over 92% of the variability in the experimental data. The close agreement between the Adjusted R2 and Predicted R2 values for each model, with the Predicted R2 being notably high (ranging from 0.8928 to 0.9922), confirms that the models are not overfitted and possess strong generalization capability for forecasting new data. The exceptionally high “Adequate Precision” ratios, all well above the desirable threshold of 4, signal a strong signal-to-noise ratio, which is essential for navigating the design space effectively. Furthermore, the low Coefficient of Variation (CV %) values, particularly for WA (1.99%) and CS (3.45%), indicate a high degree of precision and reliability in the model predictions relative to the mean response values.
The responses TS, CS, UPV, and WA were modeled using a variety of regression transformation techniques and their interactions with independent variables. The relationship between the input parameters and the outputs was modeled using quadratic regression. R2 values were near one, indicating that the prediction model can be utilized to predict output from input variables, since they are deemed statistically significant. The values of R2, adjusted R2, and predicted R2 were (0.9803, 0.9762, and 0.969), (0.9234, 0.9122, and 0.8928), (0.9569, 0.9518, and 0.9441), and (0.9943, 0.9935, and 0.9922) for CS, TS, UPV, and WA models, respectively. The difference between predicted and adjusted R2 was <0.2 for all quadratic models for CS, TS, UPV, and WA, indicating reasonable agreement.
Equations (7)–(10) show the quadratic models (QM) for CS, TS, UPV, and WA, respectively.
C S = + 13.7739 + 3.10426 P P F 0.064 R C A + 0.80342 A G E 0.0074 P P F × R C A + 0.0162 P P F × A G E 0.0005 R C A × A G E 0.475 P P F 2 0.0063 A G E 2
T S = + 2.76673 + 0.158211 P P F 0.007789 R C A + 0.017334 A G E + 0.001310 P P F × A G E 0.000040 R C A × A G E 0.000119 A G E 2
U P V = + 2938.94281 + 330.84667 P P F 16.93230 R C A + 51.02298 A G E + 0.035538 R C A 2 0.414695 A G E 2
W A = + 11.50027 0.989717 P P F + 0.026769 R C A 0.142897 A G E 0.000164 R C A × A G E + 0.111805 P P F 2 + 0.000953 A G E 2
Figure 5 presents the predictive accuracy plots (predicted vs. actual) for the developed models of concrete compressive strength (CS), tensile strength (TS), ultrasonic pulse velocity (UPV), and water absorption (WA). The predicted vs. actual plots demonstrate the correlation between the model predictions and the experimentally measured values. The close alignment of data points along the ideal line of perfect agreement for each property (CS, TS, UPV, WA) validates the high predictive accuracy and reliability of the developed models, confirming their effectiveness in predicting the respective concrete properties based on the input parameters.
Figure 6 presents the diagnostic residual vs. runs plots for the developed models. The residual plots are used to verify the independence of the model errors by plotting residuals against the run order of experiments. The random scatter of residuals around zero, without discernible patterns or trends, indicates that the models are well-formulated and that the errors are independent, satisfying a key assumption of regression analysis.

3.1.2. Response Surface Contour Plots

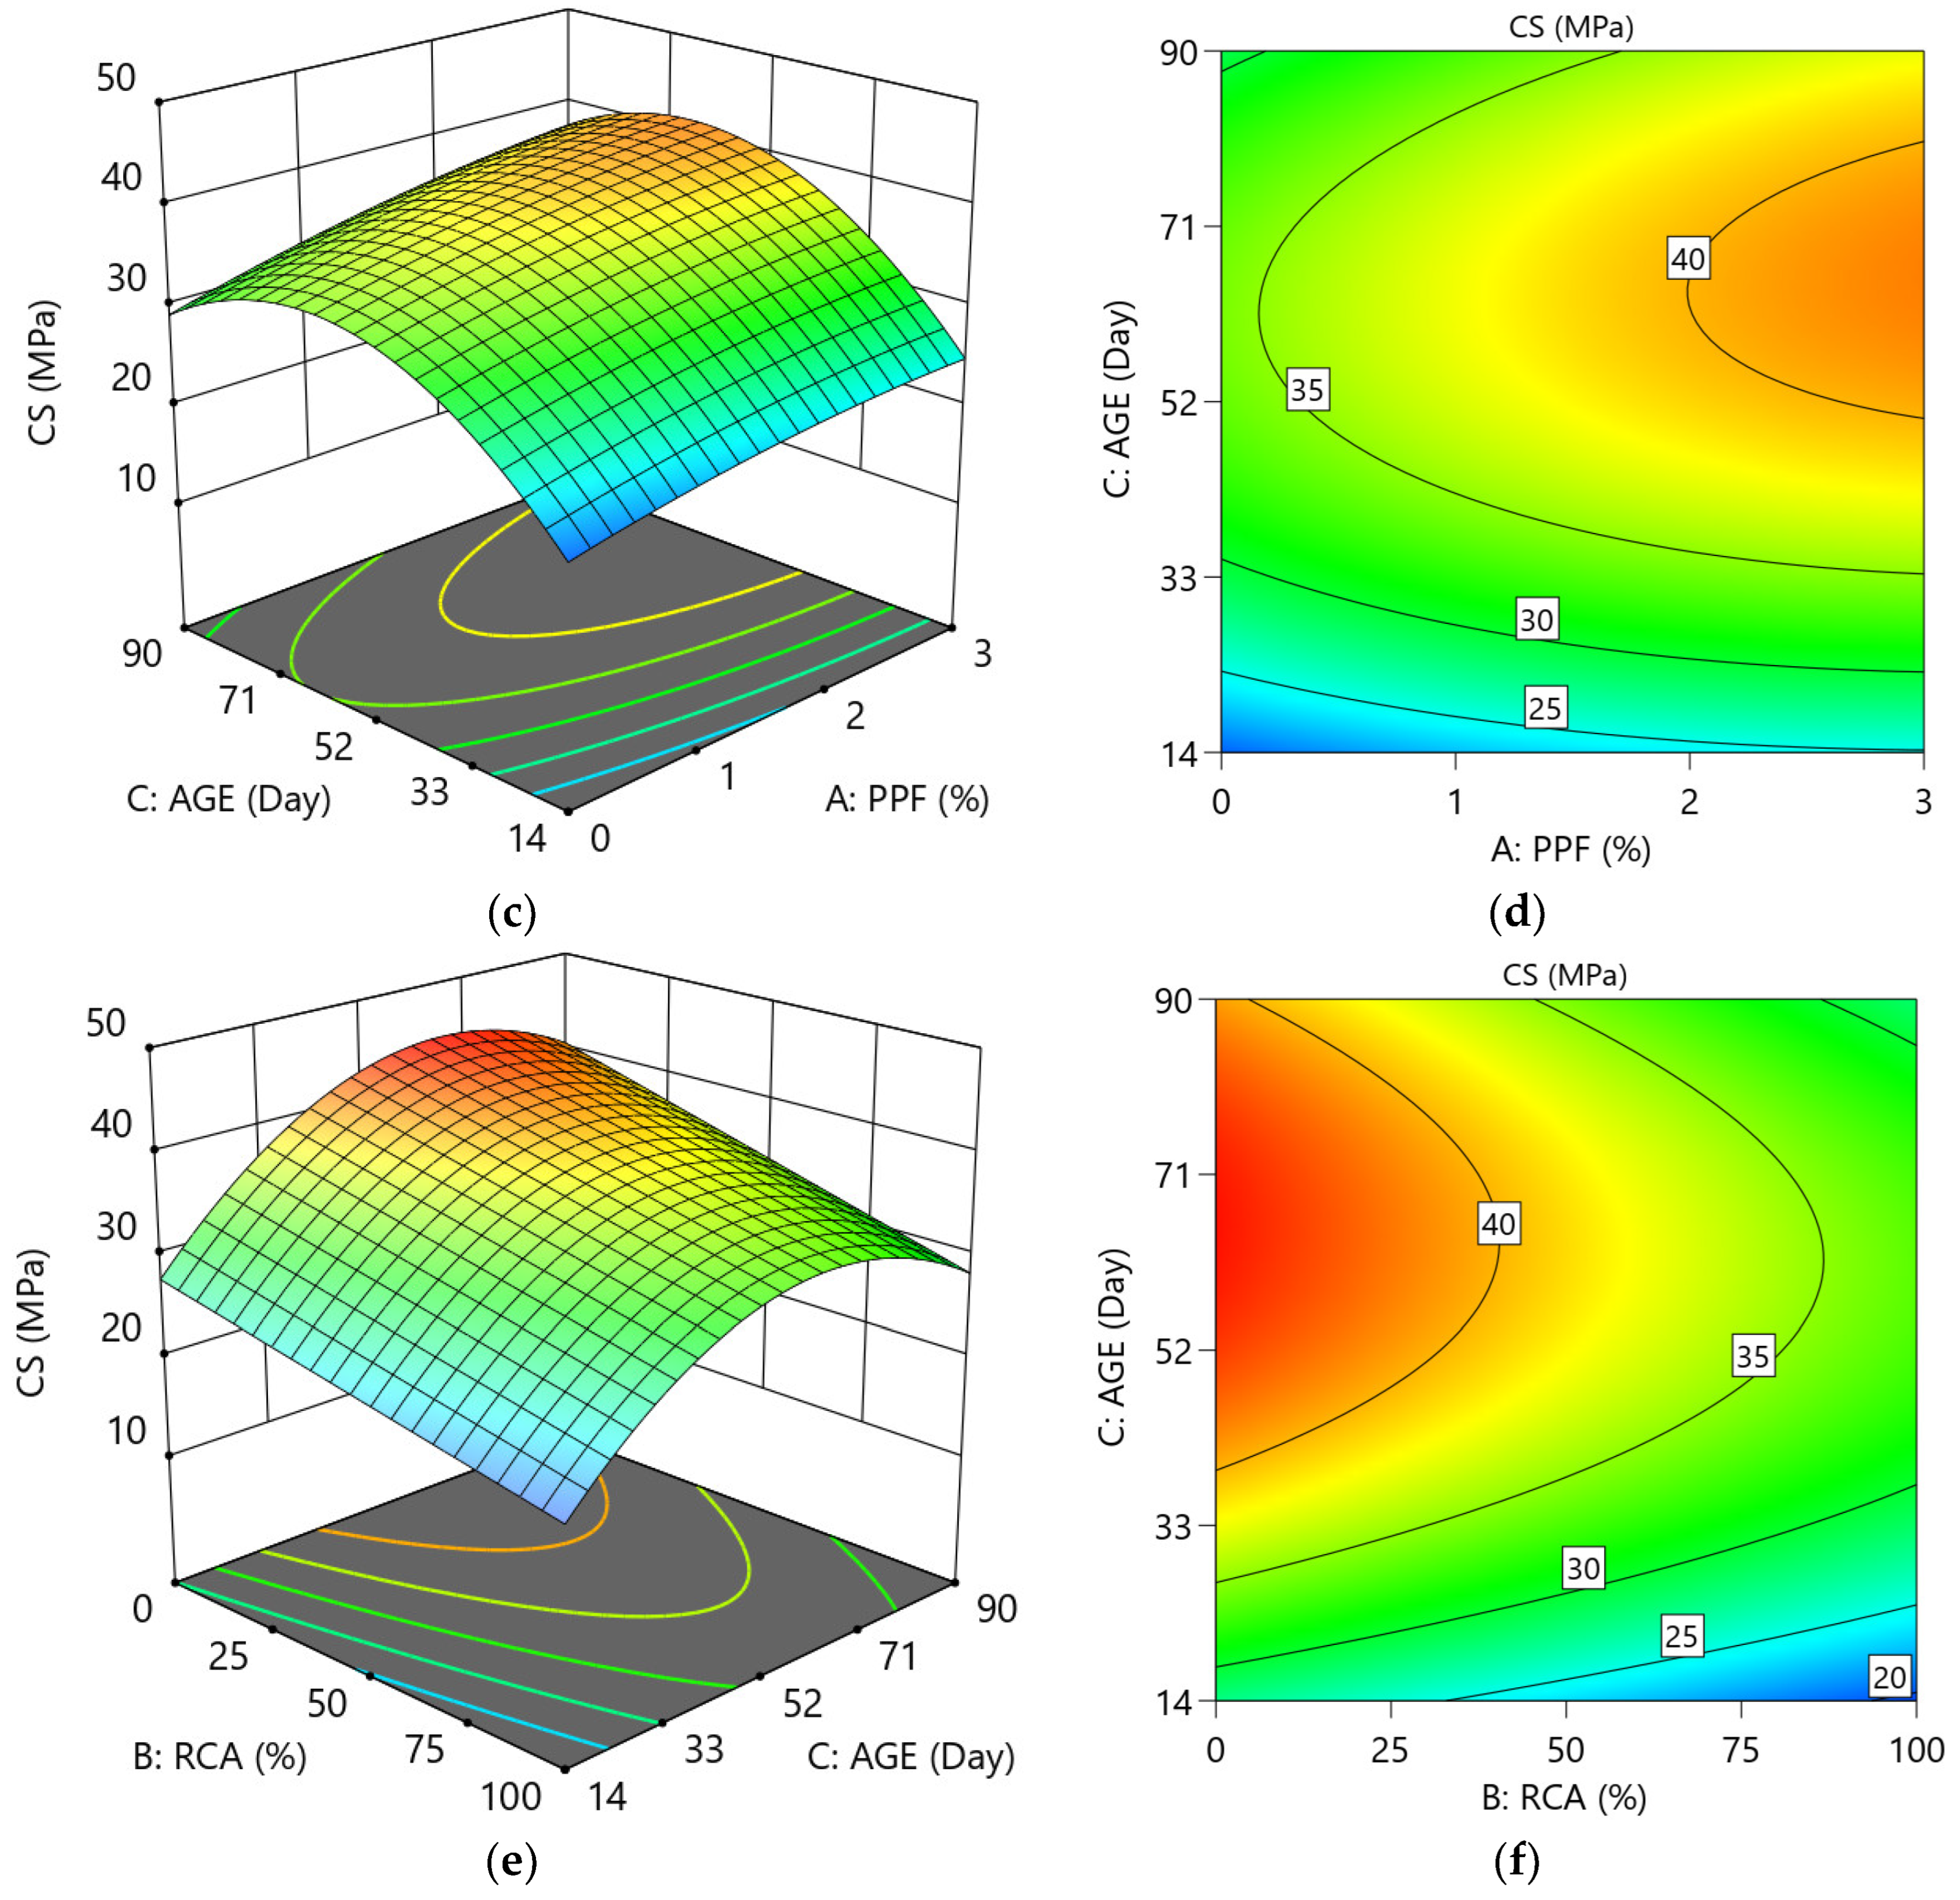
Figure 7 provides a comprehensive visualization of how Concrete Compressive Strength (CS) is influenced by the interplay of three input variables: RCA content, the PPF ratio, and the age of the concrete. The suite of 3D and 2D plots systematically examines the paired relationships between these parameters. The plots for RCA and PPF (Figure 7a,b) likely reveal the trade-off between sustainability and strength, often showing that higher RCA content can reduce CS, while PPF may mitigate this reduction by improving toughness. The plots involving Age (Figure 7c–f) demonstrate the expected strength gain over time, but crucially, they illustrate how this rate of strength development is dependent on the mix proportions; for instance, the strengthening effect of aging may be less pronounced in mixes with very high RCA content. Collectively, the figure elucidates the complex, non-linear dependencies that govern compressive strength, emphasizing that the effect of any single parameter must be considered in the context of the others for effective mix design optimization.
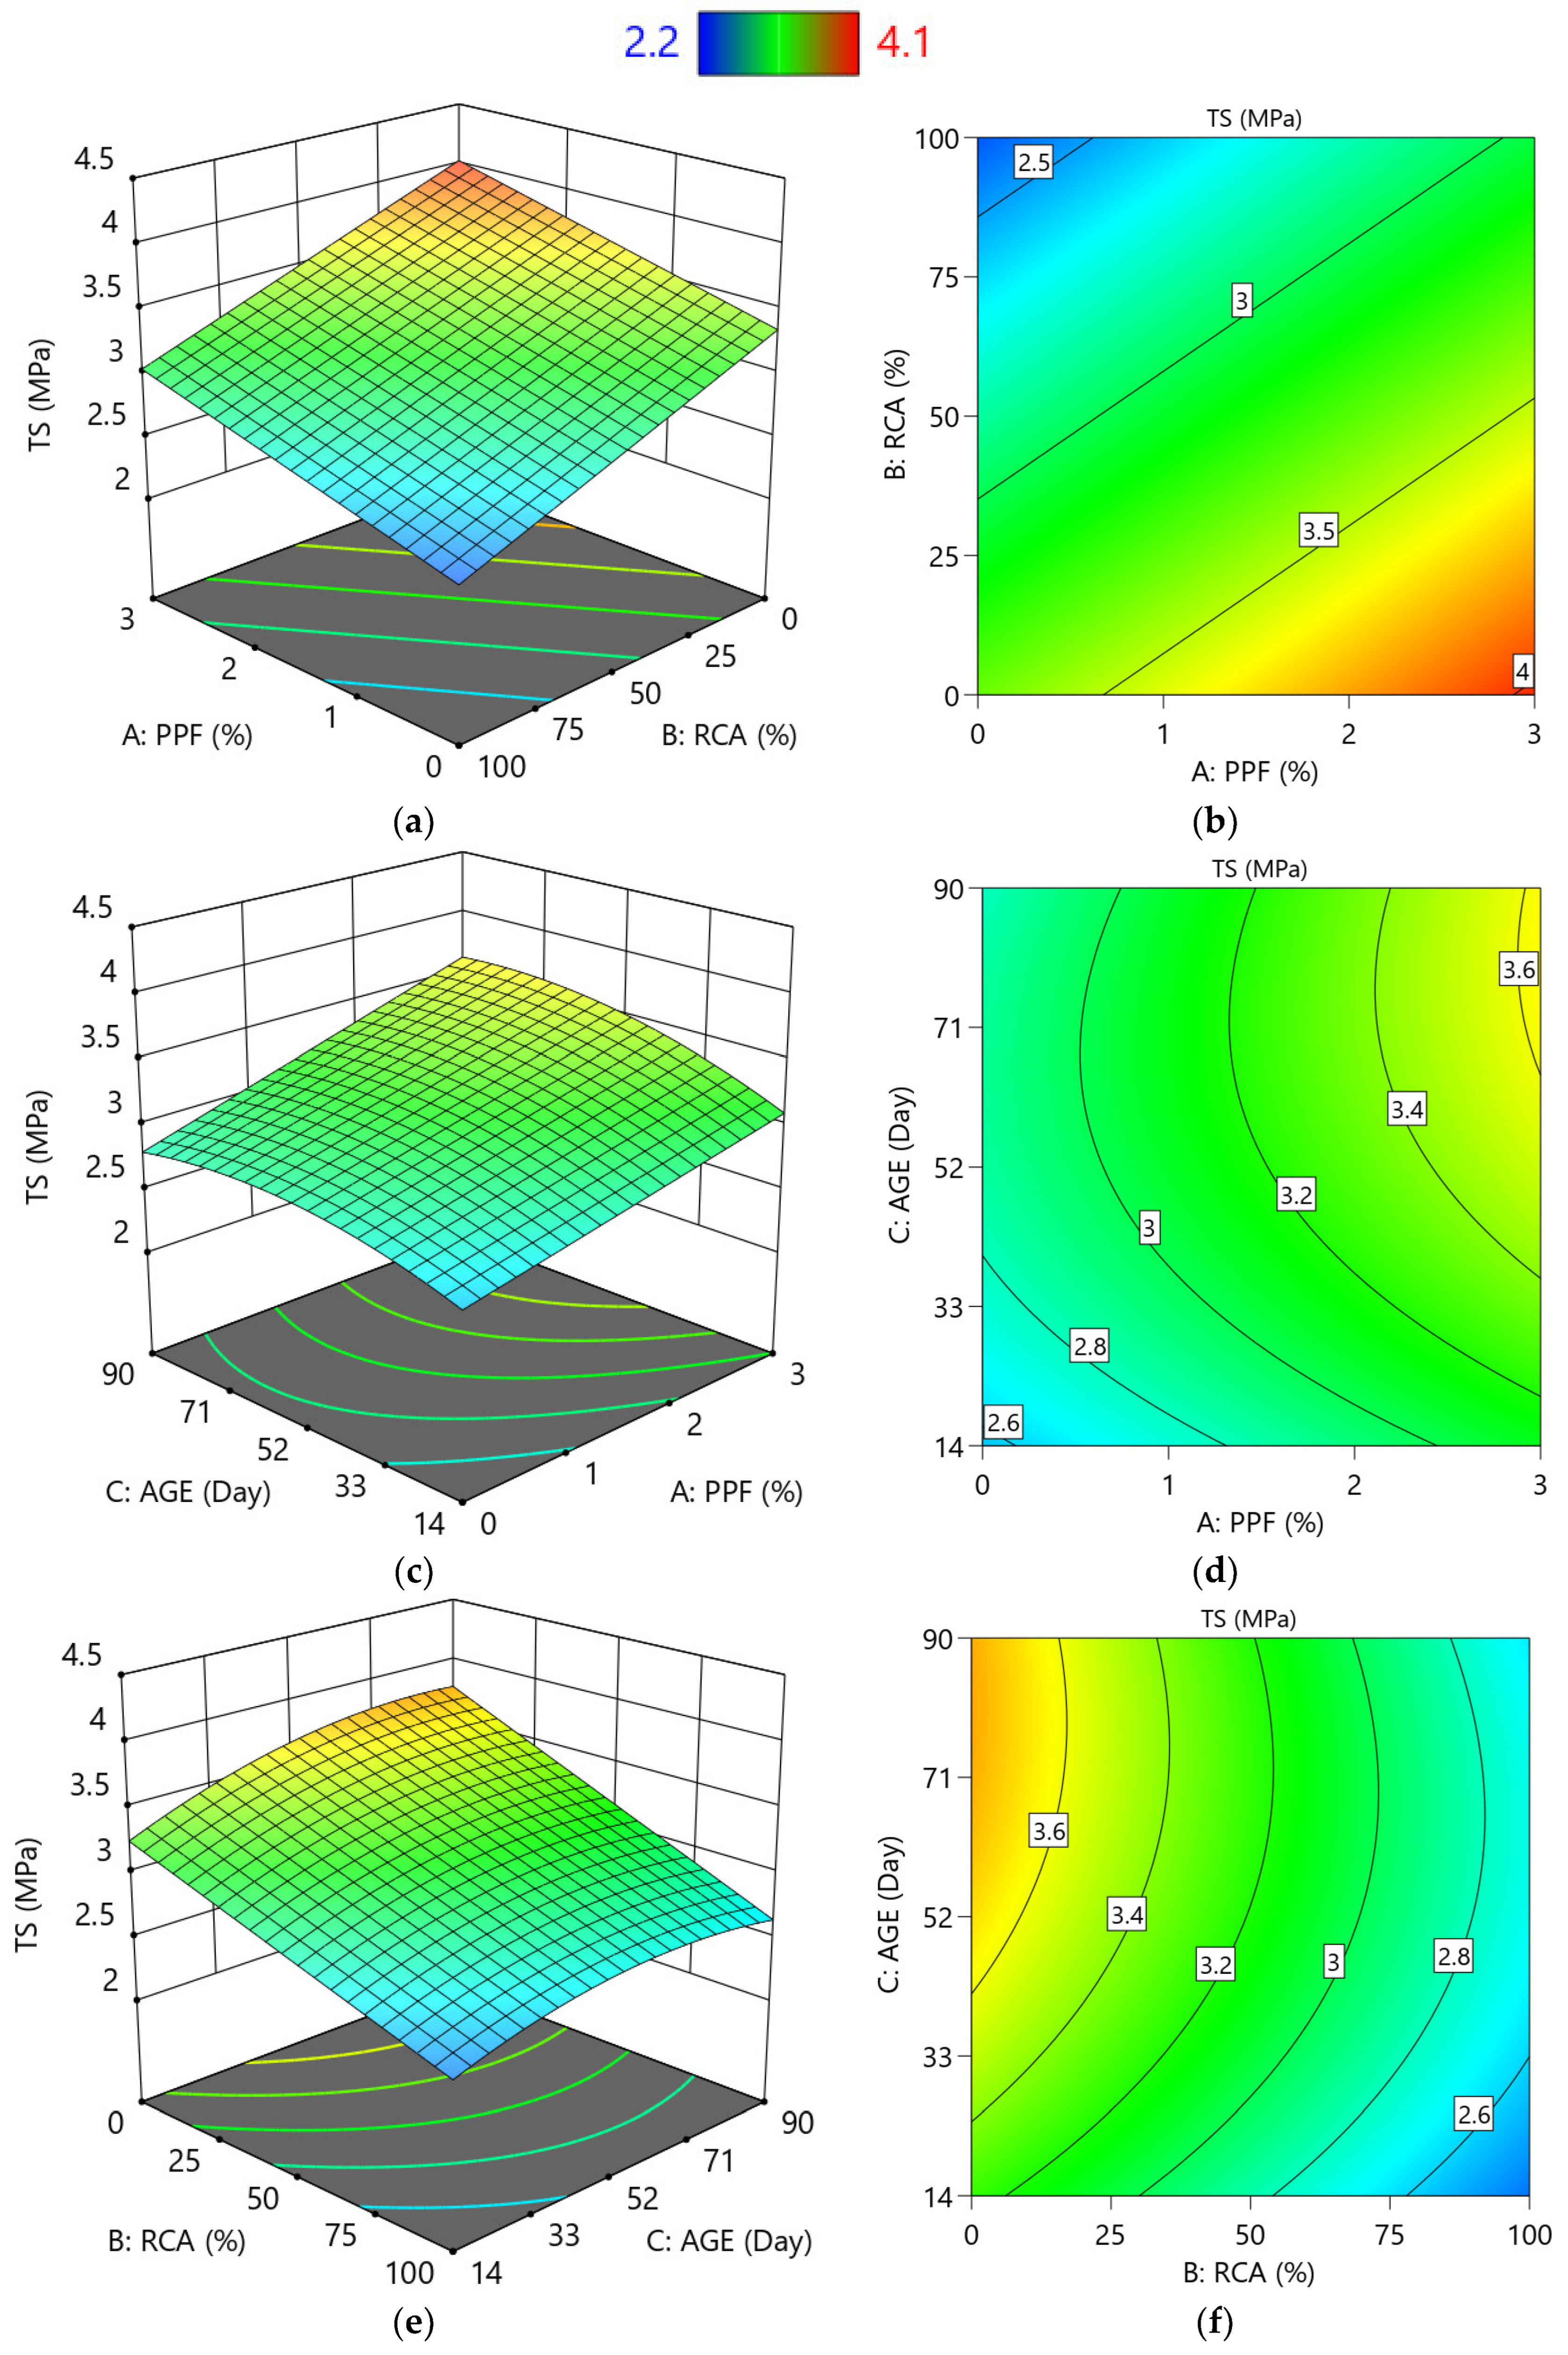
Figure 8 illustrates the influence of RCA content, PPF ratio, and concrete age on the tensile strength (TS) of concrete through a series of three-dimensional and two-dimensional plots. The figure illustrates the complex interplay between these variables, with the 3D surface plots (Figure 8a,c,e) providing a comprehensive visualization of how TS responds to the simultaneous variation of two parameters. Specifically, the plots likely demonstrate that while increased RCA content may generally lead to a reduction in tensile strength due to the inherent weaknesses of recycled materials, the incorporation of PPF can significantly mitigate this effect by providing secondary reinforcement and improving the material’s post-cracking behavior. Furthermore, the plots involving Age (Figure 8c–f) would show the expected development of tensile strength over time, potentially highlighting how the rate of this strength gain is modulated by the specific RCA and PPF proportions in the mix. The corresponding 2D contour plots (Figure 8b,d,f) offer a more detailed and quantifiable interpretation of these relationships, enabling a clearer understanding of the optimal combinations of input parameters required to achieve desired tensile performance in sustainable concrete mixtures.
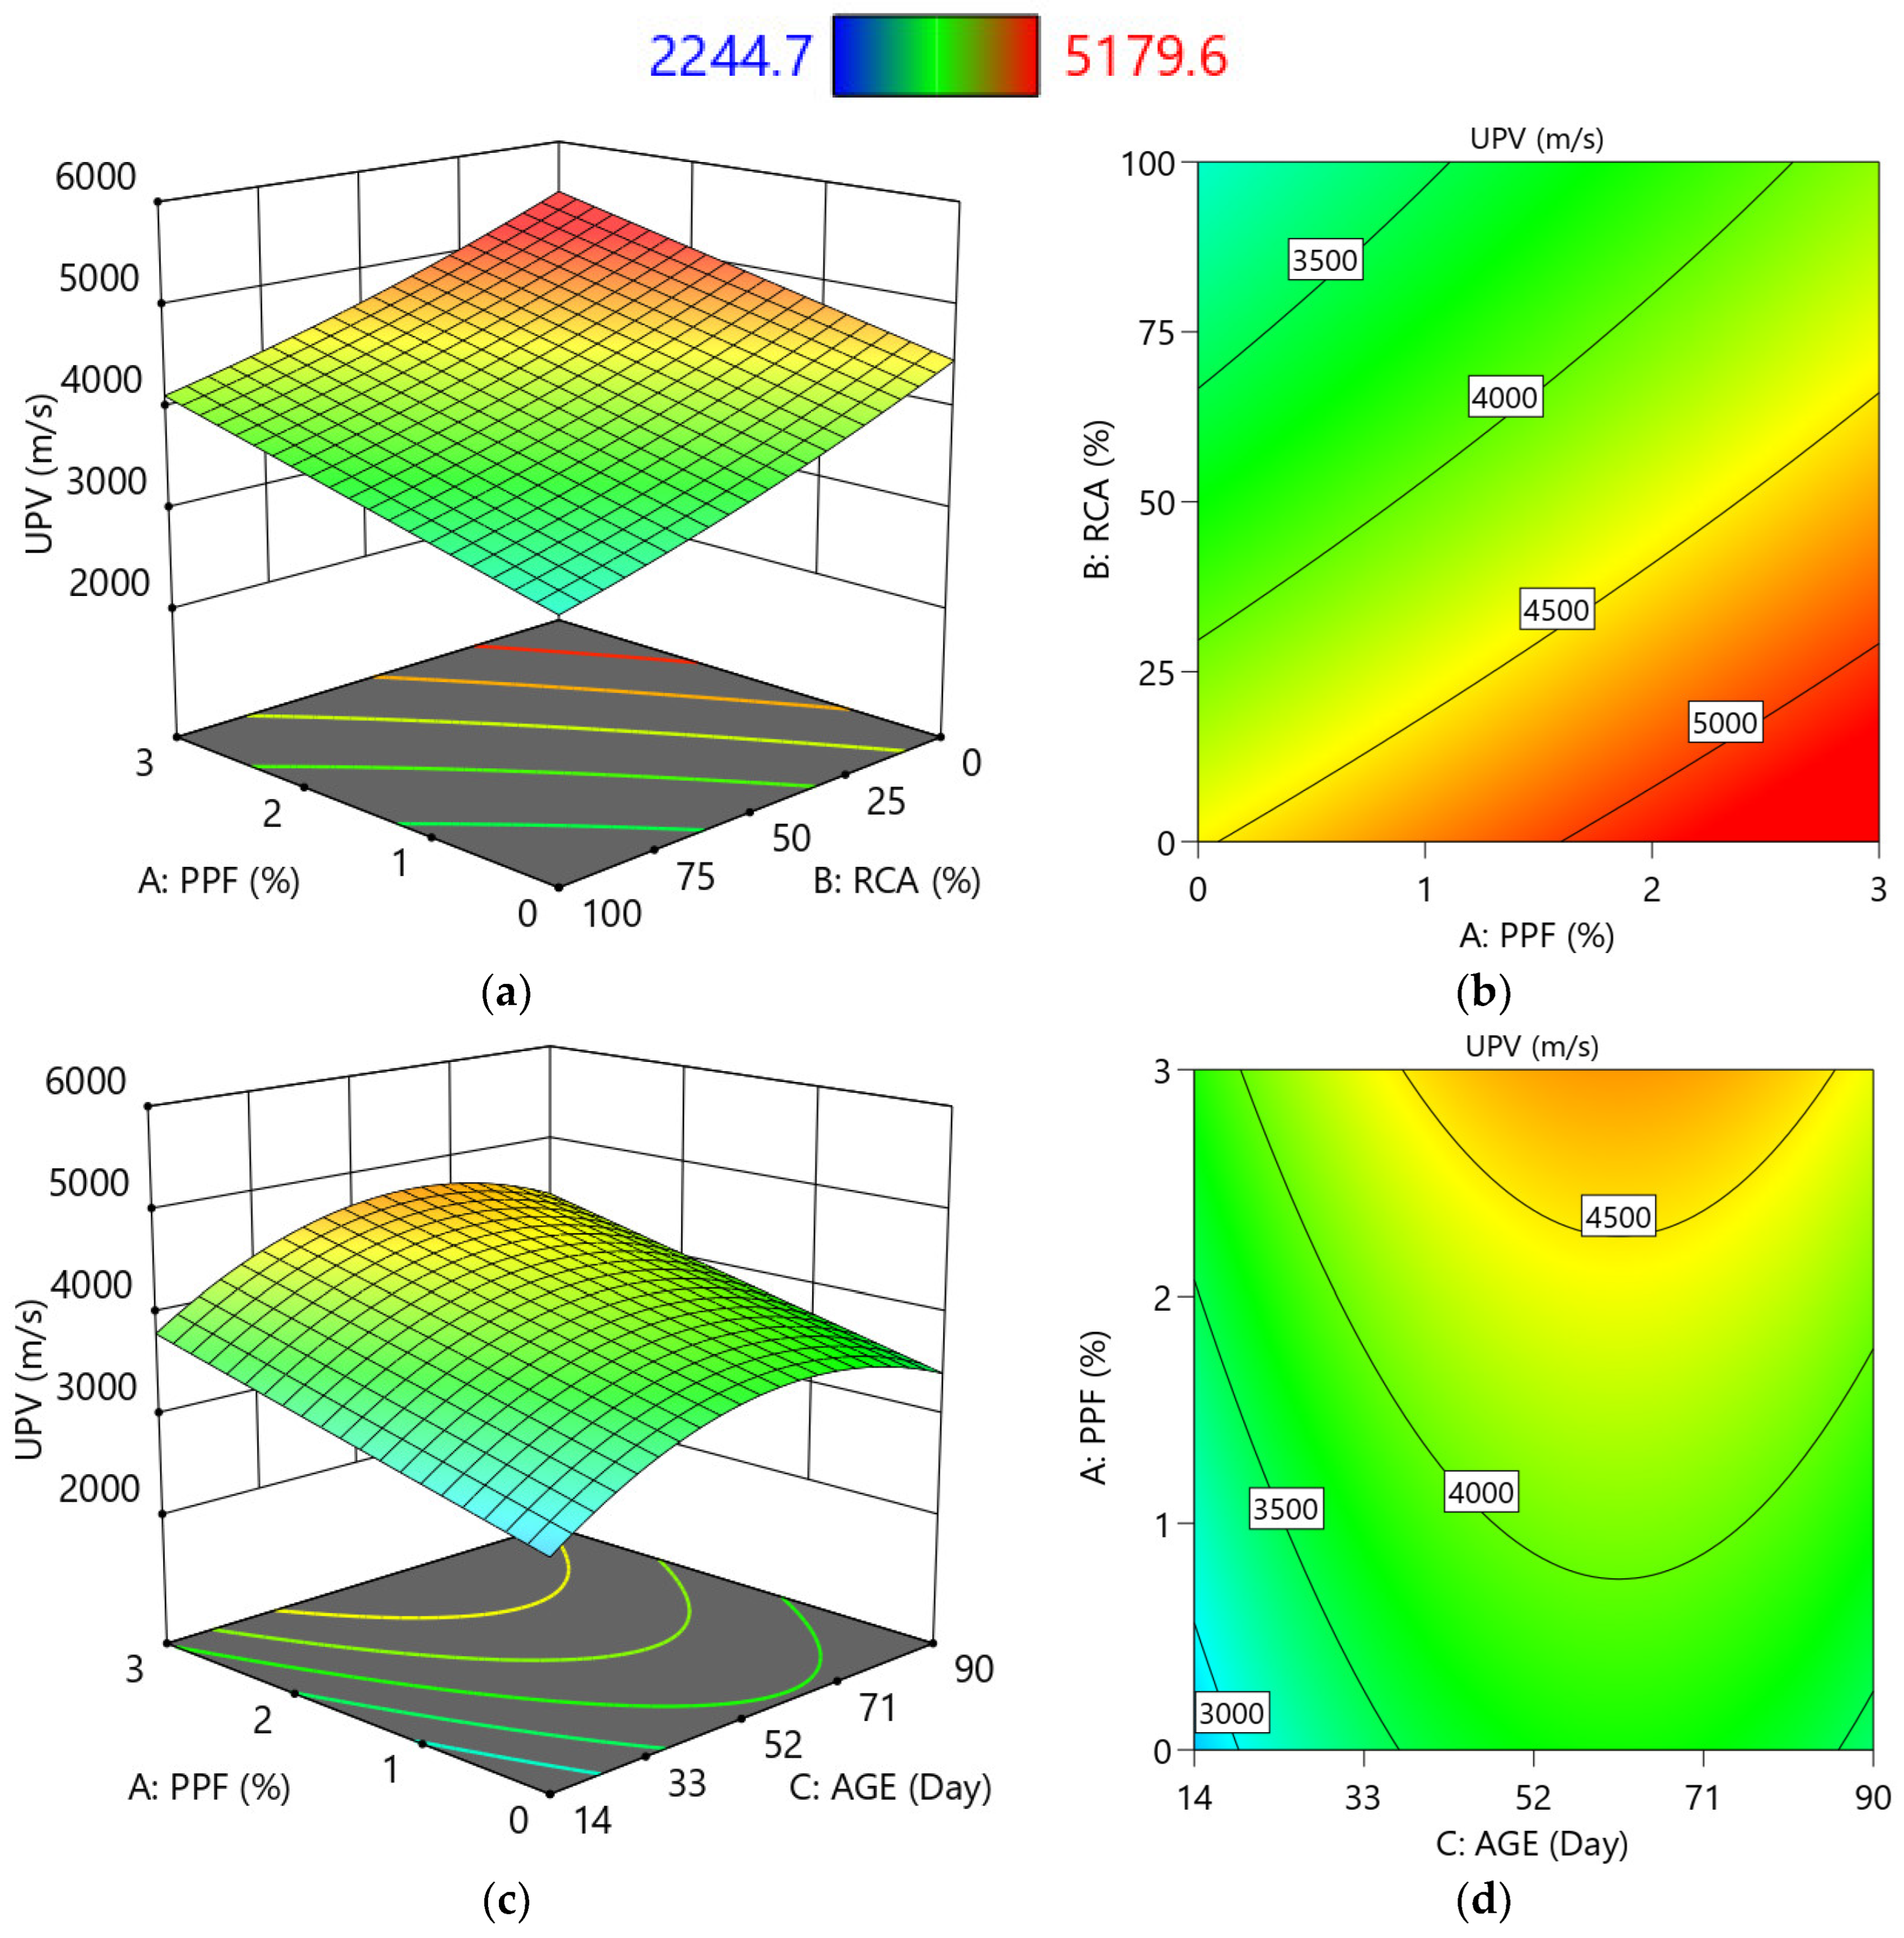
Figure 9 analyzes the effects of RCA content, PPF, and concrete age on the ultrasonic pulse velocity (UPV), an indicator of concrete’s density and structural integrity. The plots reveal critical trends: as the RCA content increases from 0% to 100%, the UPV decreases, which signifies a reduction in material homogeneity and an increase in internal microcracking due to the weaker recycled aggregate. Conversely, the inclusion of PPF appears to have a compensatory effect, likely by bridging micro-cracks and enhancing the overall compactness, thus moderately improving the UPV, particularly in mixes with higher RCA content. Furthermore, the plots involving Age demonstrate the expected positive relationship, where UPV increases over time as the cementitious matrix continues to hydrate, leading to a denser and more continuous microstructure. Collectively, the figure underscores that while high RCA usage compromises UPV, this detrimental effect can be effectively mitigated by the synergistic combination of fiber reinforcement and adequate curing age.
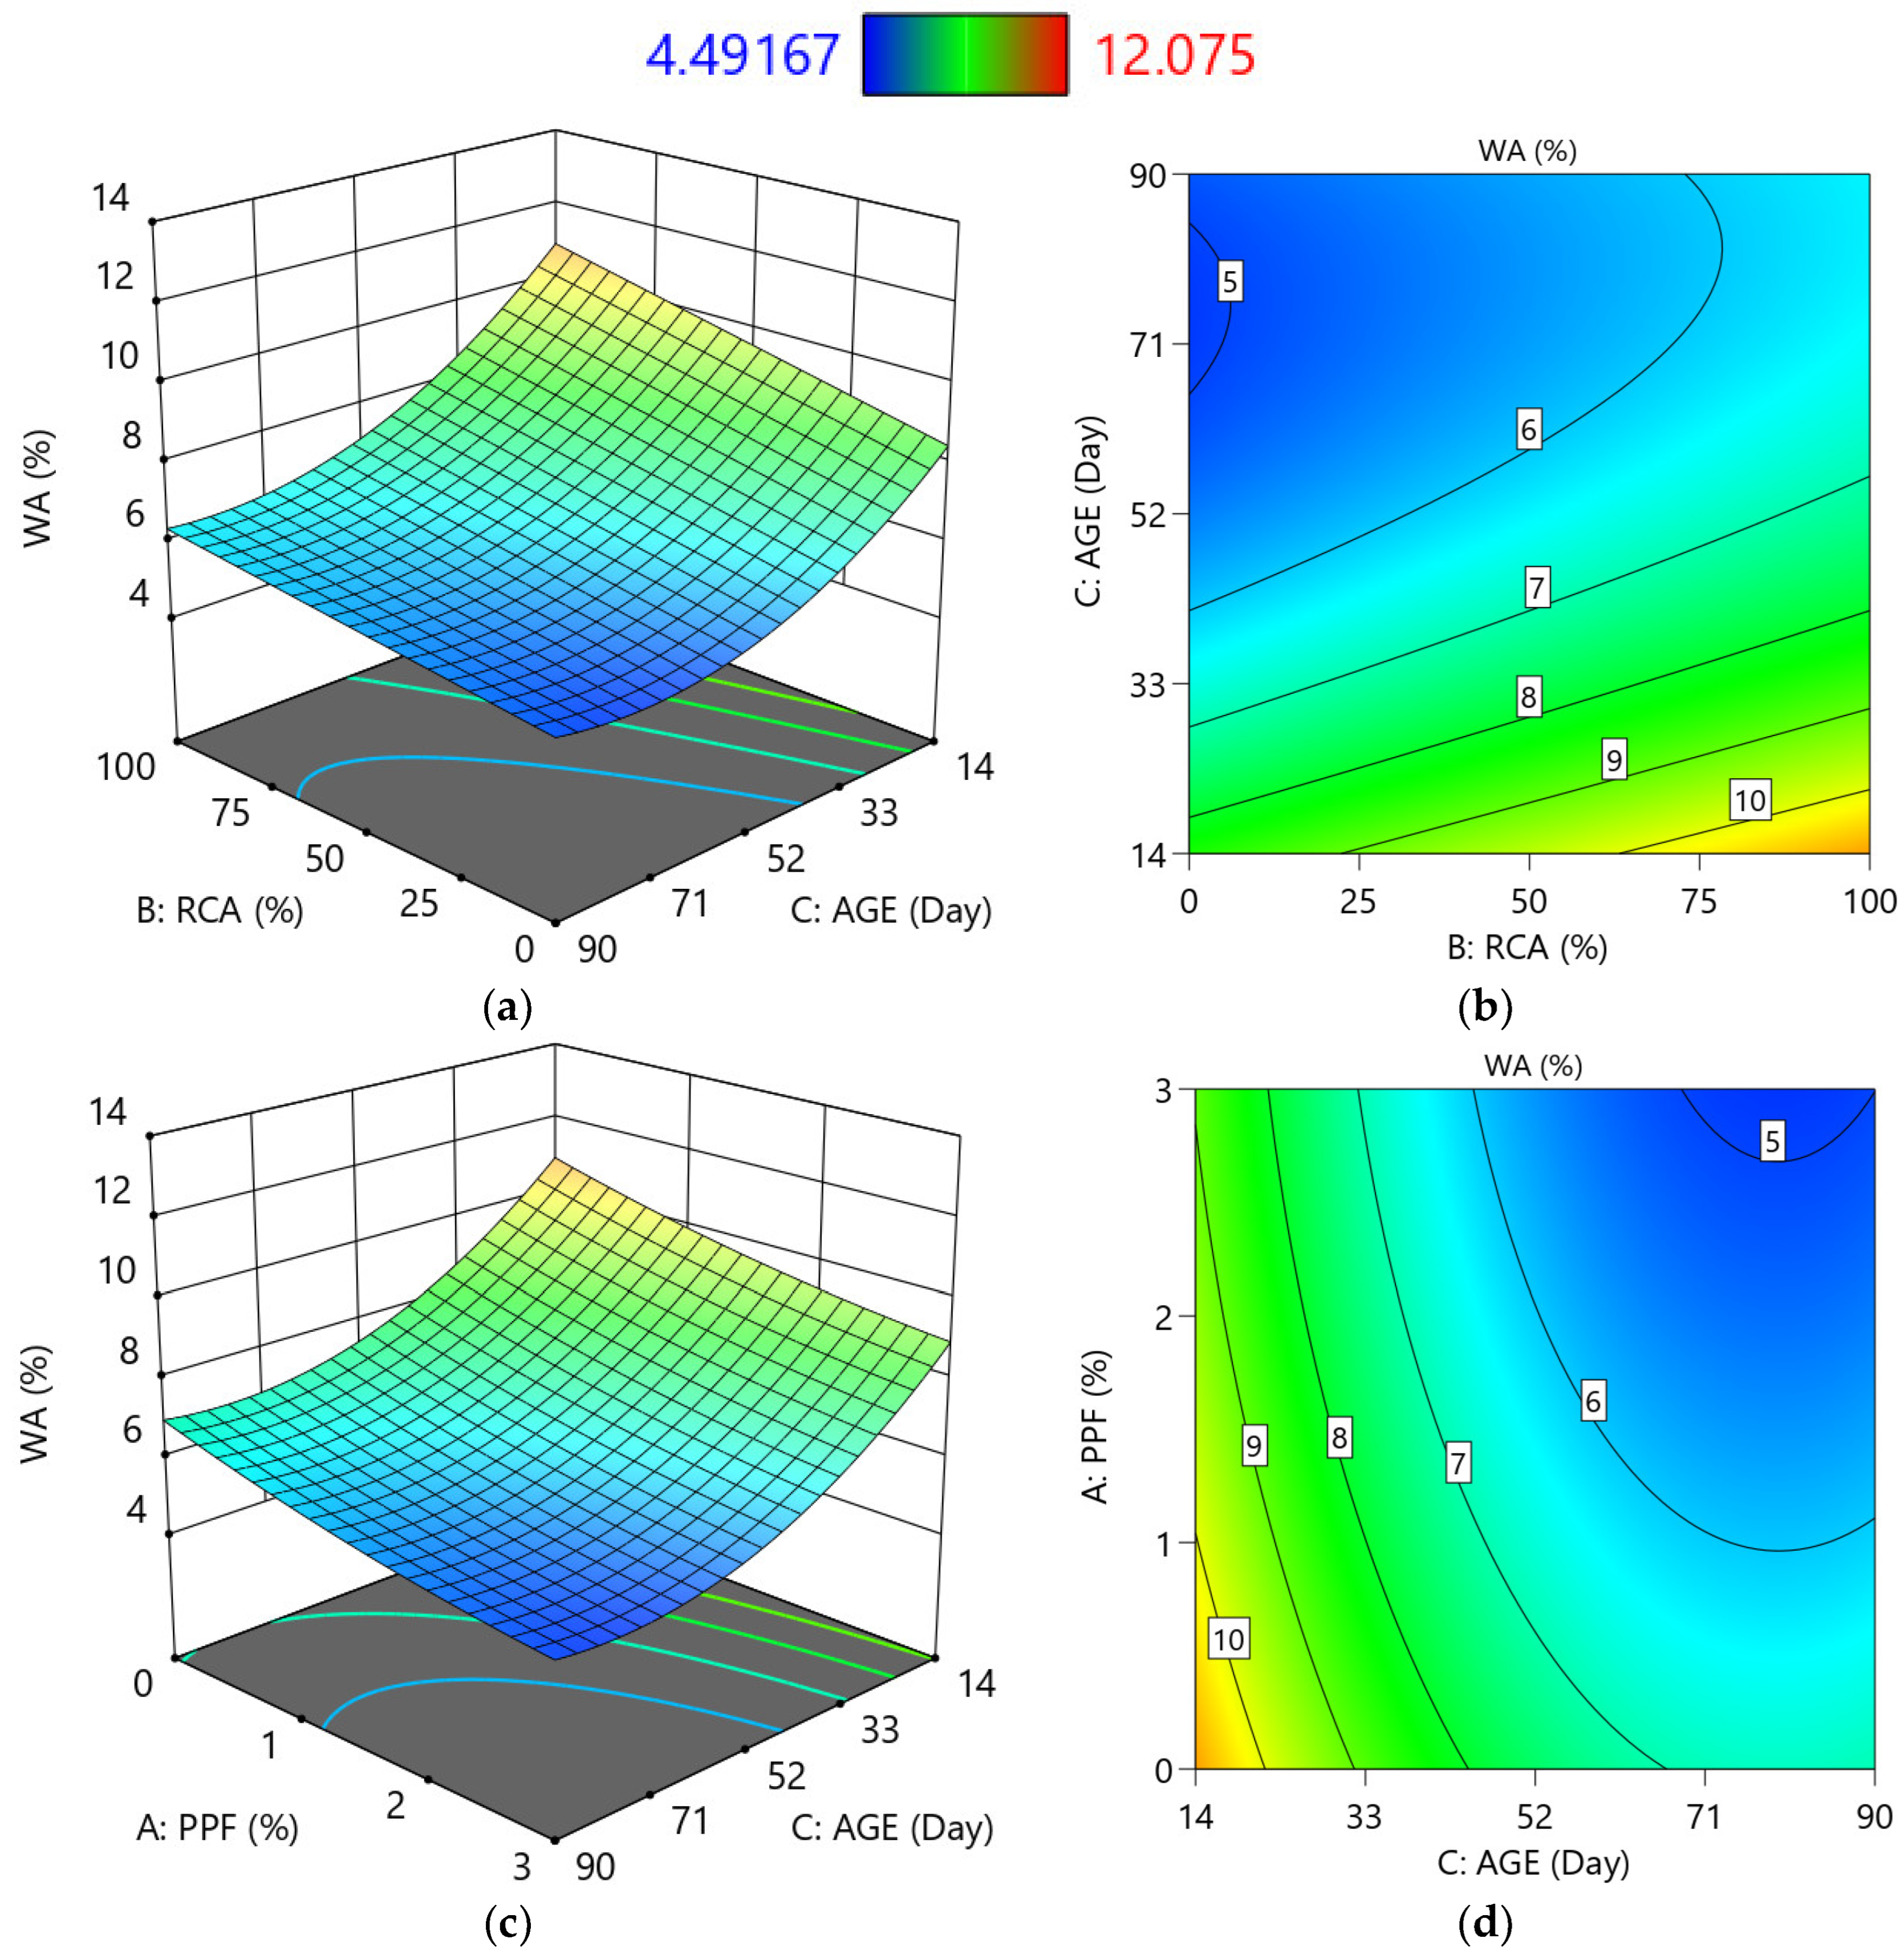
Figure 10 illustrates the interconnected effects of RCA, PPF, and concrete age on the water absorption (WA) of concrete, a critical measure of its porosity and durability. The plots indicate a strong positive correlation between RCA content and WA; as the percentage of RCA increases, water absorption rises significantly. This is attributed to the higher porosity and older mortar adhered to the recycled aggregates, which create a more permeable concrete matrix. Conversely, the addition of PPF shows a mitigating effect on WA, as the fibers likely help to bridge micro-cracks and reduce interconnectivity of pores, thereby limiting water penetration. The influence of Age is also evident, with water absorption decreasing over time due to ongoing hydration, which densifies the microstructure and reduces pore space. The combined analysis in the 3D and 2D plots suggests that while high RCA content increases permeability, this negative impact can be effectively counterbalanced by the synergistic use of an optimal PPF ratio and extended curing time, leading to a more durable concrete.

3.2. ML Prediction Models

The random forest (RF) technique is utilized as a machine learning method for predicting responses in this study.

3.2.1. Optimization of Hyperparameter

This research utilized a grid search approach for hyperparameter optimization to improve the models’ predictive performance and generalization. By methodically evaluating parameters across a specified range, the process aimed to reduce generalization errors and mitigate the risks of overfitting or underfitting. This ensures the resulting models are both accurate and robust. The specific hyperparameters and their optimized values are provided in Table 4.
Table 5 shows the summary of the statistical measures based on predictions of machine learning (RF) models of CS, TS, UPV, and WA. The values of R2 for train and test datasets for all responses range between 0.9690 and 0.9959, extremely near unity, indicating high power of the prediction models, and the developed models accurately represent the trend in the dataset. For the train dataset, the MAPE values for CS, TS, UPV, and WA were (1.46, 2.01, 1.95, and 1.7%), and for the test dataset, they were (2.53, 2.23, 2.74, and 2.51%). This indicates that all prediction models achieved error rates below 5%.
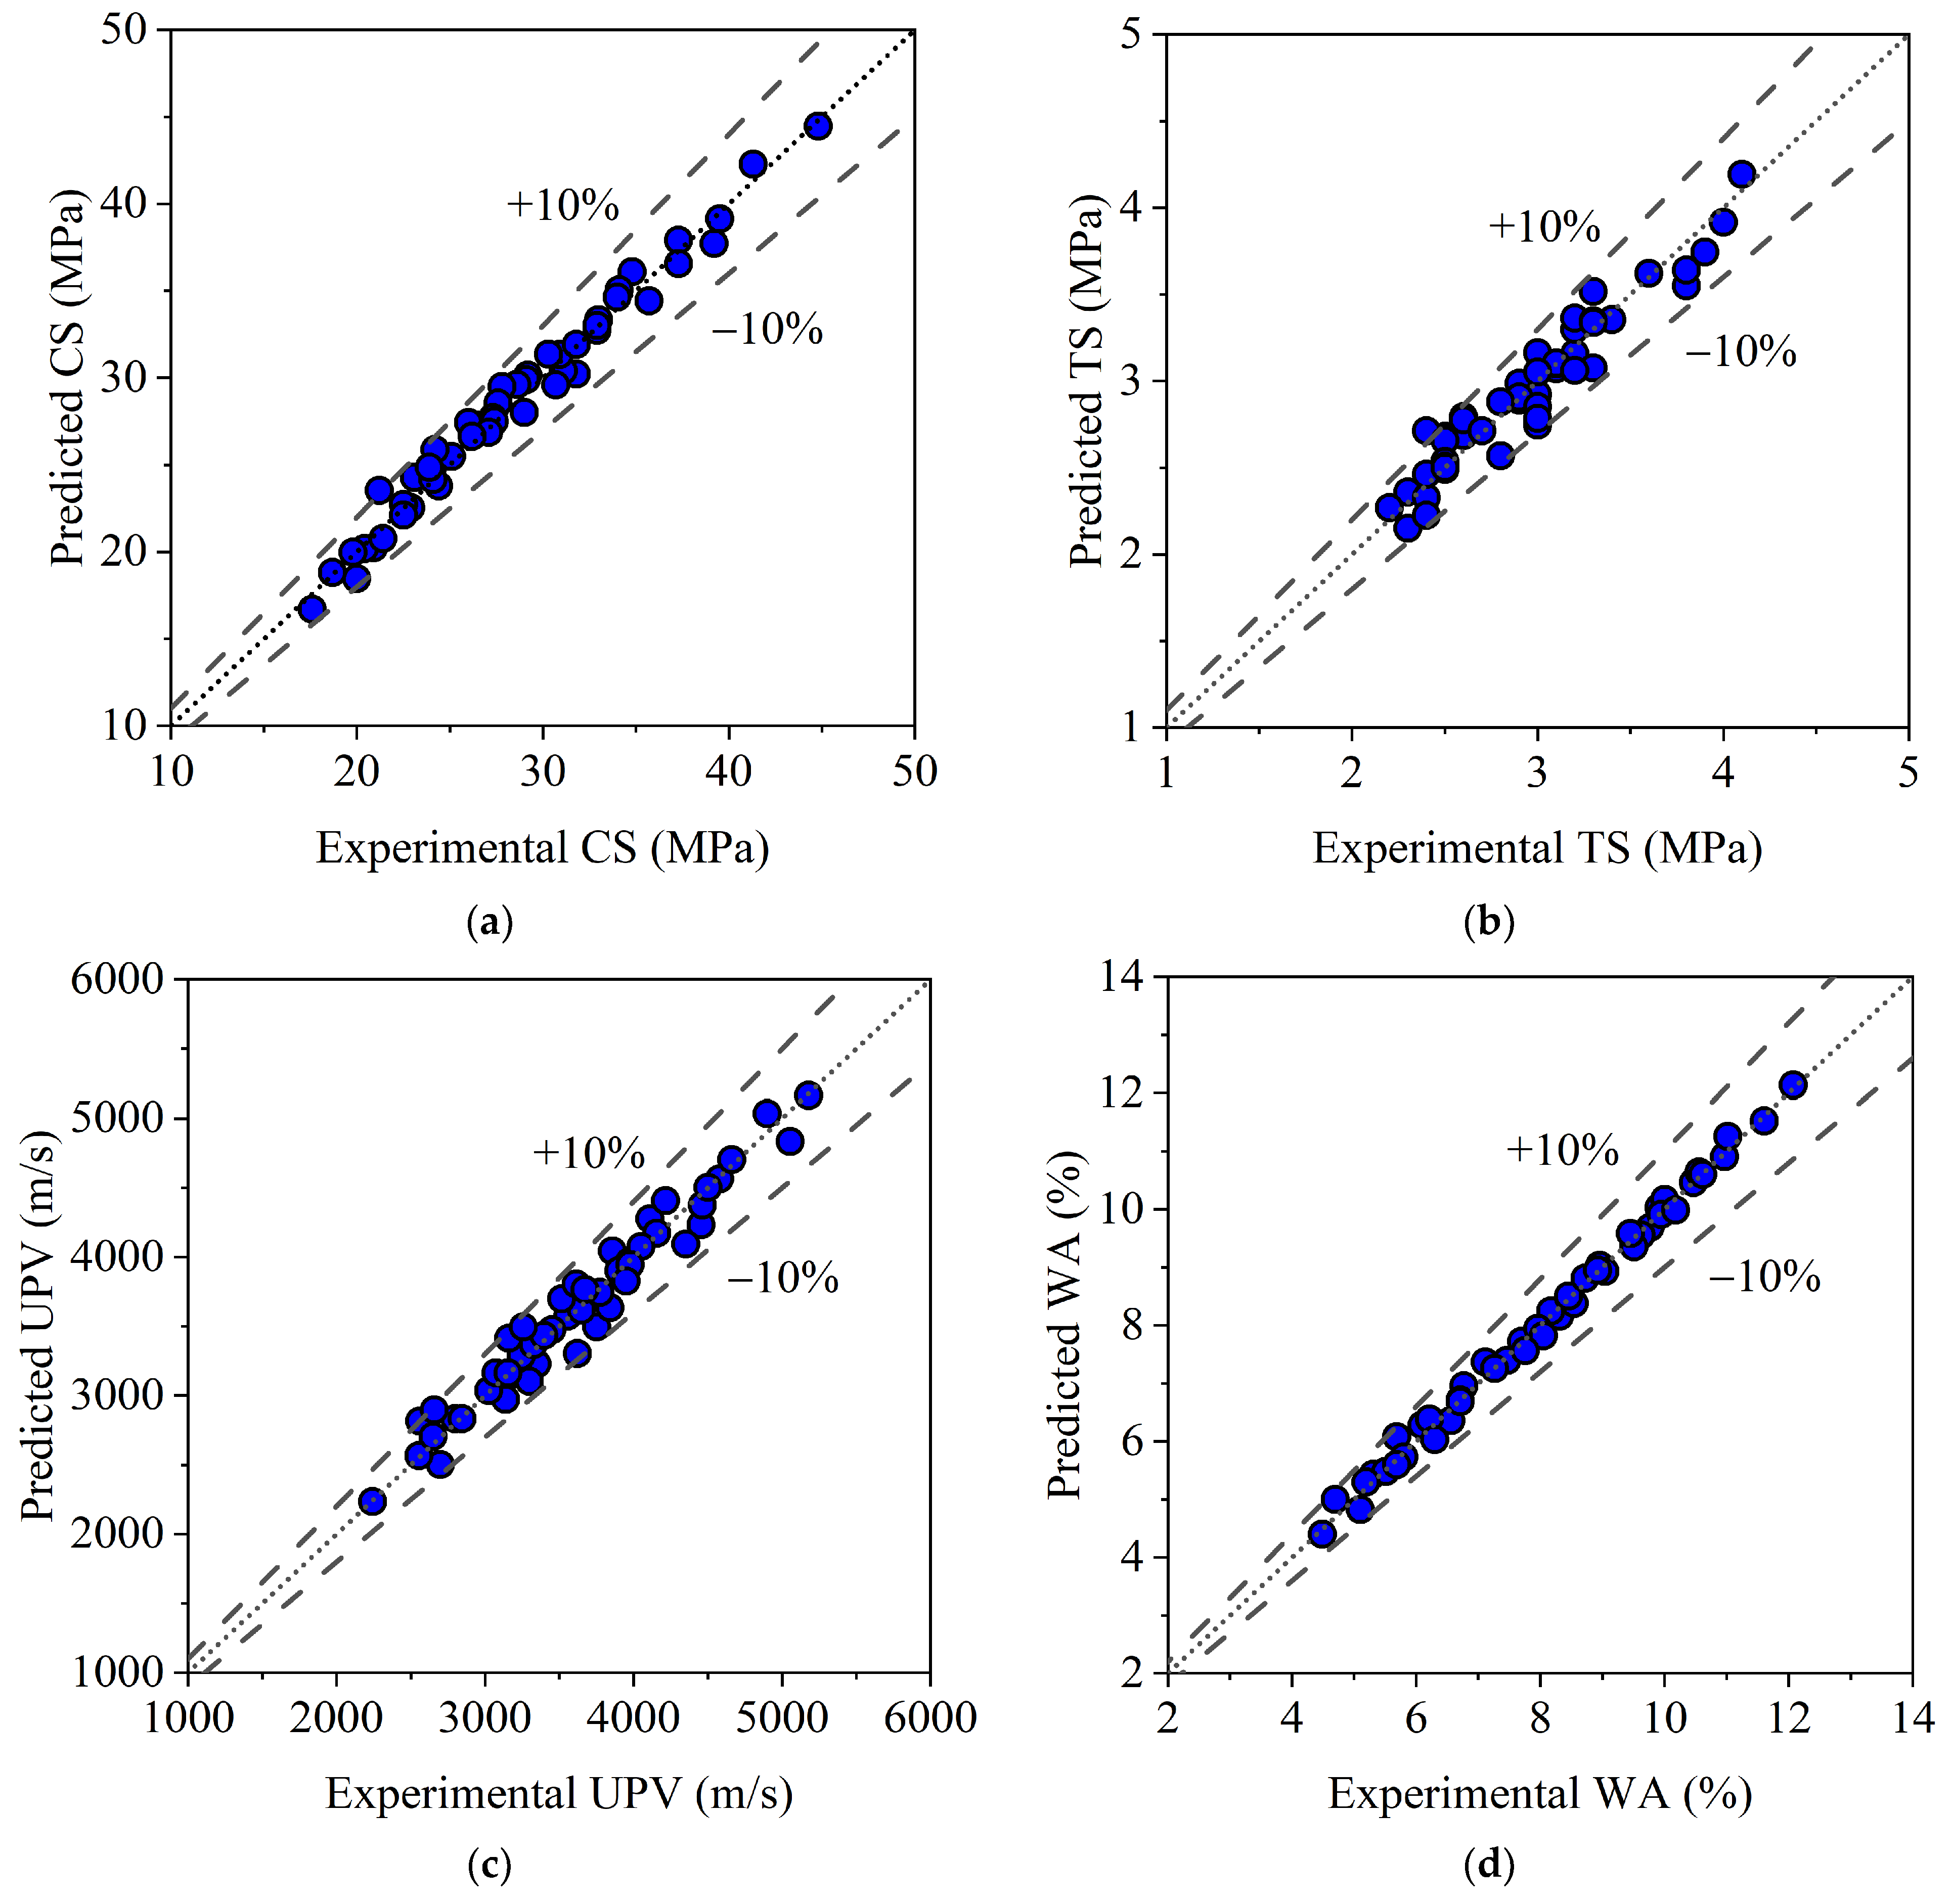
The results shown in Figure 11a indicate that the random forest model successfully predicts and correlates the experimental and estimated values of CS with R2 of 0.9955 and 0.9866 for the train and testing sets. Figure 11b compares the actual data with the predicted training and testing TS values, demonstrating that the TS prediction model performed well using the RF approach. The ML model demonstrated a significant relationship between the predicted and actual TS values, as evidenced by the R2 of 0.9810 and 0.9784, respectively, for the train and testing datasets. Figure 11c displays the comparison between the real data and the predicted train and test UPV values, showing that the UPV prediction model worked well with the RF method. Figure 11d compares the real data with the anticipated train and test WA values, showing that the WA prediction model worked well with the RF approach. The findings from Figure 11 indicate that all predicted outcomes reside within the 10% error limit. Scatter plots displaying points densely clustered around the optimal line in both datasets indicate that the model predictions approximate the actual values closely.
The prediction error versus data order plots for the developed Random Forest (RF) models are shown in Figure 12a. The compressive strength (CS) model demonstrates a high level of model stability and performance. The training errors for CS are exclusively positive and consistently very low. More importantly, these errors are distributed randomly around zero without exhibiting any discernible systematic pattern or trend across the data sequence. This random scattering of minimal errors indicates that the RF model is well-trained and has not learned any specific order-dependent biases present in the dataset. It successfully captures the underlying relationships between the input variables and the CS, leading to robust and reliable predictions. The specific plots for tensile strength (TS) (Figure 12b), ultrasonic pulse velocity (UPV) (Figure 12c), and water absorption (WA) (Figure 12d) exhibit similar behavior, suggesting that the RF algorithm generalized effectively across all four predicted concrete properties, providing a consistently high predictive accuracy throughout the entire dataset.

3.2.2. K-Fold Cross Validation (KCV)

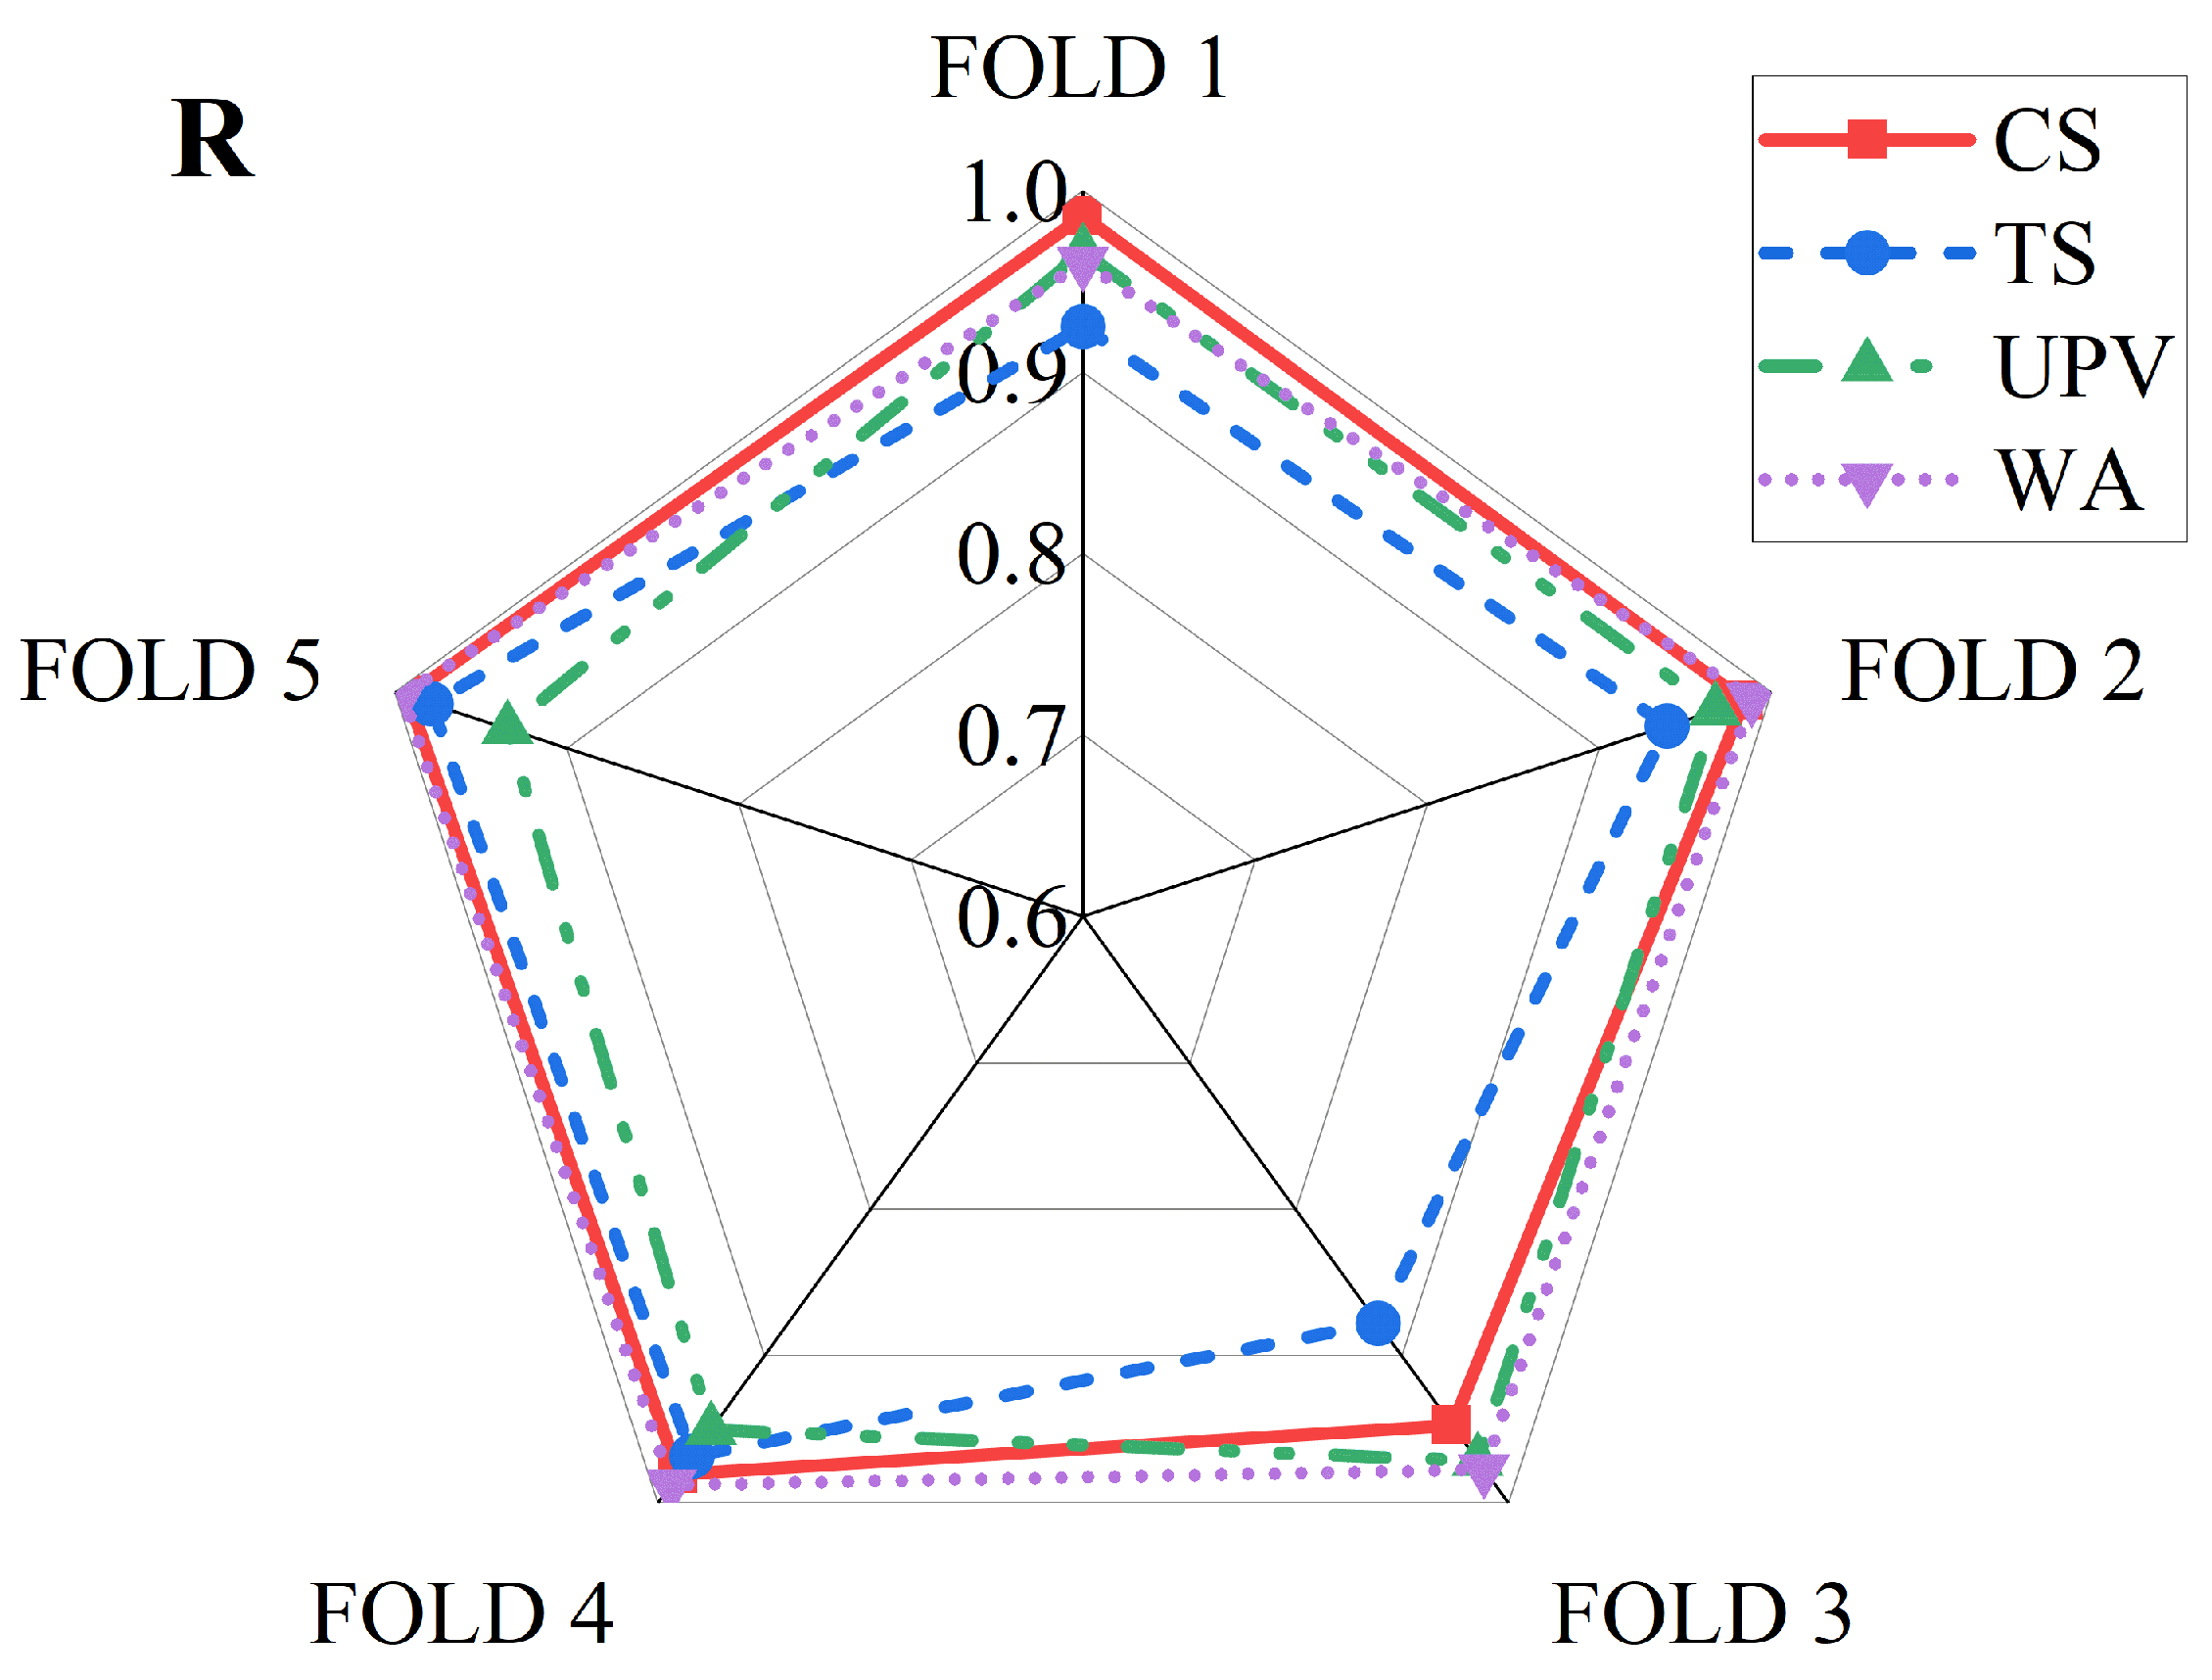
The KCV is employed to evaluate model resilience across different data subsets. Figure 13 illustrates the results for the testing data set of each folder. A k-fold analysis was employed to assess the outputs of each model (Figure 13). The R values for the CS models varied from 0.9472 to 0.9926, with a mean of 0.97804. The R value for the TS model varied from 0.8776 to 0.979, with a mean of 0.93782. The R value of the UPV model varied from 0.9344 to 0.9712, with a mean of 0.95784. The R of WA model varied from 0.9603 to 0.9955, with a mean of 0.98182 (Figure 13). The most significant variances in R for k-fold analysis were 3.2%, 6.4%, 2.4%, and 2.2% for CS, TS, UPV, and WA, respectively, signifying minimal deviation from the mean value.

3.2.3. Feature Importance

The feature importance analysis from the Random Forest model (Table 6) provides compelling, data-driven insights that align closely with the established principles of concrete materials science. The pronounced dominance of Curing Age in predicting both compressive strength (CS) and, most notably, water absorption (WA) is mechanistically sound. The high importance for CS reflects the ongoing hydration process, where strength gains are intrinsically time dependent. For WA, its paramount importance score of 0.638 underscores that continued hydration reduces capillary porosity over time, directly decreasing permeability. Conversely, Recycled Coarse Aggregate (RCA) content emerges as the most critical factor for tensile strength (TS) and ultrasonic pulse velocity (UPV). This variation could be attributed to the inherent weaknesses of RCA, specifically the old interfacial transition zone (ITZ) and adhered mortar, which create microcracks that disproportionately reduce tensile resistance and disrupt wave propagation, making RCA a more sensitive predictor for these properties than for compressive strength. The consistent secondary importance of PPF across all models validates its role as a micro-reinforcer by bridging micro-cracks and improving post-cracking tensile behavior, thereby marginally influencing UPV and reducing water absorption. This feature ranking effectively quantifies the material interactions: age governs the matrix densification, RCA defines the internal flaw population, and PPF acts as a distributed crack-control mechanism.

3.2.4. Enhanced Explainability of the Developed RF Models

Lundberg and Lee’s SHAP analysis is a method for examining machine learning models with Shapley Additive Explanations. The SHAP analysis was employed for the RF models for CS, TS, UPV, and WA.
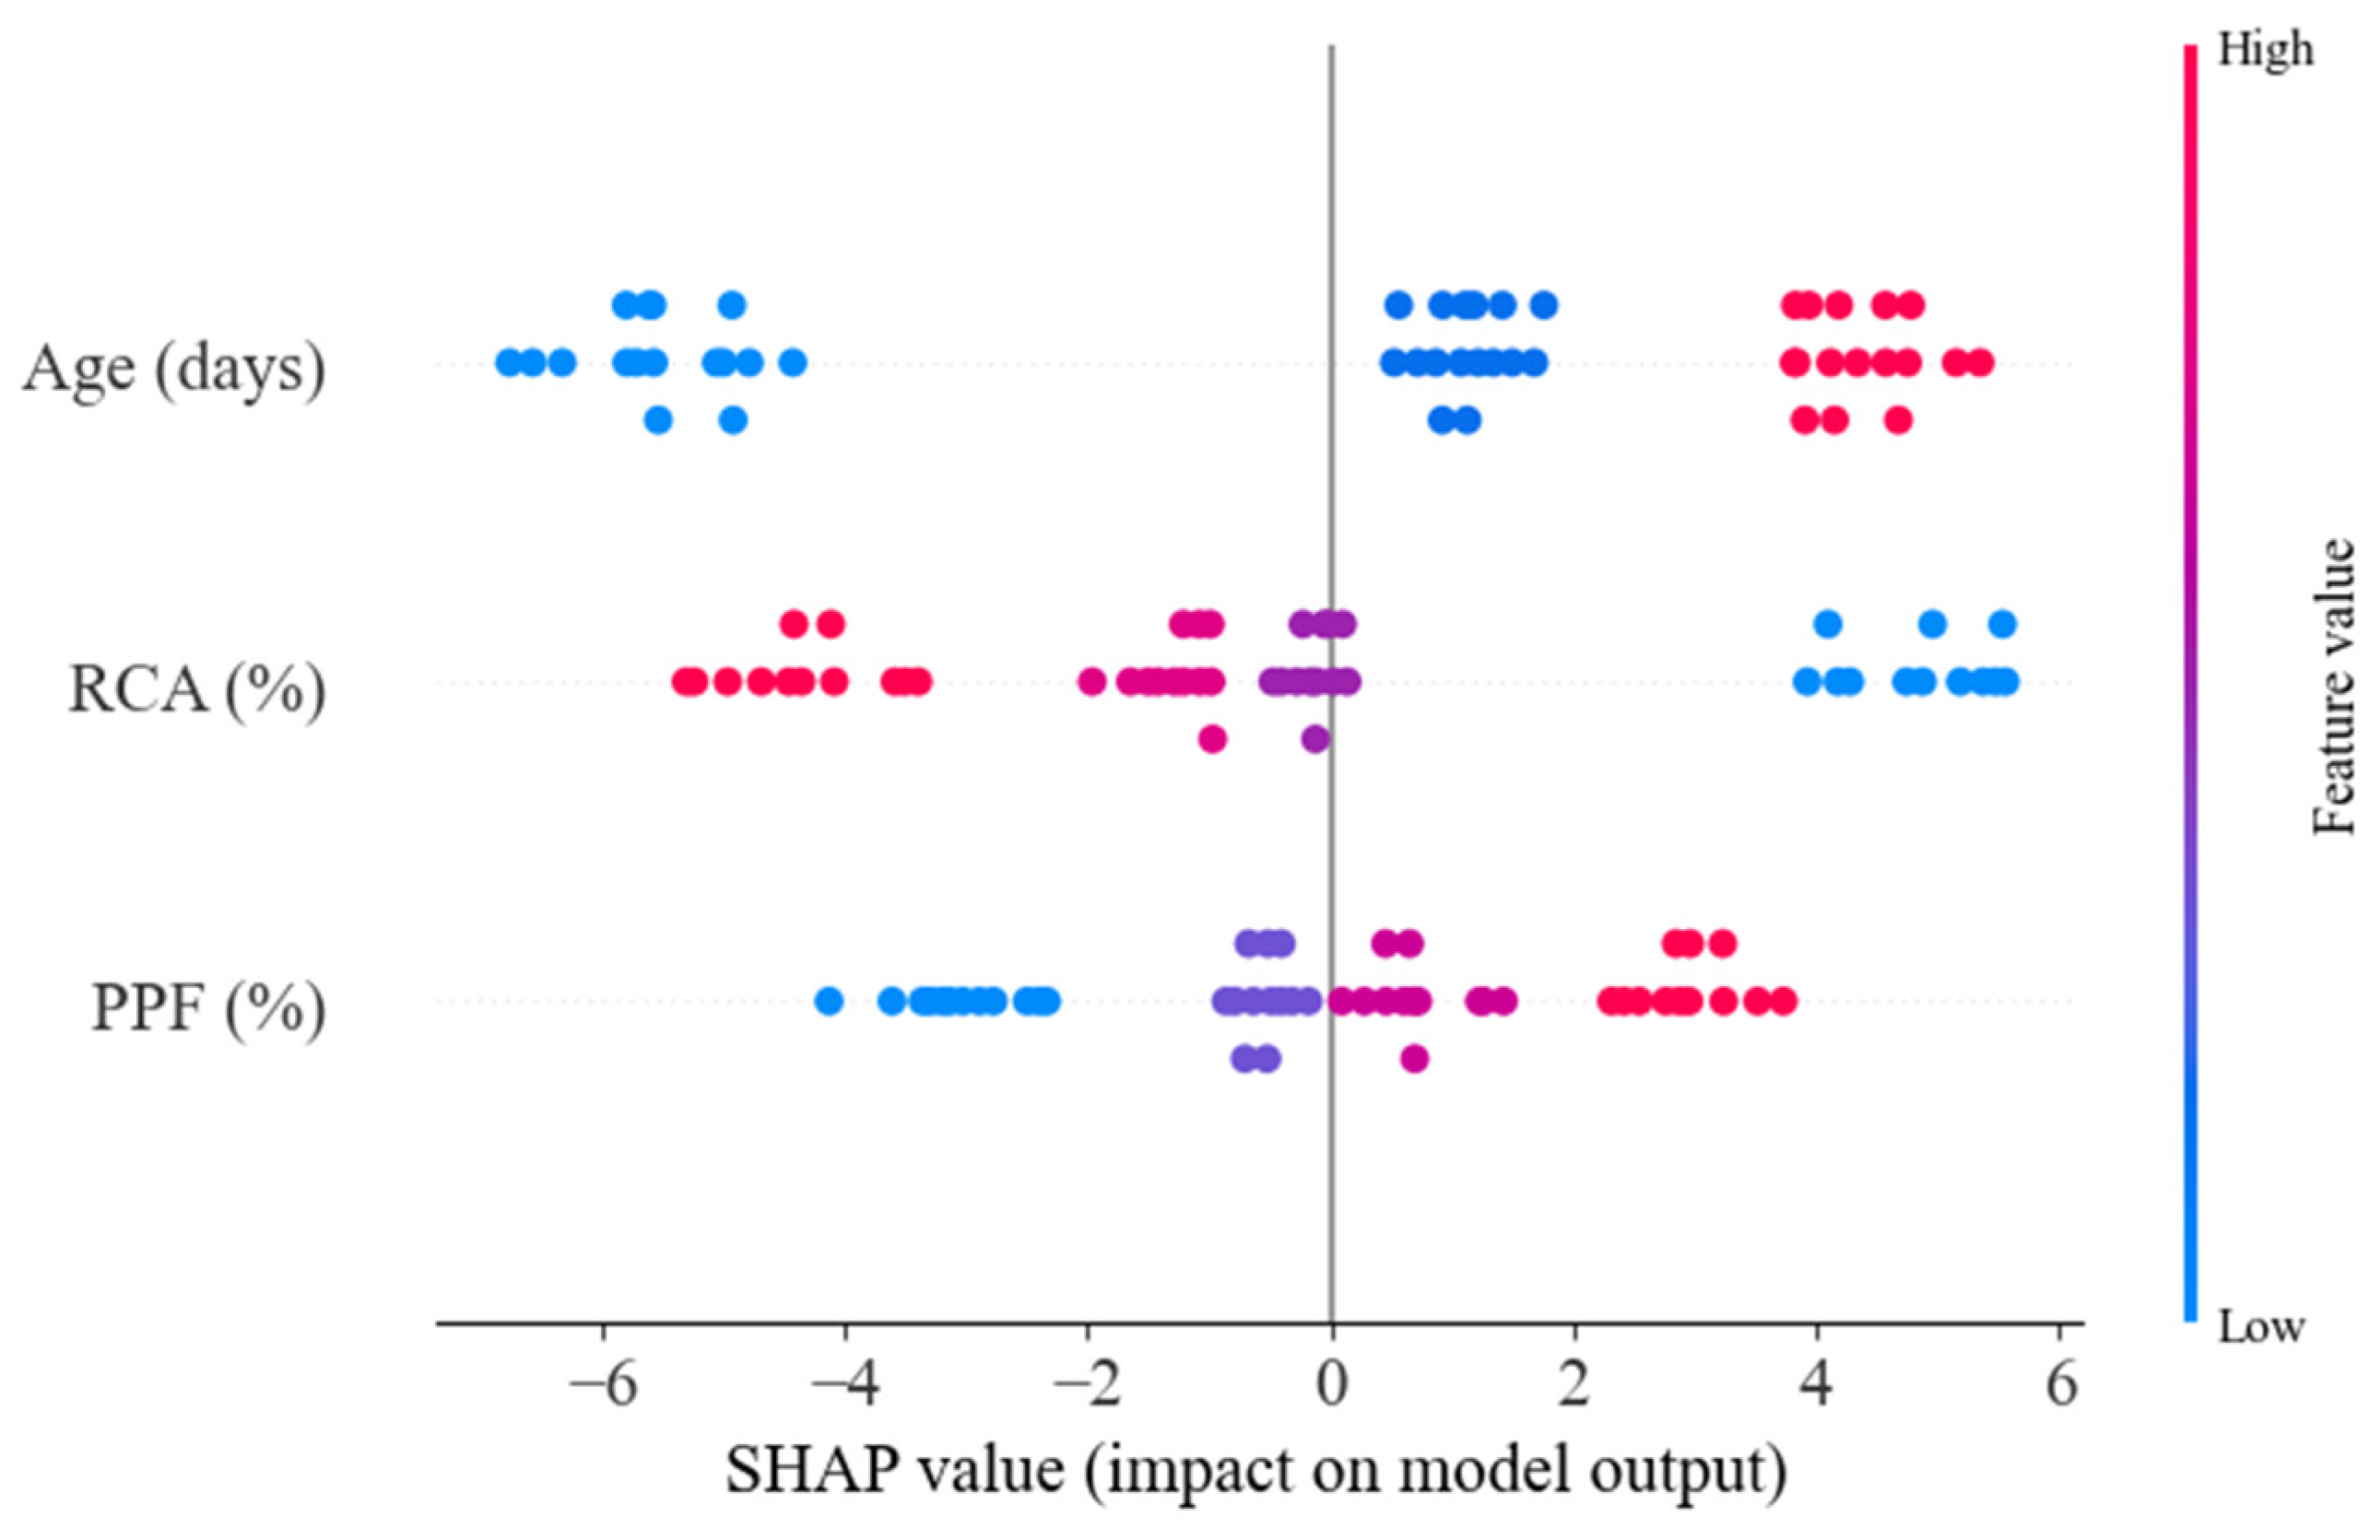
Based on the SHAP analysis for predicting the compressive strength of concrete containing recycled coarse aggregate (RCA) and polypropylene fibers (PPF), Figure 14 reveals that concrete age (in days) is the most influential feature, demonstrating the highest impact on model output. This is visually evident by its prominent position at the top of the plot, with data points spanning the widest range of SHAP values, indicating that increased curing time substantially enhances compressive strength. The percentage of RCA (%) also shows significant impact, predominantly exhibiting negative SHAP values that suggest higher RCA content generally reduces the predicted compressive strength, though some variability indicates this relationship can be context dependent. Similarly, PPF (%) content demonstrates a mixed but generally negative influence on strength outcomes, with most points clustered in negative SHAP value territory. The color gradient from low (blue) to high (red) feature values further illustrates that while older concrete consistently contributes positively to strength, higher percentages of both RCA and PPF tend to have detrimental effects on the compressive strength performance.
For TS, Figure 15 reveals a distinct feature importance hierarchy. RCA content (%) emerges as the most influential parameter, positioned at the top with data points distributed across both positive and negative SHAP values, indicating its complex, dual-nature impact on tensile strength. PPF content (%) follows as the second most significant factor, showing a similar distribution pattern but with slightly less magnitude of influence. Interestingly, concrete age (in days) demonstrates the least impact among the three features, with its data points clustered more tightly around the zero SHAP value axis. The color gradient reveals that higher values of RCA (red) are associated with both strongly positive and negative outcomes, suggesting context-dependent effects, while higher PPF percentages generally correlate with positive SHAP values, indicating their potential beneficial role in enhancing tensile strength. The relatively narrow range of SHAP values (−0.4 to 0.4) compared to compressive strength analysis suggests more moderate overall feature impacts on tensile strength performance.
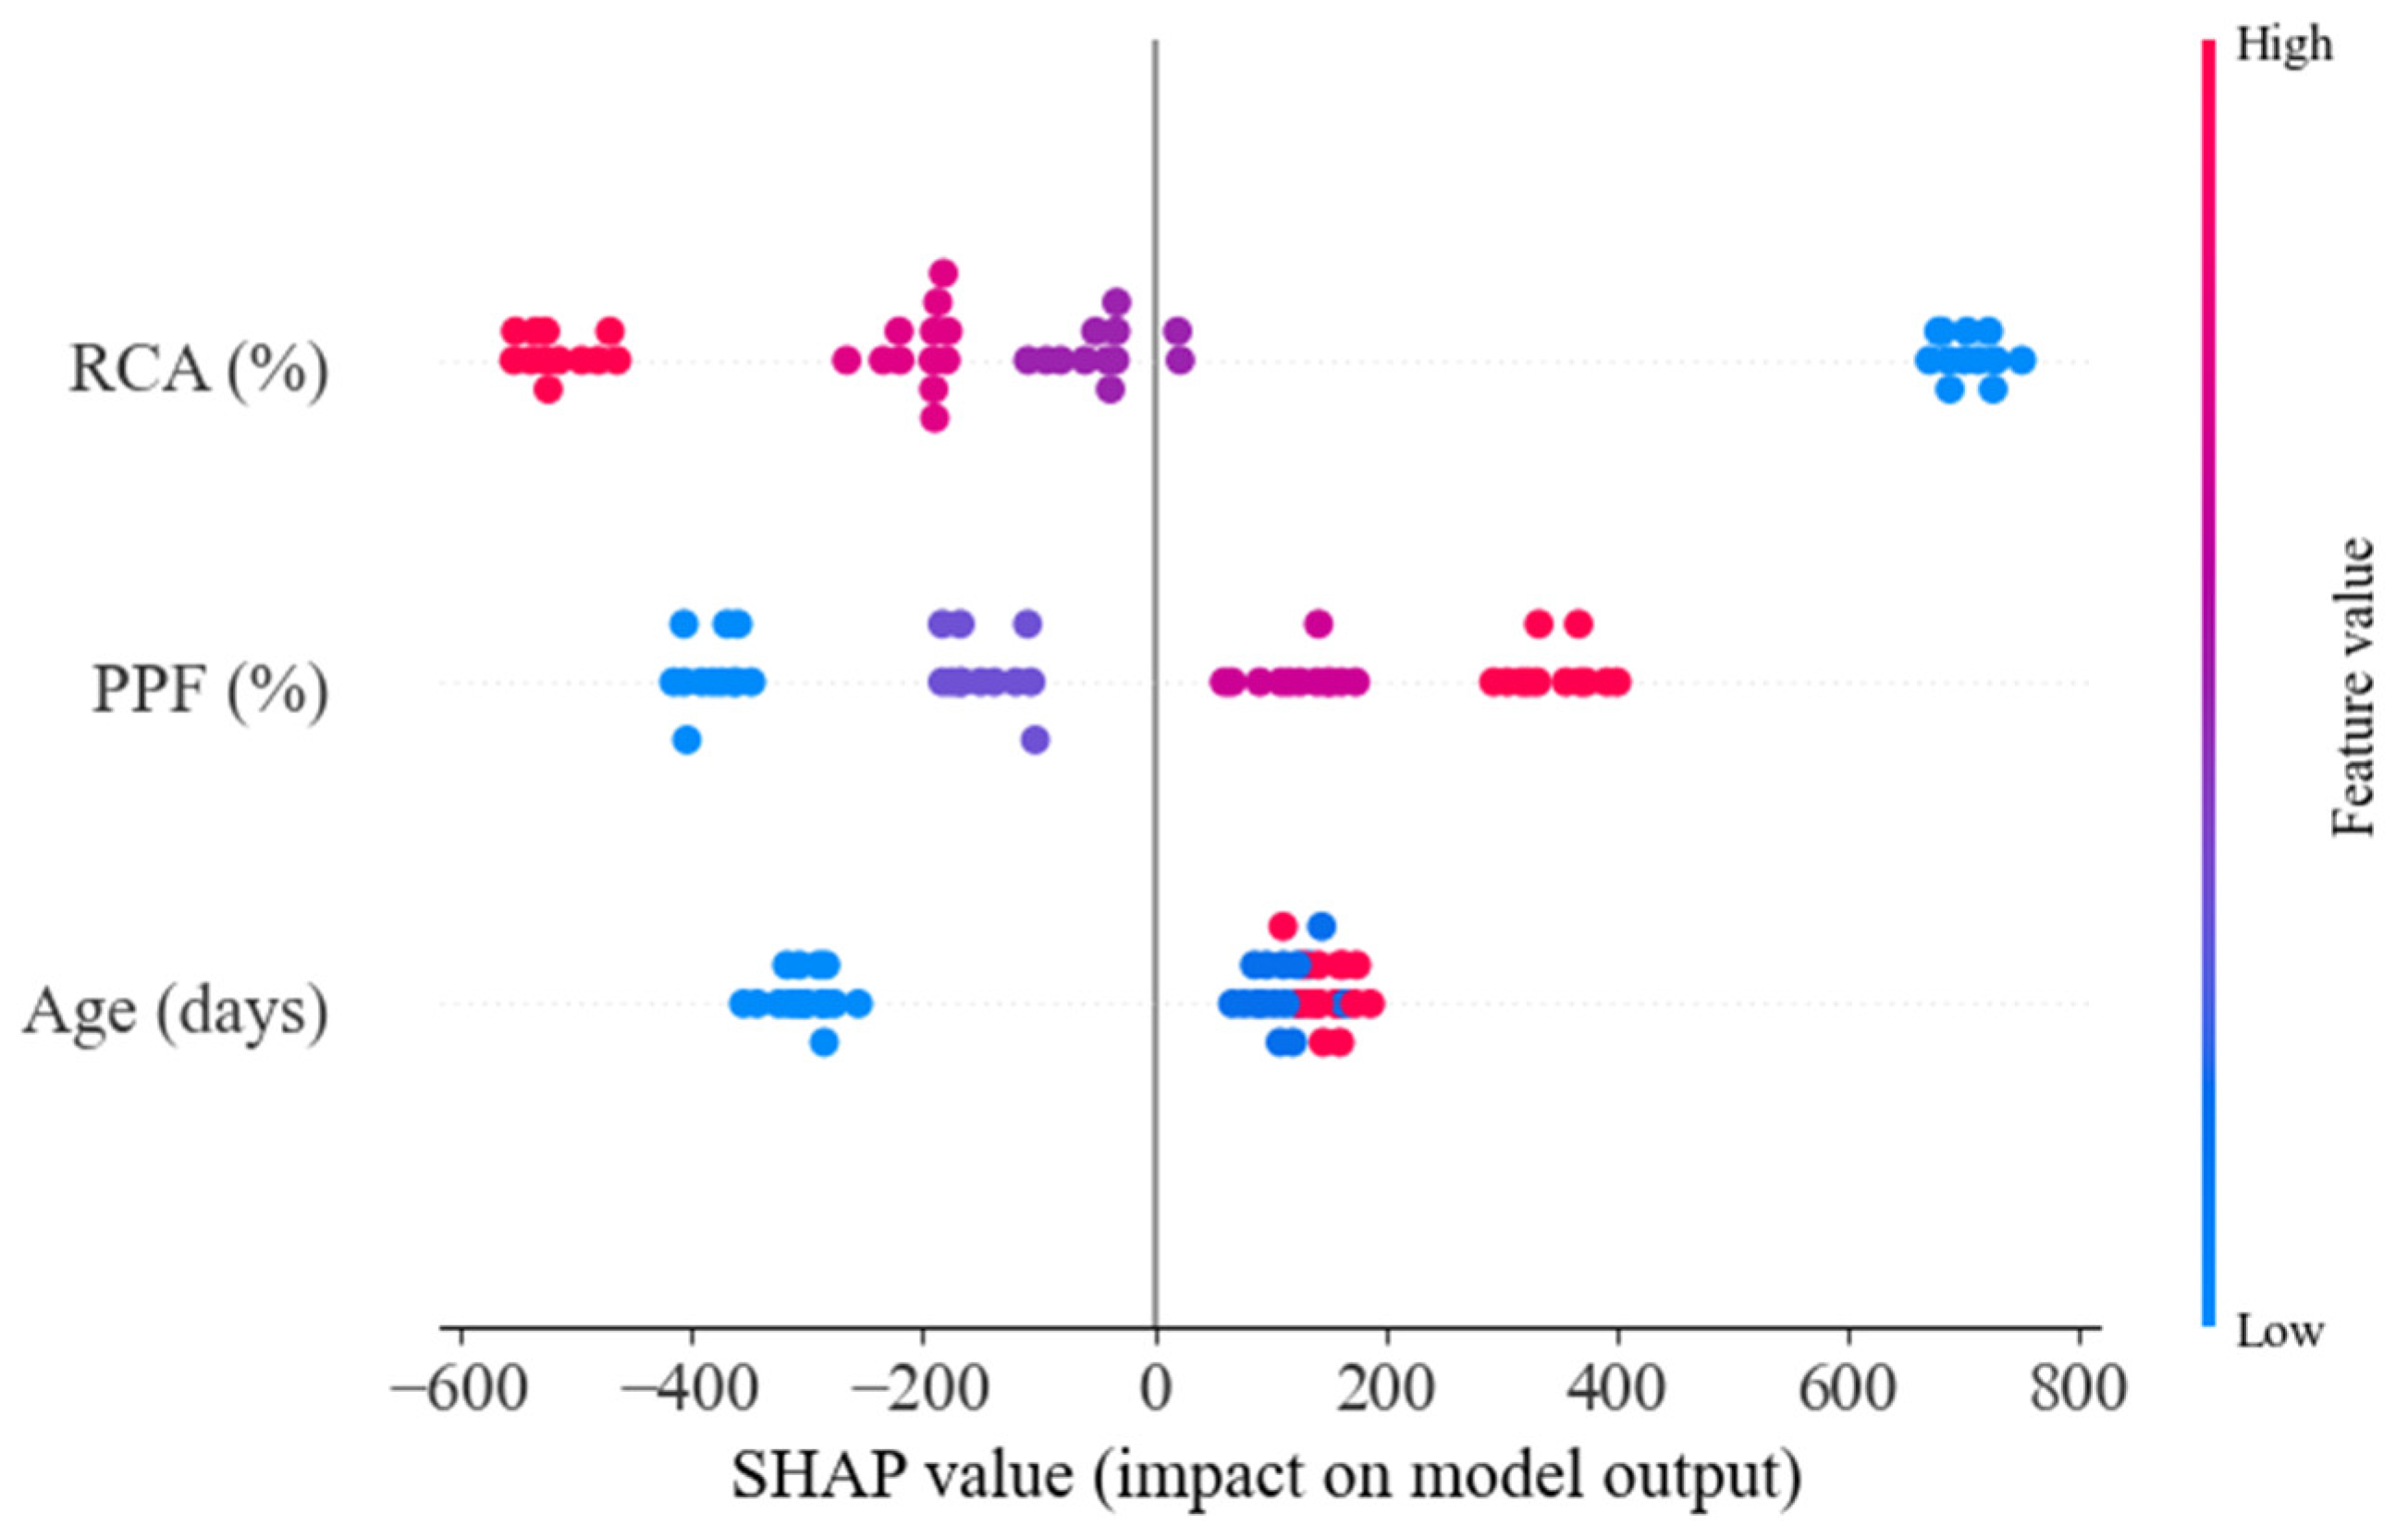
Figure 16 reveals that concrete age (days) is the dominant factor influencing UPV measurements, exhibiting the widest range of SHAP values from approximately −200 to over +800. This indicates that increased curing time has the most substantial positive impact on UPV, reflecting improved concrete density and homogeneity over time. RCA content (%) shows a moderate influence with predominantly negative SHAP values, suggesting that higher RCA percentages generally reduce UPV readings, likely due to increased porosity and interfacial transition zones in the recycled aggregate concrete. PPF content (%) demonstrates the least impact among the three features, with values clustered near zero, indicating that fiber incorporation has minimal effect on UPV measurements. The dramatic span of SHAP values (from −600 to +800) highlights the exceptional sensitivity of UPV to concrete maturation, making age the critical parameter for non-destructive assessment of concrete quality containing recycled materials.
Figure 17 demonstrates that concrete age (days) is the most influential parameter, exhibiting the strongest impact on model predictions with SHAP values spanning both positive and negative ranges. This indicates that increased curing time significantly reduces water absorption, likely due to continued hydration and pore refinement over time. PPF content (%) emerges as the second most important factor, showing a tendency toward negative SHAP values that suggest higher fiber percentages generally decrease water absorption, potentially by creating a more discontinuous pore structure. Interestingly, RCA content (%) shows the least influence among the three features, with its impact clustered near zero, revealing that the replacement level of natural aggregate with recycled concrete aggregate has minimal effect on the water absorption characteristics. The overall negative orientation of SHAP values for age and PPF content underscores their beneficial role in improving the durability performance by reducing concrete permeability.

3.3. Optimization of Engineering Properties of Concrete by RSM

Optimization in Response Surface Methodology (RSM) is a crucial final stage in which mathematical models are utilized to determine the ideal process parameters. When several, often competing, goals exist, RSM resolves these conflicts using the desirability function approach. This method converts each response into an individual desirability score, which ranges from 0 to 1, based on predefined criteria. These individual scores are then merged to produce a single overall desirability (D) value. The final purpose of the optimization is to systematically alter the input variables to maximize overall desirability, hence, determining the factor settings that provide the best achievable compromise and balance among all desired outcomes.
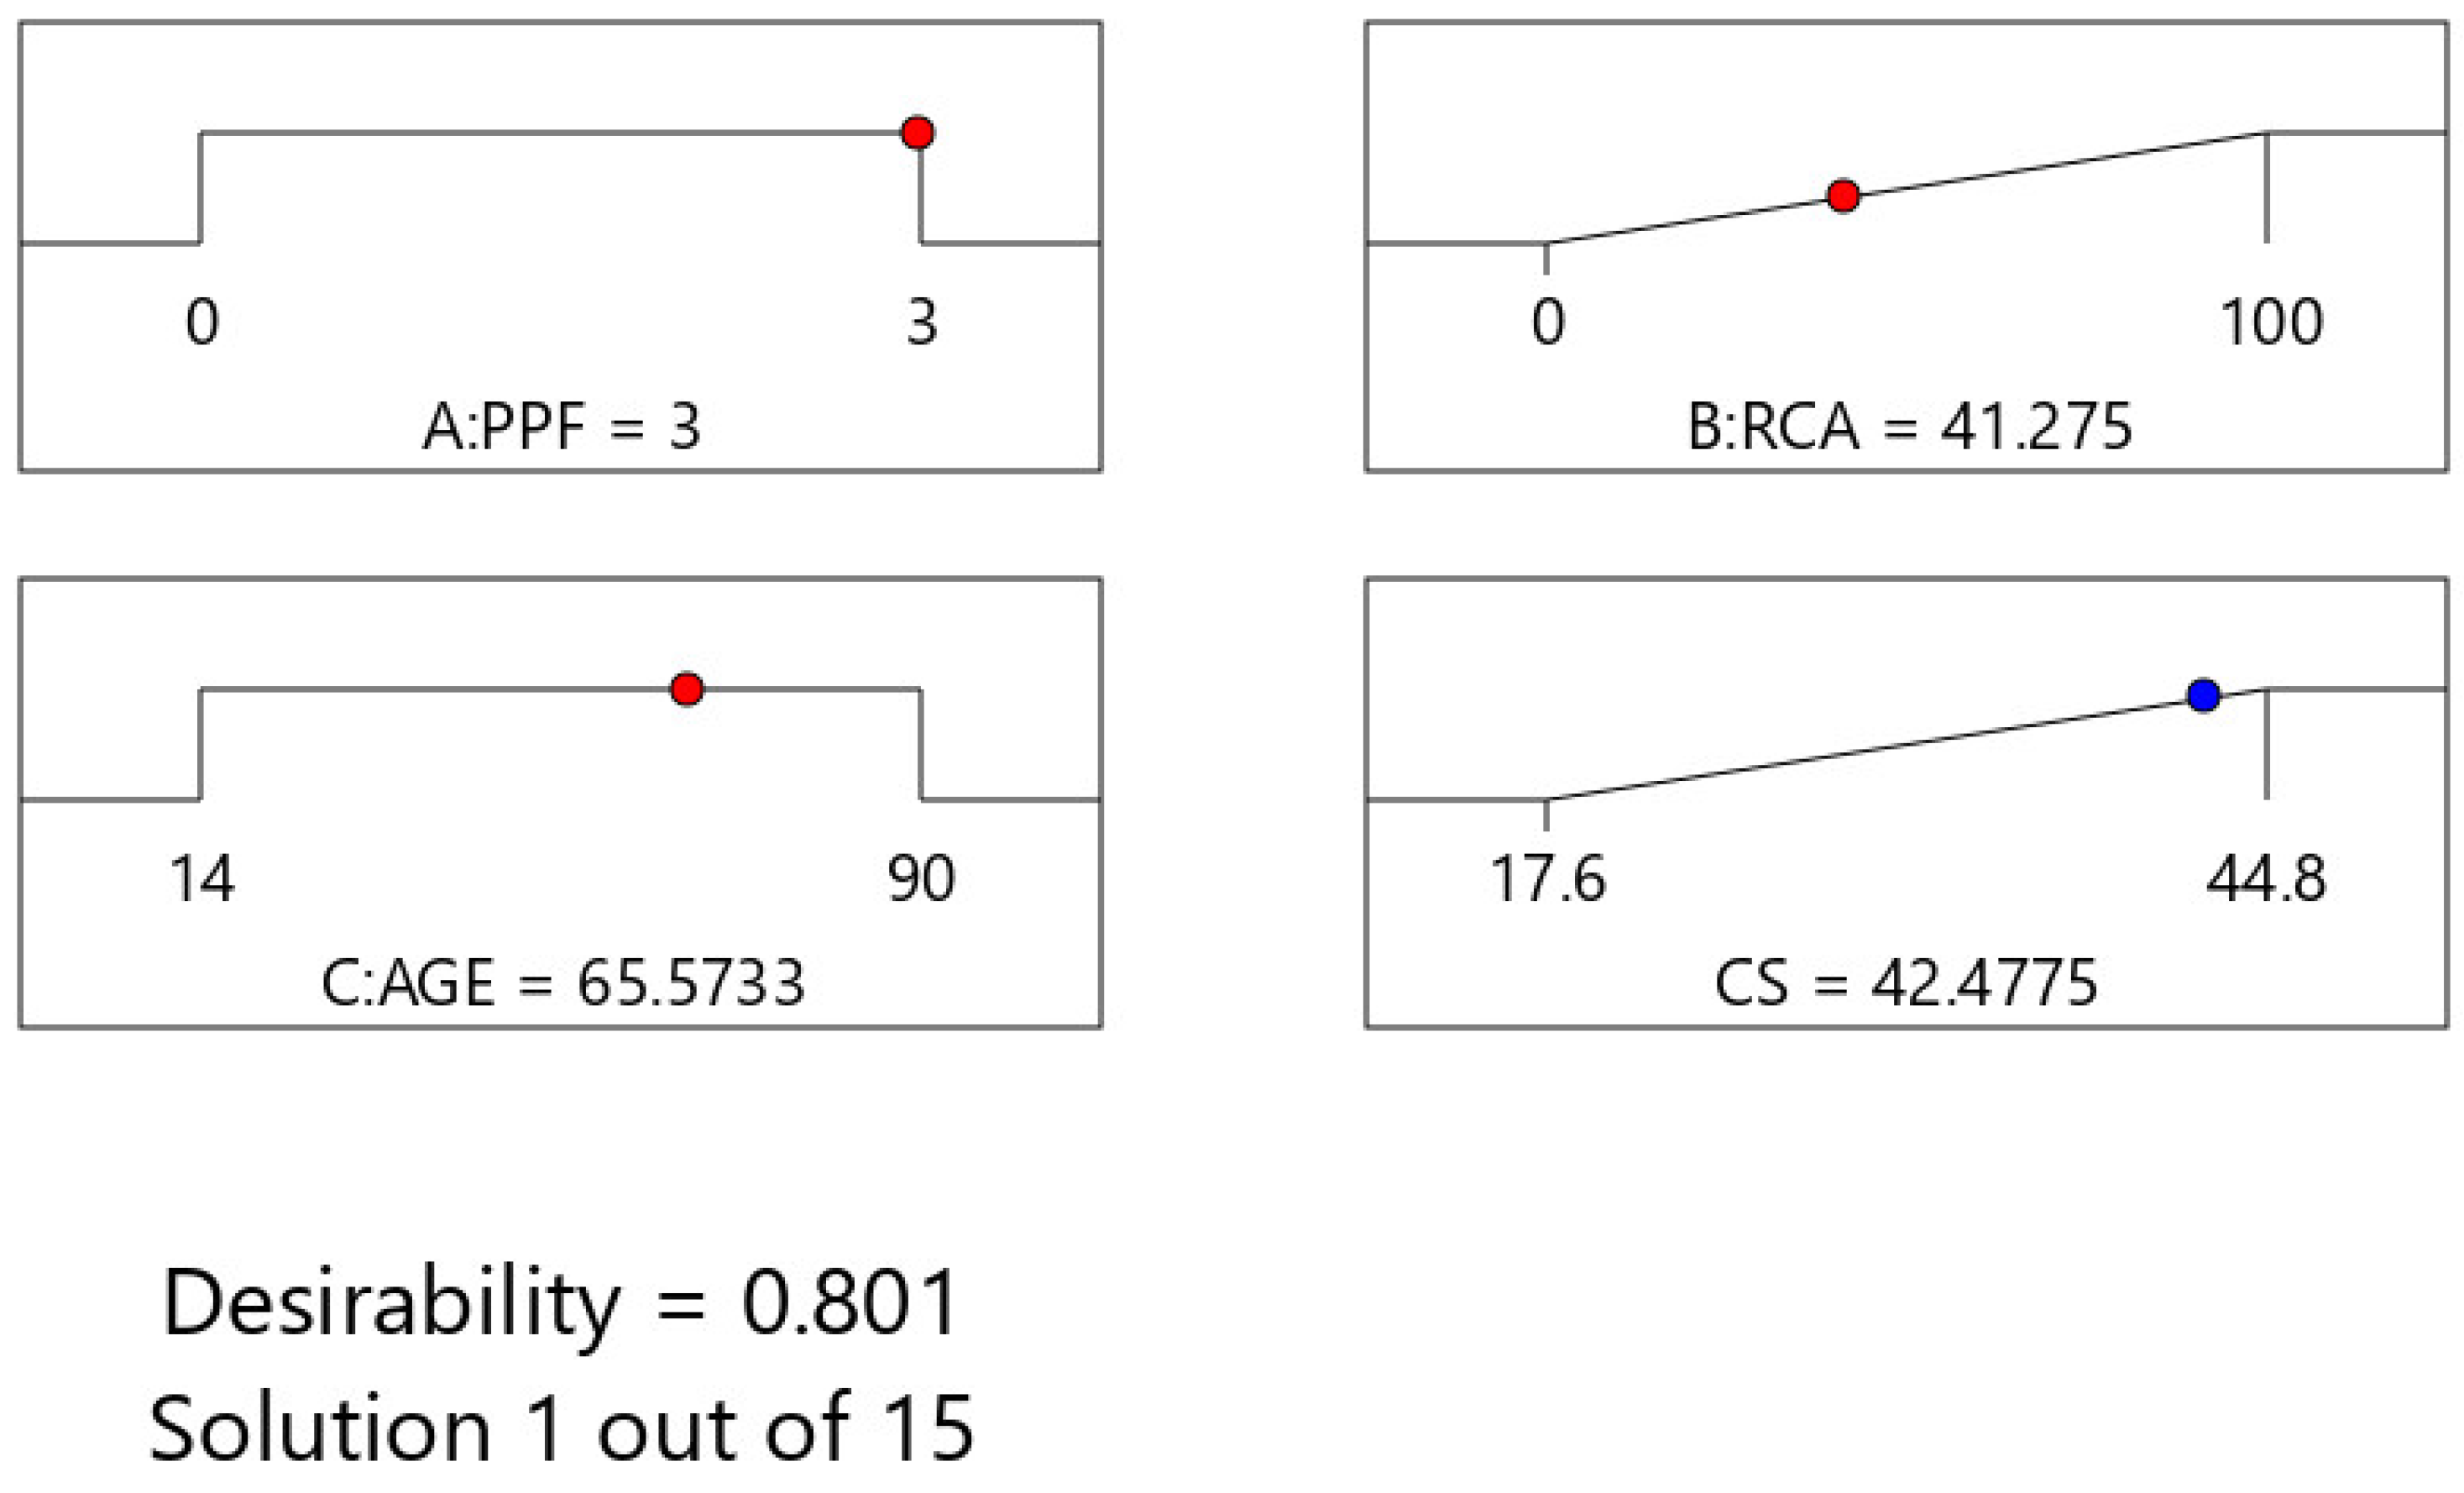
Figure 18 depicts the optimization results for concrete compressive strength, which produced a highly successful solution with an overall desirability of 0.801. This result was attained by setting PPF to 3% by volume of concrete, RCA to 41.275%, and AGE to around 66 days, all of which were maintained within their ranges. These parameters simultaneously optimized the response, leading to a CS of 42.478 MPa.
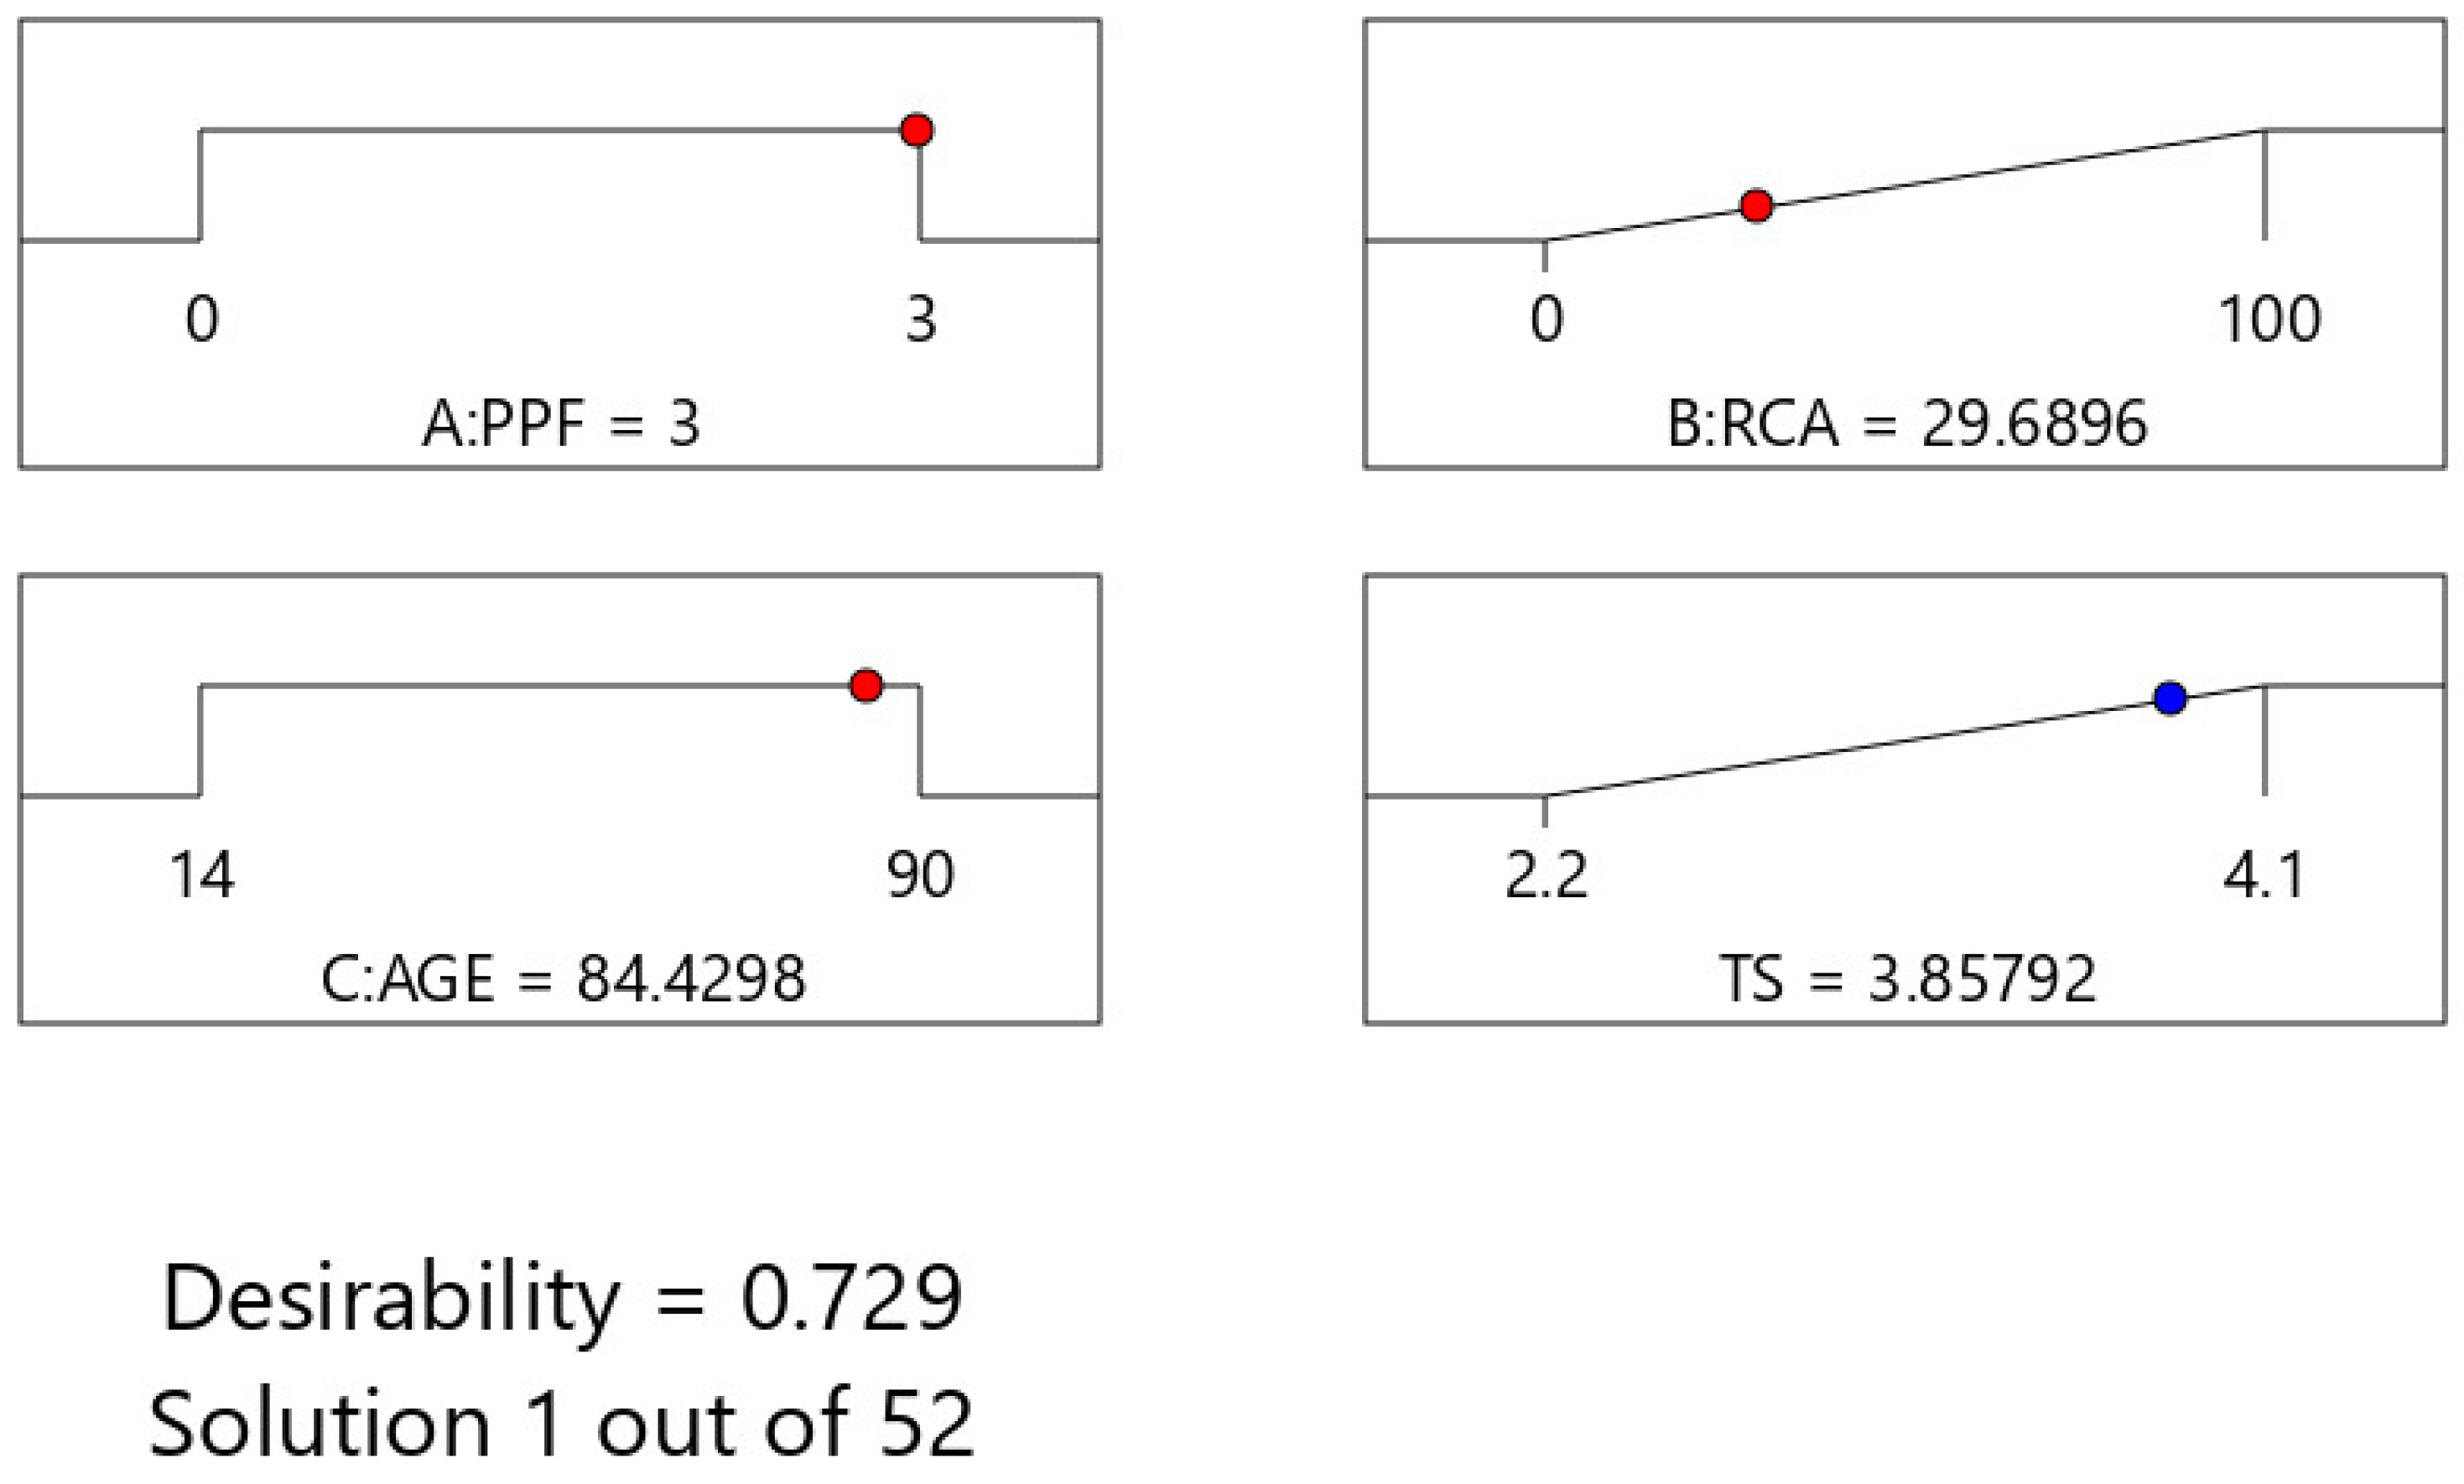
Based on the optimization results, the goal of maximizing Tensile Strength (TS) while maintaining PPF, RCA, and AGE within a given range was met, with an overall desirability of 0.729 (Figure 19). The solution confirms that a PPF value of 3%, an RCA value of 29.72%, and an AGE of around 84.45 days meet the range restrictions. Under these conditions, the model estimates a TS of 3.858 MPa.
The optimization analysis illustrated in Figure 20 found a solution that effectively balances the aims of maximizing Ultrasonic Pulse Velocity (UPV) while keeping PPF, RCA, and AGE within their defined ranges, resulting in an overall desirability of 0.749. The high score suggests a strong compromise, since the factor values (PPF = 3%, RCA = 62.34%, and AGE ≈ 62 days) satisfy range requirements while boosting UPV to 4583.48 m/s.
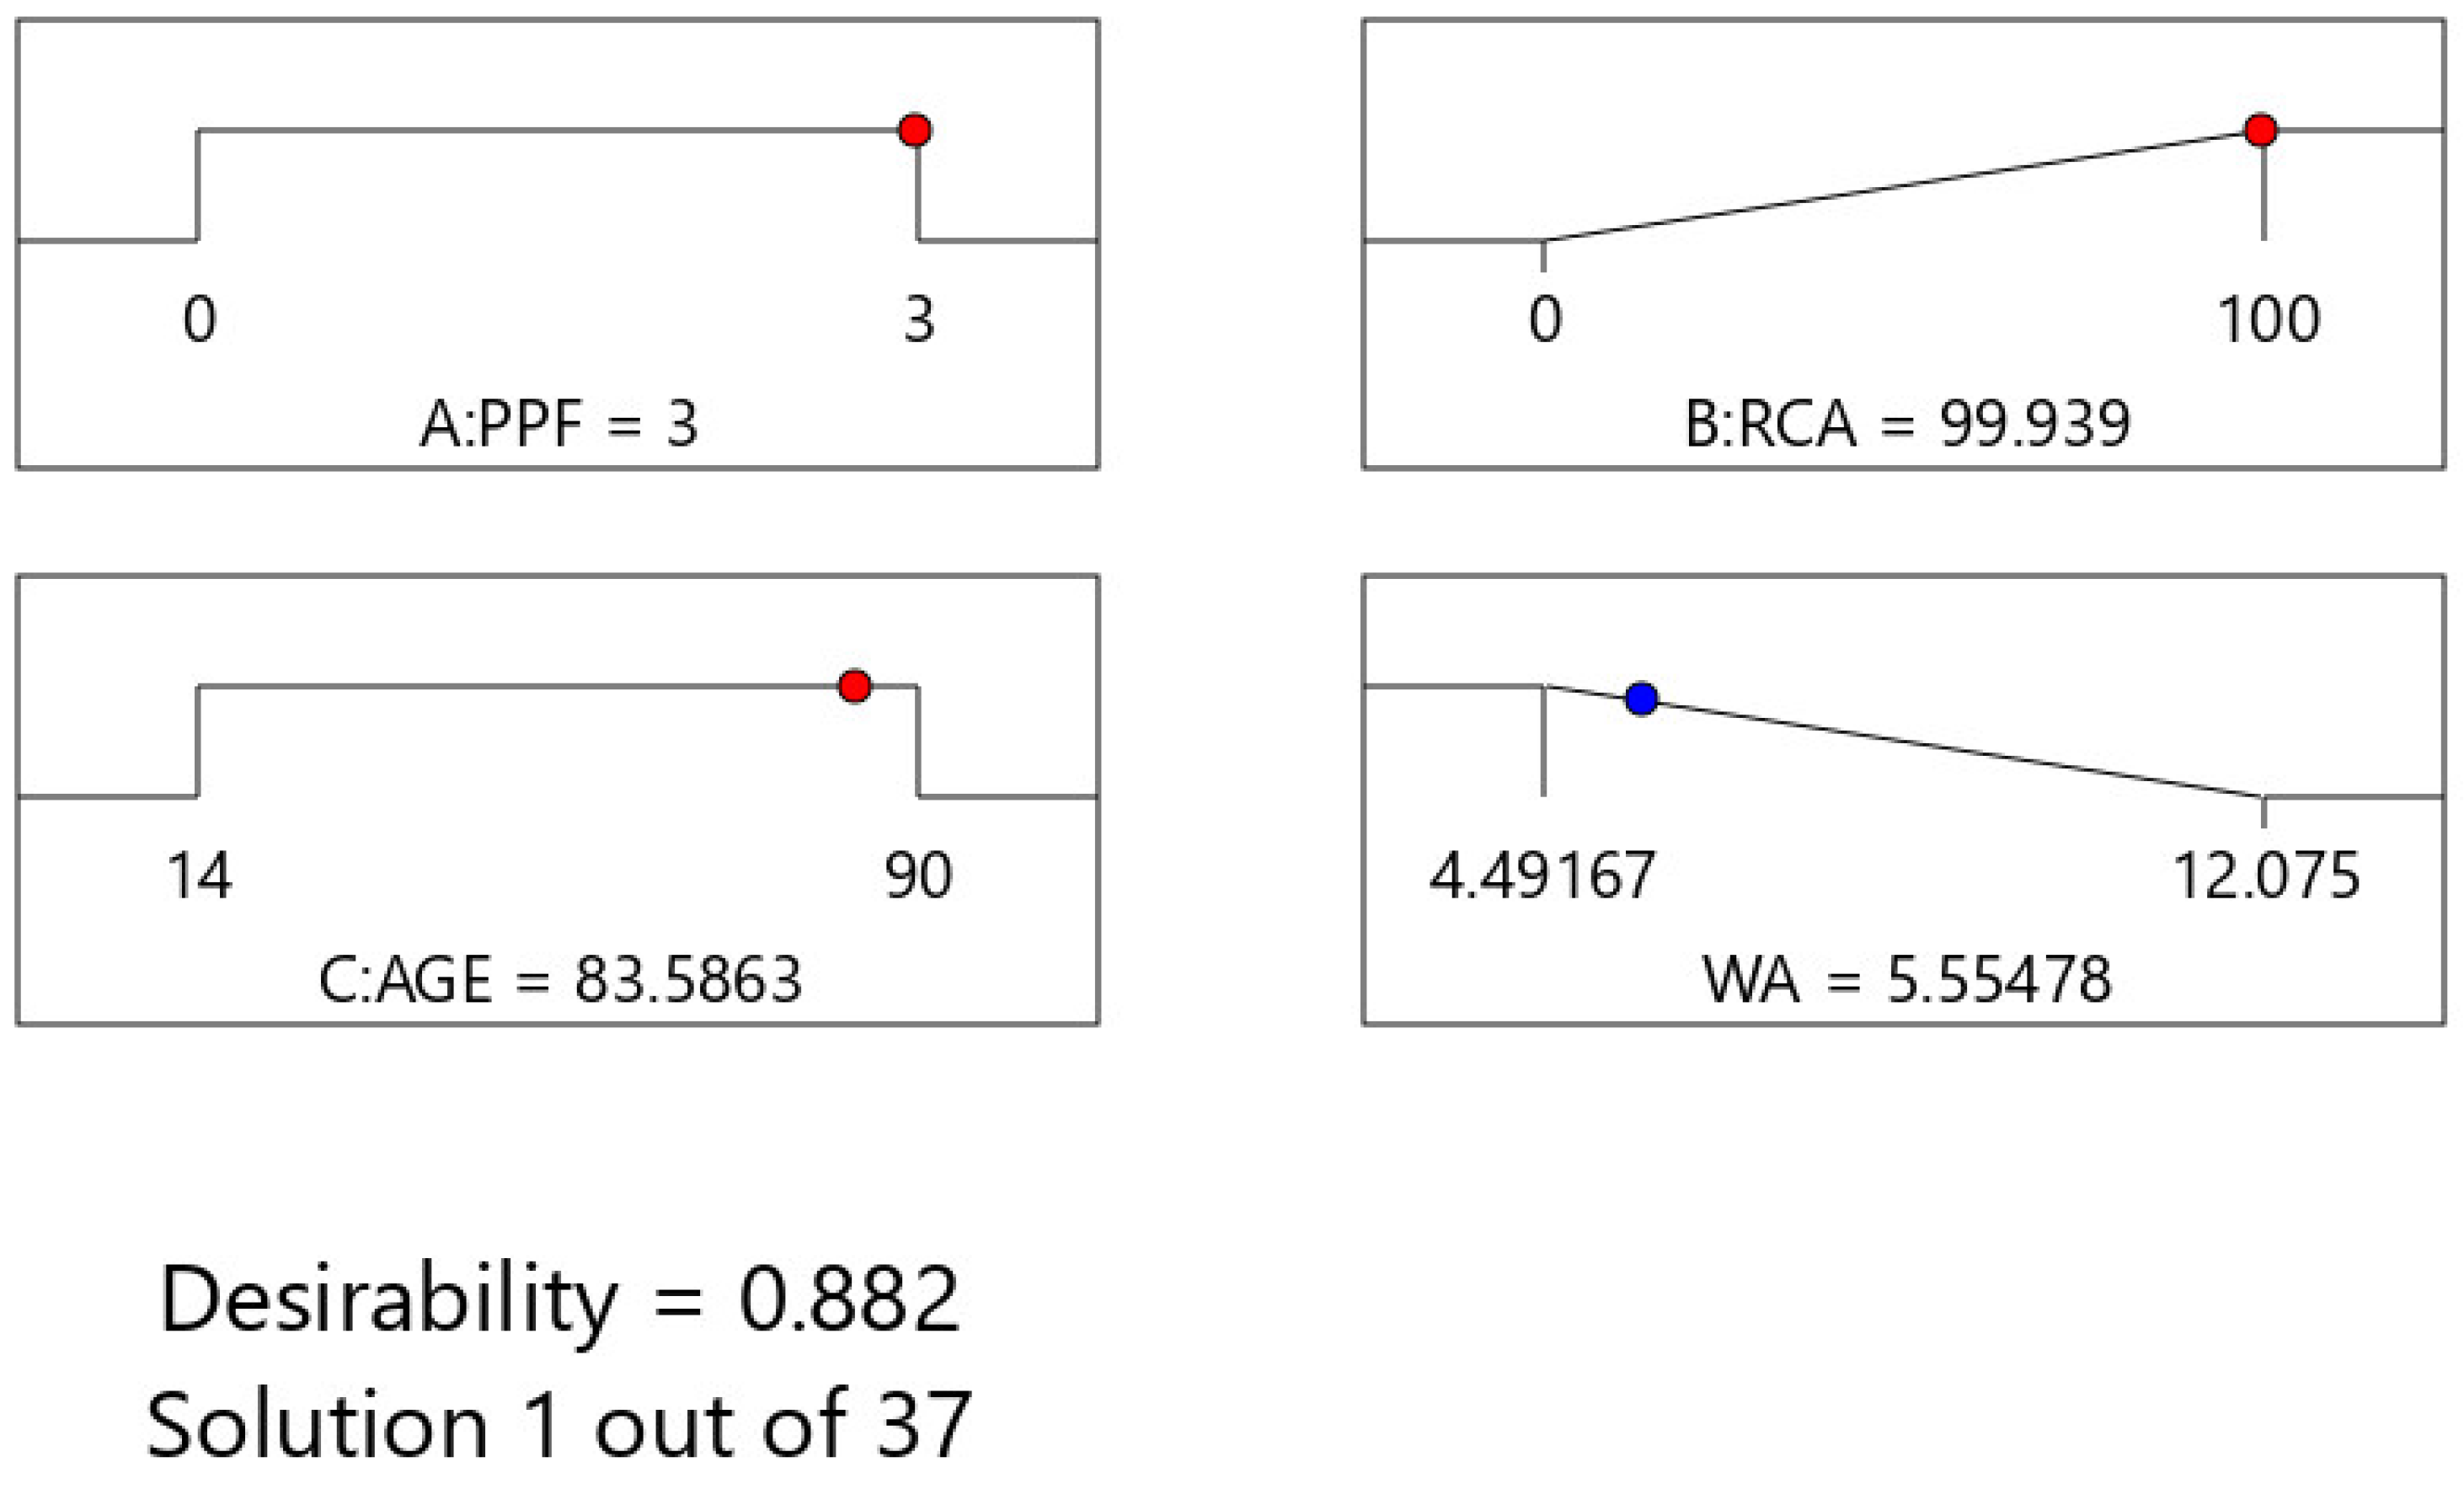
The optimization for water absorption (WA) yielded an outstanding solution with an overall desirability of 0.882 (Figure 21). This result was attained by setting PPF to 3%, RCA to an exceptional value of roughly 100%, and AGE to 83.6 days, all of which were well within their respective ranges. The solution successfully minimized WA to 5.555%.
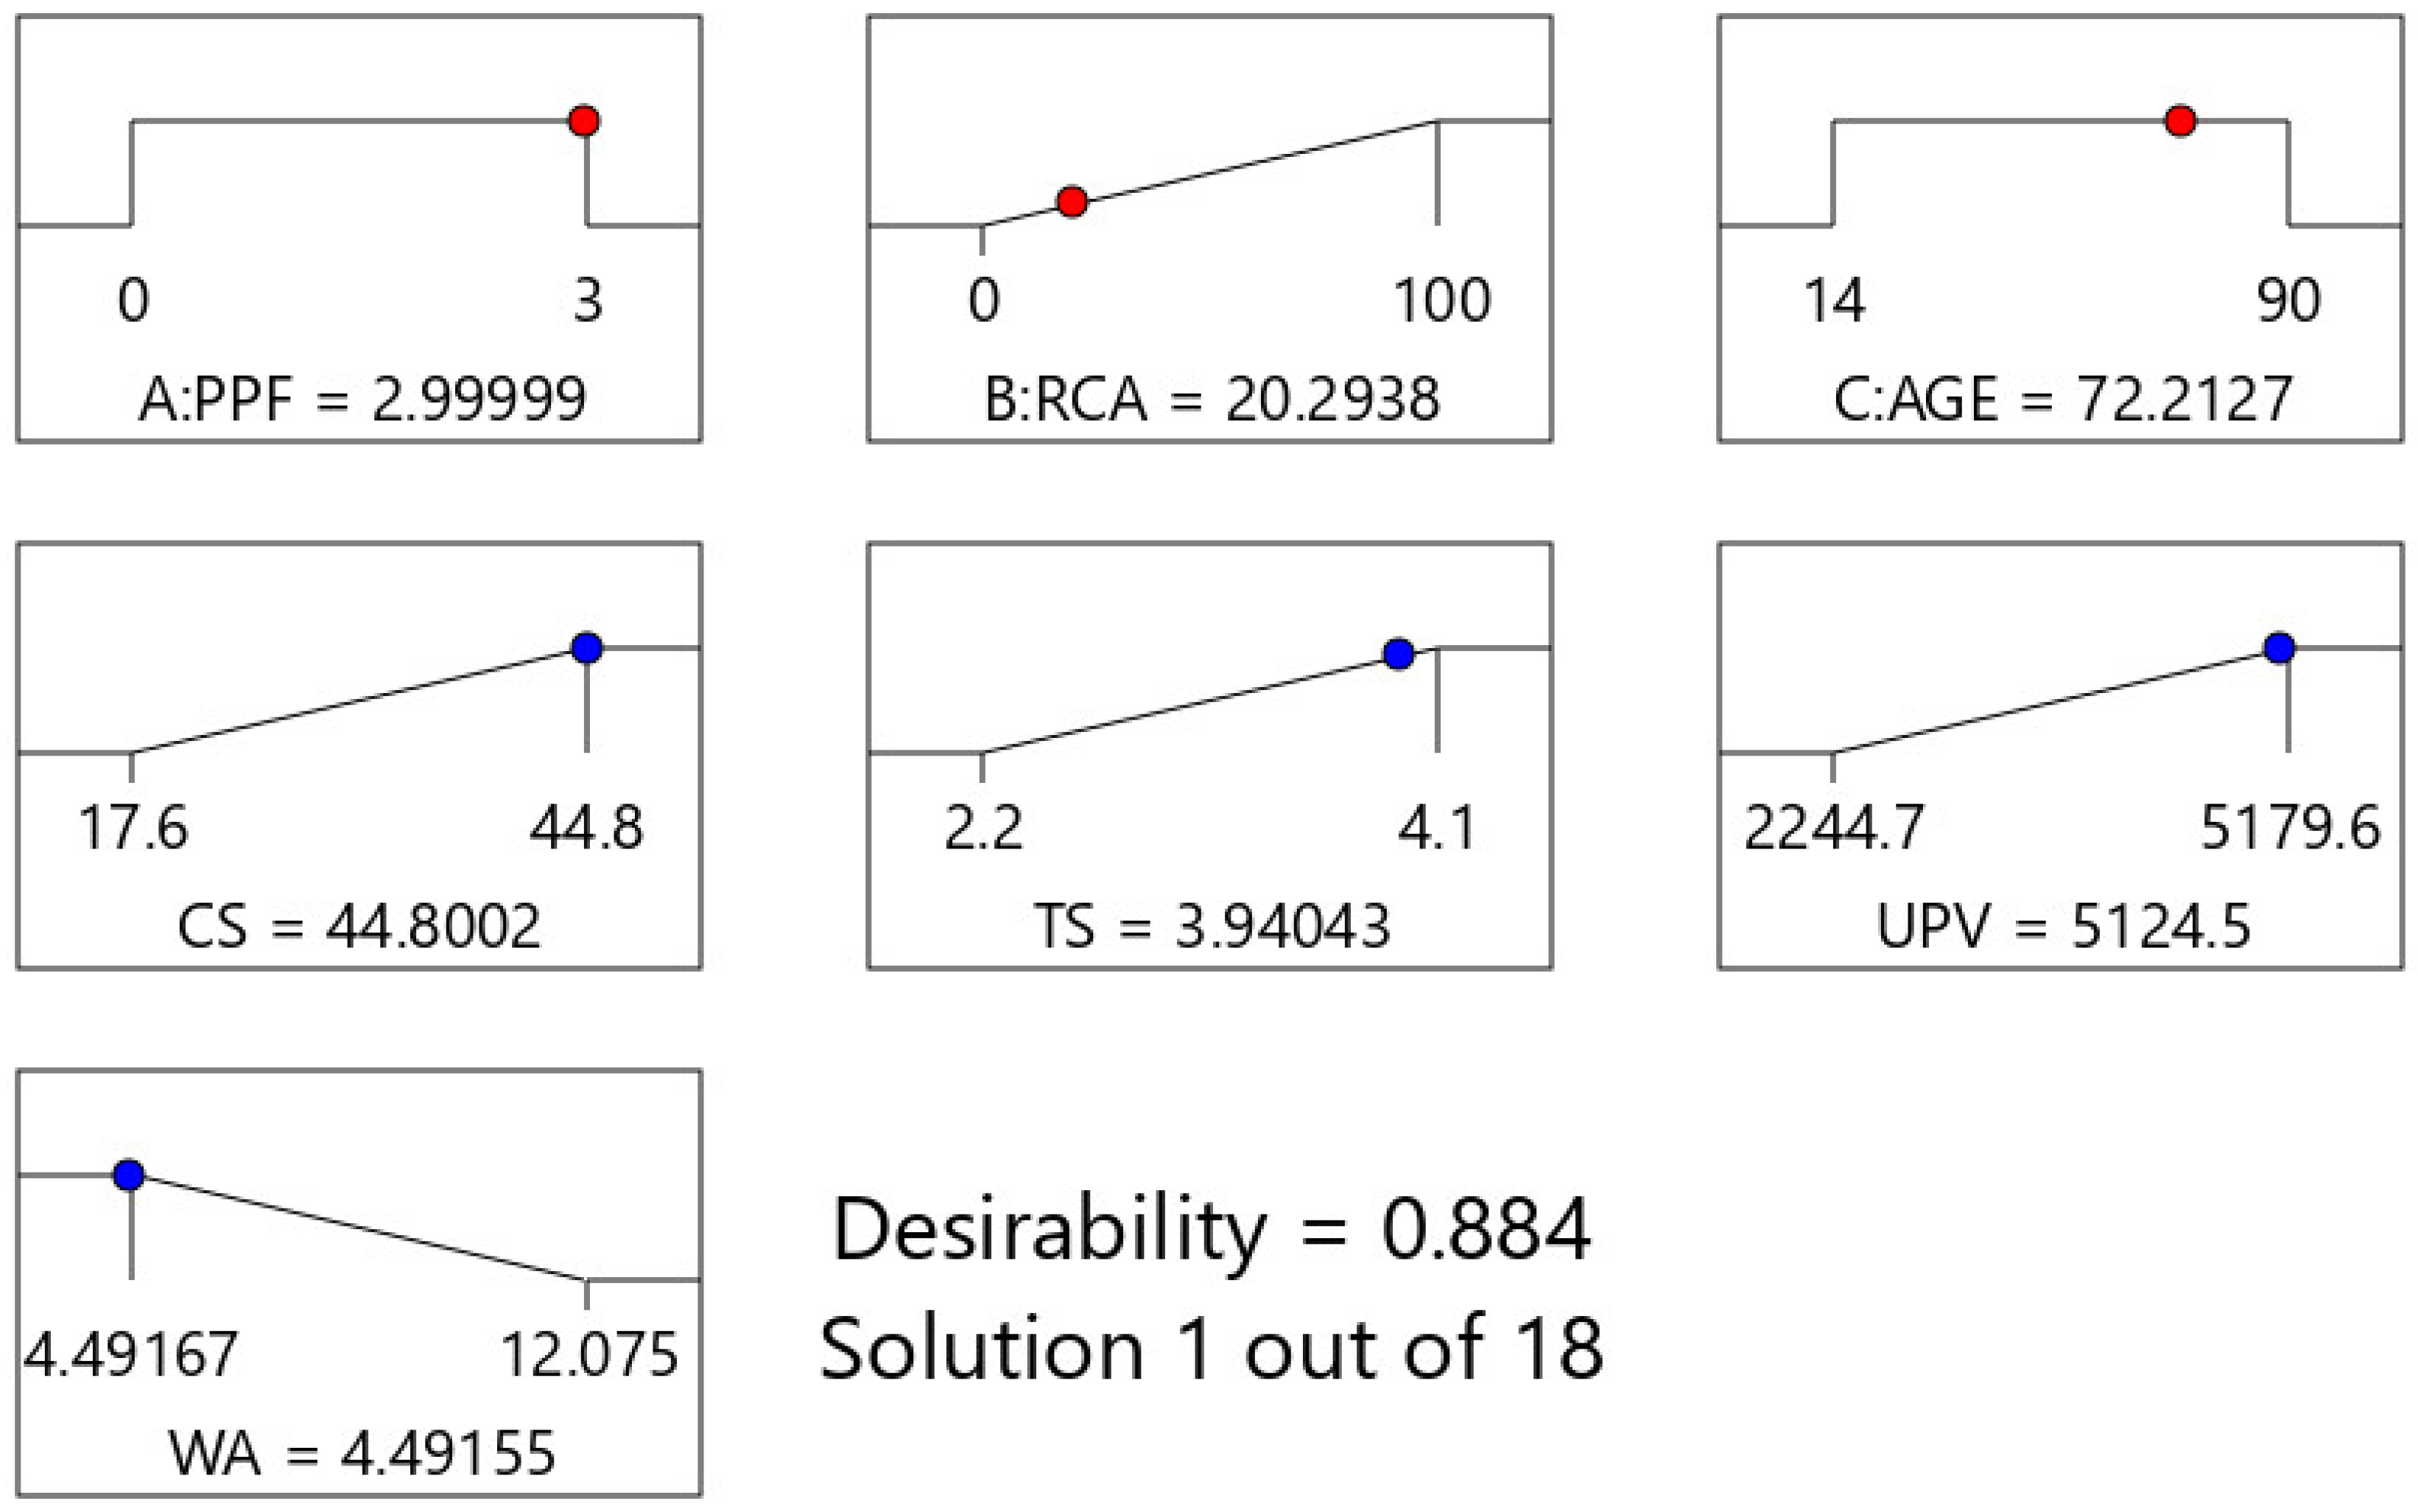
The multi-objective optimization result illustrated in Figure 22 exhibits an extraordinarily successful use of Response Surface Methodology, achieving a superior compromise across four conflicting performance criteria with an overall desirability of 0.882. The solution is defined by a PPF value of 3% by volume of concrete and an AGE of 83.6 days, and a standout feature of this solution is the simultaneous achievement of a near-maximum RCA value of 99.986, highlighting that optimal reuse of recycled content successfully maintains these factors within their ranges while simultaneously optimizing all responses. Most notably, the outcome excels at balancing the primary trade-off between durability and permeability: Water Absorption (WA) is effectively reduced to a low value of 5.555%, indicating a dense, less permeable microstructure, while Compressive Strength (CS) and Tensile Strength (TS) are increased to robust values of 44.8 MPa and 3.94 MPa, respectively, indicating excellent mechanical integrity. Furthermore, the Ultrasonic Pulse Velocity (UPV) hits a record high of 5124.5 m/s, confirming the high-quality interior density and homogeneity revealed by the previous data. The near-perfect desirability score indicates that this set of parameters is more than adequate; it represents a practical global optimum, in which any attempt to improve one property would inevitably degrade another or violate operational constraints, establishing this configuration as an ideal recipe for high-performance, sustainable material design.

4. Discussion

This study demonstrates the effectiveness of RSM and RF algorithms in calculating the CS, TS, UPV, and WA of RCA-PPF concrete. The use of RCA and PPF in concrete is crucial for producing sustainable concrete. This method not only helps to reduce waste, but it also promotes a balanced economy and protects natural resources.

4.1. Comparison of RSM and Machine Learning

The random forest model demonstrated higher R2 values of (0.9955 for CS, 0.9810 for TS, 0.9913 for UPV, and 0.9959 for WA) compared to RSM (0.9803 for CS, 0.9234 for TS, 0.9569 for UPV, and 0.9943 for WA), indicating better predictive accuracy. The CV values were 3.45, 4.82, 4.21, and 1.99 for CS, TS, UPV, and WA, respectively, ensure the stability and interpretability of their models, allowing for accurate identification of individual factor effects.
RF model showed superior performance in both the training and testing phases, with lower error rates and higher consistency. The R2 values for training were 0.9955, 0.9810, 0.9913, and 0.9959 for CS, TS, UPV, and WA, respectively, while the values were 0.9866, 0.9784, 0.9690, and 0.9895, respectively for the testing dataset. Machine learning models are more complex but offer robust predictions by capturing non-linear relationships in the data. RSM, while simpler and effective in identifying key interactions, may not capture complex patterns as effectively as machine learning models.
Based on the results from Table 7, the Random Forest (RF) model demonstrates superior predictive accuracy compared to the Response Surface Methodology (RSM) model across all four responses: CS, TS, UPV, and WA. This conclusion is drawn from the Mean Absolute Percentage Error (MAPE), where a lower value indicates a more accurate model. For every response, the RF model’s MAPE is substantially lower, with the most significant improvement seen in the UPV response, where the error was reduced from 3.16% to 1.95%. The consistent outperformance of the RF model suggests it is better at capturing the underlying, potentially non-linear, relationships in the data, making it a more reliable tool for prediction.
Based on the scatter plots shown in Figure 23, comparing the predicted versus experimental values for CS, TS, UPV, and WA, the Random Forest (RF) model demonstrates superior predictive performance and accuracy compared to the Response Surface Methodology (RSM) model. The data points generated by the RF model are more tightly clustered along the ideal 1:1 prediction line, indicating a closer agreement between its predictions and the actual experimental results. In contrast, the data points for the RSM model show a wider and more scattered distribution, reflecting a higher degree of prediction error and less reliability. Furthermore, few RSM data points fall outside the ±10% error lines, underscoring its higher variance and lower precision compared to the RF model. Overall, the visual evidence strongly confirms that the RF model is a more robust and accurate predictive tool for estimating compressive strength.
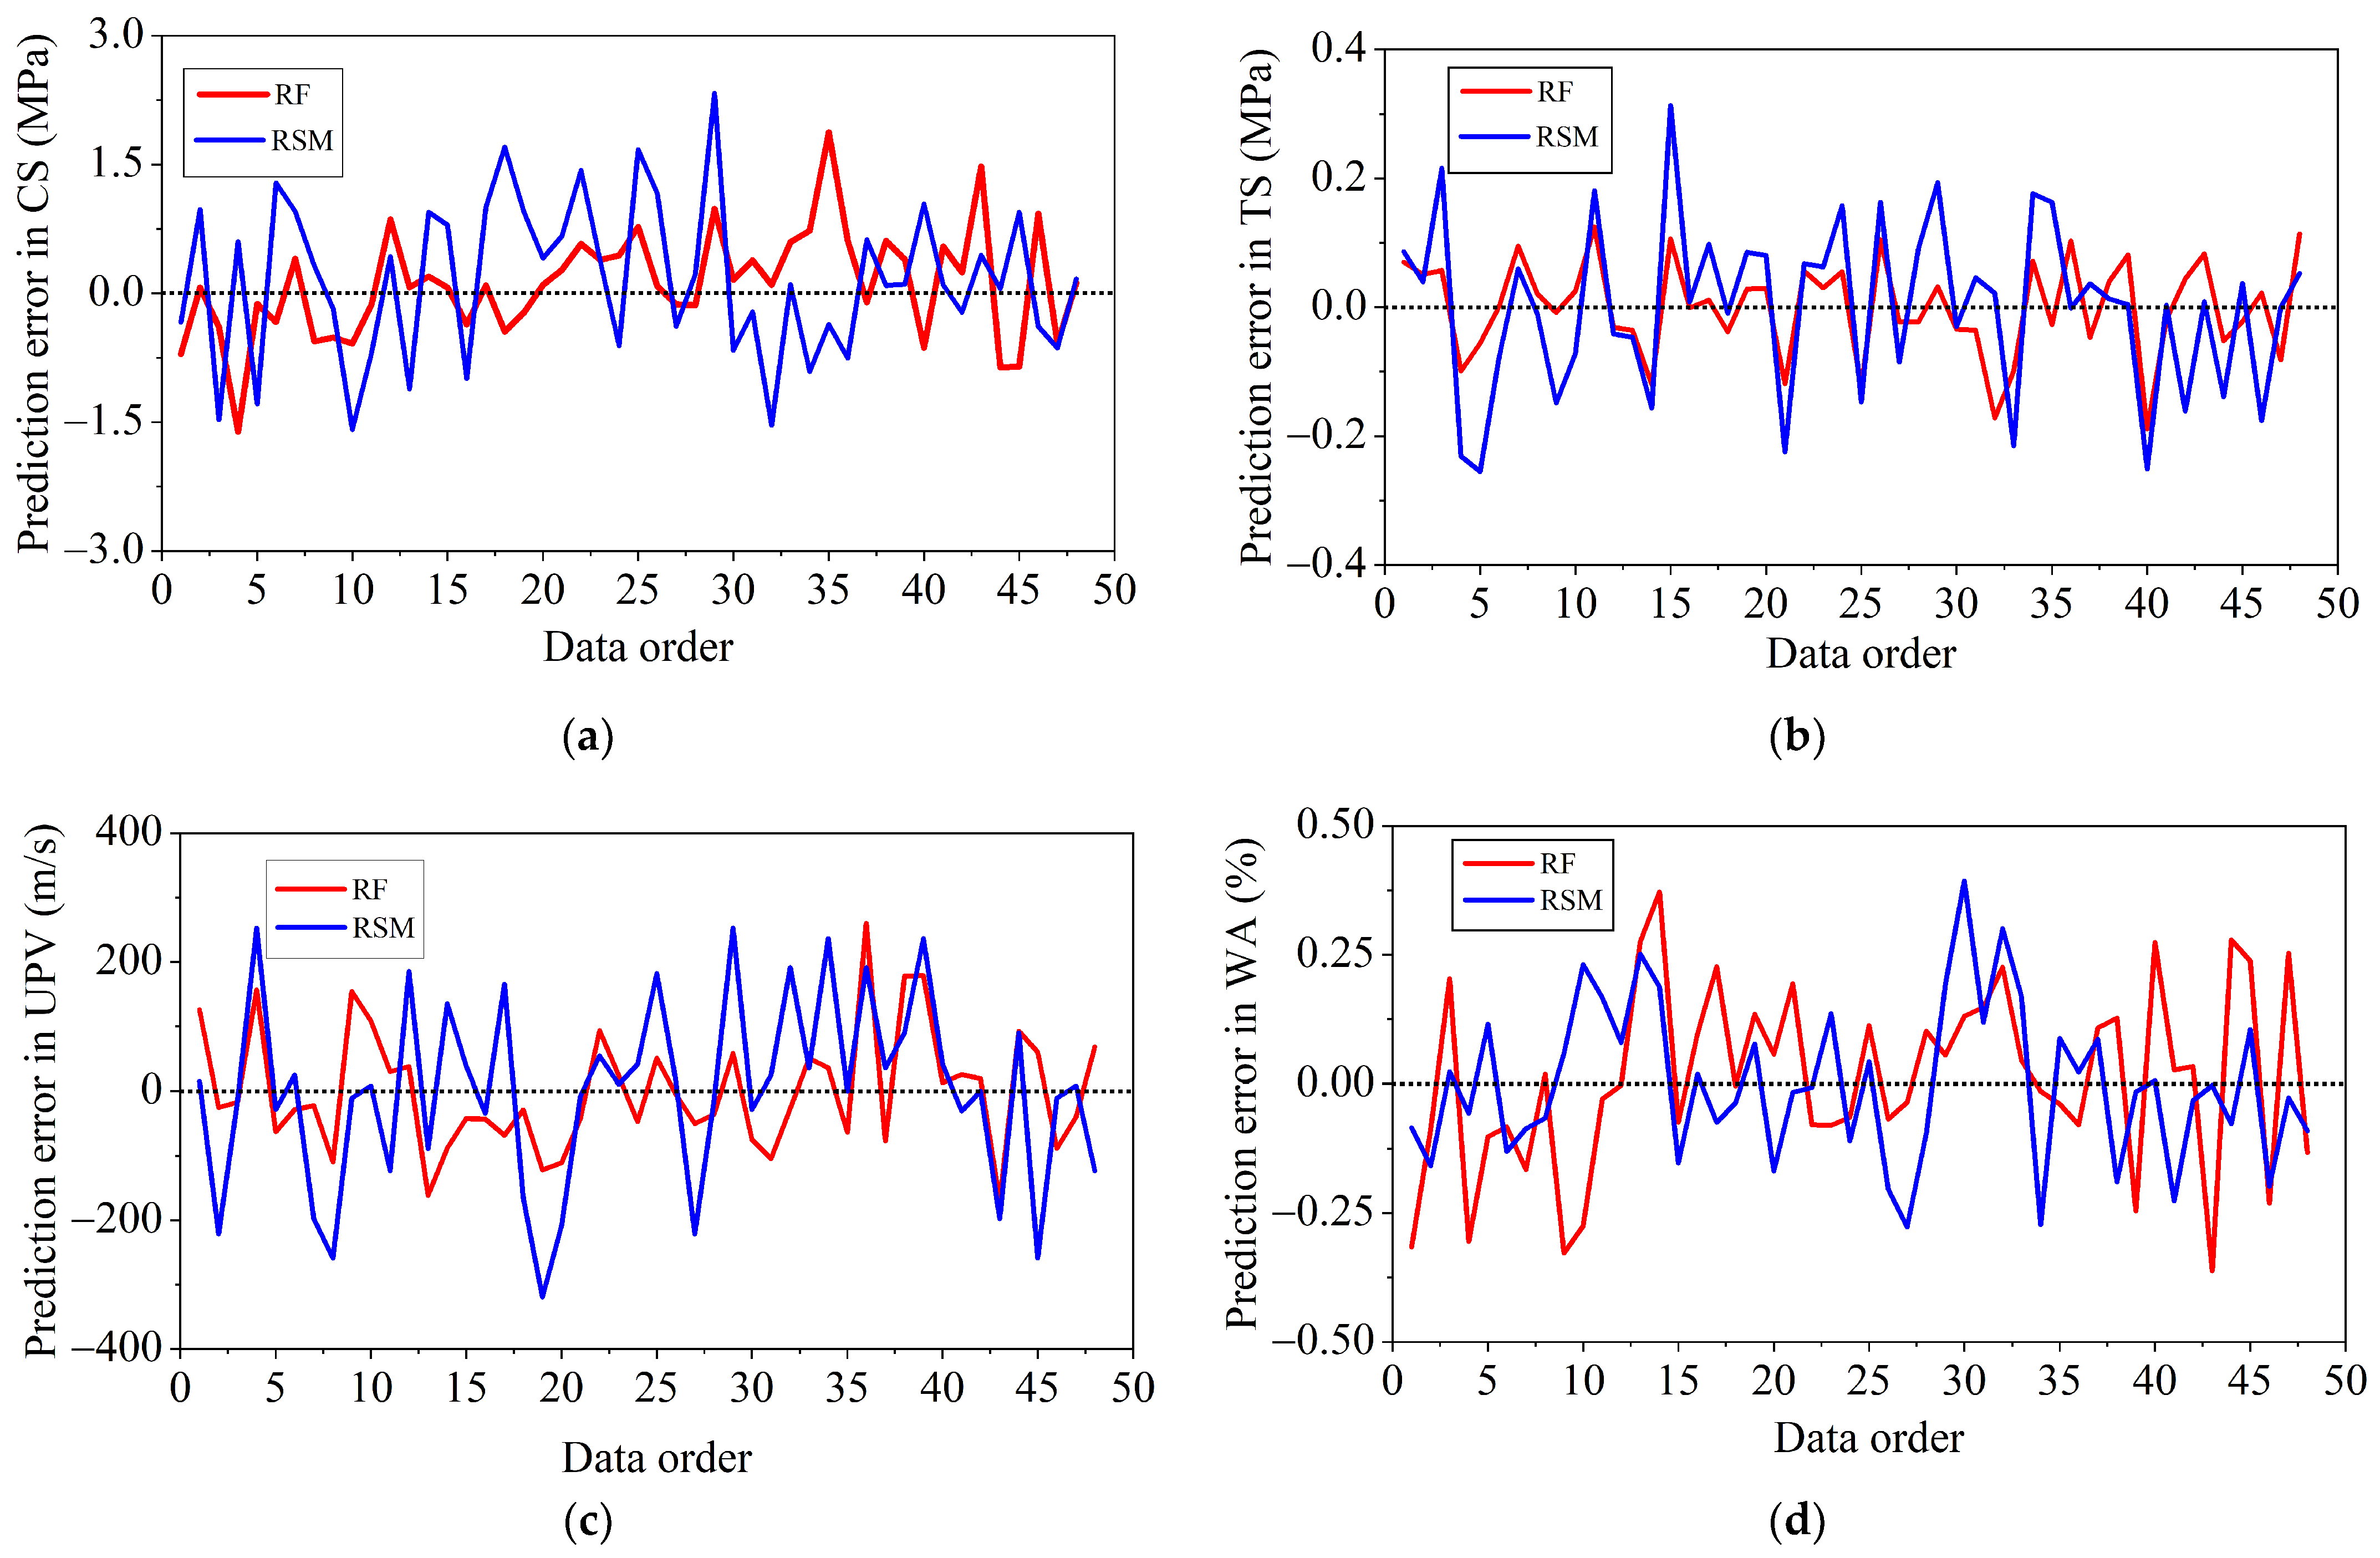
Figure 24 illustrates the disparity between the actual values and the estimated values of the responses derived from RSM and the random forest (RF) model. In predicting the engineering features of concrete incorporating RCA and PPF, specifically CS, TS, and UPV, the RF model demonstrates superior accuracy compared to regression models.

4.2. Comparison of Developed Models and Previously Developed Models

The developed RF models were compared to previously developed models from Jaglan and Singh [40], Alkharisi and Dahish [27], and Zhu et al. [33]. Jaglan and Singh [40] developed prediction models for compressive strength (CS) and tensile strength (TS) of RCA-concrete containing GGBS and polypropylene fibers using Gradient Boosting Machine and Stacked Ensemble Learning. Alkharisi and Dahish [27] developed prediction models for compressive strength (CS) of RCA-concrete containing supplementary cementitious materials and polypropylene fibers. Zhu et al. [33] developed prediction models for the tensile strength (TS) of RCA-concrete utilizing ANN, GEP, and Bagging Model.
Based on the comparison of R2 values in Table 8, the predictive performance of the current paper’s Random Forest (RF) model (R2 = 0.9866) is exceptionally high and highly competitive. It slightly outperforms the model from Alkharisi and Dahish [27], with their XGBoost (0.94854) and M5P (0.8949) techniques showing notably lower performance. However, when compared to the other models from Jaglan and Singh [40], the current RF model demonstrates a superior fit over their Stacked Ensemble Learning approach (0.95443), but is marginally outperformed by their Gradient Boosting Machine, which achieved a slightly higher R2 value of 0.98961. Overall, the current paper’s RF model establishes itself as one of the top-performing models in this comparative analysis, delivering outstanding accuracy.
The comparison of Mean Absolute Percentage Error (MAPE) results shown in Table 9 reveals a substantial performance advantage for the current paper’s Random Forest (RF) model, which achieved a markedly lower error of 2.53%. This value is less than half that of the models from Jaglan and Singh [40], whose Gradient Boosting Machine and Stacked Ensemble Learning recorded MAPEs of 5.49104 and 5.50887, respectively. The performance gap widens further when compared to the work of Alkharisi and Dahish [27], with their XGBoost (6.45328) and particularly their M5P model (12.3862) demonstrating significantly higher prediction errors. With the lowest MAPE by a considerable margin, the current RF model proves to be the most accurate and reliable in this comparison, minimizing forecasting inaccuracies to a greater degree than all other benchmarked techniques.
Based on the comparison of R2 values for the TS output in Table 10, the current paper’s Random Forest (RF) model demonstrates superior predictive performance with an R2 of 0.9784. It outperforms all the benchmarked models, establishing a clear lead. Specifically, it surpasses the Gradient Boosting Machine (0.96947) and Stacked Ensemble Learning (0.96619) models from Jaglan and Singh [40], albeit by a smaller margin. The advantage is more pronounced when compared to the models from Zhu et al. [33], whose ANN (0.863), GEP (0.8806), and Bagging Model (0.9513) all achieved notably lower R2 scores. This indicates that the current RF model explains a greater proportion of the variance in the data, confirming its robustness and making it the most effective model in this comparative analysis for this particular output.
Based on the provided MAPE results for the TS output shown in Table 11, the current paper’s Random Forest (RF) model demonstrates a decisive superiority in predictive accuracy. With a remarkably low Mean Absolute Percentage Error (MAPE) of just 2.23%, it significantly outperforms the models from Jaglan and Singh [40]. Their Gradient Boosting Machine and Stacked Ensemble Learning methods recorded substantially higher error rates of 5.71691 and 6.22232, respectively. This indicates that the RF model’s forecasts are, on average, more than twice as accurate as those of the competing models. The substantial margin in these results firmly establishes the current study’s RF model as the most precise and reliable for this specific task.
The results demonstrated that the RF model for predicting the properties of RCA-PPF concrete outperformed the other developed models in terms of performance and accuracy, exhibiting the highest R2 alongside the lowest MAPE values.

4.3. Practical Implications

This study has substantial implications for the construction sector, especially in encouraging sustainable building materials and methods. The developed RF model can predict the mechanical properties of recycled coarse aggregate (RCA) concrete with polypropylene fibers (PPF), decreasing the environmental impact of traditional concrete production. These models help engineers and developers evaluate RCA concrete with varied proportions of RCA and PPF, resulting in optimum mix designs that balance sustainability and mechanical strength. These models can help develop eco-friendly concrete mixtures by reducing virgin material use and waste. The models can accurately simulate concrete mixes, making design decisions faster and cheaper without physical testing. These models can also improve real-world RAC durability and lifetime. Overall, this study provides a realistic way to improve sustainable concrete performance.

5. Conclusions

This study illustrates a comparative study of the properties of concrete containing RCA and PPF, using RSM and RF. Different input variables have been considered, including the RCA percentage, PPF percentage, and concrete age. The concrete properties have been examined in terms of CS, TS, UPV, and WA. Prediction and optimization of the properties of concrete modified by RCA and PPF have been performed via RSM and a ML approach. The following conclusions can be drawn:
  • Increasing the RCA ratio resulted in decreased CS, TS, and UPV while increasing WA. Conversely, the inclusion of PPF improved CS, TS, and UPV, and decreased WA. Additionally, as the concrete age increased, the WA of RCA-concrete decreased.
  • The regression models developed for predicting the engineering characteristics of RCA-concrete containing PPF exhibited R2 values of 0.9803, 0.9234, 0.9569, and 0.9943 for CS, TS, UPV, and WA, respectively. These models demonstrated adequate precision (64.781, 37.540, 54.238, and 125.86) and p-values below 0.05, indicating a high level of correlation.
  • The optimal conditions for all responses were achieved at a PPF of 3% by volume of concrete, an AGE of 83.6 days, and a near-maximum RCA value of 100%, highlighting optimal reuse of recycled aggregate with an overall desirability of 0.882.
  • The ML model established a strong correlation between the experimental and predicted data, with R2 values ranging between 0.9690 and 0.9959, extremely near unity, indicating high power of the prediction models, and the developed models accurately represent the trend in the dataset.
  • Based on RF models’ results, MAPE values for CS, TS, UPV, and WA were (1.46, 2.01, 1.95, and 1.7%) for the train dataset, and (2.53, 2.23, 2.74, and 2.51%) for the test dataset. This means that all the prediction models had error rates of less than 5%.
  • The SHAP analyses demonstrate that curing age is the dominant factor influencing CS, UPV, and WA, demonstrating its critical role in microstructural development. In contrast, TS is primarily governed by RCA and PPF content. These distinct feature importance patterns underscore the need for property-specific optimization strategies when designing sustainable concrete containing recycled materials.
  • This study developed a robust and accurate predictive tool for engineers and researchers. The RF model and QM from RSM can be utilized to optimize sustainable concrete mix designs containing RCA and PPF without the immediate need for extensive laboratory trials. This accelerates the mix design process, reduces material costs, and promotes the wider adoption of sustainable construction practices.
  • The predictive models developed in this study are validated for their high accuracy within the experimental range of the utilized dataset.

6. Limitations and Future Work

While the Random Forest model demonstrated high predictive accuracy on the dataset used in this study, its performance is inherently tied to the range and nature of the data on which it was trained. Input variable optimization affects the performance of ML. New parameters require model retraining, validation, and hyperparameter optimization. A primary limitation of this study is the use of a dataset from a single source for model development and validation. This study uses three input variables and examines 144 data points; however, more input variables are needed to establish their value in predicting the properties of recycled aggregate concrete containing PPF. To enhance the model’s generalizability and practical utility, future work should focus on collating a larger, more diverse dataset encompassing a wider variety of variables, including material sources, types, compositions, recycled aggregate types, crushing index and absorption, fineness modulus, pozzolanic component ratios, specific surface area of powder, mix designs, and curing environments. A graphical user interface for assessing the durability of recycled aggregate concrete containing PPF is required. The economic viability of using RCA as a partial substitute for natural coarse aggregate and PPF as a concrete additive will highlight their wide-ranging applications.

Author Contributions

H.A.D.: Writing—original draft, Visualization, Project administration, Methodology, Investigation, Formal analysis, Conceptualization, Validation. M.K.A.: Writing—review & editing, Supervision, Methodology, Investigation, Formal analysis. All authors have read and agreed to the published version of the manuscript.

Funding

This research received no external funding.

Data Availability Statement

Raw data supporting the conclusions of this article will be made available by the corresponding author upon reasonable request.

Acknowledgments

The researchers would like to thank the Deanship of Graduate Studies and Scientific Research at Qassim University for financial support (QU-APC-2025).

Conflicts of Interest

The authors declare there are no conflicts of interest.

Abbreviations

The following abbreviations are used in this manuscript:
RCArecycled coarse aggregate
PPFpolypropylene fiber
MLmachine learning
RSMresponse surface methodology
RFrandom forest
ANOVAanalysis of variance
ITZinterfacial transition zone
CCDcentral composite design
NCAnatural coarse aggregate
RArecycled aggregate
AGEconcrete age
CScompressive strength
TStensile strength
UPVultrasonic pulse velocity
WAwater absorption
RPearson correlation coefficient
R2coefficient of determination
MAPEmean absolute percentage error
Doverall desirability D
QMquadratic model
KCVK-fold Cross Validation

Appendix A

Table A1. ANOVA analysis for CS, Ts, UPV, and WA responses.
Response SourceSum of SquaresdfMean SquareF-Valuep-Value
Compressive
Strength (CS)
Model1868.688233.59242.05<0.0001significant
A-PPF256.011256.01265.28<0.0001
B-RCA649.791649.79673.33<0.0001
C-Age919.71919.7953.01<0.0001
AB4.4314.434.60.0384
AC17.17117.1717.790.0001
BC19.85119.8520.57<0.0001
A210.83110.8311.220.0018
C2284.411284.41294.71<0.0001
Residual37.64390.965
Cor Total1906.3247
Tensile
Strength (TS)
Model10.0361.6782.4<0.0001significant
A-PPF2.912.9143.13<0.0001
B-RCA6.0416.04297.95<0.0001
C-AGE1.111.154.19<0.0001
AC0.112210.11225.530.0235
BC0.11510.1155.670.022
C20.100110.10014.940.0319
Residual0.8315410.0203
Cor Total10.8647
Ultrasonic Pulse
Velocity (UPV)
Model2.18 × 10754.36 × 106186.72<0.0001significant
A-PPF6.57 × 10616.57 × 106281.23<0.0001
B-RCA1.16 × 10711.16 × 107495.93<0.0001
C-AGE2.88 × 10612.88 × 106123.33<0.0001
B27.44 × 10417.44 × 1043.190.0815
C21.22 × 10611.22 × 10652.24<0.0001
Residual9.81 × 1054223.4 × 103
Cor Total2.28 × 10747
Water
Absorption (WA)
Model185.21630.871191.77<0.0001significant
A-PPF25.69125.69991.71<0.0001
B-RCA20.57120.57794.28<0.0001
C-AGE121.781121.784701.78<0.0001
BC1.9411.9474.72<0.0001
A20.610.623.17<0.0001
C26.4516.45248.85<0.0001
Residual1.06410.0259
Cor Total186.2747

References

  1. Alharthai, M.; Ali, T.; Qureshi, M.Z.; Ahmed, H. The Enhancement of Engineering Characteristics in Recycled Aggregates Concrete Combined Effect of Fly Ash, Silica Fume and PP Fiber. Alex. Eng. J. 2024, 95, 363–375. [Google Scholar] [CrossRef]
  2. Behera, M.; Bhattacharyya, S.K.; Minocha, A.K.; Deoliya, R.; Maiti, S. Recycled Aggregate from C&D Waste & Its Use in Concrete—A Breakthrough towards Sustainability in Construction Sector: A Review. Constr. Build. Mater. 2014, 68, 501–516. [Google Scholar] [CrossRef]
  3. Tam, V.W.Y.; Soomro, M.; Evangelista, A.C.J. A Review of Recycled Aggregate in Concrete Applications (2000–2017). Constr. Build. Mater. 2018, 172, 272–292. [Google Scholar] [CrossRef]
  4. Kisku, N.; Joshi, H.; Ansari, M.; Panda, S.K.; Nayak, S.; Dutta, S.C. A Critical Review and Assessment for Usage of Recycled Aggregate as Sustainable Construction Material. Constr. Build. Mater. 2017, 131, 721–740. [Google Scholar] [CrossRef]
  5. Silva, R.V.; de Brito, J.; Dhir, R.K. Properties and Composition of Recycled Aggregates from Construction and Demolition Waste Suitable for Concrete Production. Constr. Build. Mater. 2014, 65, 201–217. [Google Scholar] [CrossRef]
  6. Katz, A. Properties of Concrete Made with Recycled Aggregate from Partially Hydrated Old Concrete. Cem. Concr. Res. 2003, 33, 703–711. [Google Scholar] [CrossRef]
  7. Tam, V.W.Y.; Tam, C.M.; Le, K.N. Removal of Cement Mortar Remains from Recycled Aggregate Using Pre-Soaking Approaches. Resour. Conserv. Recycl. 2007, 50, 82–101. [Google Scholar] [CrossRef]
  8. Kou, S.; Poon, C.; Agrela, F. Comparisons of Natural and Recycled Aggregate Concretes Prepared with the Addition of Different Mineral Admixtures. Cem. Concr. Compos. 2011, 33, 788–795. [Google Scholar] [CrossRef]
  9. Kapoor, K.; Singh, S.P.; Singh, B. Durability of Self-Compacting Concrete Made with Recycled Concrete Aggregates and Mineral Admixtures. Constr. Build. Mater. 2016, 128, 67–76. [Google Scholar] [CrossRef]
  10. Zhang, H.; Liu, Y.; Sun, H.; Wu, S. Transient Dynamic Behavior of Polypropylene Fiber Reinforced Mortar under Compressive Impact Loading. Constr. Build. Mater. 2016, 111, 30–42. [Google Scholar] [CrossRef]
  11. Fallah, S.; Nematzadeh, M. Mechanical Properties and Durability of High-Strength Concrete Containing Macro-Polymeric and Polypropylene Fibers with Nano-Silica and Silica Fume. Constr. Build. Mater. 2017, 132, 170–187. [Google Scholar] [CrossRef]
  12. Yan, P.; Chen, B.; Afgan, S.; Aminul Haque, M.; Wu, M.; Han, J. Experimental Research on Ductility Enhancement of Ultra-High Performance Concrete Incorporation with Basalt Fibre, Polypropylene Fibre and Glass Fibre. Constr. Build. Mater. 2021, 279, 122489. [Google Scholar] [CrossRef]
  13. Imran, H.; Al-Abdaly, N.M.; Shamsa, M.H.; Shatnawi, A.; Ibrahim, M.; Ostrowski, K.A. Development of Prediction Model to Predict the CompressiveStrength of Eco-Friendly Concrete Using MultivariatePolynomial Regression Combined with Stepwise Method. Materials 2022, 15, 317. [Google Scholar] [CrossRef]
  14. Unamba, U.K.; Nwajagu, E.S.; Abutu, J.; Agbo-Anike, O.J. Predictive Model of the Compressive Strength of Concrete Containing Coconut Shell Ash as Partial Replacement of Cement Using Multiple Regression Analysis. Int. J. Innov. Sci. Res. Technol. 2021, 6, 600–608. [Google Scholar]
  15. Haque, M.; Ray, S.; Mita, A.F.; Mozumder, A.; Karmaker, T.; Akter, S. Prediction and Optimization of Hardened Properties of Concrete Prepared with Granite Dust and Scrapped Copper Wire Using Response Surface Methodology. Heliyon 2024, 10, e24705. [Google Scholar] [CrossRef] [PubMed]
  16. Patil, S.; Ramesh, B.; Sathish, T.; Saravanan, A. RSM-Based Modelling for Predicting and Optimizing the Rheological and Mechanical Properties of Fibre-Reinforced Laterized Self-Compacting Concrete. Heliyon 2024, 10, e25973. [Google Scholar] [CrossRef]
  17. Zamir Hashmi, S.R.; Khan, M.I.; Khahro, S.H.; Zaid, O.; Shahid Siddique, M.; Md Yusoff, N.I. Prediction of Strength Properties of Concrete Containing Waste Marble Aggregate and Stone Dust—Modeling and Optimization Using RSM. Materials 2022, 15, 8024. [Google Scholar] [CrossRef]
  18. Habibi, A.; Ramezanianpour, A.M.; Mahdikhani, M. RSM-Based Optimized Mix Design of Recycled Aggregate Concrete Containing Supplementary Cementitious Materials Based on Waste Generation and Global Warming Potential. Resour. Conserv. Recycl. 2021, 167, 105420. [Google Scholar] [CrossRef]
  19. Ofuyatan, O.M.; Agbawhe, O.B.; Omole, D.O.; Igwegbe, C.A.; Ighalo, J.O. RSM and ANN Modelling of the Mechanical Properties of Self-Compacting Concrete with Silica Fume and Plastic Waste as Partial Constituent Replacement. Clean. Mater. 2022, 4, 100065. [Google Scholar] [CrossRef]
  20. Mohammed, N. Characterization of Sustainable Concrete Made from Wastewater Bottle Caps Using a Machine Learning and RSM-CCD: Towards Performance and Optimization. In AToMech1-2023 Supplement; Materials Research Forum LLC: Millersville, PA, USA, 2023; pp. 38–46. [Google Scholar]
  21. Chong, B.W.; Shi, X. Meta-Analysis on PET Plastic as Concrete Aggregate Using Response Surface Methodology and Regression Analysis. J. Infrastruct. Preserv. Resil. 2023, 4, 2. [Google Scholar] [CrossRef]
  22. Pereira, F.; Mitchell, T.; Botvinick, M. Machine Learning Classifiers and FMRI: A Tutorial Overview. Neuroimage 2009, 45, S199–S209. [Google Scholar] [CrossRef] [PubMed]
  23. Khan, A.; Manan, A.; Umar, M.; Mehmood, M.; Onyelowe, K.C.; Arunachalam, K.P. Enhancing Concrete Strength for Sustainability Using a Machine Learning Approach to Improve Mechanical Performance. Sci. Rep. 2025, 15, 23067. [Google Scholar] [CrossRef] [PubMed]
  24. Manan, A.; Pu, Z.; Majdi, A.; Alattyih, W.; Elagan, S.K.; Ahmad, J. Sustainable Optimization of Concrete Strength Properties Using Artificial Neural Networks: A Focus on Mechanical Performance. Mater. Res. Express 2025, 12, 025504. [Google Scholar] [CrossRef]
  25. Yuan, X.; Tian, Y.; Ahmad, W.; Ahmad, A.; Usanova, K.I.; Mohamed, A.M.; Khallaf, R. Machine Learning Prediction Models to Evaluate the Strength of Recycled Aggregate Concrete. Materials 2022, 15, 2823. [Google Scholar] [CrossRef]
  26. Shang, M.; Li, H.; Ahmad, A.; Ahmad, W.; Ostrowski, K.A.; Aslam, F.; Joyklad, P.; Majka, T.M. Predicting the Mechanical Properties of RCA-Based Concrete Using Supervised Machine Learning Algorithms. Materials 2022, 15, 647. [Google Scholar] [CrossRef]
  27. Alkharisi, M.K.; Dahish, H.A. The Application of Response Surface Methodology and Machine Learning for Predicting the Compressive Strength of Recycled Aggregate Concrete Containing Polypropylene Fibers and Supplementary Cementitious Materials. Sustainability 2025, 17, 2913. [Google Scholar] [CrossRef]
  28. Roy, T.; Das, P.; Jagirdar, R.; Shhabat, M.; Abdullah, M.S.; Kashem, A.; Rahman, R. Prediction of Mechanical Properties of Eco-Friendly Concrete Using Machine Learning Algorithms and Partial Dependence Plot Analysis. Smart Constr. Sustain. Cities 2025, 3, 2. [Google Scholar] [CrossRef]
  29. Dhengare, S.; Waghe, U.; Yenurkar, G.; Shyamala, A. A Comprehensive Model for Concrete Strength Prediction Using Advanced Learning Techniques. Discov. Appl. Sci. 2025, 7, 551. [Google Scholar] [CrossRef]
  30. Yu, L. Strength Properties Prediction of RCA Concrete via Hybrid Regression Framework. J. Eng. Appl. Sci. 2024, 71, 6. [Google Scholar] [CrossRef]
  31. Al-Shamasneh, A.R.; Mahmoodzadeh, A.; Karim, F.K.; Saidani, T.; Alghamdi, A.; Alnahas, J.; Sulaiman, M. Application of Machine Learning Techniques to Predict the Compressive Strength of Steel Fiber Reinforced Concrete. Sci. Rep. 2025, 15, 30674. [Google Scholar] [CrossRef]
  32. Tipu, R.K.; Panchal, V.R.; Pandya, K.S. Prediction of Concrete Properties Using Machine Learning Algorithm. J. Phys. Conf. Ser. 2022, 2273, 012016. [Google Scholar] [CrossRef]
  33. Zhu, Y.; Ahmad, A.; Ahmad, W.; Vatin, N.I.; Mohamed, A.M.; Fathi, D. Predicting the Splitting Tensile Strength of Recycled Aggregate Concrete Using Individual and Ensemble Machine Learning Approaches. Crystals 2022, 12, 569. [Google Scholar] [CrossRef]
  34. Anaconda Inc. Anaconda Individual Edition, Anaconda Website. Available online: https://www.anaconda.com/products/individual (accessed on 14 January 2025).
  35. Montgomery, D.C. Design and Analysis of Experiments, 10th ed.; Wiley: Hoboken, NJ, USA, 2019; ISBN 9781118146927. [Google Scholar]
  36. Junaid, M.; Jiang, C.; Eltwati, A.; Khan, D.; Alamri, M.; Eisa, M.S. Statistical Analysis of Low-Density and High-Density Polyethylene Modified Asphalt Mixes Using the Response Surface Method. Case Stud. Constr. Mater. 2024, 21, e03697. [Google Scholar] [CrossRef]
  37. Adamu, M.; Trabanpruek, P.; Limwibul, V.; Jongvivatsakul, P.; Iwanami, M.; Likitlersuang, S. Compressive Behavior and Durability Performance of High-Volume Fly-Ash Concrete with Plastic Waste and Graphene Nanoplatelets by Using Response-Surface Methodology. J. Mater. Civ. Eng. 2022, 34, 04022222. [Google Scholar] [CrossRef]
  38. Mohammed, B.S.; Adamu, M. Mechanical Performance of Roller Compacted Concrete Pavement Containing Crumb Rubber and Nano Silica. Constr. Build. Mater. 2018, 159, 234–251. [Google Scholar] [CrossRef]
  39. Breiman, L. Random Forests. Mach. Learn. 2001, 45, 5–32. [Google Scholar] [CrossRef]
  40. Jaglan, A.; Singh, R.R. Recycled Aggregate Concrete Incorporating GGBS and Polypropylene Fibers Using RSM and Machine Learning Techniques. Buildings 2024, 15, 66. [Google Scholar] [CrossRef]
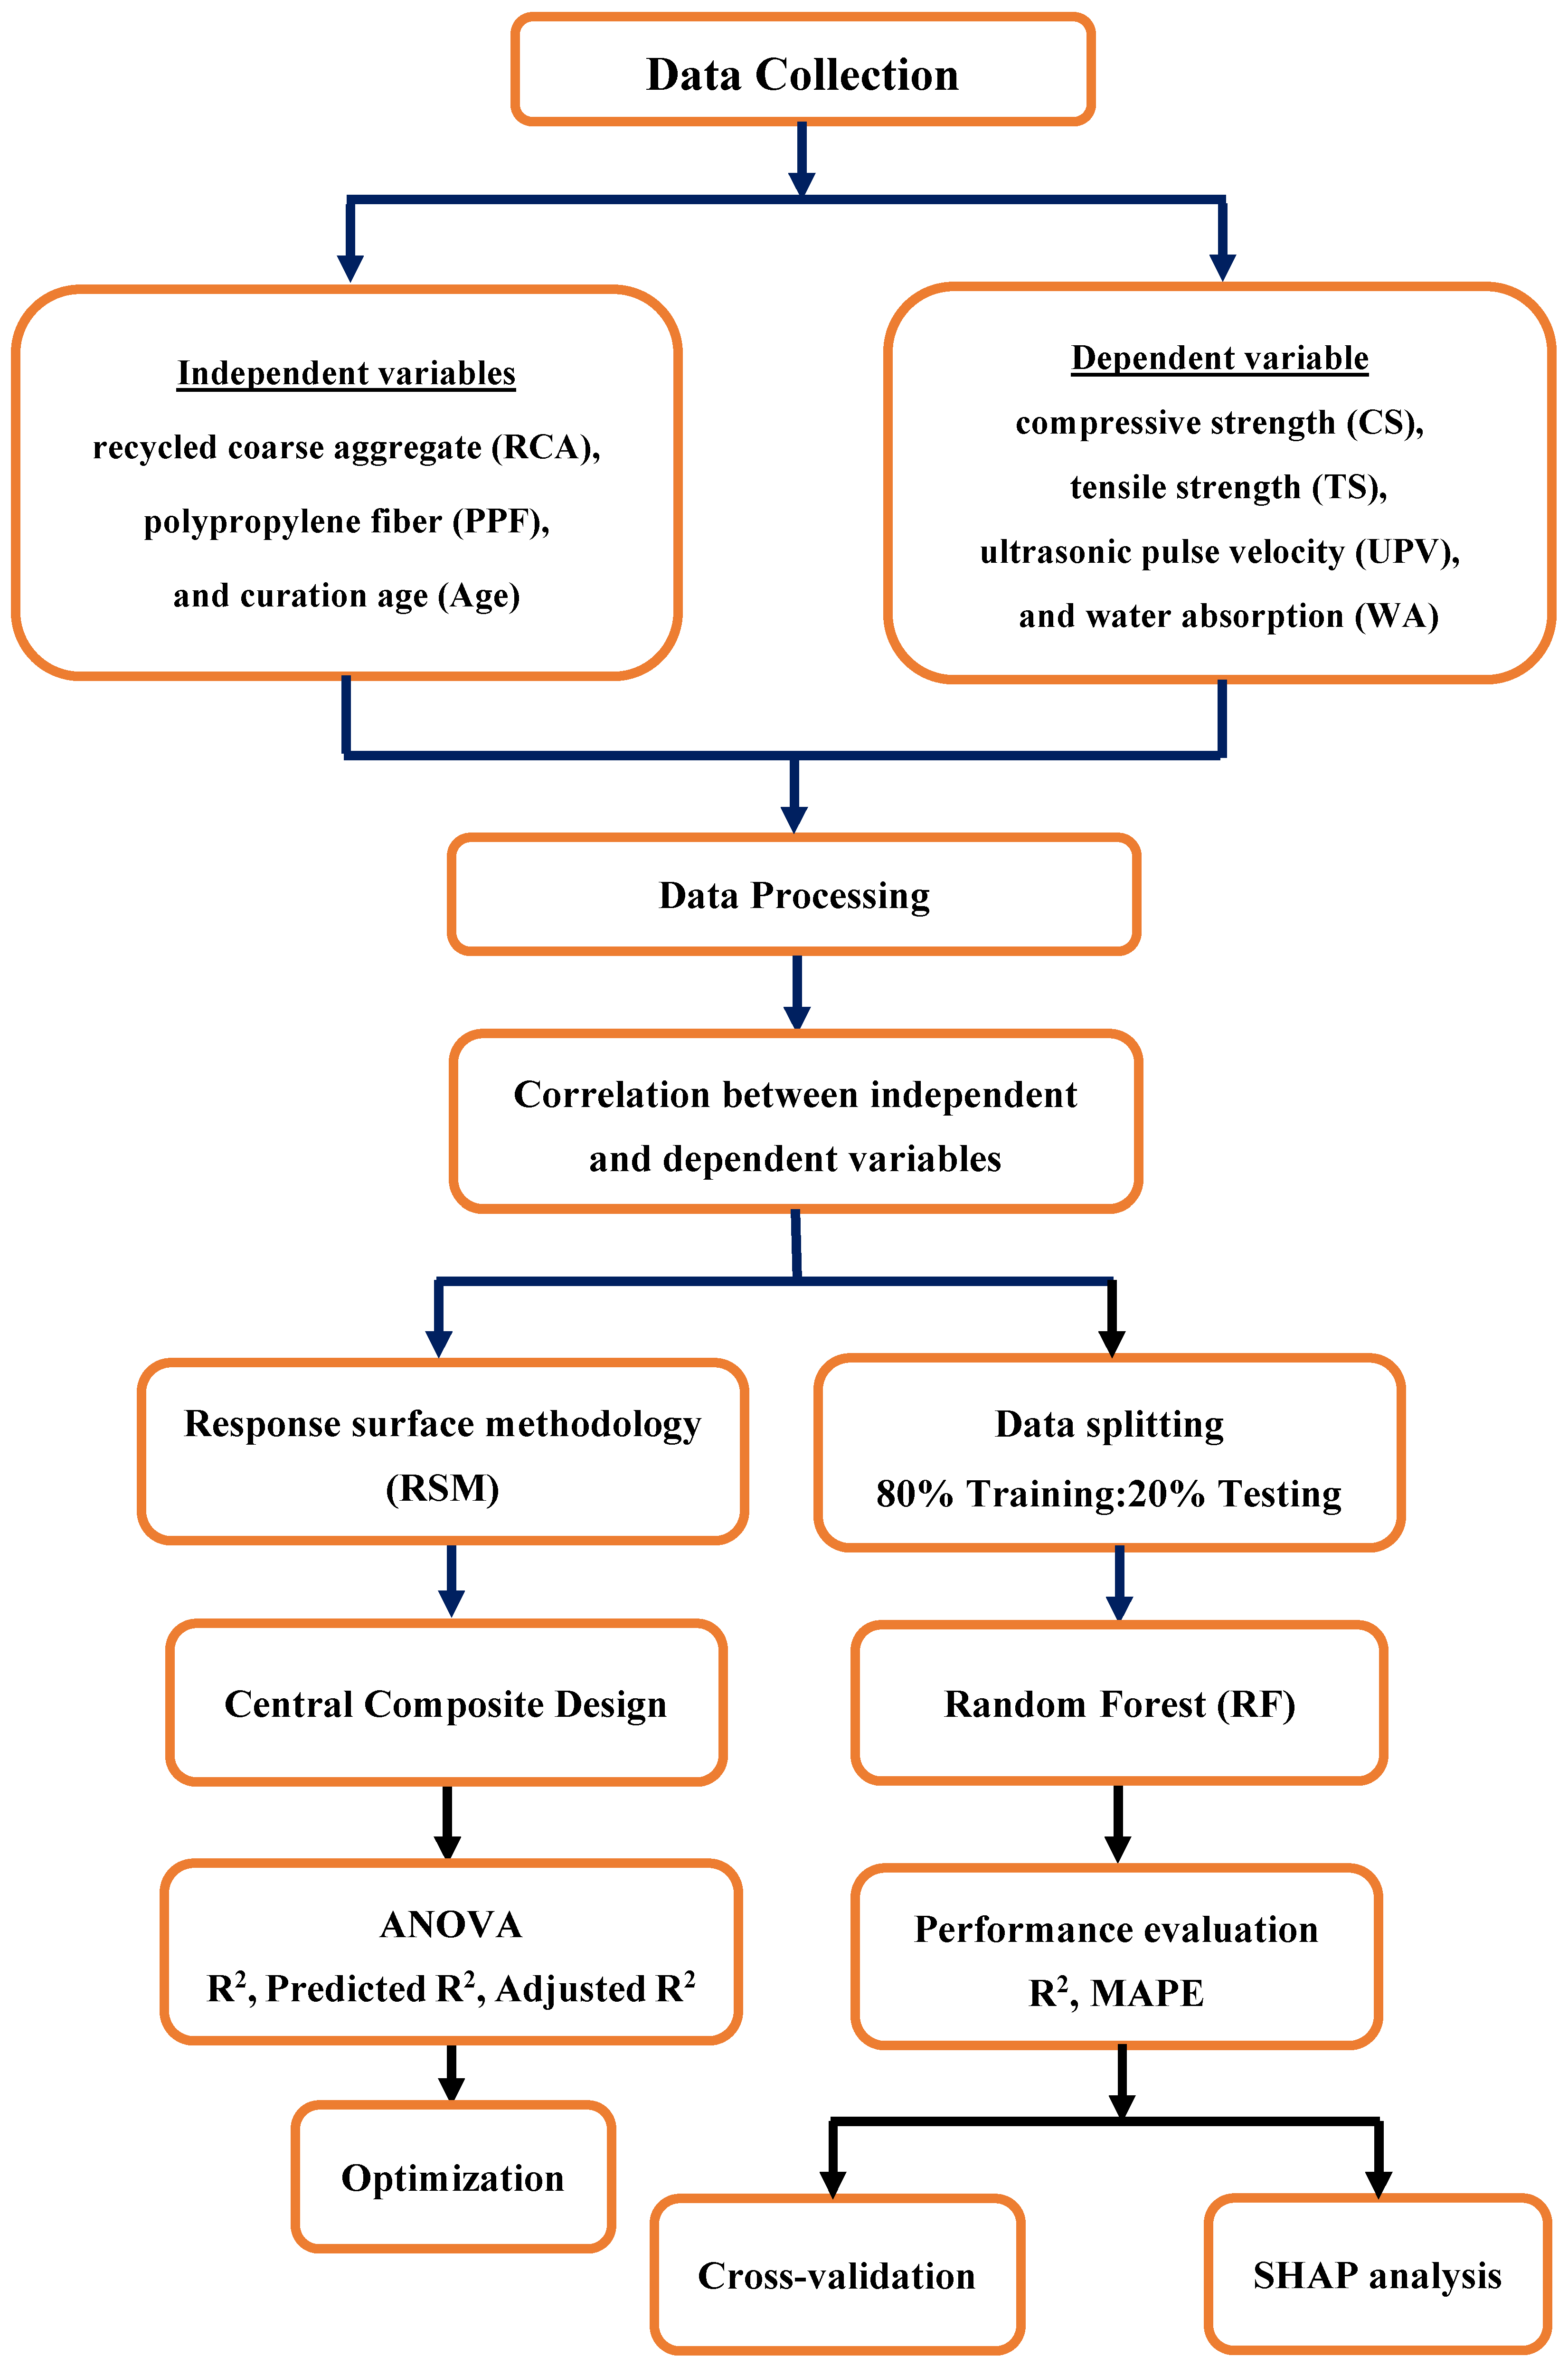
Figure 1. Research methodology flowchart.
Buildings 15 03709 g001
Figure 2. Pearson correlation coefficient (R) heatmap.
Buildings 15 03709 g002
Figure 3. Interactions between input and output parameters.
Buildings 15 03709 g003
Figure 4. RF algorithm.
Buildings 15 03709 g004
Figure 5. Predicted vs. actual data plots for the developed models: (a) CS; (b) TS; (c) UPV; (d) WA.
Buildings 15 03709 g005
Figure 6. Residual vs. run number plots for the developed QM models: (a) CS; (b) TS; (c) UPV; (d) WA.
Buildings 15 03709 g006aBuildings 15 03709 g006b
Figure 7. Plots of relationships between input parameters and CS: (a) 3D plot for CS with PPF and RCA; (b) 2D plot for CS with PPF and RCA; (c) 3D plot for CS with PPF and AGE; (d) 2D plot for CS with PPF and AGE; (e) 3D plot for CS with RCA and AGE; (f) 2D plot for CS with RCA and AGE.
Buildings 15 03709 g007aBuildings 15 03709 g007b
Figure 8. Plots of relationships between input parameters and TS: (a) 3D plot for TS with PPF and RCA; (b) 2D plot for TS with PPF and RCA; (c) 3D plot for TS with PPF and AGE; (d) 2D plot for TS with PPF and AGE; (e) 3D plot for TS with RCA and AGE; (f) 2D plot for TS with RCA and AGE.
Buildings 15 03709 g008
Figure 9. Plots of relationships between input parameters and UPV: (a) 3D plot for UPV with PPF and RCA; (b) 2D plot for UPV with PPF and RCA; (c) 3D plot for UPV with PPF and AGE; (d) 2D plot for UPV with PPF and AGE.
Buildings 15 03709 g009
Figure 10. Plots of relationships between input parameters and WA: (a) 3D plot for WA with PPF and RCA; (b) 2D plot for WA with PPF and RCA; (c) 3D plot for WA with PPF and AGE; (d) 2D plot for WA with PPF and AGE.
Buildings 15 03709 g010
Figure 11. Predictions versus experimental data (RF algorithm) for: (a) CS; (b) TS; (c) UPV; (d) WA.
Buildings 15 03709 g011
Figure 12. Prediction errors vs. data order plots for the developed RF models: (a) CS; (b) TS; (c) UPV; (d) WA.
Buildings 15 03709 g012
Figure 13. K-folds statistical measures.
Buildings 15 03709 g013
Figure 14. SHAP plots for CS.
Buildings 15 03709 g014
Figure 15. SHAP plot for TS.
Buildings 15 03709 g015
Figure 16. SHAP plots for UPV.
Buildings 15 03709 g016
Figure 17. SHAP plot for WA.
Buildings 15 03709 g017
Figure 18. Optimal concrete compressive strength.
Buildings 15 03709 g018
Figure 19. Optimal concrete tensile strength.
Buildings 15 03709 g019
Figure 20. Optimal UPV for concrete.
Buildings 15 03709 g020
Figure 21. Optimal water absorption for concrete.
Buildings 15 03709 g021
Figure 22. Optimal properties for concrete.
Buildings 15 03709 g022
Figure 23. Predictions versus experimental data (RSM and RF) for: (a) CS; (b) TS; (c) UPV; (d) WA.
Buildings 15 03709 g023
Figure 24. Variations between predicted values and experimental data based on the QM and RF models: (a) CS.; (b) TS; (c) UPV; (d) WA.
Buildings 15 03709 g024
Table 1. Summary of existing prediction models for concrete properties.
ReferenceSample SizeStudy TargetUsed ML TechniquesInput VariablesMain Results
Khan et al. (2025) [23]583Predicting compressive strength (CS) and split tensile
strength (STS).
Extreme Gradient Boosting (XGBoost), Decision Tree, and K-Nearest
Neighbors (KNN)
RCA replacement level (RL), water-to-cement ratio (w/c), aggregate-to-cement ratio (A:C), sand-to-cement ratio (S:C), bulk density of RCA (RCA-D), bulk density of natural aggregate (NA-D), RCA particle size (RCA-S), natural aggregate size
(NA-S), and the age of the concrete
XGBoost demonstrated the best performance, achieving test R2 values of 0.86 for CS and 0.88 for STS, with RMSEs of 8.32 MPa and 0.55 MPa, respectively
Manan et al. (2025) [24]358 data pointsPredict compressive strength (CS), tensile strength (TS), and modulus of elasticity (MOE) of recycled aggregate concrete (RAC)Artificial Neural Network (ANN) with K-fold cross-validation and SHAP analysisRCA replacement level (RL), Water-to-cement ratio (W/C), Aggregate-to-cement ratio (A:C), Sand-to-cement ratio (S:C), Cement content (C), Bulk density of RCA (RCA-D), Bulk density of NA (NA-D), RCA aggregate size (RCA-S)Training R2: Fc: 0.93, STS: 0.92, MOE: 0.99
Testing R2: Fc: 0.75, STS: 0.78, MOE: 0.67
SHAP analysis: Cement content and natural aggregate density (NA-D) were most influential for compressive strength; NA-D and RCA-D for tensile strength and MOE
Model validated with K-fold cross-validation; moderate overfitting observed in testing
Shang et al. (2022) [26]344 data pointsPredict compressive strength (CS) and splitting tensile strength (STS) of recycled coarse aggregate (RCA) concreteDecision Tree (DT), AdaBoost (Ensemble)Cement, Water, Fine aggregate, Natural coarse aggregate (NCA), RCA, Superplasticizers (SP), Maximum size of RCA, Density of RCA, Water absorption of RCAAdaBoost: CS: R2 = 0.95, STS: R2 = 0.92
Decision Tree: CS: R2 = 0.93, STS: R2 = 0.90
AdaBoost showed lower errors (MAE, MSE, RMSE) than DT
Sensitivity analysis: Cement was most influential for CS (36.8%) and STS (41.2%)
Alkharisi & Dahish (2025) [27]529 data pointsCompressive strength of recycled aggregate concrete with PPF, FA, and SFRSM (CCD), M5P, Random Forest (RF), XGBoostCement, NFA, NCA, RA, FA, SF, PPF, W/C, SP, AGEXGBoost performed best: R2 = 0.979 (train), 0.9485 (test), MAE = 1.149 MPa, RMSE = 2.324 MPa, MAPE = 3.19%; optimal mix: 100% RA, 1.13% PPF, 7.9% FA, 5.3% SF
Roy et al. (2025) [28]480 (CS), 110 (STS)CS and STS of RHA concreteGPR, RFR, DTRAge, Cement, RHA, Coarse Aggregate, Sand, Water, SuperplasticizerDTR best: CS R2 = 0.9646, STS R2 = 0.9691
Dhengare et al. (2025) [29]500 samplesCompressive/tensile strength of sustainable concretePCA + CNN + RFR + SVR (Hybrid)Cement, aggregates, bagasse ash, copper slag, eggshell powder, curing time, etc.MAE: 2.0 MPa, R2: 0.95
Yu (2024) [30]344 samplesPredict CS of High-Performance Concrete (HPC)Support Vector Regression (SVR) optimized with SMA, ESMA, and AOSMACement, Water, Fine Aggregate, NCA, RCA, SRCA, DRCA, WRCA, Superplasticizer, Chemical AdmixturesThe SVR-ESMA hybrid model performed best (Test R2: 0.9894, Test MAE: 0.8506 MPa), significantly outperforming other SVR-optimizer combinations.
Al-Shamasneh et al. (2025) [31]600Predicting CS of steel fiber reinforced concrete (SFRC)support vector regression (SVR), Gaussian process regression (GPR), random forest regression (RFR), extreme gradient boosting regression (XGBR), artificial neural networks (ANN), and K-nearest neighbors (KNN)fiber characteristics (type, content, length, diameter), water-to-cement (w/c) ratio, aggregate size, curing time, silica fume, and superplasticizerPrediction performance was best for GPR as it achieved the highest R2 value of 0.93 and lowest RMSE of 16.54, with XGBR, SVR, and RFR
Tipu et al. (2022) [32]1133 (CS), 642 (chloride)Compressive strength & chloride penetration depthDT, RF, SVR, GBR, ANN + PSO tuningCement, slag, fly ash, water, aggregates, superplasticizer, age, exposure conditionsRF & GBR best: R2 = 0.96, RMSE = 3.97–4.03 MPa
Zhu et al. (2022) [33]166Predicting tensile strength (TS) of concrete containing recycled aggregate (RA)The gene expression programming (GEP), artificial neural network (ANN), and bagging techniquescement, fine aggregate, natural coarse aggregate (NCA), water, recycled coarse aggregate (RCA), the maximum size of RA, superplasticizers,
the density of RA, and water absorption of RA
The bagging model outperformed the GEP and ANN
models in terms of performance.
Table 2. Statistical description of the dataset.
PPF (%)RCA (%)Age (Days)CS (MPa)TS (MPa)UPV (m/s)WA (%)
Mean1.556.254428.52.95633633.78.104
Std. Deviation1.129937.36733.376.3690.48065696.21.991
Skewness0−0.4490.6330.4550.5570.222−0.021
Kurtosis−1.377−1.148−1.533−0.288−0.285−0.449−0.977
Minimum001417.62.22244.74.49
Maximum31009044.84.15179.612.08
Table 3. Fit Statistics.
MODELR2Adjusted R2Predicted
R2
Adequate PrecisionSDMeanCV %
Compressive Strength (CS)0.98030.97620.96964.7810.982428.53.45
Tensile Strength (TS)0.92340.91220.892837.540.14242.964.82
Ultra-sonic Pulse Velocity (UPV)0.95690.95180.944154.238152.823633.74.21
Water Absorption (WA)0.99430.99350.9922125.860.16098.11.99
Table 4. Optimized hyperparameter.
HyperparameterRangeOptimized Values
CSTSUPVWA
n_estimators10–10010191334
max_depth5–201413619
min_samples_split2–102232
min_samples_leaf1–51111
max_features‘auto’, ‘sqrt’, ‘log2’sqrtlog2sqrtlog2
Table 5. Statistical measures based on RF models.
OutputData SetR2MAPE
CS Train0.99551.46
Test0.98662.53
TS Train0.98102.01
Test0.97842.23
UPV Train0.99131.95
Test0.96902.74
WA Train0.99591.70
Test0.98952.51
Table 6. Feature importance (RF model).
Order Features
CSTSUPVWA
1Age0.490RCA0.526RCA0.518Age0.638
2RCA0.324PPF0.321PPF0.315PPF0.192
3PPF0.186Age0.153Age0.168RCA0.171
Table 7. Comparison between performance indices of RSM and RF model.
CSTSUPVWA
RSMRFRSMRFRSMRFRSMRF
R20.98030.99550.92340.98100.95690.99130.99430.9959
MAPE (%)2.771.463.552.013.161.951.911.7
Table 8. R2 values for CS models.
ModelRFGradient
Boosting
Machine [40]
Stacked
Ensemble
Learning [40]
XGBoost [27]M5P [27]
R20.98660.989610.954430.948540.8949
Table 9. MAPE values for CS models.
ModelRFGradient
Boosting
Machine [40]
Stacked
Ensemble
Learning [40]
XGBoost [27]M5P [27]
MAPE (%)2.535.491045.508876.4532812.3862
Table 10. R2 values for TS models.
ModelRFGradient
Boosting
Machine [40]
Stacked
Ensemble
Learning [40]
ANN [33]GEP [33]Bagging Model [33]
R20.97840.969470.966190.8630.88060.9513
Table 11. MAPE values for TS models.
ModelRFGradient
Boosting
Machine [40]
Stacked
Ensemble
Learning [40]
MAPE (%)2.235.716916.22232
Disclaimer/Publisher’s Note: The statements, opinions and data contained in all publications are solely those of the individual author(s) and contributor(s) and not of MDPI and/or the editor(s). MDPI and/or the editor(s) disclaim responsibility for any injury to people or property resulting from any ideas, methods, instructions or products referred to in the content.