Article

Experimental Study on the Seismic Behavior of CFST Self-Centering Rocking Bridge Piers

1
Sichuan Road & Bridge Group Co., Ltd., Chengdu 610041, China
2
Department of Bridge Engineering, Tongji University, Shanghai 200092, China
*
Authors to whom correspondence should be addressed.
Buildings 2025, 15(2), 267; https://doi.org/10.3390/buildings15020267
Submission received: 19 December 2024 / Revised: 8 January 2025 / Accepted: 10 January 2025 / Published: 17 January 2025

Abstract

Compared to conventional reinforced concrete (RC) piers, self-centering rocking piers exhibit better seismic resilience and sustain minor damage. However, their construction typically relies on prefabrication. Moving large, prefabricated components can be challenging in mountainous areas with limited transportation access. Therefore, using concrete-filled steel tube (CFST) piers is a practical alternative. The steel tube both serves as a construction permanent formwork and enhances the compressive performance of concrete through confinement effects. To apply CFST self-centering rocking piers in mountainous regions with high seismic intensity, a fast construction system was designed and a 1:4 scale specimen was developed for testing. Lateral cyclic loading tests revealed that the specimen exhibited good deformation and self-centering capabilities, with a residual drift ratio of only 0.17% at a drift ratio of 7.7%. Most of the horizontal displacement was contributed through a rocking gap opening, resulting in minimal damage to the pier itself. The damage was concentrated primarily in the energy-dissipating rebars, while the prestress strands remained elastic, though prestress loss was observed.

1. Introduction

Reinforced concrete (RC) piers are one of the most widely used piers in bridge engineering [1]. However, if the ductility is insufficient, RC piers are prone to shear failure during strong earthquakes, making them difficult to repair and leading to significant economic losses [2,3,4]. To prevent this, ductility-based design principles are commonly applied in their design [5]. Concrete-filled steel tube (CFST) piers are also an example of this approach [6]. Compared to conventional RC piers, CFST piers offer a higher strength, ductility, and energy dissipation capacity [7].
Although bridge piers designed for ductility are less likely to experience shear failure, they may suffer significant residual deformation if subjected to earthquakes exceeding the design limit, making them challenging to repair [8]. This issue also exists in CFST piers, which are types of energy dissipation structures [9]. In recent years, a new concept of design principle, seismic resilience-based design, has been gaining traction [10]. Its goal is to enable engineers to design structures that can maintain functionality even after strong earthquakes. This concept is especially suited for critical structures where a loss of function could result in severe consequences, such as hospitals, nuclear power plants, schools, and crucial bridges [11,12,13,14]. A seismic resilience-based design can be achieved through several approaches, including direct and indirect methods. Conventional ductility-based piers often experience significant residual displacement after strong earthquakes. One direct method to reduce this residual displacement is to apply prestressing steel strands to piers, which use the prestress to pull piers back from earthquake forces [15,16,17,18,19,20]. Another option is to incorporate unbonded steel bars in the plastic hinge zones to limit plastic strain [21,22,23,24]. Alternatively, steel bars can be replaced with shape memory alloy (SMA) bars that leverage the superelastic property of SMA to minimize residual displacement [25,26,27,28,29,30].
The indirect methods to achieve a seismic resilience-based design include replacing conventional concrete in the plastic hinge zones with ultra-high-performance concrete (UHPC) [31,32,33,34] or engineered cementitious composites (ECC) [35,36,37,38,39] to prevent longitudinal rebar buckling and reduce plastic deformation. Replaceable precast segments [40,41,42,43] or external energy dissipation devices [44,45,46,47,48] can also decrease post-earthquake recovery time and enhance seismic resilience.
During design stages, practical construction costs and feasibility must be considered to accelerate the engineering implementation of seismic resilient piers in mountainous regions with high seismic intensity in western China, especially in Sichuan province. Thus, the unbonded prestressing steel strands are adopted as the self-centering member, and the energy-dissipating member consists of unbonded bars placed at the potential plastic hinge regions of the proposed pier. However, most of the self-centering rocking piers presented in recent studies are either entirely or segmentally precast [49,50,51]. Still, the limited field space in mountainous areas with steep slopes makes setting up a precast yard costly.
This study proposed steel tubes as permanent formwork for self-centering rocking bridge piers, enabling a cast-in-place construction better suited to mountainous terrain. A fast construction system was also designed to improve construction speed and accuracy for the energy dissipation bars, prestressing strands, and steel tube formwork. Moreover, one specimen, with a scale ratio of 1:4, was designed and constructed to understand the seismic behavior of CFST self-centering rocking bridge piers.

2. Experimental Program

2.1. Design of the Specimen

The specimen was scaled from pier #1, with a scale ratio of 1:4, of Wudongde interchange #3 bridge in a mountainous area of Sichuan province, China. This bridge is an important hub of the expressway between Huili County and Luquan County. The specimen’s section size, reinforcement, and pier length were fully designed as the original bridge pier, which can present the main mechanical performance of the original bridge pier.
The main parts of the specimen consist of the base, the rocking plate, the shear key, the rocking pier, the unbonded prestress strands, and the energy dissipation unbonded rebars, as shown in Figure 1. In this experiment, all steel parts except the rocking plate and prestress anchorage plates were made of 3 mm thick Q355 steel plates [52]. All rebars were made of HRB400E [53], and the concrete cast in the pier was C50 [54] type. Table 1 shows the mechanical property details of rebars, strands, and steel plates. The 150 mm cube block [54] had the average compressive strength of C50 concrete which was 48.5 MPa.
The base was designed as a reinforced concrete beam with a cross-section of 700 mm × 500 mm and a length of 1400 mm. The reinforcement details of the base are shown in Table 2. To prevent damage to the base due to pier rocking, a 30 mm thick Q355 steel plate was placed on top of it.
The 58 mm diameter hole in the center of the thick rocking plate was designed to constrain the rocking pier’s lateral displacement and only allow the shear key to rotate. It was also designed to locate the pier steel tube formwork quickly. The steel pipe shear key is crucial for transferring shear force from the rocking pier to the base. It is 40 mm long and has an outer diameter of 50 mm.
The steel circular tube of the rocking pier is 3 mm thick, with a 325 mm outer diameter, and 1175 mm long. Inside the rocking pier were four D15.2 prestress strands covered with D17 PVC pipes to be unbonded. In the bottom 250 mm high region of the rocking pier, six D8 energy dissipation rebars, each covered with a D11 PVC pipe, were installed unboundedly. The D8 rebars in the other region were still designated to be bonded with concrete.

2.2. Fast Construction Design

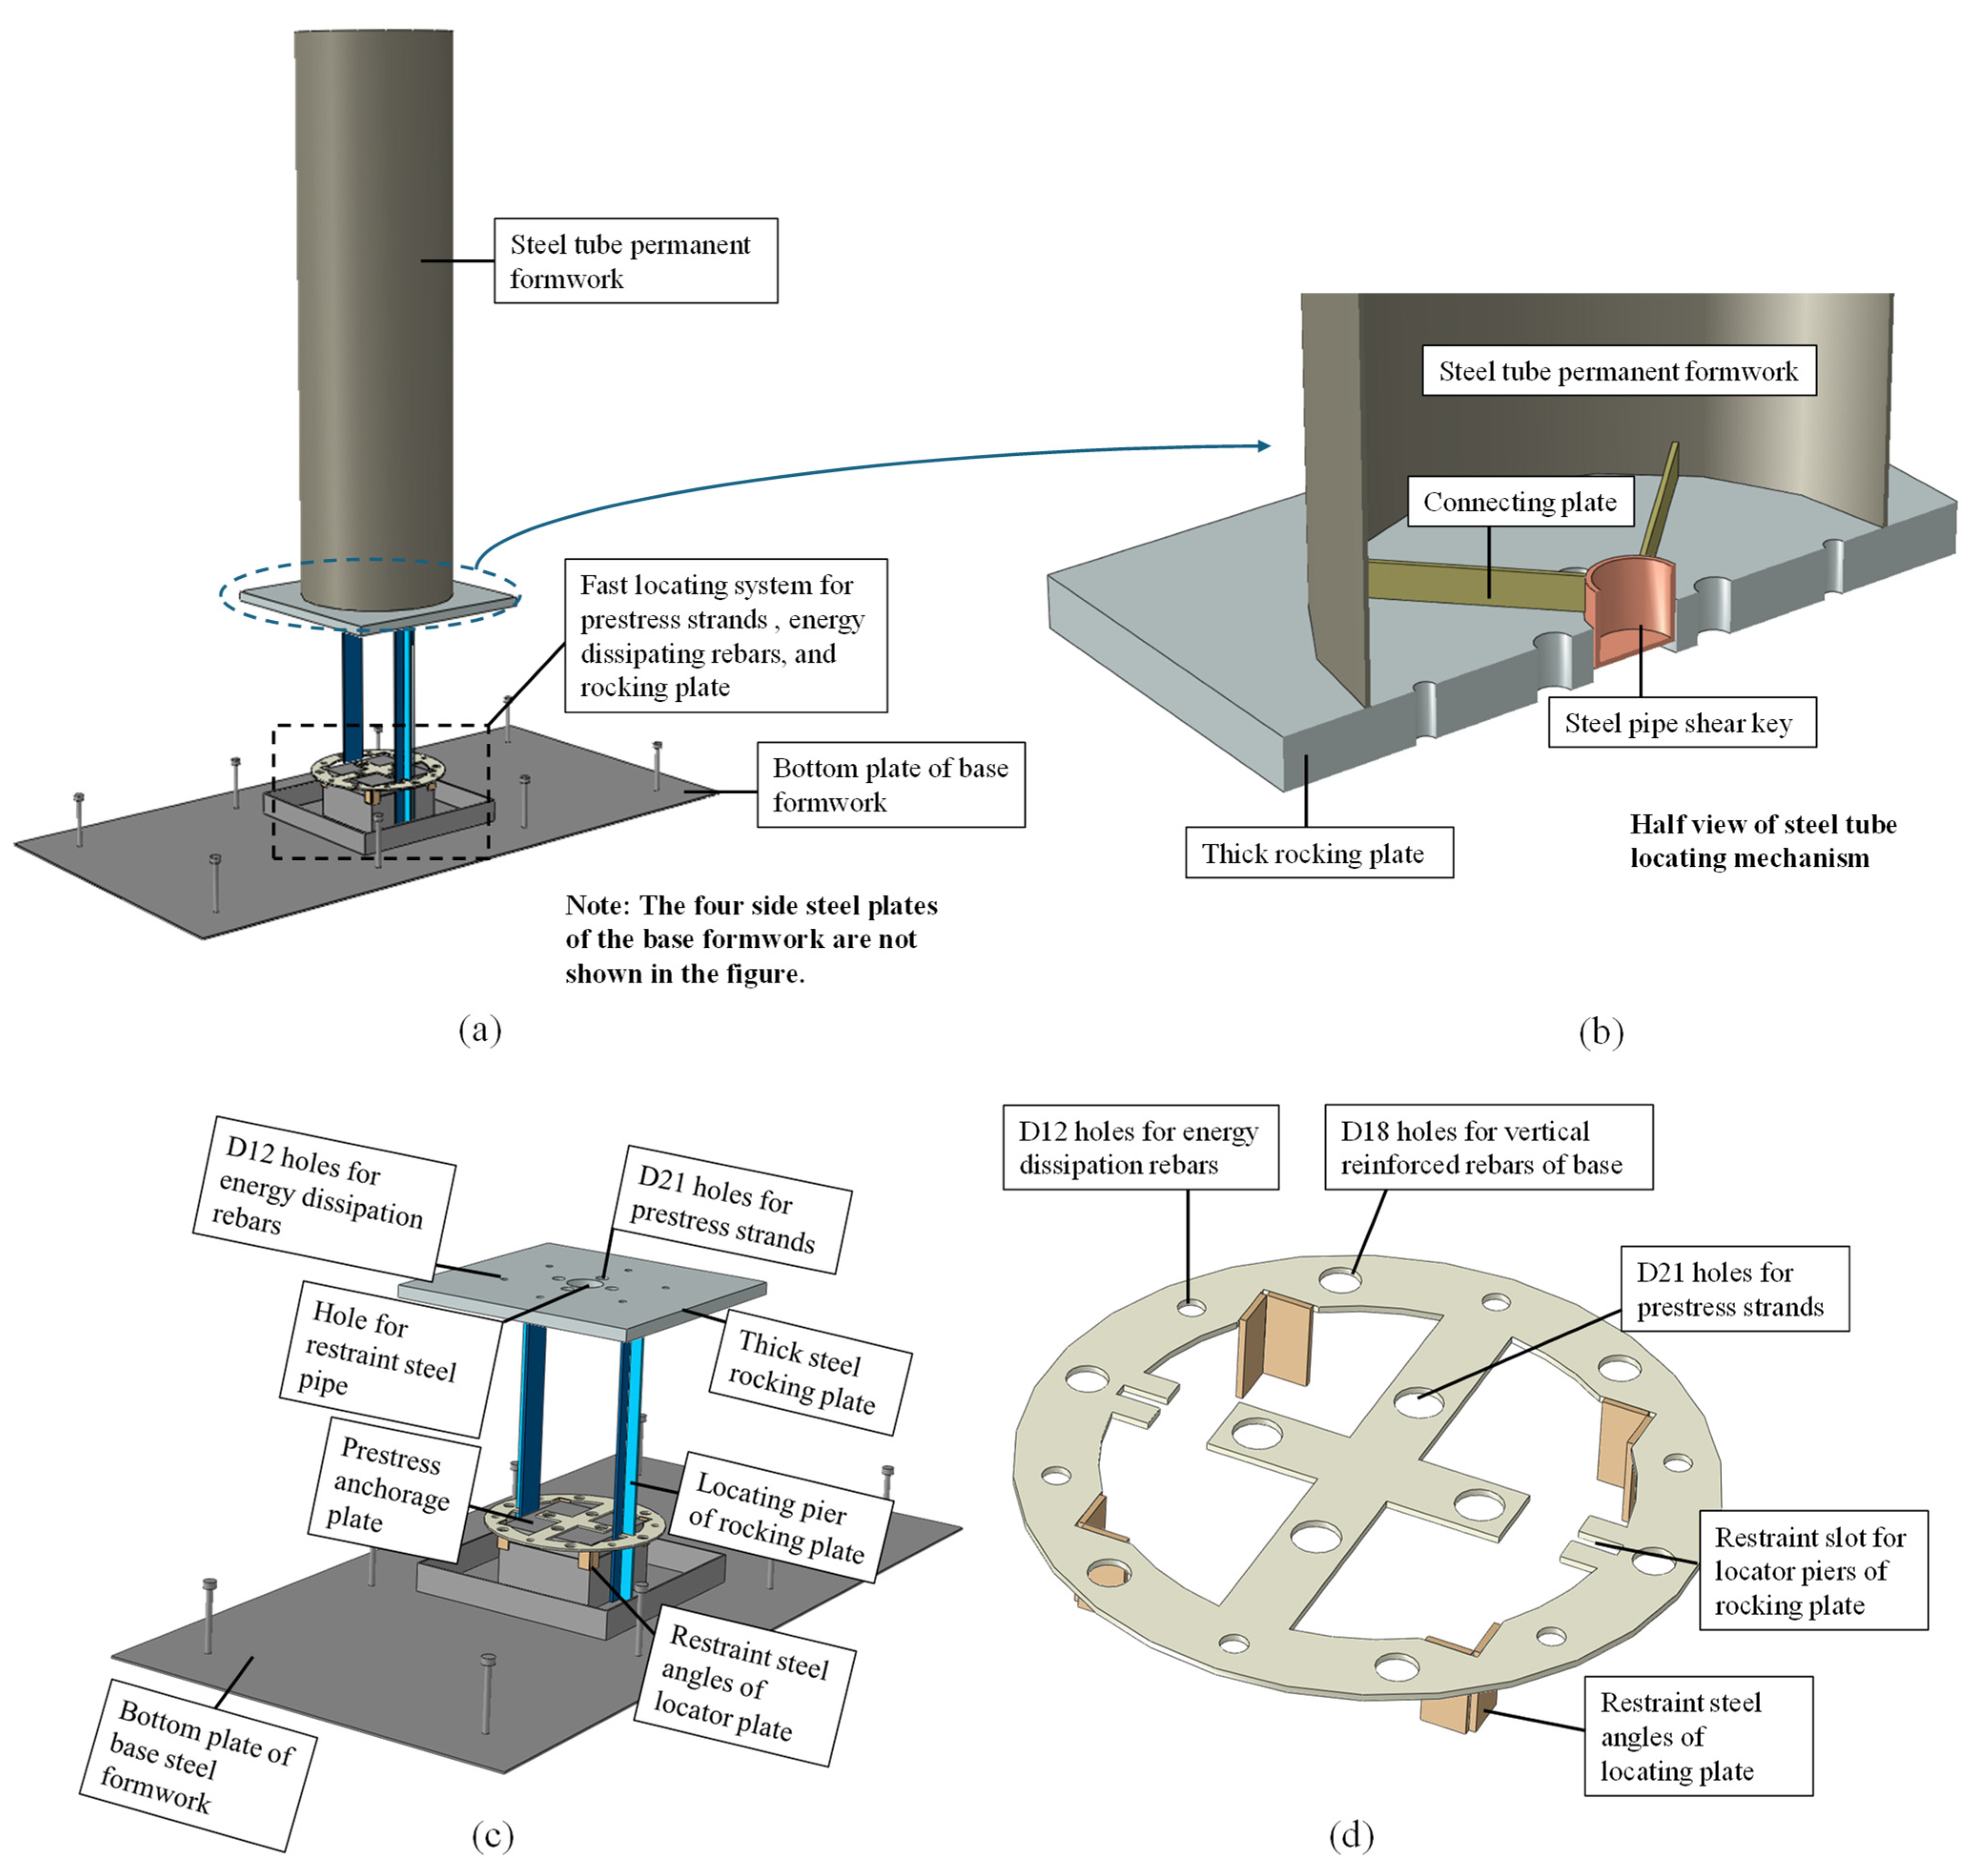
When bridge pier construction is set in mountainous regions with steep slopes, installing formworks onsite is difficult. Also, fabricating bars and prestress strands takes much more time on site. The fast construction system was proposed to accelerate the construction process of the cast-in-place self-centering rocking bridge piers, as shown in Figure 2a.
The steel pipe shear key, shown in Figure 2b, was designed to locate the steel tube formwork quickly and accurately at the construction site. Engineers can install the steel tube formwork quickly by inserting the shear key into the hole in the center of the rocking plate. The connecting plate transfers lateral force between the steel tube and the shear key.
The accurate installation of energy dissipation rebars and prestress strands is crucial for the seismic performance of self-centering rocking piers. The design details are shown in Figure 2c. This design consists of the prestress anchorage plate, the locating plate, and the locating pier of the rocking plate. The locating plate ensures the energy dissipation rebars and prestress strands are placed correctly. There are four restraint steel angles on the locating plate to install the locating plate on the prestress anchorage plate, as shown in Figure 2d.
Using the locating piers below the rocking plate ensures that the energy dissipation rebar holes and prestress strand holes in the rocking plate are on the same vertical lines as the corresponding holes in the locating plate, as shown in Figure 2c.

2.3. Construction of the Specimen

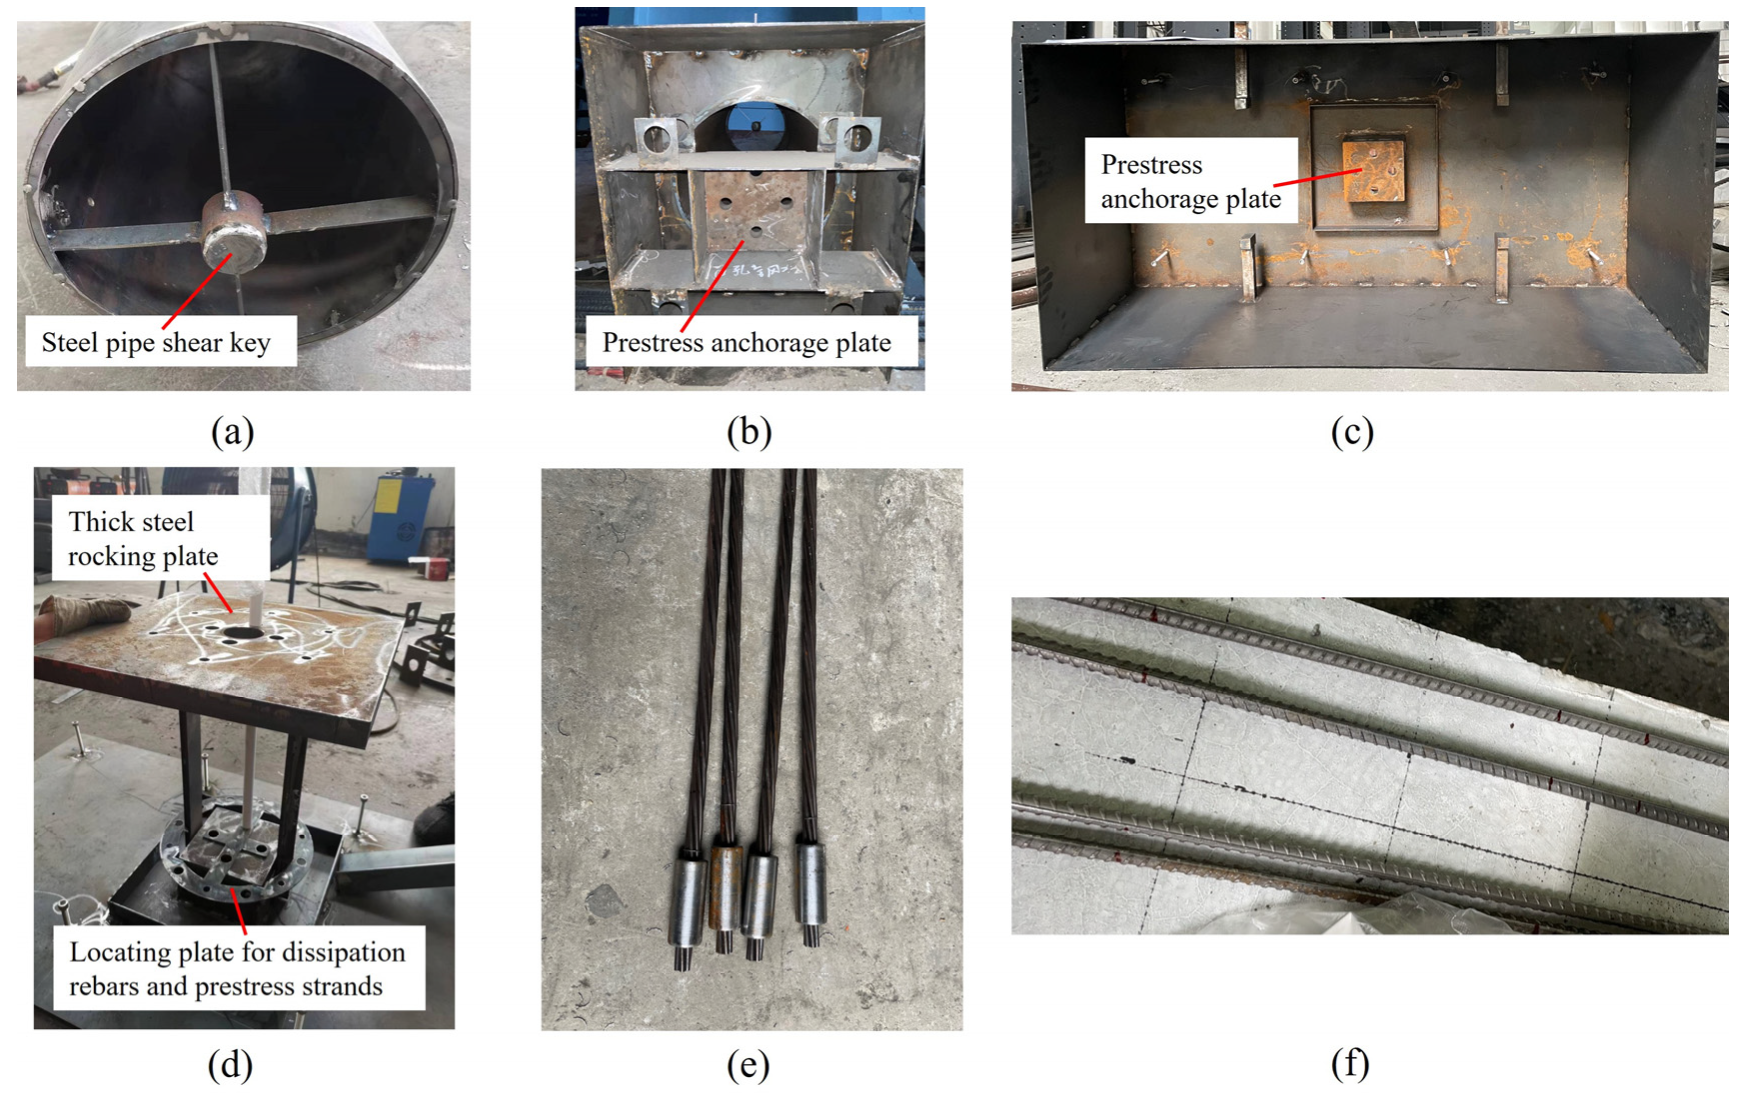
Before construction, each part was produced in a steel factory and transported to the structural laboratory. Figure 3 shows the details of each part and the pre-installation of the fast construction system in a steel factory.
After all the materials and parts were ready, the construction process started. Figure 4 shows the construction flow of the specimen. In the first step, the prestress strands covered with PVC pipes were passed through the holes in the prestress anchorage plate at the base bottom, as shown in Figure 5a. Then, the locating plate was installed on top of the prestress anchorage plate. In the next step, the base reinforcement was installed, as shown in Figure 5a. After that, dissipation rebars were installed, and the locating piers of the rocking plate were inserted into the locating plate at the base bottom, as shown in Figure 5c. In the next step, the steel tube shear key was inserted into the hole in the rocky plate center, as shown in Figure 5d. Then, concrete was cast into the base and pier steel tube formworks, as shown in Figure 5e, f. After the concrete casting finished, the specimen was cured in the laboratory for 54 days before loading, as shown in Figure 5g.

2.4. Experimental Setup and Loading Protocol

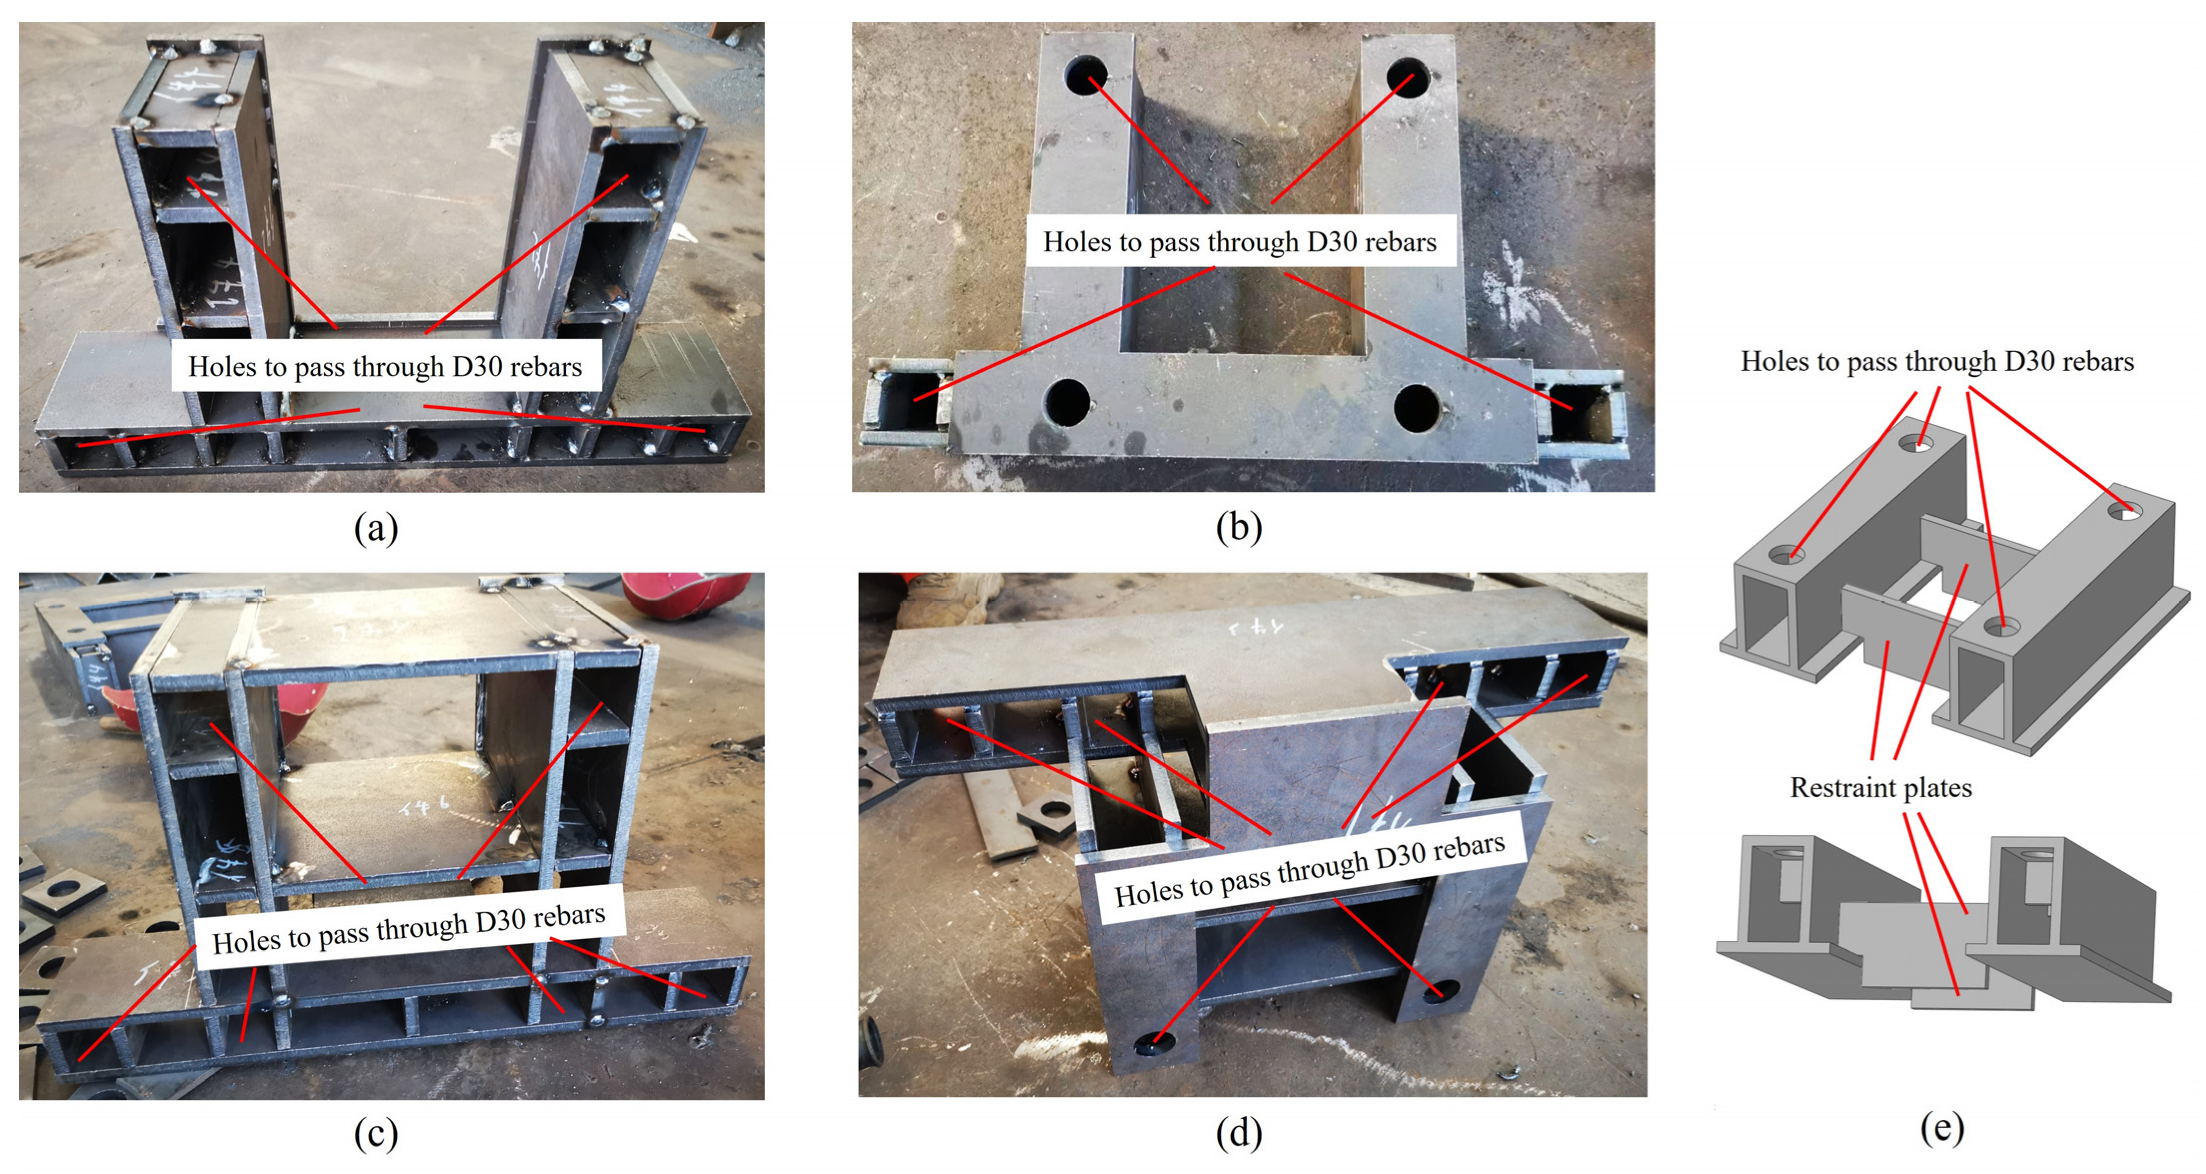
Figure 6 shows the experiment setup and installation of measuring devices. Two anchorage beams and two lateral hydraulic jacks anchored the base on the strong floor. The connecting plate A and the connecting plate B were designed to connect the horizontal actuator to the specimen loading cap. Six high-strength rebars, with a diameter of 30 mm, were passed through the holes in the connecting plates. Figure 7 shows the details of the connecting plates and the constraint plate. The constraint plate was used to connect the vertical actuator to the specimen. To ensure no torsion or slip between the vertical actuator and the specimen, two high-strength rebars with a diameter of 30 mm were installed into the holes in the constraint plate, as shown in Figure 8e.
Figure 8 shows the process of installing the specimen onto the loading platform. The specimen was lifted by a crane and moved to the loading platform. Then, four prestress strands were tensioned to around 370 MPa. Table 3 shows the prestress details of the strands. The prestress strands out of the loading cap were cut to install the restraint plate and the vertical actuator. Then, the connecting and restraint plates were installed using several D30 high-strength rebars.
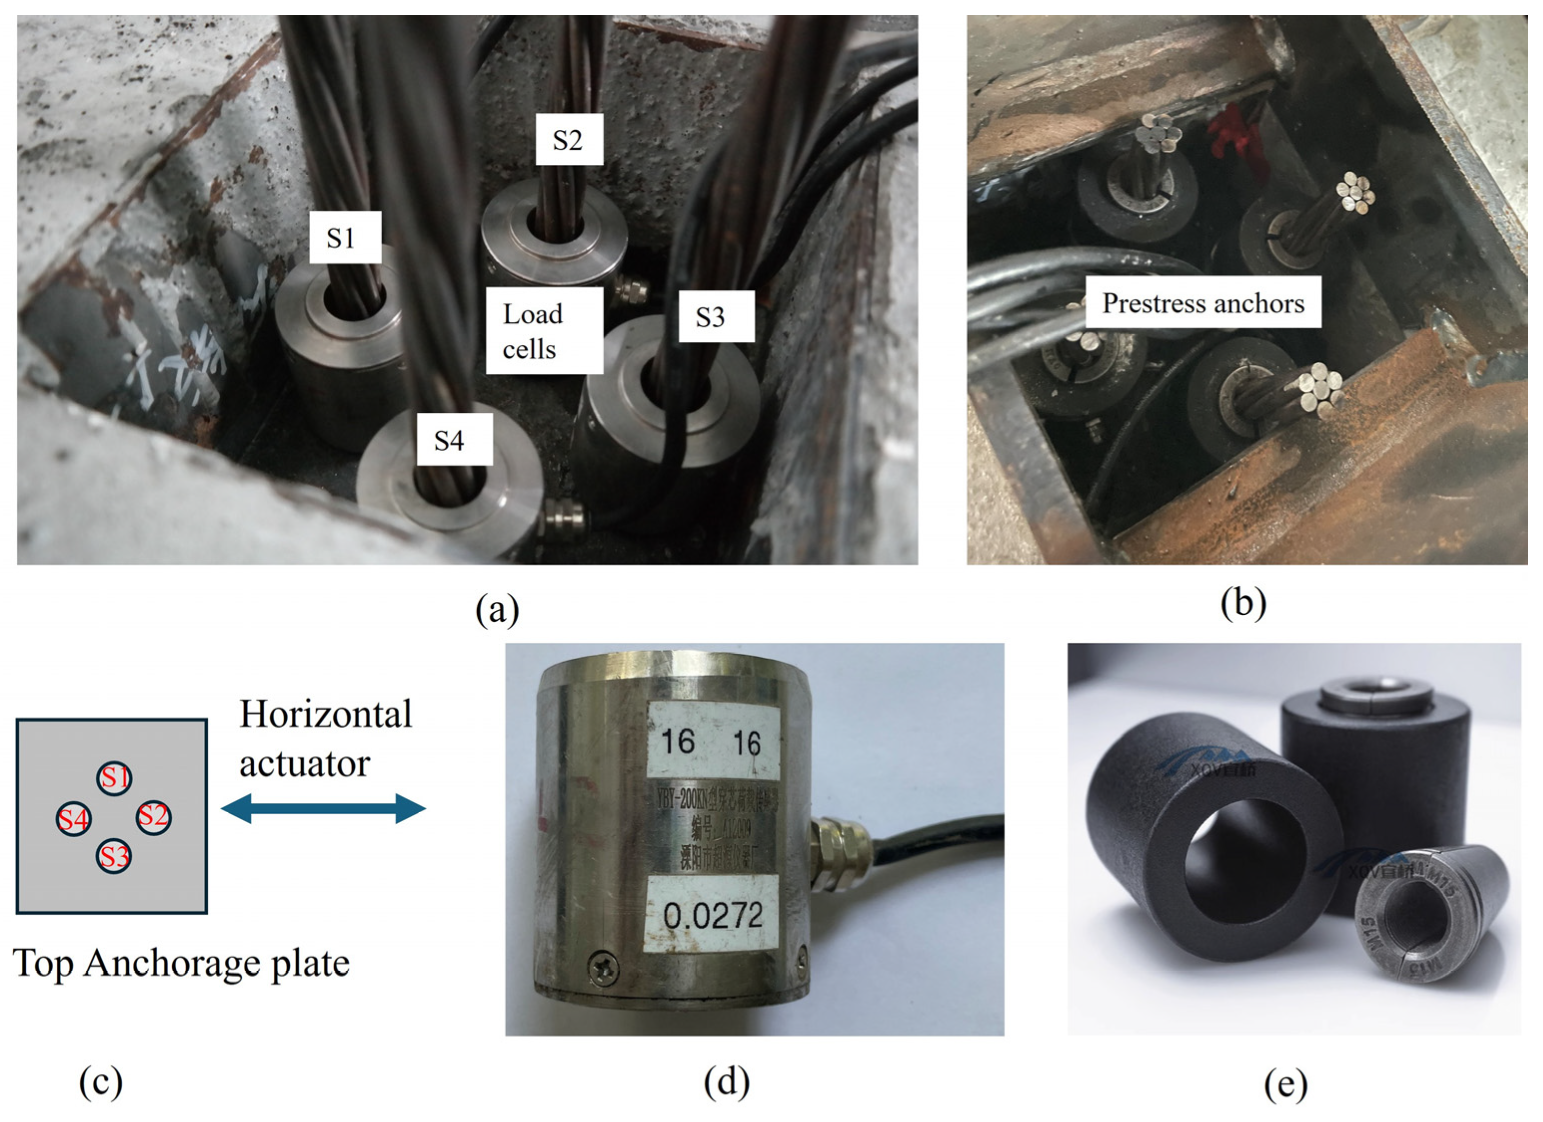
The experiment’s measuring objects consisted of the horizontal actuator load, horizontal displacement at the center of the loading cap, a gap opening at the bottom rocking interface, the tensile force of the prestressing strands, and the vertical strains of the steel tube. Figure 9 shows the details and the installation of four load cells and four anchors on the pier top.
The vertical actuator was set at a constant of 168.4 kN and was applied to the specimen before the horizontal displacement cyclic loading. The axial compression ratio was set at 0.14, including the contribution of the vertical load of 168.4 kN (ratio of 0.063) and the total prestress load of 207.81 kN (ratio of 0.077).
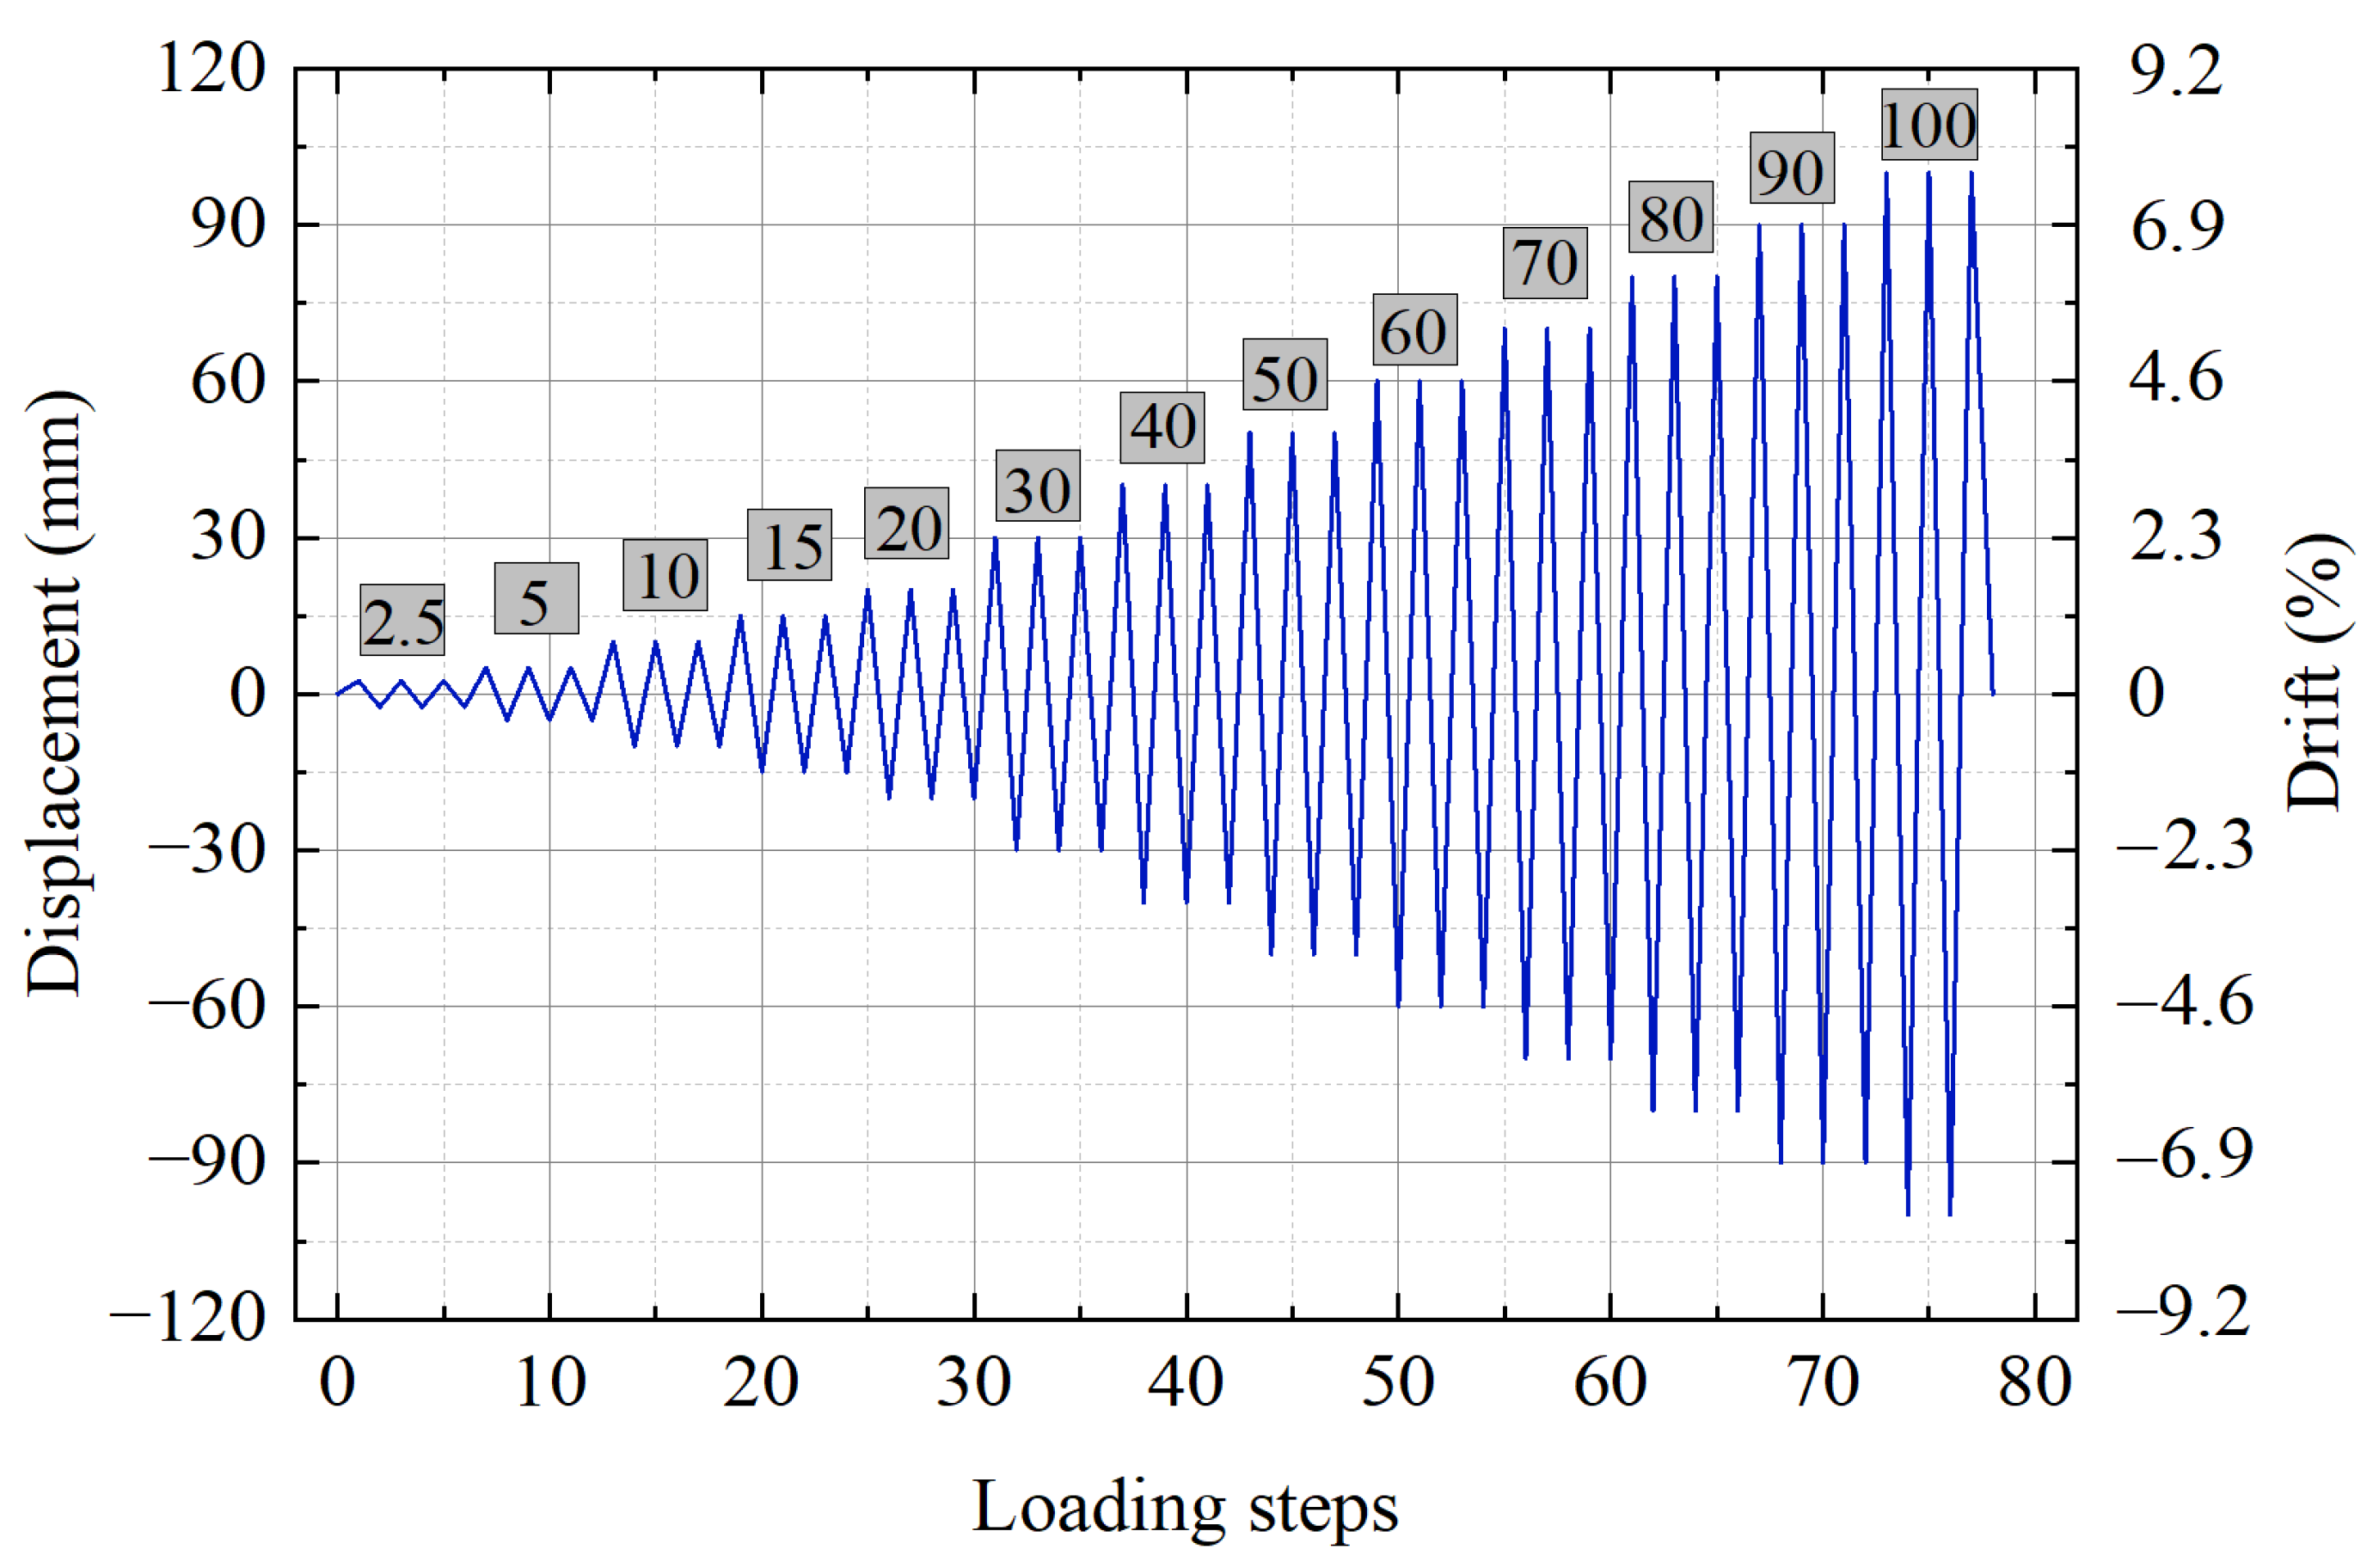
Figure 10 shows the lateral cyclic loading protocol. The lateral cyclic loading was applied by an actuator, which was controlled by displacement with a constant loading speed of 0.5 mm/s. For each level of displacement loading, it was set to repeat 3 times. The first level of displacement was set at 2.5 mm. Before the level of 15 mm, the level increment was 5 mm. After the level of 20 mm, the displacement level increased by 10 mm to 100 mm. Moreover, the vertical distance between the center of the loading cap and the pier bottom was 1300 mm.

3. Experimental Results and Discussion

3.1. Loading Process and Failure Mode

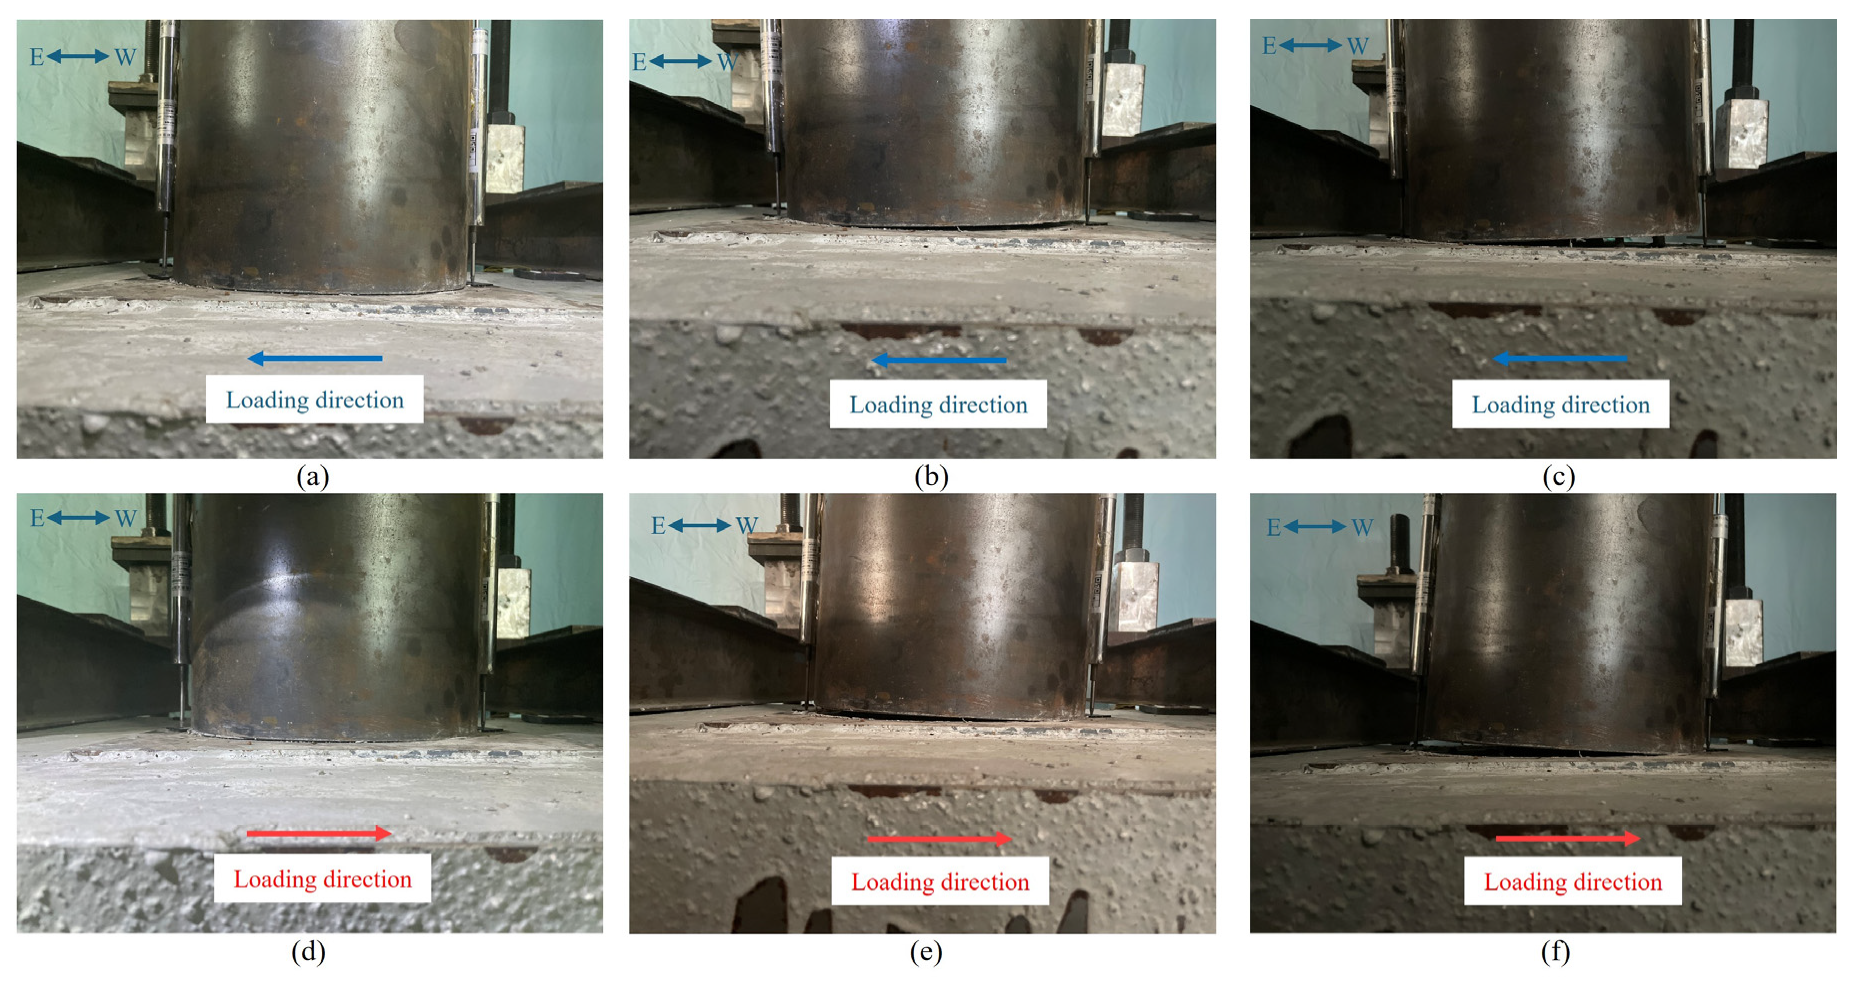
Figure 11 shows the pier rocking process as loading increases. Before the loading level of 15 mm, the rocking gap at the pier bottom was not noticeable. As the loading level increased, the rocking gap became increasingly wider.
Starting from the loading level of 60 mm, the buckling of the steel tube at the pier bottom became evident. The energy dissipation rebars were fractured several times during loading, and the fracturing sound was heard clearly. The rocking behavior was stable during the loading process, and there was no obvious torsion or slip.
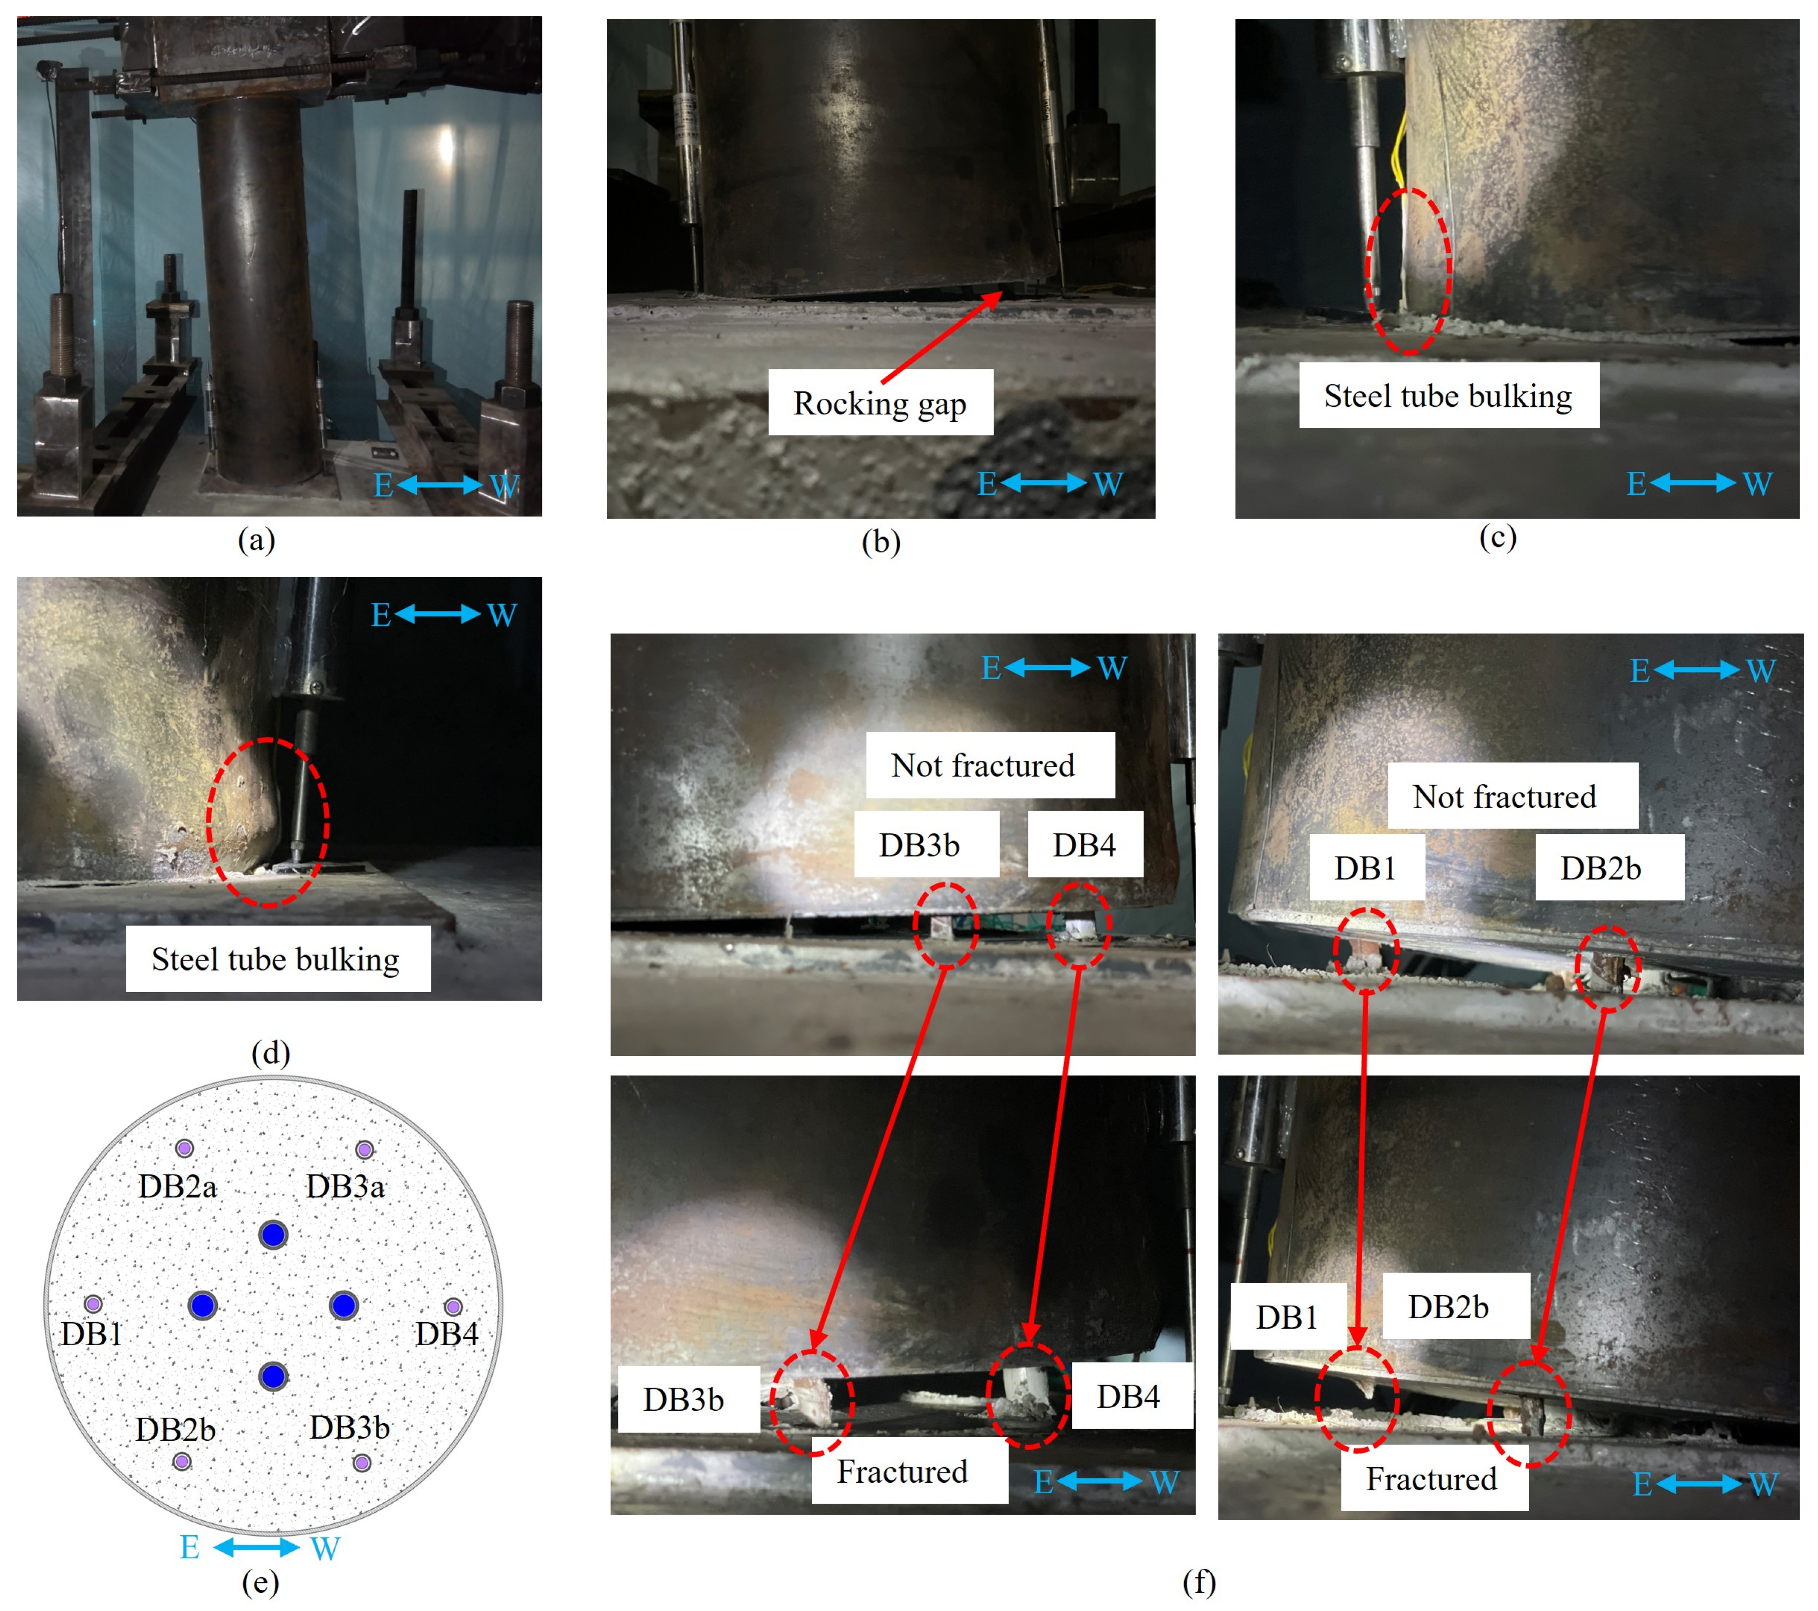
Figure 12 shows the failure mode of the specimen at the loading level of 100 mm. There was no obvious damage to the base or the rocking plate. Regarding the pier, all energy dissipation rebars were fractured during loading, as shown in Figure 12f. There was no noticeable concrete crushing or serious steel tube bulking after experiencing over a drift of 7.5%, as shown in Figure 12c,d.

3.2. Hysteresis Behavior

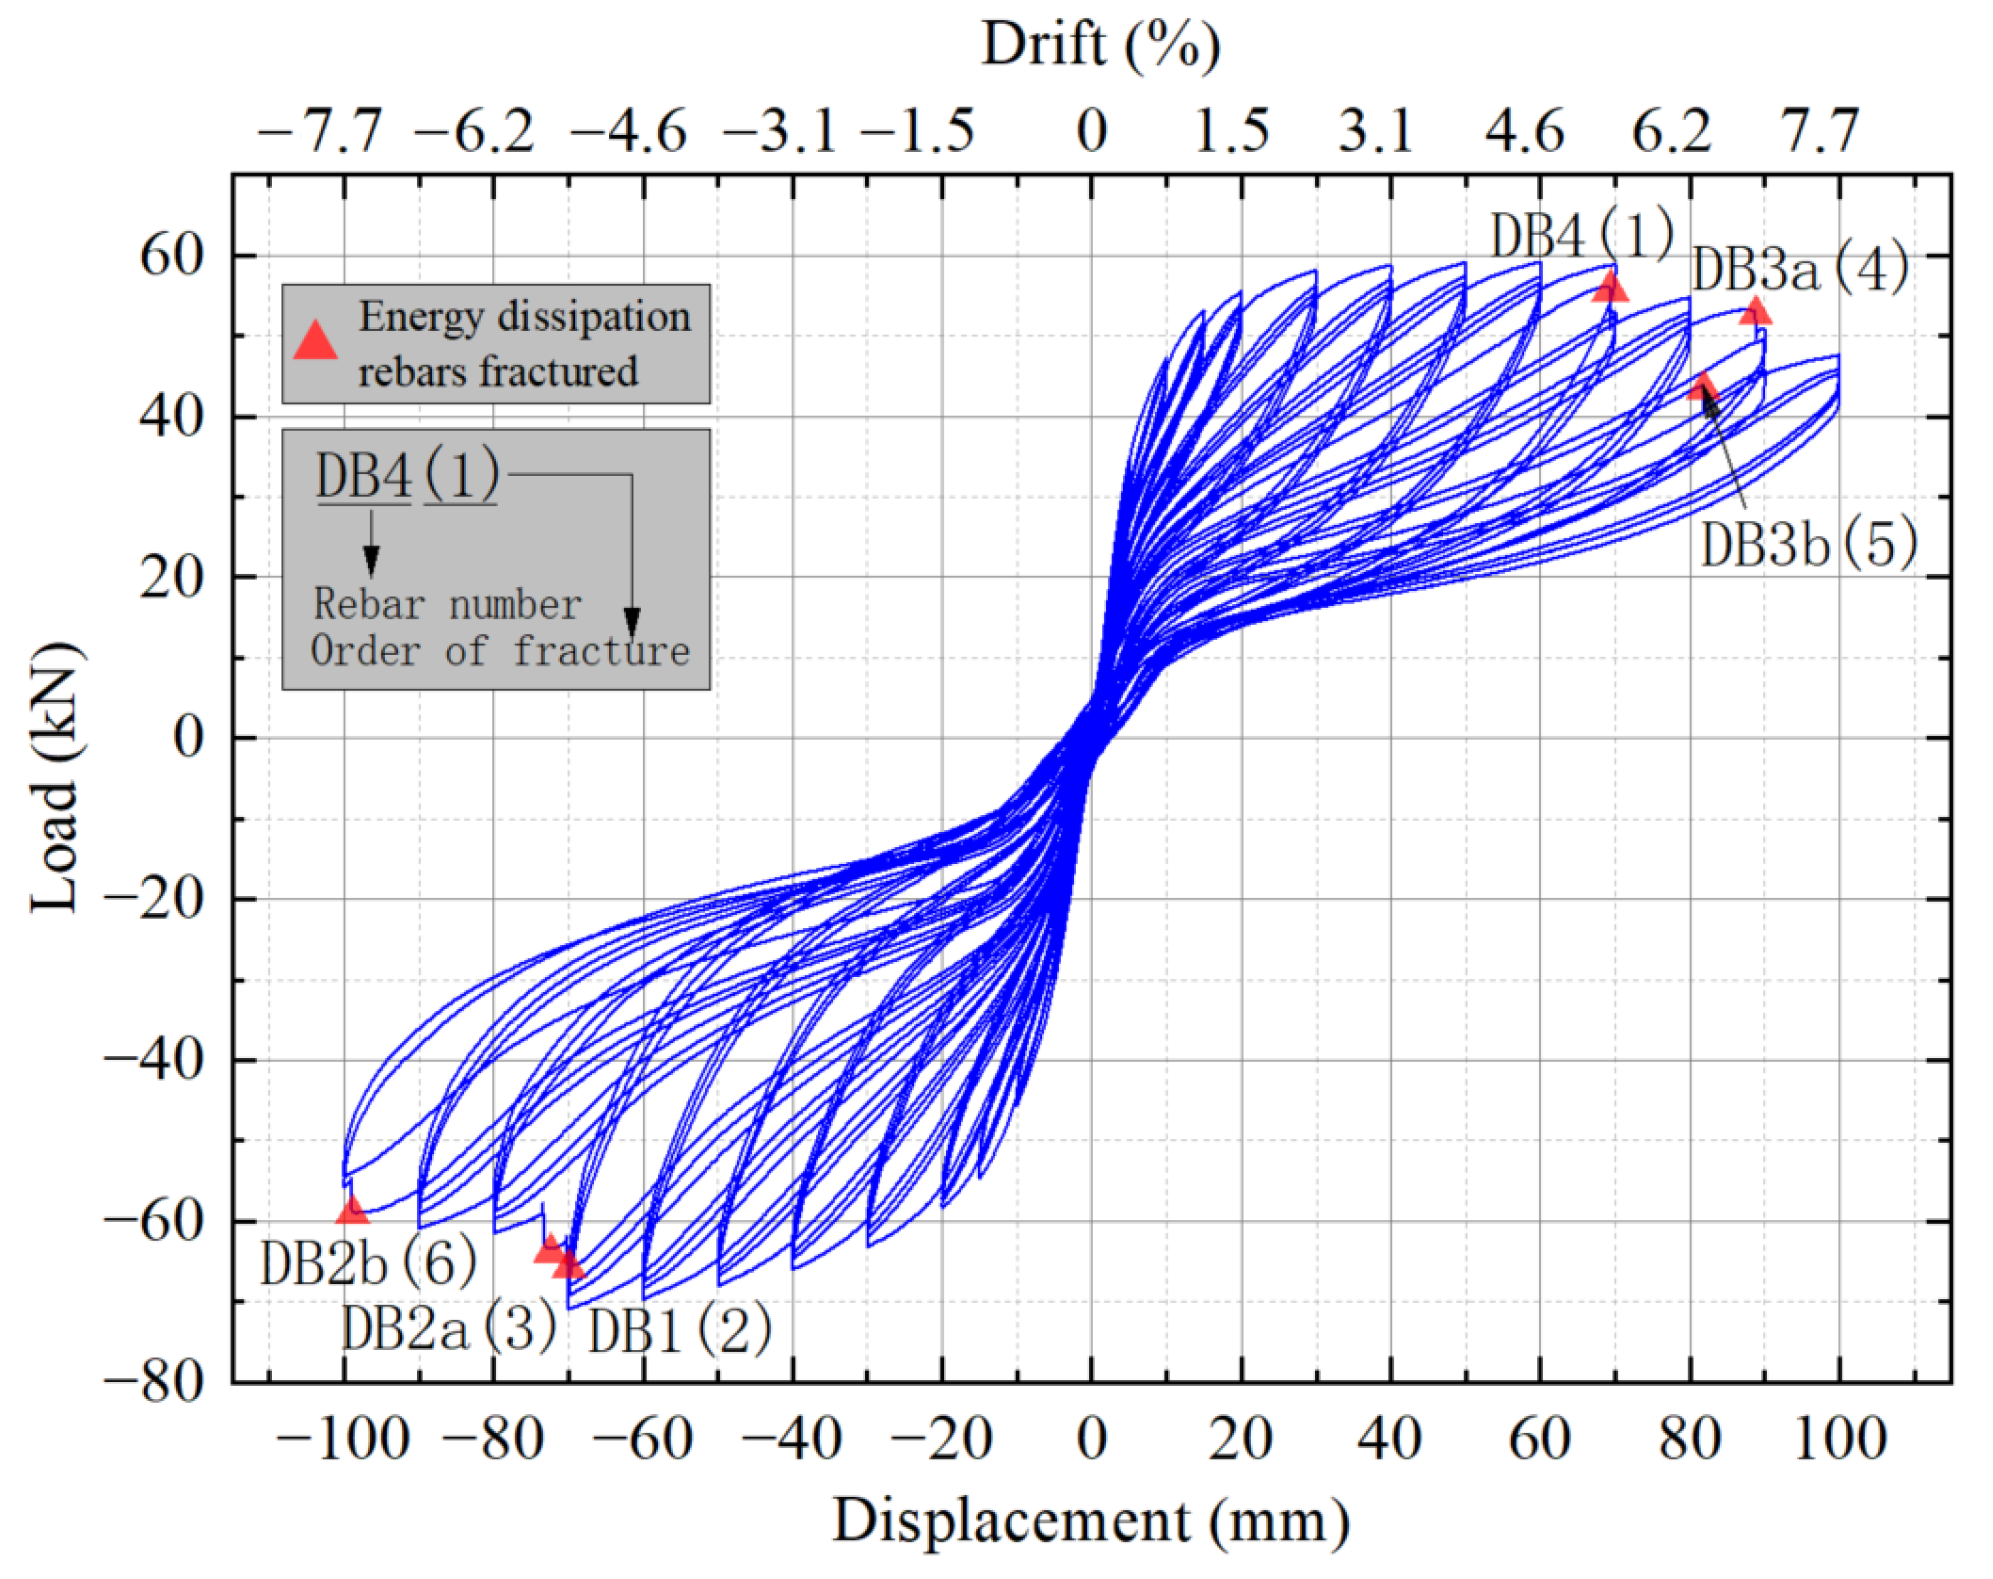
Figure 13 shows the load-displacement hysteresis curves of the specimen. The pier showed a very stable and obvious flag-shaped hysteresis behavior. Before reaching the 10 mm level, the mechanical behavior of the pier was almost linear. Starting from the 10 mm level, the pier behavior changed to nonlinear due to the yielding of the energy dissipation rebars.
During the nonlinear stage, the outermost energy dissipation rebar DB4 fractured first at the 60 mm level. Then, the outermost energy dissipation rebar DB1 fractured at roughly the 70 mm level. As loading proceeded, all of the energy dissipation rebars fractured. The specimen experienced a very stable post-yield stiffness behavior with positive tangent stiffness over a drift of 5.4% (70 mm level), as shown in Figure 14.
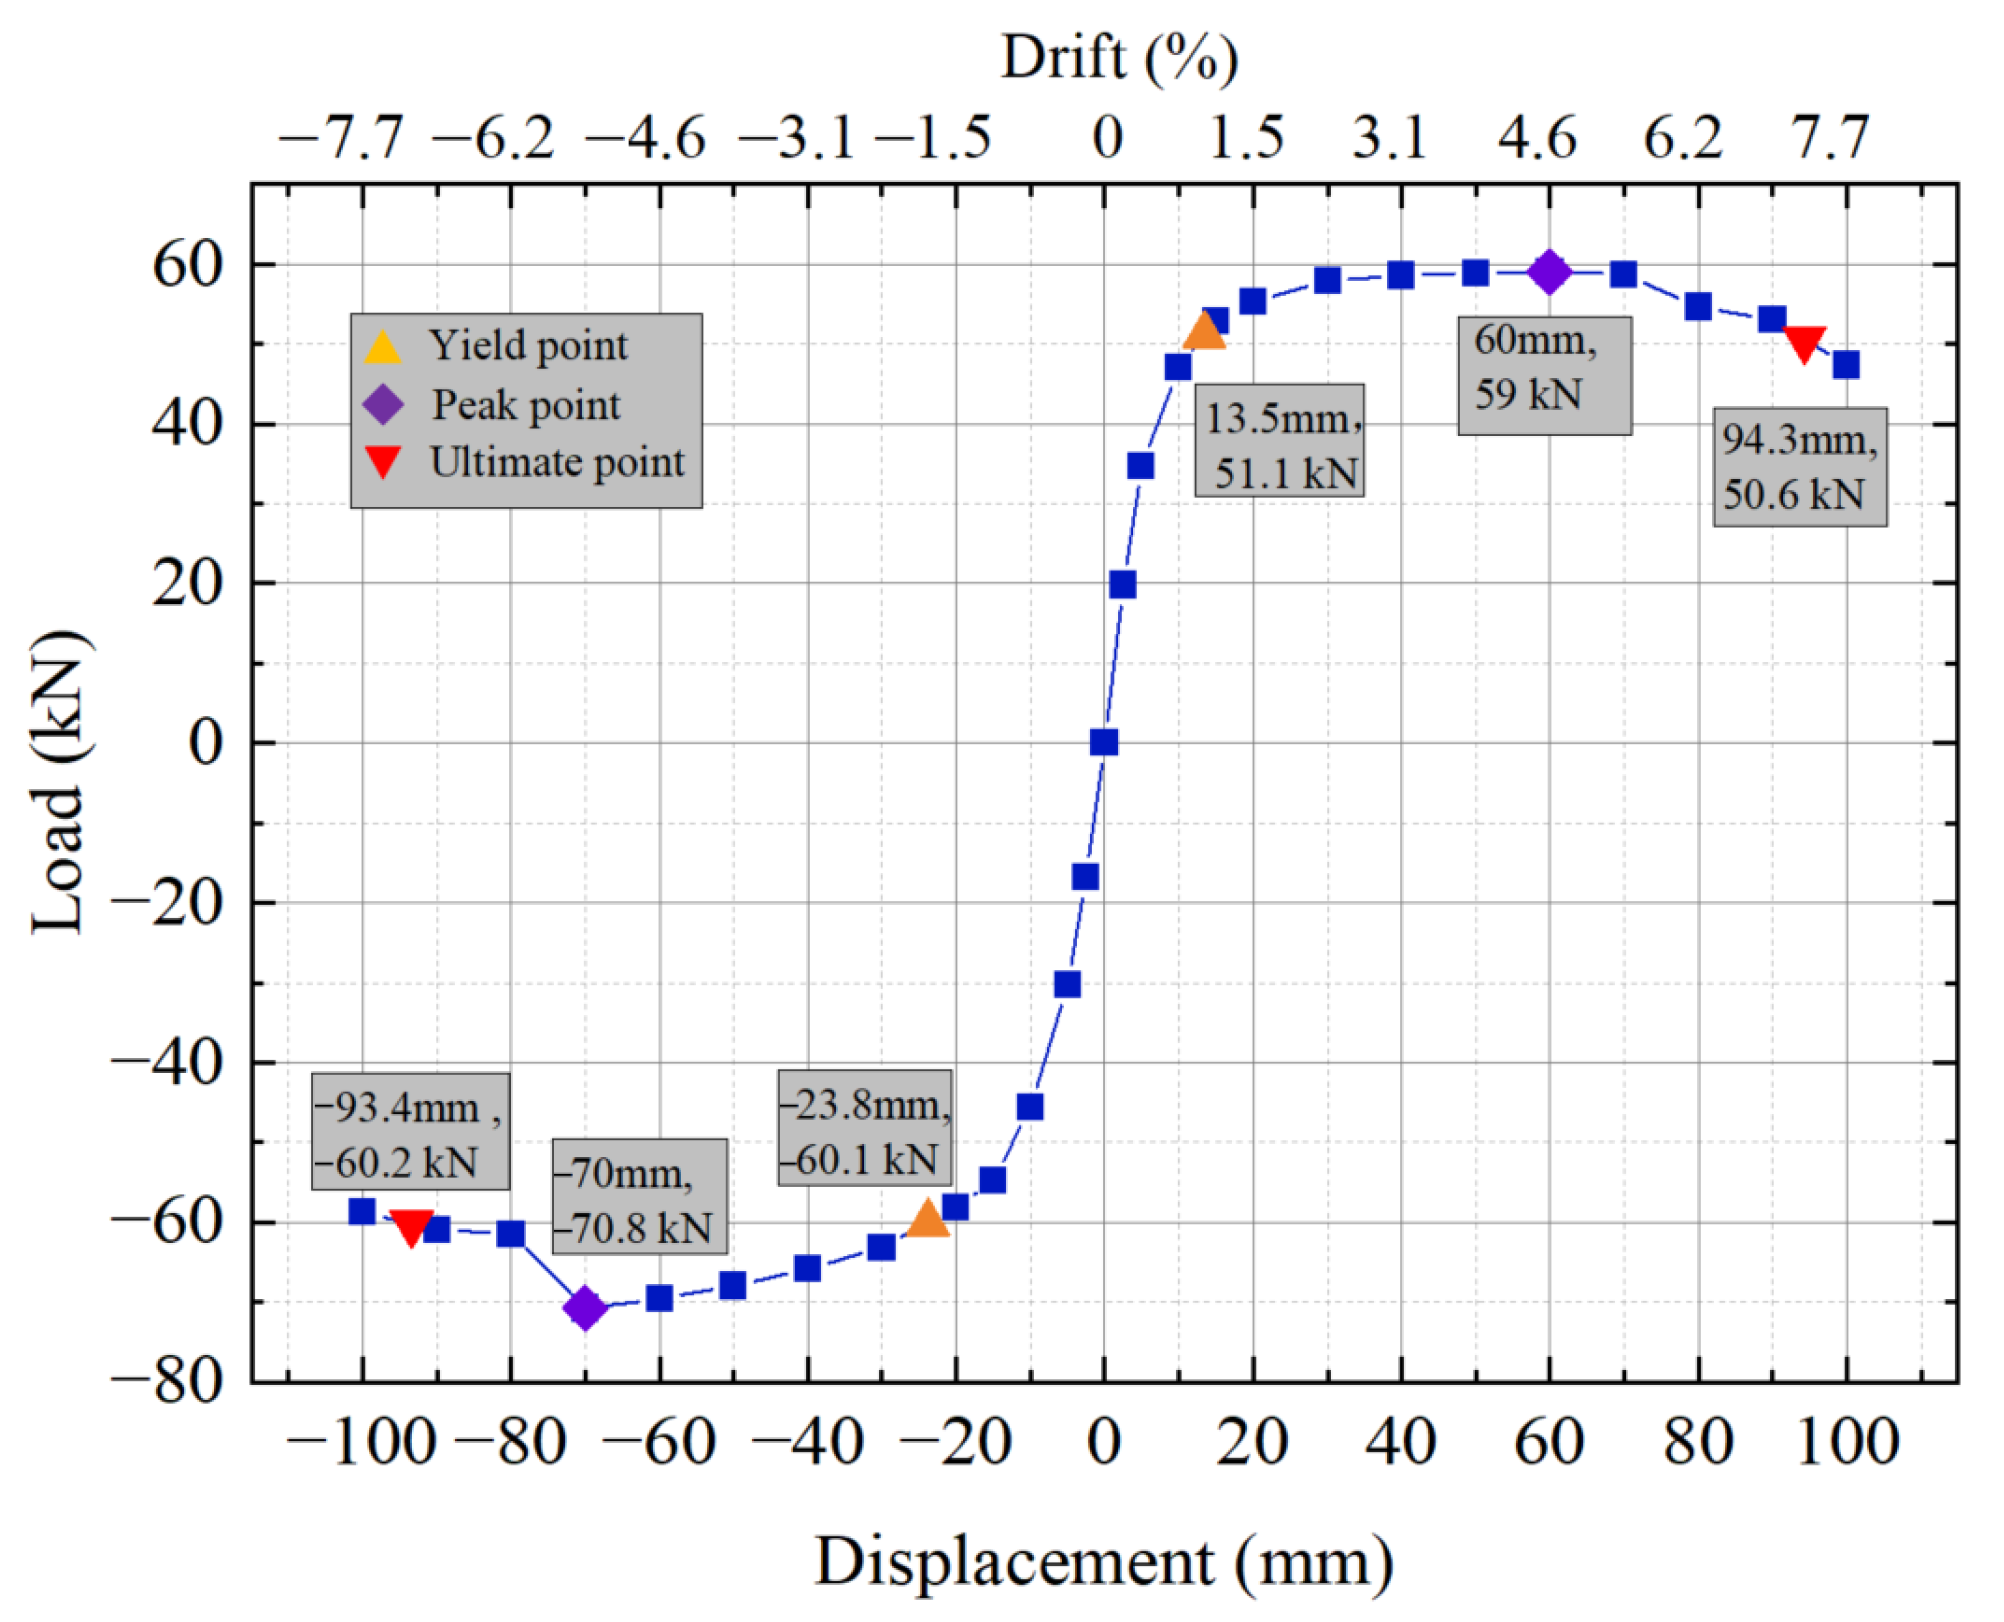
The energy dissipation rebars started to fracture at the 60 mm level, causing an instant lateral resistance reduction and energy dissipation deterioration. After all the energy dissipation rebars fractured, the lateral resistance decreased by 14.6% on average, when comparing the ultimate point with the peak point, as shown in Figure 15. The energy dissipation for each hoop decreased by 44% (Figure 16), when comparing the minimum values with the maximum values.
Figure 15 presents the backbone curve of the specimen. The key points on the diagram are the yield, peak, and ultimate points. The yield point was determined by the equivalent energy method [55]. The peak point was the point that had the maximum lateral resistance. The ultimate point was defined by the point at which the lateral resistance equals 85% of the peak resistance. The ductility coefficient was adopted to evaluate the deformation performance of the specimen, which is defined as the ratio of the ultimate displacement to the yield displacement. The ductility coefficient was 6.99 for positive loading and 3.92 for negative loading. The average ductility coefficient was 5.46.
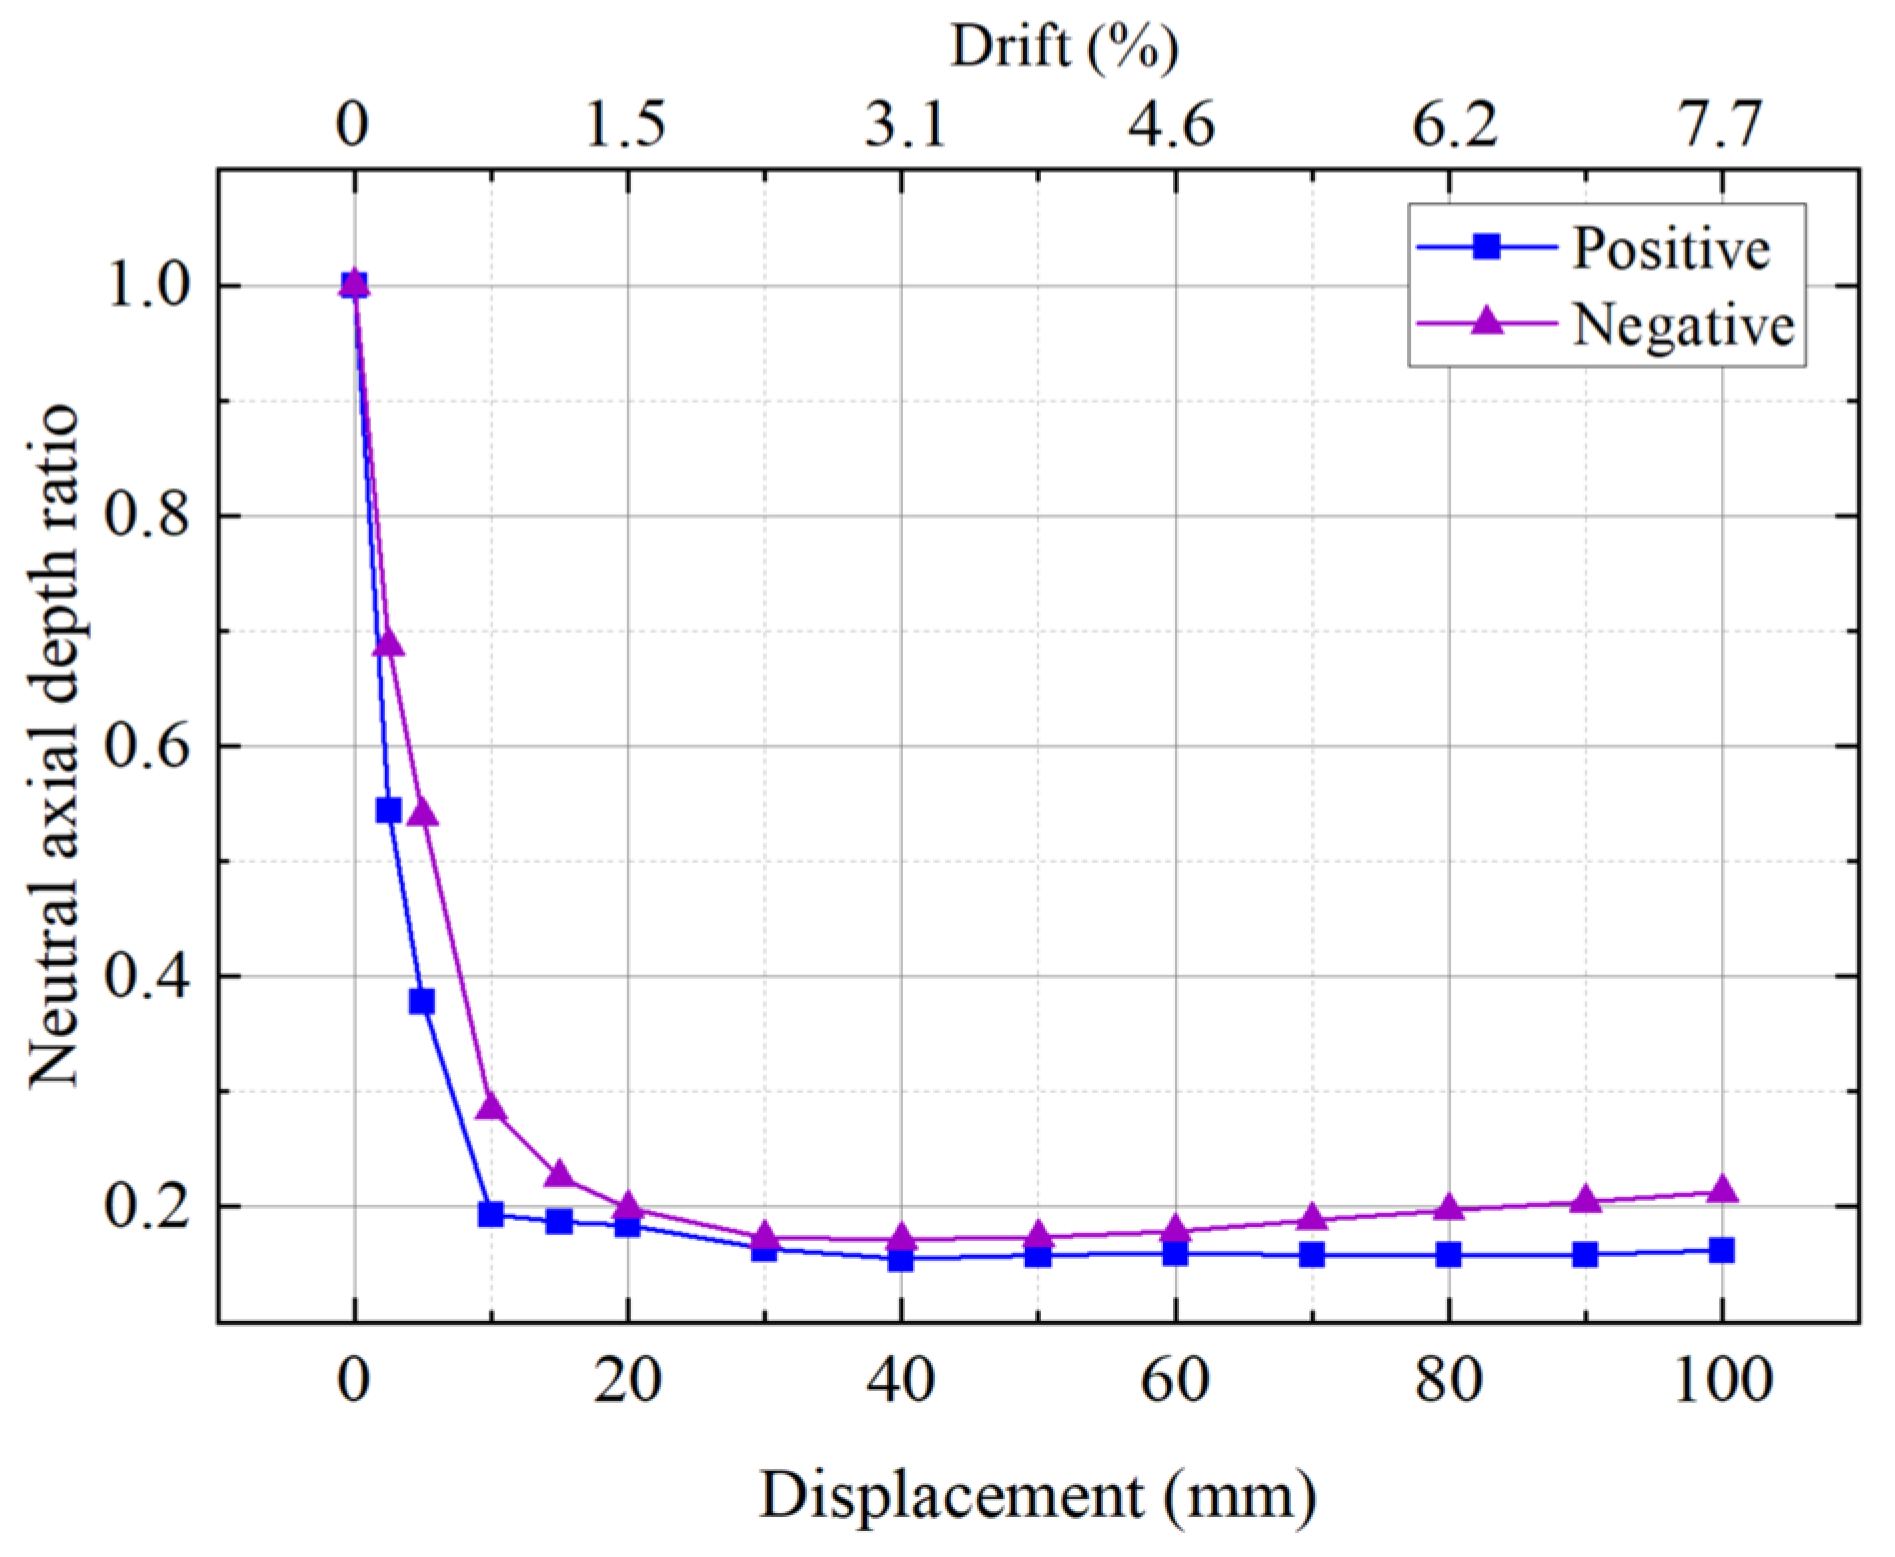
Figure 17 presents the neutral axial depth ratio curve. The neutral axial depth ratio was defined as the ratio of the neutral axial depth to the section depth. Before lateral loading, the pier bottom surface was in full contact with the rocking plate top surface. Thus, the neutral axial depth ratio was 1.0. As loading proceeded and the pier started rocking, the depth ratio dropped quickly to below 0.2 after the displacement levels of +10 mm and −20 mm, respectively. There is some difference between these two curves. The positive curve remains stable, and no significant reverse increase in the ratio was observed. However, after reaching a ratio of 0.17 at the −40 mm level for the negative curve, the ratio grows gradually.
This phenomenon occurred because, after the 40 mm negative loading, the buckling on the west side of the steel tube at the pier bottom was significantly more severe than on the east side, as shown in Figure 12c,d. The more severe the buckling, the greater the impact on compressive performance, requiring more compression area to balance the tensile force on the cross-section. Consequently, the ratio of the neutral axis height increased.
Residual displacement is one of the most important indicators for assessing the post-earthquake resilience of self-centering rocking piers. The Japanese bridge code started requiring a limitation of residual displacement to less than 1% of the bridge pier height after the Kobe earthquake [56]. To assess the post-earthquake resilience of the specimen, the residual displacement curve is plotted in Figure 18. As depicted by the curve, the residual displacement of the specimen increased gradually with the loading displacement. Upon reaching the final 100 mm level, the maximum residual displacement was approximately 2.2 mm, with a residual ratio of 0.17%, much smaller than the residual ratio limit specified in the Japanese bridge code. There was a sudden drop in the curve at 60 mm because of the small slide movement of the pier. The slide movement was due to a 4 mm gap between the shear key and the center hole in the thick rocking plate.

3.3. Curvature Distribution

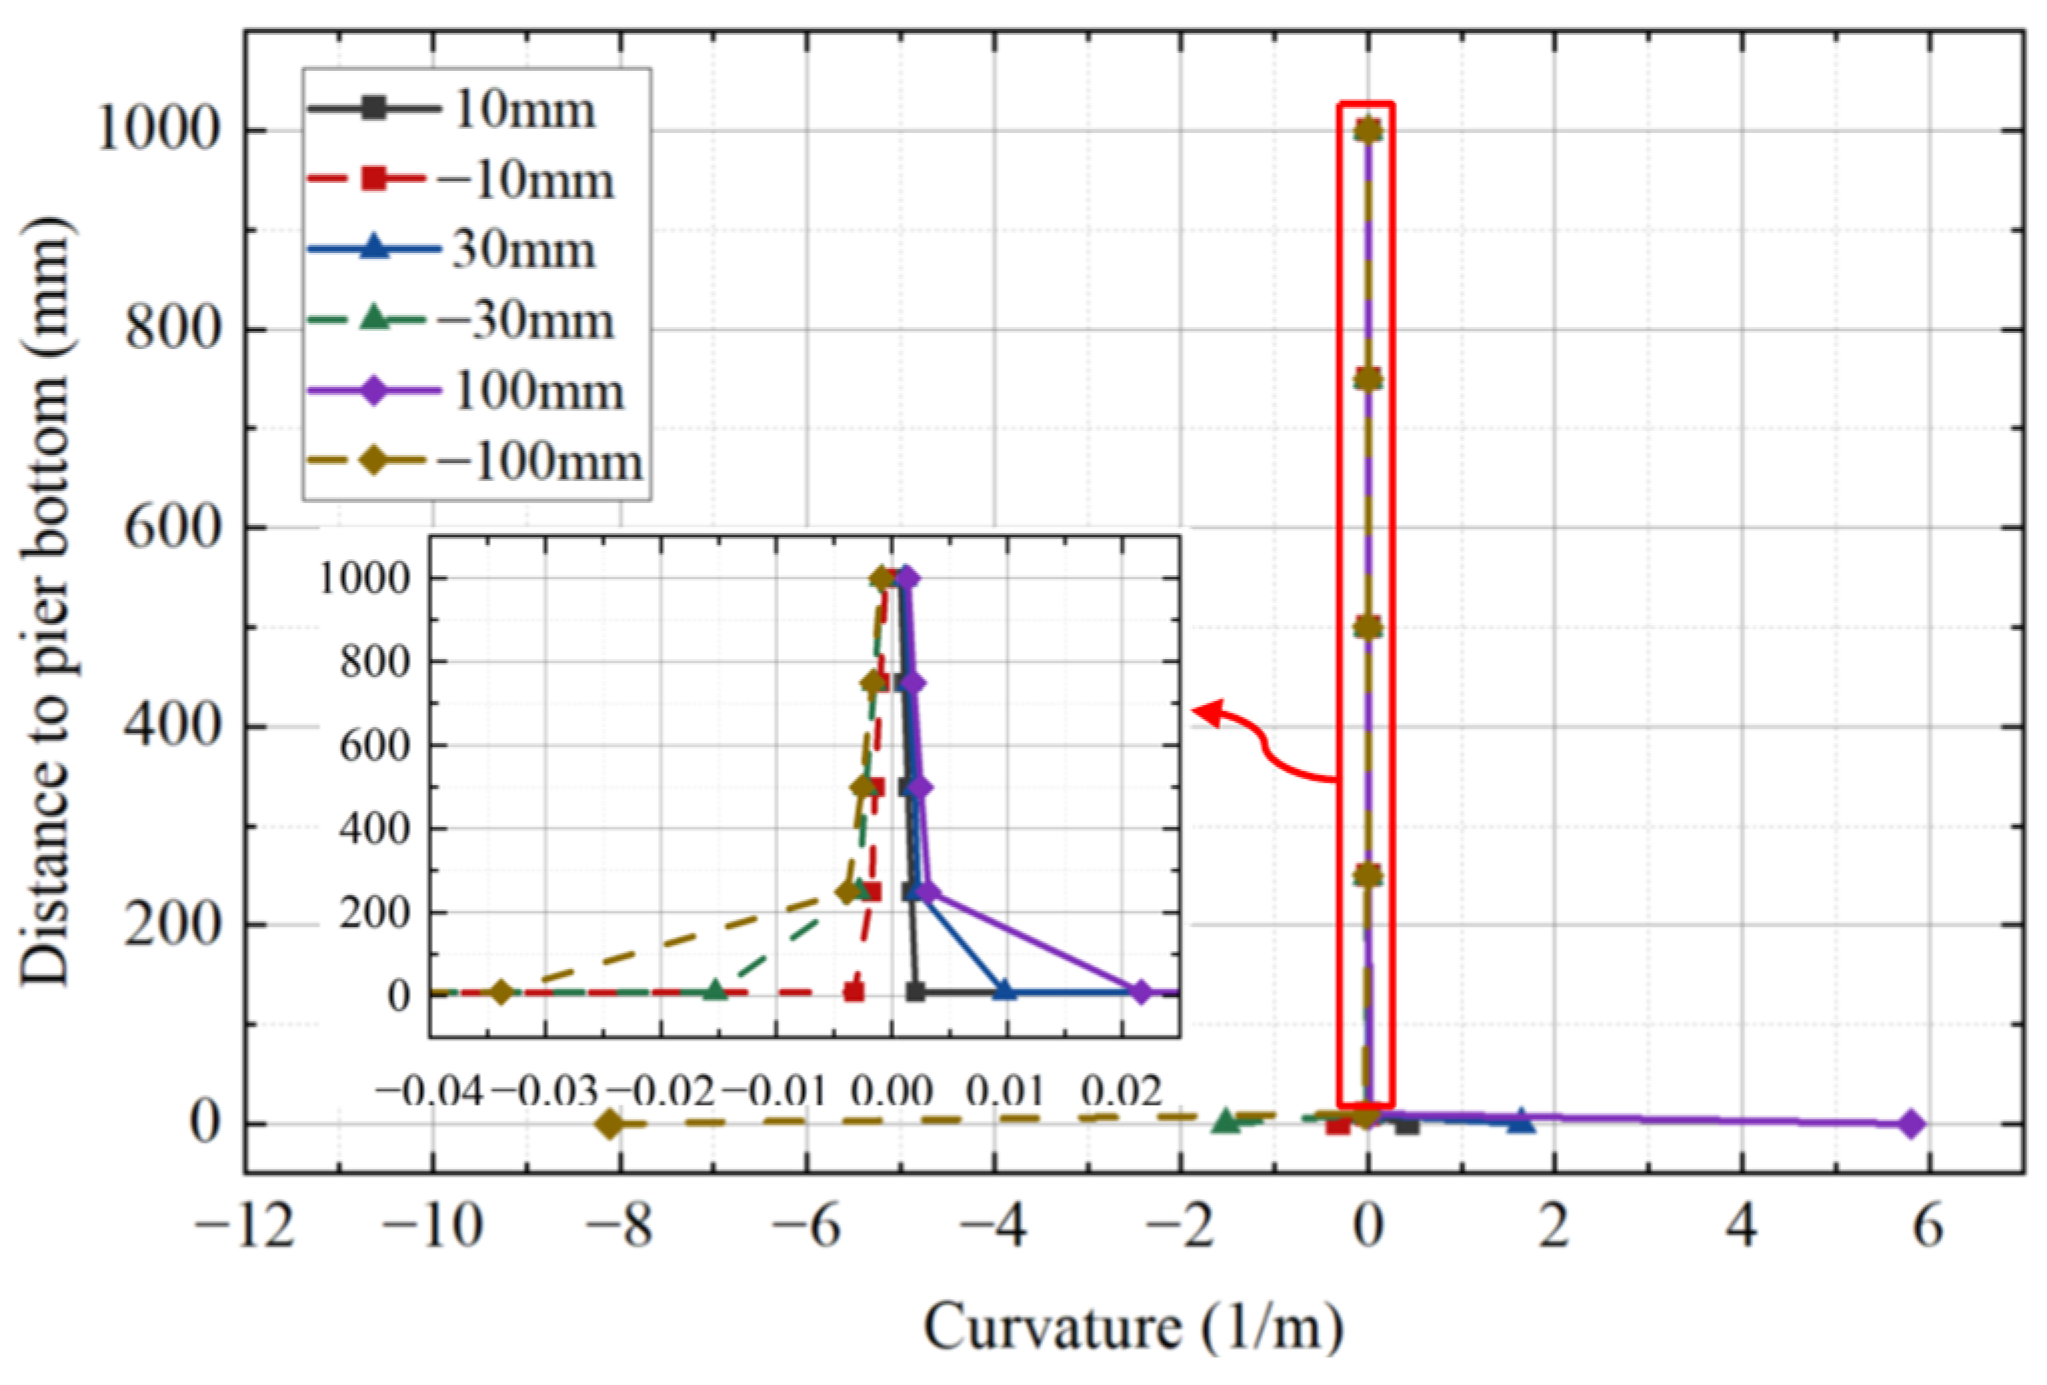
The distribution of the cross-sectional curvature along the specimen’s longitudinal axis represents each section’s bending degree. For each section with a different height, there are different equations. Within the 10 to 1000 mm height range, the curvature was determined by Equation (1), calculating the curvature using strain data. However, within the 0 to 10 mm height range, the curvature was determined by Equation (2), calculating the curvature using the displacement data due to the influence of the rocking gap opening. The mechanism of curvature calculation is plotted in Figure 19.
For Equation (1), the curvature was determined by dividing the strain difference between the east and west sides of the pier by the depth of the cross-section. Equation (2) was based on similar principles to Equation (1), dividing the strain difference by the cross-sectional depth. However, since the displacement data were used, the displacement must be converted to strain. Due to the huge opening displacement of the rocking gap, the natural logarithm function was applied to obtain the true strain.
As depicted in Figure 20, the curvature of each section exhibited an increasing trend as the loading progressed, though the rate of increase varied significantly across different height ranges. The curvature shows a smaller increase in the sections within the 250 mm to 1000 mm height range. However, in the sections within the 0 to 250 mm height range, the curvature increased rapidly. For instance, at the 100 mm level, the average curvature of the pier bottom section was 6.95 1/m, while that of the section at 250 mm height was 0.0035 1/m. There was a 1985-fold difference in magnitude between the two values. This indicated that most of the pier’s rotational displacement was concentrated at the pier’s bottom, providing rotational displacement in the form of a rocking gap opening. However, the deformation of the pier was minimal, remaining almost elastic with minimal damage, which is advantageous for rapid post-earthquake repair.
φ = ε E ε W h
φ = ln Δ E + b b ln Δ W + b b h + d

3.4. Strand Response

The prestress strand is the main member that provides a centering force to the specimen. The higher the prestress level, the better the specimen’s self-centering performance. Figure 21a shows the stress hysteresis response of the prestress strands. The stress hysteresis curve of the strands exhibits a V-shape and is nearly symmetric. The maximum tensile stress of each strand did not exceed the yield strength of 1860 MPa. A prestress loss still occurred during each cycle loading, as shown in Figure 21b. When loaded to near the maximum displacement of each cycle, the strand stress exhibited a short plateau where displacement increased, but the strand stress remained nearly constant. The stress loss was likely due to the gap between the steel pipe shear key and the restraint hole in the center of the rocking plate, which was intended to allow for shear key rotation. The loss depends on the position of the strands: the farther from the neutral axis, the greater the prestress loss, as shown in Figure 21c.

3.5. Strain Response of Steel Tube

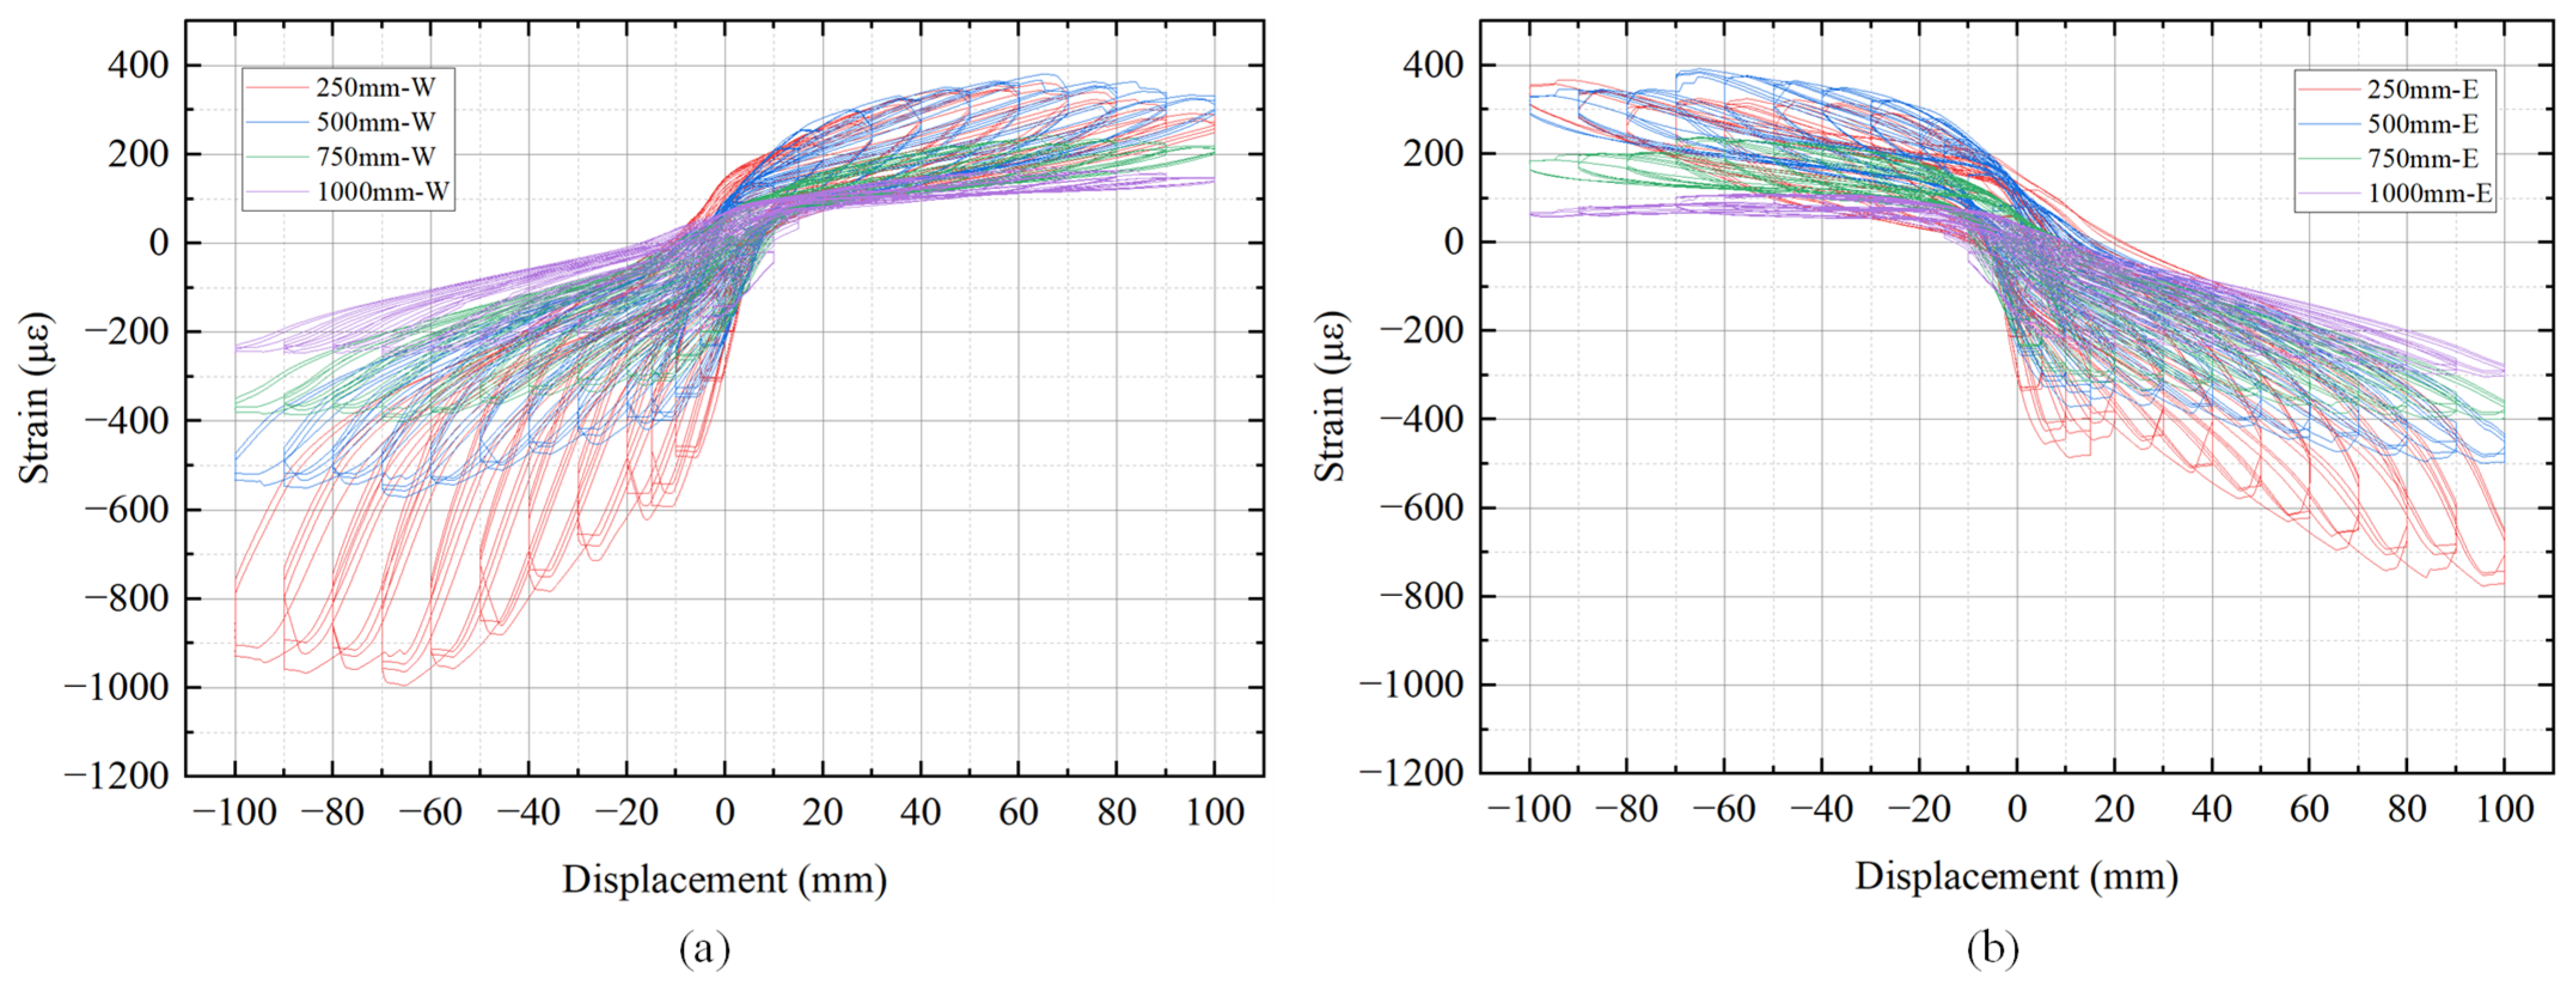
The damage of the steel tube was assessed based on the strain gauge data collected from the east and west sides of the tube. The strain hysteresis curves are shown in Figure 22. The strain curves exhibited a certain degree of symmetry, though the strain on the west side was slightly higher, corresponding to the bulking damage observed at the pier bottom. The closer to the pier bottom, the greater the strain amplitude. The steel tube remained elastic within the 250 mm to 1000 mm range because the maximum strain was less than the yield strain of 2121 με. The yield strain value came from the yield strength of a 3 mm thick Q355 steel plate.

4. Conclusions

An experimental program was carried out to evaluate the seismic behavior of CFST self-centering rocking piers. A pier specimen was designed based on a 1/4 scaled factor and tested under constant vertical and lateral cyclic loading. The following conclusions can be obtained based on this study:
(1)
This study proposed the structural details and a fast construction system for CFST self-centering rocking piers, which are suitable for rapid construction on steep mountainous slopes. Detailed descriptions were provided for the specimen fabrication, installation, loading process, and the placement of the measurement equipment.
(2)
During loading, the specimen exhibited stable rocking behavior. At the final level of a 7.7% drift, the buckling of the steel tube at the pier bottom of the specimen was minor, and there was a potential minor crushing of concrete at the compressed edge. All the energy-dissipating rebars fractured. All the prestressing strands were not yielded. A prestress loss was observed, with losses increasing in the tendons positioned further from the neutral axis.
(3)
After yielding, the specimen retained a positive tangent stiffness, maintaining a sufficient load-bearing capacity. After pier rocking, the neutral axis depth ratio at the pier bottom rapidly dropped to below 0.2. The fracture of all the energy-dissipating rebars had a minimal impact on the load-bearing capacity but significantly affected the energy-dissipation capacity.
(4)
The specimen’s hysteresis curves showed a prominent flag-shaped behavior. At the 7.7% drift level, the maximum residual drift was 0.17%, indicating excellent self-centering performance.
(5)
The cross-sectional curvature distribution along the specimen was extremely nonlinear, with a pronounced concentration at the pier bottom. The rocking gap provided most of the lateral displacement, preventing large deformations in the pier. This design significantly reduced damage to the pier.

Future Work

This study still has some unresolved issues, such as the fracture of the energy-dissipating rebars due to repeated cyclic loading, which leads to a decline in energy dissipation capacity, the challenge of quickly repairing the crushed concrete inside the steel tube at the pier bottom, and the performance of these piers in multi-span bridges. Future work may focus on further improving the design of the piers to make them easier to repair after strong earthquakes and evaluating their performance in bridge applications.

Author Contributions

Conceptualization, X.L. and J.S.; methodology, W.L. and X.L.; software, W.L. and Y.Z.; validation, W.L., Y.Z. and H.L.; formal analysis, W.L. and Y.Z.; investigation, Y.Z.; resources, X.L. and J.S.; data curation, X.L.; writing—original draft preparation, W.L.; writing—review and editing, W.L., Y.Z. and H.L.; supervision, X.L. and J.S. All authors have read and agreed to the published version of the manuscript.

Funding

This research was funded by Sichuan Road and Bridge Construction Group Co., Ltd. Science and Technology Program, grant number KY2023srbg-2-2.

Data Availability Statement

The data that support the findings of this study are available from the corresponding author upon reasonable request.

Conflicts of Interest

Authors Wei Lu, Yu Zou and Haiqing Li were employed by the company Sichuan Road & Bridge Group Co., Ltd. The remaining authors declare that the research was conducted in the absence of any commercial or financial relationships that could be construed as a potential conflict of interest.

References

  1. Yuan, W.; Wang, X.; Guo, A.; Li, C.; Dong, Z.; Wu, X. Cyclic performance of RC bridge piers retrofitted with UHPC jackets: Experimental investigation. Eng. Struct. 2022, 259, 114139. [Google Scholar] [CrossRef]
  2. Bruneau, M. Performance of steel bridges during the 1995 Hyogoken–Nanbu (Kobe, Japan) earthquake—A North American perspective. Eng. Struct. 1998, 20, 1063–1078. [Google Scholar] [CrossRef]
  3. Ji, Z.; Li, Z.; Zhang, Y.; Gao, M.; Li, T.; Sun, J.; Luo, Q. Long-period ground motion simulation and pulse probability distribution characteristics of the Kumamoto MW 7.1 earthquake in Japan. Earthq. Spectra. 2024, 87552930241276395. [Google Scholar] [CrossRef]
  4. Ji, Z.; Li, Z.; Zhang, Y.; Quanbo, L.; Sun, J.; Ju, C.; Zhang, Y. Statistical Analysis of Characteristic Parameters and Probability Distribution of Near-Fault Velocity Pulses—A Case Study on the 1999 Mw 7.6 Chi-Chi Earthquake. Seismol. Res. Lett. 2024, 95, 3433–3448. [Google Scholar] [CrossRef]
  5. Memari, A.M.; Harris, H.G.; Hamid, A.A.; Scanlon, A. Ductility evaluation for typical existing R/C bridge columns in the eastern USA. Eng. Struct. 2005, 27, 203–212. [Google Scholar] [CrossRef]
  6. Khalaf, S.; Abed, F.; Alhoubi, Y. Flexural behavior of circular concrete filled steel tubes with partially incorporated demolished concrete lumps. Compos. Part C Open Access 2023, 10, 100346. [Google Scholar] [CrossRef]
  7. Wang, R.; Han, L.-H.; Nie, J.-G.; Zhao, X.-L. Flexural performance of rectangular CFST members. Thin-Walled Struct. 2014, 79, 154–165. [Google Scholar] [CrossRef]
  8. Kawashima, K. Damage of bridges due to the 2011 Great East Japan Earthquake. J. Jpn. Assoc. Earthq. Eng. 2012, 12, 4_319–4_338. [Google Scholar] [CrossRef]
  9. Dong, B.; Pan, J.; Cai, J.; Xu, L. Mechanical behaviour of a new ECC-encased CFST column to RC beam connection under cyclic loading. Eng. Struct. 2021, 234, 111915. [Google Scholar] [CrossRef]
  10. Dong, H.; Han, Q.; Du, X.; Zhou, Y. Review on seismic resilient bridge structures. Adv. Struct. Eng. 2022, 25, 1565–1582. [Google Scholar] [CrossRef]
  11. Cimellaro, G.P.; Reinhorn, A.M.; Bruneau, M. Seismic resilience of a hospital system. Struct. Infrastruct. Eng. 2010, 6, 127–144. [Google Scholar] [CrossRef]
  12. Samadian, D.; Ghafory-Ashtiany, M.; Naderpour, H.; Eghbali, M. Seismic resilience evaluation based on vulnerability curves for existing and retrofitted typical RC school buildings. Soil Dyn. Earthq. Eng. 2019, 127, 105844. [Google Scholar] [CrossRef]
  13. Kolli, S.; Dammala, P.K.; Bhattacharya, S.; Fan, C.; Wang, T.; Cui, L. Offshore wind farms as additional coolant power sources to enhance seismic resilience of nuclear power plants–A case study. Nucl. Eng. Des. 2023, 405, 112204. [Google Scholar] [CrossRef]
  14. Capacci, L.; Biondini, F.; Frangopol, D.M. Resilience of aging structures and infrastructure systems with emphasis on seismic resilience of bridges and road networks. Resilient Cities Struct. 2022, 1, 23–41. [Google Scholar] [CrossRef]
  15. Bu, Z.-Y.; Ou, Y.-C.; Song, J.-W.; Zhang, N.-S.; Lee, G.C. Cyclic loading test of unbonded and bonded posttensioned precast segmental bridge columns with circular section. J. Bridge Eng. 2016, 21, 04015043. [Google Scholar] [CrossRef]
  16. Thonstad, T.; Mantawy, I.M.; Stanton, J.F.; Eberhard, M.O.; Sanders, D.H. Shaking table performance of a new bridge system with pretensioned rocking columns. J. Bridge Eng. 2016, 21, 04015079. [Google Scholar] [CrossRef]
  17. Mashal, M.; Palermo, A. Low-damage seismic design for accelerated bridge construction. J. Bridge Eng. 2019, 24, 04019066. [Google Scholar] [CrossRef]
  18. Zhou, Y.-L.; Han, Q.; Du, X.-L.; Jia, Z.-l. Shaking table tests of post-tensioned rocking bridge with double-column bents. J. Bridge Eng. 2019, 24, 04019080. [Google Scholar] [CrossRef]
  19. El-Hawat, O.; Fatahi, B.; Taciroglu, E. Novel post-tensioned rocking piles for enhancing the seismic resilience of bridges. Earthq. Eng. Struct. Dyn. 2022, 51, 393–417. [Google Scholar] [CrossRef]
  20. Jafari, A.; Sadeghi, M.; Alaee, F.J.; Bengar, H.A. Determining the optimal layout of energy-dissipating mechanisms for hybrid self-centering walls. In Structures; Elsevier: Amsterdam, The Netherlands, 2024; Volume 60, p. 105854. [Google Scholar]
  21. Sun, Y.; Cai, G. Seismic behavior of circular concrete columns reinforced by low bond ultrahigh strength rebars. J. Struct. Eng. 2023, 149, 04023126. [Google Scholar] [CrossRef]
  22. Wang, J.; Zhao, H.; He, J. Seismic behaviors and resilient capacity of CFRP-confined concrete columns with partially debonded high-strength steel rebars. Compos. Struct. 2019, 222, 110912. [Google Scholar] [CrossRef]
  23. Wang, J.; Sun, Y.; Takeuchi, T.; Koyama, T. Seismic behavior of circular fly ash concrete columns reinforced with low-bond high-strength steel rebar. Structures 2020, 27, 1335–1357. [Google Scholar] [CrossRef]
  24. Luo, J.; Yuan, S.; Zhao, J.; Sun, Y. Seismic behavior of concrete columns reinforced with weakly bonded ultra-high strength rebars and confined by steel tubes. Materials 2023, 16, 6868. [Google Scholar] [CrossRef] [PubMed]
  25. Li, H.; Wang, W.; Gao, C.; Li, S.; Wang, J.; Qi, J. Shape memory alloy-reinforced UHPC tube confined bridge piers for enhancing the seismic resistance of highway bridges. Eng. Struct. 2024, 302, 117411. [Google Scholar] [CrossRef]
  26. Li, S.; Wang, J.q.; Alam, M.S. Seismic performance assessment of a multispan continuous isolated highway bridge with superelastic shape memory alloy reinforced piers and restraining devices. Earthq. Eng. Struct. Dyn. 2021, 50, 673–691. [Google Scholar] [CrossRef]
  27. Billah, A.M.; Alam, M.S. Plastic hinge length of shape memory alloy (SMA) reinforced concrete bridge pier. Eng. Struct. 2016, 117, 321–331. [Google Scholar] [CrossRef]
  28. Zhou, L.; Alam, M.S. Seismic reliability-based assessment and design optimization of shape memory alloy bars in concrete bridge piers. Eng. Struct. 2025, 322, 119226. [Google Scholar] [CrossRef]
  29. Raza, S.; Shafei, B.; Saiidi, M.S.; Motavalli, M.; Shahverdi, M. Shape memory alloy reinforcement for strengthening and self-centering of concrete structures—State of the art. Constr. Build. Mater. 2022, 324, 126628. [Google Scholar] [CrossRef]
  30. Rahmzadeh, A.; Alam, M.S. Feasibility of using superelastic shape memory alloy in plastic hinge regions of steel bridge columns for seismic applications. Earthq. Eng. Struct. Dyn. 2024, 53, 2988–3008. [Google Scholar] [CrossRef]
  31. Zhang, Y.; Lei, H.; Dong, Z.; Li, T.; Ma, F.; Liu, H.; Deng, M. Cyclic response of precast concrete columns connected with cast-in-place UHPC in plastic hinge region. J. Build. Eng. 2023, 65, 105793. [Google Scholar] [CrossRef]
  32. Guan, D.; Chen, Z.; Liu, J.; Lin, Z.; Guo, Z. Seismic performance of precast concrete columns with prefabricated UHPC jackets in plastic hinge zone. Eng. Struct. 2021, 245, 112776. [Google Scholar] [CrossRef]
  33. Ding, Y.; Zeng, B.; Zhou, Z.; Wei, Y.; Zhu, M. Seismic retrofitting of RC columns using stainless steel grid-reinforced UHPC jackets in plastic hinge zone. J. Build. Eng. 2024, 84, 108637. [Google Scholar] [CrossRef]
  34. Zhou, M.; Song, J.; Yin, S.; Zhu, G.; Lu, W.; Lee, G.C. Cyclic performance of severely earthquake-damaged RC bridge columns repaired using grouted UHPC jacket. Eng. Struct. 2023, 280, 115615. [Google Scholar] [CrossRef]
  35. Zhang, R.; Zhao, R.; Liu, Z.; Chen, K.; Hu, P.; Liu, Z. Cyclic behavior of existing flexure-dominated RC bridge columns retrofitted by ECC jackets in the region of plastic hinge. Eng. Struct. 2022, 269, 114820. [Google Scholar] [CrossRef]
  36. Qian, H.; Ye, Y.; Yan, C.; Jin, G.; Li, C.; Shi, Y. Experimental study on the seismic performance of self-centering bridge piers incorporating ECC and superelastic SMA bars in the plastic hinge regions. In Structures; Elsevier: Amsterdam, The Netherlands, 2022; Volume 46, pp. 1955–1967. [Google Scholar]
  37. Ding, M.; Xu, W.; Wang, J.; Chen, Y.; Fang, R. Analytical study on seismic performance of ECC shell-RC column and its plastic hinge forming mechanism. In Structures; Elsevier: Amsterdam, The Netherlands, 2023; Volume 58, p. 105489. [Google Scholar]
  38. Li, X.; Chen, K.; Hu, P.; He, W.; Xiao, L.; Zhang, R. Effect of ECC jackets for enhancing the lateral cyclic behavior of RC bridge columns. Eng. Struct. 2020, 219, 110714. [Google Scholar] [CrossRef]
  39. Di, J.; Fan, J.; Zhou, X.; Zhao, L.; Han, B.; Qin, F.; Zhang, Z. Hysteretic behavior of composite bridge columns with plastic hinge enhanced by engineered cementitious composite jacket for seismic resistance. Eng. Struct. 2022, 251, 113532. [Google Scholar] [CrossRef]
  40. Ichikawa, S.; Matsuzaki, H.; Moustafa, A.; ElGawady, M.A.; Kawashima, K. Seismic-resistant bridge columns with ultrahigh-performance concrete segments. J. Bridge Eng. 2016, 21, 04016049. [Google Scholar] [CrossRef]
  41. Zhang, Y.; Yang, J.; Li, T.; Deng, M. Mechanical behavior of RC columns strengthened with thin UHPC jacket under cyclic loads. J. Build. Eng. 2022, 49, 104065. [Google Scholar] [CrossRef]
  42. Meng, Q. Research on efficiency of RC piers seismic strengthened by Precast SFC shell Segments. J. Vib. Shock 2018, 37, 19–27. [Google Scholar]
  43. Luo, X.; Meng, Q. Numerical Simulation Analysis of Damage Development in RC Bridge Piers with High-Performance Plastic Hinges. J. Southwest Univ. Sci. Technol. 2022, 37, 35–43. [Google Scholar]
  44. Wang, Z.; Wang, J.-Q.; Tang, Y.-C.; Liu, T.-X.; Gao, Y.-F.; Zhang, J. Seismic behavior of precast segmental UHPC bridge columns with replaceable external cover plates and internal dissipaters. Eng. Struct. 2018, 177, 540–555. [Google Scholar] [CrossRef]
  45. Nikoukalam, M.; Sideris, P. Resilient bridge rocking columns with polyurethane damage-resistant end segments and replaceable energy-dissipating links. J. Bridge Eng. 2017, 22, 04017064. [Google Scholar] [CrossRef]
  46. Zhu, Y.; Wu, J.; Zhang, J.; Xie, L.; Wei, Y.; Tong, C. Experimental and theoretical investigations of post-tensioned precast reinforced concrete bridge pier with external replaceable energy dissipaters. Eng. Struct. 2023, 294, 116719. [Google Scholar] [CrossRef]
  47. Ma, G.; Hou, C.; Hwang, H.-J.; Chen, L.; Zhang, Z. Seismic behavior of repairable columns with UHPC segments and replaceable buckling-restrained energy dissipaters. Eng. Struct. 2024, 300, 117176. [Google Scholar] [CrossRef]
  48. Zhang, D.; Li, N.; Li, Z.-X. Seismic performance of precast segmental concrete-filled steel-tube bridge columns with internal and external energy dissipaters. J. Bridge Eng. 2021, 26, 04021085. [Google Scholar] [CrossRef]
  49. Tazarv, M.; Saiid Saiidi, M. Low-damage precast columns for accelerated bridge construction in high seismic zones. J. Bridge Eng. 2016, 21, 04015056. [Google Scholar] [CrossRef]
  50. Zhang, Q.; Alam, M.S. State-of-the-art review of seismic-resistant precast bridge columns. J. Bridge Eng. 2020, 25, 03120001. [Google Scholar] [CrossRef]
  51. Tazarv, M.; Saiidi, M.S. UHPC-filled duct connections for accelerated bridge construction of RC columns in high seismic zones. Eng. Struct. 2015, 99, 413–422. [Google Scholar] [CrossRef]
  52. GB/T 1591-2018; High Strength Low Alloy Structural Steels. Standardization Administration of China: Beijing, China, 2018.
  53. GB 1499.2-2024; Steel for the Reinforcement of Concrete-Part 2: Hot Rolled Ribbed Bars. Standardization Administration of China: Beijing, China, 2024.
  54. GB 50010-2010; Code for Design of Concrete Structures. The China Architecture & Building Press: Beijing, China, 2015.
  55. Park, R. State-of-the-art report: Ductility evaluation from laboratory and analytical testing. In Proceedings of the 9th World Conference on Earthquake Engineering, Kyoto, Japan, 2–9 August 1998. [Google Scholar]
  56. Specifications for Highway Bridges Part V Seismic Design; Japan Road Association: Tokyo, Japan, 2019.
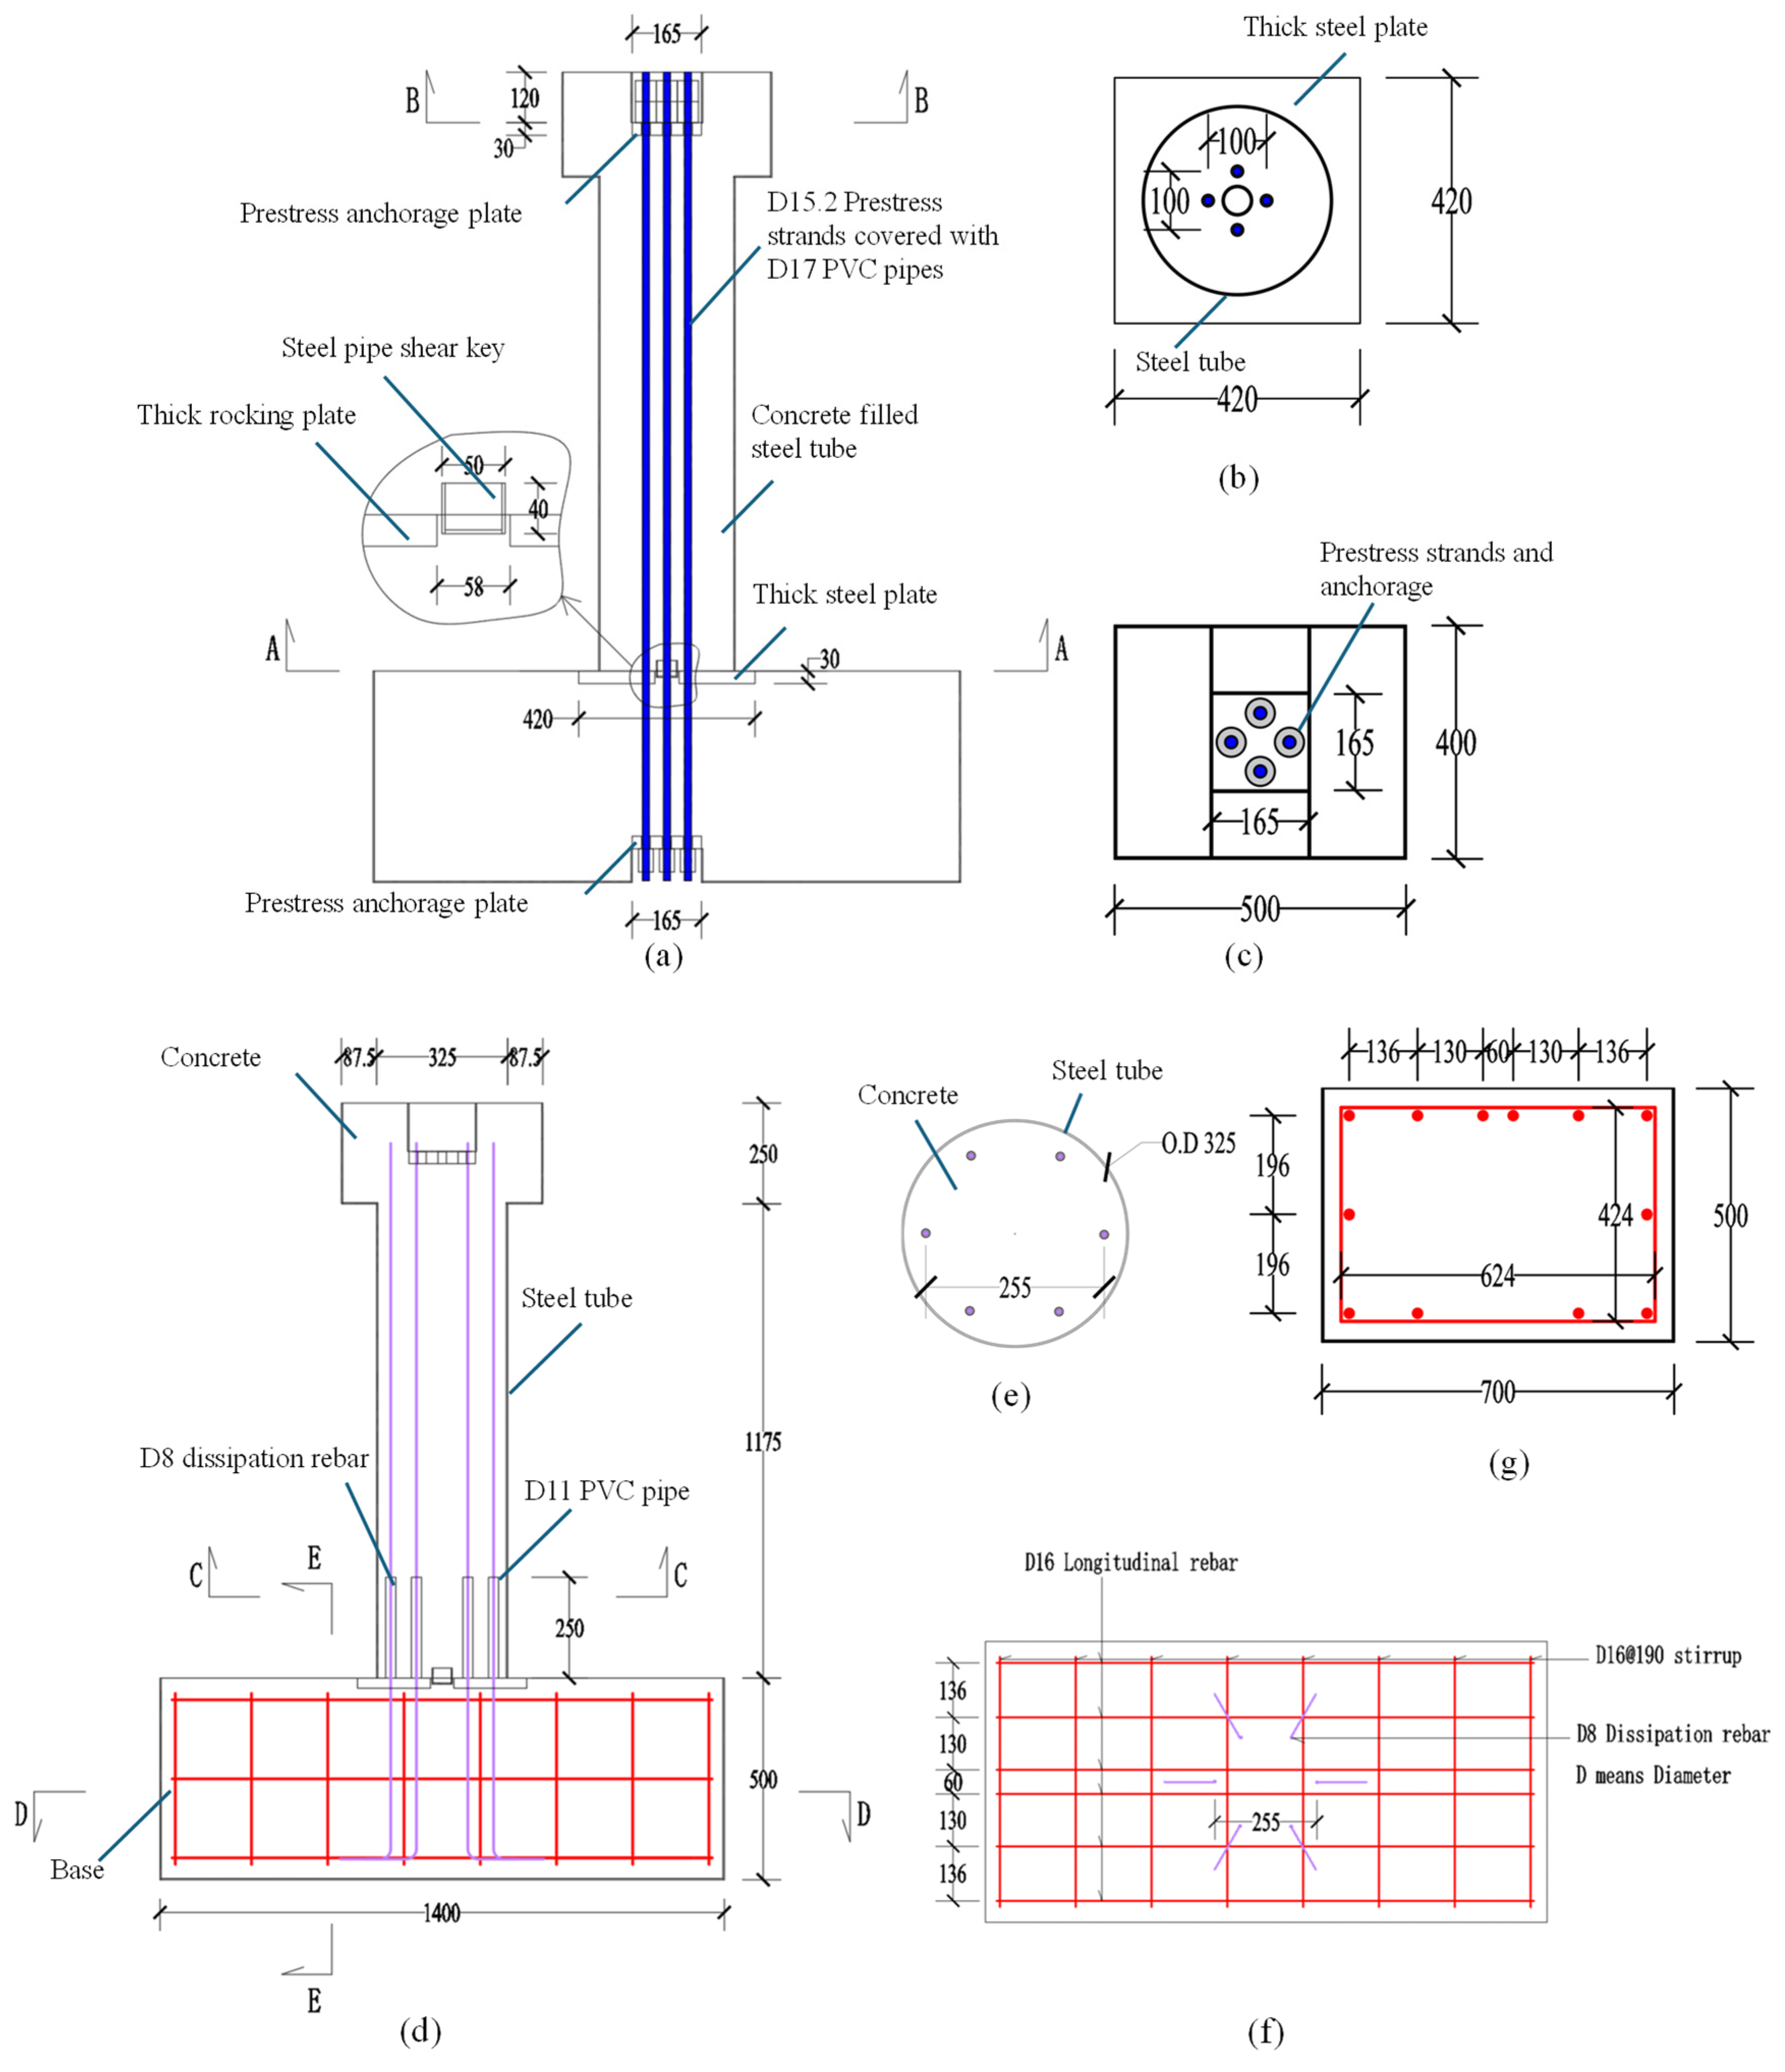
Figure 1. Design details of the specimen (unit: mm): (a) elevation of prestress, shear key, and rocking members; (b) A-A section; (c) B-B section; (d) elevation of normal members; (e) C-C section; (f) D-D section; and (g) E-E section.
Buildings 15 00267 g001
Figure 2. Design of fast construction system: (a) overview; (b) steel tube locating mechanism; (c) details of the design; and (d) details of the locating plate.
Buildings 15 00267 g002
Figure 3. Details of each part: (a) pier steel tube; (b) pier top; (c) steel formwork of base; (d) locating plate and rocking plate; (e) Prestress strands; and (f) energy dissipation rebars.
Buildings 15 00267 g003
Figure 4. Construction flow chart of the specimen.
Buildings 15 00267 g004
Figure 5. Construction of the specimen: (a) installation of prestress strands; (b) installation of locating plate and base reinforcement; (c) installation of thick steel rocking plate and energy dissipation rebars; (d) installation of pier steel tube; (e) casting concrete into the base; (f) casting concrete into pier steel tube; and (g) completion of concrete curing.
Buildings 15 00267 g005
Figure 6. Experiment setup and measuring devices.
Buildings 15 00267 g006
Figure 7. Details of connecting plates: (a) front side of connecting plate A; (b) back side of connecting plate A; (c) front side of connecting plate B; (d) back side of connecting plate B; and (e) 3D views of the restraint plate for the vertical actuator.
Buildings 15 00267 g007
Figure 8. Installing the specimen onto the loading platform: (a) lifting the specimen under the reaction frame; (b) tensioning the prestress strands; (c) cutting the prestress strands; (d) installing the connecting plates A, B, and the restraint plate; (e) connecting the specimen to the vertical actuator; and (f) completed specimen set.
Buildings 15 00267 g008
Figure 9. Details of prestress anchors and load cells at pier top: (a) load cells installed on the anchorage plate; (b) prestress anchors installed on load cells; (c) top view of the strands layout; (d) details of load cell; and (e) details of prestress anchors.
Buildings 15 00267 g009
Figure 10. Lateral displacement loading protocol.
Buildings 15 00267 g010
Figure 11. Opening progress of rocking gap: (a) 15 mm level; (b) 50 mm level; (c) 80 mm level; (d) −15 mm level; (e) −50 mm level; and (f) −80 mm level.
Buildings 15 00267 g011
Figure 12. The failure mode of the specimen: (a) pier tilting; (b) rocking gap opening; (c) steel tube bulking on the east side; (d) steel tube bulking on the west side; (e) layout of energy dissipation rebars; and (f) fracture of energy dissipation rebars.
Buildings 15 00267 g012
Figure 13. Load-displacement hysteresis curves.
Buildings 15 00267 g013
Figure 14. Stiffness curves: (a) secant stiffness curve; and (b) tangent stiffness curve.
Buildings 15 00267 g014
Figure 15. Backbone curve.
Buildings 15 00267 g015
Figure 16. Energy dissipation (average value for each level).
Buildings 15 00267 g016
Figure 17. Neutral axial depth ratio at pier bottom.
Buildings 15 00267 g017
Figure 18. Residual displacement curve.
Buildings 15 00267 g018
Figure 19. Mechanism of curvature calculation.
Buildings 15 00267 g019
Figure 20. Curvature distribution curves.
Buildings 15 00267 g020
Figure 21. Stress response in the strands: (a) stress hysteresis curves of strands; (b) stress-loading level relationship; and (c) total stress loss of strands.
Buildings 15 00267 g021
Figure 22. Strain hysteresis curves of steel tube: (a) west side; and (b) east side.
Buildings 15 00267 g022
Table 1. Properties of the steel.
ItemYield Strength (MPa)Ultimate Strength (MPa)Elongation After Fracture (%)
D16 HRB400E rebars448.9637.624.5
D8 HRB400E rebars428.1617.328.2
D15.2 prestress steel strands1836.52062.57.5
3 mm thick Q355
steel plates
445.4697.923.6
Table 2. Reinforcement details of the specimen.
ItemDetails (Unit: mm)
Base reinforcementD16 longitudinal rebar × 12
D16 stirrup × 8
Rocking pier reinforcementD8 energy dissipation rebar × 6
each covered with a D11 PVC pipe, covering distance of 250 mm, in the pier near the bottom
Prestress strandsD15.2 prestress steel strand × 4
full length covered with a D17 PVC pipe for each
Table 3. Prestress of strands after tension.
Strands NumberStrands Area (mm2)Tensile Force (kN)Tensile Stress (MPa)
S114051.95 371.08
S214054.18 386.99
S314051.13 365.23
S414050.55 361.04
Disclaimer/Publisher’s Note: The statements, opinions and data contained in all publications are solely those of the individual author(s) and contributor(s) and not of MDPI and/or the editor(s). MDPI and/or the editor(s) disclaim responsibility for any injury to people or property resulting from any ideas, methods, instructions or products referred to in the content.