1. Introduction
This article discusses the deep cementation method, one of the most effective ways to strengthen weak soils, particularly in complex geological conditions. It is used in construction, slope stabilisation, landslide prevention and building foundation reinforcement. It has been established that the use of low-carbon cementitious binders with deep mixing increases the strength of weak soils and reduces the carbon footprint. Polymer–cement composites also provide resistance in aggressive saline environments and increase durability [
1,
2]. The essence of the method is to inject cement mortar into the soil to significantly improve its mechanical properties. This method is of great importance in hydraulic engineering. It is used to reinforce dams, embankments and other hydraulic structures, ensuring their stability and preventing erosion. Studies by foreign researchers have confirmed the effectiveness of hydraulic cement and modifying additives when using the deep mixing method for sustainable soil stabilisation [
3,
4,
5].
The history of deep cementation dates back to the early 20th century, when engineers first encountered problems with unstable soils while constructing large infrastructure projects. The first attempts to reinforce soils involved injecting simple cement mortars; however, these did not always provide the necessary strength and durability [
6,
7]. The development of the construction industry and materials science in the mid-20th century led to the active research and development of new types of cement mortar. Particular attention was paid to polymer additives, which greatly improved the properties of cement mixtures. Using cement mortars with modified additives greatly improves the water resistance of soils and increases their resistance to hydrodynamic loads [
8,
9]. In the 1970s, the widespread use of polymer additives in construction made it possible to increase the effectiveness of deep cementation methods.
The active use of nanomaterials in cement mortars began in the 1990s with the advent of nanotechnology. Nanomaterials such as nanosilica and nanoclay significantly improved the microstructure of cement stone, thereby increasing its strength and durability. In their research, some scientists have characterised modern achievements in the field of polymer nanocomposites, noting their high strength and durability [
10,
11,
12]. Modern research in the field of chemical additives has also led to the development of superplasticisers and hardening accelerators, which enable the setting and hardening processes of cement mortars to be controlled. It is well-known that complex modifiers and superplasticisers enhance the rheology and strength of self-compacting concrete. Meanwhile, additives derived from alcohol production waste can improve the properties of cement-sand mixtures [
13,
14,
15].
The current stage of development of the deep cementation method is characterised by the active use of complex additives that combine the advantages of polymers, nanomaterials and chemical compounds. These additives maximise the improvement of cement mortar properties, ensuring their high efficiency in various conditions [
8,
9,
10,
11,
12,
13,
14,
15,
16].
Of particular interest are complex additives that combine the advantages of different types of modifier. Such additives maximise the improvement of cement mortar properties, ensuring high efficiency in various usage conditions. Complex additives are becoming increasingly prevalent in construction practice, offering new solutions to complex engineering problems [
12].
If we refer to the regulatory requirements for injection mortars, then, depending on the cement binder, or more precisely, the size of its particles, three types of mortars can be distinguished: injection mortars based on cements with a specific surface area of 3000 to 5000 cm
2/g—cements for general construction purposes; injection solutions based on finely dispersed binders—cements with a specific surface area of 5000 to 8000 cm
2/g; injection solutions based on ultra-fine binders—cements with a specific surface area of 8000 to 20,000 cm
2/g [
13]. This article presents the results of modifying injection solutions based on conventional cements for general construction purposes. This is justified by the fact that, in the construction market and in the engineering-geological conditions of the region in which the research was conducted (central Kazakhstan), there is high demand for conventional M500 cement for injected solutions [
14]. This type of cement is used primarily because of its availability and cost, and most importantly, the technical results of its application. While the technical results of its use in engineering-geological conditions meet design requirements, they are far from stable or high-quality. Due to the relative rigidity of the solution, it is unable to penetrate sufficiently to form the required compaction zones and therefore does not reinforce the foundation adequately. This is confirmed by the results of static tests on structures after injection, which show that the bearing capacity of structures on the ground does not correspond to the actual volume of the injected solution [
15,
16]. Thus, improving the mobility and strength of the injection solution could lead to the formation of higher-quality compacted soil zones, solving the existing problem of deep cementation of soils using general-purpose cement in the region [
17,
18].
This study is original in its focus on paraffin-based additives. Unlike polymers or nanomaterials, these have not been the subject of a systematic study in the context of cement–sand injection mixtures. This research directly addresses a gap in the literature by evaluating whether paraffin can improve flowability, reduce water segregation and maintain compressive strength. This offers a novel approach to improving the performance of deep cementation under the specific conditions of Central Kazakhstan.
Despite the abundance of studies documenting the impact of polymer and nanomodified additives on enhancing properties in injection solutions, research focused on paraffin additives has been scarce. Notably, no studies have evaluated their impact in the engineering-geological conditions of Central Kazakhstan, where general-purpose cement (M500) remains the dominant binder. This study is novel in that it develops and tests a paraffin-based additive that increases the mobility and stability of cement–sand injection solutions without compromising their mechanical properties.
The research aimed to develop the composition and production technology of a modifying additive for injection solutions based on general-purpose cements for deep soil cementation. This article presents the results of these scientific studies, focusing specifically on the bifurcation processes of solution transformations in terms of strength and mobility. The evaluation criteria are described in detail in
Section 2.
Recent advancements in soil stabilisation have placed increasing emphasis on deep cementation methods, which significantly improve soil mechanical properties through the controlled injection of cementitious mixtures. State-of-the-art studies emphasise hybrid approaches that combine cement with polymers, nanomaterials and alternative binders to enhance the durability and injectability of soils. These innovations have expanded the applicability of deep mixing technologies to a wider range of soils and geotechnical conditions. In this context, our study proposes a novel paraffin-based additive for cement-sand mortars designed to address the specific geological conditions of Central Kazakhstan.
2. Materials and Methods
The injection solution modifier includes the following components: cement, paraffin, a neutraliser (sulfuric acid) and water. The additive’s main component is paraffin, which increases the mixture’s mobility and retains active cement ions by increasing its density. Since increasing the mobility by raising the water-to-cement ratio in the cement–sand mixture leads to concrete delamination with active ions being removed to the concrete surface by water, the cement in the additive acts as a base to which the paraffin is dissolved. The result is a suspended paraffin-cement mixture in water. At the same time, when paraffin dissolves in cement, it is activated by a suspended ion-active medium. The sulfuric acid in the additive is necessary to dissolve the hydrophobic paraffin in an aqueous medium.
Preparing the modifying additive involves completely dissolving the paraffin in the cement mixture while controlling the amount of water added. This is associated with an exothermic reaction that neutralises the alkaline environment of the mixture with sulfuric acid, resulting in water evaporation. After multiple iterations of preparing the mixture, the optimal component composition was obtained, taking water evaporation into account: The optimal composition is 1000 g of cement, 200 g of paraffin, 100 g of sulfuric acid and 1000 g of water. This balanced, mobile mixture is easy to introduce into the injection solution.
The composition of the control injection solution included the following components: 500 g of cement, 1500 g of sand, 250 mL of water. The variable inclusion of the modifying additive in the control solution was: 0.2, 0.4, 0.6, 0.8, 1% by weight of the solution.
The basic studies of the effect of the modified additive on the properties of the injection solution were:
- -
mineralogical composition;
- -
consistency of the cement mortar (water-cement ratio);
- -
cone spread;
- -
compressive strength of beams;
- -
flexural strength of beams;
- -
water separation;
- -
setting times.
Specialised laboratory equipment was used to determine the physical and mechanical properties of cement–sand mortars modified with a paraffin-based additive. Compressive and flexural strengths were measured using a PGM-100MG4 hydraulic press (Controls S.p.A., Milan, Italy). Mixture mobility (slump flow) was determined using a slump flow table (NPO Stroymash, Saint Petersburg, Russia), and the water separation test was performed with a settlement-measuring apparatus (LLC Izmeritel, Kazan, Russia). The initial and final setting times were measured using a Vicat apparatus (Matest S.r.l., Treviolo, Italy). The elemental composition of the samples was examined using an energy dispersive X-ray spectrometer (Bruker AXS GmbH, Karlsruhe, Germany). All instruments were calibrated and certified in accordance with applicable standards to ensure the accuracy and reproducibility of the experimental results.
At least six samples of each mixture were prepared for testing. The following designations were used to identify the composition: ‘Mix(R)’ (where ‘R’ is the reference sample) and ‘Mix(0.2)’ to ‘Mix(1.0)’, where ‘0.2’–‘1.0’ is the percentage of the additive in the sample.
Table 1 shows the variable compositions of the samples, from which the optimal composition was selected.
The additive amounts presented in
Table 1 correspond to 0.2–1.0% of the cement mass. Therefore, Mix(0.2) represents an additive dosage of 0.2% relative to cement, Mix(0.4) corresponds to 0.4%, and so on.
Tests were carried out in an accredited laboratory using certified equipment and standard methods as described in the regulations.
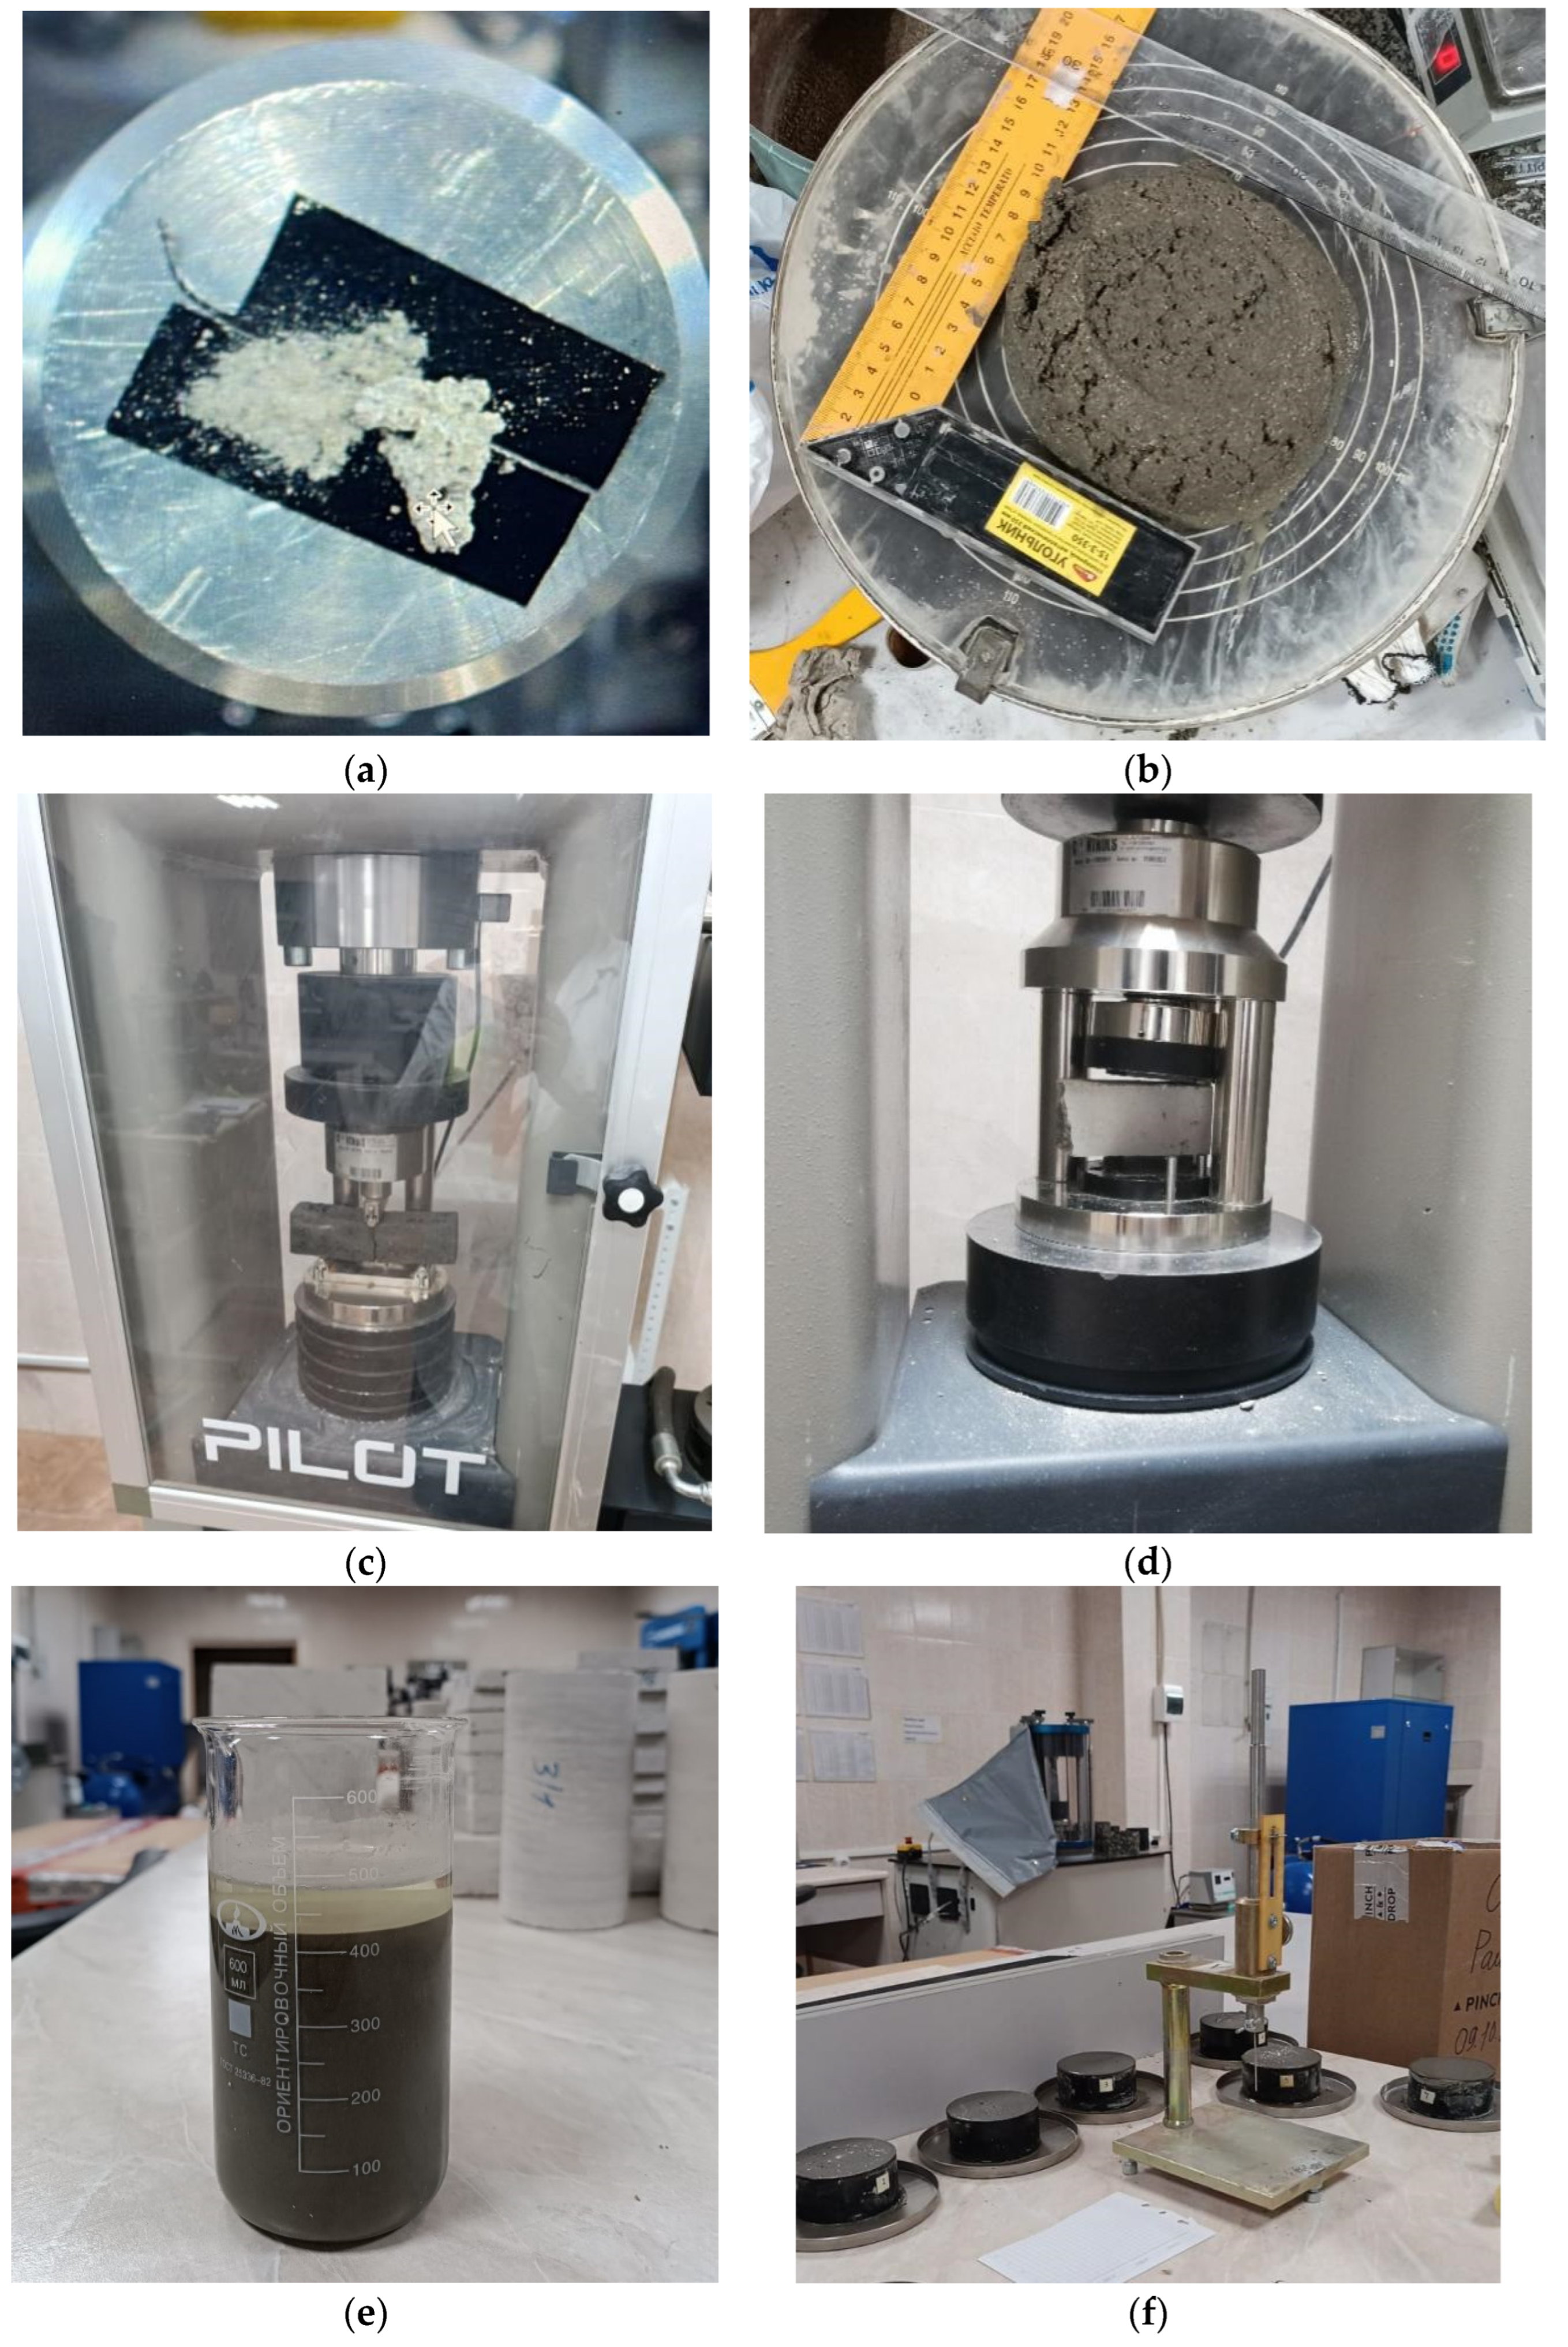
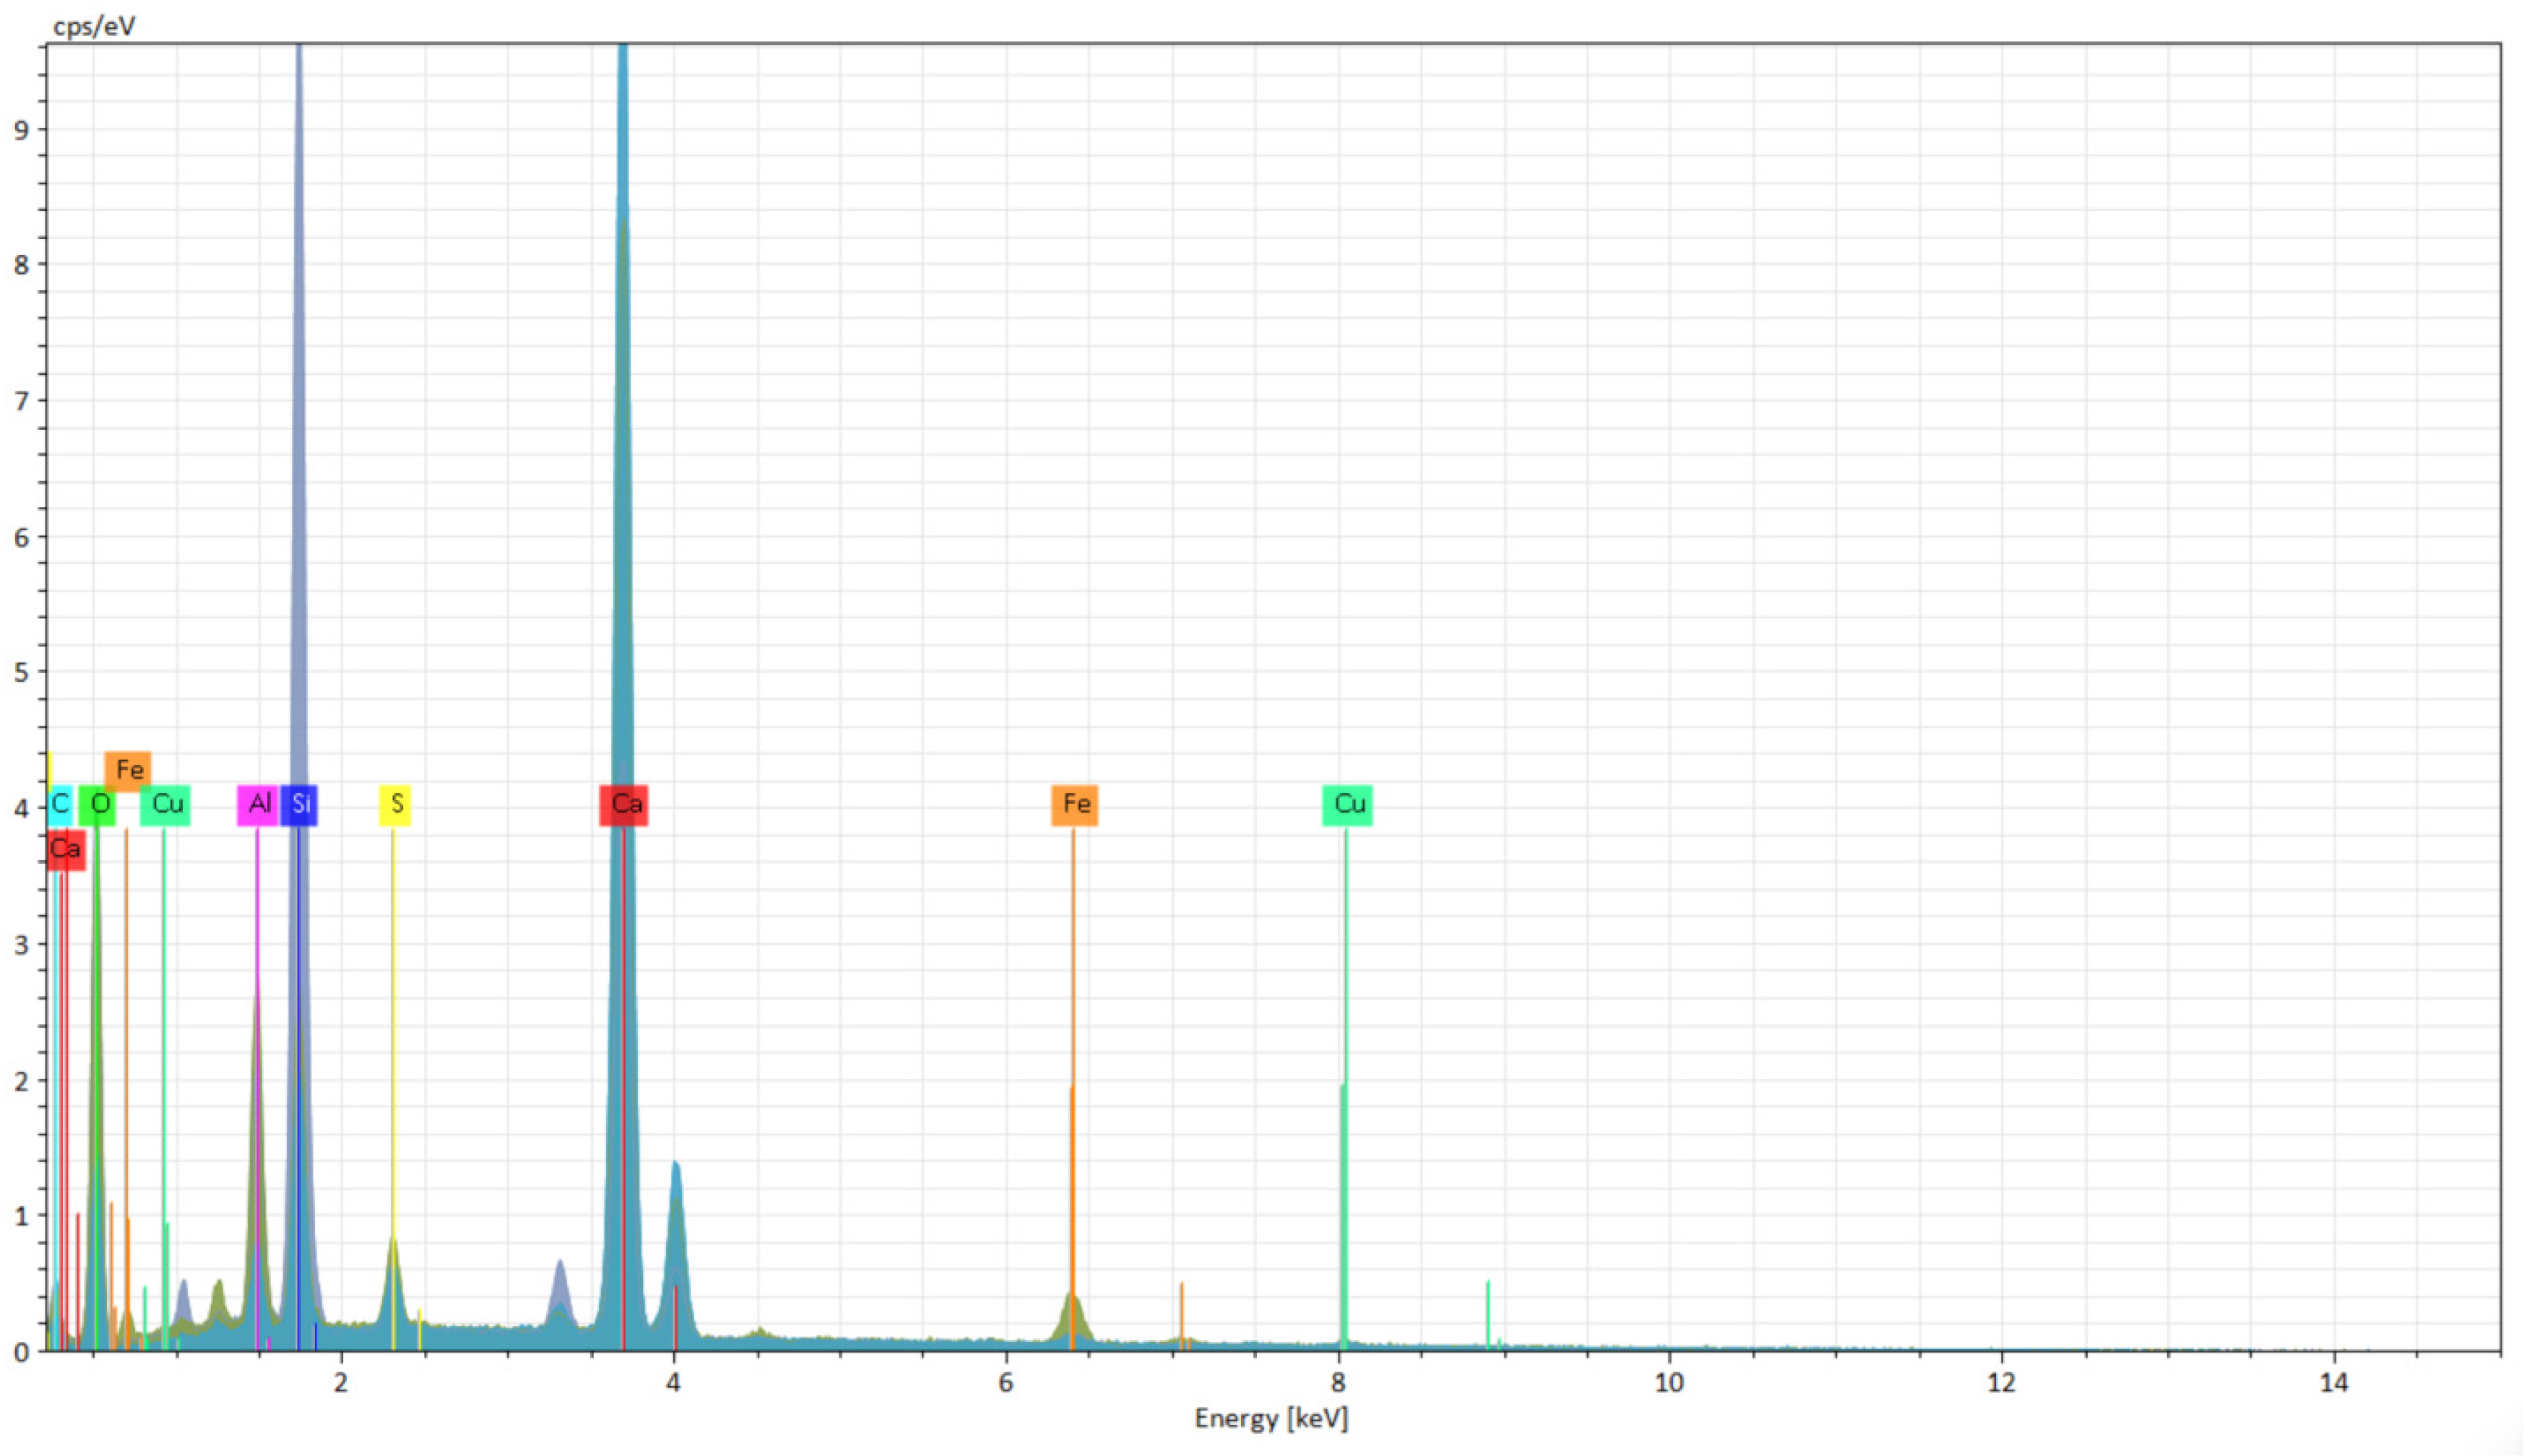
The mineralogical composition of the samples was evaluated using X-ray fluorescence analysis (XRF) to determine the elemental and mineralogical composition, as well as the effect of the additive components on the phase composition and crystal structure of the cement material (
Figure 1a). The change in mineralogical composition from the inclusion of additives of different concentrations in order to improve the physicochemical properties of cement was necessary to evaluate the performance of the additive and determine its potential suitability.
The cone spread tests (
Figure 1b) were performed in accordance with GOST 310.4 [
19]. The tests were carried out in two stages. At the first stage, the water–cement ratio was assessed for compliance with the standard cone slump value of 15 cm in diameter. At the second stage, tests were carried out at the water–cement ratio of stage 1 for samples with different concentrations of the modifying additive.
The samples were tested for compressive and flexural strength in accordance with GOST 310.4 (
Figure 1c,d), which are standard tests for evaluating the performance of injection mortars. The strength of samples with varying compositions was compared to determine the optimal composition of the modified additive and evaluate its effectiveness. Comparing the strength indicators of samples with and without the additive will allow us to assess the effect of the additive components on the modification of the injection solution and its transformation in terms of improving strength.
Water separation tests are basic for solutions (
Figure 1e) used as injection solutions and are performed in accordance with GOST 310.6 [
20]. The requirements for the limit values of water separation for solutions based on ordinary cement for general construction purposes with a specific surface area of up to 5000 cm
3/g are 2–10%. At the same time, the water separation of a stable solution is within 2–8%, a conditionally stable solution is 8–16%, and an unstable solution is >16%.
The selected concentration range of 0.2–1.0% by cement weight was determined on the basis of preliminary trials, which indicated that higher concentrations resulted in unstable mixtures, while increments smaller than 0.2% produced negligible differences. The stepwise increment of 0.2% ensured adequate resolution to identify threshold effects of the additive on mobility, strength, and water separation, while ensuring practical reproducibility in laboratory testing.
Tests for the setting time of the cement-sand mixture were performed in accordance with GOST 310.3 [
21] (
Figure 1f). The tests are also basic for assessing the performance of injection solutions. The evaluation criteria were the start of setting, the end of setting, and the duration. The standard indicator for assessing the setting time of a cement-based injection solution for general construction purposes is 3.5–13 h.
While the present study focused on laboratory-scale experiments, future research will expand the methodological framework by using statistical tools such as ANOVA to validate observed differences between sample groups more thoroughly. Furthermore, testing the material’s long-term durability under environmental stressors (e.g., freeze–thaw cycles, wet–dry alternation and exposure to saline solutions) will be necessary to assess its performance under realistic field conditions. Additionally, pilot-scale field trials will be conducted to confirm the practical applicability of the proposed additive in geotechnical engineering projects.
4. Discussion
Analysis of the elemental composition in comparison with the reference sample (Mix(R)) shows a significant increase in carbon (C) content, which is associated with the introduction of paraffin. This content reaches a maximum of 7.08% in Mix(0.4) and stabilises within 3–5%, with a further increase in the additive dosage. An increase in oxygen content indicates increased hydration process activity and component interaction. The slight change in calcium (Ca) content, the main ion of cement hydrate, indicates that the composition’s cementing ability is preserved. The introduction of the modifier results in a decrease in the content of alkali and alkaline earth metals (Na, K, Mg), which reduces the risk of secondary crystallisation and structural destruction. The stability of the silicon (Si) and aluminium (Al) content indicates stable formation of the silicate matrix.
The observed enhancements can be attributed to the chemical interactions and microstructural alterations induced by the paraffin-based additive. The increased carbon content contributes to the formation of calcium carbonate by reacting with portlandite (Ca(OH)2), thereby enhancing the density of the hydration products. Meanwhile, stabilising the calcium, silicon and aluminium content preserves the primary cementitious phases and maintains the integrity of the silicate matrix. Reduced concentrations of alkali and alkaline earth metals (Na, K, Mg) have been shown to reduce the risk of secondary crystallisation and delayed expansion, improving long-term stability. The results of the present study are consistent with those of microstructural studies of nano- and polymer-modified systems, in which densification of the cement stone and refinement of the pore structure have been observed.
According to
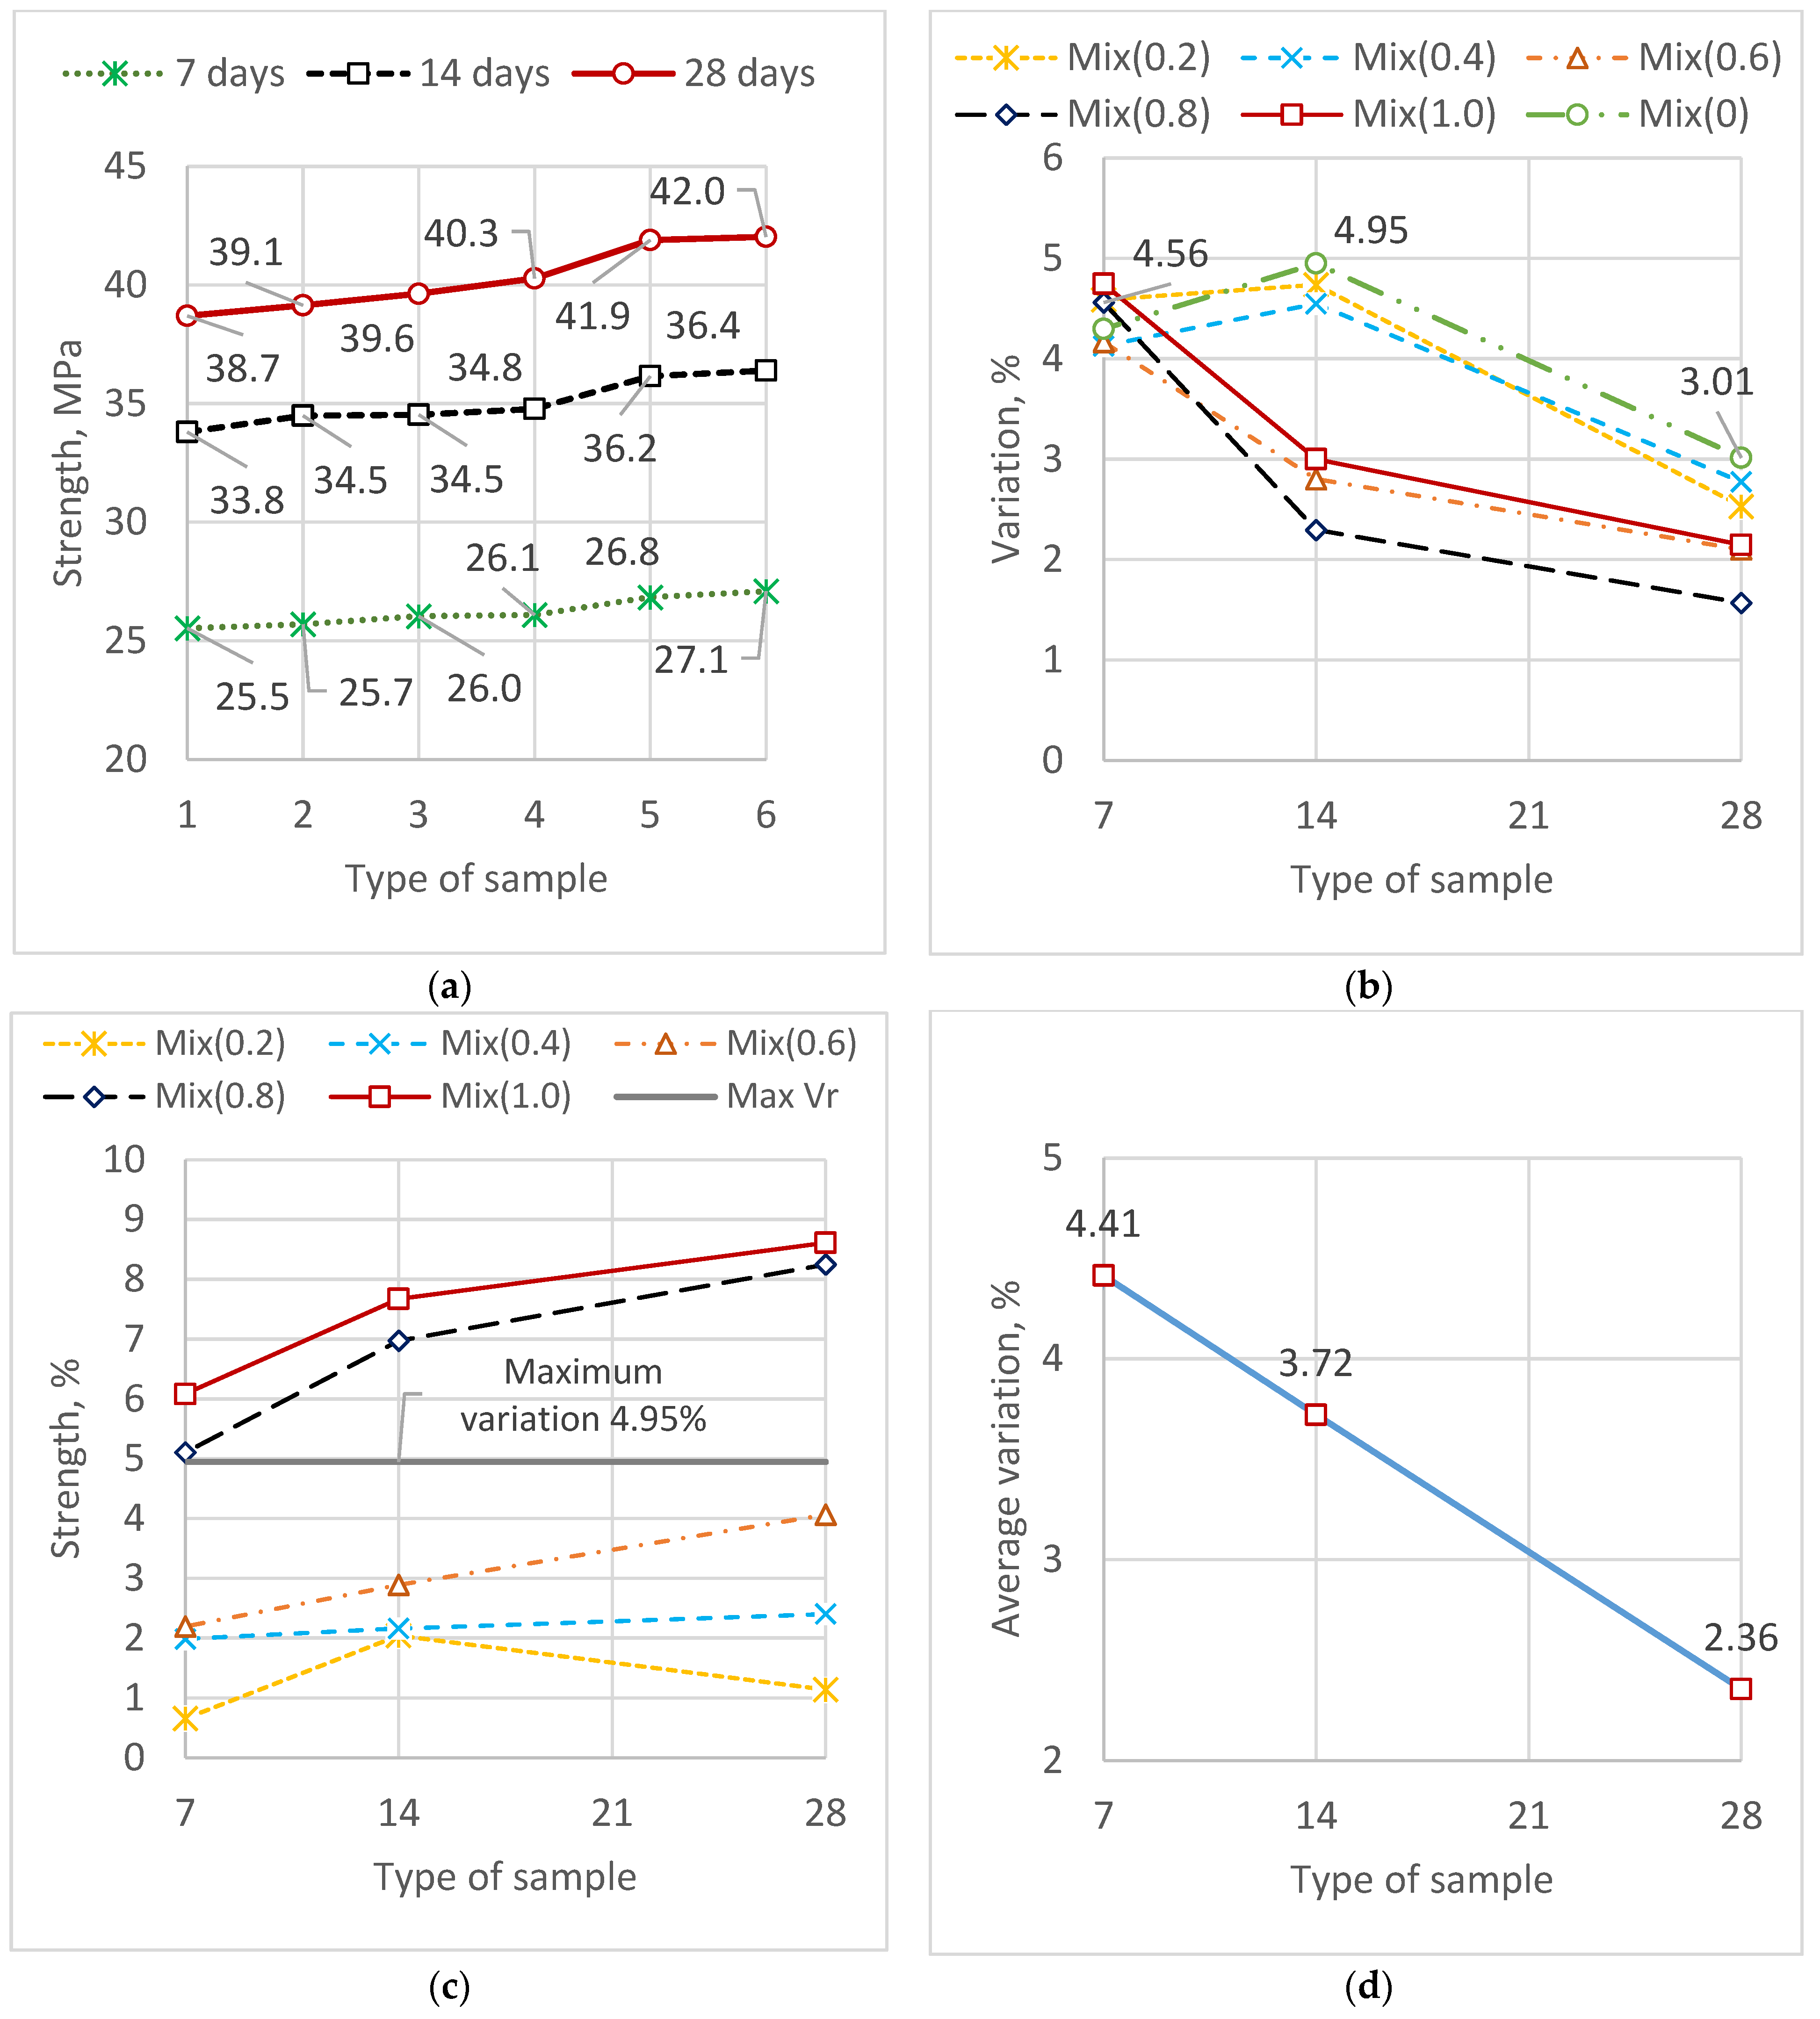
Figure 8a, there is a tendency for strength to increase with increasing additive concentration. The maximum average strength values were found in samples with the highest additive concentration (42 MPa), while the minimum values were found in the reference samples (38.7 MPa). This trend was evident across all concrete hardening lines. Numerically, the changes in strength are insignificant, for samples of different compositions they are as follows: Mix(0.2) ranges from 0.65 to 2.04%; Mix(0.4) ranges from 1.98 to 2.40%; Mix(0.6) ranges from 2.19 to 4.07%; Mix(0.8) ranges from 5.10 to 8.25%; Mix(1.0) ranges from 6.08 to 8.61%. According to diagram 2b, which illustrates the changes in coefficient of variation dynamics, the maximum value for the reference samples is 4.95%. This indicator is a measure of the maximum fluctuation of individual values from the average and therefore represents the threshold value of the additive’s effect on strength. In other words, if the percentage increase in strength exceeds this value, it can be attributed to the additive’s influence. Diagram 2b shows the percentage increase in strength and the maximum statistical error (4.95% coefficient of variation). It follows from this that curves lying above the maximum variation line can be attributed to changes in concrete’s strength characteristics, while curves below the line can be attributed to statistical error in individual strength values. Thus, at a concentration of 0.8% and above, there is a slight increase in concrete strength, reaching up to 8.25% relative to the reference sample. For an additive concentration of 1.0%, the increase relative to the reference sample is 8.61%. For 28-day samples, where the concrete’s structural strength is fully formed, the criterion for influence can be the coefficient of variation after 28 days of exposure, which is 3.01%. The influence of the additive on the maximum strength of concrete can then be observed at additive concentrations above 0.6%. However, the effect of the additive on the strength characteristics of concrete is insignificant, and this indicator is not important. Even if the strength characteristics were maintained after the additive was added, this would be a positive effect, since the main purpose of the additive is to increase the mobility of the injection mixture using ordinary building cement, i.e., to improve its ability to penetrate the soil. According to the changes in the coefficients of variation by sample age (
Figure 9a), it can be concluded that after the full strength gain period, the results become more stable, the spread of individual values decreases, which indicates that the samples are approaching full structural strength. In the initial hardening period, the structural strength is less stable, with coefficients averaging 4.41%; at the end of the strength gain period, the coefficients decrease to 2.36%.
A comparison of these findings with those of state-of-the-art additives reveals several differences. It has been demonstrated that polymer-based admixtures can improve durability and water resistance. However, these admixtures are expensive and require precise control of the curing process. Using nanomaterials, such as nanosilica, has been shown to substantially increase microstructural density and strength. It should be noted, however, that the efficacy of this approach depends on the implementation of sophisticated dispersion techniques. Geopolymer binders are garnering attention as sustainable alternatives, but their practical adoption is constrained by the availability of raw materials and the complexity of processing. In contrast, the paraffin-based additive investigated in this study offers a cost-effective, readily accessible solution that ensures sufficient mobility and stability without compromising strength. This makes paraffin a practical addition to modern additives, particularly in the engineering–geological conditions of Central Kazakhstan.
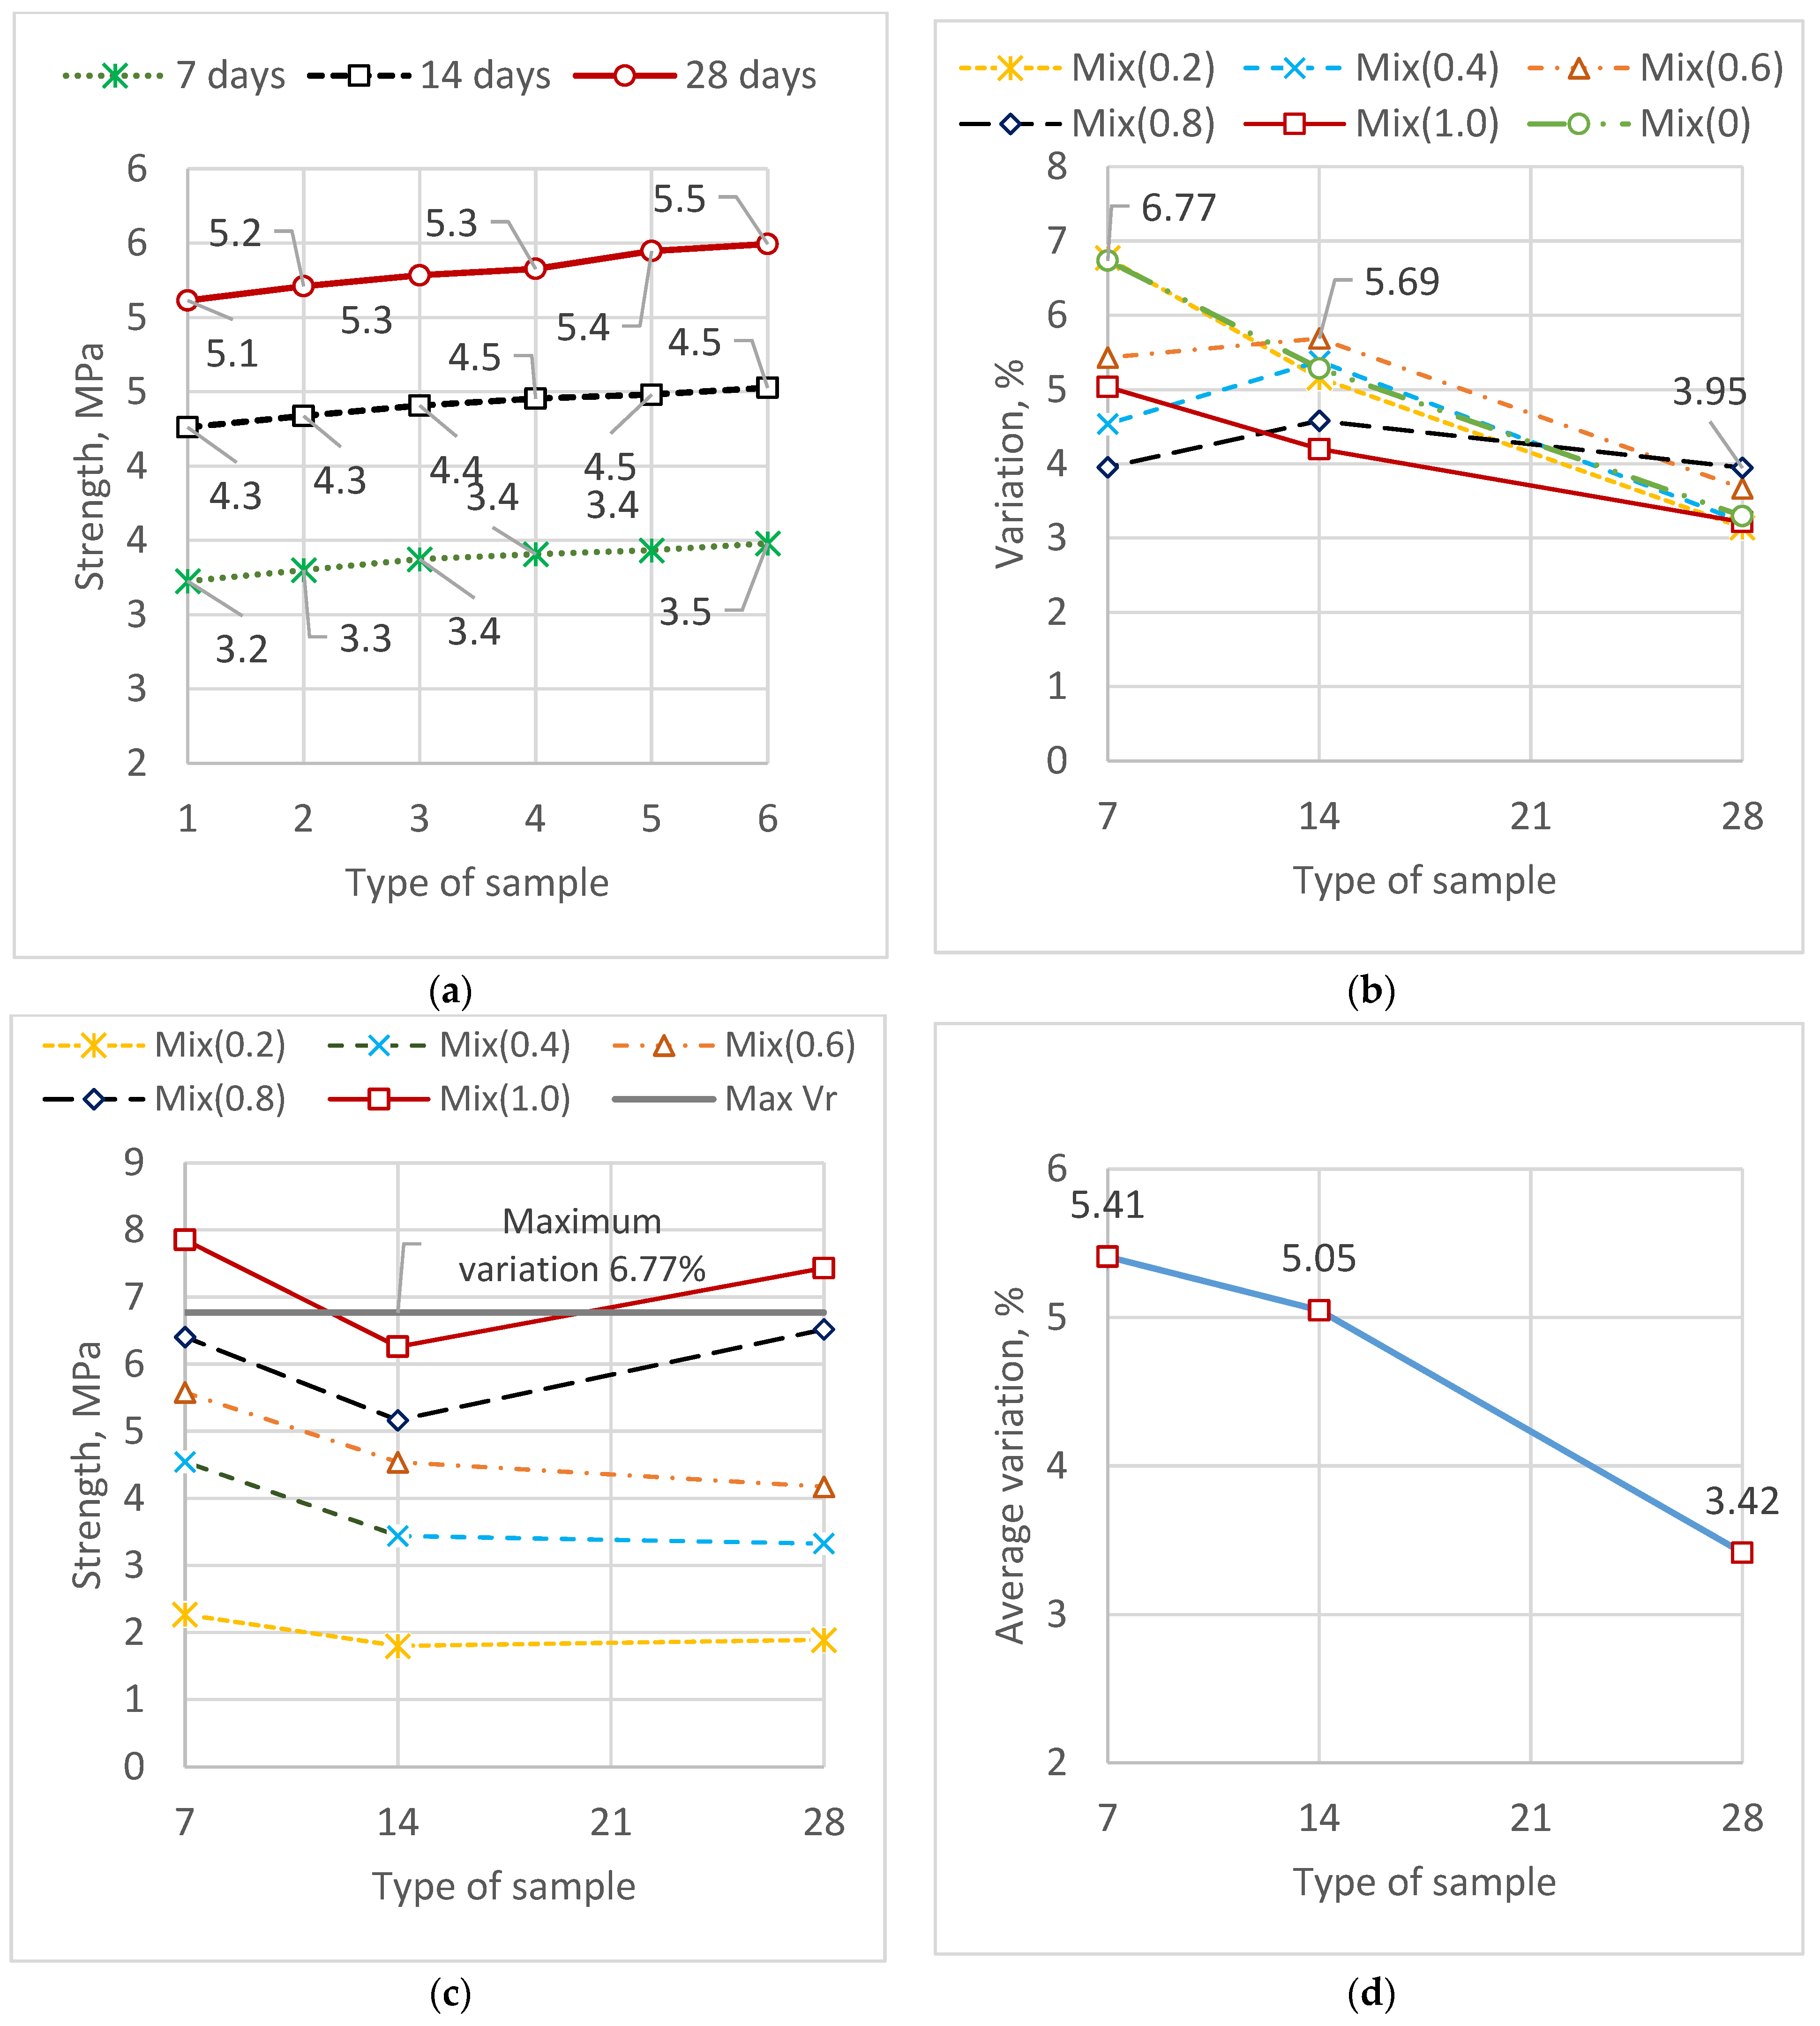
As with compressive strength, maximum average strength values were found in samples with the highest additive concentration (5.5 MPa), while minimum values were found in reference samples (5.1 MPa). While there is a tendency for strength to increase with increasing additive concentration, this is quite insignificant. Numerically, the changes in strength for samples of different compositions are as follows: Mix(0.2) ranges from 1.80 to 2.27%; Mix(0.4) ranges from 3.32 to 4.55%; Mix(0.6) ranges from 4.17 to 5.58%; Mix(0.8) ranges from 5.16 to 6.52%; Mix(1.0) ranges from 6.26 to 7.85%. According to diagram 2B, the maximum values of the coefficient of variation are 6.77%. Therefore, as in the case of compressive strength, this indicator will characterize the effect of the additive on the change in strength. Then, from diagram 2B, it follows that the effect of the additive on strength (whose values exceed the coefficient of variation) at 28 days of age is observed only at a concentration of 1.0%. Thus, in the case of flexural strength, the positive effect is the preservation of strength indicators after the addition of 0.2 to 0.8% of the additive. According to the changes in the coefficients of variation by sample age (diagram 2G), it can be concluded that after the full strength gain period, the results become more stable, the spread of individual values decreases, which indicates that the samples are approaching full structural strength. In the initial hardening period, the structural strength is less stable, with coefficients averaging 5.41%; at the end of the strength gain period, the coefficients decrease to 3.42%.
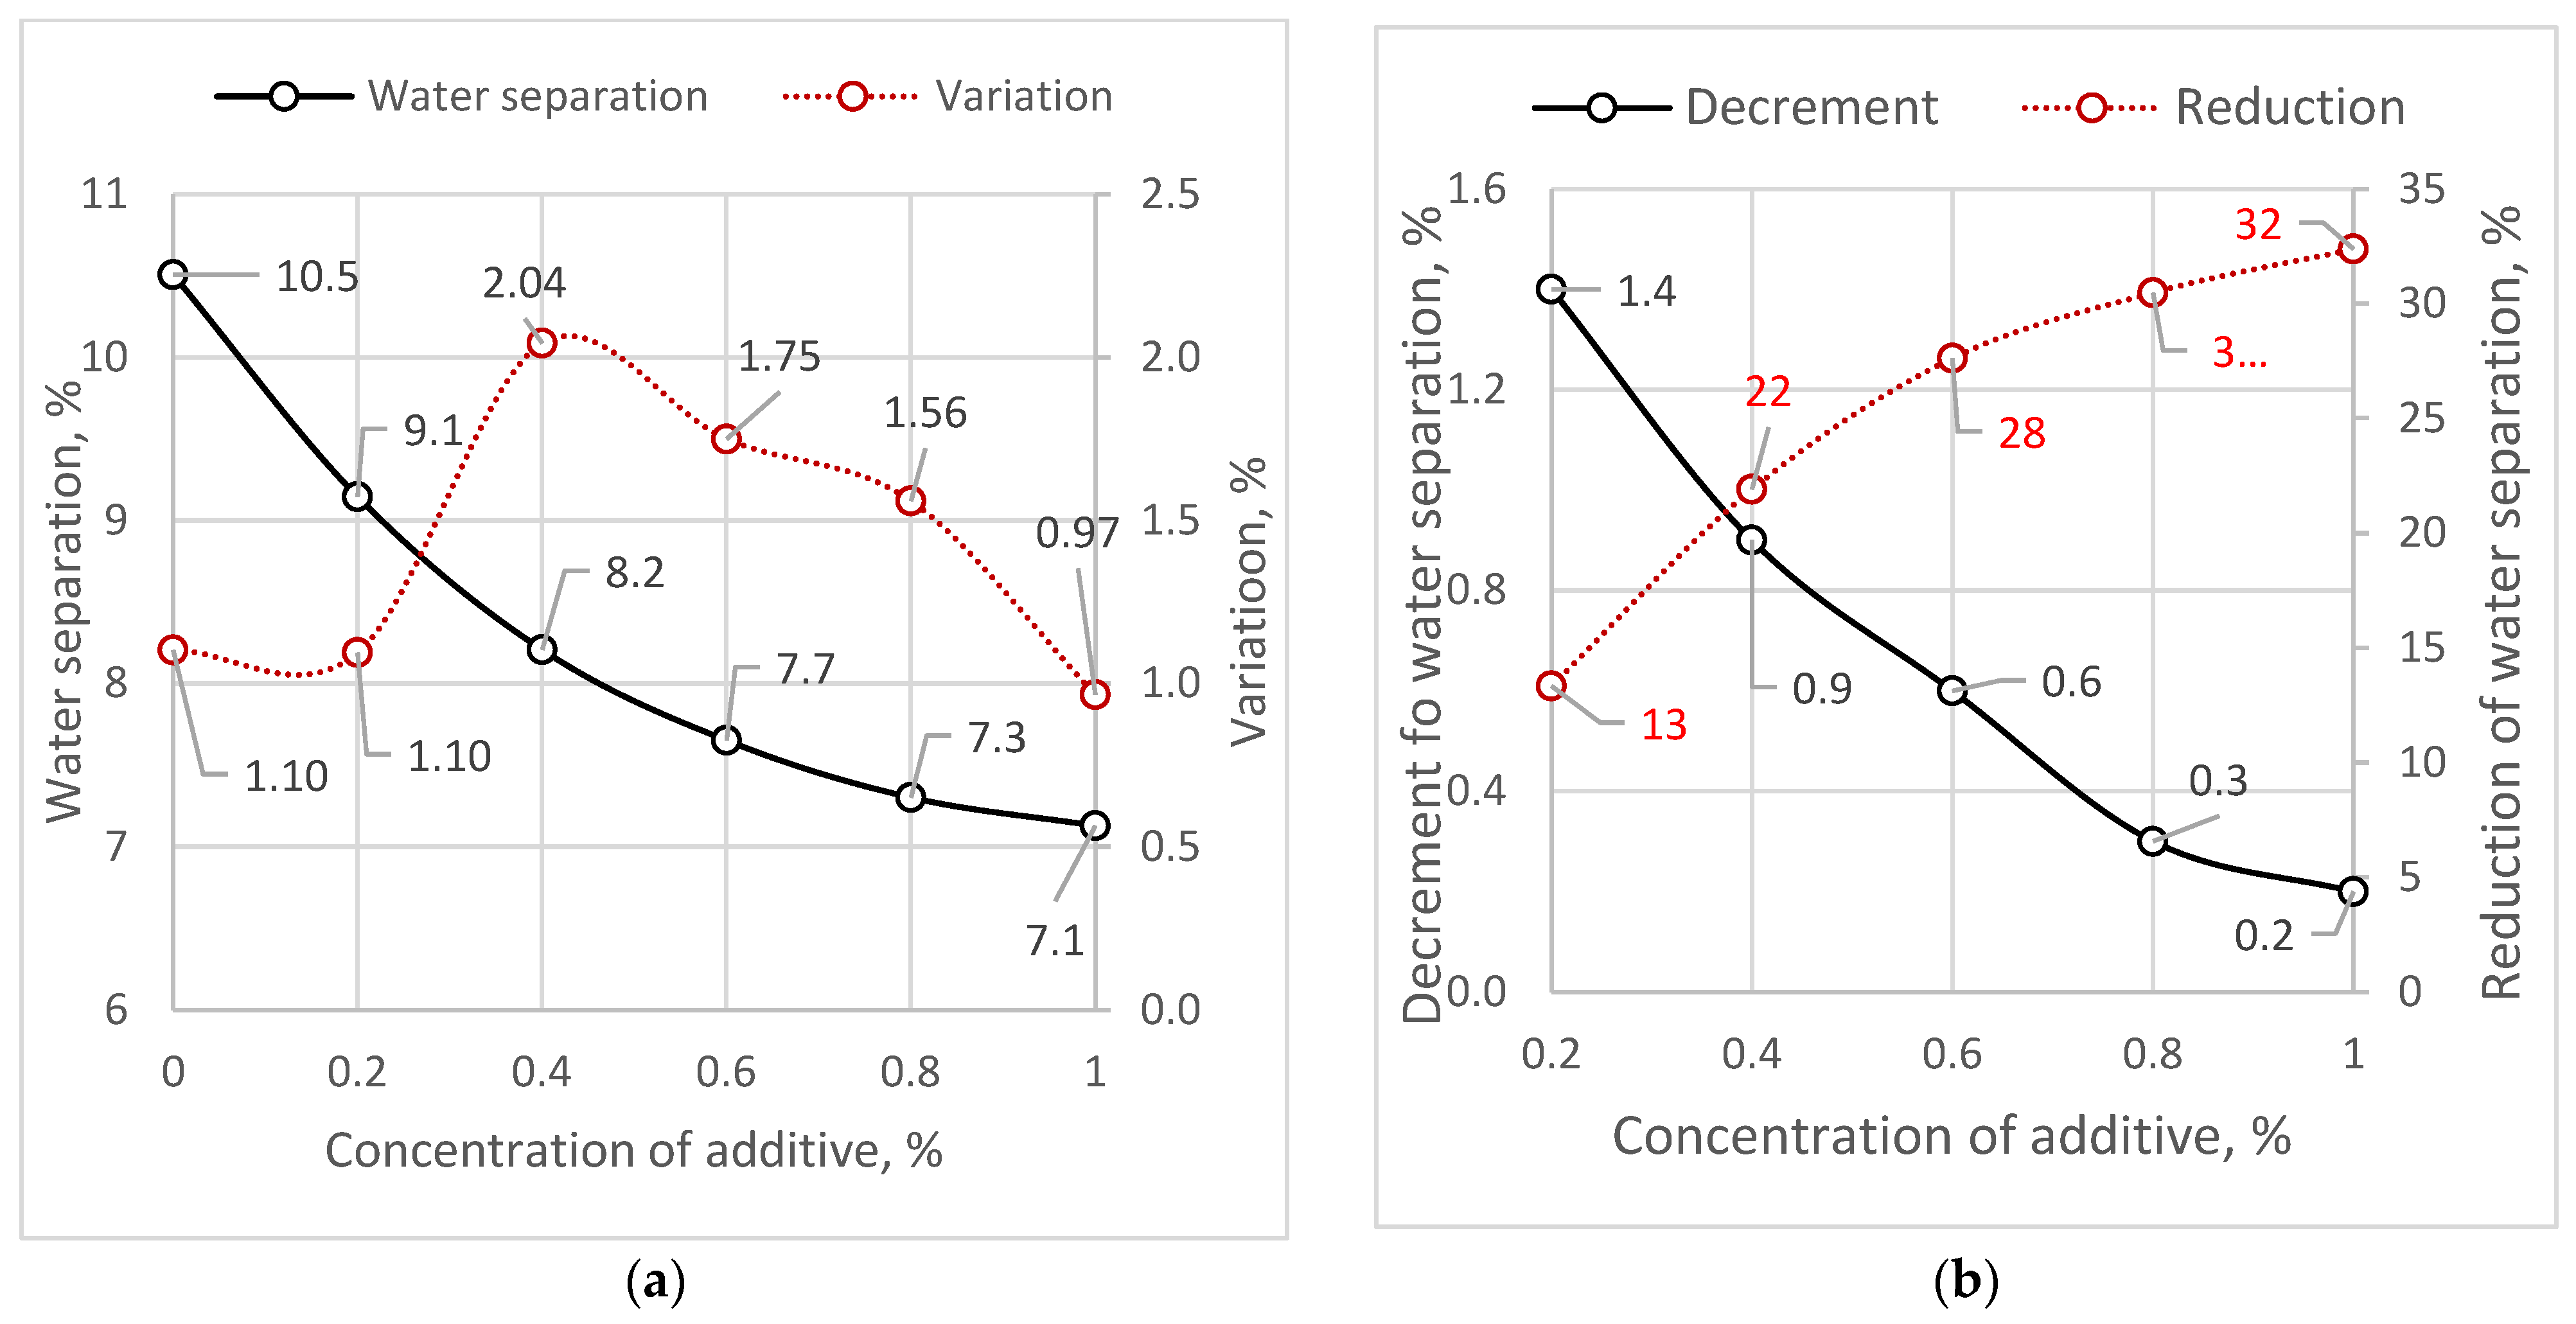
According to the test results, the average water separation value of the reference sample is 10.5%, and the individual values range from 10.39% to 10.67% with a coefficient of variation of 1.1%. According to regulatory requirements, the solution is considered conditionally stable, since water separation is within the range of 8–16%. The average water separation value of the Mix(0.2) samples is 9.1%, with individual values ranging from 9.01 to 9.29% and a coefficient of variation of 1.1%. The decrement in water separation is 1.4%, and the total reduction from the reference sample is 13%. The Mix(0.2) solution is also considered conditionally stable. The average water separation value of the Mix(0.4) samples is 8.2%, with individual values ranging from 8.03 to 8.42% and a coefficient of variation of 2.04%. The water separation decrement is 0.9%, and the total reduction from the reference sample is 22%. The water absorption values of the Mix(0.4) solution can be classified as the lower limit of conditionally stable solutions. The average water separation value of Mix(0.6) samples is 7.7%, with individual values ranging from 7.49 to 7.84% and a coefficient of variation of 1.75%. The decrement of water separation is 0.6%, and the total reduction from the reference sample is 28%. According to regulatory requirements, the Mix(0.6) solution is already considered stable, since water separation does not exceed 8%. The average water separation value for Mix(0.8) samples is 7.3%, with individual values ranging from 7.19 to 7.47% and a coefficient of variation of 1.56%. The decrement in water separation is up to 0.3%, and the total reduction from the reference sample is 30%. The Mix(0.8) solution is also considered stable. The average water separation value for Mix(1.0) samples is 7.1%, with individual values ranging from 7.05 to 7.21% and a coefficient of variation of 0.97%. The decrement in water separation decreases to 0.2%, and the total reduction from the reference sample is 32%. The Mix(1.0) solution is also stable. All water absorption datapoints have a high degree of convergence, as evidenced by the coefficients of variation, and deviations from the average do not exceed 1%, which meets the requirements of GOST 310.6. According to diagram 1B, with each subsequent increase in the concentration of the additive, a decrease in decrements is observed, which indicates a decrease in the dynamics of the additive’s effect. The solution becomes stable at a concentration of 0.6% or above, and any subsequent increase in the additive is practically imperceptible. When selecting the optimal additive ratio, a concentration of 0.6% or more of the modifying additive will be considered ideal for water separation.
Depending on the WCR (from 0.30 to 0.50), the average slump flow values range from 99 mm to 147 mm. At the same time, the data points of slump flows within each test series showed a high correlation, since the coefficients of variation did not exceed 4.0% in all cases. According to the diagrams, the increase in slump flow is not proportional to the increase in WCR; with each partial addition of water, the increase in slump flow increases. The increase decreases significantly at WCR = 0.5, but at the same time, the permissible mobility of the injection solution, close to 150 mm, is achieved. According to the diagram, with an increase in WCR, the coefficient of variation decreases, which indicates stabilization of the solution in terms of its mobility with an increase in water in its composition. Thus, for the control solution, we take the value WCR = 0.5, for which further studies of the change in the mobility of the mixture with the addition of a modifier will be carried out.
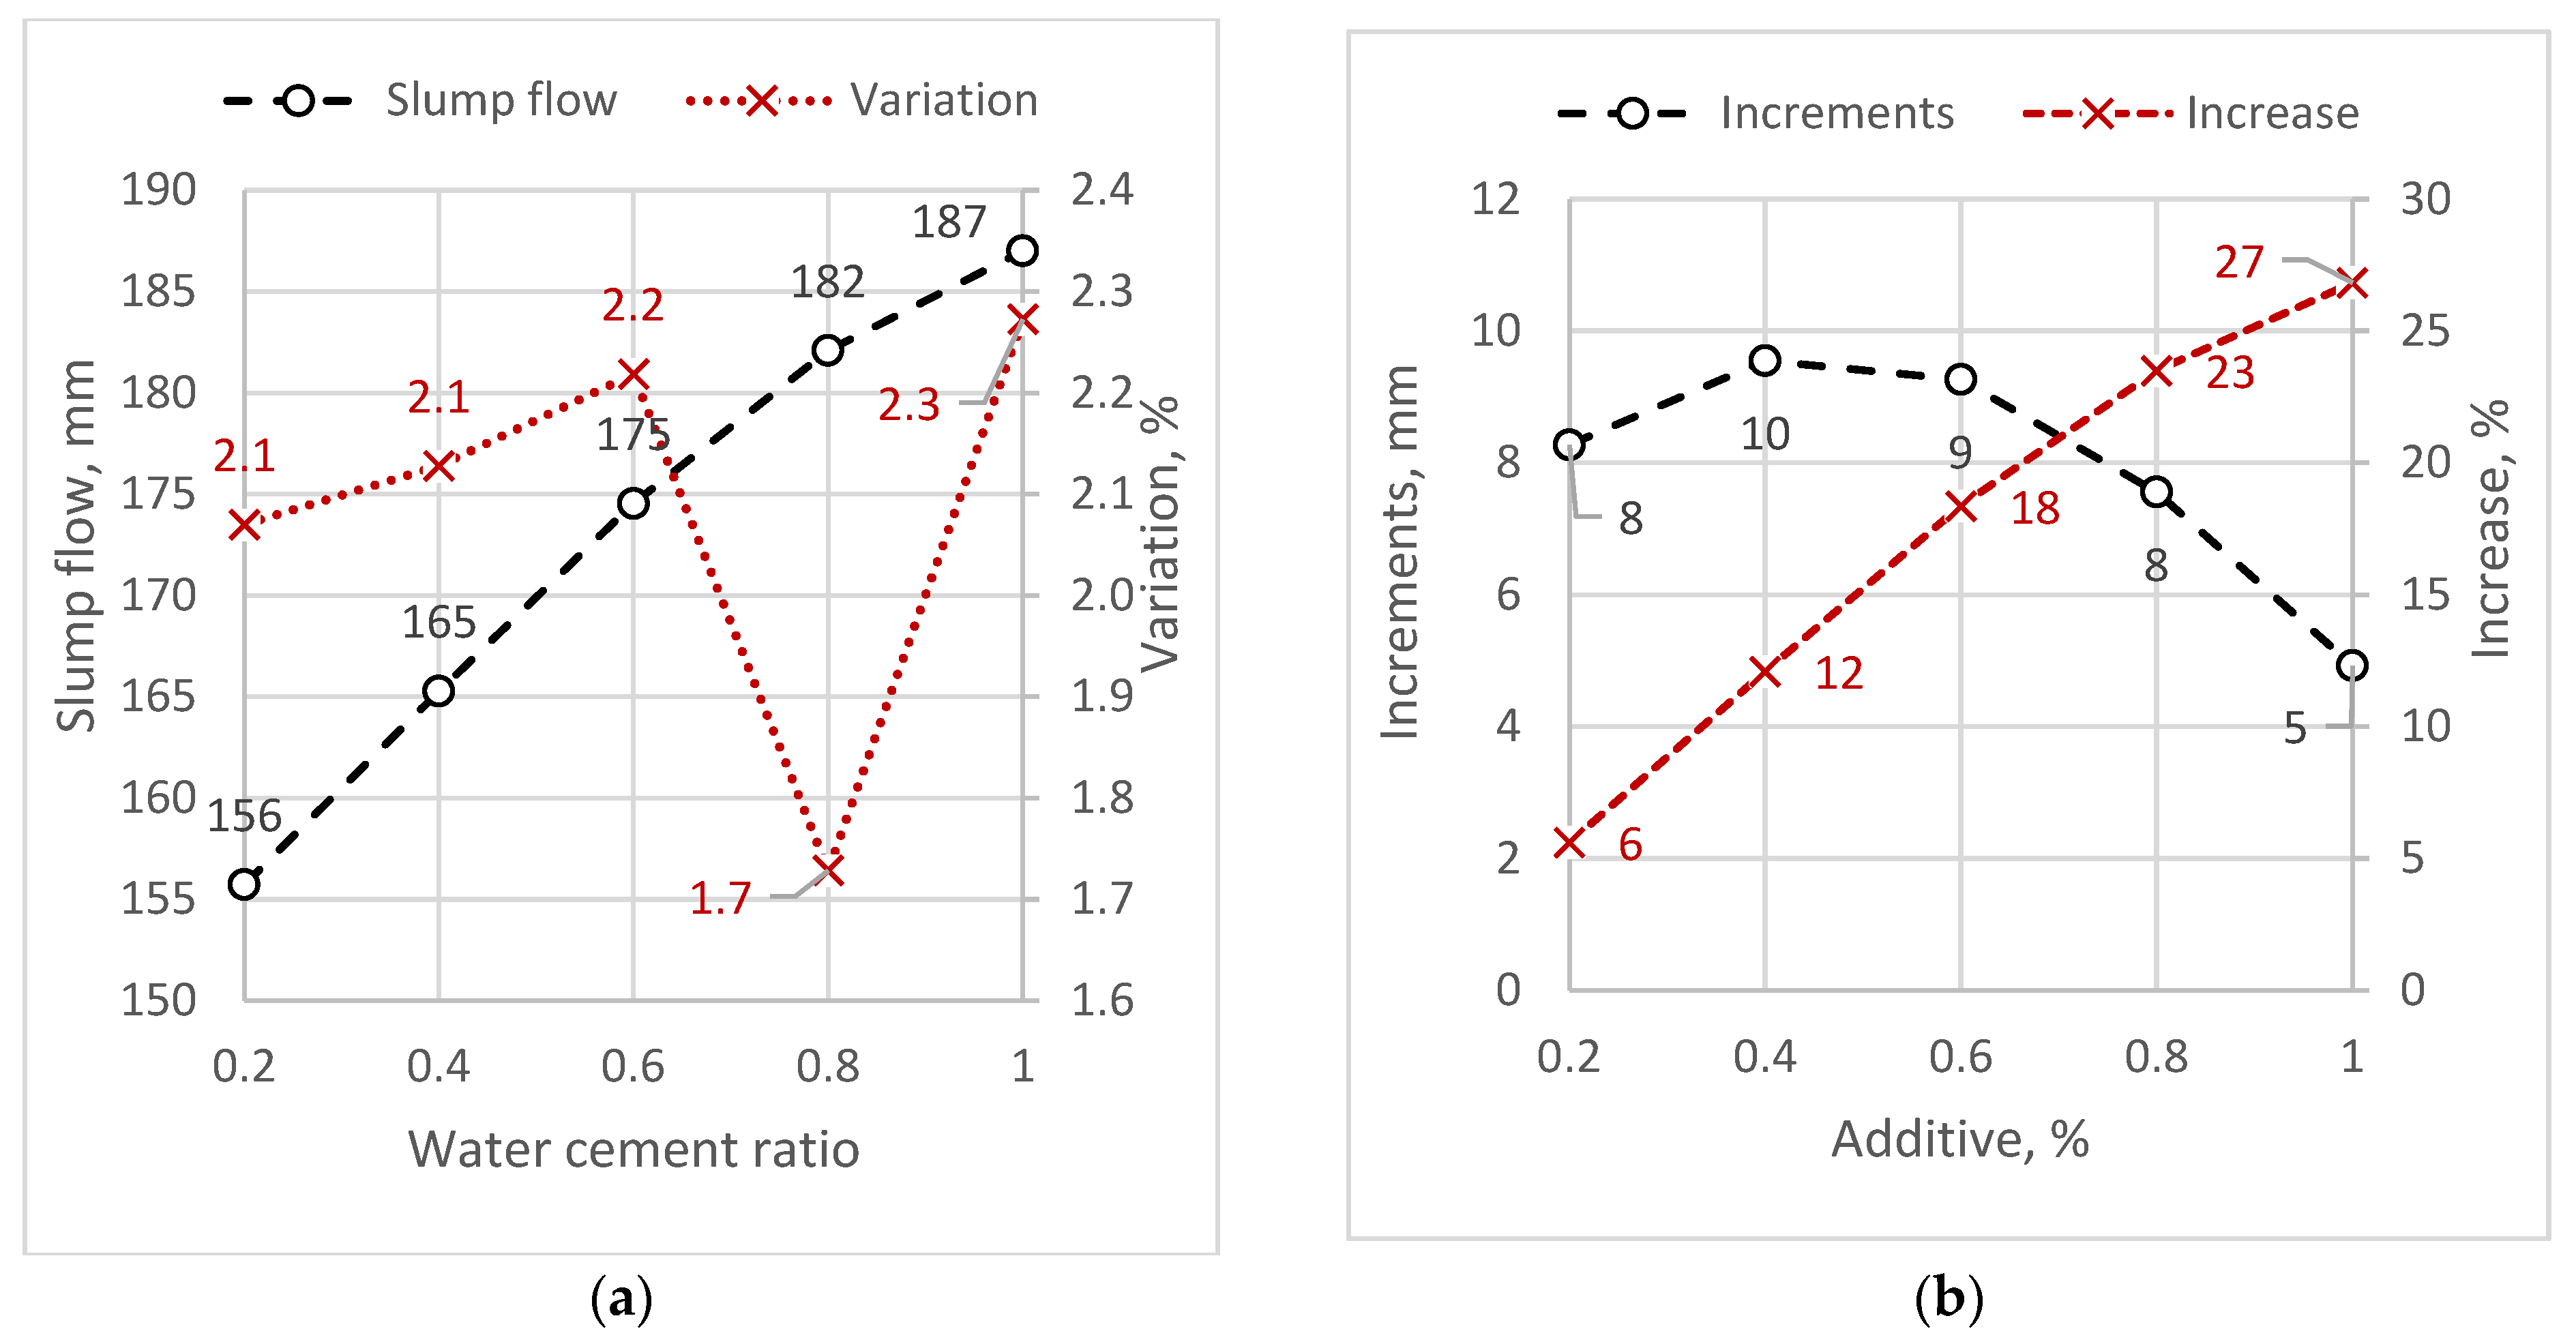
According to the test results, the average slump flow value ranges from 156 mm to 187 mm depending on the additive concentration. The increase in slump flow is relatively linear but decreases at the additive’s maximum concentration. This indicates that the additive is approaching its peak effect on the mobility of the mixture. In terms of the increase in spread diameter, the percentage increase in slump flow relative to the reference sample is 23%. However, when considering the slump flow area, the most reasonable measure, the increase reaches 62% at the additive’s maximum concentration. The coefficients of variation are low, not exceeding 2.3%, which indicates that the solution has high mobility and stable slump flow values. As the increase in slump flow is not proportional to the additive (i.e., with each subsequent 0.2% addition of the additive, the increase in slump flow decreases), subsequent studies should select the optimal concentration of the modifying additive in terms of slump flow, which is 0.6–0.8%. In all cases, the coefficients of variation do not exceed 2.3%, indicating a close relationship between the individual values and the reliability of the obtained results.
According to the diagrams in
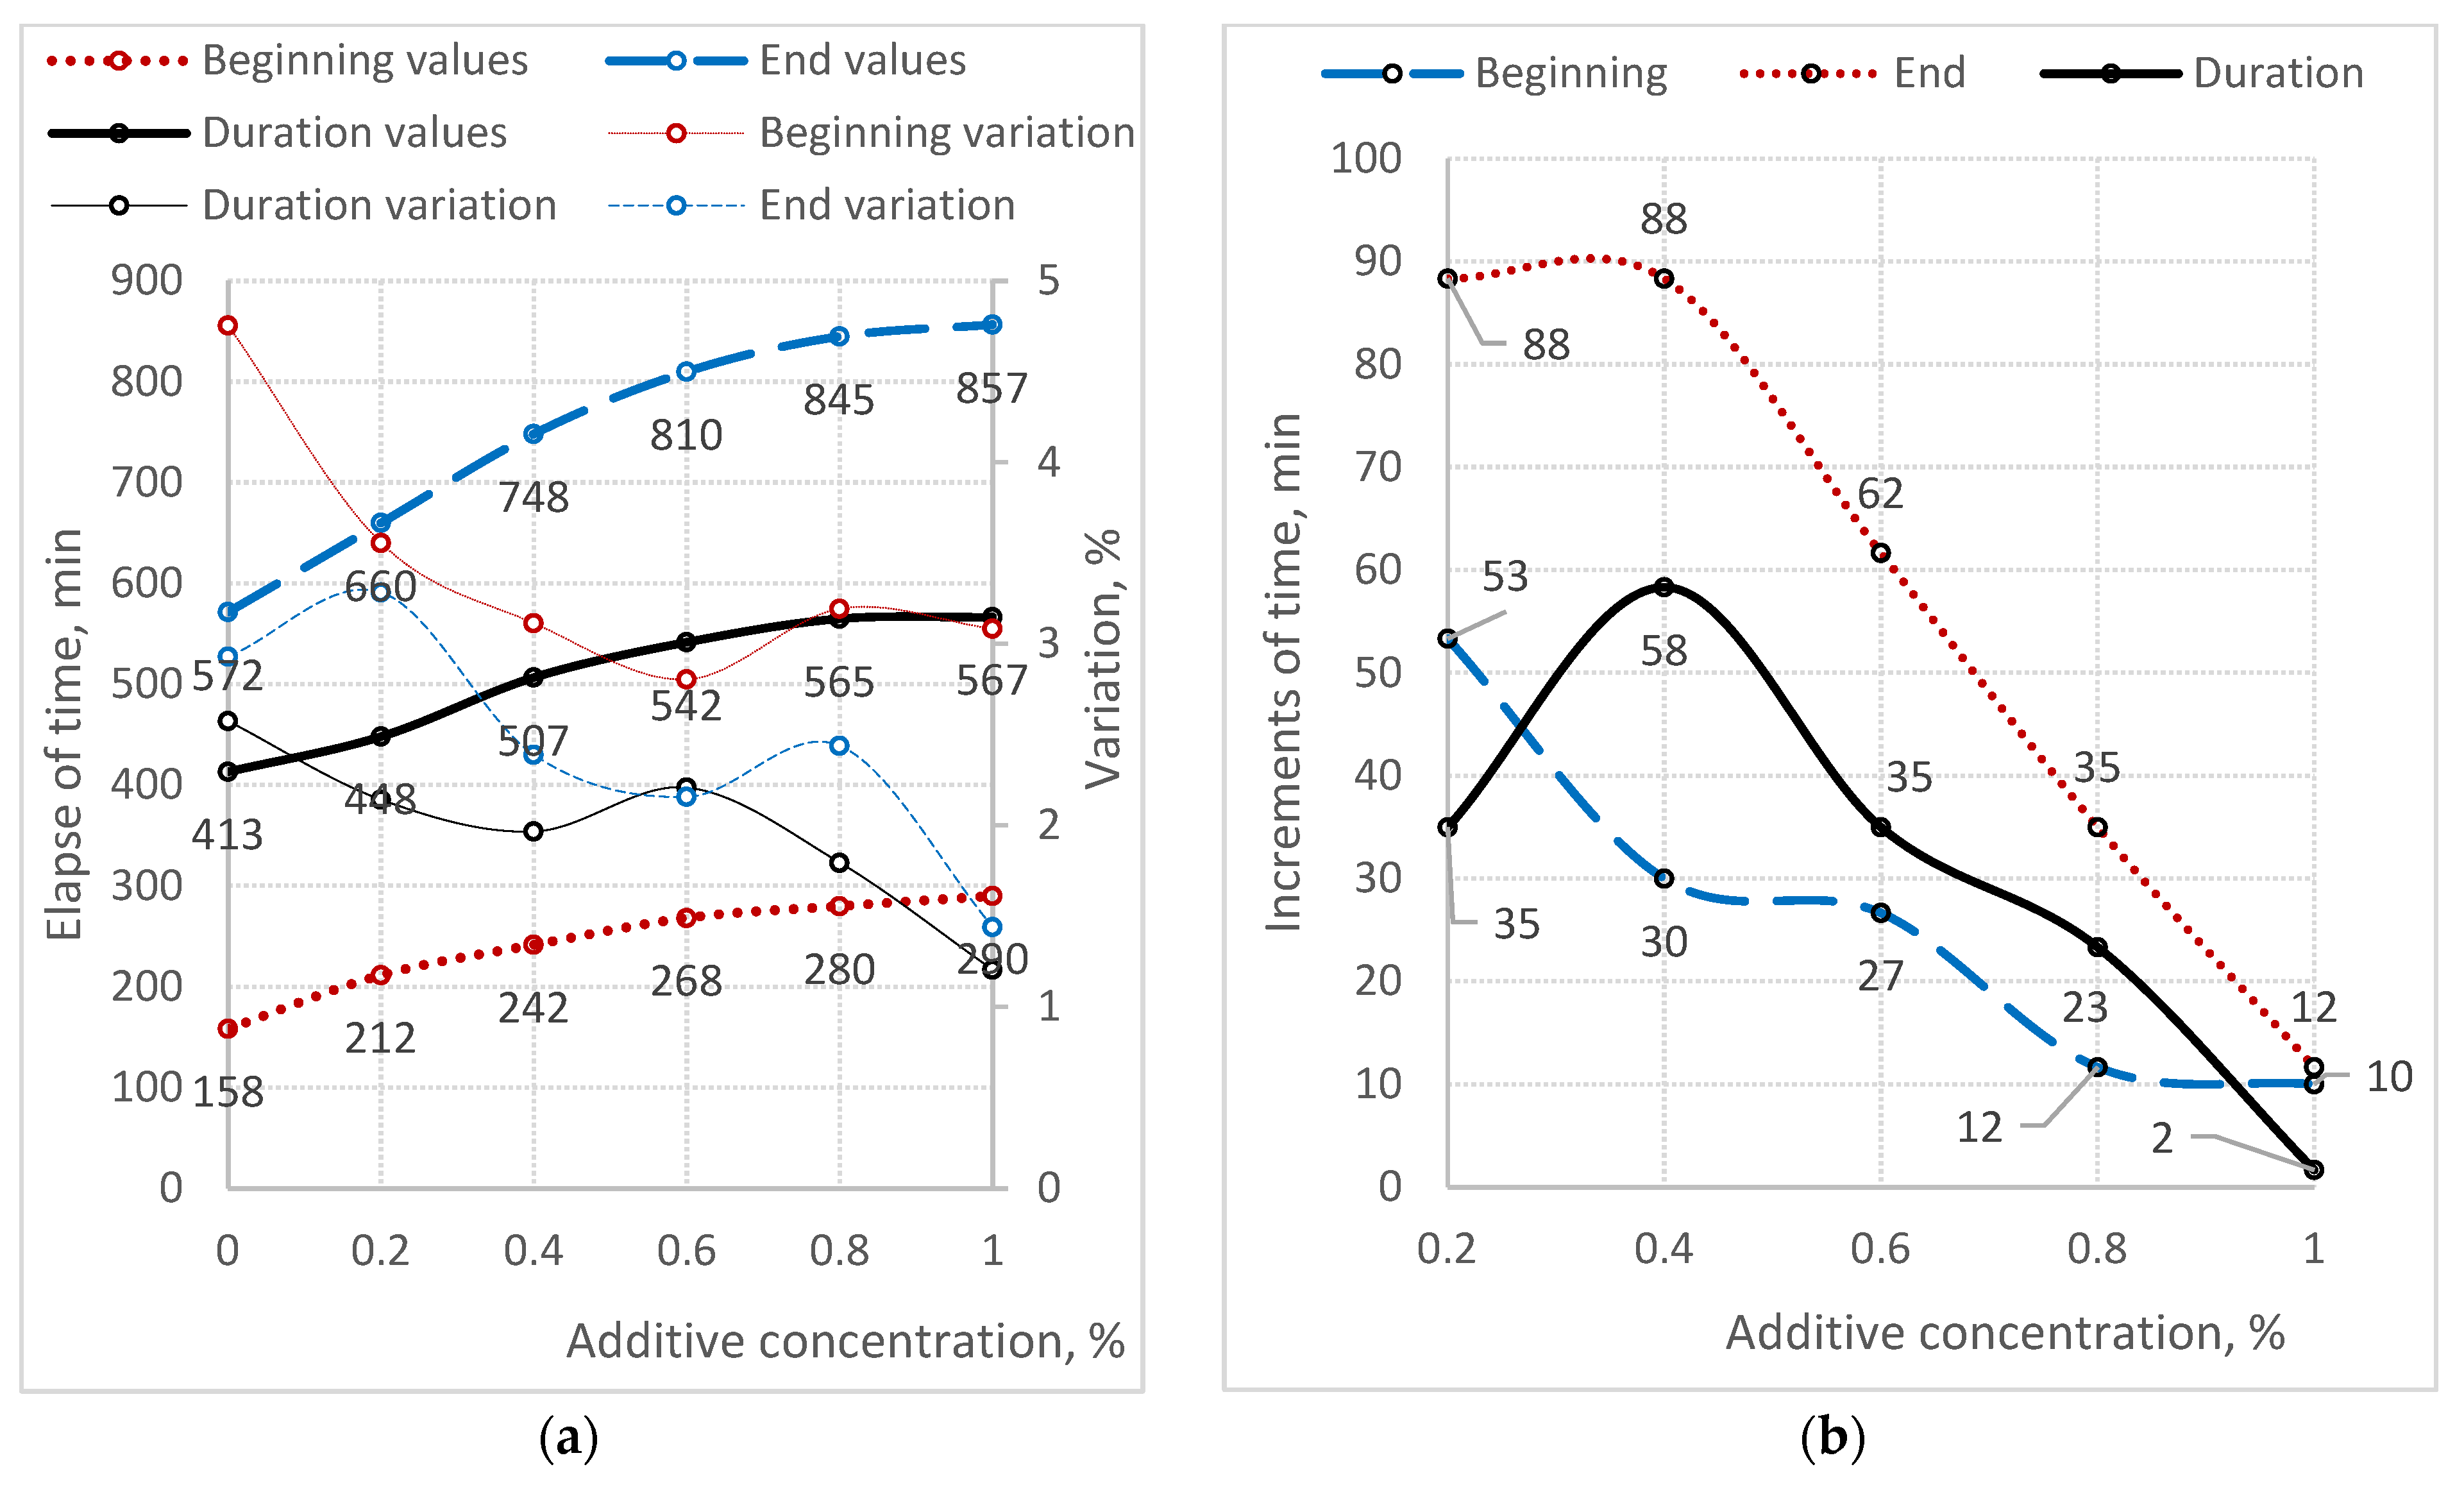
Figure 10a, the minimum average setting time for the reference samples is 158 min. The data point values range from 150 to 170 min, and the coefficient of variation in the data points is 4.8%. The maximum average setting time was recorded for samples with the highest concentration of the modifying additive: 290 min, with data points ranging from 280 to 300 min and a coefficient of variation of 3.1%. Similar trends are observed for setting completion times: the minimum average for reference samples is 572 min, with data points in the range 550–590 min and a coefficient of variation of 2.6%; the maximum for samples with a 1.0% concentration is 857 min, with data points in the range 830–890 min and a coefficient of variation of 1.2%. All data points have high convergence and close correlation, as evidenced by relatively low coefficients of variation that do not exceed 5% in any of the test series. Additionally, an increase in the additive concentration is associated with a decrease in the variation coefficients, potentially indicating an increase in the stability of the setting time of the solution due to the plasticising effect.
According to the diagrams in
Figure 10b, setting times increase nonlinearly with the addition of the additive. While the additive’s effect is maintained, its effectiveness is significantly reduced with each subsequent addition. For example, if the additive is first added at 0.2%, the increase in setting time is 88 min; however, when 1.0% of the additive is added, the increase is only 12 min. In the case of the end of setting, the increase with 1.0% additive is only 2 min. According to the diagrams in
Figure 2 the additive’s maximum effectiveness is reflected in the setting time relative to the reference sample, although this decreases with an increase in the additive. This cannot be said of the setting time, where increasing the additive concentration above 0.8% has no effect on this indicator. This is reflected in the setting times, where at 0.8% and 1.0% concentrations, the respective values of 565 and 567 min are practically identical, indicating that the additive has reached its maximum possible effect on the mixture’s setting times. Therefore, the optimal concentration for the additive’s effect on setting time is 0.8%, though concentrations between 0.4% and 1.0% may also be considered, depending on the subsequent studies’ manifestations of the mixture’s other physical and mechanical properties.
