Study on the Energy Distribution and Dissipation of High-Rise Structures Under Long-Period Ground Motions
Abstract
1. Introduction
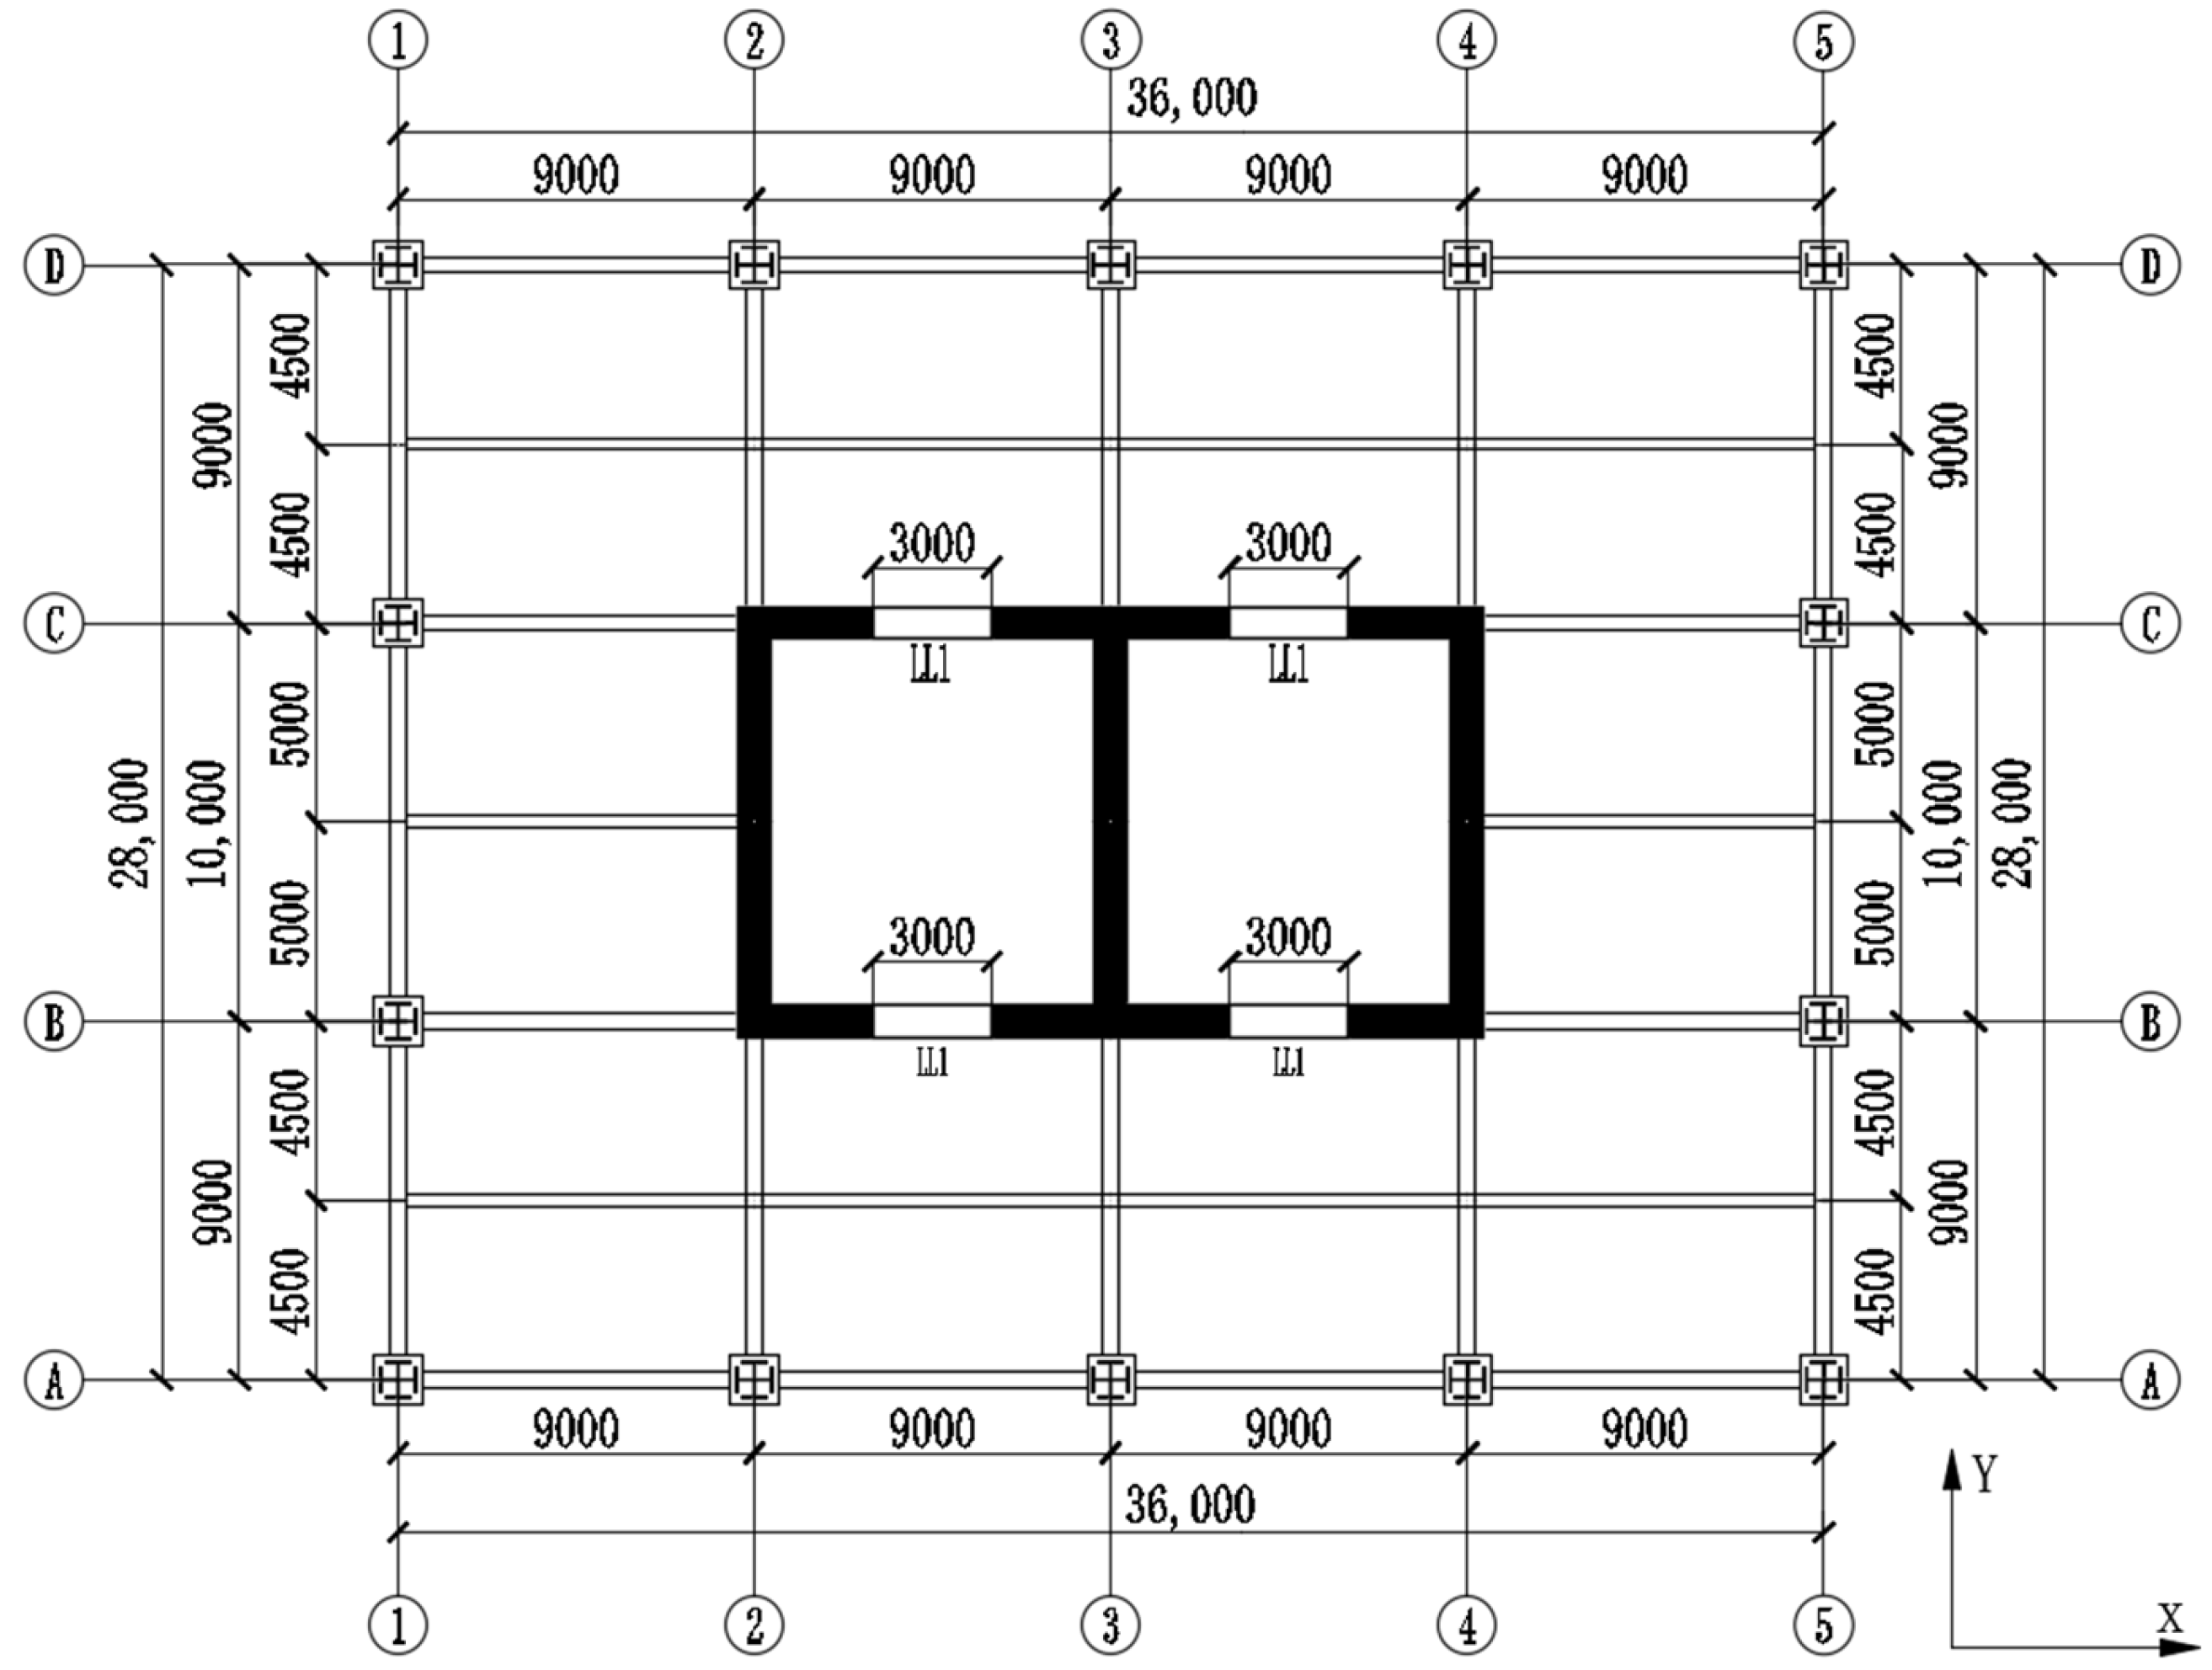
2. Structural Analysis Model
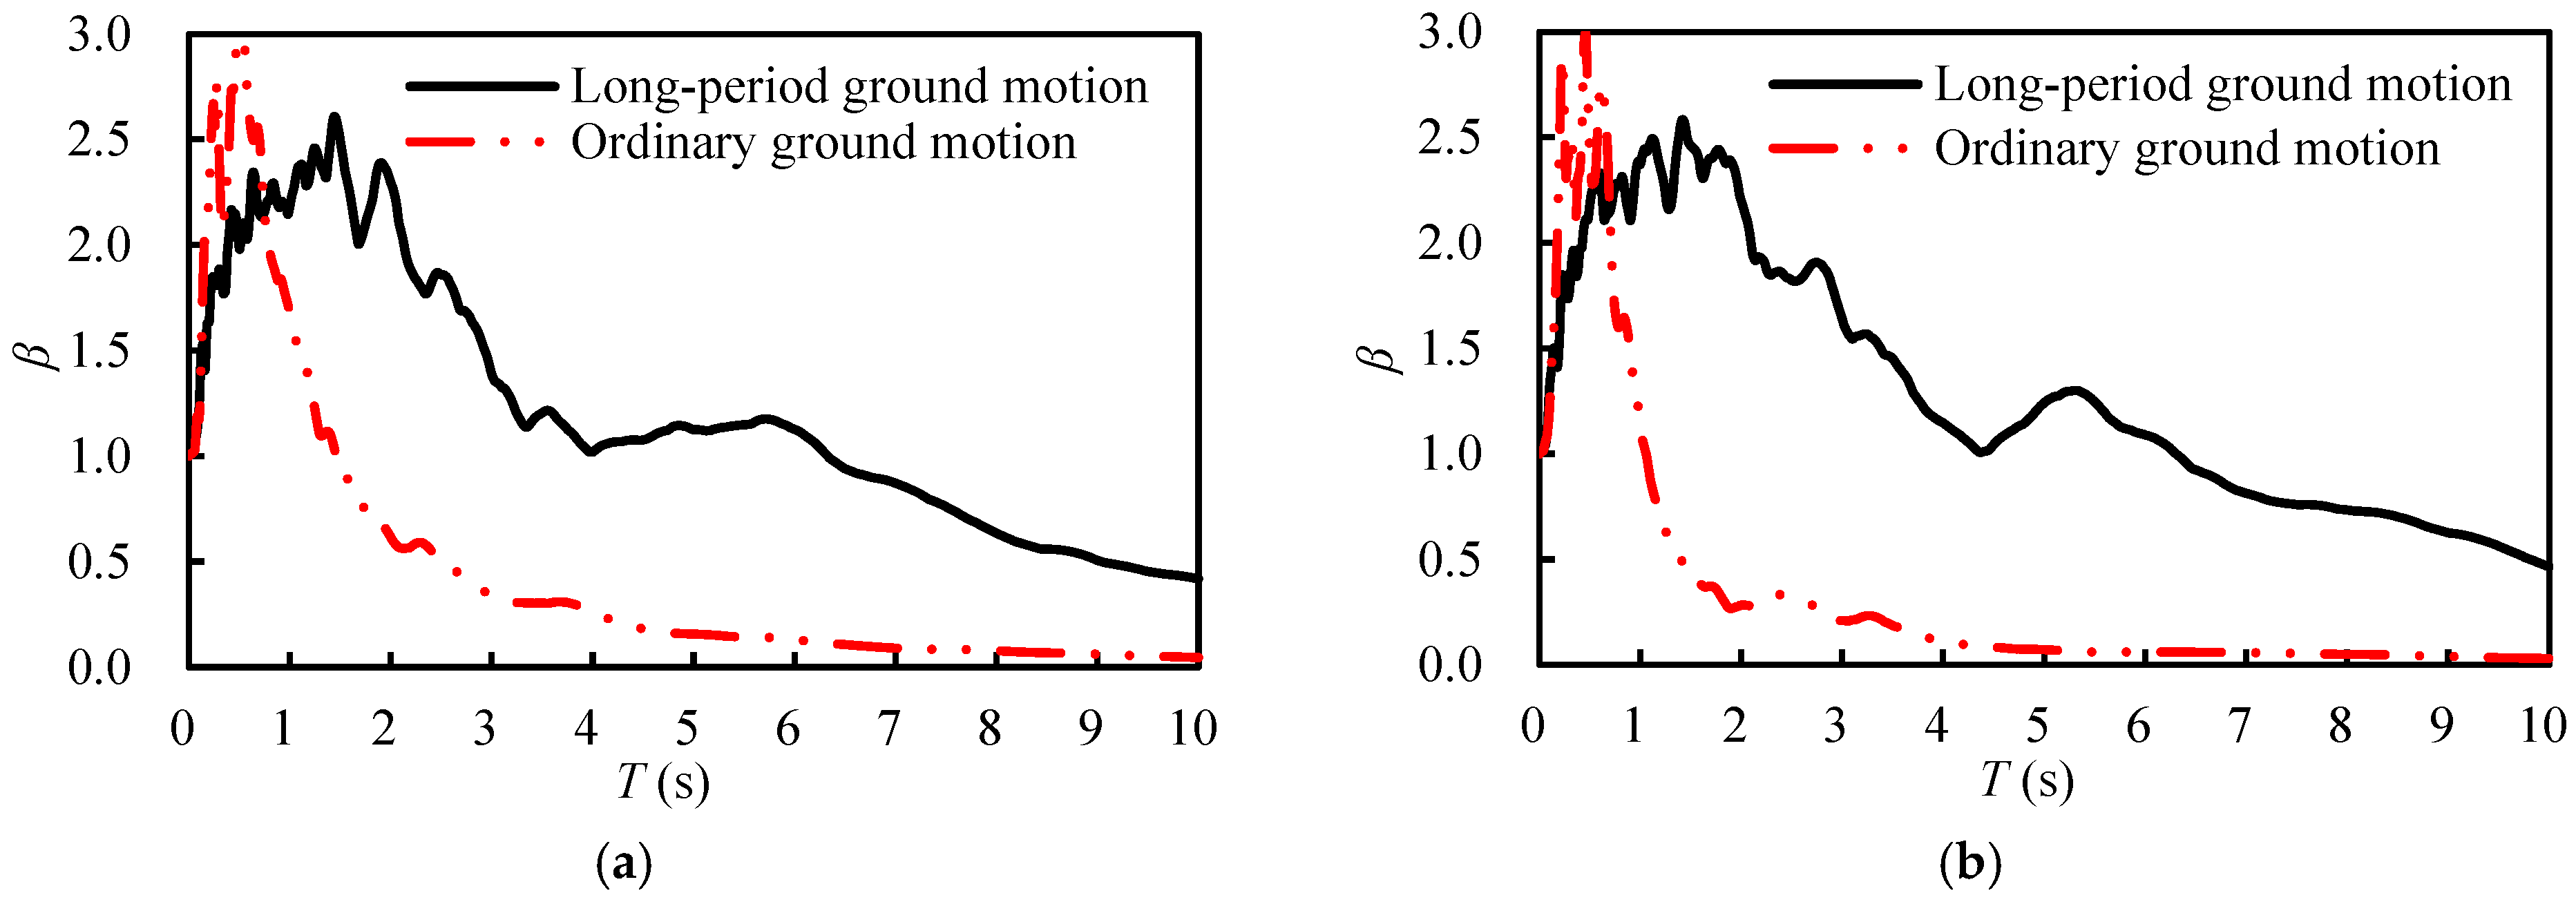
3. Selection and Characteristics of Long-Period Ground Motions
4. Input Energy and Energy Distribution of High-Rise Structures Under Long-Period Ground Motions
4.1. Input Energy of High-Rise Structures
- (1)
- At the same seismic level, the input energy of the high-rise structure under the same type of ground motions has a certain difference, but the degree of dispersion is small. According to the mathematical statistics of input energy, the coefficients of the variation in input energy under LPGMs and OGMs are 0.35 to 0.39 and 0.14 to 0.22, respectively, which are within the acceptable range of the structural seismic research, indicating that the input energy of the high-rise structure is relatively stable, and the average value can be analyzed.
- (2)
- At the same seismic level, the input energy of high-rise structures under LPGMs is significantly greater than that under OGMs. During an 8-degree frequent earthquake, 8-degree design earthquake, and 8-degree rare earthquake, the average input energy of high-rise structures under LPGMs is 13.59 times, 26.38 times, and 26.43 times that under OGMs, respectively.
- (3)
- At different seismic levels, the input energy of high-rise structures increases significantly as the PGA increases. When the PGA increases from 70 gal to 200 gal and 400 gal, the average input energy under LPGMs is 8.46 times and 26.23 times that of 70 gal, respectively, and the average input energy under OGMs is 4.36 times and 13.49 times that of 70 gal, respectively.
4.2. Input Energy Distribution in High-Rise Structures
- (1)
- Under LPGMs, the coefficients of variation of EH/EI for the structure during an 8-degree frequent earthquake, 8-degree design earthquake, and 8-degree rare earthquake are 0.289, 0.105, and 0.064, respectively, and the coefficients of variation of ED/EI are 0.083, 0.085, and 0.057, respectively. All of them are less than 0.3, and the majority are less than 0.1, indicating that the results have a small degree of dispersion and good robustness.
- (2)
- During an 8-degree frequent earthquake, the EH/EI of high-rise structures under OGMs is 0, and the structure remains elastic without plastic damage, while the structure enters the elastic–plastic state under LPGMs, generating a certain amount of EH, with the EH/EI ranging from 0.094 to 0.3 and an average of 0.218. The EH/EI is not large, indicating the structural damage is not serious, mainly relying on ED.
- (3)
- During an 8-degree design earthquake, the high-rise structure has a certain degree of plastic damage under the two types of ground motions. The EH and ED of the structure under OGMs account for more than 80% of the input energy, but the EH/EI is not large, with a maximum of no more than 0.15 and an average of only 0.097, which is far less than the ED/EI. At this time, the damage development of high-rise structures is not sufficient. Under LPGMs, the EH and ED of high-rise structures jointly dissipate more than 94% of the input energy, and the EH/EI significantly increases, with an average of 0.449, which is 4.63 times that of OGMs. Hysteretic energy gradually becomes the main way of energy dissipation.
- (4)
- During 8-degree rare earthquake, the plastic development of high-rise structures under two types of ground motions further deepens. The average EH/EI of the structure under LPGMs is 0.471, which is slightly higher than that during 8-degree design earthquake and approximately 2.14 times that of OGMs, demonstrating that the plastic damage development of the structure under LPGMs is more extensive. In comparison, it is found that the ED/EI under OGMs is significantly greater than the EH/EI, and damping energy remains the main way of energy dissipation, while the structure mainly relies on EH and ED under LPGMs.
- (5)
- Under LPGMs, from an 8-degree frequent earthquake to design earthquake, the EH/EI of high-rise structures increases rapidly, with an increase range of 1.61 to 5.99 times, indicating that the plastic deformation of the structure increases rapidly, and the structure resists input energy through severe damage to various members. From an 8-degree design earthquake to rare earthquake, the EH/EI increases only 1.05 times; the plastic development amplitude of the structure decreases. Meanwhile, the increase in the damping ratio caused by structural damage reduces the increase in the EH/EI.
5. Distribution of Hysteretic Energy Dissipation in High-Rise Structures Under Long-Period Ground Motions
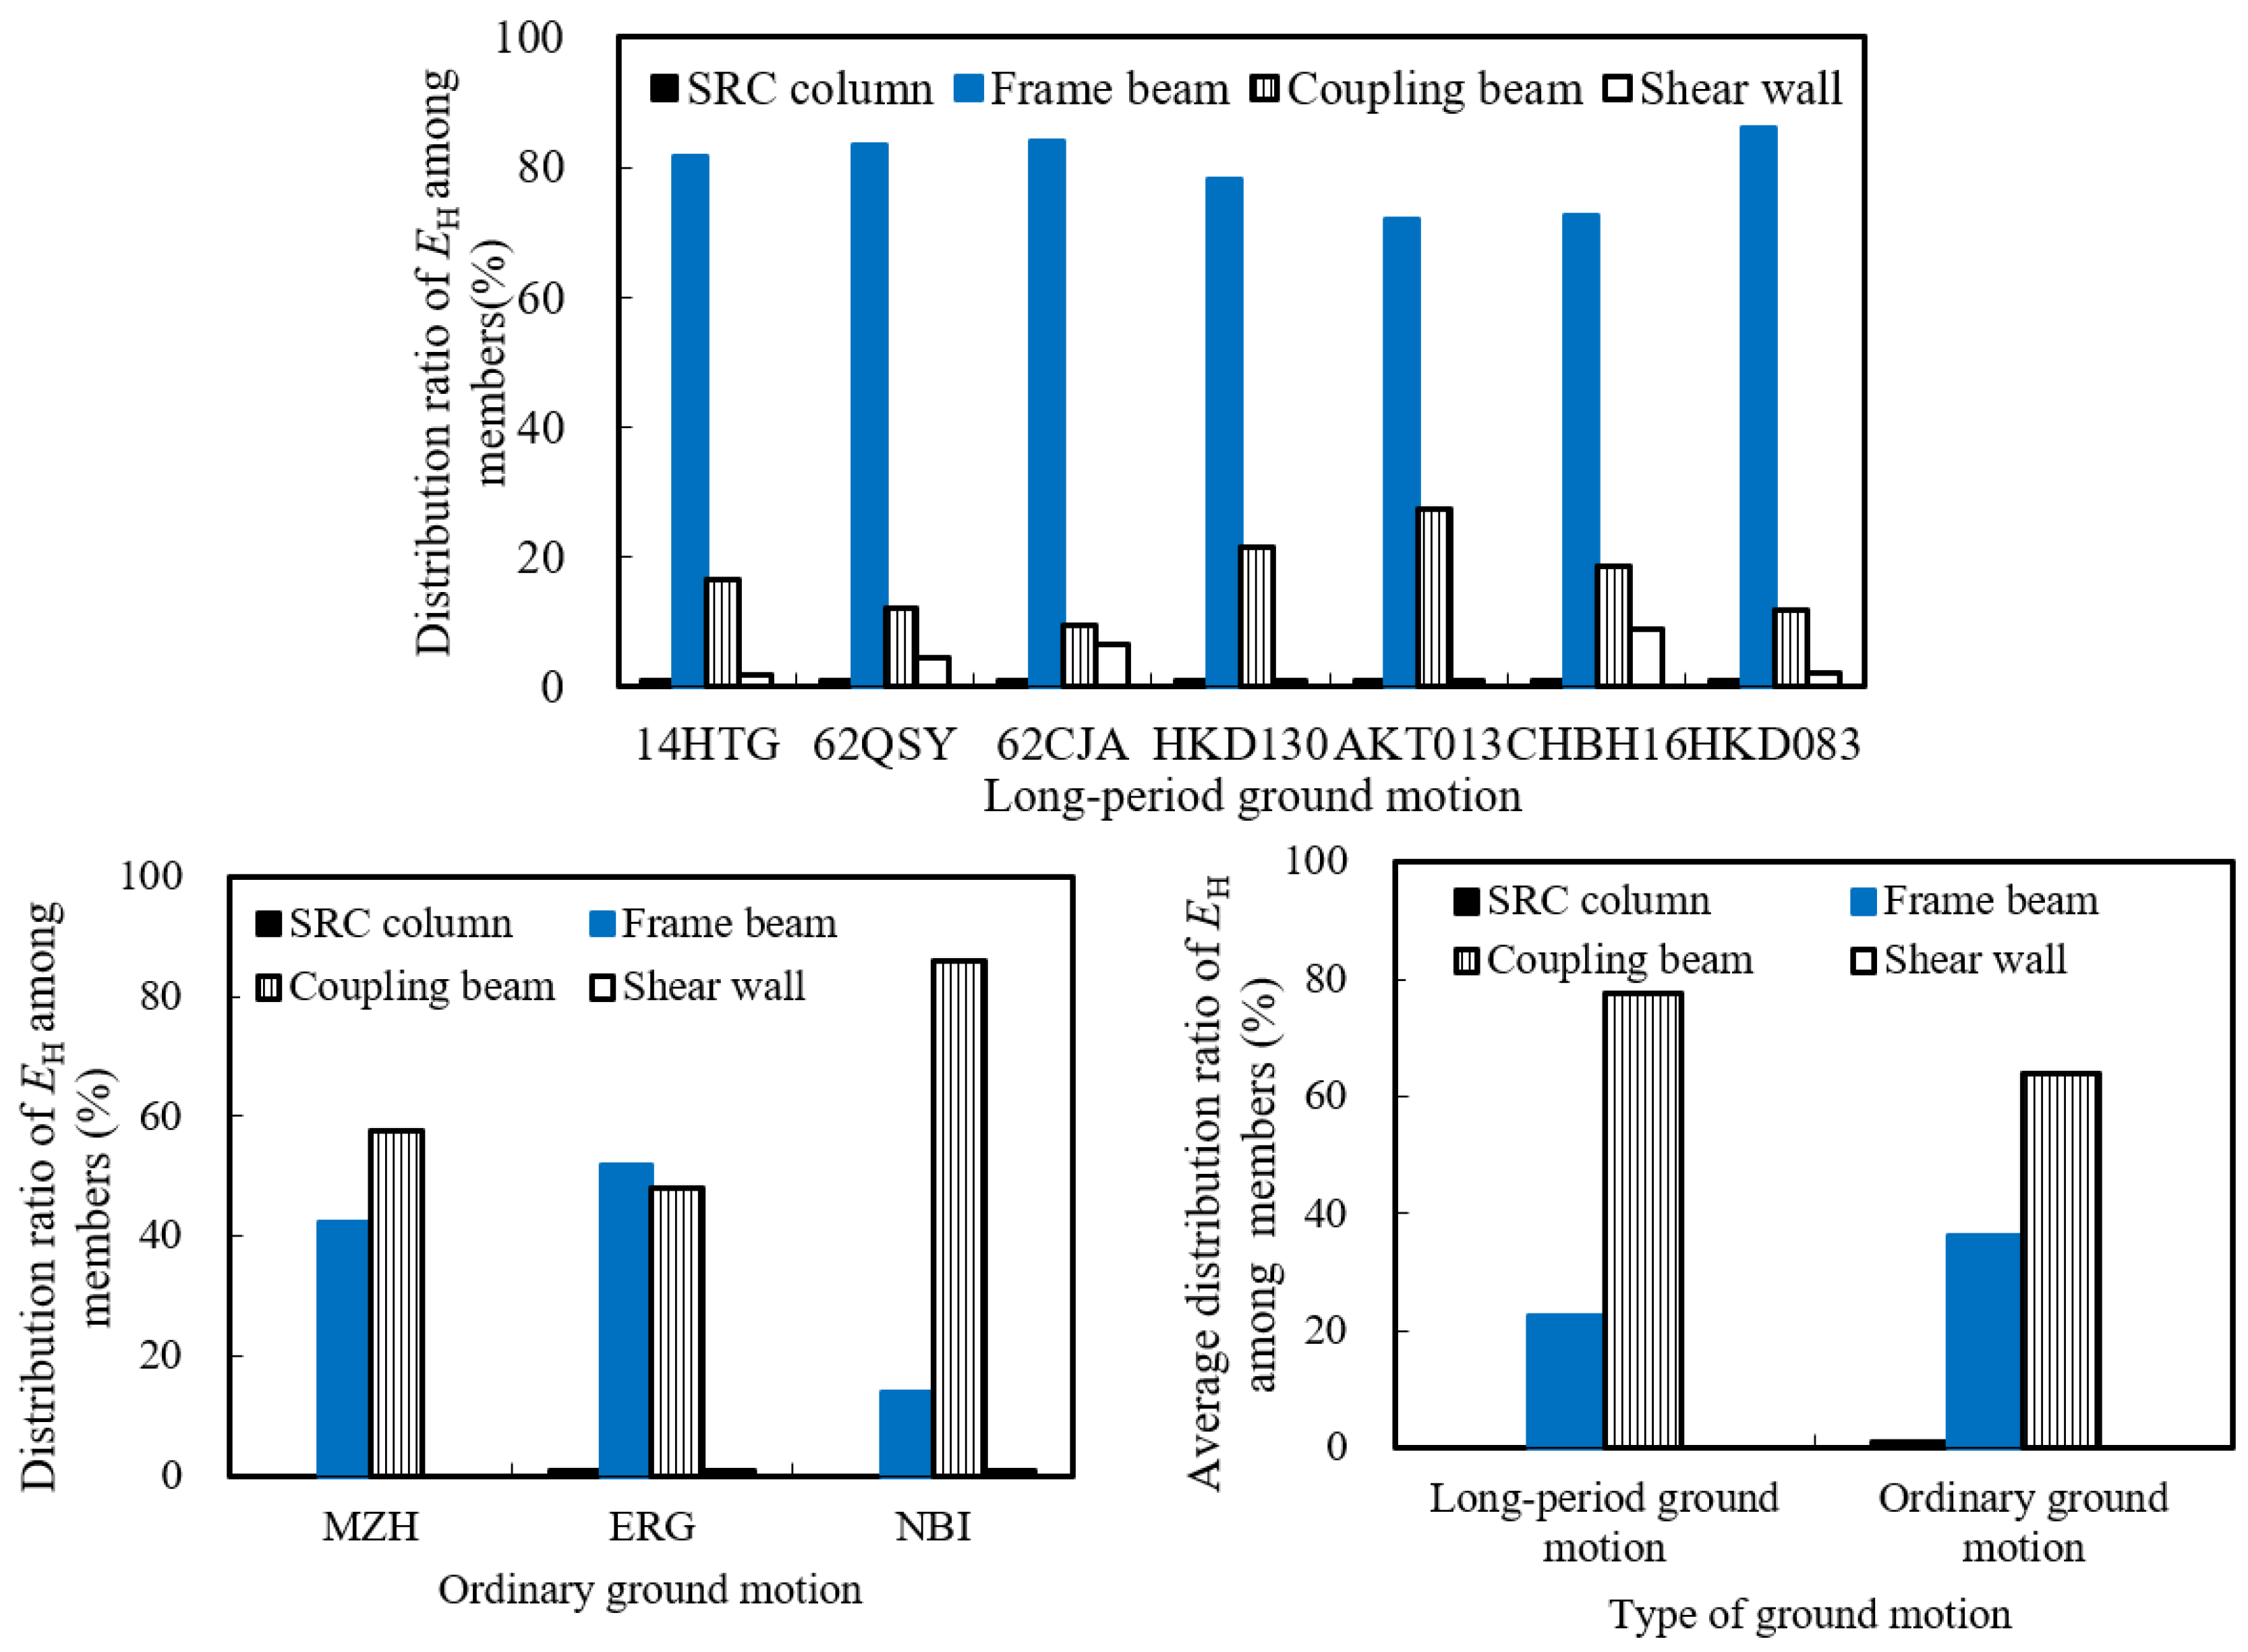
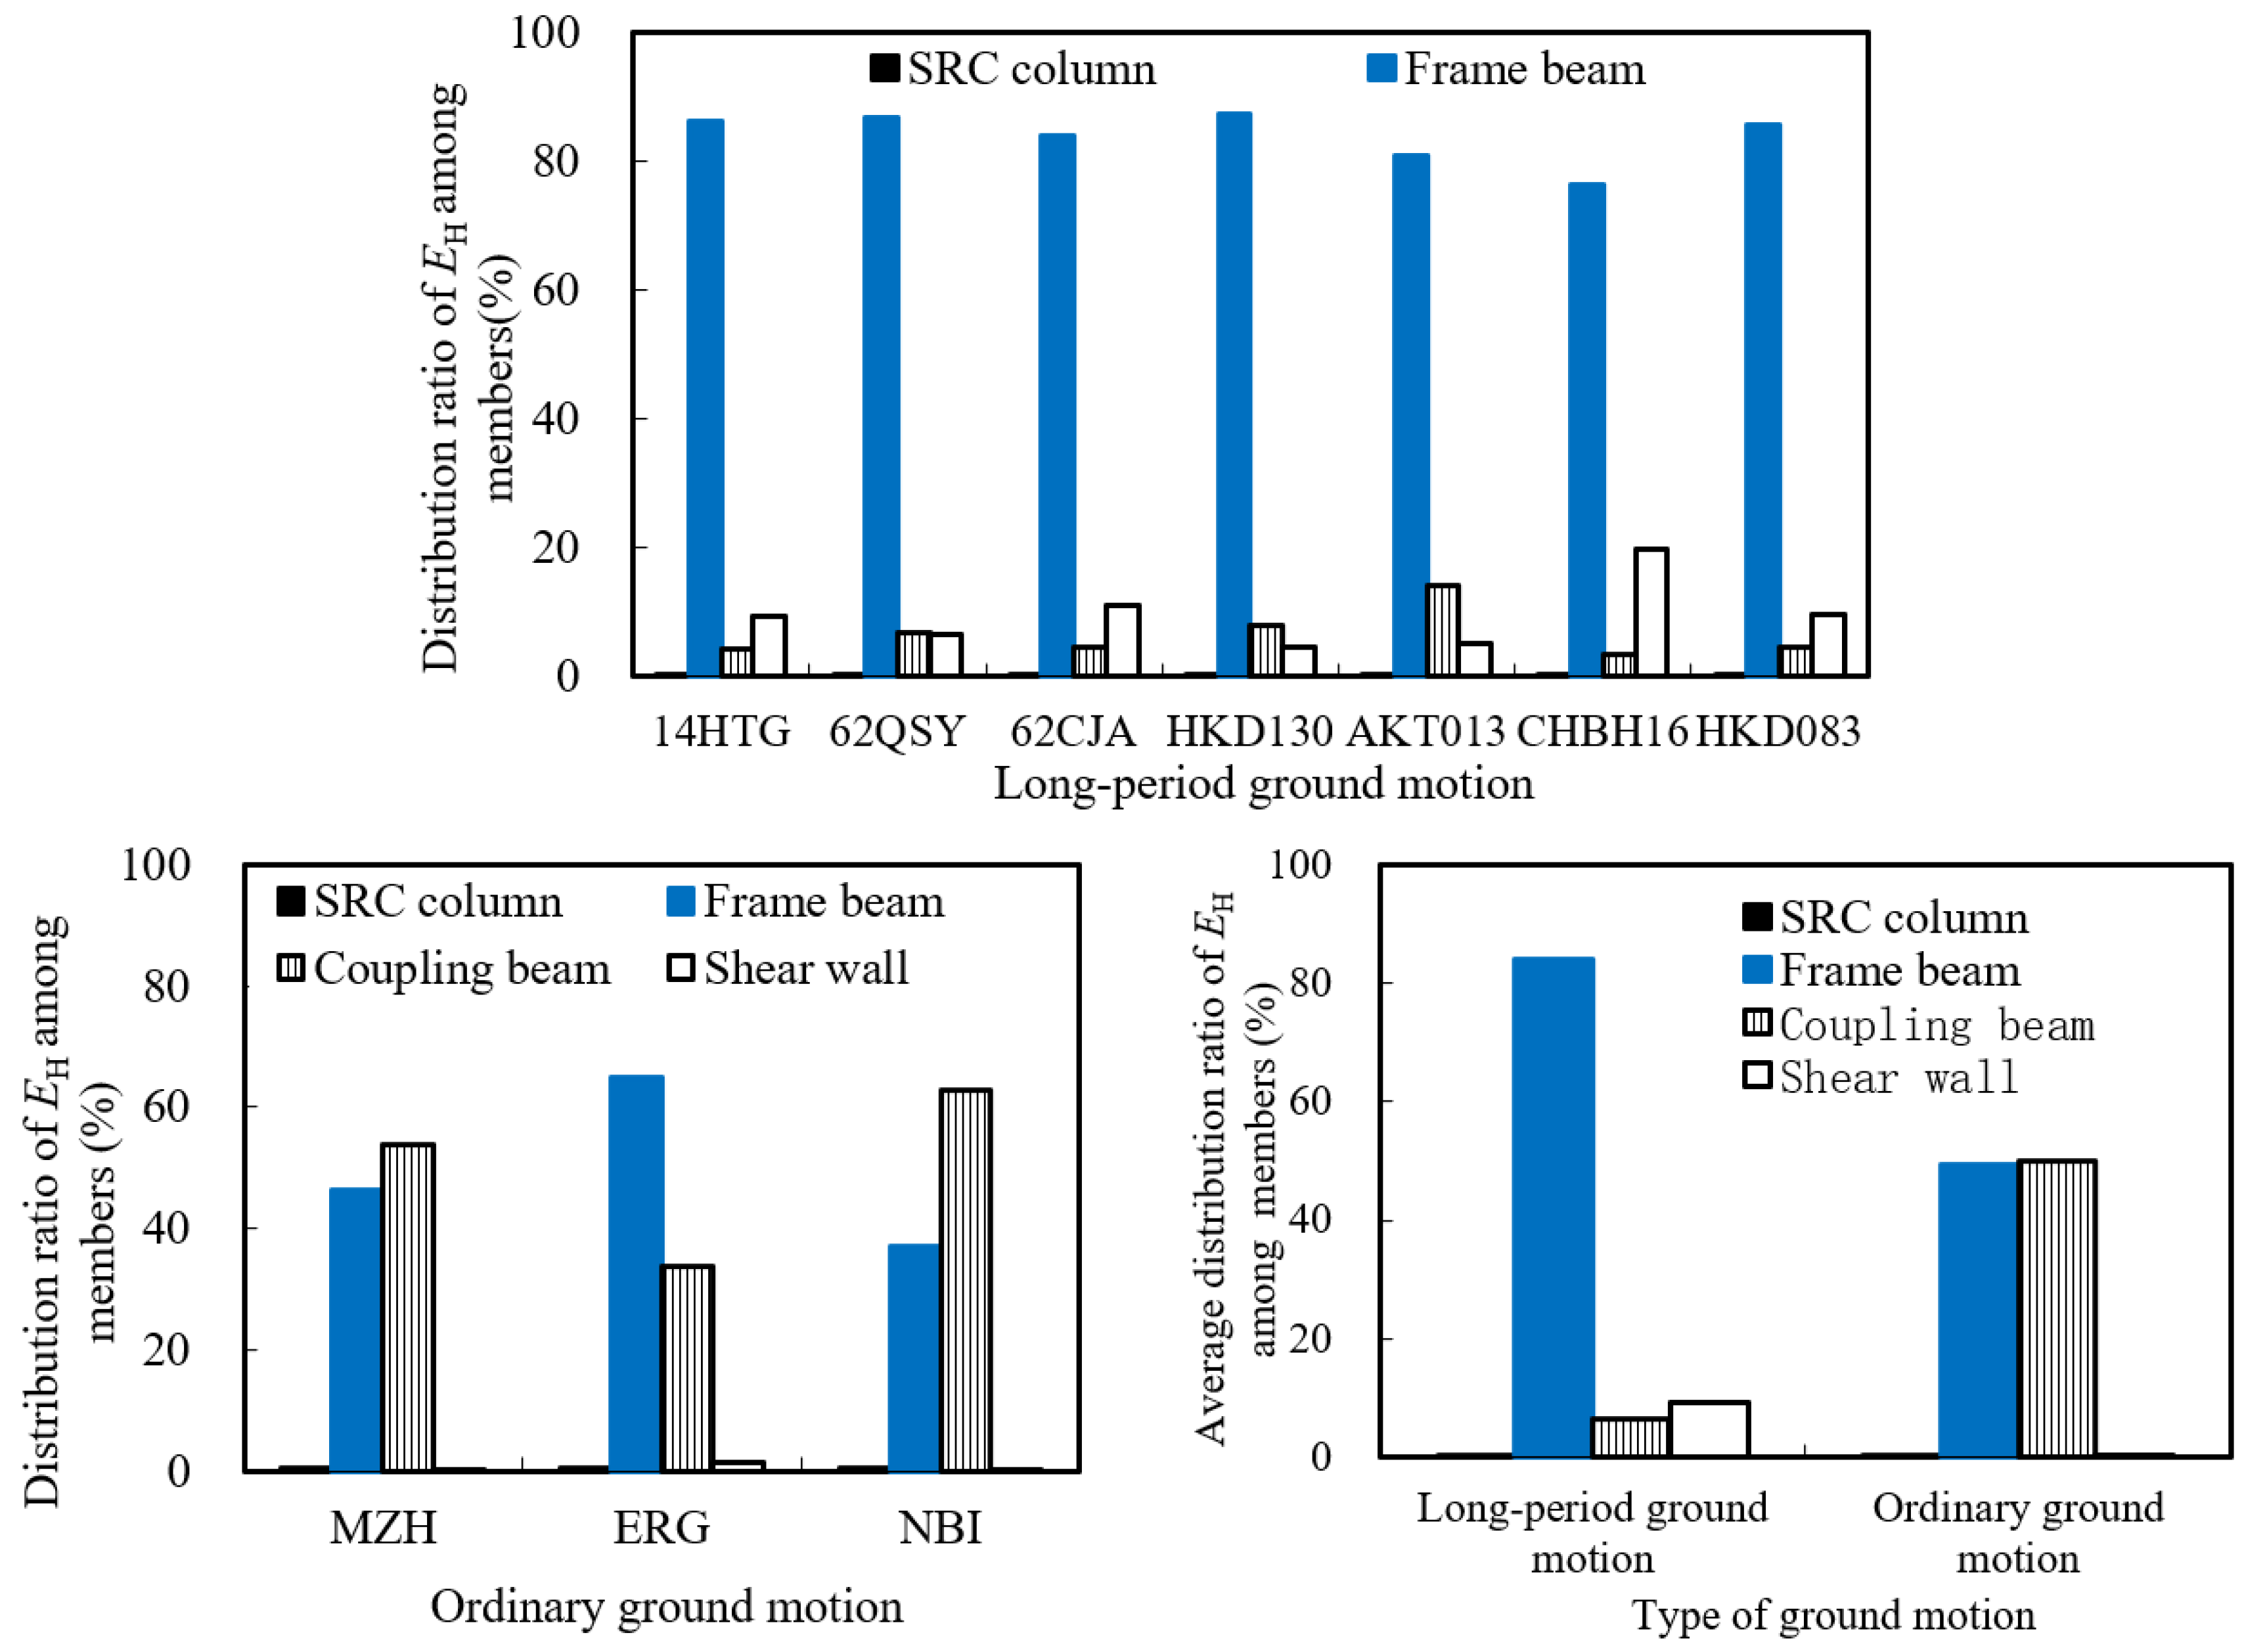
5.1. Distribution of Hysteretic Energy Dissipation Among Structural Members of High-Rise Structures
5.2. Distribution of Hysteretic Energy Dissipation of Members Along the Floors of High-Rise Structures
5.2.1. Hysteretic Energy Dissipation Distribution of Members Along the Floors Under the 8-Degree Frequent Earthquake
5.2.2. Hysteretic Energy Dissipation Distribution of Members Along the Floors Under the 8-Degree Design and Rare Earthquake
- (1)
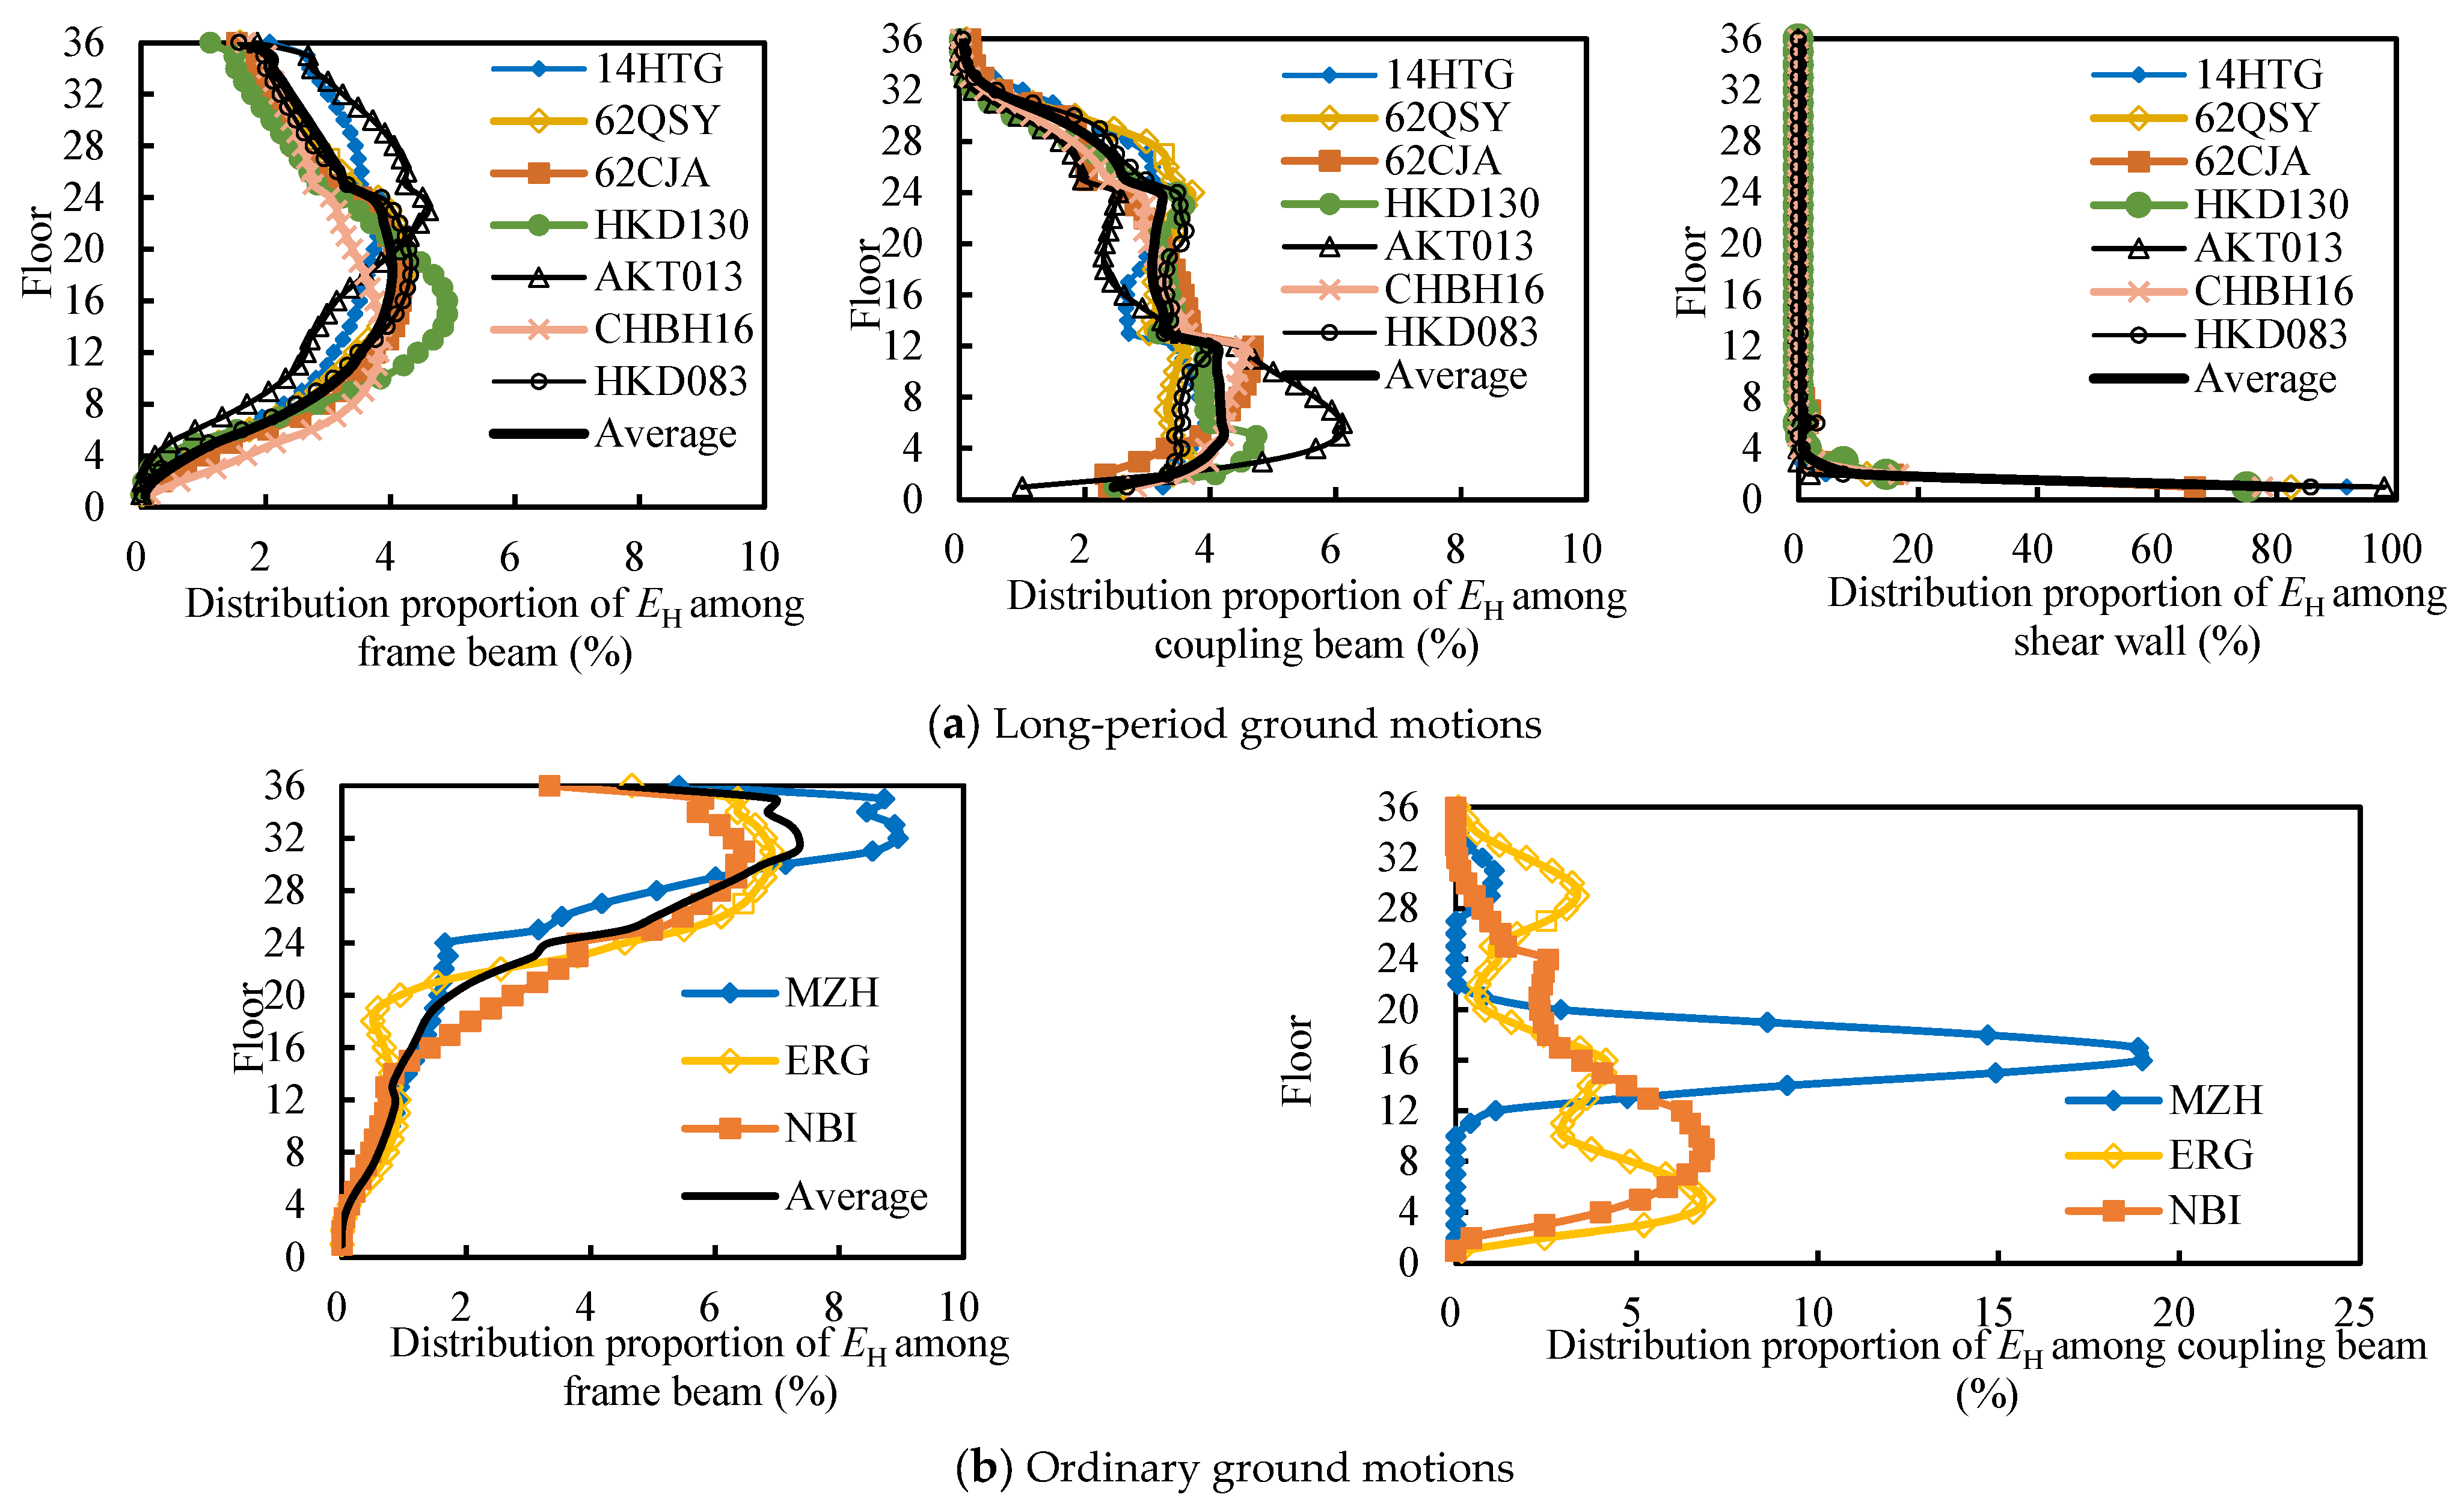
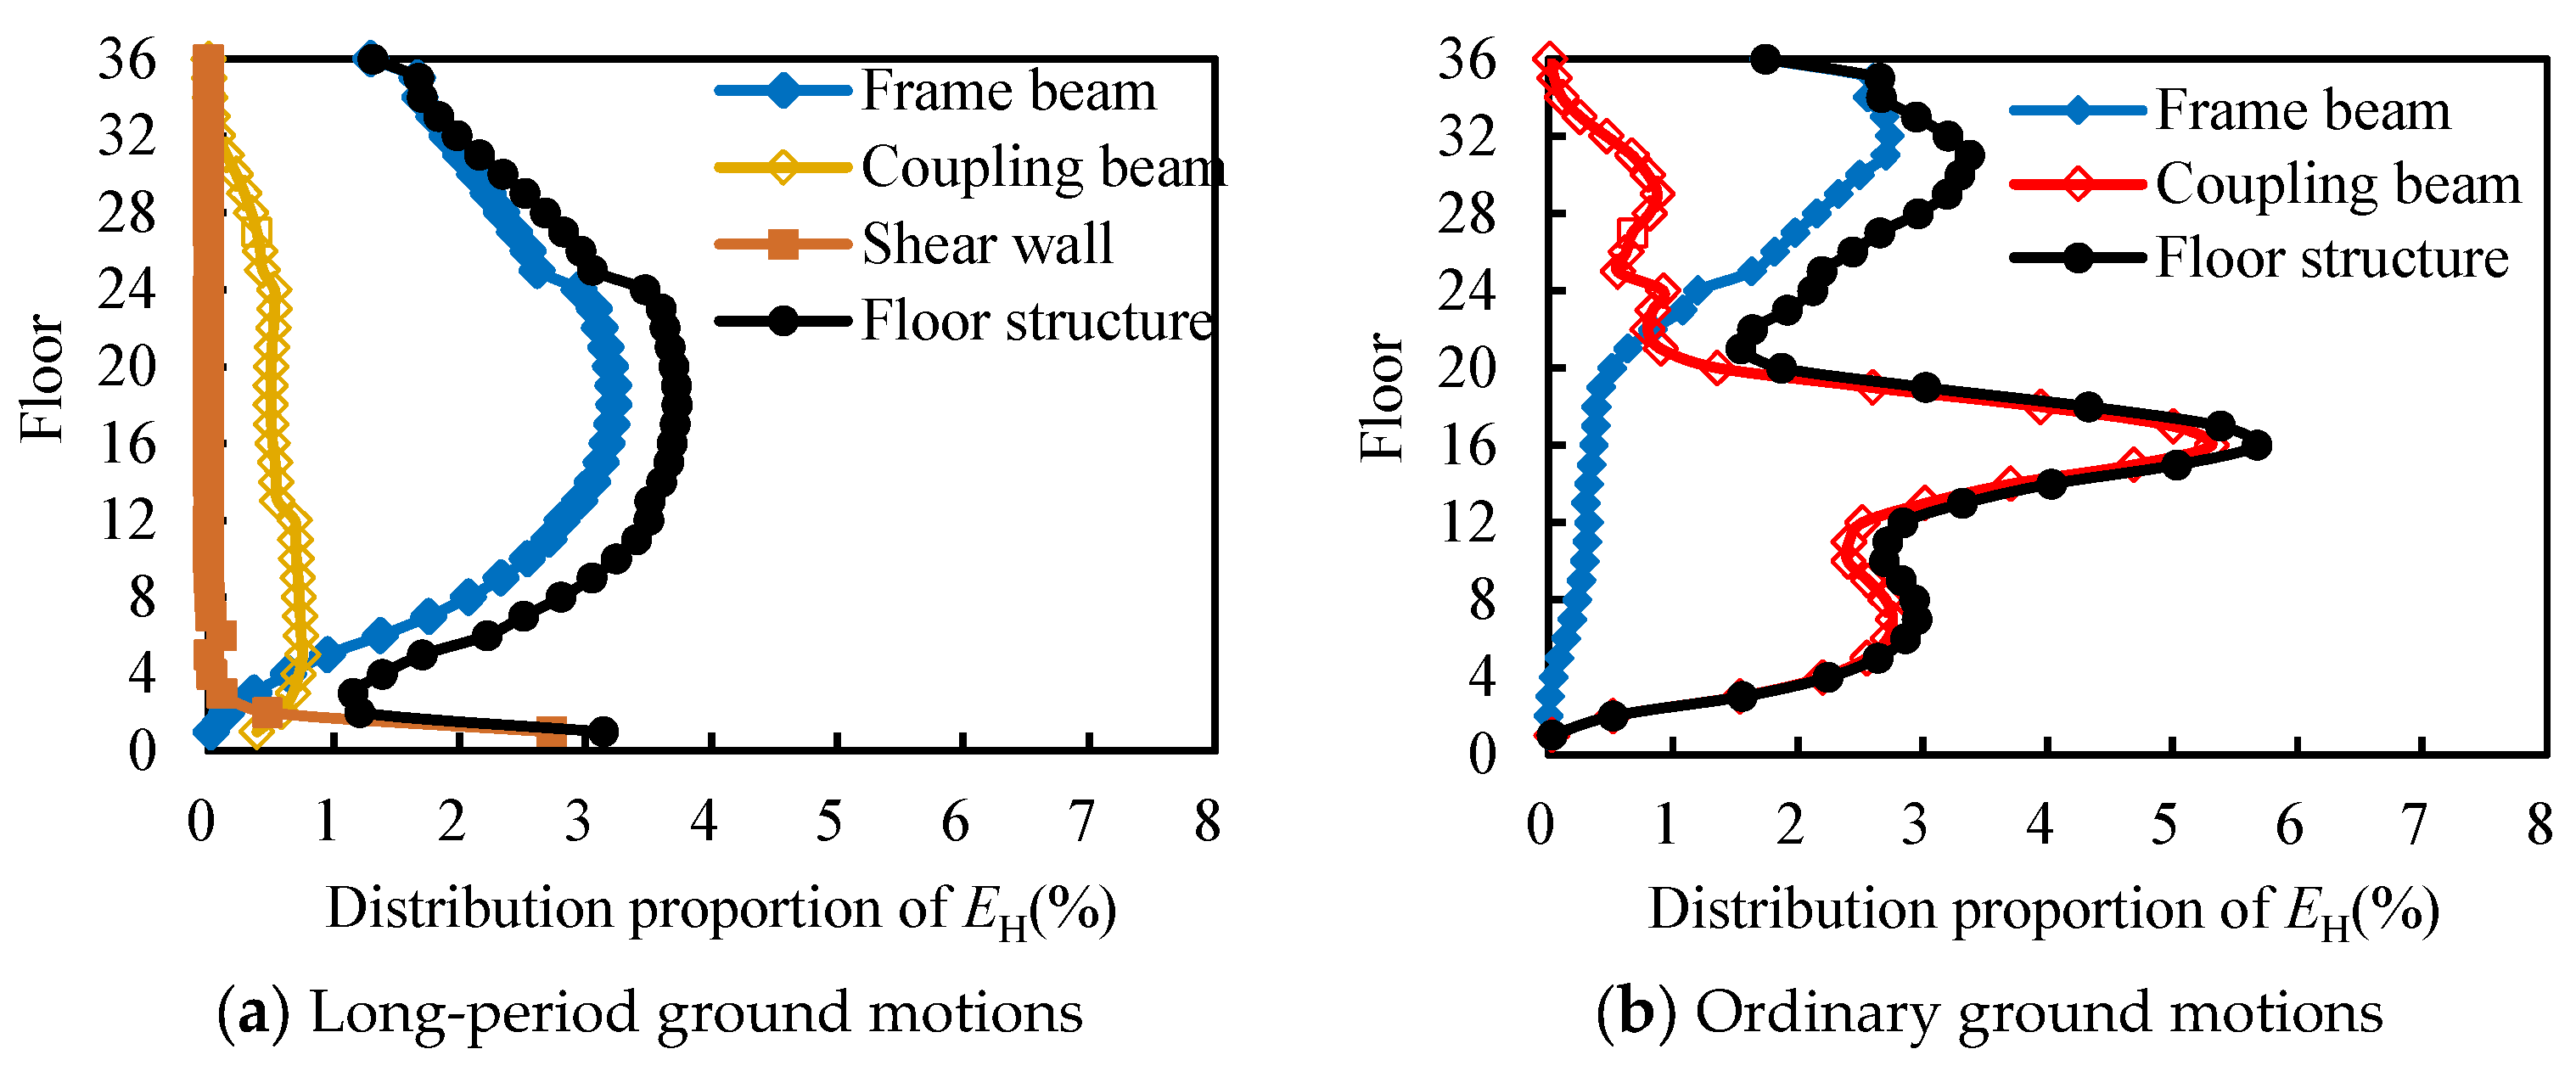
- As the floor increases, the EH ratio of the frame beams gradually increases, reaching the maximum value between the 18th and 22nd floors, accounting for approximately 3.5% to 5% of the total hysteretic energy of frame beams. Thereafter, as the floors increase, the EH ratio of the frame beams begins to decrease slowly, reaching about 1.5% to 2.5% at the top floor. Overall, the EH of frame beams is mainly concentrated in the middle and upper floors of the structure.
- (2)
- The EH ratio of coupling beams increases gradually from the bottom floor upwards, reaching the maximum at the 6th to 12th floors, which is about 3.5% to 6% of the total hysteretic energy of coupling beams. Thereafter, as the floor increases, the EH ratio of coupling beams gradually decreases, with almost no energy dissipation in floors above the 32nd. Overall, the EH of coupling beams is mainly concentrated in the lower floors of the structure.
- (3)
- The EH of the shear walls is concentrated in the first to second floors. During an 8-degree design earthquake and rare earthquake, the shear walls on the first floor dissipate the most hysteresis energy, accounting for approximately 82% and 62% of the total hysteresis energy of shear walls. As the floor rises, the EH ratio of shear walls decreases sharply; on the second floor, there is approximately 10% and 16% of the total hysteresis energy of shear walls, respectively. Above the third floor, shear walls remain almost elastic.
- (1)
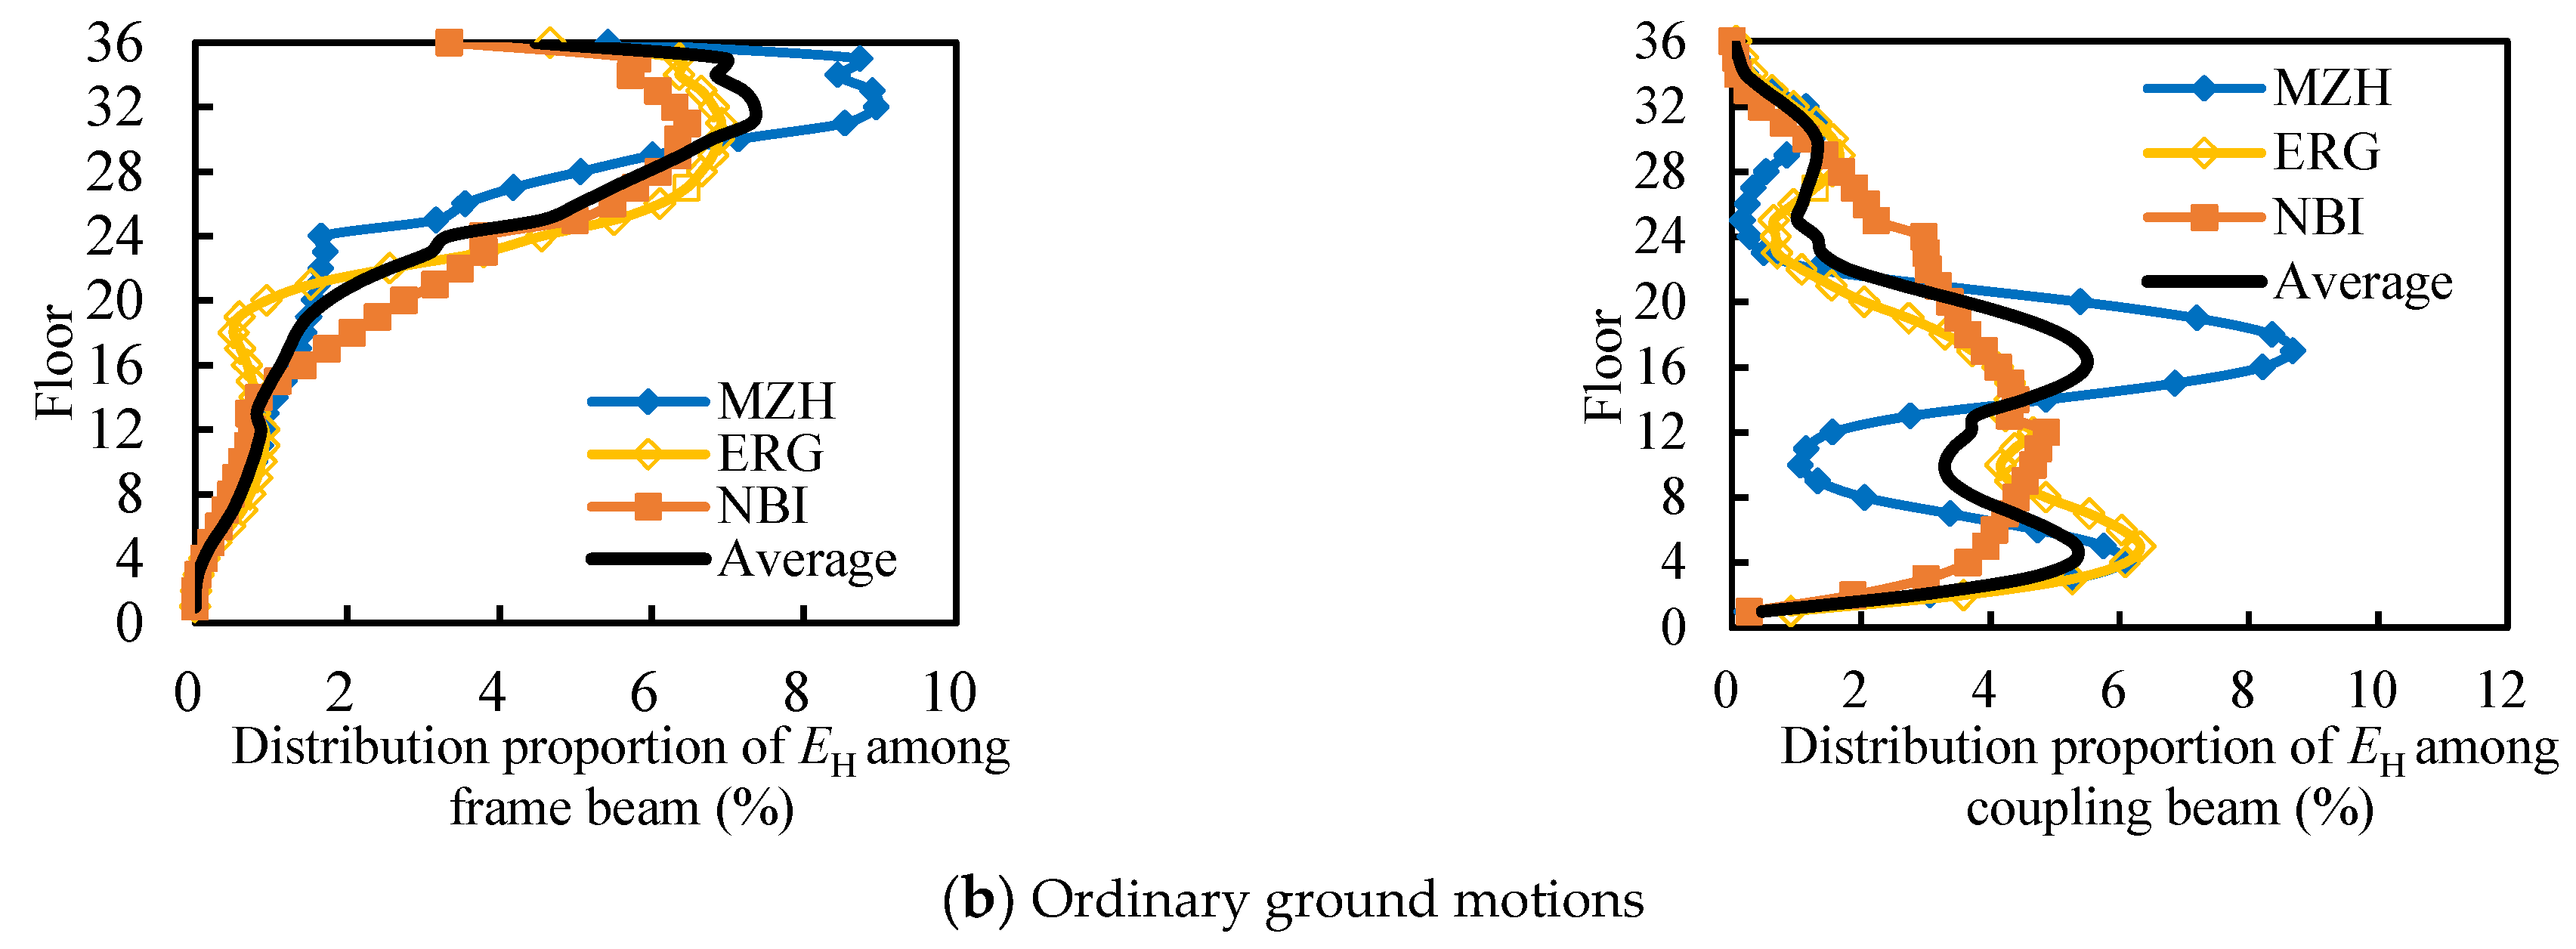
- The EH ratio of frame beams oscillates with the rise in the floor, reaching the maximum value at about the 28th to 32nd floors, and the floor with the maximum value increases significantly, showing that OGMs are more likely to excite the high-order mode response of high-rise structures. It is not difficult to find that the EH of the middle and upper frame beams is relatively large.
- (2)
- The distribution of EH of coupling beams shows significant differences. Under the ground motion MZH, the EH ratio of coupling beams oscillates violently, and the distribution of EH of coupling beams in each floor is very uneven; under the ground motion NBI, the EH ratio of coupling beams first increases and then decreases with the rise in floors, and the energy dissipation distribution is relatively average. The uncertainty of the energy distribution of coupling beams may cause the uncontrollable energy distribution of other members.
- (1)
- Under LPGMs, the EH of the structure first decreases, then increases, and then decreases with the rise in the floor. During the 8-degree design earthquake, the 12th to 24th floors of the structure dissipate the most hysteretic energy, accounting for approximately 3.5% to 3.7%, with the 1st floor also having a relatively high hysteretic energy of about 2.7%. During the 8-degree rare earthquake, the 1st floor dissipates the most hysteretic energy, accounting for 5.8%, with the 12th to 24th floors also having relatively high hysteretic energy of about 3.0% to 3.3%.
- (2)
- Under LPGMs, the EH of the first floor is mainly borne by the shear walls, which account for 87% to 93% of the total hysteretic energy on that floor. The shear walls remain almost elastic above the third floor, and the hysteretic energy is dissipated by the frame beams and coupling beams, with the frame beams being the primary energy consumption. During the 8-degree design and rare earthquake, the EH of frame beams on each floor from the 5th to the 12th accounts for 56% to 80% and 70% to 89% of the total hysteretic energy dissipation on that floor, respectively, and above the 12th floor, it accounts for more than 85% and 90%, respectively.
- (3)
- The distribution of EH under OGMs is very uneven. Under an 8-degree design earthquake, the EH below the 18th floor is basically borne by coupling beams, accounting for 91% to 99.9% of the total hysteretic energy on each floor; with the rise in the floor, the EH of frame beams increases gradually, and the EH of frame beams above the 24th floor accounts for about 75% to 99% of the total hysteretic energy on each floor. Under an 8-degree rare earthquake, the EH below the 20th floor is mainly borne by coupling beams, accounting for 59% to 99.6% of the total hysteretic energy on each floor; as the floors rise, the EH of the floors is gradually dissipated by frame beams.
6. Conclusions
- (1)
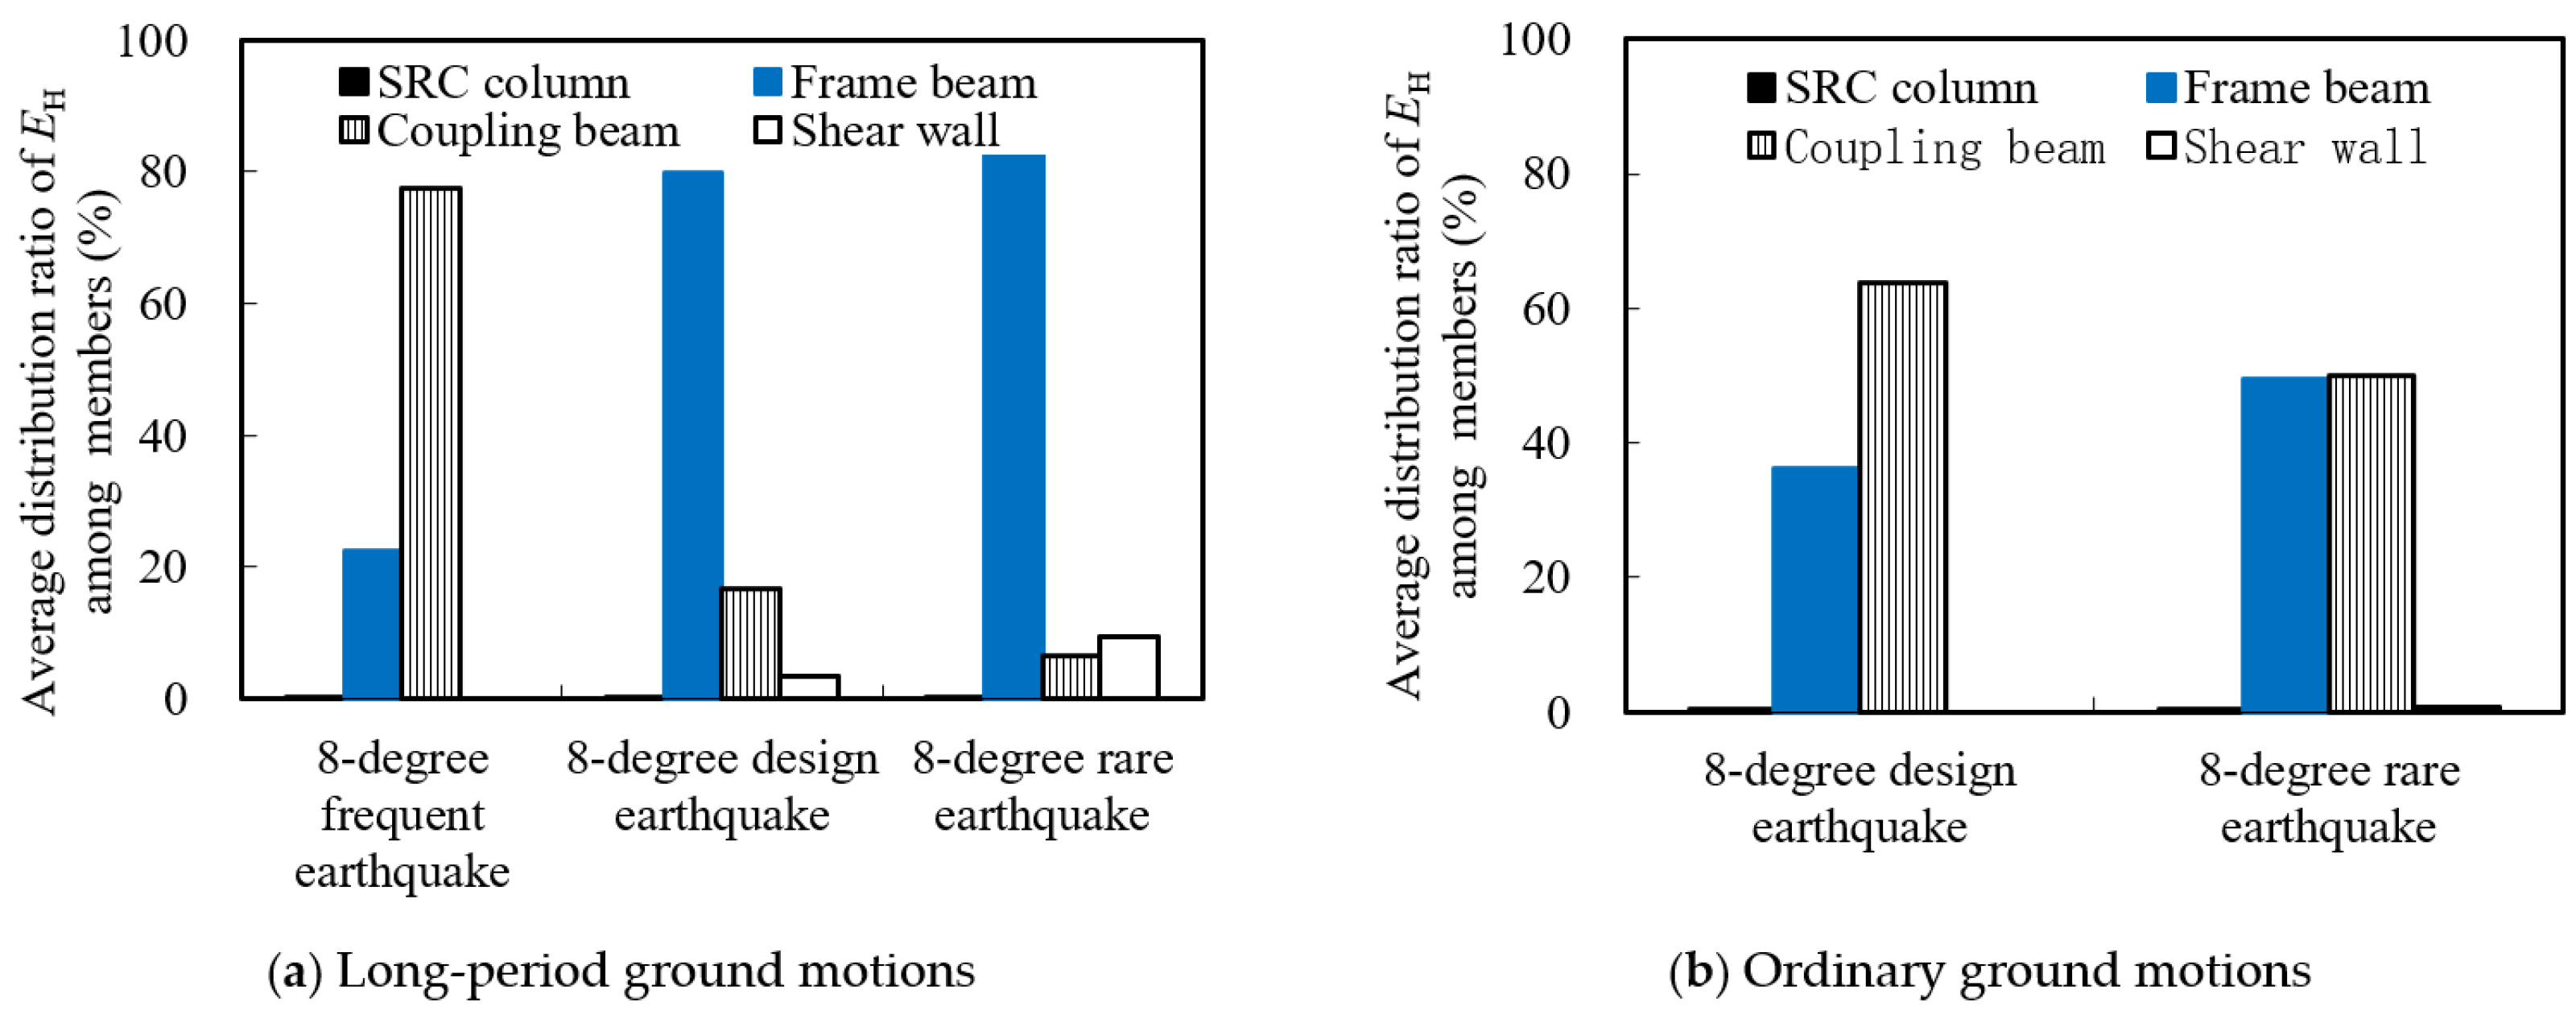
- At the same seismic level, the input energy of the structure under LPGMs is significantly larger than that under OGMs, and the input energy increases significantly with the increase in PGA. Under OGMs, the average hysteretic energy of the structure is relatively small, mainly due to damping energy dissipation. Under LPGMs, the hysteretic energy gradually becomes an important way of dissipating energy; the structure mainly relies on hysteretic energy and damping energy to dissipate seismic input energy, with the dissipated energy reaching 91% to 99% of the total input energy.
- (2)
- Under LPGMs, the hysteretic energy of the structure is mainly dissipated by coupling beams, frame beams, and shear walls. During an 8-degree frequent earthquake, the coupling beams are the main energy dissipation members, accounting for approximately 55% to 90% of the total hysteretic energy, and frame beams dissipate the remaining hysteretic energy. During an 8-degree design earthquake, the hysteretic energy ratio of frame beams significantly increases between 72% and 86%, the hysteretic energy ratio of coupling beams significantly decreases between 9% and 27%, and shear walls start to dissipate a small proportion of hysteretic energy. During an 8-degree rare earthquake, frame beams bear the majority of hysteretic energy, the hysteretic energy ratio of coupling beams greatly reduces, and the hysteretic energy ratio of shear walls increases between 5% and 20%.
- (3)
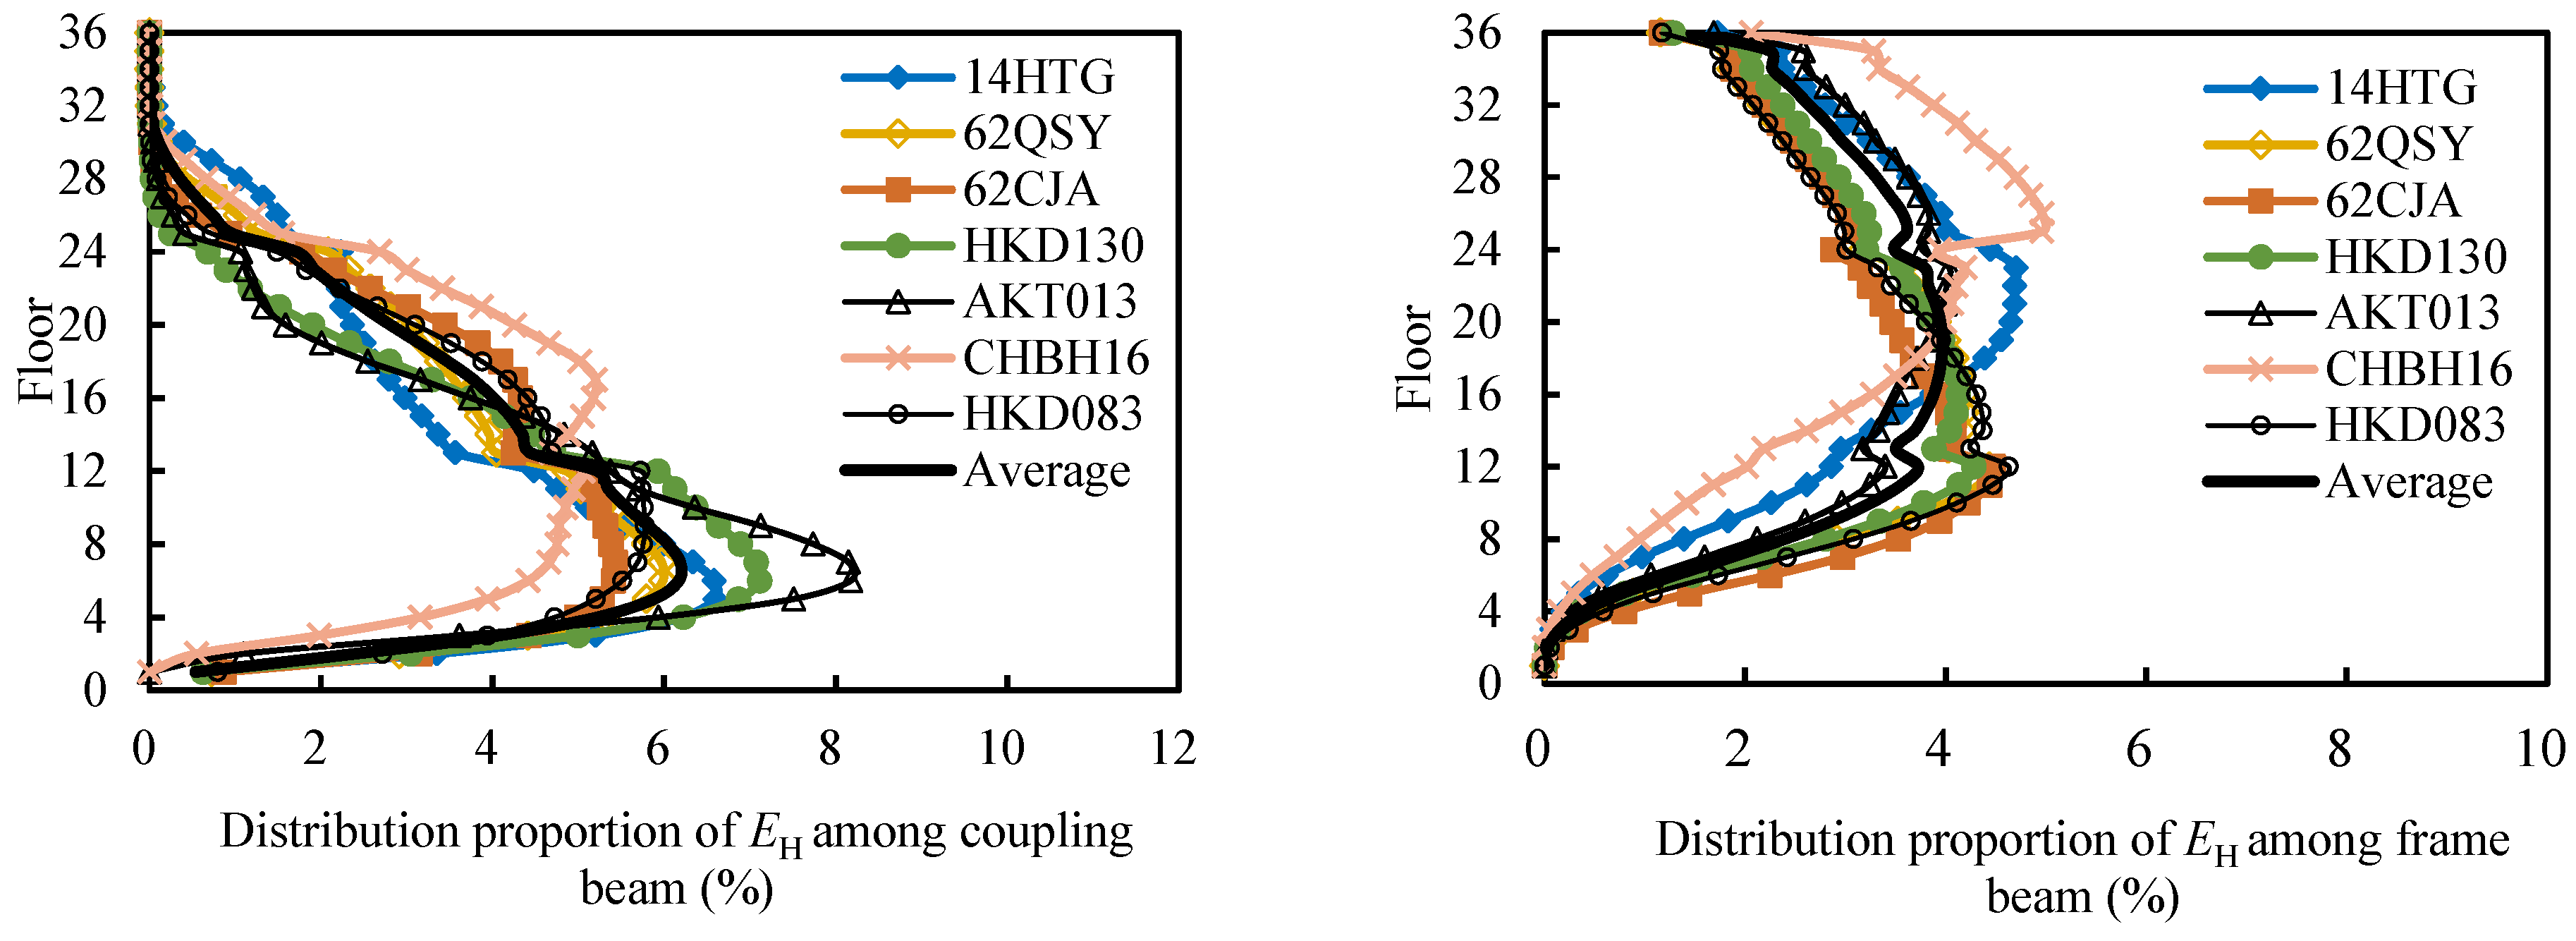
- Under LPGMs, during an 8-degree frequent earthquake, the hysteretic energy of the structure first increases and then decreases with the rise in the floor. Each floor below 2/3 of the structure mainly relies on coupling beams to dissipate hysteretic energy, with the hysteretic energy ratio ranging from 61% to 99.9%, while each floor above 2/3 of the structure gradually relies on the frame beams to dissipate hysteretic energy. During 8-degree design and rare earthquakes, the hysteretic energy dissipation of the structure first decreases, then increases, and then decreases with the rise in the floor. The hysteresis energy on the first to second floors is mainly dissipated by shear walls, while on floors above the third floor, the hysteresis energy is mainly borne by frame beams.
- (4)
- During structural design practices under LPGMs, for the energy dissipation concentration zones of high-rise structures, the reinforcement should be strengthened and ductility construction measures should be guaranteed. For high-rise structures potentially subjected to LPGMs, since the seismic demand may far exceed the prediction based on the design response spectrum in the code, it is advisable to adopt a long-period response spectrum or conduct specialized time-history analyses in the structural design.
Author Contributions
Funding
Data Availability Statement
Acknowledgments
Conflicts of Interest
References
- Tan, Q.; Li, Y.M.; Xiang, Y.M.; Luo, W.W.; Bu, C.M.; Wang, L.P. Study on characteristics of far-field long period ground motion. Earthq. Eng. Eng. Dyn. 2019, 39, 177–188. [Google Scholar]
- Beck, J.L.; Hall, J.F. Factors contributing to the catastrophe in Mexico City during the earthquake of September 19, 1985. Geophys. Res. Lett. 1986, 13, 593–596. [Google Scholar] [CrossRef]
- Hiroe, M.; Kazuki, K. Long-period ground motions from a large offshore earthquake: The case of the 2004 off the Kii peninsula earthquake, Japan. Earth Planets Space 2005, 3, 203–207. [Google Scholar]
- Yang, W.L.; Zhu, S.C.; Hong, H.C.; Tao, X.S.; Tang, Z.L. Characteristics of far-field ground motion of Wenchuan earthquake and the effect on long-periodic structures. J. Disaster Prev. Mitig. Eng. 2009, 29, 473–478. [Google Scholar]
- Zhou, F.L.; Cui, H.L.; Shigetaka, A.; Lv, X.L.; Sun, Y.P.; Li, Z.B.; Li, A.Q.; Feng, D.M.; Li, Y.M.; Xue, S.T.; et al. Inspection report of the disaster of the East Japan earthquake by Sino-Japanese joint mission. Build. Struct. 2012, 42, 1–20. [Google Scholar]
- Chung, Y.L.; Takuya, N.; Tomohiro, M. Seismic resistance capacity of beam & column connections in high-rise buildings: E-defense shaking table test. Earthq. Eng. Struct. Dyn. 2011, 40, 605–622. [Google Scholar]
- Chen, Q.J.; Yuan, W.Z.; Li, Y.C. Dynamic response characteristics of super high-rise buildings subjected to long period ground motion. J. Cent. South Univ. 2013, 20, 1341–1353. [Google Scholar] [CrossRef]
- Ji, S.Y.; Liu, S.Y.; Li, Y.M. Response characteristics of super high-rise building subjected to far-field long-period ground motion. J. Build. Struct. 2018, 39, 1–10. [Google Scholar]
- Cheng, Y.; Bai, G.L.; Dong, Y.R. Spectrum characterization of two types of long-period ground motions and seismic behavior of frame-core wall structures under multi-dimensional earthquake records. Struct. Des. Tall Spec. Build. 2018, 27, e1539. [Google Scholar] [CrossRef]
- Zhang, Z.H.; Li, Q.S. Seismic responses of super high-rise buildings under long-period ground motions. Eng. Struct. 2023, 294, 116824. [Google Scholar] [CrossRef]
- Yang, K.; Cai, P.; Zhang, Z.; Hou, Q.; Zheng, R.; Hao, B.; Wang, B. Effects of soil–structure interaction on the seismic response of RC frame–shear wall building structures under far-field long-period ground motions. Buildings 2024, 14, 3796. [Google Scholar] [CrossRef]
- Kunnath, S.K.; Chai, Y.H. Cumulative damage-based inelastic cyclic demand spectrum. Earthq. Eng. Struct. Dyn. 2004, 33, 499–520. [Google Scholar] [CrossRef]
- Miao, Z.W.; Ye, L.P. Study on Distribution of cumulative hysteretic energy in reinforced concrete frame-coupled wall. Eng. Mech. 2010, 27, 130–141. [Google Scholar]
- Li, K.; Shi, Q.X.; Wang, P.; Wang, N.; Wang, Q.W. Seismic response energy analysis for reinforced concrete frame-core wall structures. J. Vib. Shock. 2014, 33, 115–119+124. [Google Scholar]
- Bo, W.B.; Fu, L.H.; Lu, H.Y.; Xu, G.Y. Research on seismic energy distribution and dissipation of reinforced concrete frame-wall high-rise structure. J. Archit. Civ. Eng. 2015, 32, 38–45. [Google Scholar]
- Ye, L.P.; Cheng, G.Y.; Qu, Z.; Lu, X.Z. Study on energy-based seismic design method and application on steel braced frame structures. J. Build. Struct. 2012, 33, 36–45. [Google Scholar]
- Miao, Z.W.; Ye, L.P. Study on energy dissipation mechanism of reinforced concrete frame-shear wall structure under rare earthquakes. J. Build. Struct. 2013, 34, 45–52. [Google Scholar]
- Wang, P.; Shi, Q.X.; Wang, F.; Wang, Q.W.; Zheng, X.L.; Wang, B. Study of mode of energy dissipation and damage of SRC frame-RC core wall structures under strong earthquake actions. Ind. Constr. 2015, 45, 91–98. [Google Scholar]
- Wang, B.; Liu, B.Q.; Wu, T.; Bai, G.L. Analysis of low-frequency pulse characteristics and response spectrum for long-period ground motions. Earthq. Eng. Eng. Dyn. 2018, 38, 142–151. [Google Scholar]
- Zhou, J.; Fang, X.D.; Jiang, Y. Characteristic periods of response spectrum for far-field long-period seismic ground motions. J. Build. Struct. 2015, 36, 1–12. [Google Scholar]
- Zhang, L.Q.; Yu, J.J. Study on the fitting of the long-period ground motion acceleration response spectrum based on genetic algorithm. J. Nat. Disasters 2019, 28, 17–27. [Google Scholar]
- Jiang, L.J.; Bai, G.L.; Huang, W.Q.; Yu, X.M.; Luo, H.Y.; Zhu, H. Study on spectrum characteristic period of long-period ground motions. Earthq. Eng. Eng. Dyn. 2022, 42, 222–230. [Google Scholar]
- Jiang, L.; Bai, G.; Guo, L.; Li, F. Seismic damage assessment of SRC frame-RC core tube high-rise structure under long-period ground motions. Buildings 2025, 15, 3106. [Google Scholar] [CrossRef]




| Floor Number | Member | Dimension (mm × mm) | Left End | Mid-Span | Right End |
|---|---|---|---|---|---|
| 1–12 | X-axis Marginal Frame Beam | 400 × 900 | 6C25 | 2C25 + 2C22 | 4C25 + 2C22 |
| Y-axis Marginal Frame Beam | 400 × 900 | 4C25 + 4C22 | 4C25 | 4C25 + 4C20 | |
| X-axis Internal Frame Beam | 400 × 900 | 9C25 | 6C25 | 10C25 | |
| Y-axis Internal Frame Beam | 400 × 900 | 12C25 | 7C25 | 12C25 + 2C20 | |
| Secondary Beam | 300 × 600 | 8C25 | 3C25 + 2C22 | 2C25 | |
| 13–24 | X-axis Marginal Frame Beam | 400 × 900 | 6C25 | 2C25 + 2C22 | 4C25 + 2C20 |
| Y-axis Marginal Frame Beam | 400 × 900 | 4C25 + 4C22 | 4C25 | 4C25 + 4C20 | |
| X-axis Internal Frame Beam | 400 × 900 | 9C25 | 5C25 + 2C22 | 11C25 | |
| Y-axis Internal Frame Beam | 400 × 900 | 11C25 | 6C25 + 2C22 | 12C25 + 3C22 | |
| Secondary Beam | 300 × 600 | 4C25 + 4C22 | 5C25 | 4C25 | |
| 25–36 | X-axis Marginal Frame Beam | 400 × 900 | 5C25 | 4C22 | 4C25 + 1C20 |
| Y-axis Marginal Frame Beam | 400 × 900 | 4C25 + 4C20 | 2C25 + 2C22 | 4C25 + 2C22 | |
| X-axis Internal Frame Beam | 400 × 900 | 4C25 + 4C25 | 6C25 | 11C25 | |
| Y-axis Internal Frame Beam | 400 × 900 | 9C25 | 6C25 + 2C22 | 12C25 + 2C22 | |
| Secondary Beam | 300 × 600 | 8C25 | 5C25 | 2C25 |
| Section Dimension | Floor Number | Longitudinal Reinforcement | Steel Skeleton |
|---|---|---|---|
 | 1–12 | 24C25 | 2H900 × 600 × 35 |
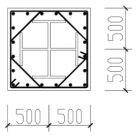 | 13–24 | 4C25 + 16C22 | 2H700 × 400 × 25 |
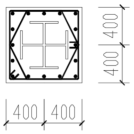 | 25–36 | 4C22 + 12C20 | 2H500 × 300 × 20 |
| Floor Number | Wall Thickness (mm) | Horizontal Reinforcement | Vertical Reinforcement | Number of Reinforcement Layers |
|---|---|---|---|---|
| 1–5 | 800 | C14@150 | C14@150 | 4 |
| 6–12 | 800 | C14@200 | C14@200 | 4 |
| 13–24 | 700 | C14@150 | C14@150 | 3 |
| 25–36 | 600 | C14@200 | C14@200 | 3 |
| Software | Mass (t) | Maximum Inter-story Drift Ratio | Weak Floors | Maximum Top Floor Displacement (mm) | Base Shear Force (kN) |
|---|---|---|---|---|---|
| Perform-3D (Version 7) | 69,922 | 0.0067 | 27 | 546 | 66,780 |
| YJK (Version 4.0) | 70,052 | 0.0071 | 28 | 617 | 74,307 |
| Error | 0.19% | 5.63% | - | 11.51% | 10.13% |
| Natural Vibration Period (s) | T1 | T2 | T3 | T4 | T5 | T6 |
| 3.352 | 2.951 | 2.495 | 0.907 | 0.844 | 0.819 | |
| Vibration Mode Characteristics | Y-direction First-order Translation | X-direction First-order Translation | Z-direction First-order Torsion | Y-direction Second-order Translation | X-direction Second-order Translation | Z-direction Second-order Torsion |
| Type of Ground Motion | No. | Earthquake Name | Recording Station | Ground Motion | PGA (cm/s2) | PGV (cm/s) | Input Direction |
| Long-Period Ground Motion | 1 | Wen chuan | 14HTG | 14HTG-NS | 16.47 | 7.56 | Y |
| 14HTG-EW | 16.13 | 7.34 | X | ||||
| 2 | 62QSY | 62QSY-NS | 17.18 | 5.45 | Y | ||
| 62QSY-EW | 18.08 | 7.37 | X | ||||
| 3 | 62CJA | 62CJA-NS | 13.19 | 5.83 | Y | ||
| 62CJA-EW | 12.24 | 7.67 | X | ||||
| 4 | Tokachi | HKD130 | HKD130-NS | 56.16 | 13.74 | Y | |
| HKD130-EW | 51.41 | 16.39 | X | ||||
| 5 | East Japan | AKT013 | AKT013-EW | 28.59 | 8.17 | Y | |
| AKT013-NS | 44.20 | 7.23 | X | ||||
| 6 | CHBH16 | CHBH16-EW | 11.83 | 9.38 | Y | ||
| CHBH16-NS | 10.52 | 4.54 | X | ||||
| 7 | HKD083 | HKD083-NS | 14.34 | 5.51 | Y | ||
| HKD083-EW | 13.31 | 8.14 | X | ||||
| Ordinary Ground Motion | 8 | Kobe | MZH | MZH090 | 52.38 | 4.83 | Y |
| MZH000 | 69.65 | 4.44 | X | ||||
| 9 | Kocaeli | Eregli | ERG180 | 89.69 | 15.15 | Y | |
| ERG090 | 106.06 | 10.96 | X | ||||
| 10 | Northridge | Newport Bch-Irvine | NBI000 | 41.24 | 4.14 | Y | |
| NBI090 | 60.72 | 5.25 | X |
| Type of Ground Motion | Ground Motion Record | 8-Degree Frequent Earthquake | 8-Degree Design Earthquake | 8-Degree Rare Earthquake | |||
|---|---|---|---|---|---|---|---|
| EI | Average Value | EI | Average Value | EI | Average Value | ||
| Long-Period Ground Motion | 14HTG | 7.37 | 5.30 | 55.97 | 44.86 | 153.03 | 139.04 |
| 62QSY | 4.97 | 37.46 | 104.16 | ||||
| 62CJA | 4.27 | 49.66 | 138.08 | ||||
| HKD130 | 4.96 | 30.23 | 79.67 | ||||
| AKT013 | 3.59 | 24.51 | 81.40 | ||||
| CHBH16 | 3.30 | 37.97 | 185.66 | ||||
| HKD083 | 8.65 | 78.24 | 231.27 | ||||
| Ordinary Ground Motion | MZH | 0.47 | 0.39 | 1.69 | 1.70 | 5.32 | 5.26 |
| ERG | 0.27 | 1.27 | 4.35 | ||||
| NBI | 0.44 | 2.13 | 6.10 | ||||
| Type of Ground Motion | Ground Motion Record | 8-Degree Frequent Earthquake | 8-Degree Design Earthquake | 8-Degree Rare Earthquake | |||
|---|---|---|---|---|---|---|---|
| EH/EI | ED/EI | EH/EI | ED/EI | EH/EI | ED/EI | ||
| Long-Period Ground Motion | 14HTG | 0.264 | 0.692 | 0.478 | 0.512 | 0.464 | 0.529 |
| 62QSY | 0.217 | 0.742 | 0.437 | 0.549 | 0.458 | 0.536 | |
| 62CJA | 0.215 | 0.719 | 0.489 | 0.502 | 0.455 | 0.539 | |
| HKD130 | 0.260 | 0.656 | 0.418 | 0.560 | 0.443 | 0.537 | |
| AKT013 | 0.094 | 0.849 | 0.354 | 0.631 | 0.468 | 0.525 | |
| CHBH16 | 0.175 | 0.763 | 0.503 | 0.482 | 0.542 | 0.449 | |
| HKD083 | 0.300 | 0.676 | 0.461 | 0.525 | 0.467 | 0.524 | |
| Ordinary Ground Motion | MZH | 0 | 0.596 | 0.025 | 0.779 | 0.123 | 0.798 |
| ERG | 0 | 0.584 | 0.148 | 0.697 | 0.332 | 0.597 | |
| NBI | 0 | 0.506 | 0.117 | 0.718 | 0.206 | 0.683 | |
Disclaimer/Publisher’s Note: The statements, opinions and data contained in all publications are solely those of the individual author(s) and contributor(s) and not of MDPI and/or the editor(s). MDPI and/or the editor(s) disclaim responsibility for any injury to people or property resulting from any ideas, methods, instructions or products referred to in the content. |
© 2025 by the authors. Licensee MDPI, Basel, Switzerland. This article is an open access article distributed under the terms and conditions of the Creative Commons Attribution (CC BY) license (https://creativecommons.org/licenses/by/4.0/).
Share and Cite
Jiang, L.; Bai, G.; Guo, L.; Shi, Y.; Zhu, F. Study on the Energy Distribution and Dissipation of High-Rise Structures Under Long-Period Ground Motions. Buildings 2025, 15, 3600. https://doi.org/10.3390/buildings15193600
Jiang L, Bai G, Guo L, Shi Y, Zhu F. Study on the Energy Distribution and Dissipation of High-Rise Structures Under Long-Period Ground Motions. Buildings. 2025; 15(19):3600. https://doi.org/10.3390/buildings15193600
Chicago/Turabian StyleJiang, Lianjie, Guoliang Bai, Lu Guo, Yun Shi, and Fangzhi Zhu. 2025. "Study on the Energy Distribution and Dissipation of High-Rise Structures Under Long-Period Ground Motions" Buildings 15, no. 19: 3600. https://doi.org/10.3390/buildings15193600
APA StyleJiang, L., Bai, G., Guo, L., Shi, Y., & Zhu, F. (2025). Study on the Energy Distribution and Dissipation of High-Rise Structures Under Long-Period Ground Motions. Buildings, 15(19), 3600. https://doi.org/10.3390/buildings15193600


