Article

Analysis on DDBD Method of Precast Frame with UHPC Composite Beams and HSC Columns

School of Civil Engineering and Architecture, Northeast Electric Power University, Jilin 132012, China
*
Author to whom correspondence should be addressed.
Buildings 2025, 15(19), 3546; https://doi.org/10.3390/buildings15193546
Submission received: 25 August 2025 / Revised: 18 September 2025 / Accepted: 28 September 2025 / Published: 2 October 2025

Abstract

Precast concrete frames integrating ultra-high-performance concrete (UHPC) beams and high-strength concrete (HSC) columns offer exceptional seismic resilience and construction efficiency. However, a performance-based seismic design methodology tailored for this hybrid structural system remains underdeveloped. This study aims to develop and validate a direct displacement-based design (DDBD) procedure specifically for precast UHPC-HSC frames. A novel six-tier performance classification scheme (from no damage to severe damage) was established, with quantitative limit values of interstory drift ratio proposed based on experimental data and code calibration. The DDBD methodology incorporates determining the target displacement profile, converting the multi-degree-of-freedom system to an equivalent single-degree-of-freedom system, and utilizing a displacement response spectrum. A ten-story case study frame was designed using this procedure and rigorously evaluated through pushover analysis. The results demonstrate that the designed frame consistently met the predefined performance objectives under various seismic intensity levels, confirming the effectiveness and reliability of the proposed DDBD method. This work contributes a performance oriented seismic design framework that enhances the applicability and reliability of UHPC-HSC structures in earthquake regions, offering both theoretical insight and procedural guidance for engineering practice.

1. Introduction

Compared to force-based design (FBD) method, performance-based seismic design method facilitates the implementation of the concept of “multilevel seismic protection”. Direct displacement-based design (DDBD) method is one of the primary branches of performance-based design [1]. Priestley et al. [2] converted the multi-degree-of-freedom (MDOF) system into an equivalent single-degree-of-freedom (SDOF) system, and designed a structure based on the target displacement. It was the first complete proposal of DDBD method. In terms of designing the lateral displacement curve, Al-Mashaykhi et al. [3] transcended the limitations of traditional first-order mode assumptions by innovatively introducing higher-order vibration modes correction coefficients. Researchers employed a multi-parameter variable analysis method to determine the optimal displacement profile model. This approach significantly enhanced the accuracy of displacement predictions [4,5,6]. Kalapodis et al. [7] introduced the concept of a modal response modification factor derived from modal analysis, facilitating an effective transition from elastic modal displacement to inelastic displacement profiles. In terms of the equivalent linearization method, Xu et al. [8] systematically evaluated the limitations associated with the application of four traditional equivalent linearization methods in self-centering systems. They established an empirical equivalent linearization model that incorporates the self-centering characteristics. Meanwhile, Muho et al. [9,10] introduced significant improvements to the DDBD method by innovating the use of an MDOF-equivalent system, as opposed to the conventional SDOF system. This innovation effectively addresses the simulation challenges posed by higher-order modal effects and geometric nonlinearities. In the establishment of displacement response spectrum, Wu et al. [11] revealed the predictive biases of various models under different site conditions. Orellana et al. [12] introduced probabilistic seismic risk analysis into the calculation of damping factors, thereby correcting the elastic displacement spectrum. Li et al. [13] focused on the characteristics of near-fault pulse-type ground motions and innovatively proposed a method for constructing period-normalized equivalent ductility displacement spectrum. Zhao et al. [14] conducted scientific calibration of displacement spectrum parameters by employing mathematical statistics methods based on real-time seismic monitoring data. Researchers have analyzed the impact of different parameters on the seismic performance and earthquake vulnerability of structures designed using two methods: DDBD and FBD. The parameters include the span and height of the structure [15], site conditions and the number of stories [16]. Comparative studies have revealed the superiority of the DDBD method. Furthermore, scholars conducted research on the DDBD method across various structural forms. Through case studies, it has been verified that this method can meet the requirements of different performance levels. The structural forms included frame structures [17,18], self-resetting structures [19,20,21], and hybrid structures [22,23,24,25,26]. Moreover, machine learning (ML) has proven effective for rapid seismic evaluation and damage prediction, such as assessing the vulnerability of reinforced concrete buildings by identifying key factors like material properties [27], and predicting structural damage using ground motion intensity measures and initial damage states [28]. Meanwhile, traditional strengthening methods, including passive damping systems, remain valuable for enhancing seismic resilience, especially in challenging site conditions like soft soil [29].
Precast concrete structures demonstrate significant advantages including rapid construction, enhanced quality control, reduced on-site labor requirements, and minimized environmental impacts, making them a crucial choice for modern industrialized building systems [30,31]. Ultra-high-performance concrete (UHPC) represents a groundbreaking advancement in cement-based materials, extensively studied for its superior properties [32,33,34]. Its performance stems from optimized particle packing and the pozzolanic reaction of silica fume, which refines microstructure and enhances hydration [35]. Recent advances include multi-agent collaborative and data-driven methods for designing UHPC with solid wastes [36], further promoting its exceptional mechanical properties and durability for structural applications. UHPC composite beams and columns can achieve remarkable improvements in static performance [37,38,39], while UHPC beam-column joints significantly enhance the moment transfer efficiency and crack resistance of frame structures [40,41]. At the system level, our previous research [42] proposed a precast UHPC and high strength concrete (HSC) frame that consists of composite beams with precast U-shaped UHPC permanent beam formworks and cast-in-place Normal strength concrete (NSC) beam cores, precast HSC columns, and cast-in-place UHPC beam-column joints. Experimental studies under cyclic lateral loading reveal that the UHPC-HSC frame exhibits a mixed sidesway mechanism dominated by beam hinges. This mechanism endows the structure with strong integrity, excellent seismic performance, and ease of post-earthquake repair. Although extensive research has been conducted on UHPC materials and structural elements, studies on the comprehensive seismic design methodology, particularly the DDBD method, for fully prefabricated frame systems incorporating UHPC and HSC remain limited.
This research focuses on the DDBD method applied to precast UHPC-HSC frame structures. The performance objectives, along with quantitative indices for the limit values of interstory drift ratio (ISDR), were proposed. Additionally, specific steps for implementing the DDBD method in precast UHPC-HSC frame structures were established. A one-bay, ten-story, three-span frame structure was designed as a case study and evaluated through pushover analysis. This research provides substantial support for the application of the DDBD method in precast UHPC-HSC frame structures.

2. Performance Levels and Quantification Index for UHPC-HSC Frame Structure

The codes JGJ 3-2010 [43] and T/CECA 20024-2022 [44] classify structural seismic performance into five distinct levels. In contrast, the FEMA 356 [45] defines four seismic performance levels for reinforced concrete structures, namely Operational (O), Immediate Occupancy (IO), Life Safety (LS), and Collapse Prevention (CP). For the precast UHPC-HSC frame structure, the damage states were categorized into six levels: no damage, slight damage, light damage, moderate damage, significant damage, and severe damage. These damage states correspond to performance Levels 1 through 6, respectively. It is noteworthy that codes JGJ 3-2010 [43] and T/CECA 20024-2022 [44] specify a four-tier classification for structural performance objectives. The performance objectives of the precast UHPC-HSC frame were categorized into four levels, each aligned with specific seismic performance requirements under the four-level seismic protection defined in GB 18306-2015 “Seismic ground motion parameters zonation map of China” [46], as detailed in Table 1.
The limit value of ISDR was employed as a quantitative index to assess each performance level of precast UHPC-HSC frame. The limit values of ISDR corresponding to different performance levels are established based on extensive post-earthquake investigations and testing. However, as UHPC is a relatively new material, research on its application in frame structures remains limited. This study comprehensively considers traditional reinforced concrete frames, collected literature data, and our preliminary experimental results to establish the limit values of ISDR for various performance levels of precast UHPC-HSC frame. According to GB 50011-2010 [47], the limit value of the elastic and elastoplastic ISDR for frame structures are 0.18% and 2%, respectively. In contrast, FEMA 356 [45] specifies these limit values as 1% for IO level, 2% for LS level, and 4% for CP level. Additionally, SEAOC Vision 2000 [48] recommends corresponding limit values of 0.5%, 2.5%, and 4% for these three performance levels. Through a comprehensive review of the literature, quasi-static test data on UHPC-connected frame structures, frame columns, and bridge piers were compiled. The ISDR at yield, peak, and ultimate points are summarized in Table 2.
Based on the above, this study proposes the limit values of ISDR for the six performance levels of precast UHPC-HSC frame structure, as summarized in Table 3. The limit value of ISDR for performance level 1 is defined as the elastic ISDR. The limit value of ISDR for performance level 2 is set at 1.1 times that of performance level 1. For performance level 4, the limit value of ISDR is set 1.1%. Performance level 3 is assigned a limit value of ISDR that is half of that for performance level 4. The limit values of ISDR for performance levels 5 and 6 are 2.5% and 4%, respectively.

3. Fundamentals of DDBD

3.1. Determination of Target Displacement

When the weak story of the frame structure reaches the limit value of ISDR, the calculated displacement of the frame structure can be considered as the target displacement for the precast UHPC-HSC frame. The displacements at each floor of the frame structure can be obtained from the target displacement and the calculation of the modal shape coefficients, as shown in the following Equations [54]:
Δ i = δ i Δ c δ c
δ i = H i H n n 4
δ i = 4 3 H i H n 1 H i 4 H n n > 4
When the number of stories in the frame structure exceeds ten, the influence of higher-order modes must be considered. Accordingly, Equation (1) should be multiplied by a lateral displacement reduction factor. This reduction factor can be expressed as a function of the number of stories, building height, or fundamental period. However, since the fundamental period is unknown during the initial design phase and building height correlates more fundamentally with higher-mode effects than the number of stories, the factor is defined in Equation (4) [54]:
ω θ = 1.15 0.0034 H n 1.0 n > 10

3.2. Equivalent Procedure for MDOF

The DDBD method requires the transformation of an MDOF system with n degrees of freedom into an equivalent SDOF system representation. The detailed derivation is provided in Appendix A.
M eff and H e are evaluated using Equations (5) and (6).
M eff = i = 1 n m i c i = i = 1 n m i Δ i Δ d
H e = i = 1 n m i Δ i H i i = 1 n m i Δ i
Δ d is calculated from Equation (7).
Δ d = i = 1 n F i Δ i V b = i = 1 n m i Δ i 2 i = 1 n m i Δ i
Using the method illustrated in Figure 1, the secant stiffness corresponding to the maximum effective displacement is taken as K eff . K eff is evaluated using Equation (8).
K eff = 2 π T eff 2 M eff = 4 π 2 T eff 2 M eff
V b is calculated from Equation (9).
V b = K eff · Δ d
The lateral loads have been distributed at a different story using design base shear given by Equations (10) and (11).
F i = V b m i Δ i i = 1 n m i Δ i n 10
F i = F t + 0.9 V b m i Δ i i = 1 n m i Δ i n > 10
ζ eq is evaluated by Equation (12) [54].
ζ eq = ζ 0 + ζ hys = 0.05 + 0.565 μ 1 μ π
μ is found by the ratio between Δ d and Δ y (Equation (13)).
μ = Δ d Δ y
Incorporates corrections for column flexural deformation, joint shear deformation, and member shear deformation in addition to the beam deformation, Δ y is evaluated using Equation (14) [54].
Δ y = θ y H e = 2 M 1 θ y 1 + M 2 θ y 2 2 M 1 + M 2 H e = 2 M 1 0.5 ε y 1 L b 1 h b 1 + M 2 0.5 ε y 2 L b 2 h b 2 2 M 1 + M 2 H e

3.3. Displacement Response Spectrum

The structural displacement response spectrum ( S d - T ) can be obtained by converting the acceleration response spectrum ( S a - T ), as expressed in Equation (15).
S d = T 2 π 2 S a
Following GB 50011-2010 [47], S a - T is determined by α , as expressed in Equation (16).
S a = α · g
S d - T is derived through the transformation of Equations (15) and (16).
S d = T 2 π 2 S a = T 2 4 π 2 α g
α is divided into four segments, and T eff can be determined by the following Equations:
(1) Linear ascending segment
T 2 0.45 + 10 η 2 0.45 T = 4 π 2 α max g S d T 0.1 s
(2) Horizontal segment
T = 2 π S d η 2 α max g 0.1 s T T g
(3) Nonlinear descending segment
T = 4 π 2 T g γ · S d η 2 α max g 1 2 γ T g T 5 T g
(4) Linear descending segment
T 2 0.2 γ η 2 η 1 T 5 T g = 4 π 2 α max g S d 5 T g T 6 s
α max is adopted from T/CECA 20024-2022 “Standard for performance-based seismic design of building structures” [44].

4. Design Procedure for Precast UHPC-HSC Frame Structures Based on DDBD

(1) Preliminary structural design: Considering the functional requirements for the use of the precast UHPC-HSC frame structure, the layout parameters, such as column grid, story height, material strength, and cross-sections of beam and column, are determined in compliance with relevant design codes. The dimensions of the U-shaped UHPC beam formwork are initially selected according to the following principles: The side wall height is determined by subtracting the thickness of the slab from the beam height. Given the excellent durability of UHPC, the thickness of the concrete protection layer can be appropriately reduced. Generally, the bottom board ranges from 50 mm to 70 mm, while the side wall thickness can be reduced to approximately 30 mm to 50 mm. The length of the cast-in-place UHPC at the beam ends is generally equal to the plastic hinge length of the beam. The height of the cast-in-place UHPC at the bottom of the column is generally equal to the plastic hinge length of the column, and it is also necessary to determine based on the construction operation space required for the pressed sleeve splicing connection.
(2) Performance objective: After comprehensively considering the importance of the structure and the owner’s requirements, the performance objective for the precast UHPC-HSC frame is selected according to Table 1. Based on the selected performance objective, [θ] under different seismic levels are determined according to Table 3.
(3)  Δ d : Identify the weak story of the precast UHPC-HSC frame and set θ = [θ]. Based on the target lateral displacement curve, calculate Δ i using Equations (1)–(4). The precast UHPC-HSC frame is converted into an equivalent SDOF system, and Δ d is calculated using Equation (7).
(4)  M eff  and  H e :  M eff and H e are calculated using Equations (5) and (6), respectively.
(5)  ζ eq  and  T eff :  μ is first computed via Equations (13) and (14), followed by evaluation of ζ eq using Equation (12), T eff is then obtained from Equations (18)–(21).
(6)  K eff  and  V b :  K eff and V b are calculated using Equations (8) and (9), respectively.
(7)  F i : The horizontal seismic action of each story of the precast UHPC-HSC frame are calculated according to Equations (10) and (11).
(8) Reinforcement design: Structural internal force calculations are performed, and the design for beams and columns is carried out to determine the required reinforcement.
(9) Design result verification: A pushover analysis is conducted on the precast UHPC-HSC frame, and the displacement curve designed based on Equations (1)–(4) is compared and analyzed with the displacement curve obtained from the pushover analysis. If the results from the pushover analysis do not meet the preset displacement objectives, the displacement curve obtained from the pushover analysis is used as the modified displacement curve, and calculations are performed again until the final design is completed.

5. Modeling Methodology and Experimental Validation

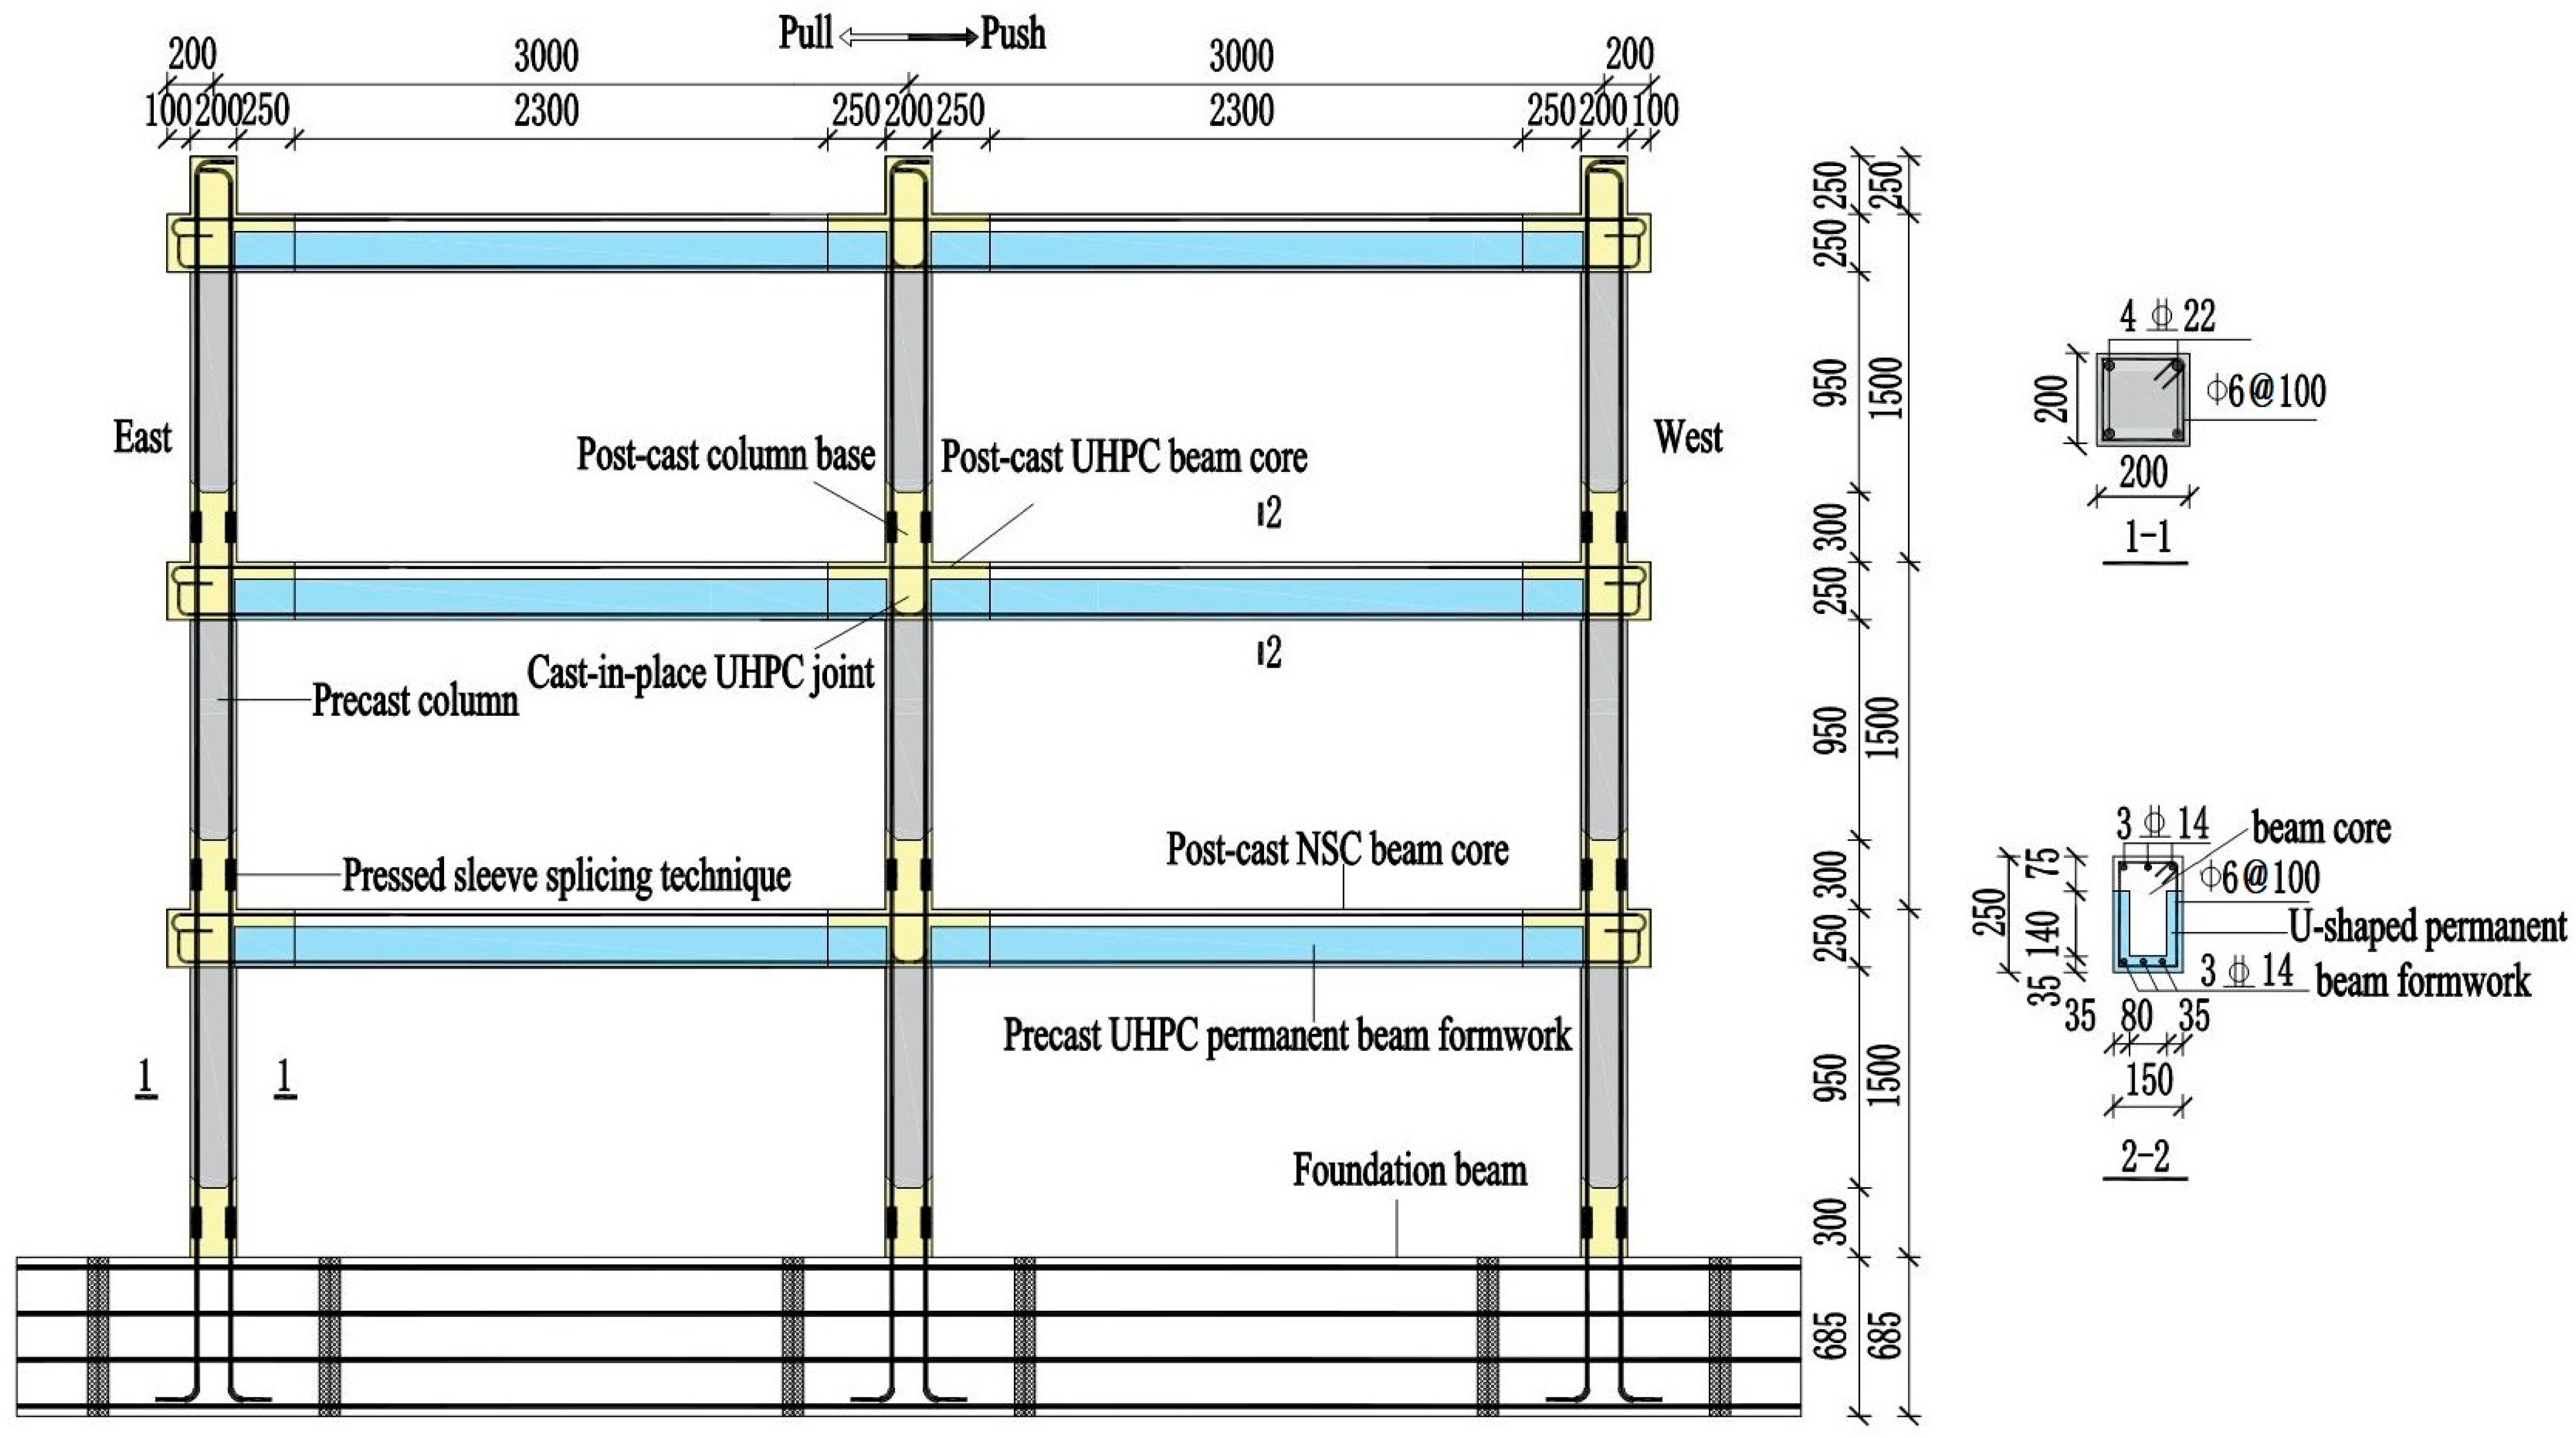
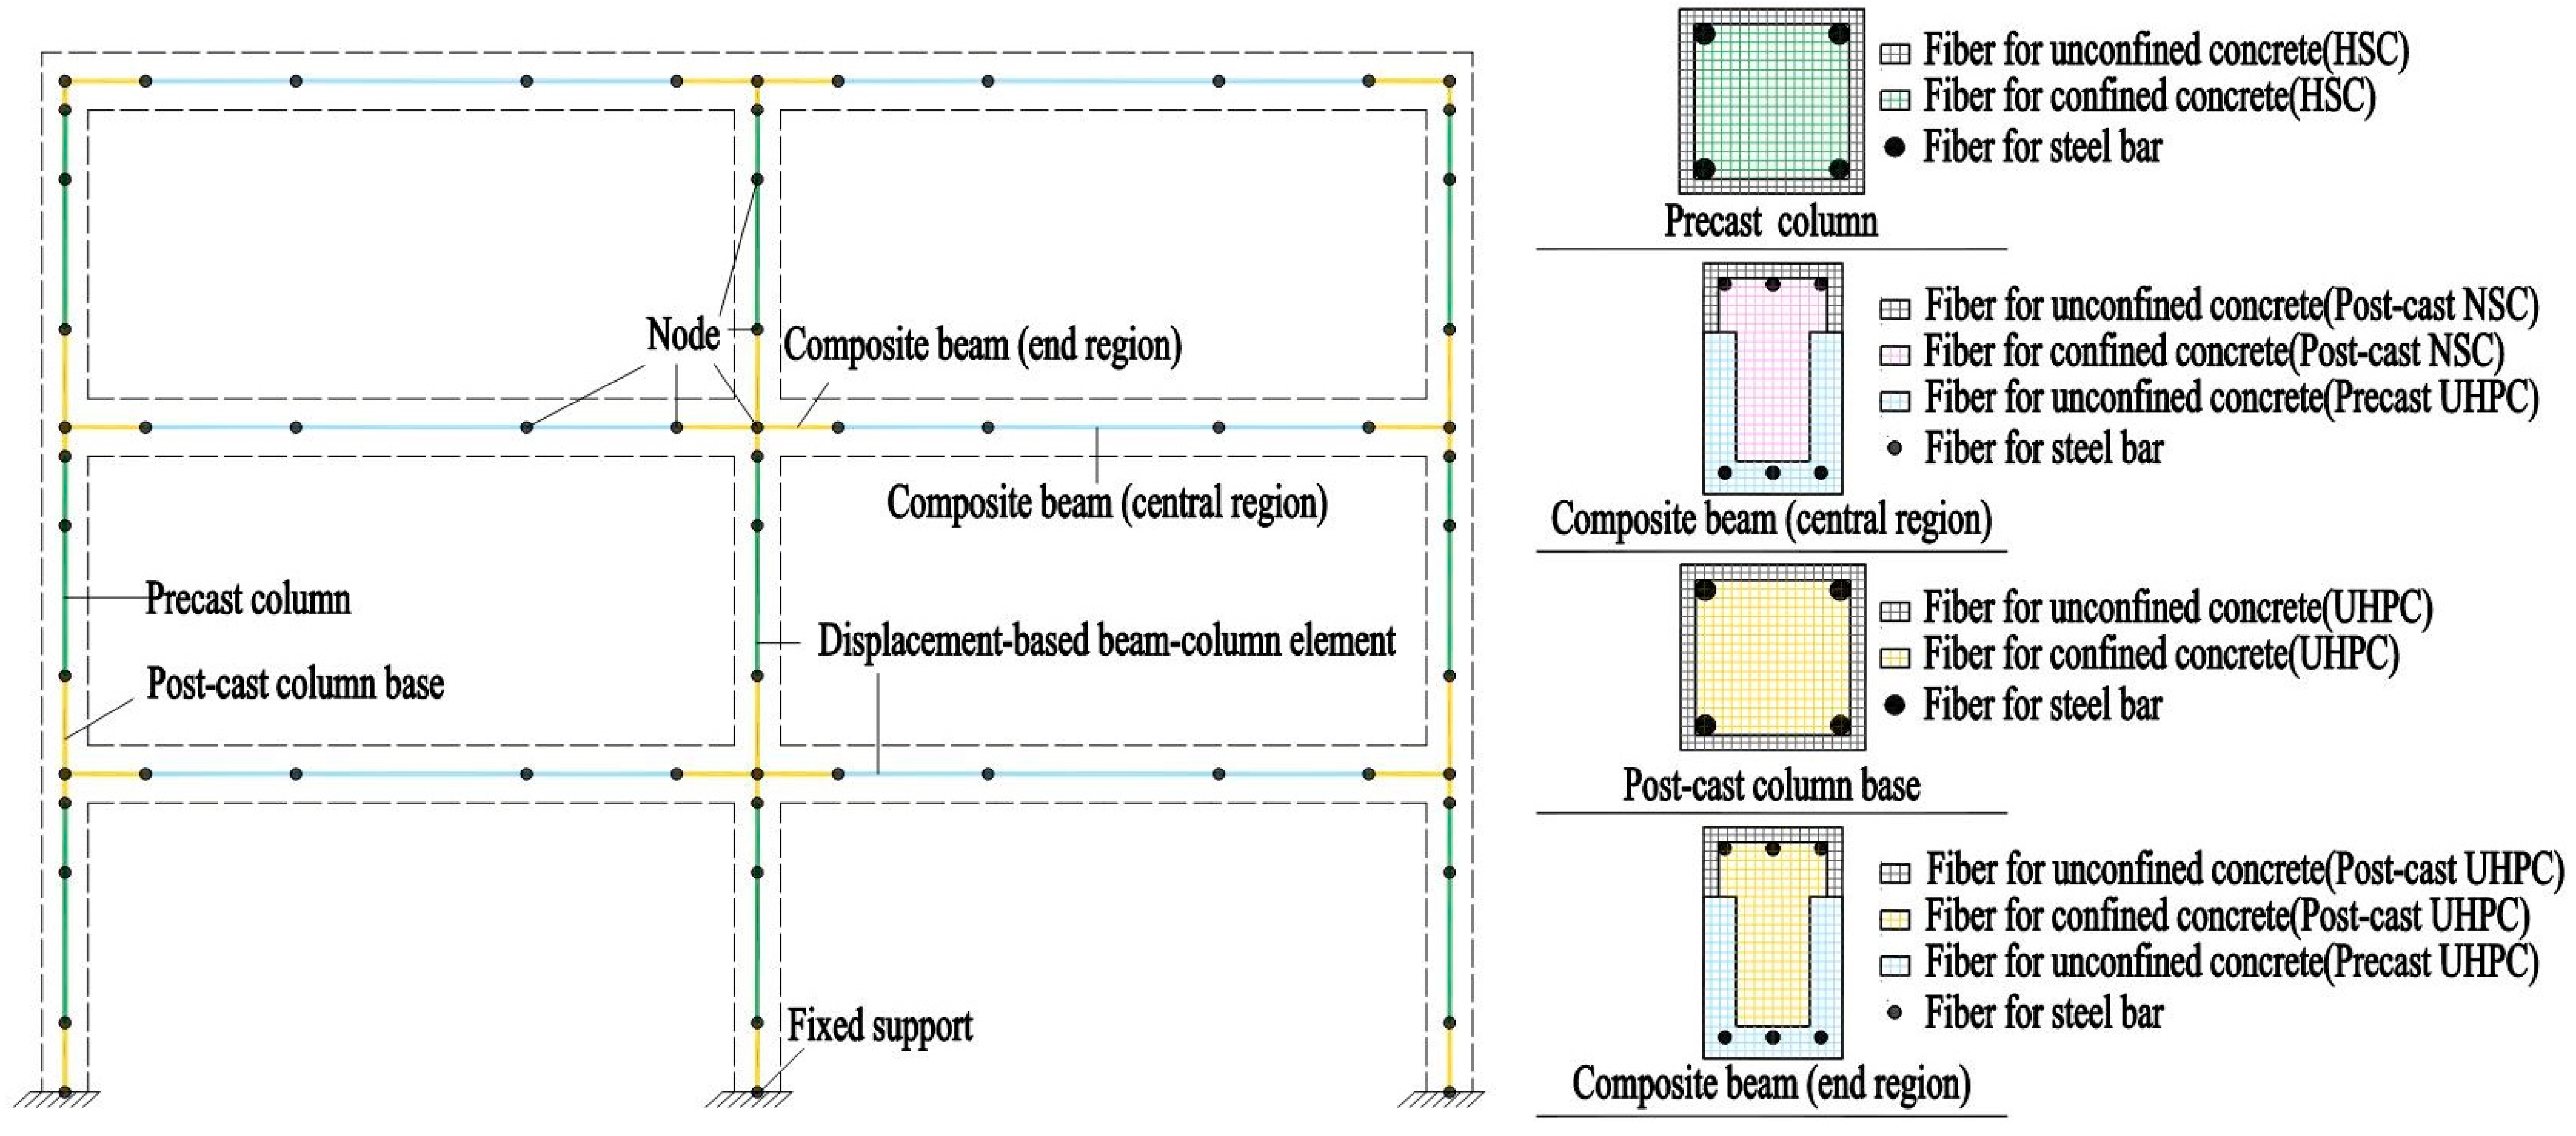
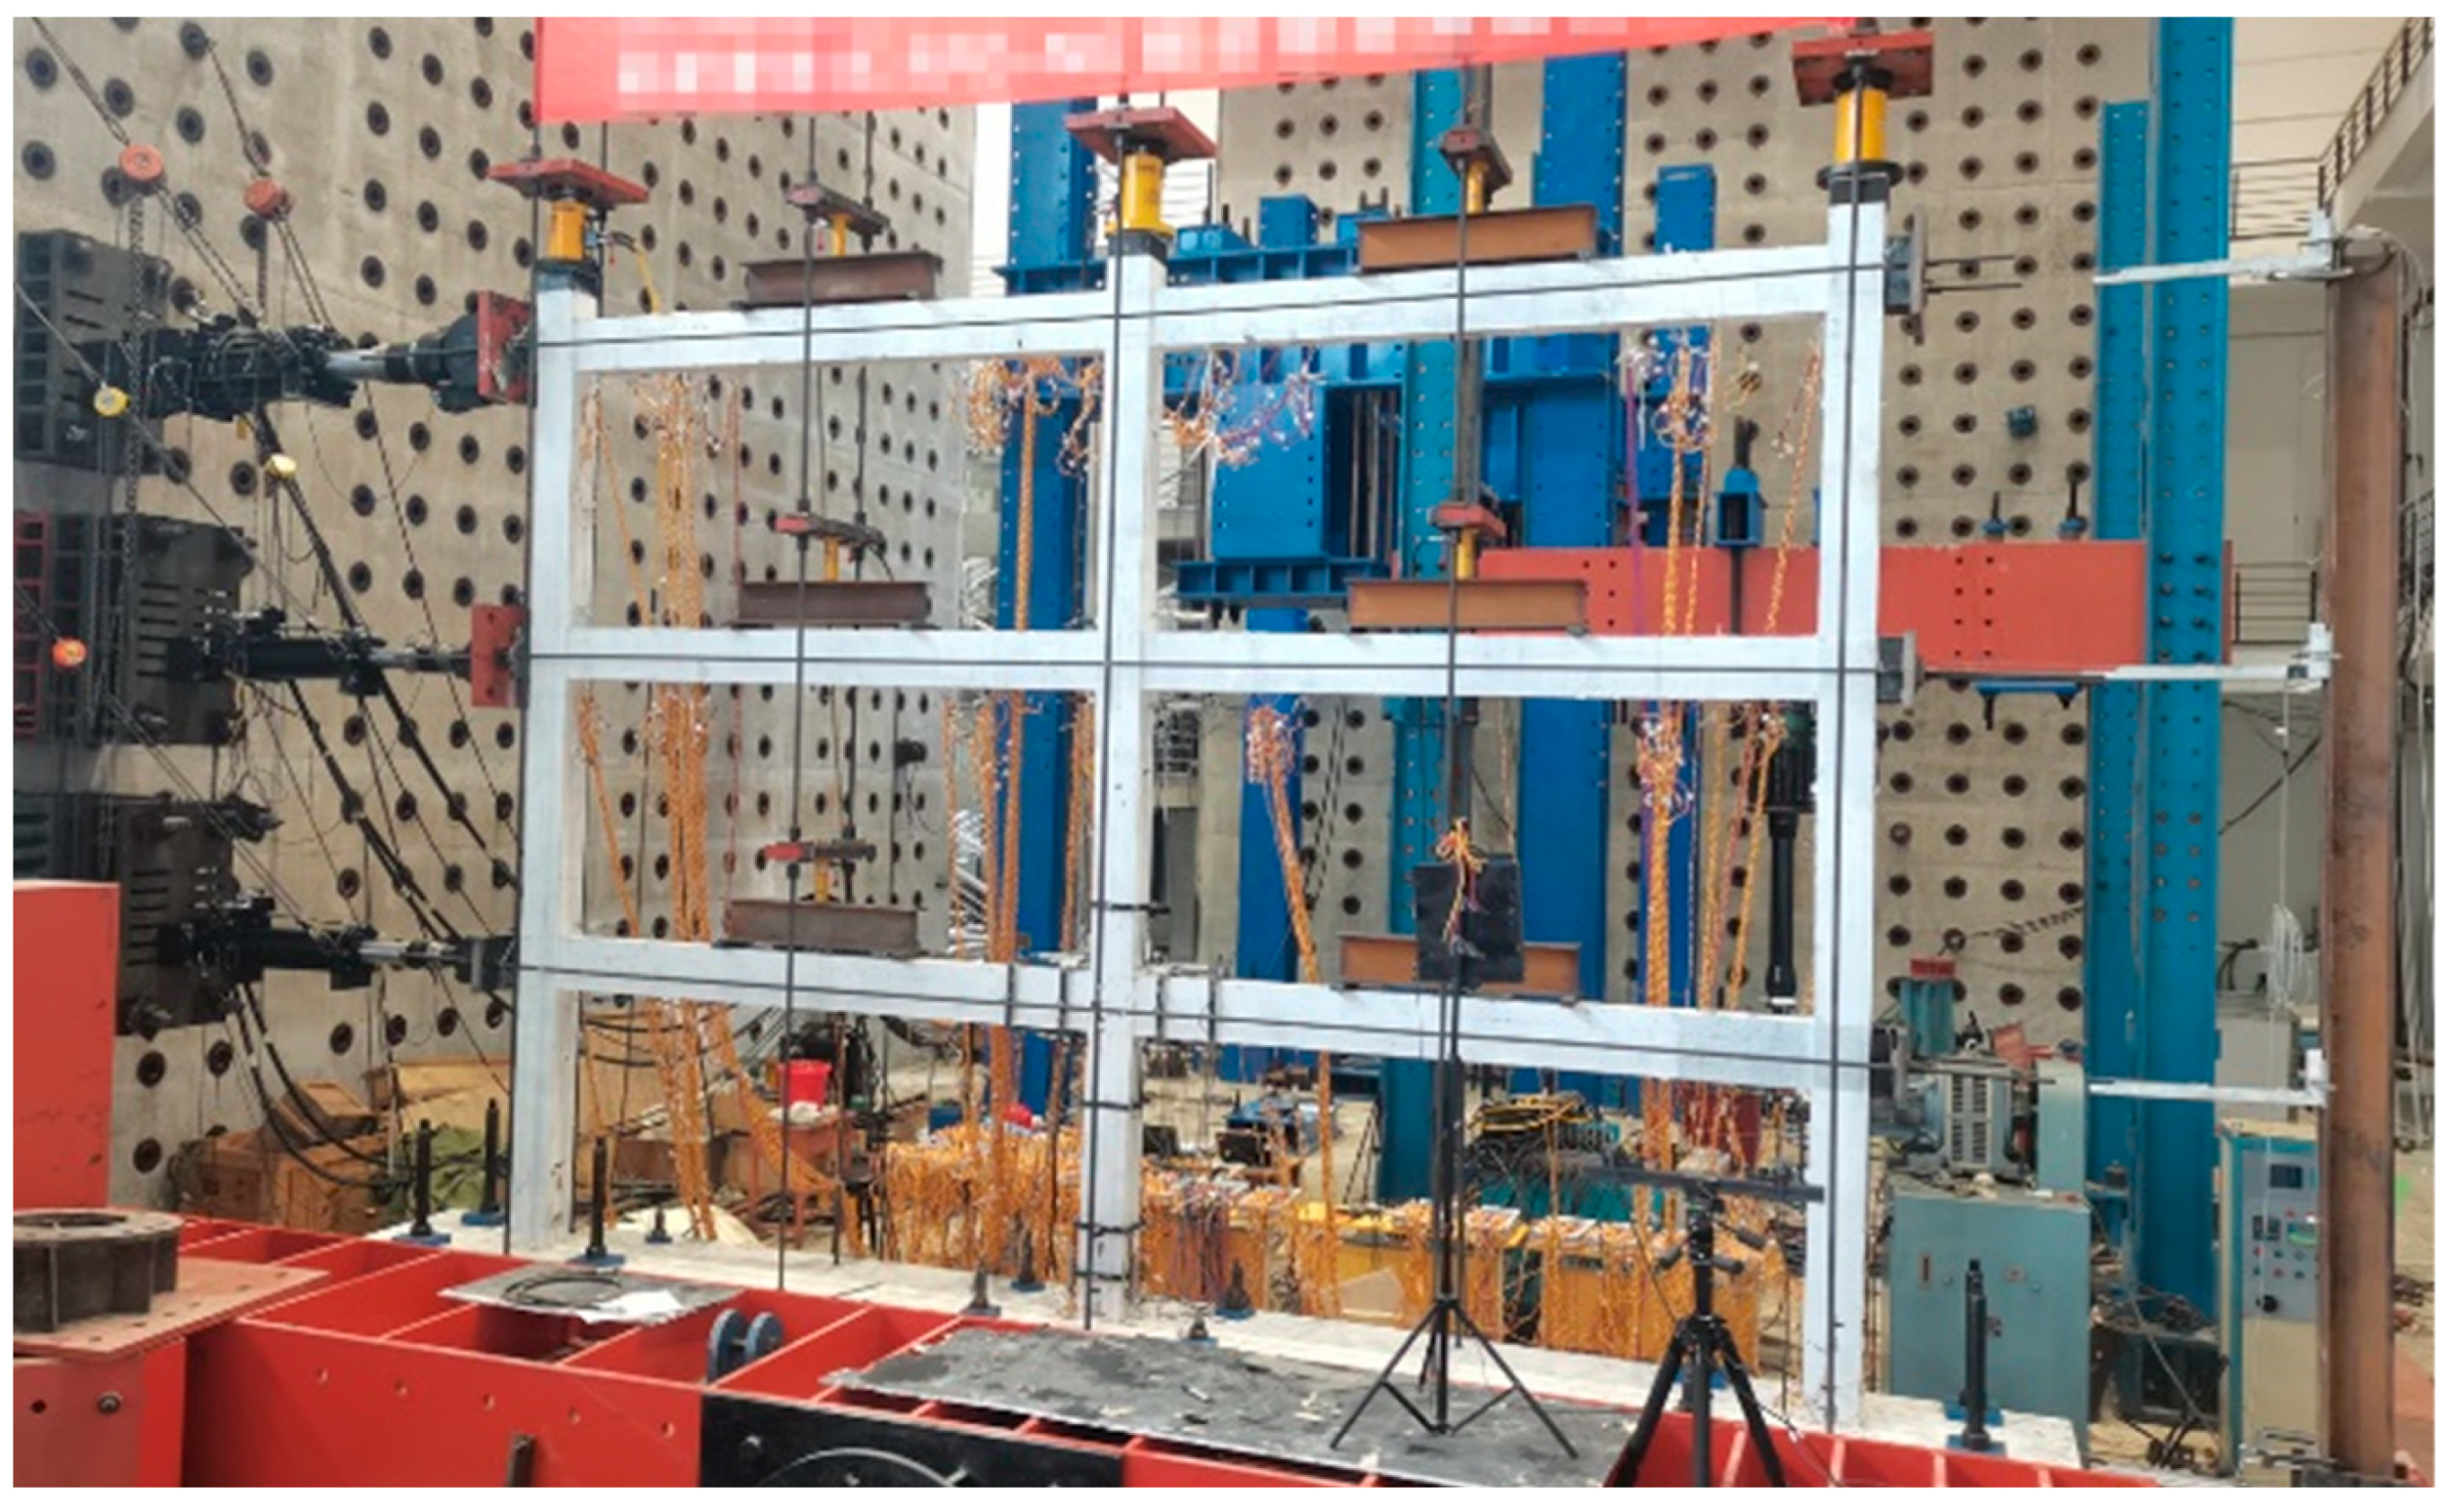
Based on the quasi-static experimental investigation of the precast UHPC-HSC frame conducted by our previous research [42], the geometric dimensions and reinforcement details of the frame structure are illustrated in Figure 2. A corresponding finite element model of the UHPC-HSC frame was developed using OpenSEES 3.4.0, with the modeling method represented in Figure 3. The model employed a two-dimensional centerline modeling strategy, in which beam and column elements were simulated using Displacement-Based Beam-Column Elements with five integration points per element. Based on the excellent integrity of composite beams observed in prior experimental study [42], it was assumed that there was perfect bond between the precast UHPC and post-cast concrete, with no relative slip. According to the plane section assumption, different materials within the fiber section work together at the same cross-section. The precast U-shaped UHPC beam formwork was modeled using distinct fiber cross-sections, while the post-cast UHPC regions were incorporated by adjusting the element lengths accordingly. The boundary conditions and loading protocol implemented in the finite element model were rigorously aligned with the test setup, as illustrated in Figure 4. The mass of the slab and the additional dead and live loads were converted into line loads distributed along the beams based on their respective load-sharing areas, thereby accurately accounting for mass effects. Rectangular cross-sections were used for the beam elements, and the stiffness contribution from the slab acting as a flange was not considered. Furthermore, to accurately capture geometric nonlinearities associated with large displacements, the P-Delta effect was included in the analysis using the geomTransformation command in OpenSEES.
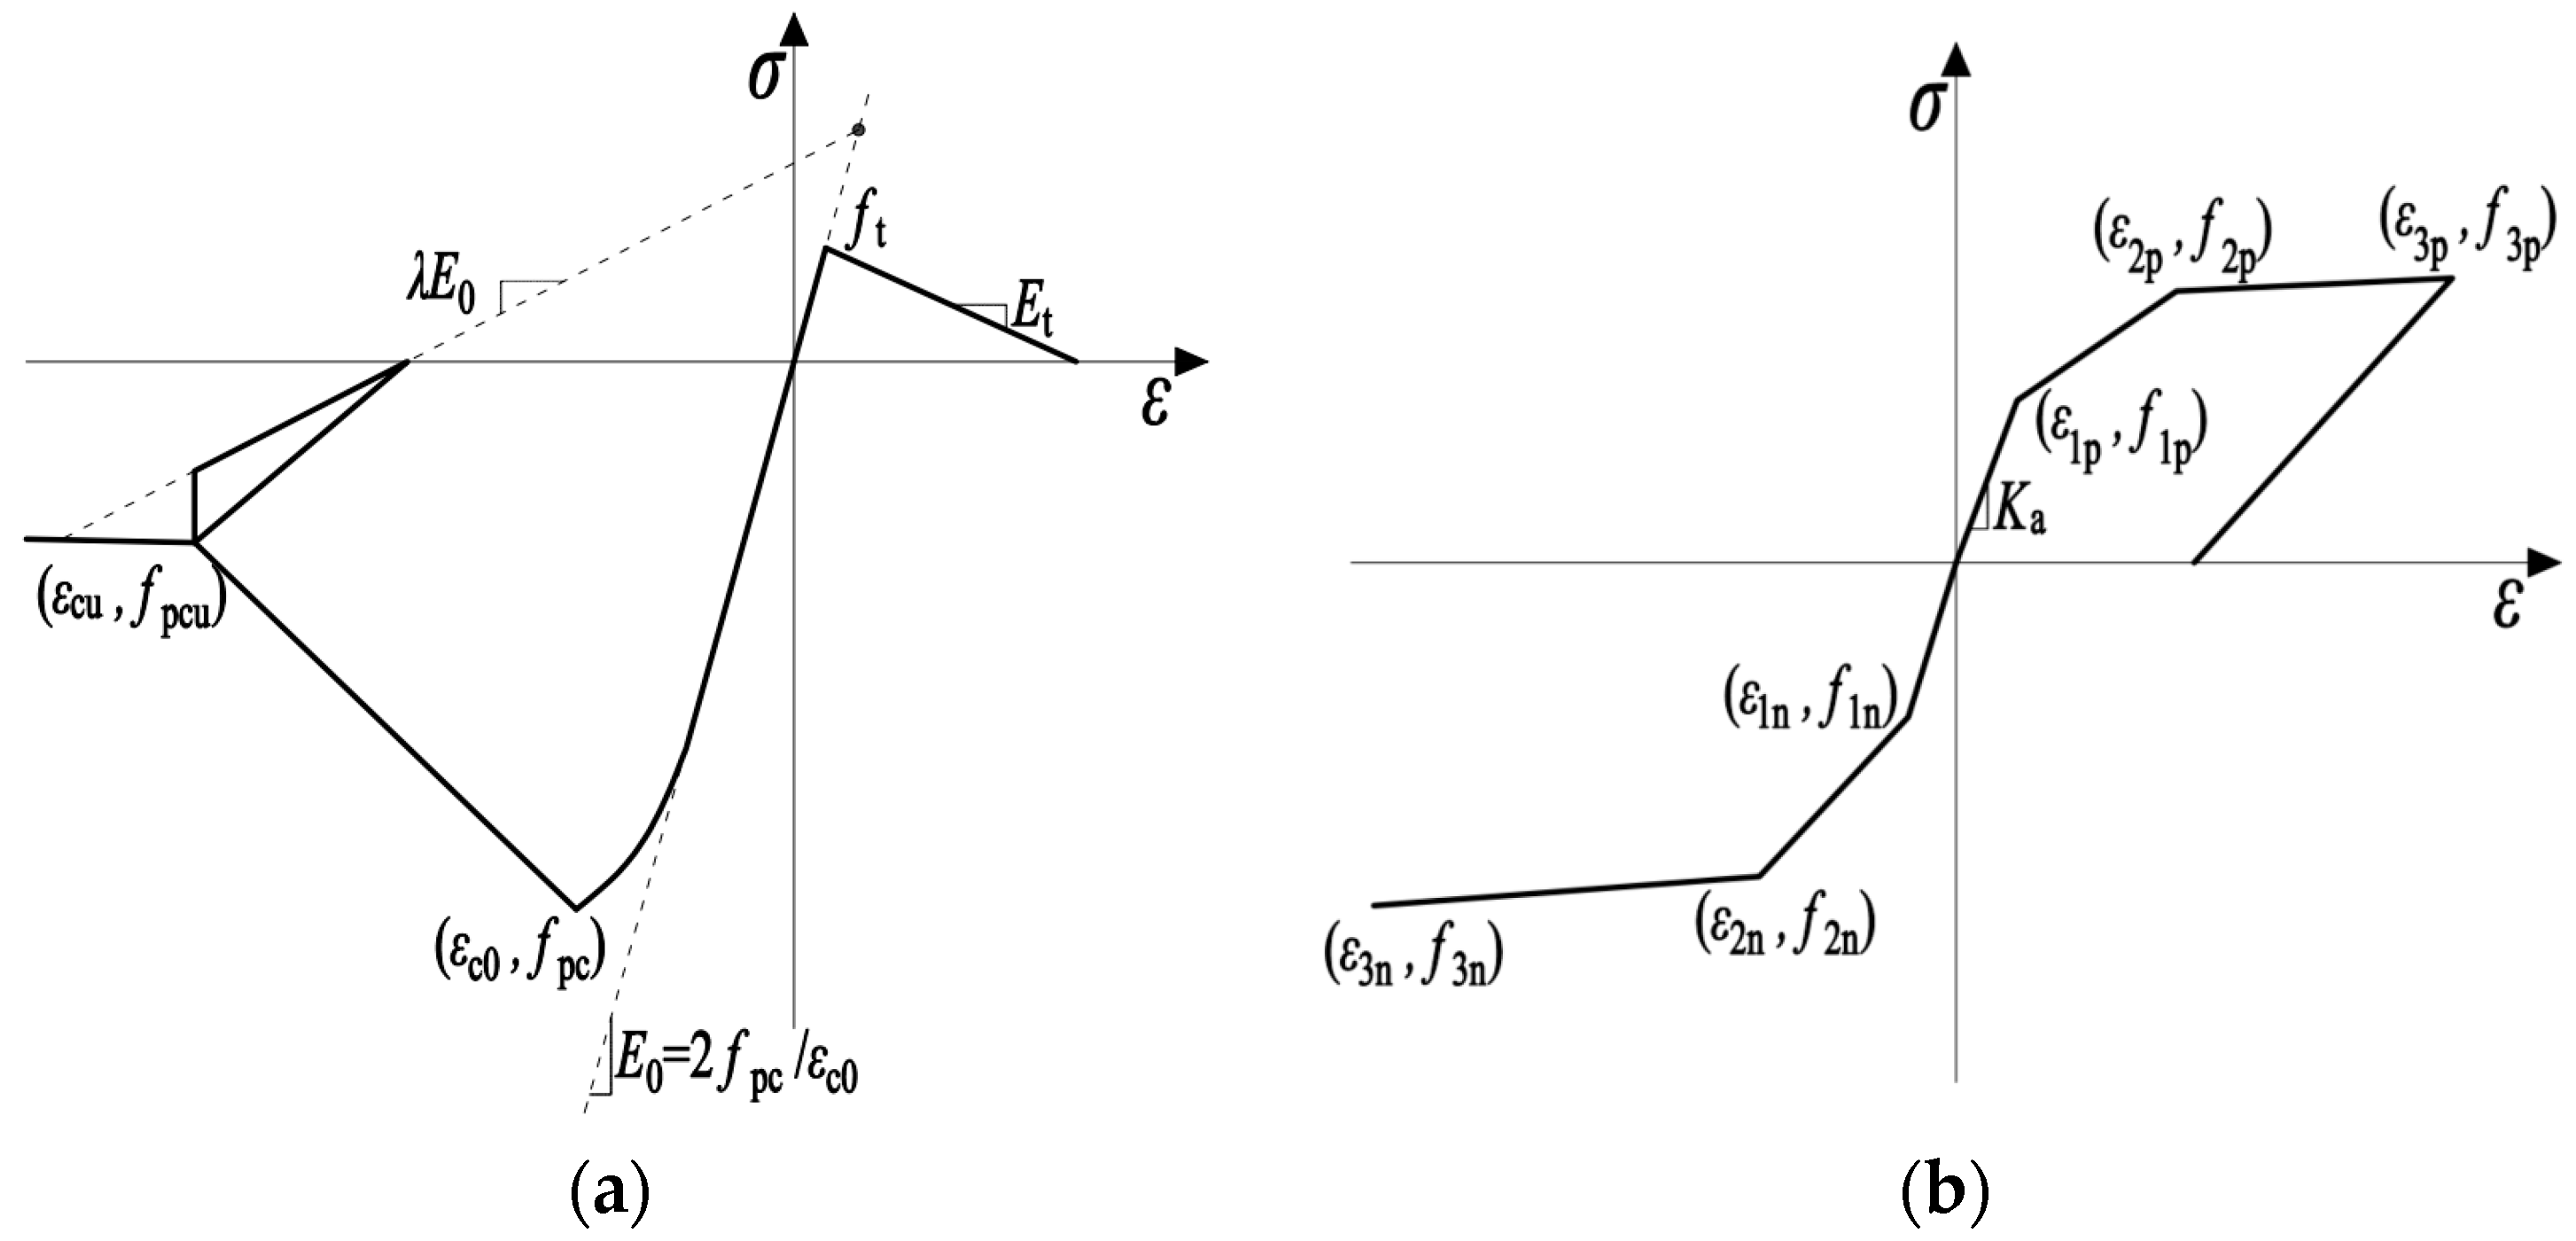
For material constitutive modeling, the Concrete02 material model (with linear tension softening) was selected to represent the concrete, whereas the Hysteretic material model was used for the steel bar, as shown in Figure 5.
(1) Constitutive Model for Concrete:
The compressive backbone curve of the Concrete02 material constitutive model is based on the modified Kent-Park model proposed by Scott et al. [55]. Its mathematical expression is given as follows:
f c = K f c 2 ε c K ε c 0 ε c K ε c 0 2 ( 0 ε c K ε c 0 ) K f c 1 Z m ε c K ε c 0 ( K ε c 0 ε c ε cu ) 0.2 K f c ( ε c > ε cu )
K = 1 + ρ s f yh f c
Z m = 0.5 3 + 0.29 f c 145 f c 1000 + 0.75 ρ s h s h K ε c 0
The initial elastic modulus of concrete is related to its peak stress and peak strain, with the peak compressive strain being determined based on this elastic modulus. The ultimate compressive strain is taken as twice the peak compressive strain for the cover concrete, while for the confined concrete, it is determined by the parameter Zm.
Regarding the value of K, for both High-Strength Concrete (HSC) and Normal-Strength Concrete (NSC), K is taken as 1 when the confinement effect of stirrups is not considered. When the confinement effect is considered, K is calculated according to Equation (23). For UHPC, the cover concrete is confined by steel fibers, while the core concrete is jointly confined by both steel fibers and stirrups.
The confining pressure provided by steel fibers is modeled using the approach proposed by Aoude et al. [56], expressed as follows:
f lf = N f F pullout = α v f l f d f τ bond
τ bond = 0.6 f c 2 3
The modified factor K, according to Ren et al. [57], is expressed by Equation (27).
K = 1 + f lf f c ( Cover   concrete ) 1 + f lf f c + ρ s f yh f c ( Core   concrete )
The tensile backbone curve of the Concrete02 material constitutive model is based on the model proposed by Yassin et al. [58], and its expression is given as follows:
f t = E 0 ε t ( 0 ε t ε t 0 ) f t E t ε t ε t 0 ( ε t 0 ε c ε tu )
(2) Constitutive Model for Steel bar:
The Hysteretic Material model was selected to represent the stress–strain relationship of the steel reinforcement. During material definition, the nominal stress and strain values were converted into their true stress and strain counterparts.
The parameters for the constitutive models were determined based on experimental data from Zhang et al. [42] and material property tests, using an inverse calibration method. The material parameters are summarized in Table 4. Additional details regarding the fiber cross-section and material constitutive models can be found in the OpenSEES command manual [59].
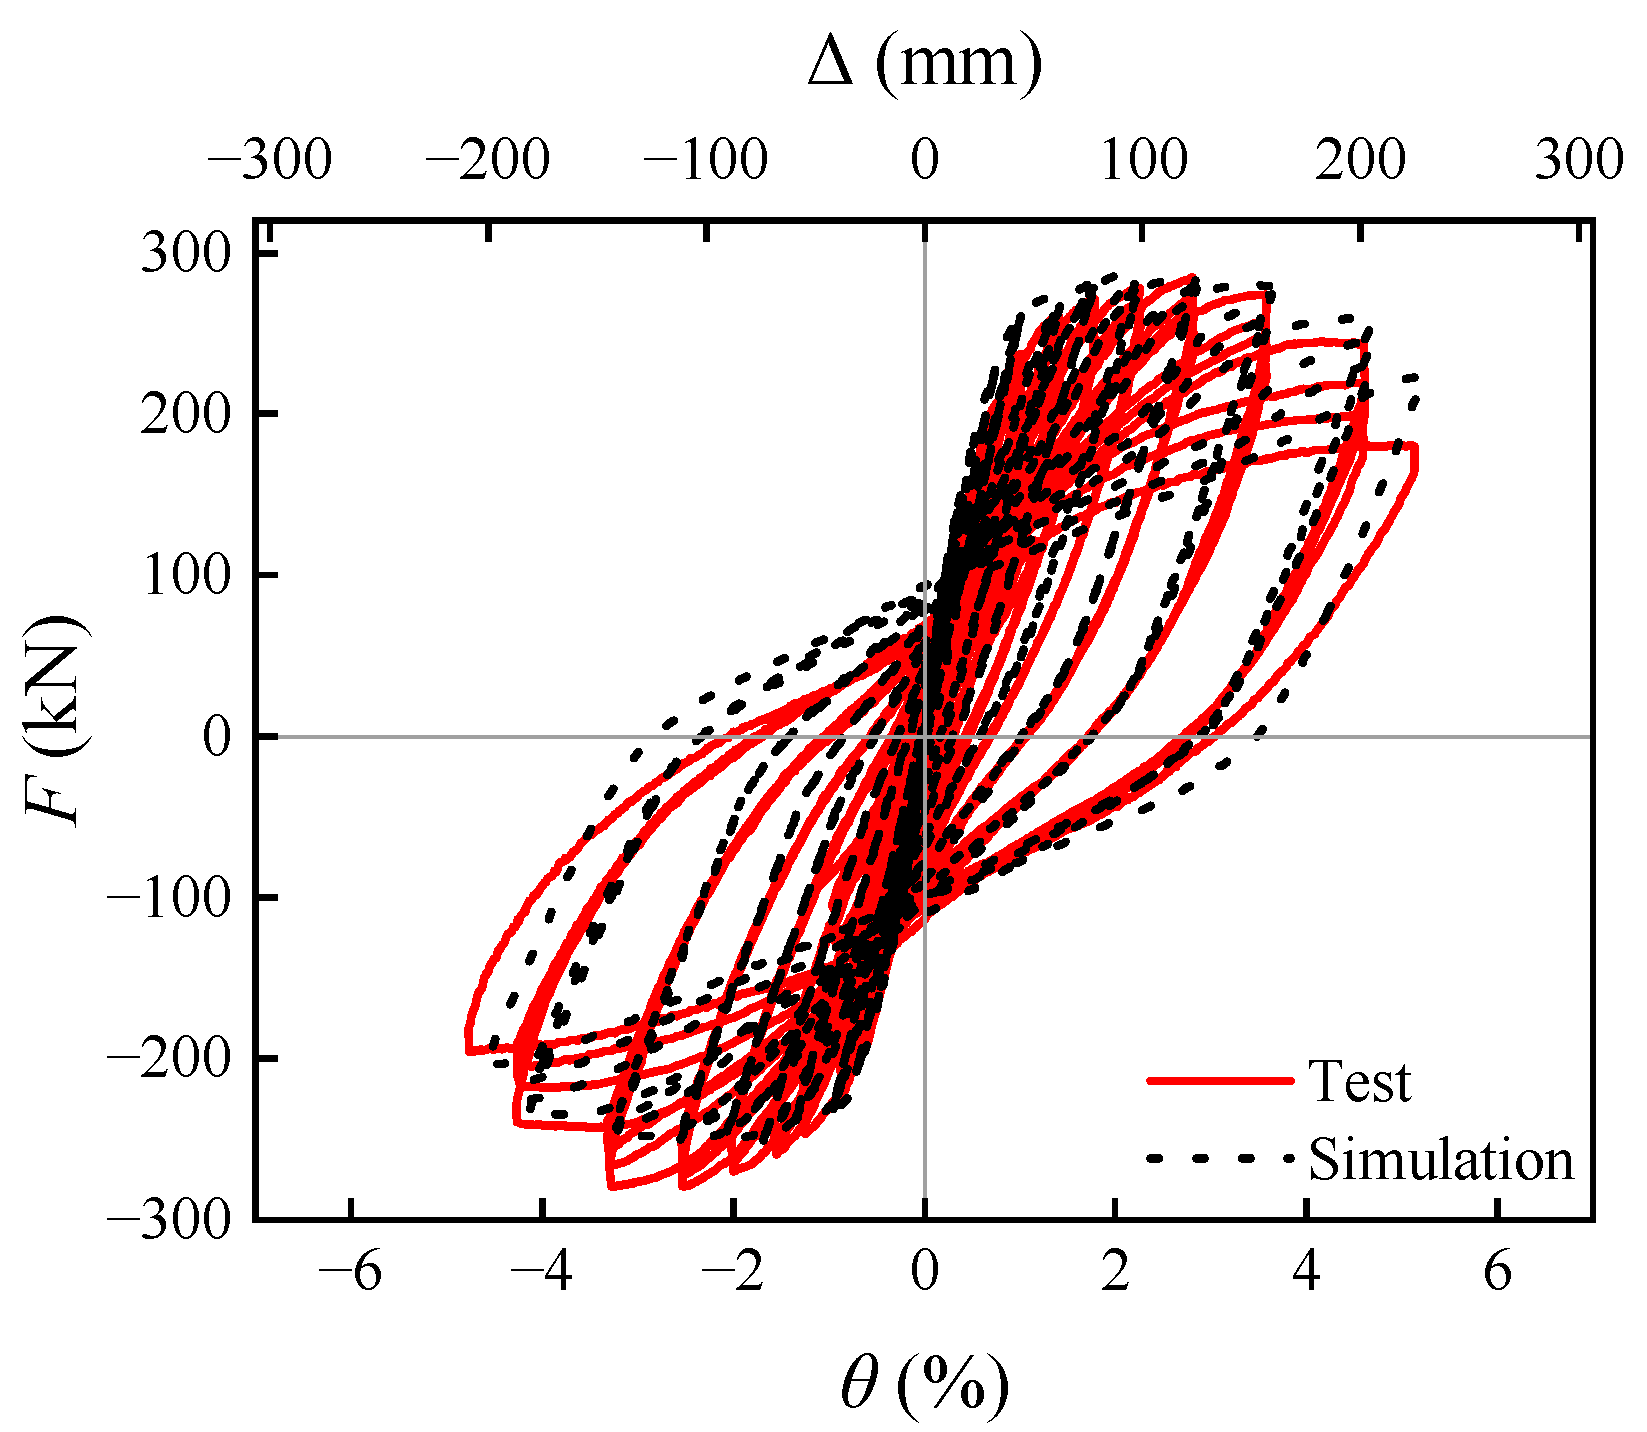
The comparison between the hysteresis curves (base shear force—roof lateral drift) from the experimental and the finite element simulation is presented in Figure 6. It can be observed that the finite element simulation results are consistent with the experimental hysteresis curves, with the stiffness degradation and the loading and unloading stiffness being in good agreement. A comparison between the test and simulation results is presented in Table 5, showing that the discrepancies are within 10%. The difference in initial stiffness between the simulation and the test is slightly larger, primarily due to the fact that in the simulation, the column base node was modeled as a fully fixed support. In contrast, during the test, the specimen base was connected to the rigid platform via anchor bolts. In the early stages of loading, minor slipping or base rotation may have occurred, and these slight displacements would manifest as a reduction in overall stiffness. The finite element model established using OpenSEES effectively reflects the seismic performance of the precast UHPC-HSC frame. The same modeling method will be adopted for the subsequent UHPC-HSC frame.

6. Case Study and Analysis of UHPC-HSC Frame Structure

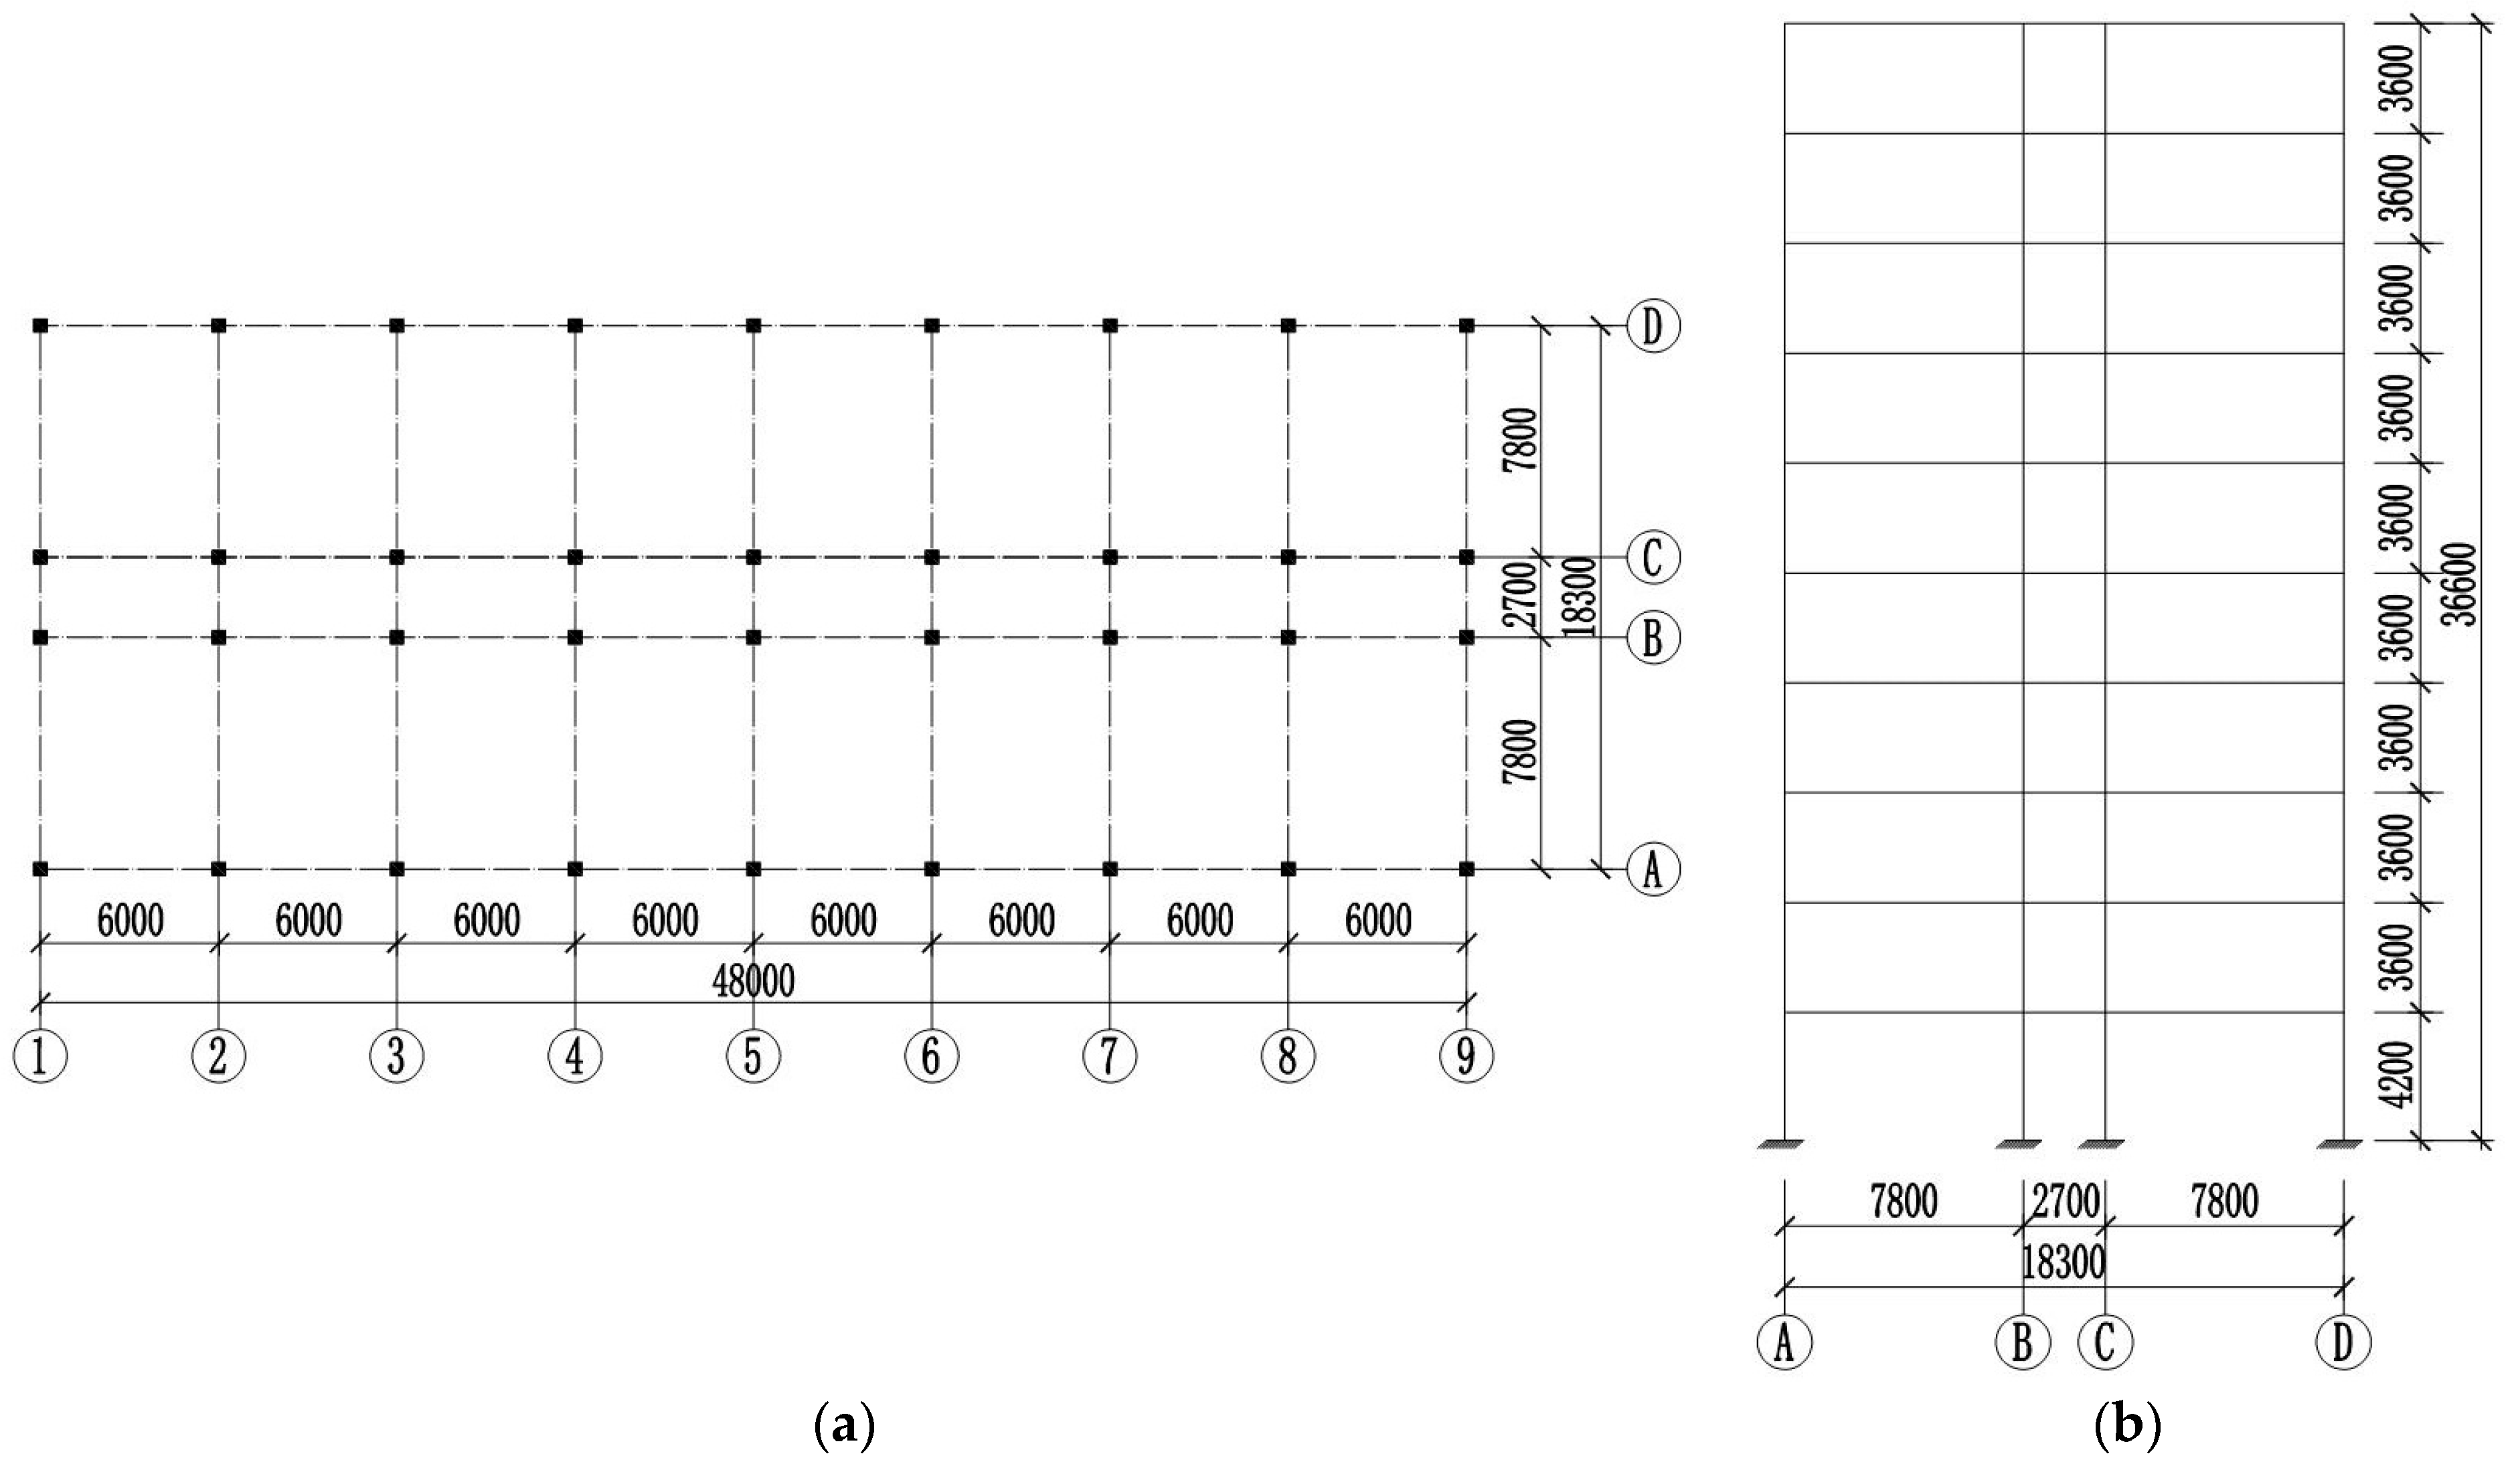
Figure 7 illustrates a newly constructed ten-story, three-span precast UHPC-HSC frame. This frame has a length of 48 m, a width of 18.3 m, and a height of 36.6 m. In accordance with GB 50011-2010 [47], the structural design parameters were determined as follows: the design service life is 50 years, the seismic rating is First degrees, the seismic precautionary intensity is 8 degree (0.2 g), the seismic design grouping is Group II, the site class is Class II, and the environmental exposure category is II(a). The applied loads were specified as follows: the roof dead load and live load were 6 kN/m2 and 0.5 kN/m2, respectively, while the corresponding floor loads were 5 kN/m2 and 2 kN/m2, respectively, and the line load from wall is 6 kN/m.

6.1. Designed for “Performance Level 1”

(1) Preliminary structural design: The structural design focuses on the ⑤-axis, featuring a 4.2 m height for the first floor and 3.6 m for standard floors, with an edge span of 7.8 m and a middle span of 2.7 m. The cross-section of precast HSC(C60) column is 650 mm × 650 mm, while the cross-section of UHPC composite beam is 300 mm × 650 mm. The composite slab has a total thickness of 120 mm, and the U-shaped UHPC(UHPC120) beam formwork, exhibits side wall with a height of 530 mm and a thickness of 40 mm, along with a bottom board thickness of 60 mm. The NSC(C40) is subsequently poured to form the beam core. For connection are cast-in-place with UHPC, including a 500 mm height at the column base and 450 mm length for the edge span and 250 mm length for the middle span at the beam end. The steel bar is HRB400E. The modeling method and the material properties of both concrete and steel bar are consistent with those adopted in Section 5.
(2) Performance objective: For this case study, performance objective D (Table 1) was selected as the design target. The design procedure for other performance objectives would be similar to that demonstrated in this case. This performance objective is associated with the corresponding limit values of ISDR obtained from Table 3. The corresponding limit values of ISDR was taken from Table 3. The relevant parameters for performance objective D are summarized in Table 6.
(3) Δ d : Structural analysis identified the first story as the weakest layer, exhibiting an ISDR of θ1 = [θ] = 0.18%.
Δ c = Δ 1 = H 1 × [ θ ] = 0.00756   m ;   δ c = δ 1 = 4 3 H 1 H n 1 H 1 4 H n = 0.1486
δ i and Δ i for each story were determined through Equations (1) and (3), with detailed design process documented in Table 7. These derived values were then incorporated into Equation (7) to obtain Δ d = 0.03706   m .
(4) M eff and H e : M eff = 1065.17   t , H e = 24.73   m .
(5) ζ eq and T eff : Δ d < Δ y , ζ eq = ζ 0 = 0.05 , α max = 0.16 , T g = 0.4   s , substitution into Equation (20) yielded T eff : η 2 = 1 , γ = 0.9 , η 1 = 0.02 ,
T eff = 4 π 2 T g γ · S d η 2 α max g 1 2 γ = 1.985   s   ( T g T 5 T g )
(6) K eff and V b : K eff = 10661.44   kN / m , V b = 395.15   kN .
(7) F i : The base shear force was distributed to each story of the precast UHPC-HSC frame, yielding F i and V i as summarized in Table 7.
(8) Reinforcement design: Based on the structural internal force analysis results, the reinforcement design for beam and column sections was carried out with the following specific configurations: The longitudinal bars in the precast columns were uniformly distributed around the perimeter with 7@32 bars for stories 1~2, 7@28 bars for stories 3~5, and 7@25 bars for stories 6~10. The longitudinal bars in the composite beams were uniformly distributed with 8@25 bars at the top and 5@25 at the bottom for stories 1~2, 6@25 bars at the top and 4@25 at the bottom for stories 3~5, and 4@25 bars at both top and bottom for stories 6~10.
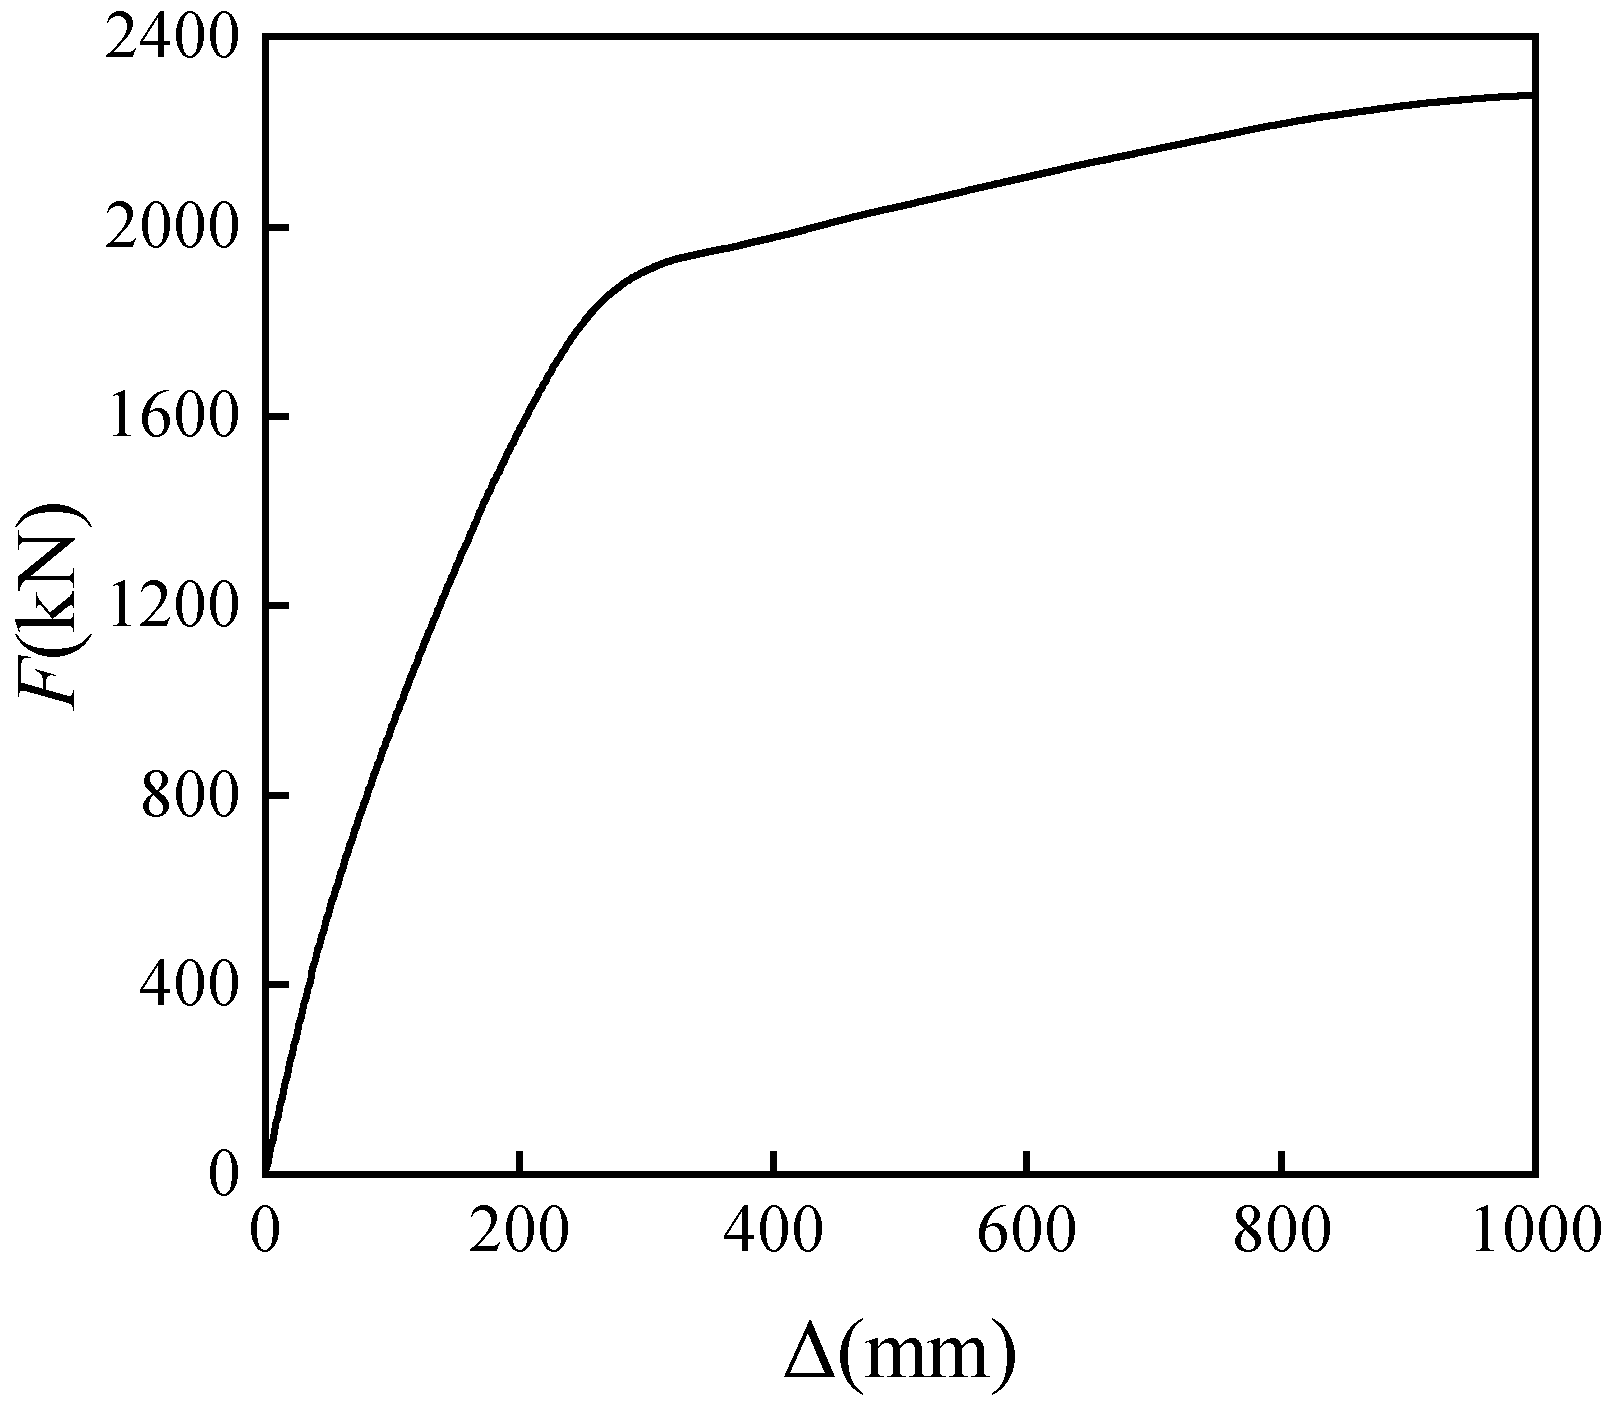
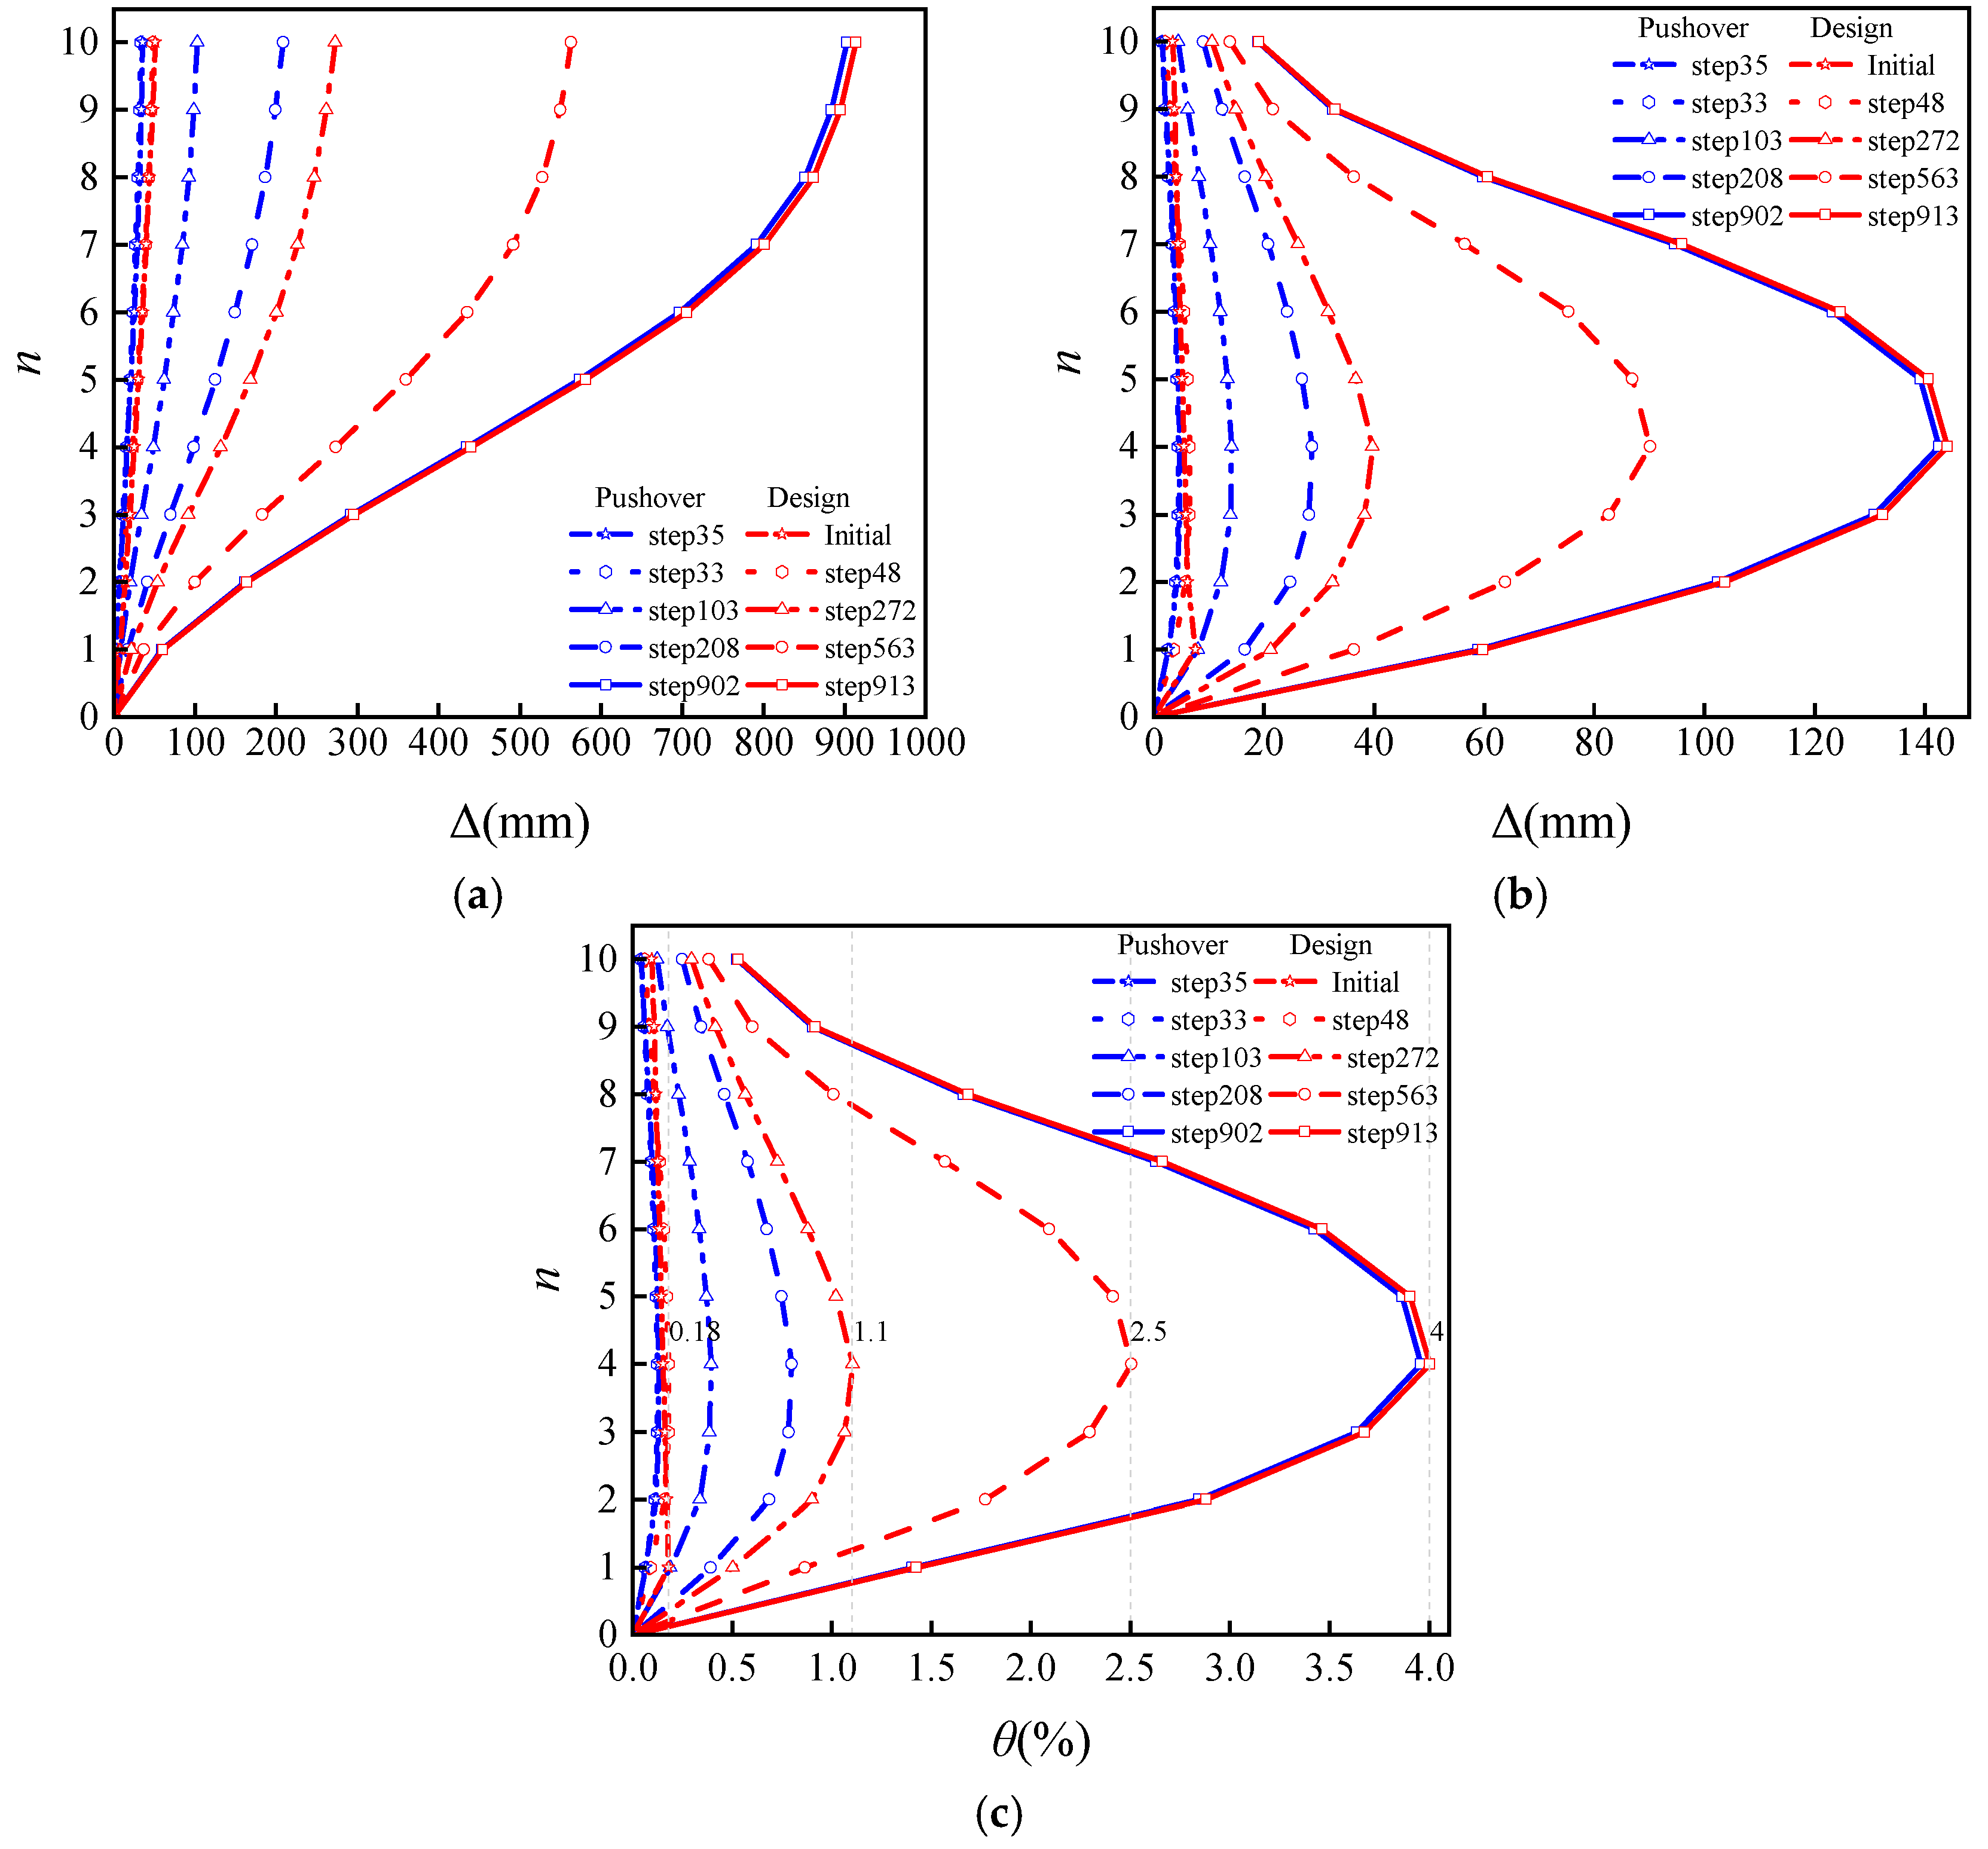
(9) Design result verification: A finite element model of the precast UHPC-HSC frame was developed following the methodology described in Section 5. Nonlinear static pushover analysis was performed, yielding the base shear—the top displacement curve is shown in Figure 8. The analysis results are tabulated in Table 8. Figure 9 presents a comparative between the pushover results and design results at various loading step.
At loading step 35, the UHPC-HSC frame attained the base shear of 405.24 kN, corresponding to performance level 1 requirements (395.15 kN). It can be observed that in Figure 9a, the design result is essentially consistent with the pushover result, and the design lateral displacements are all greater than the displacements obtained from the pushover analysis of the UHPC-HSC frame. However, in Figure 9b,c, discrepancies exist between the design results and the pushover results. The maximum ISDR obtained from the pushover analysis occurs at the fourth story (0.13%), whereas the initial design assumed the maximum ISDR to be at the first story (0.18%). This discrepancy indicates that for the 10-story UHPC-HSC frame studied in this study, the initial design was based on a first-mode assumption, while the pushover analysis revealed that its nonlinear response is influenced by a combination of higher-mode effects and non-uniform stiffness distribution. Therefore, the displacement curve needed to be modified by adopting the displacement curve derived from the pushover analysis as the design displacement curve and recalculating until the requirements were met. The steps for the modified design were as follows:
(10) Δ d : As shown in Table 8, at loading step 48, the maximum ISDR of the frame reached 0.181% at the fourth story, meeting the limit value of ISDR of performance level 1 ([θ] = 0.18%). The absolute displacements of each story were extracted and used as the design displacement curve for subsequent calculations. The modified design process is detailed in Table 9. The calculation yielded Δ d = 0.0363   m .
(11) M eff and H e : M eff = 1010.20   t , H e = 25.40   m .
(12) ζ eq and T eff : Δ d < Δ y , ζ eq = ζ 0 = 0.05 α max = 0.16 , T g = 0.4   s , substitution into Equation (20) yielded T eff : η 2 = 1 , γ = 0.9 , η 1 = 0.02 ,
T eff = 4 π 2 T g γ · S d η 2 α max g 1 2 γ = 1.948   s   ( T g T 5 T g )
(13) K eff and V b : K eff = 10498.99   kN / m , V b = 381.14   kN .
(14) F i : F i and V i of the UHPC-HSC frame are presented in Table 9. The results indicated that the modified design yielded a slightly smaller base shear compared to the initial design. Therefore, the reinforcements of beams and columns from the initial design can be adopted.
(15) Design result verification: As summarized in Table 8, the base shear of the UHPC-HSC frame reached 384.30 kN at loading step 33, exceeding the requirement of 381.14 kN for performance level 1. Furthermore, as illustrated in Figure 8, the pushover curve remained linear with no stiffness degradation at this stage. All structural components remained elastic with no yielding, indicating fully functional structural performance. Figure 9 presents a comparative between the pushover results (loading step 33) and design results (loading step 48). The comparison revealed that the design displacements were consistently greater than those from the pushover analysis, confirming that the designed precast UHPC-HSC frame satisfies the requirements of performance level 1. Moreover, when the actual displacement profile obtained from the pushover analysis was used as the modified target displacement in a second design iteration, the revised design base shear (381.14 kN) showed excellent agreement with the base shear from the pushover analysis (384.30 kN), with a relative error of only 0.8%. This represents an improvement over the initial design outcome (395.15 kN vs. 405.24 kN), reducing the error by approximately 1.75%. These results demonstrate that even when initial displacement distribution assumptions are inaccurate, the iterative design–analysis–modification process effectively self-corrects and substantially improves the final accuracy in predicting the global seismic capacity of the structure.

6.2. Verified for “Performance Level 4”

For performance level 4 verification, the lateral displacement response of the UHPC-HSC frame shall be determined based on the corresponding pushover curve under the target performance state. As shown in Table 8, at loading step 272, the maximum ISDR of the frame reached 1.103%, meeting the limit value of ISDR of performance level 4 ([θ] = 1.1%). The absolute displacements of each story were extracted and used as the design displacement curve for subsequent calculations.
(1) Δ d : The process is detailed in Table 10. The calculation yielded Δ d = 0.2091   m .
(2) M eff and H e : M eff = 1013.51   t H e = 25.33   m .
(3) ζ eq and T eff : Δ d < Δ y , ζ eq = ζ 0 = 0.05 α max = 0.45 , T g = 0.4   s , substitution into Equation (21) yielded T eff : η 2 = 1 , γ = 0.9 , η 1 = 0.02 ,
T 2 0.2 γ η 2 η 1 T 5 T g = 4 π 2 α max g S d ,   T eff = 2.941   s   ( 5 T g T 6   s )
(4) K eff and V b : K eff = 4621.22   kN / m , V b = 966.15   kN .
(5) F i : F i and V i of the UHPC-HSC frame are presented in Table 7.
(6) Result verification: As shown in Table 8, the base shear of the UHPC-HSC frame reached 967.35 kN at loading step 103, exceeding the 966.15 kN required for performance level 4. Figure 9 presents a comparative between the pushover results (loading step 103) and design results (loading step 272). The comparison revealed that the design displacements were consistently larger than those obtained from the pushover analysis, indicating that the designed precast UHPC-HSC frame satisfies the requirements of performance level 4.

6.3. Verified for “Performance Level 5”

For performance level 5 verification, as shown in Table 8, at loading step 563, the maximum ISDR of the frame reached 2.504%, meeting the limit value of ISDR of performance level 5 ([θ] = 2.5%). The absolute displacements of each story were extracted and used as the design displacement curve for subsequent calculations.
(1) Δ d : The process is detailed in Table 11. The calculation yielded Δ d = 0.4459   m .
(2) M eff and H e : M eff = 999.62   t , H e = 25.46   m .
(3) ζ eq and T eff : Δ d > Δ y , μ = 1.663 , ζ eq = 0.1217 α max = 0.9 , T g = 0.45   s , substitution into Equation (21) yielded T eff : η 2 = 0.7389 , γ = 0.8304 , η 1 = 0.0109 ,
T 2 0.2 γ η 2 η 1 T 5 T g = 4 π 2 α max g S d ,   T eff = 3.304   s   ( 5 T g T 6   s )
(4) K eff and V b : K eff = 3611.40   kN / m , V b = 1610.44   kN .
(5) F i : F i and V i of the UHPC-HSC frame are presented in Table 8.
(6) Result verification: As shown in Table 8, the base shear of the UHPC-HSC frame reached 1612.90 kN at loading step 208, exceeding the 1610.44 kN required for performance level 5. Figure 9 presents a comparative between the pushover results (loading step 208) and design results (loading step 563). The comparison revealed that the design displacements were consistently larger than those obtained from the pushover analysis, indicating that the designed precast UHPC-HSC frame satisfies the requirements of performance level 5.

6.4. Verified for “Performance Level 6”

For performance level 6 verification, as shown in Table 8, at loading step 913, the maximum ISDR of the frame reached 4.004%, meeting the limit value of ISDR of performance level 6 ([θ] = 4%). The absolute displacements of each story were extracted and used as the design displacement curve for subsequent calculations.
(1) Δ d : The process is detailed in Table 12. The calculation yielded Δ d = 0.7249   m .
(2) M eff and H e : M eff = 998.68   t , H e = 25.48   m .
(3) ζ eq and T eff : Δ d > Δ y , μ = 2.704 , ζ eq = 0.1634 α max = 1.35 , T g = 0.45   s , substitution into Equation (21) yielded T eff : η 2 = 0.6679 , γ = 0.8114 , η 1 = 0.0077 ,
T 2 0.2 γ η 2 η 1 T 5 T g = 4 π 2 α max g S d ,   T eff = 3.556   s   ( 5 T g T 6   s )
(4) K eff and V b : K eff = 3114.75   kN / m , V b = 2257.81   kN .
(5) F i : F i and V i of the UHPC-HSC frame are presented in Table 9.
(6) Result verification: As shown in Table 8, the base shear of the UHPC-HSC frame reached 2257.95 kN at loading step 902, exceeding the 2257.81 kN required for performance level 6. Figure 9 presents a comparative between the pushover results (loading step 902) and design results (loading step 913). The comparison revealed that the design displacements were consistently larger than those obtained from the pushover analysis, indicating that the designed precast UHPC-HSC frame satisfies the requirements of performance level 6. Furthermore, the design results at this loading step show excellent agreement with the pushover results, and the structure still retains a certain load-carrying capacity.
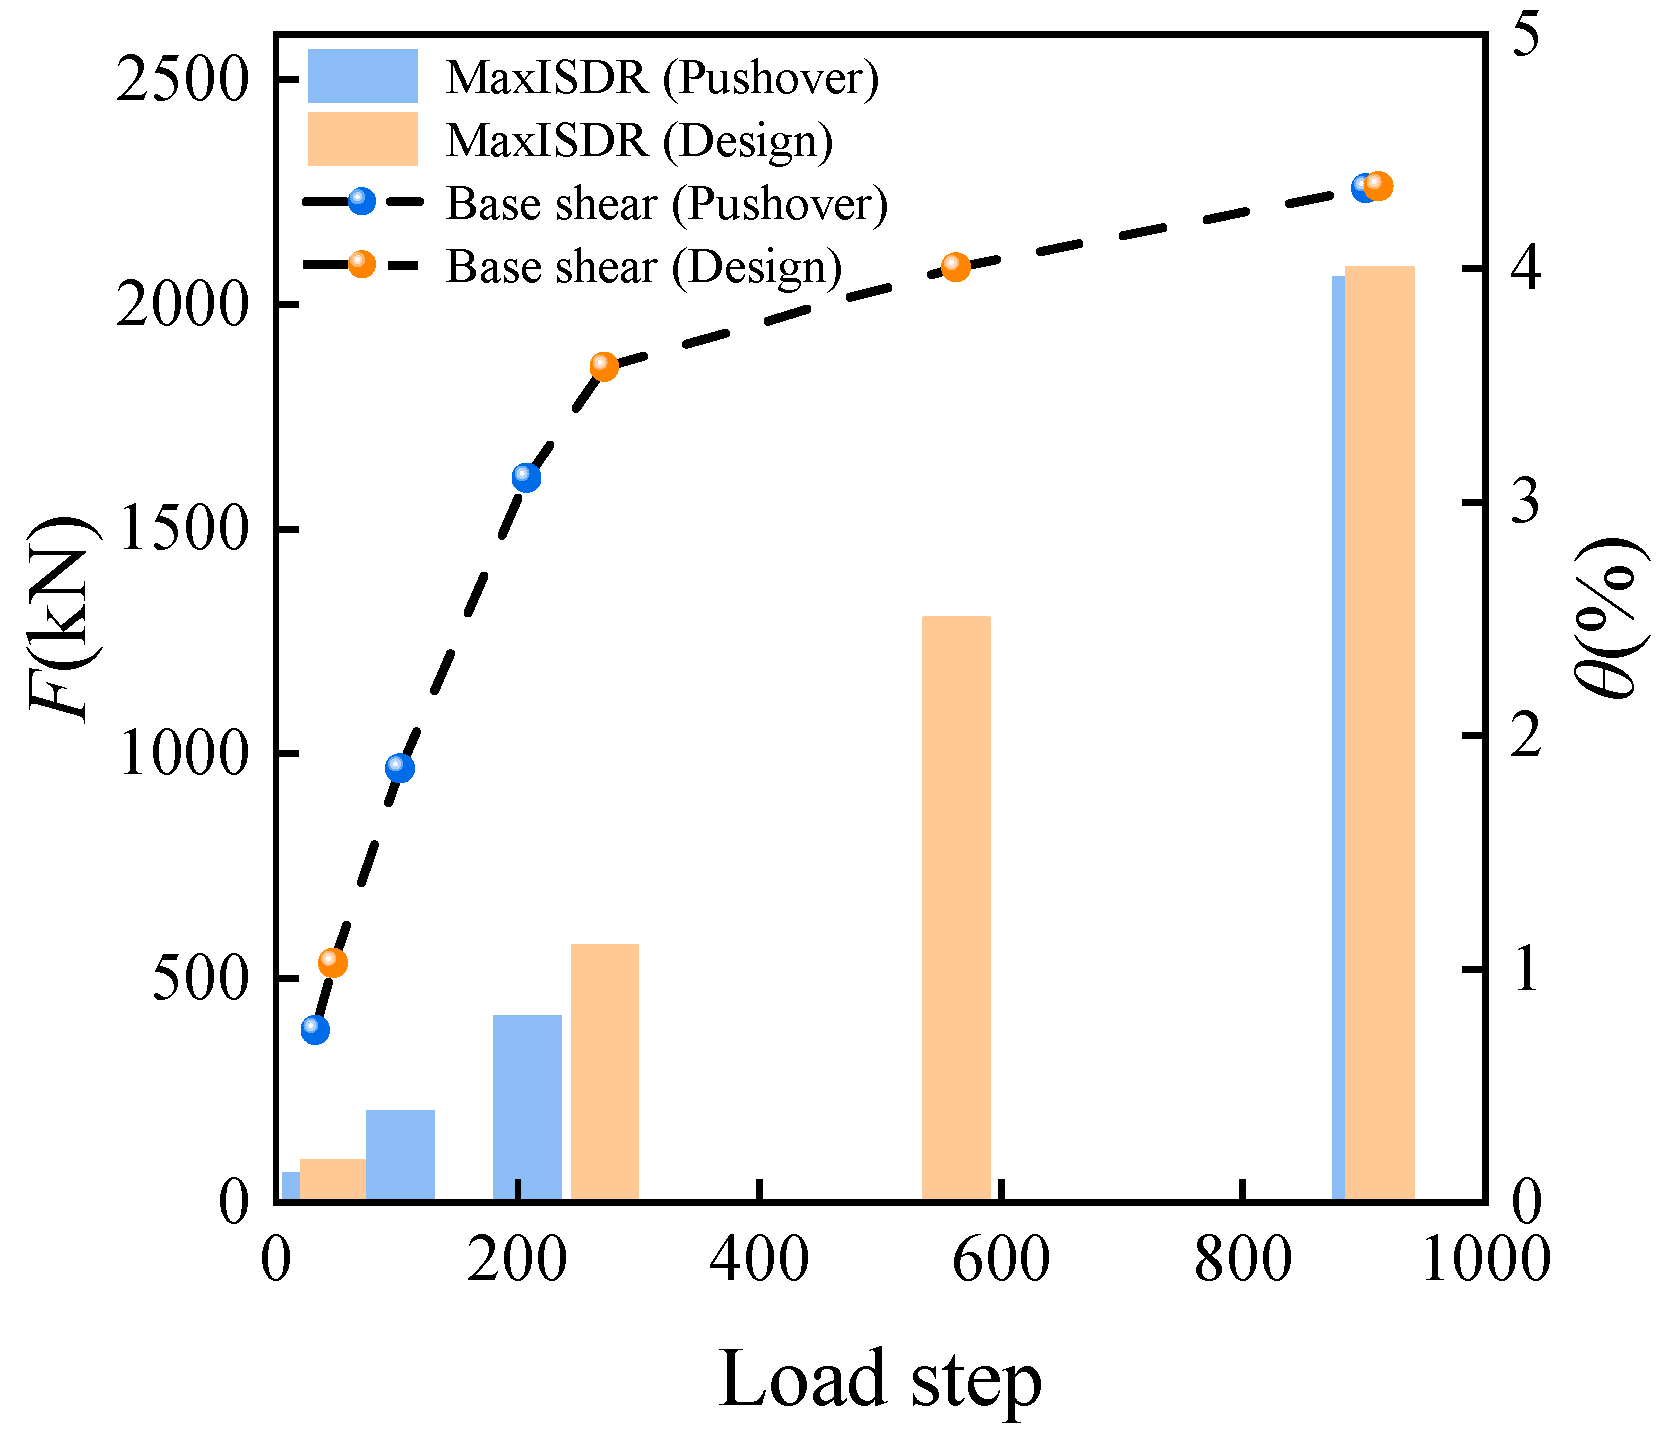
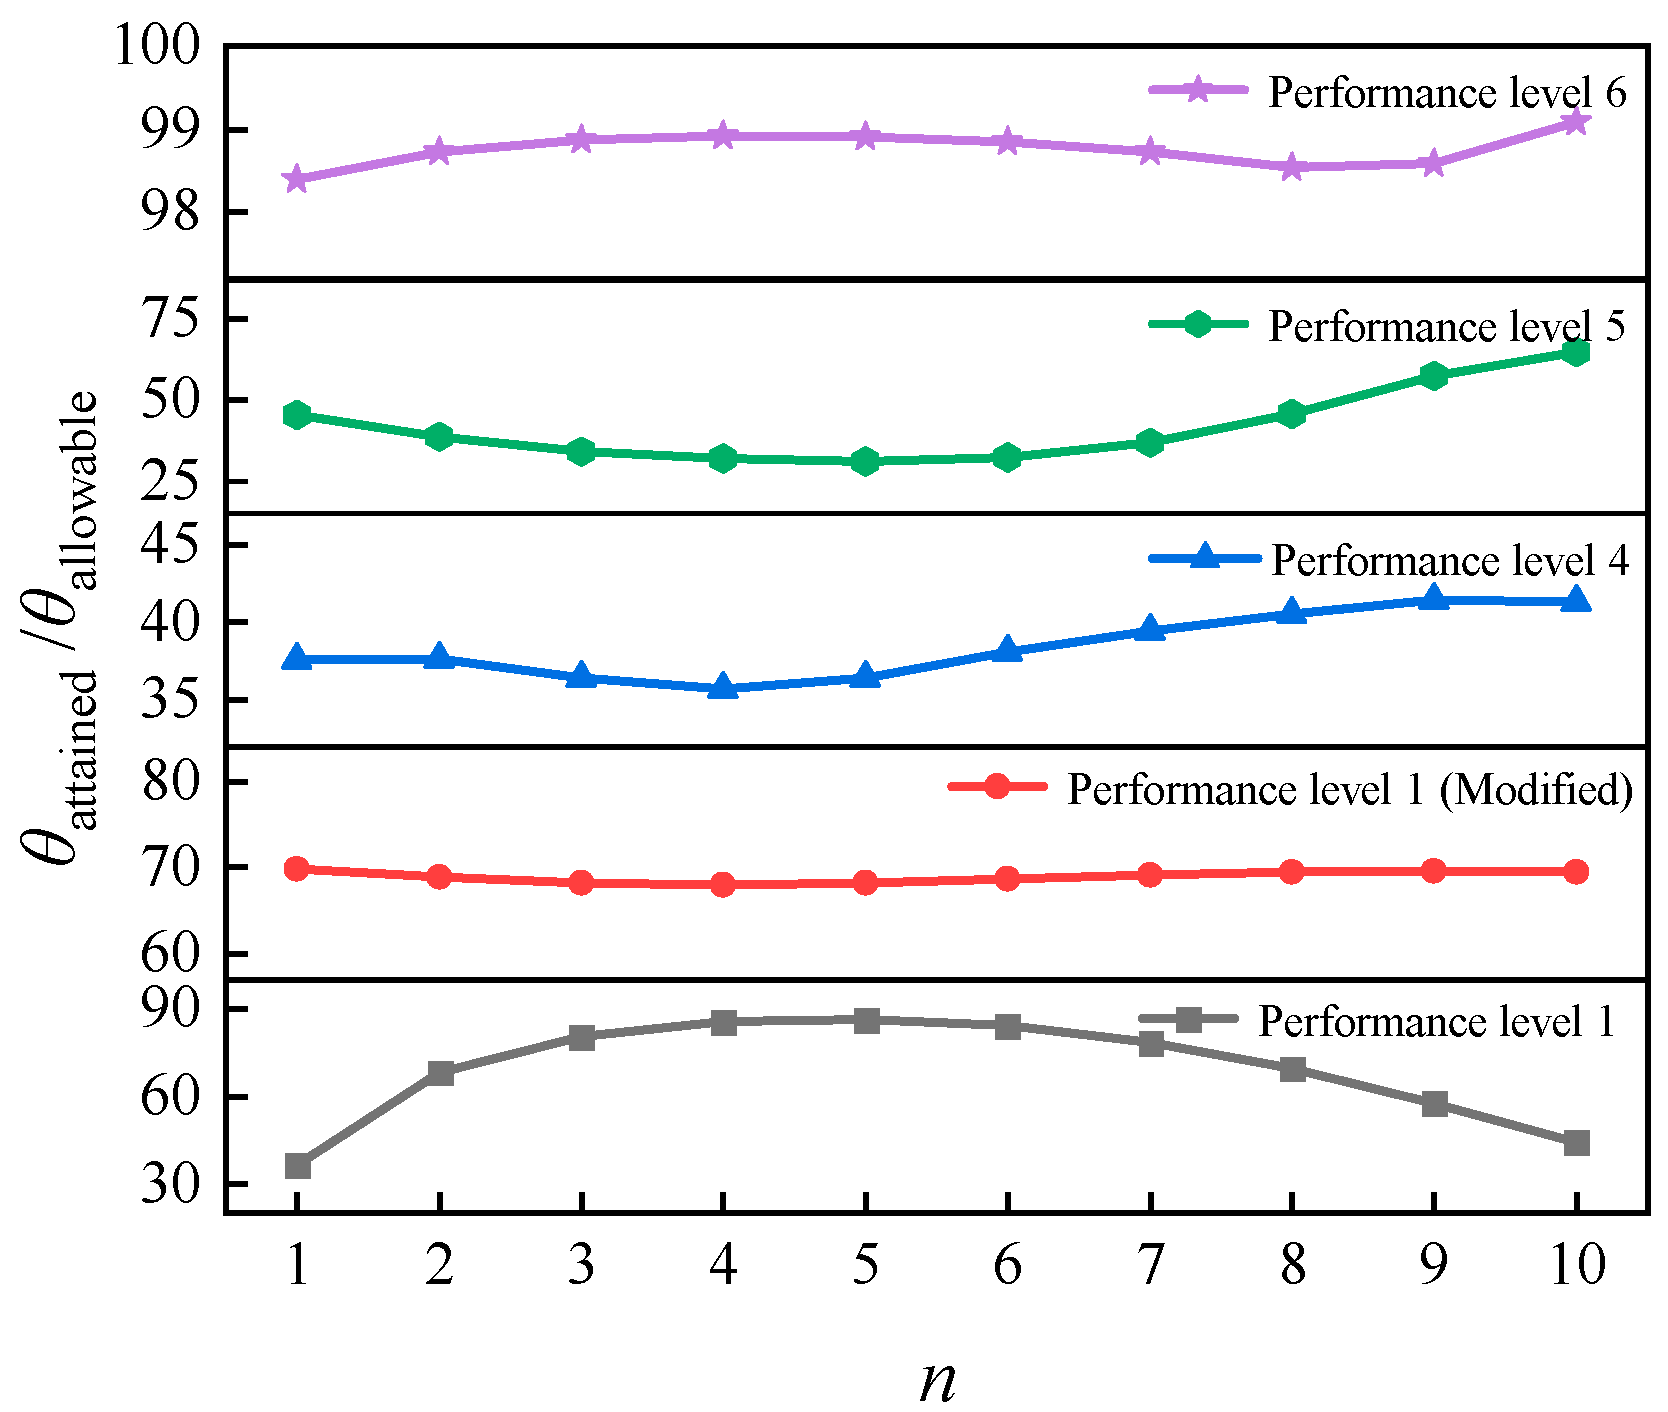
To further validate the effectiveness of the proposed DDBD methodology, Figure 10 and Figure 11 present evaluation results from the perspectives of structural response and safety margin, respectively. Figure 10 plots the variation of base shear and MaxISDR against loading steps under different performance levels, clearly capturing the structural response from the elastic stage through nonlinear behavior. The results demonstrate that the force–deformation behavior aligns well with the intended design objectives of the DDBD method. Meanwhile, the safety margin plot in Figure 11 shows that the ratio of the attained ISDR to the allowable ISDR is below 100% for all stories, indicating sufficient safety margin is maintained when the structure reaches each performance level. The results from Figure 10 and Figure 11 collectively demonstrate the safety and effectiveness of the proposed design method.

7. Conclusions

This study establishes a direct displacement-based design (DDBD) framework specifically for precast UHPC-HSC frame structures, contributing to the performance-based seismic design of advanced hybrid systems. The main original contributions and implications are summarized as follows:
(1) A novel six-level seismic performance classification scheme is introduced (from no damage to severe damage) aligned with specific seismic performance requirements under the four-level seismic protection, and the corresponding interstory drift limits are proposed (0.18% to 4.0%), providing a quantitative basis for multi-level seismic design of UHPC-HSC frames. This hierarchy offers a more refined performance objective system compared to conventional design codes.
(2) The finite element model of a three-story, two-span UHPC-HSC frame structure was established. The simulation results showed good agreement with experimental data, verifying the reliability of the model and its effectiveness in reflecting the seismic performance of the UHPC-HSC structure. This simulation method can be applied to DDBD study of UHPC-HSC frame structure.
(3) The proposed DDBD procedure integrates displacement-based principles with the unique mechanical characteristics of UHPC and HSC, explicitly accounting for deformation control and damage mitigation. The iterative design-validation approach using pushover analysis ensures that the structure reliably meets the target performance under various seismic intensities.
Although this study validated the effectiveness of the DDBD method for UHPC-HSC frame structures through pushover analysis, some limitations remain. Firstly, the static pushover analysis did not fully capture structural response under dynamic loading, especially nonlinear behavior under near-fault pulse-type motions. Subsequent research should employ nonlinear time-history analysis to evaluate the method’s seismic robustness. Secondly, since validation relied on a ten-story, three-span frame, general applicability under different stories, span-depth ratios, irregularities, and material combinations requires further parametric verification. Furthermore, the displacement profile assumption insufficiently considered higher-mode effects or stiffness non-uniformity. Future studies should incorporate MDOF systems or modal corrections to improve accuracy. Finally, three-dimensional effects such as torsion and bidirectional seismic excitations were not considered. Subsequent work should include 3D models to better evaluate dynamic response.

Author Contributions

X.Z.: Funding acquisition, Methodology, Writing—original draft; K.D.: Investigation, Data curation; Y.J.: Conceptualization, Supervision, Writing—review and editing; X.W.: Data curation, Validation. All authors have read and agreed to the published version of the manuscript.

Funding

This paper was supported by the Scientific Research Project of the Education Department of Jilin Province (No. JJKH20250886KJ), and the Doctoral Research Startup Fund (No. BSJXM-2024212).

Data Availability Statement

The original contributions presented in the study are included in the article, further inquiries can be directed to the corresponding author.

Acknowledgments

The authors thank the anonymous reviewers for their constructive comments and suggestions, which greatly improved the quality of this manuscript.

Conflicts of Interest

The authors declare no conflicts of interest.

Notation

Δ i Lateral displacement of i mass particle in the MDOF system
δ i Modal shape coefficients of each story
Δ c Target displacement of the weak story
δ c Modal shape coefficients of the weak story
H i Height of the ith story
H n Total height of the structure
n Number of stories
ω θ Lateral displacement reduction factor
ϕ i Lateral displacement shape factor
z t Function of time
Y 0 Amplitude
ω Circular frequency
a i Acceleration of i mass particle in the MDOF system
Δ d Effective displacement of the equivalent SDOF system
a d Effective acceleration of the equivalent SDOF system
F i Horizontal seismic action of i mass particle
V b Base shear
M eff Effective mass of the equivalent SDOF system
F t Lateral load at the roof story ( F t = 0.1 V b ), at other stories ( F t = 0 )
H e Effective height of the equivalent SDOF system
K eff Effective stiffness of the equivalent SDOF system
T eff Effective period of the equivalent SDOF system
ζ eq Equivalent viscous damping ratio of the equivalent SDOF system
ζ 0 Elastic damping ratio
ζ hys Hysteretic damping ratio
μ Design ductility demand
Δ y Yield displacement
θ y Yield rotation
M i Contribution of each beam to the overturning moment ( M 1 and M 2 are the moment capacity contributions of the exterior and interior beams, respectively.)
ε y Yield strain of steel bar in the beam
L b Span of the beam ( L b 1 and L b 2 are the span of the exterior and interior beams, respectively.)
h b Depth of the beam ( h b 1 and h b 2 are the depth of the exterior and interior beams, respectively.)
α Seismic influence coefficient
T Natural vibration period ( T = T eff )
α max Peak seismic influence coefficient
η 2 Damping modification factor
( η 2 = 1 + 0.05 ζ 0.08 + 1.6 ζ ,when η 2 < 0.55 , η 2 = 0.55 .)
ζ Damping ratio ( ζ = ζ eq )
T g Site-specific characteristic period
γ Decay exponent for the nonlinear descending segment ( γ = 0.9 + 0.05 ζ 0.3 + 6 ζ )
η 1 Slope reduction factor for the linear descending segment ( η 1 = 0.02 + 0.05 ζ 4 + 32 ζ , when η 1 < 0 , η 1 = 0 .)
θInterstory drift ratio (ISDR)
[θ]Limit values of interstory drift ratio
f c Concrete compressive stress
K Confinement effectiveness factor
f c Cylinder compressive strength of concrete
ε c Concrete compressive strain
E 0 Initial elastic modulus of concrete ( E 0 = 2 f c / ε c 0 )
ε c 0 Peak compressive strain of concrete
Z m Slope of the strain-softening branch
ε cu Ultimate compressive strain of concrete
ρ s Volumetric stirrup ratio
f yh Yield strength of stirrups
h Width of confined concrete core
s h Spacing of stirrups
f lf Confinement stress provided by steel fibers
N f Number of steel fibers per unit area
F pullout Average pullout strength of steel fibers
α Fiber orientation factor (can be taken as 3/8)
v f Volume fraction of steel fibers
l f Length of steel fibers
d f Diameter of steel fibers
τ bond Bond strength of the matrix
f t Concrete tensile stress
ε t Concrete tensile strain
ε t 0 Peak tensile strain of concrete
f t Tensile strength of concrete
E t Modulus of the descending branch
ε tu Ultimate tensile strain of concrete
f cu Ultimate compressive strength of concrete
f y Yield strength of longitudinal bars
ε y Yield Strain of longitudinal bars
f u Peak strength of longitudinal bars
ε u Maximum force strain of longitudinal bars
F y Yield load
F p Peak load
F u Ultimate load
K j Secant stiffness
E Cumulative energy dissipation

Appendix A

The transformation is based on three fundamental assumptions:
(1) The dynamic response of the MDOF system can be characterized by a presumed lateral displacement profile;
(2) The base shear of the MDOF system maintains equivalence with that of the equivalent SDOF system;
(3) The work conducted by the horizontal seismic forces on the MDOF system is equal to that on the equivalent SDOF system.
By assuming (1), Δ i in the MDOF system can be expressed as:
Δ i = ϕ i z t
In the MDOF system, the displacement response of i mass particle exhibits proportionality to the horizontal seismic forces acting on it. Consequently, the motion of i mass particle in the horizontal direction can be modeled as simple harmonic motion, which can be expressed by Equation (A2).
Δ i = ϕ i Y 0 sin ω t
a i is obtained by Equation (A3).
a i = ω 2 ϕ i Y 0 sin ω t = ω 2 Δ i
Under the proportionality assumption, Δ i scale linearly with Δ d through the modal participation ratio:
c i = Δ i Δ d
Time differentiation of Equation (A5) establishes the relationship between a i and a d :
c i = a i a d
F i is governed by:
F i = m i a i = m i c i a d
By assuming (2), V b is evaluated using Equation (A7).
V b = i = 1 n F i = i = 1 n m i a i = i = 1 n m i c i a d = M eff a d
F i is governed by:
F i = m i c i a d = m i Δ i Δ d V b M eff = m i Δ i i = 1 n m i Δ i V b
By assuming (3):
i = 1 n F i Δ i = V b Δ d

References

  1. Hoque, M.A.; Mukhlis, M.R.; Bhuiyan, M.A.R. Seismic response of multi-span continuous irregular bridges using displacement-based and conventional force-based methods. Int. J. Civ. Eng. 2021, 19, 837–850. [Google Scholar] [CrossRef]
  2. Priestley, M.J.N.; Kowalsky, M.J. Direct displacement-based seismic design of concrete buildings. Bull. N. Z. Natl. Soc. Earthq. Eng. 2000, 33, 421–441. [Google Scholar] [CrossRef]
  3. Al-Mashaykhi, M.; Rajeev, P.; Wijesundara, K.; Hashemi, M. Displacement profile for displacement based seismic design of concentric braced frames. J. Constr. Steel Res. 2019, 155, 233–248. [Google Scholar] [CrossRef]
  4. Fakhraddini, A.; Hamed, S.; Fadaee, M.J. Peak displacement patterns for the performance-based seismic design of steel eccentrically braced frames. Earthq. Eng. Eng. Vib. 2019, 18, 379–393. [Google Scholar] [CrossRef]
  5. Arab, M.; Riahi, H.; Daei, M. Optimum displacement profile for the direct displacement-based design of steel moment-resisting frames. Structures 2022, 44, 323–342. [Google Scholar] [CrossRef]
  6. Xie, C.D.; Wang, X.T.; Vasdravellis, G.; Liang, W. Displacement profile for direct-displacement based seismic design of dual frame-wall resilient system. J. Constr. Steel Res. 2024, 214, 108495. [Google Scholar] [CrossRef]
  7. Kalapodis, N.A.; Muho, E.V.; Qian, J.; Zhou, Y. Assessment of seismic inelastic displacement profiles of steel MRFs by means of modal behavior factors. Soil Dyn. Earthq. Eng. 2023, 175, 108218. [Google Scholar] [CrossRef]
  8. Xu, G.; Guo, T.; Li, A.Q. Equivalent linearization method for seismic analysis and design of self-centering structures. Eng. Struct. 2022, 271, 114900. [Google Scholar] [CrossRef]
  9. Muho, E.V.; Qian, J.; Beskos, D.E. A direct displacement-based seismic design method using a MDOF equivalent system: Application to R/C framed structures. Bull. Earthq. Eng. 2020, 18, 4157–4188. [Google Scholar] [CrossRef]
  10. Kalapodis, N.A.; Muho, E.V.; Beskos, D.E. Seismic design of plane steel MRFS, EBFS and BRBFS by improved direct displacement-based design method. Soil Dyn. Earthq. Eng. 2022, 153, 107111. [Google Scholar] [CrossRef]
  11. Wu, X.Y.; Chen, L.W.; Yuan, X.M. Characteristics of long-period displacement spectra based on strong ground-motion records. J. Build. Struct. 2021, 42, 195–205. [Google Scholar]
  12. Orellana, M.A.; Ruiz, S.E.; Rodríguez-Castellanos, A. Displacement spectra damping factors for preliminary design of structures with hysteretic energy-dissipation device. J. Earthq. Eng. 2022, 26, 6260–6283. [Google Scholar] [CrossRef]
  13. Li, A.Q.; Zhang, G.D.; Wu, Y.F. Constant-ductility displacement spectra of generalized flag-shaped hysteretic model subjected to near-fault pulse-like earthquakes. J. Build. Struct. 2021, 42, 205–212. [Google Scholar]
  14. Zhao, G.C.; Xu, L.J.; Zhu, X.J.; Xie, L. A displacement design spectral method adapted to the Chinese seismic design code. J. Vib. Shock. 2023, 42, 266–274. [Google Scholar]
  15. Alimohammadi, D.; Abadi, E.I.Z. Assessment of collapse safety margin for DDBD and FBD-designed RC frame buildings. Struct. Eng. Mech. 2022, 83, 229–244. [Google Scholar]
  16. Palsanawala, T.N.; Gondaliya, K.M.; Bhaiya, V.; Vasanwala, S.A. Seismic vulnerability assessment of RC frame buildings designed using the DDBD approach: A parametric study. J. Vib. Eng. Technol. 2024, 12, 2319–2334. [Google Scholar]
  17. Zhang, C.Y.; Tian, Y. Simplified performance-based optimal seismic design of reinforced concrete frame buildings. Eng. Struct. 2019, 185, 15–25. [Google Scholar] [CrossRef]
  18. Giannakouras, P.; Zeris, C. Seismic performance of irregular RC frames designed according to the DDBD approach. Eng. Struct. 2019, 182, 427–445. [Google Scholar] [CrossRef]
  19. Zhou, Y.; Gu, A. Displacement-based seismic design of self-centering shear walls under four-level seismic fortifications. J. Build. Struct. 2019, 40, 118–126. [Google Scholar]
  20. Zhou, Y.; Xiao, Y.; Gu, A. Self-centering braced rocking frame systems and displacement-based seismic design method. J. Build. Struct. 2019, 40, 17–26. [Google Scholar]
  21. Zeng, M.R.; Lu, L.; Xia, W.Q.; Hu, Y. Performance-based seismic design method of a reinforced concrete self-centering frame with beam-end spring joints. Eng. Mech. 2024, 41, 266–274. [Google Scholar]
  22. Chu, L.S.; Liu, J.; Wang, S.W.; Zhao, J. Direct displacement-based seismic design method of SRC column-steel beam hybrid frames. Eng. Mech. 2018, 35, 100–110. [Google Scholar]
  23. Chu, L.S.; He, Y.X.; Zhao, J.; Chen, Z.Q. Study on displacement-based seismic design method of CFRP-reinforced concrete shear wall. Build. Struct. 2021, 51, 57–65. [Google Scholar]
  24. Ma, X.F. Investigation on direct displacement based design method of a hybrid RC frame system with stiffened masonry wall. Build. Struct. 2020, 50, 478–484. [Google Scholar]
  25. Zhang, X.G.; Liu, X.Y.; Zhang, S.P.; Wang, J.; Fu, L.; Yang, J.; Huang, Y. Analysis on displacement-based seismic design method of recycled aggregate concrete-filled square steel tube frame structures. Struct. Concr. 2023, 24, 3461–3475. [Google Scholar] [CrossRef]
  26. Men, J.J.; Huo, W.W.; Lan, T.; Lei, M.K.; Shi, Q.X. Seismic design method of RCS hybrid frame structure with replaceable members based on stiffness and displacement. Eng. Mech. 2021, 38, 169–178. [Google Scholar]
  27. Cosgun, C. Machine learning for the prediction of evaluation of existing reinforced concrete structures performance against earthquakes. Structures 2023, 50, 1994–2003. [Google Scholar] [CrossRef]
  28. Lazaridis, P.C.; Kavvadias, I.E.; Demertzis, K.; Iliadis, L.; Vasiliadis, L.K. Structural damage prediction of a reinforced concrete frame under single and multiple seismic events using machine learning algorithms. Appl. Sci. 2022, 12, 3845. [Google Scholar] [CrossRef]
  29. Ahmadi, M.; Ebadi-Jamkhaneh, M. Seismic Upgrading of existing steel buildings built on soft soil using passive damping systems. Buildings 2023, 13, 1587. [Google Scholar] [CrossRef]
  30. Jayawardana, J.; Sandanayake, M.; Jayasinghe, J.; Kulatunga, A.K.; Zhang, G. A comparative life cycle assessment of prefabricated and traditional construction-A case of a developing country. J. Build. Eng. 2023, 72, 106550. [Google Scholar] [CrossRef]
  31. Wang, J.X.; Li, H.J.; Gao, S. Analysis and evaluation on residual impact resistance of CFST composite frames under column removal scenario. Thin-Walled Struct. 2025, 206, 112624. [Google Scholar] [CrossRef]
  32. Fan, D.; Zhu, J.; Fan, M.; Lu, J.-X.; Chu, S.; Dong, E.; Yu, R. Intelligent design and manufacturing of ultra-high performance concrete (UHPC)-A review. Constr. Build. Mater. 2023, 385, 131495. [Google Scholar] [CrossRef]
  33. Ju, Y.Z.; Zhang, H.J.; Wang, D.H.; Kong, X.; Ma, Y.; Zhang, X.; Bai, J. Effect of mineral admixtures on the resistance to sulfate attack of reactive powder concrete. J. Clean. Prod. 2024, 440, 140769. [Google Scholar] [CrossRef]
  34. Hung, C.C.; El-Tawil, S.; Chao, S.H. A review of developments and challenges for UHPC in structural engineering: Behavior, analysis, and design. J. Struct. Eng. 2021, 147, 03121001. [Google Scholar] [CrossRef]
  35. Lee, N.K.; Koh, K.T.; Kim, M.O.; Ryu, G. Uncovering the role of micro silica in hydration of ultra-high performance concrete (UHPC). Cem. Concr. Res. 2018, 104, 68–79. [Google Scholar] [CrossRef]
  36. Guo, P.W.; Jiang, Z.; Meng, W.N.; Bao, Y. Multi-agent collaboration for knowledge-guided data-driven design of ultra-high-performance concrete (UHPC) incorporating solid wastes. Cem. Concr. Res. 2025, 164, 106230. [Google Scholar] [CrossRef]
  37. Zhang, W.; Zheng, D.W.; Huang, Y.Q.; Kang, S. Experimental and simulative analysis of flexural performance in UHPC-RC hybrid beams. Constr. Build. Mater. 2024, 436, 136889. [Google Scholar] [CrossRef]
  38. Wang, X.Y.; Ju, Y.Z.; Wang, D.H.; Xing, G.; Zhang, X.; Han, Y.; Song, Y. A simplified calculation model for maximum diagonal crack width of UHPC-NC composite beams. Mech. Adv. Mater. Struct. 2024, 2422576. [Google Scholar] [CrossRef]
  39. Gao, S.; Liu, L. Effects of freeze-thaw cycles on axial compression behaviors of UHPC-RC composite columns. Materials 2024, 17, 1843. [Google Scholar] [CrossRef]
  40. Yu, J.B.; Xia, Y.F.; Guan, D.Z.; Guo, X. Seismic behavior and restoring force model of precast beam-column connections with locally reactive powder concrete. J. Build. Eng. 2024, 82, 108296. [Google Scholar] [CrossRef]
  41. Ju, Y.Z.; Kong, X.S.; Wang, D.H.; Han, Y.; Song, Y. Seismic performance of precast interior joints with UHPC composite beams and HSC columns. Structures 2025, 75, 108741. [Google Scholar] [CrossRef]
  42. Zhang, X.L.; Wang, B.X.; Ju, Y.Z.; Wang, D.; Han, Y.; Song, Y. Seismic performance of precast frame with UHPC composite beams and HSC column under cyclic loadings. Eng. Struct. 2024, 302, 117429. [Google Scholar] [CrossRef]
  43. JGJ 3-2010; Ministry of Housing and Urban-Rural Development of the People’s Republic of China. Technical Specification for Concrete Structures of Tall Building. China Architecture and Building Press: Beijing, China, 2010.
  44. T/CECA 20024-2022; China Engineering and Consulting Association. Standard for Performance-Based Seismic Design of Building Structures. China Architecture and Building Press: Beijing, China, 2022.
  45. FEMA 356; Prestandard and Commentary for the Seismic Rehabilitation of Buildings. Federal Emergency Management Agency: Washington, DC, USA, 2000.
  46. GB 18306-2015; National Standardization Administrationseismic Ground Motion Parameters Zonation Map of China. Standards Press of China: Beijing, China, 2015.
  47. GB 50011-2010; Ministry of Housing and Urban-Rural Development of the People’s Republic of China. Code for Seismic Design of Buildings. China Architecture and Building Press: Beijing, China, 2016.
  48. SEAOC, Version 2000; Performance-Based Seismic Engineering of Buildings. Structural Engineers Association of California: Sacramento, CA, USA, 1995.
  49. Chen, G.; Nie, X.X.; Zheng, Q.Z.; Chen, W.; Jiang, H. Experimental study of seismic performance of assembled concrete frames with UHPC connections. Structures 2024, 63, 106353. [Google Scholar] [CrossRef]
  50. Zheng, Q.Z.; Liu, Y.Y.; Long, L.B.; Chen, G.; Ma, Y. Experimental research on seismic behavior of precast concrete frame connected with UHPC. Ind. Constr. 2019, 49, 85–91. [Google Scholar]
  51. Peng, C.F.; Zheng, Q.Z.; Long, L.B. Study on seismic performance of precast column connected with UHPC material. Build. Constr. 2016, 38, 1711–1713. [Google Scholar]
  52. Zhang, Y.X.; Lei, H.; Dong, Z.F.; Li, T.; Ma, F.; Liu, H.; Deng, M. Cyclic response of precast concrete columns connected with cast-in-place UHPC in plastic hinge region. J. Build. Eng. 2023, 65, 105793. [Google Scholar]
  53. Xu, W.J.; Shao, X.D.; Ma, B.; Li, J.Z.; Wang, R.L. Technical and experimental studies of precast bridge piers with the UHPC connection. China Civ. Eng. J. 2022, 55, 105–116+127. [Google Scholar]
  54. Priestley, M.J.N.; Calvi, G.M.; Kowalsky, M.J. Displacement-Based Seismic Design of Structures; IUSS Press: Pavia, Italy, 2007. [Google Scholar]
  55. Scott, B.D.; Park, R.; Priestley, M.J.N. Stress-strain behavior of concrete confined by overlapping hoops at low and high strain rates. ACI J. 1982, 79, 13–27. [Google Scholar]
  56. Aoude, H. Structural Behaviour of Steel Fibre Reinforced Concrete Members; McGill University: Montreal, QC, Canada, 2007. [Google Scholar]
  57. Ren, L.; Liu, Q.Y.; Liao, Y.Z. Seismic performance of concrete piers strengthened with UHPC. J. Shenyang Jianzhu Univ. (Nat. Sci.) 2023, 39, 243–251. [Google Scholar]
  58. Mohd Yassin, M.H. Nonlinear Analysis of Prestressed Concrete Structures Under Monotonic and Cyclic Loads; University of California: Berkeley, CA, USA, 1994. [Google Scholar]
  59. Mazzoni, S.; McKenna, F.; Scott, M.H.; Fenves, G.L. OpenSEES Command Language Manual; University of California: Berkeley, CA, USA, 2009. [Google Scholar]
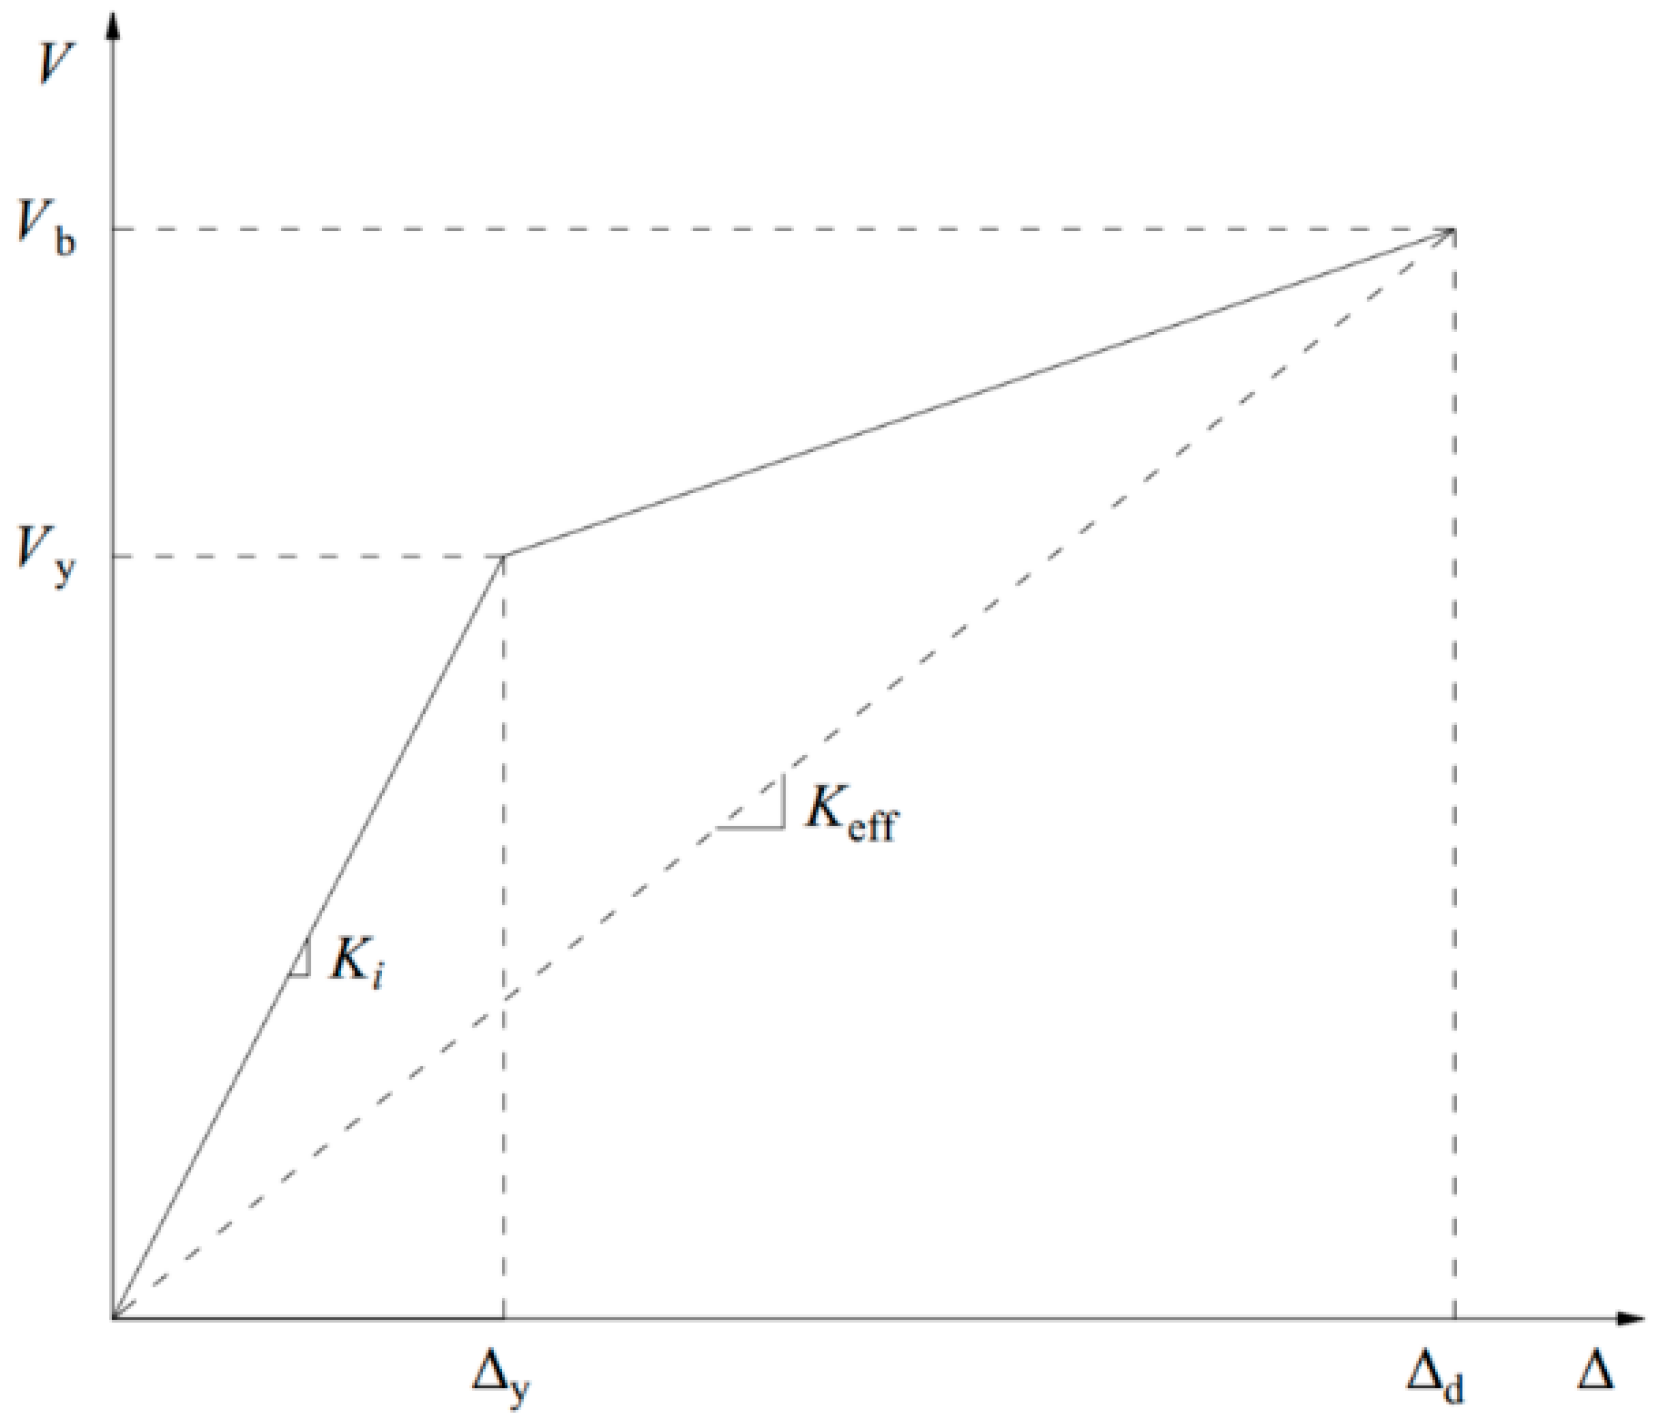
Figure 1. Effective stiffness of the SDOF system.
Buildings 15 03546 g001
Figure 2. Dimensions and reinforcement of the UHPC-HSC frame and its members (unit: mm) [42].
Buildings 15 03546 g002
Figure 3. Modeling method for the UHPC-HSC frame.
Buildings 15 03546 g003
Figure 4. Test setup [42].
Buildings 15 03546 g004
Figure 5. Constitutive Model: (a) Concrete02; (b) Hysteretic.
Buildings 15 03546 g005
Figure 6. Hysteresis curves of the UHPC-HSC frame.
Buildings 15 03546 g006
Figure 7. Plan and elevation of UHPC-HSC frame: (a) plan view; (b) elevation of the ⑤-axis (unit: mm).
Buildings 15 03546 g007
Figure 8. The pushover curve of UHPC-HSC frame.
Buildings 15 03546 g008
Figure 9. Comparison of design results and pushover results at various loading step: (a) absolute displacement; (b) interstory displacement; (c) interstory drift ratio.
Buildings 15 03546 g009
Figure 10. Relationship of base shear and MaxISDR with loading step.
Buildings 15 03546 g010
Figure 11. Safety margin plot.
Buildings 15 03546 g011
Table 1. Performance objectives for precast UHPC-HSC frame structure.
Performance ObjectiveABCD
Performance Level
Seismic Design Level
Frequent earthquake1111
Design earthquake1234
Rare earthquake2345
Extremely rare earthquake3456
Table 2. Summary of ISDR test data.
No.ReferenceSpecimen Type Specimen IDISDR
Yield PointPeak PointUltimate Point
1Zhang [42]FrameWhole frame1.14%2.67%4.45%
1st interstory0.98%2.68%4.66%
2nd interstory1.37%3.04%4.78%
3rd interstory1.06%2.30%3.93%
2Chen [49]FramePC1.16%2.09%
3Zheng [50]FramePC1.17%2.22%
Mean1.15%2.50%4.46%
Standard Deviation0.13%0.36%0.33%
4Peng [51]ColumnUHPC1601.41%4.58%4.91%
UHPC2401.44%3.26%5.02%
UHPC3201.73%2.66%4.73%
UHPC4001.63%2.54%4.91%
UHPC4801.27%2.63%4.15%
5Zhang [52]ColumnU6-50-H0.68%1.65%2.80%
U8-50-H0.52%1.65%3.15%
U12-50-H0.74%2.10%4.76%
U8-50-L0.71%1.65%2.57%
U8-150-H0.61%1.70%2.69%
6Xu [53]Bridge piersTall pier1.29%2.48%5.62%
Short pier1.09%3.06%5.10%
Mean1.09%2.50%4.20%
Standard Deviation0.43%0.87%1.09%
Table 3. Limit values of ISDR for precast UHPC-HSC frame structure.
Performance Level123456
Damage degreeNo damageSlight damageLight damageModerate damageSignificant damageSevere damage
ISDR0.18%0.20%0.55%1.1%2.5%4%
Table 4. The parameters of materials.
ConcreteLongitudinal Bars
ParametersPre-Cast UHPCPost-Cast UHPCPre-Cast HSCPre-Cast NSCParametersIn BeamIn Column
fc′ (MPa)108.286.857.437.2fy (MPa)449.94447.34
E0 (GPa)43.340.636.132.9εy0.0022390.002246
fcu (MPa)21.6417.3611.487.44fu (MPa)649.85610.52
ft′ (MPa)6.25.62.852.39εu0.125650.13672
Table 5. The comparison results between the test and the finite element simulation.
TestSimulationPercentage Deviation
Fy (kN)242.41240.90−0.62%
Fp (kN)281.92271.31−3.76%
Fu (kN)239.63230.61−3.76%
Kj (kN/mm)11.0911.988.03%
E (kN·m)255.92249.68−2.44%
Table 6. Parameters for performance objective D.
Seismic Design LevelPerformance LevelDamage DegreeLimit Value of ISDR
Frequent earthquake1No damage0.18%
Design earthquake4Moderate damage1.1%
Rare earthquake5Significant damage2.5%
Extremely rare earthquake6Severe damage4%
Table 7. Design process for “performance level 1”.
StoryHi (m) mi (t)δiΔi (m)miΔi (t·m)miΔi2 (t·m)miΔiHi (t·m2)Fi (kN)Vi (kN)
1036.6112.911.00000.05095.74370.2922210.219857.489857.4898
933.0129.230.93120.04746.12180.2900202.019361.2741118.7639
829.4129.230.85600.04355.62710.2450165.436956.3227175.0866
725.8129.230.77430.03945.09000.2005131.322450.9468226.0335
622.2129.230.68610.03494.51050.1574100.133545.1466271.1800
518.6129.230.59150.03013.88860.117072.328438.9219310.1019
415.0129.230.49050.02493.22430.080448.364832.2728342.3747
311.4129.230.38300.01952.51760.049028.700925.1993367.5741
27.8129.230.26900.01371.76850.024213.794417.7014385.2755
14.2130.530.14860.00760.98680.00754.14459.8770395.1525
1277.32 0.311839.47901.4632976.4650395.1525
Table 8. Pushover results of UHPC-HSC frame.
Loading Step3335
Base Shear384.30 kN405.24 kN
StoryAbsolute
Displacement
(mm)
Interstory
Displacement
(mm)
Interstory
Drift Ratio
(%)
Absolute
Displacement
(mm)
Interstory
Displacement
(mm)
Interstory
Drift Ratio
(%)
1032.9611.4630.04134.9601.5500.043
931.4982.0790.05833.4092.2030.061
829.4202.7270.07631.2062.8900.080
726.6933.3260.09228.3163.5260.098
623.3673.8180.10624.7914.0490.112
519.5494.1760.11620.7414.4320.123
415.3744.4170.12316.3094.6910.130
310.9564.4030.12211.6184.6740.130
26.5543.9490.1106.9444.1870.116
12.6052.6050.0622.7572.7570.066
Loading step48103
Base shear532.81 kN967.35 kN
StoryAbsolute
displacement
(mm)
Interstory
displacement
(mm)
Interstory
drift ratio
(%)
Absolute
displacement
(mm)
Interstory
displacement
(mm)
Interstory
drift ratio
(%)
1047.9502.1060.059102.9534.3850.122
945.8442.9890.08398.5686.2060.172
842.8553.9270.10992.3628.2590.229
738.9284.8140.13484.10310.3180.287
634.1145.5610.15473.78612.0790.336
528.5536.1230.17061.70713.3820.372
422.4296.5050.18148.32514.1880.394
315.9256.4610.17934.13613.9520.388
29.4645.7350.15920.18512.2260.340
13.7293.7290.0897.9597.9590.189
Loading step208272
Base shear1612.90 kN1860.26 kN
StoryAbsolute
displacement
(mm)
Interstory
displacement
(mm)
Interstory
drift ratio
(%)
Absolute
displacement
(mm)
Interstory
displacement
(mm)
Interstory
drift ratio
(%)
10208.1598.9510.249272.25510.6180.295
9199.20912.4430.346261.63814.9720.416
8186.76516.5930.461246.66620.3870.566
7170.17220.7730.577226.27926.1550.727
6149.39924.2510.674200.12431.7270.881
5125.14826.9420.748168.39736.7291.020
498.20528.7410.798131.66739.7131.103
369.46428.2140.78491.95438.3241.065
241.25024.7240.68753.63132.4670.902
116.52616.5260.39321.16321.1630.504
Loading step563902
Base shear2083.33 kN2257.95 kN
StoryAbsolute
displacement
(mm)
Interstory
displacement
(mm)
Interstory
drift ratio
(%)
Absolute
displacement
(mm)
Interstory
displacement
(mm)
Interstory
drift ratio
(%)
10563.48013.8290.384902.81918.8860.525
9549.65121.6570.602883.93332.5400.904
8527.99336.3591.010851.39259.8031.661
7491.63556.4981.569791.59094.5992.628
6435.13675.2972.092696.991123.2503.424
5359.83986.8802.413573.740139.0783.863
4272.95990.1292.504434.662142.5873.961
3182.83082.6682.296292.075130.8473.635
2100.16263.7801.772161.228102.3272.842
136.38236.3820.86658.90158.9011.402
Loading step913
Base shear2261.38 kN
StoryAbsolute
displacement
(mm)
Interstory
displacement
(mm)
Interstory
drift ratio
(%)
10913.82719.0600.529
9894.76733.0050.917
8861.76260.6901.686
7801.07295.8202.662
6705.252124.6763.463
5580.577140.6063.906
4439.971144.1384.004
3295.832132.3343.676
2163.499103.6372.879
159.86259.8621.425
Table 9. Modified design process for “performance level 1”.
StoryHi (m) mi (t)Δi (m)miΔi (t·m)miΔi2 (t·m)miΔiHi (t·m2)Fi (kN)Vi (kN)
1036.6112.910.04805.41410.2596198.156856.269056.2690
933.0129.230.04585.92470.2716195.514261.5752117.8442
829.4129.230.04295.53840.2373162.827657.5602175.4044
725.8129.230.03895.03080.1958129.795452.2855227.6899
622.2129.230.03414.40870.150497.872845.8195273.5094
518.6129.230.02863.69000.105468.634338.3504311.8598
415.0129.230.02242.89870.065043.479830.1257341.9855
311.4129.230.01592.05800.032823.461221.3888363.3743
27.8129.230.00951.22300.01169.539712.7110376.0853
14.2130.530.00370.48680.00182.04445.0589381.1442
1277.32 0.289836.67311.3313931.3263381.1442
Table 10. Design process for “performance level 4”.
StoryHi (m) mi (t)Δi (m)miΔi (t·m)miΔi2 (t·m)miΔiHi (t·m2)Fi (kN)Vi (kN)
1036.6112.910.272330.74068.36931125.1062140.1657140.1657
933.0129.230.261633.81268.84671115.8170154.1730294.3387
829.4129.230.246731.87787.8632937.2063145.3507439.6894
725.8129.230.226329.24316.6171754.4709133.3374573.0268
622.2129.230.200125.86295.1758574.1562117.9251690.9519
518.6129.230.168421.76273.6648404.785699.2296790.1815
415.0129.230.131717.01602.2404255.239677.5865867.7680
311.4129.230.092011.88371.0928135.474254.1852921.9532
27.8129.230.05366.93090.371754.061331.6024953.5557
14.2130.530.02122.76240.058511.602012.5955966.1511
1277.32 1.6738211.892644.30015367.9194966.1511
Table 11. Design process for “performance level 5”.
StoryHi (m) mi (t)Δi (m)miΔi (t·m)miΔi2 (t·m)miΔiHi (t·m2)Fi (kN)Vi (kN)
1036.6112.910.563563.623135.85032328.6037229.8549229.8549
933.0129.230.549771.033939.04382344.1187256.6285486.4834
829.4129.230.528068.235036.02762006.1090246.5167733.0001
725.8129.230.491663.536231.23661639.2345229.5412962.5413
622.2129.230.435156.234724.46981248.4101203.16251165.7037
518.6129.230.359846.503716.7338864.9683168.00671333.7104
415.0129.230.273035.27589.6288529.1365127.44291461.1533
311.4129.230.182823.62804.3199269.359385.36231546.5156
27.8129.230.100212.94441.2965100.966246.76501593.2806
14.2130.530.03644.74890.172819.945417.15661610.4372
1277.32 3.5201445.7636198.780011,350.85161610.4372
Table 12. Design process for “performance level 6”.
StoryHi (m) mi (t)Δi (m)miΔi (t·m)miΔi2 (t·m)miΔiHi (t·m2)Fi (kN)Vi (kN)
1036.6112.910.9138103.181194.28973776.4294321.8074321.8074
933.0129.230.8948115.6349103.46633815.9522360.6490682.4565
829.4129.230.8618111.369695.97413274.2650347.34601029.8024
725.8129.230.8011103.526382.93202670.9779322.88391352.6863
622.2129.230.705391.143064.27882023.3748284.26221636.9485
518.6129.230.580675.030643.56101395.5694234.00991870.9585
415.0129.230.440056.859425.0165852.8916177.33662048.2951
311.4129.230.295838.231811.3102435.8423119.23962167.5346
27.8129.230.163521.12973.4547164.811765.90062233.4352
14.2130.530.05997.81370.467732.817524.36982257.8050
1277.32 5.7164723.9201524.751018,442.93182257.8050
Disclaimer/Publisher’s Note: The statements, opinions and data contained in all publications are solely those of the individual author(s) and contributor(s) and not of MDPI and/or the editor(s). MDPI and/or the editor(s) disclaim responsibility for any injury to people or property resulting from any ideas, methods, instructions or products referred to in the content.