Abstract
Understanding the shear behavior of loess–concrete interfaces is essential for foundation design in collapsible loess regions, yet the pore-scale mechanisms remain unclear. This study investigates the relationship between interface shear strength and loess microstructure at different burial depths. Direct shear tests were conducted on undisturbed loess samples under stress conditions simulating in situ confinement. High-resolution SEM images were analyzed via Avizo to quantify pore area ratios at multiple scales, fractal dimensions, and directional probability entropy. Pearson correlation, principal component analysis (PCA), and hierarchical cluster analysis (HCA) were employed to statistically interpret the microstructure–mechanics relationship. Results show that interface shear strength increases significantly with depth (35.2–258.4 kPa), primarily due to reduced total porosity and macropore content, increased small and micropore fractions, and enhanced isotropy of pore orientation. Fractal dimension negatively correlates with strength, indicating that compaction-induced boundary regularization enhances particle contact and shear resistance, while entropy positively correlates with strength, reflecting structural homogenization and isotropic pore orientation. PCA and HCA further confirm that small and micropores are the dominant contributors to interface resistance. This study provides a quantitative framework linking microstructural evolution to mechanical performance, offering new insights for optimizing pile–soil interface design in loess areas.
1. Introduction
The mechanical behavior of soil–structure interfaces is fundamental to the stability and performance of a wide range of geotechnical systems, particularly in regions underlain by collapsible soils such as loess [1,2]. Among various interfaces, the contact between loess and concrete is of special importance in the design of foundation elements, retaining structures, and underground infrastructures in loess-covered areas [3,4]. The shear strength at this interface directly influences load transfer efficiency, deformation patterns, and the long-term safety of the structure. However, loess poses unique challenges due to its high porosity, water sensitivity, and structural heterogeneity [5,6,7], all of which complicate the interfacial shear response.
While previous studies have investigated macro-scale factors affecting interface behavior. Zhou et al. [8] investigated the effect of particle sphericity on soil-rough structural interfaces and found that lower sphericity enhanced shear strength by improving interlocking and friction. Tang and Zhang [9] explored the temperature dependency of granite shear strength, revealing that higher temperatures reduced strength due to thermal expansion and microstructural changes. Rui et al. [10] examined the cyclic shear behavior of carbonate sand-steel interfaces, showing that cyclic loading enhanced particle-steel interaction through densification and asperity interlocking. More recently, Wang et al. [11] considered different soil properties and interface roughness, demonstrating that clays and silty clays tend to exhibit strain-softening, whereas silts show strain-hardening, and further verified and modified constitutive models for interfacial shear behavior. Meng et al. [12] focused on the combined effects of sand grain size and interface groove spacing under controlled roughness conditions, revealing that interface shear strength is closely linked to grain size distribution and groove spacing, with shear band thickness positively correlated with particle size. You et al. [13] extended this research to loess–rough concrete interfaces, combining systematic shear tests and DEM simulations to clarify the effects of initial water content, dry density, and normal stress on interface shear strength, as well as the evolution of force chains and microstructural fabrics. Collectively, these studies highlight the growing research interest in soil–concrete interfaces, but the pore-scale mechanisms underlying loess–concrete shear behavior remain insufficiently understood.
The mechanical response of loess is intimately linked to its internal microstructure, which governs key behaviors such as strength, permeability, and deformation under loading [14,15]. In recent years, a range of advanced characterization techniques—such as scanning electron microscopy (SEM), mercury intrusion porosimetry (MIP), X-ray computed tomography (CT), and nuclear magnetic resonance (NMR)—have been widely employed to investigate the pore-scale features of loess [16,17,18,19]. Among these, SEM remains particularly favored due to its high spatial resolution, relatively straightforward sample preparation, and suitability for various soil types [20,21]. However, conventional SEM analysis is largely limited to qualitative interpretation and image-based observation, which restricts its applicability in quantitative microstructural studies. To address this limitation, high-resolution SEM images must be supplemented by robust digital image processing techniques to extract reliable numerical descriptors. In this study, SEM images of loess samples collected at different burial depths were processed using Avizo to obtain key parameters—such as multiscale pore area ratios, fractal dimension, and directional probability entropy—which were further correlated with interface shear strength [22,23]. Although previous studies have applied Avizo in fields such as rock fracture analysis and synthetic porous media, its application to loess interface studies, particularly in the context of concrete contact surfaces, remains limited. This work extends the use of Avizo to a geotechnical interface setting, providing new insights into the microstructural basis of loess–concrete shear behavior.
In this study, laboratory-scale direct shear tests were conducted to investigate the loess–concrete interface behavior under varying burial depths. Although no full-scale piles were involved, the experimental setup replicates essential conditions of interface contact in deep foundation scenarios. A combination of image-based microstructural analysis and multivariate statistical techniques was employed to quantify the influence of pore-scale features on interfacial shear strength. By integrating physical testing with statistical modeling, this work aims to uncover the mechanisms linking microstructure to shear resistance. Compared with previous studies that mainly emphasized macro-scale shear behavior, this research explicitly establishes a quantitative microstructure–mechanics framework using SEM–Avizo image analysis and multivariate statistics, thus providing novel insights into the depth-dependent evolution of loess–concrete interfaces and advancing the design of soil–structure systems in collapsible loess environments.
2. Materials and Methods
2.1. Raw Material
The study area is located in Fuxian County, Yan’an City, Shaanxi Province, in the central Loess Plateau. This site was chosen because it is widely regarded as representative of loess regions, where deposits are thick, continuous, and exhibit typical collapsibility and structural heterogeneity relevant to soil–structure interactions [24,25]. Although the samples were collected from a single geographic site, four burial depths (5 m, 15 m, 25 m, and 30 m) were deliberately selected to capture depth-dependent variations in stress state and microstructural evolution. These intervals correspond to shallow, intermediate, and deeper loess layers within the 0–30 m profile that is most critical for pile–soil interactions in engineering practice. At the same time, they reflect distinct stratigraphic differences in density, water content, and porosity observed during site investigation, while also providing a progressive increase in confining stress with depth. This dual consideration of stratigraphy and stress ensures that the vertical variation of microstructure and shear strength is effectively represented, while maintaining experimental feasibility given the labor-intensive nature of undisturbed sampling and SEM-based quantitative analysis.
The region is characterized by a complex topography of loess-covered hills and deeply incised gullies. The climate is semi-arid continental monsoon, with an average annual precipitation of 510–550 mm [26], concentrated in summer, which intensifies erosion and geohazard risks such as landslides and debris flows. Loess samples were carefully prepared into cylindrical specimens (0.1 m diameter, 0.2 m height). To minimize disturbance during transport, specimens were sealed with paraffin and packed in straw-filled wooden crates [27]. Their physical properties were analyzed in accordance with ASTM standards [28]. The key results are summarized in Table 1, which presents the dry density, natural water content, porosity, saturation, cohesion, and internal friction angle of the loess samples at different depths.

Table 1.
Physical properties of loess.
2.2. Test Procedure
2.2.1. Loess–Concrete Interface Shear Strength Test
The tests were conducted using an improved direct shear testing method, and the schematic diagram of the experimental apparatus is shown in Figure 1. Custom-sized concrete plates, measuring 61.8 mm × 10 mm, were cast from the same batch of concrete and prepared with identical procedures. To ensure consistency, the same set of plates was used across all shear tests. The surfaces were produced by casting against a steel mold and lightly polished, resulting in smooth interfaces with minimal asperities. This controlled preparation eliminated variability in surface texture, ensuring that the measured differences in shear strength reflect the microstructural evolution of loess rather than variations in concrete surface roughness. Undisturbed loess samples from different depths were carefully trimmed and placed into the molds, which were lubricated to facilitate easy removal. To simulate the stress conditions at the interface between the pile and the surrounding soil, the lateral stresses corresponding to different depths were applied as the normal stresses in the direct shear interface tests. It is noted that although Jaky’s empirical equation K0 = 1 − sin φ is widely used to estimate the coefficient of earth pressure at rest, in this study we adopted the theoretical expression K0 = 1/(1 + 2sin φ) proposed by Matsuoka et al. [29]. This formula is derived from the spatial mobilized plane (SMP) criterion and has been successfully applied in loess-related studies, as it better accounts for the anisotropic stress state and cemented structure of loess compared with the purely empirical Jaky relation. Based on this expression, the lateral stresses at various depths were calculated using Equations (1) and (2). Specifically, depths of 5 m, 15 m, 25 m, and 30 m were selected as representative nodes to define the variation in normal stress along the contact interface. Consequently, the approximate normal stresses at the pile-soil interface corresponding to different depth intervals were determined. The calculated normal stresses corresponding to different depths are summarized in Table 2. To minimize experimental error, each sample was subjected to three parallel tests, and the average values were used to ensure data accuracy.
where φ denotes the internal friction angle of loess (°); γ represents the unit weight of the soil (kN/m3); and h is the depth of the soil layer (m).
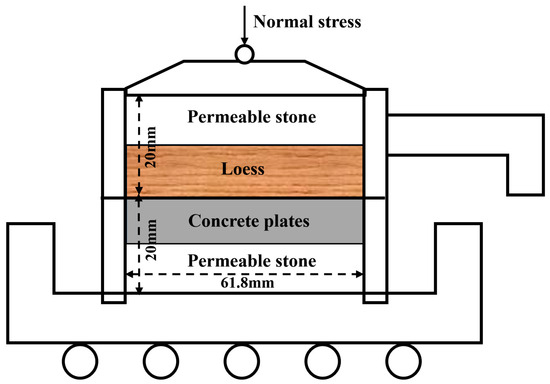
Figure 1.
Schematic diagram of experimental equipment.

Table 2.
Stress applied at different depths.
2.2.2. SEM Test
In this study, Scanning Electron Microscopy (SEM) (FEI Quanta 400 FEG SEM, FEI Company, Hillsboro, OR, USA) was used to evaluate the microstructure of loess. The original loess samples were carefully selected and prepared, with rectangular specimens of approximately 10 mm in diameter and 20 mm in height meticulously cut from the center of the sample. After air-drying for 72 h, the cylindrical specimens were manually fractured to expose fresh surfaces before the experiment, ensuring that the loess microstructure remained intact and undisturbed [30]. The samples were then coated with a gold sputter and subjected to vacuum treatment in the sample chamber to enhance the conductivity of the soil samples, thereby obtaining higher-quality microscopic images. The samples were scanned and analyzed at a magnification of 800× to thoroughly observe the soil particles and pore structure.
2.2.3. Image Processing
Image processing is an essential step in the quantitative study of the microstructural evolution characteristics of loess–concrete interface shear strength at different depths. To obtain the microstructural information of the samples, Avizo software 2019 was used to process the scanning electron microscope images at a magnification of 800× [31]. First, parameters such as contrast and brightness were adjusted to enhance subtle features of the microstructure in the images. Then, the images were binarized, simplifying the visualization by highlighting key features such as particles and pores, making subsequent analysis more straightforward. After image processing, various microstructural parameters can be extracted using the Avizo program for further analysis.
2.2.4. Multivariate Statistical Analyses
This study utilized multivariate statistical analysis to explore the relationships between collapsibility and microstructural parameters. The analysis incorporated three widely used techniques: Pearson correlation analysis, principal component analysis (PCA), and hierarchical cluster analysis (HCA), each selected for its ability to handle complex, multivariate datasets [32,33]. Such methods are increasingly recognized as powerful tools for dimensionality reduction and pattern recognition in earth science data, similar to other intelligent approaches such as artificial neural networks (ANN) applied in reservoir studies [34].
Among the multivariate statistical tools employed in this study, Pearson correlation analysis was first used to evaluate the linear relationships between microstructural parameters and interface shear strength. This method calculates the Pearson correlation coefficient (r), which ranges from −1 to 1 and quantifies the direction and strength of linear association between two continuous variables. An r value close to +1 indicates a strong positive correlation, while a value close to −1 indicates a strong negative correlation [35]. This analysis enables the identification of key structural features that most significantly influence the mechanical behavior of the soil–concrete interface. PCA was subsequently employed to reduce data dimensionality and identify the dominant factors influencing soil–concrete interface shear strength. PCA transforms a set of potentially correlated variables into a new set of orthogonal components (principal components), each capturing a portion of the total variance in the dataset [36]. By projecting the data onto the first few principal components, which explain the majority of the variance, this method facilitates clearer interpretation of the underlying relationships among variables and highlights the most influential microstructural features. HCA was also applied to group samples based on the similarity of their microstructural and mechanical characteristics. HCA is an unsupervised classification technique that iteratively merges data points or clusters according to their proximity, typically measured using Euclidean distance, and visualizes the results in the form of a dendrogram [37]. This method enables the identification of natural groupings within the dataset, providing insights into the classification of soil samples with respect to their depth-dependent properties and the evolution of interface shear strength. Although only four depth intervals were examined, each data point represents an average value derived from multiple SEM images, thereby improving its representativeness. Moreover, the consistency of results across Pearson correlation, PCA, and HCA provides additional confidence that the identified relationships are robust and reflect genuine depth-dependent trends.
3. Results and Discussion
3.1. Loess–Concrete Interface Shear Strength
The results of loess–concrete interface shear strength at different depths are shown in Figure 2, which demonstrates the evolution of pile–soil interface friction strength with shear displacement under different overburden pressures. The pile-soil interaction behavior reveals a pronounced dependency on both shear displacement and normal stress, with the friction strength increasing nonlinearly as the depth increases.
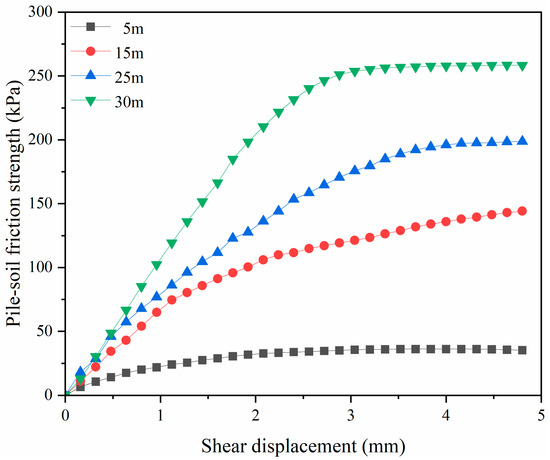
Figure 2.
Loess–concrete interface shear strength of samples at different depths.
At a shallow depth of 5 m, the pile-soil interface friction strength remains relatively low, stabilizing at approximately 30 kPa after a shear displacement of about 2.5 mm. This indicates limited shear resistance mobilization, consistent with minimal overburden stress, where interface contact is weaker and shear transfer is insufficient. As the depth increases to 15 m, a significant improvement in friction strength is observed, reaching approximately 130 kPa at a displacement of 4 mm. This highlights the enhanced role of normal stress in mobilizing shear resistance, as higher pressures improve the interlocking between the pile surface and surrounding soil particles. At greater depths of 25 m and 30 m, respectively, the pile-soil interface exhibits substantially higher friction strengths. For the 25 m depth, the strength stabilizes near 200 kPa, demonstrating a steady increase with shear displacement. In comparison, at 30 m, the interface friction strength rapidly mobilizes and achieves a peak value of 250 kPa, indicating a more efficient shear transfer mechanism under higher normal stress conditions. The behavior at these depths reflects an enhanced contact interface and reduced deformation compatibility, which are characteristic of pile-soil systems under significant overburden loads.
3.2. Microstructure Morphology
The SEM images presented in Figure 3a–d reveal the microstructural evolution of the pile–soil interface at depths of 5 m, 15 m, 25 m, and 30 m, emphasizing changes in the distribution and connectivity of inter-aggregate and intra-aggregate pores [38,39]. These changes directly influence the shear resistance observed in the mechanical behavior of the pile-soil system. At a depth of 5 m (Figure 3a), the microstructure is characterized by loosely packed clay-silt aggregates with prominent inter-aggregate pores, representing the large voids between poorly connected aggregates. The aggregates appear irregular in shape and distribution, with limited development of intra-aggregate pores. This loose arrangement limits interlocking and load transfer efficiency, corresponding to the lower frictional strength observed at this depth. At 15 m (Figure 3b), the microstructure displays more closely packed aggregates, with a reduction in inter-aggregate pore spaces and the emergence of more pronounced intra-aggregate pores within the clay-silt aggregates. The clay particles increasingly act as bridges or buttresses, linking the silt particles and enhancing the overall connectivity of the aggregates. This improved packing structure allows for more efficient stress transfer, leading to an increase in shear resistance. At 25 m (Figure 3c), further densification of the aggregates is evident. The inter-aggregate pores continue to diminish as the aggregates become more tightly arranged, while the intra-aggregate pores within the clay-silt network become more defined. The increased contact and interlocking between aggregates result in enhanced structural stability and stress mobilization across the pile-soil interface. This microstructural evolution corresponds to the observed higher shear strength. At 30 m (Figure 3d), the microstructure reaches its densest state, with minimal inter-aggregate pores and a dominance of intra-aggregate pores within the tightly packed clay-silt aggregates. The aggregates are well-formed and interlocked, exhibiting a stable and highly compacted structure. This dense packing allows for rapid mobilization of shear resistance with smaller displacements, consistent with the mechanical results at this depth. The SEM analysis reveals a systematic transition in the pile–soil microstructure with increasing depth. This is characterized by the progressive reduction in inter-aggregate pores and the concurrent development of intra-aggregate pores. At shallow depths, the loose arrangement of aggregates with prominent inter-aggregate voids results in limited load transfer. With increasing depth, aggregate densification and clay bridge formation significantly reduce inter-aggregate porosity while enhancing intra-aggregate cohesion. This structural evolution explains the increase in shear resistance observed at deeper interfaces, highlighting the critical role of aggregate packing and pore structure in the mechanical behavior of loess-pile systems.
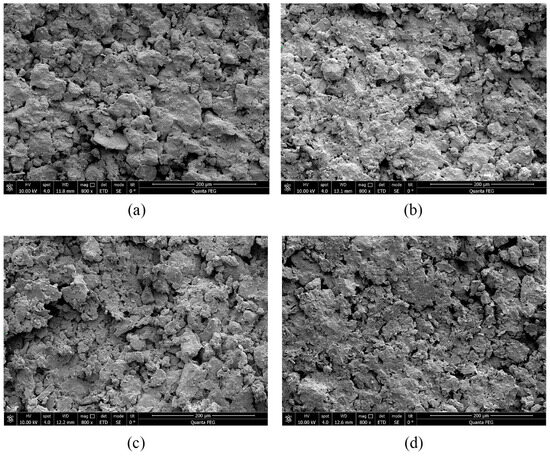
Figure 3.
Microstructural evolution of the pile-soil interface at different depths ((a) 5 m; (b) 15 m; (c) 25 m; (d) 30 m).
3.3. Pore Area Ratio
The Avizo software facilitates enhanced interpretation of SEM results by enabling the comparison between void fractions and total pore area ratios derived from SEM images [40]. The pore area ratio (PAR) is defined as the percentage of the total image area occupied by pores:
where is the summed area of all pores segmented from the SEM image and is the total area of the image. For pore-size classes, the following is computed:
where and .
The quantitative analysis of loess pore structures at depths of 5 m, 15 m, 25 m, and 30 m was performed using Avizo software, enabling precise evaluation of PARs and classification of pore types based on Lei [41]. The quantitative pore classification results are illustrated in Figure 4, which shows the histogram of different pore categories and their proportions at each depth. Although Lei’s classification dates back several decades, it remains widely applied in recent loess microstructure studies [42,43,44,45] for its ability to effectively capture the hierarchical pore system in loess. Four pore categories were identified: micropores (0–2 μm), small pores (2–8 μm), mesopores (8–32 μm), and macropores (>32 μm). Of these, inter-aggregate pores—small, mesopores, and macropores—dominate the structural macro-voids, while intra-aggregate pores, primarily micropores, reside within aggregates [46]. The pore area ratio, calculated as the total pore area to the SEM image area [40], highlights significant changes in microstructural organization with increasing depth. At a depth of 5 m, the total pore area ratio is 39.33%, the highest among the studied depths, indicating a loosely packed structure with abundant inter-aggregate voids. The pie chart shows that macropores dominate (31.4%), followed by mesopores (40.4%), small pores (22.5%), and micropores (5.7%). The predominance of macropores suggests a poorly compacted structure with limited interparticle connectivity, consistent with the SEM analysis, where extensive voids are observed between loosely arranged aggregates. At 15 m, the total pore area ratio decreases to 33.89%, indicating partial compaction of the soil matrix. Mesopores now account for the largest proportion (51.9%), followed by small pores (30.5%), with macropores (9.2%) and micropores (8.4%) reduced. This shift signifies the closure of larger inter-aggregate voids and the densification of the aggregate network, resulting in increased interparticle contact. The reduction in macropore prevalence highlights the structural transition toward a medium-pore-dominated system. At 25 m, the total pore area ratio is further reduced to 29.39%, demonstrating continued compaction with depth. Mesopores remain dominant (48.9%), while the proportion of small pores increases significantly (39%), reflecting the progressive redistribution of pore spaces. Macropores (3.8%) are nearly eliminated. The microstructure at this depth indicates advanced aggregate packing, characterized by reduced inter-aggregate porosity and a denser network of small- and meso-scale pores, correlating with enhanced mechanical stability. At the greatest depth of 30 m, the pore area ratio reaches its minimum of 24.92%, reflecting the most compacted state of the loess. The pie chart shows a near-equal distribution of small pores (43.3%) and mesopores (44.6%), while macropores are completely absent, and micropores increase to 12.1%, indicating a compression of inter-aggregate voids and a concentration of porosity within the aggregates themselves. The disappearance of macropores and the dominance of smaller pore types highlight the significant compression of inter-aggregate voids and the concentration of pore volume within the aggregates. This structural evolution aligns with the SEM observations of densely packed aggregates with minimal void spaces at this depth.
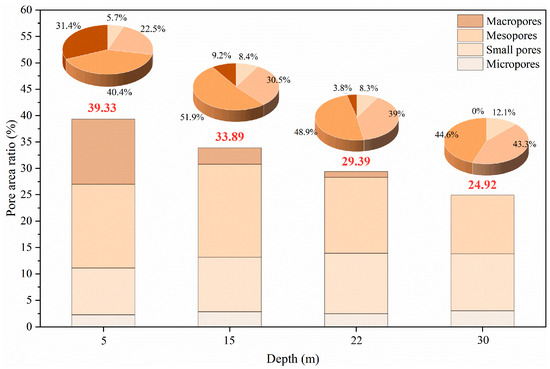
Figure 4.
Histogram of the distribution of different pore categories as a percentage of the total pore area.
3.4. Pore Shape Factor
In this study, the roundness has been introduced to quantify the pore shape distribution in samples.
where and are the area and perimeter of each single pore, respectively. Roundness values range from 0 to 1, with values closer to 1 indicating a pore shape that more closely approximates a circle [47]. The distributions of pore roundness at depths of 5 m, 15 m, 25 m, and 30 m are shown in Figure 5a–d. The roundness distributions reveal a systematic evolution in pore morphology with increasing depth, reflecting the compaction-induced reorganization of the loess microstructure. At a depth of 5 m, the roundness distribution shows a relatively uniform spread across the range, with a slight peak near 0.6, indicating a predominance of moderately rounded pores. The high proportion of circular and near-circular pores suggests a microstructure dominated by loosely packed inter-aggregate voids with minimal external pressure. At this shallow depth, the pore morphology remains largely unaffected by compaction, allowing pores to retain their original geometry. At 15 m, the roundness distribution becomes more dispersed, with an increase in the frequency of lower roundness values (<0.4). This shift indicates the emergence of elongated and irregular pore shapes as the aggregates begin to compact under moderate overburden pressure. At 25 m, the roundness distribution further skews toward lower values, with the peak frequency occurring around 0.4. The increase in elongated and irregular pores is indicative of advanced compression, where inter-aggregate voids are significantly flattened. The higher frequency of irregular pores highlights the compaction-induced collapse of larger voids and the redistribution of pore spaces into more anisotropic shapes. The microstructure at this depth reflects an increasingly stable soil matrix with reduced inter-aggregate porosity. At 30 m, the roundness distribution exhibits the highest concentration of low values, with the peak frequency around 0.3–0.4. This transformation reflects the culmination of compaction processes, resulting in a highly anisotropic and tightly packed soil structure.
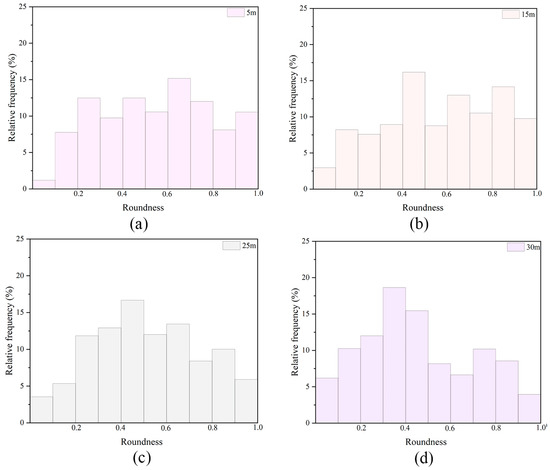
Figure 5.
Variation in pore shape factor ((a) 5 m; (b) 15 m; (c) 25 m; (d) 30 m).
3.5. Pore Fractal Dimension
A comprehensive analysis of pore morphology necessitates advanced metrics to quantify the complexity of pore shapes and their boundary irregularities. Among these, the fractal dimension (D) offers a robust approach for characterizing the intricate geometries of pore-aggregate interfaces. This parameter effectively captures the irregularity of pore boundaries, bridging the relationship between pore shape and its structural impact on loess behavior [48]. In this study, the fractal framework proposed by Moore and Donaldson [49] has been employed to calculate the fractal dimension, enabling the quantification of pore boundary irregularities.
where C denotes the fitting constant. A larger D corresponds to a more intricate pore morphology [50]. The fractal dimensions at depths of 5 m, 15 m, 25 m, and 30 m are 1.287, 1.288, 1.281, and 1.277. The corresponding values of fractal dimension are listed in Table 3. It can be observed that D decreases with increasing depth, consistent with the findings of Xu et al. [51]. At first sight, this trend may appear counterintuitive, since compaction is often associated with an increase in structural complexity. However, in the case of loess, the decline in D reflects a different mechanism. At shallow depths, the soil structure contains abundant large and irregular inter-aggregate macropores, which yield higher D values but contribute little to effective particle contact or shear resistance. With increasing depth, compaction progressively eliminates these macropores and redistributes voids into smaller, more isotropic intra-aggregate pores. This process suppresses the irregularity and elongation of pore boundaries, leading to smoother morphologies and lower measured D. Therefore, the observed decrease in fractal dimension with depth should not be interpreted as a loss of load-bearing complexity. Instead, it signifies a transition from irregular, mechanically ineffective macropore networks to denser, regularized micropore structures that enhance interparticle contact and stress transfer efficiency. In this sense, a lower D corresponds to improved packing and higher interface shear strength. This transformation underlines the critical role of compaction in reorganizing loess microstructure and aligns with prior studies demonstrating how depth and load can simplify porous material morphology while improving mechanical performance [52].

Table 3.
Fractal dimensions of different samples.
3.6. Pore Angle Distribution
The rose diagrams shown in Figure 6a–d illustrate the pore angle distributions at depths of 5 m, 15 m, 25 m, and 30 m, respectively, providing insights into the anisotropic evolution of loess microstructure under compaction. Pore angle is defined by the spatial orientation of pores, determined by the alignment between the long axis of the pore and the x-axis [53]. A total of eighteen groups were measured, each with a 10° interval for pore orientation angles. The statistical results of these measurements are visualized through rose diagrams (Figure 6). Specifically, the relative frequency of pore orientations within the ranges of 0–30° and 150–180° exhibits a minor increase with depth. However, no consistent or significant trend in the overall distribution of pore angles is observed. The results suggest that while localized adjustments in pore alignment occur, the orientation of pores does not follow a clear or systematic pattern with increasing depth. This lack of a definitive trend indicates that depth-related compaction processes exert limited influence on the angular distribution of pores, emphasizing the complexity of pore structure evolution within compacted loess.
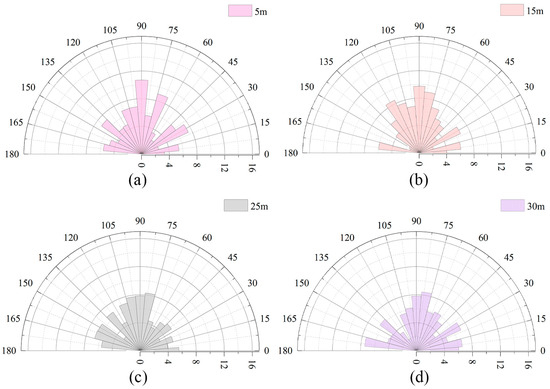
Figure 6.
Pore angle distribution ((a) 5 m; (b) 15 m; (c) 25 m; (d) 30 m).
To quantitatively assess the changes in pore angle distribution of samples, this study introduced the directional probability entropy (Hm). Hm is formally defined as follows [50]:
where Pi is the area probability of a pore appearing within a certain angle, Aθ is the area of the pore with pore angle within [θi, θi+1], Atotal is the total area of the pore, and n is the number of equidistributed orientation angles. The value of Hm ranges between 0 and 1, with larger Hm values indicating less directional is the pore.
The experimental results reveal a slight increase in Hm with depth, from 0.743 at 5 m to 0.788 at 30 m. The values of directional probability entropy at different depths are summarized in Table 4. This gradual rise suggests that pore orientation becomes increasingly uniform and less directional with increasing depth. At shallow depths, the lower Hm reflects a more pronounced alignment of pores, consistent with the visible peaks in the 0–30° and 150–180° ranges in the rose diagrams. In contrast, the higher Hm values at greater depths suggest a more isotropic distribution of pore angles, reflecting the effect of compaction-induced structural reorganization. While the increase in Hm is modest, it highlights the subtle yet measurable reduction in directional bias as depth increases. This trend aligns with the expectation that compaction reduces the influence of preferential pore alignment by homogenizing the microstructure.

Table 4.
Directional probability entropy of different samples.
3.7. Multivariate Statistical Analysis
3.7.1. Pearson Correlation Analysis
The Pearson correlation analysis provides critical insights into the relationships between loess–concrete interface shear strength (F) and various microstructural parameters, including pore characteristics, fractal dimension (D), and directional probability entropy (Hm). The corresponding correlation coefficients and their p-values are presented in Figure 7, which together indicate the strength and statistical significance of these relationships. The results demonstrate that F is strongly influenced by the pore area ratio (PAR) at different scales, the complexity of pore boundaries, and the directional alignment of pores, which collectively dictate the mechanical behavior of the soil under shear stress.
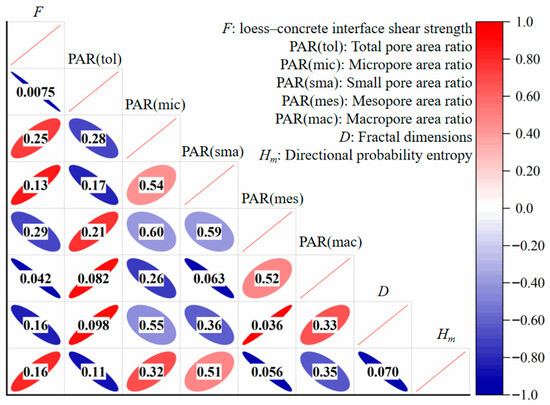
Figure 7.
Pearson correlation analysis among interface shear strength and microstructural parameters.
A strong negative correlation is observed between F and the total pore area ratio (PAR(tol)), indicating that a higher overall porosity reduces loess–concrete interface shear strength. This relationship suggests that increased porosity leads to a looser soil structure, diminishing inter-particle contact and subsequently lowering the soil’s resistance to shear forces. Among the pore size categories, small pores (PAR(sma)) exhibit a strong positive correlation with F, highlighting their critical role in enhancing soil strength. Small pores contribute to higher soil density and improved inter-particle interactions, resulting in increased friction strength. In contrast, mesopores (PAR(mes)) and macropores (PAR(mac)) show strong negative correlations with F. These larger pores act as stress-relief zones and weaken the mechanical integrity of the soil by reducing the contact area between particles, leading to a significant decrease in friction strength. Micropores (PAR(mic)) display a weak positive correlation with F, suggesting that their contribution to soil strength is less significant compared to small pores but remains beneficial under certain conditions.
Fractal dimension (D) exhibits a strong positive correlation with F, underscoring the importance of pore boundary complexity in determining soil mechanical behavior. Higher fractal dimensions reflect more irregular and interlocking pore boundaries, which enhance the mechanical interlocking of soil particles and increase the soil’s shear resistance. In contrast, directional probability entropy (Hm) shows a moderate negative correlation with F. This indicates that increased isotropy in pore orientation, as reflected by higher Hm values, reduces the directional alignment of pores, thereby diminishing the interlocking effect and weakening the soil’s resistance to shear forces.
3.7.2. Principal Component Analysis
To further elucidate the underlying relationship between the loess–concrete interface shear strength and microstructural features at varying burial depths, PCA was conducted based on a suite of quantitative indices, including total, macro-, meso-, small-, and micropore area ratios, D, and F. The results of PCA are presented in Figure 8, which shows the biplot of the first two principal components. The first two principal components (PC1 and PC2) jointly account for 92.1% of the total variance, indicating that the dimensionality of the dataset is effectively reduced while preserving the majority of its information content. The projection of the F vector indicates a strong alignment with Hm and PAR(sma), while being inversely related to PAR(mac) and PAR(tol). This suggests that denser, more structurally complex and anisotropic pore networks—characterized by lower macroporosity and higher entropy—facilitate greater mechanical interlocking at the soil–concrete interface. In contrast, specimens dominated by large, isotropic pores exhibit weaker interfacial bonding. These findings are also consistent with the Pearson correlation analysis. It should be noted that, given only four depth intervals, the PCA results are intended as exploratory rather than for rigorous statistical inference. Nevertheless, their consistency with Pearson correlation and HCA increases confidence that the identified relationships are robust.
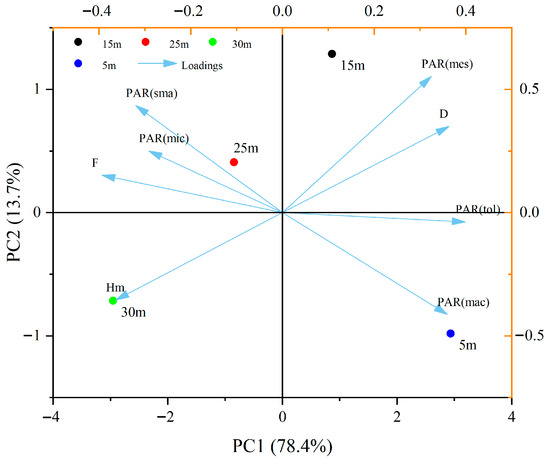
Figure 8.
Biplot of PCA.
3.7.3. Hierarchical Cluster Analysis
HCA of the dataset was performed, and the results are shown in Figure 9, where the dendrogram illustrates the clustering patterns of loess–concrete interface shear strength and microstructural parameters at different depths. Using Ward’s method and Euclidean distance as the similarity measure, the analysis effectively groups the samples (depths) into distinct clusters, providing insights into the relationships between depth and soil. The dendrogram shows two major clusters. The first cluster includes Depth 5 m, characterized by high total pore area and macropore content, resulting in the lowest loess–concrete interface shear strength. This reflects loose soil structure with less particle contact and lower shear resistance. The second cluster further divides into subclusters. Depth 15 m and Depth 25 m form a subcluster, indicating similar microstructural characteristics, including moderate mesopore and small pore content, leading to improved friction strength. Depth 30 m forms a separate branch within this cluster, reflecting its distinct characteristics of low total pore area, high micropore content, and maximum friction strength due to compaction and densification. The proximity of Depth 15 m and Depth 25 m in the dendrogram highlights their transitional nature between loose (5 m) and highly compact (30 m) soil structures. The distinct separation of Depth 30 m emphasizes its unique microstructural composition, including low porosity and a compact arrangement that maximizes shear resistance.
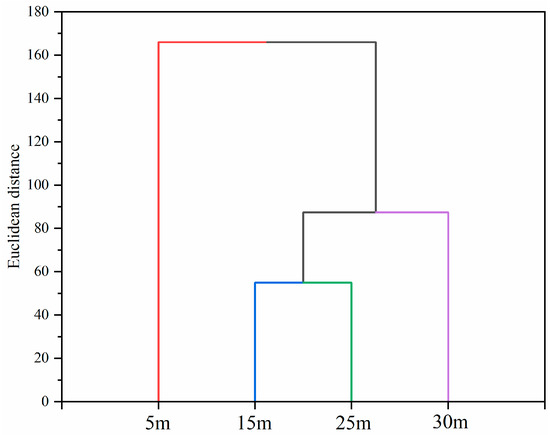
Figure 9.
Grouped dendrograms of specimens.
3.7.4. Multivariate Methods for Analyzing Loess–Concrete Interface Shear Strength Mechanisms
The variation in loess–concrete interface shear strength (F) with depth reflects the intricate interplay between soil microstructure and mechanical behavior. By integrating microstructural observations, Pearson correlation analysis, PCA, and HCA, the underlying mechanisms governing F can be elucidated with a high degree of clarity and precision. This comprehensive analysis highlights the critical roles of pore size distribution, total pore area, D, and Hm in defining the mechanical response of the loess–concrete interface.
The PAR(tol) emerges as a dominant factor influencing F, demonstrating a strong negative correlation across all methods. At shallow depths, such as 5 m, PAR(tol) reaches 39.33%, correlating with the lowest observed friction strength of 35.20 kPa. This high porosity is associated with loose soil structures dominated by macropores (PAR(mac) = 12.35%), which disrupt particle interlocking and significantly reduce the pile-soil interaction. Conversely, at 30 m depth, PAR(tol) decreases to 24.92%, driven by compaction-induced reductions in mesopores PAR(mes) = 11.12% and the near elimination of macropores (PAR(mac) = 0%). This densification enhances particle contact and interlocking, contributing to the maximum friction strength of 258.41 kPa, and the PCA results further validate this relationship.
Pore size distribution further refines the understanding of F. Micropores (PAR(mic)), which exist primarily within soil aggregates, demonstrate a moderate positive correlation with F, underscoring their role in densifying the soil matrix. The proportion of micropores increases with depth, from 2.25% at 5 m to 3.02% at 30 m, enhancing inter-particle contact and promoting mechanical stability. Small pores (PAR(sma)) show a strong positive correlation, contributing to friction strength by stabilizing the inter-aggregate matrix and facilitating stress transfer. In contrast, mesopores and macropores exhibit negative correlations. These larger pores act as stress-relief zones, reducing soil stiffness and mechanical integrity, particularly at shallow depths. The HCA results align with these findings, clustering shallow depths (e.g., 5 m) separately due to their high macropore content, while depths with reduced mesopores and macropores (e.g., 30 m) form a distinct high-strength cluster.
Structural complexity, as captured by the D, provides additional insight into the mechanisms underlying F. Higher D values at shallow depths (e.g., 1.287 at 5 m) reflect irregular and poorly interlocked pore boundaries, which weaken soil compaction and reduce friction strength. As depth increases, D slightly decreases to 1.277 at 30 m, indicating more regularized pore boundaries. Hm introduces a critical dimension of pore orientation, demonstrating a moderate positive correlation with F. At shallow depths, lower Hm values (e.g., 0.743 at 5 m) suggest anisotropic pore orientations, which limit uniform stress distribution and reduce shear resistance. With increasing depth, Hm rises to 0.788 at 30 m, indicating isotropic pore arrangements that enhance uniform stress transfer and maximize pile-soil interaction. This isotropy, combined with reduced total porosity and increased micropore content, contributes to the superior friction strength observed at greater depths.
The variation in loess–concrete interface shear strength is intricately linked to the evolution of soil microstructure under increasing stress. Higher small pore content and isotropic pore orientations at greater depths enhance interlocking and load transfer, while reductions in total porosity, macropores, and fractal dimension further improve loess–concrete interface shear strength. This comprehensive analysis underscores the importance of optimizing microstructural parameters to enhance geotechnical performance and provides a quantitative framework for understanding and designing pile-soil systems under varying stress conditions. These findings also provide direct guidance for engineering practice in collapsible loess regions. The observed increase in shear strength at greater depths (≥25 m) suggests that pile foundations anchored in deeper, denser loess layers benefit from improved interfacial resistance due to higher micropore and small-pore content. In contrast, shallow loess layers (e.g., 5 m), characterized by higher macroporosity and reduced shear resistance, pose greater risks of slip and settlement. In such cases, pre-compaction, grouting, or soil improvement techniques may be necessary prior to pile installation. Therefore, the microstructural insights obtained in this study not only clarify the mechanisms of loess–concrete interface behavior but also offer practical recommendations for optimizing pile design, selecting installation depths, and improving long-term foundation performance in collapsible loess terrains.
4. Conclusions
This study explores the relationship between loess–concrete interface shear strength (F) and microstructural parameters, using Pearson correlation analysis, principal component analysis (PCA), and hierarchical cluster analysis (HCA). The key conclusions are as follows:
- (1)
- The loess–concrete interface shear strength varies with depth, primarily influenced by the total pore area ratio (PAR(tol)), which shows a strong negative correlation with F. At shallow depths (5 m), high porosity and macropores reduce friction strength, while at greater depths (30 m), reduced porosity and increased micropore content enhance soil densification, resulting in higher friction strength.
- (2)
- Small pores (PAR(sma)) and micropores (PAR(mic)) positively correlate with F, improving soil density and inter-particle contact. Conversely, mesopores (PAR(mes)) and macropores (PAR(mac)) reduce friction strength due to their role in stress relief. Fractal dimension (D) reflects pore boundary regularity and shows a negative correlation with strength, as lower values at greater depths correspond to denser packing and stronger interparticle contact. In contrast, directional probability entropy (Hm) positively correlates with F, demonstrating that more isotropic pore orientations facilitate uniform stress transfer and improve shear resistance.
- (3)
- Pearson correlation analysis and PCA reveal that micropores and small pores significantly contribute to increased friction strength by enhancing compaction and inter-particle contact. Larger pores and higher fractal dimensions weaken the soil’s mechanical integrity. HCA clusters reveal that deeper samples with lower porosity and higher micropore content exhibit higher friction strength due to improved soil compaction.
Overall, the findings highlight that controlling pore size distribution and enhancing isotropy of pore orientation are key to improving loess–concrete interface performance. These insights can guide practical engineering design, such as optimizing pile–soil con-tact conditions or selecting compaction strategies in collapsible loess areas. It should be noted that this study was based on samples collected from a single representative site (Fuxian County) and considered only four burial depths (5, 15, 25, and 30 m). While this design ensured that typical vertical variations could be captured, it does not fully represent the entire stratigraphic sequence of loess. In addition, concrete plates with controlled surface conditions were used, meaning the influence of regional variability and interface roughness was not addressed. Future studies may expand on this work by incorporating denser depth intervals, field-scale pile loading tests, coupling hydro-mechanical effects, considering different interface textures, and applying machine learning models to predict interface behavior under complex environmental conditions.
Author Contributions
C.J.: Conceptualization, Methodology, Investigation, Formal analysis, Writing—original draft. W.X.: Conceptualization, Methodology, Supervision, Writing—Review and Editing. Q.Y.: Investigation, Resources. C.Q.: Investigation, Resources. P.F.: Investigation, Resources. Z.W.: Investigation, Software. K.Y.: Investigation, Software. All authors have read and agreed to the published version of the manuscript.
Funding
This study was substantially supported by the China Postdoctoral Science Foundation (Grant no. 2024MD753992), Shaanxi Geotechnical Mechanics and Engineering Young Talent Support Program Project (Grant no. YESS2024005), General projects of the Shaanxi Province Natural Science Basic Research Program (2025JC-YBQN-435), the National Natural Science Foundation of China (Grant Nos. 42372320 and 41972292), the Innovation Capability Support Program of Shaanxi Province (Grant No. 2021TD-54) and the Key Research and Development Projects of Shaanxi Province (Grant No. 2022ZDLSF06-03).
Informed Consent Statement
This article does not contain any studies with human participants and/or animals. Informed consent was obtained from all individual participants included in the study.
Data Availability Statement
The original contributions presented in this study are included in the article. Further inquiries can be directed to the corresponding author.
Conflicts of Interest
Author Chengliang Ji, Qingyi Yang, Chenfei Qu and Peijun Fan were employed by the company Shandong Electric Power Engineering Consulting Institute Co., Ltd. The remaining authors declare that the research was conducted in the absence of any commercial or financial relationships that could be construed as a potential conflict of interest.
References
- Chen, H.; Jiang, Y.; Gao, Y.; Yuan, X. Structural Characteristics and Its Influencing Factors of Typical Loess. Bull. Eng. Geol. Environ. 2019, 78, 4893–4905. [Google Scholar] [CrossRef]
- Pham, T.A.; Nadimi, S.; Sutman, M. Critical Review of Physical-Mechanical Principles in Geostructure-Soil Interface Mechanics. Geotech. Geol. Eng. 2024, 42, 6757–6808. [Google Scholar] [CrossRef]
- Zhang, Q.; Zhang, C. Nonlinear Shear Characteristics of Frozen Loess-Concrete Interface. PLoS ONE 2023, 18, e0290025. [Google Scholar] [CrossRef]
- Hu, C.; Li, X. Experimental Analysis of Shear Slip Characteristics at the Interface Between Loess and Cement Mortar. In Building Seismic Monitoring and Detection Technology; CRC Press: Boca Raton, FL, USA, 2023; pp. 136–149. [Google Scholar]
- Pye, K. The Nature, Origin and Accumulation of Loess. Quat. Sci. Rev. 1995, 14, 653–667. [Google Scholar] [CrossRef]
- Lancaster, N. On the Formation of Desert Loess. Quat. Res. 2020, 96, 105–122. [Google Scholar] [CrossRef]
- Yuan, K.; Ni, W.; Lü, X.; Vecchia, G.D.; Wang, H.; Li, L.; Nie, Y. Influence of Wetting–Drying Cycles on the Compression Behavior of a Compacted Loess from Microstructure Analysis. Bull. Eng. Geol. Environ. 2022, 81, 348. [Google Scholar] [CrossRef]
- Zhou, W.-H.; Jing, X.-Y.; Yin, Z.-Y.; Geng, X. Effects of Particle Sphericity and Initial Fabric on the Shearing Behavior of Soil–Rough Structural Interface. Acta Geotech. 2019, 14, 1699–1716. [Google Scholar] [CrossRef]
- Tang, Z.C.; Zhang, Y. Temperature-Dependent Peak Shear-Strength Criterion for Granite Fractures. Eng. Geol. 2020, 269, 105552. [Google Scholar] [CrossRef]
- Rui, S.; Wang, L.; Guo, Z.; Cheng, X.; Wu, B. Monotonic Behavior of Interface Shear between Carbonate Sands and Steel. Acta Geotech. 2021, 16, 167–187. [Google Scholar] [CrossRef]
- Wang, S.; Ni, Z.; Hou, F.; Li, W.; Bing, L. Consideration of Different Soil Properties and Roughness in Shear Characteristics of Concrete–Soil Interface. Buildings 2024, 14, 2889. [Google Scholar] [CrossRef]
- Meng, Z.; Li, Y.; Li, H.; Xu, J.; Shen, S. Effect Mechanism of Particle Size and Interface Geometry Characteristics on Shear Mechanical Behavior of Sand-Concrete Interface. Mater. constr. 2025, 75, e370. [Google Scholar] [CrossRef]
- You, Z.; Wang, T.; Zhang, L.; Wang, J. Experimental and DEM Investigation of Shear Behaviors of a Loess and Rough Concrete Interface. Buildings 2025, 15, 3178. [Google Scholar] [CrossRef]
- Guo, X.E.; Kim, C.H. Mechanical Consequence of Trabecular Bone Loss and Its Treatment: A Three-Dimensional Model Simulation. Bone 2002, 30, 404–411. [Google Scholar] [CrossRef]
- Yuan, K.; Ni, W.; Della Vecchia, G.; Lü, X.; Wang, H.; Nie, Y. A Microstructural Insight on a Lime-Stabilized Loess: Experimental Evidences and Pore Size Distribution Modeling. Acta Geotech. 2025, 20, 3249–3267. [Google Scholar] [CrossRef]
- Romero, E.; Simms, P.H. Microstructure Investigation in Unsaturated Soils: A Review with Special Attention to Contribution of Mercury Intrusion Porosimetry and Environmental Scanning Electron Microscopy. Geotech. Geol. Eng. 2008, 26, 705–727. [Google Scholar] [CrossRef]
- Beckett, C.T.S.; Hall, M.R.; Augarde, C.E. Macrostructural Changes in Compacted Earthen Construction Materials under Loading. Acta Geotech. 2013, 8, 423–438. [Google Scholar] [CrossRef]
- Lu, Y.; Zhang, W. Research on the Thermal Conductivity and Microstructure of Calcium Lignosulfonate-Magnesium Oxide Solidified Loess. Appl. Sci. 2025, 15, 4545. [Google Scholar] [CrossRef]
- Pan, T.; Zhao, Z.; Ma, J.; Liu, F. Experimental Investigation of Mechanical Properties and Pore Characteristics of Hipparion Laterite Under Freeze–Thaw Cycles. Appl. Sci. 2025, 15, 5202. [Google Scholar] [CrossRef]
- Vos, K.; Vandenberghe, N.; Elsen, J. Surface Textural Analysis of Quartz Grains by Scanning Electron Microscopy (SEM): From Sample Preparation to Environmental Interpretation. Earth Sci. Rev. 2014, 128, 93–104. [Google Scholar] [CrossRef]
- Yuan, K.; Ni, W.; Lü, X.; Wang, H.; Nie, Y.; Della Vecchia, G. Loess Compaction at Different Water Contents: Effects on Hydraulic Conductivity, Compression Behavior, Microstructure, and Water Distribution. J. Rock Mech. Geotech. Eng. 2025, 17, 5307–5317. [Google Scholar] [CrossRef]
- Wei, Y.; Fan, W.; Yu, B.; Deng, L.; Wei, T. Characterization and Evolution of Three-Dimensional Microstructure of Malan Loess. CATENA 2020, 192, 104585. [Google Scholar] [CrossRef]
- Zhang, Y.; Liu, C.; Zhang, Y.; Wu, X.; Zhang, F.; Zhang, J.; Li, X. The Mechanical Strength, Microstructure, and Transport Properties of Steel Slag Reinforced Loess Soil System. Case Stud. Constr. Mater. 2024, 20, e02702. [Google Scholar] [CrossRef]
- Guo, Y.; Liu, Y.; Wen, Q.; Li, Y. The Transformation of Agricultural Development towards a Sustainable Future from an Evolutionary View on the Chinese Loess Plateau: A Case Study of Fuxian County. Sustainability 2014, 6, 3644–3668. [Google Scholar] [CrossRef]
- Hu, Q.; Gao, X.; Wang, S.; Wang, Q.; Qin, Y.; Zhang, W.; Lun, F.; Li, Z. Exploring the Characteristics and Driving Forces of Orchard Expansion in Ecological Fragile Region: A Case Study of Three Typical Counties in the Loess Plateau. Front. Environ. Sci. 2023, 10, 1097236. [Google Scholar] [CrossRef]
- Zhuang, J.; Peng, J.; Wang, G.; Iqbal, J.; Wang, Y.; Li, W.; Xu, Q.; Zhu, X. Prediction of Rainfall-induced Shallow Landslides in the Loess Plateau, Yan’an, China, Using the TRIGRS Model. Earth Surf. Process. Landf. 2017, 42, 915–927. [Google Scholar] [CrossRef]
- Shao, X.; Zhang, H.; Tan, Y. Collapse Behavior and Microstructural Alteration of Remolded Loess under Graded Wetting Tests. Eng. Geol. 2018, 233, 11–22. [Google Scholar] [CrossRef]
- ASTM. Standard Practice for Classification of Soils for Engineering Purposes (Unified Soil Classification System); American Society for Testing and Materials: West Conshohocken, PA, USA, 2006. [Google Scholar]
- Matsuoka, H.; Sakakibara, K. A Constitutive Model for Sands and Clays Evaluating Principal Stress Rotation. Soils Found. 1987, 27, 73–88. [Google Scholar] [CrossRef] [PubMed]
- Xiao, T.; Li, P.; Pan, Z.; Hou, Y.; Wang, J. Relationship between Water Retention Capacity and Pore-Size Distribution of Compacted Loess. J. Soils Sediments 2022, 22, 3151–3165. [Google Scholar] [CrossRef]
- Xu, P.; Zhang, Q.; Qian, H.; Qu, W.; Li, M. Microstructure and Permeability Evolution of Remolded Loess with Different Dry Densities under Saturated Seepage. Eng. Geol. 2021, 282, 105875. [Google Scholar] [CrossRef]
- Besson, M.; Metian, M.; Bustamante, P.; Hédouin, L. Metal(Loid)s in Superficial Sediments from Coral Reefs of French Polynesia. Mar. Pollut. Bull. 2020, 155, 111175. [Google Scholar] [CrossRef] [PubMed]
- Radelyuk, I.; Tussupova, K.; Persson, M.; Zhapargazinova, K.; Yelubay, M. Assessment of Groundwater Safety Surrounding Contaminated Water Storage Sites Using Multivariate Statistical Analysis and Heckman Selection Model: A Case Study of Kazakhstan. Environ. Geochem. Health 2021, 43, 1029–1050. [Google Scholar] [CrossRef] [PubMed]
- Kianoush, P.; Mohammadi, G.; Hosseini, S.A.; Keshavarz Faraj Khah, N.; Afzal, P. ANN-Based Estimation of Pore Pressure of Hydrocarbon Reservoirs—A Case Study. Arab. J. Geosci. 2023, 16, 302. [Google Scholar] [CrossRef]
- Hou, K.; Qian, H.; Zhang, Y.; Qu, W.; Ren, W.; Wang, H. Relationship between Fractal Characteristics of Grain-Size and Physical Properties: Insights from a Typical Loess Profile of the Loess Plateau. CATENA 2021, 207, 105653. [Google Scholar] [CrossRef]
- Kim, J.-K.; Kim, E.-H.; Lee, O.-K.; Park, S.-Y.; Lee, B.; Kim, S.-H.; Park, I.; Chung, I.-M. Variation and Correlation Analysis of Phenolic Compounds in Mungbean (Vigna Radiata L.) Varieties. Food Chem. 2013, 141, 2988–2997. [Google Scholar] [CrossRef] [PubMed]
- Tiwari, N.; Satyam, N.; Sharma, M. Micro-Mechanical Performance Evaluation of Expansive Soil Biotreated with Indigenous Bacteria Using MICP Method. Sci. Rep. 2021, 11, 10324. [Google Scholar] [CrossRef]
- Romero, E.; Della Vecchia, G.; Jommi, C. An Insight into the Water Retention Properties of Compacted Clayey Soils. Géotechnique 2011, 61, 313–328. [Google Scholar] [CrossRef]
- Musso, G.; Azizi, A.; Jommi, C. A Microstructure-Based Elastoplastic Model to Describe the Behaviour of a Compacted Clayey Silt in Isotropic and Triaxial Compression. Can. Geotech. J. 2020, 57, 1025–1043. [Google Scholar] [CrossRef]
- Yuan, W.; Fan, W. Quantitative Study on the Microstructure of Loess Soils at Micrometer Scale via X-Ray Computed Tomography. Powder Technol. 2022, 408, 117712. [Google Scholar] [CrossRef]
- Lei, X. Pore Type of Loess in China and Collapsibility. Sci. China Ser. B 1987, 12, 1309–1316. [Google Scholar]
- Lv, Q.; Sui, W.; Zhang, Z.; Amat, G. Macro–Micro Correlation Analysis on the Loess from Ili River Valley Subjected to Freeze–Thaw Cycles. Sci. Rep. 2024, 14, 19322. [Google Scholar] [CrossRef]
- Wang, L.; Cheng, W.-C.; Hu, W.; Wen, S.; Shang, S. Effect of Seepage Conditions on the Microstructural Evolution of Loess across North-West China. iScience 2022, 25, 104691. [Google Scholar] [CrossRef]
- Ju, X.; Jia, Y.; Li, T.; Gao, L.; Gan, M. Morphology and Multifractal Characteristics of Soil Pores and Their Functional Implication. CATENA 2021, 196, 104822. [Google Scholar] [CrossRef]
- Nie, Y.; Ni, W.; Lü, X.; Tuo, W.; Yuan, K. Macroscopic Mechanical Behavior and Microstructural Evolution of Compacted Loess in the Chinese Loess Plateau. Soil. Tillage Res. 2023, 232, 105767. [Google Scholar] [CrossRef]
- Li, X.-A.; Sun, J.; Ren, H.; Lu, T.; Ren, Y.; Pang, T. The Effect of Particle Size Distribution and Shape on the Microscopic Behaviour of Loess via the DEM. Environ. Earth Sci. 2022, 81, 290. [Google Scholar] [CrossRef]
- Yuan, K.; Li, Q.; Ni, W.; Lü, X.; Della Vecchia, G.; Wang, H.; Nie, Y. Analysis of the Structural and Environmental Impacts of Hydrophilic ZSM-5 Molecular Sieve on Loess. Constr. Build. Mater. 2023, 366, 130248. [Google Scholar] [CrossRef]
- Bérubé, D.; Jébrak, M. High Precision Boundary Fractal Analysis for Shape Characterization. Comput. Geosci. 1999, 25, 1059–1071. [Google Scholar] [CrossRef]
- Moore, C.A.; Donaldson, C.F. Quantifying Soil Microstructure Using Fractals. Géotechnique 1995, 45, 105–116. [Google Scholar] [CrossRef]
- Chen, H.; Jiang, Y.; Niu, C.; Leng, G.; Tian, G. Dynamic Characteristics of Saturated Loess under Different Confining Pressures: A Microscopic Analysis. Bull. Eng. Geol. Environ. 2019, 78, 931–944. [Google Scholar] [CrossRef]
- Xu, P.; Zhang, Q.; Qian, H.; Li, M.; Yang, F. An Investigation into the Relationship between Saturated Permeability and Microstructure of Remolded Loess: A Case Study from Chinese Loess Plateau. Geoderma 2021, 382, 114774. [Google Scholar] [CrossRef]
- Soto-Gómez, D.; Pérez-Rodríguez, P.; Vázquez Juíz, L.; Paradelo, M.; López-Periago, J.E. 3D Multifractal Characterization of Computed Tomography Images of Soils under Different Tillage Management: Linking Multifractal Parameters to Physical Properties. Geoderma 2020, 363, 114129. [Google Scholar] [CrossRef]
- Wang, H.; Zou, J.; Wu, W.; Ni, W. Assessing Unsaturated Permeability of Loess under Multiple Rainfalls. Eng. Geol. 2023, 324, 107280. [Google Scholar] [CrossRef]
Disclaimer/Publisher’s Note: The statements, opinions and data contained in all publications are solely those of the individual author(s) and contributor(s) and not of MDPI and/or the editor(s). MDPI and/or the editor(s) disclaim responsibility for any injury to people or property resulting from any ideas, methods, instructions or products referred to in the content. |
© 2025 by the authors. Licensee MDPI, Basel, Switzerland. This article is an open access article distributed under the terms and conditions of the Creative Commons Attribution (CC BY) license (https://creativecommons.org/licenses/by/4.0/).