Article

Deformation and Control Measures of Existing Metro Shield Tunnels Induced by Large-Section Pipe Jacking Over-Crossing: A Case Study

1
School of Civil Engineering, Xi’an University of Architecture and Technology, Xi’an 710055, China
2
Shaanxi Key Laboratory of Geotechnical and Underground Space Engineering, Xi’an 710055, China
3
China Railway 20th Bureau Group Co., Ltd., Xi’an 710016, China
*
Author to whom correspondence should be addressed.
Buildings 2025, 15(12), 2105; https://doi.org/10.3390/buildings15122105
Submission received: 30 May 2025 / Revised: 13 June 2025 / Accepted: 16 June 2025 / Published: 17 June 2025
(This article belongs to the Special Issue Foundation Treatment and Building Structural Performance Enhancement)

Abstract

:
This study investigates the deformation characteristics and control measures for existing metro shield tunnels induced by large-section rectangular pipe jacking over-crossing, focusing on the Chengbei Road Comprehensive Utility Corridor project in Suzhou. A 9.1 m × 5.5 m pipe gallery was installed 73.6 m through clay strata over operational subway tunnels, with a minimum clearance of 4.356 m above the tunnel. Finite element simulations and field monitoring were employed to analyze the deformation of the existing tunnels, particularly the effectiveness of anti-uplift counterweights. The results revealed that excavation-induced unloading caused significant tunnel uplift, with maximum vertical displacements of 5.51 mm and 4.95 mm for the down line (DL) and up line (UL) tunnels, respectively. The addition of counterweights reduced these displacements by 30.3% and 37.1%, while also decreasing lateral displacements by up to 61.6% and bending moments by approximately 33%. The study demonstrates that counterweights, combined with slurry lubrication, real-time monitoring, and over-excavation control, effectively mitigate deformation and stress variations during large-section pipe jacking. The successful completion of the project without disrupting subway operations highlights the practical applicability of these measures.

1. Introduction

With the increasing development of underground space globally, pipe jacking has become widely used in urban metro construction and the installation of water, gas, and communication pipelines [1,2,3]. Due to the dense distribution of underground pipelines, pipe-jacking tunnels often intersect existing tunnels, leading to structural deformation, cracking, and even damage, which compromises tunnel safety [4,5,6]. Therefore, understanding the mechanisms behind tunnel deformation caused by pipe jacking and implementing effective control measures is crucial.
New tunnels can either under-cross or over-cross existing tunnels. The impact of under-crossing tunnels has been extensively studied, with findings showing that the settlement of existing tunnels occurs in four stages: (i) settlement, (ii) heave, (iii) secondary settlement, and (iv) stabilization [7,8,9]. The maximum deflection of the existing tunnel is sensitive to the horizontal distance between tunnels, which should be considered in planning [10]. Under-crossing induces longitudinal stress and bending moments in the existing tunnel, leading to tensile stresses that negatively affect the structure [11,12,13]. In contrast, over-crossing tunnels cause soil stress release and tunnel uplift [14,15]. Field and simulation data indicate that over-crossing leads to three phases of surface deformation: a heave-enhancing phase, a heave-weakening phase, and an absolute settlement phase [16]. The maximum tunnel displacement and convergence occur when the shield machine completes its work [17]. Over-crossing increases the soil pressure on the existing tunnel, with changes in longitudinal bending moments being more significant than those in the circumferential moments. The maximum additional longitudinal bending moment occurs at the intersection point [18].
Several studies have proposed control measures for deformation caused by tunnel excavation, including stratum loss control [19], ground reinforcement [20,21], increased structural stiffness [22,23], real-time monitoring [24], and enhanced lubrication [25]. For example, the micro-over-excavation method was used in Nanjing to control stratum loss during large-section pipe jacking [16]. Lubrication techniques were employed to facilitate tunneling and mitigate the deformation of underlying tunnels [26]. In Shenzhen, the use of grout injection and shield tunneling for the under-crossing of Metro Line 9 minimized deformation in the existing tunnel [27]. Other studies, such as those in Hohhot and Changsha, also employed reinforcement methods like inter-layer grouting and horizontal pile construction to reduce impacts on existing tunnels [28].
Despite extensive research on shield tunnel construction, studies on the impact and control of pipe jacking near existing tunnels remain limited. Moreover, the unloading effects in large-section tunnels in weak soil strata can significantly increase deformation risks [21]. At present, research on the control of the impacts of pipe-jacking construction in such strata is scarce. This paper focuses on the Chengbei Road Comprehensive Utility Corridor project in Suzhou, where a large-section pipe gallery (9.1 m × 5.5 m) crosses an existing metro tunnel with a minimal clearance of 4.356 m. The project’s soft, high-water-content, low-strength soil conditions further amplify the risks. To mitigate these impacts, in addition to real-time monitoring and enhanced lubrication, an anti-uplift counterweight method was implemented. Finite element simulations and field monitoring of surface settlement and tunnel deformation validated the effectiveness of this approach. This project successfully mitigates the impact of large-section rectangular pipe-jacking on the adjacent existing tunnels without employing additional ground reinforcement techniques in weak soil strata.

2. Project Background

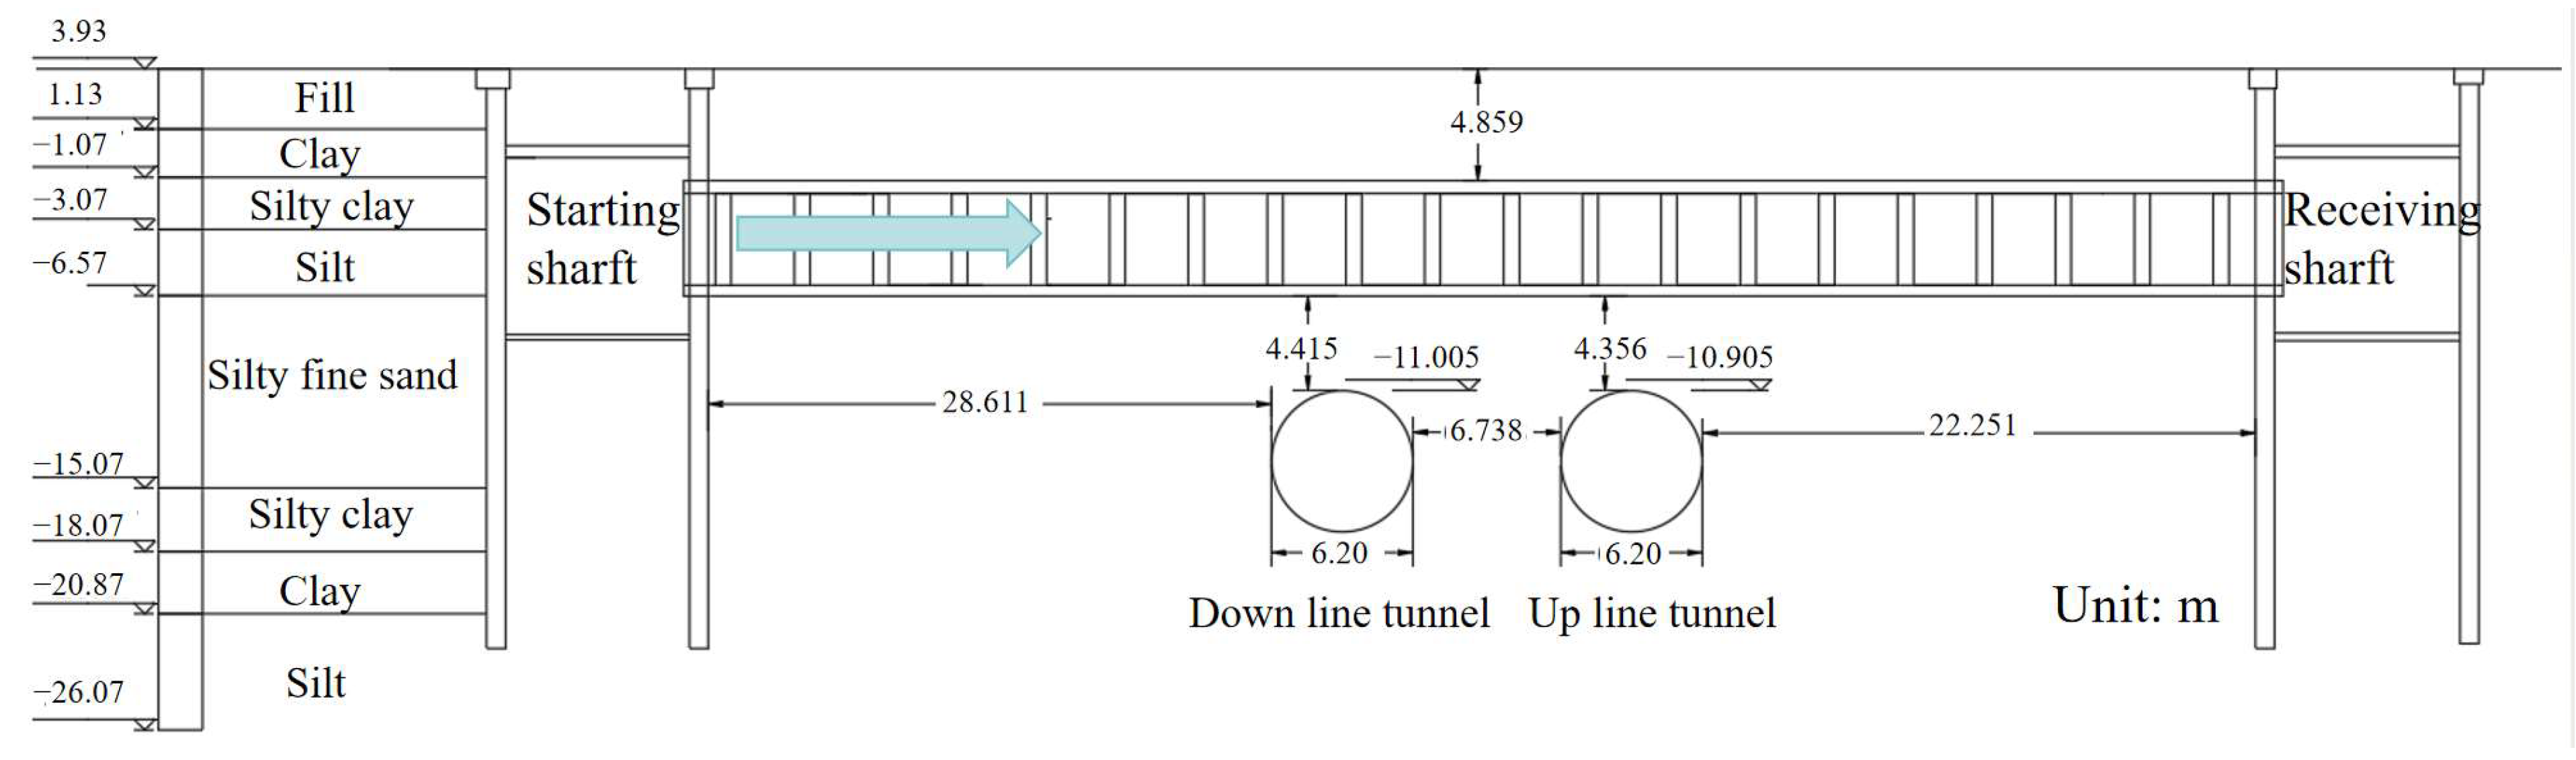
2.1. Pipe-Jacking Project and Site Condition

The Chengbei Road Comprehensive Utility Corridor project employed single-box, four-chamber pipe jacking beneath Guangji North Road. The 73.6 m jacking length traversed clay strata with an average overburden of 4.859 m. The pipe gallery cross-section measured 9.1 m × 5.5 m with a 0.5 m thickness. It crossed an operational subway tunnel (Line 4) with a vertical clearance of 4.356 m and a horizontal distance of 20–27 m. Subway operations continued during construction. Geological surveys identified strata consisting of fill, clay, silty clay, silt, and fine sand. The longitudinal profile of the project site is shown in Figure 1.

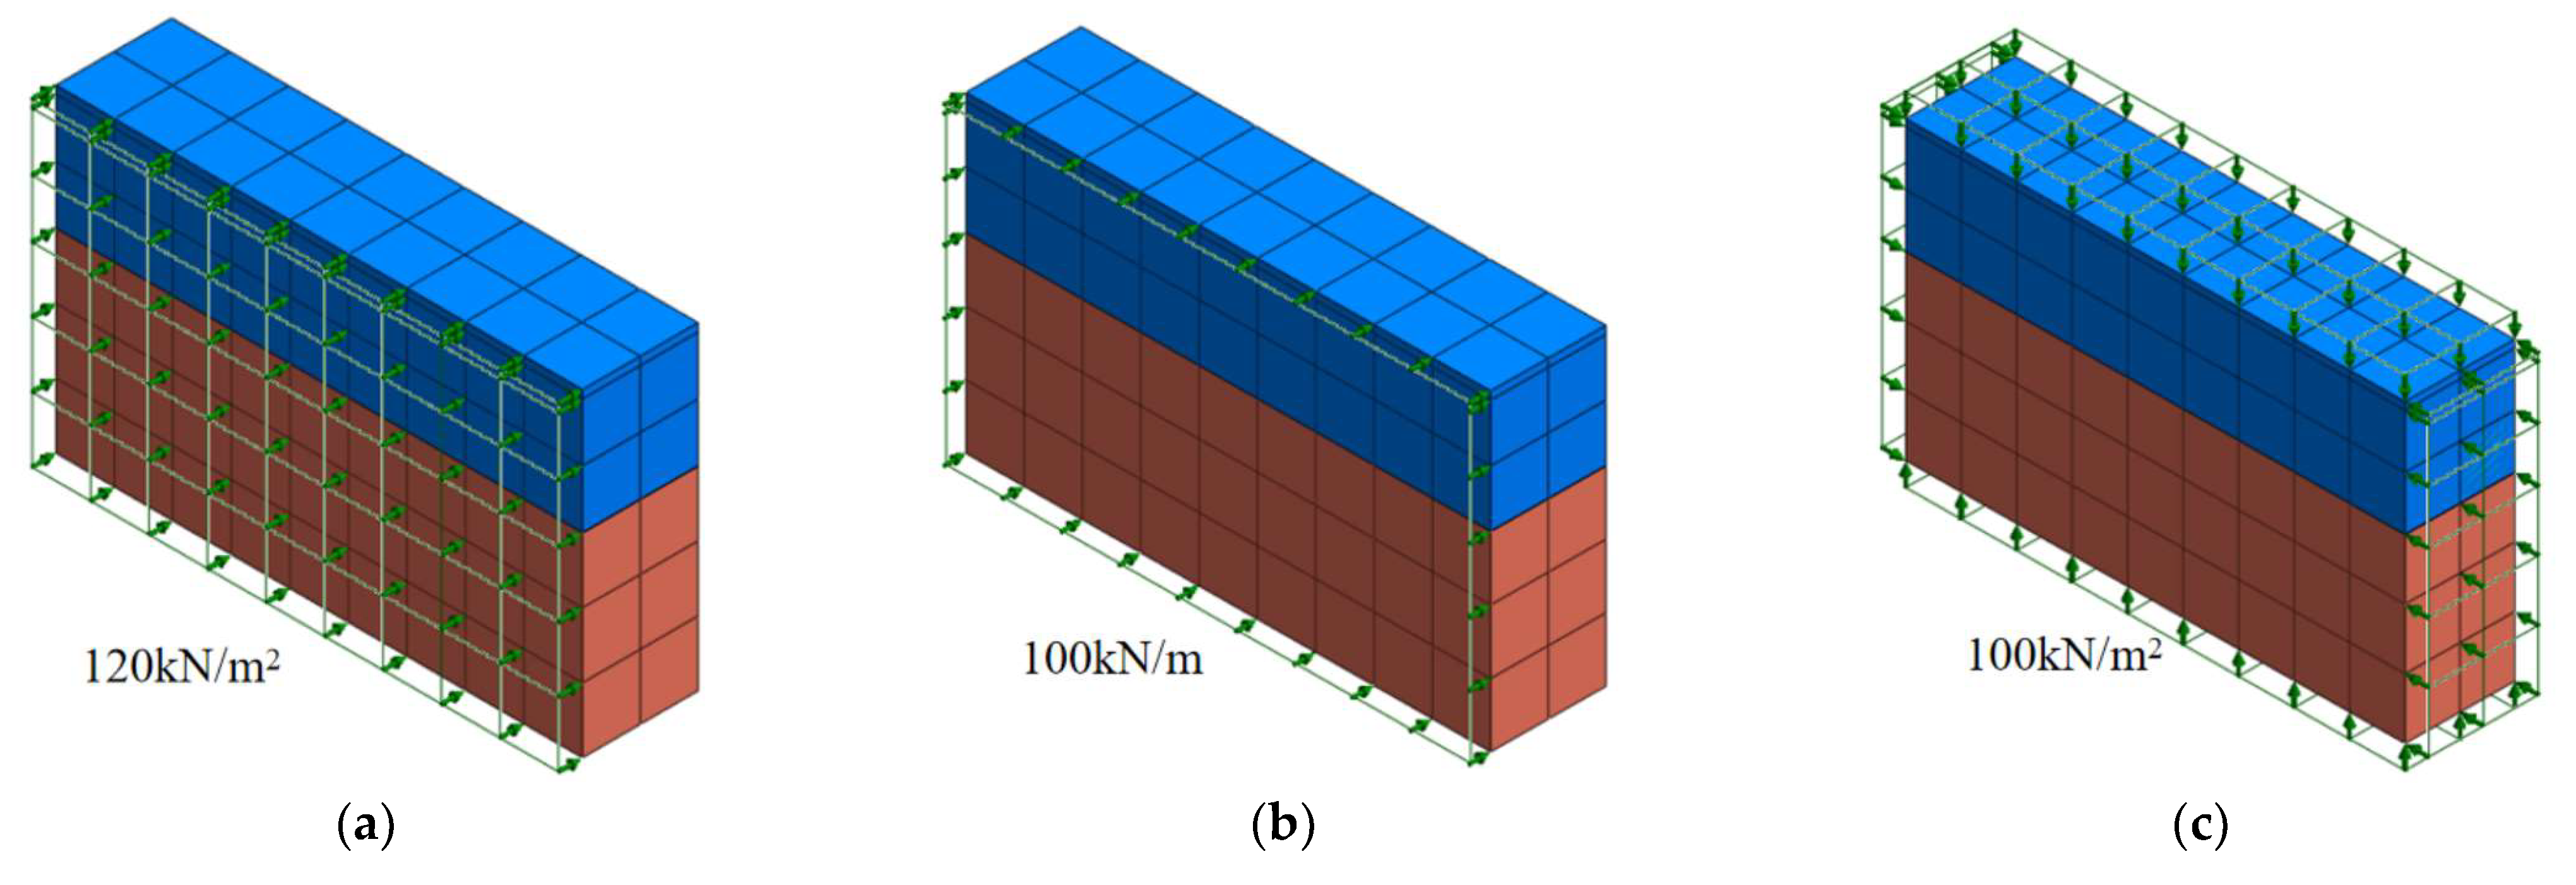
2.2. Anti-Floating Counterweights

To mitigate tunnel deformation and ensure operational safety during pipe jacking, counterweights were added inside the pipe gallery. Conventional methods such as loading ballast on unused subway sections or road surfaces were unsuitable due to ongoing subway operations and heavy traffic. This project employed self-moving counterweight carts on tracks within the pipe gallery. Cement blocks weighing 2.1 tons per meter were added incrementally as jacking progressed, as illustrated in Figure 2.

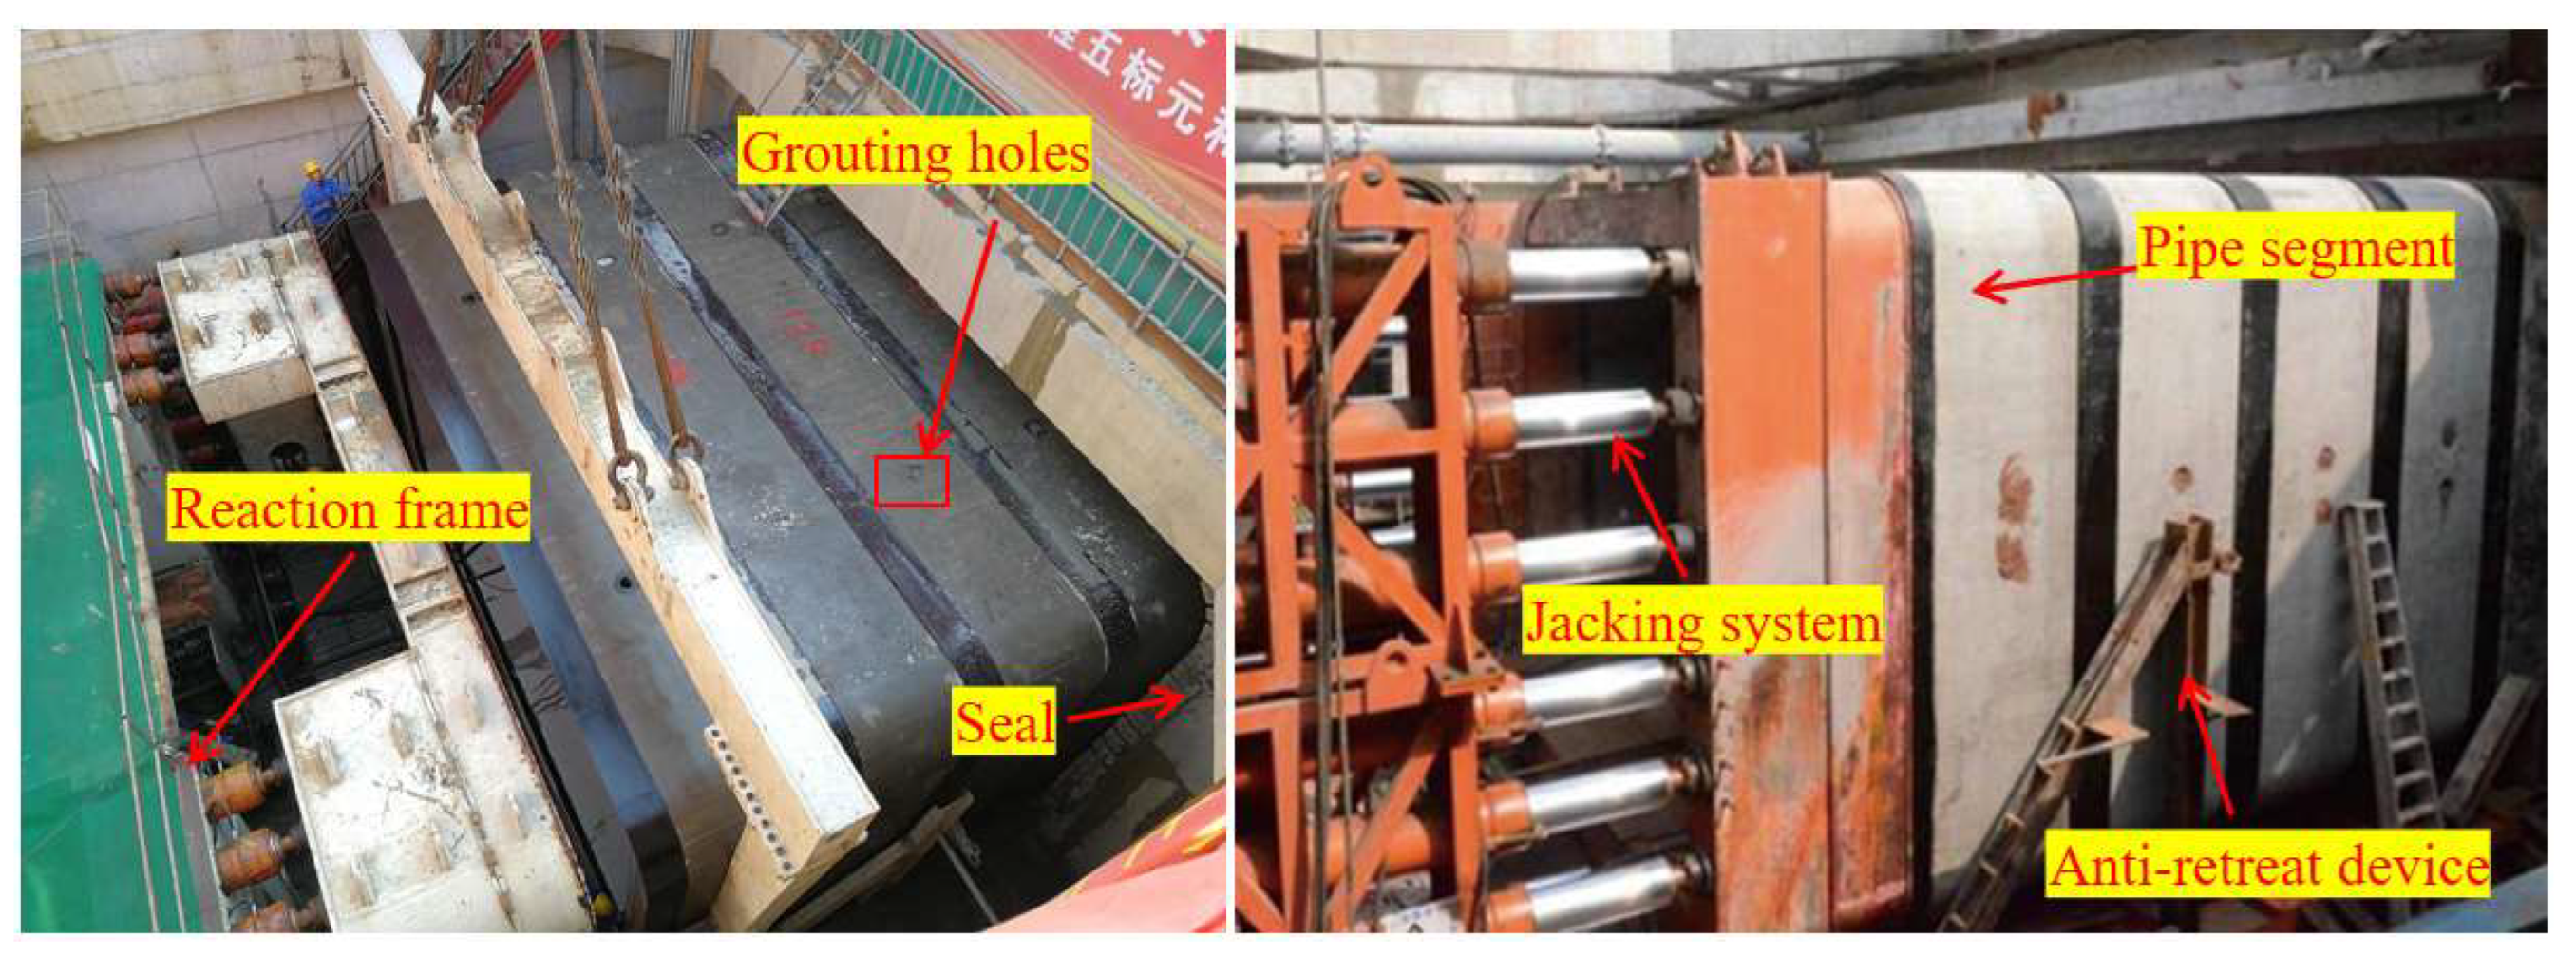
2.3. Construction Schemes

As shown in Figure 3, the project utilized a soil-pressure-balanced shield-tunneling machine, which incorporated a cutter-mixing system, a power system, alignment and hydraulic systems, a shell, a screw conveyor, a measurement and display system, and an electrical operation system. The machine’s dimensions were 5.113 m (length) × 9.12 m (width) × 5.52 m (height), with a total weight of 200 tons. The cutterhead, equipped with seven discs, was powered by 16 hydraulic jacks, providing a total thrust of 48,000 kN. Thixotropic grout, composed of bentonite, soda ash, and carboxymethyl cellulose, was injected through pre-formed holes to reduce friction between the tunnel segments and the surrounding soil. Rubber seals on the portal ring maintained the slurry pressure and enhanced lubrication. An automated monitoring system in the track traffic zone facilitated real-time adjustments to construction parameters and regulated spoil removal to prevent over-excavation. The jacking operation for the Guoji North Road tunnel commenced on 12 October and was completed successfully on 22 November, taking a total of 41 days.

3. Numerical Simulation

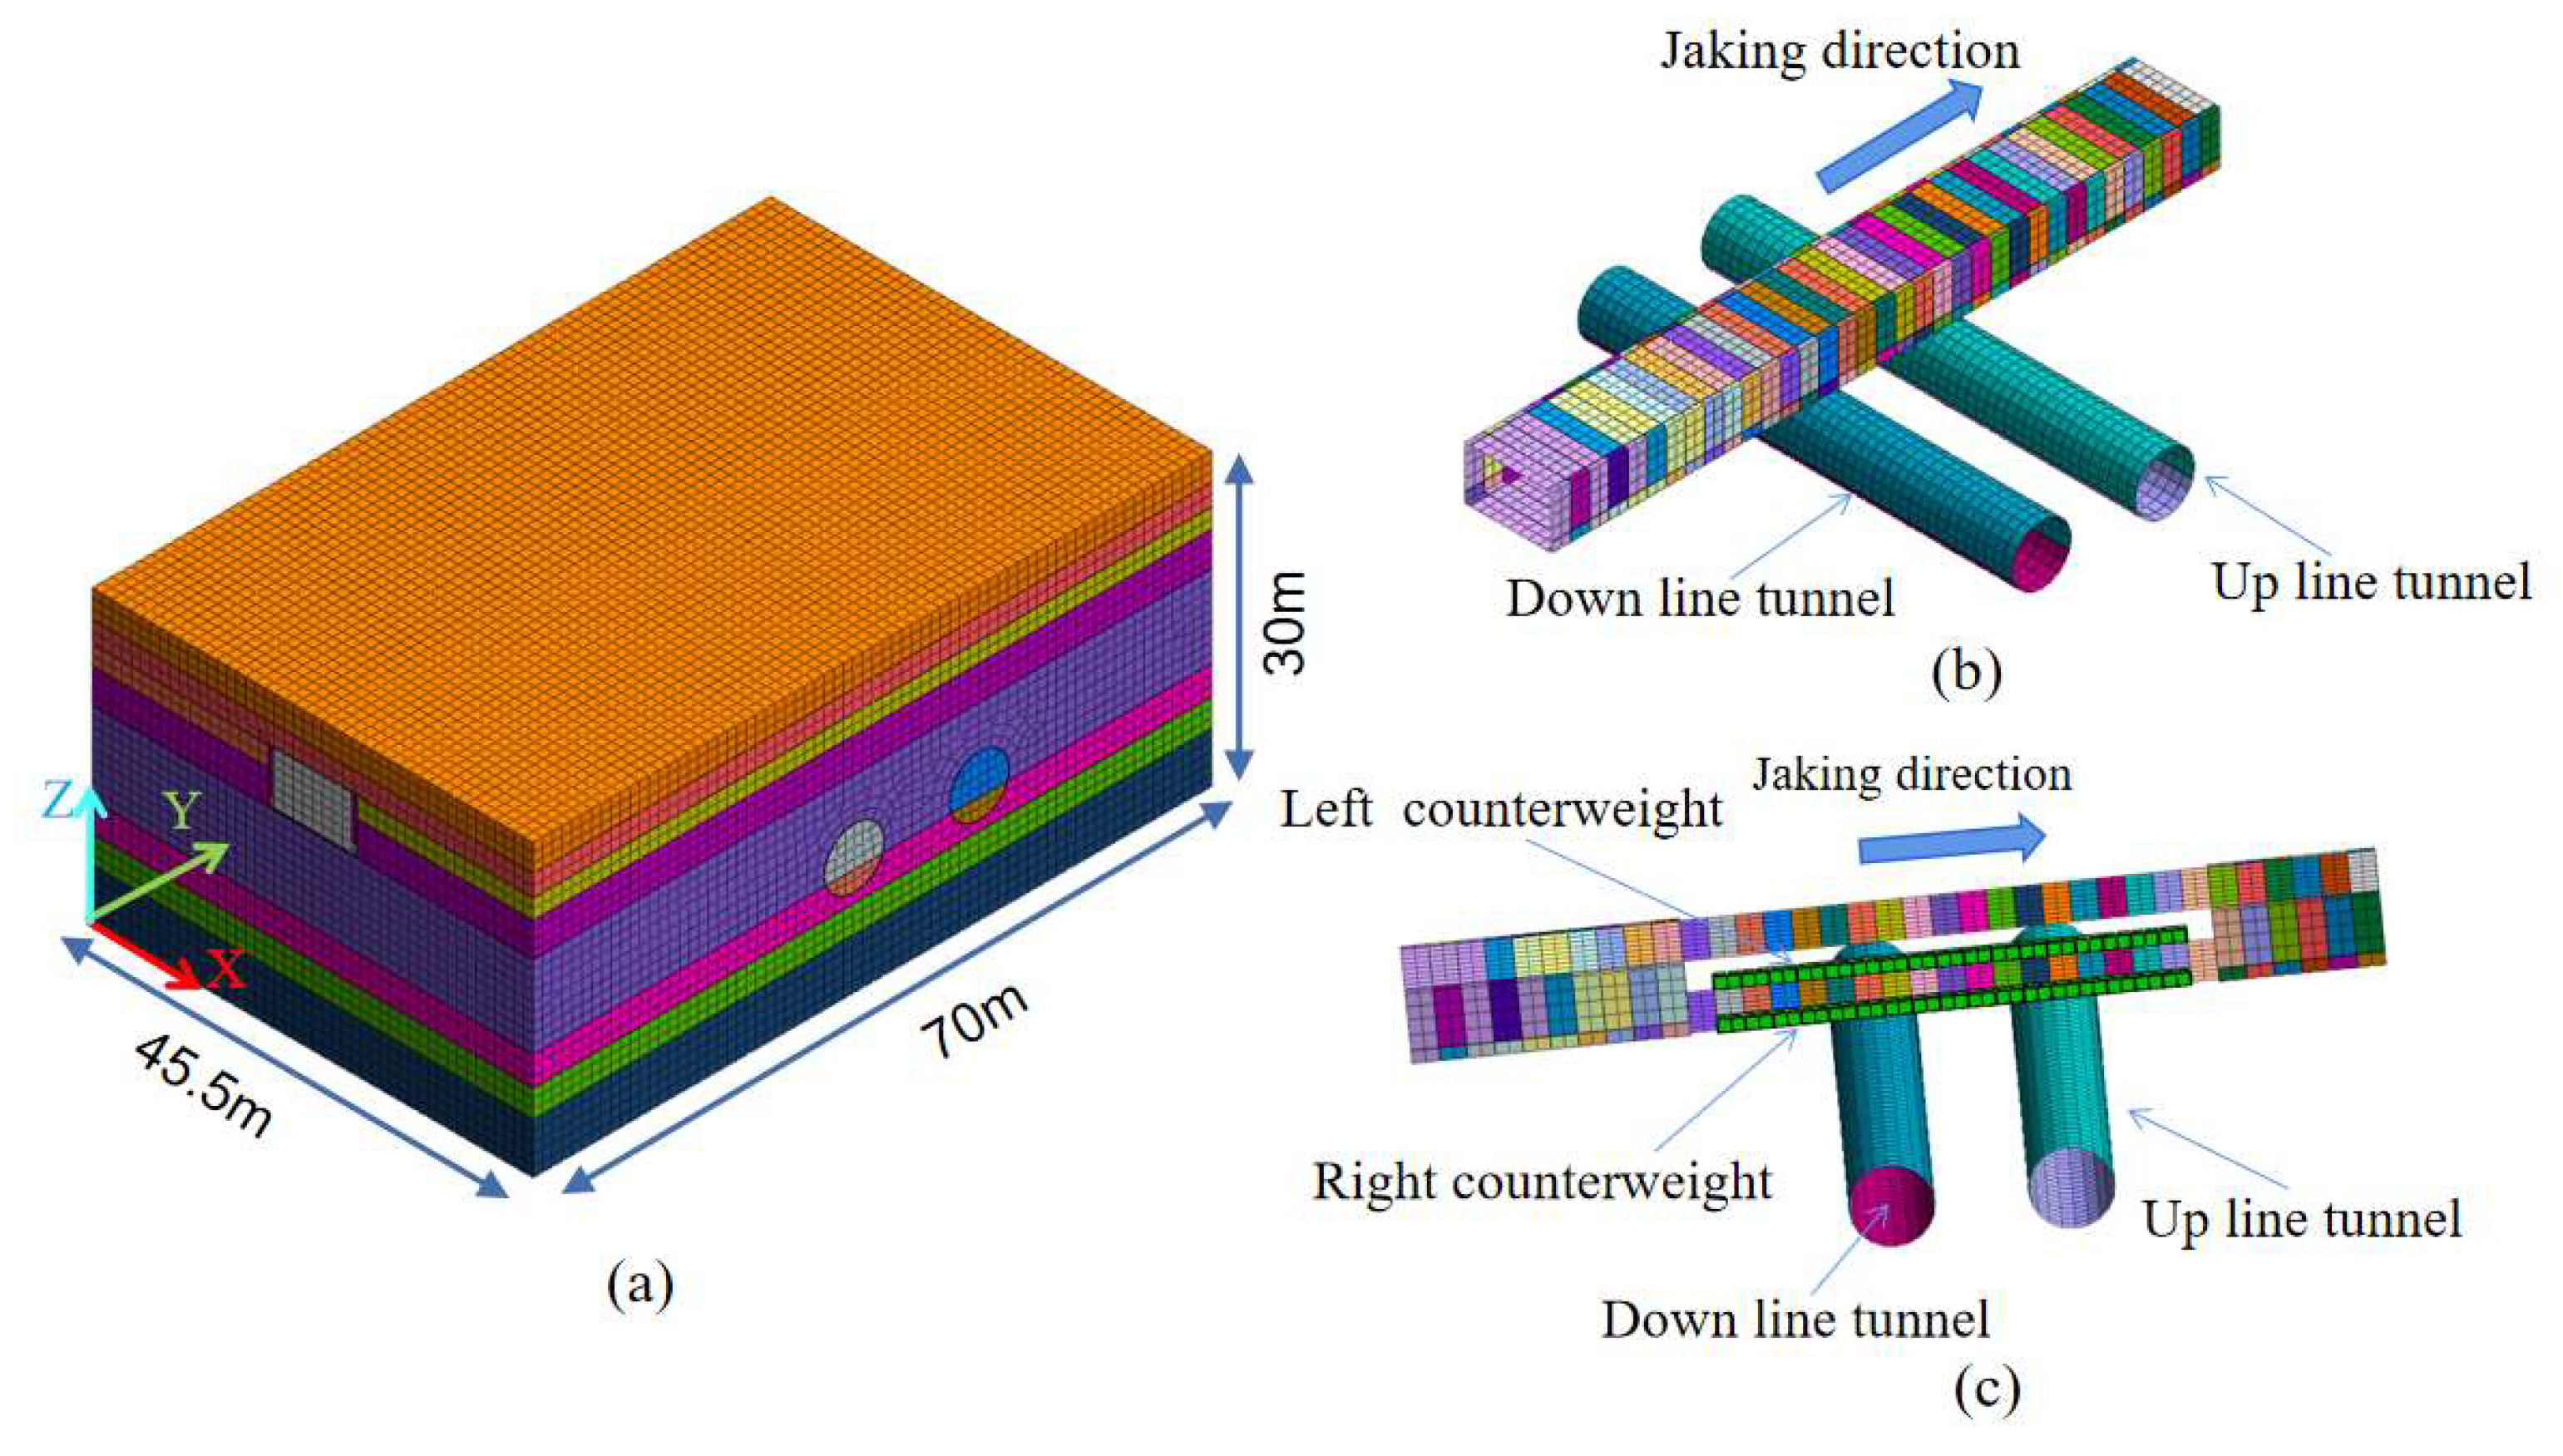
3.1. Numerical Model for the Case

A numerical model was developed using MIDAS GTS NX 2021 to simulate the spatial interaction between the pipe-jacking process and the existing subway tunnel. The work shafts and reception shafts were positioned at a sufficient distance from the subway tunnel (greater than two times the tunnel diameter), allowing their influence to be neglected. For conservative modeling, only the subway tunnel lining was considered. The model incorporated eight stratigraphic layers, derived from geological survey data, and had dimensions of 70 m × 45.5 m × 30 m (X × Y × Z), with the Y-axis representing the jacking direction. Soil behavior was modeled using the Mohr–Coulomb elastic–plastic constitutive model. To enhance convergence and accuracy, eight-node tetrahedral elements were used for meshing, resulting in a total of 102,485 nodes and 97,987 elements (Figure 4a). Normal displacement constraints were applied to all vertical boundaries and the base surface of the three-dimensional numerical model. The subway tunnel lining had a diameter of 6.2 m and a thickness of 0.5 m, while the pipe gallery section measured 9.1 m × 5.5 m, with a thickness of 0.6 m (Figure 4b). Anti-uplift counterweights, consisting of 36 cement blocks (2.1 tons/m), were placed at a depth of 8 m above the tunnel and removed after advancing 8 m beyond the lower tunnel. These blocks were distributed along tracks within the pipe gallery (Figure 4c).

3.2. Simulation Parameters

According to the relevant research [23,29] and on-site geological exploration data, the mechanical parameters of the strata and structure are shown in Table 1. The simulation accounted for face pressure, jack thrust, and grouting pressure, while excluding frictional forces between the jacking machine and the subsequent pipe segments. The jacking machine advanced 2 m per step, completing a total of 35 steps.

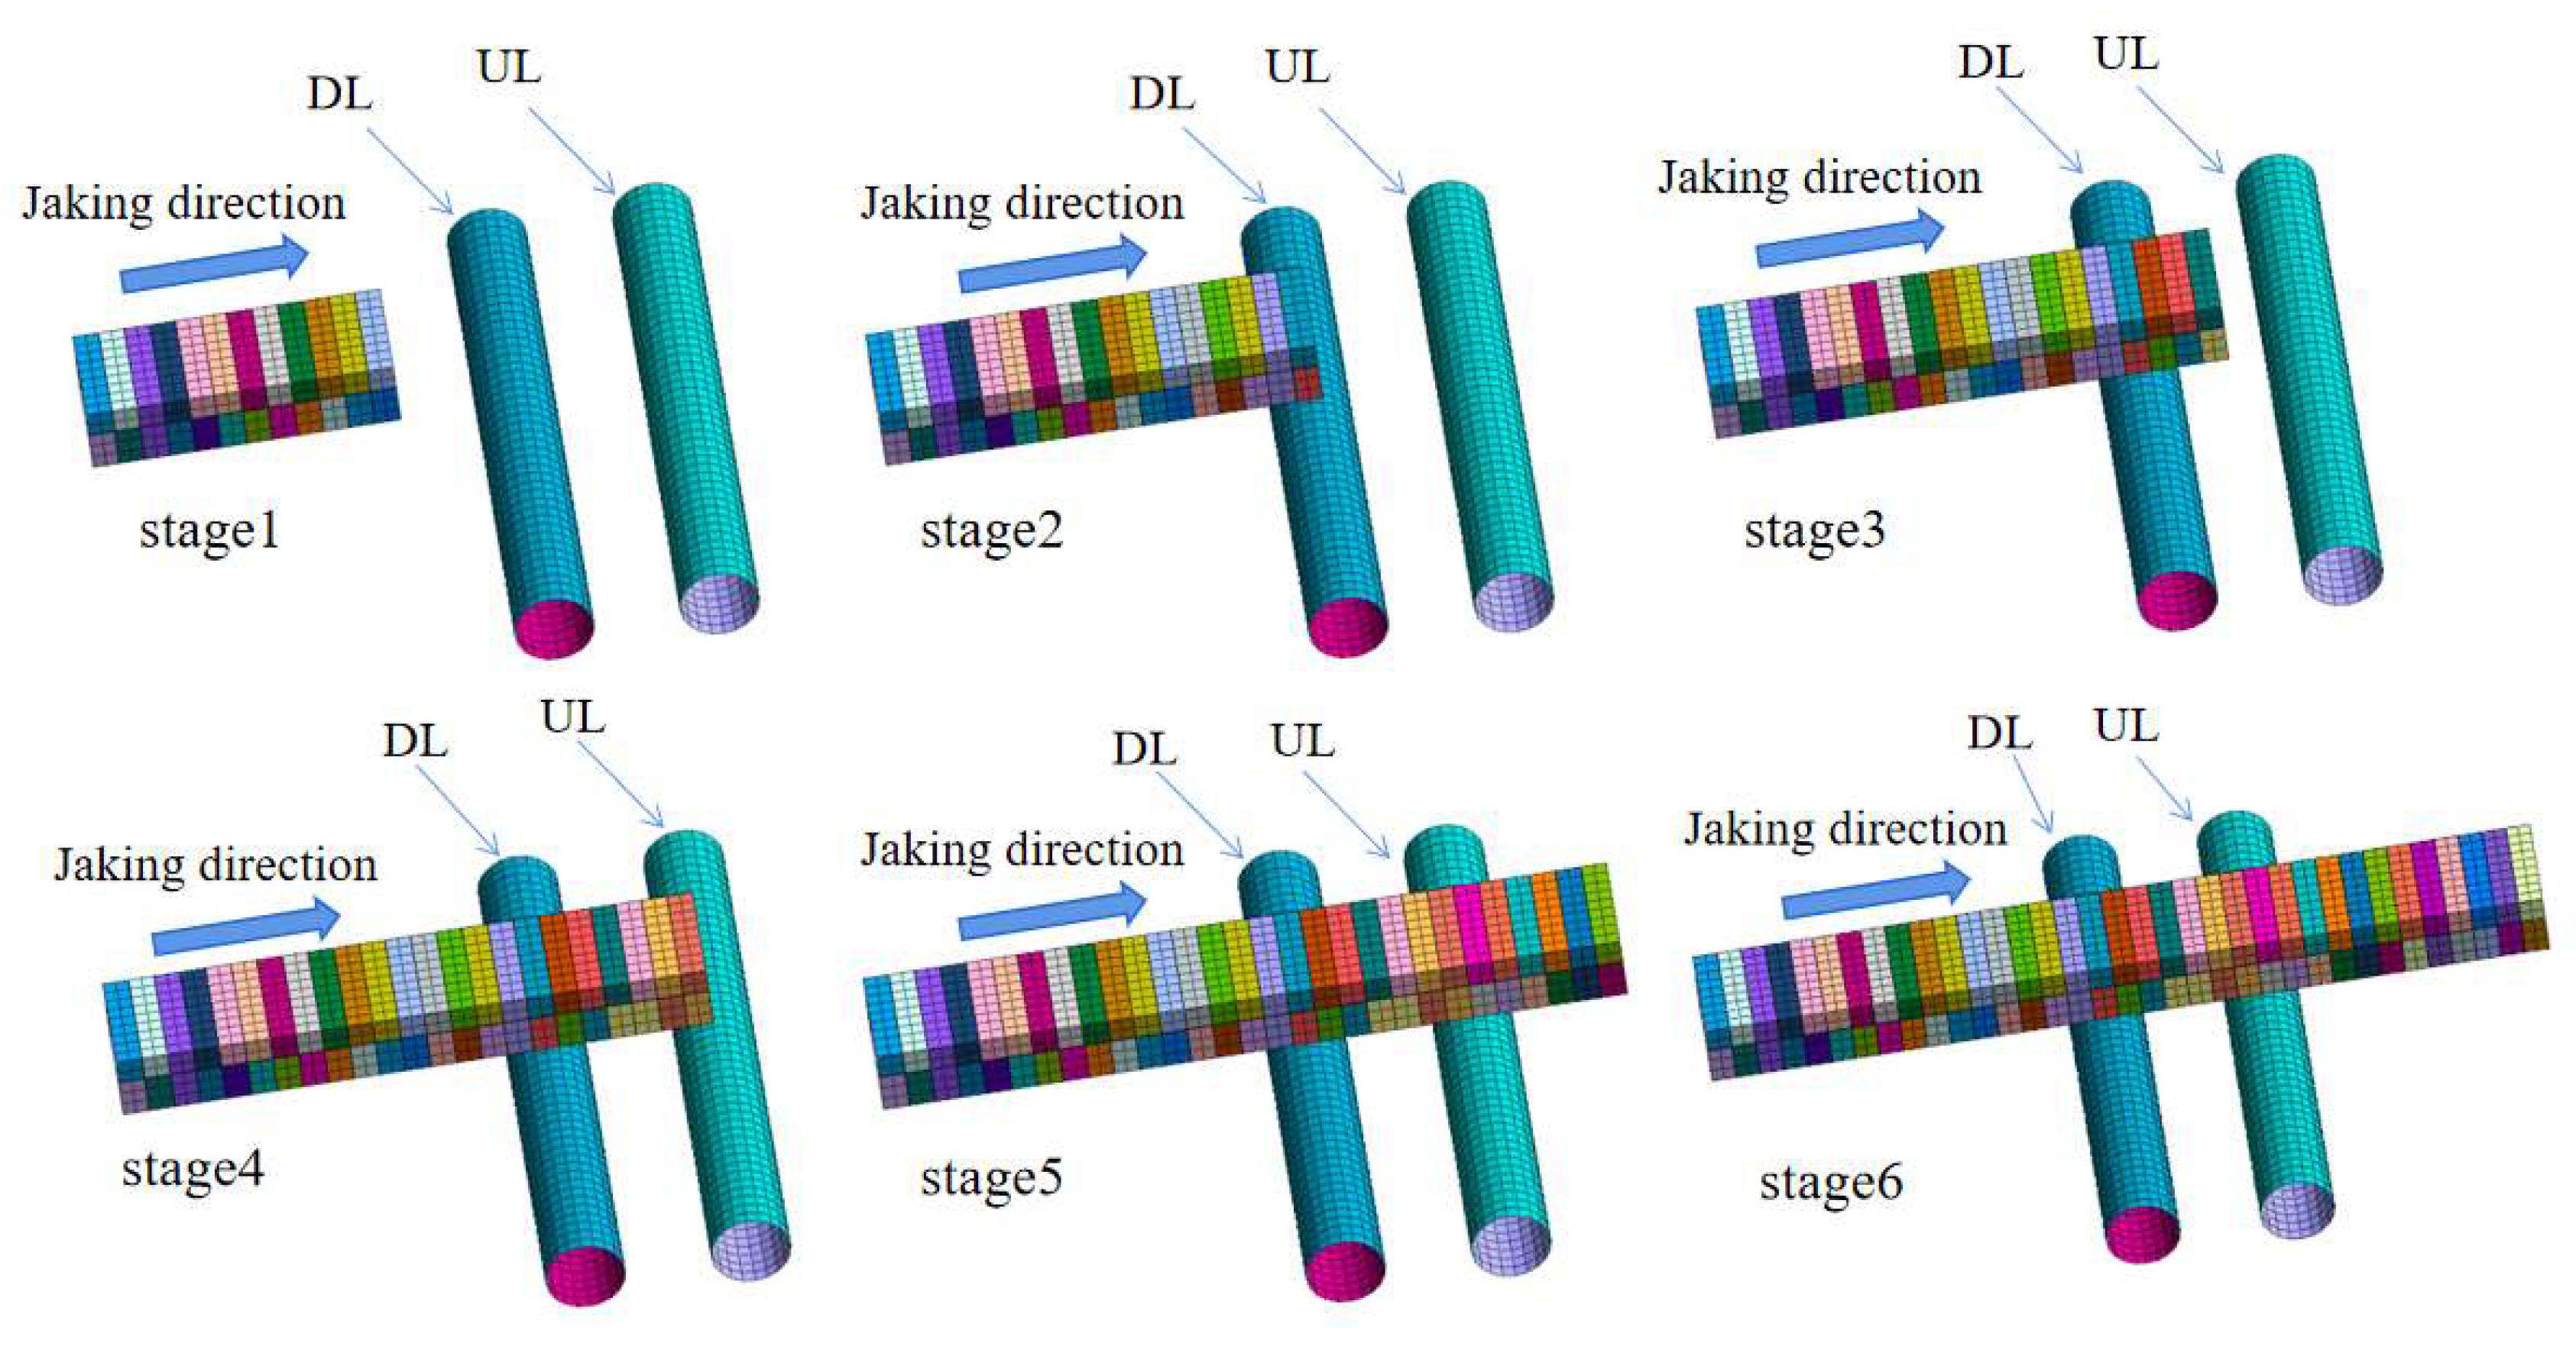
3.3. Simulation of the Jacking Process

The earth-pressure-balanced (EPB) shield-tunneling machine utilizes the pressure within the tunnel chamber to counterbalance the soil pressure at the excavation face and the water pressure. In numerical simulations, the effect of tunnel chamber pressure on the shield construction is represented by applying a uniform load at the excavation face, as illustrated in the schematic diagram of soil chamber pressure at the excavation face in Figure 5a. During construction, the tunnel chamber pressure is maintained between 1.2 and 1.8 bar to prevent insufficient chamber pressure, which could lead to soil and water loss at the tunnel crown. In the simulation, a thrust of 120 kN/m2 is applied at the tunnel face to replicate the thrust force exerted by the shield.
During tunneling, the shield is primarily advanced to the designated position by the jacking force from the starting shaft. Based on feedback from on-site test sections, the jacking speed is controlled to ensure that the maximum cutterhead torque does not exceed 600 kN·m. Accordingly, the jacking speed is maintained between 10 and 20 mm/min, with the total jacking force kept between 1900 kN and 2500 kN. The uniform load on each segment of the tunnel lining is approximately 100 kN/m. In the numerical model, the lining segments are represented as 2D elements, with a jacking force of 100 kN/m applied, as shown in Figure 5b.
Throughout the tunneling process, slurry is continuously injected around the lining to support the deformation of the surrounding soil and reduce frictional resistance during the jacking operation. This is modeled by applying a uniform load in the normal direction to the external circumference of the lining, simulating the grouting pressure, with a reference grouting pressure of 100 kN/m2, as depicted in the schematic diagram of grouting pressure in Figure 5c.

3.4. Construction Analysis Stage

To investigate the impact of pipe jacking on the deformation of the existing subway tunnel, the construction process was divided into six stages (Figure 6). In Stage 1, the pipe-jacking machine advanced to within 6 m of the DL tunnel. In Stage 2, the machine reached the axis of the DL tunnel. In Stage 3, the machine was positioned at the midpoint between the two tunnels. In Stage 4, the machine reached the axis of the UL tunnel. In Stage 5, the pipe jacking completely crossed the UL tunnel. Finally, in Stage 6, excavation was completed. During each stage, the vertical and lateral displacements, as well as the bending moments of the subway tunnel lining, were analyzed to assess the effects of the construction process on the tunnel.

4. Numerical Simulation Results

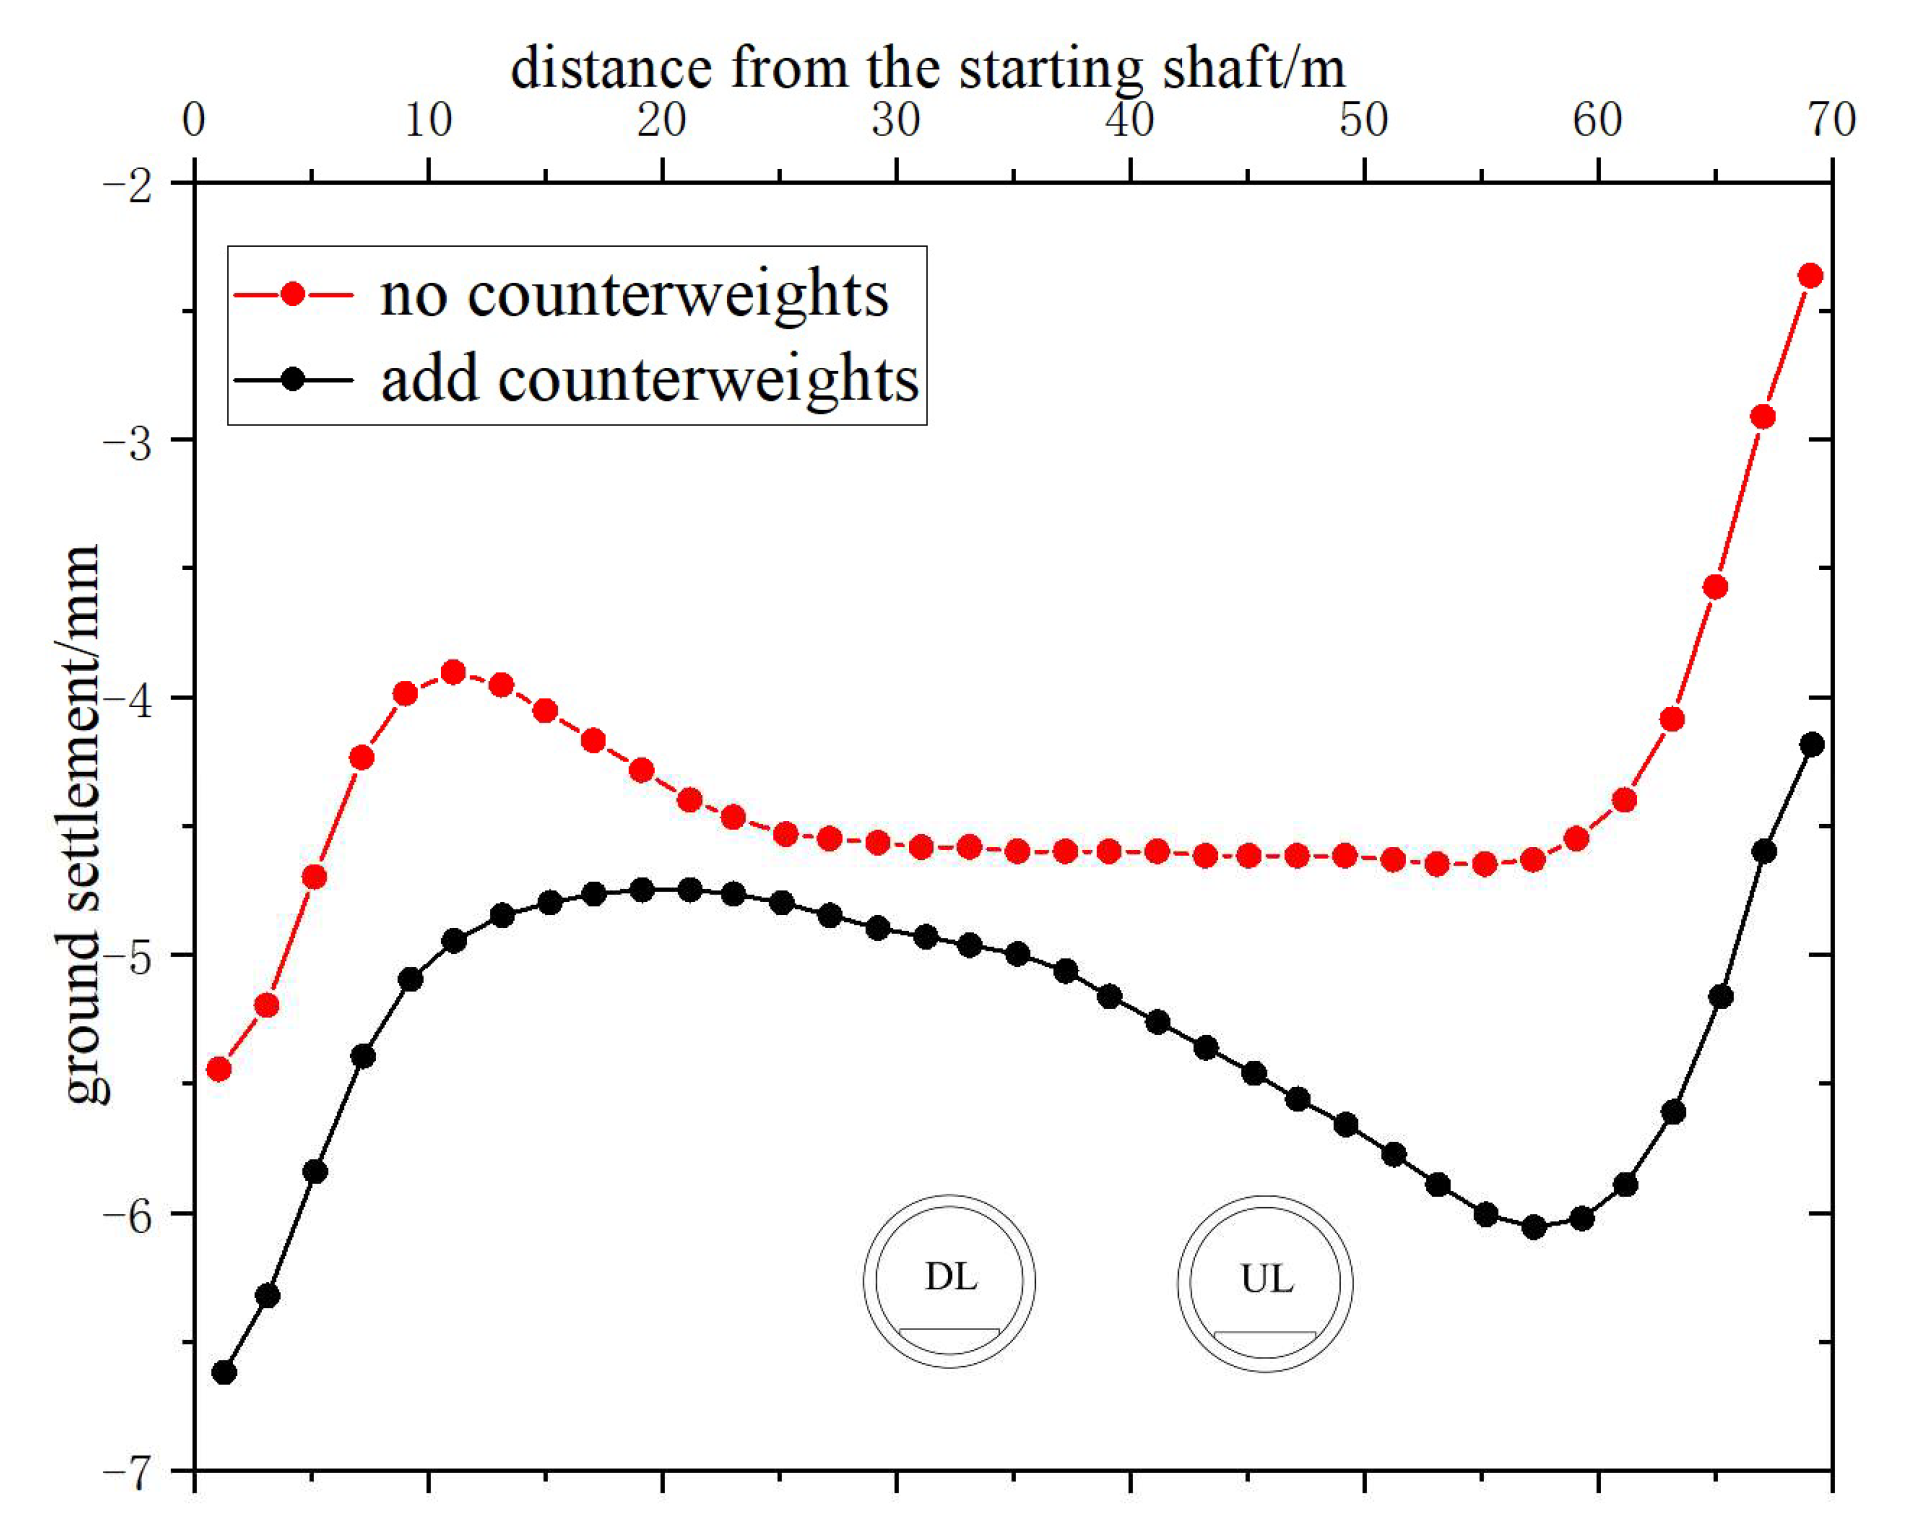
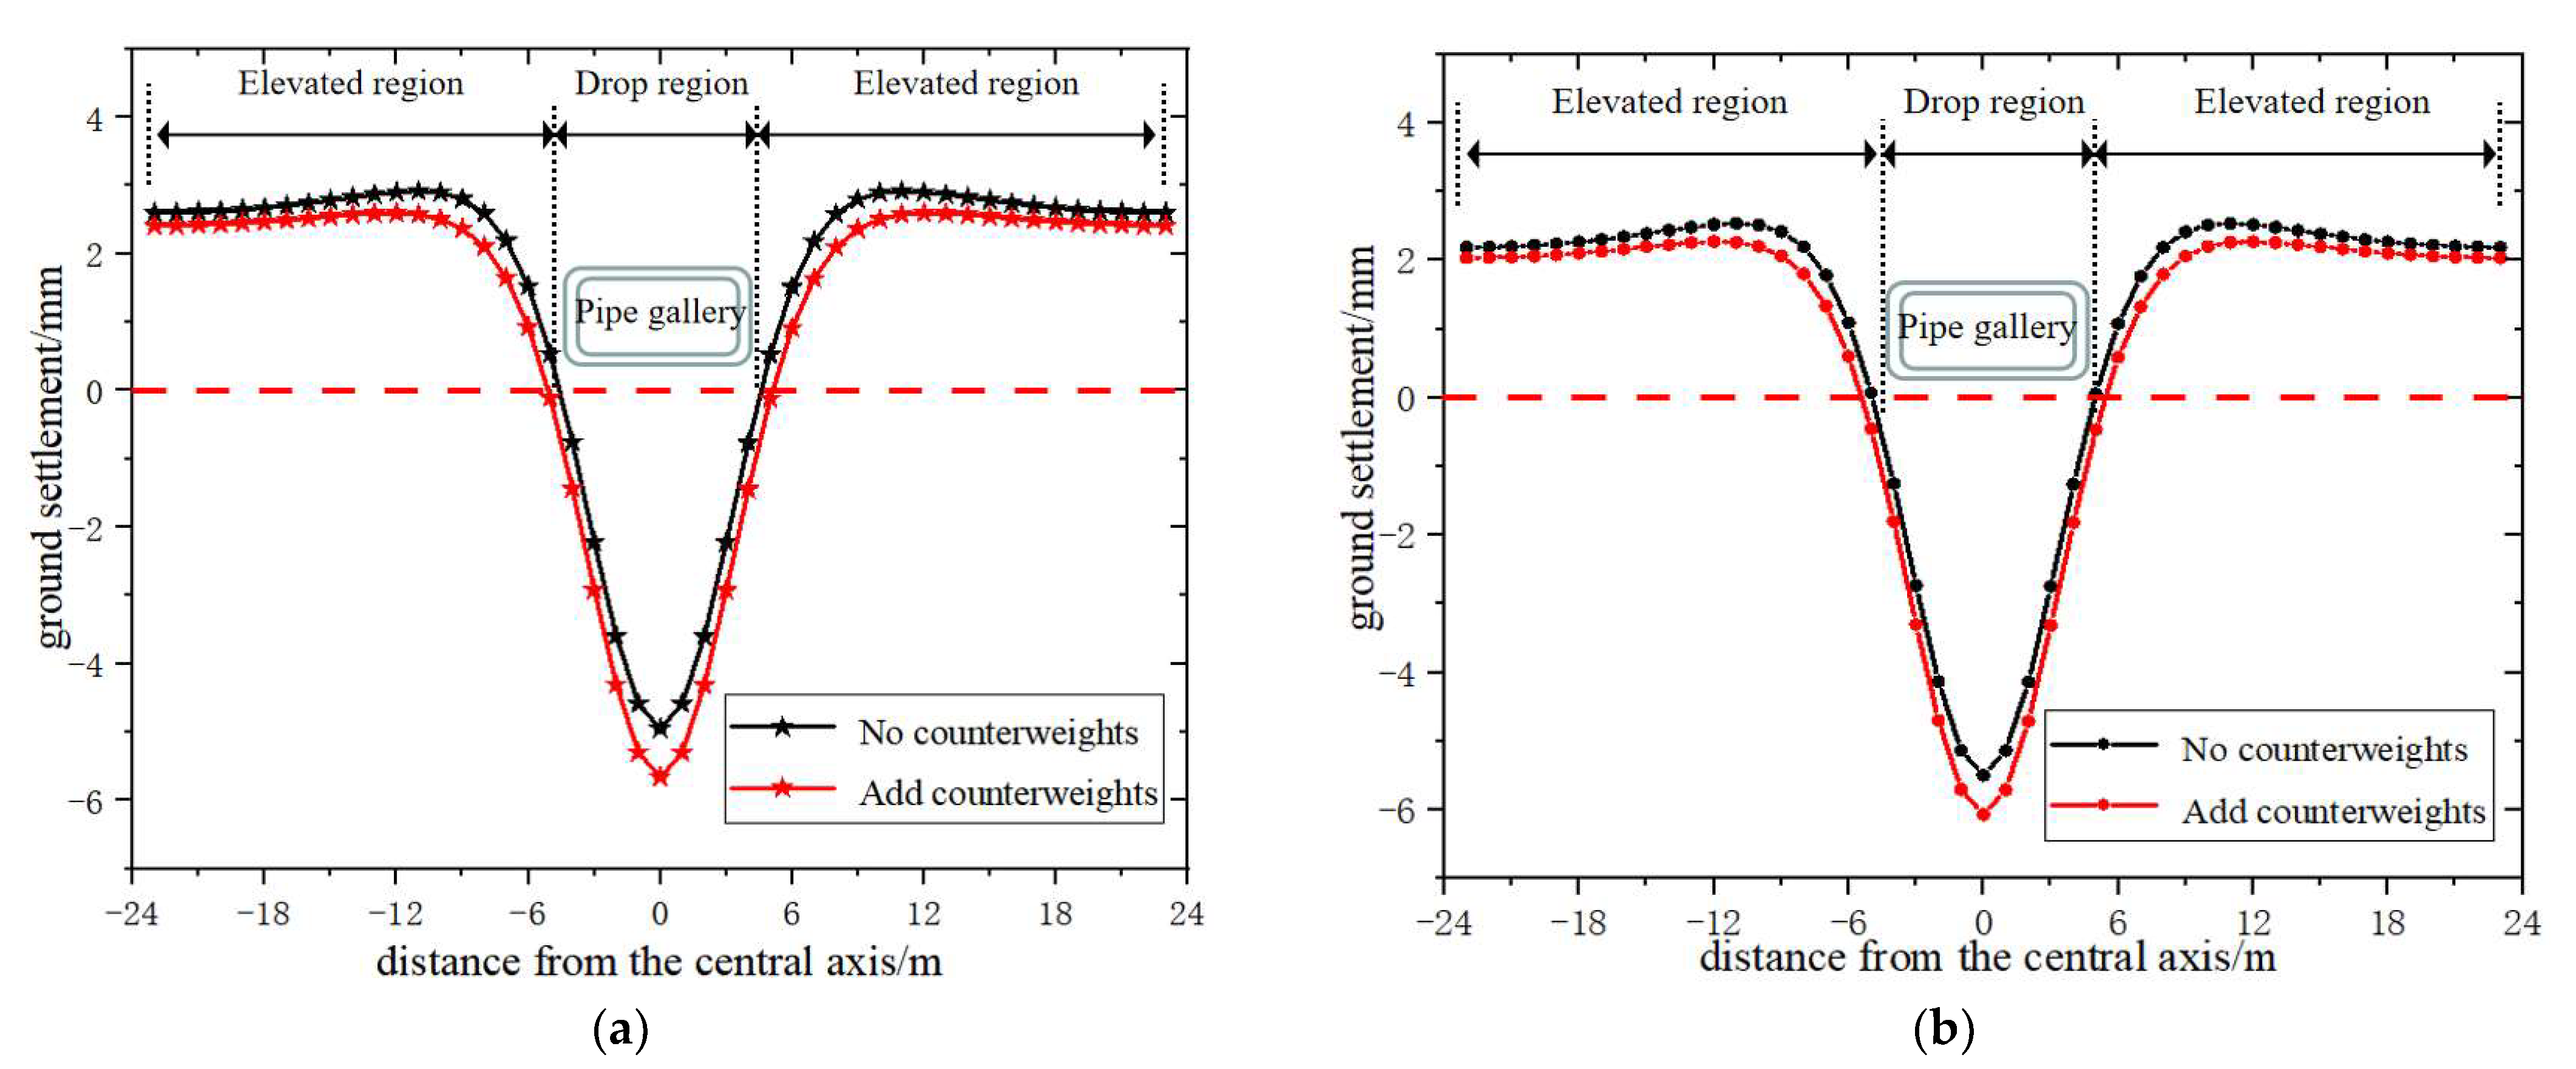
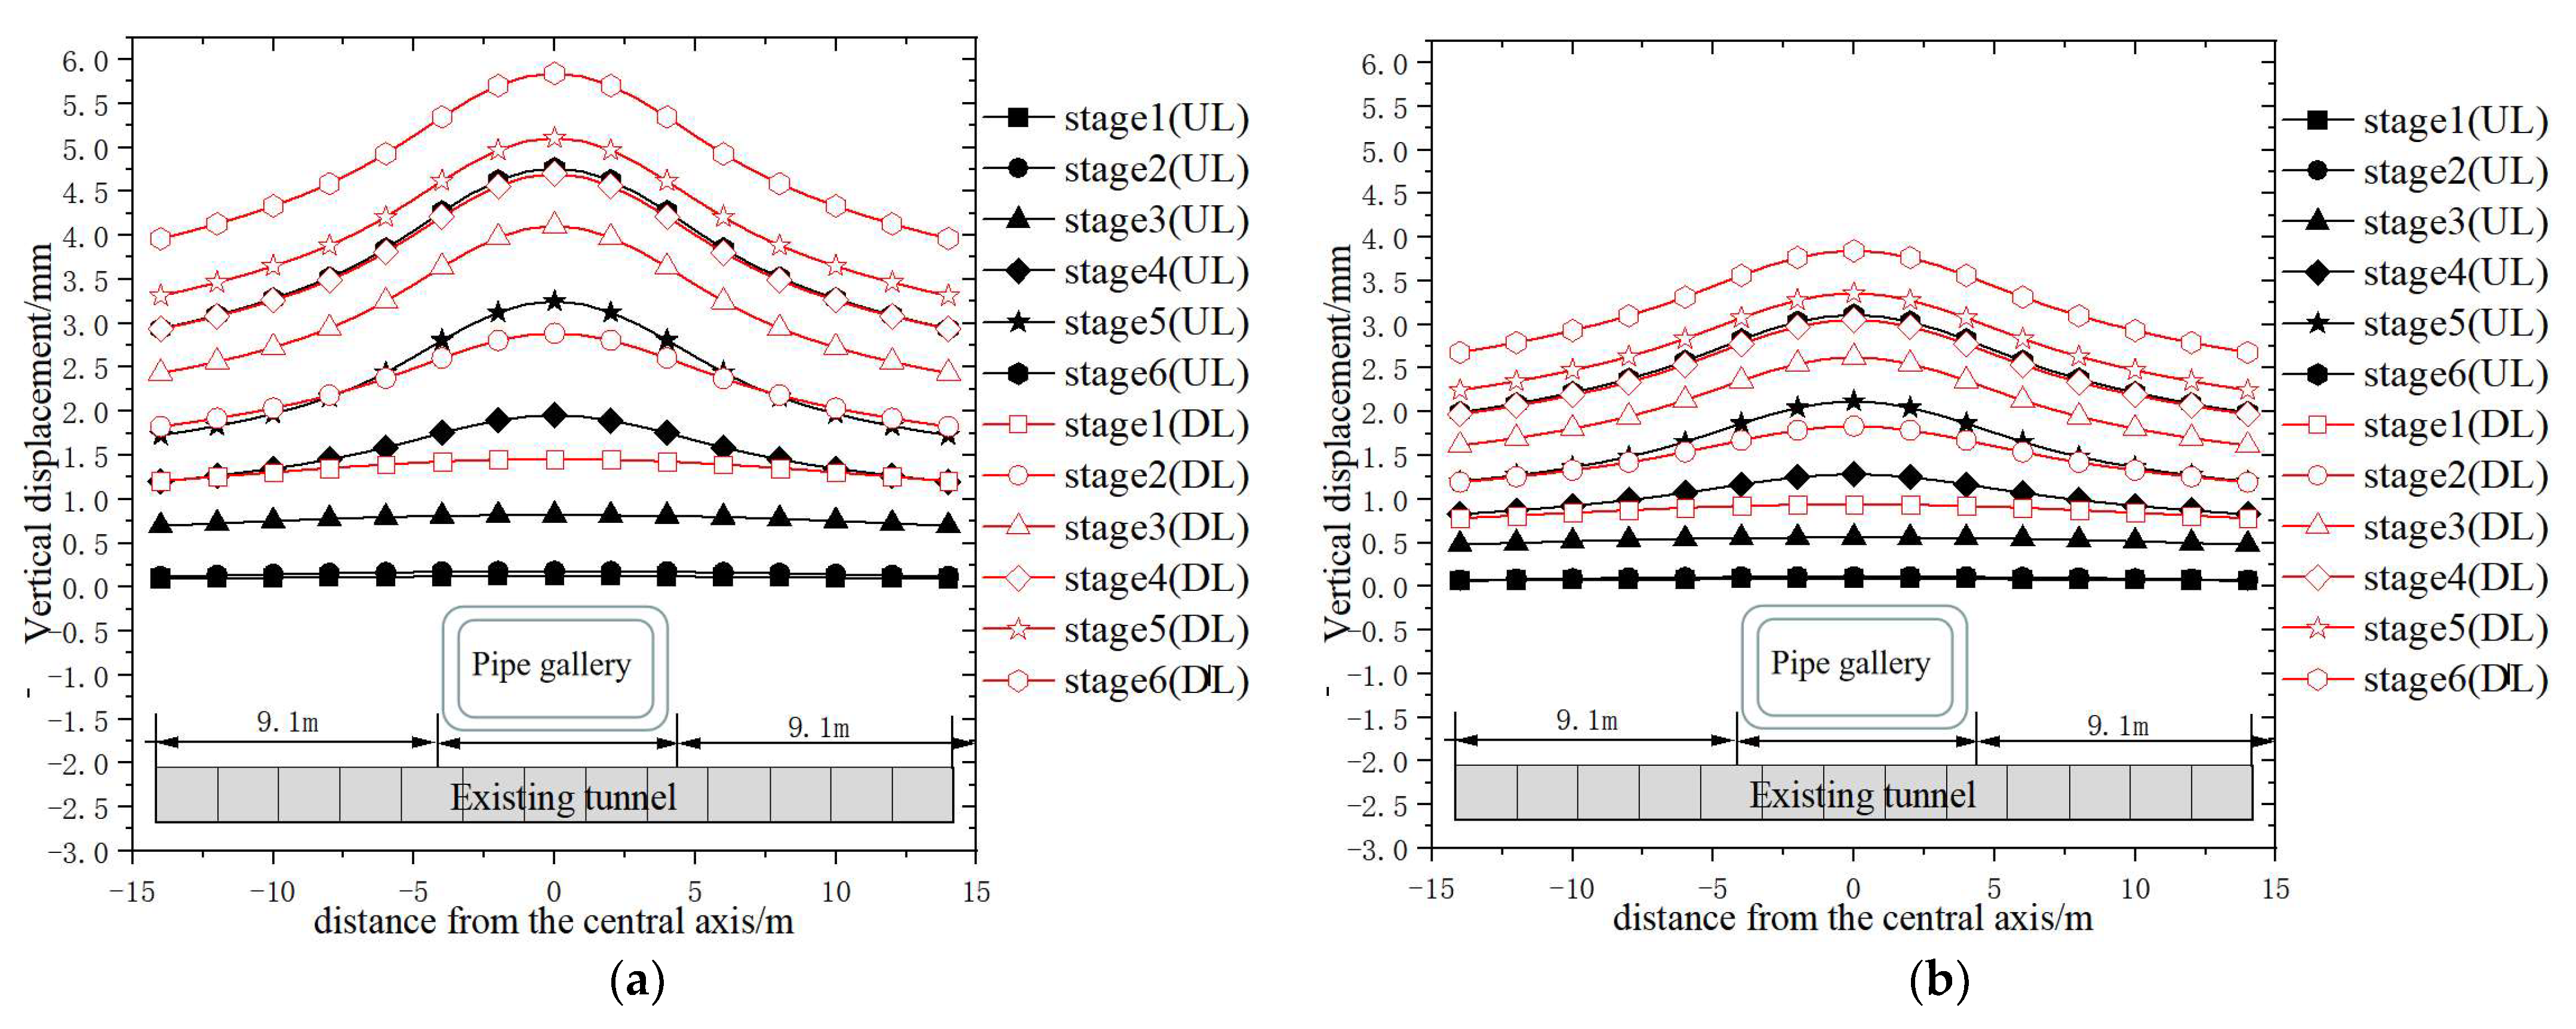
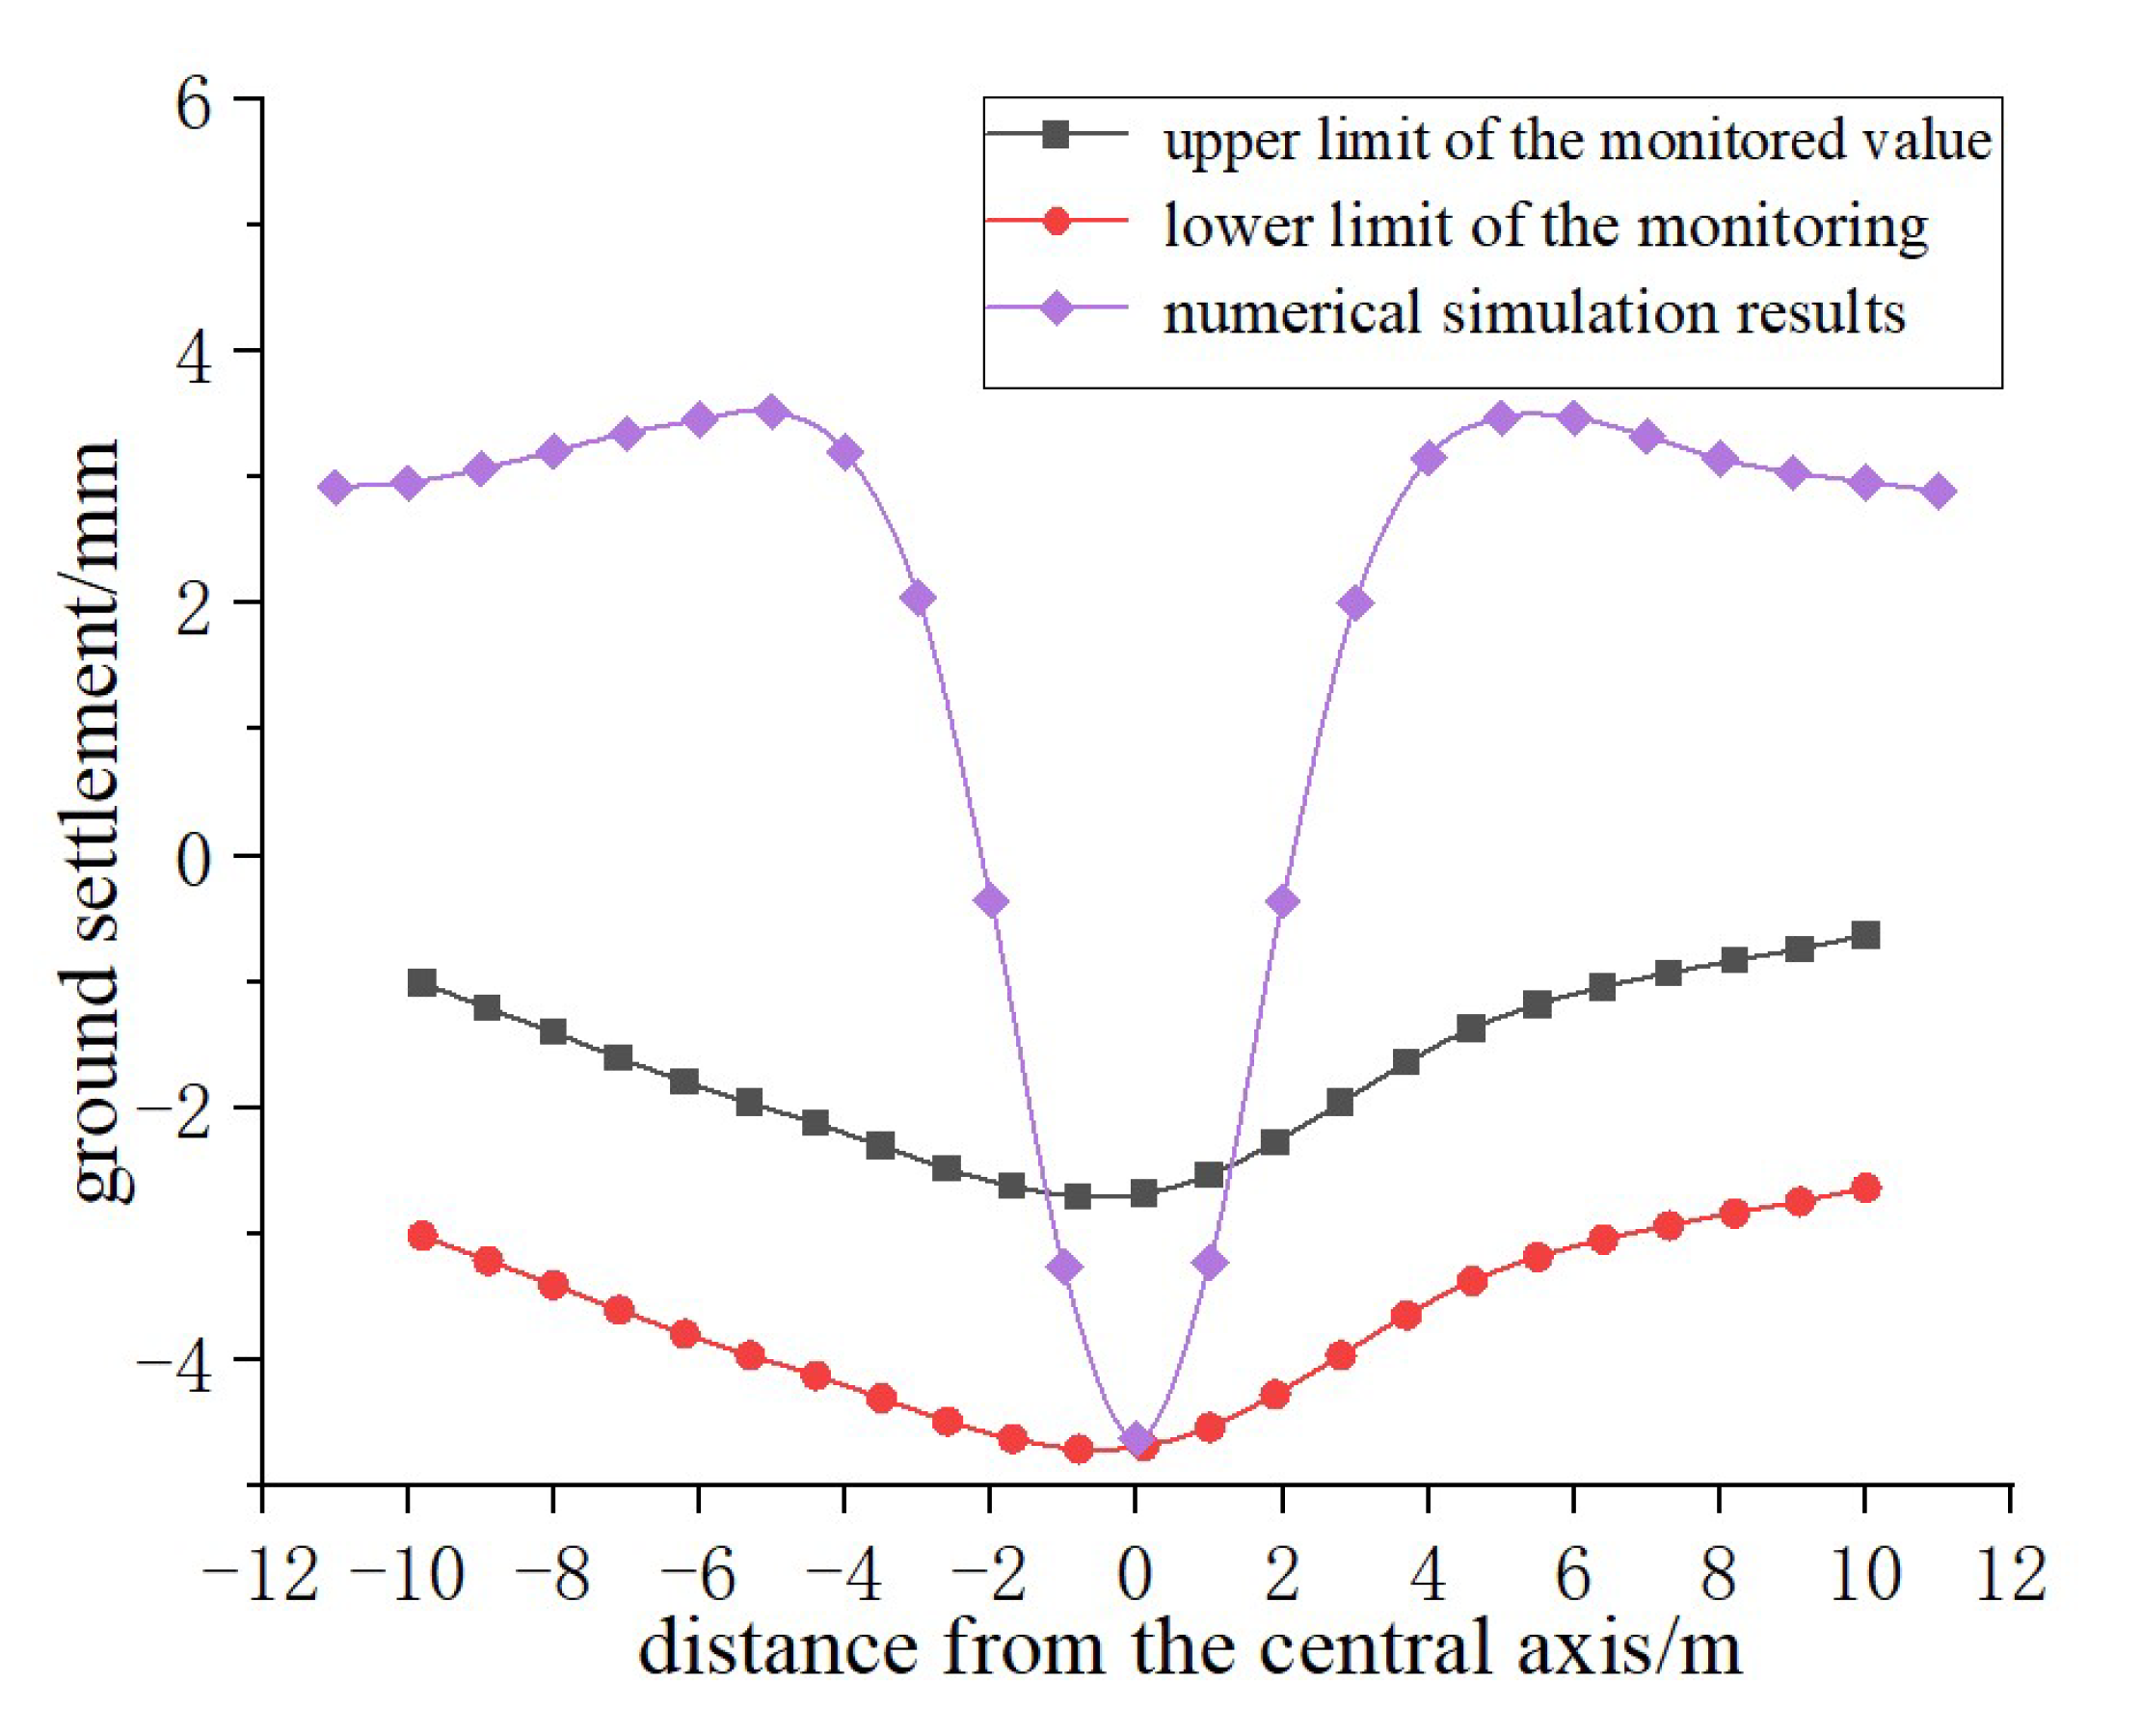
4.1. Ground Settlement

Figure 7 presents the surface settlement curve above the tunnel axis following the completion of the pipe-jacking operation. As depicted, the surface exhibits an overall settlement trend, with the displacement curve displaying an S-shape. The addition of counterweights results in increased surface settlement, with an additional settlement of 0.5 mm and 1 mm at the DL and UL locations, respectively. The surface settlement is more pronounced near the launch shaft and gradually decreases with distance from it. In the absence of counterweights, the surface settlement above the tunnel stabilizes; however, with counterweights, the surface settlement exhibits a progressively increasing trend. After reaching the maximum settlement, the surface displacement gradually decreases as construction progresses toward the shaft.
Figure 8 illustrates the surface settlement troughs at the UL and DL positions following the completion of the pipe-jacking operation. The surface deformation induced by the tunneling process consists of both uplifted and subsided areas. The subsidence region is primarily attributed to ground loss during tunnel construction, with its width approximately equal to the width of the jacking pipe. The addition of counterweights leads to an increase in both the width of the settlement trough and the maximum settlement. Specifically, with the inclusion of counterweights, the maximum surface settlement at the DL position increases from 5.51 mm to 6.02 mm, while at the UL position, it rises from 4.91 mm to 5.91 mm. These results align with the requirements outlined in the “Jacking Pipe Construction Technical Code”, which specifies that the maximum settlement in sensitive areas (e.g., busy urban zones, railways, underground pipelines) should not exceed 5–10 mm.

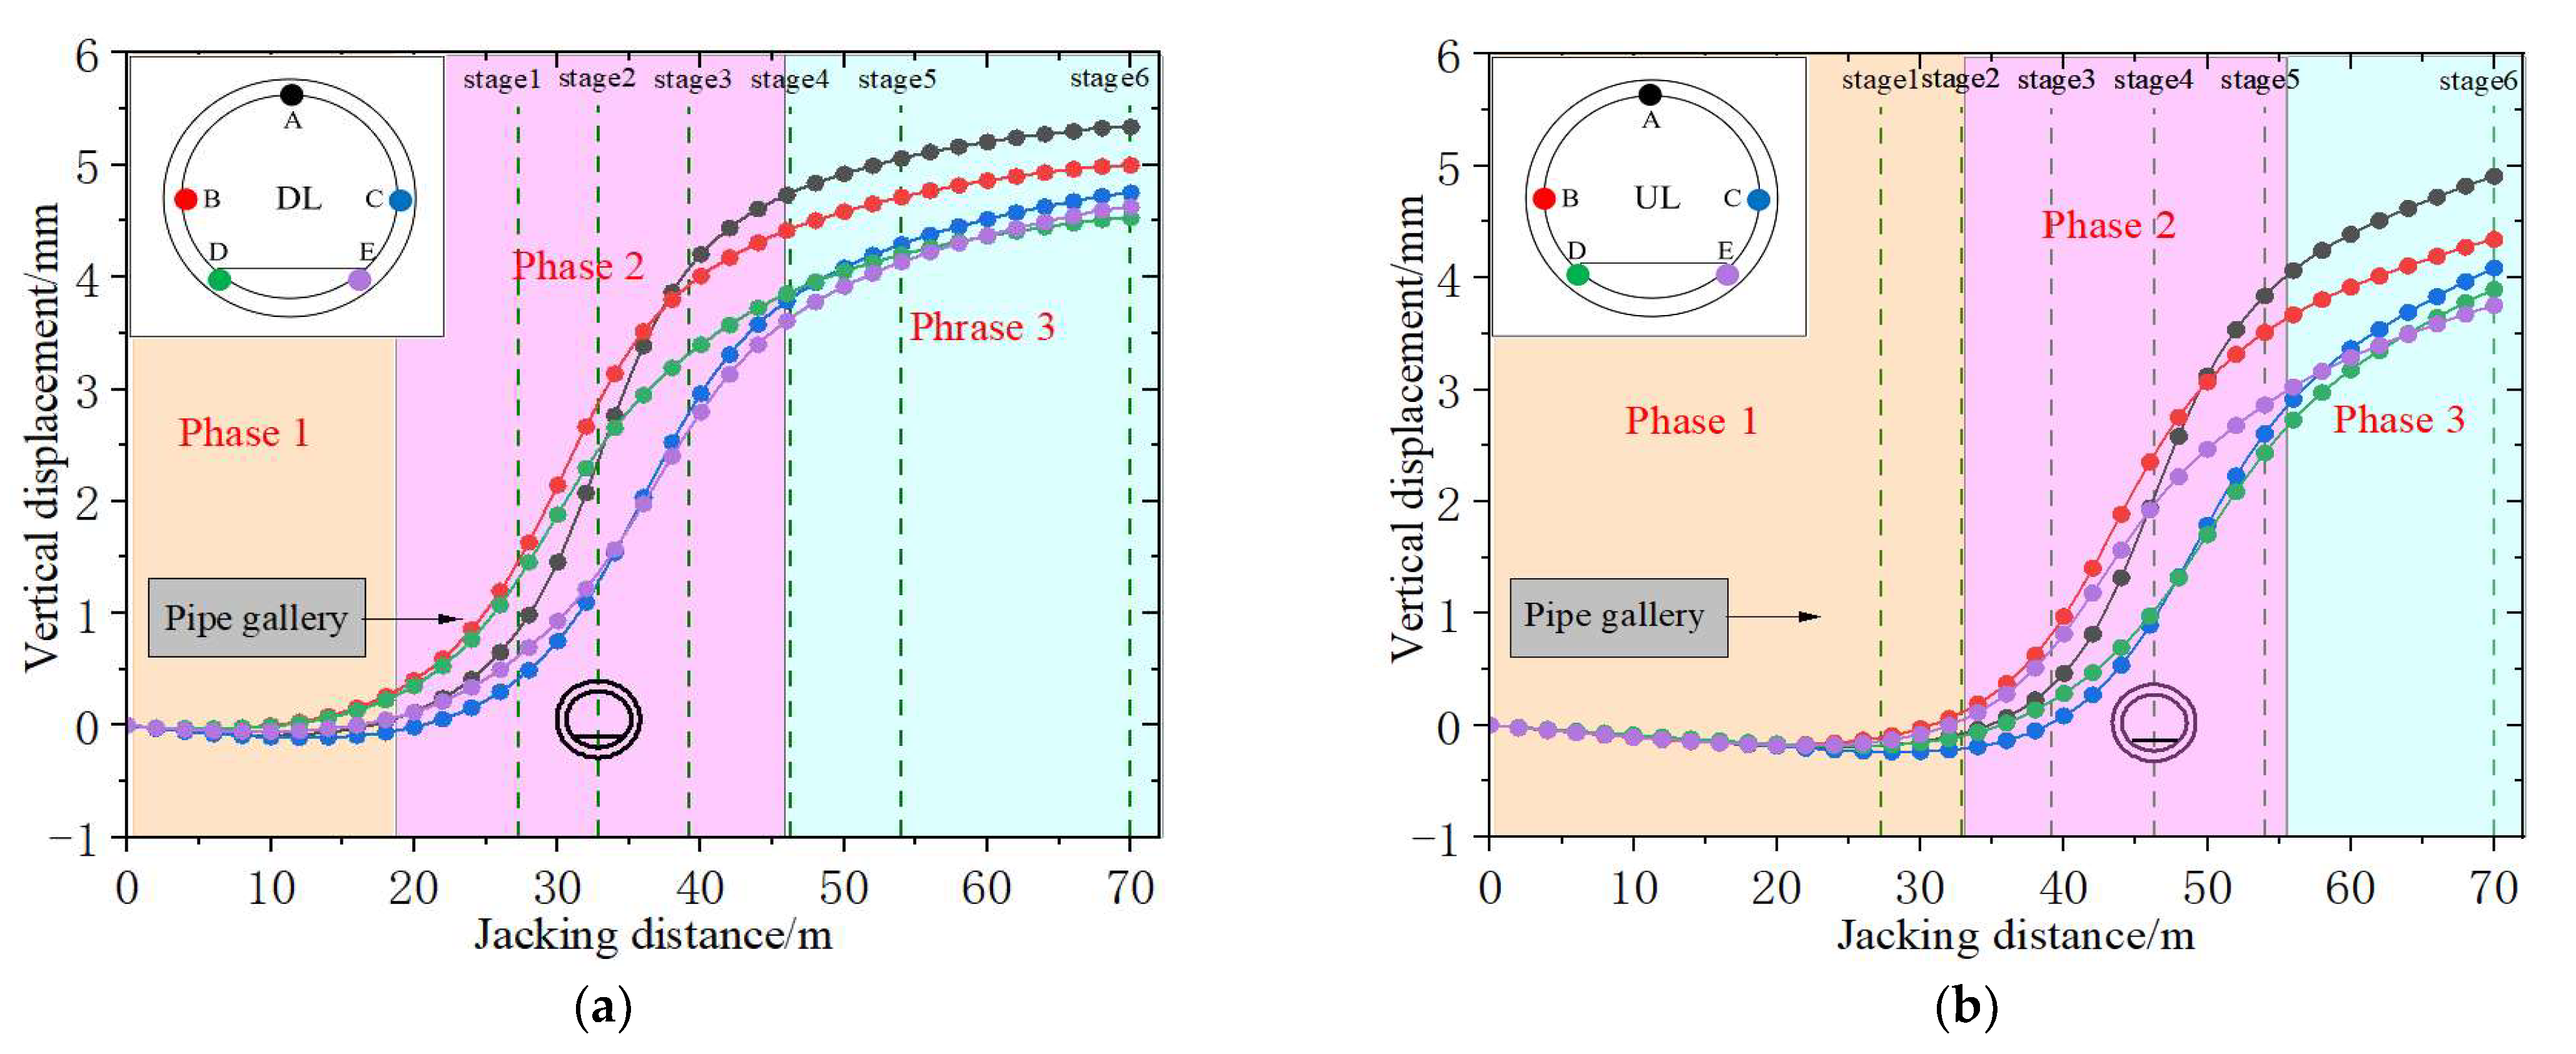
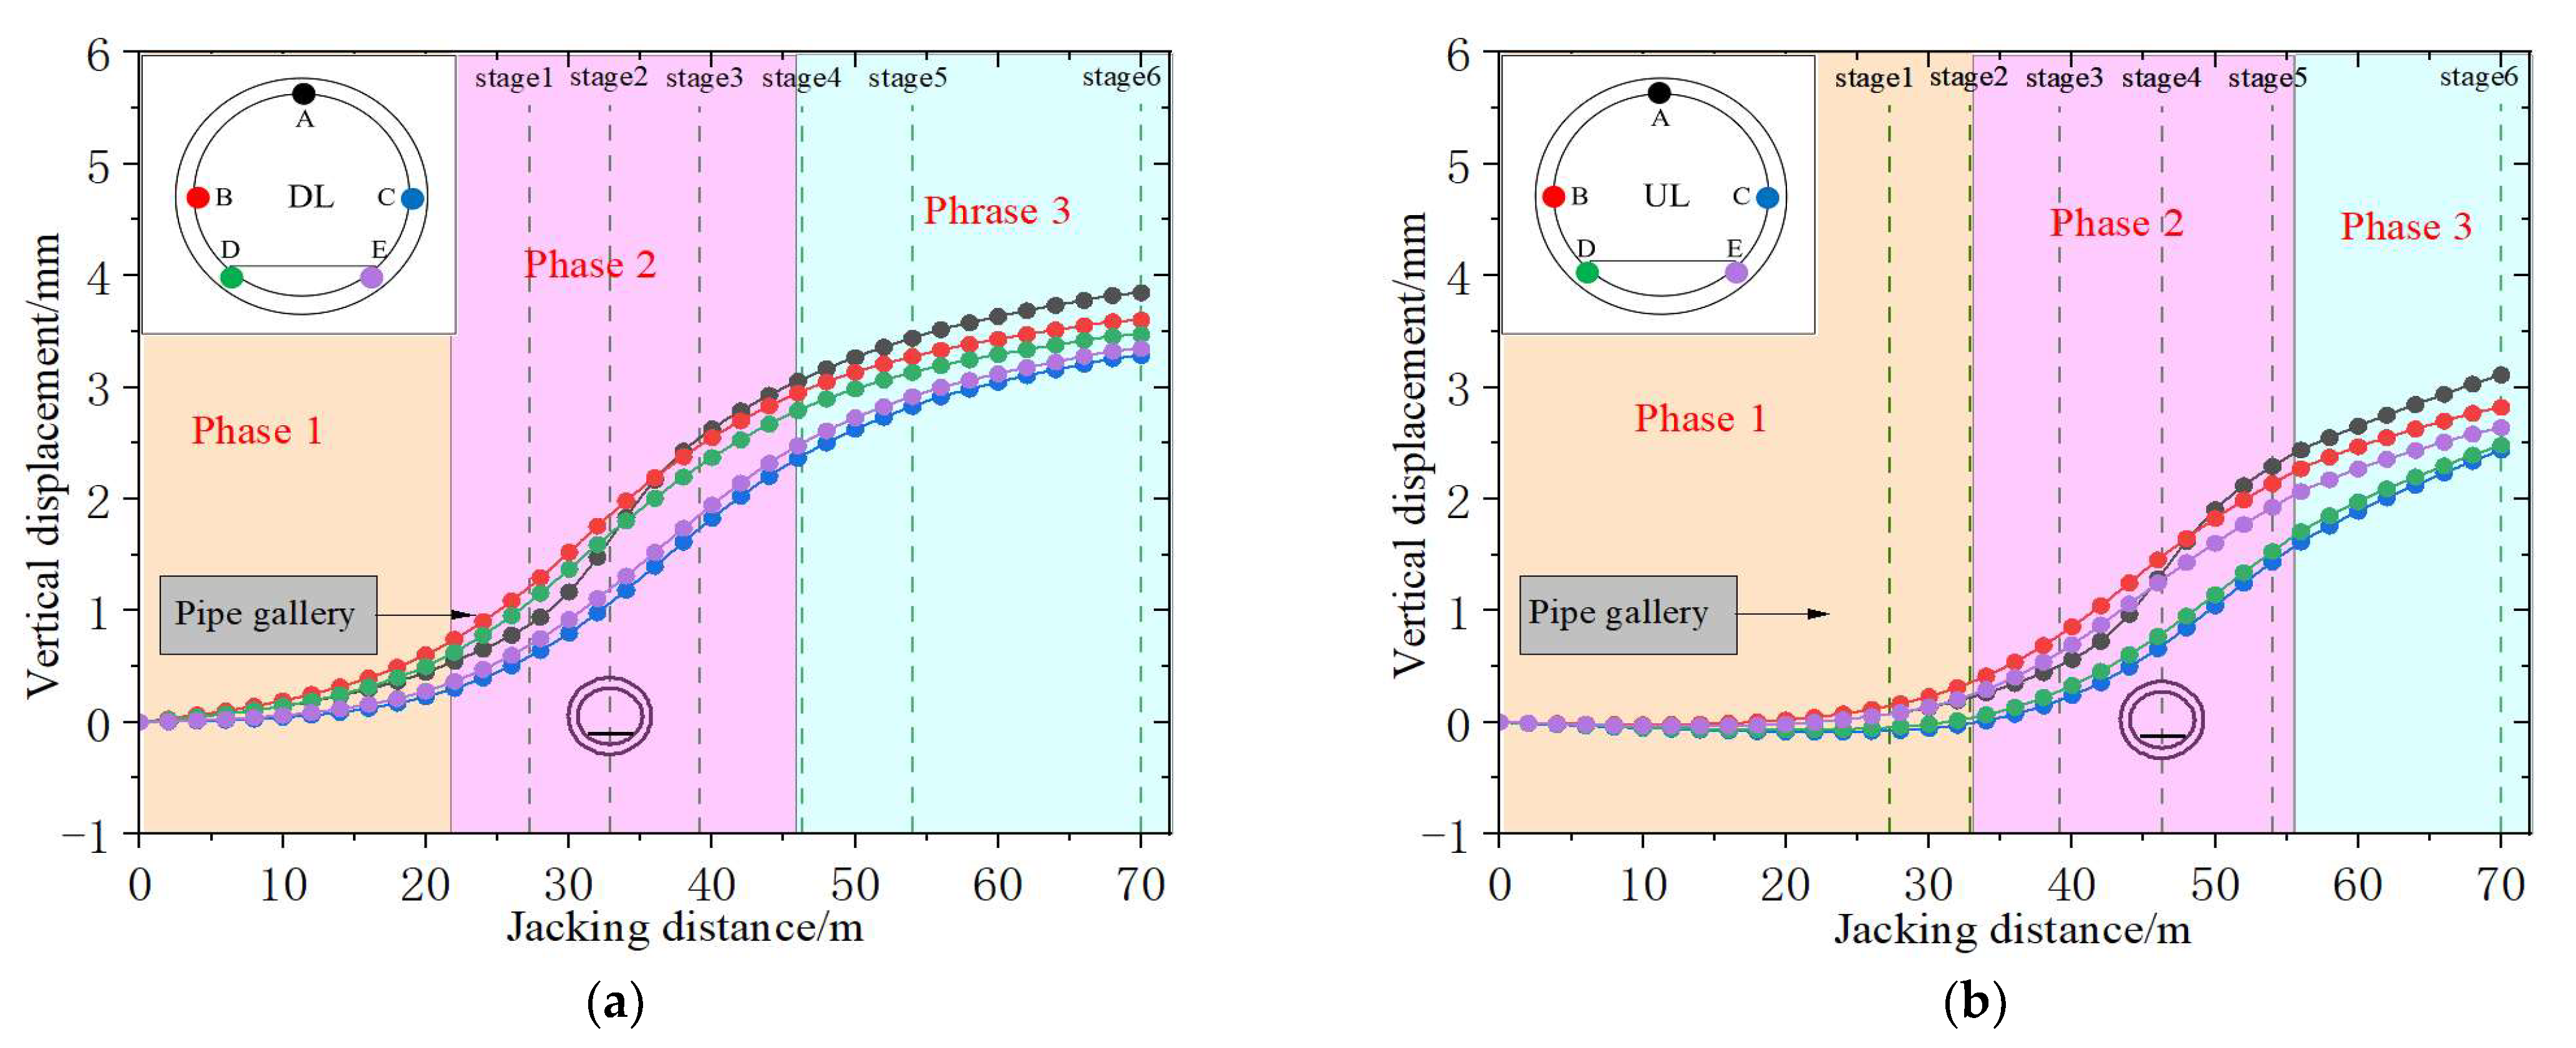
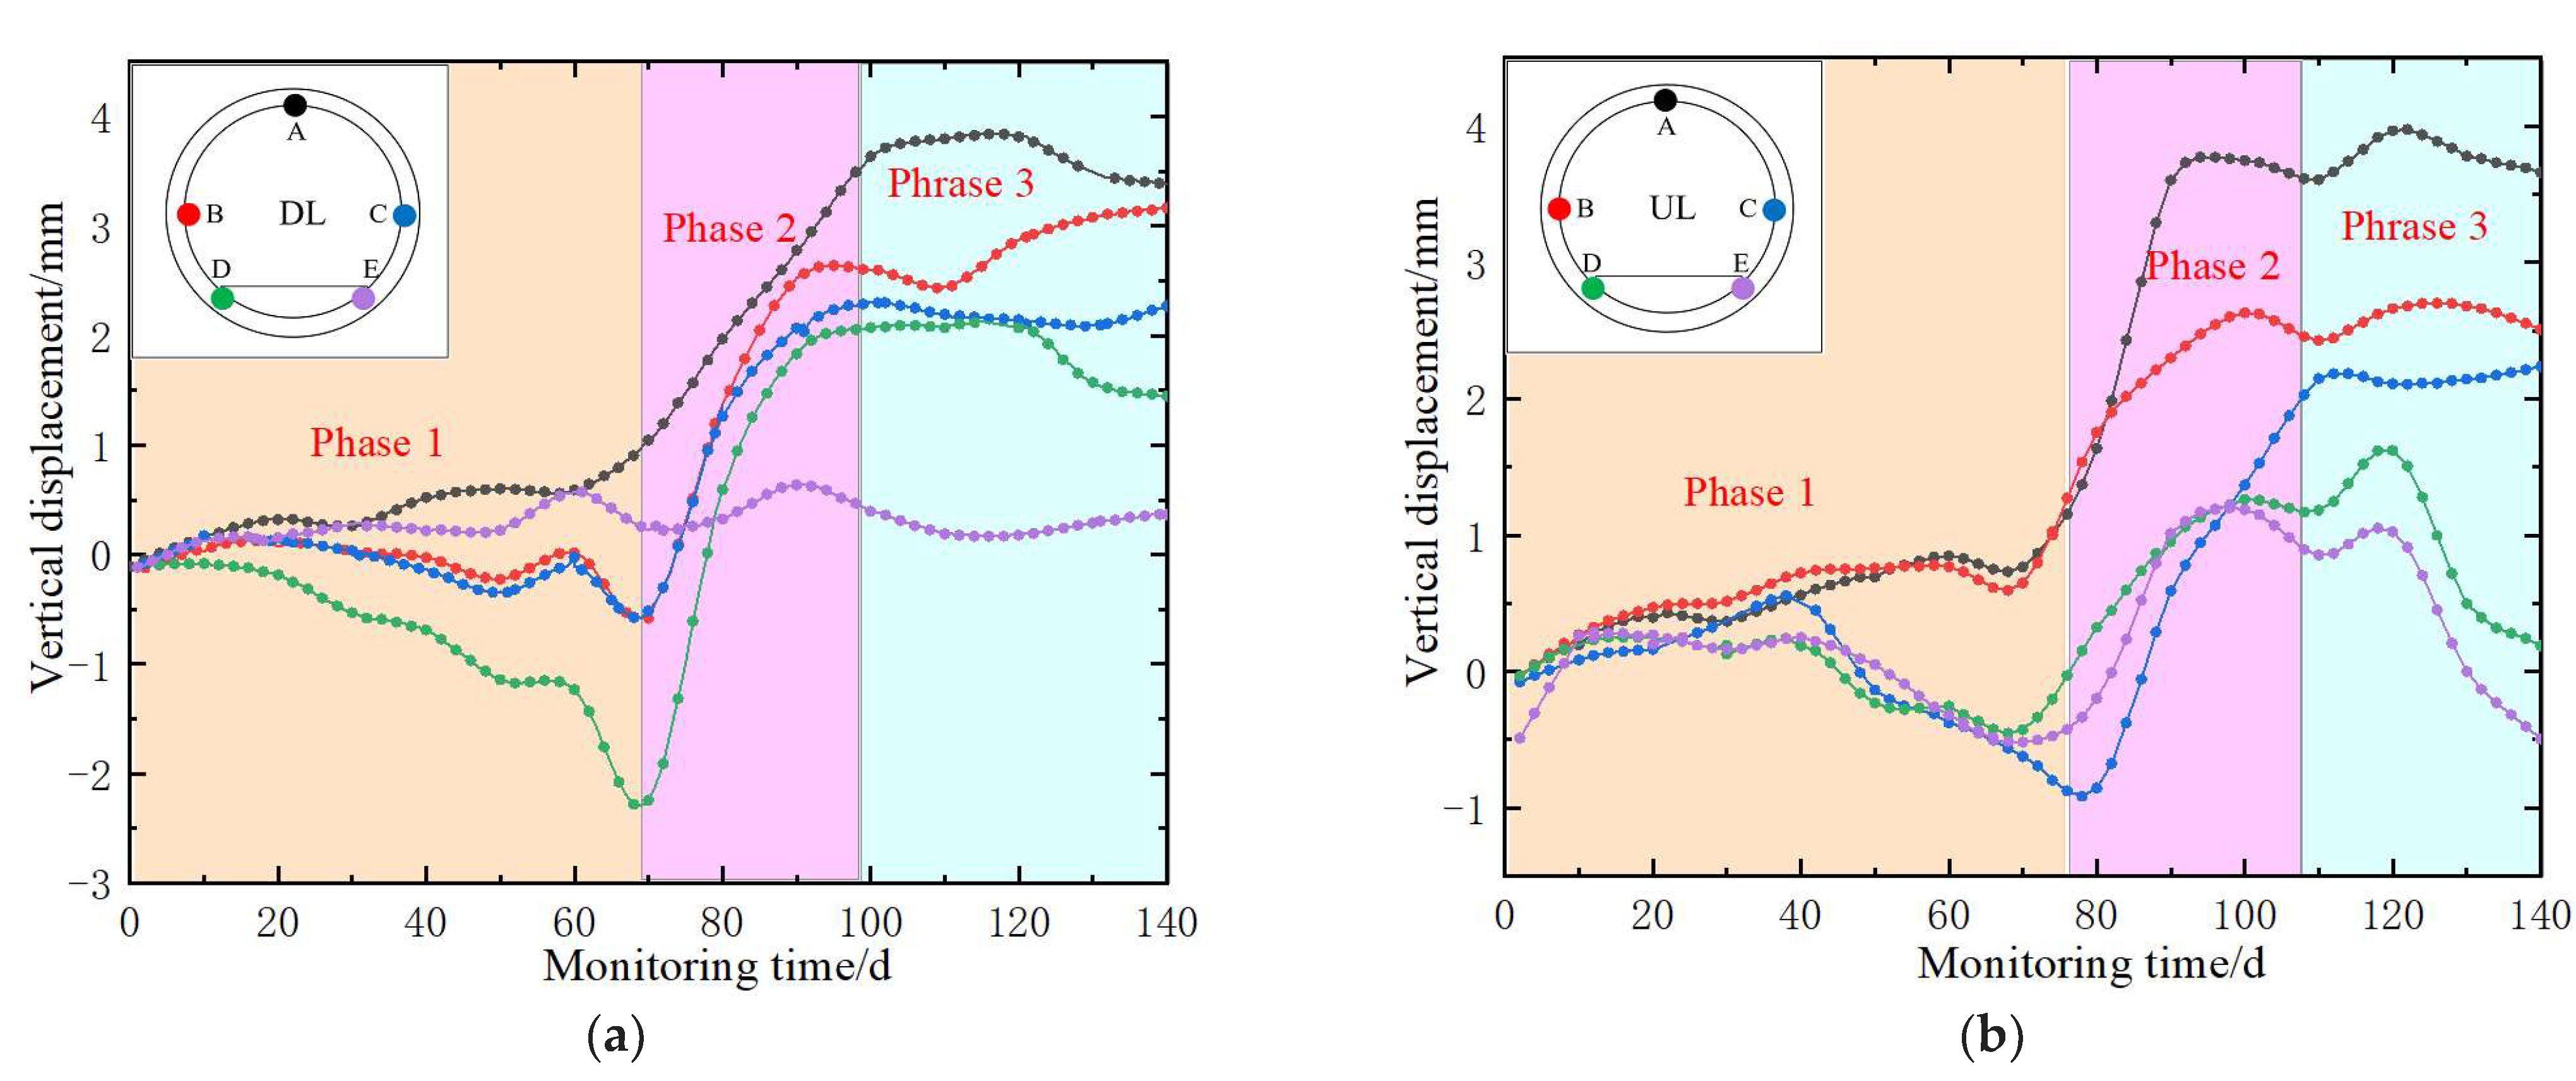
4.2. Tunnels Vertical Displacement

Figure 9 illustrates the vertical displacement distribution curve of the tunnel crown in the subway tunnel. In both the first and second stages, the unloading effect induced by the pipe-jacking operation causes uplift at the DL position, with the maximum uplift occurring along the central axis of the jacking pipe. The UL tunnel remains largely unaffected. As the jacking process continues, the uplift at both the DL and UL positions gradually increases, with the maximum uplift at the DL consistently greater than that at the UL tunnel. Following the addition of counterweights, the overall upward trend of the tunnel remains unchanged, although the uplift displacement at each stage decreases.
To further investigate the vertical displacement evolution at different locations during the jacking process, vertical displacement monitoring was conducted at the tunnel vault, left and right arch waists, and left and right ballast beds of the existing tunnel. The relationship between the jacking distance and vertical displacement at each monitoring point is shown in Figure 10 (negative values indicate settlement and positive values indicate uplift). It can be observed that the vertical displacement trends at each monitoring point for both the DL and UL tunnels follow a similar development pattern. The vertical displacement process of the tunnel can be divided into three distinct phases: the initial settlement phase, the rapid uplift phase, and the stable uplift phase.
Phase 1 occurs before the pipe jacking crosses the tunnel, during which slight settlement of the existing tunnel is induced by the weight of the jacking machine, the thrust on the tunnel face, and the squeezing effect of the grouting pressure. Phase 2 occurs during and immediately after the jacking process, when the unloading effect from excavation dominates, resulting in rapid upward displacement of the entire tunnel. Phase 3 follows the completion of the jacking process, where the influence of the pipe jacking diminishes and the tunnel’s vertical displacement stabilizes.
Figure 11 illustrates the vertical displacement variation curves for each monitoring point following the application of counterweights. Compared to Figure 12, it is evident that the counterweights did not significantly alter the overall deformation pattern of the tunnel. However, the vertical displacement development curves became smoother, accompanied by a reduced growth rate. Specifically, the vertical displacement at the DL vault decreased from 5.51 mm to 3.84 mm, representing a reduction of 30.3%. Similarly, the vertical displacement at the UL vault decreased from 4.95 mm to 3.11 mm, a reduction of 37.1%. These results indicate that the counterweights effectively mitigated the uplift.

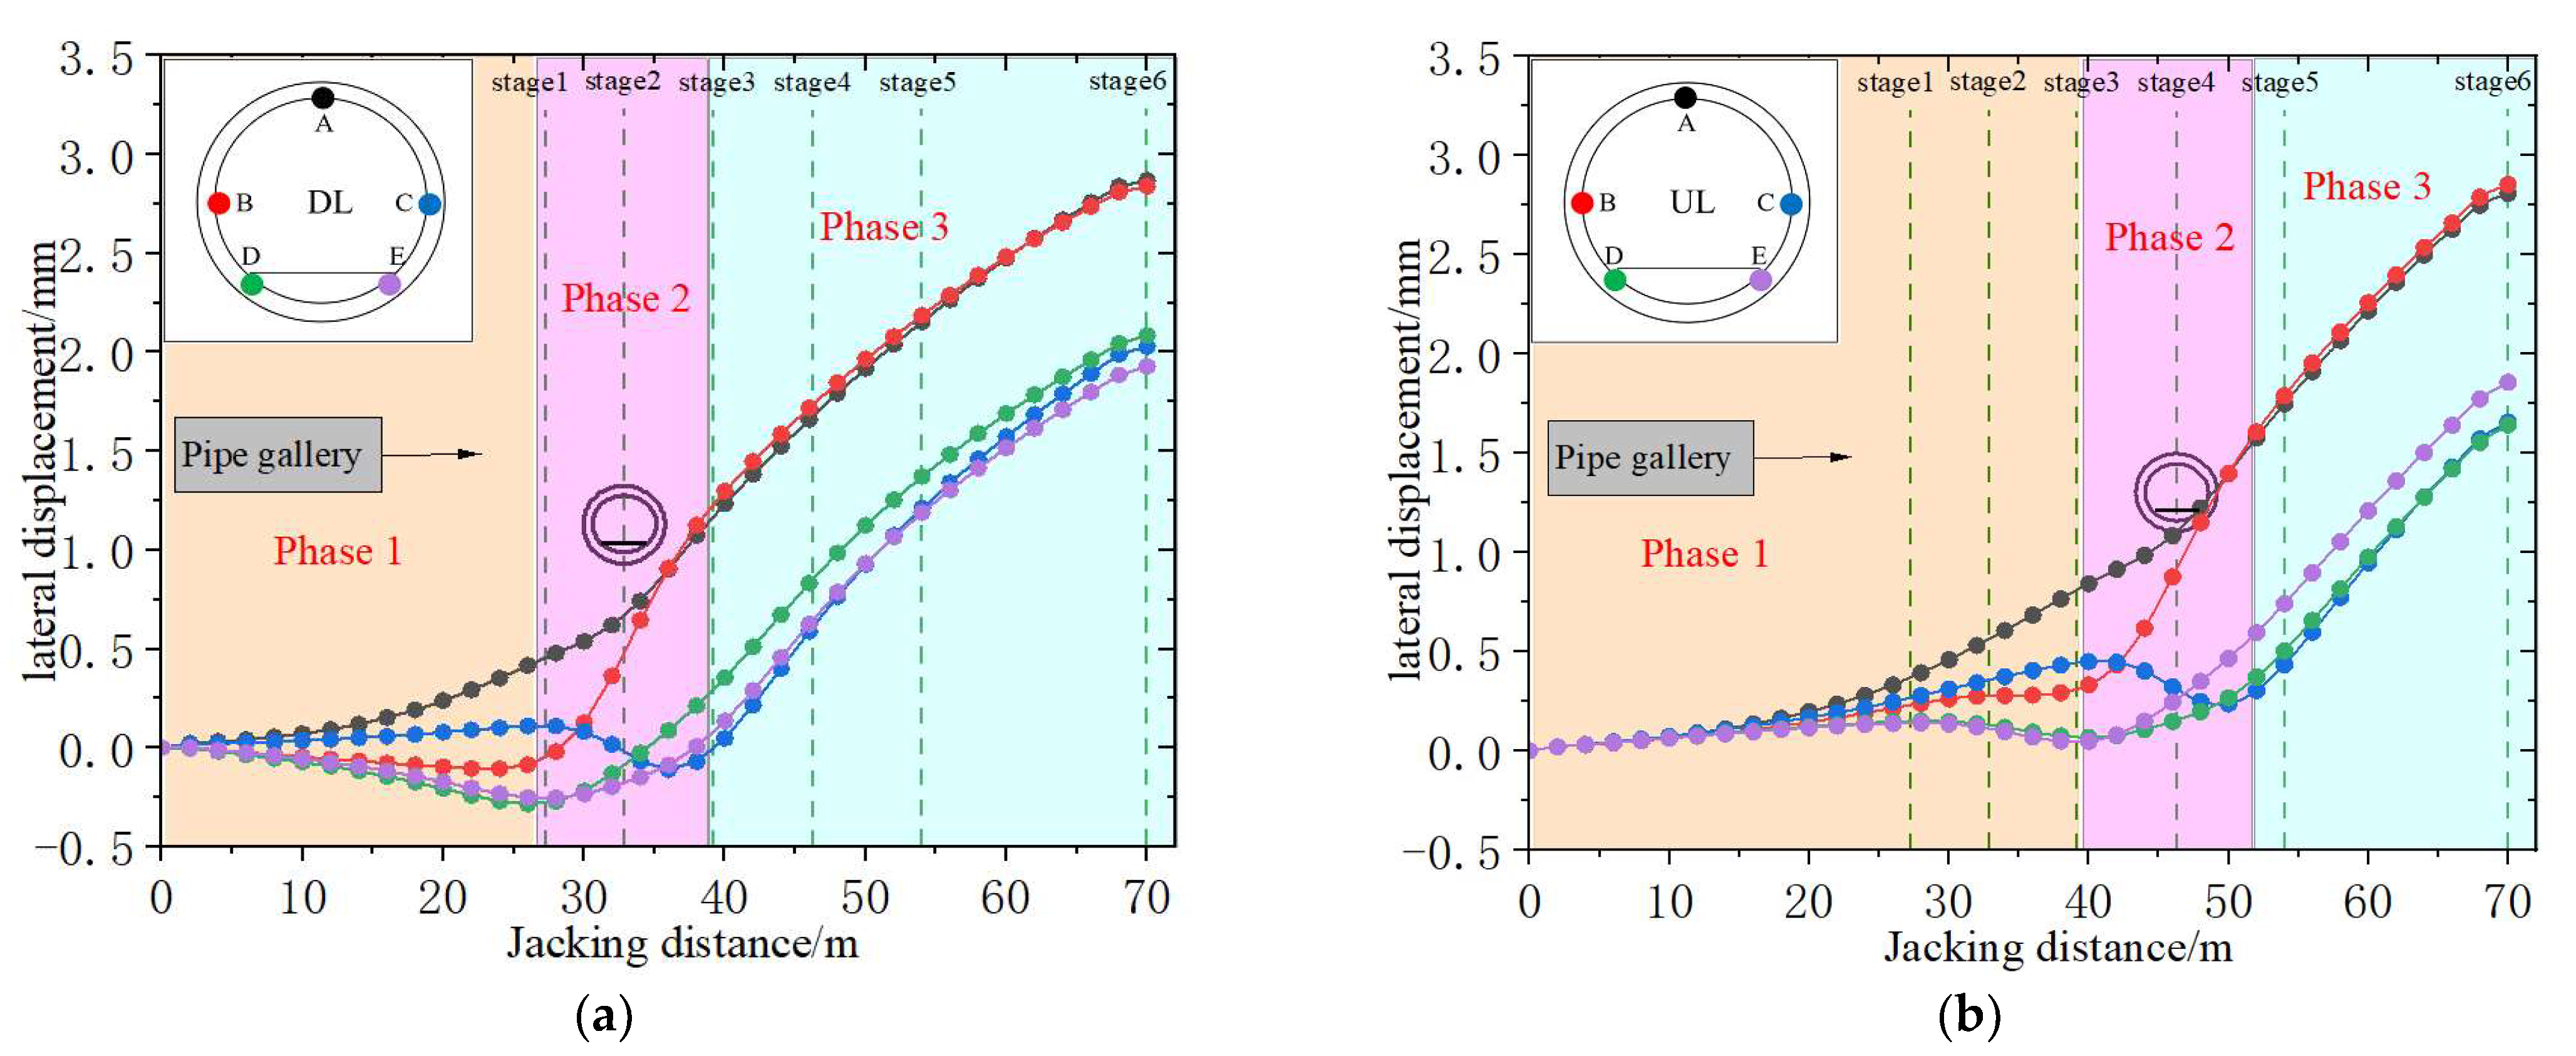
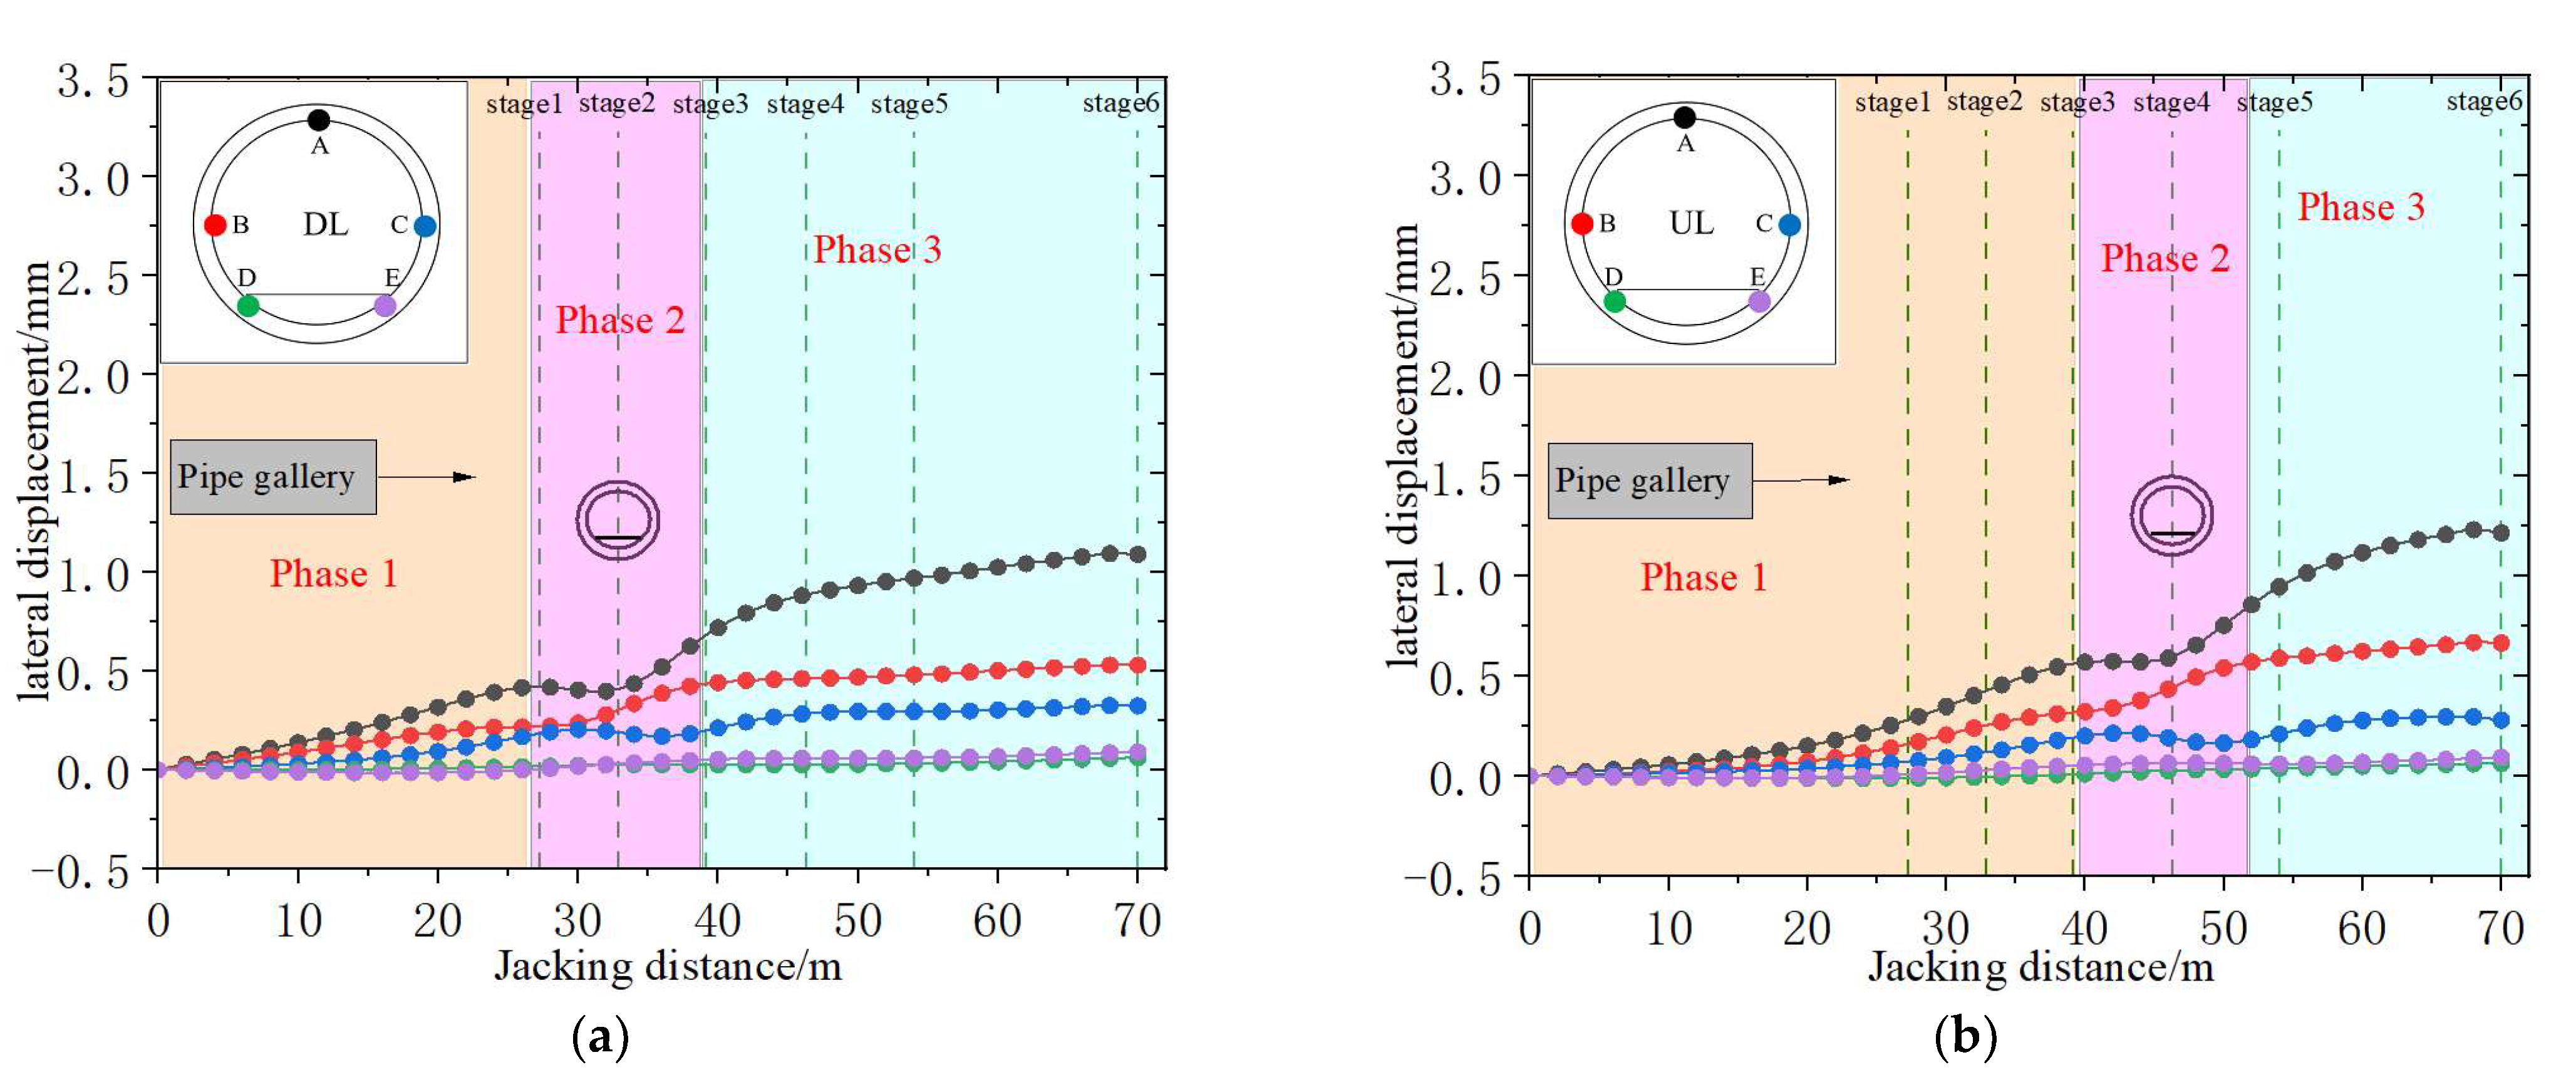
4.3. Tunnels Lateral Displacement

Figure 12 shows the distribution curve of lateral displacement at each monitoring point, which evolves through three distinct phases: the lateral stretching phase (Phase 1), the compression phase (Phase 2), and the overall offset phase (Phase 3). Phase 1 occurs before the pipe jacking reaches the tunnel, where the excavation-induced unloading effect causes lateral displacement toward the pipe on the side of the tunnel closer to the jacking operation. Meanwhile, the vault and right arch waist displace toward the reception shaft due to the thrust force. Phase 2 happens as the jacking machine approaches and crosses the tunnel. During this phase, the thrust force and grouting pressure dominate, leading to compression of the tunnel structure. Phase 3 occurs as the pipe jacking machine moves further away from the tunnel. The influence on lateral displacement diminishes, causing the horizontal displacement to stabilize, with a gradual increase in displacement toward the reception shaft.
Figure 13 presents the lateral displacement curve of the subway tunnel following the addition of counterweights. The pipe-jacking operation induces minimal lateral displacement in the ballast bed, while the vault and arch waist shift toward the direction of the receiving shaft. Once the cutting face passes through the tunnel axis, the extrusion effect of the jacking machine causes a slight reduction in lateral displacement at the vault. Subsequently, the unloading effect leads to an increase in lateral displacement toward the receiving shaft, which eventually stabilizes. Upon completion of the construction, the maximum lateral displacements at the DL and UL occur at the vault, measuring 1.09 mm and 1.23 mm, respectively. The addition of counterweights resulted in reductions of 61.6% and 55.9% in maximum lateral displacements at the DL and UL, respectively.

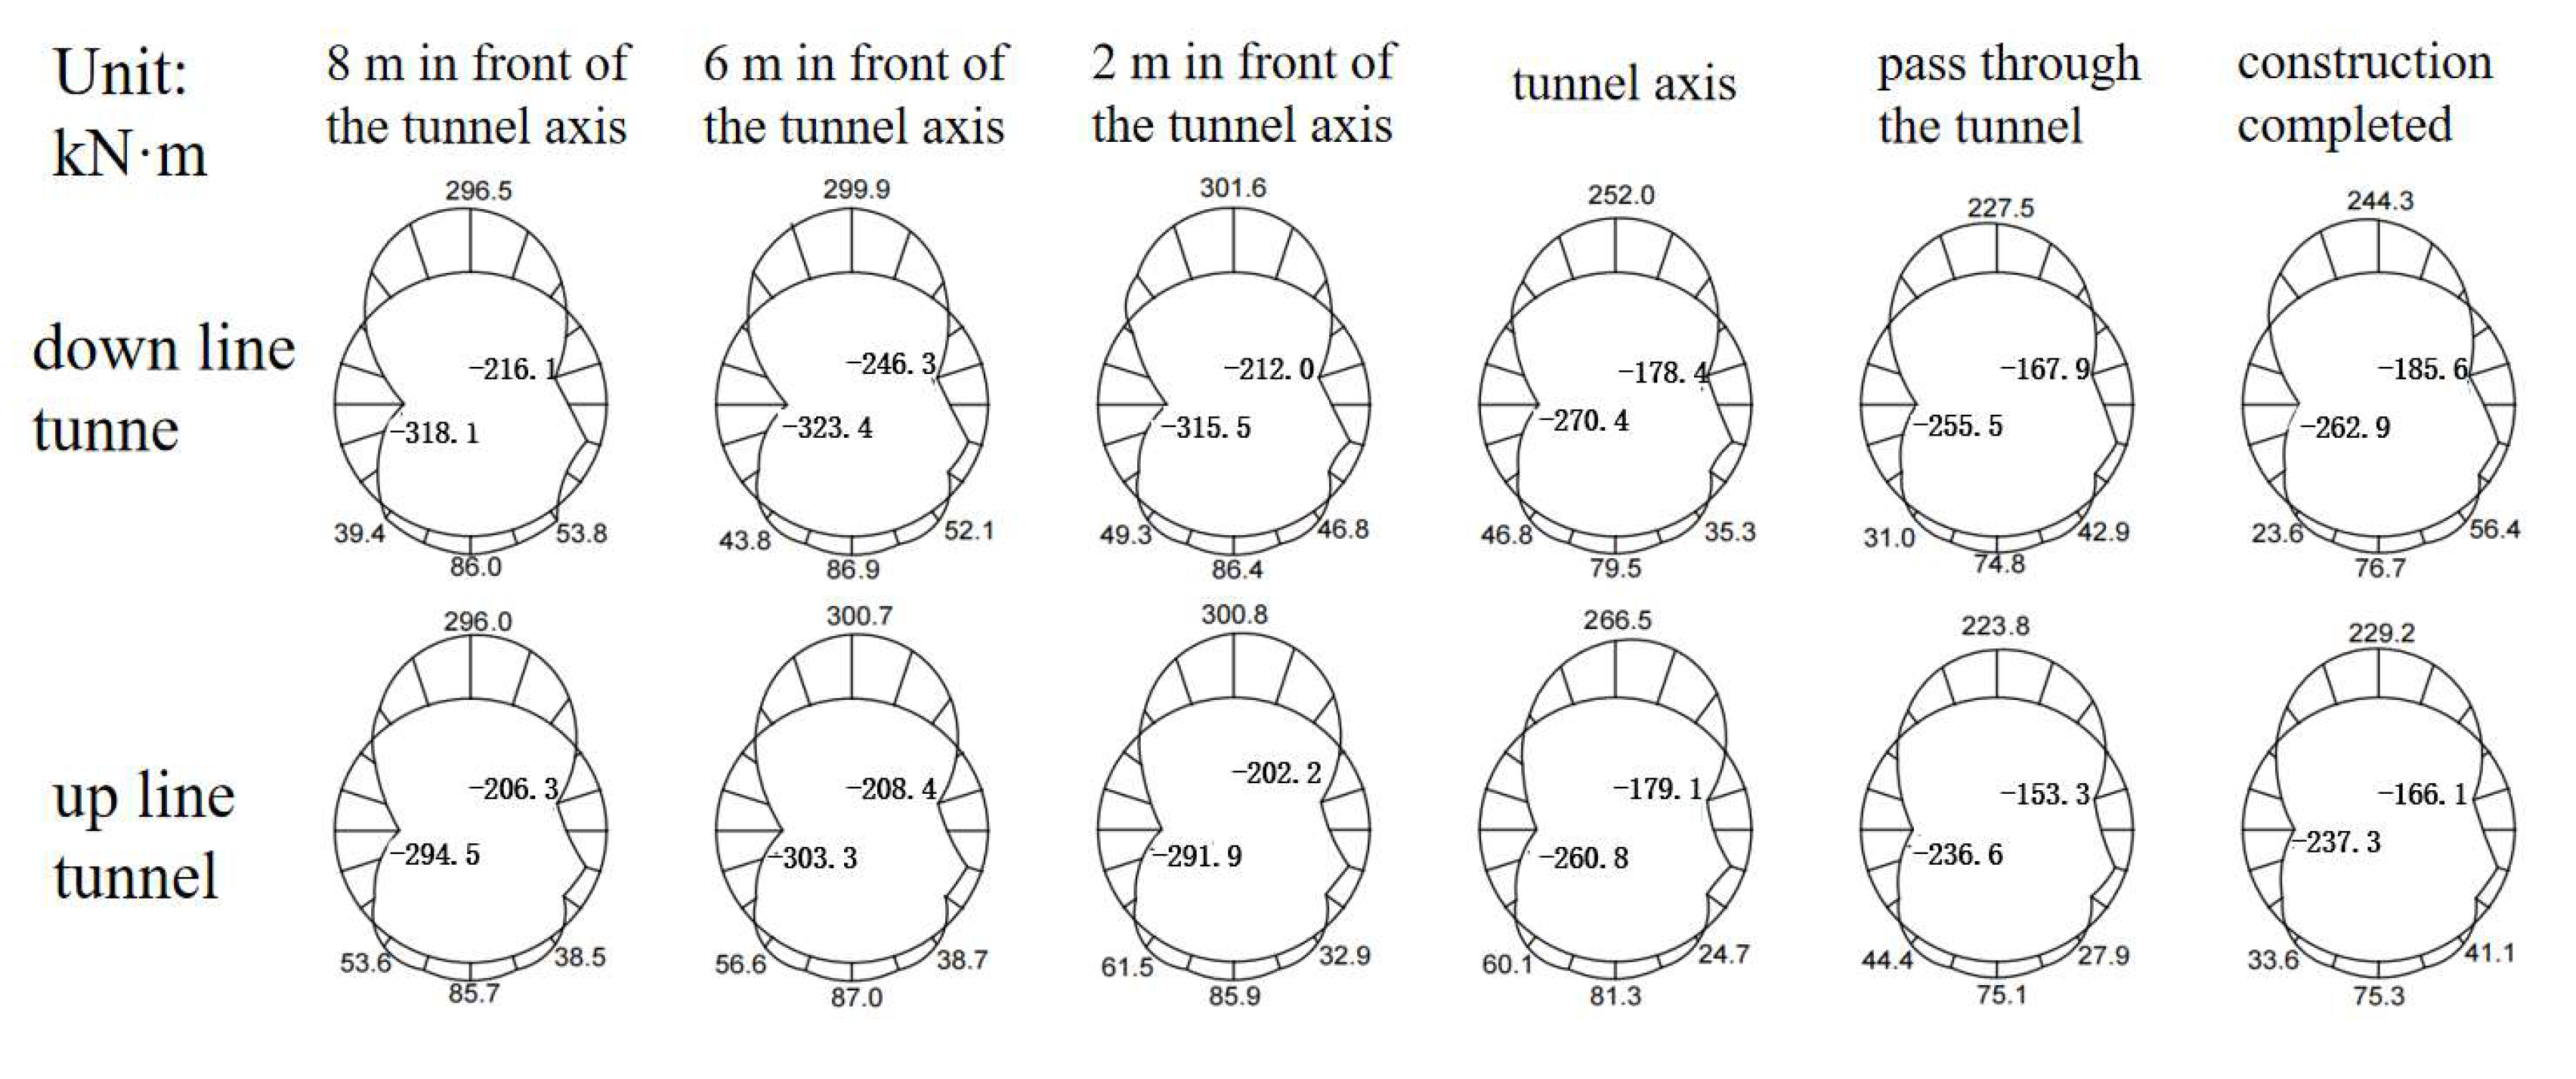
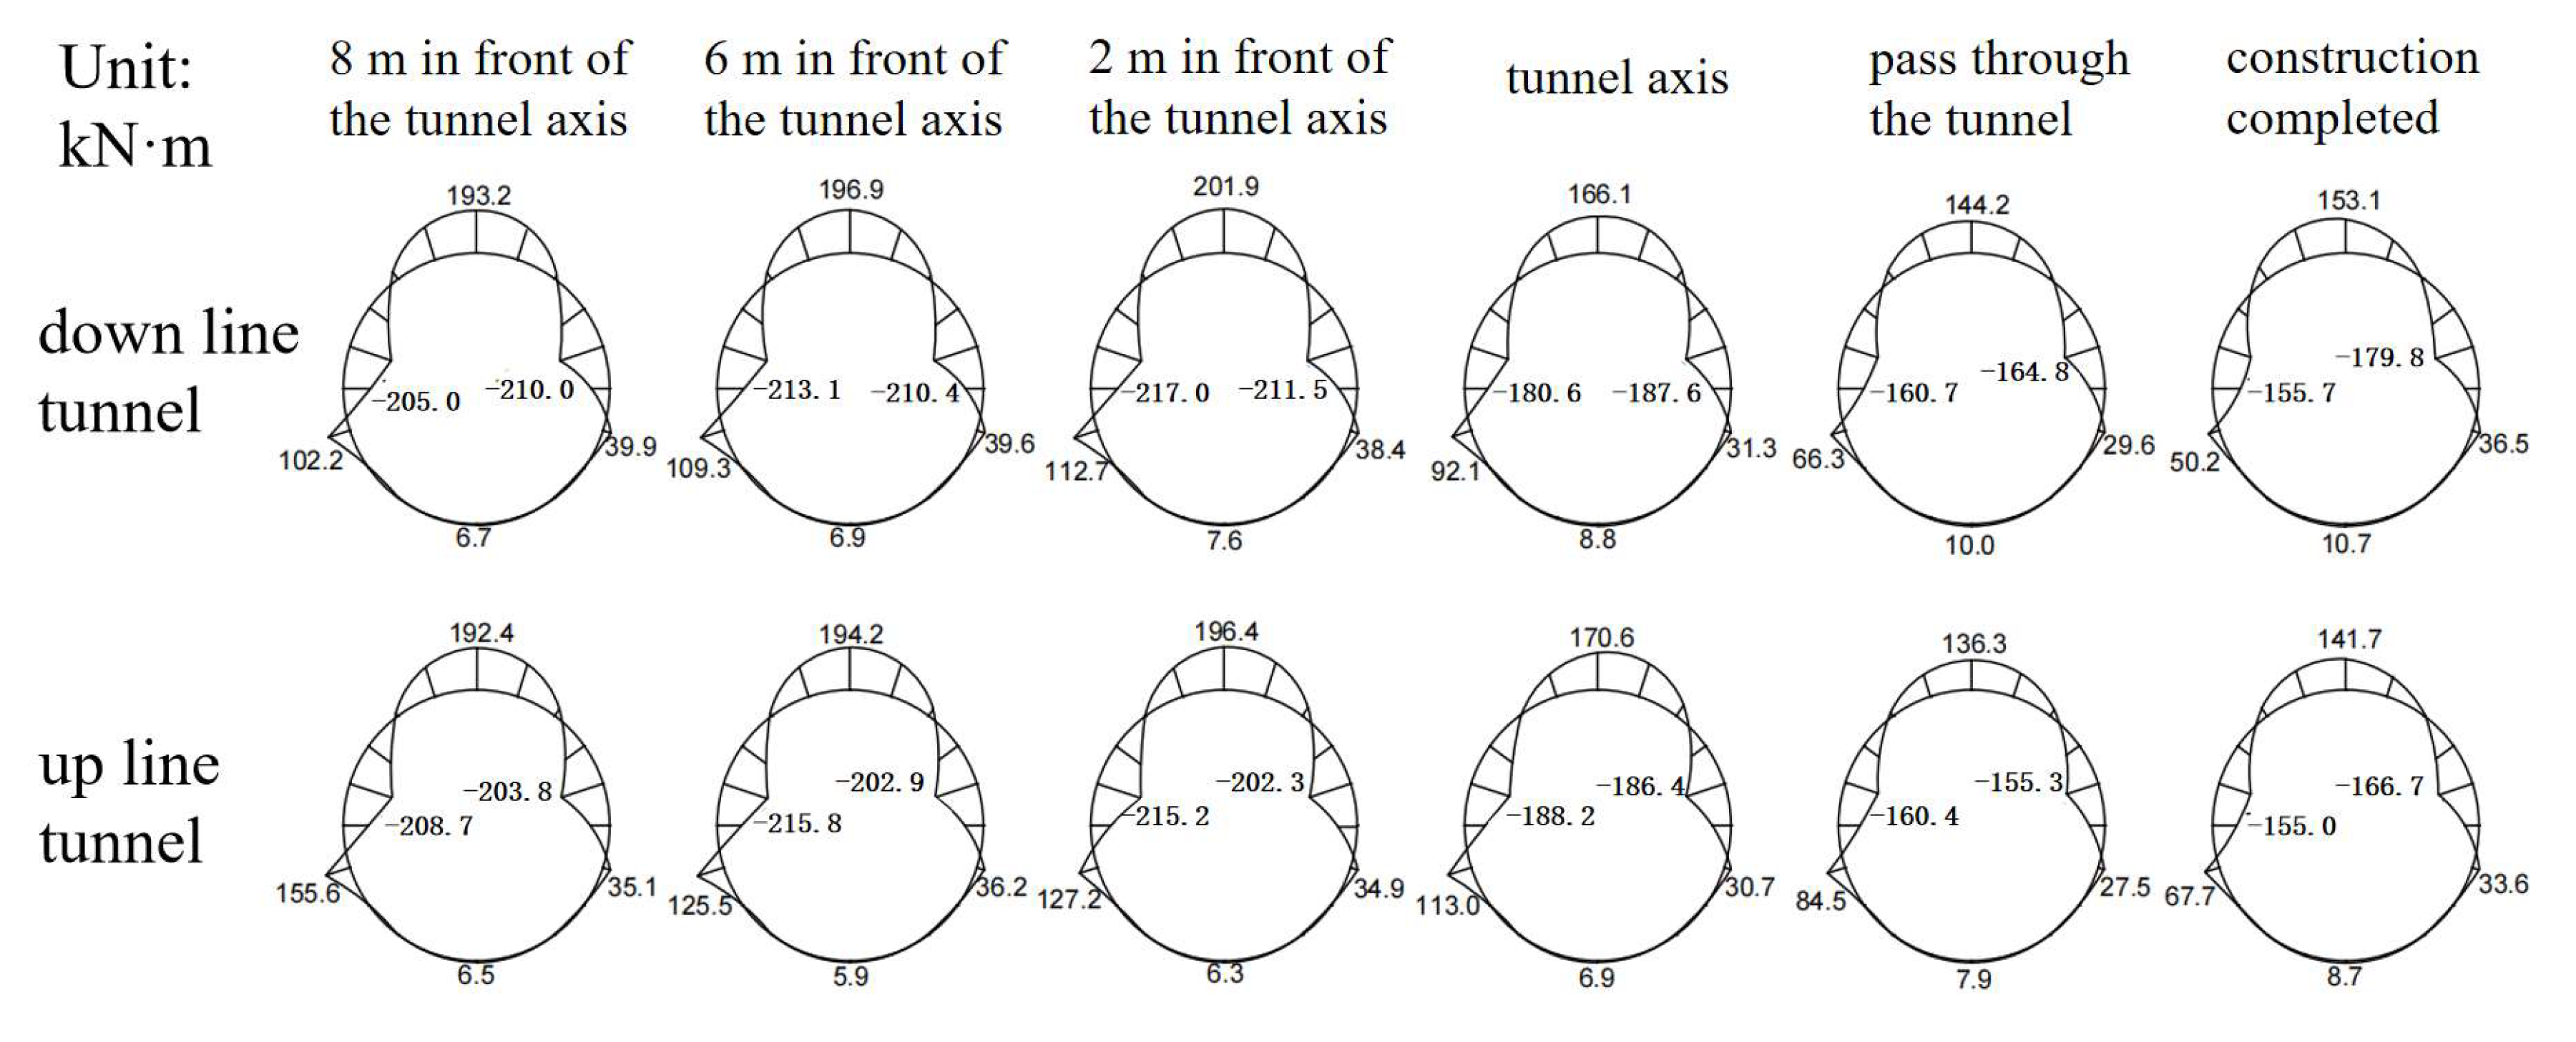
4.4. Tunnel Lining Moments

To assess the impact of pipe jacking on the forces exerted on the tunnel lining, bending-moment diagrams were plotted at various positions: 8 m, 6 m, and 2 m in front of the tunnel, at the tunnel axis, when the pipe-jacking machine completely passes through, and after construction completion (as shown in Figure 14). In most cases, the maximum bending moment occurs at the vault, the minimum at the arch waist, and the variation at the invert is minimal. Additionally, in the UL tunnel, the bending moments at all positions are slightly lower than those in the DL tunnel.
The jacking force induces lateral compression on the tunnel, which dominates the overall force characteristics, resulting in negative bending moments at both arch waists. When the cutting face is 6 m in front of the tunnel axis, the left arch waist of the DL and UL tunnels reaches maximum negative bending moments of −323.4 kN·m and −303.3 kN·m, respectively. At 2 m in front of the tunnel axis, the vault of the DL and UL tunnels reaches maximum positive bending moments of 301.6 kN·m and 300.8 kN·m, respectively. Following this, the bending moments progressively decrease, reaching the minimum positive value at the vault and the minimum negative value at the arch waist once the machine has fully passed through the tunnel. Subsequently, the bending moments gradually increase and stabilize.
Figure 15 presents the bending moments of the tunnels following the application of counterweight measures. After adding the counterweights, the bending moments in the tunnel lining are significantly reduced. Specifically, the maximum positive bending moment in the DL tunnel is decreased by 33.1%, while the maximum negative bending moment is reduced by 32.9%. In the UL tunnel, the maximum positive bending moment is reduced by approximately 34.7%, and the maximum negative bending moment by approximately 28.8%. These results demonstrate that the addition of counterweights effectively mitigates the additional bending moments in the tunnel lining caused by the pipe-jacking process.

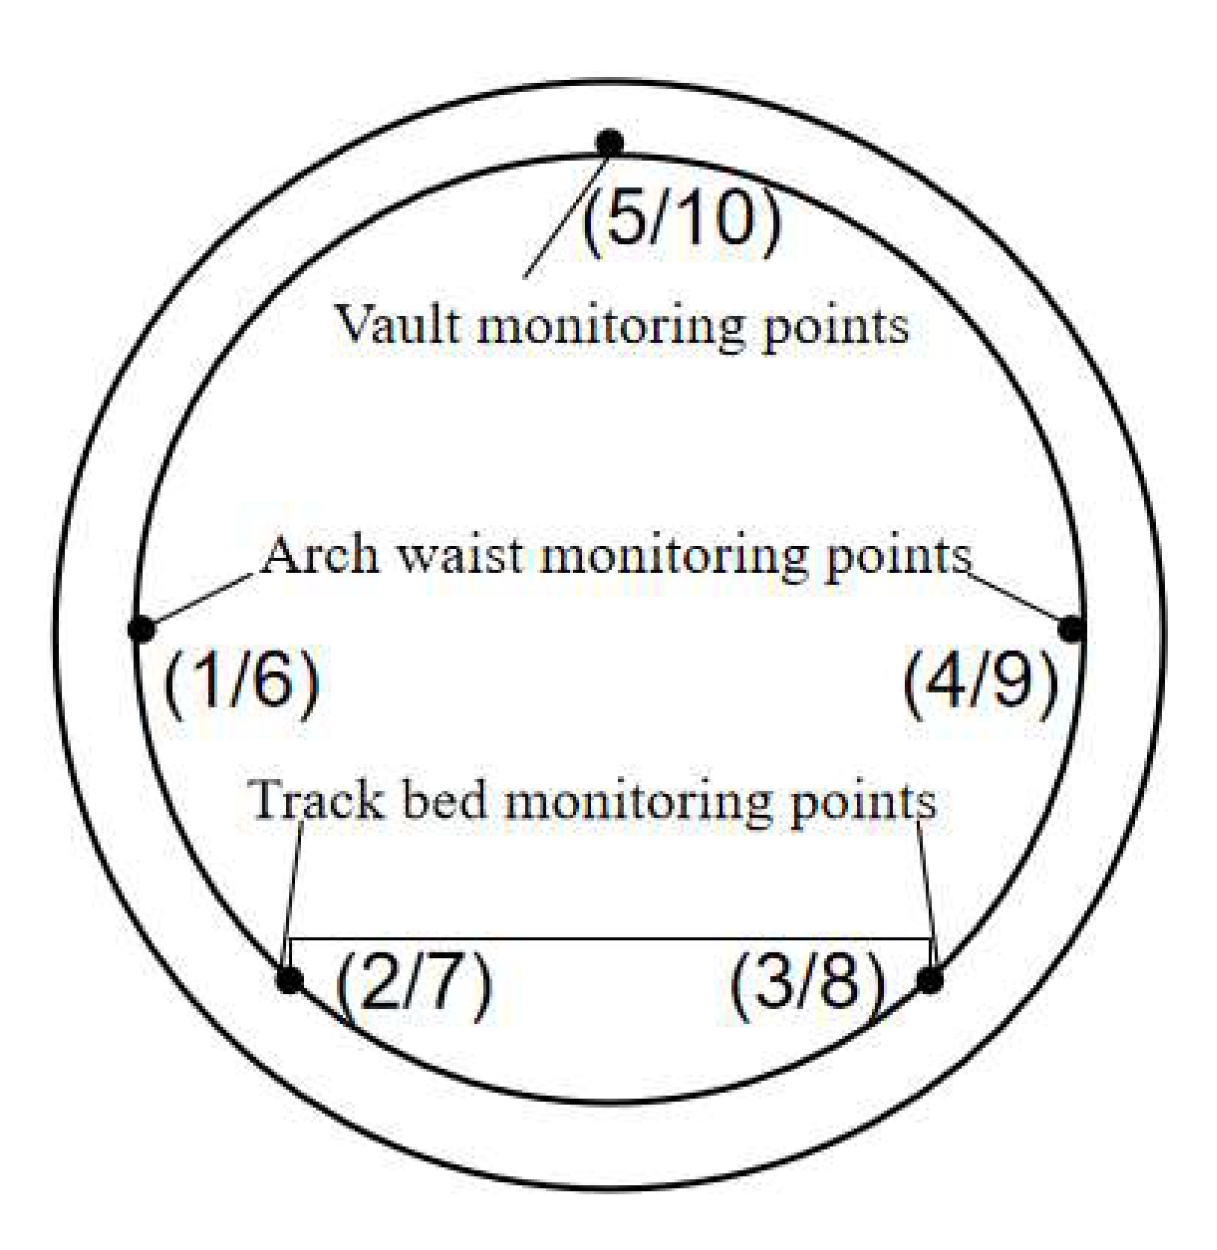
5. Field Monitoring Scheme and Results

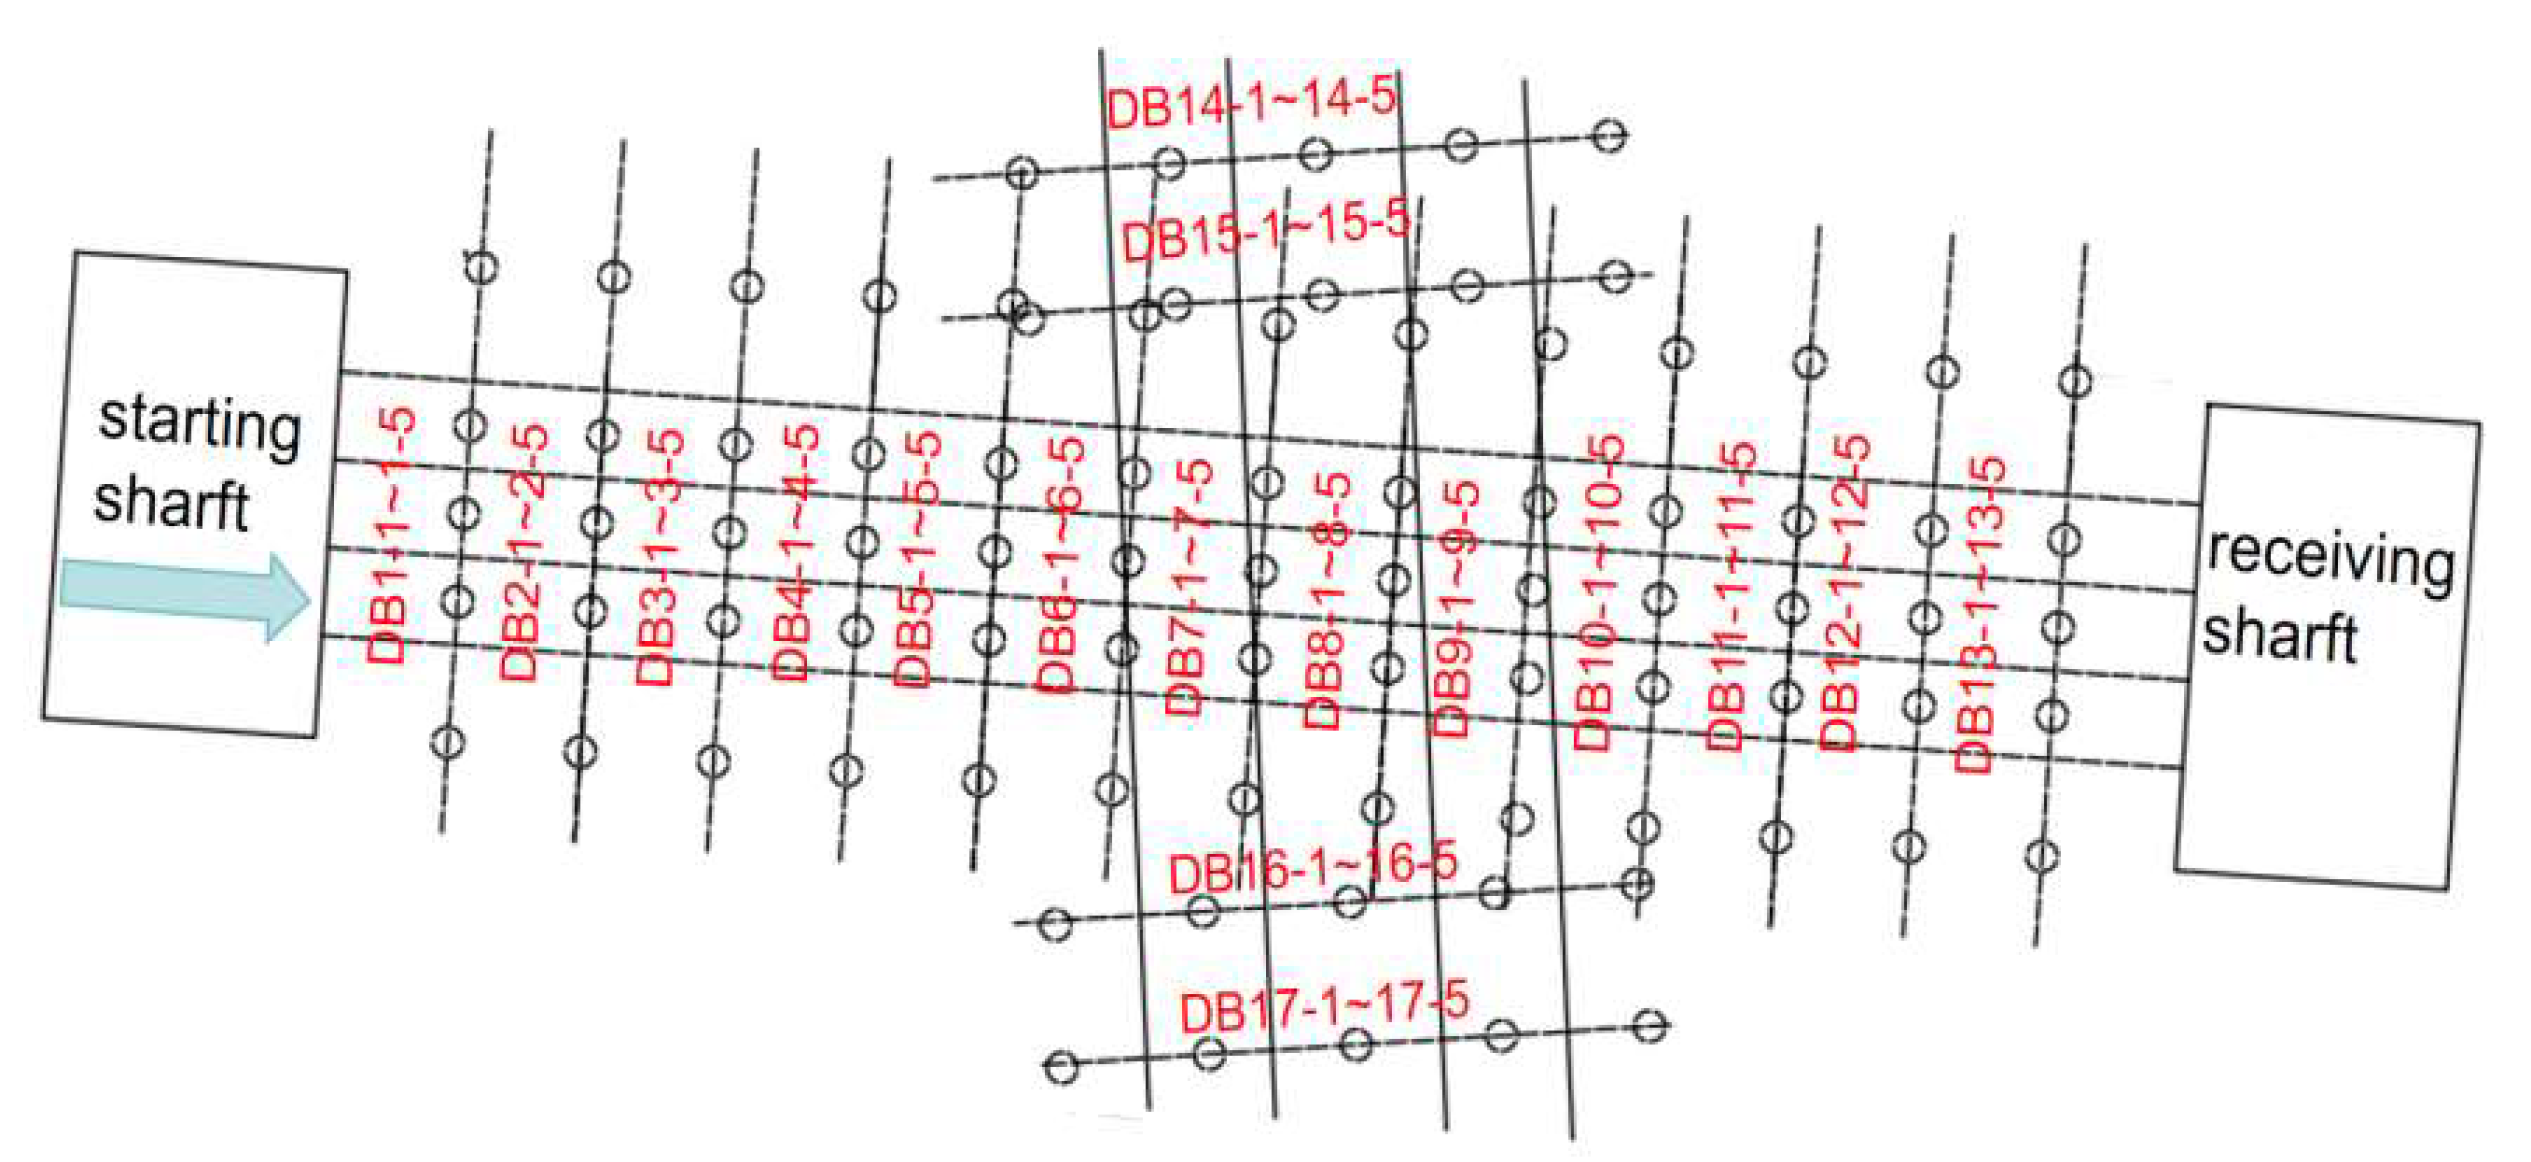
5.1. Field Monitoring Scheme

Ground surface settlement monitoring is organized into 13 groups above the pipe-jacking area, with each group spaced 5 m apart and containing 5 monitoring points (spaced 3–6 m). Outside the pipe-jacking zone, above Track No. 4, four additional groups are arranged, spaced 15 m apart, each with five monitoring points (spaced 5 m apart). In total, 85 monitoring points are set up (DB1-1 to DB17-5), as shown in Figure 16. For subway tunnel traffic in Section 4, monitoring sections are positioned every 6 m, with a denser arrangement (every 3 m) above the pipe-jacking area. Differential settlement monitoring is also conducted along the projection of the pipe-jacking’s outer edge, with a total of 4 sections. In total, 17 groups, each with 10 monitoring points (GD1-1 to GD32-10), are arranged, with detailed monitoring conducted at the vault, arch waist, and ballast bed, as shown in Figure 17.

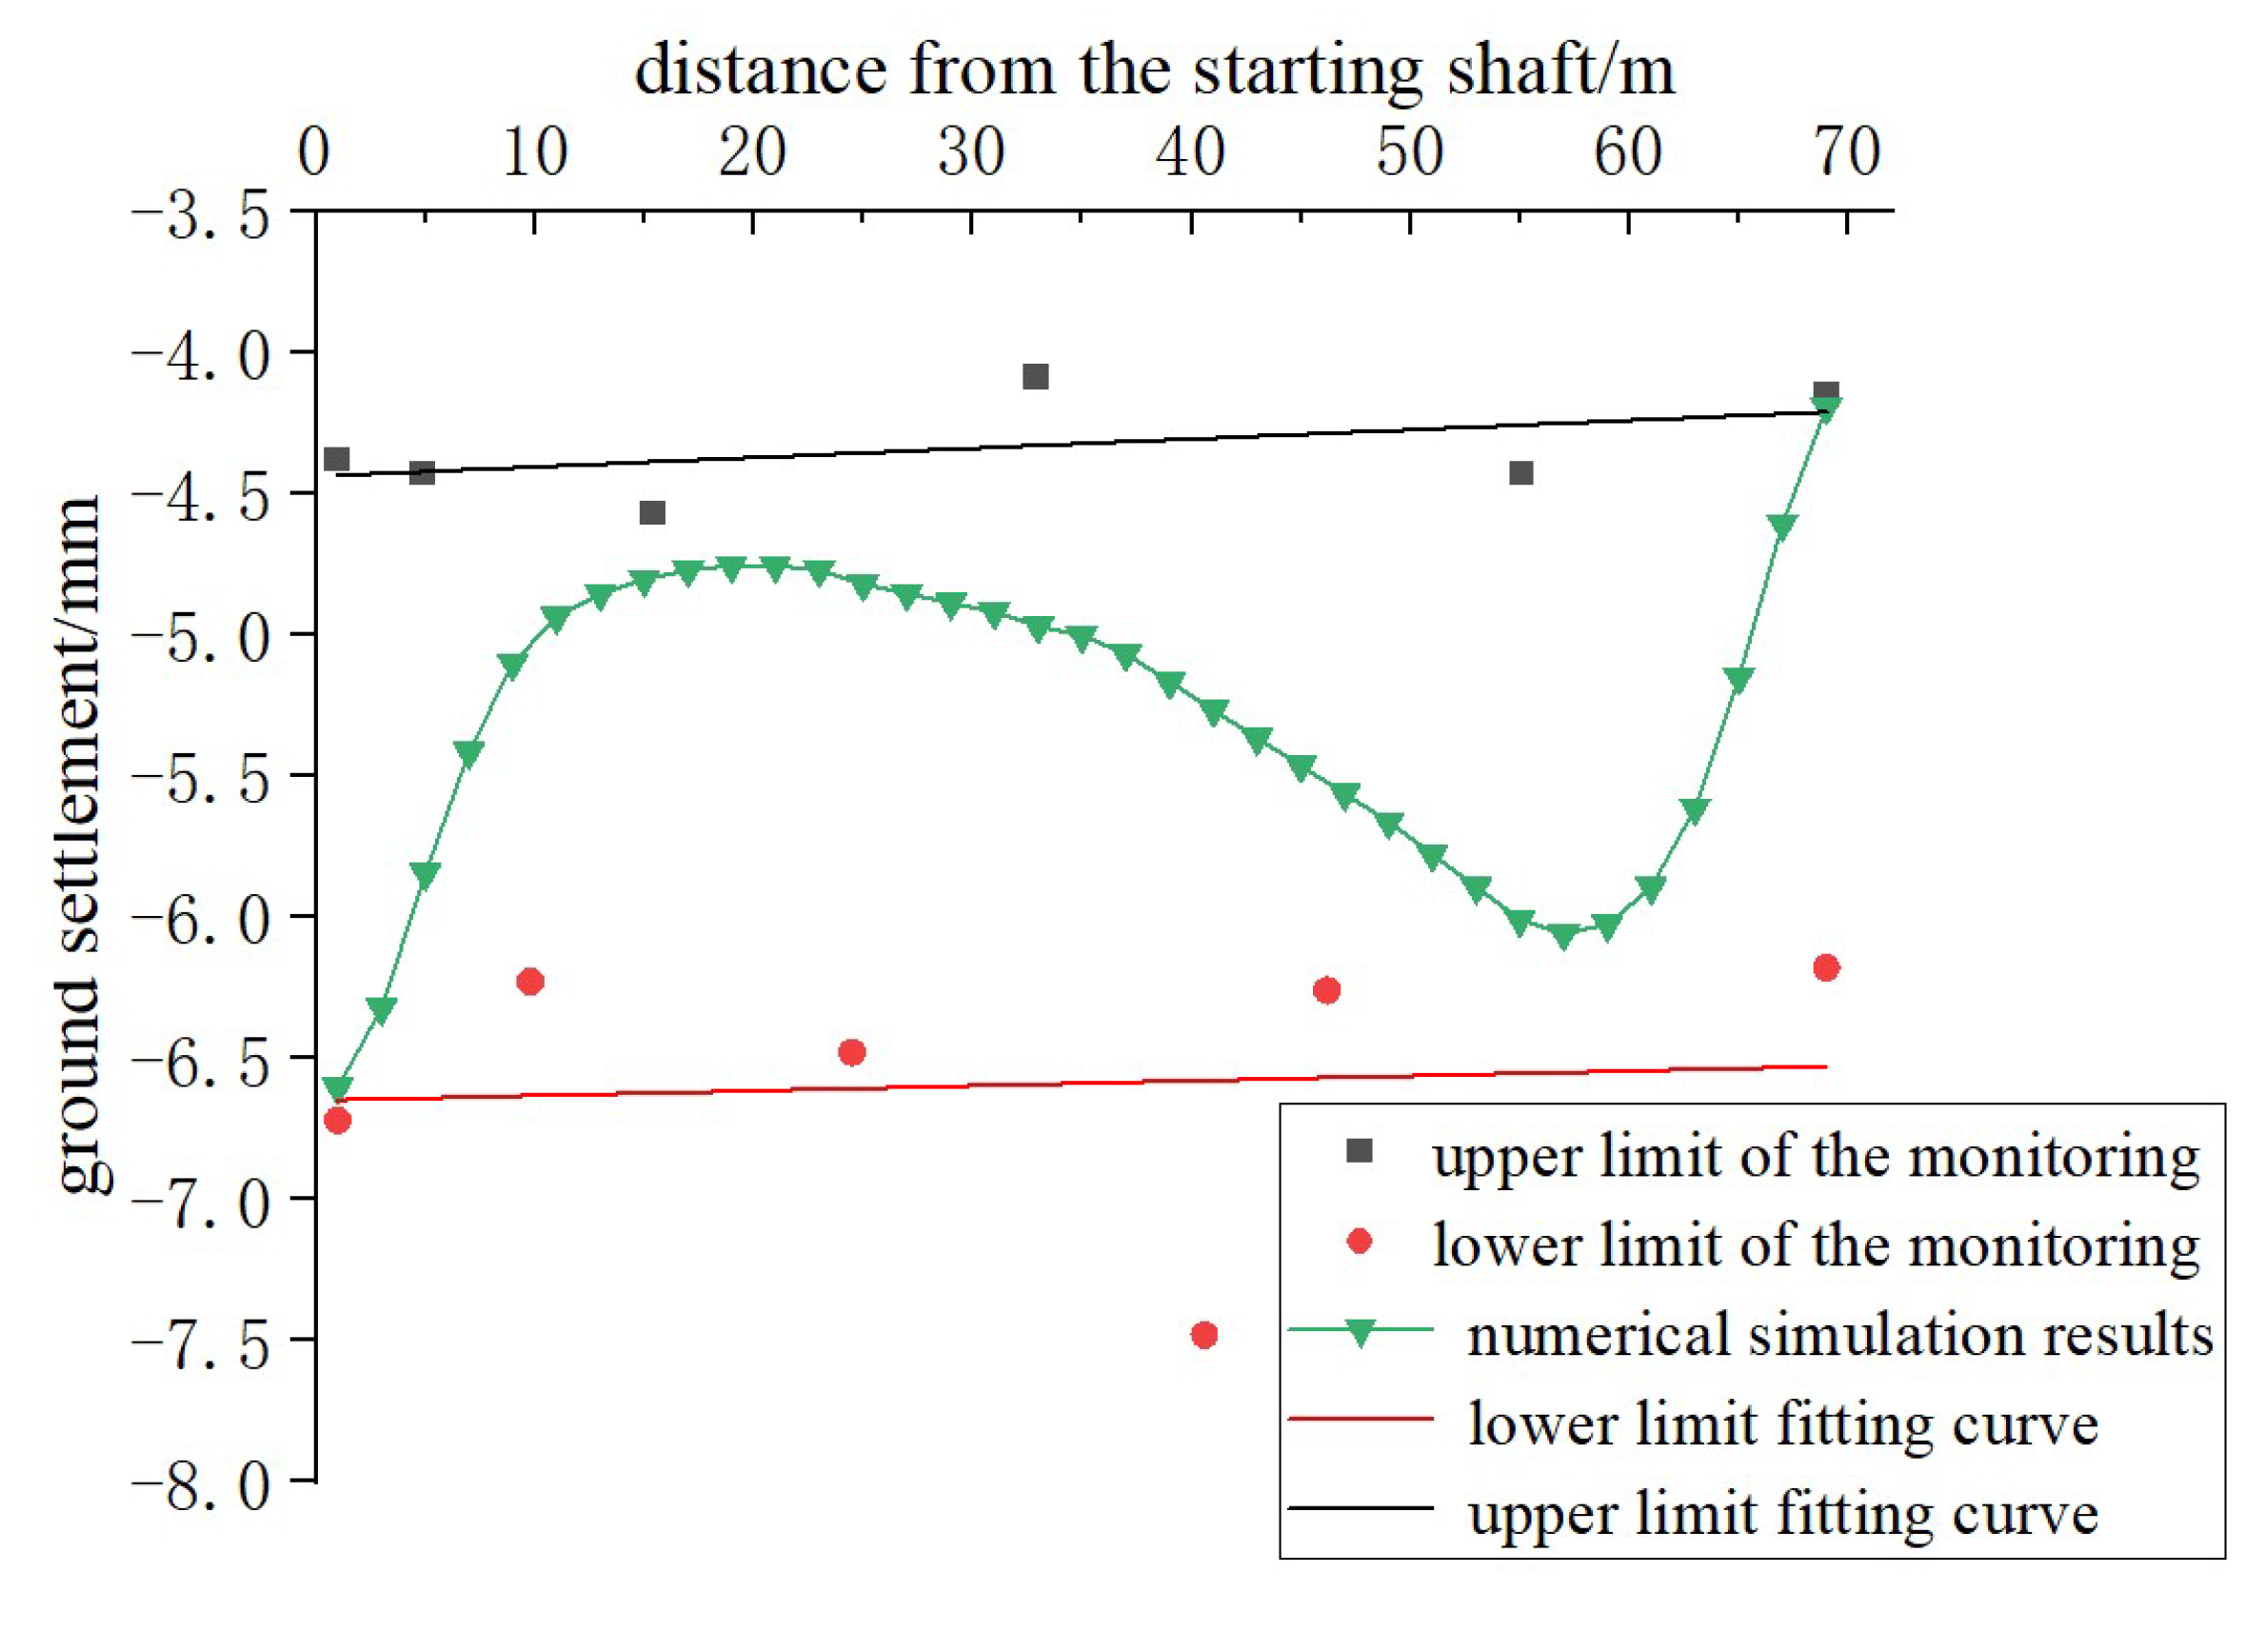
5.2. Field-Measured Ground Settlement

Figure 18 presents the ground surface settlement curve along the direction of shield tunneling. The results of the numerical simulation fall within the bounds defined by the upper and lower limits of the on-site monitoring data fitting line. The maximum settlement observed in the field monitoring occurs along the tunnel’s central axis, with a value of 7.48 mm, which falls within the regulatory standard range of 5–10 mm.
Figure 19 illustrates the ground surface settlement monitoring curve perpendicular to the tunneling direction. Positive values are observed on both sides of the settlement trough in the numerical simulation. This phenomenon is attributed to the shield pipe excavation, where the shield pipe exerts lateral pressure on the overlying soil, resulting in surface bulging on both sides of the settlement trough. However, during construction, continuous adjustments to the top thrust of the shield pipe were made to correct its direction, thereby preventing surface uplift. The minimum settlement observed in the field monitoring was 4.72 mm, and the width of the settlement trough was 20 m, both of which are consistent with the numerical simulation results.

5.3. Field-Measured Tunnels Vertical Displacement

Figure 20 presents the vertical displacement monitoring curve of the tunnels. In the early stages of construction, no significant changes were observed in the tunnel. As construction progressed, the vault of the DL tunnel exhibited a subsidence trend, with the maximum subsidence reaching 2.26 mm, consistent with the trend observed in the numerical simulation results. Once the jacking machine exited the DL tunnel, an upward displacement occurred, with the maximum uplift observed on the right side of the ballast bed, reaching 3.79 mm. Around 80 days into construction, the vault of the UL tunnel experienced its maximum subsidence of 0.86 mm, after which it began to uplift. The maximum uplift in the UL tunnel occurred on the left side of the ballast bed, with an uplift value of 3.98 mm. Throughout the jacking process, the vertical displacement of both tunnels did not exceed the alarm threshold of 5 mm.

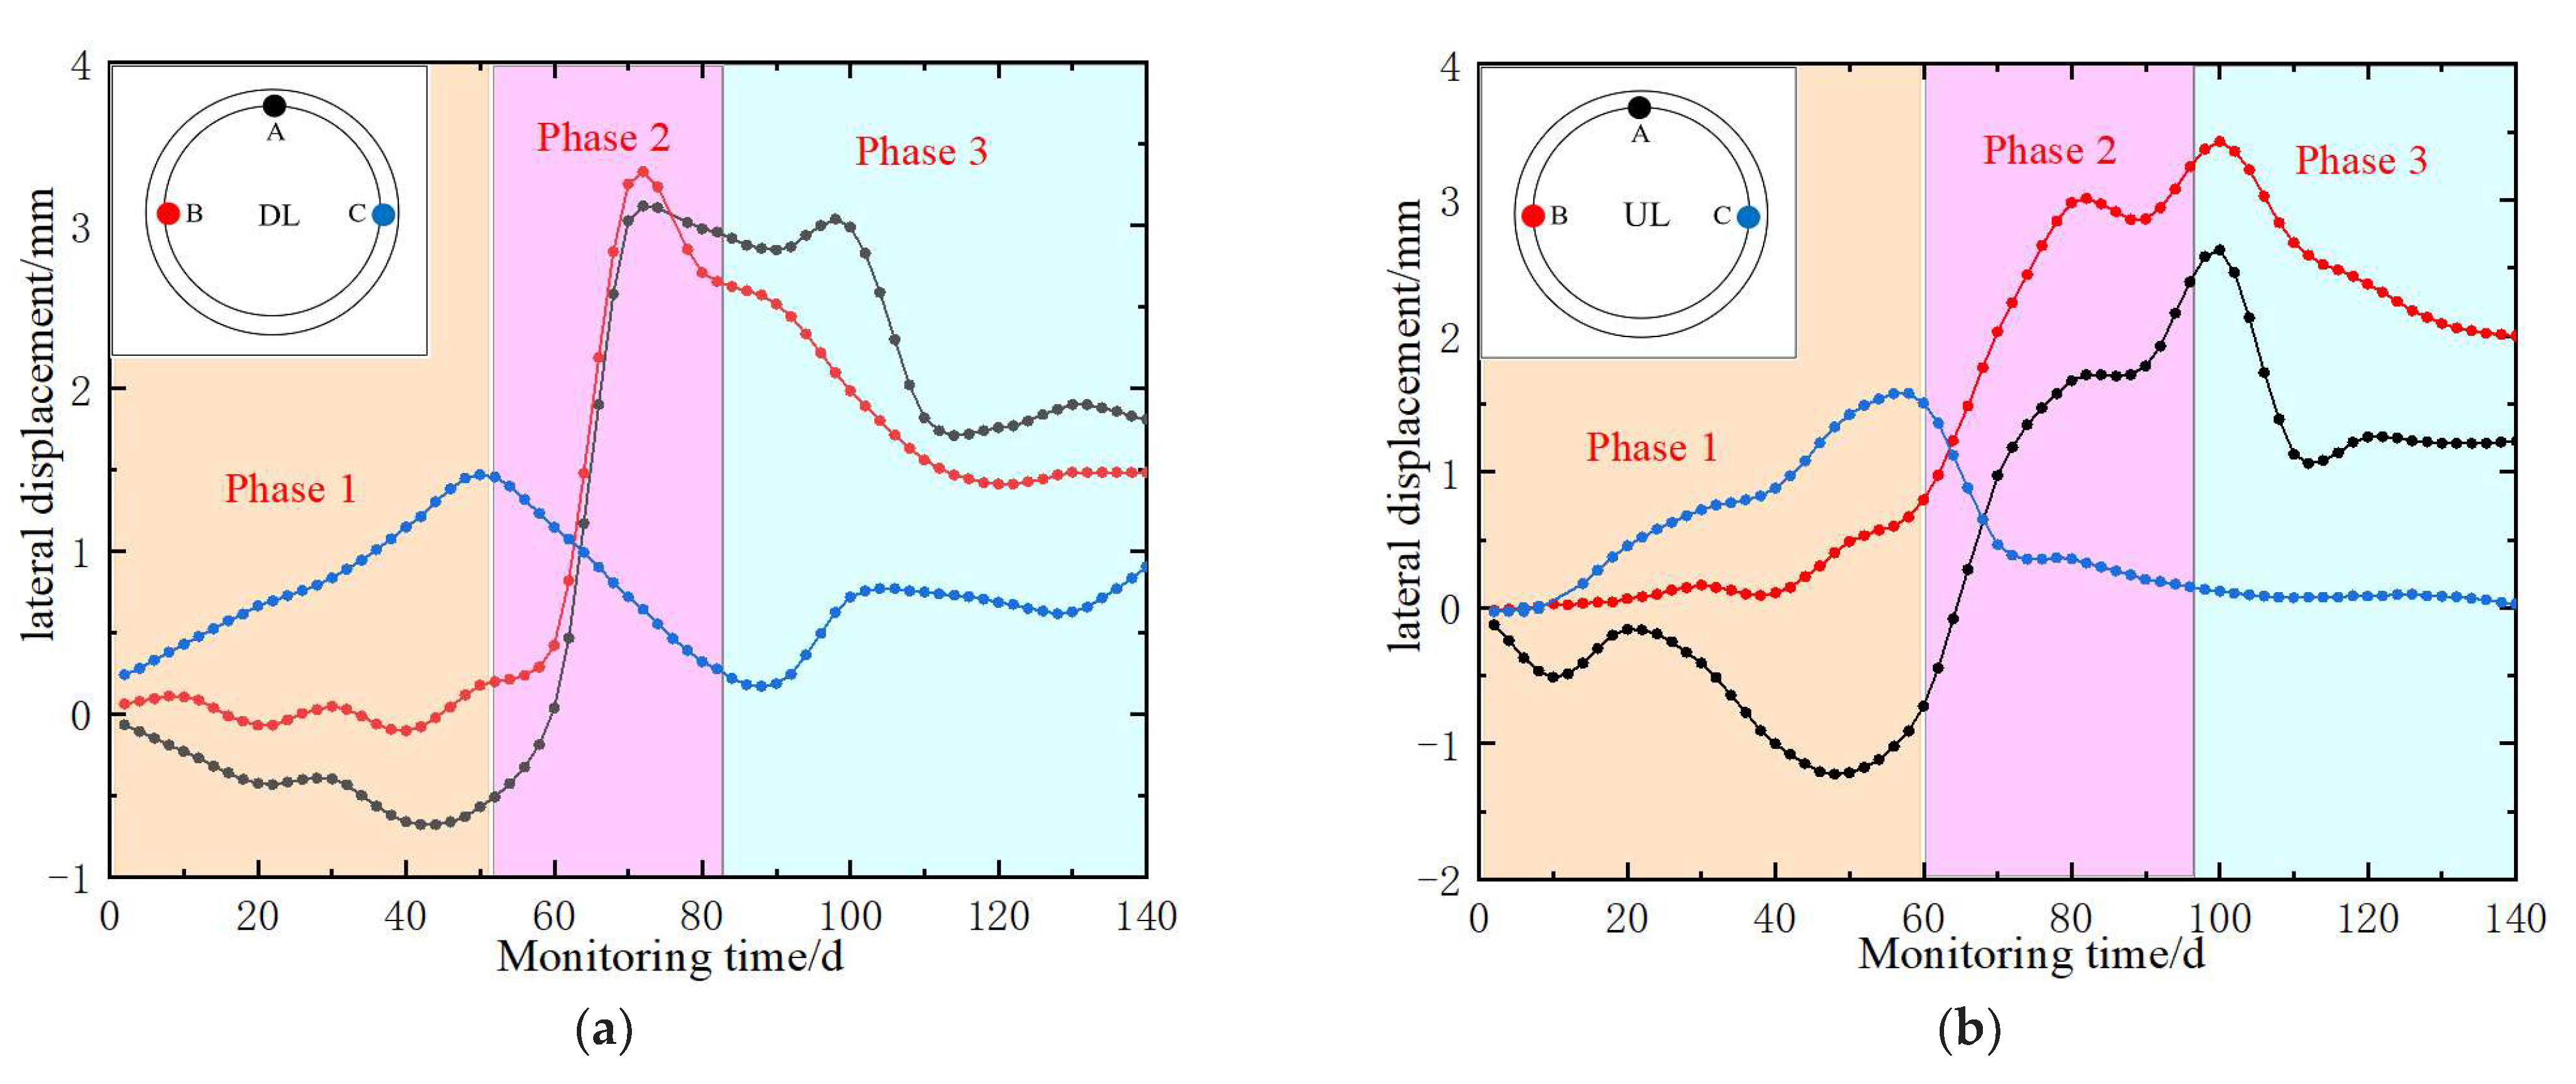
5.4. Field-Measured Tunnels Lateral Displacement

Figure 21 presents the lateral displacement curve of the tunnel. At the onset of construction, the soil surrounding the tunnel began to move toward the excavation area due to the unloading effect. The vaults of both the DL and UL tunnels shifted toward the starting shaft. As the cutting face approached the tunnel, both tunnels began to shift toward the receiving shaft. The maximum lateral displacements observed were 3.26 mm for the DL tunnel and 3.42 mm for the UL tunnel, both of which were well below the alarm threshold of 5 mm. As construction progressed, the horizontal displacement gradually stabilized, in contrast to the continuous increase observed in the numerical simulation. This discrepancy can be attributed to the use of an elastic model in the simulation, which assumes a complete rebound of the soil after unloading, without accounting for the plasticity and flowability of the real clay.

6. Discussion

6.1. Analysis of Discrepancies Between Numerical Simulation and Field Monitoring Results

A comparison between numerical simulation results and field monitoring data reveals general agreement in overall trends and magnitude, while certain discrepancies are observed, particularly the appearance of displacement reduction phases in monitoring data that are absent in simulation results. These differences may be attributed to several factors: The Mohr–Coulomb elastoplastic model adopted in numerical simulations assumes an idealized elastoplastic soil behavior, which cannot fully capture the actual soil’s plastic deformation, rheological characteristics, and time-dependent effects. The simulation fails to account for excess pore water pressure induced by excavation, whose subsequent dissipation over time would lead to ground displacement variations. Furthermore, the simulation process does not incorporate dynamic construction adjustments (e.g., real-time grouting pressure optimization and counterweight regulation), whereas such measures in field construction actively restrain displacement development and may cause partial rebound. The displacement reduction phases in monitoring data demonstrate the effectiveness of active control measures in practical engineering or the natural stabilization trend after soil plastic deformation, while simulation results focus more on conservative prediction of worst-case scenarios. These discrepancies highlight the significant influence of complex soil constitutive behavior and dynamic construction processes on deformation responses. Future research should employ more sophisticated constitutive models and incorporate construction feedback mechanisms to enhance simulation accuracy.

6.2. Applicability of the Construction Method

This project employed large-section rectangular pipe jacking (9.1 m × 5.5 m) to over-cross existing metro tunnels, utilizing self-propelled counterweight rail cars with segmented cement block loading (2.1 t/m) to mitigate tunnel heave induced by soil unloading. The solution integrated EPB shield technology with controlled face pressure (1.2–1.8 bar) and thixotropic slurry lubrication (bentonite-CMC) to reduce frictional resistance, complemented by an automated monitoring system for real-time adjustment of jacking speed (10–20 mm/min) and grouting pressure (100 kN/m2). These measures successfully reduced vertical and horizontal tunnel displacements by 30.3–37.1% and 55.9–61.6%, respectively, maintaining deformations within 5 mm while ensuring uninterrupted metro operation.
The methodology proves particularly effective in soft clay, high-water-content strata, and clay–silt composite formations where unloading effects induce significant ground deformation. The counterweight system demonstrates excellent performance in controlling soil rebound and groundwater buoyancy effects. The successful deformation control achieved makes this approach particularly valuable for urban dense areas with shallow overburden (4–10 m) and close-clearance crossings (<1D) beneath sensitive infrastructure like operational metro lines and pipelines, with potential applications in utility tunnels and other large-section underground developments. However, in hard rock formations or deep overburden conditions where unloading-induced deformation is not the primary concern, this method may not deliver optimal performance.

7. Conclusions

This paper presents a case study of a large-section rectangular pipe-jacking tunnel passing above an operational subway tunnel. The study includes a detailed examination of deformation control measures during construction, three-dimensional numerical simulations of the construction process, and corresponding on-site monitoring data. The key conclusions are as follows:
(1)
During pipe-jacking excavation, the unloading effect from the upper section causes uplift of the existing subway tunnel, with the maximum uplift occurring at the central axis of the pipe-jacking tunnel. The vertical displacement of the tunnel evolves in three phases: initial settlement, rapid uplift transition, and stable uplift.
(2)
The lateral displacement of the existing tunnel during pipe jacking is influenced by both the unloading effect and the compression from the pipe jacking machine. The displacement process is divided into three phases: lateral extension, compression, and overall shift. In the first and third phases, the unloading effect predominates, while in the second phase, as the pipe jacking machine approaches the existing tunnel, the self-weight and grouting pressure from the machine become the dominant factors.
(3)
During pipe jacking, the maximum bending moment in the tunnel lining first increases, then decreases, and slightly rebounds. When the pipe jacking machine reaches a position 2 m in front of the tunnel, the compressive force from the machine causes lateral bias in the tunnel, leading to the maximum bending moment in the lining. Monitoring should be intensified at this stage to mitigate potential risks.
(4)
The addition of counterweights proves effective in mitigating the impact of pipe jacking on the subway tunnel. After introducing anti-floating counterweights inside the rectangular pipe jacking tunnel, the maximum uplift in the DL and UL tunnels decreased by 28.0% and 35.5%, respectively. The maximum horizontal displacement was reduced by 61.6% and 55.9%, and the maximum bending moment decreased by 32.9% and 28.8%, respectively. The use of counterweights significantly reduced the tunnel’s deformation, highlighting the importance of this measure in controlling construction-induced impacts.
These findings provide valuable insights for the design and construction of tunnels in proximity to existing infrastructure, particularly in mitigating the effects of pipe-jacking operations.

Author Contributions

Conceptualization, X.T.; methodology, X.S. and Z.S.; software, P.M.; validation, P.M. and S.F.; formal analysis, X.T.; investigation, X.S.; resources, X.T.; data curation, P.M.; visualization, Z.S. All authors have read and agreed to the published version of the manuscript.

Funding

This work was supported by the National Natural Science Foundation of China (Nos. 52308375 and 52178393), the Shaanxi Province Postdoctoral Science Foundation (2023BSHEDZZ273), and the China Postdoctoral Science Foundation (2024MD753967).

Data Availability Statement

The original contributions presented in this study are included in the article. Further inquiries can be directed to the corresponding author.

Acknowledgments

The present work is subsidized and supported by the National Natural Science Foundation of China (Nos. 52308375, 52178393), the Shaanxi Province Postdoctoral Science Foundation (2023BSHEDZZ273), and the China Postdoctoral Science Foundation (2024MD753967). The authors gratefully acknowledge the financial support.

Conflicts of Interest

Author Shengyuan Fanwas employed by the company China Railway 20th Bureau Group Co., Ltd. The remaining authors declare that the research was conducted in the absence of any commercial or financial relationships that could be construed as a potential conflict of interest.

References

  1. Song, Z.P.; Wu, Y.C.; Zhang, Y.W.; Wang, K.S.; Tian, J.L.; Tian, X.X. Deformation Response of a Pipeline to Nearby Deep Foundation Pit Excavation: Numerical Simulations and Field Tests. Appl. Sci. 2023, 13, 6597. [Google Scholar] [CrossRef]
  2. Tang, J.F.; Xu, J.K.; Zhou, D.Z.; Huang, D.; Zeng, K.; Li, Y.H.; Chen, Z. Ground Surface Deformation Caused by Pipe Jacking Construction in a Soft Soil Area: An Experiment-Based Study. Buildings 2023, 13, 1628. [Google Scholar] [CrossRef]
  3. Zhang, S.; Xu, X.; Luo, F.; Shi, T.; Xu, T.; Zhang, P. Field Test and Numerical Simulation Study on Pipe Sticking of Pipe Jacking in Composite Stratum. Buildings 2024, 14, 3992. [Google Scholar] [CrossRef]
  4. Wu, X.; Xu, J.; Wang, S.; Sha, P.; Han, Z.; Chen, X.; Shu, S.; Qiao, W.; Zeng, X. Ground Deformation of Shield Tunneling through Composite Strata in Coastal Areas. Buildings 2024, 14, 19. [Google Scholar] [CrossRef]
  5. Liu, X.; Fang, Q.; Zhang, D. Mechanical responses of existing tunnel due to new tunnelling below without clearance. Tunn. Undergr. Space Technol. 2018, 80, 44–52. [Google Scholar] [CrossRef]
  6. Weng, X.; Yu, H.; Niu, H.; Hu, J.; Han, W.; Huang, X. Interactive effects of crossing tunnel construction on existing tunnel: Three-dimensional centrifugal test and numerical analyses. Transp. Geotech. 2022, 35, 100789. [Google Scholar] [CrossRef]
  7. Fang, Q.; Liu, X.; Zeng, K.H.; Zhang, X.D.; Zhou, M.Z.; Du, J.M. Centrifuge modelling of tunnelling below existing twin tunnels with different types of support. Undergr. Space 2022, 7, 1125–1138. [Google Scholar] [CrossRef]
  8. Lin, X.T.; Chen, R.P.; Wu, H.N.; Cheng, H.Z. Deformation behaviors of existing tunnels caused by shield tunneling undercrossing with oblique angle. Tunn. Undergr. Space Technol. 2019, 89, 78–90. [Google Scholar] [CrossRef]
  9. Liu, H.; Li, P.; Liu, J. Numerical investigation of underlying tunnel heave during a new tunnel construction. Tunn. Undergr. Space Technol. 2011, 26, 276–283. [Google Scholar] [CrossRef]
  10. Chen, R.P.; Lin, X.T.; Kang, X.; Zhong, Z.Q.; Liu, Y.; Zhang, P.; Wu, H.N. Deformation and stress characteristics of existing twin tunnels induced by close-distance EPBS under-crossing. Tunn. Undergr. Space Technol. 2018, 82, 468–481. [Google Scholar] [CrossRef]
  11. Jin, D.; Yuan, D.; Li, X.; Zheng, H. An in-tunnel grouting protection method for excavating twin tunnels beneath an existing tunnel. Tunn. Undergr. Space Technol. 2018, 71, 27–35. [Google Scholar] [CrossRef]
  12. Liu, X.; Fang, Q.; Zhang, D.; Wang, Z. Behaviour of existing tunnel due to new tunnel construction below. Comput. Geotech. 2019, 110, 71–81. [Google Scholar] [CrossRef]
  13. Zhai, L.H.; Cai, G.S.; Liang, Y.H.; Guan, S.X.; Wang, S.Y.; Liaquat, L. Structural Behaviors of Large-Section Mine Tunnels Undercrossing Existing Metro Lines. Buildings 2023, 13, 1771. [Google Scholar] [CrossRef]
  14. He, H.J.; Wang, S.; Shen, W.; Zhang, W. The influence of pipe-jacking tunneling on deformation of existing tunnels in soft soils and the effectiveness of protection measures. Transp. Geotech. 2023, 42, 101061. [Google Scholar] [CrossRef]
  15. Liang, R.; Xia, T.; Hong, Y.; Yu, F. Effects of above-crossing tunnelling on the existing shield tunnels. Tunneling Undergr. Space Technol. 2016, 58, 159–176. [Google Scholar] [CrossRef]
  16. Zhang, D.W.; Liu, B.; Qin, Y.J. Construction of a large-section long pedestrian underpass using pipe jacking in muddy silty clay: A case study. Tunn. Undergr. Space Technol. 2016, 60, 151–164. [Google Scholar] [CrossRef]
  17. Xu, X.; Tong, L.; Li, Z.; Liu, X.; Hu, Q.; Yao, H.; Li, J. Influence of extreme shallow jacked box tunnelling on underlying metro tunnels: A case study. Undergr. Space 2023, 12, 234–250. [Google Scholar] [CrossRef]
  18. Li, Z.; Weng, X.; Cui, Y. Study on the influence of pipe jacking construction on existing subway tunnels. Environ. Earth Sci. 2024, 83, 651. [Google Scholar] [CrossRef]
  19. Qi, W.; Yang, Z.; Jiang, Y.; Shao, X.; Yang, X.; He, Q. Structural Deformation of Existing Horseshoe-Shaped Tunnels by Shield Overcrossing. KSCE J. Civ. Eng. 2021, 25, 735–749. [Google Scholar] [CrossRef]
  20. He, J.; Yang, Z.; Zhang, X. Effect of Undercrossing Shield Tunnels Excavation on Existing Rectangular Pipe-Jacking Tunnels. Appl. Sci. 2023, 13, 12235. [Google Scholar] [CrossRef]
  21. Yan, Y.C.; Zhang, M.X.; Cao, M.J. Study on the Effect of Large Cross-Section Quasi-Rectangular Pipe Jacking near Side Crossing Viaduct Piles in Soft Soil Areas. Appl. Sci. 2023, 13, 9799. [Google Scholar] [CrossRef]
  22. Li, X.G.; Yuan, D.J. Response of a double-decked metro tunnel to shield driving of twin closely under-crossing tunnels. Tunn. Undergr. Space Technol. Inc. Trenchless Technol. Res. 2012, 28, 18–30. [Google Scholar] [CrossRef]
  23. He, Y.J.; Cheng, J.; Shi, Z.L.; Zhang, B.; Chen, L.; Li, X.; Wang, X.L.; Zhang, P. Research on Axial Stress and Strain Characteristics of Reinforced-Concrete Curved Pipe Jacking in Power Tunnels. Buildings 2024, 14, 3030. [Google Scholar] [CrossRef]
  24. Fan, S.Y.; Song, Z.P.; Xu, T.; Wang, K.M.; Zhang, Y.W. Tunnel deformation and stress response under the bilateral foundation pit construction: A case study. Arch. Civ. Mech. Eng. 2021, 21, 19. [Google Scholar] [CrossRef]
  25. Gan, X.; Yu, J.; Gong, X.; Liu, N.; Zheng, D. Behaviours of existing shield tunnels due to tunnelling underneath considering asymmetric ground settlements. Undergr. Space 2022, 7, 882–897. [Google Scholar] [CrossRef]
  26. Miao, L. Deformations of Subway Tunnels Induced by the Overcrossing Jacked Box Tunnels. Symmetry 2021, 13, 1800. [Google Scholar] [CrossRef]
  27. Zhang, Z.; Huang, M. Geotechnical influence on existing subway tunnels induced by multiline tunneling in Shanghai soft soil. Comput. Geotech. 2014, 56, 121–132. [Google Scholar] [CrossRef]
  28. Lai, H.; Zheng, H.; Chen, R.; Kang, Z.; Liu, Y. Settlement behaviors of existing tunnel caused by obliquely under-crossing shield tunneling in close proximity with small intersection angle. Tunn. Undergr. Space Technol. 2020, 97, 103258. [Google Scholar] [CrossRef]
  29. Wang, Z.Y.; Shen, X.L.; Tian, X.X.; Song, Z.P.; Zhou, P.Y. Study on the Influence and Deformation Control of Rich Water Foundation Excavation on Adjacent Buildings. Buildings 2025, 15, 52. [Google Scholar] [CrossRef]
Figure 1. Profile of Suzhou Chengbei Road Comprehensive Pipe Gallery.
Buildings 15 02105 g001
Figure 2. Schematic diagram of a self-moving counterweight device.
Buildings 15 02105 g002
Figure 3. Pipe-jacking construction process.
Buildings 15 02105 g003
Figure 4. Numerical model diagram. (a) Schematic diagram of stratigraphic dimensions; (b) schematic diagram of pipe jacking and existing tunnels; (c) counterweight for the jacking process.
Buildings 15 02105 g004
Figure 5. Schematic diagram of construction force simulations. (a) Palm face thrust; (b) jacking force; (c) grouting pressure.
Buildings 15 02105 g005
Figure 6. Pipe jacking up through subway tunnel at different stages.
Buildings 15 02105 g006
Figure 7. Surface subsidence curve.
Buildings 15 02105 g007
Figure 8. Curve of final surface settlement variation. (a) DL tunnel; (b) UL tunnel.
Buildings 15 02105 g008
Figure 9. Curve of final surface settlement variation. (a) Counterweights added; (b) without counterweights.
Buildings 15 02105 g009
Figure 10. Vertical displacement curve of subway tunnel without added counterweight. (a) DL tunnel; (b) UL tunnel.
Buildings 15 02105 g010
Figure 11. Vertical displacement curve of the subway tunnel with counterweight. (a) DL tunnel; (b) UL tunnel.
Buildings 15 02105 g011
Figure 12. Lateral displacement curve of subway tunnel without added counterweight. (a) DL tunnel; (b) UL tunnel.
Buildings 15 02105 g012
Figure 13. Lateral displacement curve of the subway tunnel with counterweight. (a) DL tunnel; (b) UL tunnel.
Buildings 15 02105 g013
Figure 14. Tunnel bending moment variation curve without counterweight.
Buildings 15 02105 g014
Figure 15. Tunnel bending moment variation curve with counterweight.
Buildings 15 02105 g015
Figure 16. Surface subsidence monitoring map.
Buildings 15 02105 g016
Figure 17. Tunnel monitoring cross-section diagram.
Buildings 15 02105 g017
Figure 18. Surface subsidence monitoring curves.
Buildings 15 02105 g018
Figure 19. Settlement trench curves.
Buildings 15 02105 g019
Figure 20. Vertical displacement monitoring curve of tunnel. (a) DL tunnel; (b) UL tunnel.
Buildings 15 02105 g020
Figure 21. Lateral displacement monitoring curve of tunnel. (a) DL tunnel; (b) UL tunnel.
Buildings 15 02105 g021
Table 1. Physical and mechanical parameters of strata and structures.
Material TypeYoung’s Modulus
(MPa)
Poisson’s
Ratio
Unit Weight (kN/m3)Cohesion (kPa)Friction (°)
Fill16.40.2519.1249.4
Clay26.40.319.447.915.3
Silty clay23.10.318.51314.3
Silt64.30.320.51726.4
Silty fine sand90.20.2720.80.132
Silty clay23.10.318.51819
Clay26.40.319.447.915.3
Silt64.30.318.51314.3
Counterweights26,0000.1525--
Tunnel segment34,5000.1525--
Pipe gallery34,5000.1525--
Disclaimer/Publisher’s Note: The statements, opinions and data contained in all publications are solely those of the individual author(s) and contributor(s) and not of MDPI and/or the editor(s). MDPI and/or the editor(s) disclaim responsibility for any injury to people or property resulting from any ideas, methods, instructions or products referred to in the content.

