Article

Integration of Drone-Based 3D Scanning and BIM for Automated Construction Progress Control

by
Nerea Tárrago Garay
1,*,
Jose Carlos Jimenez Fernandez
1,*,
Rosa San Mateos Carreton
1,
Marco Antonio Montes Grova
2,
Oskari Kruth
3 and
Peru Elguezabal
4
1
TECNALIA, Basque Research and Technology Alliance (BRTA), 48160 Derio, Spain
2
Advanced Center for Aerospace Technologies (CATEC), 41309 Seville, Spain
3
FIRA Rakennus Oy, 01530 Vantaa, Finland
4
Mechanical Engineering Department, University of the Basque Country UPV/EHU, 48013 Bilbao, Spain
*
Authors to whom correspondence should be addressed.
Buildings 2025, 15(19), 3487; https://doi.org/10.3390/buildings15193487
Submission received: 25 August 2025 / Revised: 12 September 2025 / Accepted: 17 September 2025 / Published: 26 September 2025
(This article belongs to the Special Issue Robotics, Automation and Digitization in Construction)

Abstract

The work progress control is a key aspect for correcting deviations in construction, but currently is a task still carried out very manually by personnel moved to the execution place. This work proposes to digitize and automate the procedure through the combination and contrast of digital models of the actual state of the work and the theoretical planning. The models of the real situation are generated from the laser scanning executed by drones, the theoretical planning is reflected in the BIM4D models of the project, and their combination is automated with Feature Manipulation Engine (FME) visual programming routines. A web-based digital twin platform allows access to the end user of the service in an agile way. The methodology developed has been validated with its application on a residential building in the structural erection phase in Helsinki (Finland).

1. Background

Overview of Site Progress Control: Barriers and Challenges

The primary objective of autonomous monitoring in construction project progress is the real-time detection and mitigation of potential deviations in the construction process. Automatically collected, machine-readable progress data enables significantly faster decision-making compared to traditional human observation—both in identifying deficiencies and responding to them. This data can be leveraged to generate valuable insights that support scheduling, cost control, quality assurance, and occupational safety processes [1].
Human-collected data often contains errors, leading to fragmented datasets and, consequently, an incomplete digital twin. In contrast, machines can produce far more accurate information about construction processes and analyzing it to support human decision-making. This operational model allows human resources to be reallocated from repetitive, routine tasks to cognitively demanding work that requires creative reasoning.
Moreover, high-quality data collected automatically from construction projects can serve as training material for the planning of future projects, enabling process optimization in accordance with the principles of continuous improvement.
Nowadays, the construction progress control task requires specific dedication of technical staff to capture the information of the executed elements onsite. In addition to the time consumption and its derived costs, the current procedure for this onsite data capture, and for its comparison with the design plan, have a high manual component with which errors can be incurred. This traditional approach requires human inspectors to conduct onsite observations and manually record progress, which is a labor-intensive and slow process [2]. This reliance on manual data entry introduces a considerable risk of inaccuracies [3].
The time-consuming nature of manual data collection directly translates to increased costs. A survey of construction and engineering executives revealed that nearly half still depend on manual methods to gather crucial job site data. These outdated processes slow down decision-making, negatively impact work quality, and result in unnecessary expenses. Furthermore, it is worth noting the need of personnel/workforce, which is a special problem given its current shortage.
With the aim of moving towards more efficient and automated processes, a new construction progress control methodology has been developed that, mainly, (a) on one hand, automates the as-built information capture by means of sensors that travel the facility semi-autonomously (in this case lidar on board a drone) and (b) on the other hand, automates the comparison of the actually built with the project planned through the combination of their spatial digital models (3D Point Cloud from scans and BIM model of the project). Unlike conventional Scan-vs.-BIM approaches that rely on model transformations, the proposed workflow directly compares IFC-based BIM4D elements and LiDAR point clouds within FME. This reduces data loss, lowers processing time, and increases accessibility for non-programmers, advancing current digital twin frameworks. Additionally, the detailed digital record of the work status progress, that is generated with the proposed solution, greatly improves the traceability of the construction process.

2. Literature Review

In recent years, several approaches have been developed that address the work progress control by the combination of information from onsite captures and the design models. However, neither focuses on the direct combination of both models.
Some achievements are based on technologies such as the point cloud segmentation and the development of Deep Learning algorithms for the detection of elements with specific morphologies as columns [4], others transform or extract geometric entities of the same typology (such as surfaces) from both models that are contrasted later [5], or are based on the transformation of the two models into the same format, either by generating an as built BIM model from the scan point cloud that is compared later with the design BIM [6] or on the contrary, by transforming the BIM model into a project point cloud that is compared later with the scan point cloud [7,8,9]. Other approaches differ mainly from the current one because although the process has points in common, its final objective is not the construction progress monitoring, focusing on other aspects, such as the evaluation of deformations of the built element with respect to its ideal situation to identify integrity losses [10].
The main advantage of the proposed methodology is that it simplifies the procedure by directly handling and contrasting the two types of digital models: project BIM model and scan 3D point cloud.
Concerning the generation of maps or 3D models using LiDAR sensors from autonomous vehicles, two approaches could be followed: those where the map is generated online, in real time, during the execution of the inspection process; and those where the map is created offline, which requires significantly more time.
On the one hand, SLAM techniques are used to generate online maps. SLAM is a computational technique that allows a robot to create a map of an unknown environment while simultaneously tracking its own position within that map. These types of techniques include, among other things, components dedicated to loop closure, which will allow for the correction of any drift committed by the vehicle during its movement, and optimization, which will allow for the refinement of the map generated from the loop closure. In LIO-SAM [11], factor graph optimization is used to estimate the robot localization. This factor graph is optimized using an incremental smoothing mapping [12]. There are other approaches to the SLAM problem based on Kalman filters, such as FAST-LIVO [13]. In this algorithm, in addition to integrating LiDAR, visual sensors are added with the aim of adding real colors to the map generated in real time.
On the other hand, offline point cloud processing techniques are more computationally and time-consuming. That is why some implementations need to be optimized to work on GPUs [14]. There are also hybrid approaches, where information from photogrammetry techniques is merged with LiDAR data [15].

Technologies Enhancing of the Site Control New Methodology

The state of the technologies enhancing the new approach of the construction progress control is detailed below:
  • BIM Methodology including 4D planning
A BIM (Building Information Modeling) [16] model is a digital representation of a building that integrates both the geometric information of its elements, and all the additional information assigned to these objects in the project (materials, costs, maintenance...). It is characterized by being a collaborative model that integrates all the information of the project.
The BIM design models are analyzed by the construction company and transformed into a pre-construction model that includes the planning of the tasks to be carried out onsite, following the construction company’s logic based on the available resources, both in terms of equipment and personnel. From these models, information can be extracted on each of the tasks to be carried out for the construction of each of the elements represented in the models, showing when they will be carried out and who will carry them out. This relationship between the elements to be built and the planning is carried out through a proprietary software ecosystem for the planning, control, and monitoring of construction projects based on BIM standards.
  • Drone—based onsite data capture
The use of aerial robots equipped with LiDAR sensors allows for quick scanning of the interior of a building. In addition, given the possibility of obstacles on the ground, uneven surfaces, or even holes, it can access areas that people with manual LiDAR are unable to reach. There are commercial drones that can automatically map their surroundings, but they have certain limitations: Skydio drones (Skydio, Inc., San Mateo, CA, USA) only work autonomously outdoors, where there is GNSS signal. In the case of Flyability Elios (Flyability SA, Paudex, Switzerland), it works in confined spaces where there is no GNSS signal, but it does not operate completely autonomously; rather, it is always controlled remotely by a pilot.
  • 3D Point cloud generation and process from scan sensors [17]
A 3D Point Cloud is a digital database that contains the spatial positioning (usually X, Y, Z coordinates) from points representing the surfaces of physical entities. In the case of Point Clouds generated from reality capture systems, the points are located on the outer surfaces of visible objects, because these are the points where the scanner’s light is reflected from an object or those that can be captured by a photogrammetric camera. Although continuous surfaces and objects can be perceived, the Point Cloud is a set of unrelated individual points. If the capture system is a camera, the cloud may also include color information, whereas if the capture system is only laser, the cloud will not have color information, although it will be able to include reflectivity of the material. Different point cloud processing algorithms are used for data cleaning and registration, and in recent years, some models have also been developed for their segmentation and object detection [18].
  • FME for Data integration
The development uses FME (Feature Manipulation Engine) [19], a tool for automating ETL (Extract, Transform, Load) processes involving spatial data. FME allows users to create workflows by connecting components called transformers, which handle tasks like data conversion, filtering, and validation. These workflows can be published as web services or APIs and used to send data to various destinations, including cloud storage and Digital Twin platforms.
Within the above technologies, the proposed methodology represents an advance, especially in the processes for the following:
-
Developing a fully autonomous aerial vehicle (drone) with the capability to navigate safely in close environments without GNSS signal and online mapping.
-
3D point clouds and BIM models integration automatization by visual programming with FME tool.

3. Materials and Methods

3.1. Design and Development of a Workflow for Automatic Control Monitoring

The following information is structured according to the phases of the construction project. The complete workflow is shown in Figure 1; its steps are explained in detail next in this section.
(a)
DESIGN PHASE
  • Project Information Model drafting according to Specific Requirements:
According to the designed methodology, the BIM model of the building must be available in IFC (Industry Foundation Classes) format. It may be in either IFC4 or IFC 2 × 3 format according to the current applicable standards. The IFC is a standardized, digital description of the buildings and other elements as the environment or the civil infrastructure. IFC format has been selected because it is an open, international standard, meant to be vendor-neutral, or agnostic, and usable across a wide range of hardware devices, software platforms, and interfaces for many different use cases.
The structure of an IFC file typically follows a tree-like format. At the top level, there are usually entities representing the overall project or building. At the bottom, the tree may end and contain actual physical built elements, such as walls and columns. It is important that each of the elements is classified according to its corresponding IFC type and should be labelled or uniquely identified. On the other hand, all relationships between the elements of this hierarchy must be established within the IFC.
The size of IFC files is also important in automation processes because files larger than 250 MB can slow down the execution of the process and are, therefore, not recommended.
The BIM model is usually generated using native software, such as Tekla, Revit, ArchiCAD, etc., by different experts depending on their specialization (structure, architecture, and installations). Exporting from this software to IFC format must be performed correctly for automated processes to function properly. Modeling software commonly allows for export standardization through predefined configurations, such as MDV (Model View Definition) files, which ensure interoperability between different domains.
Anyway, the BIM model must integrate the information of the execution time planning (BIM 4D—defining tasks, duration, interdependencies...). This way, the construction elements of the model are assigned a planned execution date, which allows the model to be filtered and the generation of submodels by sets of elements that must be executed on a certain date.
In the event of replanning during the work, the BIM model must be updated with this information.
  • Transformation of the project BIM model into a 3D reference point cloud for later scan positioning (optional)
The project BIM model and the subsequent scan point clouds must match their position and spatial orientation to be contrastable. This will be accomplished in all the cases where both models are geopositioned in global absolute coordinates or with the same reference system.
To resolve any other case, the BIM model is transformed into a point cloud that serves as a reference to position the point clouds generated in the in-situ scans accordingly.
This process only needs to be performed the first time. Once the drone flight captures the first Point Cloud and it is georeferenced with the Point Cloud obtained from the IFC, the subsequent Point Clouds already take this reference.
From the design BIM model, through a transformation that extracts points from their contour surfaces, reference 3D point clouds are generated. The process is automated by visual programming routines in an FME environment.
(b)
EXECUTION PHASE
  • Definition of the site control frequency
Based on the scheduling of the project, a frequency is established for the control activities that can be hourly, daily, weekly, biweekly, etc. According to this periodicity and the start and ending of the work tasks, specific dates and times of actions are established. These dates can be adjusted later depending on the actual pace of the work, if deviations to the original plan occur.
  • Scan of the construction site with Drone
For the dates established in the previous step, fully autonomous flights will be carried out in the designated area containing the area of interest. These flights can be designed by an operator, who defines the specific route they want to follow, or a map of the entire area can be created, and the route will be calculated automatically. Through these flights, and using the sensors on board the drone, 3D maps or scans of the area of interest will be generated.
  • Point cloud generation of the site
The product of the scan is a 3D point cloud with the position of points on the surface of the elements on which the light beam of the scanner laser implies. The methodology is based on a LIDAR-based capture by a drone, so these Point Clouds will contain three-dimensional positioning (x, y, z).
Only information from the exterior and accessible surfaces of the elements is captured, and this includes not only elements of interest but also all kinds of objects or obstacles present in the work. On one hand, groups of points can be found that correspond to objects/materials that do not constitute construction elements, and, on the other hand, there may be “shadowed” areas of elements that, although they have been executed, are not capturable by scanning.
Although the procedure can be adapted later to different formats, the PCD (Point Cloud Data, extension. pcd) file is considered as the selected format for 3D Point Clouds. This format is specifically designed to store 3D Point Cloud data.
A PCD file has two distinct parts: the header and the points themselves. The header is responsible for identifying and declaring general properties and must be encoded in ASCII (which implies that each entry in this format is delimited from the others using line breaks). Points data is included after the header and can be stored in ASCII or binary. The binary format is more compact and, therefore, takes less time to process. The binary is recommended for project operations. ASCII is only recommended for long-term final archiving, as it ensures more universal accessibility with standardized text abstraction that allows you to open it even in text editors.
(c)
DATA PROCESSING PHASE
  • Comparison of BIM4D model (filtered) with the onsite scan point cloud
This is the key part of the process to determine if each of the planned structural elements have been executed or not. This comparison is made for each specific date on which a work progress control activity is proposed.
The automation of the combination and comparison of both digital models of the building has been approached by the visual programming of routines in FME. The result of this combination is the establishment of which elements planned in the BIM model can be considered present in the point cloud of the capture, and, therefore, executed onsite.
There are two key aspects for the whole procedure: (1) each BIM element must have a unique identifier in the IFC file, so that any cross-referencing of information with the point cloud is linked by that identifier, and (2) the IFC property in which the new parameter is to be written must be defined, which will include the information of whether an element has been executed on a certain date, so that this information can be migrated with the file itself.
(d)
MONITORING AND VISUALIZATION PHASE
The monitoring and visualization phase plays a pivotal role in translating automated data analyses into intuitive, actionable insights for stakeholders involved in the management and supervision of construction works. The BIM updating service has been deployed as a web-based solution integrated into the Digital Twin platform, enabling real-time visibility of construction progress and deviations from schedule.
To ensure its usefulness and operational integration, the BIM updating process is fed by the Digital Twin’s data repository to access and cross-reference key data sources: the IFC model representing the planned structure, and the Point Cloud data captured by drones through regular LIDAR scans. By comparing the as-built 3D scan with the expected geometry of BIM elements planned for a given date, the system identifies whether specific tasks have been completed, remain pending, or are delayed. This assessment is then automatically encoded into a new enriched IFC file.
After each drone-based scanning session, the as-built data are processed through the implemented FME routines that directly enrich the IFC model with updated execution status. In the Helsinki case study, this update cycle was carried out on a weekly basis during the structural erection phase, but the frequency can be adapted depending on project needs and scanning schedules.
The updating process is largely automated, with FME scripts linking detected execution states to their corresponding IFC elements. However, in cases of data ambiguity or occlusion (e.g., shadowed areas or partially visible components), the workflow flags these elements for manual verification. In our study, fewer than 10% of elements required manual intervention to resolve discrepancies.
Once enriched, the updated IFC file is reintegrated into the BIM4D environment, allowing the project schedule to be dynamically adjusted. This monitoring and visualization strategy ensures that the rich digital representation of the construction site evolves in synchronization with the real-world progress, supporting transparency, accountability, and proactive decision-making across the full spectrum of stakeholders.

3.2. Development of KEY Activities

  • Development and adaptation of the drone for the scan of the construction site (EXECUTION PHASE)
To carry out the process of generating 3D maps of the construction site autonomously, a custom aerial vehicle has been designed and manufactured to fit the needs of the environment. It has compact dimensions, with a circumference of 80 cm including the impact protection system, allowing it to work in confined spaces and move between different spaces in the building under construction. In addition, it carries a high-resolution 3D LiDAR, Ouster OS0 Rev7 (Ouster, Inc., San Francisco, CA, USA) with 128 channels, and an Intel NUC 10th gen (Intel Corporation, Santa Clara, CA, USA) as an onboard computer to perform all the computing and generate the map. In Figure 2, the CAD and the real aerial robot are shown, which has been called CATEC CADRIN.
The autonomous navigation system integrates onboard LiDAR sensing with reactive SLAM. The obstacle detection range is ~30 m, with <200 ms response latency. Tests under dynamic site conditions demonstrated reliable avoidance of moving obstacles, validating suitability for real construction environments.
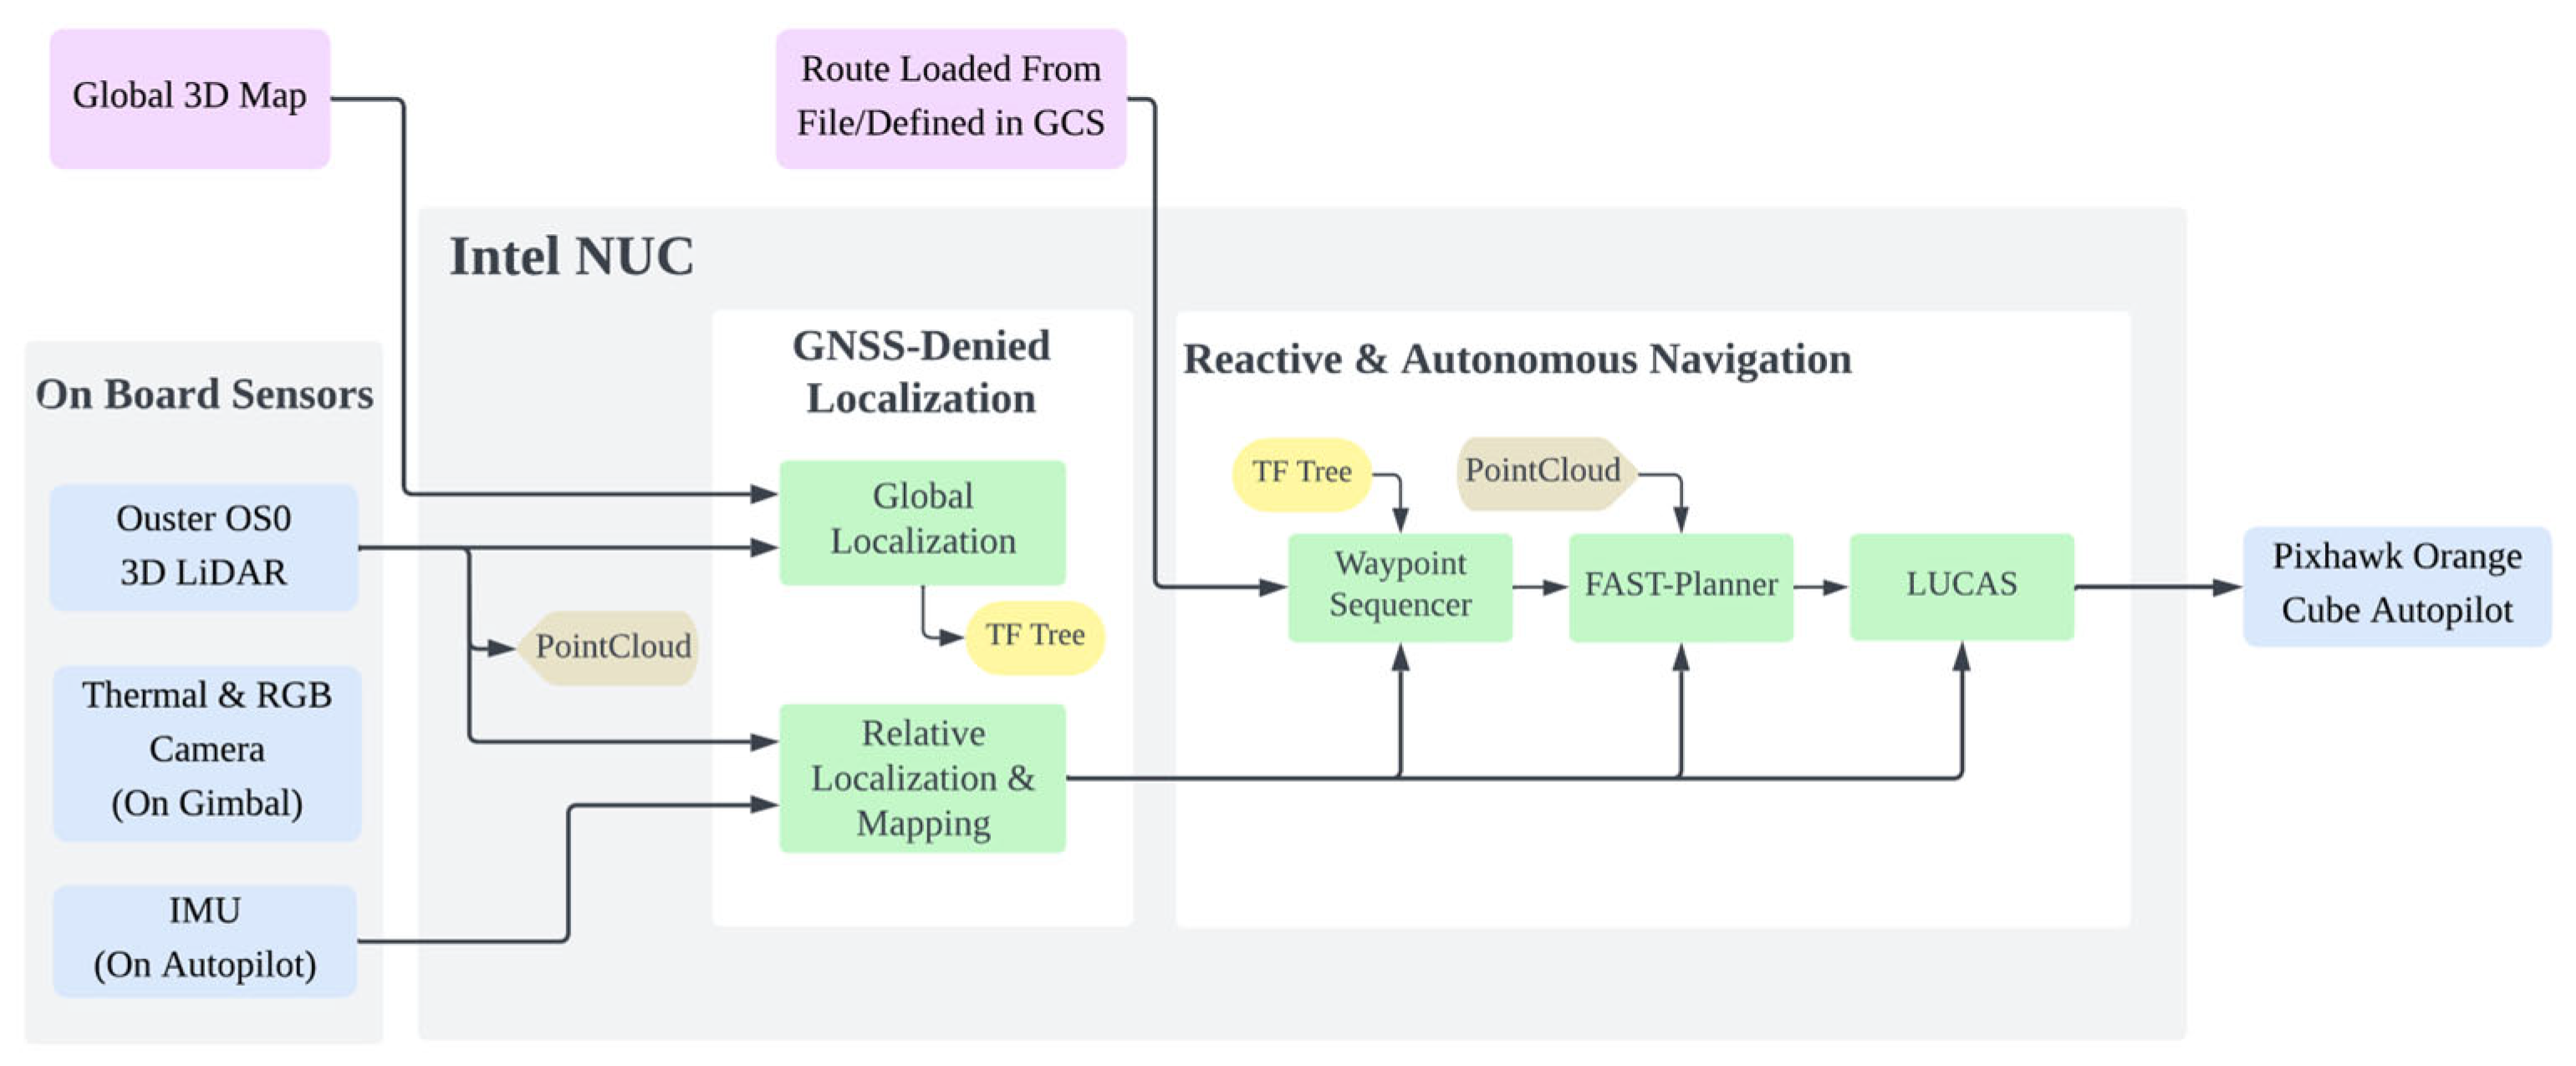
Building a 3D map of the construction site online in a totally autonomous and safe way from takeoff to landing, the proposed software architecture is shown in Figure 3. As can be seen, the software running on the onboard computer, Intel NUC, is divided into two components: the localization module in a GNSS-Denied environment and the module responsible for autonomous and reactive navigation.
Below, each of the modules that make up the autonomous system will be briefly explained:
-
GNSS-Denied Localization
Given the type of work environment and application in this use case, there will be no global referencing system. Through relative localization, the aerial robot computes its own localization with an origin at the takeoff point, as that is where the algorithm has started. Since this take-off location may vary, the complete system requires a second localization system that establishes the 3D transformation between the initial UAV pose and the global reference system, expressed in FLU coordinates at the origin of the global map. This global map can be obtained from various external sources: in this case, exported from the building’s BIM.
LIO-SAM [9], algorithm was used as a relative localization system and mapping, integrating the autopilot’s IMU measurements and the onboard 3D LiDAR scans.
Global localization will be based on point cloud matching or point cloud registration. Most advanced approaches are based on geometric features, such as corners or planes, extracted from the sensor’s point cloud.
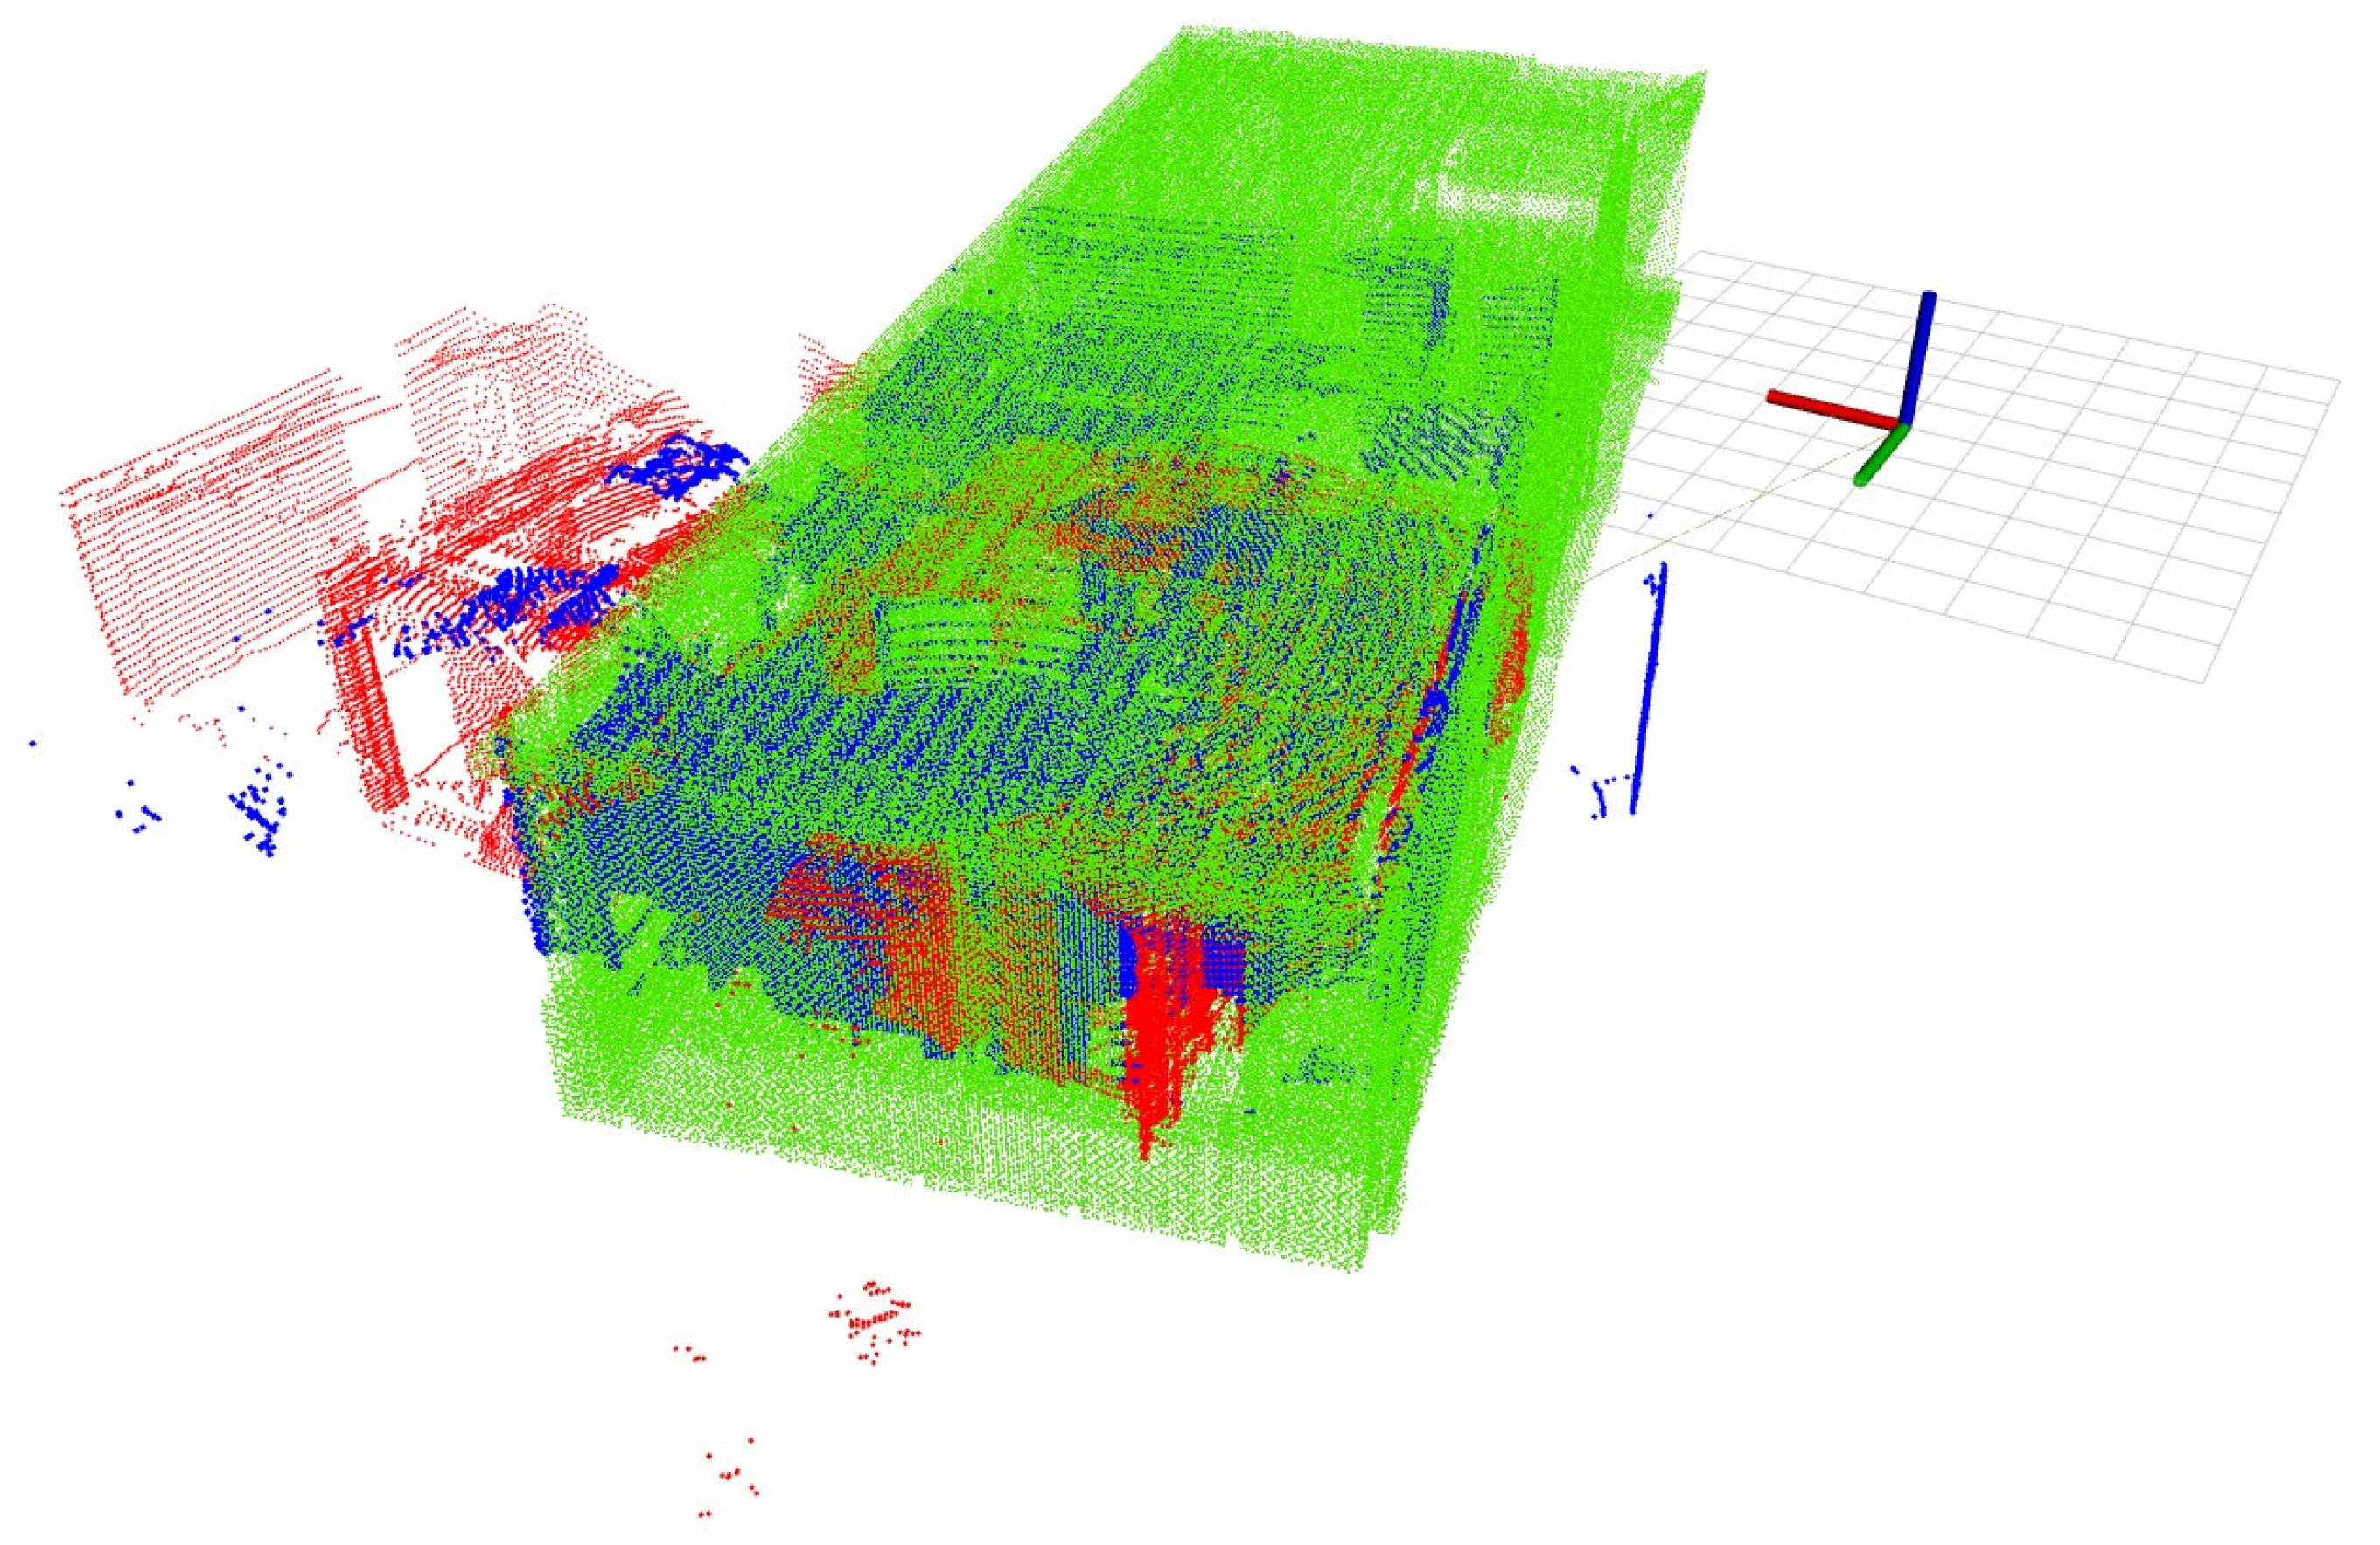
The algorithm deployed is DLL [20]; the main idea is to select points or regions within the point cloud that are easy to identify and match them with the scene, observed from different viewpoints or distances. These feature-based methods are accurate and computationally efficient. An example of this process of alignment between point clouds to obtain the global location between the starting point of the relative location and the BIM map is shown in Figure 4.
To quantify alignment accuracy, a set of control points distributed across structural elements shall be measured using a total station and compared against their corresponding locations in the aligned point cloud. The resulting root means square error (RMSE) of alignment, and the maximum deviation in occluded regions can evaluate if the DLL algorithm provided sufficiently precise alignment for automated progress assessment at building scale.
-
Reactive and Autonomous Navigation
The operator is given the possibility to design a waypoint route for the aerial robot inside the construction site.
However, it is assumed that the operator is not an experienced person in route design and there could be an obstacle between two consecutive waypoints and induce an accident during autonomous operation. Another possible cause of error is the appearance of an obstacle that was not previously known whether static or dynamic. This is why it is necessary to create and design navigation algorithms that are as reactive as possible, since this can be related to safe operations.
Furthermore, since the aim is to implement fully autonomous operations from takeoff to landing of the aerial robot, an extra layer of security and control of the aircraft must be created.
The first component is the waypoint sequencer, whose purpose is to manage the entire flight plan that the aircraft must follow. It will read the flight path provided by the operator and convert it to the appropriate reference system for the rest of the navigation system. After that, Fast-Planner [21] will generate a safe, obstacle-free route based on information about the aircraft’s environment using the point cloud and the target waypoint. Finally, the LUCAS [22] component will implement both the state machine that manages the aircraft’s autonomy and the low-level controller that allows the aircraft’s trajectories to be tracked. This component, through a MAVLink abstraction layer, will send commands to the drone’s autopilot.
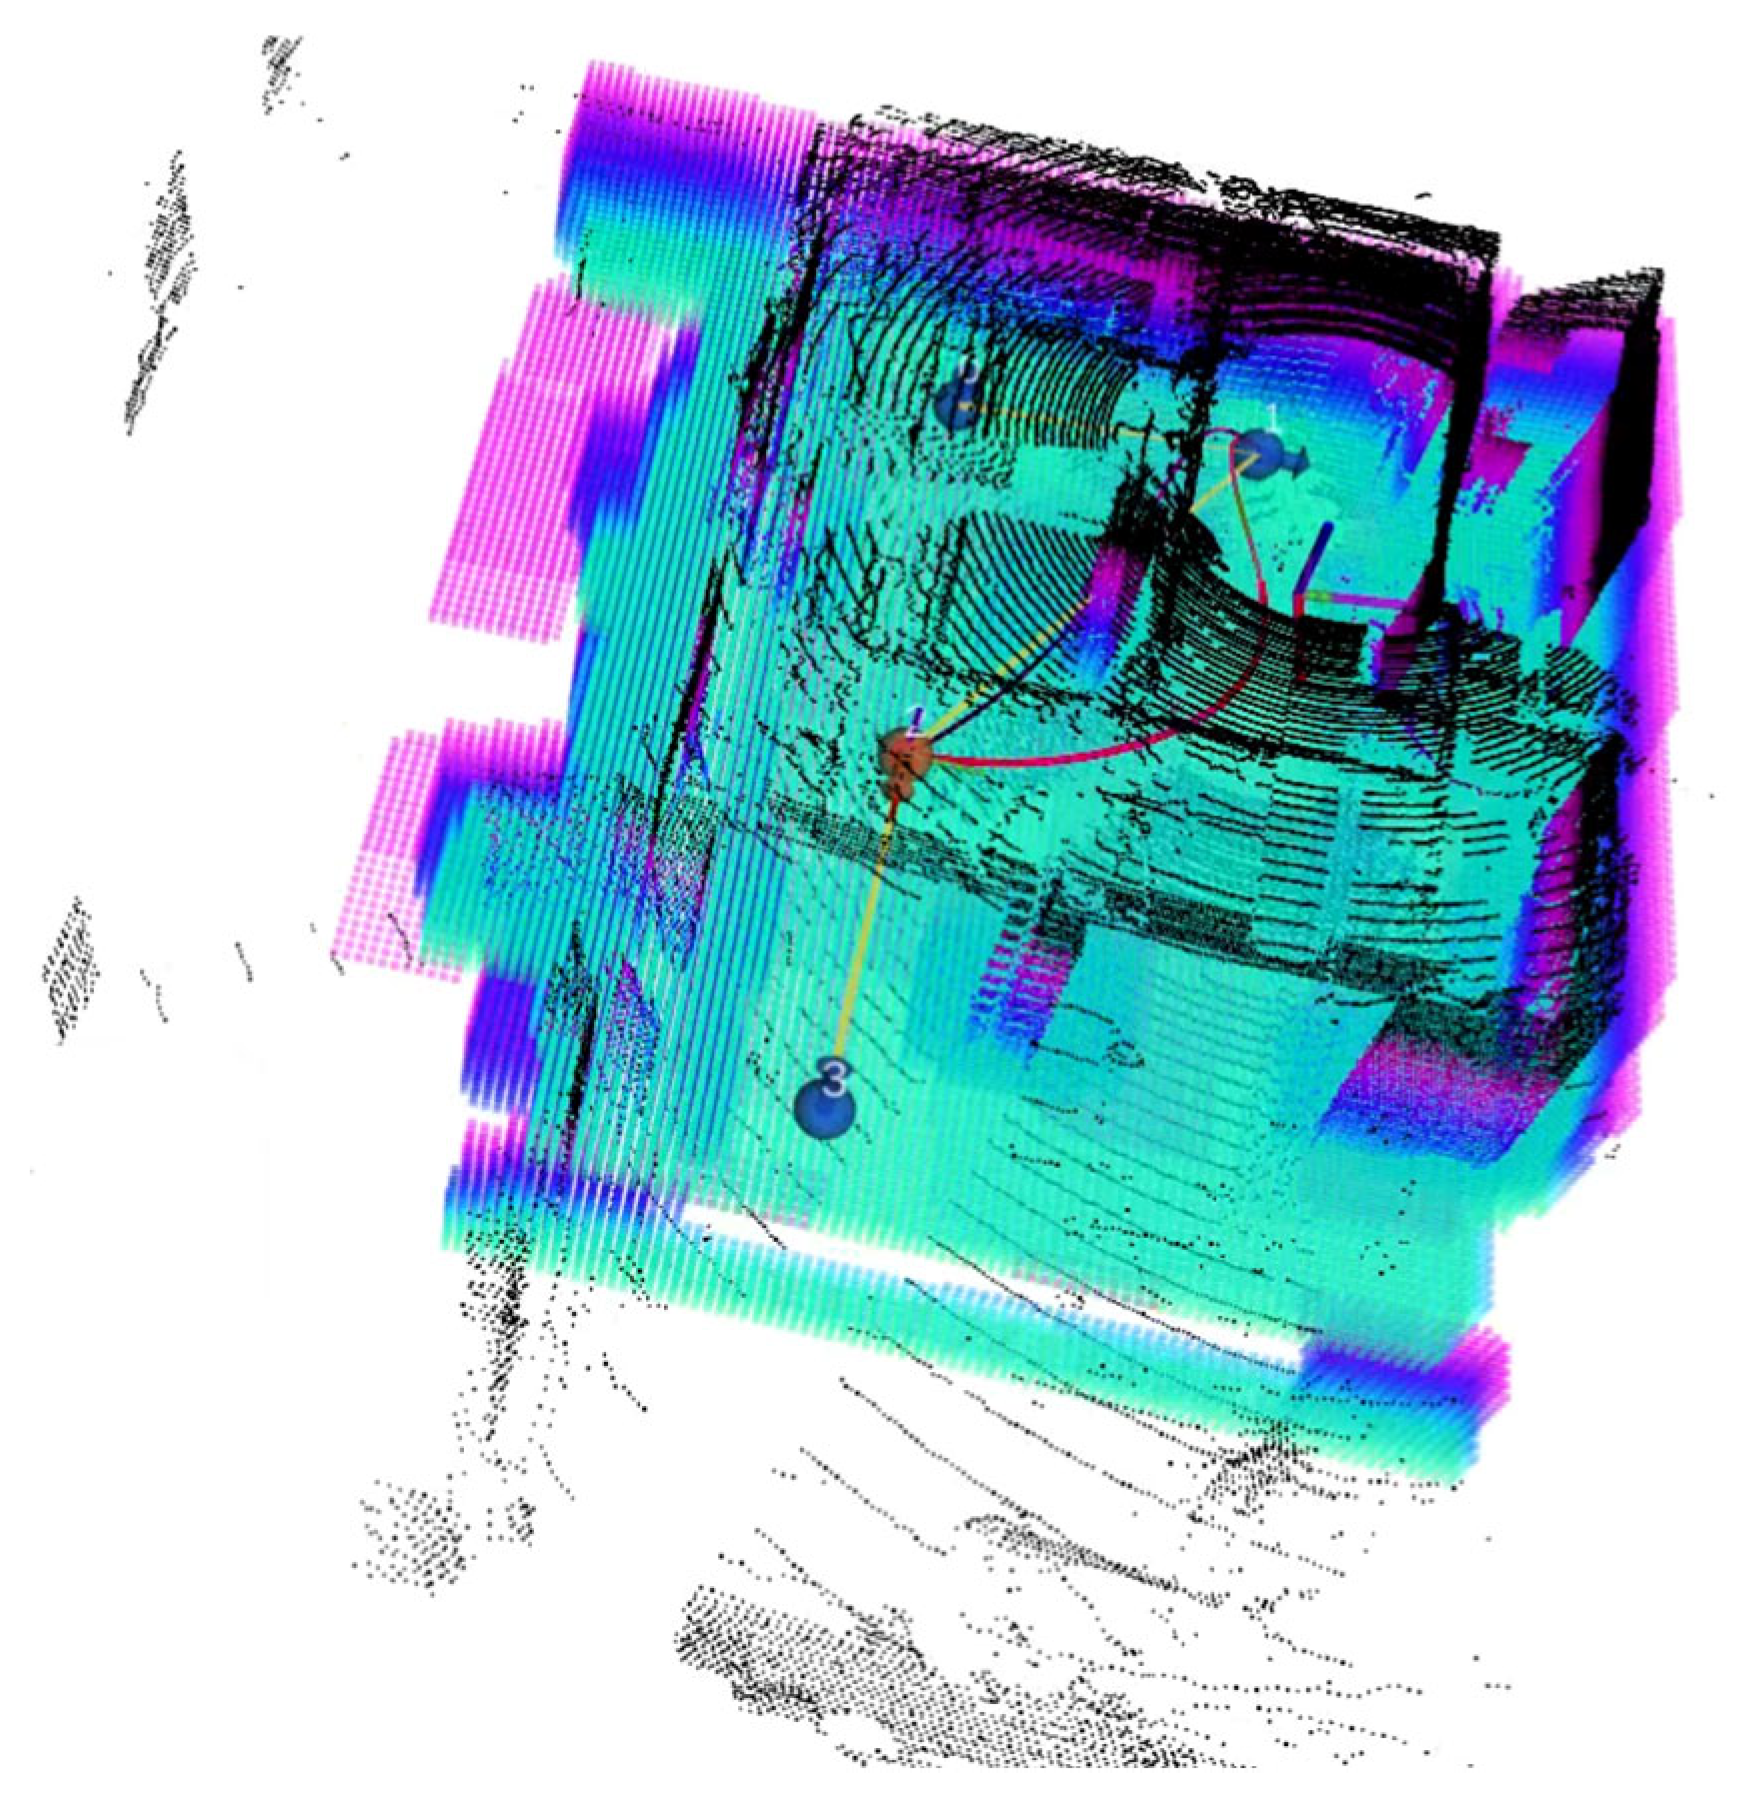
Figure 5 shows the information for the whole autonomous system. Two-point clouds are displayed, one in black, representing the LiDAR scans at that moment in time, and one in blue and violet, representing the map being constructed in real time to avoid obstacles and generate a safe route. The yellow lines and spheres correspond to the route predefined by the computer, and the red line is the safe route generated by the navigation system and the one that the aircraft will follow. Finally, the position of the aircraft is represented by an axis.
  • Data processing with FME for the 3D models integration (DESIGN and DATA PROCESSING PHASES)
Two different automatization procedures have been developed in FME: the generation of a reference point cloud from the design BIM model (DESIGN PHASE) and the comparison of the planned BIM model with the onsite scan point cloud (EXECUTION PHASE).
-
Reference point cloud generation:
The transformation procedure (shown in Figure 6) consists of reading the IFC file of the BIM model, isolate the construction elements under analysis (columns, beams, slabs, walls) and extract points from the surfaces of these elements (the density of the generated point cloud can be adjusted by varying the point interval). This way, groups/clusters of points associated with each construction element from the IFC and located on its surfaces (both interior and exterior) are created. Finally, the different groups are joined into a single 3D point cloud and written to a “.pcd” format file.
-
Planned BIM model and scan point cloud comparison:
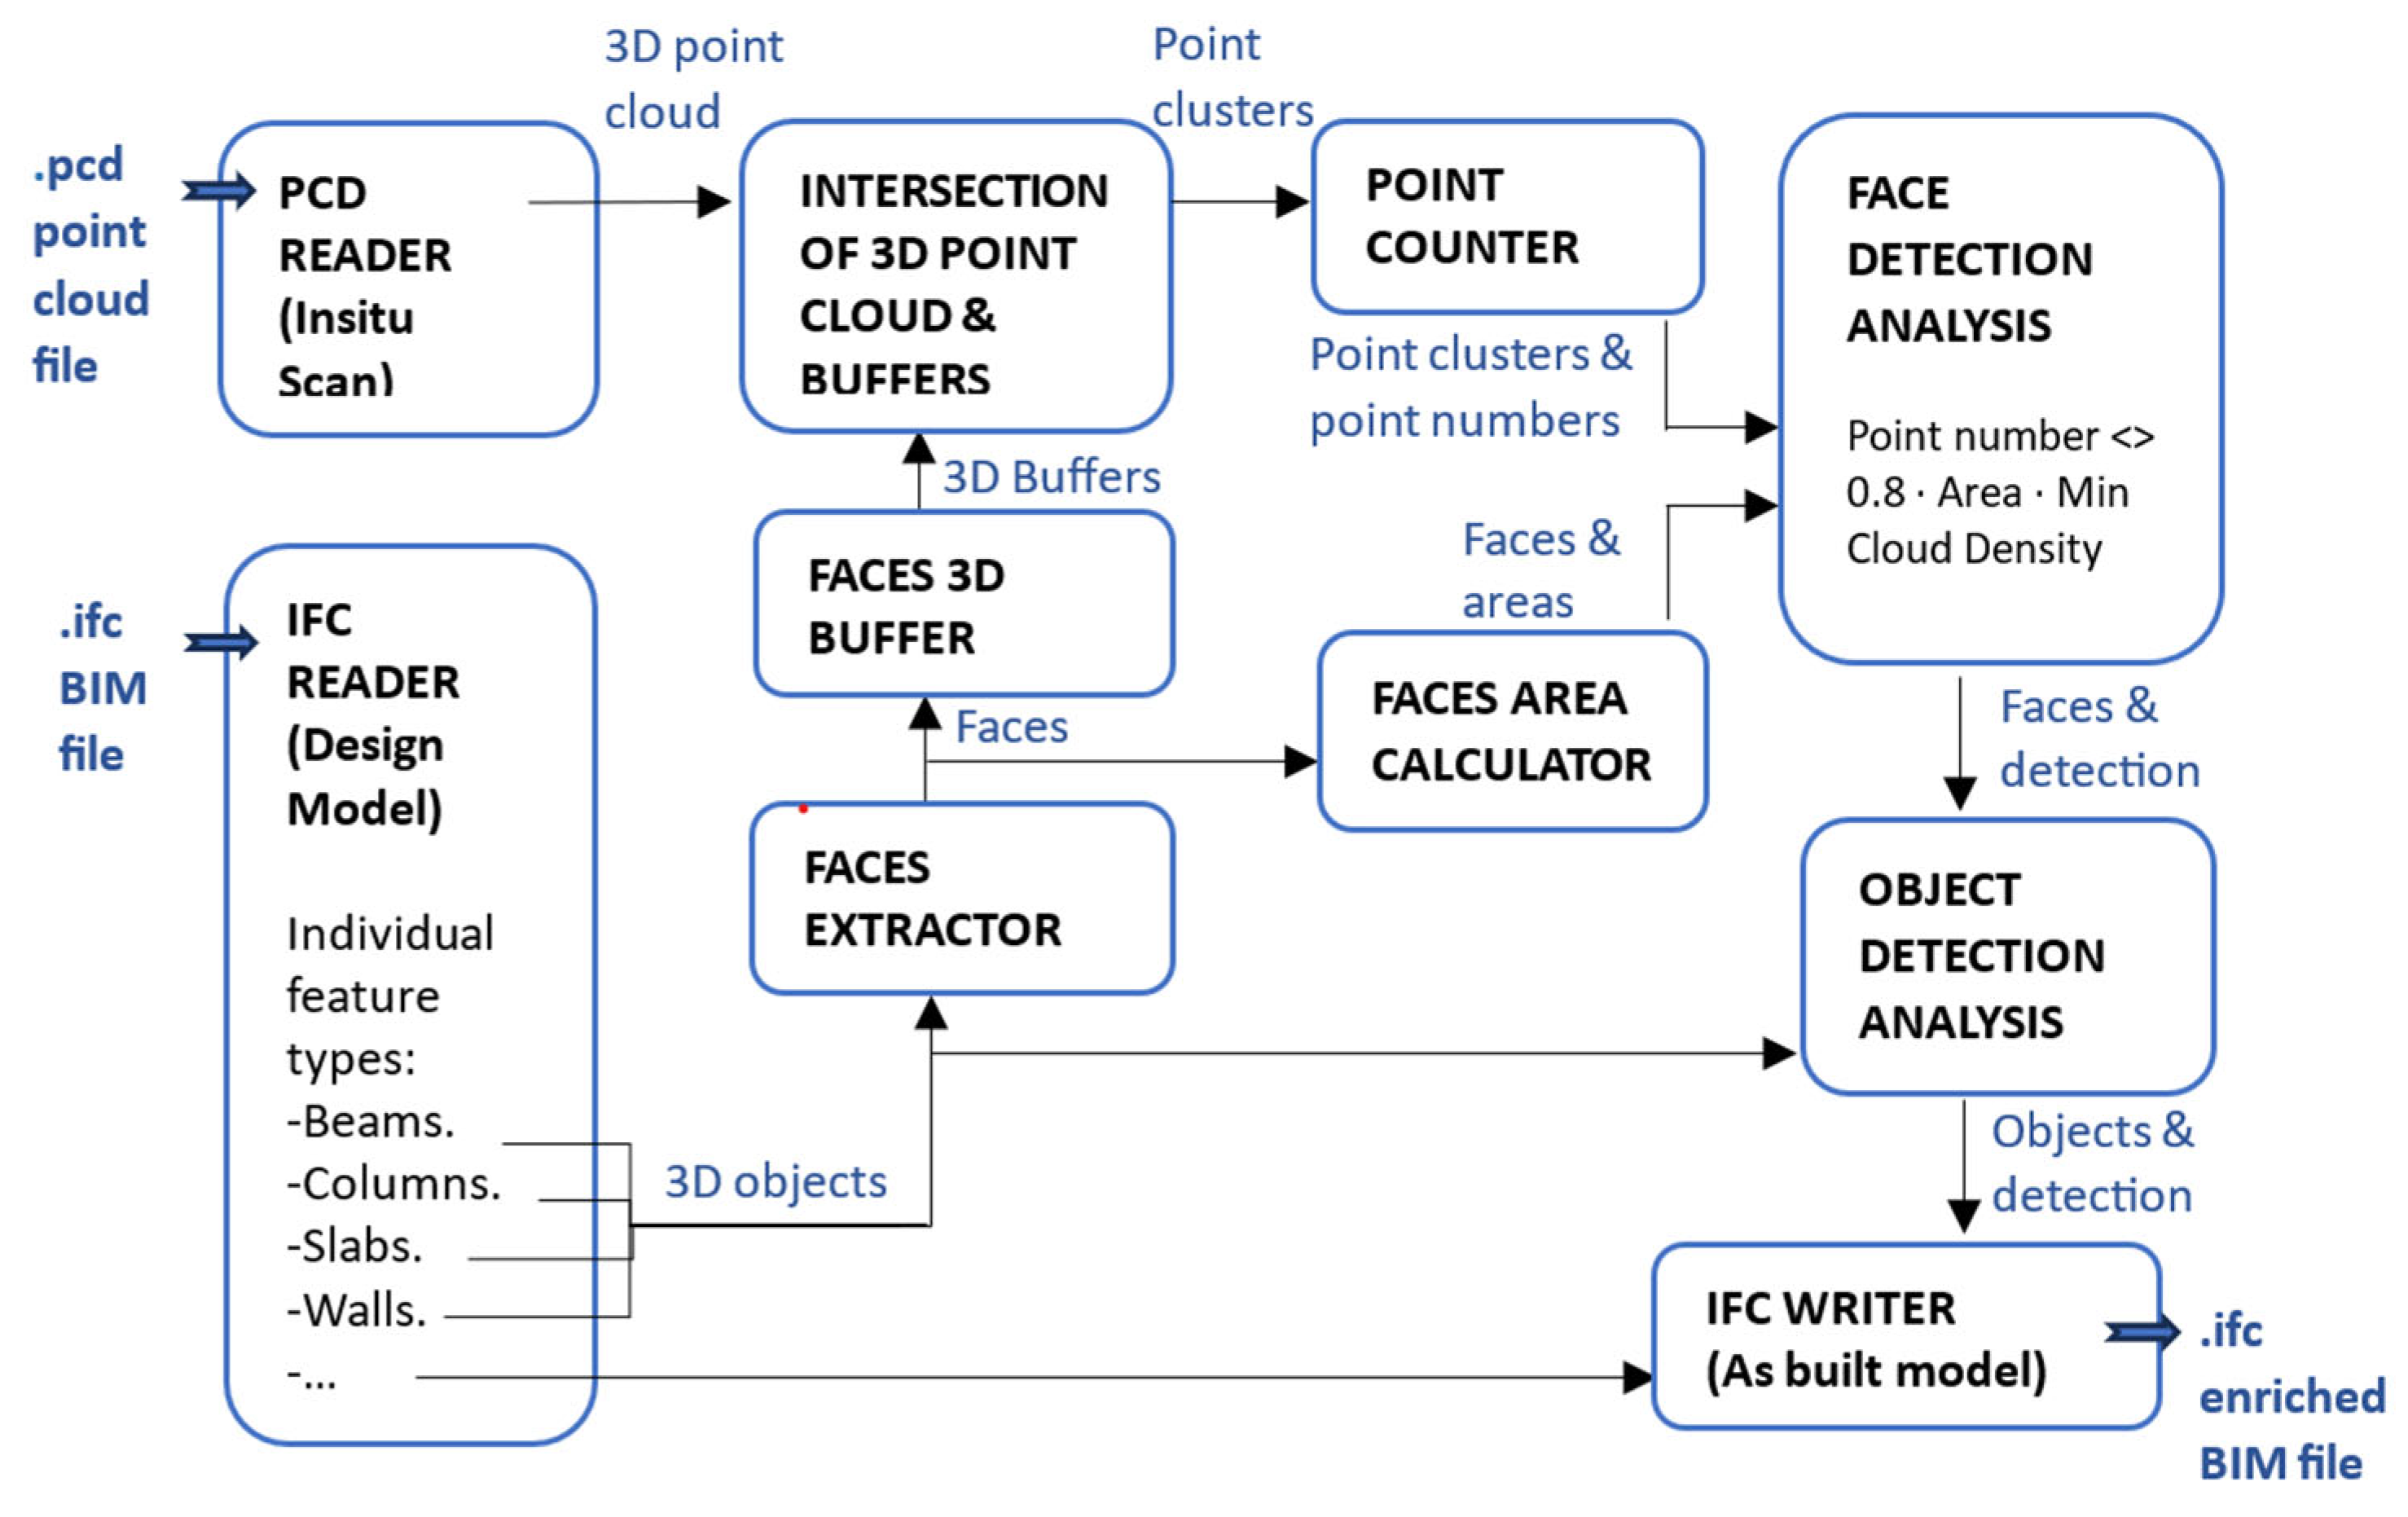
The contrast procedure (shown in Figure 7) consists of the following: read the design BIM model IFC files and the scan 3D point cloud, isolate the construction target elements of the BIM model (filtered by date), explode the elements on their faces, generate a 3D buffer of each of the faces, cut the scan point cloud with these buffers, count the number of points at each intersection and assign to each face whether it is considered detected or not based on the number of points that intersect its buffer.
The thickness of the buffers allows to consider the possible deviation of the point capture in the scan with respect to the theoretical surface. It can also be modified depending on the expected accuracy of the scan.
As a criterion to consider that a face has been detected, it is established that the number of points captured must be greater than “0.8 (reduction coefficient) × Face area × minimum surface density of the point cloud”, the latter being a parameter that can be modified by the user.
Finally, a construction element is considered detected if any of its faces has been detected, the information is assigned to a property of the element, and it is written to a new BIM model in IFC file format.
The result is an Enriched IFC File which can be visualized in the Digital Twin platform. The elements of this IFC which has been detected as executed have a parameter with this information, so through a simple filter, the user can make visible the executed/delayed elements with different colors.

3.3. Validation Through an Application of the Innovative Workflow to a Real Case Study

To validate the methodology, it has been applied in a specific use case with the following characteristics:
  • Eight-story residential building including 99 apartments executed by Fira Rakennus Oy in Finland. The building is in a newly built metropolitan area in Pasila, Helsinki.
  • Frame erection construction phase including inner gypsum-based separation walls.
  • Construction technology based on precast concrete elements (slabs and walls). This involves specific considerations, for example, the control is limited to the detection of planned elements in their location (the possibility of common erroneous executions of in situ concrete is dismissed).
In this case study, scanning was performed on a single floor of the residential building during the structural erection phase. Full coverage of that floor required one autonomous flight of approximately 20 min, corresponding to a single battery cycle. Based on this benchmark, the complete eight-story building would require approximately six flights to achieve full coverage of façades and interiors, assuming similar floor layouts and occlusion conditions. With battery exchanges, the drone can perform three to four full-building scans per day, making daily monitoring feasible.
These results indicate that while single-floor monitoring can be achieved within a single flight, multi-story projects require careful flight planning and battery management to ensure scalability. Furthermore, the ability of the methodology to improve the work progress monitoring procedure has been evaluated according to the following key performance indicators:
  • Work quality improvement by covering more space in the quality inspections;
  • Reduction in the project throughput time by reducing manual monitoring times;
  • Reducing reaction times to onsite safety hazards compared to manual surveying;
  • Human worker acceptance of the automated monitoring technology.

4. Findings

Application of the Methodology to the Case Study

This section details the results obtained by applying the new methodology to the case study of a residential building in Finland.
(a)
DESIGN PHASE
  • Project BIM4D model
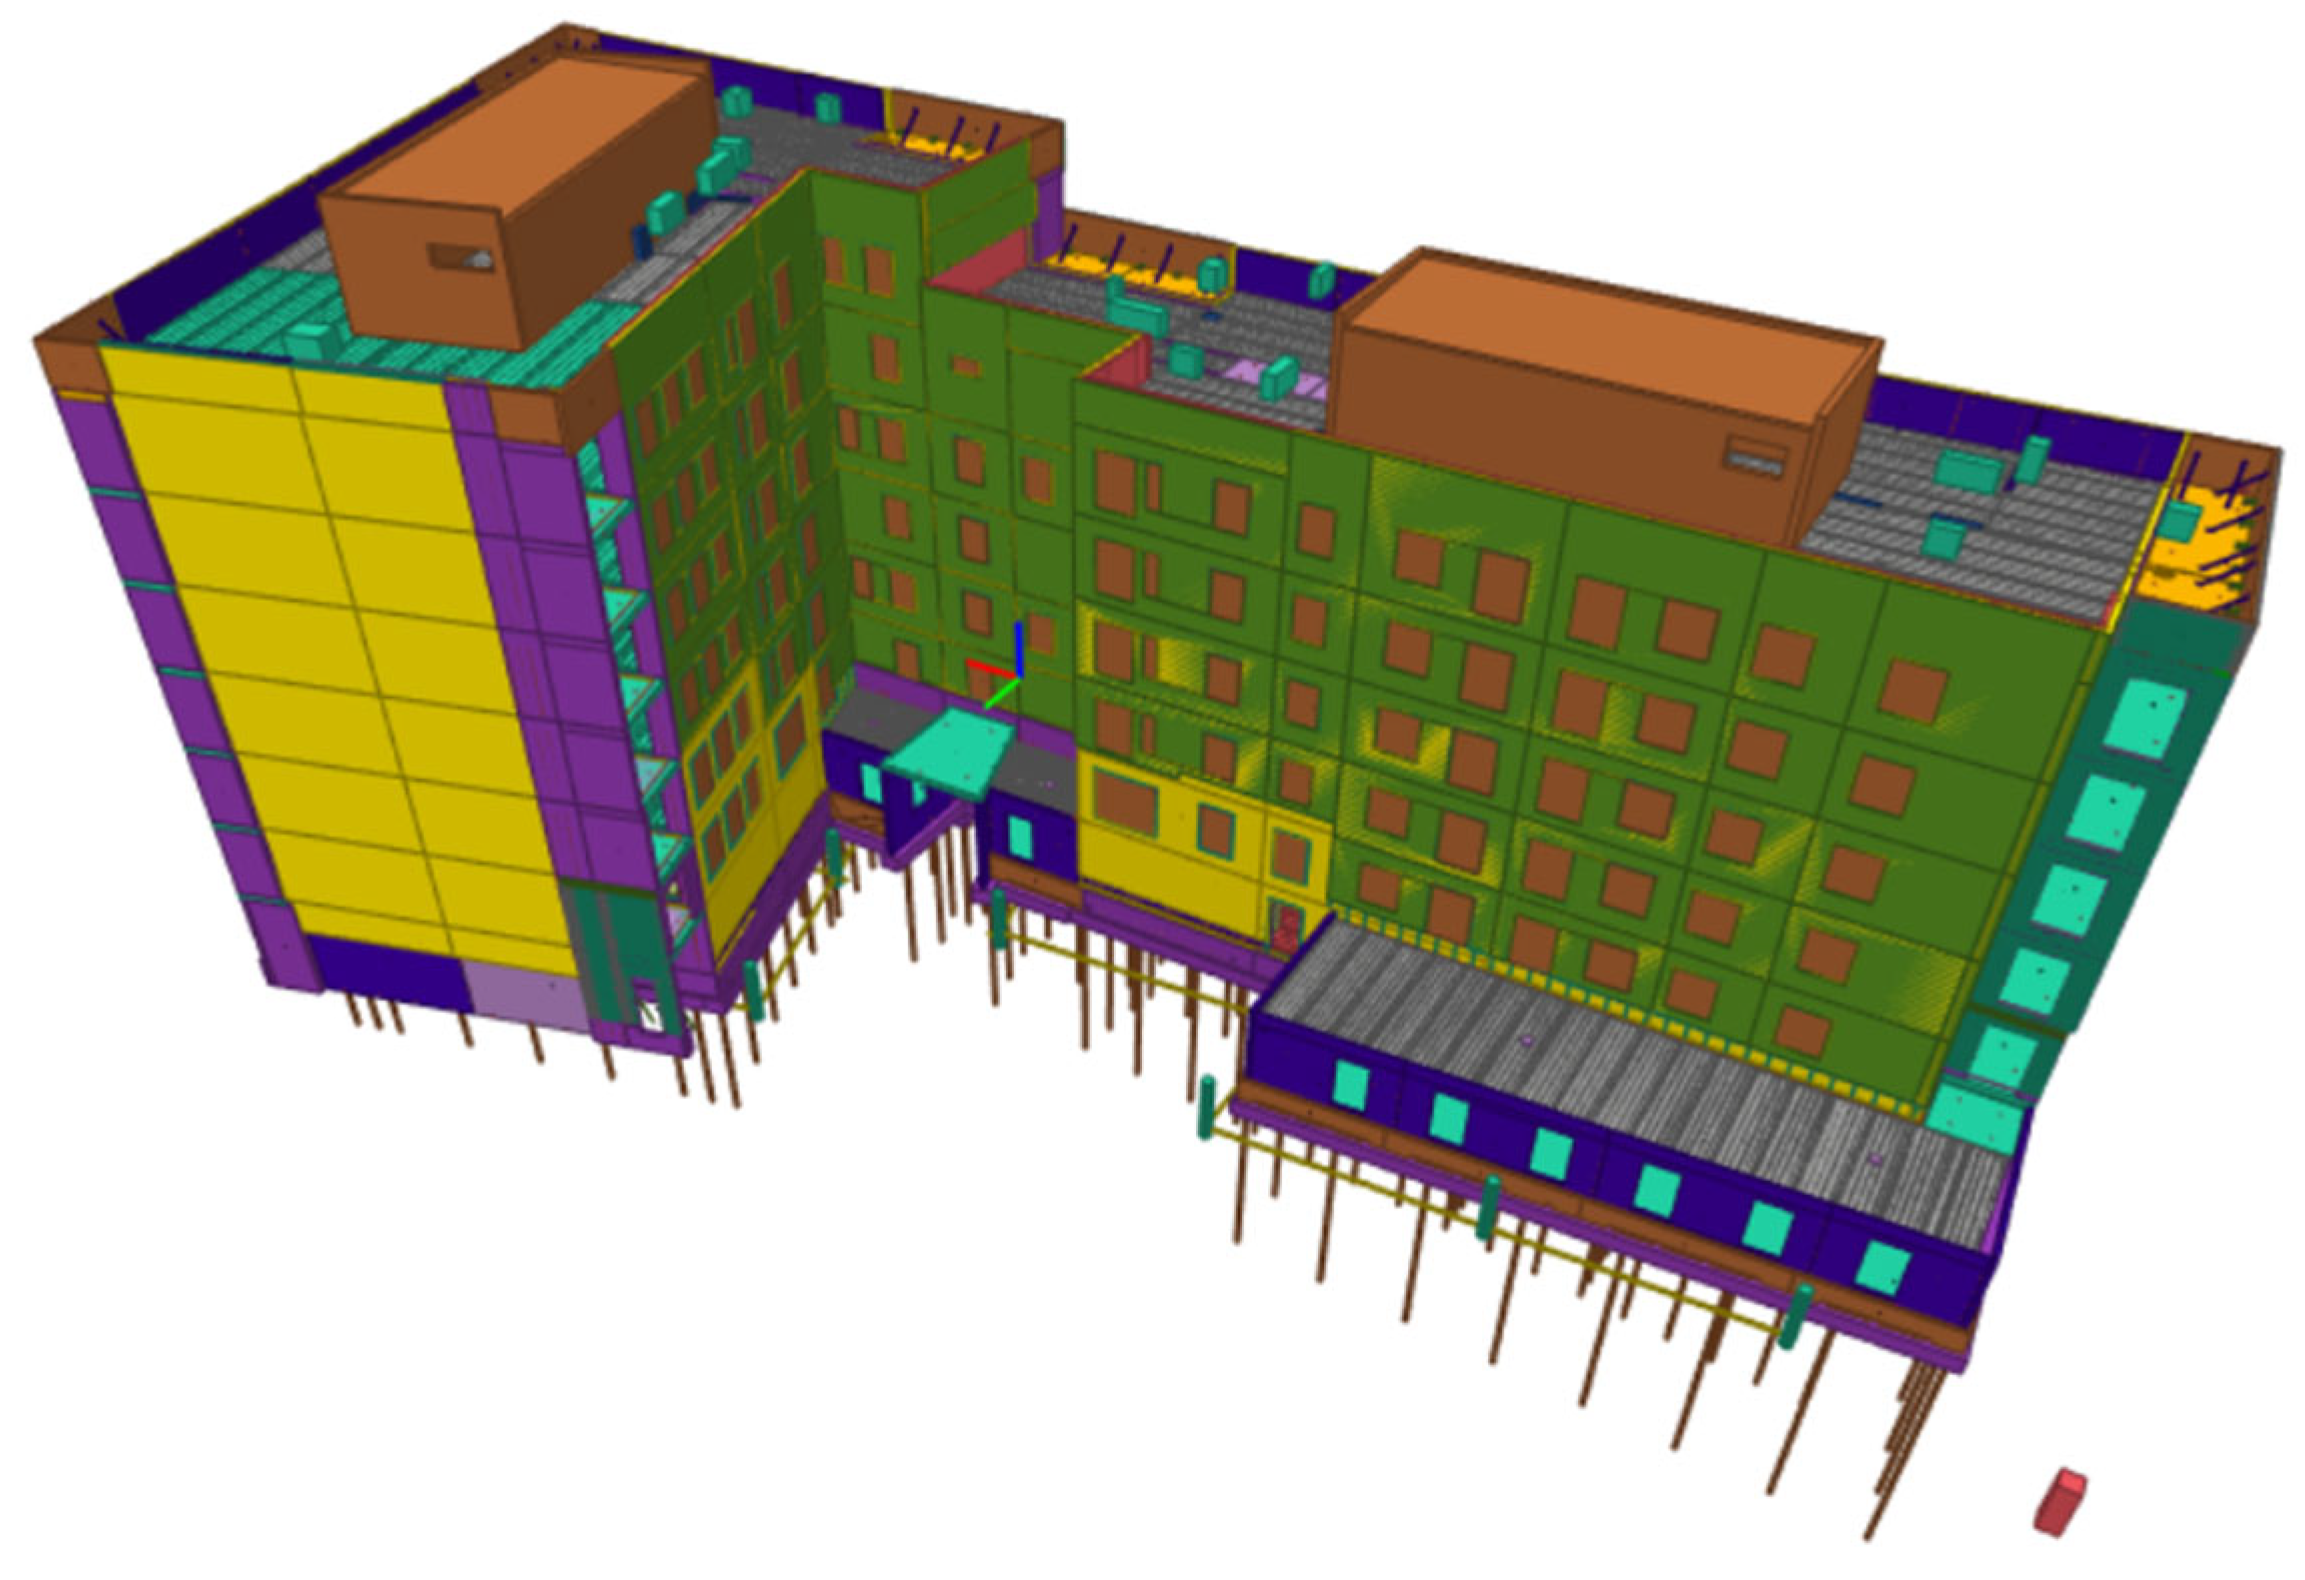
The project BIM model of the building has been generated using the native software TEKLA. The model is federated, which is a model that combines and coordinates a set of individual BIM models that represent different disciplines or aspects of the construction project, such as architecture, structure, mechanical, electrical, and plumbing (MEP), among others.
The structural BIM individual model (shown in Figure 8) has been selected as the building is in the structural execution phase.
The structural model has been then exported to IFC format (version IFC2X3), generating a structural IFC 78,725 Mb in size. Structural elements are registered as IFCBeam, IFCWall, and IFSlab. All the elements are assigned a unique identifier.
  • 3D reference point cloud for later scan positioning
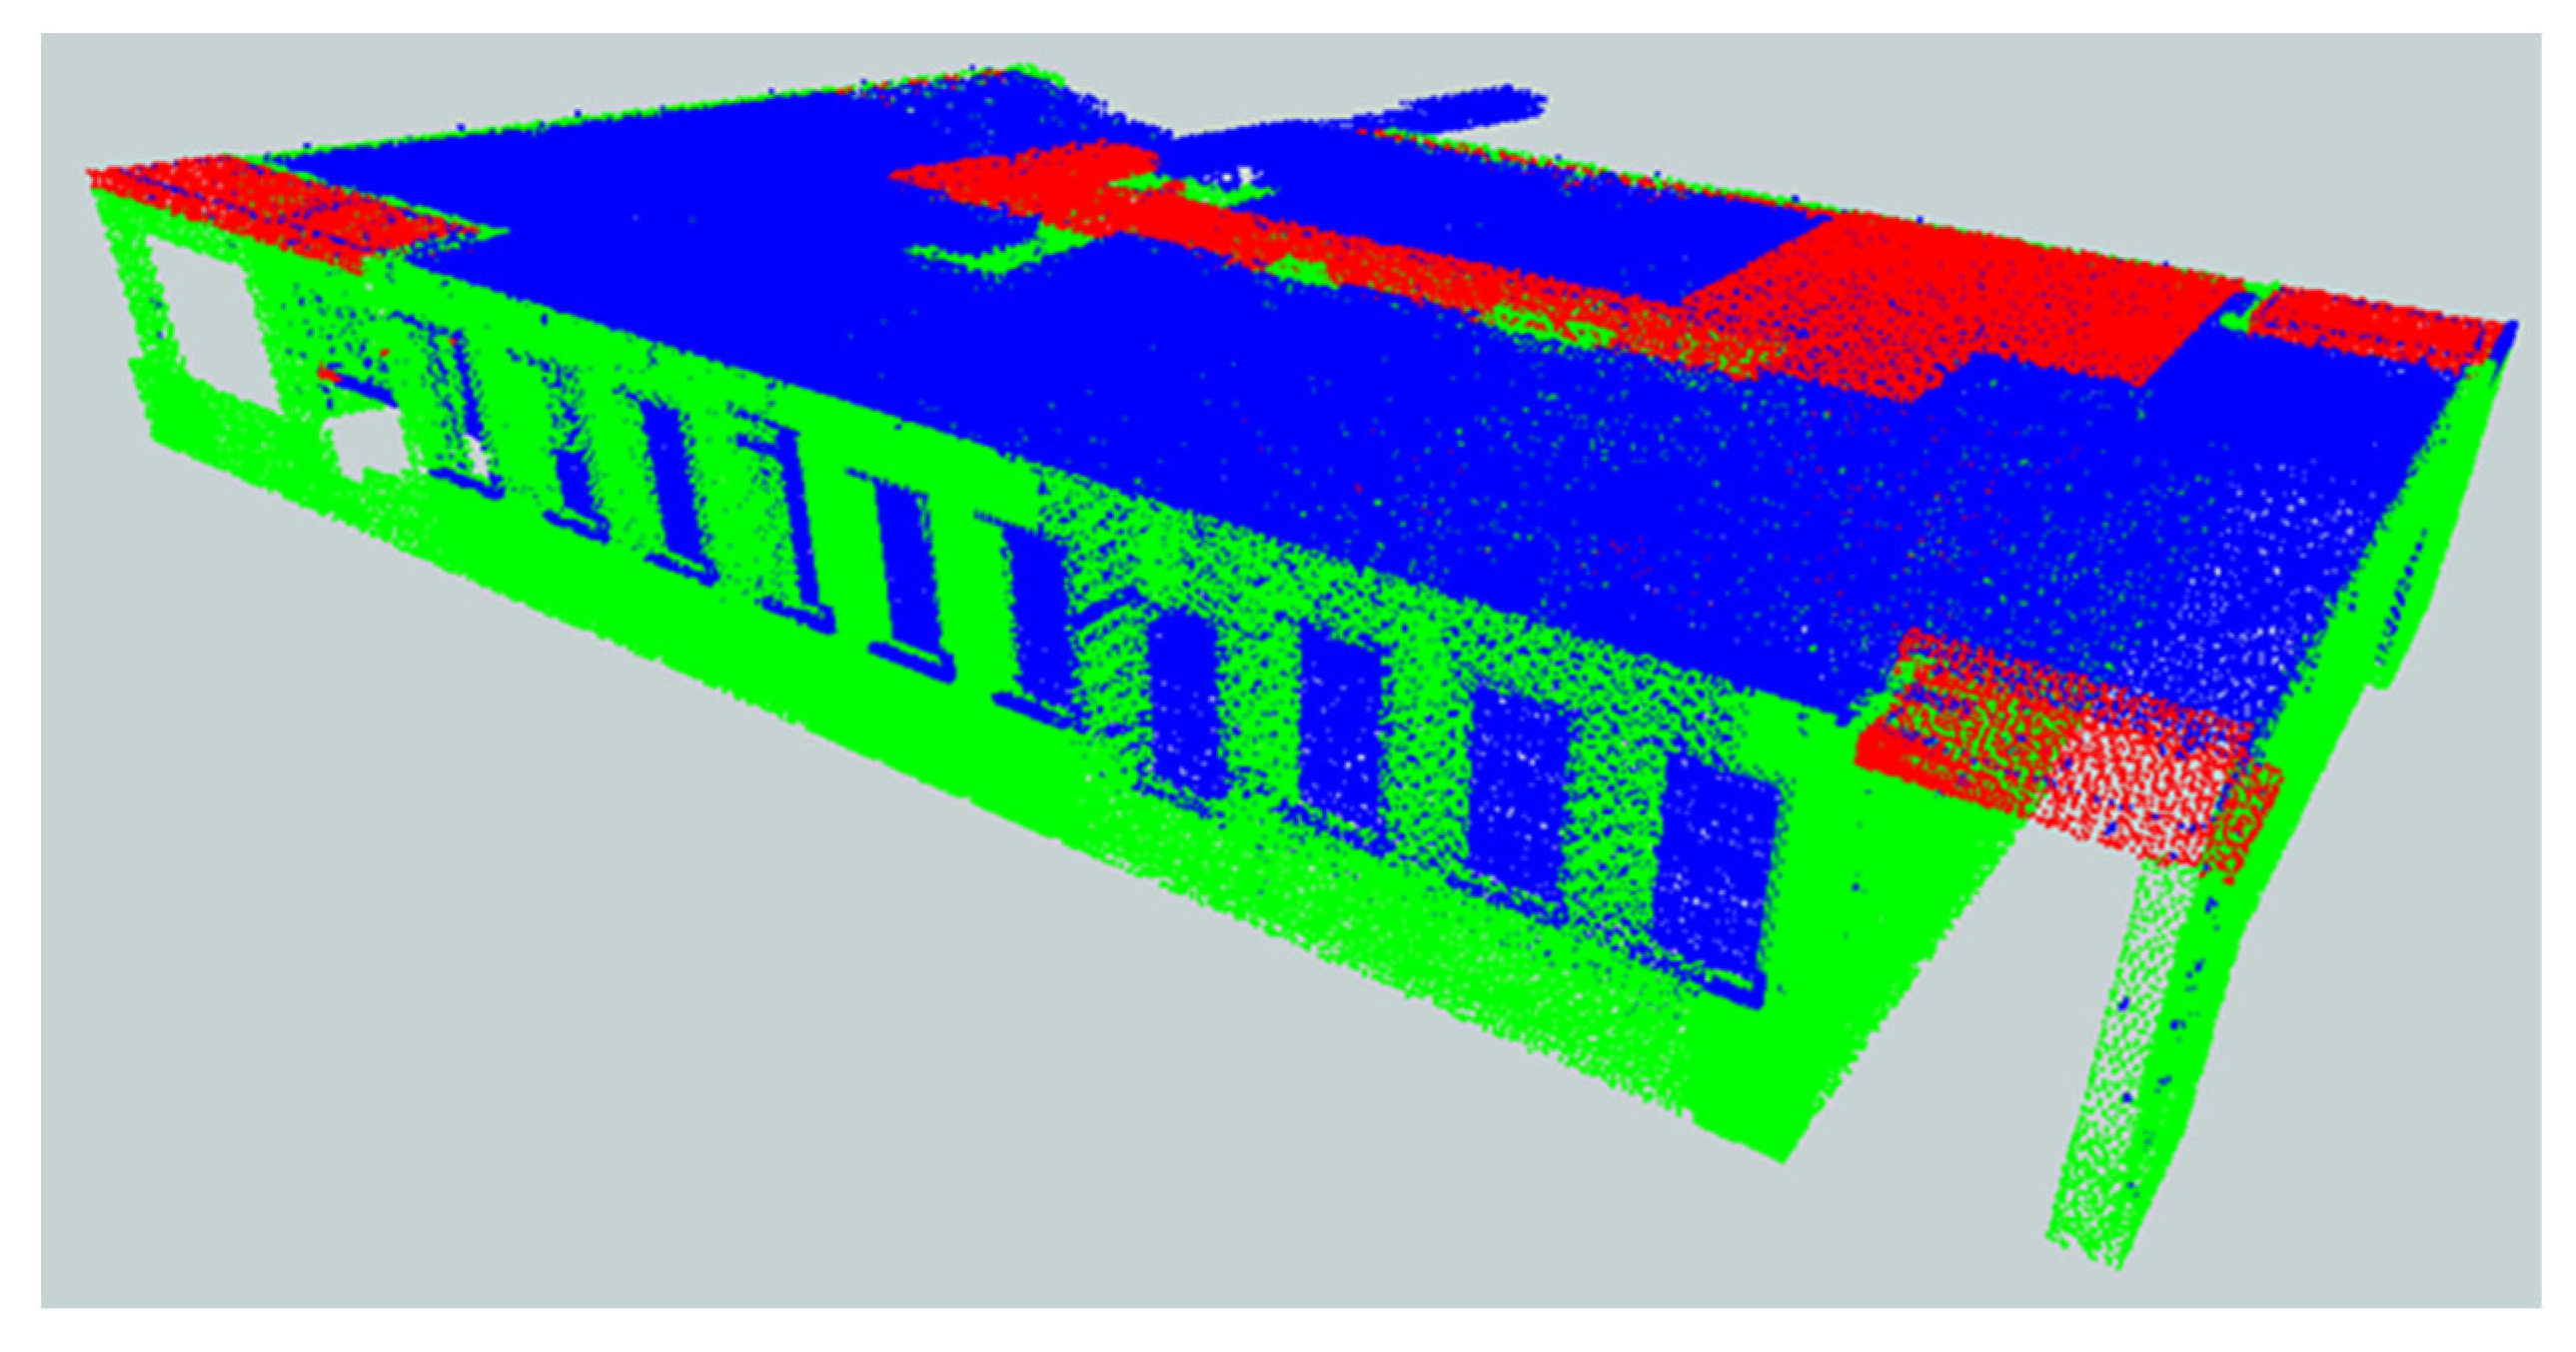
The IFC model has been transformed through FME routines to a reference point cloud (shown in Figure 9). In order to reduce the size of the data, firstly, the IFC has been filtered to the area (flat and zone) that is under execution during the analyzed progress control activity.
A 3D point cloud in .pcd format (compact binary format for project operations) of 57.352 Mb in size has been generated. The model contains 2,936,397 points, and each point includes the information of the typology of the source element to facilitate its interpretation.
(b)
EXECUTION PHASE
  • Definition of the site control frequency
Two dates close to each other have been established for the use case progress control activities: 3rd and 5th of December 2024.
Between both dates, the construction process has advanced with the placement of an interior wall.
  • Scan of the construction site with Drone
Two drone flights have been carried out inside the building in an area of the first floor. One of them prior to the construction of the interior wall and the other after. In Figure 10, the drone performing these autonomous flights is shown.
  • Point cloud generation of the site
Two-point clouds have been generated, one per drone flight. In both cases, a .pcd (compact binary format for project operations) file is generated. The generated files contain about 5 million points, and they are less than 100 Mb in weight.
The point clouds generated from the scans are positioned to match the BIM reference point cloud as shown in Figure 11. By default, BIM models are generated in mm and the scan capture is recorded in meters. New routines have been developed in FME for adjustments required due to scale changes so that they can be automated with the rest of the process.
(g)
DATA PROCESSING PHASE
  • Comparison of BIM4D model (filtered) with the onsite scan point cloud
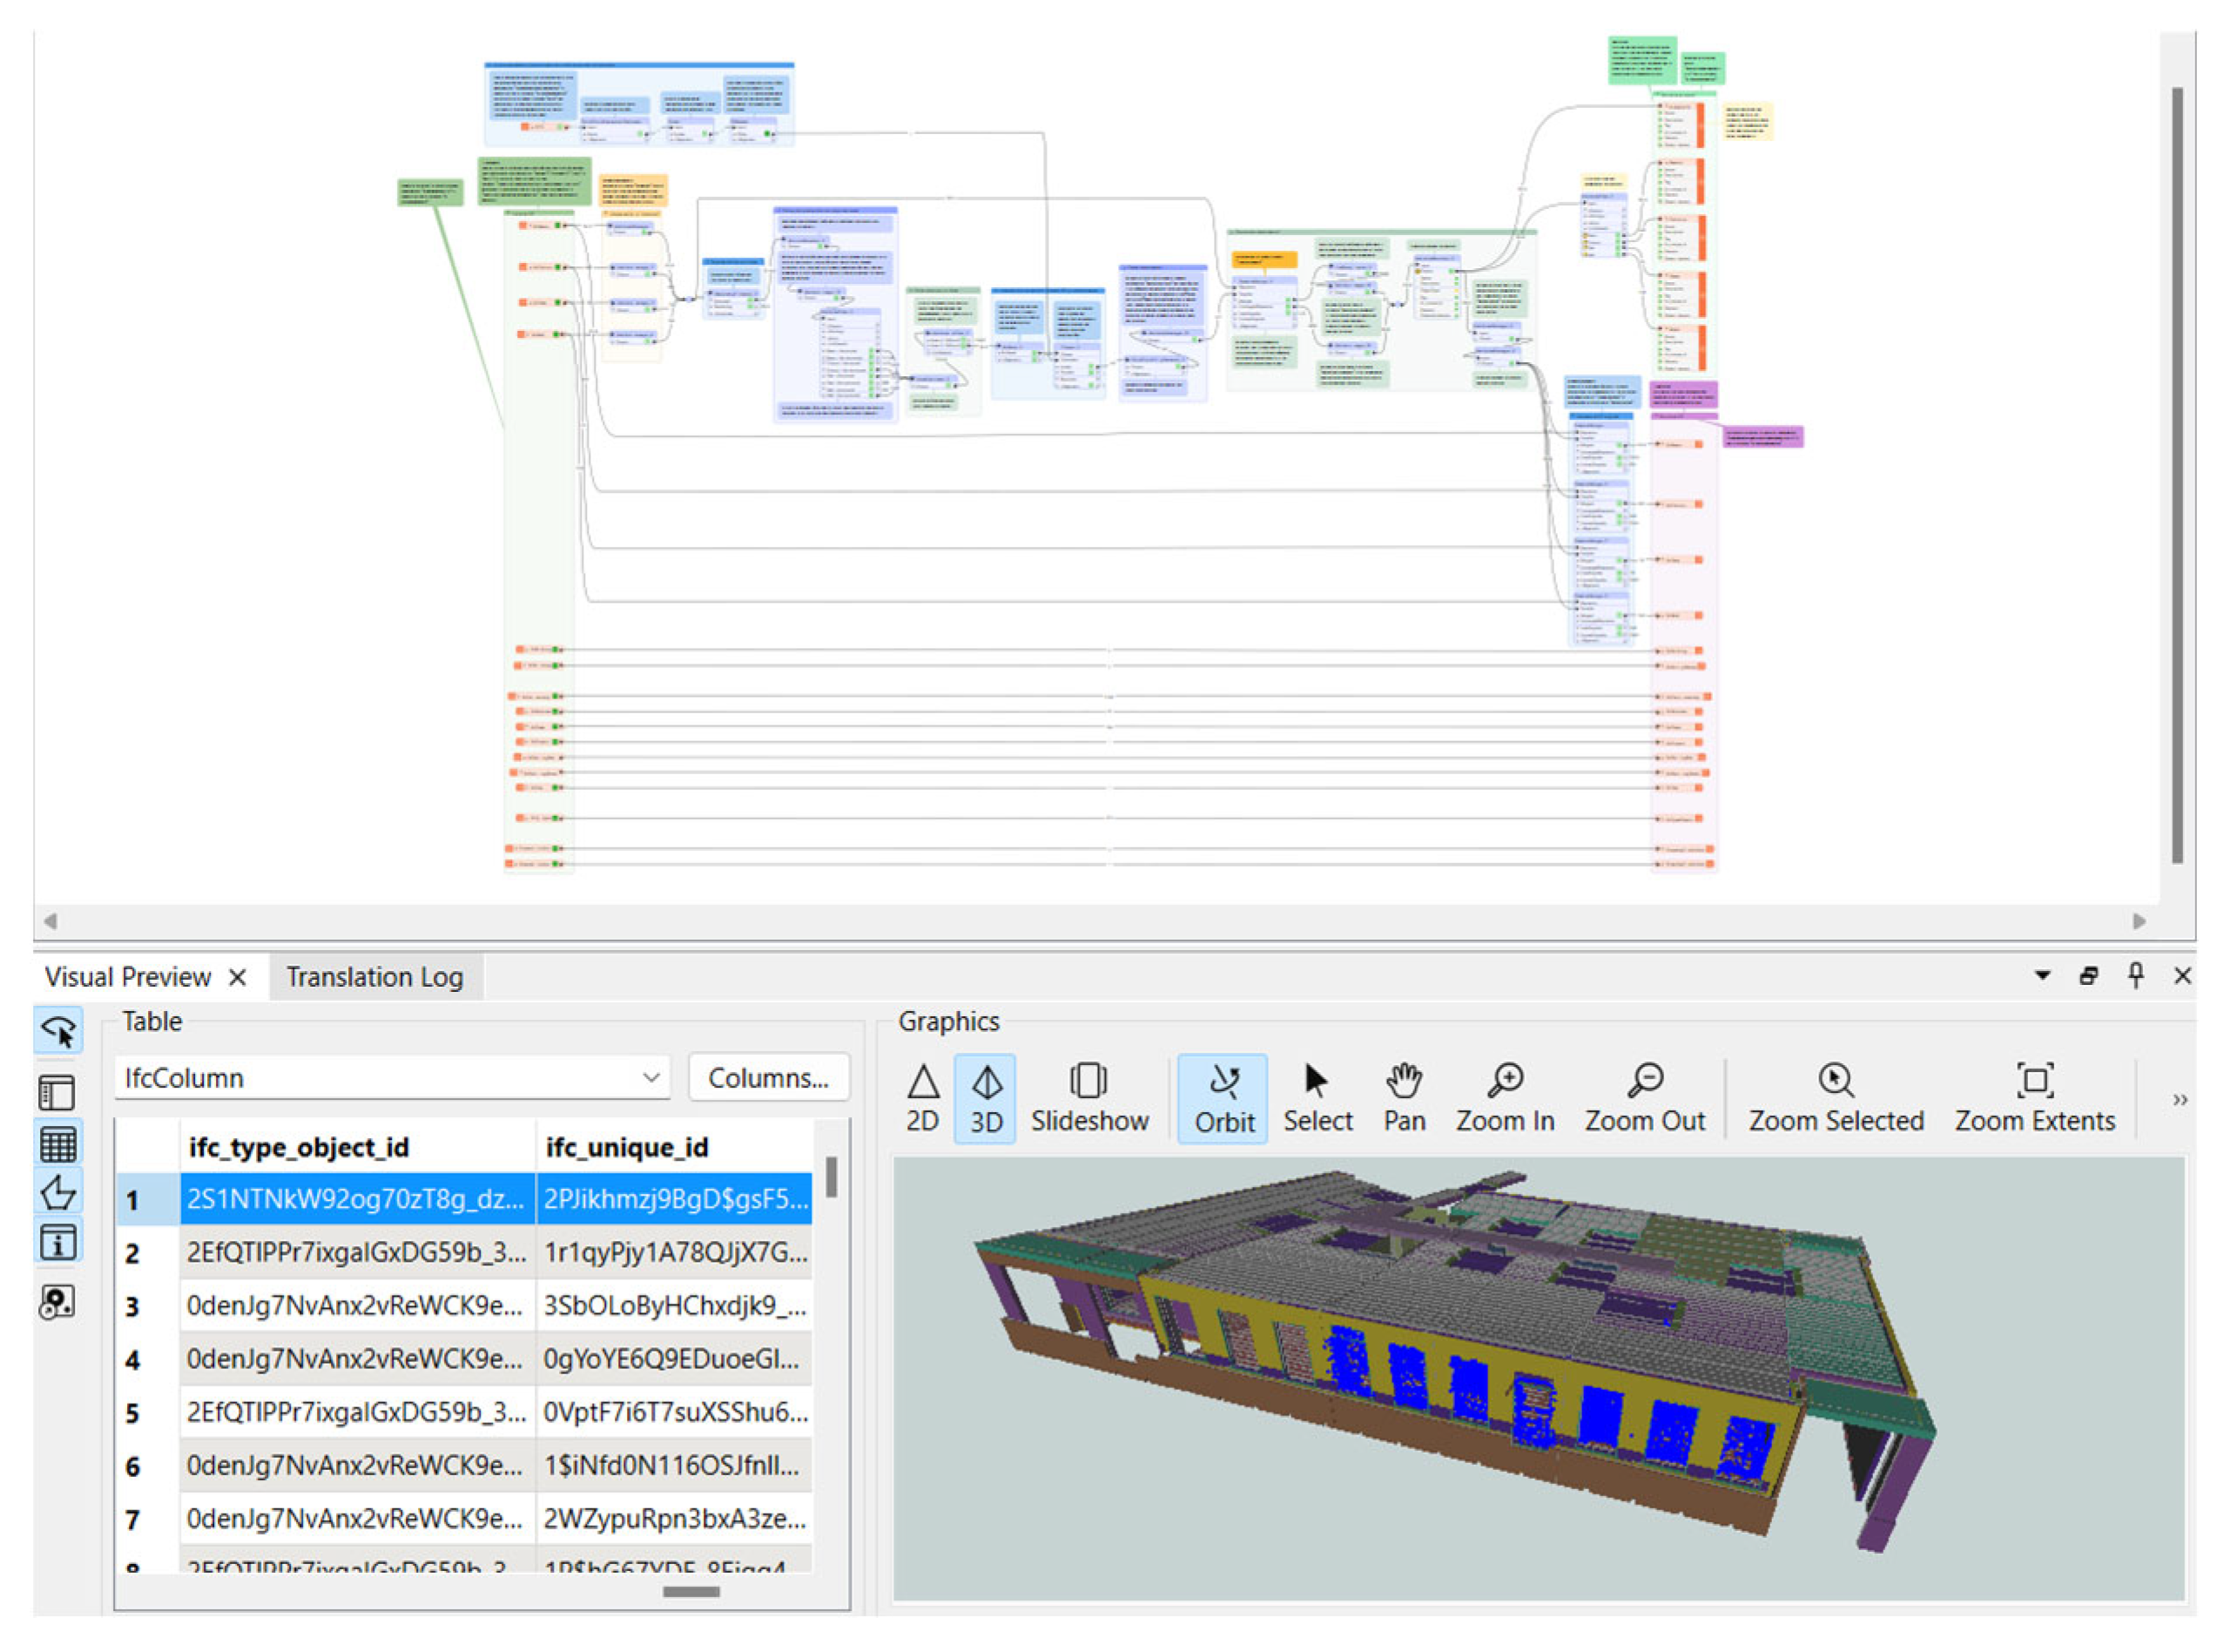
Block programming has been fully developed in FME. Its efficiency has been proven, and the process has been optimized with the lessons learned by applying it to the use case. The correct migration of all information to the final IFC has been verified, for which the structuring of the design IFC is crucial.
In addition to the main stages, some additional steps have been added to facilitate the applicability of the process, such as the reduction of considered faces (discarding very small faces, vertical ones in slabs/horizontal ones in columns...).
Figure 12 shows the appearance of the FME interface in which the above processes are developed.
  • (h) MONITORING AND VISUALIZATION PHASE
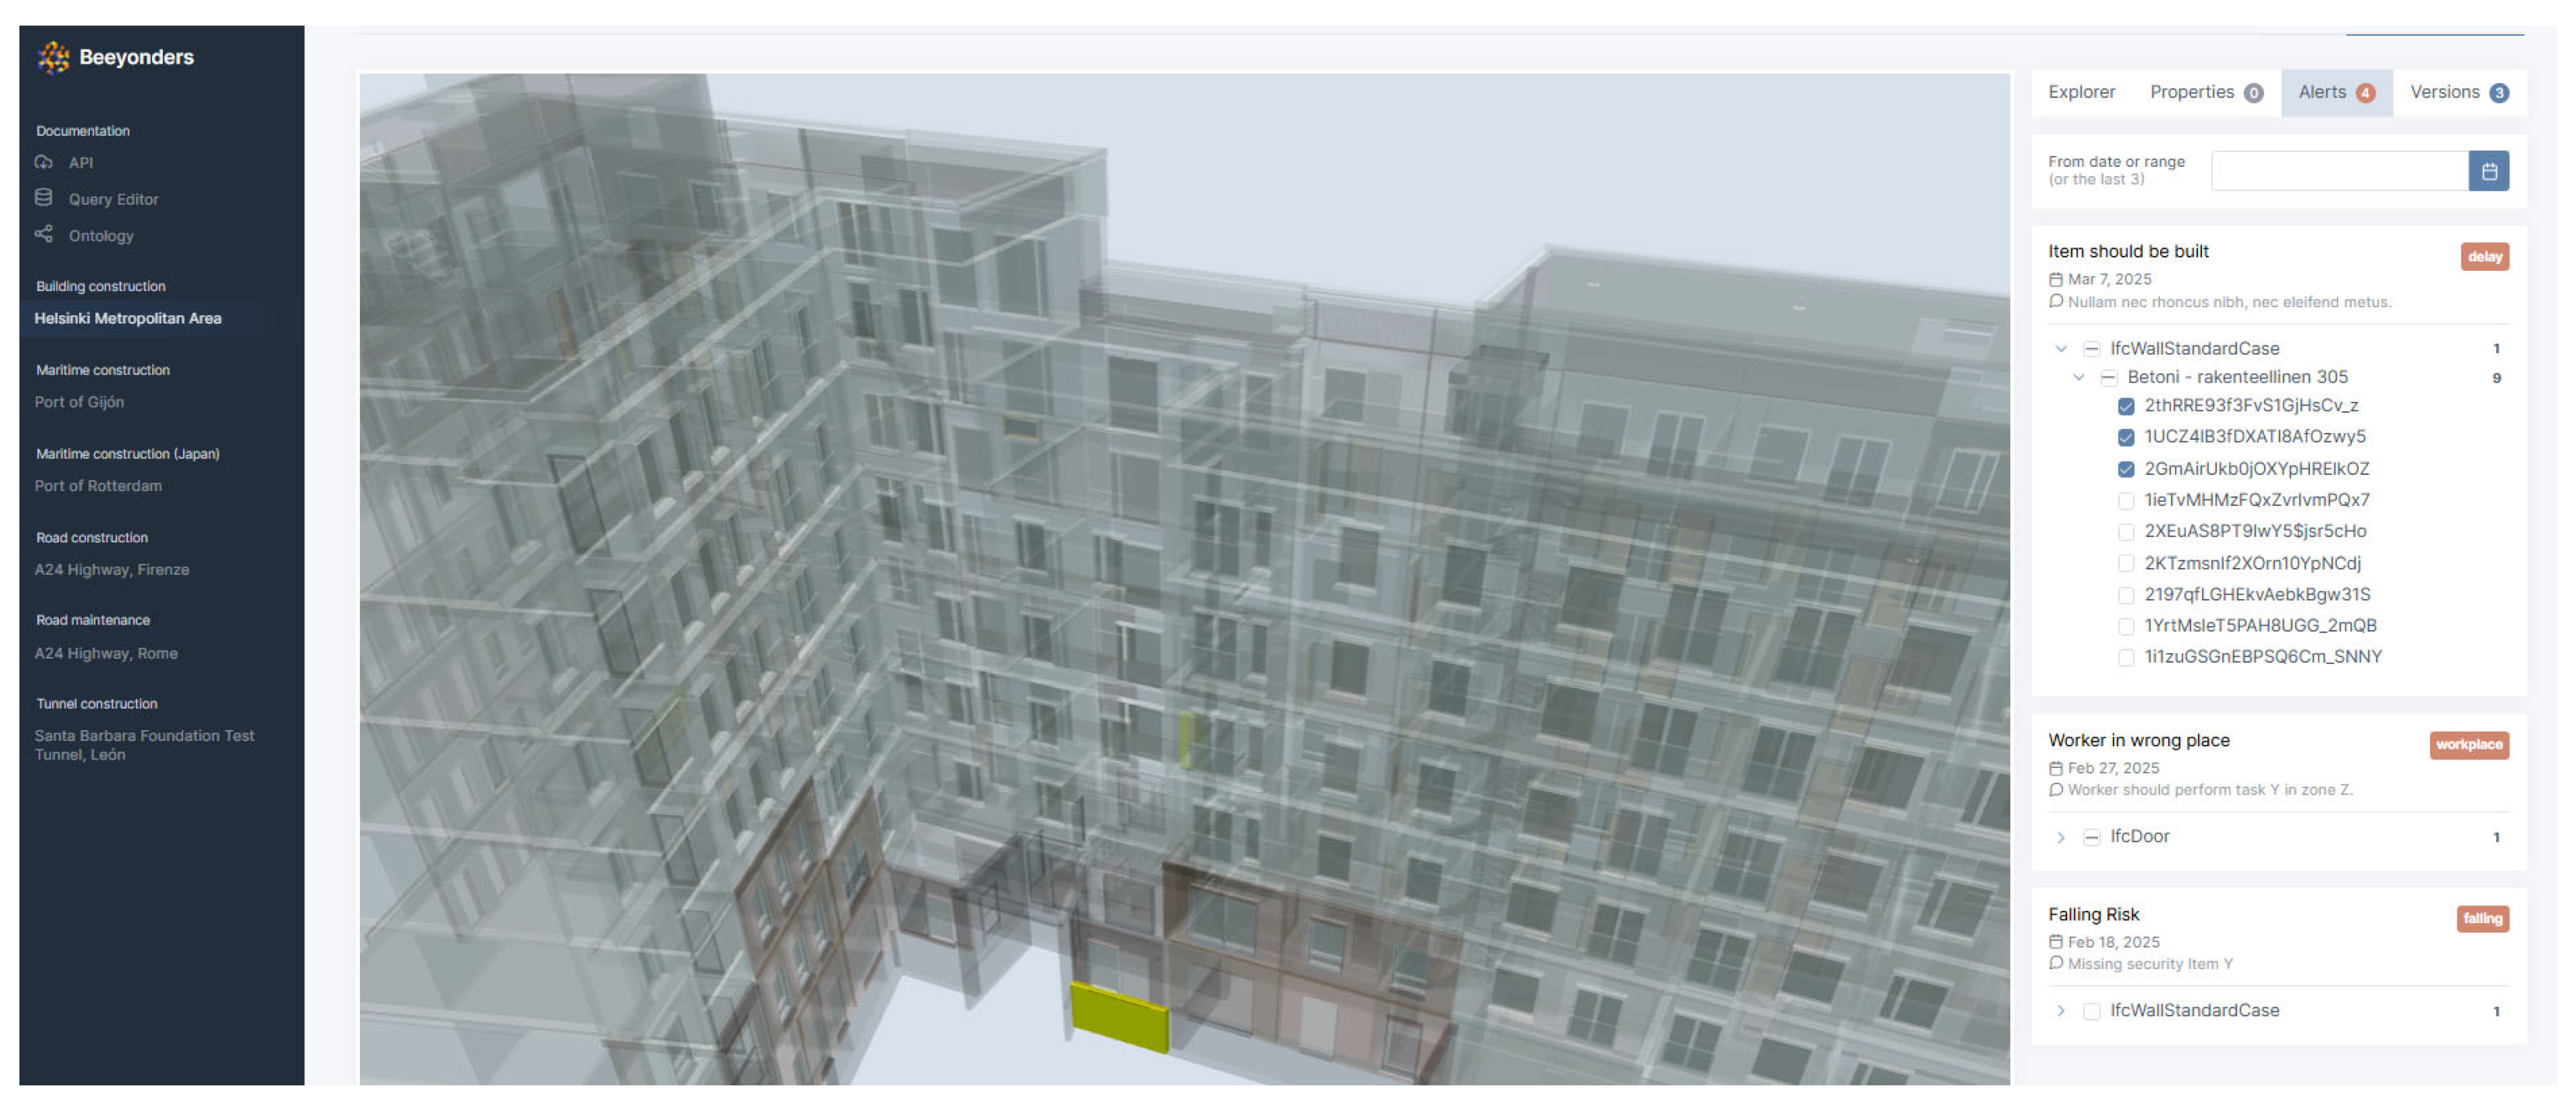
The result of this process is a clear visual representation of construction status embedded into the Digital Twin interface. Users can access the system via a web interface and request the construction state as of a specific date. The system then processes the relevant data and returns an updated 3D view of the BIM model where each element is color-coded to indicate execution status—typically distinguishing between completed, pending, or delayed tasks. This enriched model is rendered in a BIM viewer embedded in the dashboard, enabling intuitive navigation and filtering. Stakeholders, such as project managers, site supervisors, and contractors, can interact with this interface to track progress spatially and temporally, without the need for technical data interpretation.
Additionally, the BIM updating service supports the calculation and display of simple yet informative Key Performance Indicators (KPIs), such as the percentage of executed elements versus planned elements, thereby facilitating continuous performance monitoring. These indicators are exposed via the KPI management module of the Digital Twin dashboard, which integrates data from multiple sources (e.g., life-cycle assessment, productivity metrics, scan comparisons) to provide a holistic overview of project status. Integration is enabled through REST APIs and a modular backend, ensuring seamless interoperability between the Digital Twin core, the updating service, and the visualization dashboards (Figure 13).
Beyond qualitative visualization of execution status, the proposed workflow was quantitatively evaluated using KPIs to assess accuracy, efficiency, and reliability. In the Helsinki case study, the following results were obtained:
  • Detection accuracy: 92% match between executed elements identified by the workflow and ground-truth verification.
  • False positive/negative rates: <5% misclassification of elements.
  • Time savings: monitoring time reduced by approximately 70% compared to manual inspections.
  • Reliability: 95% of drone missions completed without operator intervention, with only occasional retries due to battery exchange or adverse lighting conditions.
These reported KPIs were derived from comparisons between workflow outputs and ground-truth data collected via manual inspections and project schedule logs. Detection accuracy was measured as the percentage of correctly identified executed elements relative to total executed elements, while false positive and negative rates reflected misclassifications when compared with manual verification. Time savings were estimated by benchmarking the duration of conventional site inspections against the automated workflow (drone flight plus data processing). Reliability was determined as the percentage of successful autonomous flights relative to all attempted flights.

5. Discussions

The compatibility and interoperability of the two 3D digitalization technologies employed (BIM models and point clouds) continues to be the object of scientific development and a real problem in the practice of construction. It has been proven that with the support of the FME environment, the necessary functionalities to solve this integration can be developed.
Some spatial processing capabilities of FME have results that are especially useful, such as the ability to assist in the automation of the decomposition of geometries, obtaining, for example, the bounding surfaces of the geometries by disaggregation of input objects.
In addition, the use of FME can help in the quality control of the initial data and correct its errors to a certain extent.
The visual programming approach guarantees its applicability by the construction management staff, which does not always have expert programming knowledge.
It is expected that the current continuous development of new FME capabilities in the BIM environment will allow progress in this line in the coming years, although specific difficulties will always have to be faced, such as the handling of large and complex data sets.
As for the drone-based 3D map generation system, it represents an advance over the current baseline. It has been demonstrated that it is possible to create a completely autonomous and safe system that allows real-time mapping of a building under construction. In addition, due to its safety layers, reactive navigation, and autonomy from takeoff to landing, it could be operated by an operator with no experience in aerial robots.

5.1. Limitations

The presence of shadowed areas in point cloud data introduces systematic gaps that can significantly compromise the accuracy of construction progress assessments. These occluded regions often result in the incomplete capture of built elements, which may lead to an underestimation of progress when constructed components are absent from the dataset. Conversely, interpolation or visual misinterpretation of these gaps can produce overestimation, as missing segments may be erroneously perceived as completed. Both outcomes diminish the reliability of quantitative comparisons between as-built point clouds and as-designed BIM models, thereby distorting key performance indicators such as completion percentages. The problem is particularly acute in spatially complex or equipment-dense zones, such as mechanical, electrical, and plumbing (MEP) installations, where data voids are more frequent, and the implications of misclassification are more severe. Ultimately, shadow-induced data loss undermines the precision, consistency, and credibility of automated progress monitoring frameworks, and, if unaddressed, can impair informed decision-making at the project management level.
Recent studies, however, indicate promising mitigation strategies. For instance, multi-session point cloud map merging frameworks, such as LAMM, improve data completeness by integrating scans from multiple sessions and devices, thereby minimizing occlusion effects [23]. Similarly, SLAM-based approaches have been shown to address shadowed regions dynamically: DyGS-SLAM leverages semantic segmentation and dual constraints to reconstruct dense maps in dynamic environments, effectively recovering occluded geometries [24], while SLAM3R demonstrates the capacity for dense reconstruction from monocular video, filling gaps left by static scanning [25].
At the algorithmic level, AI-driven methods such as occlusion-aware hybrid learning frameworks enable more accurate recognition and reconstruction of partially visible elements, particularly in complex MEP contexts [26]. Moreover, reviews of deep learning applications for point clouds in construction highlight how completion networks and semantic segmentation models are increasingly used to compensate for missing data and enhance the reliability of BIM-to-as-built comparisons [27].
Taken together, these developments suggest that the limitations of shadow-induced data loss can be systematically mitigated through the integration of multi-scan acquisition, mobile SLAM-enabled scanning, and AI-based interpolation techniques.
Beyond point cloud occlusion challenges, several other limitations constrain this methodology. First, drone-generated point clouds usually contain millions of points per flight, often between 50 and 150 million points per building elevation scan. Environmental noise from trees, vehicles, or moving personnel can constitute 5–10% of the dataset, necessitating filtering, segmentation, and registration prior to BIM comparison. Despite recent advances in automated preprocessing, current workflows are only partially capable of handling these tasks, requiring two to five hours of manual intervention per one to two floors in medium-sized buildings, which limits processing speed and scalability [7].
Finally, the accuracy of automated progress assessment is strongly dependent on the quality of the underlying BIM model, particularly when using IFC files. Models with insufficient Level of Detail (LOD) or outdated information can produce misclassification rates of 15–25%, whereby completed walls, partitions, or ductwork may be incorrectly flagged as missing. Errors in BIM geometry, coordinate alignment, or metadata further exacerbate these issues, especially in multidisciplinary projects involving hundreds or thousands of BIM elements [27].

5.2. Computational Requirements and Scalability

Processing large-scale point clouds alongside BIM models introduces substantial computational demands. A single terrestrial laser scan typically contains 50–200 million points, corresponding to 1–4 GB of raw data per scan when storing XYZ, intensity, and color attributes (16–32 bytes per point). When merged across multiple sessions, total datasets can easily reach tens to hundreds of gigabytes [28]. Integrating BIM models with hundreds to thousands of elements further expands memory requirements, as efficient spatial indexing structures, such as kd-trees, octrees, or voxel grids, often add tens of gigabytes of RAM usage during processing.
Scalability remains the central challenge. As projects accumulate billions of points across multiple phases and BIM models expand to tens of thousands of elements, single-machine processing becomes infeasible. Without cloud-native parallelization, GPU acceleration, or multi-resolution representations, large-scale progress monitoring risks becoming computationally prohibitive, limiting its real-world deployment [27].
The strategy adopted in the present workflow is to focus scanning efforts on active work zones rather than the entire building, thereby reducing computational load. By restricting data acquisition and processing to construction areas with ongoing activity, memory consumption and processing time are substantially reduced. In practice, this approach has ensured manageable dataset sizes even when dealing with multi-story structures.
It is also noted that the BIM models used in this study are of manageable size (~250 MB), which balanced level of detail with computational feasibility. Future developments should investigate cloud-based infrastructures and GPU-accelerated pipelines to further ensure scalability in large-scale projects.

6. Conclusions

6.1. Conclusions of the Research and Impact on Construction Industry

The proposed system automates construction progress control by integrating drone-based 3D scans of as-built conditions with as-planned BIM models. It generates georeferenced point clouds, aligns them with the BIM coordinate system, and performs element-level comparisons to automatically assess installation status and deviations, producing near real-time reports. Compared to manual inspections, which typically occur weekly and achieve 70–80% element coverage, the system can capture over 90–95% of site elements per flight, reducing human inspection time by 60–80%, and enabling daily or weekly updates instead of multi-day delays [29]. Knowledge of daily progress in planning and the identification of delays allows for the improvement of planning routines, resulting in greater predictability and, consequently, shorter delivery times by identifying deviations almost in real time.
Accuracy of progress assessment improves from ±10–15% in conventional methods to ±2–5% using UAV-BIM integration, allowing detection of partial installations and dimensional deviations at the centimeter level. Safety is enhanced by reducing onsite exposure for personnel by up to 50%, and data directly integrates with project management platforms, enabling automated alerts and faster decision-making—potentially reducing schedule deviations by 10–20% in large-scale projects [30].
Although initial investment in UAVs, sensors, and processing pipelines is higher, operational efficiency gains and avoided rework can produce ROI within one to two project cycles, particularly for medium- and large-scale construction. Limitations remain, including occlusions, dependency on flight planning and weather conditions, and the need for accurate georeferencing, but the system significantly enhances automation, coverage, precision, and decision speed compared to existing approaches.
Improvements in daily routines based on data are displayed on holistic control panels that facilitate decision-making aimed at optimizing execution processes and, consequently, reducing internal rates of return (IRR).

6.2. Future Prospects and Pending Challenges

The developed autonomous monitoring solution enables the creation of significantly more accurate, real-time digital twins compared to those generated manually by humans with impaired accuracy. As the data becomes more machine-readable and its volume increases substantially, it allows more reliable data processing at the system level. This, in turn, leads to more precise analytical capabilities across various construction processes.
Although the methodology has been validated with a residential building use case in the structural phase, it is applicable to other types of construction (such as infrastructure) and other phases of the construction process (such as architecture, installations, etc.).
The construction method of the use case is based on precast structural elements, other systems such as in situ concrete will pose additional challenges to the methodology.
Anyway, the capture task and the collected/digitized information can be useful for other purposes beyond the work progress monitoring.
A current limitation of the solution is the battery life of drones; a single charge does not allow the scanning of the entire building space multiple times per day. Flight operations must also be scheduled carefully to avoid collisions between drones and human workers in the confined spaces of construction sites.
A pending challenge is the optimization of the scan point clouds processing that could be approached using Deep Learning Algorithms. It could include (1) cleaning, to eliminate points from onsite obstructions/materials and (2) auto-clapping, to fill incomplete surfaces due to shadows of objects. Including this part of the process in FME’s visual programming would allow it to also be automated.
The continuation of this development should aim at automating the replanning of construction pending tasks based on the enriched BIM model (with the information on the real situation of the work progress).

Author Contributions

Conceptualization, R.S.M.C. and P.E.; methodology, M.A.M.G. and R.S.M.C.; software, N.T.G.; validation, O.K.; formal analysis, investigation, N.T.G.; resources, O.K. and M.A.M.G.; data curation, M.A.M.G.; writing—original draft preparation, N.T.G.; writing—review and editing, P.E.; visualization; supervision, project administration, and funding acquisition, J.C.J.F. All authors have read and agreed to the published version of the manuscript.

Funding

The developments have been carried out within the framework of a collaborative project funded by the European Commission (101058548-BEEYONDERS- HORIZON-CL4-2021-TWIN-TRANSITION-01 DOI: https://doi.org/10.3030/101058548).

Data Availability Statement

Restrictions apply to the datasets, as datasets presented in this article are not readily available because they are part of a confidential collaborative task in Horizon Europe funding program.

Acknowledgments

The authors wish to express gratitude to their colleagues from TECNALIA, CATEC, FIRA, and UPV/EHU involved in the coursework.

Conflicts of Interest

Author Oskari Kruth was employed by the company FIRA Rakennus Oy. The remaining authors declare that the research was conducted in the absence of any commercial or financial relationships that could be construed as a potential conflict of interest.

Abbreviations

The following abbreviations are used in this manuscript:
FMEFeature Manipulation Engine
ETLExtract, Transform, Load
BIMBuilding Information Modeling
4DFourth Dimension
SLAMSimultaneous Localization and Mapping
IFCIndustry Foundation Classes
MVDModel View Definition
MEPMechanical, Electrical, and Plumbing
LIDARLight Detection and Ranging
PCDPoint Cloud Data
GNSSGlobal Navigation Satellite System
FLUForward-Left-Up
ISOInternational Organization or Standardization
ASCIIAmerican Standard Code for Information Interchange
KPIKey Performance Indicator
LCALife Cycle Assessment
RESTRepresentational State Transfer
APIApplication Programming Interface
IRRInternal Rate of Return

References

  1. Mathew, A.; Li, S.; Pluta, K.; Djahel, R.; Brilakis, I. Digital Twin Enabled Construction Progress Monitoring. In Proceedings of the 2024 European Conference on Computing in Construction, Crete, Greece, 15–17 July 2024; Available online: https://ec-3.org/publications/conferences/EC32024/papers/EC32024_210.pdf (accessed on 16 December 2024).
  2. Teslim, B.; Suprise, W. Comparing Manual and Automated Auditing Techniques in Building Assessments. 2024. Available online: https://www.researchgate.net/publication/386372774 (accessed on 10 March 2025).
  3. Chauhan, I.; Seppänen, O. Automatic indoor construction progress monitoring: Challenges and solution. In Proceedings of the 2023 European Conference on Computing in Construction, Crete, Greece, 10–12 July 2023. [Google Scholar] [CrossRef]
  4. Tsige, G.Z.; Alsadik, B.S.A.; Oude Elberink, S.; Bassier, M. Automated Scan-vs-BIM Registration Using Columns Segmented by Deep Learning for Construction Progress Monitoring. Int. Arch. Photogramm. Remote Sens. Spatial Inf. Sci. 2025, XLVIII-G-2025, 1455–1462. Available online: https://isprs-archives.copernicus.org/articles/XLVIII-G-2025/1455/2025/ (accessed on 18 August 2025).
  5. Gruner, F.; Romanschek, E.; Wujanz, D.; Clemen, C.; Wujanz, D. Scan vs. BIM: Patch-Based Construction Progress Monitoring Using BIM and 3D Laser Scanning (ProgressPatch). 2023. Available online: https://fig.net/resources/proceedings/fig_proceedings/fig2023/papers/ts05d/TS05D_gruner_romanschek_et_al_12203.pdf (accessed on 16 December 2024).
  6. Ibrahimkhil, M.; Shen, X.; Barati, K. Enhanced Construction Progress Monitoring through Mobile Mapping and As-built Modeling. In Proceedings of the 38th International Symposium on Automation and Robotics in Construction (ISARC 2021), Dubai, United Arab Emirates, 2–4 November 2021. [Google Scholar] [CrossRef]
  7. Kavaliauskas, P.; Fernandez, J.B.; McGuinness, K.; Jurelionis, A. Automation of Construction Progress Monitoring by Integrating 3D Point Cloud Data with an IFC-Based BIM Model. Buildings 2022, 12, 1754. [Google Scholar] [CrossRef]
  8. Reja, V.; Bhadaniya, P.; Varghese, K.; Ha, Q. Vision-Based Progress Monitoring of Building Structures Using Point-Intensity Approach. In Proceedings of the 38th International Symposium on Automation and Robotics in Construction (ISARC 2021), Dubai, United Arab Emirates, 2–4 November 2021. [Google Scholar] [CrossRef]
  9. Yu, S. Research on Construction Progress Monitoring Based on 3D Point Clouds and BIM Models. In Proceedings of the 2024 4th International Conference on Electronic Information Engineering and Computer Communication (EIECC), Wuhan, China, 27–29 December 2024; pp. 667–673. [Google Scholar] [CrossRef]
  10. Kim, B.; Jo, I.; Ham, N.; Kim, J.-J. Simplified Scan-vs-BIM Frameworks for Automated Structural Inspection of Steel Structures. Appl. Sci. 2024, 14, 11383. [Google Scholar] [CrossRef]
  11. Shan, T.; Englot, B.; Meyers, D.; Wang, W.; Ratti, C.; Rus, D. LIO-SAM: Tightly-coupled Lidar Inertial Odometry via Smoothing and Mapping. In Proceedings of the 2020 IEEE/RSJ International Conference on Intelligent Robots and Systems (IROS), Las Vegas, NV, USA, 25–29 December 2020; pp. 5135–5142. [Google Scholar] [CrossRef]
  12. Kaess, M.; Johannsson, H.; Roberts, R.; Ila, V.; Leonard, J.; Dellaert, F. iSAM2: Incremental smoothing and mapping with fluid relinearization and incremental variable reordering. In Proceedings of the 2011 IEEE International Conference on Robotics and Automation, Shanghai, China, 9–13 May 2011; pp. 3281–3288. [Google Scholar] [CrossRef]
  13. Zheng, C.; Xu, W.; Zou, Z.; Hua, T.; Yuan, C.; He, D.; Zhou, B.; Liu, Z.; Lin, J.; Zhu, F.; et al. FAST-LIVO2: Fast, Direct LiDAR–Inertial–Visual Odometry. IEEE Trans. Robot. 2025, 41, 326–346. [Google Scholar] [CrossRef]
  14. Koide, K.; Yokozuka, M.; Oishi, S.; Banno, A. Globally Consistent 3D LiDAR Mapping With GPU-Accelerated GICP Matching Cost Factors. IEEE Robot. Autom. Lett. 2021, 6, 8591–8598. [Google Scholar] [CrossRef]
  15. Maskeliūnas, R.; Maqsood, S.; Vaškevičius, M.; Gelšvartas, J. Fusing LiDAR and Photogrammetry for Accurate 3D Data: A Hybrid Approach. Remote Sens. 2025, 17, 443. [Google Scholar] [CrossRef]
  16. Rui, Y.; Lim, Y.-W.; Siang, T. Construction Project Management Based on Building Information Modeling (BIM). Civ. Eng. Archit. 2021, 9, 2055–2061. [Google Scholar] [CrossRef]
  17. Rebolj, D.; Pučko, Z.; ČušBabič, N.; Bizjak, M.; Mongus, D. Point cloud quality requirements for Scan-vs-BIM based automated construction progress monitoring. Autom. Constr. 2017, 84, 323–334. [Google Scholar] [CrossRef]
  18. Wang, Q.; Tan, Y.; Mei, Z. Computational Methods of Acquisition and Processing of 3D Point Cloud Data for Construction Applications. Arch. Comput. Methods Eng. 2020, 27, 479–499. [Google Scholar] [CrossRef]
  19. Safe Software. FME: Data Integration Platform. 2024. Available online: https://fme.safe.com (accessed on 15 January 2024).
  20. Caballero, F.; Merino, L. DLL: Direct LIDAR Localization. A map-based localization approach for aerial robots. In Proceedings of the 2021 IEEE/RSJ International Conference on Intelligent Robots and Systems (IROS), Prague, Czech Republic, 28–30 September 2021; pp. 5491–5498. [Google Scholar] [CrossRef]
  21. Zhou, B.; Gao, F.; Wang, L.; Liu, C.; Shen, S. Robust and Efficient Quadrotor Trajectory Generation for Fast Autonomous Flight. IEEE Robot. Autom. Lett. 2019, 4, 3529–3536. [Google Scholar] [CrossRef]
  22. Murillo, J.I.; Montes, M.A.; Zahinos, R.; Trujillo, M.A.; Viguria, A.; Heredia, G. Simplifying Autonomous Aerial Operations: LUCAS, a Lightweight Framework for UAV Control and Supervision. In Proceedings of the 2025 International Conference on Unmanned Aircraft Systems (ICUAS), Charlotte, NC, USA, 14–17 May 2025; pp. 854–861. [Google Scholar] [CrossRef]
  23. Wei, H.; Li, R.; Cai, Y.; Yuan, C.; Ren, Y.; Zou, Z.; Wu, H.; Zheng, C.; Zhou, S.; Xue, K.; et al. LAMM: Large-scale multi-session point-cloud map merging. IEEE Robot. Autom. Lett. 2024, 10, 88–95. [Google Scholar] [CrossRef]
  24. Zhu, F.; Zhao, Y.; Chen, Z.; Jiang, C.; Zhu, H.; Hu, X. DyGS-SLAM: Realistic Map Reconstruction in Dynamic Scenes Based on Double-Constrained Visual SLAM. Remote Sens. 2025, 17, 625. [Google Scholar] [CrossRef]
  25. Liu, Y.; Dong, S.; Wang, S.; Yin, Y.; Yang, Y.; Fan, Q.; Chen, B. SLAM3R: Real-time dense scene reconstruction from monocular RGB videos. arXiv 2024. [Google Scholar] [CrossRef]
  26. Jing, S.; Li, X.; Maru, M.B.; Yu, B.; Cha, G.; Park, S. Occlusion-aware hybrid learning framework for point cloud understanding in building mechanical, electrical, and plumbing systems. Energy and Buildings. 2025, 344, 115955. [Google Scholar] [CrossRef]
  27. Yue, H.; Wang, Q.; Zhao, H.; Zeng, N.; Tan, Y. Deep learning applications for point clouds in the construction industry: A review. Autom. Constr. 2024, 168, 105769. [Google Scholar] [CrossRef]
  28. Abreu, N.; Pinto, A.; Matos, A.; Pires, M. Procedural point cloud modelling in scan-to-BIM and scan-vs-BIM applications: A review. ISPRS Int. J. Geo-Inf. 2023, 12, 260. [Google Scholar] [CrossRef]
  29. Savarese, S.; Fischer, M.; Flager, F.; Hamledari, H. Using UAVs for Automated BIM-Based Construction Progress Monitoring and Quality Control. Center for Integrated Facility Engineering, Stanford University. 2020. Available online: https://cife.stanford.edu (accessed on 15 January 2024).
  30. Kielhauser, C.; Renteria Manzano, R.; Hoffman, J.J.; Adey, B.T. Automated construction progress and quality monitoring for commercial buildings with unmanned aerial systems: An application study from Switzerland. Infrastructures 2020, 5, 98. [Google Scholar] [CrossRef]
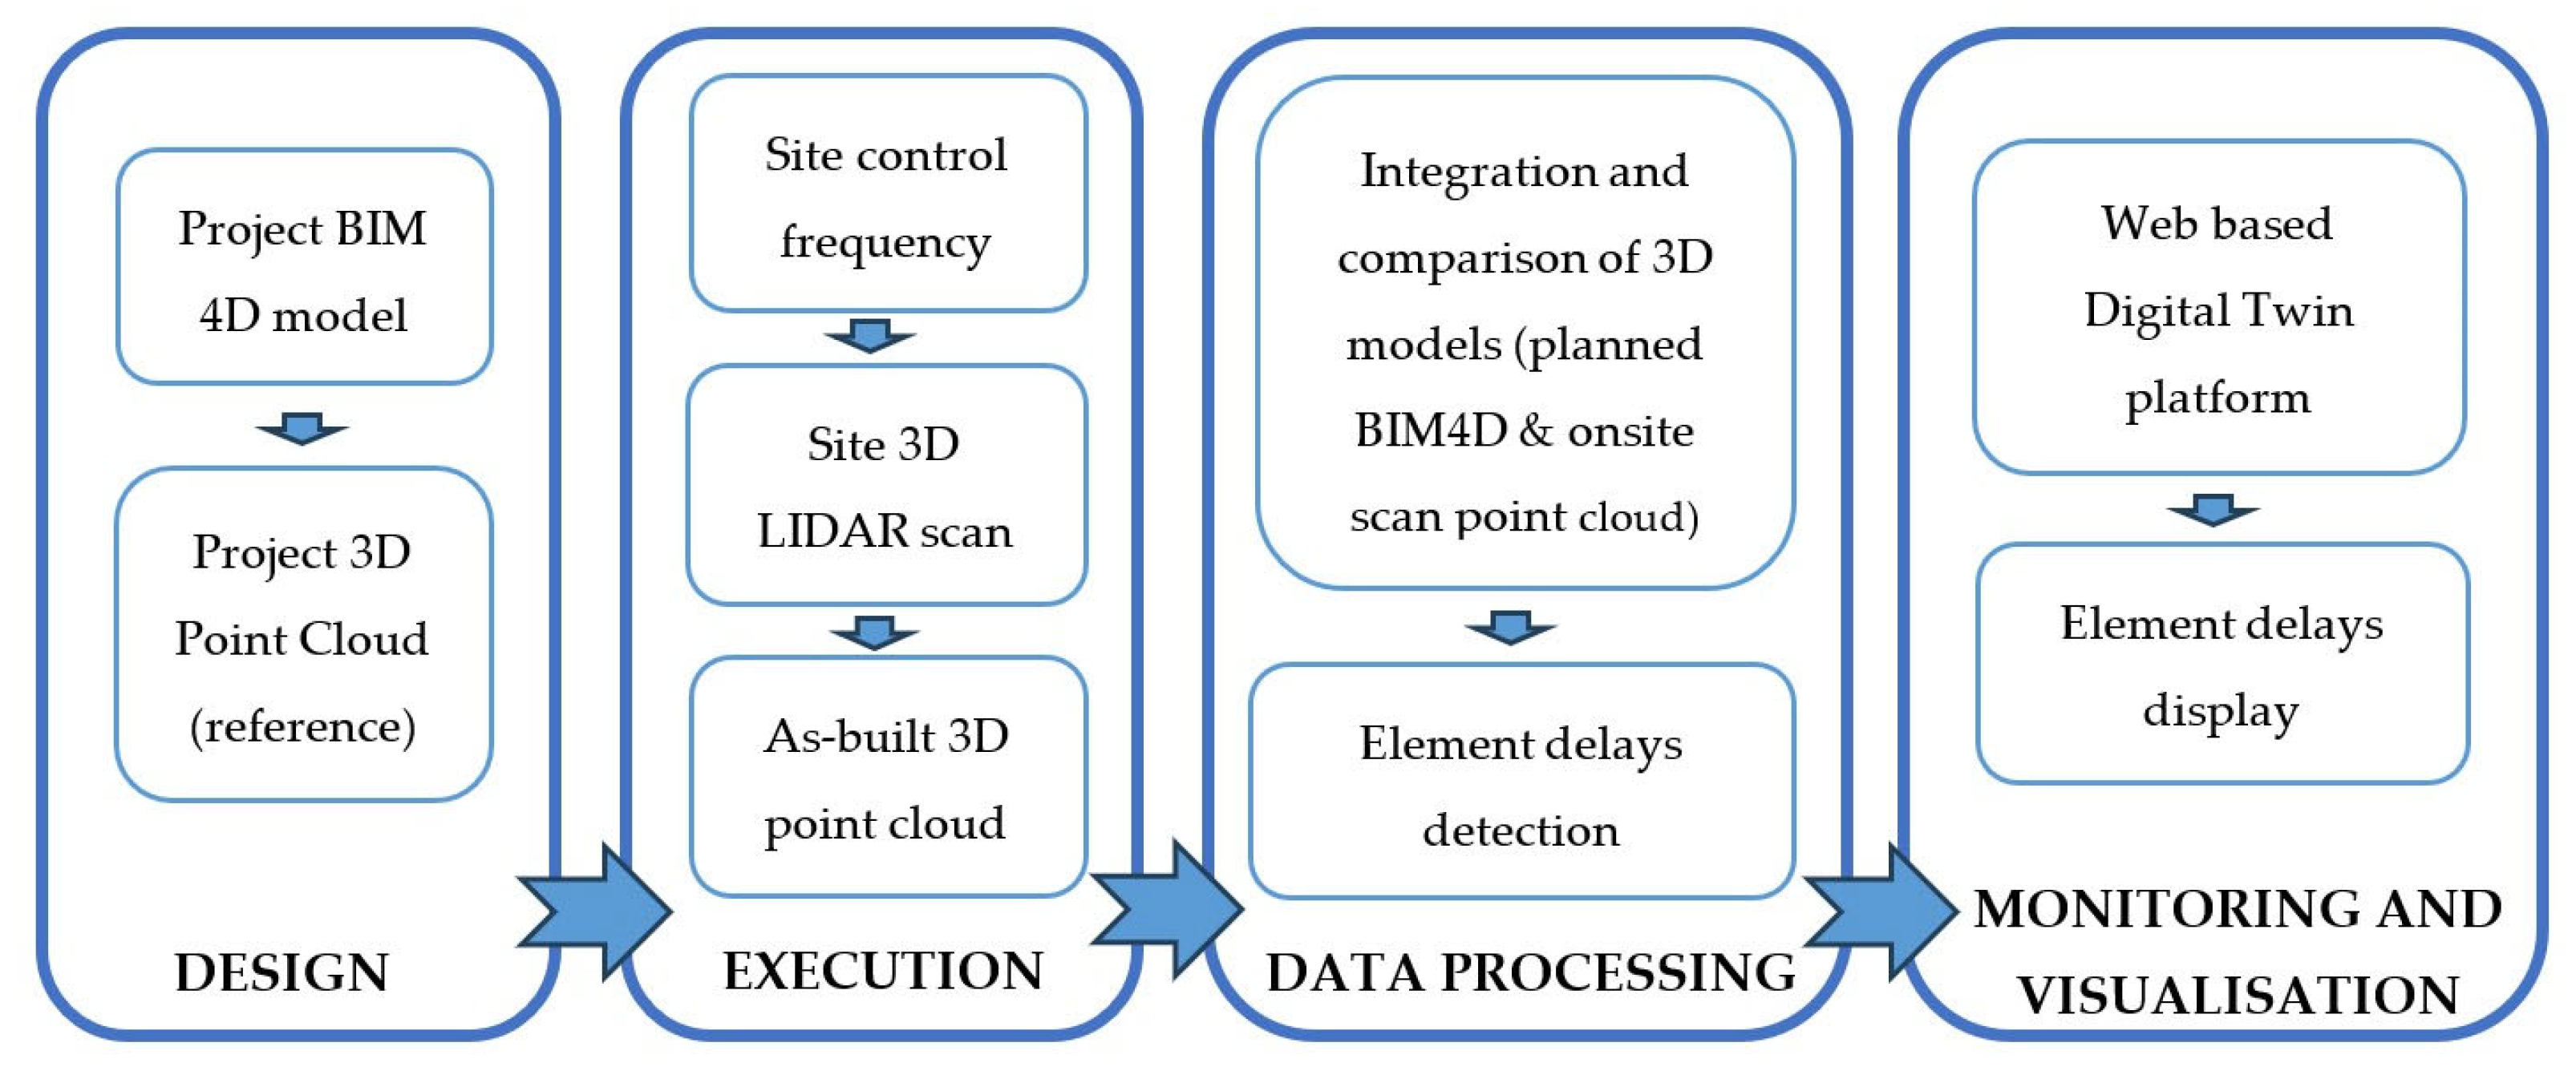
Figure 1. Process flowchart.
Buildings 15 03487 g001
Figure 2. CATEC CADRIN aerial vehicle.
Buildings 15 03487 g002
Figure 3. CADRIN software architecture.
Buildings 15 03487 g003
Figure 4. DLL alignment process. In green, the target point cloud (the BIM’s one). In red, the source point cloud, and in blue, the aligned point cloud.
Buildings 15 03487 g004
Figure 5. Autonomous navigation in the construction site.
Buildings 15 03487 g005
Figure 6. Reference point cloud generation flowchart (later deployed in FME).
Buildings 15 03487 g006
Figure 7. BIM model and point cloud comparison flowchart (later deployed in FME).
Buildings 15 03487 g007
Figure 8. Use case structure BIM model.
Buildings 15 03487 g008
Figure 9. 3D reference point cloud.
Buildings 15 03487 g009
Figure 10. Use case onsite scan ((Right): Overview of the working site. (Left): Detailed view of the drone flying autonomously).
Buildings 15 03487 g010
Figure 11. Use case scan point cloud generation ((Left): Real-time map generation aligned with the reference cloud. (Right): Result of the map generated).
Buildings 15 03487 g011
Figure 12. Use case models comparison with FME (appearance of FME blocks and crossing of 3D spatial models).
Buildings 15 03487 g012
Figure 13. Digital Twin interface.
Buildings 15 03487 g013
Disclaimer/Publisher’s Note: The statements, opinions and data contained in all publications are solely those of the individual author(s) and contributor(s) and not of MDPI and/or the editor(s). MDPI and/or the editor(s) disclaim responsibility for any injury to people or property resulting from any ideas, methods, instructions or products referred to in the content.