Article

Visual and Non-Destructive Testing of ASR Affected Piers from Montreal’s Champlain Bridge

by
Leah Kristufek
*,
Leandro F. M. Sanchez
,
Beatriz Martín-Pérez
and
Martin Noël
Department of Civil Engineering, University of Ottawa, Ottawa, ON K1N 6N5, Canada
*
Author to whom correspondence should be addressed.
Buildings 2025, 15(18), 3262; https://doi.org/10.3390/buildings15183262
Submission received: 3 July 2025 / Revised: 7 August 2025 / Accepted: 26 August 2025 / Published: 10 September 2025
(This article belongs to the Section Building Materials, and Repair & Renovation)

Abstract

Condition assessment of reinforced concrete structures presents a significant challenge worldwide as structures built in the post-war construction period (1950s–1970s) reach end of service life. The alkali-silica reaction (ASR) is one of several damage mechanisms which commonly affect infrastructure in Canada. Frequent freeze-thaw cycles and heavy use of de-icing salts in winter as well as high heat and humidity in summer are expected to have intensified ASR-induced damage. This work investigates five segments of a pier cap—PC, which had undergone encapsulation repair, and four segments of a pier shaft—PS, which represented dry and semi-submerged conditions, removed from a highway bridge constructed starting in 1957. Preliminary evaluation through visual inspection (conventional, qualitative and quantitative using the cracking index—CI) and non-destructive techniques (rebound hammer—RBH, ultrasonic pulse velocity—UPV and surface resistivity) was conducted on both internal (i.e., cut during decommissioning) and external (i.e., exposed while in service) surfaces of five PC segments and four PS segments. Differences in geometry, exposure conditions and repair history from the two members were found to have limited impact on the results of quantitative tests (i.e., CI, RBH and UPV results with average values of 1.6 mm/m, 37 MPa and 2.4 Km/s, respectively) while still exhibiting qualitative differences in visual determination (i.e., crack patterns, surface appearance and crack widths).

1. Introduction

Since the advent of Portland cement in the early 20th century, concrete has become one of the most common building materials, with construction practices evolving to facilitate increasingly diverse uses (e.g., different shapes and sizes). However, inspection of reinforced concrete structures presents significant challenges, with internal damage often going undetected despite the potential for significant reductions in mechanical properties. Due to a construction boom in the post-war era (1950s–1970s), many North American structures are now nearing the end of their service life [1], representing a pressing need to accurately identify the most deteriorated structures for replacement. The presence of internal swelling reactions (ISR), where expansive damage is induced by chemical reactions within the concrete, is of particular concern, with damage due to ISR identified more frequently as the age of concrete increases. Among these, the alkali-silica reaction (ASR) presents a significant risk to infrastructure worldwide. ASR occurs between the highly alkaline pore solution and unstable mineral phases in aggregate particles, with significant reductions in modulus of elasticity occurring even at low levels of damage from this mechanism [2] due to cracking in cement paste and aggregate particles induced by the formation of an expansive reaction product.
Visual and non-destructive testing are the first steps in routine inspection for the monitoring of in-service structures. Results from these tests are used to determine if further testing, such as extraction of cores, is needed to determine the cause and extent of damage (i.e., diagnosis), along with the potential for further deterioration (i.e., prognosis); these are critical for the selection of efficient maintenance and repair strategies. However, detection of ISR, in this discussion considered to be primarily ASR, which result in swelling throughout the concrete material, presents a significant challenge since cracking in field structures is complex with a combination of damage mechanisms often occurring concurrently [3,4]. Damage caused by ISR (e.g., cracking) can be potentially overshadowed by visible damage on the surface, such as discoloration, rust and scaling [5]. Mechanisms including freeze-thaw and corrosion can additionally cause surface deterioration, resulting in misleading results from non-destructive techniques such as rebound hammers and ultrasonic pulse velocity, which rely on transmissions through the damaged layer [6]. As such, current techniques for the detection of ASR in internal concrete are limited, necessitating the removal of concrete cores to verify cause and extent of internal damage [7,8]. Results from investigations of in-service structures are further limited in the literature due to confidentiality and safety concerns with recent literature focusing on results from extracted cores [9,10,11,12].
Tracking damage development in members of a structure is an important aspect of visual inspections. Qualitative (i.e., identifying crack patterns) and quantitative (i.e., the cracking index—CI [8,13] methods are used to enhance visual inspections, facilitating comparisons between different members or between the same locations over time. Use of artificial intelligence models has become increasingly common in recent years, sparking increased interest in using systematic visual assessments of in-service structures [14]. When visual inspections indicate increasing damage in members, non-destructive tests (NDT) are often used to determine next steps. Commonly used NDTs include the rebound hammer (to estimate compressive strength), ultrasonic pulse velocity (to estimate interior concrete quality, including delamination within concrete), and surface electrical resistivity (to evaluate the likelihood of chloride ingress).
It is widely known that visual and non-destructive tests have important limitations. Temperature and moisture conditions can impact results with similar climatic conditions recommended when the same test is repeated over numerous years [8]. Surface resistivity and UPV are especially sensitive to moisture conditions in concrete. NDTs are further limited by the condition of the surface concrete since damage such as delamination may block the ability of tests to evaluate the interior concrete. UPV additionally can underestimate damage when reinforcing bars are parallel to the measurement direction due to faster transmission through steel [15], presenting a challenge for use in highly reinforced concrete members. Otherwise, the non-destructive nature, relatively low costs and ease of use of these methods mean that NDTs will continue to be used on in-service structures.

1.1. Background

The Champlain Bridge (CB) was a Canadian highway bridge which experienced significant deterioration in concrete members, ultimately leading to its decommissioning in 2019 after 57 years in service. The bridge, which crossed the St. Lawrence River, experienced a harsh service environment with cold, snowy winters and hot humid summers. Concrete members exhibited signs of deterioration early in the service life, with the cause of damage thought to be a combination of damage mechanisms including reinforcement corrosion, freeze-thaw cycles and alkali-silica reaction (ASR), which were identified during inspections as early as the 1980s and 1990s [16]. The presence of ASR in members of the bridge was confirmed through the extraction of cores from several piers during the mid-1990s [17]; however, its long-term impact on concrete performance and potential structural implications were poorly understood. Deterioration of reinforced concrete members necessitated an increasing number of repair and rehabilitation measures, both across the whole bridge (e.g., improved drainage system to remove chloride-rich water from the driving surface [16]) and localized to individual deteriorated members (e.g., removal of concrete with high concentrations of chloride from runoff water, implementing external post-tensioning). While repairs undoubtably helped to extend the service life of the structure, repair strategies differed depending on the damage mechanisms present in the members, with ASR often overlooked in condition assessment of in-service structures due to its reduced visibility at the surface of the structure. The CB was constructed using a novel pre-stressed design where the bridge surface consisted of an interconnected system of girders, diaphragms and deck slabs and consisted of six traffic lanes. T-type piers with a ‘hammerhead’ pier cap design supported seven girders per span, with expansion joints positioned directly above the pier cap. During decommissioning of the structure, a variety of members were set aside for research. Of these, a pier cap, part of pier 42 W located in the on-land portion of the Montreal approach, and a pier shaft, part of pier 38 W located in the river (Figure 1), were of interest due to the high likelihood of ASR [17].
Although ASR has been the subject of considerable research worldwide, there continues to be limited literature available about the long-term impact of this mechanism in reinforced concrete structures [18]. Several factors contribute to this gap in knowledge, including confidentiality requirements for many in-service structures and the relatively long time span required for ASR to develop in field structures. Moreover, although individual deterioration mechanisms (e.g., reinforcement corrosion, freeze-thaw, ASR) have been researched extensively, in isolation they are likely to occur simultaneously in real structures. Multiple mechanisms working together may significantly increase the rate of deterioration compared to a single mechanism [19,20,21,22], or can induce the initiation of new mechanisms [23], and their combined effects are important to understand when conducting condition assessments.
ASR impacts many concrete structures in Canada, including numerous structures in Quebec and Ontario [24,25,26]; however, it is challenging to identify this mechanism without extracting cores. ASR is a chemical reaction between the alkali hydroxides from the concrete pore solution and aggregates containing unstable mineral phases. This reaction produces a secondary product (the so-called ASR gel) which absorbs water, resulting in expansion and cracking of the affected concrete [7,24]. ASR results in significant reductions in mechanical properties, especially the modulus of elasticity [2], and thus is a significant threat to the long-term performance of affected concrete members.
During visual assessments of ASR-affected structures, a characteristic ‘map cracking’ pattern is frequently identified in ‘plain’ (i.e., minimally reinforced) concrete. However, when members are reinforced (e.g., heavily reinforced structural concrete members), crack patterns from ASR often occur parallel to the main reinforcement [27,28,29,30,31], making it difficult to distinguish it from other deterioration mechanisms, such as corrosion of steel reinforcement. Reduced alkalinity in surface concrete due to weathering may further reduce the presence of reaction products (e.g., the ASR gel), further complicating detection of ASR during visual inspections.
In older structures, repairs are also common. This is the case for the pier cap investigated in this work, which underwent an encapsulation repair in 2004 after 42 years in service. During this repair, concrete was removed up to the outermost layer of reinforcing bars and replaced by a less permeable repair concrete [32,33], followed by the addition of three Dywidag bars to provide additional longitudinal post-tensioning [33] in 2008 (Figure 2).

1.2. Scope of Work

This paper presents the results of qualitative and quantitative visual assessments and non-destructive testing performed on ASR-affected members (i.e., pier cap (PC) and pier shaft (PS)) from the Champlain Bridge. Testing was conducted to evaluate how differences within the members (i.e., orientation of surfaces, wet vs. dry) and between the members (i.e., different geometry, previous repairs) impacted visual and NDT outcomes. The research findings are expected to improve understanding of the relationship between concrete damage due to ASR detected in visual and non-destructive test results for these reinforced concrete members. Extended analysis of qualitative and quantitative visual testing (i.e., observed crack orientations and measured crack widths) will further provide a link to future work evaluating concrete cores from these members using a multi-level testing protocol.

2. Materials and Methods

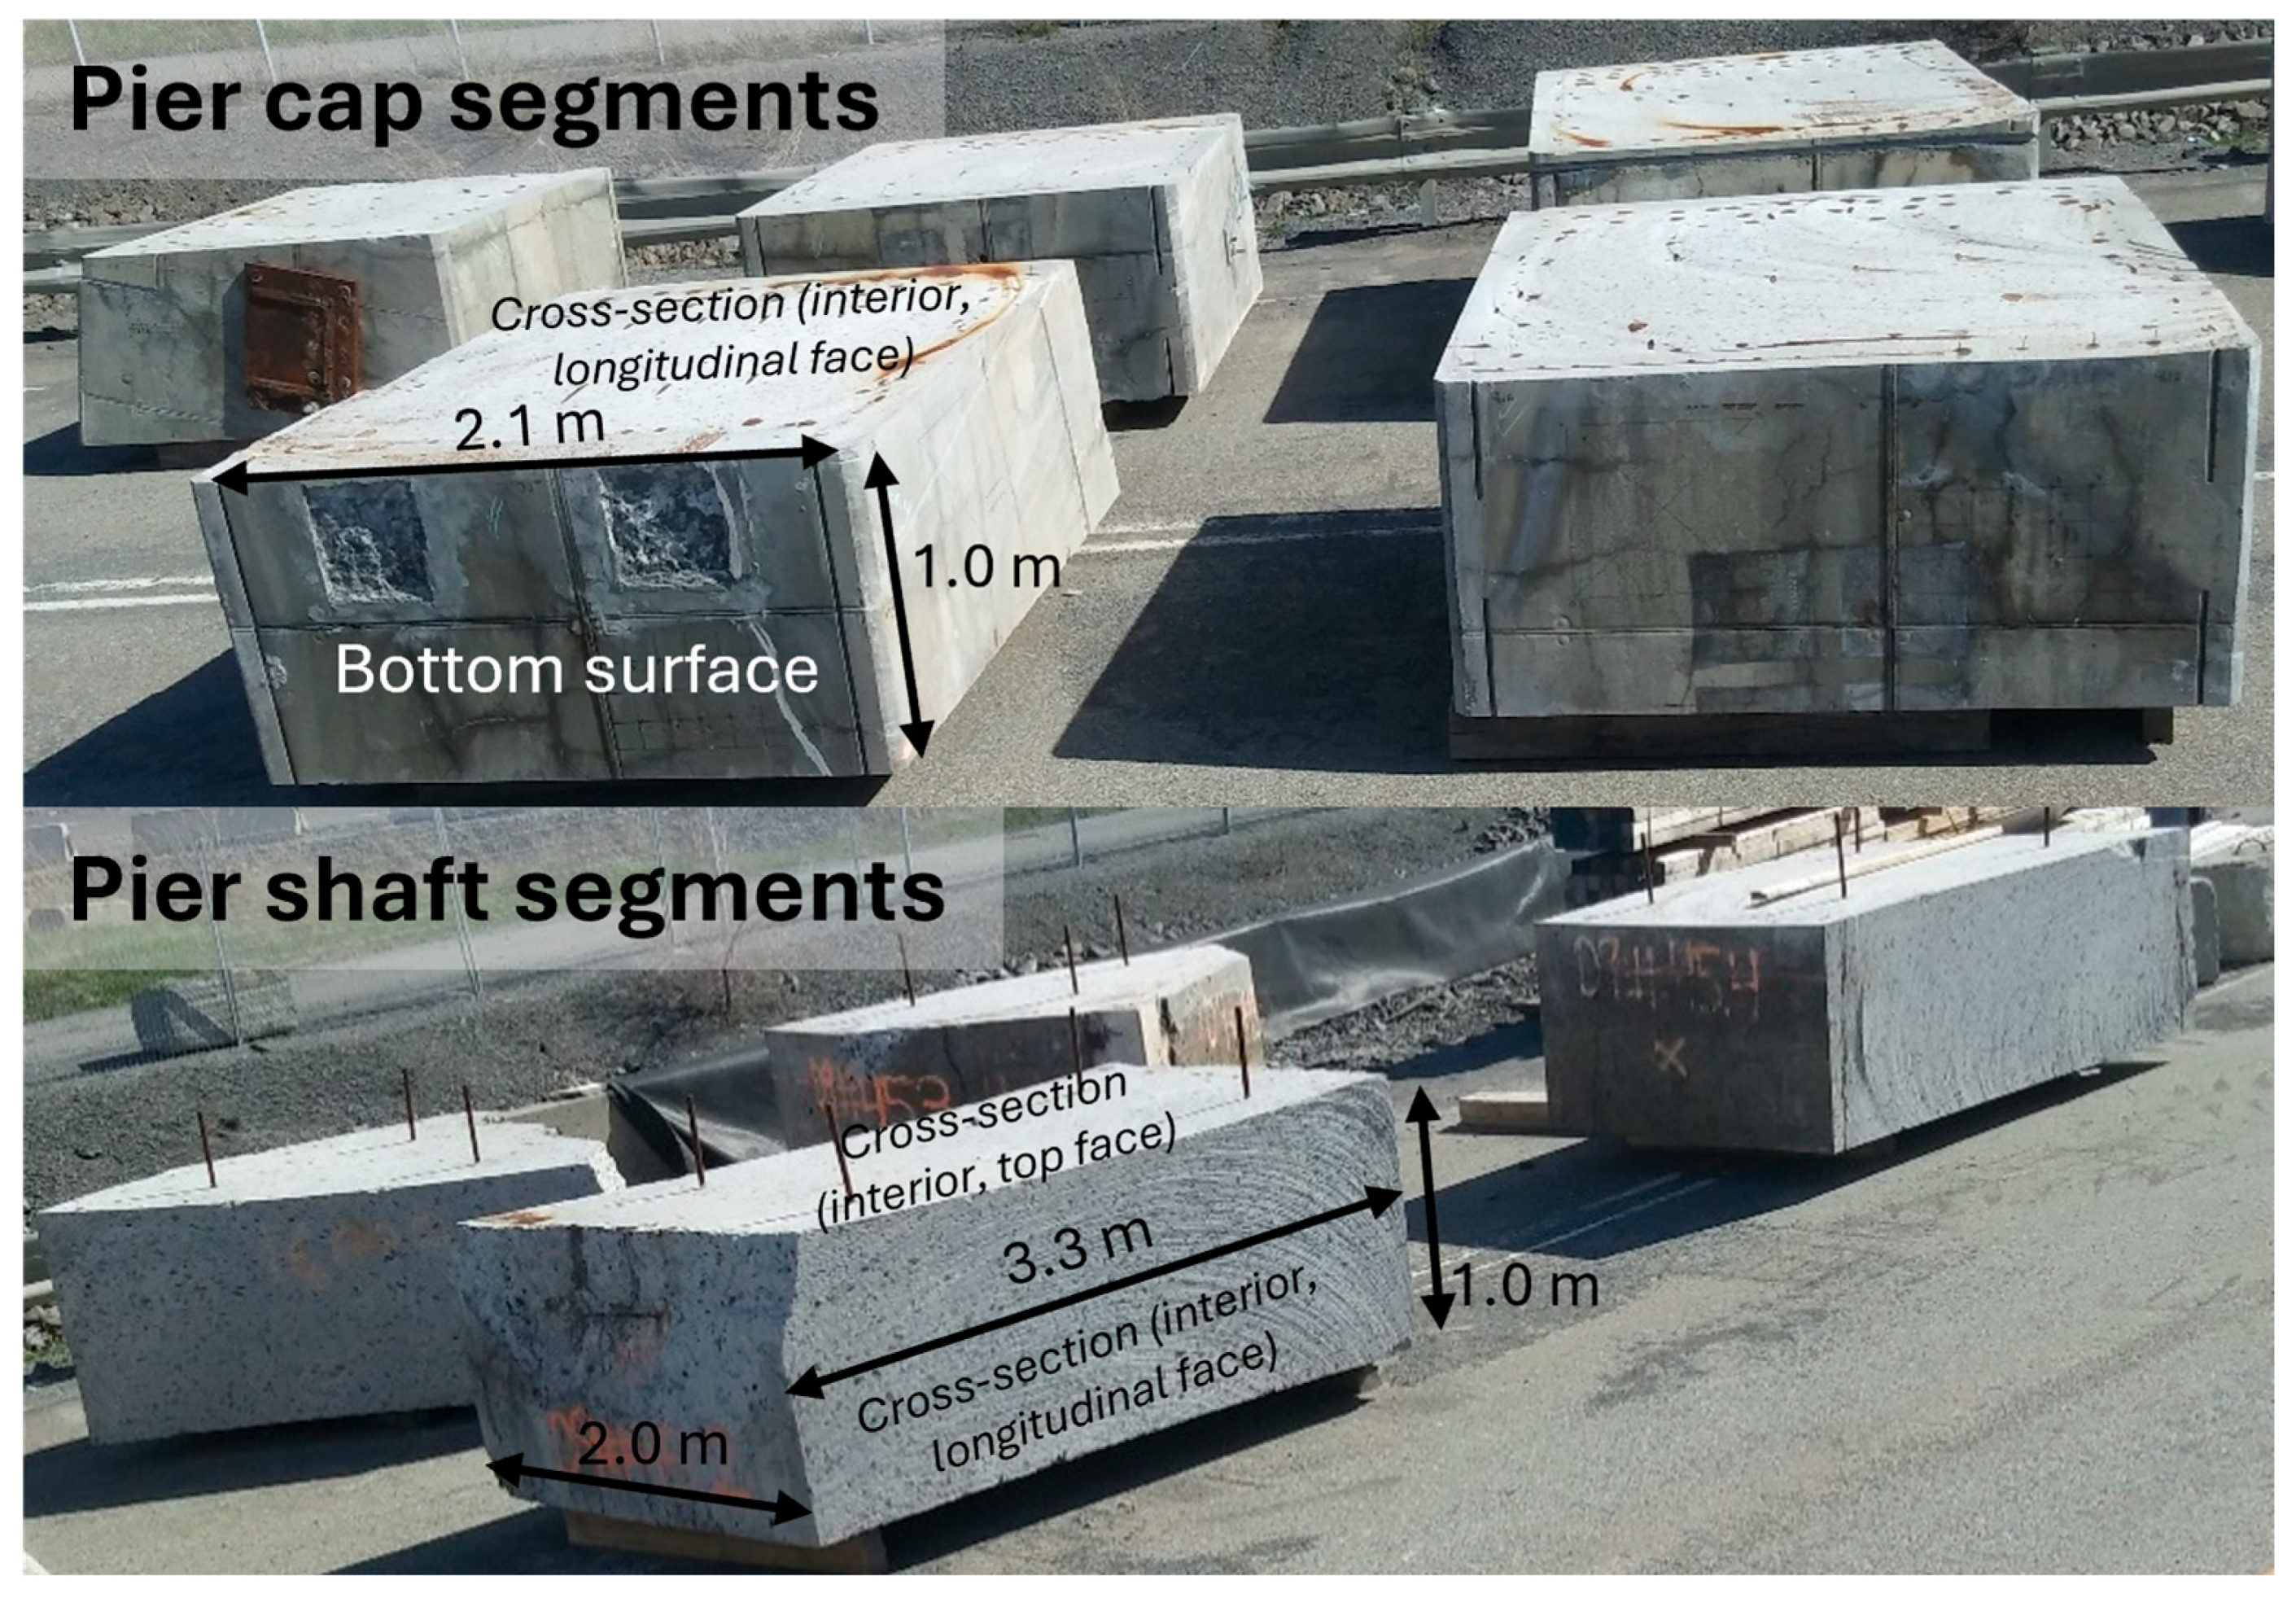
The PC (extracted from pier 42 W) and PS (extracted from pier 38 W) members were removed from the CB as part of the deconstruction process, with sections of the two members accessed in 2021–2023. Visual and non-destructive tests were performed on the primary exposed faces of the PC and PS as well as internal surfaces exposed during deconstruction (Figure 3), with the east, west and bottom facing surfaces investigated for all five PC segments (i.e., two from the north end and three from the south end), and all east and west faces investigated from the PS segments (i.e., all from the south end). Visual inspection techniques included conventional and quantitative (i.e., using the cracking index) methods, while non-destructive techniques utilized included Schmidt hammer, ultrasonic pulse velocity and surface resistivity. Preliminary results of investigation of the PC were previously reported in [34], which was presented at the 6th International Conference on Concrete Repair, Rehabilitation and Retrofitting, while preliminary results of investigation of the PS were previously reported in [35], which was presented at the Canadian Society of Civil Engineers annual conference in 2023.

2.1. Visual Inspection

Detailed visual inspection was performed on all segments, with a focus on surfaces that were exposed to weathering when the members were in service. This included qualitative (photos, noting discoloration, metal fixtures attached to surfaces, etc.), semi-qualitative (i.e., measuring crack widths) and quantitative (i.e., cracking index—CI) assessments of observable damage. Surface crack data collected in situ (i.e., location and width of cracks) were manually traced onto photos using the software GIMP (version 2.10.34) to identify the cracking pattern. The widths of visible cracks were measured, with a priority placed on recording the widest crack widths along with signs of increased moisture which could indicate a predisposition to ASR [5,8].
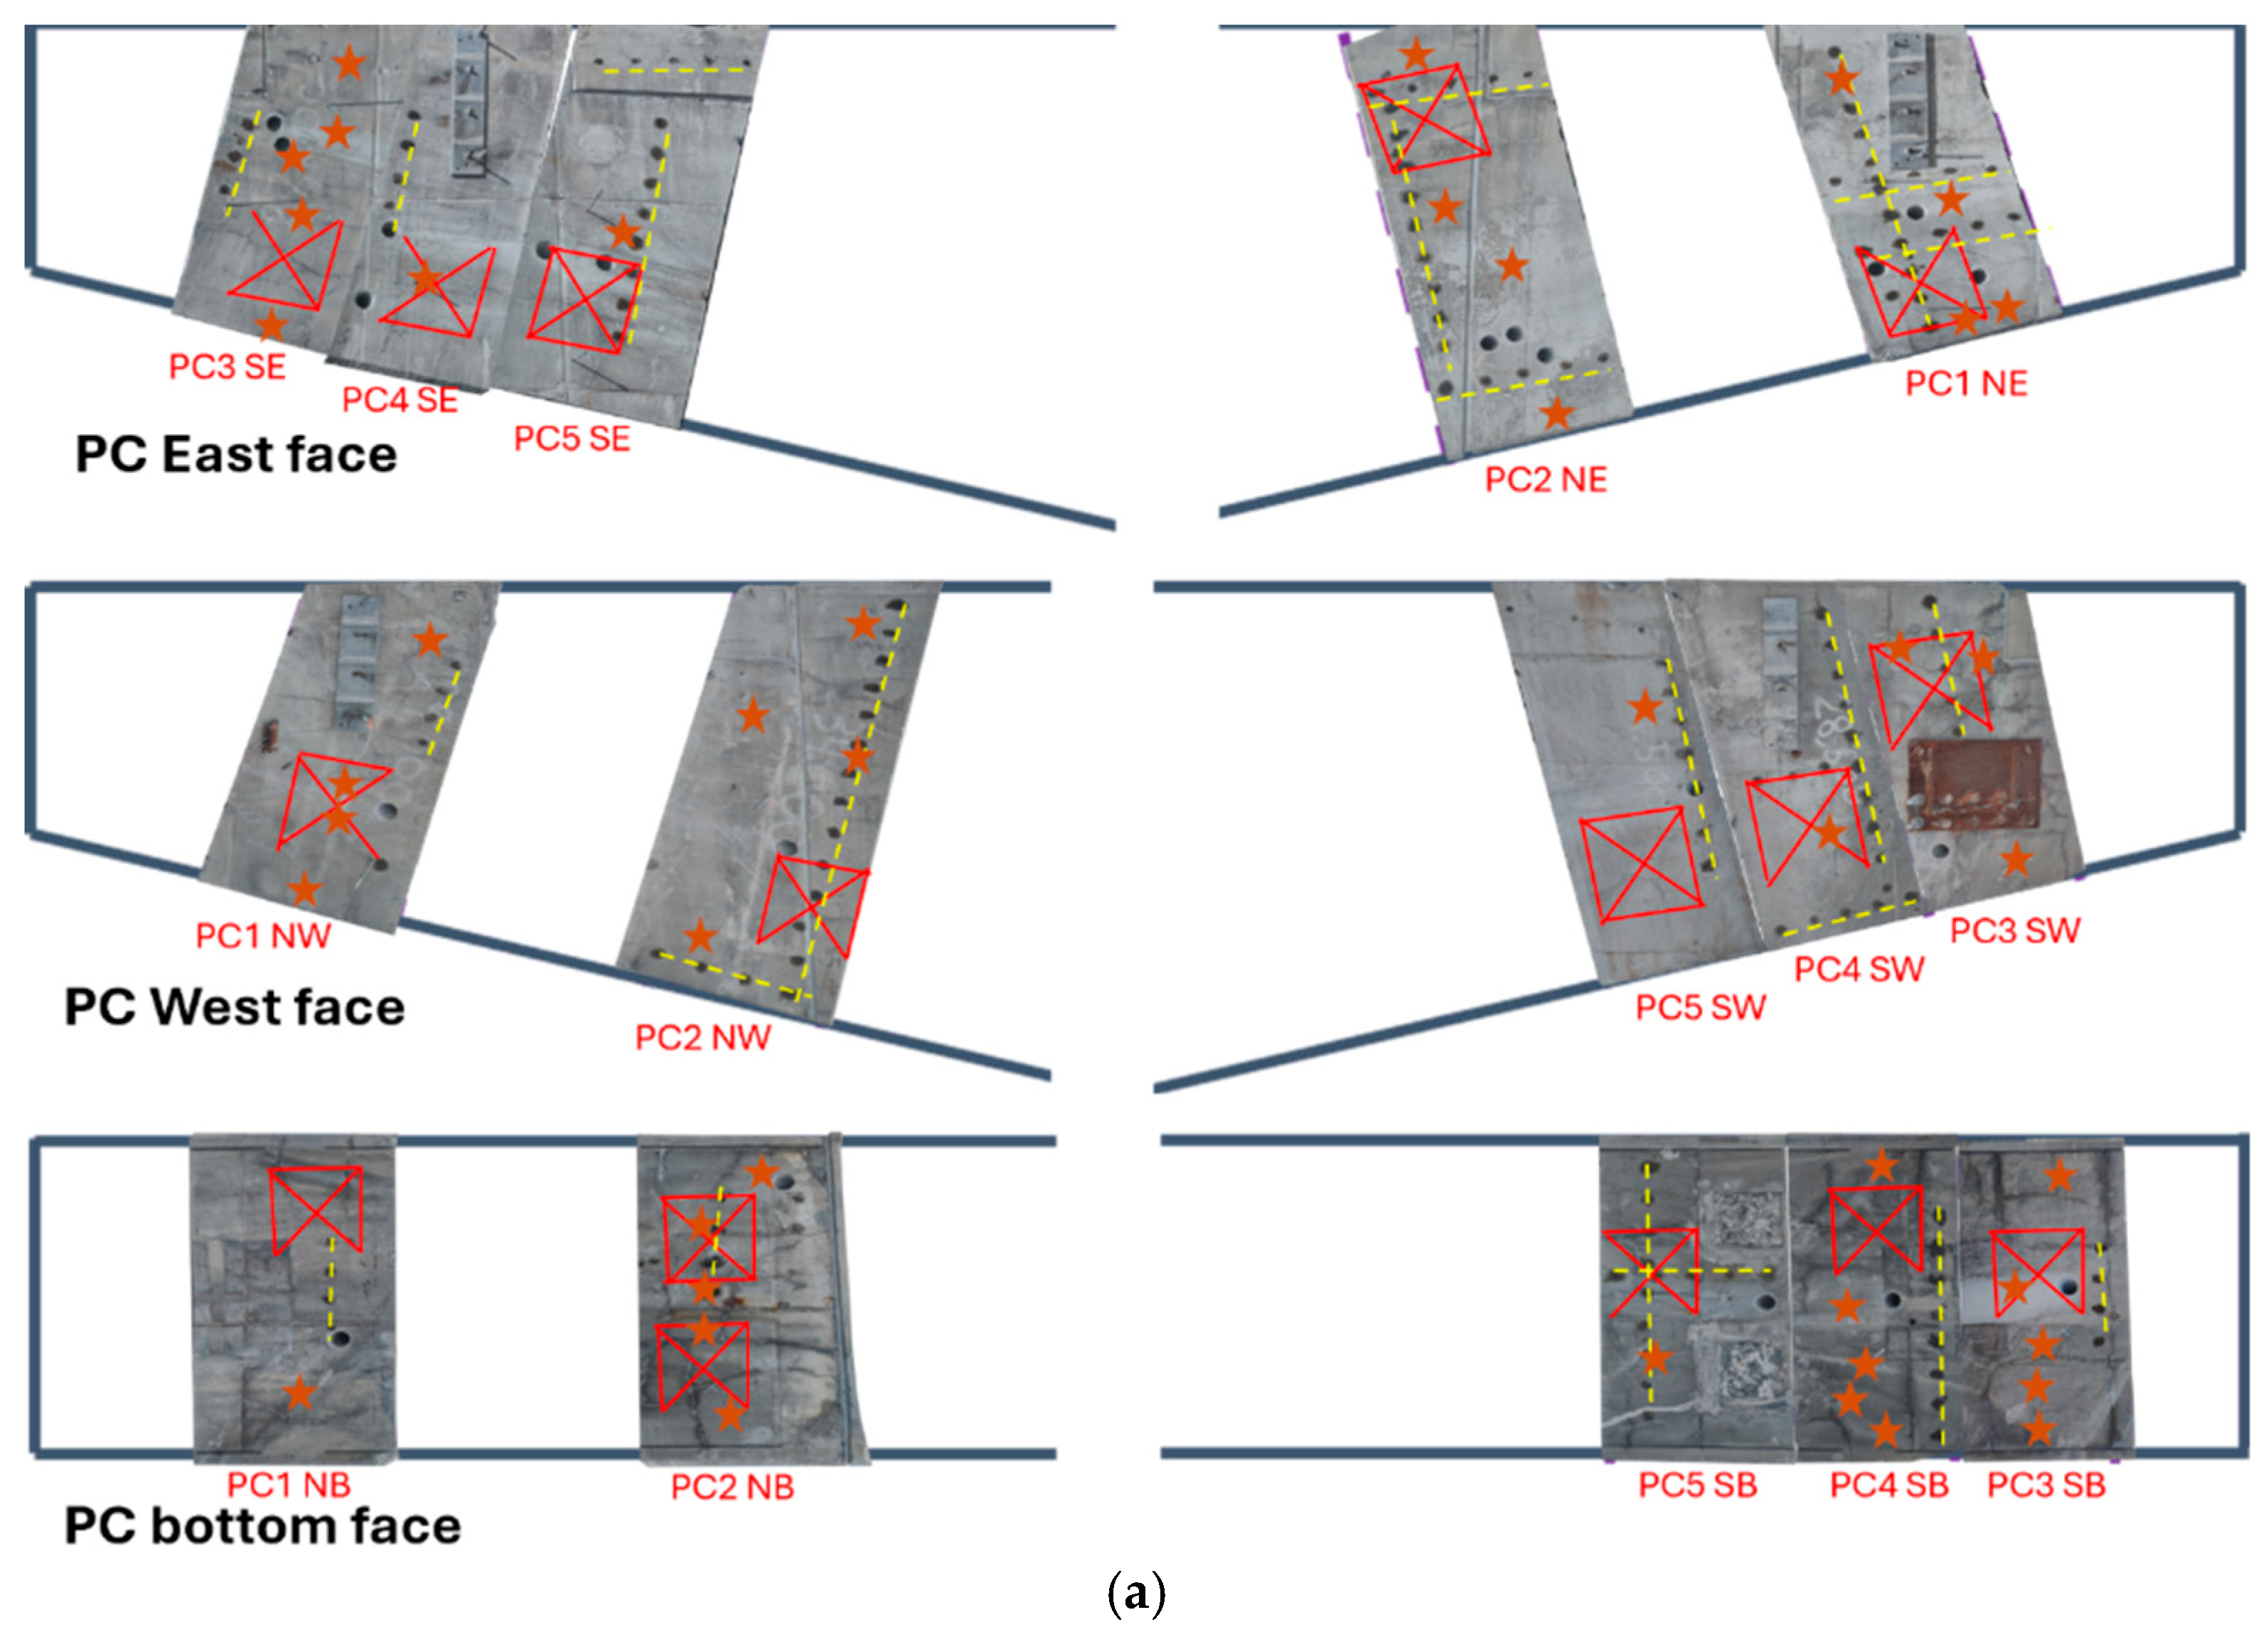
The CI, a quantitative visual inspection technique, was performed at the most damaged location (i.e., that with the highest number of visible cracks) on each surface in each of the west, east and bottom of each PC segment and the east and west surfaces of each PS segment. A minimum of one vertical and horizontal line with length 0.5 m in an ‘L’ shape as well as two diagonal lines in the shape of an ‘X’ were drawn on the surfaces, with additional horizontal and vertical lines evaluated in some locations (see Figure 3). A minimum length of 2 m in each direction (i.e., vertical or horizontal lines) is recommended for statistically significant results, as discussed by Fournier et al. [8]. The width of cracks intersecting the lines was recorded, with the CI value in mm/m determined as shown in Equation (1). In reinforced concrete, a CI value greater than 0.5 mm/m [8] indicates the need for further assessment, while crack widths in excess of 0.15 mm also trigger additional investigation, particularly for pre-stressed concrete [36]. All cracking indices were performed using a crack comparator card to measure crack widths.
C I = C r a c k   o p e n i n g s B a s e   l e n g t h

2.2. Non-Destructive Testing

Three non-destructive test techniques were used to investigate concrete quality (i.e., rebound hammer, ultrasonic pulse velocity, and surface electrical resistivity) with measurements performed at several locations on each surface of interest to evaluate variation across different areas of the members. The locations of rebound hammer and ultrasonic pulse velocity measurements are shown in Figure 4, while surface resistivity was conducted on an average of seven evenly spaced locations per surface and has not been shown in the figure. Surfaces which would have been accessible in situ were prioritized, with NDTs also performed on cross-sectional areas exposed when segments were removed from the structure.
Rebound hammer measurements were conducted following the procedure in ASTM C 805 [37]. Tests were performed with the device held perpendicular to the test surface (i.e., device held parallel to the ground). Rebound values were converted to the compressive strength for a standard concrete cylinder using the calibration chart included with the testing device.
Ultrasonic pulse velocity (UPV) testing was conducted as described in ASTM C 597-16 [15]. Tests were performed using 0.2 m spacing increments between the transmitter and receiver; contact to the surface was achieved using petroleum jelly. The indirect method was used due to the large size of the segments and the presence of reinforcing bars, which can impact the results. In this work, UPV speeds of 3.0 km/s or slower are considered to indicate the need for further investigation following [38] (i.e., need for destructive testing, coring etc.).
Surface resistivity was conducted using a four-pronged concrete electrical resistivity device with surfaces wetted 10–20 min before testing to achieve approximate SSD condition at the time of testing and avoid water films on the surface as per [28]. Readings were performed on all members on the same day following a week of periodic rain. Following AASHTO-T-358 [39] and ACI 228.2R-13 [40], surface resistivity values < 12 kΩ·cm are taken to indicate high probability of chloride ion penetration (low-durability concrete) while surface resistivity values > 254 kΩ·cm indicate low probability of chloride ion penetration (high-durability concrete).

3. Results

3.1. Visual Inspection (Qualitative)

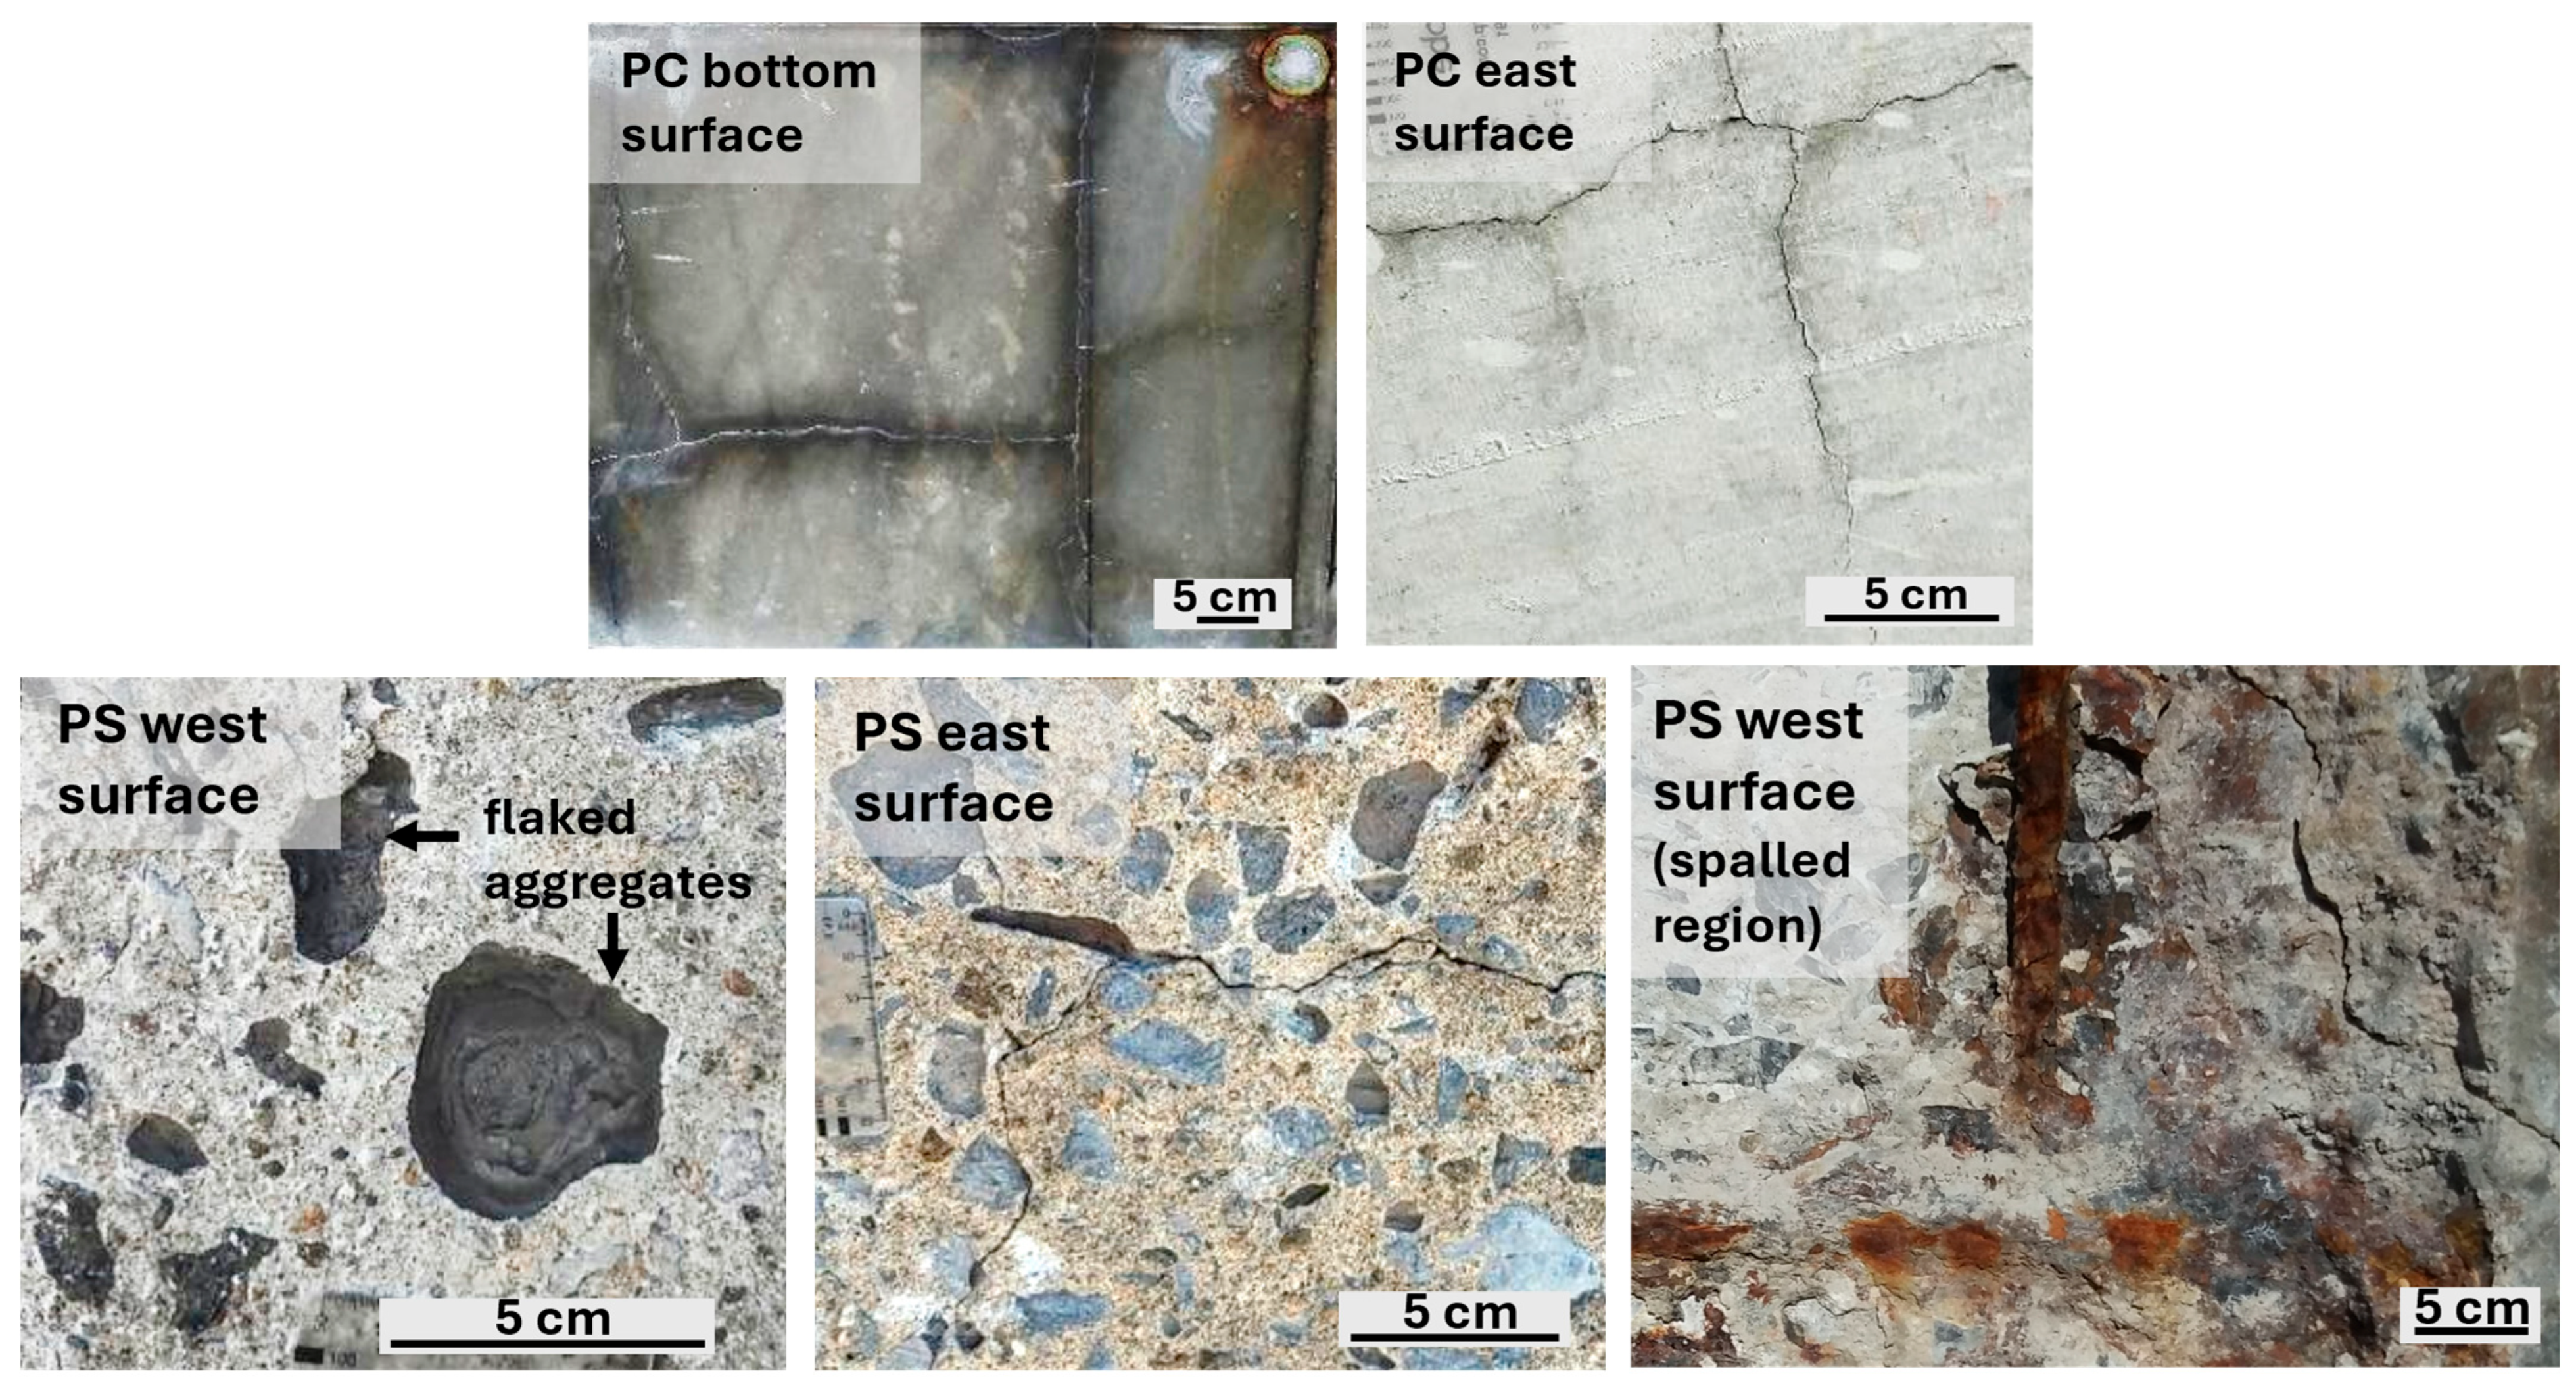
The initial conventional visual inspection identified clear differences between surface concrete quality in the PC and PS members, reflecting the different repair histories (i.e., the 2004 encapsulation repair on the PC) and the localized service environments of the two members (i.e., the submerged and semi-submerged environment of the PS). The bottom surface of the PC member was noted to have a darker appearance compared to east and west surfaces (Figure 5). In the PS segment, exposed aggregates were noted to have flaking or be recessed within the cement paste, indicating deterioration of the aggregate in the service environment.
Cross-sectional surfaces exposed during decommissioning of the structure allowed observation of internal cracking, repair concrete and rebar spacing which could not be observed while the PC and PS were in service. This revealed that the PC repair concrete displayed cover depths varying between 130 and 230 mm. The reinforcement configuration was also visible (Figure 6), with the largest diameter rebar (60 mm ϕ) located at the top of the PC members, with significantly lower reinforcement density in the middle of the member. In the PS cross-sectional surfaces, a lower reinforcement ratio was observed (Figure 6). Planes of delamination could additionally be identified parallel to the external surfaces aligned with the locations of reinforcement (Figure 7). Cracking and visible reaction products (i.e., white gel) in both the cement paste and aggregates could be observed on cross-sectional surfaces without the aid of magnification, while reaction products were not readily visible on external surfaces.

3.1.1. Crack Patterns on Members

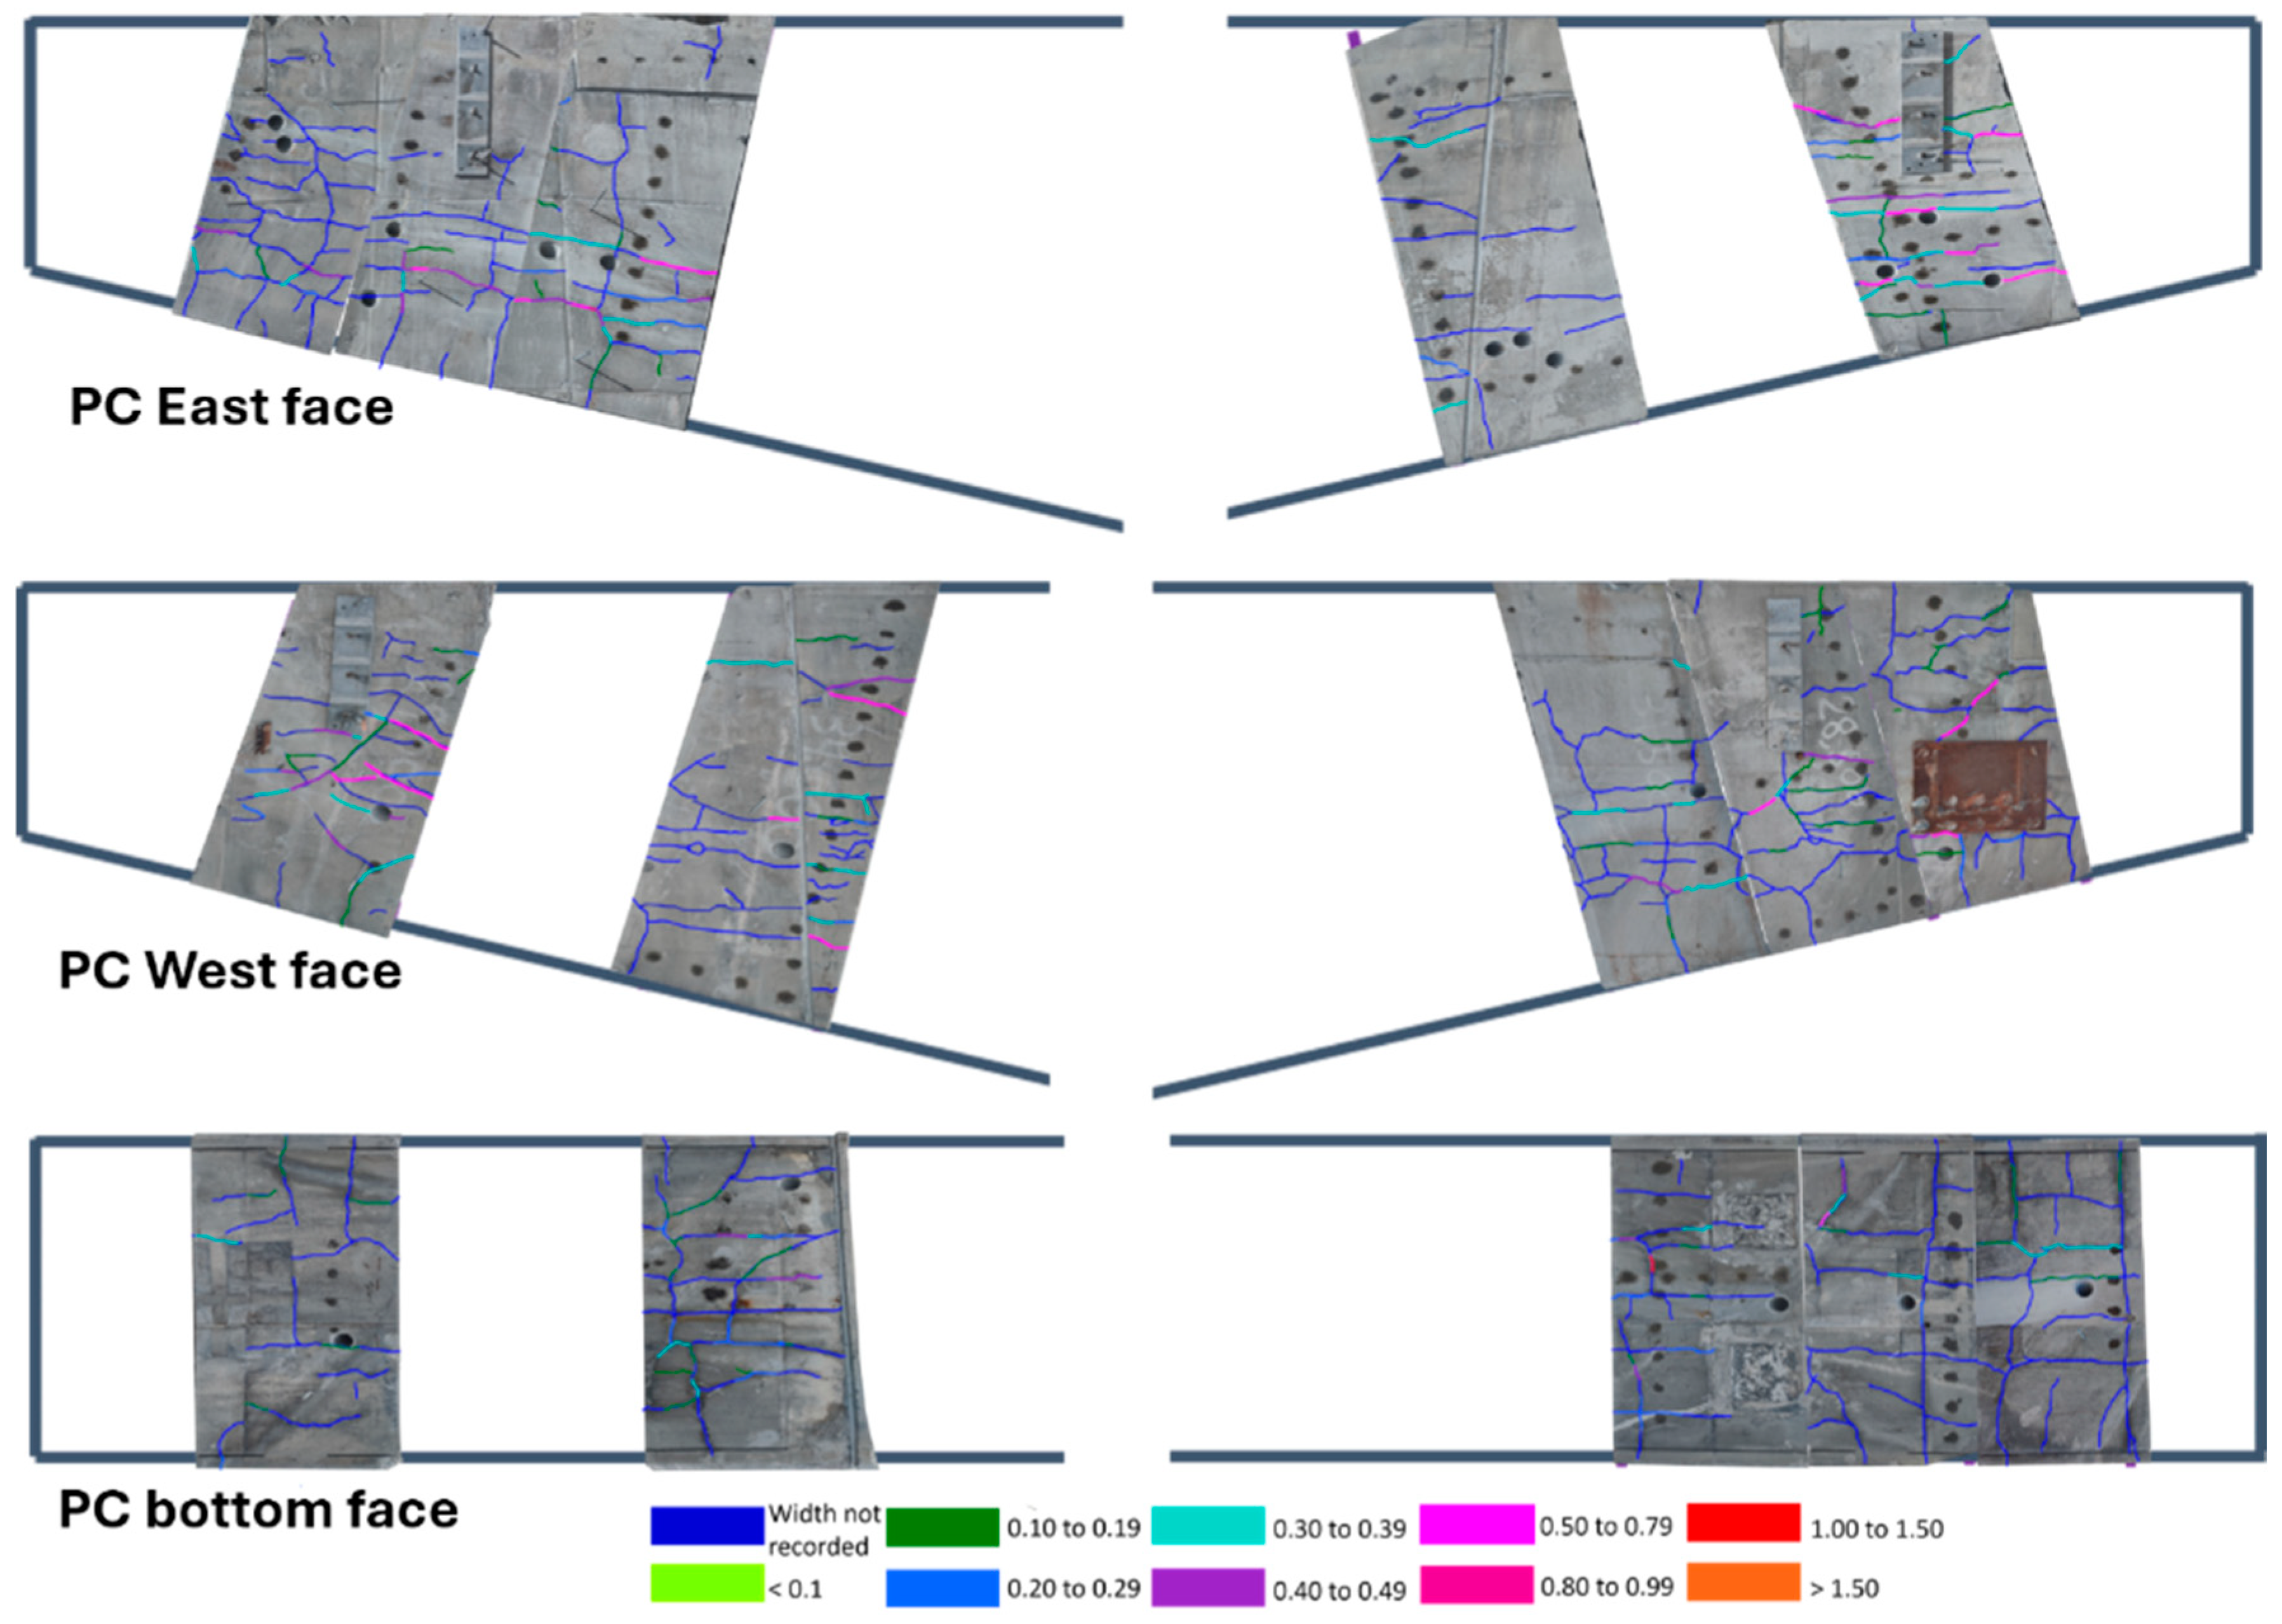
Crack patterns observed on the PC and PS members are shown in Figure 8 and Figure 9, respectively. In the PC, cracking was noted to occur parallel to the bottom, with a higher crack density in areas of less reinforcement. Longitudinal cracks were also observed to be the longest in all surfaces, with transverse cracking extending from the east or west surfaces through the bottom surface. In the PS, vertical cracks were seen to be the predominant crack orientation, with cracks occurring both horizontally and vertically observed to align with reinforcement. A reduction in cracking was noted in the semi-submerged zone, while a long longitudinal crack on the east face was observed to align with reinforcement exposed in the corresponding area on the west face, which had experienced spalling. PS cracks oriented vertically within the member were found to be widest, with the width frequently exceeding 1 mm (colored red and orange).

3.1.2. Cracking Index (CI)

The quantitative visual assessment method, CI, was used to quantify damage on different areas of the members, including different faces (e.g., west vs. east) and compare it between different service environments (e.g., wet vs. dry regions). Due to spalling on the dry portion of the PS west face, CI could not be conducted in this region. Figure 10 shows the average CI for all squares on each face (average of five CI squares for each PC surface, average of three and four CI squares for the west and east faces of the PS, respectively). The highest CI values occurred on the east face of the PS, having a value of 2.5 mm/m. However, all average CI values were higher than 0.5 mm/m, indicating the need for further investigation of the members [8] (i.e., conducting NDTs and/or extracting cores from the members for further testing). When separated into crack widths intersecting different lines of the CI (i.e., vertical, horizontal and diagonal), directional variation was observed. The highest values in mm/m were obtained along the vertical lines of the CI for all but the PS west face, while cracks intersecting horizontal lines were found to be lowest in all but the PS west face, with several instances where no cracks intersected horizontal lines, resulting in a value of zero. CI along the diagonal lines of the CI square resulted in an intermediate value between that of the vertical and horizontal CI values.
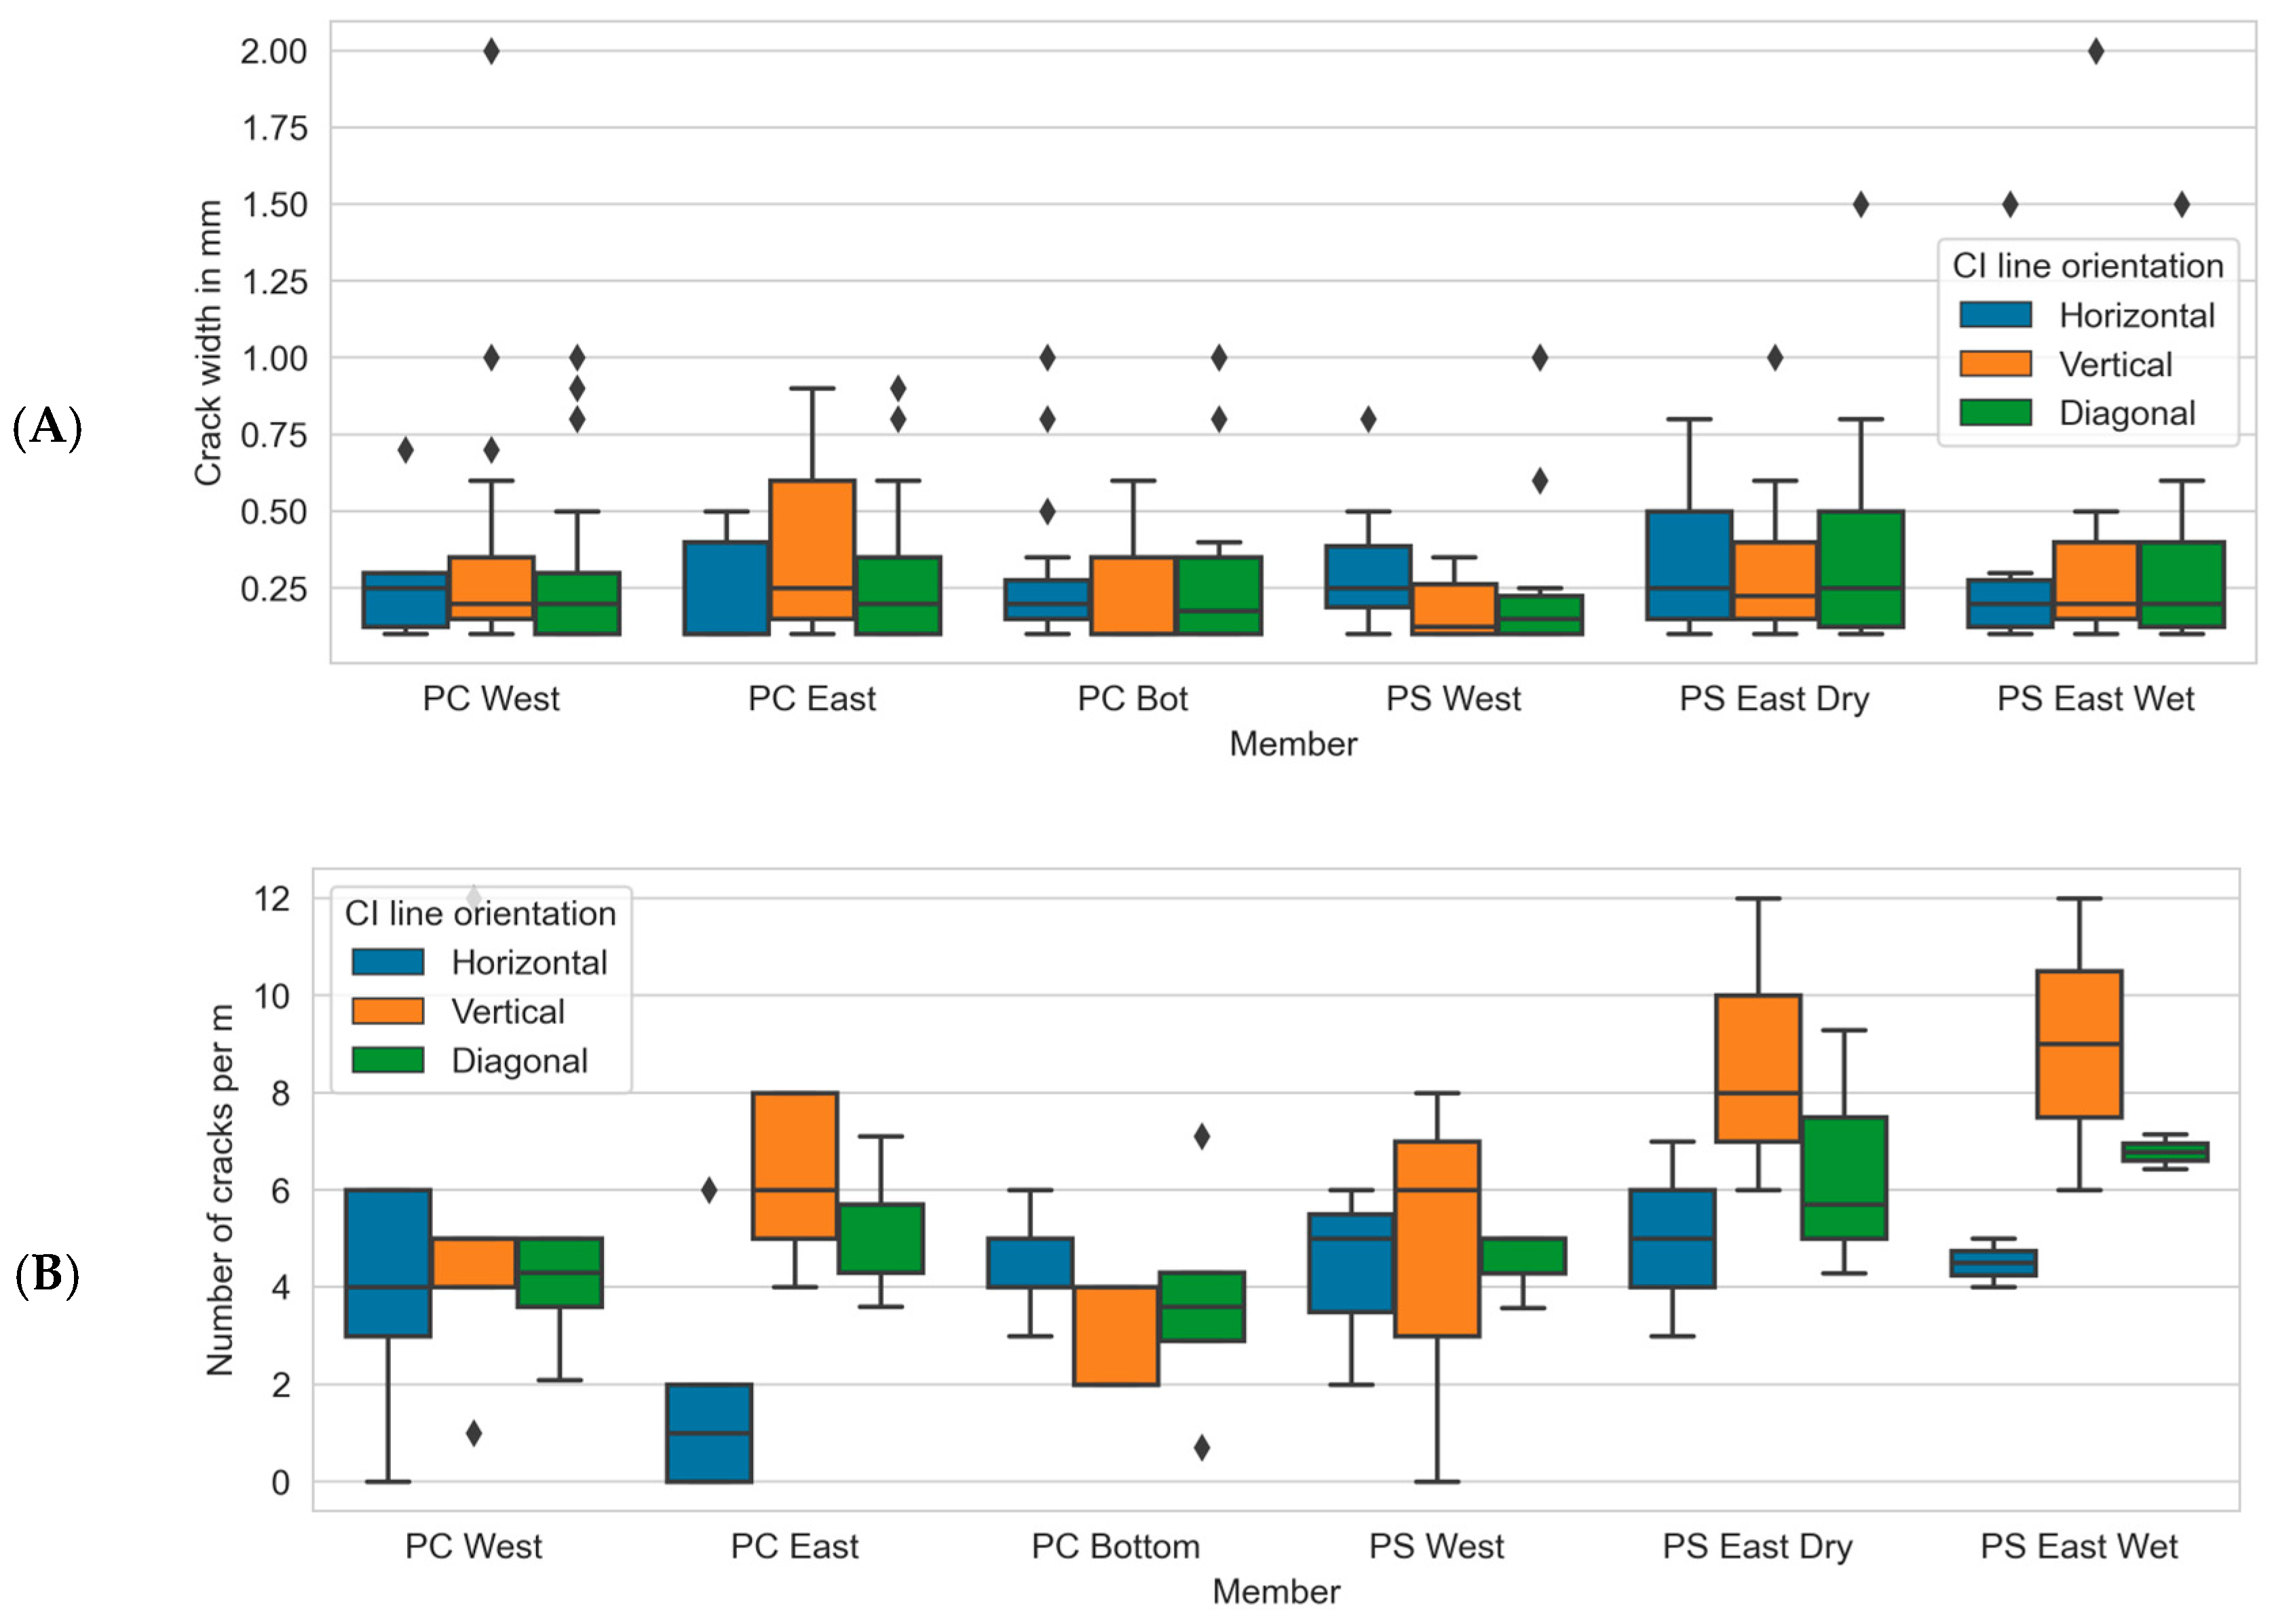
The measured crack widths and the number of cracks per meter intersecting the vertical, horizontal and diagonal CI lines are shown in Figure 11. Median crack widths for the PC ranged from 0.10 to 0.25 mm, while median crack widths for the PS ranged from 0.13 to 0.25 mm. Outliers were frequently observed for crack widths from both members, indicating a large range for the upper half of the data. The median number of cracks ranged from 1 to 6 cracks per meter in the PC and from 4.5 to 9 cracks per meter in the PS specimen, with higher numbers of cracks generally observed for the PS.

3.2. Non-Destructive Testing

3.2.1. Rebound Hammer

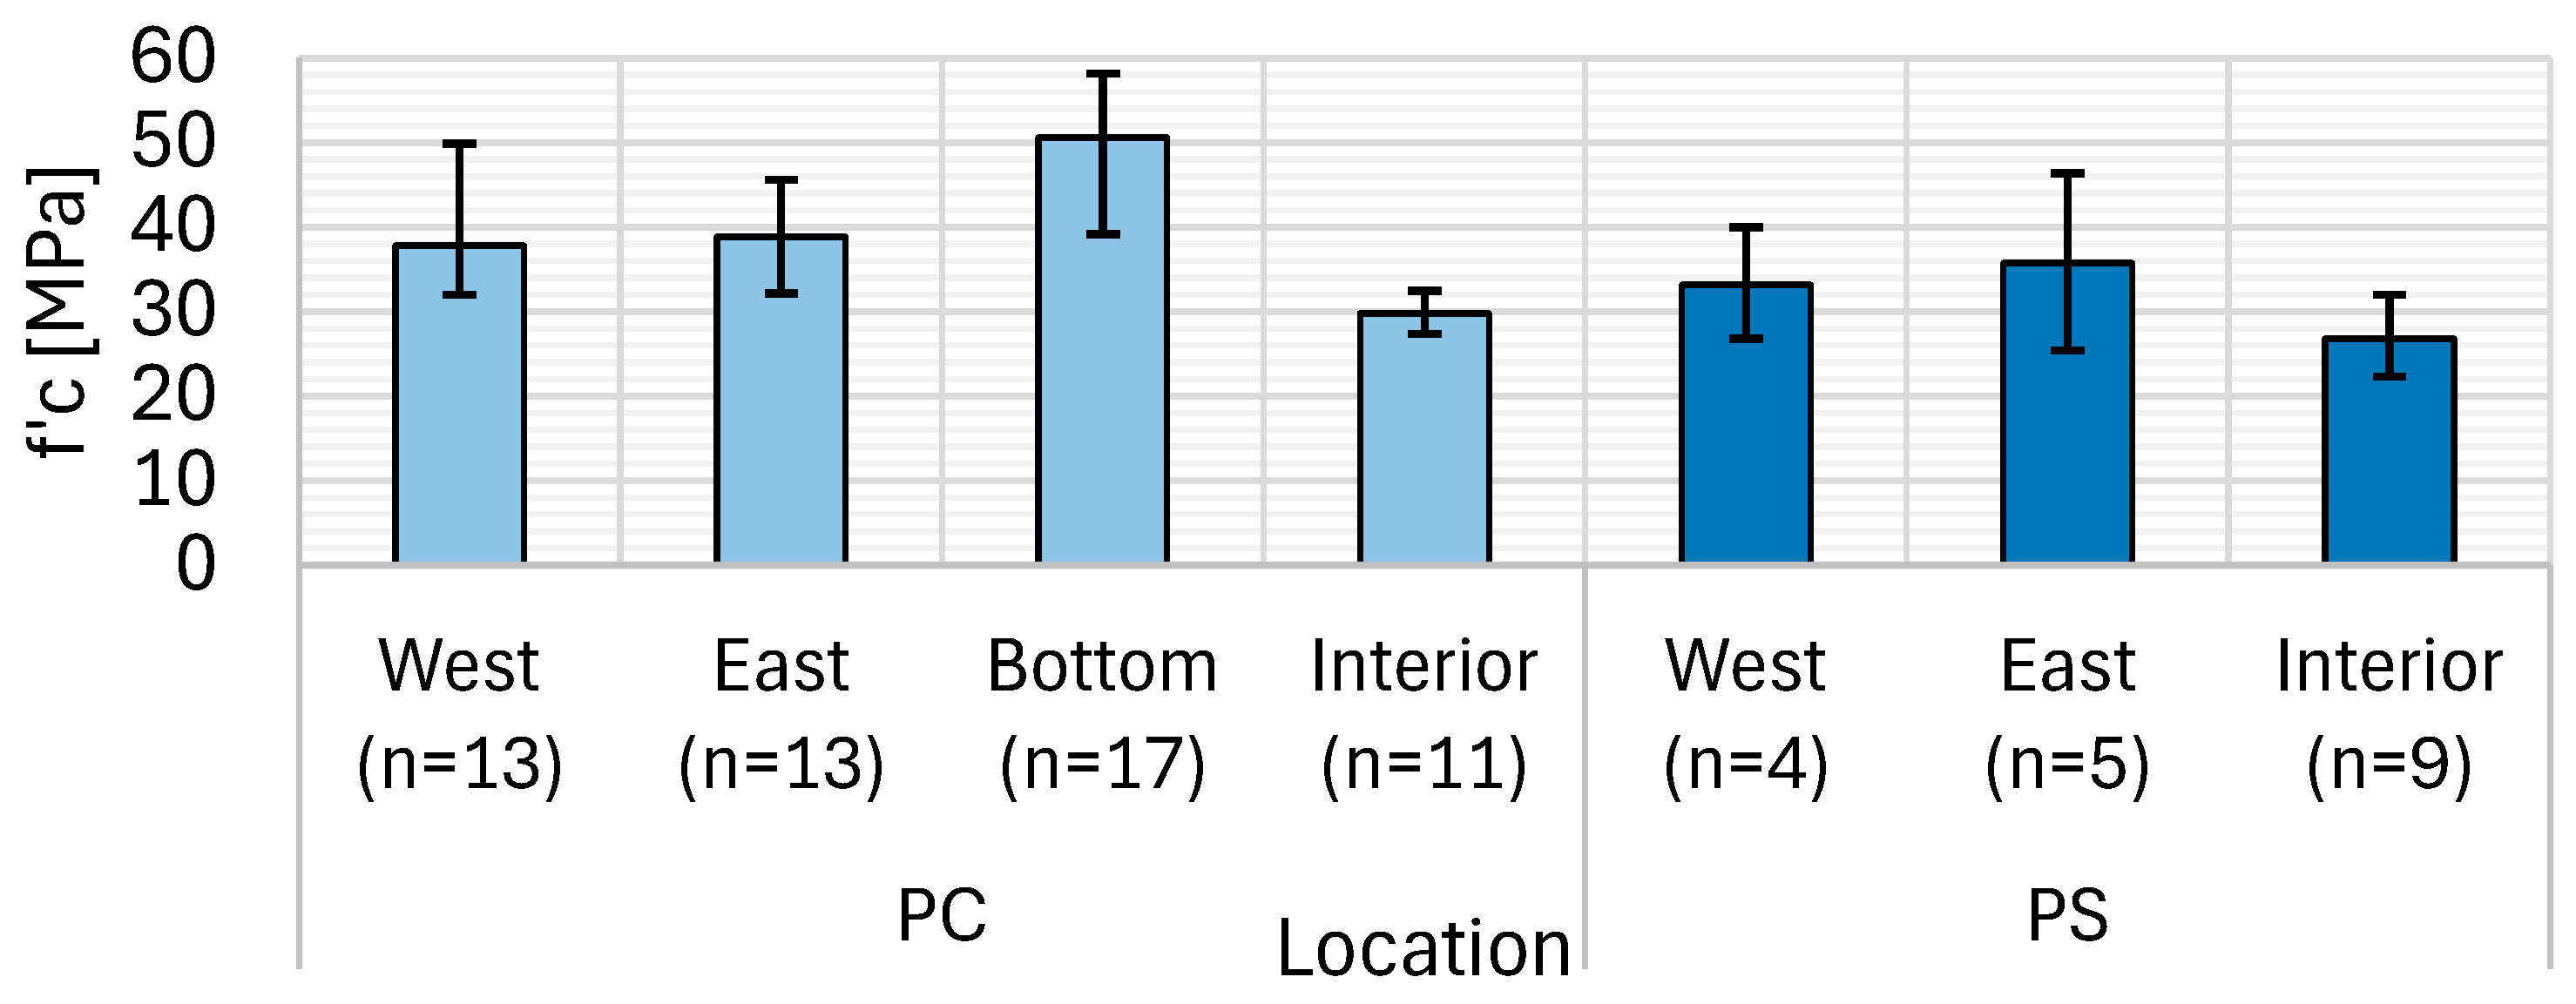
The average compressive strength calculated from the rebound hammer numbers for distinct surfaces of the PC and PS members is shown in Figure 12. The external surfaces of the PC (repair concrete) have higher compressive strengths, with the highest average strength of 51 MPa occurring on the bottom surface, while average strengths on east and west faces are 38 and 39 MPa, respectively. Internal concrete from the cut surfaces of the PC presented a lower concrete strength of 30 MPa. This is more aligned with values in the PS, where average strengths vary from 36 MPa on the east faces to 33 MPa in interior locations, suggesting similar compressive strengths in the two members. In contrast, cores extracted transversally from the PC and PS and tested in compression (i.e., representing interior conditions) were found to have average values of 27 MPa and 23 MPa, respectively.

3.2.2. Ultrasonic Pulse Velocity (UPV)

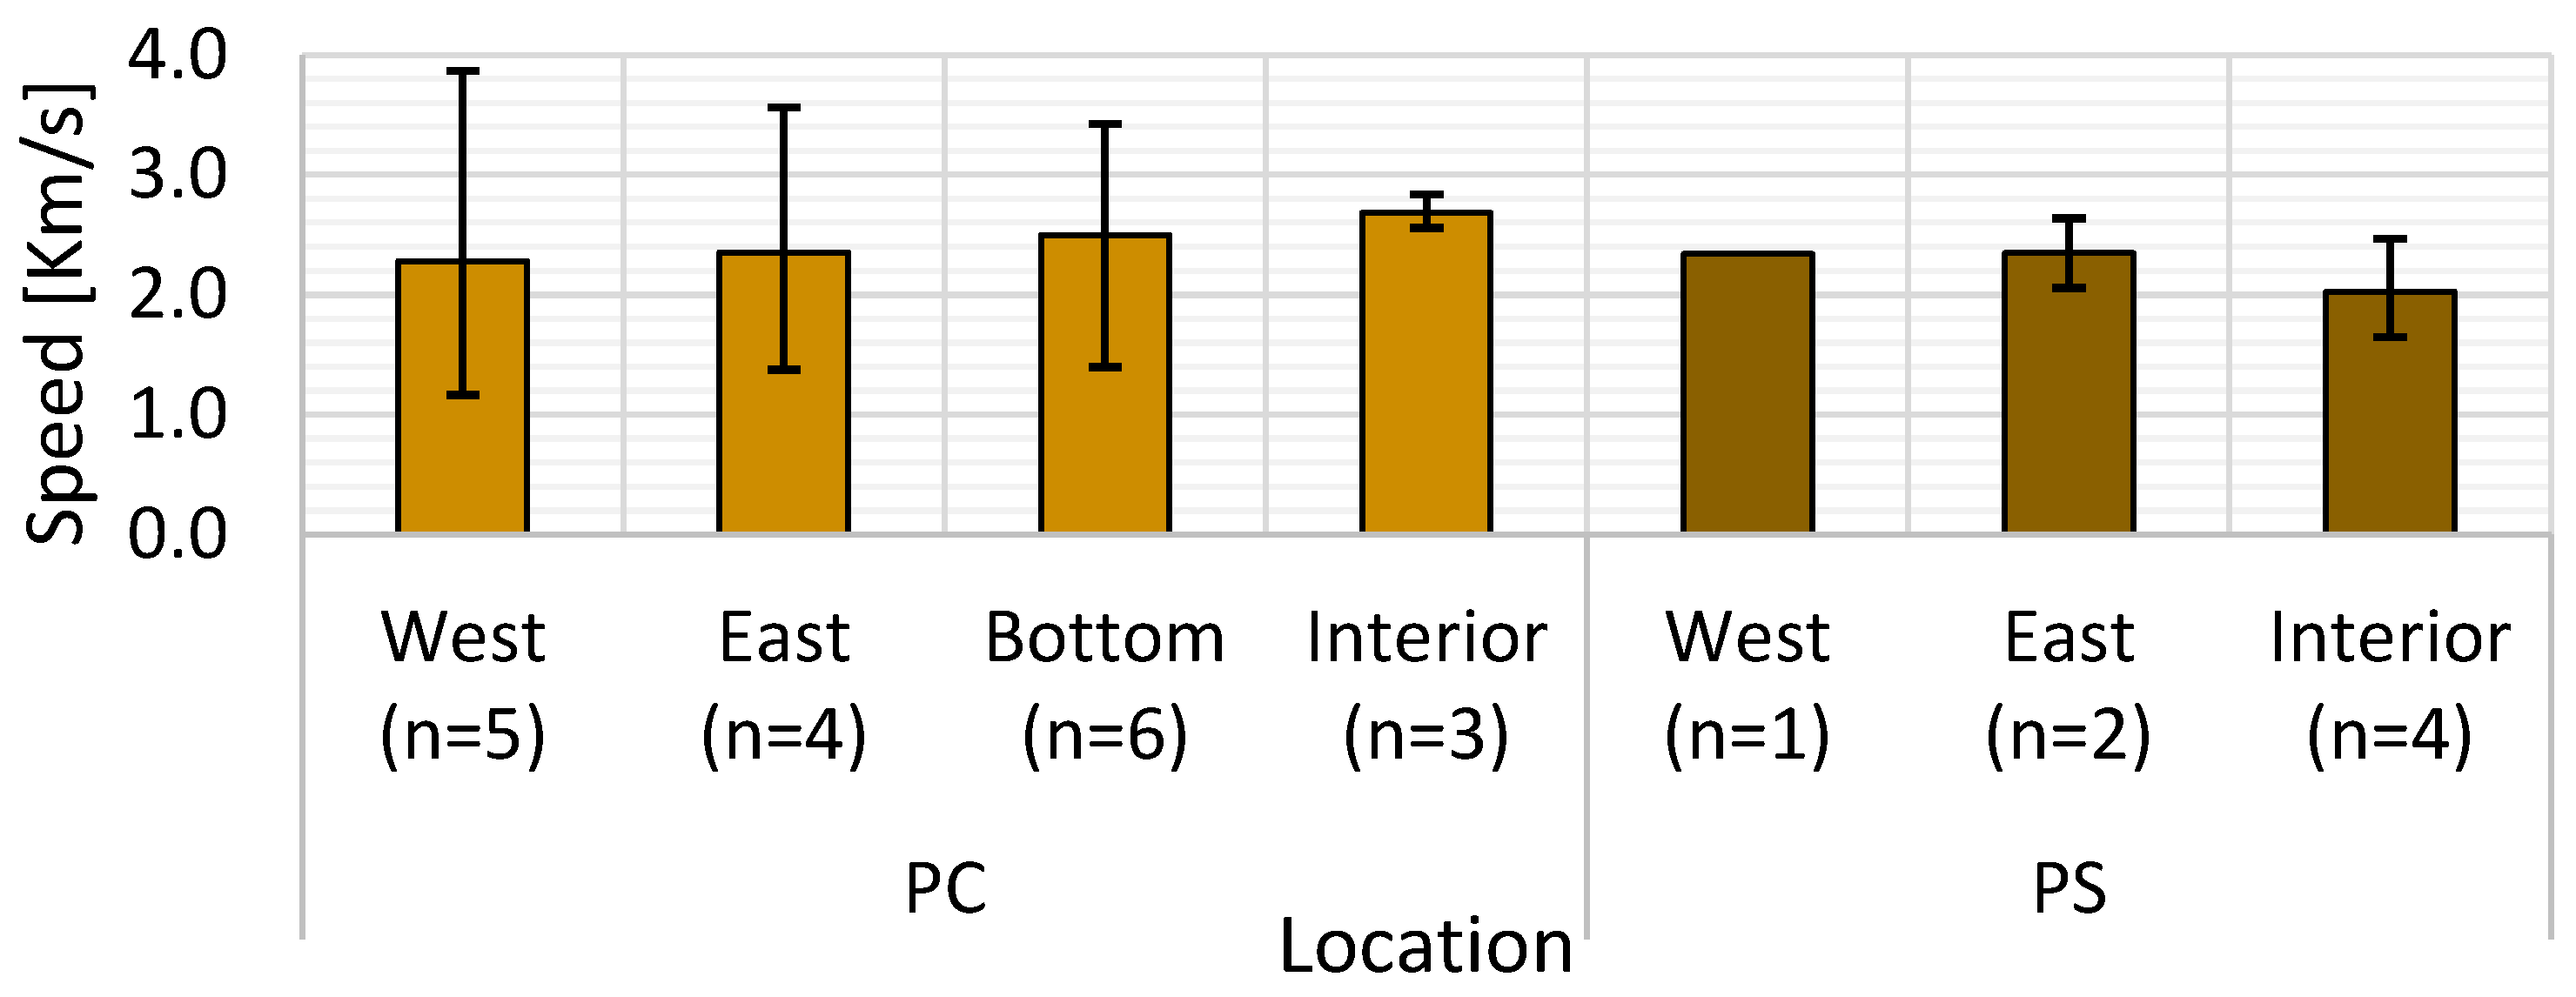
Individual UPV measurements were performed by taking the average reading over various lengths (up to 1.8 m) and in various locations (e.g., vertical vs. horizontal), as shown in Figure 4. UPV values were averaged from various locations on distinct surfaces of the PC and PS and are presented in Figure 13. Average UPV speeds were less than 3.0 km/s for both members, indicating the need for further testing [38]. External surfaces in the PC (i.e., repair concrete) had high variability between maximum and minimum measured values. This may reflect interference from reinforcing bars as per [15] since additional reinforcement was used during the repair, resulting in more reinforcement in the concrete cover. Internal locations in the PC presented a higher average UPV value with the lowest variability; however, this value was within the range of UPV found for other PC surfaces.
In the PS, UPV measurements on surface locations were impeded by high surface deterioration coupled with large visible cracks. Measurements in the ‘wet’ region were unsuccessful due to the frequency of these cracks. Only measurements on the upper (dry) surface of the PS, which exhibited lower deterioration, and at the southernmost point of the PS, where a metal plate reduced surface deterioration, were conducted successfully on exterior PS surfaces. Both locations resulted in similar UPV speeds of around 2.0 km/s.

3.2.3. Surface Electrical Resistivity

Surface resistivity readings successfully differentiated between the repair concretes on the exterior (average readings of 265 kΩ·cm, with standard deviation of 83.5 kΩ·cm) and the internal concrete (average readings of 9 kΩ·cm, with standard deviation of 1.2 kΩ·cm). This indicates that the repair concrete provided a good barrier against the ingress of harmful ions such as chloride, while the original concrete would have been vulnerable. Average surface resistivity for segments from the PS was 25 kΩ·cm (with standard deviation of 19.6 kΩ·cm), representing a low probability of chloride ingress [39].

4. Discussion

The presence of ASR in both members was expected, given the previous testing on cores from CB piers [17] and use of the same type of silicious limestone as coarse aggregate. Visual inspection of internal concrete of both members supported the presence of ASR, with cracks containing suspected ASR frequently observed. Despite this, differences in geometry (i.e., higher reinforcement in PC) and environment (i.e., submerged, semi-submerged and wet regions in PS) resulted in different damage patterns in the two members, namely the greater presence of wide cracks parallel to reinforcement in the PS. However, although damage manifested differently, the quantitative visual assessment techniques (i.e., the CI) and non-destructive testing (i.e., rebound hammer, UPV and surface resistivity) indicated similar results: i.e., high damage requiring further investigation of both members.

4.1. Directional Cracking Identified in Visual Assessment

4.1.1. Observed Cracking

Crack patterns (presented in Figure 8 and Figure 9) showed areas in both members indicative of ‘map cracking’. These areas are located in regions with moderate reinforcement in the PC and PS, with PS additionally exhibiting an area of reduced cracking between dry and submerged regions. A higher density of cracking appears in the PC towards the outer ends of the member on the east and west faces, while cracking is reduced near the top of the member. There was less cracking in the concrete at the top of the PC where external post-tensioning was used for the final 10 years of service [33], while concrete near the south and north ends of the member would have had less protection from the bridge deck (i.e., direct sun, wind and precipitation) in addition to differences in stress throughout the member. In the PS, the transition area between wet and dry regions was observed to have less cracking (i.e., fewer horizontal cracks), while many cracks can be seen to be aligned with the reinforcement, particularly in the spalled region on the west face. The PS exhibited significant scaling and deterioration of exterior aggregates, especially in the wetted region (i.e., submerged or semi-submerged). This agrees with the findings of [41] where the highest damage occurred at the waterline of hydraulic structures.

4.1.2. The CI and Individual Crack Widths

When crack widths and computed CI were considered, anisotropic properties were identified, with widths and number of cracks varying depending on direction. The CI is a powerful tool for comparison of damage, especially cracking due to internal swelling reactions, at different locations in a concrete member or between different members in a structure [8]. However, the choice of location for CI, which is recommended to be the most damaged portion of the area of interest, can be biased by the presence of large cracks which may indicate types of deterioration other than internal swelling reactions. As such, this may introduce bias when single cracks with large widths are present (e.g., the 1.2 cm crack omitted from Figure 10 and Figure 11), which could impact CI as a comparative technique. CI results for different line segments (i.e., the vertical and horizontal lines of the CI) as well as average crack widths and number of cracks intersecting these lines are discussed in the following two paragraphs.
In the PC segments, the CI values for vertical lines (i.e., cracks traveling longitudinally) were higher compared to horizontal lines (i.e., cracks traveling vertically); this resulted in an average CI of 1.8 and 1.7 mm/m along vertical lines in the west and east faces, respectively, compared to 1.1 and 0.5 mm/m cracks intersecting horizontal lines. On the east and west surfaces, CI values correspond to both wider and more numerous cracks intersecting the vertical lines of the CI (average widths of 0.35–0.34 mm) compared to smaller width cracks (0.16–0.19 mm) intersecting horizontal lines. Conversely, differences between the CI for horizontal and vertical lines on the bottom surface were caused primarily by different numbers of cracks in the two directions since average crack widths were the same for all CI line orientations (0.30 ± 0.02 mm). In the context of the suspected internal swelling reaction (i.e., ASR), the difference in crack widths suggests expansion in the member may have occurred preferentially vertically within the member.
In the PS segments, CI results indicated high variability between surfaces in the member. On the east face, the CI presented high readings with a similar trend to the PC, where CI values for the vertical lines (2.7 and 3.9 mm/m for dry and wet surfaces, respectively) were much larger than the CI values for the horizontal lines (1.2 and 1.5 mm/m for dry and wet surfaces, respectively), indicating higher damage occurring longitudinally. The CI in these locations resulted from increases in both average crack widths and crack frequency. The widths of cracks intersecting vertical lines were found to be 0.30 mm (dry region) and 0.51 mm (wet region) compared to those of cracks intersecting horizontal lines, which were found to be 0.20 mm (dry region) and 0.30 mm (wet region). Conversely, the CI on the west face had the lowest values along the vertical lines, where the average crack width was 0.12 mm compared to 0.27 mm on the horizontal line, while a similar number of cracks were identified in all directions.
The magnitudes of the CI values in both members were greater than 0.50 mm/m, indicating the need for further investigation (i.e., NDTs and/or extraction and testing of cores) [8]. The CI values in the PC segments were found to be lower compared to those in the PS due primarily to a higher number of cracks on the PS east face. The average crack width intersecting vertical lines on the wet portion of the PS east face was notably large (0.51 mm) compared to crack widths in other regions. Furthermore, although locations were chosen to represent areas with the highest damage in each segment, some locations on the PS were not sufficiently flat to use the CI (i.e., the spalled sections on the west face and the large crack near the southern tip of the west face where the surface was displaced outwards). East and west surfaces of the PS were observed to have similar reinforcement configurations, suggesting that variations were caused primarily by exposure conditions (e.g., differences due to flow within the river).

4.2. Assessment of Surface and Internal Damage

4.2.1. Observed Cracking

Durability issues were evident on external surfaces of both members, including significant cracking and discolored regions, indicating a high probability of ASR similar to deterioration identified by Kanjee et al. [10]. In the PS, additional signs of damage included spalling along with significant planes of delamination which were visible on cut surfaces. It was expected that the surface of these members would experience higher damage compared to the interior due to the contributions of reinforcement corrosion, freeze-thaw damage and erosion of submerged surfaces, with observed damage supporting the presence of these damage mechanisms. Average crack widths identified at the surface of both members were around 0.30 mm, suggesting that in both members, the ingress of harmful ions such as chlorides, as well as the ingress of moisture, can occur more rapidly through cracks compared to ingress in uncracked concrete [42]. Visual assessments of interior surfaces identified that there was no significant corrosion in interior reinforcing bars (i.e., more than 20 cm from the exterior surface). White products in aggregates, including cracks extending from aggregates containing white material (i.e., the suspected ASR gel), could be observed on internal surfaces without the aid of magnification. However, had internal surfaces not been exposed, only the ‘map cracking’ pattern at select locations in each member would have indicated ASR since the secondary product from ASR was not visible from the exterior. Limited visible ASR at surface locations agrees with expected reductions in pH in surface layers (e.g., due to wetting and drying cycles, carbonation, etc.). This reiterates that the presence of ASR cannot be ruled out prior to extraction of cores.

4.2.2. Non-Destructive Testing

NDTs conducted on various exterior surfaces (e.g., east vs. west faces) were compared to tests on interior surfaces to evaluate whether these tests represent the interior concrete condition. Rebound hammer readings were found to over-estimate the compressive strength in surface locations, while UPV did not indicate significant differences between internal and external surfaces. In most cases, the rebound hammer and UPV, respectively, resulted in similar values for both members (33–39 MPa for rebound hammer and 2.0–2.7 km/s for UPV), while the surface electrical resistivity indicated clear differences between the original concrete (9 kΩ·cm in the PC, indicating high permeability, and 25 kΩ·cm in the PS, indicating low permeability concrete as per AASHTO T 358) and repair concrete (265 kΩ·cm, indicating negligible permeability concrete). Rebound hammer results for the bottom surface of the pier cap were found to be high (50 MPa), which may be due to the techniques used during the encapsulation repair (e.g., use of self-leveling concrete, resulting in greater compaction at bottom of formwork), while the highest UPV was found in the PC interior. This suggests that the compressive strength of the repair concrete was comparable to that of the interior concrete. Surface electrical resistivity successfully differentiated between the repair concrete and internal concrete, indicating that the original concrete was more susceptible to chloride ingress; however, it did not have sufficient sensitivity to identify areas of increased concrete damage.
Similar NDT results for the two members are contrary to higher CI values found for the PS east face. This illustrates limitations for both NDTs and the future extraction of cores since wide cracks may prohibit the successful completion of testing (e.g., UPV values cannot be obtained across wide cracks, and there is a difficulty obtaining cores with adequate dimensions for the stiffness damage test—SDT). This is to say that above some level of damage, e.g., above a certain crack width, both non-destructive tests and extraction of cores (i.e., cores may not remain intact) may no longer be able to quantitatively capture the extent of damage. As a result, in field structures presenting extensive signs of deterioration, visual techniques (e.g., crack width measurements and CI) remain an essential part of condition assessments.

4.2.3. Impact of PC Encapsulation Repair

The encapsulation repair was performed on the PC 15 years prior to decommissioning of the CB, with both self-leveling and standard concrete used for the repair [32]. Self-leveling concrete, in particular, has been found to exhibit good properties, including for overhead repairs [43] (e.g., the bottom surface of the PC). Results of surface electrical resistivity indicate that the repair concrete would have presented a barrier against harmful ions such as chloride, which was a known durability concern for this member type in the CB [16], along with reducing moisture that could contribute to increased ASR-induced damage. However, development of cracks in the repair, as were measured here, may indicate a reduced effectiveness since only cracks of less than 0.3 mm are thought to prevent diffusion into concrete [42], and a number of the measured PC cracks exceeded this width. CI values recorded on exterior PC surfaces further indicated high levels of cracking indicative of an internal swelling reaction (i.e., beyond expected cracking from shrinkage and loading); however, this work was unable to determine if this represents only expansion since the repair was conducted or if cracking pre-dating the repair played a role. Regardless, the use of CI on repaired surfaces should be performed cautiously as a comparative tool for determining where to prioritize work.

5. Conclusions

Visual assessments and non-destructive tests conducted on PC and PS segments of the former Champlain Bridge in Montréal consistently indicated high levels of damage. As such, further investigation is needed (i.e., extraction and testing of concrete cores) to assess the cause, likely ASR as per previous assessment of piers in this structure, and the extent of damage in the PC and PS members. Due to the different service environments and geometries, results for pier members are not expected to provide insight into other bridge components (e.g., deck slabs, girders and diaphragms). Nevertheless, the main findings obtained in this research were as follows:

5.1. Visual Assessment

  • ‘Map cracking’ patterns were noted in areas with moderate reinforcement regions of both members. Reduced cracking was visible in high reinforcement regions of the PC as well as the semi-submerged region of the PS.
  • Anisotropy was identified with crack widths varying by direction. In the PC and on the east face of the PS, vertical cracks (i.e., intersecting the horizontal CI lines) were both thinner and less frequent compared to horizontal cracks. In the context of an internal swelling reaction such as ASR, these differences in crack widths suggest expansion is occurring preferentially in one direction (i.e., vertically) compared to another.
  • The CI indicating the highest damage was obtained on the PS east face. The CI corresponding to this location exhibited wider and more frequent cracks intersecting the CI, with cracks primarily oriented horizontally.
  • Although the PC was encapsulated in repair concrete 15 years before decommissioning of the structure, average crack widths were similar to average crack widths recorded on the PS. This suggests that assessment of reinforced concrete members using crack width measurements can provide insight into increasing deterioration within the member.
  • The presence of ASR in the members was not clearly indicated by inspection of exterior surfaces, while internal surfaces exposed during decommissioning of the members included clear indicators of ASR gel in aggregates and paste.

5.2. Non-Destructive Testing

  • The rebound hammer estimated an average concrete strength between 33 and 39 MPa in east, west and interior locations of the PS and PC. The average compressive strength on the PC bottom surfaces was estimated at 50 MPa. In the PC, the rebound hammer did not identify significant differences in compressive strength on the exterior (repair concrete) surfaces compared to the interior (original) concrete.
  • Ultrasonic pulse velocity results were less than 3.0 km/s, indicating the need for further investigation (e.g., extraction of cores for laboratory analysis), which agrees with the extent of cracking observed during the visual inspection.
  • Electrical surface resistivity measurements clearly distinguished between the PC repair concrete (low permeability to chloride ingress) and the internal concrete (higher permeability); however, there was high variation when used solely on the repair concrete. The electrical surface resistivity was comparable for the PC interior concrete and PS external and internal concrete.
  • The application of the investigated non-destructive tests was limited in areas with wide crack widths, such as the east face of the PS, emphasizing the need for complementary semi-quantitative and quantitative visual assessments (i.e., crack width measurements and CI) in the evaluation of reinforced concrete damage.
Visual and non-destructive tests successfully identified the high level of deterioration in both the PC and PS members; however, without access to interior surfaces, the cause of the deterioration could not be clearly identified. This suggests that the extraction of concrete cores continues to be necessary to establish the cause and extent of damage in reinforced concrete members even at high levels of deterioration.

Author Contributions

Conceptualization, L.F.M.S., B.M.-P., M.N. and L.K.; methodology, L.K. and L.F.M.S.; formal analysis, L.K.; investigation, L.K.; resources, L.F.M.S., B.M.-P. and M.N.; writing—original draft preparation, L.K.; writing—review and editing, L.F.M.S., B.M.-P. and M.N.; visualization, L.K.; supervision, L.F.M.S.; funding acquisition, L.F.M.S., B.M.-P. and M.N. All authors have read and agreed to the published version of the manuscript.

Funding

The authors wish to acknowledge the Natural Sciences and Engineering Research Council of Canada (NSERC) for partly funding this research under NSERC Alliance grant ALLRP 566567-21. The authors also wish to express their gratitude to the Ontario Graduate Scholarship (OGS) for providing funding support to Leah Kristufek through a scholarship. This research and development project would not have been possible without the contribution and collaboration of the Jacques Cartier and Champlain Bridge Incorporated. The additional support from JCCBI was provided through Contract 90057.

Data Availability Statement

Some or all data, models, or codes that support the findings of this study are available from the corresponding author upon reasonable request.

Acknowledgments

The authors would like to thank Issa Fowai and Dana Tawil for their assistance during visits to the specimen storage site.

Conflicts of Interest

The authors declare no conflicts of interest.

References

  1. Van Breugel, K. Societal Burden and Engineering Challenges of Ageing Infrastructure. Procedia Eng. 2017, 171, 53–63. [Google Scholar] [CrossRef]
  2. Sanchez, L.F.M.; Fournier, B.; Jolin, M.; Mitchell, D.; Bastien, J. Overall assessment of Alkali-Aggregate Reaction (AAR) in concretes presenting different strengths and incorporating a wide range of reactive aggregate types and natures. Cem. Concr. Res. 2017, 93, 17–31. [Google Scholar] [CrossRef]
  3. Trejo, D.; Mazarei, V.; Ideker, J.H.; Isgor, O.B. Influence of alkali-silica reaction reactivity on corrosion in reinforced concrete. ACI Mater. J. 2017, 114, 723–731. [Google Scholar] [CrossRef]
  4. Fournier, B.; Bérubé, M.-A. Alkali-Aggregate reaction in concrete: A review of basic concepts and engineering implications. Can. J. Civ. Eng. 2000, 27, 167–191. [Google Scholar] [CrossRef]
  5. RILEM Guide to Diagnosis and Appraisal of AAR Damage to Concrete in Structures; Springer: Dordrecht, The Netherlands, 2013.
  6. Rivard, P.; Saint-Pierre, F. Assessing alkali-silica reaction damage to concrete with non-destructive methods: From the lab to the field. Constr. Build. Mater. 2009, 23, 902–909. [Google Scholar] [CrossRef]
  7. RILEM technical committee 259-ISR. Diagnosis & Prognosis of AAR Affected Structures; Springer Nature: Cham, Switzerland, 2021. [Google Scholar]
  8. Fournier, B.; Bérubé, M.-A.; Folliard, K.J.; Thomas, M. Report on the Diagnosis, Prognosis, and Mitigation of Alkali-Silica Reaction (ASR) in Transportation Structures; United States Federal Highway Administration, Office of Pavement Technology: Washington, DC, USA, 2010.
  9. Barbosa, R.A.; Hansen, S.G.; Hansen, K.K.; Hoang, L.C.; Grelk, B. Influence of alkali-silica reaction and crack orientation on the uniaxial compressive strength of concrete cores from slab bridges. Constr. Build. Mater. 2018, 176, 440–451. [Google Scholar] [CrossRef]
  10. Kanjee, J.P.; Ballim, Y.; Otieno, M. A visual condition assessment of a reinforced concrete railway bridge subject to alkali silica reaction (ASR) deterioration in Johannesburg. MRS Adv. 2023, 8, 570–576. [Google Scholar] [CrossRef]
  11. Ahmed, H.; Zahedi, A.; Sanchez, L.F.M.; Fecteau, P.L. Condition assessment of ASR-affected reinforced concrete columns after nearly 20 years in service. Constr. Build Mater. 2022, 347, 128570. [Google Scholar] [CrossRef]
  12. Sanchez, L.F.M.; Fournier, B.; Mitchell, D.; Bastien, J. Condition assessment of an ASR-affected overpass after nearly 50 years in service. Constr. Build. Mater. 2020, 236, 117554. [Google Scholar] [CrossRef]
  13. Godart, B.; Fasseu, P.; Michel, M. Diagnosis and monitoring of concrete bridges damaged by AAR in Northern France. In Proceedings of the Ninth International Conference on Alkali-Aggregate Reaction in Concrete, London, UK, 27–31 July 1992; pp. 368–375. [Google Scholar]
  14. Nguyen, A.; Gharehbaghi, V.; Le, N.T.; Sterling, L.; Chaudhry, U.I.; Crawford, S. ASR crack identification in bridges using deep learning and texture analysis. Structures 2023, 50, 494–507. [Google Scholar] [CrossRef]
  15. ASTM C597; Standard Test Method for Pulse Velocity Through Concrete. American Society for Testing and Materials: West Conshohocken, PA, USA, 2016.
  16. Carlin, G.P.; Mirza, M.S.; Gaudreault, M. Rehabilitation Measures for Champlain Bridge, Montreal, Canada. Can. J. Civ. Eng. 1996, 23, 1326–1340. [Google Scholar] [CrossRef]
  17. Bérubé, M.-A.; Frenette, J. Évaluation de la Réactivité Alcaline dans le Béton des Piles 12, 18 et 20 W du Pont Champlain; Labratoire de Matériaux de Quebec Inc.: Quebec City, Canada, 1994. [Google Scholar]
  18. Noël, M.; Sanchez, L.; Tawil, D. Structural implications of internal swelling reactions in concrete: Review and research needs. Mag. Concr. Res. 2018, 70, 1052–1063. [Google Scholar] [CrossRef]
  19. Diao, B.; Sun, Y.; Cheng, S.; Ye, Y. Effects of Mixed Corrosion, Freeze-Thaw Cycles, and Persistent Loads on Behavior of Reinforced Concrete Beams. J. Cold Reg. Eng. 2011, 25, 37–52. [Google Scholar] [CrossRef]
  20. Wang, Y.; Cao, Y.; Zhang, P.; Ma, Y.; Zhao, T.; Wang, H.; Zhang, Z. Water absorption and chloride diffusivity of concrete under the coupling effect of uniaxial compressive load and freeze-thaw cycles. Constr. Build. Mater. 2019, 209, 566–576. [Google Scholar] [CrossRef]
  21. Panesar, D.K.; Ching, G. Implications of coupled degradation mechanisms of cement based materials exposed to cold climates. Int. J. Mech. Sci. 2018, 144, 865–876. [Google Scholar] [CrossRef]
  22. Sanchez, L.F.M.; Drimalas, T.; Fournier, B.; Mitchell, D.; Bastien, J. Comprehensive damage assessment in concrete affected by different internal swelling reaction (ISR) mechanisms. Cem. Concr. Res. 2018, 107, 284–303. [Google Scholar] [CrossRef]
  23. Antolik, A.; Jóźwiak-Niedźwiedzka, D. ASR induced by chloride- and formate-based deicers in concrete with non-reactive aggregates. Constr. Build Mater. 2023, 400, 132811. [Google Scholar] [CrossRef]
  24. Bérubé, M.A.; Smaoui, N.; Bissonnette, B.; Fournier, B. Outil D’Evaluation et de Gestion des Ouvrages D’art Affectes de Reactions Alcalis-Silice (RAS); Ministere des Transports du Quebec: Quebec City, Canada, 2005.
  25. Rogers, C. Alkali-aggregate reactivity in Canada. Cem. Concr. Compos. 1993, 15, 13–19. [Google Scholar] [CrossRef]
  26. Bérubé, M.-A.; Durand, B.; Vézina, D.; Fournier, B. Alkali-aggregate reactivity in Québec (Canada). Can. J. Civ. Eng. 2000, 27, 226–245. [Google Scholar] [CrossRef]
  27. Gautam, B.P.; Panesar, D.K.; Sheikh, S.A.; Vecchio, F.J. Effect of multiaxial stresses on alkali-silica reaction damage of concrete. ACI Mater. J. 2017, 114, 595–604. [Google Scholar] [CrossRef]
  28. Fan, S.; Hanson, J.M. Length Expansion and Cracking of Plain and Reinforced Concrete Prisms Due to Alkali-Silica Reaction. ACI Mater. J. 1998, 95, 480–485. [Google Scholar] [CrossRef]
  29. Fan, S.; Hanson, J.M. Effect of Alkali Silica Reaction Expansion and Cracking on Structural Behavior of Reinforced Concrete Beams. ACI Mater. J. 1999, 95, 488–495. [Google Scholar]
  30. Zahedi, A.; Sanchez, L.F.M.; Noël, M. Appraisal of visual inspection techniques to understand and describe ASR-induced development under distinct confinement conditions. Constr. Build Mater. 2022, 323, 126549. [Google Scholar] [CrossRef]
  31. Zahedi, A.; Trottier, C.; Sanchez, L.F.; Noël, M. Condition assessment of alkali-silica reaction affected concrete under various confinement conditions incorporating fine and coarse reactive aggregates. Cem. Concr. Res. 2022, 153, 106694. [Google Scholar] [CrossRef]
  32. Groupe Counseil Genivar (2003) Champlain Bridge, Rehabilitation of Piers, Pier Caps, Bearings and Beams (2004) Phases of Demolition.
  33. Leroux Beaudoin Hurens & Associes Inc. (2005) Pont Champlain, réfection de piles, chevêtres, appuis et poutres (2004) CONTRAT No: 60494.
  34. Kristufek, L.; Zahedi, A.; Tawil, D.; Sanchez, L.; Martín-Pérez, B.; Noël, M. Preliminary evaluation of Pier cap from an ASR affected bridge in Central Canada. MATEC Web Conf. 2022, 364, 03005. [Google Scholar] [CrossRef]
  35. Kristufek, L.; Sanchez, L.; Martin-Perez, B.; Noël, M. Condition Assessment of Concrete Pier Shaft Segment from Bridge in Central Canada. In Proceedings of the CSCE 2023 Conference, Moncton, NB, Canada, 24–27 May 2023. [Google Scholar]
  36. Institution of Structural Engineers (ISE). Structural Effects of Alkali-Silica Reaction—Technical Guidance Appraisal of Existing Structures; Institution of Structural Engineers: London, UK, 1992. [Google Scholar]
  37. ASTM C 805/C805M-18; Standard Test Method for Rebound Number of Hardened Concrete. American Society for Testing and Materials: West Conshohocken, PA, USA, 2018.
  38. IS 13311-1 (Part 1); Method of Non-Destructive Testing of Concrete, Part 1: Ultrasonic Pulse Velocity [CED 2: Cement and Concrete]. 1–7 Bureau of Indian Standards: New Delhi, India, 1992.
  39. AASHTO T 358-15; Standard Method of Test for Surface Resistivity Indication of Concrete’s Ability to Resist Chloride Ion Penetration. American Association of State Highway and Transportation Officials: Washington, DC, USA, 2015.
  40. Report on Nondestructive Test Methods for Evaluation of Concrete in Structures; ACI 228. American Concrete Institute: Farmington Hills, MI, USA, 2013. [CrossRef]
  41. Rosenqvist, M.; Pham, L.W.; Terzic, A.; Fridh, K.; Hassanzadeh, M. Effects of interactions between leaching, frost action and abrasion on the surface deterioration of concrete. Constr. Build. Mater. 2017, 149, 849–860. [Google Scholar] [CrossRef]
  42. ACI Committee 222. Protection of Metals in Concrete Against Corrosion Reported by ACI Committee 222; American Concrete Institute: Farmington Hills, MI, USA, 2001; ACI 1–41. [Google Scholar]
  43. Lacombe, P.; Beauprd, D.; Pouliot, N. Rheology and bonding characteristics of self-leveling concrete as a repair material. Mater. Struct. 1999, 32, 593–600. [Google Scholar] [CrossRef]
Figure 1. Location of pier cap—PC (42 W) and pier shaft—PS (38 W). (Image sources: Left and right images courtesy of JCCBI, center image: Map data © 2022 Google, Rene-Levesque-Blvd.).
Buildings 15 03262 g001
Figure 2. The pier cap following removal of the surface concrete in 2004 (left) and in 2018 after addition of external longitudinal reinforcement and the modular truss system (right) (image sources: (left image) courtesy of JCCBI, (right image): Map data © 2022 Google).
Buildings 15 03262 g002
Figure 3. Pier cap and pier shaft segments investigated.
Buildings 15 03262 g003
Figure 4. (a) Test locations on PC (cracking index indicated by red lines, rebound hammer indicated by red star, and ultrasonic pulse velocity indicated by yellow lines). (b) Test locations on PC and PS (cracking index indicated by red lines, rebound hammer indicated by red star, and ultrasonic pulse velocity indicated by yellow lines).
Buildings 15 03262 g004aBuildings 15 03262 g004b
Figure 5. Surface damage observed on PC (top row) and PS (bottom row) members.
Buildings 15 03262 g005
Figure 6. View of rebar arrangement inside PC and PS sections.
Buildings 15 03262 g006
Figure 7. Cross-sectional surfaces of the PC showing (a) cracks suggesting ASR; and (b) repair and planes of delamination in the PS on (c) horizontal surface and (d) vertical surfaces.
Buildings 15 03262 g007
Figure 8. Observed cracking on PC member (UPV measurement points and core extraction location visible on samples as dark circles). Line colour indicates the corresponding measured crack width.
Buildings 15 03262 g008
Figure 9. Observed cracking on PS member. Line colour indicates the corresponding measured crack width.
Buildings 15 03262 g009
Figure 10. Average, horizontal, vertical and diagonal Cracking Index (CI) components for different faces of the PC and PS members. Error bars indicate the maximum and minimum recorded values. Crack with width 12 mm omitted from PC east face (wet) horizontal line.
Buildings 15 03262 g010
Figure 11. Box and whisker plots of (A) crack widths and (B) number of cracks for different faces of the PC and PS members. Crack with width 12 mm omitted from PC east face (wet) horizontal line.
Buildings 15 03262 g011
Figure 12. Average compressive strength calculated from rebound hammer numbers for PC and PS members. Error bars indicate maximum and minimum values, and n corresponds to the number of measurements.
Buildings 15 03262 g012
Figure 13. Average Ultrasonic Pulse Velocity (UPV) speed for PC and PS members. Error bars indicate maximum and minimum values, and n corresponds to the number of measurements.
Buildings 15 03262 g013
Disclaimer/Publisher’s Note: The statements, opinions and data contained in all publications are solely those of the individual author(s) and contributor(s) and not of MDPI and/or the editor(s). MDPI and/or the editor(s) disclaim responsibility for any injury to people or property resulting from any ideas, methods, instructions or products referred to in the content.